UNITED STATES
SECURITIES AND EXCHANGE COMMISSION
Washington, D.C. 20549
FORM 10-K
|
x
|
ANNUAL REPORT PURSUANT TO SECTION 13 OR 15(d) OF THE
|
SECURITIES EXCHANGE ACT OF 1934
For the fiscal year ended
December 31, 2016
or
|
¨
|
TRANSITION REPORT PURSUANT TO SECTION 13 OR 15(d) OF THE SECURITIES EXCHANGE ACT OF 1934
|
For the transition period from to
Commission file number 001-36674
USD PARTNERS LP
(Exact Name of Registrant as Specified in Its Charter)
|
Delaware
|
30-0831007
|
|
(State or Other Jurisdiction of Incorporation or Organization)
|
(I.R.S. Employer Identification No.)
|
811 Main Street, Suite 2800
Houston, Texas 77002
(Address of Principal Executive Offices) (Zip Code)
Registrant’s telephone number, including area code
(281) 291-0510
Securities registered pursuant to Section 12(b) of the Act:
|
Title of each class
|
Name of each exchange on which registered
|
|
|
Common Units Representing Limited Partner Interests
|
New York Stock Exchange
|
|
Securities registered pursuant to Section 12(g) of the Act: None
Indicate by check mark if the registrant is a well-known seasoned issuer, as defined in Rule 405 of the Securities Act. Yes
¨
No
x
Indicate by check mark if the registrant is not required to file reports pursuant to Section 13 or Section 15(d) of the Act. Yes
¨
No
x
Indicate by check mark whether the registrant (1) has filed all reports required to be filed by Section 13 or 15(d) of the Securities Exchange Act of 1934 during the preceding 12 months (or for such shorter period that the registrant was required to file such reports), and (2) has been subject to such filing requirements for the past 90 days. Yes
x
No
¨
Indicate by check mark whether the registrant has submitted electronically and posted on its corporate Web site, if any, every Interactive Data File required to be submitted and posted pursuant to Rule 405 of Regulation S-T (§ 232.405 of this chapter) during the preceding 12 months (or for such shorter period that the registrant was required to submit and post such files). Yes
x
No
¨
Indicate by check mark if disclosure of delinquent filers pursuant to Item 405 of Regulation S-K (§ 229.405) is not contained herein, and will not be contained, to the best of the registrant’s knowledge, in definitive proxy or information statements incorporated by reference in Part III of this Form 10-K or any amendment to this Form 10-K.
¨
Indicate by check mark whether the registrant is a large accelerated filer, an accelerated filer, a non-accelerated filer, or a smaller reporting company. See the definitions of “large accelerated filer,” “accelerated filer” and “smaller reporting company” in Rule 12b-2 of the Exchange Act. (Check one):
|
Large Accelerated Filer
¨
|
Accelerated Filer
x
|
|
Non-Accelerated Filer
¨
|
Smaller reporting company
¨
|
|
(Do not check if a smaller reporting company)
|
|
Indicate by check mark whether the registrant is a shell company (as defined in Rule 12b-2 of the Exchange Act). Yes
¨
No
x
As of
June 30, 2016
, the last business day of the registrant's most recently completed second fiscal quarter, the aggregate market value of the registrant's Common Units held by non-affiliates was
$101,955,956
computed by reference to the price at which the common equity was last sold, or the average bid and asked price of such common equity.
As of
March 3, 2017
, the registrant has outstanding
16,537,498
common units;
6,278,127
subordinated units;
92,500
Class A units; and
461,136
general partner units.
DOCUMENTS INCORPORATED BY REFERENCE: NONE
TABLE OF CONTENTS
|
Page
|
||
Unless the context otherwise requires, all references in this Annual Report on Form 10-K, or this “Annual Report” or this “Form 10-K” to “USD Partners,” “USDP,” “the Partnership,” “we,” “our,” “us,” or like terms used in the present tense or prospectively (beginning October 15, 2014) refer to USD Partners LP and its subsidiaries. References in this Annual Report to “the Predecessor,” “we,” “our,” “us,” or like terms, when used in a historical context (periods prior to October 15, 2014), refer to the following subsidiaries, collectively, that were contributed to USD Partners in connection with our Initial Public Offering of 9,120,000 common units that we completed on October 15, 2014, the “IPO”: San Antonio Rail Terminal LLC, USD Logistics Operations GP LLC, USD Logistics Operations LP, USD Rail Canada ULC, USD Rail International S.A.R.L., USD Rail LP, USD Terminals Canada ULC, USD Terminals International S.A.R.L. and West Colton Rail Terminal LLC. The Predecessor also includes the membership interests in the following five subsidiaries of USD which operated crude oil rail terminals that were sold in December 2012: Bakersfield Crude Terminal LLC, Eagle Ford Crude Terminal LLC, Niobrara Crude Terminal LLC, St. James Rail Terminal LLC, and Van Hook Crude Terminal LLC, collectively known as the “Discontinued Operations.”
Unless the context otherwise requires, all references in this Annual Report to (i) “our general partner” refer to USD Partners GP LLC, a Delaware limited liability company; (ii) “USD” refers to US Development Group LLC, a Delaware limited liability company, and where the context requires, its subsidiaries; (iii) “USDG” and “our sponsor” refer to USD Group LLC, a Delaware limited liability company and currently the sole direct subsidiary of USD; (iv) “Energy Capital Partners” refers to Energy Capital Partners III, LP and its parallel and co-investment funds and related investment vehicles; and (v) “Goldman Sachs” refers to The Goldman Sachs Group, Inc. and its affiliates.
This Annual Report includes forward-looking statements, which are statements that frequently use words such as “anticipate,” “believe,” “continue,” “could,” “estimate,” “expect,” “forecast,” “intend,” “may,” “plan,” “position,” “projection,” “should,” “strategy,” “target,” “will” and similar words. Although we believe that such forward-looking statements are reasonable based on currently available information, such statements involve risks, uncertainties and assumptions and are not guarantees of performance. Future actions, conditions or events and future results of operations may differ materially from those expressed in these forward-looking statements. Any forward-looking statement made by us in this Annual Report speaks only as of the date on which it is made, and we undertake no obligation to publicly update any forward-looking statement. Many of the factors that will determine these results are beyond our ability to control or predict. Specific factors that could cause actual results to differ from those in the forward-looking statements include: (1) changes in general economic conditions; (2) the effects of competition, in particular, by pipelines and other terminalling facilities; (3) shut-downs or cutbacks at upstream production facilities, or refineries, petrochemical plants or other businesses to which we transport products; (4) the supply of, and demand for, crude oil and biofuel rail terminalling services; (5) our limited history as a separate public partnership; (6) the price and availability of debt and equity financing; (7) hazards and operating risks that may not be covered fully by insurance; (8) disruptions due to equipment interruption or failure at our facilities or third-party facilities on which our business is dependent; (9) natural disasters, weather-related delays, casualty losses and other matters beyond our control; (10) changes in laws or regulations to which we are subject, including compliance with environmental and operational safety regulations that may increase our costs; and (11) our ability to successfully identify and finance acquisitions and other growth opportunities. For additional factors that may affect results, see “
Item 1A. Risk Factors
” included elsewhere in this Annual Report and our subsequently filed Quarterly Reports on Form 10-Q, which are available to the public from the U.S. Securities and Exchange Commission, or SEC, at their website www.sec.gov and from our website at www.usdpartners.com.
ii
Glossary
The following abbreviations, acronyms and terms used in this Form 10-K are defined below:
|
AOCI
|
Accumulated other comprehensive income
|
|
|
API Gravity
|
American Petroleum Institute Gravity
|
|
|
Bbl or bbl
|
Barrels, common unit of measure in the oil industry, which equates to 42 U.S. gallons
|
|
|
Bitumen
|
A dense, highly viscous, petroleum-based hydrocarbon that is found in deposits such as oil sands
|
|
|
Bpd
|
Barrels per day
|
|
|
CAA
|
Clean Air Act, as amended
|
|
|
CAD or C$
|
Amount denominated in Canadian dollars
|
|
|
CWA
|
Clean Water Act, as amended
|
|
|
Diluent
|
Refers to lighter hydrocarbon products such as natural gasoline or condensate that are blended with heavy crude oil to allow for pipeline transportation of heavy crude oil
|
|
|
DOT
|
U.S. Department of Transportation
|
|
|
EBITDA
|
Earnings before Interest, Taxes, Depreciation and Amortization
|
|
|
EPA
|
Environmental Protection Agency
|
|
|
Ethanol
|
A clear, colorless, flammable oxygenated liquid typically produced chemically from ethylene, or biologically from fermentation of various sugars from carbohydrates found in agricultural crops and cellulosic residues from crops or wood, which is used in the United States as a gasoline octane enhancer and oxygenate
|
|
|
Exchange Act
|
Securities Exchange Act of 1934, as amended
|
|
|
FERC
|
Federal Energy Regulatory Commission
|
|
|
GAAP
|
U.S. Generally Accepted Accounting Principles
|
|
|
General Partner
|
USD Partners GP LLC, the general partner of the Partnership
|
|
|
GHG
|
Greenhouse gases such as carbon dioxide
|
|
|
Heavy crude
|
A crude oil with a low API Gravity characterized by high relative density and viscosity. Heavy crude oils require greater levels of processing to produce high value products such as gasoline and diesel
|
|
|
Hydrocarbon-by-rail
|
The transportation of hydrocarbons, such as crude oil and ethanol, by rail, particularly through the use of unit trains
|
|
|
IPO
|
The initial public offering of 9,120,000 of our common units
which priced on October 8, 2014 and closed on October 15, 2014
|
|
|
Legacy railcar
|
A DOT Specification 111 railcar that does not comply with the Association of American Railroads (AAR) Casualty Prevention Circular (CPC) letter known as CPC-1232 which specifies requirements for railcars built for the transportation of certain hazardous materials, including crude oil and ethanol
|
|
|
LIBOR
|
London Interbank Offered Rate—British Bankers’ Association’s average settlement rate for deposits in United States dollars
|
|
|
Manifest train
|
Trains that are composed of mixed cargos and often stop at several destinations
|
|
|
Mbpd
|
A thousand barrels per day
|
|
|
MMbbls
|
A million barrels
|
|
|
MMbpd
|
A million barrels per day
|
|
|
NGA
|
Natural Gas Act
|
|
|
NGL or NGLs
|
Natural gas liquids
|
|
|
NYMEX
|
The New York Mercantile Exchange where commodity futures, options contracts and other energy futures are traded
|
|
|
NYSE
|
New York Stock Exchange
|
|
|
Oil sands
|
Deposits of loose sand or partially consolidated sandstone that are saturated with highly viscous bitumen
|
|
|
PADD III
|
Petroleum Administration for Defense District consisting of Alabama, Arkansas, Louisiana, Mississippi, New Mexico and Texas
|
|
|
Partnership Agreement
|
Second Amended and Restated Agreement of Limited Partnership of USD Partners LP
|
|
|
Partnership
|
USD Partners LP and its consolidated subsidiaries
|
|
|
SEC
|
U.S. Securities and Exchange Commission
|
|
|
Throughput
|
The volume processed through a terminal or refinery
|
|
|
Unit train
|
Refers to trains comprised of up to 120 railcars and are composed of one cargo shipped from one point of origin to one destination
|
|
iii
OVERVIEW
We are a fee-based, growth-oriented master limited partnership formed in 2014 by US Development Group LLC, or USD, through its wholly-owned subsidiary USD Group LLC, or USDG, to acquire, develop and operate energy-related logistics assets, including rail terminals and other high-quality and complementary midstream infrastructure. Our principal assets consist of: (i) a crude oil origination terminal in Hardisty, Alberta, Canada, with capacity to load up to two 120-railcar unit trains per day, (ii) a crude oil terminal in Casper, Wyoming, with unit train-capable railcar loading capacity in excess of 100,000 barrels per day, or Bpd, and six customer-dedicated storage tanks with 900,000 barrels, or Bbls, of total capacity and (iii) two unit train-capable ethanol destination terminals in San Antonio, Texas, and West Colton, California. Our terminals provide critical infrastructure allowing our customers to transport energy-related products from multiple supply regions to various demand markets that are dependent on these products. In addition, we provide our customers with railcars and fleet services related to the transportation of liquid hydrocarbons and biofuels by rail under multi-year, take-or-pay contracts. As of
December 31, 2016
, our railcar fleet consisted of
2,953
railcars which we leased from various railcar manufacturers and financial entities, including
2,108
coiled and insulated, or C&I, railcars.
We generate substantially all of our operating cash flow from multi-year, take-or-pay contracts for crude oil terminalling services, such as railcar loading for transportation to end markets, storage and blending in on-site tanks, as well as related logistics services. We do not take ownership of the products that we handle nor do we receive any payments from our customers based on the value of such products. We believe rail will continue as an important transportation option for energy producers, refiners and marketers due to its unique advantages relative to other transportation means. Specifically, rail transportation of energy-related products provides flexible access to key demand centers on a relatively low fixed-cost basis with faster physical delivery, while preserving the specific quality of customer products over long distances.
The following table summarizes information about our terminalling facility assets:
|
Terminal Name
|
Location
|
Designed
Capacity (Bpd) |
Commodity
Handled
|
Primary
Customers
|
Terminal
Type
|
|||||
|
Hardisty terminal
|
Alberta, Canada
|
~172,629
(1)
|
Crude Oil
|
Producers/Refiners
/Marketers
|
Origination
|
|||||
|
Casper terminal
|
Wyoming, U.S.
|
~126,594
(2)
|
Crude Oil
|
Refiners
|
Origination
|
|||||
|
San Antonio terminal
|
Texas, U.S.
|
20,000
|
Ethanol
|
Refiners/Blenders
|
Destination
|
|||||
|
West Colton terminal
|
California, U.S.
|
13,000
|
Ethanol
|
Refiners/Blenders
|
Destination
|
|||||
|
(1)
|
Based on two 120-railcar unit trains comprised of 31,800 gallon (approximately 757 bbls) railcars being loaded at 95% of volumetric capacity per day. Actual amount of crude oil loading capacity may vary based on factors including the size of the unit trains, the size, type and volumetric capacity of the railcars utilized and the type and specifications of crude oil loaded, among other factors.
|
|
(2)
|
Based on one 120-railcar unit train comprised of 31,800 gallon (approximately 757 bbls) railcars being loaded at 95% of volumetric capacity per day and up to 56 manifest railcars per day. Actual amount of crude oil loading capacity may vary based on factors including the size of the unit train, the size, type and volumetric capacity of the railcars utilized and the type and specifications of crude oil loaded, among other factors.
|
Our multi-year, take-or-pay terminal services agreements are primarily with high-quality, investment grade customers, including major integrated oil companies, refiners and marketers. The terminal services agreements with customers of our Hardisty terminal have an initial term of five years and extend through mid-2019. The terminal services agreements with the three customers of our Casper terminal have initial terms ranging from three to five years and extend through August 2017, October 2018, and September 2019, respectively. As of December 31, 2016, the volume-weighted average remaining contract life of our take-or-pay terminal service agreements was approximately 2.4 years.
In addition to terminalling services, we provide customers with railcars and fleet services under master fleet services agreements on a multi-year, take-or-pay basis for periods ranging from five to nine years. In the aggregate,
1
our master fleet services agreements have a weighted-average remaining contract life of
4.1
years as of December 31, 2016.
One of our key strengths is our relationship with our sponsor, USDG. USDG is the sole direct subsidiary of USD. USD and its affiliates are engaged in designing, developing, owning and managing large-scale multi-modal logistics centers and energy-related infrastructure assets across North America. USD was among the first companies to successfully develop the hydrocarbon-by-rail concept and has built or operated unit train-capable terminals with an aggregate capacity of over 850,000 Bpd. Ten of these terminals were subsequently sold in multiple transactions for an aggregate sales price in excess of $740 million. From January 2006 through December
2016
, USD has loaded or handled through its terminal network a total of over
183 million
barrels, or MMbbls, of liquid hydrocarbons and biofuels. USD also has a nationally recognized safety record with no reportable spills at any of its terminals since its inception, as defined by the U.S. Department of Transportation, or DOT, Pipeline and Hazardous Materials Safety Administration, or PHMSA. USD is currently owned by Energy Capital Partners, Goldman Sachs and certain of USD’s management team members.
On September 19, 2014, Energy Capital Partners made a significant investment in USD and indicated an intention to invest an additional $1.0 billion of equity capital in USD, subject to market and other conditions, to support future growth and expansion plans. Energy Capital Partners, together with its affiliates and affiliated funds, is a private equity firm with over $13.0 billion in capital commitments that primarily invests in North America’s energy infrastructure. Energy Capital Partners has significant energy infrastructure, midstream, master limited partnership and financial expertise to complement its investment in USD. To date, Energy Capital Partners and its affiliated funds have 21 investment platforms with investments in the power generation, electric transmission, midstream and renewable sectors of the energy industry.
USD, through its direct ownership of USDG, has stated that it intends for us to be its primary growth vehicle in North America. We intend to strategically expand our business by acquiring energy-related logistics assets related to the storage and transportation of liquid hydrocarbons and biofuels from both USDG and third parties. We also intend to grow organically by opportunistically pursuing growth projects and enhancing the profitability of our existing assets. We believe that our relationship with USD and its successful project development and operating history, safety track record and industry relationships provide us with many avenues to execute our growth strategy.
2
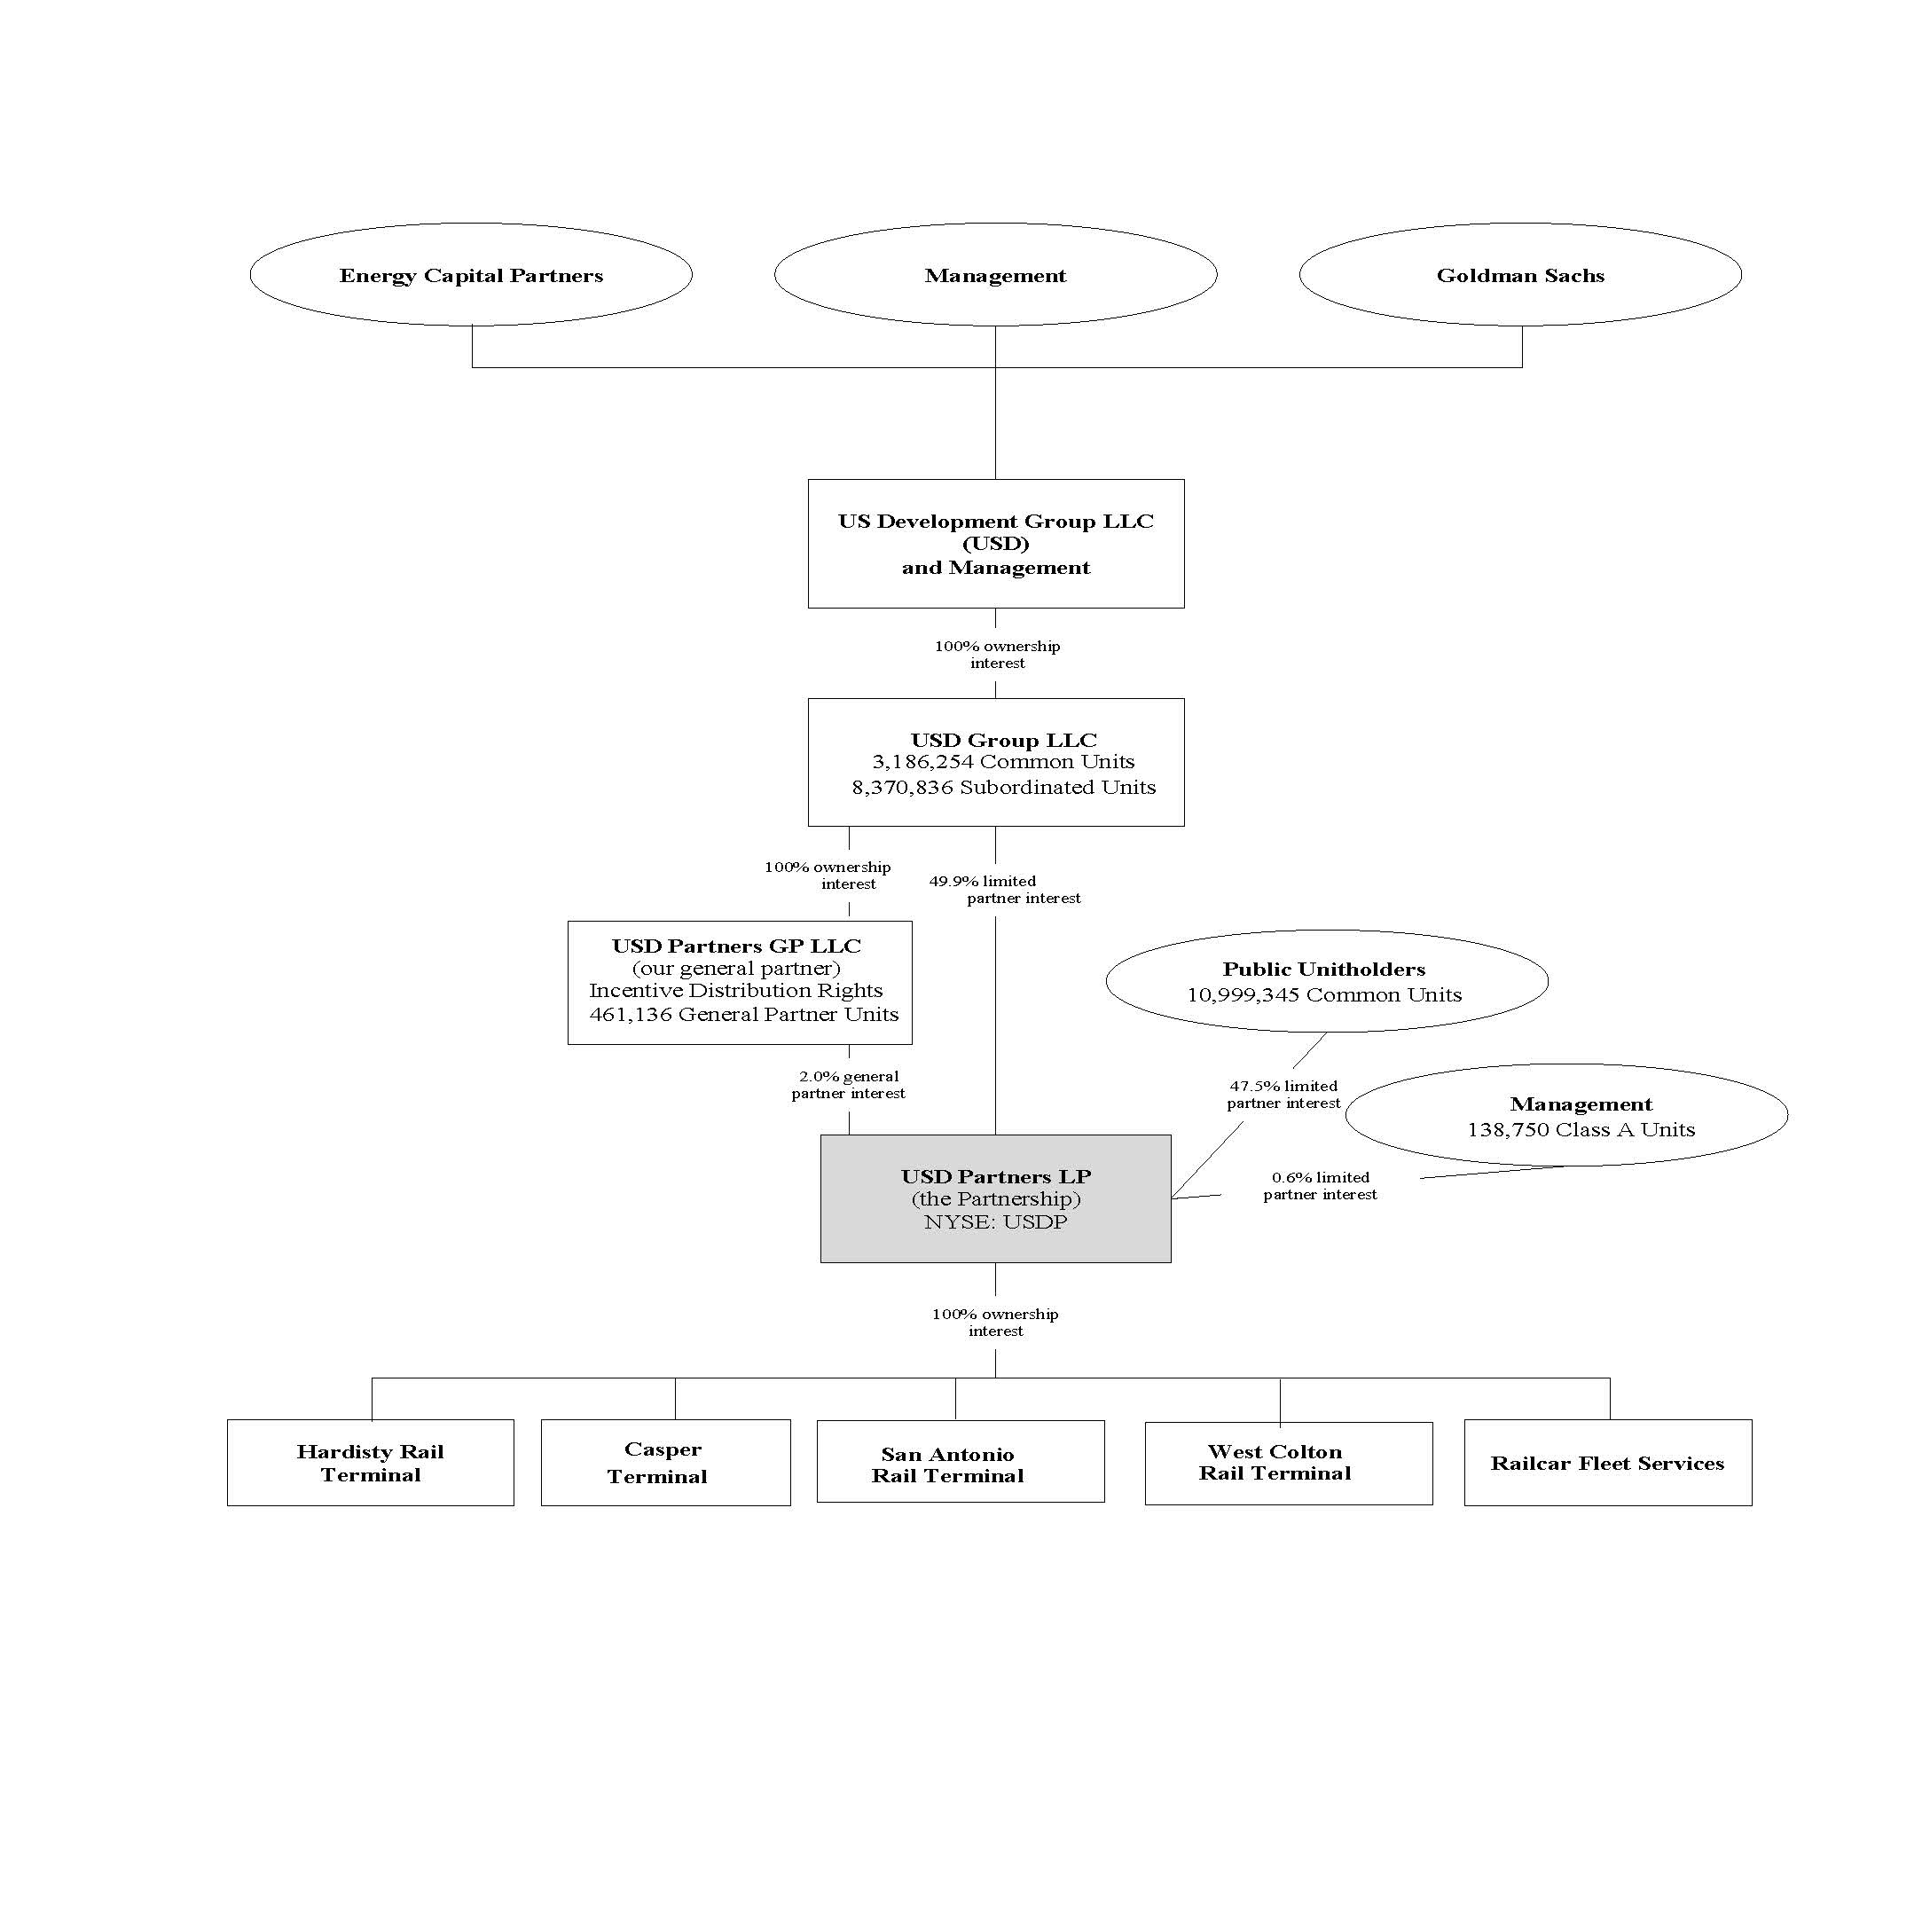
The following chart depicts a simplified organization and ownership structure as of
December 31, 2016
. The ownership percentages referred to below illustrate the relationships among us, our general partner, USDG, USD, Energy Capital Partners and Goldman Sachs, and excludes
838,863
phantom units outstanding under our Long Term Incentive Plan at
December 31, 2016
.
3
BUSINESS STRATEGY
Our primary business objective is to continue increasing the quarterly cash distributions we make to our unitholders over time. We intend to accomplish this objective by executing the following business strategies:
|
•
|
Generate stable and predictable fee-based cash flows.
Substantially all of the operating cash flow we expect to generate is attributable to multi-year, take-or-pay agreements. We intend to continue to seek stable and predictable cash flows by executing additional long-term, take-or-pay agreements with existing and new customers.
|
|
•
|
Pursue accretive acquisitions
. We intend to pursue strategic and accretive acquisitions of energy-related logistics assets related to the storage and transportation of liquid hydrocarbons and biofuels from both USD and third parties. We regularly evaluate and monitor the marketplace to identify acquisitions within our existing geographies and in new regions that may be pursued independently or jointly with USD.
|
|
•
|
Pursue organic growth initiatives
. We intend to pursue organic growth opportunities and seek operational efficiencies that complement, optimize or improve the profitability of our assets. For example, our Casper terminal includes the foundation for two additional storage tanks, which if constructed, may result in additional long-term volume commitments and cash flows.
|
|
•
|
Maintain a conservative capital structure
. We intend to maintain a conservative capital structure which, when combined with our focus on stable, fee-based cash flows, should afford us access to capital at a competitive cost. Consistent with our disciplined financial approach, we intend to fund the capital required for expansion and acquisition projects through a balanced combination of equity and debt financing. We believe this approach provides us the flexibility to effectively pursue accretive acquisitions and organic growth projects as they become available.
|
|
•
|
Maintain safe, reliable and efficient operations
. We are committed to safe, efficient and reliable operations that comply with environmental and safety regulations. We strive to continually improve operating performance through our commitment to technologically-advanced logistics and operations systems, employee training programs and other safety initiatives and programs with railroads, railcar producers and first responders. All of our facilities currently meet or exceed applicable government safety regulations and are in compliance with recently enacted orders regarding the movement of liquid hydrocarbons and biofuels by rail. We believe these objectives are integral to the success of our business as well as to our access to growth opportunities.
|
BUSINESS SEGMENTS
We conduct our business through two distinct reporting segments: Terminalling services and Fleet services.
These segments have unique business activities that require different operating strategies. For information relating to revenues from external customers, operating income and total assets for each segment, as well as by geographic area, refer to
Note 15. Segment Reporting
of our consolidated financial statements included in Item 8.
Financial Statements and Supplementary Data
of this Annual Report. For information relating to revenues from material customers, refer to
Note 17. Major Customers and Concentration of Credit Risk
of our consolidated financial statements included in Item 8.
Financial Statements and Supplementary Data
of this Annual Report.
Terminalling services
We generate substantially all of our operating cash flow by charging fixed fees for handling energy-related products and providing related services on a multi-year, take-or-pay basis. We do not take ownership of the underlying products that we handle nor do we receive any payments from our customers based on the value of such products. Thus, we have no direct exposure to risks associated with fluctuating commodity prices, although these risks could indirectly influence our activities and results of operations over the long term.
4
Our Terminalling services business consists of the following operations:
Hardisty Terminal
Our Hardisty terminal, which commenced operations on June 30, 2014, is an origination terminal where we load various grades of Canadian crude oil onto railcars for transportation to end markets. Hardisty is one of the major crude oil hubs in North America and is an origination point for export pipelines to the United States. The Hardisty terminal can load up to two 120-railcar unit trains per day and consists of a fixed loading rack with 30 railcar loading positions, a unit train staging area and loop tracks capable of holding five unit trains simultaneously. The terminal is also equipped with an on-site vapor management system that allows our customers to minimize hydrocarbon loss while improving safety during the loading process. Our Hardisty terminal receives inbound deliveries of crude oil through a direct pipeline connection from Gibson Energy Inc.'s, or Gibson's, Hardisty storage terminal. Gibson, one of the largest independent midstream companies in Canada, has 8.9 MMbbls of storage and access to most of the major pipeline systems in the Hardisty hub. The terminal's strategic location and direct pipeline connection to substantial storage capacity provides efficient access to the major producers in the region. Our Hardisty terminal is also connected to Canadian Pacific Railroad’s North Main Line, a high capacity line with the ability to service key refining markets across North America.
We have a facilities connection agreement with Gibson under which Gibson operates and maintains a 24-inch diameter pipeline and related facilities connecting Gibson’s storage terminal with our Hardisty terminal, which we operate and maintain. Gibson is responsible for transporting product through the pipeline to our Hardisty terminal. This pipeline from Gibson's storage terminal is the exclusive means by which our Hardisty terminal receives crude oil. Subject to certain limited exceptions regarding manifest train facilities, our Hardisty terminal is also the exclusive means by which crude oil from Gibson’s Hardisty storage terminal may be transported by rail. We remit pipeline fees to Gibson for the transportation of crude oil to the Hardisty terminal based on a predetermined formula. The facilities connection agreement also gives Gibson a right of first refusal in the event of a sale of our Hardisty terminal to a third party. The agreement has a 20-year term and will expire in 2034 unless renewed. Our and Gibson’s obligations under this facilities connection agreement may be suspended in the case of a force majeure event. Additionally, the agreement may be terminated by the non-defaulting party in case of specified events of default.
Substantially all of the capacity at our Hardisty terminal is contracted under multi-year, take-or-pay terminal services agreements with seven customers. Approximately 83% of the contracted capacity at our Hardisty terminal is contracted with subsidiaries of five investment grade companies that include major integrated oil companies, refiners and marketers. Each of the terminal services agreements has an initial contract term of five years that extends through mid-2019. Six of the seven Hardisty terminal service agreements have automatic one-year renewal provisions and will terminate only if written notice is given by either party within a specified time period before the end of the initial term or a renewal term. The seventh agreement will renew upon written agreement at least six months prior to the end of the initial term or the then current renewal term. Each of our terminal services agreements contain annual inflation-based rate escalators based upon the consumer price index of either Canada or Alberta. If a force majeure event occurs, a customer’s obligation to pay us may be suspended, in which case the length of the contract term will be extended by the same duration as the force majeure event. We will not be liable for any losses of crude oil handled at our Hardisty terminal unless due to our negligence.
Under the terminal services agreements we have entered into with customers of our Hardisty terminal, our customers are obligated to pay the greater of a minimum monthly commitment fee or a throughput fee based on the actual volume of crude oil loaded at our Hardisty terminal. If a customer loads fewer unit trains or barrels than its maximum allotted amount in any given month, that customer will receive a credit for up to six months, which may be used to offset fees on throughput volumes in excess of its minimum monthly commitments in future periods, to the extent capacity is available for the excess volume.
Casper Terminal
The Casper terminal, which we acquired in November 2015, is a crude oil storage, blending and railcar loading terminal located in Casper, Wyoming, where Spectra Energy Partners’ Express Pipeline from Western Canada (~280,000 Bpd of capacity) interconnects with the Platte Pipeline to Wood River, Illinois (~145,000 Bpd of capacity). The Casper
5
terminal currently offers six customer-dedicated storage tanks with 900,000 Bbls of total capacity and unit train-capable railcar loading capacity in excess of 100,000 Bpd. The terminal’s approximately 300-acre footprint and modular design allow for the addition of a second loading station and an additional 1.1 MMbbls of storage capacity with minimal disruption to existing operations and relatively low incremental capital costs.
Inbound crude oil is delivered to the Casper terminal primarily through our dedicated 24-inch diameter, six-mile direct pipeline connection from the Express Pipeline, which provides our customers with access to multiple grades of Canadian crude oil. The Casper terminal can also receive volumes through two truck unloading stations. All inbound volumes are fed directly into the customer’s dedicated storage tank(s), which enhances their ability to control the quality of the product from origin to end market. This also allows customers to blend multiple grades of crude oil to optimize the economics associated with refining varying grades of crude oil.
Outbound crude oil is loaded onto railcars and then transported to end markets by the Burlington Northern Santa Fe railroad, or the BNSF, in either manifest or unit train shipments. The terminal’s location on the BNSF’s main line offers advantaged transportation costs to key U.S. refining markets where several customer-preferred destinations are also served by the BNSF. Shipping with a single Class 1 railroad reduces railroad switching fees and enables faster train turn-times, thus improving railcar fleet utilization.
The Casper terminal commenced operations in September 2014 and is supported by multi-year, take-or-pay agreements with primarily investment grade refiner customers. The initial term of the agreements varies from three to five years, with extension or renewal options for one to three additional years. Under these terminal services agreements, our customers are obligated to pay the greater of a minimum monthly commitment fee or a throughput fee based on the actual volume of crude oil loaded. If a customer loads fewer unit trains or barrels than its maximum allotted amount in any given month, that customer will receive a credit which may be used to offset future throughput fees in excess of the minimum monthly commitment fees, to the extent capacity is available for the excess volume. Unused credits generally expire if not used by the end of each calendar quarter.
Ethanol Terminals
Our San Antonio and West Colton terminals are unit train-capable destination terminals that transload ethanol received by rail from producers onto trucks to meet local ethanol demand. Each terminal is equipped with 20 railcar offloading positions and three truck loading positions. Our terminals receive inbound deliveries exclusively by rail on the Union Pacific railroad's, or the UP's, high speed lines. Located within five miles of San Antonio's gasoline blending terminals, our San Antonio terminal can transload up to 20,000 Bpd of ethanol and is the only ethanol rail terminal within a 20-mile radius. Located less than one mile from gasoline blending terminals that supply the greater San Bernardino and Riverside County-Inland Empire region, our West Colton terminal can transload up to 13,000 Bpd of ethanol and is the only ethanol rail terminal within a ten-mile radius.
Due to corrosion concerns unique to biofuels such as ethanol, the long-haul transportation of biofuels by multi-product pipelines is less efficient and less economical than transportation by rail. We believe these corrosion concerns, combined with the proximity of our terminals to local demand markets, strategically positions our terminals to benefit from anticipated changes in environmental and gasoline blending regulations that are expected to increase the use of ethanol in the market for transportation fuel.
We receive fixed fees per gallon of ethanol transloaded at each of our ethanol terminals pursuant to terminal services agreements with subsidiaries of an investment grade company. Our San Antonio terminal services agreement entitles the customer to 100% of the terminal’s capacity through February 2017, which date was extended in January 2017 to May 1, 2017. In early February 2017, the lessor of the real property upon which the San Antonio terminal resides indicated their intent to terminate our lease with them concurrently with the conclusion of the extension agreement for terminalling services we have with our customer, at which time we expect to wind down the operations of this terminal. During the year ended December 31, 2016, our San Antonio terminal contributed less than 3% of our Adjusted EBITDA. As a result, we do not expect the termination of this agreement to have a material impact on our financial position, results of operation or cash flows in future periods, although we have recognized a non-cash impairment loss of
$3.5 million
, including an asset retirement obligation of
$1.0 million
for amounts we expect to spend to restore the
6
property to its original condition in our consolidated financial statements for the year ended
December 31, 2016
. Our West Colton terminal operates under a terminal services agreement that has been in place since July 2009 and is terminable at any time by either party upon 150 days' notice. We continue to seek permits to construct an approximately one-mile pipeline directly from our West Colton terminal to Kinder Morgan Inc.’s gasoline blending terminals, which, if approved and constructed, may result in long-term volume commitments and cash flows.
Fleet Services
We provide our customers with railcars and fleet services related to the transportation of liquid hydrocarbons and biofuels by rail under master fleet services agreements on a multi-year, take-or-pay basis for periods ranging from five to nine years. We do not own any railcars. As of
December 31, 2016
, our fleet consisted of
2,953
railcars, which we leased from various railcar manufacturers and financial entities. We have assigned certain payment and performance obligations under the leases and master fleet services agreements for
2,613
of these railcars to other parties, but we have retained certain rights and obligations with respect to the servicing of these railcars. Approximately
84%
of our current railcar fleet is dedicated to customers of our Hardisty terminal, including an affiliate of USDG. The remaining
16%
of our railcar fleet is dedicated to a customer of terminals belonging to subsidiaries previously sold by our predecessor. The master fleet services agreements we have with certain of our Hardisty terminal customers have a weighted-average remaining contract life of
4.6
years as of December 31, 2016. In the aggregate, our master fleet services agreements have a weighted-average remaining contract life of
4.1
years as of December 31, 2016.
Under the master fleet services agreements, we provide customers with railcar-specific fleet services, which may include, among other things, the provision of relevant administrative and billing services, the maintenance of railcars in accordance with standard industry practice and applicable law, the management and tracking of the movement of railcars, the regulatory and administrative reporting and compliance as required in connection with the movement of railcars, and the negotiation for and sourcing of railcars. Our customers typically pay monthly fees per railcar for these services to us and our assignees, which include a component for railcar use and a component for fleet services. The master fleet services agreements will expire unless notice to renew is provided by our customers. We believe our ability to provide access to high-quality railcars provides an incentive to secure terminalling capacity at our facilities for customers who do not otherwise have access to such railcars. We expect that the longer terms typical of fleet services agreements will also incentivize our customers to extend their initial terminal services agreements with us.
Approximately 95% of our railcars currently in service were constructed in 2013 and later. The average age of our fleet currently in service is approximately three years, as compared with the estimated 50-year life associated with these types of railcars. We have partnered with leaders in the railcar supply industry, such as CIT Rail, Union Tank Car Company, Trinity Industries and others. We believe that our relationships with these industry leaders enable us to obtain railcar market insight and to procure railcars on advantageous terms, with shorter lead times than some of our competitors. Our current railcars are designed to a minimum DOT-111 railcar standard and are built to carry between 28,000 to 31,800 gallons of bulk liquid volume.
As of
December 31, 2016
, our railcar fleet consisted of a mix of
2,108
C&I railcars and
845
non-coiled, non-insulated railcars. Our C&I railcars can reheat heavy viscous grades of crude oil, reducing the need to blend these heavier grades with diluents.
BENEFITS OF RAIL
The following benefits of rail have become a primary focus for producers, refiners, marketers and other energy-related market participants, and as such, have established, or have the potential to establish, rail as a preferred mode of transportation for crude oil as well as refined petroleum products, biofuels, natural gas liquids, or NGLs, and frac sand/proppant:
Access to areas without existing or easily accessible transportation infrastructure
. Many producing regions, such as the Western Canadian oil sands, have concentrated production in areas with limited existing pipeline takeaway capacity. The extensive existing rail infrastructure network provides efficient takeaway capacity to these producing regions and access to multiple demand centers.
7
Faster deployment
. Rail terminals can be constructed at a fraction of the time required to lay a long-haul pipeline, providing a timely solution to meet new and evolving market demands. Relative to rail, new pipeline construction faces challenges such as lengthier build times and more extensive environmental permitting processes, geographic constraints and, in some cases, the lack of required political and regulatory support.
Flexibility to deliver to different end markets
. Unlike pipelines, which typically transport product to a single demand market, rail offers producers and shippers access to many of the most advantageous demand centers throughout North America, enabling producers and shippers to obtain competitive prices for their products and to retain the flexibility to determine the ultimate destination until the time of transportation.
Comprehensive solution for refiners
. Rail provides refiners flexible access to multiple qualities and grades of crude oil (feedstock) from multiple production sources. Additionally, shipping in railcars improves the ability to preserve the specific quality of the product over long distances relative to pipelines.
Faster delivery to demand markets
. Rail can transport energy-related products to end markets much faster than pipelines, trucks or waterborne tankers. While a pipeline can take 30-45 days to transport crude oil to the Gulf Coast from Western Canada, unit trains can move crude oil along a similar path in approximately nine days.
Reduced shipper commitment requirements
. Whereas all of the pipeline transportation fee is typically subject to long-term shipper commitments, only a portion of rail transportation costs require long-term shipper commitments (railroads are typically contracted on a spot basis). Consequently, pipeline customers bear greater risk of shifts in regional price differentials and the location of demand markets.
Reduced shipper transportation cost
. Rail provides shippers a competitive transportation option, particularly in situations where either (i) the amount of diluent required for the transportation of crude oil by pipeline is high, which is generally the case for production from the Canadian oil sands, or (ii) multiple modes of transportation are required to reach a particular end market.
FUTURE GROWTH OPPORTUNITIES
We apply a disciplined approach to pursuing our growth strategy, which may include organic growth initiatives as well as acquisitions of energy-related logistics assets. Potential acquisitions may include assets developed by our sponsor or by third party logistics providers.
Our sponsor is currently pursuing several development projects related to the storage and transportation of liquid hydrocarbons and biofuels. These development projects are expected to be supported by long-term, take-or-pay agreements with strategic customers which would generate stable and predictable cash flows. Energy Capital Partners has indicated an intention to invest an additional $1.0 billion of equity capital in USD, subject to market and other conditions, to support future growth and expansion plans.
U.S. Gulf Coast
In October 2015, our sponsor announced a joint venture to develop a premier U.S. Gulf Coast logistics terminal on a 988-acre parcel of property on the Houston Ship Channel. Its strategic location is uniquely positioned to provide customers with flexible market access to key demand centers, both domestic and abroad. Preliminary master planning efforts suggest that the property footprint is capable of supporting up to ten to twelve million barrels of storage capacity, multiple docks (including barge and deep water), and a rail terminal with capacity to unload multiple unit trains per day. The property is in proximity to substantially all major inbound and outbound pipelines and can be directly accessed by multiple Class 1 railroads.
Worldwide consumption of liquid fuels is estimated to have increased by over one million barrels per day in 2016 and is projected to increase by another three million barrels per day by 2018. Recent industry developments highlight the Gulf Coast’s strategic importance within global energy markets and ability to meet growing demand. Exports of crude oil from PADD 3 have increased more than twenty percent since the lifting of the export ban in December 2015. Additionally, PADD 3 exports of petroleum products have increased ten percent over the last year and
8
thirty five percent over the last two years. Finally, given expected growth in Permian Basin crude oil production, industry participants have announced plans to add more than 600,000 Bpd of pipeline capacity to transport crude oil from West Texas to the Houston refining and distribution hub for domestic consumption or export to other markets.
Our sponsor expects that these industry dynamics will contribute to growing demand for storage, staging, blending, export and other logistics services along the Gulf Coast, including at its Houston Ship Channel property. Accordingly, our sponsor is actively engaged in commercial negotiations with potential customers to provide solutions for crude oil, biofuels and refined products.
Western Canada
Western Canadian crude oil production is projected to increase throughout the next decade, driven primarily by developments in Alberta’s oil sands region. In June 2016, the Canadian Association of Petroleum Producers projected that the supply of crude oil from Western Canada will grow by approximately 590,000 Bpd by 2020 and 890,000 Bpd by 2025 relative to 2015. Since then, several companies have announced plans to increase production capacity at their oil sands facilities, in part due to cost savings and optimization achieved during the recent commodity price downturn.
For example, Canadian Natural Resources recently announced plans to reinstate the development of the 40,000 Bpd Kirby North project and the evaluation of an opportunity to debottleneck the Horizon fractionation tower during upcoming turnaround work, in order to increase production by 5,000 to 15,000 Bpd. Cenovus Energy announced plans to resume construction on its 50,000 Bpd Christina Lake Phase G project and is advancing engineering work on two previously deferred expansion projects that total 75,000 Bpd of expected design capacity. MEG Energy announced an initiative at its Christina Lake Phase 2B project that is expected to increase production by approximately 20,000 Bpd. Consistent with these trends, our partner, Gibson Energy, recently commissioned ahead of schedule 2.9 million barrels of incremental storage capacity at the Hardisty hub, representing a nearly 50% increase. Gibson successfully secured short term contracts to utilize the tanks, as necessary, until the long-term, take-or-pay contracts commence later in 2017.
Certain end users, including refineries across North America, have made substantial investments in recent years in order to efficiently process heavy grades of crude oil, such as those from Western Canada. Even with recent regulatory approvals, additions to pipeline takeaway capacity are not expected to keep pace with production growth over the next several years. As a result, multiple industry forecasts project demand for rail takeaway solutions will increase in 2017 and 2018. We believe our Hardisty and Casper terminals, with established capacity and scalable designs, are well-positioned as strategic locations to meet expected future takeaway needs.
Our sponsor retained the right to develop certain expansions of our Hardisty terminal, which they are actively pursuing. These expansions may include solutions to transport heavier grades of crude oil produced in Western Canada, which our sponsor believes will maximize benefits to producers, refiners and railroads.
Right of First Offer
In connection with our IPO, we entered into an omnibus agreement with USD and USDG, pursuant to which we were granted a right of first offer on any midstream infrastructure assets that they may develop, construct, or acquire for a period of seven years after the October 15, 2014, closing of our IPO. Additional information about the omnibus agreement and the right of first offer are included in this Annual Report under
Item 13. Certain Relationships and Related Transactions, and Director Independence
.
We cannot assure you that USD will be able to develop or construct, or that we or USD will be able to acquire, any additional midstream infrastructure projects. Among other things, the ability of USD to further develop the Hardisty terminal, or any other project, and our ability to acquire such projects, will depend upon USD’s and our ability to raise additional equity and debt financing. We are under no obligation to make any offer, and USD and USDG are under no obligation to accept any offer we make, with respect to any asset subject to our right of first offer. Additionally, the approval of Energy Capital Partners is required for the sale of any assets by USD or its subsidiaries, including us (other than sales in the ordinary course of business), acquisitions of securities of other entities that exceed specified materiality thresholds and any material unbudgeted expenditures or deviations from our approved budgets. Energy Capital Partners may make these decisions free of any duty to us and our unitholders. This approval would be required for the potential
9
acquisition by us of any projects to expand the Hardisty terminal, as well as any other projects or assets that USD may develop or acquire in the future or any third party acquisition we may pursue independently or jointly with USD. Energy Capital Partners is under no obligation to approve any such transaction. Please refer to the discussion under
Item 10. Directors, Executive Officers and Corporate Governance-Special Approval Rights of Energy Capital Partners
regarding the rights of Energy Capital Partners. If we are unable to acquire any projects to expand the Hardisty terminal from USD, which USD retained the right to develop and operate at the time of our IPO, these expansions may compete directly with our Hardisty terminal for future throughput volumes, which may impact our ability to enter into new terminal services agreements, including with our existing customers, following the termination of our existing agreements, or the terms thereof, and our ability to compete for future spot volumes. Furthermore, cyclical changes in the demand for crude oil and other liquid hydrocarbons may cause USD, or us, to further re-evaluate any future expansion projects, including expansion of the Hardisty terminal.
COMPETITION
The energy-related logistics infrastructure business is highly competitive. The ability to secure additional agreements for rail terminalling and railcar fleet services is primarily based on the availability of alternative means of transportation, primarily pipelines, as well as the reputation, efficiency, flexibility, location, market economics and reliability of the services provided and pricing for those services.
Our Hardisty and Casper terminals face competition from other logistics services providers, such as pipelines and other terminalling service providers. In addition, our customers may also choose to construct or acquire their own terminalling assets. If our customers choose to ship crude oil via alternative means, we may only receive the minimum monthly commitment fees at our Hardisty and Casper terminals and may be unable to renew, extend or replace customer agreements following expiration of their terms. Our ethanol terminalling business faces competition from other terminals and trucks that may be able to supply end-user markets with ethanol and other biofuels on a more competitive basis due to terminal location, price, versatility or services provided. Both of our ethanol terminals are served by the UP. In the Southern California market, we compete directly with ethanol facilities in the Fontana, Carson and San Diego areas, which are served by the BNSF. A combination of rail freight and trucking economics, which comprise the largest share of the value chain, make it very difficult to compete with other facilities in this market based on terminalling throughput fees alone.
Our railcar fleet services face competition from other providers of railcars. This competition may limit our ability to increase the number of railcars under contract, and thus, limit our ability to increase our revenues. However, we believe our relationships with leaders in the railcar supply industry such as CIT Rail, Union Tank Car Company and Trinity Industries, will enable us to continue procuring railcars on advantageous terms.
We believe that we are favorably positioned to compete in our industry due to the strategic location of our terminals, quality of service provided at our terminals, our independent strategy, our reputation and industry relationships, and the versatility and complementary nature of our services. The competitiveness of our service offerings could be significantly impacted by the entry of new competitors into the markets in which we operate. However, we believe that significant barriers to entry exist in the energy-related logistics business. These barriers include significant costs and execution risk, a lengthy permitting and development cycle, financing challenges, shortage of personnel with the requisite expertise, and a finite number of sites suitable for development.
SEASONALITY
The amount of throughput at our terminals is affected by the level of supply and demand for crude oil, refined products and biofuels, as well as, to a lesser extent, seasonality. Demand for gasoline is generally higher during the summer months than during the winter months due to seasonal increases in highway traffic and construction work. Production in Western Canada may be impeded by severe winter conditions that reduce production and volumes. However, many effects of seasonality on our revenues are substantially mitigated due to our terminal service agreements with our customers that include minimum monthly commitment fees, as well as our master fleet services agreements which require our customers to pay a base monthly fee per railcar. Furthermore, because there are multiple end markets for the crude oil and biofuels handled at our terminals, the effect of seasonality otherwise attributable to one particular end market is mitigated.
10
IMPACT OF REGULATION
General
Our operations are subject to complex and frequently-changing federal, state, provincial and local laws and regulations regarding the protection of health, property and the environment, including laws and regulations that govern the handling and release of crude oil and other liquid hydrocarbon materials. Compliance with existing and anticipated environmental and safety laws and regulations increases our overall cost of business, including our capital costs to construct, maintain, operate, and upgrade equipment and facilities. While these laws and regulations may affect our maintenance capital expenditures and net income, customers typically place additional value on utilizing established and reputable third-party providers to satisfy their terminalling and logistics needs. As a result, we expect to increase our market share in relation to customer-owned operations or smaller operators that lack an established track record of safety and environmental compliance.
Violations of environmental or safety laws or regulations can result in the imposition of significant administrative, civil and criminal fines and penalties and, in some instances, injunctions banning or delaying certain activities. We believe our facilities are in substantial compliance with applicable environmental and safety laws and regulations. However, these laws and regulations are subject to frequent change at the federal, state, provincial and local levels, and the legislative and regulatory trend has been to place increasingly stringent limitations on activities that may affect the environment.
Our operations contain risks of accidental releases into the environment, such as releases of crude oil, ethanol or hazardous substances from our terminals. To the extent an event is not covered by our insurance policies, such accidental releases could subject us to substantial liabilities arising from environmental cleanup and restoration costs, claims made by neighboring landowners and other third parties for personal injury and property damage, and fines or penalties for any related violations of environmental or safety laws or regulations.
Air Emissions
Our operations are subject to and affected by the Clean Air Act, or CAA, and its implementing regulations, as well as comparable state and local statutes and regulations. Our operations are subject to the CAA’s permitting requirements and related emission control requirements relating to specific air pollutants, as well as the requirement to maintain a risk management program to help prevent accidental releases of certain regulated substances. We are currently required to obtain and maintain various construction and operating permits under the CAA and have incurred capital expenditures to maintain compliance with all applicable federal and state laws regarding air emissions. We may, nonetheless, be required to incur additional capital expenditures in the near future for the installation of certain air pollution control devices at our terminals when regulations change, we add new equipment, or when we modify our existing equipment. Our Canadian operations are similarly subject to federal and provincial air emission regulations.
Our customers are also subject to, and similarly affected by, environmental regulations restricting air emissions. These include U.S. and Canadian federal and state or provincial actions to develop programs for the reduction of greenhouse gas, or GHG, emissions such as proposals to create a cap-and-trade system that would require companies to purchase carbon dioxide emission allowances for emissions at manufacturing facilities and emissions caused by the use of the fuels sold. In addition, the U.S. Environmental Protection Agency, or EPA, has begun to regulate carbon dioxide emissions. As a result of these regulations, our customers could be required to undertake significant capital expenditures, operate at reduced levels, and/or pay significant penalties. We are uncertain what our customers’ responses to these emerging issues will be. Those responses could reduce throughput at our terminals, as well as impact our cash flows and our ability to make distributions or satisfy debt obligations.
Climate Change
Following its December 2009 “endangerment finding” that GHG emissions pose a threat to public health and welfare, the EPA has begun to regulate GHG emissions under the authority granted to it by the federal CAA. Based on these findings, the EPA has adopted regulations under existing provisions of the federal CAA that require Prevention of Significant Deterioration, or PSD, pre-construction permits and Title V operating permits for GHG emissions from certain large stationary sources. Under these regulations, facilities required to obtain PSD permits must meet “best
11
available control technology” standards for their GHG emissions established by the states or, in some cases, by the EPA on a case-by-case basis. The EPA has also adopted rules requiring the monitoring and reporting of GHG emissions from specified sources in the United States, including, among others, certain onshore oil and natural gas processing and fractionating facilities and, starting in October 2015, onshore petroleum and natural gas gathering and boosting activities as well as natural gas transmission pipelines. We believe we are in substantial compliance with all GHG emissions permitting and reporting requirements applicable to our operations.
In response to studies suggesting that emissions of CO
2
, methane and certain other gases may be contributing to warming of the Earth’s atmosphere, over 190 countries, including the United States and Canada where we operate, committed to a legally binding treaty to reduce GHG emissions, the terms of which were defined at the Paris climate conference in December 2015. The terms of the Paris treaty to reduce GHG emissions are to become effective in 2020. With regard to the oil and gas industry, it is unclear at this time what direction the governments of the United States or Canada plan to take. Increased costs associated with compliance with any future legislation or regulation of GHG emissions, if it occurs, may have a material adverse effect on our results of operations, financial condition and cash flows. In addition, climate change legislation and regulations may result in increased costs not only for our business but also for our customers, thereby potentially decreasing demand for our services. Decreased demand for our services may have a material adverse effect on our results of operations, financial condition and cash flows. Finally, many scientists believe that increasing concentrations of GHGs in the Earth's atmosphere produce climate changes that can have significant physical effects, such as increased frequency and severity of storms, droughts and floods, as well as other climatic events. If any such effects were to occur, it is uncertain if they would have an adverse effect on our financial condition and results of operations.
Waste Management and Related Liabilities
To a large extent, the environmental laws and regulations affecting our operations relate to the release of hazardous substances or solid wastes into soils, groundwater, and surface water, and include measures to control pollution of the environment. These laws generally regulate the generation, storage, treatment, transportation, and disposal of solid and hazardous waste. They also require corrective action, including investigation and remediation, at a facility where such waste may have been released or disposed.
Site Remediation
. The federal Comprehensive Environmental Response, Compensation, and Liability Act, commonly referred to as CERCLA or Superfund, and comparable state laws impose liability without regard to fault or to the legality of the original conduct on certain classes of persons regarding the presence or release of a “hazardous substance” in (or into) the environment. Those persons include the former and present owner or operator of the site where the release occurred and the transporters and generators of the hazardous substance found at the site. Under CERCLA, these persons may be subject to joint and several liability for the costs of cleaning up the hazardous substances and for damages to natural resources. CERCLA also authorizes the EPA and, in some instances, third parties, to act in response to threats to the public health or the environment and to seek to recover the costs they incur from the
responsible classes of persons. Claims filed for personal injury and property damage allegedly caused by hazardous substances or other pollutants released into the environment are not uncommon from neighboring landowners and other
third parties. Petroleum products are typically excluded from CERCLA’s definition of “hazardous substances.” In the ordinary course of operating our business, we do not handle wastes that are designated as hazardous substances and, as a result, we have limited exposure under CERCLA for all or part of the costs required to clean up sites at which hazardous substances have been released into the environment. Costs for any such remedial actions, as well as any related claims, could have a material adverse effect on our maintenance capital expenditures and operating expenses to the extent not covered by insurance. Canadian and provincial laws also impose liabilities for releases of certain substances into the environment.
We currently own or lease properties where hydrocarbons are currently handled or have been handled for many years. Although we have utilized operating and disposal practices that were standard in the industry at the time, petroleum hydrocarbons or other wastes may have been disposed of or released on or under the properties owned or leased by us, or on or under other locations where these wastes have been taken for disposal. These properties and wastes disposed thereon may be subject to CERCLA, the federal Resource Conservation and Recovery Act, as amended, or RCRA, and comparable state and Canadian federal and provincial laws and regulations. Under these laws and regulations, we could be required to remove or remediate previously disposed wastes (including wastes disposed of or released by prior owners or operators), to clean up contaminated property (including contaminated groundwater), or to perform remedial
12
operations to prevent future contamination. We have not been identified by any state or federal agency as a Potentially Responsible Party under CERCLA in connection with the transport and/or disposal of any waste products to third-party disposal sites. We maintain insurance of various types with varying levels of coverage that we consider adequate under the circumstances to cover our operations and properties. The insurance policies are subject to deductibles and retention levels that we consider reasonable and not excessive. Consistent with insurance coverage generally available in the industry, in certain circumstances our insurance policies provide limited coverage for losses or liabilities relating to certain pollution events, including gradual pollution or sudden and accidental occurrences.
Solid and Hazardous Wastes
. Our operations generate solid wastes, including some hazardous wastes, which are subject to the requirements of RCRA and analogous state and Canadian federal and provincial laws that impose requirements on the handling, storage, treatment and disposal of hazardous wastes. Many of the
wastes that we generate are not subject to the most stringent requirements of RCRA because our operations generate primarily oil and gas wastes, which currently are excluded from consideration as RCRA hazardous wastes. Specifically, RCRA excludes from the definition of hazardous waste produced waters and other wastes intrinsically associated with the exploration, development, or production of crude oil and natural gas. However, these oil and gas exploration and production wastes may still be regulated under state solid waste laws and regulations. Oil and gas wastes may be included as hazardous wastes under
RCRA in the future, in which event our wastes as well as the wastes of our competitors will be subject to more rigorous and costly disposal requirements, resulting in additional capital expenditures or operating expenses.
Water
The Federal Water Pollution Control Act, as amended, also known as the Clean Water Act, or CWA, and analogous state and Canadian federal and provincial laws impose restrictions and strict controls regarding the discharge of pollutants into navigable waters of the United States or into any type of water body in Canada, as well as state and provincial waters. Federal, state and provincial regulatory agencies can impose administrative, civil and/or criminal penalties for non-compliance with discharge permits or other requirements of the CWA and comparable laws, in addition to requiring remedial action to clean up such water body and surrounding land.
The Oil Pollution Act of 1990, or OPA, amended certain provisions of the CWA, as they relate to the release of petroleum products into navigable waters. OPA subjects owners of facilities to strict, joint and potentially unlimited liability for containment and removal costs, natural resource damages, and certain other consequences of an oil spill. These laws impose regulatory burdens on our operations. We believe that we are in substantial compliance with applicable OPA requirements. State and Canadian federal and provincial laws also impose requirements relating to the prevention of oil releases and the remediation of areas affected by releases when they occur. We believe that we are in substantial compliance with all such federal, state and Canadian requirements.
Endangered Species Act
The Endangered Species Act restricts activities that may affect endangered species or their habitats. While some of our facilities are in areas that may be designated as habitat for endangered species, we believe that we are in substantial compliance with the Endangered Species Act. However, the discovery of previously unidentified endangered species could cause us to incur additional costs or become subject to operating restrictions or bans in the affected area.
Rail Safety
We facilitate the transport of crude oil and related products by rail in the United States and Canada. We do not own or operate the railroads on which crude-oil-carrying railcars are transported; however, we currently lease or manage a large railcar fleet on behalf of our customers. Accordingly, we are indirectly subject to regulations governing railcar design and manufacture, and increasingly stringent regulations pertaining to the shipment of crude oil by rail.
High-profile accidents involving crude oil unit trains in Quebec, North Dakota, Virginia, West Virginia and Illinois, have raised concerns about the environmental and safety risks associated with transporting crude oil by rail, and the associated risks arising from railcar design. In August 2013, the Federal Railroad Administration, or FRA, issued both an Action Plan for Hazardous Materials Safety and an order imposing new standards on railroads for properly securing rolling equipment. A proposed rule with regard to the latter was subsequently released in September 2014. In August 2013, the FRA and PHMSA began conducting inspections of crude-oil-carrying railcars from the Bakken
13
formation to make sure cargo is properly identified to railroads and emergency responders. In February 2014, the DOT and transportation industry agreed to certain voluntary measures designed to enhance the safety of crude oil shipments by rail, which include lowering speed limits for crude oil trains traveling in high-risk areas, modifying routes to avoid such high-risk areas, increasing the frequency of track inspections, implementing improved braking mechanisms, and improving the training of certain emergency responders.
In February 2014, as amended and restated in March 2014, the DOT issued another order, immediately requiring all carriers who transport crude oil from the Bakken region by rail to ensure that the product is properly tested and classified in accordance with federal safety regulations, and further requiring that all crude oil shipments be designated in the two highest risk categories, effectively mandating that crude oil be transported in more robust railcars. Any person failing to comply with the order is subject to potential civil penalties up to $175,000 for each violation or for each day they are found to be in violation, as well as potential criminal prosecution. Similarly, in February 2014, the Canadian Department of Transport, which we refer to as Transport Canada, finalized new regulations requiring shippers and carriers of crude oil by rail to properly sample, classify, certify and disclose certain characteristics of the crude oil being shipped, and gave shippers and carriers six months to comply with these new regulatory procedures. In April 2014, the Canadian Minister of Transport, who oversees Transport Canada, announced a series of directives and other actions to address the Transportation Safety Board of Canada’s initial recommendations on rail safety. Effective immediately, Transport Canada prohibited the least crash-resistant and non-upgraded or retrofitted DOT-111 railcars from carrying dangerous goods. Additionally, Transport Canada ordered DOT-111 railcars used to transport crude oil and ethanol that are not compliant with required safety standards be phased out or retrofitted by May 2017; thereafter, retrofitted DOT-111 railcars will be permitted to be used only with respect to certain packing groups until May 2025. We currently provide railcar services for 2,953 railcars, 375 of which will still be under contract and require retrofitting pursuant to this directive. The remaining railcars either have leases that will expire before they are required to be retrofitted, or already meet the requirements of the directive. We do not own any of the railcars in our railcar fleet and are not directly responsible for costs associated with the retrofitting of DOT-111 railcars. However, costs associated with the retrofitting of railcars would increase the incremental monthly cost of the applicable railcar lease, which cost we would seek to pass through to our customers and could affect demand for our services. We are currently working with our railcar suppliers on modification scheduling in an attempt to avoid disruptions. Transport Canada also identified key routes and revised operating practices put in place for the transportation of crude oil on those routes.
In May 2014, the DOT issued another order, immediately requiring railroads operating trains carrying more than one million gallons of Bakken crude oil to notify State Emergency Response Commissions regarding the estimated volume, frequency, and transportation route of those shipments. Also in May 2014, the FRA and PHMSA issued a joint Safety Advisory to the rail industry advising those shipping or offering Bakken crude oil to use railcar designs with the highest available level of integrity and to avoid using older legacy DOT-111 or CTC-111 railcars. In July 2014, Transport Canada adopted the CPC-1232 technical standards as the minimum safety threshold for railcars transporting dangerous goods after May 2017.
In May 2015, the DOT, in coordination with Transport Canada, finalized new rail safety rules. The final rule includes more stringent construction standards for rail tank cars constructed after October 1, 2015. The final rule also creates a new North American tank car standard known as the DOT Specification 117 (DOT-117) with thicker steel and redesigned bottom outlet valves, among other improvements, over the DOT-111 tank car. U.S. crude oil shippers will have until January 1, 2018, to phase out or upgrade older DOT-111 tank cars, while Canadian shippers will be required to phase DOT-111 cars out of crude oil service by May 1, 2017. The rule will also require companies hauling crude in the U.S. or Canada to retrofit or phase out non-jacketed CPC-1232 tank cars by April 1, 2020. In addition, the final rule includes mandates for using electronically controlled pneumatic braking systems and for performing routing analyses and makes permanent the provisions of an emergency order issued by DOT in April 2015 imposing a speed limit of 40 miles per hour (mph) in high-threat urban areas for crude oil trains containing at least one older-model tank car. The speed limit for all other crude-by-rail service will be restricted to 50 mph, in line with the speed limit railroads voluntarily adopted in 2013. The final rule requires offerors to develop and carry out sampling and testing programs for all unrefined petroleum-based products, including crude oil, and to certify that hazardous materials subject to the program are packaged in accordance with the test results, but does not require oil companies to process their products to make them less volatile before shipment.
14
We believe that the current retrofit timelines that have been released to date should provide us with sufficient time to make any changes to our railcar fleet that is required due to these new regulations. Nearly 95% of our fleet was manufactured in 2013 and 2014 and has been constructed to the CPC-1232 standard. Were DOT to adopt more strict specifications for tank cars, it would likely result in increased difficulty and costs to obtain compliant cars after the applicable phase-out dates. While we may be able to pass some of these costs on to our customers, there may be additional costs that we cannot pass on to our customers. We are continuously monitoring the railcar regulatory landscape and remain in close contact with railcar suppliers and other industry stakeholders to stay informed of railcar regulation rulemaking developments. Given the current railcar design compliance requirements and timelines outlined in the most recent Transport Canada and DOT rules, we do not anticipate a material impact to our ability to transport crude oil under our existing contracts. If future rulemakings result in more stringent design requirements and compressed compliance timelines, then our ability to transport these volumes could be affected by a delay in the railcar industry’s ability to provide adequate railcar modification repair services. We may not have access to a sufficient number of compliant cars to transport the required volumes under our existing contracts. This may lead to a decrease in revenues and other consequences.
The adoption of additional federal, state, provincial or local laws or regulations, including any voluntary measures by the rail industry regarding railcar design or crude oil and liquid hydrocarbon rail transport activities, or efforts by local communities to restrict or limit rail traffic involving crude oil, could affect our business by increasing compliance costs and decreasing demand for our services, which could adversely affect our financial position and cash flows.
Crude Oil Pipeline Safety
In connection with our acquisition of the Casper terminal and related facilities, we became subject to regulation by the Federal Energy Regulatory Commission, or FERC, the DOT through PHMSA, as well as other federal, state and local laws and regulations relating to the operation of our dedicated crude oil pipeline, rates charged for transportation service, and protection of health, property and the environment. The transportation and storage of crude oil and refined petroleum products involve a risk that hazardous liquids may be released into the environment, potentially causing harm to the public or the environment. In turn, such incidents may result in substantial expenditures for response actions, significant government penalties, liability to government agencies for natural resources damages, and significant business interruption. DOT has adopted safety regulations with respect to the design, construction, operation, maintenance, inspection and management of our crude oil pipeline and related assets. These regulations contain requirements for the development and implementation of pipeline integrity management programs, which include the inspection and testing of pipelines and necessary maintenance or repairs. These regulations also require that pipeline operation and maintenance personnel meet certain qualifications and that pipeline operators develop comprehensive spill response plans.
We are subject to regulation by the DOT under the Hazardous Liquid Pipeline Safety Act of 1979, also known as the HLPSA. The HLPSA delegated to DOT the authority to develop, prescribe, and enforce minimum federal safety standards for the transportation of hazardous liquids by pipeline. Congress also enacted the Pipeline Safety Act of 1992, also known as the PSA, which added the environment to the list of statutory factors that must be considered in establishing safety standards for hazardous liquid pipelines, required that regulations be issued to define the term “gathering line” and that safety standards for certain “regulated gathering lines” be established, and mandated that regulations be issued to establish criteria for operators to use in identifying and inspecting pipelines located in High Consequence Areas, or HCAs, defined as those areas that are unusually sensitive to environmental damage, that cross a navigable waterway, or that have a high population density. In 1996, Congress enacted the Accountable Pipeline Safety and Partnership Act, also known as the APSPA, which limited the operator identification requirement mandate to pipelines that cross a waterway where a substantial likelihood of commercial navigation exists, required that certain areas where a pipeline rupture would likely cause permanent or long-term environmental damage be considered in determining whether an area is unusually sensitive to environmental damage, and mandated that regulations be issued for the qualification and testing of certain pipeline personnel. In the Pipeline Inspection, Protection, Enforcement, and Safety Act of 2006, also known as the PIPES Act, Congress required mandatory inspections for certain U.S. crude oil and natural gas transmission pipelines in HCAs and mandated that regulations be issued for low-stress hazardous liquid pipelines and pipeline control room management. We are also subject to the Pipeline Safety, Regulatory Certainty and Job Creation Act of 2011, which reauthorized funding for federal pipeline safety programs through 2015, increased penalties for safety violations,
15
established additional safety requirements for newly constructed pipelines, and required studies of certain safety issues that could result in the adoption of new regulatory requirements for existing pipelines. The Protecting Our Infrastructure of Pipelines and Enhancing Safety Act of 2016 reauthorized the federal pipeline safety programs of PHMSA through 2019.
PHMSA administers compliance with these statutes and has promulgated comprehensive safety standards and regulations for the transportation of hazardous liquids by pipeline, including regulations for the design and construction of new pipeline systems or those that have been relocated, replaced or otherwise changed; pressure testing of new pipelines; operation and maintenance of pipeline systems, establishing programs for public awareness and damage prevention, and managing the operation of pipeline control rooms; protection of steel pipelines from the adverse effects of internal and external corrosion; and integrity management requirements for pipelines in HCAs. On January 13, 2017, PHMSA issued a final rule amending federal safety standards for hazardous liquid pipelines. The final rule is the latest step in a lengthy rulemaking process that began in 2010 with a request for comments and continued with publication of a rulemaking proposal in October 2015. The general effective date of this final rule is six months from publication in the Federal Register, but it is currently subject to further administrative review in connection with the transition of Presidential administrations. The final rule addresses several areas including reporting requirements for gravity and unregulated gathering lines, inspections after weather or climatic events, leak detection system requirements, revisions to repair criteria and other integrity management revisions. In addition, PHMSA issued new regulations on January 23, 2017, on operator qualification, cost recovery, accident and incident notification and other pipeline safety changes. These new regulations are effective March 24, 2017. These regulations are also subject, however, to potential further review in connection with the transition of Presidential administrations. We do not anticipate that we would be impacted by either of these regulatory initiatives to any greater degree than other similarly situated competitors upon their going into effect.
We monitor the structural integrity of our pipeline system through a program of periodic internal assessments using high resolution internal inspection tools, as well as hydrostatic testing and direct assessment that conforms to federal standards. We accompany these assessments with a review of the data and repair anomalies, as required, to ensure the integrity of the pipeline. We then utilize sophisticated risk algorithms and a comprehensive data integration effort to ensure that the highest risk areas receive the highest priority for scheduling subsequent integrity assessments. We use external coatings and impressed current cathodic protection systems to protect against external corrosion. We conduct all cathodic protection work in accordance with National Association of Corrosion Engineers standards. We continually monitor, test, and record the effectiveness of these corrosion inhibiting systems.
Crude Oil Pipeline Rate Regulation
The rates we charge for use of our dedicated crude oil pipeline are subject to regulation by various federal, state and local agencies. FERC regulates the transportation of crude oil on our dedicated Casper pipeline under the Interstate Commerce Act, or ICA, Energy Policy Act of 1992, or EPAct 1992, and the rules and regulations promulgated under those laws. FERC regulations require that rates charged by pipelines that provide transport services in interstate or foreign commerce for crude oil and refined petroleum products (collectively referred to as “petroleum pipelines”) and certain other liquids be just and reasonable, not unduly discriminatory, and not confer any undue preference upon any shipper. FERC regulations also require interstate common carrier petroleum pipelines to file with FERC and publicly post tariffs stating their transportation rates and terms and conditions of service. Under the ICA, FERC or interested persons may challenge existing or changed rates or services. FERC is authorized to investigate such charges and may suspend the effectiveness of a new rate for up to seven months. A successful rate challenge could result in a common carrier paying refunds together with interest for the period that the rate was in effect. FERC may also order a pipeline to change its rates and may require a common carrier to pay shippers reparations for damages sustained for a period up to two years prior to the filing of a complaint.
EPAct 1992 required FERC to establish a simplified and generally applicable methodology to adjust tariff rates for inflation for interstate petroleum pipelines. As a result, FERC adopted an indexing rate methodology which, as currently in effect, allows common carriers to change their rates within prescribed ceiling levels that are tied to changes in the Producer Price Index for Finished Goods, or PPIFG. FERC’s indexing methodology is subject to review every five years. During the five-year period commencing July 1, 2011 and ending June 30, 2016, common carriers charging
16
indexed rates were permitted to adjust their indexed ceilings annually by PPIFG plus 2.65%. Beginning July 1, 2016, the indexing method provided for annual changes equal to the change in PPIFG plus 1.23%. The indexing methodology is applicable to existing rates, including grandfathered rates, with the exclusion of market-based rates. A pipeline is not required to raise its rates up to the index ceiling, but it is permitted to do so and rate increases made under the index are presumed to be just and reasonable unless a protesting party can demonstrate that the portion of the rate increase resulting from application of the index is substantially in excess of the pipeline’s increase in costs. Under the indexing rate methodology, in any year in which the index is negative, pipelines must file to lower their rates if those rates would otherwise be above the rate ceiling. In October 2016, FERC issued an Advance Notice of Proposed Rulemaking seeking comment on a number of proposals, including: (1) whether the Commission should deny any increase in a rate ceiling or annual index-based rate increase if a pipeline’s revenues exceed total costs by 15% for the prior two years; (2) a new percentage comparison test that would deny a proposed increase to a pipeline’s rate or ceiling level greater than 5% above the barrel-mile cost changes; and (3) a requirement that all pipelines file indexed ceiling levels annually, with the ceiling levels subject to challenge and restricting the pipeline’s ability to carry forward the full indexed increase to a future period. The comment period with respect to the proposed rules extends until March 17, 2017.
While common carriers often use the indexing methodology to change their rates, common carriers may elect to support proposed rates by using other methodologies such as cost-of-service ratemaking, market-based rates, and settlement rates. A pipeline can follow a cost-of-service approach when seeking to increase its rates above the rate ceiling (or when seeking to avoid lowering rates to the reduced rate ceiling). A common carrier can charge market-based rates if it establishes that it lacks significant market power in the affected markets. In addition, a common carrier can establish rates under settlement if agreed upon by all current shippers. We have used settlement rates for our dedicated crude oil pipeline. If we used cost-of-service rate making to establish or support our rates, the issue of the proper allowance for federal and state income taxes could arise. In 2005, FERC issued a policy statement stating that it would permit common carriers, among others, to include an income tax allowance in cost-of-service rates to reflect actual or potential tax liability attributable to a regulated entity’s operating income, regardless of the form of ownership. Under FERC’s policy, a tax pass-through entity seeking such an income tax allowance must establish that its partners or members have an actual or potential income tax liability on the regulated entity’s income. Whether a pipeline’s owners have such actual or potential income tax liability is subject to review by FERC on a case-by-case basis. Although this policy is generally favorable for common carriers that are organized as pass-through entities, it still entails rate risk due to the FERC’s case-by-case review approach. The application of this policy, as well as any decision by FERC regarding our cost of service, may also be subject to review in the courts. On December 23, 2016, FERC issued an Inquiry Regarding the Commission’s Policy for Recovery of Income Tax Credits. FERC is seeking comment regarding how to address any double recovery resulting from the Commission’s current income tax allowance and rate of return policies. The comment period with respect to the proposed rules extends until April 7, 2017.
Intrastate services provided by our pipeline are subject to regulation by the Wyoming Public Service Commission. This state commission uses a complaint-based system of regulation, both as to matters involving rates and priority of access. The Wyoming Public Service Commission could limit our ability to increase our rates or to set rates based on our costs or order us to reduce our rates and require the payment of refunds to shippers. FERC and state regulatory commissions generally have not investigated rates, unless the rates are the subject of a protest or a complaint. However, FERC, or a state commission, could investigate our rates on its own initiative or at the urging of a third party.
If our rate levels were investigated by FERC or a state commission, the inquiry could result in a comparison of our rates to those charged by others or to an investigation of our costs, including:
|
•
|
the overall cost of service, including operating costs and overhead;
|
|
•
|
the allocation of overhead and other administrative and general expenses to the regulated entity;
|
|
•
|
the appropriate capital structure to be utilized in calculating rates;
|
|
•
|
the appropriate rate of return on equity and interest rates on debt;
|
|
•
|
the rate base, including the proper starting rate base;
|
|
•
|
the throughput underlying the rate; and
|
|
•
|
the proper allowance for federal and state income taxes
|
17
If the FERC, or the Wyoming Public Service Commission, on their own initiative or due to challenges by third parties, were to lower our tariff rates or deny any rate increase or other material changes to the types, or terms and conditions, of service we might propose, the profitability of our pipeline and terminal located in Casper, Wyoming, may suffer.
Employee Safety
We are subject to the requirements of the U.S. federal Occupational Safety and Health Act, or OSHA, and comparable state and Canadian federal and provincial statutes that regulate the protection of the health and safety of workers. In addition, the OSHA hazard communication standard and the Canadian Workplace Hazardous Materials Information System, or WHMIS, require that information be maintained about hazardous materials used or produced in operations and that this information be provided to employees, state and local government authorities and citizens. We believe that our operations are in substantial compliance with OSHA in the United States and comparable state and Canadian federal and provincial requirements, including general industry standards, record keeping requirements, and monitoring of occupational exposure to regulated substances.
Security
While we are not currently subject to governmental standards for the protection of computer-based systems and technology from cyber threats and attacks, proposals to establish such standard are being considered in the U.S. Congress and by U.S. Executive Branch departments and agencies, including the U.S. Department of Homeland Security, or DHS, and we may become subject to such standards in the future. We currently are implementing our own cyber security programs and protocols; however, we cannot guarantee their effectiveness. A significant cyber-attack could have a material effect on our operations and those of our customers.
EMPLOYEES
We are managed and operated by the board of directors and executive officers of USD Partners GP LLC, our general partner. Neither we nor our subsidiaries have any employees. Our general partner has the sole responsibility for providing the employees and other personnel necessary to conduct our operations. All of the employees that conduct our business are employed by affiliates of our general partner. Our general partner and its affiliates have approximately
72
employees performing services for our operations. We believe that our general partner and its affiliates have a satisfactory relationship with those employees.
INSURANCE
Our rail terminals, pipeline, storage tanks and railcars may experience damage as a result of an accident or natural disaster. These hazards can cause personal injury and loss of life, severe damage to and destruction of property and equipment, pollution or environmental damage and suspension of operations. We maintain insurance and are insured under the property, business interruption and liability policies of USD and certain of its subsidiaries, subject to the deductibles and limits under those policies, which we consider to be reasonable and prudent under the circumstances to cover our operations and assets. However, such insurance does not cover every potential risk associated with our logistics assets, and we cannot ensure that such insurance will be adequate to protect us from all material expenses related to potential future claims for personal and property damage, or that these levels of insurance will be available in the future at commercially reasonable prices. Although we believe that our assets are adequately covered by insurance, a substantial uninsured loss could have a material adverse effect on our financial position, results of operations and cash flows. As we grow, we will continue to monitor our policy limits and retentions as they relate to the overall cost and scope of our insurance program.
AVAILABLE INFORMATION
We make available free of charge on or through our Internet website at
http://www.usdpartners.com
our Annual Reports on Form 10-K, Quarterly Reports on Form 10-Q, Current Reports on Form 8-K and other information statements, and if applicable, amendments to those reports filed or furnished pursuant to Section 13(a) of the Securities Exchange Act of 1934, as amended, or the Exchange Act, as soon as reasonably practicable after we electronically file such material with the SEC. Information contained on our website is not part of this report.
18
You should carefully consider the risk factors below in connection with the other sections of this Annual Report. Each of these risk factors could have a material effect on our business, operating results, cash flows and financial condition, as well as the value of an investment in our common units.
Risks Related to our Business
We may not have sufficient cash from operations following the establishment of cash reserves and payment of fees and expenses, including cost reimbursements to our general partner, to enable us to pay the minimum quarterly distribution, or any distribution, to holders of our common, Class A, subordinated, and general partner units.
In order to pay the minimum quarterly distribution of
$0.2875
per unit per quarter, or
$1.15
per unit on an annualized basis, we require available cash of approximately $6.7 million per quarter, or $26.6 million per year, based on the number of common, Class A, subordinated and general partner
units outstanding at
December 31, 2016
. We may not have sufficient available cash from operating surplus each quarter to enable us to pay the minimum quarterly distribution. The amount of cash we can distribute on our units principally depends upon the amount of cash we generate from our operations, which will fluctuate from quarter to quarter based on, among other things:
|
•
|
our entitlement to minimum monthly payments associated with our take-or-pay terminal services agreements and the impact of credits for unutilized contractual capacity;
|
|
•
|
our ability to acquire new customers and retain existing customers;
|
|
•
|
the rates and terminalling fees we charge for the volumes we handle;
|
|
•
|
the volume of crude oil and other liquid hydrocarbons we handle;
|
|
•
|
damage to terminals, railroads, pipelines, facilities, related equipment and surrounding properties caused by hurricanes, earthquakes, floods, fires, severe weather, explosions and other natural disasters and acts of terrorism including damage to third party pipelines, railroads or facilities upon which our customers rely for transportation services;
|
|
•
|
leaks or accidental releases of products or other materials into the environment, including explosions, chemical fumes or other similar events, whether as a result of human error, natural disaster or otherwise;
|
|
•
|
prevailing economic and market conditions; including low or volatile commodity prices and their effect on our customers;
|
|
•
|
the level of our operating, maintenance and general and administrative costs;
|
|
•
|
regulatory action affecting railcar design or the transportation of crude oil by rail; and
|
|
•
|
the supply of, or demand for, crude oil and other liquid hydrocarbons.
|
In addition, the actual amount of cash we will have available for distribution will depend on other factors, some of which are beyond our control, including:
|
•
|
the level and timing of capital expenditures we make;
|
|
•
|
the cost of acquisitions, if any;
|
|
•
|
our debt service requirements and other liabilities;
|
|
•
|
our requirements to pay distribution equivalents on phantom unit awards, or Phantom Units, pursuant to the terms of the USD Partners LP 2014 Long-Term Incentive Plan, or LTIP;
|
|
•
|
fluctuations in our working capital needs;
|
|
•
|
fluctuations in the values of foreign currencies in relation to the U.S. dollar, including the Canadian dollar;
|
|
•
|
our ability to borrow funds and access capital markets;
|
|
•
|
restrictions contained in our debt agreements;
|
|
•
|
the amount of cash reserves established by our general partner; and
|
|
•
|
other business risks affecting our cash levels.
|
19
The amount of cash we have available for distribution to holders of our common units, Class A units, subordinated units and general partner units depends primarily on our cash flow rather than on our profitability, which may prevent us from making distributions, even during periods in which we record net income.
The amount of cash we have available for distribution depends primarily upon our cash flow and not solely on profitability, which will be affected by non-cash items. As a result, we may make cash distributions during periods when we record losses for financial accounting purposes and may not make cash distributions during periods when we record net earnings for financial accounting purposes.
Our contracts subject us to renewal risks.
We provide terminalling services for liquid hydrocarbons and biofuels under contracts with terms of various durations and renewal. Each of the seven terminal services agreements with our Hardisty terminal customers has an initial contract term of five years and expires in 2019. The initial terms of six of these agreements commenced between June 30, 2014 and August 1, 2014, and the initial term of a seventh agreement commenced on October 1, 2014. Our sole customer contract for our San Antonio terminal has a current term expiring in May 2017 and we anticipate that this customer will not renew or extend this contract further as it moves its business to a new wholly-owned terminal it is in the process of constructing. Our sole customer contract for our West Colton terminal is with the same customer currently at our San Antonio terminal, and is terminable at any time by either party. The three terminal services agreements with our Casper terminal customers have an initial contract term of three to five years and a volume-weighted average contract life of approximately two years as of
December 31, 2016
. One of the customers at our Casper terminal, whose terminalling services agreement with us represented approximately $12 million of our Adjusted EBITDA for the year ended December 31, 2016, has a remaining term expiring in the third quarter of 2017, if not otherwise renewed or extended. This customer did not exercise its option to extend the agreement for an additional three-year term.
As these contracts expire, we will have to negotiate extensions or renewals with existing customers or enter into new contracts with other customers. We may not be able to obtain new contracts on favorable commercial terms, if at all. We also may be unable to maintain the economic structure of a particular contract with an existing customer or maintain the overall mix of our contract portfolio if, for example, prevailing crude oil prices and the associated spreads between different grades of crude oil remain at present levels or decline further. Depending on prevailing market conditions at the time of a contract renewal, customers with fee-based contracts may desire to enter into contracts under different fee or term arrangements or may seek to purchase such capacity on an uncommitted basis. To the extent we are unable to renew our existing contracts on terms that are favorable to us or successfully manage our overall contract mix over time, our revenue and cash flows could decline and both our ability to make cash distributions to our unitholders and our ability to remain in compliance with the covenants under our credit facility could be materially and adversely affected.
We depend on a limited number of customers for a significant portion of our revenues. The loss of, or material nonpayment or nonperformance by, any one or more of these customers could adversely affect our ability to make cash distributions to our unitholders.
We generate the vast majority of our operating cash flow in connection with providing crude oil terminalling services at our Hardisty and Casper terminals. Substantially all of the capacity at our Hardisty and Casper terminals is contracted under multi-year, take-or-pay terminal services agreements. A continued sustained reduction in the prices of crude oil and other commodities could have a material adverse effect on our customers’ businesses. In particular, oil sands production in Canada is particularly susceptible to decline as a result of long-term reductions in the price of crude oil due to its relatively high production costs. As a result, some of our customers may have material financial or liquidity issues or may, as a result of operational incidents or other events, be disproportionately affected as compared to larger or better-capitalized companies. Any material nonpayment or nonperformance by any of our key customers could have a material adverse effect on our business, financial condition, results of operations, and ability to make quarterly distributions to our unitholders. In addition, liquidity issues resulting from sustained lower crude oil prices could lead our customers to go into bankruptcy or could encourage them to seek to repudiate, cancel, renegotiate or fail to renew their agreements with us for various reasons. We expect our exposure to concentrated risk of non-payment or non-
20
performance to continue as long as we remain substantially dependent on a relatively limited number of customers for a substantial portion of our revenue.
Additionally, one customer has the right, but not the obligation, to exclusively use all of our capacity at our San Antonio terminal under a contract that has a term expiring in May 2017, and is also the sole customer under contract at our West Colton terminal, which is terminable at any time upon 150 days' notice. If we were unable to renew our contracts with one or more of these customers, including customers at our Hardisty or Casper terminals, on favorable terms, we may not be able to replace any of these customers in a timely fashion, on favorable terms or at all.
We may not be able to compete effectively and our business is subject to the risk of a capacity overbuild of midstream infrastructure and the entrance of new competitors in the areas where we operate.
We face competition in all aspects of our business and can give no assurances that we will be able to compete effectively. Our terminals compete with existing and potential new hydrocarbon by rail terminals, as well as alternative modes of transporting hydrocarbons from production centers to refining or aggregation centers, such as existing and potential new crude oil pipelines and water-borne vessels. Our competitors include other midstream companies, major integrated energy companies, independent producers and refiners, as well as commodity marketers and traders of widely varying sizes, financial resources and experience. We compete on the basis of many factors, including geographic proximity to production areas, market access, rates, terms of service, connection costs and other factors. Many of our competitors have access to capital resources significantly greater than ours.
A significant driver of competition in some of the markets where we operate is the risk of development of new midstream infrastructure capacity driven by the combination of (i) significant increases in oil and gas production and development in the particular production areas, both actual and anticipated, (ii) low barriers to entry and (iii) generally widespread access to relatively low cost capital. This environment exposes us to the risk that these areas become overbuilt, resulting in an excess of midstream infrastructure capacity. We face these risks in particular with respect to the potential development of additional pipeline takeaway capacity from the Canadian oil sands region, where our customers source the majority of the crude handled at our Hardisty and Casper terminals. One significant such potential pipeline project was recently the subject of a U.S. Presidential memorandum inviting the proposed developer to resubmit its previously denied application to permit the pipeline to cross the U.S. Border. Most midstream projects require several years of “lead time” to develop and companies like us that develop such projects are exposed (to varying degrees depending on the contractual arrangements that underpin specific projects) to the risk that expectations for oil and gas development in the particular area may not be realized or that too much capacity is developed relative to the demand for services that ultimately materializes. If we experience a significant capacity overbuild in one or more of the areas where we operate, it could have a material adverse effect on our business, financial condition, results of operations, and ability to make quarterly distributions to our unitholders.
Any reduction in our or our customers’ ability to utilize third-party storage facilities, pipelines, railroads or trucks that interconnect with our terminals or to continue utilizing them at current costs could negatively impact customer volumes and renewal rates at our terminals.
We and the customers of our terminals are dependent upon access to third-party storage facilities, pipelines, railroads and truck fleets to receive and deliver crude oil and other liquid hydrocarbons to or from us. The continuing operation of such third-party storage facilities, pipelines, railroads and other midstream facilities or assets is not within our control. Any interruptions or reduction in the capabilities of these third parties due to testing, line repair, reduced operating pressures, or other causes in the case of pipelines, or track repairs, derailments or other causes, in the case of railroads, could result in reduced volumes transported through our terminals.
In particular, we entered into a facilities connection agreement with Gibson whereby Gibson would construct a pipeline to provide our Hardisty terminal with exclusive pipeline access to Gibson’s Hardisty storage terminal, which is the source of all of the crude oil handled by our Hardisty terminal. In addition, substantially all of the crude oil handled by our Casper terminal has historically been sourced from the Express Pipeline. Our customer base is accordingly constrained by customer access to Gibson’s Hardisty storage terminal in the case of our Hardisty terminal, and the Express Pipeline in the case of our Casper terminal. If our existing customers don’t maintain their capacity with Gibson or Express, or in the case of our Casper terminal, our customers’ capacity allocations on the Express
21
pipeline are reduced by prorations due to the capacity demands of other shippers or other reasons, the volume shipped by our existing customers may be reduced or our customers may choose not to renew their agreements with us at existing rates and volumes, if at all, which would have a material adverse effect on our results of operations and ability to make quarterly distributions to our unitholders. Similar issues could arise based on other capacity issues arising before or after a customer’s products reach or leave our terminals, including rail capacity constraints and constraints at receiving terminals or other midstream facilities downstream of receiving terminals.
The lack of diversification of our assets and geographic locations could adversely affect our ability to make distributions to our common unitholders.
We generate the vast majority of our operating cash flow in connection with providing crude oil terminalling services at our Hardisty and Casper terminals, both of which receive the majority of their crude oil from the Canadian oil sands through the Hardisty hub. Due to the lack of diversification in our assets and geographic location, an adverse development in our businesses or areas of operations, especially to our Hardisty and Casper terminals, including those due to catastrophic events, weather, regulatory action or decreases in the price of, or demand for, crude oil, could have a significantly greater impact on our results of operations and distributable cash flow to our common unitholders than if we maintained more diverse assets and locations. In particular, due in part to relatively high production costs, oil sands production in Canada may be particularly susceptible to decline as a result of long-term declines in the price of crude oil, which could materially impact our ability to secure additional long-term customer contracts and renewals at our Hardisty terminal and our Casper terminal, and the ability of USD Group LLC to contract for and complete expansions.
We do not own some of the land on which our terminals are located, which could disrupt our operations.
We do not own all of the land on which our West Colton and San Antonio terminals are located, which land we obtained the right to use through leases from the Class I railroad servicing those terminals. These leases are currently cancellable at will by either party. We are therefore subject to the possibility of lease cancellation, more onerous terms and/or increased costs to retain the land necessary to operate these terminals. Our loss of these rights, through our inability to renew or the unwillingness of the land owner to negotiate right-of-way contracts or leases, or otherwise, could cause us to cease operations on the affected land, incur costs to dismantle and remove existing facilities, increase costs related to continuing operations elsewhere and reduce our revenue.
The fees charged to customers under our agreements with them for the transportation of crude oil may not escalate sufficiently or at all to cover increases in costs, and the agreements may be temporarily suspended or terminated in some circumstances, which would affect our profitability.
We generate the vast majority of our operating cash flow in connection with providing crude oil terminalling services at our Hardisty and Casper terminals. Substantially all of the capacity at our Hardisty and Casper terminals is contracted under multi-year, take-or-pay terminal services agreements, which, in the case of our Hardisty terminal, are subject to inflation-based rate escalators. The terminal services agreements at our Casper terminal are not subject to inflation-based rate escalators. Any inflation-based escalators in our terminal services agreements may be insufficient to compensate for increases in our costs. Additionally, some customers’ obligations under their agreements with us may be temporarily suspended upon the occurrence of certain events, some of which are beyond our control, or may be terminated in the case of uninterrupted force majeure events of over one year wherein the supply of crude oil is curtailed or cut off. Force majeure events may include (but are not limited to) revolutions, wars, acts of enemies, embargoes, import or export restrictions, strikes, lockouts, fires, storms, floods, acts of God, explosions, mechanical or physical failures of our equipment or facilities of our customers, or any cause or causes of any kind or character (except financial) reasonably beyond the control of the party failing to perform. If either the escalation of fees under the terminal services agreements at our Hardisty terminal is insufficient to cover increased costs, we experience increased costs at our Casper terminal, or if any customer suspends or terminates its contracts with us, our profitability and ability to make quarterly distributions to our unitholders could be materially and adversely affected.
22
We serve customers who are involved in drilling for, producing and transporting crude oil and other liquid hydrocarbons. Adverse developments affecting the fossil fuel industry or drilling activity, including continuing low or further reduced prices of crude oil or biofuels, reduced demand for crude oil products and increased regulation of drilling, production or transportation could cause a reduction of volumes transported through our terminals.
Our business, including our ability to grow our business through the contracting and development of new terminals, as well as our ability to secure renewals or extensions of agreements with customers at our existing terminals, depends on the continued development, production and demand for crude oil and other liquid hydrocarbons from areas unserved or underserved by existing alternative transportation solutions. The willingness of exploration and production companies to develop and produce crude oil in particular producing regions depends largely on their ability to conduct these activities profitably, which in turn depends largely upon the markets for and prices of crude oil and other commodities. A continued sustained reduction in the prices of crude oil and other commodities would have a material adverse effect on our business. The factors impacting the prices of crude oil and other commodities include the supply of and demand for these commodities, which fluctuate with changes in market and economic conditions, and other factors, including:
|
•
|
worldwide and regional economic conditions;
|
|
•
|
worldwide and regional political events, including actions taken by foreign oil producing nations;
|
|
•
|
worldwide and regional weather events and conditions, including natural disasters and seasonal changes that could decrease supply or demand;
|
|
•
|
the levels of domestic and international production and consumer demand;
|
|
•
|
the availability of transportation systems with adequate capacity;
|
|
•
|
fluctuations in demand for crude oil, such as those caused by refinery downtime or turnarounds;
|
|
•
|
fluctuations in the price of crude oil, which may have an impact on the spot prices for the transportation of crude oil by pipeline or railcar;
|
|
•
|
increased government regulation or prohibition of the transportation of hydrocarbons by rail;
|
|
•
|
the volatility and uncertainty of world crude oil prices as well as regional pricing differentials;
|
|
•
|
fluctuations in gasoline consumption;
|
|
•
|
the price and availability of alternative fuels;
|
|
•
|
changes in mandates to blend renewable fuels, such as ethanol, into petroleum fuels;
|
|
•
|
the price and availability of the raw materials used to produce ethanol, such as corn;
|
|
•
|
the effect of energy conservation measures, such as more efficient fuel economy standards for automobiles;
|
|
•
|
the nature and extent of governmental regulation and taxation, including the amount of subsidies for ethanol;
|
|
•
|
fluctuations in demand from electric power generators and industrial customers; and
|
|
•
|
the anticipated future prices of oil and other commodities.
|
The prices of crude oil and related products remain at levels significantly below the historically high prices experienced in recent years. A combination of factors have contributed to the current price environment, including weakening demand, increased worldwide production, announcements by the Organization of Petroleum Exporting Countries regarding production levels and a strengthening of the U.S. dollar relative to most other currencies. Our Hardisty terminal and Casper terminal both derive a majority of the crude oil volumes they transport from the Canadian oil sands, which are considered to have relatively high production costs. As a result, low prices for crude oil, exploration and production companies operating in the Canadian oil sands have and may further reduce capital spending for expansion projects designed to increase crude oil production. We expect that further declines in crude oil prices or prices remaining at current levels for a prolonged period of time may result in further reductions in capital spending, which would likely decrease the likelihood that our existing customers would renew their contracts with us at current prices or at all, reduce the opportunities for us to grow our assets and otherwise have a material adverse impact on our business and results of operations.
23
The dangers inherent in our operations could cause disruptions and expose us to potentially significant losses, costs or liabilities and reduce our liquidity. We are particularly vulnerable to disruptions in our operations because most of our terminalling operations are concentrated at the Hardisty and Casper terminals.
Our operations are subject to significant hazards and risks inherent in transporting and storing crude oil, intermediate products and refined products. These hazards and risks include, but are not limited to, natural disasters, fires, explosions, pipeline or railcar ruptures and spills, third party interference and mechanical failure of equipment at our terminals, any of which could result in disruptions, pollution, personal injury or wrongful death claims and other damage to our properties and the property of others. There is also risk of mechanical failure and equipment shutdowns both in the normal course of operations and following unforeseen events. Because the vast majority of our cash flow is generated from operations conducted at our Hardisty and Casper terminals, any sustained disruption at either of these terminals, the Gibson storage terminal, which is the source of all of the crude oil handled by our Hardisty terminal, or the Express pipeline, which is the primary source of the crude oil handled by the Casper terminal, would have a material adverse effect on our business, financial condition, results of operations and cash flows and, as a result, our ability to make distributions.
Some of our customers’ operations cross the U.S./Canada border and are subject to cross-border regulation.
Our customers’ cross border activities subject them to regulatory matters, including import and export licenses, tariffs, Canadian and U.S. customs and tax issues and toxic substance certifications. Such regulations include the Short Supply Controls of the Export Administration Act, the North American Free Trade Agreement and the Toxic Substances Control Act. Violations of these licensing, tariff and tax reporting requirements could result in the imposition of significant administrative, civil and criminal penalties on our customers. Our revenue and cash flows could decline and our ability to make cash distributions to our unitholders could be materially and adversely affected should our customers fail to comply with these cross-border regulations.
Changes in the provincial royalty rates and drilling incentive programs in Canada could decrease the oil and gas exploration and pipeline activities in Canada, which could adversely affect the demand for our terminalling services.
Certain provincial governments collect royalties on the production from lands owned by the government of Canada. These fiscal royalty regimes are reviewed and adjusted from time to time by the respective provincial governments for appropriateness and competitiveness. Any increase in the royalty rates assessed by, or any decrease in the drilling incentive programs offered by, a provincial government could negatively affect the drilling activity, which could adversely affect the demand for our terminalling services.
Exposure to currency exchange rate fluctuations will result in fluctuations in our cash flows and operating results.
Currency exchange rate fluctuations could have an adverse effect on our results of operations. A majority of the cash flows from our current assets will be generated in Canadian dollars, but we intend to make distributions to our unitholders in U.S. dollars. As such, a portion of our distributable cash flow will be subject to currency exchange rate fluctuations between U.S. dollars and Canadian dollars. For example, if the Canadian dollar weakens significantly, the corresponding distributable cash flow in U.S. dollars could be less than what is necessary to pay our minimum quarterly distribution.
A significant strengthening of the U.S. dollar relative to other currencies could result in an increase in our financing expenses and could materially affect our financial results under GAAP. In addition, because we report our operating results in U.S. dollars, changes in the value of the U.S. dollar also result in fluctuations in our reported revenues and earnings. In addition, under GAAP, all foreign currency-denominated monetary assets and liabilities such as cash and cash equivalents, accounts receivable, restricted cash, accounts payable, long-term debt and capital lease obligations are revalued and reported based on the prevailing exchange rate at the end of the reporting period. This revaluation may cause us to report significant non-monetary foreign currency exchange gains and losses in certain periods.
24
Increases in rail freight costs may adversely affect our results of operations.
The largest component of a shipment of crude by rail is the rail freight transportation costs. Unlike terminal services fees, which are typically established by long-term contracts, railroad freight transportation is typically purchased on a spot basis. Accordingly, high spot rail freight costs from or to our terminals may make the shipment of crude or other liquid hydrocarbons less attractive or unattractive to our customers and potential customers. In addition, transporters of hydrocarbons by rail compete with other parties, such as coal, grain and corn, which ship their product by rail. Demand for transportation of crude or other products by rail has previously caused shortages in available locomotives and railroad crews. Such shortages may ultimately increase the cost to transport hydrocarbons by rail. Additionally, diesel fuel costs generally fluctuate with increasing and decreasing world crude oil prices, and accordingly are subject to political, economic and market factors that are outside of our control. Diesel fuel prices are a significant component of the costs to our customers of shipping hydrocarbons by rail. Increased costs to ship hydrocarbons by rail could curtail demand for shipment of hydrocarbons by rail which would have an adverse effect on our results of operations and cash flows and our ability to attract new customers and retain existing customers.
Our business could be adversely affected if service on the railroads is interrupted or if more stringent regulations are adopted regarding railcar design or the transportation of crude oil by rail.
We do not own or operate the railroads on which crude-oil-carrying railcars are transported; however, we do manage a railcar fleet that is subject to regulations governing railcar design and manufacture. Due to increased use of hydraulic fracturing and other changes in extraction technologies, the volume of crude oil and liquid hydrocarbons produced and transported in North America has increased substantially, and the geographic location of that production has shifted as compared to historical production. As a result a growing percentage of crude oil is being transported by rail. High-profile accidents involving crude-oil-carrying trains in recent years, in conjunction with increased use of rail transportation, have raised concerns about the environmental and safety risks associated with crude oil transport by rail and railcar design.
The DOT and Transport Canada released a series of directives and other actions to address rail safety concerns. Among the directives is a final rule requiring that DOT-111 railcars used to transport crude oil and ethanol that are not compliant with required safety standards be phased out or retrofitted as early as May 1, 2017 (January 1, 2018 in the U.S.), with none in use after May 1, 2023 and CPC-1232 railcars used to transport crude oil and ethanol that are not compliant with required safety standards be phased out or retrofitted as early as April 1, 2020, with none in use after May 1, 2025. We currently provide railcar services for 2,953 railcars, 375 of which will still be under contract and require retrofitting pursuant to this directive. The remaining railcars either have leases that will expire before they are required to be retrofitted, or already meet the requirements of the directive. We do not own any of the railcars in our railcar fleet and are not directly responsible for costs associated with the retrofitting of DOT-111 railcars. However, costs associated with the retrofitting of railcars would increase the incremental monthly cost of the applicable railcar lease, which cost is expected to be passed through to our customers and could affect demand for our services. The timing of retrofits to the rail cars we manage could disrupt our operations; however, we intend to work with our railcar suppliers on modification scheduling in an attempt to avoid major disruptions.
DOT and Transport Canada have also required operators to take certain precautions relating to rail routing, and mandated reductions in train speed and the implementation of new braking technology, to address rail safety concerns. The recent changes to U.S. and Canadian regulations and the adoption of additional federal, state, provincial or local laws or regulations, including any voluntary measures by the rail industry regarding railcar design or crude oil and liquid hydrocarbon rail transport activities, or efforts by local communities to restrict or limit rail traffic involving crude oil, could affect our business by increasing compliance costs and decreasing demand for our services, which could adversely affect our financial position and cash flows. Moreover, any disruptions in the operations of railroads, including those due to shortages of railcars, weather-related problems, flooding, drought, accidents, mechanical difficulties, strikes, lockouts or bottlenecks, could adversely impact our customers’ ability to move their products and, as a result, could affect our business.
We may be subject to liability or expense in connection with the use of our railcars by our customers.
25
We lease an aggregate of
2,953
railcars from various railcar manufacturers and financial entities and we provide these railcars to our customers pursuant to master fleet services agreements. We have assigned certain payment and performance obligations under the leases and master fleet services agreements for
2,613
of these railcars to other parties, but have retained certain rights and obligations with respect to the servicing of these railcars. Although our customers are responsible for the use, maintenance and condition of the railcars subject to their master fleet services agreements with us, we, and not our customers, are directly responsible to our lessors. In the event that our lessors seek to recover any costs at lease expiration resulting from the condition of the railcars, they will primarily look to us to recoup these amounts. Although our customers have generally agreed to be responsible for any costs we incur as a result of their use of our railcars, our customers may deny culpability for any specific costs. In the event that we are unable to resolve disputes related to return costs with our lessors and our customers, we may be obligated to pay the associated costs ourselves or the disputes may result in legal proceedings. Any such legal proceedings may be costly and we may not be able to recover our costs of participation in such proceedings from either the lessors or our customers. In addition, in the event that any such legal proceeding results in a judgment against us that is not reimbursable by our customer, such judgment could result in material costs for us. Finally, as the lessee of our railcars, we may be named in any legal proceedings related to any damage to third parties or the environment caused by the use of our railcars by our customers. In the event that we are unable to obtain indemnification from our customers as a result of such potential claims, we may incur material costs and liabilities. Any costs or liabilities resulting from our customers’ use of our railcars could have a material adverse effect on our business, financial condition, results of operations and cash flows and, as a result, our ability to make distributions.
Changes in, or challenges to, our pipeline rates and other terms and conditions of service could have a material adverse effect on our financial condition and results of operations.
Our dedicated crude oil pipeline at the Casper terminal is subject to regulation by various federal, state and local agencies. FERC regulates the interstate transportation services provided on our dedicated crude oil pipeline under the ICA, the EPAct 1992 and the rules and regulations promulgated under those laws. FERC regulations require that rates for interstate service on pipelines that transport crude oil and refined petroleum products (collectively referred to as “petroleum pipelines”) and certain other liquids to be just and reasonable, not be unduly discriminatory and not confer any undue preference upon any shipper. FERC regulations also require interstate common carrier petroleum pipelines to file with FERC and publicly post tariffs stating their interstate transportation rates and terms and conditions of service. Under the ICA, FERC or interested persons may challenge existing or changed rates or services. FERC is authorized to investigate such charges and may suspend the effectiveness of a new rate for up to seven months. A successful rate challenge could result in a common carrier paying refunds together with interest for the period that the rate was in effect. FERC may also order a pipeline to change its rates, and may require a common carrier to pay shippers reparations for damages sustained for a period up to two years prior to the filing of a complaint.
Intrastate services provided by our pipeline are subject to regulation by the Wyoming Public Service Commission. The Wyoming Public Service Commission uses a complaint-based system of regulation, both as to matters involving rates and priority of access. The Wyoming Public Service Commission could limit our ability to increase our rates or to set rates based on our costs or order us to reduce our rates and require the payment of refunds to shippers. FERC and state regulatory commissions generally have not investigated rates unless the rates are the subject of a protest or a complaint. However, FERC or the Wyoming Public Service Commission could investigate our rates on its own initiative or at the urging of a third party. If FERC or the Wyoming Public Service Commission were to lower our tariff rates or deny any rate increase or other material changes to the types, or terms and conditions, of service we might propose, the profitability of our dedicated crude oil pipeline and terminal located in Casper, Wyoming, could suffer. In addition, if we were permitted to raise our tariff rates for the dedicated crude oil pipeline, there might be a significant delay between the time the tariff rate increase is approved and the time that the rate increase actually goes into effect, which could adversely affect our cash flow. Furthermore, competition from other pipelines and terminals may prevent us from raising our tariff rates even if FERC or the Wyoming Public Service Commission permits us to do so. FERC and the Wyoming Public Service Commission periodically implement new rules, regulations and terms and conditions of service. New initiatives or orders may adversely affect the rates charged for our services or otherwise adversely affect our financial condition, results of operations and cash flows and our ability to make cash distributions to our unitholders.
26
Restrictions in our senior secured credit agreement could adversely affect our business, financial condition, results of operations, ability to make distributions to unitholders and value of our common units.
We are dependent upon the earnings and cash flow generated by our operations in order to meet our debt service obligations under our senior secured credit agreement and to allow us to make cash distributions to our unitholders. The operating and financial restrictions and covenants in our senior secured credit agreement and any future financing agreements could restrict our ability to finance future operations or capital needs or to expand or pursue our business activities, which may, in turn, limit our ability to make cash distributions to our unitholders. Our senior secured credit agreement limits our ability to, among other things:
|
•
|
incur or guarantee additional debt;
|
|
•
|
make distributions on or redeem or repurchase units;
|
|
•
|
make certain investments and acquisitions;
|
|
•
|
incur certain liens or permit them to exist;
|
|
•
|
enter into certain types of transactions with affiliates;
|
|
•
|
merge or consolidate with other affiliates;
|
|
•
|
transfer, sell or otherwise dispose of assets;
|
|
•
|
engage in a materially different line of business;
|
|
•
|
enter into certain burdensome agreements; and
|
|
•
|
prepay other indebtedness.
|
Our senior secured credit agreement also includes covenants requiring us to maintain certain financial ratios. Our ability to meet those financial ratios and tests can be affected by events beyond our control, and we cannot assure you that we will meet those ratios and tests. In addition, if we are unable to maintain our existing revenues and cash flows, particularly in connection with the potential renewal or extension of our existing take or pay agreements, we may be required to reduce our indebtedness or fall out of compliance with one or more of these ratios or tests.
The provisions of our senior secured credit agreement may affect our ability to obtain future financing and pursue attractive business opportunities and our flexibility in planning for, and reacting to, changes in business conditions. In addition, a failure to comply with the provisions of our senior secured credit agreement could result in a default or an event of default that could enable our lenders to declare the outstanding principal of that debt, together with accrued and unpaid interest, to be immediately due and payable along with triggering the exercise of other remedies. If the payment of our debt is accelerated, our assets may be insufficient to repay such debt in full, and our unitholders could experience a partial or total loss of their investment.
The credit and risk profile of our general partner and its owner, USD Group LLC, could adversely affect our credit ratings and risk profile, which could increase our borrowing costs or hinder our ability to raise capital and additionally have a direct impact on our ability to pay our minimum quarterly distribution
The credit and business risk profiles of our general partner and USD Group LLC, neither of which has a rating from any credit agency, may be factors considered in credit evaluations of us. This is because our general partner, which is owned by USD Group LLC, controls our business activities, including our cash distribution policy and growth strategy. In addition, a wholly-owned affiliate of our general partner is a customer of ours at our Hardisty terminal and may become a customer at other terminals we own or control in the future. Any adverse change in the financial condition of USD Group LLC, including the degree of its financial leverage and its dependence on cash flow from us to service its indebtedness, if any, may adversely affect our credit ratings and risk profile. If we were to seek a credit rating in the future, our credit rating may be adversely affected by the leverage of our general partner or USD Group LLC, as credit rating agencies such as Standard & Poor’s Ratings Services and Moody’s Investors Service may consider the leverage and credit profile of USD Group LLC and its affiliates because of their ownership interest in and control of us. Any adverse effect on our credit rating would increase our cost of borrowing or hinder our ability to raise financing in the capital markets, which would impair our ability to grow our business and make distributions to common unitholders.
27
Our growth strategy requires access to new capital. Tightened capital markets or increased competition for investment opportunities could impair our ability to grow.
We regularly consider and evaluate potential acquisitions and other opportunities to grow our business. Any limitations on our access to new capital will impair our ability to execute this strategy. If the cost of such capital becomes too expensive, our ability to develop or acquire strategic and accretive assets will be limited. We may not be able to raise the necessary funds on satisfactory terms, if at all. The primary factors that influence our initial cost of equity include market conditions, including our then current unit price, fees we pay to underwriters and other offering costs, which include amounts we pay for legal and accounting services. The primary factors influencing our cost of borrowing include interest rates, credit spreads, covenants, underwriting or loan origination fees and similar charges we pay to lenders.
Weak economic conditions, more stringent lending standards, higher interest rates and volatility in the financial markets could increase the cost of raising money in the debt and equity capital markets, while diminishing the availability of funds from those markets. These factors among others may limit our ability to execute our growth strategy.
While Energy Capital Partners has indicated an intention to invest over an additional $1.0 billion of equity capital in USD, subject to market and other conditions, it has not made a commitment to provide any direct or indirect financial assistance to us. Furthermore, Energy Capital Partners must approve any issuances of additional equity by us, which determination may be made free of any duty to us or our unitholders, and members of our general partner’s board of directors appointed by Energy Capital Partners must approve the incurrence by us or refinancing of our indebtedness outside of the ordinary course of business, which may limit our flexibility to obtain financing and to pursue other business opportunities.
Our existing debt and any additional debt we incur in the future may limit our flexibility to obtain financing and to pursue other business opportunities.
As of
December 31, 2016
, we had approximately
$223.1 million
of outstanding borrowings under our senior secured credit agreement. We have the ability to incur additional debt, including under our existing senior secured credit agreement. Our level of indebtedness could have important consequences for us, including the following:
|
•
|
our ability to obtain additional financing, if necessary, for working capital, capital expenditures, acquisitions, or other purposes, may be impaired, or such financing may not be available on favorable terms;
|
|
•
|
our funds available for operations, future business opportunities and cash distributions to unitholders may be reduced by that portion of our cash flow required to make interest payments on our debt;
|
|
•
|
we may be more vulnerable to competitive pressures or a downturn in our business or the economy generally; and
|
|
•
|
our flexibility in responding to changing business and economic conditions may be limited.
|
Our ability to service our debt depends upon, among other things, our financial and operating performance, which will be affected by prevailing economic conditions and financial, business, regulatory and other factors, some of which are beyond our control. If our operating results are not sufficient to service indebtedness, we will be forced to take actions such as reducing distributions, reducing or delaying our business activities, acquisitions, investments or capital expenditures, selling assets or seeking additional equity capital. We may not be able to take any of these actions on satisfactory terms or at all.
If we are unable to make acquisitions on economically acceptable terms from USD or third parties, our future growth would be limited, and any acquisitions we may make could reduce, rather than increase, our cash flows and ability to make distributions to unitholders.
A portion of our strategy to grow our business and increase distributions to unitholders is dependent on our ability to make acquisitions that result in an increase in cash flow. If we are unable to make acquisitions from USD or third parties, because we are unable to identify attractive acquisition candidates or negotiate acceptable purchase agreements,
28
we are unable to obtain financing for these acquisitions on economically acceptable terms, we are outbid by competitors or we or the seller are unable to obtain any necessary consents, our future growth and ability to increase distributions to unitholders will be limited. Energy Capital Partners must also approve the acquisition of the securities of any entity by us if the acquisition exceeds specified thresholds. Furthermore, even if we do consummate acquisitions that we believe will be accretive, we may not realize the intended benefits, and the acquisition may in fact result in a decrease in cash flow. Any acquisition involves potential risks, including, among other things:
|
•
|
mistaken assumptions about revenues and costs, including synergies;
|
|
•
|
the assumption of unknown liabilities;
|
|
•
|
limitations on rights to indemnity from the seller;
|
|
•
|
mistaken assumptions about the overall costs of equity or debt;
|
|
•
|
the diversion of management’s attention from other business concerns;
|
|
•
|
unforeseen difficulties operating in new product areas or new geographic areas; and
|
|
•
|
customer or key employee losses at the acquired businesses.
|
If we consummate any future acquisitions, our capitalization and results of operations may change significantly, and unitholders will not have the opportunity to evaluate the economic, financial and other relevant information that we will consider in determining the application of these funds and other resources.
We may be unsuccessful in integrating future acquisitions with our existing operations, and in realizing all or any part of the anticipated benefits of any such acquisitions.
From time to time, we evaluate and expect to acquire assets and businesses that we believe complement our existing assets and businesses, such as our acquisition of the Casper terminal. These acquisitions may require substantial capital or the incurrence of substantial indebtedness. Our capitalization and results of operations may change significantly as a result of future acquisitions. Acquisitions and business expansions involve numerous risks, including difficulties in the assimilation of the assets and operations of the acquired businesses, inefficiencies and difficulties that arise because of unfamiliarity with new assets and the businesses associated with them and new geographic areas and the diversion of management’s attention from other business concerns. Further, unexpected costs and challenges may arise whenever businesses with different operations or management are combined, and we may experience unanticipated delays in realizing the benefits of an acquisition. Also, following an acquisition, we may discover previously unknown liabilities associated with the acquired business or assets for which we have no recourse under applicable indemnification provisions. Our inability to successfully integrate any future acquisitions into our existing operations and asset platform could have a material adverse effect on our business, financial condition, results of operations, and ability to make quarterly distributions to our unitholders.
Our right of first offer to acquire certain of USD’s existing assets and projects and certain projects that it may develop, construct or acquire in the future is subject to risks and uncertainty, and ultimately we may not acquire any of those assets or businesses.
Our omnibus agreement provides us with a right of first offer for a period of seven years from October 15, 2014 on certain of USD’s existing assets and projects as well as any additional midstream infrastructure that it may develop, construct or acquire in the future, subject to certain exceptions. The consummation and timing of any future acquisitions pursuant to this right will depend upon, among other things, USD’s continued development of midstream infrastructure projects and successful execution of such projects, USD’s willingness to offer assets for sale and obtain any necessary consents, our ability to negotiate acceptable purchase agreements and commercial agreements with respect to such assets and our ability to obtain financing on acceptable terms. We can offer no assurance that we will be able to successfully consummate any future acquisitions or successfully integrate assets acquired pursuant to our right of first offer. Furthermore, USD is under no obligation to accept any offer that we may choose to make. Additionally, the approval of Energy Capital Partners is required for the sale of any assets by USD or its subsidiaries, including us (other than sales in the ordinary course of business), acquisitions of securities of other entities that exceed specified materiality thresholds and any material unbudgeted expenditures or deviations from our approved budgets. Energy Capital Partners may make these decisions free of any duty to us and our unitholders. This approval would be required for the potential acquisition by us of any projects to expand the Hardisty terminal, as well as any other projects or assets that USD may
29
develop or acquire in the future or any third party acquisition we may intend to pursue jointly or independently from USD. Energy Capital Partners is under no obligation to approve any such transaction. Please refer to the discussion under
Item 10. Directors, Executive Officers and Corporate Governance—Special Approval Rights of Energy Capital Partners
regarding the rights of Energy Capital Partners. In addition, we may decide not to exercise our right of first offer if and when any assets are offered for sale, and our decision will not be subject to unitholder approval. Further, our right of first offer may be terminated by USD at any time in the event that it no longer controls our general partner. Please refer to the discussion under
Part II, Item 8. Financial Statements and Supplementary Data, Note 13. Transactions with Related Parties
for additional information regarding our omnibus agreement.
Growing our business by constructing new assets subjects us to construction risks and risks that supplies for such facilities will not be available upon completion thereof.
One of the ways we intend to grow our business is through the construction of new assets. The construction of new assets requires the expenditure of capital, some of which may exceed our resources, and involve regulatory, environmental, political and legal uncertainties. If we undertake the construction of new assets, we may not be able to complete them on schedule or at all or at the budgeted cost. Moreover, our revenues may not increase upon the expenditure of funds on a particular project. For instance, if we build a new significant asset, the construction will occur over a period of time, and we will not receive any revenues until after completion of the project, if at all. Moreover, we may construct assets to provide services to capture revenue which does not materialize or for which we are unable to acquire new customers. We may also rely on estimates of potential demand for our services in our decision to construct new assets, which may prove to be inaccurate because there are numerous uncertainties inherent in estimating demand for our services. As a result, new assets we construct may not be able to attract sufficient demand to achieve our expected investment return, which could materially and adversely affect our results of operations, cash flows and financial condition.
We operate in a highly regulated industry and increased costs of compliance with, or liability for violation of, existing or future laws, regulations and other requirements could significantly increase our costs of doing business, thereby adversely affecting our profitability.
Our industry is subject to laws, regulations and other requirements including, but not limited to, those relating to the environment, safety, working conditions, public accessibility and other requirements. These laws and regulations are enforced by federal agencies including, but not limited to, the EPA, the DOT, PHMSA, the FERC, the FRA, the Federal Motor Carrier Safety Administration, or FMCSA, OSHA, state agencies such as the Texas Commission on Environmental Quality, the Railroad Commission of Texas, the California Environmental Protection Agency, or Cal/EPA, the California Public Utilities Commission, or CPUC, and Canadian agencies such as Environment Canada and Transport Canada as well as numerous other state and federal agencies. Ongoing compliance with, or a violation of, these laws, regulations and other requirements could have a material adverse effect on our business, financial condition, results of operations, and ability to make quarterly distributions to our unitholders.
In addition, these laws and regulations, and the interpretation or enforcement thereof, are subject to frequent change by regulatory authorities, and we are unable to predict the ongoing cost to us of complying with these laws and regulations or the future impact of these laws and regulations on our operations. Violation of environmental laws, regulations and permits can result in the imposition of significant administrative, civil and criminal penalties, injunctions and construction bans or delays.
Under various federal, state, provincial and local environmental requirements, as the owner or operator of terminals, we may be liable for the costs of removal or remediation of contamination at our existing locations, whether we knew of, or were responsible for, the presence of such contamination. The failure to timely report and properly remediate contamination may subject us to liability to third parties and may adversely affect our ability to sell or rent our property or to borrow money using our property as collateral. Additionally, we may be liable for the costs of remediating third-party sites where hazardous substances from our operations have been transported for treatment or disposal, regardless of whether we own or operate that site. In the future, we may incur substantial expenditures for investigation or remediation of contamination that has not yet been discovered at our current or former locations or locations that we may acquire.
30
A discharge of hydrocarbons or hazardous substances into the environment could, to the extent the event is not insured or insurance is not otherwise available, subject us to substantial expense, including the cost to respond in compliance with applicable laws and regulations, fines and penalties, natural resource damages and claims made by employees, neighboring landowners and other third parties for personal injury and property damage. We may experience future catastrophic sudden or gradual releases into the environment from our pipeline or terminals or discover historical releases that were previously unidentified or not assessed. Although our inspection and testing programs are designed in compliance with applicable legal requirements to prevent, detect and address these releases promptly, damages and liabilities incurred due to any future environmental releases from our assets have the potential to substantially affect our business. Such discharges could also subject us to media and public scrutiny that could have a negative effect on the value of our common units.
Environmental, safety and other regulations are stringent. Penalties for violations have increased and may increase further in amount, and new environmental laws and regulations may be proposed and enacted. Moreover, interpretations of existing requirements change from time to time. While we cannot predict the impact that future environmental, health and safety requirements or changed interpretations of existing requirements may have on our operations, such future activity may result in material expenditures to ensure our continued compliance and material costs if we are found not to be in compliance. Such future activity could adversely affect our operations, cash flow and net revenues.
We are subject to stringent environmental and safety laws and regulations that may expose us to significant costs and liabilities.
Our operations are subject to stringent and complex federal, state, provincial and local environmental and safety laws and regulations that govern the discharge of materials into the environment or otherwise relate to environmental protection.
These laws and regulations may impose numerous obligations that are applicable to our operations, including the acquisition of permits to conduct regulated activities, the incurrence of capital or operating expenditures to limit or prevent releases of materials from pipelines, railcars and terminals, and the imposition of substantial liabilities and remedial obligations for pollution resulting from our operations or at locations currently or previously owned or operated by us. Numerous governmental authorities, such as the EPA, the DOT, Environment Canada, Transport Canada and analogous state and provincial agencies, have the power to enforce compliance with these laws and regulations and the permits issued under them, oftentimes requiring difficult and costly corrective actions or costly pollution control measures. Failure to comply with these laws, regulations and permits may result in the assessment of administrative, civil and criminal penalties, the imposition of remedial obligations and the issuance of injunctions limiting or preventing some or all of our operations. In addition, we may experience a delay in obtaining or be unable to obtain required permits or regulatory authorizations, which may cause us to lose potential and current customers, interrupt our operations and limit our growth and revenue.
We may incur significant environmental costs and liabilities in connection with our operations due to historical industry operations and waste disposal practices, our handling of hydrocarbon and other wastes and potential emissions and discharges related to our operations. Joint and several, strict liability may be incurred, without regard to fault, under certain of these environmental laws and regulations in connection with discharges or releases of hydrocarbon wastes on, under, or from our properties and terminals. In addition, changes in environmental laws occur frequently, and any such changes that result in additional permitting obligations or more stringent and costly waste handling, storage, transport, disposal or remediation requirements could have a material adverse effect on our operations or financial position. We may not be able to recover all or any of these costs from insurance.
We could incur substantial costs or disruptions in our business if we cannot obtain or maintain necessary permits and authorizations or otherwise comply with health, safety, environmental and other laws and regulations.
Our operations require authorizations and permits that are subject to revocation, renewal or modification and can require operational changes to limit the effect or potential effect on the environment and/or health and safety. A violation of authorization or permit conditions or other legal or regulatory requirements could result in substantial fines, criminal sanctions, permit revocations, injunctions, and/or facility shutdowns. In addition, major modifications of our
31
operations could require modifications to our existing permits or upgrades to our existing pollution control and safety-related equipment. Any or all of these matters could have a material adverse effect on our business, financial condition, results of operations, and ability to make quarterly distributions to our unitholders.
Our business involves many hazards and operational risks, some of which may not be fully covered by insurance. If a significant accident or event occurs for which we are not adequately insured, or if we fail to recover anticipated insurance proceeds for significant accidents or events for which we are insured, our operations and financial results could be adversely affected.
Our operations are subject to all of the risks and hazards inherent in the provision of terminalling services, including:
|
•
|
damage to railroads and terminals, related equipment and surrounding properties caused by natural disasters, acts of terrorism and actions by third parties;
|
|
•
|
damage from construction, vehicles, farm and utility equipment or other causes;
|
|
•
|
leaks of crude oil and other hydrocarbons or regulated substances or losses of oil as a result of the malfunction of equipment or facilities or operator error;
|
|
•
|
ruptures, fires and explosions; and
|
|
•
|
other hazards that could also result in personal injury and loss of life, pollution and suspension of operations.
|
These and similar risks could result in substantial costs due to personal injury and/or loss of life, severe damage to and destruction of property and equipment and pollution or other damage. These risks may also result in curtailment or suspension of our operations. A natural disaster or other hazard affecting the areas in which we operate could also have a material adverse effect on our operations. We are not fully insured against all risks inherent in our business. In addition, although we are insured for environmental pollution resulting from environmental accidents that occur on a sudden and accidental basis, we may not be insured against all environmental accidents that might occur, some of which may result in claims for remediation, damages to natural resources or injuries to personal property or human health. If a significant accident or event occurs for which we are not fully insured, it could adversely affect our operations and financial condition. Furthermore, we may not be able to maintain or obtain insurance of the type and amount we desire at reasonable rates, particularly following a significant accident or event for which we seek insurance. As a result of market conditions, premiums and deductibles for certain of our insurance policies may substantially increase. In some instances, certain insurance could become unavailable or available only for reduced amounts of coverage.
Climate change legislation, regulatory initiatives and litigation could result in increased operating costs and reduced demand for the oil services we provide.
In response to studies suggesting that emissions of carbon dioxide, methane and certain other gases may be contributing to warming of the Earth’s atmosphere, over 190 countries, including the United States and Canada, reached an agreement to reduce GHG emissions at the Paris climate conference in December 2015. The terms of the Paris treaty to reduce GHG emissions are to become effective in 2020. In addition, the U.S. Congress has considered legislation to restrict or regulate emissions of GHGs. Comprehensive climate legislation appears unlikely to be passed by either house of Congress in the near future, although additional energy legislation and other initiatives may be proposed that address GHGs and related issues. In addition, almost half of the states (including California and Texas, in which we operate), either individually or through multi-state regional initiatives, have begun to address GHG emissions, primarily through the planned development of emission inventories or regional GHG cap and trade programs. Although most of the state-level initiatives have to date been focused on large sources of GHG emissions, such as electric power plants, it is possible that smaller sources could become subject to GHG-related regulation. Depending on the particular program, we could be required to control emissions or to purchase and surrender allowances for GHG emissions resulting from our operations, and to the extent federal or state measures are successful in reaching hydrocarbon fuel usage, they could have an indirect effect on our business.
Independent of Congress, the EPA is beginning to adopt regulations to address GHG emissions under its existing CAA authority. For example, in 2009, the EPA adopted rules regarding regulation of GHG emissions from motor vehicles. In addition, in September 2009, the EPA issued a final rule requiring the monitoring and reporting of GHG emissions from specified large GHG emission sources in the United States. In November 2010, EPA expanded this
32
existing GHG emissions reporting rule to petroleum facilities, requiring reporting of GHG emissions by regulated petroleum facilities to the EPA beginning in 2012 and annually thereafter. In October 2015, EPA further expanded its GHG emissions reporting program to include onshore petroleum and natural gas gathering and boosting activities, as well as natural gas transmission pipelines. We monitor and report our GHG emissions. However, operational or regulatory changes could require additional monitoring and reporting at some or all of our other facilities at a future date. In 2010, the EPA also issued a final rule, known as the “Tailoring Rule,” that makes certain large stationary sources and modification projects subject to permitting requirements for GHG emissions under the CAA. Several of the EPA’s GHG rules are being challenged in pending court proceedings and, depending on the outcome of these proceedings, such rules may be modified or rescinded or the EPA could develop new rules.
Although it is not possible at this time to accurately estimate how potential future laws or regulations addressing GHG emissions in Canada or the United States would impact our business, any future federal, state or provincial laws or implementing regulations that may be adopted to address GHG emissions could require us to incur increased operating costs and could adversely affect demand for the crude oil and other liquid hydrocarbons we handle in connection with our services. The potential increase in the costs of our operations resulting from any legislation or regulation to restrict emissions of GHGs could include new or increased costs to operate and maintain our facilities, install new emission controls on our facilities, acquire allowances to authorize our GHG emissions, pay any taxes related to our GHG emissions and administer and manage a GHG emissions program. While we may be able to include some or all of such increased costs in the rates charged by our terminals, such recovery of costs is uncertain. Moreover, incentives to conserve energy or use alternative energy sources could reduce demand for oil, resulting in a decrease in demand for our services. We cannot predict with any certainty at this time how these possibilities may affect our operations.
Because we have a limited operating history, you may have difficulty evaluating our ability to pay cash distributions to our unitholders, or our ability to be successful in implementing our business strategy.
We are dependent on our Hardisty terminal and Casper terminal for a majority of our cash flow. As recently constructed terminalling facilities, the operating performance of the Hardisty and Casper terminals over the long term is not yet proven. We may encounter risks and difficulties frequently experienced by companies whose performance is dependent upon newly constructed facilities, such as customer utilization and renewal rates, the terminals not functioning as expected, higher than expected operating costs, breakdown or failures of equipment and operational errors.
Because of our limited operating history and performance record at the Hardisty and Casper terminals, it may be difficult for you to evaluate our business and results of operations to date and to assess our future prospects. We may be less successful in maintaining a consistent operating level at the Hardisty and Casper terminals capable of generating cash flows from our operations sufficient to regularly pay a cash distribution, or to pay any cash distribution to our unitholders than a company whose major facilities have had longer operating histories. Finally, we may be less equipped to identify and address operating risks and hazards in the conduct of our businesses at the Hardisty and Casper terminals than those companies whose major facilities have had longer operating histories.
We may recognize impairment on long-lived assets, goodwill and intangible assets.
Periodically, we review our long-lived assets for impairment whenever economic events or changes in circumstances indicate that the carrying value of an asset may not be recoverable. We also review our goodwill and intangible assets for indicators of impairment in accordance with applicable accounting standards. Significant negative industry or general economic trends, disruptions to our business and unexpected significant changes or planned changes in our use of the assets may result in impairments to our goodwill, intangible assets and other long-lived assets. Any reduction in or impairment of the value of goodwill or intangible assets will result in a charge against earnings, which could have a material adverse impact on our reported results of operations and financial condition.
The implementation of derivatives regulations could have an adverse effect on our ability to use derivatives contracts to reduce the effect of foreign exchange, interest rate and other risks associated with our business.
The Dodd-Frank Wall Street Reform and Consumer Protection Act ("Dodd-Frank Act"), establishes federal oversight and regulation of the over-the-counter derivatives market and entities that participate in that market. Although
33
the U.S. Commodity Futures Trading Commission and the other relevant regulators have finalized most of the regulations under the Dodd-Frank Act, they continue to review and refine initial rulemakings through additional interpretations and supplemental rulemakings. As a result, it is not possible at this time to predict the ultimate effect of the rules and regulations on our business and while most of the regulations have been adopted, any new regulations or modifications to existing regulations may increase the cost of derivatives contracts, materially alter the terms of derivatives contracts, reduce the availability of derivatives to protect against risks we encounter and reduce our ability to monetize or restructure our existing derivatives contracts. If we reduce our use of derivatives as a result of the legislation and regulations, our results of operations may become more volatile and our cash flows may be less predictable, which could adversely affect our ability to plan for and fund capital expenditures. Any of these consequences could have a material adverse effect on us, our financial condition, our results of operations and our cash flows.
Our ability to operate our business effectively could be impaired if we fail to attract and retain key management personnel.
We are managed and operated by the board of directors and executive officers of our general partner. All of the personnel that conduct our business are employed by affiliates of our general partner, but we sometimes refer to these individuals as our employees. Our ability to operate our business and implement our strategies depends on our continued ability and the ability of affiliates of our general partner to attract and retain highly skilled management personnel. Competition for these persons is intense. Given our size, we may be at a disadvantage, relative to our larger competitors, in the competition for these personnel. We or affiliates of our general partner may not be able to attract and retain qualified personnel in the future, and the failure to retain or attract senior executives and key personnel could have a material adverse effect on our ability to effectively operate our business. Neither we nor our general partner maintains key person life insurance policies for any of our senior management team.
Terrorist or cyber-attacks and threats, escalation of military activity in response to these attacks or acts of war could have a material adverse effect on our business, financial condition, results of operations and ability to make quarterly distributions to our unitholders.
Terrorist attacks and threats, cyber-attacks, escalation of military activity or acts of war may have significant effects on general economic conditions, fluctuations in consumer confidence and spending and market liquidity, each of which could materially and adversely affect our business. Future terrorist or cyber-attacks, rumors or threats of war, actual conflicts involving the United States or its allies, or military or trade disruptions may significantly affect our operations and those of our customers. Strategic targets, such as energy-related assets and transportation assets, may be at greater risk of future attacks than other targets in the United States. We do not maintain specialized insurance for possible liability resulting from a cyber-attack on our assets that may shut down all or part of our business. Disruption or significant increases in energy prices could result in government-imposed price controls. It is possible that any of these occurrences, or a combination of them, could have a material adverse effect on our business, financial condition, results of operations, and ability to make quarterly distributions to our unitholders.
If we fail to maintain an effective system of internal controls, we may not be able to report our financial results timely and accurately or prevent fraud, which would likely have a negative impact on the market price of our common units.
We are subject to the public reporting requirements of the Exchange Act. We prepare our financial statements in accordance with U.S. generally accepted accounting principles, or GAAP. Effective internal controls are necessary for us to provide reliable financial reports, prevent fraud and to operate successfully as a publicly traded partnership. We may be unsuccessful in maintaining our internal controls, and we may be unable to maintain effective controls over our financial processes and reporting in the future or to comply with our obligations under Section 404 of the Sarbanes-Oxley Act of 2002, which we refer to as Section 404. For example, Section 404 requires us, among other things, to annually review and report on, and our independent registered public accounting firm to assess, the effectiveness of our internal controls over financial reporting.
Any failure to maintain effective internal controls or to improve our internal controls could harm our operating results or cause us to fail to meet our reporting obligations. Given the difficulties inherent in the design and operation of internal controls over financial reporting, we can provide no assurance as to our, or our independent registered public
34
accounting firm’s conclusions about the effectiveness of our internal controls, and we may incur significant costs in our efforts to comply with Section 404. Ineffective internal controls will subject us to regulatory scrutiny and a loss of confidence in our reported financial information, which could have an adverse effect on our business and would likely have a material adverse effect on the trading price of our common units.
For as long as we are an emerging growth company, we will not be required to comply with certain disclosure requirements that apply to other public companies.
For as long as we remain an “emerging growth company” as defined in the Jumpstart Our Business Startups Act (JOBS Act), we may take advantage of certain exemptions from various reporting requirements that are applicable to other public companies that are not emerging growth companies, including not being required to provide an auditor’s attestation report on management’s assessment of the effectiveness of our system of internal control over financial reporting pursuant to Section 404 of the Sarbanes-Oxley Act and reduced disclosure obligations regarding executive compensation in our periodic reports. We will remain an emerging growth company for up to five years from the October 2014 date of our IPO, although we will lose that status sooner if we have more than $1.0 billion of revenues in a fiscal year, have more than $700.0 million in market value of our limited partner interests held by non-affiliates, or issue more than $1.0 billion of non-convertible debt over a three-year period.
In addition, the JOBS Act provides that an emerging growth company can delay adopting new or revised accounting standards until such time as those standards apply to private companies. We have irrevocably elected to “opt out” of this exemption and, therefore, will be subject to the same new or revised accounting standards as other public companies that are not emerging growth companies.
To the extent that we rely on any of the exemptions available to emerging growth companies, you will receive less information about our executive compensation and internal control over financial reporting than issuers that are not emerging growth companies. If some investors find our common units to be less attractive as a result, there may be a less active trading market for our common units and our trading price may be more volatile.
Risks Inherent in an Investment in Us
Our general partner and its affiliates, including USD, have conflicts of interest with us and limited duties to us and our unitholders, and they may favor their own interests to our detriment and that of our unitholders.
USD indirectly owns a
49.9%
limited partner interest and indirectly owns and controls our general partner, which owns a
2.0%
general partner interest in us. Although our general partner has a duty to manage us in a manner that is not adverse to the best interests of our partnership and our unitholders, the directors and officers of our general partner also have a duty to manage our general partner in a manner that is not adverse to the best interests of its owner, USD. Conflicts of interest may arise between USD and its affiliates, including our general partner, on the one hand, and us and our unitholders, on the other hand. In resolving these conflicts, the general partner may favor its own interests and the interests of its affiliates, including USD, over the interests of our common unitholders. These conflicts include, among others, the following situations:
|
•
|
neither our partnership agreement nor any other agreement requires USD to pursue a business strategy that favors us, and the directors and officers of USD have a fiduciary duty to make these decisions in the best interests of the members of USD. USD may choose to shift the focus of its investment and growth to areas not served by our assets;
|
|
•
|
USD may be constrained by the terms of its debt instruments, if any, from taking actions, or refraining from taking actions, that may be in our best interests;
|
|
•
|
our partnership agreement replaces the fiduciary duties that would otherwise be owed by our general partner with contractual standards governing its duties, limiting our general partner’s liabilities and restricting the remedies available to our unitholders for actions that, without the limitations, might constitute breaches of fiduciary duty;
|
|
•
|
except in limited circumstances, our general partner has the power and authority to conduct our business without unitholder approval;
|
35
|
•
|
our general partner will determine the amount and timing of asset purchases and sales, borrowings, issuance of additional partnership securities and the creation, reduction or increase of cash reserves, each of which can affect the amount of cash that is distributed to our unitholders;
|
|
•
|
our general partner will determine the amount and timing of many of our cash expenditures and whether a cash expenditure is classified as an expansion capital expenditure, which would not reduce operating surplus, or a maintenance capital expenditure, which would reduce our operating surplus. This determination can affect the amount of cash that is distributed to our unitholders and to our general partner, the amount of adjusted operating surplus generated in any given period, the conversion ratio of vested Class A units and the ability of the subordinated units to convert into common units;
|
|
•
|
our general partner will determine which costs incurred by it are reimbursable by us;
|
|
•
|
our general partner may cause us to borrow funds in order to permit the payment of cash distributions, even if the purpose or effect of the borrowing is to make a distribution on the subordinated units, to make incentive distributions, to affect the conversion ratio of Class A units to common units or to satisfy the conditions required to convert subordinated units to common units;
|
|
•
|
our partnership agreement permits us to classify up to $18.5 million as operating surplus, even if it is generated from asset sales, non-working capital borrowings or other sources that would otherwise constitute capital surplus. This cash may be used to fund distributions on our subordinated units or to our general partner in respect of the general partner interest or the incentive distribution rights;
|
|
•
|
our partnership agreement does not restrict our general partner from causing us to pay it or its affiliates for any services rendered to us or entering into additional contractual arrangements with any of these entities on our behalf;
|
|
•
|
our general partner intends to limit its liability regarding our contractual and other obligations;
|
|
•
|
our general partner may exercise its right to call and purchase all of the common units not owned by it and its affiliates if it and its affiliates own more than 80.0% of the common units;
|
|
•
|
our general partner controls the enforcement of obligations owed to us by our general partner and its affiliates;
|
|
•
|
our general partner decides whether to retain separate counsel, accountants or others to perform services for us; and
|
|
•
|
our general partner may elect to cause us to issue common units to it in connection with a resetting of the target distribution levels related to our general partner’s incentive distribution rights without the approval of the conflicts committee of the board of directors of our general partner, which we refer to as our conflicts committee, or our unitholders. This election may result in lower distributions to our common unitholders in certain situations.
|
Under the terms of our partnership agreement, the doctrine of corporate opportunity, or any analogous doctrine, does not apply to our general partner or any of its affiliates, including its executive officers, directors and owners. Any such person or entity that becomes aware of a potential transaction, agreement, arrangement or other matter that may be an opportunity for us will not have any duty to communicate or offer such opportunity to us. Any such person or entity will not be liable to us or to any limited partner for breach of any fiduciary duty or other duty by reason of the fact that such person or entity pursues or acquires such opportunity for itself, directs such opportunity to another person or entity or does not communicate such opportunity or information to us. This may create actual and potential conflicts of interest between us and affiliates of our general partner and result in less than favorable treatment of us and our unitholders. Please refer to the discussion under
Item 13. Certain Relationships and Related Transactions, and Director Independence
regarding conflicts of interests and fiduciary duties of our general partner.
Energy Capital Partners has substantial influence over USD and our general partner, and its interests may differ from those of USD, us and our public unitholders.
Energy Capital Partners currently has the right to appoint three of seven members of USD’s board of directors and three of nine members of our general partner’s board of directors and may in the future have the right to appoint the majority of USD’s board of directors if it invests a specified amount in USD, or certain other conditions are met. For so long as Energy Capital Partners is able to appoint more than one member to USD’s board of directors, USD will not, and will not permit its subsidiaries, including us and our general partner, to take or agree to take certain actions
36
without the affirmative vote of Energy Capital Partners, including, among others, any acquisitions or dispositions and any issuances of additional equity interests in us. Energy Capital Partners may make these decisions free of any duty to us and our unitholders. Additionally, members of our general partner’s board of directors appointed by Energy Capital Partners, if any, must approve any distributions made by us, any incurrence of debt by us and the approval, modification or revocation of our budget. As a result, Energy Capital Partners is able to significantly influence the management and affairs of USD and our general partner, including the amount of distributions we make, if any, our policies and operations, the appointment of management, future issuances of securities, amendments to our organizational documents and the entering into of extraordinary transactions. The interests of Energy Capital Partners may not in all cases be aligned with the interests of our common unitholders and, in certain situations, they have no duty to us or our unitholders.
Energy Capital Partners may have an interest in pursuing acquisitions, divestitures and other transactions that, in its judgment, could enhance its equity investment, even though such transactions might involve risks to our common unitholders, or Energy Capital Partners may have an interest in not pursuing transactions that would otherwise benefit us. For example, Energy Capital Partners could influence us to make acquisitions, investments and capital expenditures that increase our indebtedness or to sell revenue-generating assets or to not make such acquisitions, investments or capital expenditures. In addition, Energy Capital Partners may have different tax considerations that could influence its position, including regarding whether and when to dispose of assets and whether and when to incur new or refinance existing indebtedness. In addition, the structuring of future transactions by our general partner may take into consideration these tax or other considerations even where no similar benefit would accrue to our common unitholders or us. Energy Capital Partners may make the decisions to approve any acquisition or disposition by us free of any duty to us and our unitholders.
Energy Capital Partners’ influence on USD and our general partner may have the effect of delaying, preventing or deterring a change of control of our company. Energy Capital Partners and its affiliates and affiliated funds are in the business of making investments in companies in the energy industry and may from time to time acquire and hold interests in businesses that compete directly or indirectly with us. USD’s limited liability company agreement provides that Energy Capital Partners shall not have any duty to refrain from engaging directly or indirectly in the same or similar business activities or lines of business as us or any of our subsidiaries, and that in the event that Energy Capital Partners acquires knowledge of a potential transaction or matter which may be a corporate opportunity for itself and us or any of our subsidiaries, neither we nor any of our subsidiaries shall, to the fullest extent permitted by law, have any expectancy in such corporate opportunity, and Energy Capital Partners shall not, to the fullest extent permitted by law, have any duty to communicate or offer such corporate opportunity to us or any of our subsidiaries and may pursue or acquire such corporate opportunity for itself or direct such corporate opportunity to another person. Energy Capital Partners and its affiliates may also pursue acquisition opportunities that are complementary to our business and, as a result, those acquisition opportunities may not be available to us. Please refer to the discussion under
Item 10. Directors, Executive Officers and Corporate Governance—Special Approval Rights of Energy Capital Partners
regarding the rights of Energy Capital Partners.
At any time following the fifth anniversary of the date of Energy Capital Partners’ investment in USD, Energy Capital Partners, upon giving written notice, shall have the right to compel USD to effect the total sale of Energy Capital Partners’ interests in USD, which we refer to as an ECP Exit. Such a sale could include an acquisition by the remaining owners of USD of Energy Capital Partners’ interests in USD or an initial public offering of USD. If the ECP Exit has not been completed within 180 days of the date USD receives notice of Energy Capital Partners’ desire to sell, Energy Capital Partners shall have the right to compel USD to effect a total sale of USD pursuant to an auction process on terms and conditions determined by, and in a process managed by, the members of USD’s board of directors that are appointed by Energy Capital Partners, provided that certain conditions in connection with the sale are met.
We intend to distribute a significant portion of our available cash, which could limit our ability to pursue growth projects and make acquisitions.
Pursuant to our cash distribution policy we intend to distribute most of our available cash, as that term is defined in our partnership agreement, to our unitholders. As a result, we expect to rely primarily upon external financing sources, including commercial bank borrowings and the issuance of debt and equity securities, to fund our acquisitions and expansion capital expenditures. Therefore, to the extent we are unable to finance our growth externally, our cash distribution policy will significantly impair our ability to grow. In addition, because we intend to distribute most of our
37
available cash, our growth may not be as fast as that of businesses that reinvest their available cash to expand ongoing operations. To the extent we issue additional units in connection with any acquisitions or expansion capital expenditures, the payment of distributions on those additional units may increase the risk that we will be unable to maintain or increase our per unit distribution level. There are no limitations in our partnership agreement or our senior secured credit agreement on our ability to issue additional units, including units ranking senior to the common units as to distribution or liquidation, and our unitholders will have no preemptive or other rights (solely as a result of their status as unitholders) to purchase any such additional units. The incurrence of additional commercial borrowings or other debt to finance our growth strategy would result in increased interest expense, which, in turn, may reduce the amount of cash available to distribute to our unitholders.
The board of directors of our general partner may modify or revoke our cash distribution policy at any time at its discretion and our partnership agreement does not require us to pay any distributions at all. Additionally, members of our general partner’s board of directors appointed by Energy Capital Partners must approve any distributions made by us.
The board of directors of our general partner has adopted a cash distribution policy pursuant to which we intend to distribute quarterly at least $0.2875 per unit on all of our units to the extent we have sufficient cash after the establishment of cash reserves and the payment of our expenses, including payments to our general partner and its affiliates. However, the board may change such policy at any time at its discretion. Additionally, members of our general partner’s board of directors appointed by Energy Capital Partners, if any, must approve any distributions made by us. Our partnership agreement does not require us to pay distributions at all and our general partner’s board of directors has broad discretion in setting the amount of cash reserves each quarter. Investors are cautioned not to place undue reliance on the permanence of our cash distribution policy in making an investment decision. Any modification or revocation of our cash distribution policy could substantially reduce or eliminate the amounts of distributions to our unitholders. The amount of distributions we make and the decision to make any distribution is determined by the board of directors of our general partner as well as the members of our general partner’s board of directors appointed by Energy Capital Partners, whose interests may differ from those of our common unitholders. Our general partner has limited duties to our unitholders, which may permit it to favor its own interests or the interests of our sponsor or its affiliates to the detriment of our common unitholders.
Our partnership agreement replaces our general partner’s fiduciary duties to holders of our common units with contractual standards governing its duties.
Our partnership agreement contains provisions that eliminate the fiduciary standards to which our general partner would otherwise be held by state fiduciary duty law and replaces those duties with several different contractual standards. For example, our partnership agreement permits our general partner to make a number of decisions in its individual capacity, as opposed to in its capacity as our general partner, free of any duties to us and our unitholders. This provision entitles our general partner to consider only the interests and factors that it desires and relieves it of any duty or obligation to give any consideration to any interest of, or factors affecting, us, our affiliates or our limited partners. By purchasing a common unit, a unitholder is treated as having consented to the provisions in our partnership agreement, including the provisions discussed above. Please refer to the discussion under
Item 13. Certain Relationships and Related Transactions, and Director Independence
regarding conflicts of interests and fiduciary duties of our general partner.
Our partnership agreement restricts the remedies available to holders of our common and subordinated units for actions taken by our general partner that might otherwise constitute breaches of fiduciary duty.
Our partnership agreement contains provisions that restrict the remedies available to unitholders for actions taken by our general partner that might otherwise constitute breaches of fiduciary duty under state fiduciary duty law. For example, our partnership agreement:
|
•
|
provides that whenever our general partner makes a determination or takes, or declines to take, any other action in its capacity as our general partner, our general partner is required to make such determination, or take or decline to take such other action, in good faith and will not be subject to any higher standard imposed by our partnership agreement, Delaware law, or any other law, rule or regulation, or at equity;
|
|
•
|
provides that our general partner and its officers and directors will not be liable for monetary damages to us or our limited partners resulting from any act or omission unless there has been a final and non-appealable
|
38
judgment entered by a court of competent jurisdiction determining that our general partner or its officers and directors, as the case may be, acted in bad faith or engaged in fraud or willful misconduct or, in the case of a criminal matter, acted with knowledge that the conduct was criminal; and
|
•
|
provides that our general partner will not be in breach of its obligations under our partnership agreement or its fiduciary duties to us or our limited partners if a transaction with an affiliate or the resolution of a conflict of interest is approved in accordance with, or otherwise meets the standards set forth in, our partnership agreement.
|
In connection with a situation involving a transaction with an affiliate or a conflict of interest, our partnership agreement provides that any determination by our general partner must be made in good faith, and that our conflicts committee and the board of directors of our general partner are entitled to a presumption that they acted in good faith. In any proceeding brought by or on behalf of any limited partner of the partnership, the person bringing or prosecuting such proceeding will have the burden of overcoming such presumption. Please refer to the discussion under
Item 13. Certain Relationships and Related Transactions, and Director Independence
regarding conflicts of interests and fiduciary duties of our general partner.
Our general partner has limited liability regarding our obligations.
Our general partner has limited liability under our contractual arrangements so that the counterparties to such arrangements have recourse only against our assets, and not against our general partner or its assets. Our general partner may therefore cause us to incur indebtedness or other obligations that are nonrecourse to our general partner. Our partnership agreement provides that any action taken by our general partner to limit its liability is not a breach of our general partner’s fiduciary duties, even if we could have obtained more favorable terms without the limitation on liability. In addition, we are obligated to reimburse or indemnify our general partner to the extent that it incurs obligations on our behalf. Any such reimbursement or indemnification payments would reduce the amount of cash otherwise available for distribution to our unitholders.
If you are not both a citizenship eligible holder and a rate eligible holder, your common units may be subject to redemption.
In order to avoid (1) any material adverse effect on the maximum applicable rates that can be charged to customers by our subsidiaries on assets that are subject to rate regulation by the FERC or analogous regulatory body, and (2) any substantial risk of cancellation or forfeiture of any property, including any governmental permit, endorsement or other authorization, in which we have an interest, we have adopted certain requirements regarding those investors who may own our common units. Citizenship eligible holders are individuals or entities whose nationality, citizenship or other related status does not create a substantial risk of cancellation or forfeiture of any property, including any governmental permit, endorsement or authorization, in which we have an interest, and will generally include individuals and entities who are U.S. citizens. Rate eligible holders are individuals or entities subject to U.S. federal income taxation on the income generated by us or entities not subject to U.S. federal income taxation on the income generated by us, so long as all of the entity’s owners are subject to such taxation. If you are not a person who meets the requirements to be a citizenship eligible holder and a rate eligible holder, you run the risk of having your units redeemed by us at the market price as of the date three days before the date the notice of redemption is mailed. The redemption price will be paid in cash or by delivery of a promissory note, as determined by our general partner. In addition, if you are not a person who meets the requirements to be a citizenship eligible holder, you will not be entitled to voting rights.
Cost reimbursements, which are determined in our general partner’s sole discretion, and fees due to our general partner and its affiliates for services provided are substantial and reduce our distributable cash flow to you.
Under our partnership agreement, we are required to reimburse our general partner and its affiliates for all costs and expenses that they incur on our behalf for managing and controlling our business and operations. Except to the extent specified under our omnibus agreement, our general partner determines the amount of these expenses. Under the terms of the omnibus agreement we are required to reimburse USD for providing certain general and administrative services to us. Our general partner and its affiliates also may provide us other services for which we will be charged fees. Payments to our general partner and its affiliates are substantial and reduce the amount of distributable cash flow to unitholders. For the twelve months ending December 31,
2017
, we estimate that these expenses will be approximately
39
$6.1 million
, which includes, among other items, compensation expense for all employees required to manage and operate our business. For a description of the cost reimbursements to our general partner, please read the discussion under
Part II, Item 8. Financial Statements and Supplementary Data, Note 13. Transactions with Related Parties
regarding reimbursements to our general partner under the omnibus agreement.
Unitholders have very limited voting rights and, even if they are dissatisfied, they cannot remove our general partner without its consent.
Unlike the holders of common stock in a corporation, unitholders have only limited voting rights on matters affecting our business and, therefore, limited ability to influence management’s decisions regarding our business. Unitholders do not elect our general partner or the board of directors of our general partner and have no right to elect our general partner or the board of directors of our general partner on an annual or other continuing basis. The board of directors of our general partner is chosen by the members of our general partner, which is indirectly owned by USD. Furthermore, if the unitholders are dissatisfied with the performance of our general partner, they will have little ability to remove our general partner. As a result of these limitations, the price at which our common units trade could be diminished because of the absence or reduction of a takeover premium in the trading price.
The unitholders are unable initially to remove our general partner without its consent because our general partner and its affiliates own sufficient units to prevent its removal. The vote of the holders of at least 66
2
/
3
% of all outstanding units voting together as a single class is required to remove our general partner. At
December 31, 2016
, our general partner and its affiliates own
49.9%
of the limited partnership interests entitled to vote in this matter (excluding general partner units and without consideration of any common units held by our officers, directors, employees and certain other persons affiliated with us). Also, if our general partner is removed without cause during the time any subordinated units are outstanding and the subordinated units held by our general partner and its affiliates are not voted in favor of that removal, all remaining subordinated units will automatically be converted into common units, and any existing arrearages on the common units will be extinguished. A removal of our general partner under these circumstances would adversely affect the common units by prematurely eliminating their distribution and liquidation preference over the subordinated units, which would otherwise have continued until we had met certain distribution and performance tests. Furthermore, all of the unvested Class A units will immediately vest and convert into common units based on the maximum conversion factor that could have applied to such Class A units. This conversion would adversely affect the common units by prematurely eliminating the liquidation preference of common units over the Class A units, which would have otherwise continued while certain conditions remained unsatisfied.
“Cause”
is narrowly defined under our partnership agreement to mean that a court of competent jurisdiction has entered a final, non-appealable judgment finding the general partner liable for actual fraud or willful
misconduct in its capacity as our general partner. Cause does not include most cases of charges of poor management of the business, so the removal of our general partner because of the unitholders’ dissatisfaction with our general partner’s performance in managing us will most likely result in the automatic conversion to common units of all remaining outstanding subordinated units.
Furthermore, unitholders’ voting rights are further restricted by the partnership agreement provision providing that any units held by a person that owns 20.0% or more of any class of units then outstanding, other than our general partner, its affiliates, their transferees, and persons who acquired such units with the prior approval of the board of directors of our general partner, cannot vote on any matter.
Our partnership agreement also contains provisions limiting the ability of unitholders to call meetings or to acquire information about our operations, as well as other provisions limiting the unitholders’ ability to influence the manner or direction of management.
Our general partner interest or the control of our general partner may be transferred to a third party without unitholder consent.
Our general partner may transfer its general partner interest to a third party at any time without the consent of the unitholders. Furthermore, there is no restriction in our partnership agreement on the ability of USD Group LLC to transfer its membership interest in our general partner to a third party. The new owners of our general partner would
40
then be in a position to replace the board of directors and officers of our general partner with their own choices and to control the decisions taken by the board of directors and officers.
The incentive distribution rights of our general partner may be transferred to a third party without unitholder consent.
Our general partner may transfer its incentive distribution rights to a third party at any time without the consent of our unitholders. If our general partner transfers its incentive distribution rights to a third party but retains its general partner interest, our general partner may not have the same incentive to grow our partnership and increase quarterly distributions to unitholders over time as it would if it had retained ownership of its incentive distribution rights. For example, a transfer of incentive distribution rights by our general partner could reduce the likelihood of USD selling or contributing additional midstream infrastructure assets and businesses to us, as USD would have less of an economic incentive to grow our business, which in turn would impact our ability to grow our asset base.
We may issue additional units without unitholder approval, which would dilute unitholder interests.
At any time, we may issue an unlimited number of limited partner interests of any type without the approval of our unitholders and our unitholders will have no preemptive or other rights (solely as a result of their status as unitholders) to purchase any such limited partner interests. Further, neither our partnership agreement nor our senior secured credit agreement prohibits the issuance of equity securities that may effectively rank senior to our common units as to distributions or liquidations. The issuance by us of additional common units or other equity securities of equal or senior rank will have the following effects:
|
•
|
our unitholders’ proportionate ownership interest in us will decrease;
|
|
•
|
the amount of distributable cash flow on each unit may decrease;
|
|
•
|
because a lower percentage of total outstanding units will be subordinated units, the risk that a shortfall in the payment of the minimum quarterly distribution will be borne by our common unitholders will increase;
|
|
•
|
the ratio of taxable income to distributions may increase;
|
|
•
|
the relative voting strength of each previously outstanding unit may be diminished; and
|
|
•
|
the market price of our common units may decline.
|
USD Group LLC may sell our units in the public or private markets, and such sales could have an adverse impact on the trading price of the common units.
USD Group LLC held 3,186,254 common units and 8,370,836 subordinated units at
December 31, 2016
. All of the subordinated units will convert into common units on a one-for-one basis in separate, sequential tranches, with each tranche comprising 20.0% of the subordinated units outstanding at the closing of our IPO on October 15, 2014. A separate tranche will convert on each business day occurring no earlier than January 1, 2015 (but not more than once in any twelve-month period), assuming the conditions for conversion are satisfied. Additionally, we have agreed to provide USD Group LLC with certain registration rights. The sale of these units in the public or private markets could have an adverse impact on the price of the common units.
Our general partner’s discretion in establishing cash reserves may reduce the amount of distributable cash flow to unitholders.
Our partnership agreement requires our general partner to deduct from operating surplus cash reserves that it determines are necessary to fund our future operating expenditures. In addition, our partnership agreement permits the general partner to reduce available cash by establishing cash reserves for the proper conduct of our business, to comply with applicable law or agreements to which we are a party, or to provide funds for future distributions to partners. These cash reserves will affect the amount of distributable cash flow to unitholders.
41
Affiliates of our general partner, including USD, and Energy Capital Partners and its affiliates may compete with us, and none of Energy Capital Partners, our general partner or any of their respective affiliates have any obligation to present business opportunities to us.
Neither our partnership agreement nor our omnibus agreement prohibits USD or any other affiliates of our general partner or Energy Capital Partners or its affiliates from owning assets or engaging in businesses that compete directly or indirectly with us. In addition, USD and other affiliates of our general partner, and Energy Capital Partners and its affiliates may acquire, construct or dispose of additional midstream infrastructure in the future without any obligation to offer us the opportunity to purchase any of those assets. For example, USD Group LLC currently owns the right to construct and further develop the Hardisty terminal, which USD Group LLC expects to complete in a future period. If we are unable to acquire these facilities from USD Group LLC, these expansions may compete directly with our Hardisty terminal for future throughput volumes, which may impact our ability to enter into new terminal services agreements, including with our existing customers, following the termination of our existing agreements or the terms thereof and our ability to compete for future spot volumes. As a result, competition from USD and other affiliates of our general partner could materially adversely impact our results of operations and distributable cash flow to unitholders.
Our general partner may cause us to borrow funds in order to make cash distributions, even where the purpose or effect of the borrowing benefits the general partner or its affiliates.
In some instances, our general partner may cause us to borrow funds under our Revolving Credit Facility, from USD or otherwise from third parties in order to permit the payment of cash distributions. These borrowings are permitted even if the purpose and effect of the borrowing is to enable us to make a distribution on the subordinated units, to make incentive distributions or to satisfy the conditions required to convert subordinated units into common units.
Our general partner has a limited call right that it may exercise at any time it or its affiliates own more than 80.0% of the outstanding limited partner interests and that may require you to sell your common units at an undesirable time or price.
If at any time our general partner and its affiliates own more than 80.0% of the then issued and outstanding common units, our general partner has the right, but not the obligation, which it may assign to any of its affiliates or to us, to acquire all, but not less than all, of the common units held by unaffiliated persons at a price not less than their then-current market price. As a result, you may be required to sell your common units at an undesirable time or price and may not receive any return on your investment. You may also incur a tax liability upon a sale of your units. Our general partner and its affiliates own approximately 22.5% of our common units (excluding any common units held by our officers, directors, employees and certain other persons affiliated with us) and 49.9% of our common units assuming the conversion of all subordinated units into common units.
Your liability may not be limited if a court finds that unitholder action constitutes control of our business.
A general partner of a partnership generally has unlimited liability for the obligations of the partnership, except for those contractual obligations of the partnership that are expressly made non-recourse to the general partner. Our partnership is organized under Delaware law, and we conduct business in a number of other states. The limitations on the liability of holders of limited partner interests for the obligations of a limited partnership have not been clearly established in some jurisdictions. You could be liable for our obligations as if you were a general partner if a court or government agency were to determine that:
|
•
|
we were conducting business in a state but had not complied with that particular state’s partnership statute; or
|
|
•
|
your right to act with other unitholders to remove or replace the general partner, to approve some amendments to our partnership agreement or to take other actions under our partnership agreement constitute “control” of our business.
|
42
Unitholders may have to repay distributions that were wrongfully distributed to them.
Under certain circumstances, unitholders may have to repay amounts wrongfully distributed to them. Under Section 17-607 of the Delaware Revised Uniform Limited Partnership Act, we may not make a distribution to you if the distribution would cause our liabilities to exceed the fair value of our assets. Delaware law provides that for a period of three years from the date of the impermissible distribution, limited partners who received the distribution and who knew at the time of the distribution that it violated Delaware law will be liable to the limited partnership for the distribution amount. Transferees of common units are liable for the obligations of the transferor to make contributions to the partnership that are known to the transferee at the time of the transfer and for unknown obligations if the liabilities could be determined from our partnership agreement. Liabilities to partners on account of their partnership interest and liabilities that are non-recourse to the partnership are not counted for purposes of determining whether a distribution is permitted.
Because our common units are yield-oriented securities, increases in interest rates could adversely impact our unit price, our distributable cash flow, our ability to issue equity or incur debt for acquisitions or other purposes and our ability to make cash distributions at our intended levels.
Interest rates may increase in the future. As a result, interest rates on our future credit facilities and debt offerings could be higher than current levels, causing our financing costs to increase accordingly. As with other yield-oriented securities, our unit price is affected by the level of our cash distributions and implied distribution yield. The distribution yield is often used by investors to compare and rank yield-oriented securities for investment decision-making purposes. Therefore, changes in interest rates, either positive or negative, may affect our interest expense and distributable cash flow, the yield requirements of investors who invest in our units, and a rising interest rate environment could have an adverse impact on our unit price, our ability to issue equity or incur debt for acquisitions or other purposes and our ability to make cash distributions at our intended levels.
The holder of our incentive distribution rights may elect to cause us to issue common units and general partner units to it in connection with a resetting of the target distribution levels related to its incentive distribution rights, without the approval of our conflicts committee or the holders of our common units. This could result in lower distributions to holders of our common units.
Our general partner has the right, at any time when there are no subordinated units outstanding and it has received distributions on its incentive distribution rights at the highest level to which it is entitled (48.0%, in addition to distributions paid on its 2.0% general partner interest) for each of the prior four consecutive fiscal quarters, to reset the initial target distribution levels at higher levels based on our distributions at the time of the exercise of the reset election. Following a reset election, the minimum quarterly distribution will be adjusted to equal the reset minimum quarterly distribution, and the target distribution levels will be reset to correspondingly higher levels based on percentage increases above the reset minimum quarterly distribution.
If our general partner elects to reset the target distribution levels, it will be entitled to receive a number of common units and general partner units. The number of common units to be issued to our general partner will be equal to that number of common units that would have entitled the general partner to a quarterly cash distribution equal to distributions to our general partner on the incentive distribution rights in the prior quarter. Our general partner will also be issued the number of general partner units necessary to maintain our general partner’s interest in us at the level that existed immediately prior to the reset election. We anticipate that our general partner would exercise this reset right in order to facilitate acquisitions or internal growth projects that would not be sufficiently accretive to cash distributions per common unit without such conversion. It is possible, however, that our general partner could exercise this reset election at a time when it is experiencing, or expects to experience, declines in the cash distributions it receives related to its incentive distribution rights and may, therefore, desire to be issued common units rather than retain the right to receive distributions based on the initial target distribution levels. This risk could be elevated if our incentive distribution rights have been transferred to a third party. As a result, a reset election may cause our common unitholders to experience a reduction in the amount of cash distributions that they would have otherwise received had we not issued new common units and general partner units in connection with resetting the target distribution levels. Additionally, our general
43
partner has the right to transfer all or any portion of our incentive distribution rights at any time, and such transferee shall have the same rights as the general partner relative to resetting target distributions if our general partner concurs that the tests for resetting target distributions have been fulfilled.
The NYSE does not require a publicly traded limited partnership like us to comply with certain of its corporate governance requirements.
Our common units are listed on the NYSE. Because we are a publicly traded limited partnership, the NYSE does not require us to have a majority of independent directors on our general partner’s board of directors or to establish a compensation committee or a nominating and corporate governance committee. Accordingly, unitholders will not have the same protections afforded to shareholders of corporations that are subject to all of the NYSE corporate governance requirements.
We incur increased costs as a result of being a publicly traded partnership.
As a publicly traded partnership, we incur significant legal, accounting and other expenses that we did not incur prior to our IPO. For example, the Sarbanes-Oxley Act of 2002, as well as rules implemented by the SEC and the NYSE, require publicly traded entities to adopt various corporate governance practices that further increase our costs, including requirements to have at least three independent directors, create an audit committee and adopt policies regarding internal controls and disclosure controls and procedures, including the preparation of reports on internal controls over financial reporting.
The price of our common units may fluctuate significantly, and you could lose all or part of your investment.
The market price of our common units may also be influenced by many factors, some of which are beyond our control, including:
|
•
|
our quarterly distributions;
|
|
•
|
our quarterly or annual earnings or those of other companies in our industry;
|
|
•
|
announcements by us or our competitors of significant contracts or acquisitions;
|
|
•
|
changes in accounting standards, policies, guidance, interpretations or principles;
|
|
•
|
general economic conditions;
|
|
•
|
the failure of securities analysts to cover our common units or changes in financial estimates by analysts;
|
|
•
|
future sales of our common units; and
|
|
•
|
other factors described in these “Risk Factors.”
|
Tax Risks
Our tax treatment depends on our status as a partnership for U.S. federal income tax purposes. If the Internal Revenue Service ("IRS") were to treat us as a corporation for U.S. federal income tax purposes, which would subject us to entity-level taxation, then our distributable cash flow to our unitholders would be substantially reduced.
The anticipated after-tax economic benefit of an investment in our common units depends largely on our being treated as a partnership for U.S. federal income tax purposes.
Despite the fact that we are a limited partnership under Delaware law, it is possible in certain circumstances for a partnership such as ours to be treated as a corporation for U.S. federal income tax purposes. A change in our business or a change in current law could cause us to be treated as a corporation for U.S. federal income tax purposes or otherwise subject us to entity-level taxation as an entity.
If we were treated as a corporation for U.S. federal income tax purposes, we would pay U.S. federal income tax on our taxable income at the corporate tax rate, which is currently a maximum of 35.0%, and would likely pay state and local income tax at varying rates. Distributions would generally be taxed again as corporate dividends (to the extent
44
of our current and accumulated earnings and profits), and no income, gains, losses, deductions, or credits would flow through to you. Because a tax would be imposed upon us as a corporation, our distributable cash flow would be substantially reduced. Therefore, if we were treated as a corporation for U.S. federal income tax purposes, there would be a material reduction in the anticipated cash flow and after-tax return to our unitholders, likely causing a substantial reduction in the value of our common units.
Our partnership agreement provides that, if a law is enacted or existing law is modified or interpreted in a manner that subjects us to taxation as a corporation or otherwise subjects us to entity-level taxation for federal, state or local income tax purposes, the minimum quarterly distribution amount and the target distribution levels may be adjusted to reflect the impact of that law on us.
Notwithstanding our treatment for U.S. federal income tax purposes, we are subject to certain non-U.S.-taxes. If a taxing authority were to successfully assert that we have more tax liability than we anticipate or legislation were enacted that increased the taxes to which we are subject, the distributable cash flow to our unitholders could be further reduced.
Some of our business operations and subsidiaries are subject to income, withholding and other taxes in the non-U.S. jurisdictions in which they are organized or from which they receive income, reducing the amount of distributable cash flow. In computing our tax obligation in these non-U.S. jurisdictions, we are required to take various tax accounting and reporting positions on matters that are not entirely free from doubt and for which we have not received rulings from the governing tax authorities, such as whether withholding taxes will be reduced by the application of certain tax treaties. Upon review of these positions the applicable authorities may not agree with our positions. A successful challenge by a taxing authority could result in additional tax being imposed on us, reducing the distributable cash flow to our unitholders. In addition, changes in our operations or ownership could result in higher than anticipated tax being imposed in jurisdictions in which we are organized or from which we receive income and further reduce the distributable cash flow. Although these taxes may be properly characterized as foreign income taxes, you may not be able to credit them against your liability for U.S. federal income taxes on your share of our earnings.
If we were subjected to a material amount of additional entity-level taxation by individual states, counties or cities, it would reduce our distributable cash flow to our unitholders.
Changes in current state, county or city law may subject us to additional entity-level taxation by individual states, counties or cities. Several states have subjected, or are evaluating ways to subject partnerships to entity-level taxation through the imposition of state income, franchise and other forms of taxation. Imposition of any such taxes may substantially reduce the distributable cash flow to you and the value of our common units could be negatively impacted. Our partnership agreement provides that, if a law is enacted or existing law is modified or interpreted in a manner that subjects us to entity-level taxation, the minimum quarterly distribution amount and the target distribution levels may be adjusted to reflect the impact of that law on us.
The tax treatment of publicly traded partnerships, companies with multinational operations or an investment in our common units could be subject to potential legislative, judicial or administrative changes and differing interpretations, possibly on a retroactive basis.
The present U.S. federal income tax treatment of publicly traded partnerships, companies with multinational operations, or an investment in our common units may be modified by administrative, legislative or judicial interpretation at any time. For example, members of Congress and the President have periodically considered substantive changes to the existing U.S. federal income tax laws that affect publicly traded partnerships, including the elimination of the qualifying income exception upon which we rely for our treatment as a partnership for U.S. federal income tax purposes. Any modification to the U.S. federal income tax laws and interpretations thereof may or may not be retroactively applied and could make it more difficult or impossible to meet the exception for us to be treated as a partnership for U.S. federal income tax purposes. We are unable to predict whether any such changes will ultimately be enacted. However, it is possible that a change in law could affect us, and any such changes could negatively impact the value of an investment in our common units.
45
Our unitholders’ share of our income will be taxable to them for U.S. federal income tax purposes even if they do not receive any cash distributions from us.
Because a unitholder is treated as a partner to whom we will allocate taxable income that could be different in amount than the cash we distribute, a unitholder’s allocable share of our taxable income will be taxable to the unitholder, which may require the payment of U.S. federal income taxes and, in some cases, state and local income taxes, on the unitholder's share of our taxable income even if the unitholder receives no cash distributions from us. Our unitholders may not receive cash distributions from us equal to their share of our taxable income or even equal to the actual tax liability that results from that income.
If the IRS contests the U.S. federal income tax positions we take, the market for our common units may be adversely impacted and the cost of any IRS contest will reduce our distributable cash flow to our unitholders.
We have not requested a ruling from the IRS with respect to our treatment as a partnership for U.S. federal income tax purposes. The IRS may adopt positions that differ from the positions we take, and the IRS’s positions may ultimately be sustained. It may be necessary to resort to administrative or court proceedings to sustain some or all of the positions we take and such positions may not ultimately be sustained. Any contest with the IRS, and the outcome of any IRS contest, may have a materially adverse impact on the market for our common units and the price at which they trade. In addition, our costs for any contest with the IRS will be borne indirectly by our unitholders and our general partner because the costs will reduce our distributable cash flow.
Some of our activities may not generate qualifying income, and we conduct these activities in a separate subsidiary that is treated as a corporation for U.S. federal income tax purposes. Corporate U.S. federal income tax paid by this subsidiary reduces our cash available for distribution.
In order to maintain our status as a partnership for U.S. federal income tax purposes, 90% or more of our gross income in each tax year must be qualifying income under Section 7704 of the Internal Revenue Code. To ensure that 90% or more of our gross income in each tax year is qualifying income, we currently conduct a portion of our business, relating to railcar fleet services, in a separate subsidiary that is treated as a corporation for U.S. federal income tax purposes.
Such corporate subsidiary is subject to corporate-level federal income tax on its taxable income at the corporate tax rate, which is currently a maximum of 35%, and will also likely pay state (and possibly local) income tax at varying rates, on its taxable income. If the IRS were to successfully assert that such corporate subsidiary has more tax liability than we anticipate or legislation were enacted that increased the corporate tax rate, our cash available for distribution to our unitholders would be further reduced.
If the IRS makes audit adjustments to our income tax return for tax years beginning after December 31, 2017, it may assess and collect any taxes (including any applicable penalties and interest) resulting from such audit adjustment directly from us, in which case our cash available for distribution to our unitholders might be substantially reduced.
Pursuant to the Bipartisan Budget Act of 2015, for tax years beginning after December 31, 2017, if the IRS makes audit adjustments to our income tax returns, it may assess and collect any taxes (including any applicable penalties and interest) resulting from such audit adjustments directly from us. Generally, we expect to elect to have our general partner and our unitholders take such audit adjustment into account in accordance with their interests in us during the tax year under audit, but there can be no assurance that such election will be effective in all circumstances. If we are unable to have our general partner and our unitholders take such audit adjustment into account in accordance with their interests in us during the tax year under audit, our current unitholders may bear some or all of the tax liability resulting from such audit adjustment, even if such unitholders did not own units in us during the tax year under audit. If, as a result of any such adjustments, we are required to make payments of taxes, penalties and interest, our cash available for distribution to our unitholders might be substantially reduced. These rules are not applicable to us for tax years beginning on or prior to December 31, 2017.
46
Tax gain or loss on the disposition of our common units could be more or less than expected.
If our unitholders sell common units, they will recognize a gain or loss for U.S. federal income tax purposes equal to the difference between the amount realized and their tax basis in those common units. Because distributions in excess of their allocable share of our net taxable income decrease their tax basis in their common units, the amount, if any, of such prior excess distributions with respect to the common units a unitholder sells will, in effect, become taxable income to the unitholder if it sells such common units at a price greater than its tax basis in those common units, even if the price received is less than its original cost. Furthermore, a substantial portion of the amount realized on a sale of common units, whether or not representing gain, may be taxed as ordinary income due to potential recapture items, including depreciation recapture. In addition, because the amount realized includes a unitholder’s share of our nonrecourse liabilities, a unitholder that sells common units, may incur a tax liability in excess of the amount of cash received from the sale.
Tax-exempt entities and non-U.S. persons face unique tax issues from owning our common units that may result in adverse tax consequences to them.
Investment in common units by tax-exempt entities, such as employee benefit plans and individual retirement accounts, or IRAs, and non-U.S. persons raises issues unique to them. For example, virtually all of our income allocated to organizations that are exempt from U.S. federal income tax, including IRAs and other retirement plans, will be unrelated business taxable income and will be taxable to them. Distributions to non-U.S. persons will be reduced by withholding taxes at the highest applicable effective tax rate, and non-U.S. persons will be required to file U.S. federal income tax returns and pay tax on their share of our taxable income. If you are a tax-exempt entity or a non-U.S. person, you should consult a tax advisor before investing in our common units.
We treat each purchaser of common units as having the same tax benefits without regard to the actual common units purchased. The IRS may challenge this treatment, which could adversely affect the value of the common units.
Because we cannot match transferors and transferees of common units and because of other reasons, we have adopted depreciation and amortization positions that may not conform to all aspects of existing Treasury regulations promulgated under the Internal Revenue Code and referred to as “Treasury Regulations.” A successful IRS challenge to those positions could adversely affect the amount of tax benefits available to you. A successful IRS challenge could also affect the timing of these tax benefits or the amount of gain from your sale of common units and could have a negative impact on the value of our common units or result in audit adjustments to your tax returns.
We prorate our items of income, gain, loss and deduction for U.S. federal income tax purposes between transferors and transferees of our units each month based upon the ownership of our units on the first business day of each month, instead of on the basis of the date a particular unit is transferred. The IRS may challenge aspects of our proration method, which could change the allocation of items of income, gain, loss and deduction among our unitholders.
We prorate our items of income, gain, loss and deduction between transferors and transferees of our units each month based upon the ownership of our units on the first day of each month, instead of on the basis of the date a particular unit is transferred. The U.S. Department of Treasury and the IRS have issued Treasury Regulations that permit publicly traded partnerships to use a monthly simplifying convention that is similar to ours, but they do not specifically authorize all aspects of the proration method we have adopted. If the IRS were to successfully challenge this method, we could be required to change the allocation of items of income, gain, loss and deduction among our unitholders.
A unitholder whose common units are loaned to a “short seller” to effect a short sale of common units may be considered as having disposed of those common units. If so, he would no longer be treated for U.S. federal income tax purposes as a partner with respect to those common units during the period of the loan and may be required to recognize gain or loss from the disposition.
Because a unitholder whose common units are loaned to a “short seller” to effect a short sale of common units may be considered as having disposed of the loaned common units, he may no longer be treated for federal income tax
47
purposes as a partner with respect to those common units during the period of the loan to the short seller and the unitholder may be required to recognize gain or loss from such disposition. Moreover, during the period of the loan to the short seller, any of our income, gain, loss or deduction with respect to those common units may not be reportable by the unitholder and any cash distributions received by the unitholder as to those common units could be fully taxable as ordinary income. Unitholders desiring to assure their status as partners and avoid the risk of gain recognition from a loan to a short seller are urged to modify any applicable brokerage account agreements to prohibit their brokers from loaning their common units.
We have adopted certain valuation methodologies in determining a unitholder's allocations of income, gain, loss and deduction. The IRS may challenge these methodologies or the resulting allocations, and such a challenge could adversely affect the value of our common units.
In determining the items of income, gain, loss and deduction allocable to our unitholders, in certain circumstances, including when we issue additional units, we must determine the fair market value of our assets. Although we may from time to time consult with professional appraisers regarding valuation matters, we make many fair value estimates using a methodology based on the market value of our common units as a means to measure the fair market value of our assets. The IRS may challenge these valuation methods and the resulting allocations of income, gain, loss and deduction.
A successful IRS challenge to these methods or allocations could adversely affect the amount, character and timing of taxable income or loss allocated to our unitholders. It also could affect the amount of gain from our unitholders’ sale of common units and could have a negative impact on the value of our common units or result in audit adjustments to our unitholders’ tax returns without the benefit of additional deductions.
The sale or exchange of 50.0% or more of our capital and profits interests during any twelve-month period will result in the termination of our partnership for U.S. federal income tax purposes.
We will be considered to have technically terminated our partnership for U.S. federal income tax purposes if there is a sale or exchange of 50.0% or more of the total interests in our capital and profits within a twelve-month period. For purposes of determining whether the 50.0% threshold has been met, multiple sales of the same interest will be counted only once. Our technical termination would, among other things, result in the closing of our taxable year for all unitholders, which would result in us filing two tax returns (and our unitholders could receive two Schedules K-1 if relief was not available, as described below) for one fiscal year and could result in a deferral of depreciation deductions allowable in computing our taxable income. In the case of a unitholder reporting on a taxable year other than a fiscal year ending December 31, the closing of our taxable year may also result in more than twelve months of our taxable income or loss being includable in his taxable income for the year of termination. Our termination currently would not affect our classification as a partnership for U.S. federal income tax purposes, but instead we would be treated as a new partnership for U.S. federal income tax purposes. If treated as a new partnership, we must make new tax elections, including a new election under Section 754 of the Internal Revenue Code, and could be subject to penalties if we are unable to determine that a termination occurred. The IRS has provided a publicly traded partnership technical termination relief program whereby, if a publicly traded partnership that technically terminated requests publicly traded partnership technical termination relief and such relief is granted by the IRS, among other things, the partnership will only have to provide one Schedule K-1 to unitholders for the year notwithstanding two partnership tax years.
As a result of investing in our common units, you may become subject to state, local and foreign taxes and return filing requirements in jurisdictions where we operate or own or acquire properties.
In addition to U.S. federal income taxes, our unitholders are likely subject to other taxes, including state, local and foreign taxes, unincorporated business taxes and estate, inheritance or intangible taxes that are imposed by the various jurisdictions in which we conduct business or control property now or in the future, even if they do not live in any of those jurisdictions. Our unitholders are likely required to file state, local and foreign income tax returns and pay state and local income taxes in some or all of these various jurisdictions. Further, our unitholders may be subject to penalties for failure to comply with those requirements. We currently own assets and conduct business in Alberta, Canada, California, Texas and Wyoming. Some of these jurisdictions currently impose a personal income tax on
48
individuals. As we make acquisitions or expand our business, we may control assets or conduct business in additional states that impose a personal income tax. Our unitholders bear responsibility for filing all federal, state, local and foreign tax returns.
A description of our properties is included in
Item 1. Business
, which is incorporated herein by reference.
Our Hardisty terminal is located on land we own. Our Casper terminal is located on land we own, as well as land owned by others, but operated by us under leases with private land owners, public authorities, railways, or public utilities. Our West Colton and San Antonio terminals are located on land owned by others and are operated by us under easements and rights-of-way, licenses, leases or permits that have been granted by private land owners, public authorities, railways or public utilities.
We have satisfactory title and other rights to all of the real estate assets that were contributed to us at the closing of our IPO and that we have subsequently acquired. Under the omnibus agreement, our sponsor has agreed to indemnify us for any materially adverse title defects and any failures to obtain certain consents and permits necessary to conduct our business that are identified prior to the fifth anniversary of the closing of the IPO. Under the membership interest purchase agreement entered into in connection with the acquisition of the Casper terminal, Casper Crude to Rail Holdings, LLC, as seller of the Casper terminal, agreed to indemnify us for the inaccuracy or breach of its representation that it has good and valid title to its owned property and a valid leasehold for its leased property, subject to certain exceptions and deductibles, that are identified prior to the 18-month anniversary of our acquisition of the Casper terminal.
Obligations under our senior secured credit facility are secured by a first priority lien on our assets and those of our restricted subsidiaries (as such term is defined in our senior secured credit facility), other than certain excluded assets. Title to the real property necessary for us to operate our business may also be subject to encumbrances in some cases, such as customary interests generally retained in connection with the acquisition of real property, liens that can be imposed in some jurisdictions for government-initiated action to clean up environmental contamination, liens for current taxes and other burdens, and easements, restrictions, and other encumbrances to which the underlying properties were subject at the time of lease or acquisition by our Predecessor or us. However, we do not believe that any of these burdens would materially detract from the value of these properties or from our interest in these properties or would materially interfere with their use in the operation of our business.
Although we may, from time to time, be involved in litigation and claims arising out of our operations in the normal course of business, we are not a party to any litigation or governmental or other proceeding that we believe will have a material adverse impact on our consolidated financial condition or results of operations. In addition, under our omnibus agreement, USD has agreed to indemnify us for certain environmental and other liabilities attributable to the ownership or operation of the assets contributed to us in connection with the IPO that occurred prior to the closing of the IPO.
Not Applicable.
49
Our common units are listed and traded on the NYSE, under the ticker symbol "USDP". The following table presents intraday high and low sales prices per common unit and cash distributions declared to unitholders for each quarter.
|
First Quarter
|
Second Quarter
|
Third Quarter
|
Fourth Quarter
|
|||||||||||||
|
2016
|
||||||||||||||||
|
High
|
$
|
8.71
|
|
$
|
12.00
|
|
$
|
13.25
|
|
$
|
16.80
|
|
||||
|
Low
|
$
|
4.72
|
|
$
|
7.90
|
|
$
|
9.40
|
|
$
|
11.56
|
|
||||
|
Quarterly cash distribution per unit
(1)
|
$
|
0.3075
|
|
$
|
0.3150
|
|
$
|
0.3225
|
|
$
|
0.3300
|
|
||||
|
2015
|
||||||||||||||||
|
High
|
15.06
|
|
15.38
|
|
12.50
|
|
$
|
10.77
|
|
|||||||
|
Low
|
12.10
|
|
11.75
|
|
7.62
|
|
$
|
6.00
|
|
|||||||
|
Quarterly cash distribution per unit
(1)
|
0.2875
|
|
0.2900
|
|
0.2925
|
|
$
|
0.3000
|
|
|||||||
|
(1)
|
Represents cash distribution attributable to the quarter and declared and paid within 60 days following the end of such quarter.
|
On
March 3, 2017
, the last reported sales price of our common units on the NYSE was
$13.40
per common unit. On
March 3, 2017
, there were approximately
2,200
common unitholders,
fourteen
of which were registered common unitholder of record. An established public trading market does not exist for our Class A units, subordinated units, or our general partner units. Our Class A units are held by senior management of USD. All of our subordinated units are held by USD Group LLC, while all of our general partner units are held by USD Partners GP LLC.
Under our current cash distribution policy, we intend to make minimum quarterly distributions to the holders of our common, Class A, subordinated and general partner units of at least
$0.2875
per unit, or
$1.15
per unit on an annualized basis, to the extent we have sufficient available cash after the establishment of cash reserves and the payment of costs and expenses, including the payment of expenses to our general partner and its affiliates. Our current cash distribution policy is also subject to certain restrictions, as well as the discretion of our general partner in determining the amount of our available cash each quarter. These restrictions include restrictions under our senior secured credit agreement, our general partner's discretion to establish reserves and to take other actions provided by our limited partnership agreement, and the performance of our subsidiaries. For further information about distributions and about these and other limitations and risks related to distributions, please read
Item 1A. Risk Factors
and
Item 7. Management’s Discussion and Analysis of Financial Condition and Results of Operations—Liquidity and Capital Resources—Distributions.
SECURITIES AUTHORIZED FOR ISSUANCE UNDER EQUITY COMPENSATION PLANS
Please see
Item 12. Security Ownership of Certain Beneficial Owners and Management and Related Stockholder Matters—Securities Authorized for Issuance Under Equity Compensation Plans
for information regarding our equity compensation plans as of
December 31, 2016
.
UNREGISTERED SALES OF EQUITY SECURITIES
None not previously reported on a current report on Form 8-K.
ISSUER PURCHASES OF EQUITY SECURITIES
None.
50
The following table sets forth, for the periods and at the dates indicated, the summary historical financial data of USD Partners LP and our Predecessor. The table is derived, and should be read in conjunction with, our audited consolidated financial statements and notes thereto included in
Item 8. Financial Statements and Supplementary Data
. See also
Item 7. Management’s Discussion and Analysis of Financial Condition and Results of Operations
.
|
For the Year Ended December 31,
|
|||||||||||||||||||
|
2016
|
2015
|
2014
|
2013
|
2012
|
|||||||||||||||
|
(in thousands, except per unit amounts and bpd)
|
|||||||||||||||||||
|
Income Statements Data
(1)(2)(3)
|
|||||||||||||||||||
|
Operating revenues
|
$
|
111,125
|
|
$
|
81,763
|
|
$
|
36,098
|
|
$
|
26,301
|
|
$
|
24,875
|
|
||||
|
Operating costs
|
78,485
|
|
59,309
|
|
35,451
|
|
24,832
|
|
21,744
|
|
|||||||||
|
Operating income
|
32,640
|
|
22,454
|
|
647
|
|
1,469
|
|
3,131
|
|
|||||||||
|
Interest expense, net
|
9,837
|
|
4,368
|
|
4,825
|
|
3,241
|
|
2,050
|
|
|||||||||
|
Loss (gain) associated with derivative instruments
|
140
|
|
(5,161
|
)
|
(1,536
|
)
|
—
|
|
—
|
|
|||||||||
|
Foreign currency transaction loss (gain)
|
(750
|
)
|
(201
|
)
|
4,850
|
|
39
|
|
—
|
|
|||||||||
|
Provision for (benefit from) income taxes
|
(759
|
)
|
5,755
|
|
186
|
|
30
|
|
26
|
|
|||||||||
|
Income (loss) from continuing operations
|
24,172
|
|
17,693
|
|
(7,678
|
)
|
(1,841
|
)
|
1,055
|
|
|||||||||
|
Discontinued operations:
|
|||||||||||||||||||
|
Income from discontinued operations
|
—
|
|
—
|
|
—
|
|
948
|
|
65,204
|
|
|||||||||
|
Gain on sale from discontinued operations
|
—
|
|
—
|
|
—
|
|
7,295
|
|
394,318
|
|
|||||||||
|
Net income (loss)
|
$
|
24,172
|
|
$
|
17,693
|
|
$
|
(7,678
|
)
|
$
|
6,402
|
|
$
|
460,577
|
|
||||
|
Less: Predecessor loss prior to the IPO (from January 1, 2014 through October 14, 2014)
|
(7,206
|
)
|
|||||||||||||||||
|
Net loss attributable to general and limited partner interests in USD Partners LP subsequent to the IPO (from October 15, 2014 through December 31, 2014)
|
$
|
(472
|
)
|
||||||||||||||||
|
Net income (loss) attributable to limited partner interest
|
$
|
23,690
|
|
$
|
17,339
|
|
$
|
(7,524
|
)
|
$
|
6,274
|
|
$
|
451,366
|
|
||||
|
Net income (loss) per common unit (basic and diluted)
(4)
|
$
|
1.06
|
|
$
|
0.83
|
|
$
|
(0.29
|
)
|
$
|
0.54
|
|
$
|
39.06
|
|
||||
|
Net income (loss) per subordinated unit (basic and diluted)
(4)
|
$
|
1.02
|
|
$
|
0.82
|
|
$
|
(0.63
|
)
|
$
|
0.54
|
|
$
|
39.06
|
|
||||
|
Distributions declared per limited partner interest
|
$
|
1.275
|
|
$
|
1.170
|
|
$
|
0.240
|
|
||||||||||
|
Cash Flow Data
(1)(2)
|
|||||||||||||||||||
|
Net cash provided by (used in) operating activities
|
$
|
53,076
|
|
$
|
36,204
|
|
$
|
(3,085
|
)
|
$
|
9,239
|
|
$
|
1,798
|
|
||||
|
Net cash used in investing activities
|
(93
|
)
|
(213,283
|
)
|
(34,204
|
)
|
(56,114
|
)
|
(773
|
)
|
|||||||||
|
Net cash provided by (used in) financing activities
|
(51,298
|
)
|
147,957
|
|
45,705
|
|
44,885
|
|
(25,227
|
)
|
|||||||||
|
Net cash provided by discontinued operations
|
—
|
|
—
|
|
24,241
|
|
5,168
|
|
25,687
|
|
|||||||||
|
Balance Sheet Data (at period end)
(1)(2)
|
|||||||||||||||||||
|
Property and equipment, net
|
$
|
125,702
|
|
$
|
133,010
|
|
$
|
84,059
|
|
$
|
61,364
|
|
$
|
7,881
|
|
||||
|
Total assets
|
305,967
|
|
328,398
|
|
148,280
|
|
107,268
|
|
58,934
|
|
|||||||||
|
Long-term debt, net
|
220,894
|
|
239,444
|
|
78,458
|
|
30,000
|
|
30,000
|
|
|||||||||
|
Total liabilities
|
259,149
|
|
278,638
|
|
110,085
|
|
104,665
|
|
45,548
|
|
|||||||||
|
Partners' Capital
|
|||||||||||||||||||
|
Predecessor equity
|
—
|
|
—
|
|
—
|
|
4,003
|
|
13,391
|
|
|||||||||
|
Common units
|
122,802
|
|
141,374
|
|
127,865
|
|
—
|
|
—
|
|
|||||||||
|
Class A units
|
1,811
|
|
1,749
|
|
550
|
|
—
|
|
—
|
|
|||||||||
|
Subordinated units
|
(76,749
|
)
|
(93,445
|
)
|
(90,214
|
)
|
—
|
|
—
|
|
|||||||||
|
General Partner
|
111
|
|
220
|
|
12
|
|
—
|
|
—
|
|
|||||||||
|
Accumulated other comprehensive loss
|
(1,157
|
)
|
(138
|
)
|
(18)
|
|
(1,400)
|
|
(5)
|
|
|||||||||
|
Total Partners' Capital
|
$
|
46,818
|
|
$
|
49,760
|
|
$
|
38,195
|
|
$
|
2,603
|
|
$
|
13,386
|
|
||||
|
Operating Information
|
|||||||||||||||||||
|
Average daily terminal throughput (bpd)
(5)
|
31,727
|
|
27,430
|
|
39,125
|
|
15,533
|
|
15,871
|
|
|||||||||
|
Non-GAAP Measures
(1)(6)
|
|||||||||||||||||||
|
Adjusted EBITDA
|
$
|
63,690
|
|
$
|
42,752
|
|
$
|
15,266
|
|
$
|
1,971
|
|
$
|
3,621
|
|
||||
|
Distributable cash flow
|
$
|
53,885
|
|
$
|
35,062
|
|
$
|
11,577
|
|
$
|
116
|
|
$
|
1,020
|
|
||||
51
|
(1)
|
Our selected financial data reflects our recapitalization, receipt and use of approximately
$145 million
of net proceeds we received in connection with our October 15, 2014 initial public offering of
9,120,000
common units and the issuance of
1,093,545
common units and
10,463,545
subordinated units to USDG and
427,083
general partner units to USD Partners GP LLC, as well as
250,000
Class A units to certain members of management. Additionally, we borrowed $100 million on the Term Loan Facility component of our senior secured credit agreement, which we distributed to USDG.
|
|
(2)
|
Our income statement, cash flow and balance sheet data reflect the following acquisition and dispositions:
|
|
Month of Acquisition/Disposition
|
Description of Acquisition/Disposition
|
|
|
November 2015
|
Acquisition of Casper Crude to Rail, LLC and subsidiary located in Casper, Wyoming.
|
|
|
December 2012
|
Disposition by our Predecessor of multiple crude oil rail terminal facilities located in California, Colorado, Louisiana, North Dakota and Texas.
|
|
|
(3)
|
Operating costs for the fourth quarter of 2016, include a non-cash impairment loss of approximately
$3.5 million
, to write down the noncurrent assets of the San Antonio rail terminal to fair market value.
|
|
(4)
|
Net income per unit for periods prior to October 15, 2014, are computed on a retrospective basis assuming the minimum quarterly distribution amount of
$0.2875
per unit, or
$1.15
per unit on an annualized basis, was distributed on the units issued to our general partner and USDG as if they were outstanding the entire period.
|
|
(5)
|
Includes the average daily throughput of the Casper terminal from our acquisition in November 2015 and the Hardisty terminal, which was placed into service in late June 2014.
|
|
(6)
|
A reconciliation of our non-GAAP financial measures is included in Part II,
Item 7. Management's Discussion and Analysis of Financial Condition and Results of Operations — How We Evaluate Our Operations — Adjusted EBITDA and Distributable Cash Flow
of this Report.
|
52
The following discussion and analysis of our financial condition and results of operations is based on and should be read in conjunction with our consolidated financial statements and the accompanying notes included in
Item 8. Financial Statements and Supplementary Data of this Annual Report on Form 10-K
. Unless the context otherwise requires, references in this discussion to USD Partners, USDP, the Partnership, we, our, us or like terms used in the present tense or prospectively (periods beginning on or after October 15, 2014) refer to USD Partners LP and its subsidiaries. References to the Predecessor, we, our, us, or like terms, when used in a historical context (periods prior to October 15, 2014), refer to the following subsidiaries, collectively, that were contributed to USD Partners in connection with our initial public offering of 9,120,000 common units completed on October 15, 2014: San Antonio Rail Terminal LLC, USD Logistics Operations GP LLC, USD Logistics Operations LP, USD Rail LP, USD Rail Canada ULC, USD Rail International S.A.R.L., USD Terminals Canada ULC, USD Terminals International S.A.R.L. and West Colton Rail Terminal LLC, collectively, the “Contributed Subsidiaries." The Predecessor also includes the membership interests in the following five subsidiaries of US Development Group LLC, or USD, which operated crude oil rail terminals that were sold in December 2012: Bakersfield Crude Terminal LLC, Eagle Ford Crude Terminal LLC, Niobrara Crude Terminal LLC, St. James Rail Terminal LLC, and Van Hook Crude Terminal LLC, collectively known as the “Discontinued Operations.” This discussion contains forward-looking statements that involve risks and uncertainties. Our actual results could differ materially from those discussed below. Factors that could cause or contribute to such differences include, but are not limited to, those identified below and those discussed in
Part I, Item 1A. “Risk Factors”
included elsewhere in this report.
Overview and Recent Developments
We are a fee-based, growth-oriented master limited partnership formed by USD to acquire, develop and operate energy-related logistics assets, including rail terminals and other high-quality and complementary midstream infrastructure. Our principal assets consist of: (i) a crude oil origination terminal in Hardisty, Alberta, Canada, with capacity to load up to two 120-railcar unit trains per day, (ii) a crude oil terminal in Casper, Wyoming, with unit train-capable railcar loading capacity in excess of 100,000 barrels per day, or Bpd, and six customer-dedicated storage tanks with 900,000 barrels, or Bbls, of total capacity and (iii) two unit train-capable ethanol destination terminals in San Antonio, Texas, and West Colton, California. Our terminals provide critical infrastructure allowing our customers to transport energy-related products from multiple supply regions to numerous demand markets that are dependent on these products. In addition, we provide our customers with railcars and fleet services related to the transportation of liquid hydrocarbons and biofuels by rail under multi-year, take-or-pay contracts. As of
December 31, 2016
, our railcar fleet consisted of
2,953
railcars, which we leased from various railcar manufacturers and financial entities, including
2,108
coiled and insulated, or C&I, railcars.
We generate substantially all of our operating cash flow from multi-year, take-or-pay contracts for crude oil terminalling services, such as railcar loading for transportation to end markets, storage and blending in on-site tanks, as well as related logistics services. We do not take ownership of the products that we handle nor do we receive any payments from our customers based on the value of such products. We believe rail will continue as an important transportation option for energy producers, refiners and marketers due to its unique advantages relative to other transportation means. Specifically, rail transportation of energy-related products provides flexible access to key demand centers on a relatively low fixed-cost basis with faster physical delivery, while preserving the specific quality of customer products over long distances.
Market Update
Substantially all of our operating cash flows are generated from take-or-pay contracts and, as a result, are not directly related to actual throughput volumes at our terminals. The volume of crude oil loaded at our Hardisty and Casper terminals is primarily influenced by the difference in price between Western Canadian Select, or WCS, and other grades of crude oil processed by refiners, commonly referred to as spreads, rather than absolute price levels. Spreads are influenced by, among other things, the availability of crude oil supplies relative to the level of demand from end users, such as refiners.
53
In mid-2016, wildfires in Alberta significantly interrupted production from nearby oil sands facilities. This meaningfully reduced crude oil supplies available to the market and effectively offset expected production growth for the year. As a result, WCS spreads remained narrow throughout 2016 as existing pipeline capacity largely met takeaway needs.
Western Canadian crude oil production is projected to increase throughout the next decade, driven primarily by developments in Alberta’s oil sands region. In June 2016, the Canadian Association of Petroleum Producers projected that the supply of crude oil from Western Canada will grow by approximately 590,000 Bpd by 2020 and 890,000 Bpd by 2025 relative to 2015. Since then, several companies have announced plans to increase production capacity at their oil sands facilities, in part due to cost savings and optimization achieved during the recent commodity price downturn.
For example, Canadian Natural Resources recently announced plans to reinstate the development of the 40,000 Bpd Kirby North project and the evaluation of an opportunity to debottleneck the Horizon fractionation tower during upcoming turnaround work in order to increase production by 5,000 to 15,000 Bpd. Cenovus announced plans to resume construction on its 50,000 Bpd Christina Lake Phase G project and is advancing engineering work on two previously deferred expansion projects that total 75,000 Bpd of expected design capacity. MEG Energy announced an initiative at its Christina Lake Phase 2B project that is expected to increase production by approximately 20,000 Bpd. Consistent with these trends, our partner, Gibson Energy, recently commissioned ahead of schedule 2.9 million barrels of incremental storage capacity at the Hardisty hub, representing a nearly 50% increase. Gibson successfully secured short term contracts to utilize the tanks, as necessary, until the long-term take-or-pay contracts commence later in 2017.
Certain end users, including refineries across North America, have made substantial investments in recent years in order to efficiently process heavy grades of crude oil, such as those from Western Canada. Even with recent regulatory approvals, additions to pipeline takeaway capacity are not expected to keep pace with production growth over the next several years. As a result, multiple industry forecasts project demand for rail takeaway solutions will increase in 2017 and 2018. Our Hardisty and Casper terminals, with established capacity and scalable designs, are well-positioned as strategic locations to meet expected future takeaway needs.
With additional volumes of crude oil handled at our Hardisty and Casper terminals, we expect to incur additional operating costs, including subcontracted rail services and pipeline fees.
Our sponsor retained the right to develop certain expansions of our Hardisty terminal, which they are actively pursuing. These expansions may include solutions to transport heavier grades of crude oil produced in Western Canada, which our sponsor believes will maximize benefits to producers, refiners and railroads. Our sponsor is also currently in discussions with potential customers related to its proposed development of a marine terminal joint venture on the Houston Ship Channel. We anticipate that any solutions developed by our sponsor would be subject to the right of first offer in our favor contained in the omnibus agreement between us and USD.
How We Generate Revenue
We conduct our business through two distinct reporting segments: Terminalling services and Fleet services. We have established these reporting segments as strategic business units to facilitate the achievement of our long-term objectives, to assist in resource allocation decisions and to assess operational performance.
Terminalling Services
We generate substantially all of our operating cash flow by charging fixed fees for handling energy-related products and providing related services. We do not take ownership of the underlying products that we handle nor do we receive any payments from our customers based on the value of such products. Thus, we have no direct exposure to risks associated with fluctuating commodity prices, although these risks could indirectly influence our activities and results of operations over the long term.
Hardisty Terminal Services Agreements
. We have entered into terminal services agreements with seven high-quality, primarily investment grade counterparties or their subsidiaries: Cenovus Energy, Gibson, J. Aron & Company, Phillips 66, Suncor Energy, Total and USD Marketing LLC. Substantially all of the terminalling capacity at our Hardisty
54
terminal is contracted under multi-year, take-or-pay terminal services agreements subject to inflation-based escalators with a volume-weighted average remaining contract life of approximately 2.53 years as of December 31, 2016. Furthermore, approximately 83% of the contracted capacity at our Hardisty terminal is contracted with subsidiaries of five investment grade companies. All of our counterparties are obligated to pay a minimum monthly commitment fee and can load a maximum allotted number of unit trains or barrels per month. If a customer loads fewer unit trains or barrels than its maximum allotted amount in any given month, that customer will receive a credit for up to six months. This credit may be used to offset fees on throughput volumes in excess of the customer's minimum monthly commitments in future periods to the extent capacity is available for the excess volume. We will receive a per-barrel fee on any volumes handled in excess of the customers' maximum allowed volume, to the extent the additional volume is not subject to the credit discussed above. If a force majeure event occurs, a customer’s obligation to pay us may be suspended, in which case the length of the contract term will be extended by the same duration as the force majeure event.
Casper Terminal Services Agreements
. Our Casper terminal is supported by take-or-pay terminal services agreements with high quality, primarily investment grade refiners. The initial term of the agreements varies from three to five years, with extension or renewal options for one to three additional years, and a volume-weighted average remaining contract life of 1.96 years as of December 31, 2016. Under these terminal services agreements, our customers are obligated to pay the greater of a minimum monthly commitment fee or a throughput fee based on the actual volume of crude oil loaded. If a customer loads fewer unit trains or barrels than its maximum allotted amount in any given month, that customer will receive a credit which may be used to offset future throughput fees in excess of the minimum monthly commitment fees, to the extent capacity is available for the excess volume. Unused credits generally expire if not used by the end of each calendar quarter.
Ethanol Terminal Services Agreements.
We have terminal services agreements with subsidiaries of an investment grade company for our San Antonio and West Colton terminals pursuant to which we are paid fixed fees per gallon of ethanol transloaded at each terminal. In August 2016, we received notification from the customer of our San Antonio terminal of their intent to terminate their terminalling services agreement with us, effective February 2017, which date was extended in January 2017 to May 1, 2017. In early February 2017, the lessor of the real property upon which the San Antonio terminal resides indicated their intent to terminate our lease with them concurrently with the conclusion of the extension agreement for terminalling services we have with our customer, at which time we expect to wind down the operations of this terminal. The agreement entitles the customer to 100% of the terminal’s capacity, subject to our right to seek additional customers if minimum volume usage thresholds are not met. We expect to wind down the operations of our San Antonio terminal following the May 1, 2017, termination date as discussed in more detail below under
General Trends and Outlook — San Antonio Terminal
and in
Note 7. Property and Equipment
to our consolidated financial statements included in
Item 8. Financial Statements and Supplementary Data
of this Annual Report. The West Colton terminal services agreement has been in place since July 2009 and is terminable at any time by either party upon 150 days' notice. We are seeking permits to construct an approximately one-mile pipeline directly from our West Colton terminal to Kinder Morgan Inc.'s gasoline blending terminals, which, if approved and constructed, may result in long-term volume commitments and cash flows.
Fleet Services
We provide our customers with railcars and fleet services related to the transportation of liquid hydrocarbons and biofuels by rail on a multi-year, take-or-pay basis under master fleet services agreements for periods ranging from five to nine years. We do not own any railcars. As of
December 31, 2016
, our railcar fleet consisted of
2,953
railcars, which we leased from various railcar manufacturers and financial entities, including
2,108
C&I railcars. We have assigned certain payment and performance obligations under the leases and master fleet service agreements for
2,613
of the railcars to other parties, but we have retained certain rights and obligations with respect to the servicing of these railcars. Approximately
84%
of our current railcar fleet is dedicated to customers of our Hardisty terminal. The remaining
16%
of our railcar fleet is dedicated to a customer of terminals belonging to subsidiaries previously sold by our predecessor. The master fleet services agreements we have with certain of our Hardisty terminal customers have a weighted-average remaining contract life of
4.6
years as of December 31, 2016. In the aggregate, our master fleet services agreements have a weighted-average remaining contract life of
4.1
years as of December 31, 2016.
55
Under the master fleet services agreements, we provide customers with railcar-specific fleet services, which may include, among other things, the provision of relevant administrative and billing services, the maintenance of railcars in accordance with standard industry practice and applicable laws, the management and tracking of the movement of railcars, the regulatory and administrative reporting and compliance as required in connection with the movement of railcars, and the negotiation for and sourcing of railcars. Our customers typically pay us and our assignees monthly fees per railcar for these services, which include a component for railcar use and a component for fleet services.
Historically, we contracted with railroads on behalf of some of our customers to arrange for the movement of railcars from our terminals to the destinations selected by our customers. We were the contracting party with the railroads for those shipments and were responsible to the railroads for the related fees charged by the railroads, for which we were reimbursed by our customers. Both the fees charged by the railroads to us and the reimbursement of these fees by our customers are included in our consolidated statements of operations in the revenues and operating costs line items entitled “Freight and other reimbursables.”
How We Evaluate Our Operations
Our management uses a variety of financial and operating metrics to evaluate our operations. We consider these metrics to be significant factors in assessing our ability to generate cash and pay distributions and include: (i) Adjusted EBITDA and DCF; (ii) operating and maintenance expenses; and (iii) volumes. We define Adjusted EBITDA and DCF below.
Adjusted EBITDA and Distributable Cash Flow
We define Adjusted EBITDA as "Net cash provided by operating activities" adjusted for changes in working capital items, changes in restricted cash, interest, income taxes, foreign currency transaction gains and losses, adjustments related to deferred revenue associated with minimum monthly commitment fees and other items which do not affect the underlying cash flows produced by our businesses. Adjusted EBITDA is a non-GAAP, supplemental financial measure used by management and external users of our financial statements, such as investors and commercial banks, to assess:
|
•
|
our liquidity and the ability of our business to produce sufficient cash flow to make distributions to our unitholders; and
|
|
•
|
our ability to incur and service debt and fund capital expenditures.
|
We define Distributable Cash Flow, or DCF, as Adjusted EBITDA less net cash paid for interest, income taxes and maintenance capital expenditures. DCF does not reflect changes in working capital balances. DCF is a non-GAAP, supplemental financial measure used by management and by external users of our financial statements, such as investors and commercial banks, to assess:
|
•
|
the amount of cash available for making distributions to our unitholders;
|
|
•
|
the excess cash flow being retained for use in enhancing our existing business; and
|
|
•
|
the sustainability of our current distribution rate per unit.
|
We believe that the presentation of Adjusted EBITDA and DCF in this report provides information that enhances an investor's understanding of our ability to generate cash for payment of distributions and other purposes. The GAAP measure most directly comparable to Adjusted EBITDA and DCF is "Net cash provided by operating activities". Adjusted EBITDA and DCF should not be considered an alternative to "Net cash provided by operating activities" or any other measure of liquidity presented in accordance with GAAP. Adjusted EBITDA and DCF exclude some, but not all, items that affect cash from operations and these measures may vary among other companies. As a result, Adjusted EBITDA and DCF may not be comparable to similarly titled measures of other companies.
56
The following table sets forth a reconciliation of Adjusted EBITDA and DCF to the most directly comparable financial measure calculated and presented in accordance with GAAP:
|
Year Ended December 31,
|
|||||||||||
|
2016
|
2015
|
2014
|
|||||||||
|
(in thousands)
|
|||||||||||
|
Reconciliation of Net cash provided by operating activities to Adjusted EBITDA and Distributable cash flow:
|
|||||||||||
|
Net cash provided by (used in) operating activities
|
$
|
53,076
|
|
$
|
36,204
|
|
$
|
(3,085
|
)
|
||
|
Add (deduct):
|
|||||||||||
|
Bad debt expense
|
—
|
|
—
|
|
(1,424
|
)
|
|||||
|
Amortization of deferred financing costs
|
(861
|
)
|
(659
|
)
|
(1,056
|
)
|
|||||
|
Deferred income taxes
|
(46
|
)
|
(814
|
)
|
—
|
|
|||||
|
Changes in accounts receivable and other assets
|
(1,859
|
)
|
730
|
|
8,511
|
|
|||||
|
Changes in accounts payable and accrued expenses
|
1,917
|
|
880
|
|
2,372
|
|
|||||
|
Changes in deferred revenue and other liabilities
|
996
|
|
(10,085
|
)
|
(17,497
|
)
|
|||||
|
Change in restricted cash
|
654
|
|
(870
|
)
|
6,490
|
|
|||||
|
Interest expense, net
|
9,837
|
|
4,368
|
|
4,825
|
|
|||||
|
Provision for (benefit from) income taxes
|
(759
|
)
|
5,755
|
|
186
|
|
|||||
|
Foreign currency transaction loss (gain)
(1)
|
(750
|
)
|
(201
|
)
|
4,850
|
|
|||||
|
Unrecovered reimbursable freight costs
(2)
|
—
|
|
—
|
|
1,616
|
|
|||||
|
Deferred revenue associated with minimum monthly commitment fees
(3)
|
1,485
|
|
7,444
|
|
9,478
|
|
|||||
|
Adjusted EBITDA
|
63,690
|
|
42,752
|
|
15,266
|
|
|||||
|
Add (deduct):
|
|||||||||||
|
Cash paid for income taxes
(4)
|
(845
|
)
|
(3,995
|
)
|
(101
|
)
|
|||||
|
Cash paid for interest
|
(8,722
|
)
|
(3,695
|
)
|
(3,588
|
)
|
|||||
|
Maintenance capital expenditures
|
(238
|
)
|
—
|
|
—
|
|
|||||
|
Distributable cash flow
|
$
|
53,885
|
|
$
|
35,062
|
|
$
|
11,577
|
|
||
|
(1)
|
Represents foreign exchange transaction amounts associated with activities between our U.S. and Canadian subsidiaries.
|
|
(2)
|
Represents costs incurred associated with unrecovered reimbursable freight costs related to the initial delivery of railcars in support of the Hardisty terminal.
|
|
(3)
|
Represents deferred revenue associated with minimum monthly commitment fees in excess of throughput utilized, which fees are not refundable to our customers. Amounts presented are net of: (a) the corresponding prepaid Gibson pipeline fee that will be recognized as expense concurrently with the recognition of revenue; (b) revenue recognized in the current period that was previously deferred; and (c) expense recognized for previously prepaid Gibson pipeline fees, which correspond with the revenue recognized that was previously deferred. Refer to the discussion in
Note 10. Deferred Revenue
of our consolidated financial statements included in Part II, Item 8. Financial Statements and Supplementary Data of this Annual Report.
|
|
(4)
|
Includes amounts we received as a partial refund of approximately $3.7 million (representing C$4.9 million) for our 2015 foreign income taxes.
|
Operating and Maintenance Expenses
Our management seeks to maximize the profitability of our operations by effectively managing operating and maintenance expenses. Given that both our Hardisty and Casper terminals were constructed in 2014, we do not expect to incur significant maintenance expenditures in the near term to maintain the operating capacity of these facilities. We record routine maintenance expenses associated with operating our assets in "Operating and maintenance" costs in our consolidated statements of operations. Our operating and maintenance expenses are comprised primarily of pipeline fees, repairs and maintenance expenses, materials and supplies, subcontracted rail expenses, utility costs, insurance premiums and rent for facilities and equipment. In addition, our operating expenses include the cost of leasing railcars from third-party railcar suppliers and the shipping fees charged by railroads, which costs are generally passed through to our customers. Although our assets are relatively new, we expect to incur costs to maintain these assets in compliance with sound business practices, our contractual relationships and to comply with regulatory requirements for operating
57
these assets. We expect our expenses to remain relatively stable, but they may fluctuate from period to period depending on the mix of activities performed during a period and the timing of these expenditures.
Volumes
The amount of Terminalling services revenue we generate depends on minimum customer commitment fees and the volume of crude oil that we handle at our terminals in excess of those minimum commitments, as well as the volume of biofuels transloaded at our ethanol terminals. These volumes are primarily affected by the supply of and demand for crude oil, refined products and biofuels in the markets served directly or indirectly by our assets. Additionally, these volumes are affected by the spreads between the benchmark prices for these products, which are influenced by, among other things, the available takeaway capacity in those markets. Although customers at our Hardisty and Casper terminals have committed to minimum monthly fees under their terminal services agreements with us, which will generate the majority of our Terminalling services revenue, our results of operations will also be affected by:
|
•
|
our customers’ utilization of our terminals in excess of their minimum monthly volume commitments;
|
|
•
|
our ability to identify and execute accretive acquisitions and commercialize organic expansion projects to capture incremental volumes; and
|
|
•
|
our ability to renew contracts with existing customers, enter into contracts with new customers, increase customer commitments and throughput volumes at our terminals, and provide additional ancillary services at those terminals.
|
General Trends and Outlook
San Antonio Terminal
In August 2016, we received notification from the customer of our San Antonio terminal stating their intent to terminate their terminalling services agreement with us in early February 2017, which was extended in January 2017 to early May 2017. In early February 2017, the lessor of the real property upon which the San Antonio terminal resides indicated their intent to terminate our lease with them concurrently with the conclusion of the extension agreement for terminalling services we have with our customer, at which time we expect to wind down the operations of this terminal. As a result we have recognized a non-cash impairment loss of approximately
$3.5 million
for the year ended
December 31, 2016
, including an asset retirement obligation of
$1.0 million
for amounts we expect to spend to restore the property to its original condition.
During the year ended December 31, 2016, our San Antonio terminal contributed less than 3% of our Adjusted EBITDA. Except as indicated above, we do not expect the termination of this agreement to have a material impact on our cash flows, financial position, or results of operations.
Income Taxes
We completed a study we commissioned in 2015 to evaluate the appropriate return attributable to the activities of our foreign subsidiaries, based upon the performance of risk management and other functions we provide. Based upon the results of this study, we adopted a methodology for determining the return attributable to our Canadian subsidiaries and concluded the return initially attributed to the activities of our foreign subsidiaries exceeded the amounts considered to be reasonable based on the functions we provide on behalf of these subsidiaries. As a result, we determined that we had over-estimated our foreign income tax liability for 2015 by approximately
$4.4 million
, a majority of which was refunded to us prior to December 31, 2016. We received an additional refund of approximately $0.6 million (representing C$0.9 million) in February 2017 and do not expect any additional income tax refunds with respect to our 2015 Canadian income taxes.
We estimate our
2017
income tax provision to approximate
C$5.7 million
, based upon the current operations of our foreign subsidiaries. These estimates are subject to changes in the underlying operating activities and results of these foreign subsidiaries, as well as fluctuations in the exchange rate between the U.S. dollar and the Canadian dollar, among other factors.
58
Factors That May Impact Future Results of Operations
Demand for Rail Transportation of Crude Oil and Biofuels
High-growth crude oil production areas in North America are often located at significant distances from refining centers, creating constantly evolving regional imbalances, which require the expedited development of flexible and sustainable transportation solutions. The extensive existing rail network, combined with rail transportation’s relatively low capital and fixed costs compared to other transportation alternatives, has strategically positioned rail as a long-term transportation solution to growing and evolving energy infrastructure needs. In the event that additional pipeline capacity is constructed, or crude oil production decreases significantly, demand for transportation of crude oil by rail may be impacted.
Changes in environmental and gasoline blending regulations may affect the use of ethanol in the market for transportation fuel. Due to corrosion concerns unique to biofuels, such as ethanol, the long-haul transportation of biofuels via multi-product pipelines is less efficient and less economical than rail. Rail also helps aggregate fragmented ethanol production across the country. In the event that dedicated pipelines are constructed, or additional technologies are developed to allow for more economical transportation of biofuels on multi-product pipelines, demand for transportation of biofuels by rail may be impacted.
Supply and Demand for Crude Oil and Refined Products
The volume of crude oil and biofuels that we handle at our terminals and the number of railcars we provide and perform railcar-specific fleet services for ultimately depends on refining and blending margins. Refining and blending margins are dependent mostly upon the price of crude oil or other refinery feedstocks and the price of refined products. These prices are affected by numerous factors beyond our control, including the global supply and demand for crude oil and gasoline and other refined products. The supply of crude oil will depend on numerous factors, including commodity pricing, improvements in extractive technology, environmental regulation and other factors. We believe that our Adjusted EBITDA and DCF will not be impacted in the near term to the extent of our multi-year, take-or-pay terminal services agreements. However, our ability to grow through expansion or acquisitions and our ability to renew or extend our terminal services agreements could be impacted by a long-term reduction in supply or demand.
Customer Contract Expirations and Renewals
Our business is subject to the risk that we will not be able to renew, extend or replace our customer contracts as their terms expire. Each of the seven terminalling services agreements with our Hardisty terminal customers has an initial contract term of five years and expires in 2019. The initial term of six of these agreements commenced between June 30, 2014 and August 1, 2014, and the initial term of a seventh agreement commenced on October 1, 2014. The three terminalling services agreements with our Casper terminal customers have initial contract terms expiring in 2017, 2018 and 2019, respectively. Our sole customer contract for our San Antonio terminal has a term expiring in May 2017, and we anticipate that this customer will not renew or extend this contract further as it moves its business to a new wholly-owned terminal it is constructing. Our sole customer contract for our West Colton terminal is with the same customer at our San Antonio terminal and is terminable at any time by either party upon 150 days' notice.
One of the customers at our Casper terminal, whose terminalling services agreement with us represented approximately $12 million of our Adjusted EBITDA for the year ended December 31, 2016, has a remaining term expiring in the third quarter of 2017, if not otherwise renewed or extended. This customer did not exercise its option to extend the agreement for an additional three-year term. We remain in active discussions with this customer, as well as other existing and potential new customers, for the provision of terminalling services by our Casper Terminal. We also are in active discussions with respect to the provision of terminalling services at our Hardisty terminal for periods following the terms of our existing agreements. Projected growth in Western Canada crude oil production, including recently announced additions to oil sands production capacity, represents a meaningful opportunity to meet upcoming takeaway needs with our strategically-positioned and scalable assets, particularly given current industry headwinds for new infrastructure projects. For a discussion of the risks associated with our ability to renew, extend or replace customer contracts, see
Risk Factors — Our contracts subject us to renewal risks
.
59
Deferred Revenues Generated from Our Hardisty Operations
Under the terminal services agreements we have entered into with customers of our Hardisty terminal, our customers are obligated to pay the greater of a minimum monthly commitment fee or a throughput fee based on the actual volume of crude oil loaded at our Hardisty terminal. If a customer loads fewer unit trains or barrels than its maximum allotted amount in any given month, that customer will receive a credit for up to six months to offset fees on throughput in excess of their minimum monthly commitments in future periods, to the extent capacity is available for the excess volume. We record the portion of customer payments in excess of amounts paid for volumes actually shipped as deferred revenues on our consolidated balance sheet. Lower throughput volumes do not affect our Adjusted EBITDA, DCF, or our ability to pay our minimum quarterly distribution, since such deferred revenues do not affect our cash flow. We typically recognize as revenue any amounts we have deferred within six months when these “make-up rights” are either used or expire. The utilization or expiration of make-up rights will not affect our cash flows since the fees associated with such volumes were previously collected. Additional discussion regarding make-up rights and deferred revenues is included in
Note 10. Deferred Revenues
to our consolidated financial statements in Item 8.
Financial Statements and Supplementary Data
of this Annual Report.
Regulatory Environment
Our operations are subject to federal, state, and local laws and regulations relating to the protection of health and the environment, including laws and regulations that govern the handling of liquid hydrocarbons and biofuels. Additionally, we are subject to regulations governing railcar design and evolving regulations pertaining to the shipment of liquid hydrocarbons and biofuels by rail. Please read
Item 1. Business—Impact of Regulation
.
Similar to other industry participants, compliance with existing and any additional environmental laws and regulations could increase our overall cost of business, including our capital costs to construct, maintain, operate and upgrade equipment and facilities, or the costs of our customers, which may reduce the attractiveness of rail transportation. Our master fleet services agreements generally obligate our customers to pay for modifications and other required repairs to our leased and managed railcar fleet. However, we cannot assure that we will be able to successfully pass all such regulatory costs on to our customers. While changes in these laws and regulations could indirectly affect Adjusted EBITDA and DCF, we believe that consumers of our services place additional value on utilizing established and reputable third-party providers to satisfy their rail terminalling and logistics needs, which may allow us to increase market share relative to customer-owned operations or smaller operators that lack an established track record of safety and regulatory compliance.
Acquisition Opportunities
We plan to continue pursuing strategic acquisitions that will provide attractive returns to our unitholders, including energy-related logistics assets related to the storage and transportation of liquid hydrocarbons and biofuels, from both USD and third parties. We intend to leverage our industry relationships and market knowledge to successfully execute on such opportunities, which we may pursue independently or jointly with USD. We have entered into an omnibus agreement with USD and USD Group LLC, pursuant to which USD Group LLC has granted us a right of first offer on any midstream infrastructure assets that they may develop, construct, or acquire for a period of seven years after the October 15, 2014, closing of our IPO. Additional information regarding our growth opportunities is discussed in
Item 1. Business
—Future Growth Opportunities
and information regarding the omnibus agreement is presented in
Note 13. Transactions with Related Parties
—Omnibus Agreement
of Item 8. Financial Statement and Supplementary Data
.
We cannot assure you that USD will be able to develop or construct, or that we or USD will be able to acquire, any other midstream infrastructure projects, including any projects to expand the Hardisty terminal. Among other things, the ability of USD to further develop the Hardisty terminal, or any other project, and our ability to acquire such projects, will depend upon USD’s and our ability to raise additional equity and debt financing. We are under no obligation to make any offer, and USD and USD Group LLC are under no obligation to accept any offer we make, with respect to any asset subject to our right of first offer. Additionally, the approval of Energy Capital Partners is required for the sale of any assets by USD or its subsidiaries, including us (other than sales in the ordinary course of business), acquisitions of securities of other entities that exceed specified materiality thresholds and any material unbudgeted expenditures or deviations from our approved budget. Energy Capital Partners may make these decisions free of any duty to us and our unitholders. This approval would be required for the potential acquisition by us of any projects to expand the Hardisty terminal, as well as any other projects or assets that USD may develop or acquire in the future or any third party acquisition we may pursue independently or jointly with USD. Energy Capital Partners is under no obligation to approve any such transaction. Additional discussion of the special approval rights of Energy Capital Partners is included in
Item
60
10. Directors, Executive Officers and Corporate Governance
—Special Approval Rights of Energy Capital Partners
. If we are unable to acquire any projects to expand the Hardisty terminal from USD, which USD retained the right to develop and operate at the time of our IPO, these expansions may compete directly with our current Hardisty terminal assets for future throughput volumes, which may impact our ability to enter into new terminal services agreements, including with our existing customers, following the termination of our existing agreements or the terms thereof and our ability to compete for future spot volumes. Furthermore, cyclical changes in the demand for crude oil and other liquid hydrocarbons may cause USD or us to reevaluate any future expansion projects, including any projects to expand the Hardisty terminal. Additionally, if we do not make acquisitions on economically acceptable terms, our future growth will be limited, and the acquisitions we do make may reduce, rather than increase, our DCF.
Interest Rate Environment
The interest rates available in U.S. and international credit markets remain near historic lows, although the U.S. Federal Reserve Board has stated their intent to further increase interest rates in the U.S. over the next twelve months. As the overall economy strengthens, we expect monetary policy will tighten to counter possible inflation, resulting in higher interest rates. Should interest rates continue to rise, our financing costs will increase accordingly. This could affect our future ability to access the credit markets at rates we consider reasonable to fund our future growth. Additionally, as with other yield-oriented securities, our unit price will be affected by the level of our cash distributions and an associated implied distribution yield. Therefore, changes in interest rates, either positive or negative, may affect the yield requirements of investors who invest in our units, and, as such, a rising interest rate environment could have an adverse impact on our unit price and our ability to issue additional equity, or increase the cost of issuing equity. However, we expect that our cost of capital would remain competitive, as our competitors would face similar circumstances.
Factors Affecting the Comparability of Our Financial Results
The comparability of our current financial results in relation to prior periods are affected by the factors described below.
Our historical results of operations include revenues and expenses related to (i) the construction of our Hardisty terminal, (ii) the operation of our San Antonio and West Colton terminals, (iii) our railcar fleet services throughout North America and (iv) the operations of our Hardisty terminal, which commenced in late June 2014. Costs incurred in the Predecessor periods with respect to the Hardisty terminal are primarily related to pre-operational activities.
Casper Terminal Acquisition
Our operating results for periods after November 17, 2015, include the revenues and costs associated with our operation of the Casper terminal, which we acquired on this date.
Selling, General and Administrative Costs
Our results of operations for periods prior to our IPO included a $1.2 million management fee each year for the West Colton and San Antonio terminals. In addition, our historical selling, general and administrative costs included certain expenses allocated by our sponsor for corporate costs including insurance, professional fees, facilities, information services, human resources and other support departments, as well as direct expenses. These allocated expenses were charged or allocated to us primarily on the basis of direct usage when identifiable, with the remainder allocated evenly across the number of operating subsidiaries or allocated based on budgeted volumes or projected revenues. Our sponsor charges us a fixed annual fee for the management and operation of our assets for the provision of various centralized administrative services, as well as allocates general and administrative costs and expenses incurred by them on our behalf. In 2016, the fixed annual fee increased by approximately $0.7 million to $3.2 million, primarily as a result of hiring new employees dedicated to our services. We recently received approval from the Board of Directors to increase the fixed annual fee to $3.3 million for 2017.
We incur unit based compensation expense associated with the phantom units granted to directors, officers and employees of USDG pursuant to the USD Partners LP 2014 Long-Term Incentive Plan, or LTIP, and Class A units
61
granted to certain executive officers and other key employees of USDG. We recognize the expense associated with the outstanding phantom units and with each Class A Vesting Tranche ratably over its requisite service period.
We also incur additional general and administrative expenses annually as a result of being a publicly traded partnership, consisting of costs associated with SEC reporting requirements, tax return and Schedule K-1 preparation and distribution, independent auditor fees, investor relations activities, Sarbanes-Oxley Act compliance, stock exchange listing, registrar and transfer agent fees, incremental director and officer liability insurance and director compensation. These additional general and administrative expenses are not reflected in our historical financial statements.
Foreign Currency Exchange Rates
Prior to June 2014, our operating income was predominantly derived from our San Antonio and West Colton terminals and, as a result, we historically had minimal exposure to fluctuations in foreign currency exchange rates. Currently, we derive a significant amount of operating income from our Canadian operations, particularly our Hardisty terminal. Given our exposure to fluctuations in the exchange rate between the Canadian dollar and the U.S. dollar, our operating income and assets which are denominated in Canadian dollars will be positively affected when the Canadian dollar increases in relation to the U.S. dollar and will be negatively affected when the Canadian dollar decreases relative to the U.S. dollar, assuming all other factors are held constant. Conversely, our liabilities which are denominated in Canadian dollars will be positively affected when the Canadian dollar decreases in relation to the U.S. dollar and will be negatively affected when the Canadian dollar increases relative to the U.S. dollar. We have entered into derivative contracts to mitigate a significant portion of the potential impact that fluctuations in the value of the Canadian dollar relative to the U.S. dollar may have on cash flows generated by our Hardisty terminal operations through 2017. As a result, we do not expect foreign currency exchange rates to have a significant impact on our operating cash flows in the near term. The derivative contracts in place for our 2016 fiscal year secured a minimum exchange rate of 0.84 U.S. dollars for each Canadian dollar for the majority of our anticipated Canadian cash flows, whereas our derivative contracts for 2015 secured a minimum exchange rate of 0.91 U.S. dollars for each Canadian dollar. For our 2017 fiscal year, we have entered into forward contracts that effectively fix the amount we will receive in U.S. dollars for each Canadian dollar at an exchange rate of approximately 0.78.
Income Tax Expense
Prior to our IPO, we were included in the consolidated U.S. federal income tax return of our sponsor, in which we were treated as an entity disregarded as separate from our sponsor for U.S. federal income tax purposes. Subsequent to the closing of our IPO, we have been and continue to be treated as a partnership for U.S. federal income tax purposes, with each partner being separately taxed on their share of our taxable income. Therefore, no U.S. federal income tax expense is reflected in our financial statements for periods prior to the October 15, 2014, closing of our IPO.
Our Hardisty terminal is subject to Canadian income taxes that result from taxable income generated by our Canadian operations and withholding taxes that are applicable to certain distributions from our Canadian subsidiaries. Prior to commencing operations in late June 2014, our Hardisty terminal did not generate any taxable income, but produced net operating losses that were available to reduce future Canadian provincial and federal taxable income. We utilized net operating losses relating to our Canadian terminalling business during the second half of 2014 and for 2015, to the extent available, to offset Canadian taxable income generated during these periods. The combined Canadian federal and provincial income tax rate was 25% prior to the income tax rate increase enacted by the Canadian province of Alberta in June 2015, which retroactively increased the combined provincial/federal income tax rate by 1% for 2015 and an additional 1% beginning in 2016. As a result, we paid income taxes on our Canadian income at a combined provincial/federal income tax rate of
27%
and
26%
in 2016 and 2015, respectively. We have a Canadian loss carryforward of approximately
$4.4 million
and
$4.9 million
as of
December 31, 2016
and
2015
, respectively, the benefit of which we do not expect to realize. We will also be required to pay withholding taxes at a rate of 5% on cash distributed to us from our Canadian subsidiaries in excess of amounts they have borrowed from us.
In 2016, prior to filing our 2015 Canadian tax returns, we adopted a methodology for determining the return attributable to our Canadian subsidiaries based upon completion of a study we initially commissioned in 2015. The methodology we adopted for determining the return attributable to our Canadian subsidiaries supported by this study resulted in a reduction of our Canadian income tax liability for the 2015 tax year, as reflected in the Canadian income
62
tax returns we filed in 2016. The resulting decrease in our Canadian income tax liability was reflected in our 2016 income statement as a reduction to our 2016 provision for income taxes. We have also reduced our provision for income taxes in 2016 for the lower expected Canadian income tax liability we anticipate for 2016 as a result of the methodology we adopted for determining the return attributable to our Canadian subsidiaries.
Financing
Historically, our operations were financed with cash generated by our operations and intercompany loans from our sponsor. On October 15, 2014, in connection with the closing of our IPO, we entered into a five-year, $300.0 million senior secured credit agreement, or the Credit Agreement, comprised of a $100.0 million term loan, the Term Loan Facility (borrowed in Canadian dollars and maturing on July 14, 2019) and a $200.0 million revolving credit facility, the Revolving Credit Facility (maturing on October 15, 2019), which is automatically increased as the Term Loan Facility principal is reduced.
In November 2015, we amended our Credit Agreement to increase our total borrowing capacity from $300 million to $400 million, while all other terms and conditions of the existing Credit Agreement remained unchanged. We also reset our ability to request an additional $100 million of incremental Revolving Credit Facility commitments, subject to receiving increased commitments from lenders or other financial institutions and satisfaction of certain conditions.
As of
March 3, 2017
, we had
$214.0 million
drawn on our Revolving Credit Facility and
C$3.6 million
(representing
$2.8 million
) outstanding under our Term Loan Facility in relation to the balances presented at
December 31, 2016
, in our consolidated balance sheet. As a result of the borrowings we have made under the terms of our Credit Agreement, our interest expense in 2016 exceeded amounts incurred in 2015 and 2014.
We anticipate using the cash flows generated by our Canadian subsidiaries to repay borrowings under our Term Loan Facility and borrowing up to the U.S. dollar equivalent amount under our Revolving Credit Facility, as necessary, to fund distributions to our unitholders. Following repayment of our Term Loan Facility and absent the incurrence of additional Canadian debt, we anticipate utilizing any excess cash flows produced by our Canadian subsidiaries to repay amounts they have borrowed from our U.S. entities, including us. Any amounts distributed by our Canadian subsidiaries to us in order to partially fund distributions to our unitholders, which are in excess of amounts they have borrowed from us, would be subject to Canadian withholding taxes.
Cash Distributions
We intend to make minimum quarterly distributions of at least $0.2875 per common unit ($1.15 per unit on an annualized basis) to the extent we have sufficient cash from operations after establishment of cash reserves and payment of fees and expenses, including payments to our general partner. We intend to pay distributions no later than 60 days after the end of each quarter. We paid our most recent distribution on
February 17, 2017
, at a rate of
$0.33
per common unit (
$1.32
per unit on an annualized basis) for the quarter ending
December 31, 2016
, to unitholders of record on
February 13, 2017
.
63
RESULTS OF OPERATIONS
We conduct our business through two distinct reporting segments: Terminalling services and Fleet services. We have established these reporting segments as strategic business units to facilitate the achievement of our long-term objectives, to aid in resource allocation decisions and to assess operational performance.
The following table summarizes our operating results by business segment and corporate charges for each of the years indicated:
|
For the Year Ended December 31,
|
|||||||||||
|
2016
|
2015
|
2014
|
|||||||||
|
(in thousands)
|
|||||||||||
|
Operating income
|
|||||||||||
|
Terminalling services
|
$
|
40,531
|
|
$
|
27,510
|
|
$
|
2,944
|
|
||
|
Fleet services
|
1,813
|
|
2,427
|
|
(429
|
)
|
|||||
|
Corporate and other
|
(9,704
|
)
|
(7,483
|
)
|
(1,868
|
)
|
|||||
|
Total operating income
|
32,640
|
|
22,454
|
|
647
|
|
|||||
|
Interest expense, net
|
9,837
|
|
4,368
|
|
4,825
|
|
|||||
|
Loss (gain) associated with derivative instruments
|
140
|
|
(5,161
|
)
|
(1,536
|
)
|
|||||
|
Foreign currency transaction loss (gain)
|
(750
|
)
|
(201
|
)
|
4,850
|
|
|||||
|
Provision for (benefit from) income taxes
|
(759
|
)
|
5,755
|
|
186
|
|
|||||
|
Net income (loss)
|
$
|
24,172
|
|
$
|
17,693
|
|
$
|
(7,678
|
)
|
||
Summary Analysis of Operating Results
Year ended December 31, 2016 compared to the year ended December 31, 2015
Our operating results for the year ended
December 31, 2016
, compared with our operating results for the year ended
December 31, 2015
, were largely driven by the following:
|
•
|
a contribution of approximately
$10.2 million
derived from the Casper terminal operations we acquired in November 2015, partially offset by the additional interest expense we incurred on amounts borrowed for the acquisition;
|
|
•
|
additional terminalling services revenue resulting from inflation-indexed rate escalations associated with our terminalling services agreements;
|
|
•
|
a non-cash impairment loss of approximately
$3.5 million
we recognized in connection with winding down our San Antonio Terminal operations, including an asset retirement obligation of
$1.0 million
for amounts we expect to spend to restore the property to its original condition;
|
|
•
|
declines in our fleet services business resulting from reductions to the number of railcars in our fleet;
|
|
•
|
increased corporate costs largely associated with unit based compensation due to increases in the trading price of our common units and additional amounts we are charged pursuant to the omnibus agreement;
|
|
•
|
non-cash losses associated with the revaluation of our foreign currency derivative instruments as compared with gains in the prior year due to a more stable exchange rate between the U.S. and Canada; and
|
|
•
|
a reduction in our income taxes resulting from a methodology we adopted for determining the return attributable to the activities of our foreign subsidiaries based on the functions we provide and risks we manage on their behalf, which resulted in a reduction of our Canadian income tax liabilities for the
2015
and
2016
tax years.
|
64
Year ended December 31, 2015 compared to the year ended December 31, 2014
Our operating results for the year ended December 31, 2015, compared with our operating results for the year ended December 31, 2014, were largely driven by the following:
|
•
|
a full year of operation of our Hardisty terminal, which commenced operation in late June 2014 and contributed approximately $23.1 million to the operating income of our Terminalling services business for the year ended December 31, 2015, compared with a contribution of $2.2 million for the year ended December 31, 2014;
|
|
•
|
the Casper terminal operations, which we acquired in November 2015, contributed approximately $0.8 million to the operating income of our Terminalling services business;
|
|
•
|
an increased number of railcars in service in our Fleet services business resulting from the full year operation of the Hardisty terminal. Operating income of our Fleet services business increased approximately $2.9 million for the year ended December 31, 2015, compared with the same period of 2014;
|
|
•
|
a full year of costs related to our omnibus agreement and public partnership expenses for the year ended December 31, 2015, that we did not incur prior to our IPO in October 2014; and
|
|
•
|
the favorable impact of gains on the foreign currency derivative instrument contracts we entered into in May 2014 and June 2015, which were largely offset by the continued deterioration of the Canadian dollar relative to the U.S. dollar from December 31, 2014 to December 31, 2015, that reduced the operating results of our Canadian subsidiaries when translated into U.S. dollars.
|
A comprehensive discussion of our operating results by segment is presented below.
65
RESULTS OF OPERATIONS - BY SEGMENT
TERMINALLING SERVICES
The following table sets forth the operating results of our Terminalling services business and the approximate average daily throughput volumes of our terminals for the specified periods:
|
For the Year Ended December 31,
|
|||||||||||
|
2016
|
2015
|
2014
|
|||||||||
|
(in thousands, except bpd)
|
|||||||||||
|
Revenues
|
|||||||||||
|
Terminalling services
|
$
|
99,947
|
|
$
|
64,069
|
|
$
|
21,765
|
|
||
|
Railroad incentives
|
76
|
|
434
|
|
719
|
|
|||||
|
Freight and other reimbursables
|
13
|
|
—
|
|
—
|
|
|||||
|
Total revenues
|
100,036
|
|
64,503
|
|
22,484
|
|
|||||
|
Operating costs
|
|||||||||||
|
Subcontracted rail services
|
8,077
|
|
7,710
|
|
6,994
|
|
|||||
|
Pipeline fees
|
20,799
|
|
17,249
|
|
3,625
|
|
|||||
|
Freight and other reimbursables
|
13
|
|
—
|
|
—
|
|
|||||
|
Operating and maintenance
|
2,625
|
|
1,768
|
|
1,924
|
|
|||||
|
Selling, general and administrative
|
4,899
|
|
4,156
|
|
4,366
|
|
|||||
|
Depreciation and amortization
|
23,092
|
|
6,110
|
|
2,631
|
|
|||||
|
Total operating costs
|
59,505
|
|
36,993
|
|
19,540
|
|
|||||
|
Operating income
|
40,531
|
|
27,510
|
|
2,944
|
|
|||||
|
Interest expense, net
|
1,006
|
|
2,026
|
|
3,600
|
|
|||||
|
Loss (gain) associated with derivative instruments
|
140
|
|
(5,161
|
)
|
(1,536
|
)
|
|||||
|
Foreign currency transaction loss (gain)
|
(28
|
)
|
166
|
|
4,406
|
|
|||||
|
Provision for (benefit from) income taxes
|
(1,184
|
)
|
5,581
|
|
47
|
|
|||||
|
Net income (loss)
|
$
|
40,597
|
|
$
|
24,898
|
|
$
|
(3,573
|
)
|
||
|
Average daily terminal throughput (bpd)
|
31,727
|
|
27,430
|
|
39,125
|
|
|||||
Year ended
December 31, 2016
compared to the year ended
December 31, 2015
Terminalling Services Revenue
Revenue generated by our Terminalling services segment increased
$35.5 million
to
$100.0 million
for the year ended December 31, 2016, from
$64.5 million
for the year ended
December 31, 2015
.This increase was largely due to our acquisition of the Casper terminal in mid-November of 2015, which provided an additional
$28.1 million
of revenue to our Terminalling services business in 2016. In addition, due to inflation-indexed rate escalations associated with our terminalling services agreements for our Hardisty terminal, we recognized more revenue for 2016 than we recognized during 2015, partially offset by additional amounts we deferred. Our terminalling services revenue was also affected by the decline in the Canadian dollar relative to the U.S. dollar. Our terminalling services revenue would have been approximately
$2.3 million
greater if the average exchange rate for the Canadian dollar in relation to the U.S. dollar for the year ended
December 31, 2016
, was the same as the average exchange rate for the year ended
December 31, 2015
.
Terminalling services revenue for the year ended December 31, 2016, excludes approximately
$27.1 million
of amounts associated with minimum monthly commitment fees we received as payment from our customers that we have deferred and recorded as short-term liabilities in our consolidated balance sheet. We have deferred recognizing this revenue in connection with the minimum monthly commitment fees paid by customers of our Hardisty terminal that are in excess of their actual throughput volumes due to the make-up rights we have granted them under their terminal
66
services agreements with us. Our customers can use these make-up rights for periods of up to six months to offset throughput volumes in excess of their minimum monthly commitments in future periods, to the extent capacity is available for the excess volume. We expect to recognize the deferred amounts in revenue as our customers use these rights, upon expiration of the make-up period, or when our customers' ability to utilize those rights is determined to be remote. We recognized approximately
$24.2 million
of previously deferred revenue during the year ended
December 31, 2016
.
Railroad Incentive Payments
Historically, we have received incentive payments from railroads in connection with large capital projects that are projected to create incremental traffic on their networks. With respect to our Hardisty terminal, we have the right to receive incentive payments based on the number of railcars loaded for certain customers through mid-2017. A portion of these payments increase the pipeline fees payable to Gibson. The decline in these payments is due to a decrease in the number of railcars loaded in
2016
as compared with
2015
.
Operating Costs
The operating costs of our Terminalling services segment increased
$22.5 million
to
$59.5 million
for the year ended
December 31, 2016
, from
$37.0 million
for the year ended
December 31, 2015
, primarily as a result of our acquisition of the Casper terminal which added
$18.6 million
of incremental operating costs during
2016
. Our operating expenses would have been approximately
$1.2 million
greater if the average exchange rate for the Canadian dollar in relation to the U.S. dollar for the year ended
December 31, 2016
, was the same as the average exchange rate for the year ended
December 31, 2015
.
We continue to proactively manage our operating costs in an effort to align with the current business environment, which may result in additional cost savings over the near term. However, we do not expect these benefits to remain over the long term as market and economic conditions improve.
Subcontracted rail services
. We subcontract a majority of the services related to the operations of our terminals, which costs are primarily fixed. These subcontracted rail services costs increased
$0.4 million
to
$8.1 million
for the year ended
December 31, 2016
, from
$7.7 million
for the year ended
December 31, 2015
, primarily due to the additional costs for these services incurred at our Casper terminal, which contributed approximately
$2.8 million
more to these costs, partially offset by a decrease in costs at our Hardisty terminal, due to a decrease in the number of railcars loaded in
2016
as compared with
2015
.
Pipeline fees
. We incur pipeline fees related to a facilities connection agreement with Gibson for the delivery of crude oil from Gibson's Hardisty storage terminal to our Hardisty terminal via pipeline. The pipeline fees we pay to Gibson are based on a predetermined formula, which includes amounts collected from customers at our Hardisty terminal. We may defer recognizing portions of these costs as expense until such time as we recognize the related deferred revenue following the expiration of any make-up rights provisions. Pipeline fees increased
$3.6 million
to
$20.8 million
for the year ended
December 31, 2016
, from
$17.2 million
for the year ended
December 31, 2015
, primarily due to the increase in direct operating income we recognized at our Hardisty terminal.
Operating and maintenance.
Operating and maintenance expenses increased
$0.9 million
to
$2.6 million
for the year ended
December 31, 2016
, from the year ended
December 31, 2015
, primarily as a result of our acquisition of the Casper terminal.
Selling, general and administrative
. Selling, general and administrative expenses increased
$0.7 million
to
$4.9 million
for the year ended
December 31, 2016
, from
$4.2 million
for the year ended
December 31, 2015
, primarily due to incremental costs associated with our management and operation of the Casper terminal.
Depreciation and amortization
. Depreciation and amortization expense increased
$17.0 million
to
$23.1 million
for the year ended
December 31, 2016
, from
$6.1 million
for the year ended
December 31, 2015
, primarily due to the additional depreciation and amortization expense associated with our Casper terminal which we acquired in November 2015. In addition, we incurred a non-cash impairment loss of
$3.5 million
, in connection with the expected May 1,
67
2017 termination of our customer contract for ethanol transloading services at our San Antonio terminal, including an asset retirement obligation of
$1.0 million
for amounts we expect to spend to restore the property to its original condition
.
Other Expenses
Interest expense.
Interest expense for our Terminalling services segment decreased by
$1.0 million
to
$1.0 million
for the year ended
December 31, 2016
, from
$2.0 million
for the year ended
December 31, 2015
, primarily due to the lower average outstanding balance of our Term Loan Facility during the year ended
December 31, 2016
, as compared with the year ended
December 31, 2015
.
Loss associated with derivative instruments
. In June 2015 and April 2016, we entered into derivative contracts to mitigate our exposure to fluctuations in foreign currency exchange rates, specifically between the U.S. dollar and the Canadian dollar, related to operations at our Hardisty terminal. We record all of our derivative financial instruments at fair market value in our consolidated financial statements, which we adjust each period for changes in the fair market value, or mark to market.
From
December 31, 2015
to
December 31, 2016
, the exchange rate, representing the midpoint of the range for the bid and ask prices between the U.S. dollar and Canadian dollar, increased from 0.7210 to 0.7440 U.S. dollars for each Canadian dollar. This change in the exchange rate decreased the value of our derivative contracts at
December 31, 2016
, relative to the value at
December 31, 2015
, producing a loss of
$0.1 million
for the year ended
December 31, 2016
. By way of comparison, from December 31, 2014 to December 31, 2015, the exchange rate, between the U.S. dollar and Canadian dollar decreased from 0.8621 to 0.7210 U.S. dollars for each Canadian dollar, producing a gain of $5.2 million for the year ended December 31, 2015.
Foreign currency transaction loss (gain)
Our Terminalling services segment recognized minimal foreign currency transaction gains for the year ended
December 31, 2016
, compared with losses of
$0.2 million
for the year ended
December 31, 2015
, which are primarily the result of routine settlement of U.S. dollar denominated transactions with Canadian dollars by our Canadian subsidiaries.
Provision for (benefit from) income taxes
. A significant amount of our operating income is generated by our Hardisty terminal, located in the Canadian province of Alberta. As a Canadian business, operating income from our Hardisty terminal is subject to corporate income tax rates enacted by the Canadian federal and the Alberta provincial governments, which on a combined basis have increased from 26% in
2015
to 27% beginning January 1, 2016. As a result, we recognized income tax liabilities and expenses in our consolidated financial statements based upon these higher income tax rates.
Our benefit from income taxes for the Terminalling services segment was
$1.2 million
for the year ended
December 31, 2016
, as compared with a provision for income taxes of
$5.6 million
for the year ended
December 31, 2015
. In 2016, prior to filing our 2015 Canadian tax returns, we adopted a methodology for determining the return attributable to the activities of our foreign subsidiaries based on the functions we provide and risks we manage on their behalf, which resulted in a reduction of our Canadian income tax liabilities for the
2015
and
2016
tax years. The resulting reduction of our Canadian income tax liabilities for
2015
was reflected as a decrease to our provision for income taxes for the year ended
December 31, 2016
, resulting in a net benefit from income taxes for
2016
. We utilized net operating losses relating to our Canadian terminalling business during
2015
, to the extent available, to offset Canadian taxable income generated in
2015
. For
2016
, we have no operating loss carryforwards available to apply towards future ordinary taxable income derived from our Canadian terminalling business.
Year ended December 31, 2015 compared to the year ended December 31, 2014
Terminalling Services Revenue
Revenue generated by our Terminalling services segment increased $42.0 million to $64.5 million for the year ended December 31, 2015, from $22.5 million for the year ended December 31, 2014. This increase was primarily attributable to our Hardisty terminal being operational for the entire twelve months in the year ended December 31, 2015, whereas during the year ended December 31, 2014, the terminal operations commenced in late June 2014. Also
68
contributing to the greater revenue in 2015 is the addition of the Casper terminal in mid-November, which provided an additional $3.8 million of revenue to our Terminalling services business. Our terminalling services revenue was also affected by the decline in the Canadian dollar relative to the U.S. dollar. Our terminalling services revenue would have been approximately $8.3 million greater if the average exchange rate for the Canadian dollar in relation to the U.S. dollar for the year ended December 31, 2015, was the same as the average exchange rate for the year ended December 31, 2014.
Terminalling services revenue for the year ended December 31, 2015, excludes approximately $24.2 million of amounts associated with minimum monthly commitment fees we received as payment from our customers that we have deferred and recorded as short-term liabilities in our consolidated balance sheet. We have deferred recognizing this revenue in connection with the minimum monthly commitment fees paid by customers of our Hardisty terminal that are in excess of their actual throughput volumes due to the make-up rights we have granted them under their terminal services agreements with us. Our customers can use these make-up rights for periods of up to six months to offset throughput volumes in excess of their minimum monthly commitments in future periods, to the extent capacity is available for the excess volume. We recognized the deferred amounts in revenue as our customers use these rights, upon expiration of the make-up period, or when our customers' ability to utilize those rights is determined to be remote. We recognized approximately $14.6 million of previously deferred revenue during the year ended December 31, 2015.
Railroad Incentive Payments
Historically, we have received incentive payments from railroads in connection with large capital projects that are projected to create incremental traffic on their networks. With respect to our Hardisty terminal, we have the right to receive incentive payments based on the number of railcars loaded for certain customers through mid-2017. A portion of these payments increases the pipeline fees payable to Gibson. We recognized revenue of approximately $0.4 million and $0.7 million for railroad incentive payments during the years ended December 31, 2015 and 2014, respectively, in connection with the operation of our Hardisty terminal. The decline in these payments is partially due to a decrease in the number of railcars loaded in 2015 as compared with 2014, coupled with the decline in the average exchange rate for Canadian dollars in relation to U.S. dollars during the year ended December 31, 2015.
Operating Costs
The operating costs of our Terminalling services segment increased $17.5 million to $37.0 million for the year ended December 31, 2015, from $19.5 million for the year ended December 31, 2014. The increase is primarily attributable to our Hardisty terminal being operational for a full year during 2015, as compared with approximately six months of operation in 2014 when the terminal was placed into service. Also contributing to the increase in operating expenses in 2015 is the addition of the Casper terminal in mid-November, which added $3.0 million of operating expenses. Our operating expenses would have been approximately $4.8 million dollars greater if the average exchange rate for the Canadian dollar in relation to the U.S. dollar for the year ended December 31, 2015 was the same as the average exchange rate for the year ended December 31, 2014.
Consistent with recent industry trends, we have proactively managed our operating costs in an effort to align with the current business environment. These efforts are likely to continue to result in cost savings over the near term. However, we do not expect these benefits to remain over the long term as market conditions improve.
Subcontracted rail services
. We subcontract a majority of the services related to the operations of our terminals, which costs are primarily fixed. These Subcontracted rail services costs increased $0.7 million to $7.7 million for the year ended December 31, 2015, from $7.0 million for the year ended December 31, 2014, primarily due to our acquisition of the Casper terminal in November 2015, which contributed approximately $0.4 million to these costs and partially due to our Hardisty terminal being operational for a full year during 2015, as compared with approximately six months of operation in 2014 when the terminal was placed into service. Our subcontracted rail services costs would have been approximately $0.8 million greater if the average exchange rate for the Canadian dollar in relation to the U.S. dollar for the year ended December 31, 2015, was the same as the average exchange rate for the year ended December 31, 2014.
Pipeline fees
. We incur pipeline fees related to a facilities connection agreement with Gibson for the delivery of crude oil from Gibson's storage terminal to our Hardisty terminal via pipeline. The pipeline fees paid to Gibson are
69
based on a predetermined formula which includes amounts collected from customers at our Hardisty terminal. We may defer recognizing portions of these costs as expense until such time that we recognize the related deferred revenue following the expiration of any make up rights provisions. Pipeline fees increased $13.6 million to $17.2 million for the year ended December 31, 2015, from $3.6 million for the year ended December 31, 2014, primarily due to our Hardisty terminal being operational for a full year during 2015, as compared with approximately six months of operation in 2014 when the terminal was placed into service. Our pipeline fees would have been approximately $2.7 million greater if the average exchange rate for the Canadian dollar in relation to the U.S. dollar for the year ended December 31, 2015, was the same as the average exchange rate for the year ended December 31, 2014.
Operating and Maintenance
. Operating and maintenance expenses decreased $0.2 million to $1.8 million for the year ended December 31, 2015. Maintenance and repair costs were higher for the year ended December 31, 2015, than for the year ended December 31, 2014, primarily due to maintenance repairs at our terminals. These costs were more than offset by a decrease in expenses for operational materials and supplies attributable to the decrease in the number of railcar shipments.
Selling, general and administrative
. Selling, general and administrative expenses decreased $0.2 million to $4.2 million for the year ended December 31, 2015, from $4.4 million for the year ended December 31, 2014. Salaries and benefits, property taxes and other administrative costs were higher for the year ended December 31, 2015, than for the year ended December 31, 2014, primarily due to our acquisition of the Casper terminal in November 2015. These costs were more than offset by a $0.9 million decrease in management fees charged to the terminalling businesses in 2014 prior to our IPO that were subsequently discontinued.
Depreciation and amortization
. Depreciation and amortization expense increased $3.5 million to $6.1 million for the year ended December 31, 2015, from $2.6 million for the year ended December 31, 2014, primarily due to our acquisition of the Casper terminal in November 2015, which contributed approximately $1.8 million to depreciation and amortization expense and partially due to depreciation of our Hardisty terminal for a full year during 2015, as compared with approximately six months for 2014, the year in which the terminal was placed into service. Our depreciation and amortization expense would have been approximately $0.6 million greater if the average exchange rate for the Canadian dollar in relation to the U.S. dollar for the year ended December 31, 2015, was the same as the average exchange rate for the year ended December 31, 2014.
Other Expenses
Interest expense.
Interest expense for our Terminalling services segment decreased by $1.6 million to $2.0 million for the year ended December 31, 2015, from $3.6 million for the year ended December 31, 2014, primarily due to lower weighted average balances of outstanding debt and weighted average interest rates during the year ended December 31, 2015, as compared with the year ended December 31, 2014. Additionally, a majority of the interest expense we incurred during the year ended December 31, 2015, is associated with the outstanding balance on our Term Loan Facility, which is denominated in Canadian dollars. Our interest expense would have been approximately $0.3 million greater if the average exchange rate for the Canadian dollar in relation to the U.S. dollar for the year ended December 31, 2015, was the same as the average exchange rate for the year ended December 31, 2014. During the year ended December 31, 2014, substantially all of our interest expense was denominated in U.S. dollars and as a result, exchange rate fluctuations did not affect the reported interest expense.
Gain associated with derivative instruments
. In May 2014 and June 2015, we entered into derivative contracts to mitigate our exposure to fluctuations in foreign currency exchange rates, specifically between the U.S. dollar and the Canadian dollar, related to operations at our Hardisty terminal. We record all of our derivative financial instruments at fair market value in our consolidated financial statements, which we adjust each period for changes in the fair market value, or mark to market.
From December 31, 2014 to December 31, 2015, the exchange rate, representing the midpoint of the range between the bid and ask prices, between the U.S. dollar and Canadian dollar decreased from 0.8621 to 0.7210 U.S. dollars for each Canadian dollar. This change in the exchange rate increased the value of our derivative contracts at
70
December 31, 2015, relative to the value at December 31, 2014, producing a gain of $5.2 million for the year ended December 31, 2015.
From May 20, 2014, when we initially executed our derivative contracts to mitigate our exposure to Canadian cash flows, to December 31, 2014, the exchange rate, representing the midpoint of the range between the bid and ask prices, between the U.S. and Canadian dollars decreased from 0.9186 to 0.8621 U.S. dollars for each Canadian dollar. This change in the exchange rate increased the value of our derivative contracts at December 31, 2014, relative to the value at May 20, 2014, producing a gain of $1.5 million for the year ended December 31, 2014.
Foreign currency transaction loss
Our Terminalling services segment recognized foreign currency transaction gains of $0.2 million for the year ended December 31, 2015, primarily related to the routine settlement of intercompany transactions associated with the operations of our Hardisty terminal. Foreign currency transaction losses of $4.4 million for the year ended December 31, 2014, primarily resulted from settlement of U.S. dollar denominated bank debt in periods prior to our IPO and the recapitalization transactions completed in contemplation of our IPO, as well as routine transactions with external customers.
Provision for income taxes
. A significant amount of our operating income is generated by our Hardisty terminal, which is located in the Canadian province of Alberta. As a Canadian business, operating income from our Hardisty terminal is subject to corporate income tax rates enacted by the Canadian federal and provincial governments, which on a combined basis have increased effective July 1, 2015, from 25% to 26% of taxable income for the entirety of 2015, and which increased further to 27% beginning January 1, 2016. Our provision for income taxes for the Terminalling services segment was $5.6 million for the year ended December 31, 2015, as compared with $47 thousand for the year ended December 31, 2014, partially as a result of these recently enacted tax rate changes. The increase is primarily attributable to the current and deferred income taxes associated with our Hardisty terminal operations, which commenced operations in late June 2014 and did not generate taxable income for the year ended December 31, 2014.
FLEET SERVICES
The following table sets forth the operating results of our Fleet services business for each of the years ended
December 31, 2016
,
2015
and
2014
.
|
For the Year Ended December 31,
|
|||||||||||
|
2016
|
2015
|
2014
|
|||||||||
|
(in thousands)
|
|||||||||||
|
Revenues
|
|||||||||||
|
Fleet leases
|
$
|
6,137
|
|
$
|
11,833
|
|
$
|
8,788
|
|
||
|
Fleet services
|
3,010
|
|
3,462
|
|
2,221
|
|
|||||
|
Freight and other reimbursables
|
1,942
|
|
1,965
|
|
2,605
|
|
|||||
|
Total revenues
|
11,089
|
|
17,260
|
|
13,614
|
|
|||||
|
Operating costs
|
|||||||||||
|
Fleet leases
|
6,174
|
|
11,833
|
|
8,788
|
|
|||||
|
Freight and other reimbursables
|
1,942
|
|
1,965
|
|
2,605
|
|
|||||
|
Operating and maintenance
|
337
|
|
294
|
|
200
|
|
|||||
|
Selling, general and administrative
|
823
|
|
741
|
|
2,450
|
|
|||||
|
Total operating costs
|
9,276
|
|
14,833
|
|
14,043
|
|
|||||
|
Operating income (loss)
|
1,813
|
|
2,427
|
|
(429
|
)
|
|||||
|
Foreign currency transaction loss (gain)
|
(71
|
)
|
43
|
|
(17
|
)
|
|||||
|
Provision for income taxes
|
242
|
|
173
|
|
140
|
|
|||||
|
Net income (loss)
|
$
|
1,642
|
|
$
|
2,211
|
|
$
|
(552
|
)
|
||
71
Year ended
December 31, 2016
compared to the year ended
December 31, 2015
Revenues
Revenues from our Fleet services segment decreased
$6.2 million
to
$11.1 million
for the year ended
December 31, 2016
, from
$17.3 million
for the year ended
December 31, 2015
. The decrease was primarily attributable to a reduction in the number of railcars directly leased by us to our customers, which also resulted in a
$5.7 million
decrease in Fleet leases, a corresponding
$0.5 million
decrease in Fleet services, and
no
notable changes in Freight and other reimbursables revenue. The Freight and other reimbursables revenues represent customer reimbursements to us for freight and other charges that we have incurred on behalf of our customers and were exactly offset by Freight and other reimbursables costs.
Fleet leases
. Fleet leases revenue decreased
$5.7 million
to
$6.1 million
for the year ended
December 31, 2016
, from
$11.8 million
for the year ended
December 31, 2015
, primarily due to a reduction in the number of railcars directly leased by us for our customers. We directly leased an average of approximately
350
railcars in the year ended
December 31, 2016
, compared with approximately
650
railcars in the year ended
December 31, 2015
. Our fleet lease revenues were offset by slightly more costs we incurred to lease railcars from our lessors than we received in lease revenue due to excess mileage we agreed to pay on behalf of a customer.
Fleet services.
We receive a service fee for fleet management services we provide for both the railcars we directly lease to our customers and those railcar leases that, subsequent to June 30, 2016, have been assigned to unrelated parties. The average number of railcars for which we provide fleet management services decreased to approximately
3,000
for the year ended
December 31, 2016
, from approximately
3,500
for the year ended
December 31, 2015
. The declines are the result of non-renewal of expiring railcar leases associated with activities of our Predecessor. As a result of the decrease in the average number of railcars for which we provide fleet management services, our fleet services revenue declined by
$0.5 million
from
December 31, 2015
to
December 31, 2016
.
Operating Costs
Operating costs primarily consist of railcar leases and related expenses incurred for services provided to customers of our terminals. Operating costs of our fleet services segment decreased
$5.6 million
to
$9.3 million
for the year ended
December 31, 2016
, from the year ended
December 31, 2015
. The decrease is primarily due to a reduction in the number of directly leased railcars in our fleet and a reduction in activity, which also resulted in a decrease of
$5.7 million
in Fleet leases costs and essentially
no
change in Freight and other reimbursables costs. "Selling, general and administrative" and "Operating and maintenance" expenses were relatively consistent between periods.
Other Expenses
Provision for income taxes.
We recognized income tax expense of
$242 thousand
with respect to our Fleet services business for the year ended
December 31, 2016
, as compared with
$173 thousand
for the year ended
December 31, 2015
, which amounts are primarily attributable to additional taxable income.
Year ended December 31, 2015 compared to the year ended December 31, 2014
Revenues
Revenues from our Fleet services segment increased $3.7 million to $17.3 million for the year ended December 31, 2015, from $13.6 million for the year ended December 31, 2014. The increase is primarily attributable to an increase in fleet leases associated with the Hardisty terminal being in service for the full year in 2015 and only one-half of the year in 2014, coupled with additional fleet services revenue resulting from railcar management services provided to affiliates of USD.
Fleet leases
. Fleet leases revenue increased $3.0 million to $11.8 million for the year ended December 31, 2015, from $8.8 million for the year ended December 31, 2014, primarily due to an increase in railcars directly leased by us to our customers. Our lease revenue is directly correlated with the number of railcars we have leased to customers. We directly leased an average of approximately
650
railcars to our customers for the year ended
December 31, 2015
, compared with approximately
600
railcars for the year ended December 31, 2014. During 2014, we assigned our rights
72
to payments from customers under master fleet services agreements associated with specific railcars, together with our obligations to make rental payments to the owners of the railcars, to related parties of USD. The assignment of these rights to receive payments under the master fleet services agreements and our obligations to make payments under the associated leases reduced the amount of lease revenue we otherwise would have recognized, and similarly reduced the lease costs as discussed below under operating costs.
Fleet services
. We receive a service fee for fleet management services we provide for both the railcars we directly lease to our customers and those railcar leases that have been assigned to related parties of USD. The average number of railcars for which we provide fleet management services increased to approximately
3,500
for the year ended
December 31, 2015
, from approximately
2,800
for the year ended December 31, 2014. As a result of the increase in the average number of railcars for which we provide fleet management services, our fleet services revenue increased by
$1.2 million
from December 31, 2014 to
December 31, 2015
.
Freight and other reimbursables
. Freight and other reimbursables revenues decreased $0.6 million to $2.0 million for the year ended December 31, 2015, from $2.6 million for the year ended December 31, 2014, primarily resulting from a decrease in the delivery and shipment of railcars associated with the startup of our Hardisty terminal that occurred in 2014, partially offset by additional repairs and maintenance costs we incurred and passed through to our customers. Freight and other reimbursables revenues were exactly offset by Freight and other reimbursables costs payable to the railroads.
Operating Costs
Operating costs of our fleet services segment increased $0.8 million to $14.8 million for the year ended December 31, 2015, from $14.0 million for the year ended December 31, 2014, primarily due to an increase in Fleet leases costs for our direct leases of railcars made on behalf of our customers, partially offset by decreases in Freight and other reimbursables and Selling, general and administrative expenses.
Fleet leases costs
. Fleet leases costs increased $3.0 million to $11.8 million for the year ended December 31, 2015, from $8.8 million for the year ended December 31, 2014, primarily due to an increase in direct leases we entered for railcars that we in turn provide to our customers. A majority of the increase in railcars we leased during 2015 were for a related party of USD. For the year ended December 31, 2015, we directly leased an average of approximately
650
railcars as compared with approximately
600
for the year ended December 31, 2014. During 2014, we assigned our obligations to make payments under certain railcar leases and master fleet services agreements to related parties of USD. The assignment of these obligations to make lease payments reduced the amount of lease costs we otherwise would have recognized, which is similar in amount to the reduction in lease revenue as discussed above.
Freight and other reimbursables costs
. Freight and other reimbursables costs decreased $0.6 million to $2.0 million for the year ended December 31, 2015, from $2.6 million for the year ended December 31, 2014, primarily resulting from a decrease in the costs for the delivery and shipment of railcars associated with the startup of our Hardisty terminal that occurred in 2014, partially offset by additional repairs and maintenance costs we incurred and passed through to our customers. Freight and other reimbursables costs were exactly offset by Freight and other reimbursables revenues.
Selling, general and administrative
. Selling, general and administrative expenses for our Fleet services segment decreased $1.7 million to $0.7 million for the year ended December 31, 2015, primarily due to a provision for bad debts for unrecoverable reimbursable freight costs we incurred in 2014 for the initial delivery of railcars on behalf of a customer that we did not incur in 2015.
Depreciation
. Our Fleet services segment does not own any significant amounts of property upon which to record depreciation expense and, as a result, did not incur depreciation expense for either of the years ended December 31, 2015 or 2014.
73
Other Expenses
Provision for income taxes.
Provision for income taxes for our Fleet services segment was $173 thousand for the year ended December 31, 2015, and $140 thousand for the year ended December 31, 2014, in each case primarily consisting of provisions for state franchise taxes and federal income taxes of USD Rail LP.
CORPORATE ACTIVITIES
The following table sets forth our corporate charges for each of the periods indicated:
|
For the Year Ended December 31,
|
|||||||||||
|
2016
|
2015
|
2014
|
|||||||||
|
(in thousands)
|
|||||||||||
|
Operating costs
|
|||||||||||
|
Selling, general and administrative
|
$
|
9,704
|
|
$
|
7,483
|
|
$
|
1,868
|
|
||
|
Operating loss
|
(9,704
|
)
|
(7,483
|
)
|
(1,868
|
)
|
|||||
|
Interest expense, net
|
8,831
|
|
2,342
|
|
1,225
|
|
|||||
|
Foreign currency transaction loss (gain)
|
(651
|
)
|
(410
|
)
|
461
|
|
|||||
|
Provision for (benefit from) income taxes
|
183
|
|
1
|
|
(1
|
)
|
|||||
|
Net loss
|
$
|
(18,067
|
)
|
$
|
(9,416
|
)
|
$
|
(3,553
|
)
|
||
Year ended
December 31, 2016
compared to the year ended
December 31, 2015
The Net loss associated with our corporate activities increased by
$8.7 million
to
$18.1 million
for the year ended
December 31, 2016
, from
$9.4 million
for the year ended
December 31, 2015
. Selling, general and administrative expenses increased by
$2.2 million
, primarily due to incremental unit based compensation expense associated with the additional Phantom Units granted in February 2016 to directors and employees of our general partner and its affiliates under our Long-Term Incentive Plan. Unit based compensation expense also increased due to a higher closing price for our common units on the NYSE at
December 31, 2016
, compared with the closing price at
December 31, 2015
. Selling, general and administrative expense also increased due to the annual adjustment of the management fee we are charged by affiliates of USDG pursuant to the omnibus agreement. Interest expense was the greatest contributor to the increases in corporate activity costs, which increased by
$6.5 million
during the year ended
December 31, 2016
, primarily due to a higher average balance outstanding on our Revolving Credit Facility resulting from amounts we borrowed for our acquisition of the Casper terminal, as well as higher average rates of interest relative to the same period in 2015. We recognized a provision for income taxes of
$0.2 million
for the year ended
December 31, 2016
, consisting primarily of a provision for Texas state franchise tax of USD Partners LP.
Year ended December 31, 2015 compared to the year ended December 31, 2014
The increase in our losses associated with our corporate activities for the year ended December 31, 2015 from the year ended December 31, 2014, primarily relates to an increase in selling, general and administrative costs and interest expense. Selling, general and administrative costs include unit based compensation expense attributable to Class A units which were granted in October 2014 and Phantom units awarded in February 2015 under our Long-term Incentive Plan, in addition to amounts we are charged pursuant to the terms of our omnibus agreement with USDG, which we entered into in October 2014 at the closing of our IPO. Interest expense for the year ended December 31, 2015, was higher than that for the year ended December 31, 2014, primarily due to the new borrowings under our Revolving Credit Facility in the current year.
Growth Opportunities for our Operations
We apply a disciplined approach to pursuing our growth strategy, which may include organic growth initiatives as well as acquisitions of energy-related logistics assets. Potential acquisitions may include assets developed by our sponsor or by third party logistics providers.
Our sponsor is currently pursuing several development projects related to the storage and transportation of liquid hydrocarbons and biofuels. These development projects are expected to be supported by long-term take-or-pay
74
agreements with strategic customers which would generate stable and predictable cash flows. Energy Capital Partners has indicated an intention to invest an additional $1.0 billion of equity capital in USD, subject to market and other conditions, to support future growth and expansion plans.
U.S. Gulf Coast
In October 2015, our sponsor announced a joint venture to develop a premier U.S. Gulf Coast logistics terminal on a 988-acre parcel of property on the Houston Ship Channel. Its strategic location is uniquely positioned to provide customers with flexible market access to key demand centers, both domestic and abroad. Preliminary master planning efforts suggest that the property footprint is capable of supporting up to ten to twelve million barrels of storage capacity, multiple docks (including barge and deep water), and a rail terminal with capacity to unload multiple unit trains per day. The property is in proximity to substantially all major inbound and outbound pipelines and can be directly accessed by multiple Class 1 railroads.
Worldwide consumption of liquid fuels is estimated to have increased by over one million barrels per day in 2016 and is projected to increase by another three million barrels per day by 2018. Recent industry developments highlight the Gulf Coast’s strategic importance within global energy markets and ability to meet growing demand. Exports of crude oil from PADD 3 have increased more than twenty percent since the lifting of the export ban in December 2015. Additionally, PADD 3 exports of petroleum products have increased ten percent over the last year and thirty-five percent over the last two years. Finally, given expected growth in Permian Basin crude oil production, industry participants have announced plans to add more than 600,000 Bpd of pipeline capacity to transport crude oil from West Texas to the Houston refining and distribution hub for domestic consumption or export to other markets.
Our sponsor expects that these industry dynamics will contribute to growing demand for storage, staging, blending, export and other logistics services along the Gulf Coast, including at its Houston Ship Channel property. Accordingly, our sponsor is actively engaged in commercial negotiations with potential customers to provide solutions for both crude oil and refined products.
Western Canada
Western Canadian crude oil production is projected to increase throughout the next decade, driven primarily by developments in Alberta’s oil sands region. In June 2016, the Canadian Association of Petroleum Producers projected that the supply of crude oil from Western Canada will grow by approximately 590,000 Bpd by 2020 and 890,000 Bpd by 2025 relative to 2015. Since then, several companies have announced plans to increase production capacity at their oil sands facilities, in part due to cost savings and optimization achieved during the recent commodity price downturn.
For example, Canadian Natural recently announced plans to reinstate the development of the 40,000 Bpd Kirby North project and the evaluation of an opportunity to debottleneck the Horizon fractionation tower during upcoming turnaround work, in order to increase production by 5,000 to 15,000 Bpd. Cenovus announced plans to resume construction on its 50,000 Bpd Christina Lake Phase G project and is advancing engineering work on two previously deferred expansion projects that total 75,000 Bpd of expected design capacity. MEG Energy announced an initiative at its Christina Lake Phase 2B project that is expected to increase production by approximately 20,000 Bpd. Consistent with these trends, our partner, Gibson Energy, recently commissioned ahead of schedule 2.9 million barrels of incremental storage capacity at the Hardisty hub, representing a nearly 50% increase. Gibson successfully secured short term contracts to utilize the tanks, as necessary, until the long-term take-or-pay contracts commence later in 2017.
Certain end users, including refineries across North America, have made substantial investments in recent years in order to efficiently process heavy grades of crude oil, such as those from Western Canada. Even with recent regulatory approvals, additions to pipeline takeaway capacity are not expected to keep pace with production growth over the next several years. As a result, multiple industry forecasts project demand for rail takeaway solutions will increase in 2017 and 2018. Our Hardisty and Casper terminals, with established capacity and scalable designs, are well-positioned as strategic locations to meet expected future takeaway needs.
75
Our sponsor retained the right to develop certain expansions of our Hardisty terminal, which they are actively pursuing. These expansions may include solutions to transport heavier grades of crude oil produced in Western Canada, which our sponsor believes will maximize benefits to producers, refiners and railroads.
Right of First Offer
In connection with our IPO, we entered into an omnibus agreement with USD and USDG, pursuant to which we were granted a right of first offer on any midstream infrastructure assets that they may develop, construct, or acquire for a period of seven years after the October 15, 2014, closing of our IPO. Additional information about the omnibus agreement and the right of first offer are included in
Note 13. Transactions with Related Parties
of our consolidated financial statements at
Part II, Item 8. Financial Statements and Supplementary Data of this Annual Report on Form 10-K.
We cannot assure you that USD will be able to develop or construct, or that we or USD will be able to acquire, any additional midstream infrastructure projects. Among other things, the ability of USD to further develop the Hardisty terminal, or any other project, and our ability to acquire such projects, will depend upon USD’s and our ability to raise additional equity and debt financing. We are under no obligation to make any offer, and USD and USDG are under no obligation to accept any offer we make, with respect to any asset subject to our right of first offer. Additionally, the approval of Energy Capital Partners is required for the sale of any assets by USD or its subsidiaries, including us (other than sales in the ordinary course of business), acquisitions of securities of other entities that exceed specified materiality thresholds and any material unbudgeted expenditures or deviations from our approved budgets. Energy Capital Partners may make these decisions free of any duty to us and our unitholders. This approval would be required for the potential acquisition by us of any projects to expand the Hardisty terminal, as well as any other projects or assets that USD may develop or acquire in the future or any third party acquisition we may pursue independently or jointly with USD. Energy Capital Partners is under no obligation to approve any such transaction. Please refer to the discussion under
Item 10. Directors, Executive Officers and Corporate Governance
-Special Approval Rights of Energy Capital Partners
regarding the rights of Energy Capital Partners. If we are unable to acquire any projects to expand the Hardisty terminal from USD, which USD retained the right to develop and operate at the time of our IPO, these expansions may compete directly with our Hardisty terminal for future throughput volumes, which may impact our ability to enter into new terminal services agreements, including with our existing customers, following the termination of our existing agreements, or the terms thereof, and our ability to compete for future spot volumes. Furthermore, cyclical changes in the demand for crude oil and other liquid hydrocarbons may cause USD, or us, to further re-evaluate any future expansion projects, including expansion of the Hardisty terminal.
LIQUIDITY AND CAPITAL RESOURCES
Our principal liquidity requirements are to make distributions to our unitholders, finance current operations, fund capital expenditures, including acquisitions and the costs we may incur to construct new assets, and service our debt. Historically, we have financed our operations with cash generated from our operating activities, borrowings under our credit facility and loans from our sponsor.
Liquidity Sources
We expect our ongoing sources of liquidity to include borrowings under our
$400 million
Credit Agreement, issuances of additional debt and equity securities either privately or pursuant to our effective shelf registration statement, as well as cash we generate from our operating activities. We believe that cash generated from these sources will be sufficient to meet our working capital and capital expenditure requirements and to make quarterly cash distributions.
76
The following table presents our available liquidity as of the dates indicated:
|
December 31,
|
|||||||
|
2016
|
2015
|
||||||
|
(in millions)
|
|||||||
|
Cash and cash equivalents
|
$
|
11.7
|
|
$
|
10.5
|
|
|
|
Aggregate borrowing capacity under Credit Agreement
|
400.0
|
|
400.0
|
|
|||
|
Less: Term Loan Facility amounts outstanding
|
10.1
|
|
41.5
|
|
|||
|
Revolving Credit Facility amounts outstanding
|
213.0
|
|
201.0
|
|
|||
|
Letters of credit outstanding
|
—
|
|
—
|
|
|||
|
Available liquidity
(1)
|
$
|
188.6
|
|
$
|
168.0
|
|
|
|
(1)
|
Pursuant to the terms of our Credit Agreement, our borrowing capacity for
2016
is limited to
4.5
times our trailing 12-month Consolidated EBITDA.
|
Energy Capital Partners must approve any additional issuances of equity by us, which determinations may be made free of any duty to us or our unitholders. Members of our general partner’s board of directors appointed by Energy Capital Partners must also approve the incurrence by us of additional indebtedness or refinancing outside of our existing indebtedness that is not in the ordinary course of business.
Credit Agreement
The $400 million Credit Agreement is comprised of a
$300 million
Revolving Credit Facility, and a
$100 million
Term Loan Facility (borrowed in Canadian dollars), with Citibank, N.A., as administrative agent, and a syndicate of lenders. The Credit Agreement is a five year committed facility that matures October 15, 2019, unless amended or extended.
Our Revolving Credit Facility and issuances of letters of credit are available for working capital, capital expenditures, permitted acquisitions and general partnership purposes, including distributions. As we make payments on the Term Loan Facility, availability equal to the U.S. dollar equivalent amount of the payments is automatically transferred from the Term Loan Facility to the Revolving Credit Facility, ultimately increasing availability on the Revolving Credit Facility to
$400 million
once the Term Loan Facility is fully repaid. In addition, we have the ability to increase the maximum amount of credit available under the Credit Agreement by an aggregate amount of up to
$100 million
, to a total facility size of
$500 million
, as amended, subject to receiving increased commitments from lenders or other financial institutions and satisfaction of certain conditions. The Revolving Credit Facility includes an aggregate
$20 million
sublimit for standby letters of credit and a
$20 million
sublimit for swingline loans. Obligations under the Revolving Credit Facility are guaranteed by our restricted subsidiaries, and are secured by a first priority lien on our assets and those of our restricted subsidiaries, other than certain excluded assets.
As of
December 31, 2016
and
December 31, 2015
, we had amounts outstanding for the respective periods of
$10.1 million
and
$41.5 million
under the Term Loan Facility and
$213.0 million
and
$201.0 million
under the Revolving Credit Facility.
The Term Loan Facility was used to fund a
$100 million
distribution to USDG in connection with the closing of our IPO and is guaranteed by USDG. The guaranty by USDG includes a covenant that USDG maintain a net worth (without taking into account its interests in us, either directly or indirectly) greater than the outstanding amount of the term loan. In the event the USDG net worth covenant is breached and not cured within a certain amount of time, the interest rate on the term loan increases by an additional
1.0%
.
Amounts outstanding on the Term Loan Facility are not subject to any scheduled repayment prior to its maturity on July 14, 2019. Mandatory prepayments of the Term Loan Facility are required from certain non-ordinary course asset sales subject to customary exceptions and reinvestment rights.
77
Loans under the Credit Agreement accrue interest at a per annum rate by reference, at the borrowers' election, to the London Interbank Offered Rate, or LIBOR, the Canadian Dealer Offered Rate or CDOR, a base rate, or Canadian prime rate, in each case, plus an applicable margin. Our borrowings under the Credit Agreement for revolving loans bear interest at either a base rate and Canadian prime rate, as applicable plus an applicable margin ranging from
1.25%
to
2.25%
, or at LIBOR or CDOR, as applicable, plus an applicable margin ranging from
2.25%
to
3.25%
. Borrowings under the Term Loan Facility bear interest at either the base rate and Canadian prime rate, as applicable, plus a margin ranging from
1.35%
to
2.35%
or at LIBOR or CDOR, as applicable, plus an applicable margin ranging from
2.35%
to
3.35%
. The applicable margin, as well as a commitment fee on the Revolving Credit Facility, ranging from
0.375%
per annum to
0.50%
per annum on unused commitments, will vary based upon our consolidated net leverage ratio, as defined in our Credit Agreement. The actual average interest rate on our outstanding indebtedness was
3.66%
and
2.71%
at
December 31, 2016
and
2015
, respectively.
Our Credit Agreement contains affirmative and negative covenants that, among other things, limit or restrict our ability and the ability of our restricted subsidiaries to incur or guarantee debt, incur liens, make investments, make restricted payments, engage in business activities, engage in mergers, consolidations and other organizational changes, sell, transfer or otherwise dispose of assets or enter into burdensome agreements or enter into transactions with affiliates on terms that are not arm’s length, in each case, subject to exceptions.
Additionally, we are required to maintain the following financial ratios, each determined on a quarterly basis for the immediately preceding four quarter period then ended (or such shorter period as shall apply, on an annualized basis):
|
•
|
Consolidated Interest Coverage Ratio (as defined in the credit agreement), of at least
2.50
to 1.00;
|
|
•
|
Consolidated Leverage Ratio of not greater than
4.50
to 1.00 (or
5.00
to 1.00 at any time after we have issued at least
$150.0 million
of unsecured notes). In addition, upon the consummation of a Material Acquisition (as defined in our Credit Agreement), for the fiscal quarter in which the Material Acquisition is consummated and for two fiscal quarters immediately following such fiscal quarter (the “Material Acquisition Period”), if elected by us by written notice to the Administrative Agent given on or prior to the date of such acquisition, the maximum permitted ratio shall be increased by
0.50
to 1.00 above the otherwise relevant level; and
|
|
•
|
after we have issued at least
$150.0 million
of unsecured notes, a Consolidated Senior Secured Leverage Ratio (as defined in the Credit Agreement) of not greater than
3.50
to 1.00 (or
4.00
to 1.00 during a Material Acquisition Period).
|
Our Credit Agreement generally prohibits us from making cash distributions (subject to exceptions as set forth in the Credit Agreement) except so long as no default exists or would be caused thereby, we may make cash distributions to unitholders up to the amount of our available cash (as defined in our partnership agreement).
The Credit Agreement contains events of default, including, but not limited to (and subject to grace periods in circumstances set forth in the Credit Agreement), the failure to pay any principal, interest or fees when due, failure to perform or observe any covenant that does not have certain materiality qualifiers contained in the Credit Agreement or related loan documentation, any representation, warranty or certification made or deemed made in the agreements or related loan documentation being untrue in any material respect when made, default under certain material debt agreements, commencement of bankruptcy or other insolvency proceedings, certain changes in our ownership or the ownership of our general partner, material judgments or orders, certain judgment defaults, ERISA events or the invalidity of the loan documents. Upon the occurrence and during the continuation of an event of default under the agreements, the lenders may, among other things, terminate their commitments, declare any outstanding loans to be immediately due and payable and/or exercise remedies against us and the collateral as may be available to the lenders under the agreements and related documentation or applicable law.
As of
December 31, 2016
, we were in compliance with the covenants set forth in our Credit Agreement.
Shelf Registration Statement
We have an effective shelf registration statement on file with the United States Securities and Exchange Commission which allows us to issue up to $500 million in aggregate offering price of common units, preferred units
78
and debt securities. The debt securities may be guaranteed by some or all of our subsidiaries. The registration statement became effective May 18, 2016 and is available for use for up to three years. We may conduct offerings under this registration statement at any time. We may use the net proceeds from any such offerings for general partnership purposes, which may include funding debt repayment, future acquisitions, capital expenditures and additions to working capital.
Cash Flows
The following table and discussion presents a summary of cash flows associated with our operating, investing and financing activities for the specified periods.
|
For the Year Ended December 31,
|
|||||||||||
|
2016
|
2015
|
2014
|
|||||||||
|
(in thousands)
|
|||||||||||
|
Net cash provided by (used in):
|
|||||||||||
|
Operating activities
|
$
|
53,076
|
|
$
|
36,204
|
|
$
|
(3,085
|
)
|
||
|
Investing activities
|
(93
|
)
|
(213,283
|
)
|
(34,204
|
)
|
|||||
|
Financing activities
|
(51,298
|
)
|
147,957
|
|
45,705
|
|
|||||
|
Discontinued operations
|
—
|
|
—
|
|
24,241
|
|
|||||
|
Effect of exchange rates on cash
|
(480
|
)
|
(627
|
)
|
1,441
|
|
|||||
|
Net change in cash and cash equivalents
|
$
|
1,205
|
|
$
|
(29,749
|
)
|
$
|
34,098
|
|
||
Operating Activities
Net cash provided by operating activities increased by
$16.9 million
to
$53.1 million
for the year ended
December 31, 2016
, from
$36.2 million
of net cash provided by operating activities for the year ended
December 31, 2015
. The increase was primarily attributable to the cash flows produced by our Casper terminal, which we acquired in November 2015. The increase in cash flows from operating activities was partially offset by net changes in our working capital accounts resulting from the timing of receipts and payment of our accounts receivable and payable balances, as well as the increase in our restricted cash balances.
Net cash provided by operating activities increased by $39.3 million to $36.2 million for the year ended December 31, 2015, from $3.1 million of net cash used in operating activities for the year ended December 31, 2014. The increase was primarily due to the increase in net income and the net changes in working capital associated with the operations of our Hardisty terminal, which commenced operations in late June 2014 and was fully operational during the full year ended December 31, 2015. Also contributing to our operating cash flows was our acquisition of the Casper terminal, which contributed to our cash flows from the November 17, 2015 date we acquired the business.
Investing Activities
Net cash used in investing activities decreased by
$213.2 million
to
$0.1 million
for the year ended
December 31, 2016
, from
$213.3 million
for the year ended
December 31, 2015
. The decrease was primarily attributable to our acquisition of the Casper terminal in 2015, with no acquisition activity in 2016. In addition, there were fewer growth capital expenditures made to enhance our terminal operations during the year ended
December 31, 2016
, than we made during the year ended
December 31, 2015
.
Net cash used in investing activities increased by $179.1 million to $213.3 million for the year ended December 31, 2015, from $34.2 million for the year ended December 31, 2014. The increase was primarily due to our acquisition of the Casper terminal in November 2015. Investing activities in 2014 were primarily associated with the development of the Hardisty terminal, which was fully operational during 2015.
Financing Activities
Net cash used in financing activities increased by
$199.3 million
to
$51.3 million
for the year ended
December 31, 2016
, from net cash provided of
$148.0 million
for the year ended
December 31, 2015
. During 2016 we
79
paid cash distributions of
$29.7 million
and repaid the equivalent of
$33.6 million
on our Term Loan Facility (representing
C$44.0 million
) and
$8.0 million
on our Revolving Credit Facility. These payments were partially offset by proceeds of
$20.0 million
we received from borrowing on our Revolving Credit Facility.
Net cash provided by financing activities increased by $102.3 million to $148.0 million for the year ended December 31, 2015, from $45.7 million for the year ended December 31, 2014. During 2015, we borrowed $203 million on our Revolving Credit facility, which was primarily used for the acquisition of the Casper terminal. Partially offsetting the proceeds we received from financing activities were cash distributions of $24.0 million and repayment on our Term Loan Facility of $30.5 million. During 2014, we received net proceeds of $137.5 million from our initial public offering after underwriting discounts, commissions and reimbursements of USDG for expenses of the offering. We also received $67.8 million, net of deferred financing costs, from the Bank of Oklahoma credit facility, which we used to repay a loan previously made to us by our sponsor for the development of the Hardisty terminal. In addition, we received proceeds of $100 million on our Term loan which we distributed to USDG. We also received a $14.3 million contribution from our sponsor in 2014. These proceeds were partially offset by repayment of $97.8 million on our Bank of Oklahoma credit facility, repayment of $49.4 million on loans outstanding from our parent and repayment of $15.0 million on our Term Loan Facility.
80
Segment Adjusted EBITDA
We use the cash generated by our reporting segments to support our liquidity position. Our segments offer different services and are managed accordingly. Our chief operating decision maker, or CODM, regularly reviews financial information about both segments in order to allocate resources and evaluate performance. Our CODM assesses segment performance based on the cash flows produced by our established reporting segments using Segment Adjusted EBITDA. We define Segment Adjusted EBITDA as "Net cash provided by operating activities" adjusted for changes in working capital items, changes in restricted cash, interest, income taxes, foreign currency transaction gains and losses, adjustments related to deferred revenue associated with minimum monthly commitment fees and other items which do not affect the underlying cash flows produced by our businesses.
The following table provides a reconciliation of our Segment Adjusted EBITDA to Net cash provided by operating activities:
|
For the Years Ended December 31,
|
|||||||||||
|
2016
|
2015
|
2014
|
|||||||||
|
(in thousands)
|
|||||||||||
|
Segment Adjusted EBITDA
|
|||||||||||
|
Terminalling services
|
$
|
67,507
|
|
$
|
45,347
|
|
$
|
15,397
|
|
||
|
Fleet services
|
1,813
|
|
2,427
|
|
1,187
|
|
|||||
|
Corporate activities
(1)
|
(5,630
|
)
|
(5,022
|
)
|
(1,318
|
)
|
|||||
|
Total Adjusted EBITDA
|
63,690
|
|
42,752
|
|
15,266
|
|
|||||
|
Add (deduct):
|
|||||||||||
|
Amortization of deferred financing costs
|
861
|
|
659
|
|
1,056
|
|
|||||
|
Deferred income taxes
|
46
|
|
814
|
|
—
|
|
|||||
|
Bad debt expense
|
—
|
|
—
|
|
1,424
|
|
|||||
|
Unrecovered reimbursable freight costs
(2)
|
—
|
|
—
|
|
(1,616
|
)
|
|||||
|
Changes in accounts receivable and other assets
|
1,859
|
|
(730
|
)
|
(8,511
|
)
|
|||||
|
Changes in accounts payable and accrued expenses
|
(1,917
|
)
|
(880
|
)
|
(2,372
|
)
|
|||||
|
Changes in deferred revenue and other liabilities
|
(996
|
)
|
10,085
|
|
17,497
|
|
|||||
|
Change in restricted cash
|
(654
|
)
|
870
|
|
(6,490
|
)
|
|||||
|
Interest expense, net
|
(9,837
|
)
|
(4,368
|
)
|
(4,825
|
)
|
|||||
|
Benefit from (provision for) income taxes
|
759
|
|
(5,755
|
)
|
(186
|
)
|
|||||
|
Foreign currency transaction gain (loss)
(3)
|
750
|
|
201
|
|
(4,850
|
)
|
|||||
|
Deferred revenue associated with minimum monthly commitment fees
(4)
|
(1,485
|
)
|
(7,444
|
)
|
(9,478
|
)
|
|||||
|
Net cash provided by operating activities
|
$
|
53,076
|
|
$
|
36,204
|
|
$
|
(3,085
|
)
|
||
|
(1)
|
Corporate activities represent corporate and financing transactions that are not allocated to our established reporting segments.
|
|
(2)
|
Represents costs incurred with respect to unrecovered reimbursable freight costs associated with the initial delivery of railcars in support of our Hardisty terminal.
|
|
(3)
|
Represents foreign exchange transaction gains or losses associated with activities between our U.S. and Canadian subsidiaries.
|
|
(4)
|
Represents deferred revenue associated with minimum monthly commitment fees in excess of throughput utilized, which fees are not refundable to the customers. Amounts presented are net of: (a) the corresponding prepaid Gibson pipeline fee that will be recognized as expense concurrently with the recognition of revenue; (b) revenue recognized in the current period that was previously deferred; and (c) expense recognized for previously prepaid Gibson pipeline fees, which correspond with the revenue recognized that was previously deferred. Refer to the discussion in
Note 10. Deferred revenue
of our consolidated financial statements included in Part II, Item 8.
Financial Statements and Supplementary Data
of this Annual Report.
|
Terminalling Services Segment
Adjusted EBITDA from our Terminalling services segment increased
$22.2 million
to
$67.5 million
for the year ended
December 31, 2016
, from
$45.3 million
for the year ended
December 31, 2015
, and increased
$30.0 million
for
81
the year ended
December 31, 2015
, from the year ended
December 31, 2014
. The increase for 2016 is primarily the result of cash generated by our Casper terminal, which we acquired in November 2015. The increase in 2015 is primarily due to a full year of operating our Hardisty terminal whereas in 2014 the Hardisty terminal was only operational for half of the year.
Fleet Services Segment
Adjusted EBITDA from our Fleet services segment decreased
$0.6 million
to
$1.8 million
for the year ended
December 31, 2016
, from
$2.4 million
for the year ended
December 31, 2015
, and increased
$1.2 million
for the year ended
December 31, 2015
, from
$1.2 million
for the year ended
December 31, 2014
. The decrease in 2016 is primarily the result of a reduction in the total number of railcars in our fleet from which we generate cash for providing services primarily in support of customers of our terminals. In 2015, the number of railcars in our fleet was greater than in 2014, thus producing more cash from the services provided.
Cash Requirements
Our primary requirements for capital are for funding capital expenditures, including acquisitions and the costs we may incur to construct new assets, servicing our debt and making distributions to our unitholders.
Capital Requirements
Our historical capital expenditures have primarily consisted of the costs to construct and acquire energy-related logistics assets. Our operations are expected to require investments to expand, upgrade or enhance existing facilities and to meet environmental and operational regulations.
Our partnership agreement requires that we categorize our capital expenditures as either expansion capital expenditures, maintenance capital expenditures or investment capital expenditures.
|
•
|
Expansion capital expenditures are cash expenditures incurred for acquisitions or capital improvements that we expect will increase our operating income or operating capacity over the long-term. Examples of expansion capital expenditures include the acquisition of terminals, rail lines and railcars or other complementary midstream assets from USD or third parties and the construction or development of new terminals or additional capacity at our existing terminals to the extent such capital expenditures are expected to expand our operating capacity or operating income. Expansion capital expenditures include interest payments (and related fees) on debt incurred to finance all or a portion of expansion capital expenditures in respect of the period from the date that we enter into a binding obligation to commence the construction, development, replacement, improvement or expansion of a capital asset and ending on the earlier to occur of the date that such capital improvement commences commercial service and the date that such capital improvement is disposed of or abandoned.
|
|
•
|
Maintenance capital expenditures are cash expenditures made to maintain, over the long term, our operating capacity, operating income or our asset base. Examples of maintenance capital expenditures are expenditures to repair and refurbish our terminals.
|
|
•
|
Investment capital expenditures are those capital expenditures that are neither maintenance capital expenditures nor expansion capital expenditures. Investment capital expenditures will largely consist of capital expenditures made for investment purposes. Examples of investment capital expenditures include traditional capital expenditures for investment purposes, such as purchases of securities, as well as other capital expenditures that might be made in lieu of such traditional investment capital expenditures, such as the acquisition of a capital asset for investment purposes or development of facilities that are in excess of the maintenance of our existing operating capacity or operating income, but that are not expected to expand our operating capacity or operating income over the long term.
|
Based on the nature of our operations, our assets typically require minimal to no maintenance capital expenditures. However, we expect to incur costs to maintain our assets in compliance with sound business practice, our contractual relationships and applicable regulatory requirements, some of which will be characterized as maintenance capital expenditures. Both our Hardisty and Casper terminals were constructed in 2014, and therefore, we do not expect to incur significant maintenance capital expenditures in the near term to maintain the operating capacity of these facilities.
82
We incurred
$238 thousand
of maintenance capital expenditures during the year ended December 31, 2016, primarily at our Casper terminal for environmental monitoring and security equipment. We had
no
maintenance capital expenditures during the years ended
December 31, 2015
and
2014
. We record routine maintenance expenses we incur in connection with the operation of our assets in "Operating and maintenance" expense in our consolidated statements of operations.
Our total expansion capital expenditures for the year ended
December 31, 2016
amounted to
$0.5 million
and were for planned growth projects at our Hardisty and Casper terminals. For the year ended
December 31, 2015
, our total expansion capital expenditures were
$212.1 million
and were primarily for our acquisition of the Casper terminal coupled with enhancements made to our Hardisty terminal to increase load pressure and provide for alternative power sources to keep the terminal operational in the event of a power loss. We expect to fund future capital expenditures from cash on our balance sheet, cash flow generated from our operations, borrowing on our Revolving Credit Facility, the issuance of additional partnership interests or long-term debt.
We anticipate reducing our outstanding indebtedness to the extent we generate cash flows in excess of our operating and investing needs. During the year ended December 31, 2016, we repaid
C$44.0 million
on our Term Loan Facility (the equivalent of
$33.6 million
) and
$8.0 million
on our Revolving Credit Facility. These payments were partially offset by proceeds from borrowing
$20.0 million
on our Revolving Credit Facility, which we used for general partnership purposes.
Distributions
We intend to pay a minimum quarterly distribution of at least
$0.2875
per unit. Our most recently declared quarterly distribution of
$0.3300
per unit equates to approximately
$7.6 million
per quarter, or
$30.6 million
per year, based on the number of common, Class A, subordinated, and general partner units outstanding as of
February 13, 2017
. Notwithstanding the recommendation of the management of our general partner, members of our general partner’s board of directors appointed by Energy Capital Partners, if any, must approve any distributions made by us.
Other Items Affecting Liquidity
Credit Risk
Our exposure to credit risk may be affected by the concentration of customers, as well as changes in economic or other conditions. Our customers' businesses react differently to changing conditions. We believe that our credit-review procedures, loss reserves, customer deposits and collection procedures have adequately provided for amounts that may be uncollectible in the future.
Foreign Currency Exchange Risk
We currently derive a significant portion of our cash flow from our Canadian operations, particularly our Hardisty
terminal. As a result, portions of our cash and cash equivalents are denominated in Canadian dollars and are held by foreign subsidiaries, which amounts are subject to fluctuations resulting from changes in the exchange rate between the U.S. dollar and the Canadian dollar.
83
Contractual Obligations and Commitments
In the ordinary course of business, we enter into a variety of contractual obligations and other commitments. The following table summarizes the principal amount of our future minimum obligations and commitments that have remaining non-cancellable terms in excess of one year at
December 31, 2016
:
|
Payments Due by Year
|
|||||||||||||||||||||||||||
|
Total
|
2017
|
2018
|
2019
|
2020
|
2021
|
Thereafter
|
|||||||||||||||||||||
|
(in thousands)
|
|||||||||||||||||||||||||||
|
Operating services agreements
(1)
|
$
|
16,933
|
|
$
|
7,105
|
|
$
|
6,124
|
|
$
|
3,704
|
|
$
|
—
|
|
$
|
—
|
|
$
|
—
|
|
||||||
|
Operating leases
(2)
|
24,584
|
|
4,467
|
|
4,071
|
|
4,071
|
|
4,072
|
|
4,072
|
|
3,831
|
|
|||||||||||||
|
Interest
(3)
|
25,336
|
|
9,052
|
|
9,052
|
|
7,232
|
|
—
|
|
—
|
|
—
|
|
|||||||||||||
|
Credit Agreement
(4)
|
223,128
|
|
—
|
|
—
|
|
223,128
|
|
—
|
|
—
|
|
—
|
|
|||||||||||||
|
Total
|
$
|
289,981
|
|
$
|
20,624
|
|
$
|
19,247
|
|
$
|
238,135
|
|
$
|
4,072
|
|
$
|
4,072
|
|
$
|
3,831
|
|
||||||
|
(1)
|
These future obligations represent labor service agreements at our terminal facilities.
|
|
(2)
|
Future minimum lease payments under non-cancellable operating leases for land, building, track, and railcars.
|
|
(3)
|
Interest payable on our Credit Agreement is variable. We estimated interest through maturity using rates in effect on
December 31, 2016
.
|
|
(4)
|
Principal repayment obligations under our Credit Agreement as of
December 31, 2016
.
|
SUBSEQUENT EVENTS
Refer to
Note 23. Subsequent events
of our consolidated financial statements included in Item 8.
Financial Statements and Supplementary Data
of this Annual Report for a discussion regarding our subsequent events.
Recent Accounting Pronouncements Not Yet Adopted
Refer to
Note 2. Summary of significant accounting policies
of our consolidated financial statements included in Item 8.
Financial Statements and Supplementary Data
of this Annual Report for a discussion regarding recent accounting pronouncements that we have not yet adopted.
OFF-BALANCE SHEET ARRANGEMENTS
In the normal course of business, we are a party to off-balance sheet arrangements relating to various master fleet services agreements, whereby we have agreed to assign certain payment and other obligations to third party special purpose entities that are not consolidated with us. We have also entered into agreements to provide fleet services to these special purpose entities for fixed servicing fees and reimbursement of out-of-pocket expenses. The purpose of these transactions is to remove the risk to us of non-payment by our customers, which would otherwise negatively impact our financial condition and results of operations. For more information on these special purpose entities see the discussion of our relationship with the variable interest entities described in
Note 12 – Nonconsolidated Variable Interest Entities
and
Note 13 – Transactions with Related Parties
to our consolidated financial statements for the years ended
December 31, 2016
,
2015
and
2014
included in Part II, Item 8.
Financial Statements and Supplementary Data
of this Annual Report. Liabilities related to these arrangements are generally not reflected in our consolidated balance sheets, and we do not expect any material impact on our cash flows, results of operations or financial condition as a result of these off-balance sheet arrangements.
Prior to July 1, 2016, a member of the board of directors of USD exercised control over the VIEs, resulting in these entities being classified as related parties during that period. Related party sales to the special purpose entities were
$0.8 million
,
$1.9 million
and
$1.5 million
during the years ended
December 31, 2016
,
2015
and
2014
, respectively. These sales are recorded in "Fleet services—related party" on the accompanying consolidated statements of operations.
Related party deferred revenues from the special purpose entities were
$2.8 million
as of
December 31, 2015
, which were recorded in "Deferred revenue—related party" on the accompanying consolidated balance sheets.
84
CRITICAL ACCOUNTING POLICIES AND ESTIMATES
Our selection and application of accounting policies is an important process that has developed as our business activities have evolved and as new accounting pronouncements have been issued. Accounting decisions generally involve an interpretation of existing accounting principles and the use of judgment in applying those principles to the specific circumstances existing in our business. We make every effort to comply with all applicable accounting principles and believe the proper implementation and consistent application of these principles is critical. However, not all situations we encounter are specifically addressed in the accounting literature. In such cases, we must use our best judgment to implement accounting policies that clearly and accurately present the substance of these situations. We accomplish this by analyzing similar situations and the accounting guidance governing them and consulting with experts about the appropriate interpretation and application of the accounting literature to these situations.
In addition to the above, certain amounts included in or affecting our consolidated financial statements and related disclosures must be estimated, requiring us to make certain assumptions with respect to values or conditions that cannot be known with certainty at the time the consolidated financial statements are prepared. These estimates affect the reported amounts of assets, liabilities, revenues, expenses and related disclosures with respect to contingent assets and liabilities. The basis for our estimates is historical experience, consultation with experts and other sources we believe to be reliable. While we believe our estimates are appropriate, actual results can and often do differ from these estimates. Any effect on our business, financial position, results of operations and cash flows resulting from revisions to these estimates are recorded in the period in which the facts that give rise to the revision become known.
We believe our critical accounting policies and estimates discussed in the following paragraphs address the more significant judgments and estimates we use in the preparation of our consolidated financial statements. Each of these areas involve complex situations and a high degree of judgment either in the application and interpretation of existing accounting literature or in the development of estimates that affect our consolidated financial statements. Our management has discussed the development and selection of the critical accounting policies and estimates related to the reported amounts of assets, liabilities, revenues and expenses and disclosure of contingent liabilities with the Audit Committee of the board of directors of our general partner.
The following discussion relates to the critical accounting policies and estimates for both USD Partners LP and our Predecessor. Our consolidated financial statements are prepared in accordance with accounting principles generally accepted in the United States. The preparation of consolidated financial statements requires management to make judgments, assumptions and estimates based on the best available information at the time. The following accounting policies are considered critical because they are important to the portrayal of our financial condition and results, and involve a higher degree of complexity and judgment on the part of management. Actual results may differ based on the accuracy of the information utilized and subsequent events, some over which we may have little or no control. Significant estimates by management include the estimated lives of depreciable property and equipment, recoverability of long-lived assets and goodwill, and provision and deferral of income taxes.
Revenue Recognition
Revenues are derived from railcar loading and offloading services for bulk liquid products including crude oil, biofuels, and related products, as well as sourcing railcar fleets and related logistics and maintenance services. We recognize revenue when persuasive evidence of an arrangement exists, delivery has occurred or services have been rendered, the buyer’s price is fixed or determinable and collectability is reasonably assured. In accordance with FASB Accounting Standards Codification, or ASC, 605, Revenue Recognition, we record revenues for Fleet services on a gross basis when we are deemed the primary obligor for the services. We also record revenues from reimbursable costs on a gross basis as reimbursements for out-of-pocket expenses are included in revenues and operating costs.
Revenues for Terminalling services are recognized when services are provided based on the contractual rates related to throughput volumes. Our terminalling services agreements typically contain “take-or-pay” provisions whereby we are entitled to a minimum monthly commitment fee. In accordance with the terms of these agreements, we recognize the portions of these minimum monthly commitment fees paid for volumes in excess of actual throughput when the customer’s ability to make up the minimum volume has expired, the throughput is utilized or when it is determined that the likelihood that the customer will utilize the make-up rights is remote. Revenue for Fleet services and related
85
party administrative services is recognized ratably over the contract period. Revenue for reimbursable costs is recognized as the costs are incurred. We have deferred revenues for amounts collected from customers in our Fleet services segment, which will be recognized as revenue when earned pursuant to the contractual terms. We have prepaid rent associated with these deferred revenues on our railcar leases, which will be recognized as expense when incurred.
Capitalization Policies and Depreciation Methods
We record property and equipment at its original cost, which we depreciate on a straight-line basis over the estimated useful lives of the assets, which range from
five
to
20 years
. Our determination of the useful lives of property and equipment requires us to make various assumptions when the assets are acquired or placed into service about the expected usage, normal wear and tear and the extent and frequency of maintenance programs. Expenditures for repairs and maintenance are charged to expense as incurred, while improvements that extend the service life or capacity of existing property and equipment are capitalized. Upon the sale or retirement of an asset, the related costs and accumulated depreciation are removed from the accounts and any gain or loss is recognized in our operating results.
During construction we capitalize direct costs, such as labor, materials and overhead, as well as interest cost we may incur on indebtedness at our incremental borrowing rate.
Impairment of Long-lived Assets
We evaluate long-lived assets for impairment whenever events or changes in circumstances indicate the carrying amount of an asset may not be recoverable. A long-lived asset is considered impaired when the sum of the estimated, undiscounted future cash flows from the use of the asset and its eventual disposition is less than the carrying amount of the asset. Factors that indicate potential impairment include: a significant decrease in the market value of the asset, operating or cash flow losses associated with the use of the asset, and a significant change in the asset’s physical condition or use.
When alternative courses of action to recover the carrying amount of a long-lived asset are under consideration, estimates of future undiscounted cash flows take into account possible outcomes and probabilities of their occurrence. If the carrying amount of the long-lived asset is not recoverable based on the estimated future undiscounted cash flows, an impairment loss is recognized to the extent the carrying value exceeds the estimated fair value of the long-lived asset.
Assessment of Recoverability of Goodwill
Goodwill represents the future economic benefits arising from other assets acquired in a business combination that are not individually identified and separately recognized. Goodwill is only included in our Terminalling services segment.
We do not amortize goodwill, but test it for impairment annually based on the carrying values of our reporting units on the first day of the third quarter of each year, or more frequently if impairment indicators arise that suggest the carrying value of goodwill may be impaired. The assessment of the recoverability of goodwill is highly subjective due to frequent changes in economic conditions underlying the assumptions upon which the valuations are based and global factors affecting the prices for crude oil and demand for our services. In assessing our ability to recover the carrying value of goodwill, we make critical assumptions that include but are not limited to:
|
(1)
|
our projections of future financial performance, which include contract renewal expectations;
|
|
(2)
|
our expected market weighted average cost of capital;
|
|
(3)
|
an expected range of EBITDA multiples derived from equity prices of public companies with similar operating and investment characteristics; and
|
|
(4)
|
an expected range of EBITDA multiples for transactions based on actual sales and purchases of comparable businesses.
|
86
We recognize an impairment loss when the carrying amount of a reporting unit exceeds its implied fair value. We reduce the carrying value of goodwill to its fair value at the time we determine that an impairment has occurred.
The approximately $33.6 million balance of our goodwill originated from our acquisition of the Casper terminal in November 2015 and is wholly attributed to this reporting unit. We measured the fair value of our Casper terminal reporting unit using customary business valuation techniques including an income analysis, market analysis and transaction analysis, which we weighted at 50%, 25% and 25%, respectively. The critical assumptions used in our analysis include the following:
|
(1)
|
A weighted average cost of capital of 10%;
|
|
(2)
|
A capital structure consisting of approximately 35% debt and 65% equity;
|
|
(3)
|
A range of EBITDA multiples derived from stock prices of public companies with similar operating and investment characteristics, from 9x to 10x; and
|
|
(4)
|
A range of EBITDA multiples for transactions based on actual sales and purchases of comparable businesses, from 8.5x to 9.5x.
|
The key assumptions listed above were based upon economic conditions existing at or prior to the July 1, 2016, valuation date. Our weighted average cost of capital is subject to variability and is dependent upon such factors as changes in benchmark rates of interest established by the Federal Open Market Committee of the Federal Reserve Board, the British Bankers Association and other central banking regulatory authorities, as well as perceptions of risk and market uncertainty regarding our business, industry and those of our peers and our underlying capital structure. We expect our long-term underlying capital structure to approximate a weighting of 50% debt and 50% equity. Each of the above assumptions are likely to change due to economic uncertainty surrounding global and North American energy markets that are highly correlated with crude oil, natural gas and other energy-related commodity prices and other market factors.
Assumptions we make under the income approach include our projections of future financial performance of the Casper terminal reporting unit, which include contract renewal expectations and commitments regarding the use of these facilities. To the extent that our assumptions for contract renewals and customer commitments vary from what we experience in the future, our projections of future financial performance underlying the fair value derived from the income approach of the Casper terminal reporting unit could yield results that are significantly different from those produced.
The EBITDA multiples we used to estimate the fair value of the Casper terminal reporting unit are subject to uncertainty associated with market conditions in the energy sector. We derived the assumption based upon EBITDA multiples for several peer organizations that operate in the mid-stream energy sector, generally providing services associated with the transportation of energy-related products. The EBITDA multiples of each of these entities is affected by changes in the supply of and demand for energy-related products, which affects the demand for the services they provide. Declines in the production of energy-related products as well as lower demand for these products can reduce the operating results of these organizations and accordingly, the multiples that market participants are willing to pay for EBITDA, which is used as a proxy for cash flow. Changes in the EBITDA multiples of the peer organizations we use to estimate fair value could significantly affect the fair value of the Casper terminal reporting unit we derived using this approach.
The EBITDA multiples from executed purchase and sales transactions of businesses that are similar to our Casper terminal reporting unit we used to estimate the fair value are also subject to variability, which is dependent upon market conditions in the energy sector, as well as the perceived benefits the acquiring entity expects to derive from the transaction. The transactions comprising the pool occurred during the immediately preceding two years and future transactions may have no correlation to the EBITDA multiples for similar transactions in the future. Further deterioration in economic conditions in the energy sector could result in a greater number of distressed sales at lower EBITDA multiples than currently estimated. Additionally, a representative sample of transactions in the future may not provide
87
a sufficient population upon which to derive an EBITDA multiple. These factors, among others, could cause our estimates of fair value for the Casper terminal reporting unit to vary significantly from the amounts determined under this method.
As indicated above, our estimate of fair value for the Casper terminal reporting unit required us to use significant unobservable inputs representative of Level 3 fair value measurements, including assumptions related to the future performance of our Casper terminal. We completed our impairment analysis of goodwill and determined that the fair value of the Casper terminal reporting unit exceeded its carrying value at July 1, 2016, by an amount slightly greater than 9%. We have not observed any events or circumstances subsequent to our analysis that would suggest the fair value of our Casper terminal is below its carrying amount as of
December 31, 2016
.
Income Taxes
We are not a taxable entity for U.S. federal income tax purposes or for a majority of the states that impose an income tax. Taxes on our net income are generally borne by our unitholders through the allocation of taxable income, except for USD Rail LP, which, on October 7, 2014, elected to be classified as an entity taxable as a corporation. Our income tax expense is predominantly attributable to Canadian federal and provincial income taxes imposed on our operations based in Canada. Additionally, we are subject to state income tax laws that apply to entities organized as partnerships by the State of Texas. This state income tax is computed on our modified gross margin, which we have determined to be an income tax as set forth in the authoritative accounting guidance. Our current and historical provision for income taxes also reflects income taxes associated with USD Rail LP.
We recognize deferred income tax assets and liabilities for temporary differences between the relevant basis of our assets and liabilities for financial reporting and tax purposes. We record the impact of changes in tax legislation on deferred income tax assets and liabilities in the period the legislation is enacted.
Pursuant to the authoritative accounting guidance regarding uncertain tax positions, we recognize the tax effects of any uncertain tax position as the largest amount that will more likely than not be realized upon ultimate settlement with the taxing authority having full knowledge of the position and all relevant facts. Under this criterion, we evaluate the most likely resolution of an uncertain tax position based on its technical merits and on the outcome that we expect would likely be sustained under examination.
Net income for financial statement purposes may differ significantly from taxable income of unitholders as a result of differences between the tax basis and financial reporting basis of assets and liabilities and the taxable income allocation requirements under our partnership agreement. The aggregate difference in the basis of our net assets for financial and tax reporting purposes cannot be readily determined because information regarding each partner’s tax attributes in us is not available.
Foreign Currency
A substantial portion of our operations are conducted in Canada and are accounted for in the local currency, the Canadian dollar, which we translate into our reporting currency, the U.S. dollar. We translate most Canadian dollar denominated balance sheet accounts at the end of period exchange rate, while most income statement accounts are translated monthly based on the average exchange rate for each monthly period. Amounts translated from foreign currencies into our U.S. dollar reporting currency can vary between periods due to fluctuations in the exchange rates between the foreign currency and the U.S. dollar.
Our exposure to market risks primarily arise from changes in interest rates and foreign currency exchange rates. We do not take title to the crude oil, biofuels or related products that we handle at our facilities and, as a result, we have minimal direct exposure to risks associated with changes in commodity prices. All of our derivative financial instruments are employed in connection with an underlying asset, liability and/or forecasted transaction and are not entered into with the objective of speculating on interest rates or foreign exchange rates.
88
Interest Rate Risk
We are charged variable rates of interest on our indebtedness outstanding under the Credit Agreement which exposes us to fluctuations in interest rates. Interest rates prevalent in the current credit markets have been and remain near historic lows. Our credit agreement allows us the option of selecting interest rates on amounts we borrow that are based upon the LIBOR, CDOR, and a Canadian or U.S. base interest rate as set forth in the Credit Agreement. As the economic environments in North America and Europe strengthen, monetary policy could tighten, resulting in higher interest rates. Interest rates on variable rate credit facilities and future debt offerings could be higher than current levels, causing our financing costs to increase accordingly. We may use derivative instruments to hedge our exposure to variable interest rates in the future. Our current exposure to interest rate fluctuations relates to the approximate
$223.1 million
gross amount of our outstanding indebtedness maturing in 2019 bearing interest at a rate of
3.66%
at
December 31, 2016
.
Based on the outstanding balance of our variable rate debt as of
December 31, 2016
, we estimate that if interest rates average 50 basis points higher or lower in 2017 than in 2016, our interest expense would change by approximately
$1.1 million
.
Foreign Currency Risk
Our cash flow derived from the Hardisty terminal is reported in the U.S. dollar equivalent of such amounts as denominated in Canadian dollars. Monetary assets and liabilities of our Canadian subsidiaries are translated to U.S. dollars using the applicable exchange rate as of the end of a reporting period. Revenues, expenses and cash flow are translated using the average exchange rate during the reporting period.
A significant amount of the cash flows we produce are derived from our Hardisty terminal operations in the province of Alberta, Canada. As a result, fluctuations in the exchange rates between the Canadian dollar and the U.S. dollar could have a significant effect on our results of operations, cash flows and financial position. The quarterly cash distributions we expect to make to our unitholders will be denominated in U.S. dollars, which are supported by cash flows we derive from our foreign and domestic subsidiaries. As such, a portion of the cash flow we expect to distribute will be subject to currency exchange rate fluctuations between U.S. dollars and Canadian dollars. For example, if the Canadian dollar weakens significantly relative to the U.S. dollar, exchanging the cash flows we derive from our Canadian subsidiaries for U.S. dollars could reduce the amount of cash we have available to distribute to our unitholders.
We use derivative financial instruments including futures, forwards, swaps, options, and other financial instruments with similar characteristics to minimize the impact of changes in the exchange rate between the U.S. dollar and the Canadian dollar. In June 2015, we entered into four separate collar arrangements with an aggregate notional value of
C$32.0 million
on the date executed, which used written call and purchased put options to limit the amount of loss or gain that we received upon converting the notional value to U.S. dollars. One of the collar arrangements settled at the end of each fiscal quarter during 2016 with a notional value ranging between
C$7.9 million
and
C$8.1 million
. These derivative contracts were executed to secure cash flows totaling
C$32.0 million
at an exchange rate range where a Canadian dollar is exchanged for an amount between
0.84
and
0.86
U.S. dollars.
In April 2016, we entered into four separate forward contracts with an aggregate notional amount of
C$33.5 million
to manage our exposure to fluctuations in the exchange rate between the Canadian dollar and the U.S. dollar resulting from our Canadian operations during the 2017 calendar year. Each forward contract effectively fixes the exchange rate we will receive for each Canadian dollar we sell to the counterparty. One of these forward contracts will settle at the end of each fiscal quarter during 2017 and secures an exchange rate where a Canadian dollar is exchanged for an amount between
0.7804
and
0.7809
U.S. dollars.
We have not designated these derivative financial instruments as hedges of our foreign currency rate exposures, but instead we mark these contracts to market value quarterly with the change in fair value recorded to "Gain associated with derivative instruments" in our consolidated statements of operations. The gains or losses associated with changes in the fair value of our foreign currency derivative contracts do not affect our cash flows until the underlying contract is settled by making or receiving a payment to or from the counterparty.
89
The following table presents summarized information about our outstanding foreign currency contracts at
December 31, 2016
:
|
Notional
|
Forward Rate
(1)
|
Market Price
(1)
|
Fair Value
|
|||||||||
|
(in thousands)
|
||||||||||||
|
Forward contracts maturing in 2017
|
||||||||||||
|
March 31, 2017
|
C$
|
8,300,000
|
|
0.7804
|
0.7444
|
$
|
299
|
|
||||
|
June 30, 2017
|
C$
|
8,400,000
|
|
0.7805
|
0.7453
|
296
|
|
|||||
|
September 29, 2017
|
C$
|
8,400,000
|
|
0.7807
|
0.7462
|
290
|
|
|||||
|
December 29, 2017
|
C$
|
8,400,000
|
|
0.7809
|
0.7473
|
282
|
|
|||||
|
Total
|
$
|
1,167
|
|
|||||||||
|
(1)
|
Forward rates and market prices are denoted in amounts where a Canadian dollar is exchanged for the indicated amount of U.S. dollars. The forward rate represents the rate we will receive upon settlement and the market price represents the rate we would expect to pay had the contract been settled on
December 31, 2016
.
|
90
INDEX TO CONSOLIDATED FINANCIAL STATEMENTS,
SUPPLEMENTARY INFORMATION AND
CONSOLIDATED FINANCIAL STATEMENT SCHEDULES
USD PARTNERS LP
|
Page
|
|
FINANCIAL STATEMENT SCHEDULES
Financial statement schedules not included in this report have been omitted because they are not applicable or the required information is either immaterial or shown in the consolidated financial statements or notes thereto.
91
Report of Independent Registered Public Accounting Firm
Board of Directors of USD Partners GP LLC, as General Partner of USD Partners LP and the Partners of
USD Partners LP
Houston, Texas
We have audited the accompanying consolidated balance sheets of USD Partners LP and its subsidiaries (the “Partnership”) as of December 31, 2016 and 2015, and the related consolidated statements of operations, comprehensive income (loss), partners’ capital, and cash flows for each of the three years in the period ended December 31, 2016. These consolidated financial statements are the responsibility of the Partnership’s management. Our responsibility is to express an opinion on these consolidated financial statements based on our audits.
We conducted our audits in accordance with the standards of the Public Company Accounting Oversight Board (United States). Those standards require that we plan and perform the audits to obtain reasonable assurance about whether the consolidated financial statements are free of material misstatement. The Partnership is not required to have, nor were we engaged to perform, an audit of its internal control over financial reporting. Our audits included consideration of internal control over financial reporting as a basis for designing audit procedures that are appropriate in the circumstances, but not for the purpose of expressing an opinion on the effectiveness of the Partnership’s internal control over financial reporting. Accordingly, we express no such opinion. An audit also includes examining, on a test basis, evidence supporting the amounts and disclosures in the consolidated financial statements, assessing the accounting principles used and significant estimates made by management, as well as evaluating the overall presentation of the consolidated financial statements. We believe that our audits provide a reasonable basis for our opinion.
In our opinion, the consolidated financial statements referred to above present fairly, in all material respects, the financial position of the Partnership at December 31, 2016 and 2015, and the results of its operations and its cash flows for each of the three years in the period ended December 31, 2016, in conformity with accounting principles generally accepted in the United States of America.
/s/ BDO USA, LLP
Houston, Texas
March 9, 2017
92
USD PARTNERS LP
|
For the Years Ended December 31,
|
|||||||||||
|
2016
|
2015
|
2014
|
|||||||||
|
(in thousands, except per unit amounts)
|
|||||||||||
|
Revenues
|
|||||||||||
|
Terminalling services
|
$
|
93,014
|
|
$
|
58,841
|
|
$
|
18,266
|
|
||
|
Terminalling services — related party
|
6,933
|
|
5,228
|
|
3,499
|
|
|||||
|
Railroad incentives
|
76
|
|
434
|
|
719
|
|
|||||
|
Fleet leases
|
2,577
|
|
7,710
|
|
8,788
|
|
|||||
|
Fleet leases — related party
|
3,560
|
|
4,123
|
|
—
|
|
|||||
|
Fleet services
|
1,084
|
|
622
|
|
720
|
|
|||||
|
Fleet services — related party
|
1,926
|
|
2,840
|
|
1,501
|
|
|||||
|
Freight and other reimbursables
|
1,955
|
|
1,880
|
|
2,141
|
|
|||||
|
Freight and other reimbursables — related party
|
—
|
|
85
|
|
464
|
|
|||||
|
Total revenues
|
111,125
|
|
81,763
|
|
36,098
|
|
|||||
|
Operating costs
|
|
||||||||||
|
Subcontracted rail services
|
8,077
|
|
7,710
|
|
6,994
|
|
|||||
|
Pipeline fees
|
20,799
|
|
17,249
|
|
3,625
|
|
|||||
|
Fleet leases
|
6,174
|
|
11,833
|
|
8,788
|
|
|||||
|
Freight and other reimbursables
|
1,955
|
|
1,965
|
|
2,605
|
|
|||||
|
Operating and maintenance
|
2,962
|
|
2,062
|
|
2,124
|
|
|||||
|
Selling, general and administrative
|
9,658
|
|
7,673
|
|
4,781
|
|
|||||
|
Selling, general and administrative — related party
|
5,768
|
|
4,707
|
|
3,903
|
|
|||||
|
Depreciation and amortization
|
23,092
|
|
6,110
|
|
2,631
|
|
|||||
|
Total operating costs
|
78,485
|
|
59,309
|
|
35,451
|
|
|||||
|
Operating income
|
32,640
|
|
22,454
|
|
647
|
|
|||||
|
Interest expense, net
|
9,837
|
|
4,368
|
|
4,825
|
|
|||||
|
Loss (gain) associated with derivative instruments
|
140
|
|
(5,161
|
)
|
(1,536
|
)
|
|||||
|
Foreign currency transaction loss (gain)
|
(750
|
)
|
(201
|
)
|
4,850
|
|
|||||
|
Income (loss) before provision for income taxes
|
23,413
|
|
23,448
|
|
(7,492
|
)
|
|||||
|
Provision for (benefit from) income taxes
|
(759
|
)
|
5,755
|
|
186
|
|
|||||
|
Net income (loss)
|
$
|
24,172
|
|
$
|
17,693
|
|
$
|
(7,678
|
)
|
||
|
Less: Predecessor loss prior to the initial public offering (from January 1, 2014 through October 14, 2014)
|
|
(7,206
|
)
|
||||||||
|
Net loss attributable to general and limited partner interests in USD Partners LP subsequent to the initial public offering (from October 15, 2014 through December 31, 2014)
|
|
$
|
(472
|
)
|
|||||||
|
Net income (loss) attributable to limited partner interest
|
$
|
23,690
|
|
$
|
17,339
|
|
$
|
(7,524
|
)
|
||
|
Net income (loss) per common unit (basic and diluted) (Note 3)
|
$
|
1.06
|
|
$
|
0.83
|
|
$
|
(0.29
|
)
|
||
|
Weighted average common units outstanding
|
13,867
|
|
10,427
|
|
3,042
|
|
|||||
|
Net income (loss) per subordinated unit (basic and diluted) (Note 3)
|
$
|
1.02
|
|
$
|
0.82
|
|
$
|
(0.63
|
)
|
||
|
Weighted average subordinated units outstanding
|
8,668
|
|
10,464
|
|
10,464
|
|
|||||
The accompanying notes are an integral part of these consolidated financial statements.
93
USD PARTNERS LP
CONSOLIDATED STATEMENTS OF COMPREHENSIVE INCOME (LOSS)
|
For the Years Ended December 31,
|
|||||||||||
|
2016
|
2015
|
2014
|
|||||||||
|
(in thousands)
|
|||||||||||
|
Net income (loss)
|
$
|
24,172
|
|
$
|
17,693
|
|
$
|
(7,678
|
)
|
||
|
Other comprehensive income (loss) — foreign currency translation
|
(1,019
|
)
|
(120
|
)
|
1,382
|
|
|||||
|
Comprehensive income (loss)
|
$
|
23,153
|
|
$
|
17,573
|
|
$
|
(6,296
|
)
|
||
The accompanying notes are an integral part of these consolidated financial statements.
94
USD PARTNERS LP
|
For the Years Ended December 31,
|
|||||||||||
|
2016
|
2015
|
2014
|
|||||||||
|
(in thousands)
|
|||||||||||
|
Cash flows from operating activities:
|
|
|
|||||||||
|
Net income (loss)
|
$
|
24,172
|
|
$
|
17,693
|
|
$
|
(7,678
|
)
|
||
|
Adjustments to reconcile net income (loss) to net cash provided by (used in)operating activities:
|
|||||||||||
|
Depreciation and amortization
|
23,092
|
|
6,110
|
|
2,631
|
|
|||||
|
Loss (gain) associated with derivative instruments
|
140
|
|
(5,161
|
)
|
(1,536
|
)
|
|||||
|
Settlement of derivative contracts
|
2,399
|
|
4,283
|
|
344
|
|
|||||
|
Bad debt expense
|
—
|
|
—
|
|
1,424
|
|
|||||
|
Amortization of deferred financing costs
|
861
|
|
659
|
|
1,056
|
|
|||||
|
Unit based compensation expense
|
4,074
|
|
2,461
|
|
550
|
|
|||||
|
Deferred income taxes
|
46
|
|
814
|
|
—
|
|
|||||
|
Changes in operating assets and liabilities, net of acquisitions:
|
|||||||||||
|
Accounts receivable
|
79
|
|
1,647
|
|
(4,264
|
)
|
|||||
|
Accounts receivable — related party
|
1,750
|
|
(1,805
|
)
|
268
|
|
|||||
|
Prepaid expenses and other current assets
|
30
|
|
(572
|
)
|
(4,515
|
)
|
|||||
|
Accounts payable and accrued expenses
|
(1,897
|
)
|
(336
|
)
|
(1,880
|
)
|
|||||
|
Accounts payable and accrued expenses — related party
|
(20
|
)
|
(544
|
)
|
(492
|
)
|
|||||
|
Deferred revenue and other liabilities
|
1,854
|
|
9,500
|
|
17,497
|
|
|||||
|
Deferred revenue — related party
|
(2,850
|
)
|
585
|
|
—
|
|
|||||
|
Change in restricted cash
|
(654
|
)
|
870
|
|
(6,490
|
)
|
|||||
|
Net cash provided by (used in) operating activities
|
53,076
|
|
36,204
|
|
(3,085
|
)
|
|||||
|
Cash flows from investing activities:
|
|||||||||||
|
Additions of property and equipment
|
(474
|
)
|
(1,671
|
)
|
(33,736
|
)
|
|||||
|
Proceeds from settlement of purchase price
|
381
|
|
—
|
|
—
|
|
|||||
|
Acquisitions, net of cash received
|
—
|
|
(210,445
|
)
|
—
|
|
|||||
|
Purchase of derivative contracts
|
—
|
|
(1,167
|
)
|
(468
|
)
|
|||||
|
Net cash used in investing activities
|
(93
|
)
|
(213,283
|
)
|
(34,204
|
)
|
|||||
|
Cash flows from financing activities:
|
|||||||||||
|
Payments on BOK credit facility
|
—
|
|
—
|
|
(97,845
|
)
|
|||||
|
Proceeds from borrowings on BOK credit facility
|
—
|
|
—
|
|
67,845
|
|
|||||
|
Payments for deferred financing costs
|
—
|
|
(854
|
)
|
(3,909
|
)
|
|||||
|
Contributions
|
—
|
|
—
|
|
14,329
|
|
|||||
|
Distributions
|
(29,665
|
)
|
(24,032
|
)
|
(107,828
|
)
|
|||||
|
Vested phantom units used for payment of participant taxes
|
(77
|
)
|
—
|
|
—
|
|
|||||
|
Proceeds from issuance of units
|
—
|
|
335
|
|
—
|
|
|||||
|
Proceeds from long-term debt
|
20,000
|
|
203,000
|
|
100,000
|
|
|||||
|
Repayment of long-term debt
|
(41,556
|
)
|
(30,492
|
)
|
(14,992
|
)
|
|||||
|
Net proceeds from the initial public offering
|
—
|
|
—
|
|
137,495
|
|
|||||
|
Repayment of loan from parent
|
—
|
|
—
|
|
(49,390
|
)
|
|||||
|
Net cash provided by (used in) financing activities
|
(51,298
|
)
|
147,957
|
|
45,705
|
|
|||||
|
Cash flows from discontinued operations:
|
|||||||||||
|
Net cash provided by investing activities
|
—
|
|
—
|
|
29,473
|
|
|||||
|
Net cash used in financing activities
|
—
|
|
—
|
|
(5,232
|
)
|
|||||
|
Net cash provided by discontinued operations
|
—
|
|
—
|
|
24,241
|
|
|||||
|
Effect of exchange rates on cash
|
(480
|
)
|
(627
|
)
|
1,441
|
|
|||||
|
Net change in cash and cash equivalents
|
1,205
|
|
(29,749
|
)
|
34,098
|
|
|||||
|
Cash and cash equivalents — beginning of year
|
10,500
|
|
40,249
|
|
6,151
|
|
|||||
|
Cash and cash equivalents — end of year
|
$
|
11,705
|
|
$
|
10,500
|
|
$
|
40,249
|
|
||
The accompanying notes are an integral part of these consolidated financial statements.
95
USD PARTNERS LP
|
December 31,
|
|||||||
|
2016
|
2015
|
||||||
|
(in thousands)
|
|||||||
|
ASSETS
|
|
|
|||||
|
Current assets
|
|||||||
|
Cash and cash equivalents
|
$
|
11,705
|
|
$
|
10,500
|
|
|
|
Restricted cash
|
5,433
|
|
4,640
|
|
|||
|
Accounts receivable, net
|
4,321
|
|
4,333
|
|
|||
|
Accounts receivable — related party
|
219
|
|
1,889
|
|
|||
|
Prepaid expenses
|
10,325
|
|
10,191
|
|
|||
|
Other current assets
|
2,562
|
|
3,908
|
|
|||
|
Total current assets
|
34,565
|
|
35,461
|
|
|||
|
Property and equipment, net
|
125,702
|
|
133,010
|
|
|||
|
Intangible assets, net
|
111,919
|
|
124,581
|
|
|||
|
Goodwill
|
33,589
|
|
33,970
|
|
|||
|
Other non-current assets
|
192
|
|
1,376
|
|
|||
|
Total assets
|
$
|
305,967
|
|
$
|
328,398
|
|
|
|
LIABILITIES AND PARTNERS’ CAPITAL
|
|||||||
|
Current liabilities
|
|||||||
|
Accounts payable and accrued expenses
|
$
|
2,221
|
|
$
|
4,092
|
|
|
|
Accounts payable and accrued expenses — related party
|
214
|
|
232
|
|
|||
|
Deferred revenue, current portion
|
26,928
|
|
22,158
|
|
|||
|
Deferred revenue, current portion — related party
|
4,292
|
|
5,485
|
|
|||
|
Other current liabilities
|
3,513
|
|
2,914
|
|
|||
|
Total current liabilities
|
37,168
|
|
34,881
|
|
|||
|
Long-term debt, net
|
220,894
|
|
239,444
|
|
|||
|
Deferred revenue, net of current portion
|
264
|
|
2,022
|
|
|||
|
Deferred revenue, net of current portion — related party
|
—
|
|
1,542
|
|
|||
|
Deferred income tax liability, net
|
823
|
|
749
|
|
|||
|
Total liabilities
|
259,149
|
|
278,638
|
|
|||
|
Commitments and contingencies (Note 14)
|
|
|
|||||
|
Partners’ capital
|
|||||||
|
Common units (14,185,599 authorized and issued at December 31, 2016 and 11,947,127 authorized and issued at December 31, 2015)
|
122,802
|
|
141,374
|
|
|||
|
Class A units (250,000 authorized, 138,750 issued at December 31, 2016 and 185,000 issued at December 31, 2015)
|
1,811
|
|
1,749
|
|
|||
|
Subordinated units (10,463,545 authorized, 8,370,836 issued at December 31, 2016 and 10,463,545 issued at December 31, 2015)
|
(76,749
|
)
|
(93,445
|
)
|
|||
|
General partner units (461,136 authorized and issued at December 31, 2016 and 2015)
|
111
|
|
220
|
|
|||
|
Accumulated other comprehensive loss
|
(1,157
|
)
|
(138
|
)
|
|||
|
Total partners' capital
|
46,818
|
|
49,760
|
|
|||
|
Total liabilities and partners' capital
|
$
|
305,967
|
|
$
|
328,398
|
|
|
The accompanying notes are an integral part of these consolidated financial statements.
96
USD PARTNERS LP
CONSOLIDATED STATEMENTS OF PARTNERS' CAPITAL
|
For the Years Ended December 31,
|
||||||||||||||||||||
|
2016
|
2015
|
2014
|
||||||||||||||||||
|
Units
|
Amount
|
Units
|
Amount
|
Units
|
Amount
|
|||||||||||||||
|
(in thousands, except unit amounts)
|
||||||||||||||||||||
|
Common units
|
||||||||||||||||||||
|
Beginning balance
|
11,947,127
|
|
$
|
141,374
|
|
10,213,545
|
|
$
|
127,865
|
|
—
|
|
$
|
—
|
|
|||||
|
Units issued
|
—
|
|
—
|
|
1,733,582
|
|
15,325
|
|
—
|
|
—
|
|
||||||||
|
Allocation of partnership interests
|
—
|
|
—
|
|
—
|
|
—
|
|
1,093,545
|
|
60
|
|
||||||||
|
Proceeds from IPO
|
—
|
|
—
|
|
—
|
|
—
|
|
9,120,000
|
|
137,495
|
|
||||||||
|
Conversion of units
|
2,138,959
|
|
(18,300
|
)
|
—
|
|
—
|
|
—
|
|
—
|
|
||||||||
|
Common units issued for vested phantom units
|
99,513
|
|
(77
|
)
|
—
|
|
—
|
|
—
|
|
—
|
|
||||||||
|
Net income (loss)
|
—
|
|
14,644
|
|
—
|
|
8,605
|
|
—
|
|
(228
|
)
|
||||||||
|
Unit based compensation expense
|
—
|
|
2,670
|
|
—
|
|
1,109
|
|
—
|
|
—
|
|
||||||||
|
Distributions
|
—
|
|
(17,509
|
)
|
—
|
|
(11,530
|
)
|
—
|
|
(9,462
|
)
|
||||||||
|
Ending balance
|
14,185,599
|
|
122,802
|
|
11,947,127
|
|
141,374
|
|
10,213,545
|
|
127,865
|
|
||||||||
|
Class A units
|
||||||||||||||||||||
|
Beginning balance
|
185,000
|
|
1,749
|
|
220,000
|
|
550
|
|
—
|
|
—
|
|
||||||||
|
Units issued
|
—
|
|
—
|
|
—
|
|
—
|
|
250,000
|
|
—
|
|
||||||||
|
Conversion of units
|
(46,250
|
)
|
(871
|
)
|
—
|
|
—
|
|
—
|
|
—
|
|
||||||||
|
Net income
|
—
|
|
148
|
|
—
|
|
153
|
|
—
|
|
—
|
|
||||||||
|
Unit based compensation expense
|
—
|
|
977
|
|
—
|
|
1,500
|
|
—
|
|
550
|
|
||||||||
|
Forfeited units
|
—
|
|
—
|
|
(35,000
|
)
|
(245
|
)
|
(30,000
|
)
|
—
|
|
||||||||
|
Distributions
|
—
|
|
(192
|
)
|
—
|
|
(209
|
)
|
—
|
|
—
|
|
||||||||
|
Ending balance
|
138,750
|
|
1,811
|
|
185,000
|
|
1,749
|
|
220,000
|
|
550
|
|
||||||||
|
Subordinated units
|
||||||||||||||||||||
|
Beginning balance
|
10,463,545
|
|
(93,445
|
)
|
10,463,545
|
|
(90,214
|
)
|
—
|
|
—
|
|
||||||||
|
Allocation of partnership interests
|
—
|
|
—
|
|
—
|
|
—
|
|
10,463,545
|
|
558
|
|
||||||||
|
Conversion of units
|
(2,092,709
|
)
|
19,171
|
|
—
|
|
—
|
|
—
|
|
—
|
|
||||||||
|
Net income (loss)
|
—
|
|
8,898
|
|
—
|
|
8,581
|
|
—
|
|
(234
|
)
|
||||||||
|
Distributions
|
—
|
|
(11,373
|
)
|
—
|
|
(11,812
|
)
|
—
|
|
(90,538
|
)
|
||||||||
|
Ending balance
|
8,370,836
|
|
(76,749
|
)
|
10,463,545
|
|
(93,445
|
)
|
10,463,545
|
|
(90,214
|
)
|
||||||||
|
General Partner
|
||||||||||||||||||||
|
Beginning balance
|
461,136
|
|
220
|
|
427,083
|
|
12
|
|
—
|
|
—
|
|
||||||||
|
Units issued
|
—
|
|
—
|
|
34,053
|
|
335
|
|
—
|
|
—
|
|
||||||||
|
Allocation of partnership interests
|
—
|
|
—
|
|
—
|
|
—
|
|
427,083
|
|
22
|
|
||||||||
|
Net income (loss)
|
—
|
|
482
|
|
—
|
|
354
|
|
—
|
|
(10
|
)
|
||||||||
|
Distributions
|
—
|
|
(591
|
)
|
—
|
|
(481
|
)
|
—
|
|
—
|
|
||||||||
|
Ending balance
|
461,136
|
|
111
|
|
461,136
|
|
220
|
|
427,083
|
|
12
|
|
||||||||
|
Predecessor Partner Interest
|
||||||||||||||||||||
|
Beginning balance
|
—
|
|
—
|
|
4,003
|
|
||||||||||||||
|
Net loss
|
—
|
|
—
|
|
(7,206
|
)
|
||||||||||||||
|
Contribution
|
—
|
|
—
|
|
14,233
|
|
||||||||||||||
|
Distributions
|
—
|
|
—
|
|
(7,831
|
)
|
||||||||||||||
|
Allocation of partnership interests
|
—
|
|
—
|
|
(3,199
|
)
|
||||||||||||||
|
Ending balance
|
—
|
|
—
|
|
—
|
|
||||||||||||||
|
Accumulated other comprehensive income (loss)
|
||||||||||||||||||||
|
Beginning balance
|
(138
|
)
|
(18
|
)
|
(1,400
|
)
|
||||||||||||||
|
Cumulative translation adjustment
|
(1,019
|
)
|
(120
|
)
|
1,382
|
|
||||||||||||||
|
Ending balance
|
(1,157
|
)
|
(138
|
)
|
(18
|
)
|
||||||||||||||
|
Total partners’ capital at December 31,
|
$
|
46,818
|
|
$
|
49,760
|
|
$
|
38,195
|
|
|||||||||||
The accompanying notes are an integral part of these consolidated financial statements.
97
USD PARTNERS LP
NOTES TO THE CONSOLIDATED FINANCIAL STATEMENTS
1. ORGANIZATION AND DESCRIPTION OF BUSINESS
General
USD Partners LP and its consolidated subsidiaries, collectively referred to herein as we, us, our, the Partnership and USDP, is a fee-based, growth-oriented master limited partnership formed in 2014 by US Development Group LLC, or USD, through its wholly-owned subsidiary USD Group LLC, or USDG. We were formed to acquire, develop and operate energy-related logistics assets, including rail terminals and other high-quality and complementary midstream infrastructure. We generate substantially all of our operating cash flows from multi-year, take-or-pay contracts for crude oil terminalling services, such as railcar loading for transportation to end markets, storage and blending in on-site tanks, as well as related logistics services. In addition, we provide our customers with railcars and fleet services related to the transportation of liquid hydrocarbons and biofuels by rail under multi-year, take-or-pay contracts. We do not take ownership of the products that we handle nor do we receive any payments from our customers based on the value of such products. Our common units are traded on the New York Stock Exchange, or NYSE, under the symbol USDP.
From the time of our formation in June 2014, through the completion of our initial public offering in October 2014, our capital accounts included an approximate
2.0%
general partner interest held by USD Partners GP LLC, a wholly-owned subsidiary of USDG, while all of our limited partner interests were held by USDG.
Our capital accounts were distributed as follows at the specified dates:
|
December 31,
|
||||||
|
2016
|
2015
|
|||||
|
Common units held by the Public
|
47.5
|
%
|
47.1
|
%
|
||
|
Common units held by USDG
|
13.8
|
%
|
4.7
|
%
|
||
|
Subordinated units held by USDG
|
36.1
|
%
|
45.4
|
%
|
||
|
Class A units held by management
|
0.6
|
%
|
0.8
|
%
|
||
|
General partner interest held by USD Partners GP LLC
|
2.0
|
%
|
2.0
|
%
|
||
|
100.0
|
%
|
100.0
|
%
|
|||
Initial Public Offering
In October 2014, we completed the initial public offering, or IPO, of
9,120,000
of our common units for proceeds of approximately
$145 million
after underwriting discounts, commissions and structuring fees. On the same date, we entered into a
five
year senior secured credit agreement with a consortium of lenders with an aggregate capacity of
$300 million
comprised of a
$200 million
revolving credit facility and a
$100 million
term loan. The term loan facility was used to fund a
$100 million
distribution to USDG and is guaranteed by USDG. We also completed other transactions in connection with the closing of our IPO pursuant to which USDG conveyed to us its ownership interests in each of its subsidiaries that own or operate the Hardisty, San Antonio and West Colton terminals and the railcar business. In exchange for these ownership interests, we: (1) issued to USDG
1,093,545
of our common units and all
10,463,545
of our subordinated units (2) assumed
$30 million
of borrowings under a senior secured credit agreement payable to Bank of Oklahoma and (3) granted USDG the right to receive
$100 million
. Additionally, we issued to our general partner
427,083
General Partner Units, representing a
2.0%
general partner interest in us, as well as all of our incentive distribution rights, or IDRs.
In contemplation of the IPO of our common units, the board of directors of our general partner granted
250,000
Class A units, representing limited partner interests in USDP, to key employees in August 2014. The awards issued are performance-based awards that contain distribution equivalent rights, or DERs. We determined the grant date of these awards, as defined within the relevant accounting guidance, to be the day on which the IPO was effective, or
98
October 8, 2014. Assuming certain conditions are met, Class A units become eligible to convert into common units in
four
equal tranches beginning no earlier than January 1, 2016, at a conversion factor ranging from
1.0
to
2.0
.
Unless the context otherwise requires, references to the Predecessor, we, our, us or like terms, when used in a historical context (periods prior to October 15, 2014), refer to the following subsidiaries, collectively, that were contributed to the Partnership in connection with our IPO: San Antonio Rail Terminal LLC, or SART, USD Logistics Operations GP LLC, USD Logistics Operations LP, USD Rail LP, USD Rail Canada ULC, USD Terminals Canada ULC, or USDTC, West Colton Rail Terminal LLC, or WCRT, USD Terminals International S.A.R.L., and USD Rail International S.A.R.L., collectively referred to as the Contributed Subsidiaries. The Predecessor also includes the membership interests in the following
five
subsidiaries of USD which operated crude oil rail terminals that were sold in December 2012 (the "Sale") to a large energy transportation, terminalling and pipeline company, referred to as the Acquirer: Bakersfield Crude Terminal LLC, Eagle Ford Crude Terminal LLC, Niobrara Crude Terminal LLC, St. James Rail Terminal LLC, or SJRT, and Van Hook Crude Terminal LLC, collectively known as the Discontinued Operations. As a result of the Sale, another subsidiary, USD Services LLC, or USDS, ceased operations and is also included in the results of Discontinued Operations. Refer to
Note 22 — Discontinued Operations
for additional details.
Casper Terminal Acquisition
In November 2015, we completed our acquisition of all of the membership interests of Casper Crude to Rail, LLC, or the Casper terminal, from Casper Crude to Rail Holdings, LLC for approximately
$225.8 million
. The Casper crude oil terminal, located in Casper, Wyoming, primarily consists of unit train-capable railcar loading capacity in excess of
100,000
barrel per day,
six
customer-dedicated storage tanks with
900,000
barrels of total capacity and a
six
-mile,
24
-inch diameter pipeline with a direct connection from Spectra Energy Partners' Express Pipeline. Refer to
Note 4 - Casper Terminal Acquisition
for additional details regarding this acquisition.
US Development Group LLC
USD and its affiliates are engaged in designing, developing, owning and managing large-scale multi-modal logistics centers and energy-related infrastructure assets across North America. USD is the indirect owner of USDG and our general partner and is currently owned by Energy Capital Partners, Goldman Sachs and certain of USD's management team members.
2. SUMMARY OF SIGNIFICANT ACCOUNTING POLICIES
Basis of Presentation and Use of Estimates
We prepare our consolidated financial statements in accordance with accounting principles generally accepted in the United States of America, or GAAP. Our preparation of these consolidated financial statements requires us to make estimates and assumptions that affect the reported amounts of assets, liabilities, and the disclosure of contingent assets and liabilities at the date of the financial statements and the reported amounts of revenues and expenses during the reporting period. We regularly evaluate these estimates utilizing historical experience, consultation with experts and other methods we consider reasonable in the circumstances. Nevertheless, actual results may differ from these estimates. We record the effect of any revisions to these estimates in our consolidated financial statements in the period in which the facts that give rise to the revision become known. Significant estimates we make include, but are not limited to, the estimated lives of depreciable property and equipment, recoverability of long-lived assets, the allowance for doubtful accounts, the amounts of deferred revenue and related prepaid pipeline fees.
Change in Reporting Entity
Prior to the completion of our IPO in October 2014, our financial position, results of operations and cash flows consisted of the Predecessor, which represented a combined reporting entity. Subsequent to the IPO, our financial position, results of operations and cash flows consist of our consolidated activities and balances. The assets and liabilities in our consolidated financial statements have been reflected on a historical cost basis, as prior to the IPO all of the assets and liabilities presented were wholly-owned by USDG and its affiliates and were transferred within the USDG consolidated group.
99
The consolidated statements of operations for periods prior to the IPO included expense allocations for certain corporate functions historically provided by USDG, including, but not limited to, general corporate expenses related to finance, legal, information technology, human resources, communications, insurance, utilities and executive compensation. Those allocations were based primarily on direct usage when identifiable, budgeted volumes or projected revenues, the remainder was allocated evenly across the number of operating entities. The consolidated statements of operations for periods prior to the IPO include amounts allocated to the Predecessor for general corporate expenses incurred by USDG within "Selling, general and administrative." Management considers the basis on which the expenses have been allocated to reasonably reflect the utilization of services provided to or for the benefit received by the Predecessor during the periods presented prior to the IPO. The allocations may not, however, reflect the expenses the Predecessor would have incurred as an independent company for the periods presented prior to the IPO. Actual costs that may have been incurred if the Predecessor had been a standalone entity would depend on a number of factors, including the organizational structure, whether functions were outsourced or performed by employees and strategic decisions made in areas such as information technology and infrastructure. The Predecessor is unable to determine what such costs would have been had the Predecessor been independent prior to the IPO. Effective with the IPO, our general partner and its affiliates provide services to us pursuant to an omnibus agreement and a service agreement between the parties. The allocations and related estimates and assumptions are described more fully in
Note 13 — Transactions with Related Parties
.
Principles of Consolidation
The consolidated financial statements include our accounts and those of our wholly-owned subsidiaries on a consolidated basis. All significant intercompany accounts and transactions have been eliminated in consolidation. We consolidate the accounts of entities over which we have a controlling financial interest through our ownership of the general partner or the majority voting interests of the entity.
Comparative Amounts
We have made certain reclassifications to the amounts reported in the prior year financial statements to conform with the current year presentation. None of these reclassifications have an impact on our operating results, cash flows or financial position.
Foreign Currency
A substantial portion of our operations are conducted in Canada and are accounted for in the local currency, the Canadian dollar, which we translate into our reporting currency, the U.S. dollar. We translate most Canadian dollar denominated balance sheet accounts at the end of period exchange rate, while most income statement accounts are translated based on the average exchange rate for each monthly period. Fluctuations in the exchange rates between the Canadian dollar and the U.S. dollar can create variability in the amounts we translate and report in U.S. dollars.
Within these consolidated financial statements, we denote amounts denominated in Canadian dollars with "C$" immediately prior to the stated amount.
Revenue Recognition
We derive our revenues from railcar loading and unloading services for bulk liquid products, including crude oil, biofuels, and related products, as well as sourcing railcar fleets and related logistics and maintenance services. We recognize revenue when persuasive evidence of an arrangement exists, delivery has occurred or services have been performed, the buyer’s price is fixed or determinable and collectability is reasonably assured. In accordance with the applicable accounting guidance, we record revenues for fleet leases on a gross basis, since we are deemed the primary obligor for the services. We also recognize as revenue on our consolidated statements of operations in "Freight and other reimbursables," on a gross basis, the amounts we charge to our customers for the out-of-pocket expenses we have incurred to provide our railcar fleet services.
We recognize revenue for terminalling services we provide based upon the contractual rates set forth in our agreements related to throughput volumes. Substantially all of the capacity at our Casper and Hardisty terminals is contracted under multi-year agreements that contain “take-or-pay” provisions where we are entitled to payment from
100
our customer of a minimum monthly commitment fee, regardless of whether the specified throughput to which the customer committed is achieved. These agreements grant the customers make-up rights that allow them to load volumes in excess of their minimum monthly commitment in future periods, without additional charge, to the extent capacity is available for the excess volume. With respect to the Casper terminal, the make-up rights generally expire within the three-month period, representing a calendar quarter, for which the volumes were originally committed. With respect to the Hardisty terminal, the make-up rights typically expire, if unused, in subsequent periods up to six months following the period for which the volumes were originally committed. We defer recognition of the revenue associated with volumes that are below the minimum monthly commitments until the earlier of (1) the period in which the throughput is utilized, (2) the customer’s ability to make up the minimum volume has expired in accordance with the terms of the agreements, or (3) we determine that the likelihood that the customer will be able to make up the minimum volume is remote.
We recognize revenue for fleet leases and related party administrative services ratably over the contract period. Revenue for reimbursable costs is recognized as the costs are incurred. We have deferred revenues for amounts collected in advance from customers in our Fleet services segment, which will be recognized as revenue as the underlying services are performed pursuant to the terms of our contracts. We have prepaid rent associated with these deferred revenues on our railcar leases, which we will recognize as expense as these railcars are used.
In December 2013, USDTC entered into a binding agreement with a major railway transportation company, which we refer to as the "Railway," effective with the commencement of the Hardisty terminal operations in June 2014, whereby in consideration for the Railway being the sole rail freight transportation service provider at the Hardisty terminal for certain customers, the Railway agreed to pay USDTC an average incentive payment amount of C
$100
per railcar shipped up to a maximum of C
$12.5 million
through mid-2017. We recognize these revenues in "Railroad incentives" in our consolidated statements of operations as railcars utilize the services of the Railway pursuant to the terms of the agreement.
Income Taxes
We are not a taxable entity for U.S. federal income tax purposes, or for a majority of the states that impose an income tax. Taxes on our net income are generally borne by our unitholders through the allocation of taxable income, except for USD Rail LP, which, in October 2014, elected to be classified as an entity taxable as a corporation. Our income tax expense is predominantly attributable to Canadian federal and provincial income taxes imposed on our operations based in Canada. Additionally, we are subject to state income tax laws that apply to entities organized as partnerships by the State of Texas. This state income tax is computed on our modified gross margin, which we have determined to be an income tax as set forth in the authoritative accounting guidance. Our current and historical provision for income taxes also reflects income taxes associated with USD Rail LP.
We recognize deferred income tax assets and liabilities for temporary differences between the relevant basis of our assets and liabilities for financial reporting and tax purposes. We record the impact of changes in tax legislation on deferred income tax assets and liabilities in the period the legislation is enacted.
Pursuant to the authoritative accounting guidance regarding uncertain tax positions, we recognize the tax effects of any uncertain tax position as the largest amount that will more likely than not be realized upon ultimate settlement with the taxing authority having full knowledge of the position and all relevant facts. Under this criterion, we evaluate the most likely resolution of an uncertain tax position based on its technical merits and on the outcome that we expect would likely be sustained under examination.
Our policy is to recognize any interest or penalties related to the underpayment of income taxes as a component of income tax expense or benefit. We have not historically incurred any significant interest or penalties for the underpayment of income taxes.
Net income for financial statement purposes may differ significantly from the taxable income we allocate to our unitholders as a result of differences between the tax basis and financial reporting basis of assets and liabilities and the taxable income allocation requirements set forth in our partnership agreement. The aggregate difference in the basis
101
of our net assets for financial and tax reporting purposes cannot be readily determined because information regarding each partner’s tax attributes in us is not available.
Cash and Cash Equivalents
Cash and cash equivalents consist of all unrestricted demand deposits and funds invested in highly liquid instruments with original maturities of three months or less. We periodically assess the financial condition of the financial institutions where these funds are held and believe that our credit risk is minimal.
Accounts Receivable
Accounts receivable consist of billed and unbilled amounts due from our customers, which include crude oil producing and petroleum refining companies, as well as marketers of petroleum, petroleum products and biofuels, for services we have provided. We perform ongoing credit evaluations of our customers. When appropriate, we use the specific identification method to estimate allowances for doubtful accounts based on our customers’ financial condition and collection history, as well as other pertinent factors. Accounts are written-off against the allowance for doubtful accounts when significantly past due and we have deemed the amounts uncollectible.
Capitalization Policies and Depreciation Methods
We record property and equipment at its original cost, which we depreciate on a straight-line basis over the estimated useful lives of the assets, which range from
five
to
20 years
. Our determination of the useful lives of property and equipment requires us to make various assumptions when the assets are acquired or placed into service about the expected usage, normal wear and tear and the extent and frequency of maintenance programs. Expenditures for repairs and maintenance are charged to expense as incurred, while improvements that extend the service life or capacity of existing property and equipment are capitalized. Upon the sale or retirement of an asset, the related costs and accumulated depreciation are removed from the accounts and any gain or loss is recognized in our operating results.
During construction we capitalize direct costs, such as labor, materials and overhead, as well as interest cost we may incur on indebtedness at our incremental borrowing rate.
Asset Retirement Obligations
We record a liability for the fair value of asset retirement obligations and conditional asset retirement obligations that we can reasonably estimate. We collectively refer to asset retirement obligations and conditional asset retirement obligations as ARO. Typically, we record an ARO at the time an asset is constructed or acquired, if a reasonable estimate of fair value can be made. In connection with establishing an ARO, we capitalize the expected costs as part of the carrying value of the related assets. We recognize any ongoing expense for the accretion component of the liability resulting from changes in value of the ARO due to the passage of time as part of accretion expense. We depreciate the initial capitalized cost over the useful lives of the related assets. We extinguish the liabilities for an ARO when assets are taken out of service or otherwise abandoned.
Legal obligations exist for our SART and WCRT facilities due to terms within our lease agreements with the lessor that require us to remove our facilities at final abandonment. We generally own the land on which our Casper and Hardisty terminals and related facilities reside and as a result, similar legal obligations generally do not exist that would require us to remove our Casper and Hardisty facilities at final abandonment. However, a portion of the Casper terminal is on land that is leased, where the lessor has the option to either purchase the facilities from us at salvage value, or to require us to remove our facilities at the termination of the lease and restore the land to its original condition. We have recognized an asset retirement obligation for our SART facility in the amount of
$1.0 million
at
December 31, 2016
, representing the costs we expect to incur at final abandonment following the contract termination on May 1, 2017. The WCRT operates in a geographical and regulatory environment significantly different from that of SART and has unique operating characteristics that make determination of the economic life of the asset coupled with the methods of settlement necessary for estimating the fair value of the ARO related to this facility impracticable. With respect to the Casper terminal, we cannot reasonably estimate the timing, or determine the method that the lessor will elect with regard to the action we will be required to take at the termination of the lease. In each of these cases, the asset retirement obligation cost is considered indeterminate because there is limited data or information that can be
102
derived from past practice, industry practice, our intentions or the estimated economic life of the asset. Useful lives of our terminal facilities are primarily derived from available supply resources and ultimate consumption of those resources by end users. Many variables can affect the remaining lives of the assets, which preclude us from making a reasonable estimate of the ARO. We will recognize the fair value of an ARO for the Casper terminal and WCRT facilities in the periods in which sufficient information exists that will allow us to reasonably estimate potential settlement dates and methods.
Impairment of Long-lived Assets
We evaluate our long-lived assets for impairment whenever events or changes in circumstances indicate the carrying amount of an asset may not be recoverable. We consider a long-lived asset to be impaired when the sum of the estimated, undiscounted future cash flows from the use of the asset and its eventual disposition is less than the carrying amount of the asset. Factors that indicate potential impairment include economic obsolescence, the business climate, legal matters, a significant decrease in operating income or cash flows associated with the use of the asset and a significant change in the asset’s physical condition or use. Our estimates of future undiscounted cash flows take into account possible outcomes and probabilities of their occurrence when alternative courses of action to recover the carrying amount of a long-lived asset are under consideration. We recognize an impairment loss to the extent the carrying value exceeds the estimated fair value of the long-lived asset following our determination that the carrying amount of a long-lived asset is not recoverable based on the estimated future undiscounted cash flows.
We determined the assets of our San Antonio terminal were impaired at
December 31, 2016
, as discussed in more detail
in
Note 7 — Property and Equipment
, following our decision in early
2017
to wind down these operations at the conclusion of our terminalling services agreement with a customer that was extended to
May 1, 2017.
Intangible Assets
Our intangible assets primarily consist of customer contracts. We amortize these assets on a straight-line basis over the weighted average useful lives of the underlying assets, representing the period over which the assets are expected to contribute directly or indirectly to our future cash flows.
Goodwill
Goodwill represents the future economic benefits arising from other assets acquired in a business combination that are not individually identified and separately recognized. The goodwill reflected in our consolidated balance sheet arose in connection with our acquisition of the Casper terminal in November 2015 and is allocated to our Terminalling services segment.
We test goodwill for impairment annually based on the carrying values of our reporting units on the first day of the third quarter of each year, or more frequently if impairment indicators arise that suggest the carrying value of goodwill may be impaired. In testing goodwill for impairment, we make critical assumptions that include but are not limited to:
|
(1)
|
projections of future financial performance, which includes contract renewal expectations;
|
|
(2)
|
market weighted average cost of capital;
|
|
(3)
|
EBITDA multiples derived from stock prices of public companies with similar operating and investment characteristics; and
|
|
(4)
|
EBITDA multiples for transactions based on actual sales and purchases of comparable businesses.
|
We recognize an impairment loss when the carrying amount of a reporting unit exceeds its implied fair value. We reduce the carrying value of goodwill to its fair value when we determine that an impairment has occurred.
We had
no
impairment of goodwill for the year ended
December 31, 2016
.
Fair Value Measurements
We apply the authoritative accounting provisions for measuring fair value to our financial instruments and related disclosures, which include cash and cash equivalents, accounts receivable, accounts payable, debt, and derivative
103
instruments. We define fair value as an exit price representing the expected amount we would receive to sell an asset or pay to transfer a liability in an orderly transaction with market participants at the measurement date.
We employ a hierarchy which prioritizes the inputs we use to measure recurring fair value into three distinct categories based upon whether such inputs are observable in active markets or unobservable. We classify assets and liabilities in their entirety based on the lowest level of input that is significant to the fair value measurement. Our methodology for categorizing assets and liabilities that are measured at fair value pursuant to this hierarchy gives the highest priority to unadjusted quoted prices in active markets and the lowest level to unobservable inputs, summarized as follows:
|
•
|
Level 1 — Quoted prices in active markets for identical assets or liabilities.
|
|
•
|
Level 2 — Other significant observable inputs (including quoted prices in active markets for similar assets or liabilities).
|
|
•
|
Level 3 — Significant unobservable inputs (including our own assumptions in determining fair value).
|
We use the cost, income or market valuation approaches to estimate the fair value of our assets and liabilities when insufficient market-observable data is available to support our valuation assumptions.
The carrying amounts of cash and cash equivalents, accounts receivable, accounts payable, and the long-term debt represented by our
$400 million
senior secured credit facility as presented on our consolidated balance sheets approximate fair value due to the short-term nature of these items and, with respect to the senior secured credit facility, the frequent re-pricing of the underlying obligations. The fair value of our historical accounts receivable with affiliates and payables with affiliates cannot be determined due to the related party nature of these items.
Derivative Financial Instruments
Our net income and cash flows are subject to volatility stemming from changes in interest rates on our variable rate debt obligations and fluctuations in foreign currency exchange rates. We do not currently employ any derivative financial instruments to manage our exposure to fluctuations in interest rates, although we may use derivative financial instruments, including swaps, options and other financial instruments with similar characteristics to manage this exposure in the future. In order to manage our exposure to fluctuations in foreign currency exchange rates and the related risks to our unitholders, we use derivative financial instruments to offset these risks. We have a program that utilizes swaps, options and other financial instruments with similar characteristics to reduce the risks associated with the effects of foreign currency exposures related to our Canadian subsidiaries, which have cash flows denominated in Canadian dollars. Under this program, our strategy is to have gains or losses on the derivative contracts mitigate the foreign currency transaction gains or losses to the extent practical. Economically, the derivative contracts help us to limit our exposure such that the exchange rate will effectively lie between the floor and the ceiling of the rates set forth in the derivative contacts or otherwise set the exchange rate at a specified date and amount. All of our derivative financial instruments are employed in connection with an underlying asset, liability and/or forecast transaction and are not entered into for speculative purposes.
In accordance with the authoritative accounting guidance, we record all derivative financial instruments in our consolidated balance sheets at fair value as current or noncurrent assets or liabilities on a net basis by counterparty. We do not designate, nor have we historically designated, any of our derivative financial instruments as hedges of an underlying asset, liability and/or forecast transaction. To qualify for hedge accounting treatment as set forth in the authoritative accounting guidance, very specific requirements must be met in terms of hedge structure, hedge objective and hedge documentation. As a result, changes in the fair value of our derivative financial instruments and the related cash settlement of matured contracts are recognized in "Gain associated with derivative instruments" on our consolidated statements of operations. Refer to
Note 18 — Derivative Financial Instruments
Recent Accounting Pronouncements Not Yet Adopted
The Jumpstart Our Business Startups Act, or JOBS Act, provides that an emerging growth company can delay adopting new or revised accounting standards until such time as those standards apply to private companies. We have
104
irrevocably elected to “opt out” of this exemption and, therefore, will be subject to the same new or revised accounting standards as other public companies that are not emerging growth companies.
Intangibles — Goodwill and Other
In January 2017, the Financial Accounting Standards Board, or FASB, issued Accounting Standards Update No. 2017-04, or ASU 2017-04, which amends the FASB Accounting Standards Codification, or ASC, Topic 350 to modify the concept of impairment from the condition that exists when the carrying amount of goodwill exceeds its implied fair value to the condition that exists when the carrying amount of a reporting unit exceeds its fair value. An entity no longer will determine goodwill impairment by calculating the implied fair value of goodwill by assigning the fair value of a reporting unit to all of its assets and liabilities as if that reporting unit had been acquired in a business combination. An entity should recognize an impairment loss for the amount by which the carrying amount of a reporting unit exceeds the reporting unit's fair value. However, the loss recognized should not exceed the total amount of goodwill allocated to that reporting unit.
The pronouncement is effective for fiscal years beginning after December 15, 2019, or for any interim impairment testing within those fiscal years and is required to be applied prospectively, with early adoption permitted. We do not expect our adoption of this standard to have a material impact on our consolidated financial statements.
Restricted Cash
In November 2016 the FASB issued Accounting Standards Update No. 2016-18, or ASU 2016-18, which amends ASC Topic 230 to require that a statement of cash flows explain the change during the period in the total of cash, cash equivalents, and amounts generally described as restricted cash or restricted cash equivalents. Therefore, amounts generally described as restricted cash and restricted cash equivalents will be included with cash and cash equivalents when we reconcile the beginning-of-period and end-of-period total amounts shown on our consolidated statements of cash flows.
The pronouncement is effective for fiscal years beginning after December 15, 2017, and interim periods within those fiscal years and is required to be applied retrospectively for all financial statements presented, with early adoption permitted. We do not expect to adopt this standard early, nor do we expect our adoption of this standard to have a material impact on our consolidated financial statements, other than the presentation of cash and cash equivalents within our consolidated statements of cash flows.
Leases
In February 2016, the FASB issued Accounting Standards Update No. 2016-02, or ASU 2016-02, which amends ASC Topic 842 to require balance sheet recognition of lease assets and lease liabilities by lessees for those leases classified as operating leases. The amendment provides an option that permits us to elect not to recognize the lease assets and liabilities for leases with a term of 12 months or less. The pronouncement is effective for years beginning after December 15, 2018, and early adoption is permitted.
We cannot reasonably estimate the impact our adoption of ASU 2016-02 will currently have on our consolidated financial statements. We do not currently recognize operating leases in our balance sheets as will be required by ASU 2016-02, but record payments for operating leases as rent expense as incurred. Our process for implementing ASU 2016-02 will involve evaluating all of our existing leases with terms greater than 12 months to quantify the impact to our financial statements, developing accounting policies and internal control processes to address adherence to the requirements of the standard, evaluating the capability of existing accounting systems and any enhancements needed, determining the need to modify any bank or debt compliance requirements, and training and educating our workforce and the investment community regarding the financial statement impact that application of the standard will have. We have not yet initiated our process for implementing ASU 2016-02 and have not determined whether we will early adopt the provisions of this standard.
105
Revenue from Contracts with Customers
In May 2014, the FASB issued Accounting Standards Update No. 2014-09, or ASU 2014-09, that outlines a single comprehensive model for entities to use in accounting for revenue arising from contracts with customers and supersedes most current revenue recognition guidance, including industry-specific guidance. In July 2015, the FASB delayed the effective date of the new revenue standard by one year, which is now effective for annual and interim periods beginning on or after December 15, 2017, and may be applied on either a full or modified retrospective basis. Additionally, the FASB has issued and is likely to continue issuing Accounting Standards Updates to clarify application of the guidance in the original standard and to provide practical expedients for implementing the guidance, all of which will be effective upon adoption.
We have performed an initial assessment of the impact our adoption of ASU 2014-09 is expected to have on our current accounting policies, which remains subject to revision following the review and approval of our management. Our implementation of these policies will next require us to develop appropriate financial models to permit quantifying the impact our application of ASU 2014-09 will have on our previously issued financial statements. Additionally, our implementation of ASU 2014-09 will require training and educating our workforce and the investment community regarding the financial statement impact that application of the standard will have based upon the terms of our existing contracts and any new contracts we may execute in the future. Our evaluation and modification of existing accounting policies is ongoing, but nearing completion.
We currently expect to adopt ASU 2014-09 by applying the full retrospective transition method. The most significant policy revision we have identified to date relates to our accounting for the make-up rights provisions granted to customers of our Hardisty terminal. Under our current policy, we defer revenue associated with the make-up rights provisions until the earlier of when the throughput is utilized, the make-up rights expire, or when it is determined that the likelihood that the customer will utilize the make-up right is remote. Our revised revenue policy will require us to assess the value of the make-up rights option based upon the likelihood of exercise and the expected amount to be received from the option exercise to determine the amount of revenue to defer. For example, if we consider the make‑up rights option unlikely to be exercised, we would attribute no value to the option and apply
100%
breakage resulting in the recognition of all the revenue. We have identified other elements within our consolidated financial statements that are likely to be affected by our policy revisions for assessing the value of make-up rights provisions granted to customers of our Hardisty terminal. However, we continue to evaluate the impact our adoption of ASU 2014-09 may have on other elements within our consolidated financial statements. We cannot currently quantify with sufficient accuracy the impact that our adoption will have on each of the elements we expect to be affected within our consolidated financial statements.
The following discussion addresses the primary items within our financial statements we expect to be affected by our application of the requirements of ASU 2014-09, based upon modifications of our accounting policies, which have not yet been finalized. The discussion focuses on the impact we expect ASU 2014-09 to have on each of these items as compared with the amounts we have historically presented as a result of our application of currently accepted accounting standards associated with revenue. Once ASU 2014-09 is adopted and presented on a full retrospective basis, we anticipate the variances between periods for each of the items discussed will not be significantly different than the historical trends in each of these items.
Terminalling Services Revenue and Deferred Revenue -
We expect the terminalling services revenue of our Hardisty terminal operations to increase by a portion of the amounts previously deferred in connection with the payments we receive from our customers for their minimum monthly volume commitments. We have historically deferred recognition of all such amounts due to the make-up rights we have granted customers of our Hardisty terminal for periods up to
six months
following the month for which the minimum volume commitments were paid. Historically, breakage associated with these make-up rights options has been
100%
, which could result in our recognizing a portion, or all of the previously deferred amounts as revenue upon our adoption of ASU 2014-09. Breakage rates will be regularly evaluated and modified as necessary to reflect our current expectations and experience.
Pipeline Fees and Prepaid Expenses -
We expect our pipeline fees to increase by a portion of the amounts we have paid to Gibson and historically recorded as prepaid pipeline fees in connection with the revenue we have collected from customers of our Hardisty terminal for minimum monthly commitment fees, for which we have deferred recognition. We have historically recognized these prepaid pipeline fees as expense concurrently with the recognition
106
of revenue associated with the expiration of the make-up rights we granted to customers of our Hardisty terminal. As a result of our expected recognition of a portion of the previously deferred revenue, we expect to concurrently recognize a comparable portion of the prepaid pipeline fees as expense in connection with our adoption of ASU 2014-09.
Provision for Income Taxes and Non-current Deferred Income Tax Liability -
As a result of the anticipated increases in “Terminalling services revenue” and “Pipeline fees” as discussed above, we expect our provision for income taxes and the related non-current deferred income tax liability to be affected by the change resulting from the expected increase in “Income (loss) from continuing operations before provision for income taxes.”
Other Comprehensive Income (Loss) - Foreign Currency Translation and Accumulated Other Comprehensive Income (Loss) -
Our translation of the foregoing items within our consolidated income statements and balance sheets will also result in changes to the amounts reported in our consolidated statements of comprehensive income (loss) for “Other comprehensive income (loss) – foreign currency translation” and the related amount for “Accumulated other comprehensive income (loss)” included in our consolidated balance sheets. The functional currency of our Hardisty terminal is the Canadian dollar, which we translate into U.S. dollars for reporting in our consolidated financial statements.
Cash Flows From Operating Activities -
We do not expect our adoption of ASU 2014-09 to affect the amount we report as Cash flow from operating activities, as our adoption of this standard does not affect cash flow. However, we expect the components that comprise “Net cash provided by (used in) operating activities” within our Consolidated Statements of Cash Flows will change to reflect the changes presented in the income statement and balance sheet items discussed above.
3. NET INCOME PER LIMITED PARTNER AND GENERAL PARTNER INTEREST
We allocate our net income among our general partner and limited partners using the two-class method in accordance with applicable authoritative accounting guidance. Under the two-class method, we allocate our net income and any net income in excess of distributions to our limited partners, our general partner and the holder of the IDRs according to the distribution formula for available cash as set forth in our partnership agreement. We allocate any distributions in excess of earnings for the period to our limited partners and general partner based on their respective proportionate ownership interests in us, as set forth in the partnership agreement after taking into account distributions to be paid with respect to the IDRs. The formula for distributing available cash as set forth in our partnership agreement is as follows:
|
Distribution Targets
|
Portion of Quarterly
Distribution Per Unit
|
Percentage Distributed to Limited Partners
|
Percentage Distributed to
General Partner
(including IDRs)
(1)
|
|||
|
Minimum Quarterly Distribution
|
Up to $0.2875
|
98%
|
2%
|
|||
|
First Target Distribution
|
> $0.2875 to $0.330625
|
98%
|
2%
|
|||
|
Second Target Distribution
|
> $0.330625 to $0.359375
|
85%
|
15%
|
|||
|
Third Target Distribution
|
> $0.359375 to $0.431250
|
75%
|
25%
|
|||
|
Thereafter
|
Amounts above $0.431250
|
50%
|
50%
|
|||
|
(1)
|
Assumes our general partner maintains a
2%
general partner interest in us.
|
107
We determined basic and diluted net income (loss) per limited partner unit as set forth in the following tables:
|
For the Year Ended December 31, 2016
|
||||||||||||||||||||
|
Common
Units |
Subordinated
Units |
Class A
Units |
General
Partner Units |
Total
|
||||||||||||||||
|
(in thousands, except per unit amounts)
|
||||||||||||||||||||
|
Net income attributable to general and limited partner interests in USD Partners LP
(1)
|
$
|
14,644
|
|
$
|
8,898
|
|
$
|
148
|
|
$
|
482
|
|
$
|
24,172
|
|
|||||
|
Less: Distributable earnings
(2)
|
18,708
|
|
11,041
|
|
183
|
|
608
|
|
30,540
|
|
||||||||||
|
Distributions in excess of earnings
|
$
|
(4,064
|
)
|
$
|
(2,143
|
)
|
$
|
(35
|
)
|
$
|
(126
|
)
|
$
|
(6,368
|
)
|
|||||
|
Weighted average units outstanding
(3)
|
13,867
|
|
8,668
|
|
145
|
|
461
|
|
||||||||||||
|
Distributable earnings per unit
(4)
|
$
|
1.35
|
|
$
|
1.27
|
|
$
|
1.26
|
|
|||||||||||
|
Overdistributed earnings per unit
(5)
|
(0.29
|
)
|
(0.25
|
)
|
(0.24
|
)
|
||||||||||||||
|
Net income per limited partner unit (basic and diluted)
|
$
|
1.06
|
|
$
|
1.02
|
|
$
|
1.02
|
|
|||||||||||
|
(1)
|
Represents earnings allocated to each class of units based on the actual ownership of the Partnership during the period.
|
|
(2)
|
Represents the per unit distributions paid of
$0.3075
for the three months ended March 31,
2016
,
$0.3150
for the three months ended June 30,
2016
,
$0.3225
for the three months ended September 30,
2016
, and
$0.3300
distributable for the three months ended December 31,
2016
, representing the full year-distribution amount of
$1.275
per unit. Amounts presented for each class of units include a proportionate amount of the
$756 thousand
distributed and
$262 thousand
distributable to holders of the equity-classified phantom units pursuant to the DERs granted under the USD Partners LP 2014 Long-Term Incentive Plan.
|
|
(3)
|
Represents the weighted average units outstanding during the year.
|
|
(4)
|
Represents the total distributable earnings divided by the weighted average number of units outstanding for the year.
|
|
(5)
|
Represents the distributions in excess of earnings divided by the weighted average number of units outstanding for the year.
|
|
For the Year Ended December 31, 2015
|
||||||||||||||||||||
|
Common
Units |
Subordinated
Units |
Class A
Units |
General
Partner Units |
Total
|
||||||||||||||||
|
(in thousands, except per unit amounts)
|
||||||||||||||||||||
|
Net income attributable to general and limited partner interests in USD Partners LP
(1)
|
$
|
8,605
|
|
$
|
8,581
|
|
$
|
153
|
|
$
|
354
|
|
$
|
17,693
|
|
|||||
|
Less: Distributable earnings
(2)
|
12,682
|
|
12,452
|
|
212
|
|
518
|
|
25,864
|
|
||||||||||
|
Distributions in excess of earnings
|
$
|
(4,077
|
)
|
$
|
(3,871
|
)
|
$
|
(59
|
)
|
$
|
(164
|
)
|
$
|
(8,171
|
)
|
|||||
|
Weighted average units outstanding
(3)
|
10,427
|
|
10,464
|
|
201
|
|
431
|
|
||||||||||||
|
Distributable earnings per unit
(4)
|
$
|
1.22
|
|
$
|
1.19
|
|
$
|
1.05
|
|
|||||||||||
|
Overdistributed earnings per unit
(5)
|
(0.39
|
)
|
(0.37
|
)
|
(0.29
|
)
|
||||||||||||||
|
Net income per limited partner unit (basic and diluted)
|
$
|
0.83
|
|
$
|
0.82
|
|
$
|
0.76
|
|
|||||||||||
|
(1)
|
Represents earnings allocated to each class of units based on the actual ownership of the Partnership during the year.
|
|
(2)
|
Represents the per unit distributions paid for the period of
$0.2875
for the three months ended March 31, 2015,
$0.2900
for the three months ended June 30, 2015,
$0.2925
for the three months ended September 30, 2015 and
$0.3000
for the three months ended December 31, 2015, representing the full year distribution of
$1.17
per unit. Amounts presented for each class of units include a proportionate amount of the
$434 thousand
distributed for the year to holders of the equity-classified phantom units pursuant to the DERs granted under the USD Partners LP 2014 Long-Term Incentive Plan.
|
|
(3)
|
Represents the weighted average units outstanding during the year.
|
|
(4)
|
Represents the total distributable earnings divided by the weighted average number of units outstanding for the year.
|
|
(5)
|
Represents the distributions in excess of earnings divided by the weighted average number of units outstanding for the year.
|
108
|
For the Year Ended December 31, 2014
|
||||||||||||||||||||
|
Common
Units |
Subordinated
Units |
Class A
Units |
General
Partner Units |
Total
|
||||||||||||||||
|
(in thousands, except per unit amounts)
|
||||||||||||||||||||
|
Predecessor net loss allocation to general and limited partner interests
(1)
|
$
|
(668
|
)
|
$
|
(6,394
|
)
|
$
|
—
|
|
$
|
(144
|
)
|
(7,206
|
)
|
||||||
|
Net loss attributable to general and limited partner interests
(1)
|
(228
|
)
|
(234
|
)
|
—
|
|
(10
|
)
|
(472
|
)
|
||||||||||
|
Less: Distributable earnings
(2)
|
3,499
|
|
12,033
|
|
61
|
|
318
|
|
15,911
|
|
||||||||||
|
Distributions in excess of earnings
|
$
|
(4,395
|
)
|
$
|
(18,661
|
)
|
$
|
(61
|
)
|
$
|
(472
|
)
|
$
|
(23,589
|
)
|
|||||
|
Weighted average units outstanding
(3)
|
3,042
|
|
10,464
|
|
53
|
|
427
|
|
||||||||||||
|
Distributable earnings per unit
(4)
|
$
|
1.15
|
|
$
|
1.15
|
|
$
|
1.14
|
|
|||||||||||
|
Overdistributed earnings per unit
(5)
|
(1.44
|
)
|
(1.78
|
)
|
(1.14
|
)
|
||||||||||||||
|
Net loss per limited partner unit (basic and diluted)
|
$
|
(0.29
|
)
|
$
|
(0.63
|
)
|
$
|
—
|
|
|||||||||||
|
(1)
|
Represents earnings allocated to each class of units on a retrospective basis using the percentage ownership in the Partnership as if the units issued to our general partner and USDG in connection with the IPO were outstanding for the year ended
December 31, 2014
, and common units issued to the public and Class A units issued to certain members of management were outstanding from October 15, 2014, the closing date of our IPO, to
December 31, 2014
.
|
|
(2)
|
Represents the total distributions that would have been payable for the year ended
December 31, 2014
, assuming the minimum quarterly distribution amount of
$0.2875
per unit, or
$1.15
per unit on an annualized basis, was distributed for each of the
four
distribution payments that would have been made on a retrospective basis if the units issued to our general partner and USDG were outstanding for the entire year and common units issued to the public and Class A units issued to certain members of management were outstanding from October 15, 2014, the closing of the IPO, to
December 31, 2014
..
|
|
(3)
|
Represents the weighted average units outstanding computed on a retrospective basis as if the units issued to our general partner and USDG in connection with the IPO were outstanding for the entire year and common units issued to the public and Class A units issued to certain members of management were outstanding from October 15, 2014, the closing date of our IPO, to
December 31, 2014
.
|
|
(4)
|
Represents the total distributable earnings divided by the weighted average number of units outstanding for the year.
|
|
(5)
|
Represents the distributions in excess of earnings divided by the weighted average number of units outstanding for the year.
|
4. CASPER TERMINAL ACQUISITION
We acquired
100%
of the membership interests of Casper Crude to Rail, LLC, which we refer to as the Casper terminal, in November 2015. The Casper terminal, primarily consists of a unit train-capable railcar loading facility with capacity in excess of
100,000
barrels per day,
six
customer-dedicated storage tanks with
900,000
barrels of total capacity and a
six
-mile,
24
-inch diameter pipeline with a direct connection from Spectra Energy Partners' Express Pipeline. We acquired all of the issued and outstanding membership interests of the Casper terminal in exchange for approximately $
210.4 million
in cash, or the Cash Consideration, and
1,733,582
of our common units representing limited partner interests in us, or the Equity Consideration. The Cash Consideration, which includes approximately $
2.1 million
for initial working capital, was funded using approximately $
35.0 million
of cash on hand retained from the excess proceeds of our initial public offering in October 2014 and $
175.4 million
of senior secured credit facility borrowings. We issued the Equity Consideration to Cogent Energy Solutions, LLC, or Cogent, one of the owners of the Seller. The number of common units comprising the Equity Consideration was determined by reference to the volume-weighted average daily closing price of
$9.62
per common unit for the
30
trading day period prior to October 12, 2015. In connection with the Equity Consideration issued to Cogent, our general partner contributed
$0.3 million
in exchange for
34,053
additional general partner units sufficient to maintaining its
2%
general partner interest in us, on substantially the same terms as the common units issued to Cogent.
We accounted for our acquisition of the Casper terminal as a business combination using the acquisition method, whereby we recognized the acquisition date fair value of the identifiable assets acquired and liabilities assumed with any unallocated purchase price paid being attributed to goodwill. We incurred approximately
$0.5 million
for transaction costs in connection with our acquisition of the Casper terminal, consisting primarily of legal and other professional fees, which we expensed as incurred and included in "Selling, general and administrative" within our consolidated statements of operations.
109
The following table summarizes our preliminary and final allocation of the consideration we paid for the Casper terminal among the assets acquired and liabilities assumed. We determined the fair value of the identifiable assets acquired and liabilities assumed based upon estimates and assumptions made by management and developed with the assistance of external advisers, with any consideration paid in excess of the fair value of the net assets being attributed to goodwill.
|
Purchase Price Allocation
|
|||||||
|
Preliminary
|
Final
|
||||||
|
Consideration:
|
(in thousands)
|
||||||
|
Cash paid to Seller
|
$
|
210,445
|
|
$
|
210,445
|
|
|
|
Fair value of equity issued to Seller
|
15,325
|
|
15,325
|
|
|||
|
Total consideration
|
$
|
225,770
|
|
$
|
225,770
|
|
|
|
Allocation of purchase price
|
|||||||
|
Working capital, net
|
$
|
1,530
|
|
$
|
1,911
|
|
|
|
Property and equipment
|
64,204
|
|
64,204
|
|
|||
|
Intangible assets
|
126,066
|
|
126,066
|
|
|||
|
Goodwill
|
33,970
|
|
33,589
|
|
|||
|
Total purchase price
|
$
|
225,770
|
|
$
|
225,770
|
|
|
We have included the results of operations of the Casper terminal in our results of operations from the acquisition date. For the year ended
December 31, 2016
, the Casper terminal generated revenues of $
31.9
million and net income of $
10.3
million. From November 17, 2015 through December 31, 2015, the Casper terminal generated revenues of
$3.8 million
and net income of
$0.8 million
.
The following table presents our unaudited pro forma consolidated financial information as if the closing of the Casper terminal acquisition had occurred on January 1, 2014:
|
For the Year Ended December 31,
|
||||||||
|
2015
|
2014
|
|||||||
|
(in thousands except per unit amounts)
|
||||||||
|
Total revenues
|
$
|
112,325
|
|
$
|
44,536
|
|
||
|
Operating income
|
$
|
30,997
|
|
$
|
1,682
|
|
||
|
Net income (loss)
|
$
|
21,310
|
|
$
|
(12,043
|
)
|
||
|
Earnings (loss) per common unit (basic and diluted)
|
$
|
0.93
|
|
$
|
(0.52
|
)
|
||
The unaudited pro forma financial information presented above has been prepared by combining our historical results and the historical results of the Casper terminal and further reflects the effect of purchase accounting adjustments and the elimination of transaction costs, among other items. Other significant pro forma adjustments have been made to take into account, from the beginning of the period, additional depreciation and amortization of the fair value of the noncurrent assets resulting from the application of purchase accounting, as well as the additional interest expense we would have incurred from the incremental borrowings on our revolving credit facility. This pro forma information is not necessarily indicative of the actual results of operations that would have occurred if we had acquired the Casper terminal on January 1, 2014, or that may result in the future and does not reflect potential synergies, integration costs or other such costs and savings.
Transition Services Agreement
In connection with our acquisition of the Casper terminal we also entered into a transition services agreement with Cogent, pursuant to which Cogent provided certain accounting, administrative, customer support and information
110
technology support services to the Casper terminal for a period of approximately three months following the closing while we transitioned such services to our management.
5. RESTRICTED CASH
We include in restricted cash on our consolidated balance sheets amounts representing a cash account for which the use of funds is restricted by a facilities connection agreement among us and Gibson Energy Partnership, or Gibson, that we entered into during
2014
in connection with the development of our Hardisty terminal. The collaborative arrangement is further discussed in
Note 11. Collaborative Arrangement
. As of
December 31, 2016
and
2015
, we had restricted cash balances of
$5.4 million
and
$4.6 million
, respectively, for undistributed amounts retained in our joint revenue collection bank account.
6. ACCOUNTS RECEIVABLE
We had
no
allowances for doubtful accounts at
December 31, 2016
, and approximately
$21 thousand
at
December 31, 2015
. We had
no
bad debt expense for the years ended
December 31, 2016
and
2015
, and approximately
$1.4 million
for the year ended
December 31, 2014
, which is included in "Selling, general and administrative" in our consolidated statements of operations.
7. PROPERTY AND EQUIPMENT
Our property and equipment is comprised of the following:
|
December 31,
|
Estimated
Useful Lives (Years) |
||||||||
|
2016
|
2015
|
||||||||
|
(in thousands)
|
|||||||||
|
Land
|
$
|
9,636
|
|
$
|
9,549
|
|
N/A
|
||
|
Trackage and facilities
|
108,782
|
|
110,557
|
|
20
|
||||
|
Pipeline
|
10,313
|
|
10,295
|
|
20
|
||||
|
Equipment
|
8,234
|
|
8,237
|
|
5-10
|
||||
|
Furniture
|
44
|
|
43
|
|
5
|
||||
|
Total property and equipment
|
137,009
|
|
138,681
|
|
|||||
|
Accumulated depreciation
|
(13,821
|
)
|
(8,326
|
)
|
|||||
|
Construction in progress
|
2,514
|
|
2,655
|
|
|||||
|
Property and equipment, net
|
$
|
125,702
|
|
$
|
133,010
|
|
|||
The amounts classified as “Construction in progress” are excluded from amounts being depreciated. These amounts represent property that is not yet ready to be placed into productive service as of the respective consolidated balance sheet date.
We had
no
capitalized interest costs for the years ended
December 31, 2016
and
2015
, and
$230 thousand
of capitalized interest costs for the year ended
December 31, 2014
.
In August 2016, we received notification from the sole customer of our San Antonio terminal stating their intent to terminate our terminalling services agreement with them in early February 2017, which was extended in January 2017 to May 1, 2017. In early February 2017, the lessor of the real property upon which the San Antonio terminal resides indicated their intent to terminate our lease with them concurrently with the conclusion of the extension agreement for terminalling services we have with our customer, at which time we expect to wind down the operations of this terminal. As a result, we have recognized a non-cash impairment loss of approximately
$3.5 million
for the year ended
December 31, 2016
, to write down the noncurrent assets of the terminal to fair market value, the charge for which we have included in "Depreciation and amortization" within our consolidated statements of operations. The impairment loss includes an asset retirement obligation of
$1.0 million
for amounts we expect to spend to restore the property to its original condition. We determined the fair market value of these assets to approximate
$0.2 million
, based upon
111
market prices for similar assets and discounted cash flows we expect to derive from their use through the contract termination date. The San Antonio terminal is included in our Terminalling services segment as reported in our segment results included in
Note 15 — Segment Reporting.
8. GOODWILL AND INTANGIBLE ASSETS
Goodwill
Goodwill represents the excess of the purchase price paid for an entity over the estimated fair value of the assets acquired and liabilities assumed. Our goodwill originated from our acquisition of the Casper terminal, which is included in our Terminalling services segment. As of
December 31, 2016
, the carrying amount of our goodwill was
$33.6 million
.
Changes in the balance of Goodwill are presented in the following table (in thousands):
|
Balance at December 31, 2014
|
$
|
—
|
|
|
|
Goodwill recognized in connection with the Casper acquisition
|
33,970
|
|
||
|
Balance at December 31, 2015
|
33,970
|
|
||
|
Proceeds from settlement of Casper purchase price
|
(381
|
)
|
||
|
Balance at December 31, 2016
|
$
|
33,589
|
|
|
We test goodwill for impairment annually based on the carrying values of our reporting units on the first day of the third quarter of each year, or more frequently if events or changes in circumstances suggest that the fair value of a reporting unit is less than its carrying value. During the third quarter of 2016 we completed our impairment analysis of goodwill and determined that the fair value of the Casper terminal exceeded its carrying value at July 1, 2016. Even if our estimate of the fair value of goodwill had been reduced by
9%
in our impairment analysis, no impairment loss would have resulted. The critical assumptions used in our analysis include the following:
|
1)
|
A weighted average cost of capital of
10%
;
|
|
2)
|
A capital structure consisting of approximately
35%
debt and
65%
equity;
|
|
3)
|
A range of EBITDA multiples derived from equity prices of public companies with similar operating and investment characteristics, from
9x
to
10x
; and
|
|
4)
|
A range of EBITDA multiples for transactions based on actual sales and purchases of comparable businesses, from
8.5x
to
9.5x
.
|
We measured the fair value of our Casper terminal by using an income analysis, market analysis and transaction analysis with weightings of
50%
,
25%
and
25%
, respectively. Our estimate of fair value required us to use significant unobservable inputs representative of a Level 3 fair value measurement, including assumptions related to the future performance of our Casper terminal. We have not observed any events or circumstances subsequent to our analysis that would suggest the fair value of our Casper terminal is below its carrying amount as of December 31, 2016.
112
Intangible Assets
The composition, gross carrying amount and accumulated amortization of our identifiable intangible assets are as follows as of the dates indicated:
|
December 31, 2016
|
December 31, 2015
|
||||||
|
(in thousands)
|
|||||||
|
Carrying amount:
|
|||||||
|
Customer service agreements
|
$
|
125,960
|
|
$
|
125,960
|
|
|
|
Other
|
106
|
|
106
|
|
|||
|
Total carrying amount
|
126,066
|
|
126,066
|
|
|||
|
Accumulated amortization:
|
|||||||
|
Customer service agreements
|
(14,135
|
)
|
(1,484
|
)
|
|||
|
Other
|
(12
|
)
|
(1
|
)
|
|||
|
Total accumulated amortization
|
(14,147
|
)
|
(1,485
|
)
|
|||
|
Total intangible assets, net
|
$
|
111,919
|
|
$
|
124,581
|
|
|
Our identifiable intangible assets at
December 31, 2016
and
2015
, originated from our acquisition of the Casper terminal and are directly associated with our terminalling services segment. Refer to
Note 4 — Casper Terminal Acquisition
,
for additional discussion of the Casper terminal acquisition. The customer service agreements are multi-year, take-or-pay agreements. The acquisition date fair value attributed to the intangible assets was based on the present value of the future revenue stream expected to be derived from our relationships with the existing customers of the Casper terminal, which we expect to continue over a period of approximately
10
years. At
December 31, 2016
, the remaining average life of the agreements is
1.96 years
until the next renewal. We are amortizing our intangibles over the
10
year estimated useful lives of these assets.
The pre-tax amortization expense associated with intangible assets totaled approximately
$12.6 million
and
$1.5 million
for the years ended
December 31, 2016
and
2015
, respectively. We expect the annual pre-tax amortization expense associated with our intangible assets at
December 31, 2016
, to approximate
$12.6 million
for each of the next five years.
9. DEBT
Credit Agreement
In connection with our IPO, we entered into a
$300 million
senior secured credit agreement, the Credit Agreement, comprised of a
$200 million
revolving credit facility, the Revolving Credit Facility, and a
$100 million
term loan, the Term Loan Facility (borrowed in Canadian dollars), with Citibank, N.A., as administrative agent, and a syndicate of lenders. The Credit Agreement is a
five
year committed facility that matures October 15, 2019, unless amended or extended.
On November 13, 2015, we entered into an amendment of our Credit Agreement to increase the Revolving Credit Facility commitments thereunder to $
300 million
with the option to further increase them to $
400 million
subject to receipt of additional lender commitments and satisfaction of other conditions. This amendment to our Credit Agreement did not affect the interest rate, the October 15, 2019 maturity date, or the collateral and guarantees. In connection with the amendment, we incurred additional deferred financing costs of
$0.9 million
, which, in addition to the deferred financing costs from origination of the Credit Agreement, will be amortized over the remaining term of the Credit Agreement using the effective interest method.
Our Revolving Credit Facility and any letters of credit issued thereunder are available for working capital, capital expenditures, permitted acquisitions and general partnership purposes, including distributions. As we make payments on the Term Loan Facility, availability equal to the U.S. dollar equivalent amount of the payments is automatically transferred from the Term Loan Facility to the Revolving Credit Facility, ultimately increasing the availability on our Revolving Credit Facility to
$400 million
once the Term Loan Facility is fully repaid. In addition, we have the ability
113
to increase the maximum amount of credit available under the Credit Agreement, as amended, by an aggregate amount of up to
$100 million
to a total facility size of
$500 million
, subject to receiving increased commitments from lenders or other financial institutions and satisfaction of certain conditions. The Revolving Credit Facility includes an aggregate
$20 million
sublimit for standby letters of credit and a
$20 million
sublimit for swingline loans. Obligations under the Revolving Credit Facility are guaranteed by our restricted subsidiaries (as such term is defined in our senior secured credit facility) and are secured by a first priority lien on our assets and those of our restricted subsidiaries, other than certain excluded assets.
The Term Loan Facility was used to fund a
$100 million
distribution to USDG in connection with the closing of our IPO and is guaranteed by USDG. The guaranty by USDG includes a covenant that USDG maintain a net worth (without taking into account its interests in us, either directly or indirectly) greater than the outstanding amount of the term loan. In the event the USDG net worth covenant is breached and not cured within a certain amount of time, the interest rate on the term loan will be increased by an additional
1.0%
. Amounts outstanding on the Term Loan Facility are not subject to any scheduled repayment prior to its maturity on July 14, 2019. Mandatory prepayments of the term loan are required from certain non-ordinary course asset sales, subject to customary exceptions and reinvestment rights.
Loans under the Credit Agreement accrue interest at a per annum rate by reference, at our election, to the London Interbank Offered Rate, or LIBOR, the Canadian Dealer Offered Rate, or CDOR, a base rate, or Canadian prime rate, in each case, plus an applicable margin. Our borrowings under the Revolving Credit Agreement bear interest at either a base rate and Canadian prime rate plus an applicable margin ranging from
1.25%
to
2.25%
, or at LIBOR or CDOR plus an applicable margin ranging from
2.25%
to
3.25%
. Borrowings under the Term Loan Facility bear interest at either the base rate or Canadian prime rate plus a margin ranging from
1.35%
to
2.35%
or at LIBOR or CDOR, as applicable, plus an applicable margin ranging from
2.35%
to
3.35%
. The applicable margin, as well as a commitment fee on the Revolving Credit Facility of
0.375%
to
0.50%
per annum on unused commitments, will vary based upon our consolidated net leverage ratio, as defined in our Credit Agreement. The actual average interest rate on our outstanding indebtedness was
3.66%
and
2.71%
at
December 31, 2016
and
2015
, respectively.
Our Credit Agreement contains affirmative and negative covenants that, among other things, limit or restrict our ability and the ability of our restricted subsidiaries to incur or guarantee debt, incur liens, make investments, make restricted payments, engage in business activities, engage in mergers, consolidations and other organizational changes, sell, transfer or otherwise dispose of assets or enter into burdensome agreements or enter into transactions with affiliates on terms that are not arm’s length, in each case, subject to exceptions.
Additionally, we are required to maintain the following financial ratios, each determined on a quarterly basis for the immediately preceding four quarter period then ended (or such shorter period as shall apply, on an annualized basis):
|
•
|
Consolidated Interest Coverage Ratio (as defined in the credit agreement) of at least
2.50
to 1.00;
|
|
•
|
Consolidated Leverage Ratio of not greater than
4.50
to 1.00 (or
5.00
to 1.00 at any time after we have issued at least
$150.0 million
of unsecured notes). In addition, upon the consummation of a Material Acquisition (as defined in our Credit Agreement), for the fiscal quarter in which the Material Acquisition is consummated and for two fiscal quarters immediately following such fiscal quarter (the “Material Acquisition Period”), if elected by us by written notice to the Administrative Agent given on or prior to the date of such acquisition, the maximum permitted ratio shall be increased by
0.50
to 1.00 above the otherwise relevant level; and
|
|
•
|
after we have issued at least
$150.0 million
of unsecured notes, a Consolidated Senior Secured Leverage Ratio (as defined in the Credit Agreement) of not greater than
3.50
to 1.00 (or
4.00
to 1.00 during a Material Acquisition Period).
|
Our Credit Agreement generally prohibits us from making cash distributions (subject to exceptions as set forth in the Credit Agreement). However, so long as no default exists or would be caused by making a cash distribution, we may make cash distributions to our unitholders up to the amount of our available cash (as defined in our partnership agreement).
The Credit Agreement contains events of default, including, but not limited to (and subject to grace periods in circumstances set forth in the Credit Agreement), the failure to pay any principal, interest or fees when due, failure to
114
perform or observe any covenant that does not have certain materiality qualifiers contained in the Credit Agreement or related loan documentation, any representation, warranty or certification made or deemed made in the agreements or related loan documentation being untrue in any material respect when made, default under certain material debt agreements, commencement of bankruptcy or other insolvency proceedings, certain changes in our ownership or the ownership of our general partner, material judgments or orders, certain judgment defaults, ERISA events or the invalidity of the loan documents. Upon the occurrence and during the continuation of an event of default under the agreements, the lenders may, among other things, terminate their commitments, declare any outstanding loans to be immediately due and payable and/or exercise remedies against us and the collateral as may be available to the lenders under the agreements and related documentation or applicable law. As of
December 31, 2016
, we were in compliance with the covenants set forth in our Credit Agreement.
We determined the capacity available to us under the terms of our Credit Agreement was as follows as of the specified dates:
|
December 31,
|
|||||||
|
2016
|
2015
|
||||||
|
(in millions)
|
|||||||
|
Aggregate borrowing capacity under the Credit Agreement
|
$
|
400.0
|
|
$
|
400.0
|
|
|
|
Less: Term Loan Facility amounts outstanding
|
10.1
|
|
41.5
|
|
|||
|
Revolving Credit Facility amounts outstanding
|
213.0
|
|
201.0
|
|
|||
|
Letters of credit outstanding
|
—
|
|
—
|
|
|||
|
Available under the Credit Agreement
(1)
|
$
|
176.9
|
|
$
|
157.5
|
|
|
|
(1)
|
Pursuant to the terms of our Credit Agreement our borrowing capacity at
December 31, 2016
is limited to
4.5
times our trailing 12-month consolidated EBITDA.
|
In November 2008, the Predecessor, through USDG, became party to a credit agreement, the BOK Credit Agreement, with the Bank of Oklahoma consisting of a revolving credit facility with a borrowing capacity of
$150 million
. The BOK Credit Agreement was guaranteed by all USDG subsidiaries, including us. The outstanding balance under the BOK Credit Agreement was
$97.8 million
prior to our repayment of the entire outstanding balance on October 15, 2014, with proceeds we received from our IPO. We incurred interest expense under the terms of the BOK Credit Agreement at LIBOR plus a margin based on USDG’s leverage ratio, as defined in the BOK Credit Agreement. The average interest rate was
3.90%
for the year ended
December 31, 2014
, in addition to a fee of
0.50%
that was charged on the unused portion of the BOK Credit Agreement.
Interest expense associated with our outstanding indebtedness was as follows for the specified periods:
|
For the Years Ended December 31,
|
|||||||||||
|
2016
|
2015
|
2014
|
|||||||||
|
(in thousands)
|
|||||||||||
|
Interest expense on BOK Credit Agreement
|
$
|
—
|
|
$
|
—
|
|
$
|
2,819
|
|
||
|
Interest expense on Credit Agreement
|
8,986
|
|
3,773
|
|
980
|
|
|||||
|
Amortization of deferred financing costs
|
861
|
|
659
|
|
1,056
|
|
|||||
|
Total interest expense
|
$
|
9,847
|
|
$
|
4,432
|
|
$
|
4,855
|
|
||
115
Our long-term debt balances included the following components as of the specified dates:
|
December 31,
|
|||||||
|
2016
|
2015
|
||||||
|
(in thousands)
|
|||||||
|
Term Loan Facility
|
$
|
10,128
|
|
$
|
41,539
|
|
|
|
Revolving Credit Facility
|
213,000
|
|
201,000
|
|
|||
|
Less: Deferred financing costs, net
|
(2,234
|
)
|
(3,095
|
)
|
|||
|
Total long-term debt, net
|
$
|
220,894
|
|
$
|
239,444
|
|
|
10. DEFERRED REVENUE
Our deferred revenue includes amounts we have received in cash from customers as payment for their minimum monthly commitment fees under take-or-pay contracts, where such payments exceed the charges implied by the customer's actual throughput based on contractual rates set forth in our terminalling services agreements. We grant customers of our Hardisty terminal a credit for periods up to
six months
, which may be used to offset fees on throughput in excess of their minimum monthly commitments in future periods, to the extent capacity is available for the excess volume. We refer to these credits as make-up rights. We defer revenue associated with make-up rights until the earlier of when the throughput is utilized, the make-up rights expire, or when it is determined that the likelihood that the customer will utilize the make-up right is remote. A majority of our deferred revenue derived from the make-up rights provisions of our terminalling services agreements are denominated in Canadian dollars and translated into U.S. dollars at the exchange rate in effect at the end of the period. As a result, the balance of our deferred revenue may vary from period to period due to changes in the exchange rate between the U.S. dollar and the Canadian dollar.
Our deferred revenues also include amounts collected in advance from customers of our Fleet services business, which will be recognized as revenue when earned pursuant to the terms of our contractual arrangements. We have likewise prepaid the rent on our railcar leases that are associated with the deferred revenue, which we will recognize as expense concurrently with our recognition of the associated revenue.
The following table provides details of our deferred revenue with unrelated customers as reflected in our consolidated balance sheets as of the dates indicated:
|
December 31,
|
|||||||
|
2016
|
2015
|
||||||
|
(in thousands)
|
|||||||
|
Customer prepayments, current portion
(1)
|
$
|
3,705
|
|
$
|
1,763
|
|
|
|
Minimum monthly commitment fees
|
23,223
|
|
20,395
|
|
|||
|
Total deferred revenue, current portion
|
$
|
26,928
|
|
$
|
22,158
|
|
|
|
Customer prepayments
(1)
|
$
|
264
|
|
$
|
2,022
|
|
|
|
Total deferred revenue, net of current portion
|
$
|
264
|
|
$
|
2,022
|
|
|
|
(1)
|
Represents amounts associated with lease payments received in advance from our Fleet services customers.
|
Refer to
Note 13—Transactions with Related Parties
for a discussion of deferred revenues associated with related parties included in our consolidated balance sheets.
11. COLLABORATIVE ARRANGEMENTS
We entered into a facilities connection agreement in
2014
with Gibson under which Gibson developed, constructed and operates a pipeline and related facilities connected to our Hardisty terminal. Gibson’s storage terminal is the exclusive means by which our Hardisty terminal receives crude oil. Subject to certain limited exceptions regarding manifest train facilities, our Hardisty terminal is the exclusive means by which crude oil from Gibson's Hardisty storage
116
terminal may be transported by rail. We remit pipeline fees to Gibson for the transportation of crude oil to our Hardisty terminal based on a predetermined formula. For the years ended
December 31, 2016
,
2015
and
2014
we recorded
$20.8 million
,
$17.2 million
and
$3.6 million
, respectively, as "Pipeline fees" in our consolidated statements of operations. Additionally, at
December 31, 2016
and
2015
, we had prepaid pipeline fees of
$6.8 million
and
$6.4 million
, respectively, included in "Prepaid expenses" within our consolidated balance sheets, which will be recognized as expense concurrently with the recognition of revenue that we deferred in connection with our minimum monthly volume commitments.
12. NONCONSOLIDATED VARIABLE INTEREST ENTITIES
In 2014, we entered into purchase, assignment and assumption agreements to assign payment and performance obligations for certain operating lease agreements with lessors, as well as customer fleet service payments related to these operating leases, with unconsolidated entities in which we have variable interests. These variable interest entities, or VIEs, include LRT Logistics Funding LLC, USD Fleet Funding LLC, USD Fleet Funding Canada Inc., and USD Logistics Funding Canada Inc. We treat these entities as variable interests under the applicable accounting guidance due to their having an insufficient amount of equity invested at risk to finance their activities without additional subordinated financial support. We are not the primary beneficiary of the VIEs, as we do not have the power to direct the activities that most significantly affect the economic performance of the VIEs, nor do we have the power to remove the managing member under the terms of the VIE's limited liability company agreements. Accordingly, we do not consolidate the results of the VIEs in our consolidated financial statements.
Prior to July 1, 2016, our activities with the VIEs were treated as related party transactions and disclosed in
Note 13 – Transactions with Related Parties
due to the managing member of the VIEs being a member of the board of directors of USD. The managing member subsequently transferred ownership and control of the companies to a party that is unaffiliated with USD or us. As a result, for periods following June 30, 2016, we no longer treat the VIEs as related parties.
The following table summarizes the total assets and liabilities between us and the VIEs as reflected in our consolidated balance sheets at
December 31, 2016
, as well as our maximum exposure to losses from entities in which we have a variable interest, but are not the primary beneficiary. Generally, our maximum exposure to losses is limited to amounts receivable for services we provided, reduced by any deferred revenues.
|
December 31, 2016
|
|||||||||||
|
Total assets
|
Total liabilities
|
Maximum exposure to loss
|
|||||||||
|
(in thousands)
|
|||||||||||
|
Accounts receivable
|
$
|
7
|
|
$
|
—
|
|
$
|
—
|
|
||
|
Accounts payable
|
—
|
|
3
|
|
—
|
|
|||||
|
Deferred revenue, current portion
|
—
|
|
1,297
|
|
—
|
|
|||||
|
Deferred revenue, net of current portion
|
—
|
|
264
|
|
—
|
|
|||||
|
$
|
7
|
|
$
|
1,564
|
|
$
|
—
|
|
|||
We have assigned certain payment and performance obligations under the leases and master fleet service agreements for
2,613
of the railcars to the VIEs, but we have retained certain rights and obligations with respect to the servicing of these railcars.
During the years
2016
,
2015
and
2014
, we provided no explicit or implicit financial or other support to these VIEs that were not previously contractually required.
13. TRANSACTIONS WITH RELATED PARTIES
Nature of Relationship with Related Parties
USD is engaged in designing, developing, owning and managing large-scale multi-modal logistics centers and other energy-related midstream infrastructure across North America. USD is also the sole owner of USDG and the
117
ultimate parent of our general partner. USD is owned by Energy Capital Partners, Goldman Sachs and certain members of its management.
USDG is the sole owner of our general partner. Prior to our IPO, USDG held a
98.0%
limited partner interest in us, and at
December 31, 2016
owned
3,186,254
of our common units and all
8,370,836
of our subordinated units representing a combined
49.9%
limited partner interest in us. USDG also provides us with general and administrative support services necessary for the operation and management of our business.
USD Partners GP LLC, our general partner both before and after the IPO, currently owns all
461,136
of our general partner units representing an approximate
2%
general partner interest in us, as well as all of our incentive distribution rights. Pursuant to our partnership agreement, our general partner is responsible for our overall governance and operations.
Initial Public Offering Transactions
In connection with our IPO, we entered into agreements regarding the vesting of assets in, the assumption of liabilities by us and our subsidiaries, and the application of the proceeds from the IPO. We also completed other transactions in connection with the closing of our IPO pursuant to which USD conveyed to us its ownership interests in each of its subsidiaries that own or operate the Hardisty, San Antonio and West Colton terminals and the railcar business. In exchange for these ownership interests, we: (1) issued to USDG
1,093,545
of our common units and all
10,463,545
of our subordinated units, in each case representing limited partner interests in us, (2) assumed
$30 million
of borrowings under a senior secured credit agreement payable to Bank of Oklahoma and (3) granted USDG the right to receive
$100 million
. Additionally, we issued our general partner
427,083
general partner units, representing a
2.0%
general partner interest in us, as well as all of our incentive distribution rights. We have entered into various agreements as discussed below with our general partner, USDG and its affiliates on terms that we consider to be no less favorable to us or our subsidiaries than those that could have been negotiated with unaffiliated parties for similar services.
Omnibus Agreement
We are a party to an omnibus agreement with USD, USDG and certain of their subsidiaries including our general partner that provide for the following matters:
|
•
|
our payment of an annual amount to USDG for providing certain general and administrative services by USDG and its affiliates and executive management services by officers of our general partner. Other portions of this annual amount are based on the costs actually incurred by USDG and its affiliates in providing the services;
|
|
•
|
our right of first offer to acquire any Hardisty expansion projects as well as other additional midstream infrastructure that USD and USDG may construct or acquire in the future;
|
|
•
|
our obligation to reimburse USDG for any out-of-pocket costs and expenses incurred by USDG in providing general and administrative services (which reimbursement is in addition to certain expenses of our general partner and its affiliates that are reimbursed under our partnership agreement), as well as any other out-of-pocket expenses incurred by USDG on our behalf; and
|
|
•
|
an indemnity by USDG for certain environmental and other liabilities, and our obligation to indemnify USDG and its subsidiaries for events and conditions associated with the operation of our assets that occur after the closing of the IPO and for environmental liabilities related to our assets to the extent USDG is not required to indemnify us.
|
So long as USDG controls our general partner, the omnibus agreement will remain in full force and effect. If USDG ceases to control our general partner, either party may terminate the omnibus agreement, provided that the indemnification obligations will remain in full force and effect in accordance with their terms.
Payment of Annual Fee and Reimbursement of Expenses
We pay USDG, in equal monthly installments, the annual amount USDG estimates will be payable by us during the calendar year for providing services for our benefit. The omnibus agreement provides that this amount, which included a fixed annual fee of
$3.2 million
and
$2.5 million
for the years ended
December 31, 2016
and
2015
, respectively, may be adjusted annually to reflect, among other things, changes in the scope of the general and
118
administrative services provided to us due to a contribution of assets to us, or an acquisition or disposition of assets by us, or our subsidiaries, or for changes in any law, rule or regulation applicable to us, which affects the cost of providing the general and administrative services. We also reimburse USDG for any out-of-pocket costs and expenses incurred on our behalf in providing general and administrative services to us. This reimbursement is in addition to our reimbursement of our general partner and its affiliates for certain costs and expenses incurred on our behalf for managing our business and operations, as required by our partnership agreement.
The total amounts charged to us under the omnibus agreement for the years ended
December 31, 2016
,
2015
and
2014
was
$5.8 million
,
$4.7 million
and
$0.4 million
, respectively, which amounts are included in "Selling, general and administrative
—
related party" in our consolidated statements of operations. We had a payable balance of
$0.2 million
with respect to these costs at
December 31, 2016
and also at
2015
, included in "Accounts payable and accrued expenses
—
related party" within our consolidated balance sheets.
From time to time, in the ordinary course of business, USD and its affiliates may receive vendor payments or other amounts due to us or our subsidiaries. In addition, we may make payments to vendors and other unrelated parties on behalf of USD and its affiliates for which they routinely reimburse us. We had a receivable balance at
December 31, 2016
of
$0.2 million
related to these transactions included in "Accounts receivable — related party" within our consolidated balance sheet and
no
similar amounts receivable at
December 31, 2015
.
Right of First Offer
Under the omnibus agreement, until the
seven
th anniversary of the closing of our IPO, prior to engaging in any negotiation regarding the sale, transfer or disposition of certain specified expansion projects at our Hardisty terminal retained by USDG or any other midstream infrastructure assets that USD or USDG may develop, construct or acquire, USD or USDG is required to provide written notice to us setting forth the material terms and conditions upon which USD or USDG would sell or transfer such assets or businesses to us. Following the receipt of such notice, we will have
60 days
to determine whether the asset is suitable for our business at that particular time, and to propose a transaction with USD or USDG. We and USD or USDG will then have
60 days
to negotiate in good faith to reach an agreement on such transaction. If we and USD or USDG, as applicable, are unable to agree on terms during such
60
-day period, then USD or USDG, as applicable, may transfer such asset to any third party during a
180
-day period following the expiration of such
60
-day period on terms generally no less favorable to the third party than those included in the written notice.
Our decision to make any offer will require the approval of the conflicts committee of the board of directors of our general partner. The consummation and timing of any acquisition by us of the assets covered by our right of first offer will depend on, among other factors, USD or USDG’s decision to sell an asset covered by our right of first offer, our ability to reach an agreement with USD or USDG on the price and other terms and our ability to obtain financing on acceptable terms. USD or USDG are under no obligation to accept any offer that we may choose to make.
Additionally, the approval of Energy Capital Partners is required for the sale of any assets by USD or its subsidiaries, including sales to or by USDG and us (other than sales in the ordinary course of business), acquisitions of securities of other entities that exceed specified materiality thresholds and any material unbudgeted expenditures or deviations from our approved budgets. Energy Capital Partners may make these decisions free of any duty to us and our unitholders. This approval would be required for the potential acquisition by us of any Hardisty expansion projects, as well as any other projects or assets that USD or USDG may develop or acquire in the future or any third party acquisition we may intend to pursue jointly or independently from USD or USDG. Energy Capital Partners is under no obligation to approve any such transaction.
Indemnification
Under the omnibus agreement, USDG has agreed to indemnify us for all known and certain unknown environmental liabilities that are associated with the ownership or operation of our assets and due to occurrences on or before October 15, 2014, the closing date of our IPO. Indemnification for any unknown environmental liabilities is limited to liabilities due to occurrences on or before October 15, 2014 and are identified prior to October 15, 2017, and are subject to an aggregate deductible of
$500,000
before we are entitled to indemnification. Additionally, the omnibus
119
agreement imposes a
$10.0 million
ceiling on the amount for which USDG indemnifies us with respect to environmental claims once we meet the deductible, if applicable. USDG also indemnifies us for certain defects in title to the assets contributed to us and failure to obtain certain consents, licenses and permits necessary to conduct our business, including the cost of curing any such condition and certain tax liabilities attributable to the operation of the assets contributed to us prior to the time they were contributed that are identified prior to the fifth anniversary of the closing of our IPO.
USDG also indemnifies us for liabilities, subject to an aggregate deductible of
$500,000
, relating to:
|
•
|
the assets contributed to us, other than environmental liabilities, that arise out of the ownership or operation of the assets prior to the closing of the IPO and that are asserted prior to the third anniversary of the closing of the IPO;
|
|
•
|
events and conditions associated with any assets retained by USDG; and
|
|
•
|
all tax liabilities attributable to the assets contributed to us arising prior to the closing of the IPO or otherwise related to USDG’s contribution of those assets to us in connection with the IPO.
|
Assignment of Costs
During the first quarter of 2015, USDG assumed the obligation to pay a portion of the freight costs associated with the movement of empty railcars related to a customer contract entered into in June 2013, prior to our formation. The assumption was effective as of January 1, 2015 and included reimbursement to us for any amounts we paid subsequent to the effective date. We did
no
t receive any significant reimbursements pursuant to the terms of the assumption agreement for the year ended
December 31, 2016
. During the year ended
December 31, 2015
, we were reimbursed approximately
$2.9 million
, by USDG pursuant to the agreement. As of
December 31, 2016
and
2015
, we had
no
amounts receivable in respect to these costs.
Variable Interest Entities
We entered into purchase, assignment and assumption agreements to assign payment and performance obligations for certain operating lease agreements as well as customer fleet service payments related to these operating leases with the VIEs. Prior to July 1, 2016, a member of the board of directors of USD exercised control over the VIEs as its managing member. Subsequent to June 30, 2016, the managing member transferred ownership of the VIEs to a party that is unaffiliated with USD or us. As a result, for periods following June 30, 2016, we no longer treat the VIEs as related parties. Refer to
Note 12 – Nonconsolidated Variable Interest Entities
for additional discussion and information regarding transactions with the VIEs subsequent to June 30, 2016.
For periods prior to July 1, 2016, our related party sales to the VIEs are included in the accompanying consolidated statements of operations as set forth in the following table for the indicated periods:
|
For the Years Ended December 31,
|
|||||||||||
|
2016
|
2015
|
2014
|
|||||||||
|
(in millions)
|
|||||||||||
|
Fleet services — related parties
|
$
|
0.8
|
|
$
|
1.9
|
|
$
|
1.5
|
|
||
The following table summarizes the total assets and liabilities between us and the VIEs at
December 31, 2015
, at which time the VIEs were considered related parties:
|
December 31, 2015
|
|||||||||||
|
Total assets
|
Total liabilities
|
Maximum exposure to loss
|
|||||||||
|
(in thousands)
|
|||||||||||
|
Accounts receivable — related party
|
$
|
196
|
|
$
|
—
|
|
$
|
—
|
|
||
|
Deferred revenue, current portion — related party
|
—
|
|
1,287
|
|
—
|
|
|||||
|
Deferred revenue, net of current portion — related party
|
—
|
|
1,542
|
|
—
|
|
|||||
|
$
|
196
|
|
$
|
2,829
|
|
$
|
—
|
|
|||
120
Related Party Revenue and Deferred Revenue
We have agreements to provide USD Marketing LLC, or USDM, a wholly owned subsidiary of USDG, terminalling and fleet services with respect to our Hardisty terminal operations, which include reimbursement to us for certain out-of-pocket expenses we incur. The terms and conditions of these agreements are consistent with the terms and conditions of our agreements with unrelated parties at the Hardisty terminal.
Information about related party sales to USDM is presented below:
|
For the Years Ended December 31,
|
|||||||||||
|
2016
|
2015
|
2014
|
|||||||||
|
(in thousands)
|
|||||||||||
|
Terminalling services — related party
|
$
|
6,933
|
|
$
|
5,228
|
|
$
|
—
|
|
||
|
Fleet leases — related party
|
3,560
|
|
4,123
|
|
—
|
|
|||||
|
Fleet services — related party
|
1,116
|
|
966
|
|
—
|
|
|||||
|
Freight and other reimbursables — related party
|
—
|
|
85
|
|
—
|
|
|||||
|
$
|
11,609
|
|
$
|
10,402
|
|
$
|
—
|
|
|||
Additionally, we have deferred revenue included in "Deferred revenue, current – related party" in our consolidated balance sheets associated with our terminalling and fleets services agreements with USDM for amounts we have collected from them for their minimum volume commitment fees and prepaid lease amounts as follows:
|
December 31,
|
|||||||
|
2016
|
2015
|
||||||
|
(in thousands)
|
|||||||
|
Customer prepayments, current portion
(1)
|
$
|
390
|
|
$
|
390
|
|
|
|
Minimum monthly commitment fees
|
3,902
|
|
3,808
|
|
|||
|
Total deferred revenue, current portion
|
$
|
4,292
|
|
$
|
4,198
|
|
|
|
(1)
|
Represents amounts associated with lease payments received in advance.
|
We also have agreements with J. Aron & Company, or J. Aron, a wholly owned subsidiary of The Goldman Sachs Group, Inc., or GS, to provide terminalling and fleet services, with respect to our Hardisty terminal operations, which includes reimbursement to us for certain out-of-pocket expenses we incur. GS ceased to be a principal shareholder of USD in October 2014, and as a result, for
2015
and periods thereafter, J. Aron is no longer treated as a related party. The terms and conditions of these agreements are similar to the terms and conditions of our agreements with unrelated parties at the Hardisty terminal. J. Aron has entered into assignment arrangements with third parties in respect to portions of these services and may do so again in the future.
Information about related party sales to J. Aron is presented below:
|
For the Year Ended December 31,
|
|||
|
2014
|
|||
|
(in thousands)
|
|||
|
Terminalling services — related party
|
$
|
3,499
|
|
|
Freight and other reimbursables — related party
|
464
|
|
|
|
$
|
3,963
|
|
|
We did
no
t have any outstanding balances due from J. Aron as of
December 31, 2016
and
2015
.
121
Cost Allocations
Prior to our IPO, USDG allocated overhead costs to us for general and administrative services, including insurance, professional fees, facilities, information services, human resources and other support provided to us. Where costs incurred on our behalf could not be determined by specific identification, the costs were primarily allocated evenly across the number of operating subsidiaries or allocated based on budgeted volumes or projected revenues. We believe these allocations are a reasonable reflection of the utilization of services provided. However, the allocations may not fully reflect the expenses that we would have incurred had we been a stand-alone company during the periods presented. Following our IPO, we are charged these costs as set forth in the Omnibus agreement as discussed above.
The total amounts charged to us for overhead cost allocations for the year ended
December 31, 2014
were
$3.5 million
, which was recorded in "Selling, general and administrative — related party" within the consolidated statements of operations.
Cash Distributions
We paid aggregate cash distributions to USDG as a holder of our common units and all of our subordinated units and to USD Partners GP LLC for their general partner interest as set forth in the tables below on the dates indicated.
|
Year Ended December 31, 2016
|
||||||||||||
|
Distribution Declaration Date
|
Record Date
|
Distribution
Payment Date
|
Amount Paid to
USDG
|
Amount Paid to
USD Partners GP LLC
|
||||||||
|
(in thousands)
|
||||||||||||
|
February 4, 2016
|
February 15, 2016
|
February 19, 2016
|
$
|
3,467
|
|
$
|
138
|
|
||||
|
April 28, 2016
|
May 9, 2016
|
May 13, 2016
|
3,554
|
|
142
|
|
||||||
|
July 28, 2016
|
August 8, 2016
|
August 12, 2016
|
3,640
|
|
145
|
|
||||||
|
October 27, 2016
|
November 7, 2016
|
November 14, 2016
|
3,727
|
|
149
|
|
||||||
|
$
|
14,388
|
|
$
|
574
|
|
|||||||
|
Year Ended December 31, 2015
|
||||||||||||
|
Distribution Declaration Date
|
Record Date
|
Distribution
Payment Date
|
Amount Paid to
USDG
|
Amount Paid to
USD Partners GP LLC
|
||||||||
|
(in thousands)
|
||||||||||||
|
January 29, 2015
|
February 9, 2015
|
February 13, 2015
|
$
|
2,817
|
|
$
|
102
|
|
||||
|
April 28, 2015
|
May 11, 2015
|
May 15, 2015
|
3,322
|
|
123
|
|
||||||
|
July 30, 2015
|
August 10, 2015
|
August 14, 2015
|
3,352
|
|
124
|
|
||||||
|
October 29, 2015
|
November 9, 2015
|
November 13, 2015
|
3,381
|
|
125
|
|
||||||
|
$
|
12,872
|
|
$
|
474
|
|
|||||||
In 2014, we paid cash distributions of
$107.8 million
to USD in connection with the completion of our IPO.
Transition Services Agreement
In connection with our acquisition of the Casper terminal in November 2015, we entered into a transition services agreement with Cogent, pursuant to which Cogent provided certain accounting, administrative, customer support and information technology support services to the Casper terminal for three months following the closing date, while we transitioned such services to our management.
Two
officers of an affiliate of our general partner are the principal owners of Cogent. As a result these officers are considered to be beneficiaries of this agreement. Pursuant to the terms of this agreement, we incurred approximately
$52 thousand
and
$44 thousand
of expenses for
December 31, 2016
and
2015
.
122
14. COMMITMENTS AND CONTINGENCIES
Rail Service Agreements
We have rail service agreements at our terminal facilities with labor service providers that expire at various dates from
2017
through
2019
. After the initial term of the agreements, the rail service contracts will continue to be in effect for consecutive
one
-year terms unless either party provides the other party written notice prior to the end of the term. Under these agreements, we incurred approximately
$8.1 million
,
$7.7 million
and
$7.0 million
in service fees for the years ended
December 31, 2016
,
2015
and
2014
, respectively, which are recorded in "Subcontracted rail services" within our consolidated statements of operations.
The future minimum payments for these rail services agreements are as follows (in thousands):
|
Year ending December 31,
|
|||
|
2017
|
$
|
7,105
|
|
|
2018
|
6,124
|
|
|
|
2019
|
3,704
|
|
|
|
Total
|
$
|
16,933
|
|
Operating Leases and Fleet Lease Income
We have non-cancellable operating leases for railroad tracks, land surfaces, and railcars that expire on various dates from
2016
through
2024
. We incurred
$0.4 million
,
$0.4 million
and
$0.3 million
in lease expenses for buildings, offices, tracks and land for the years ended
December 31, 2016
,
2015
and
2014
, respectively, which are recorded in "Operating and maintenance" within our consolidated statements of operations. Additionally, we incurred
$6.2 million
,
$11.8 million
and
$8.8 million
of fleet service expenses for railcar leases for the years ended
December 31, 2016
,
2015
and
2014
, respectively, which are recorded in "Fleet leases" within our consolidated statements of operations.
The approximate amount of our future minimum lease payments under our non-cancellable operating leases are as follows (in thousands):
|
Year ending December 31,
|
|||
|
2017
|
$
|
4,467
|
|
|
2018
|
4,071
|
|
|
|
2019
|
4,071
|
|
|
|
2020
|
4,072
|
|
|
|
2021
|
4,072
|
|
|
|
Thereafter
|
3,831
|
|
|
|
Total
|
$
|
24,584
|
|
We serve as an intermediary to assist our customers with obtaining railcars. In connection with our leasing of railcars from third parties, we simultaneously enter into lease agreements with our customers for non-cancellable terms that are designed to recover our costs associated with leasing the railcars as well as a fee for providing this service. Our lease agreements with customers require them to make monthly payments to us totaling
$29.2 million
under non-cancellable terms through
2022
, which are concurrent with the payments we are required to make to our lessors under our non-cancellable operating leases as set forth in the table above. We record the revenue we derive from these leases in "Fleet leases" and "Fleet leases
—
related party" within our consolidated statements of operations.
123
The approximate amount of our future rental income under non-cancellable operating leases are as follows (in thousands):
|
Year ending December 31,
|
|||
|
2017
|
$
|
5,789
|
|
|
2018
|
4,678
|
|
|
|
2019
|
4,678
|
|
|
|
2020
|
4,678
|
|
|
|
2021
|
4,678
|
|
|
|
Thereafter
|
4,678
|
|
|
|
Total
|
$
|
29,179
|
|
Contingent Liabilities
From time to time, we may be involved in legal, tax, regulatory and other proceedings in the ordinary course of business. We do not believe that we are currently a party to any such proceedings that will have a material adverse impact on our financial condition or results of operations.
In connection with the railcar services we provide, we regularly incur railcar cleanup and repair costs upon our return of these railcars to the lessors. We typically pass such costs on to our customers pursuant to the terms of our lease agreements with them. A legacy customer associated with a terminal sold by USD prior to our IPO has returned over
320
railcars to us, approximately
215
of which the lessors claim require additional cleaning and repair from alleged corrosion. We are currently in discussions with the lessors and our customer regarding the validity of these additional costs. We believe that our customer will ultimately be responsible for any costs associated with these returns, and USD has agreed to indemnify us to the extent that we are unable to recover any such costs from our customer.
124
15. SEGMENT REPORTING
We manage our businesses in
two
reportable segments: Terminalling services and Fleet services. The Terminalling services segment charges minimum monthly commitment fees under multi-year take-or-pay contracts to load various grades of crude oil into railcars as well as fixed fees per gallon to transload ethanol from railcars, including related logistics services. The Fleet services segment provides customers with railcars and fleet services related to the transportation of liquid hydrocarbons and biofuels under long-term, take-or-pay contracts. Corporate activities are not considered a reportable segment, but are included to present corporate and financing transactions which are not allocated to our established reporting segments.
Our segments offer different services and are managed accordingly. Our chief operating decision maker, or CODM, regularly reviews financial information about both segments in order to allocate resources and evaluate performance. Our CODM assesses segment performance based on the cash flows produced by our established reporting segments using Segment Adjusted EBITDA. We define Segment Adjusted EBITDA as "Net cash provided by operating activities" adjusted for changes in working capital items, changes in restricted cash, interest, income taxes, foreign currency transaction gains and losses, adjustments related to deferred revenue associated with minimum monthly commitment fees and other items which do not affect the underlying cash flows produced by our businesses.
The following tables summarize our reportable segment data for continuing operations:
|
For the Year Ended December 31, 2016
|
|||||||||||||||
|
Terminalling
services
|
Fleet
services
|
Corporate
|
Total
|
||||||||||||
|
(in thousands)
|
|||||||||||||||
|
Revenues
|
|||||||||||||||
|
Terminalling services
|
$
|
93,014
|
|
$
|
—
|
|
$
|
—
|
|
$
|
93,014
|
|
|||
|
Terminalling services — related party
|
6,933
|
|
—
|
|
—
|
|
6,933
|
|
|||||||
|
Railroad incentives
|
76
|
|
—
|
|
—
|
|
76
|
|
|||||||
|
Fleet leases
|
—
|
|
2,577
|
|
—
|
|
2,577
|
|
|||||||
|
Fleet leases — related party
|
—
|
|
3,560
|
|
—
|
|
3,560
|
|
|||||||
|
Fleet services
|
—
|
|
1,084
|
|
—
|
|
1,084
|
|
|||||||
|
Fleet services — related party
|
—
|
|
1,926
|
|
—
|
|
1,926
|
|
|||||||
|
Freight and other reimbursables
|
13
|
|
1,942
|
|
—
|
|
1,955
|
|
|||||||
|
Freight and other reimbursables — related party
|
—
|
|
—
|
|
—
|
|
—
|
|
|||||||
|
Total revenues
|
100,036
|
|
11,089
|
|
—
|
|
111,125
|
|
|||||||
|
Operating costs
|
|||||||||||||||
|
Subcontracted rail services
|
8,077
|
|
—
|
|
—
|
|
8,077
|
|
|||||||
|
Pipeline fees
|
20,799
|
|
—
|
|
—
|
|
20,799
|
|
|||||||
|
Fleet leases
|
—
|
|
6,174
|
|
—
|
|
6,174
|
|
|||||||
|
Freight and other reimbursables
|
13
|
|
1,942
|
|
—
|
|
1,955
|
|
|||||||
|
Operating and maintenance
|
2,625
|
|
337
|
|
—
|
|
2,962
|
|
|||||||
|
Selling, general and administrative
|
4,899
|
|
823
|
|
9,704
|
|
15,426
|
|
|||||||
|
Depreciation and amortization
|
23,092
|
|
—
|
|
—
|
|
23,092
|
|
|||||||
|
Total operating costs
|
59,505
|
|
9,276
|
|
9,704
|
|
78,485
|
|
|||||||
|
Operating income (loss)
|
40,531
|
|
1,813
|
|
(9,704
|
)
|
32,640
|
|
|||||||
|
Interest expense, net
|
1,006
|
|
—
|
|
8,831
|
|
9,837
|
|
|||||||
|
Loss associated with derivative instruments
|
140
|
|
—
|
|
—
|
|
140
|
|
|||||||
|
Foreign currency transaction gain
|
(28
|
)
|
(71
|
)
|
(651
|
)
|
(750
|
)
|
|||||||
|
Provision for (benefit from) income taxes
|
(1,184
|
)
|
242
|
|
183
|
|
(759
|
)
|
|||||||
|
Net income (loss)
|
$
|
40,597
|
|
$
|
1,642
|
|
$
|
(18,067
|
)
|
$
|
24,172
|
|
|||
|
Total assets
|
$
|
297,250
|
|
$
|
5,773
|
|
$
|
2,944
|
|
$
|
305,967
|
|
|||
|
Capital expenditures and acquisitions
|
$
|
474
|
|
$
|
—
|
|
$
|
—
|
|
$
|
474
|
|
|||
125
|
For the Year Ended December 31, 2015
|
|||||||||||||||
|
Terminalling
services
|
Fleet
services
|
Corporate
|
Total
|
||||||||||||
|
(in thousands)
|
|||||||||||||||
|
Revenues
|
|||||||||||||||
|
Terminalling services
|
$
|
58,841
|
|
$
|
—
|
|
$
|
—
|
|
$
|
58,841
|
|
|||
|
Terminalling services — related party
|
5,228
|
|
—
|
|
—
|
|
5,228
|
|
|||||||
|
Railroad incentives
|
434
|
|
—
|
|
—
|
|
434
|
|
|||||||
|
Fleet leases
|
—
|
|
7,710
|
|
—
|
|
7,710
|
|
|||||||
|
Fleet leases— related party
|
—
|
|
4,123
|
|
—
|
|
4,123
|
|
|||||||
|
Fleet services
|
—
|
|
622
|
|
—
|
|
622
|
|
|||||||
|
Fleet services — related party
|
—
|
|
2,840
|
|
—
|
|
2,840
|
|
|||||||
|
Freight and other reimbursables
|
—
|
|
1,880
|
|
—
|
|
1,880
|
|
|||||||
|
Freight and other reimbursables — related party
|
—
|
|
85
|
|
—
|
|
85
|
|
|||||||
|
Total revenues
|
64,503
|
|
17,260
|
|
—
|
|
81,763
|
|
|||||||
|
Operating costs
|
|||||||||||||||
|
Subcontracted rail services
|
7,710
|
|
—
|
|
—
|
|
7,710
|
|
|||||||
|
Pipeline fees
|
17,249
|
|
—
|
|
—
|
|
17,249
|
|
|||||||
|
Fleet leases
|
—
|
|
11,833
|
|
—
|
|
11,833
|
|
|||||||
|
Freight and other reimbursables
|
—
|
|
1,965
|
|
—
|
|
1,965
|
|
|||||||
|
Operating and maintenance
|
1,768
|
|
294
|
|
—
|
|
2,062
|
|
|||||||
|
Selling, general and administrative
|
4,156
|
|
741
|
|
7,483
|
|
12,380
|
|
|||||||
|
Depreciation and amortization
|
6,110
|
|
—
|
|
—
|
|
6,110
|
|
|||||||
|
Total operating costs
|
36,993
|
|
14,833
|
|
7,483
|
|
59,309
|
|
|||||||
|
Operating income (loss)
|
27,510
|
|
2,427
|
|
(7,483
|
)
|
22,454
|
|
|||||||
|
Interest expense, net
|
2,026
|
|
—
|
|
2,342
|
|
4,368
|
|
|||||||
|
Gain associated with derivative instruments
|
(5,161
|
)
|
—
|
|
—
|
|
(5,161
|
)
|
|||||||
|
Foreign currency transaction loss (gain)
|
166
|
|
43
|
|
(410
|
)
|
(201
|
)
|
|||||||
|
Provision for income taxes
|
5,581
|
|
173
|
|
1
|
|
5,755
|
|
|||||||
|
Net income (loss)
|
$
|
24,898
|
|
$
|
2,211
|
|
$
|
(9,416
|
)
|
$
|
17,693
|
|
|||
|
Total assets
|
$
|
316,232
|
|
$
|
5,719
|
|
$
|
6,447
|
|
$
|
328,398
|
|
|||
|
Capital expenditures
|
$
|
212,116
|
|
$
|
—
|
|
$
|
—
|
|
$
|
212,116
|
|
|||
126
|
For the Year Ended December 31, 2014
|
|||||||||||||||
|
Terminalling
services
|
Fleet
services
|
Corporate
|
Total
|
||||||||||||
|
(in thousands)
|
|||||||||||||||
|
Revenues
|
|||||||||||||||
|
Terminalling services
|
$
|
18,266
|
|
$
|
—
|
|
$
|
—
|
|
$
|
18,266
|
|
|||
|
Terminalling services — related party
|
3,499
|
|
—
|
|
—
|
|
3,499
|
|
|||||||
|
Railroad incentives
|
719
|
|
—
|
|
—
|
|
719
|
|
|||||||
|
Fleet leases
|
—
|
|
8,788
|
|
—
|
|
8,788
|
|
|||||||
|
Fleet services
|
—
|
|
720
|
|
—
|
|
720
|
|
|||||||
|
Fleet services — related party
|
—
|
|
1,501
|
|
—
|
|
1,501
|
|
|||||||
|
Freight and other reimbursables
|
—
|
|
2,141
|
|
—
|
|
2,141
|
|
|||||||
|
Freight and other reimbursables — related party
|
—
|
|
464
|
|
—
|
|
464
|
|
|||||||
|
Total revenues
|
22,484
|
|
13,614
|
|
—
|
|
36,098
|
|
|||||||
|
Operating costs
|
|||||||||||||||
|
Subcontracted rail services
|
6,994
|
|
—
|
|
—
|
|
6,994
|
|
|||||||
|
Pipeline fees
|
3,625
|
|
—
|
|
—
|
|
3,625
|
|
|||||||
|
Fleet leases
|
—
|
|
8,788
|
|
—
|
|
8,788
|
|
|||||||
|
Freight and other reimbursables
|
—
|
|
2,605
|
|
—
|
|
2,605
|
|
|||||||
|
Operating and maintenance
|
1,924
|
|
200
|
|
—
|
|
2,124
|
|
|||||||
|
Selling, general and administrative
|
4,366
|
|
2,450
|
|
1,868
|
|
8,684
|
|
|||||||
|
Depreciation
|
2,631
|
|
—
|
|
—
|
|
2,631
|
|
|||||||
|
Total operating costs
|
19,540
|
|
14,043
|
|
1,868
|
|
35,451
|
|
|||||||
|
Operating income (loss)
|
2,944
|
|
(429
|
)
|
(1,868
|
)
|
647
|
|
|||||||
|
Interest expense, net
|
3,600
|
|
—
|
|
1,225
|
|
4,825
|
|
|||||||
|
Gain associated with derivative instruments
|
(1,536
|
)
|
—
|
|
—
|
|
(1,536
|
)
|
|||||||
|
Foreign currency transaction loss (gain)
|
4,406
|
|
(17
|
)
|
461
|
|
4,850
|
|
|||||||
|
Provision for (benefit from) income taxes
|
47
|
|
140
|
|
(1
|
)
|
186
|
|
|||||||
|
Net loss
|
$
|
(3,573
|
)
|
$
|
(552
|
)
|
$
|
(3,553
|
)
|
$
|
(7,678
|
)
|
|||
|
Total assets
|
$
|
105,093
|
|
$
|
7,692
|
|
$
|
35,495
|
|
$
|
148,280
|
|
|||
|
Capital expenditures
|
$
|
33,736
|
|
$
|
—
|
|
$
|
—
|
|
$
|
33,736
|
|
|||
127
Segment Adjusted EBITDA
The following table provides a reconciliation of Segment Adjusted EBITDA to "Net cash provided by (used in) operating activities":
|
For the Years Ended December 31,
|
|||||||||||
|
2016
|
2015
|
2014
|
|||||||||
|
(in thousands)
|
|||||||||||
|
Segment Adjusted EBITDA
|
|||||||||||
|
Terminalling services
|
$
|
67,507
|
|
$
|
45,347
|
|
$
|
15,397
|
|
||
|
Fleet services
|
1,813
|
|
2,427
|
|
1,187
|
|
|||||
|
Corporate activities
(1)
|
(5,630
|
)
|
(5,022
|
)
|
(1,318
|
)
|
|||||
|
Total Adjusted EBITDA
|
63,690
|
|
42,752
|
|
15,266
|
|
|||||
|
Add (deduct):
|
|||||||||||
|
Amortization of deferred financing costs
|
861
|
|
659
|
|
1,056
|
|
|||||
|
Deferred income taxes
|
46
|
|
814
|
|
—
|
|
|||||
|
Bad debt expense
|
—
|
|
—
|
|
1,424
|
|
|||||
|
Unrecovered reimbursable freight costs
(2)
|
—
|
|
—
|
|
(1,616
|
)
|
|||||
|
Changes in accounts receivable and other assets
|
1,859
|
|
(730
|
)
|
(8,511
|
)
|
|||||
|
Changes in accounts payable and accrued expenses
|
(1,917
|
)
|
(880
|
)
|
(2,372
|
)
|
|||||
|
Changes in deferred revenue and other liabilities
|
(996
|
)
|
10,085
|
|
17,497
|
|
|||||
|
Change in restricted cash
|
(654
|
)
|
870
|
|
(6,490
|
)
|
|||||
|
Interest expense, net
|
(9,837
|
)
|
(4,368
|
)
|
(4,825
|
)
|
|||||
|
Benefit from (provision for) income taxes
|
759
|
|
(5,755
|
)
|
(186
|
)
|
|||||
|
Foreign currency transaction gain (loss)
(3)
|
750
|
|
201
|
|
(4,850
|
)
|
|||||
|
Deferred revenue associated with minimum monthly commitment fees
(4)
|
(1,485
|
)
|
(7,444
|
)
|
(9,478
|
)
|
|||||
|
Net cash provided by (used in) operating activities
|
$
|
53,076
|
|
$
|
36,204
|
|
$
|
(3,085
|
)
|
||
|
(1)
|
Corporate activities represent corporate and financing transactions that are not allocated to our established reporting segments.
|
|
(2)
|
Represents costs incurred with respect to unrecovered reimbursable freight costs associated with the initial delivery of railcars in support of our Hardisty terminal.
|
|
(3)
|
Represents foreign exchange transaction gains or losses associated with activities between our U.S. and Canadian subsidiaries.
|
|
(4)
|
Represents deferred revenue associated with minimum monthly commitment fees in excess of throughput utilized, which fees are not refundable to our customers. Amounts presented are net of: (a) the corresponding prepaid Gibson pipeline fee that will be recognized as expense concurrently with the recognition of revenue; (b) revenue recognized in the current period that was previously deferred; and (c) expense recognized for previously prepaid Gibson pipeline fees, which correspond with the revenue recognized that was previously deferred. Refer to
Note 10 – Deferred Revenue
for additional discussion of deferred revenue.
|
The following tables summarize the geographic data for our continuing operations:
|
For the Year Ended December 31, 2016
|
|||||||||||
|
U.S.
|
Canada
|
Total
|
|||||||||
|
(in thousands)
|
|||||||||||
|
Revenues
|
|||||||||||
|
Third party
|
$
|
44,792
|
|
$
|
53,914
|
|
$
|
98,706
|
|
||
|
Related party
|
$
|
5,426
|
|
$
|
6,993
|
|
$
|
12,419
|
|
||
|
Total assets
|
$
|
224,450
|
|
$
|
81,517
|
|
$
|
305,967
|
|
||
128
|
For the Year Ended December 31, 2015
|
|||||||||||
|
U.S.
|
Canada
|
Total
|
|||||||||
|
(in thousands)
|
|||||||||||
|
Revenues
|
|||||||||||
|
Third party
|
$
|
20,134
|
|
$
|
49,353
|
|
$
|
69,487
|
|
||
|
Related party
|
$
|
6,945
|
|
$
|
5,331
|
|
$
|
12,276
|
|
||
|
Total assets
|
$
|
250,309
|
|
$
|
78,089
|
|
$
|
328,398
|
|
||
|
For the Year Ended December 31, 2014
|
|||||||||||
|
U.S.
|
Canada
|
Total
|
|||||||||
|
(in thousands)
|
|||||||||||
|
Revenues
|
|||||||||||
|
Third party
|
$
|
17,049
|
|
$
|
13,585
|
|
$
|
30,634
|
|
||
|
Related party
|
$
|
1,933
|
|
$
|
3,531
|
|
$
|
5,464
|
|
||
|
Total assets
|
$
|
50,967
|
|
$
|
97,313
|
|
$
|
148,280
|
|
||
16. INCOME TAXES
U.S. Federal and State Income Taxes
We are treated as a partnership for U.S. federal and most state income tax purposes, with each partner being separately taxed on their share of our taxable income. One of our subsidiaries, USD Rail LP, has elected to be classified as an entity taxable as a corporation for U.S. federal income tax purposes. We are also subject to state franchise tax in the state of Texas, which is treated as an income tax under the applicable accounting guidance. Our U.S. federal income tax expense for the year ended
December 31, 2016
and
2015
is based upon our effective federal income tax rate of
34%
as applied to the taxable loss of USD Rail LP in
2016
in the amount of
$755 thousand
and taxable income in the amount of
$161 thousand
for
2015
. As a result of the losses in
2016
we did
no
t record a provision for U.S. federal income tax for that year. For the year ended
December 31, 2015
, we utilized U.S. federal net operating loss carryforwards to partially offset our taxable income. For the year ended
December 31, 2014
, we had
no
U.S. federal income tax expense, and our state income tax expense was determined based on an effective Texas franchise tax rate of
0.50%
.
Foreign Income Taxes
Our Canadian operations are conducted through entities that are subject to Canadian federal and provincial income taxes. The Canadian federal income tax rate on business income is currently
15%
. In June 2015, the Canadian province of Alberta enacted a tax rate increase which raised income tax rates on Alberta businesses from a previous rate of
10%
to an effective rate of
11%
for all of
2015
, further increasing to
12%
beginning January 1, 2016. As a result, we recognized income tax liabilities and expenses in our consolidated financial statements based upon the combined federal and provincial income tax rate of
27%
as applied to the pretax book income for our Canadian operations for
2016
. The combined rate was also used to compute deferred income tax expense, which is the result of temporary differences that are expected to reverse in the future. For the year ended
December 31, 2015
, we used
$3.0 million
of available net operating loss carryforwards to partially offset our taxable income. As a result our effective Canadian income tax rate was
23.4%
for
2015
. For the year ended
December 31, 2014
, there was a net loss in our Canadian operations resulting in a loss carryforward.
In
2016
, prior to filing our
2015
Canadian tax returns, we adopted a methodology for determining the return attributable to our Canadian subsidiaries based upon completion of a study we initially commissioned in
2015
. The methodology for determining the return attributable to our Canadian subsidiaries supported by this study resulted in a reduction of our Canadian income tax liability for the
2015
tax year by
$4.4 million
. The resulting decrease in our Canadian income tax liability is reflected in our
2016
statements of operations as a reduction to our
2016
provision for income taxes.
129
Consolidated Provision for (Benefit from) Income Taxes
Components of our provision for (benefit from) income taxes are presented below:
|
Years Ended December 31,
|
|||||||||||
|
2016
|
2015
|
2014
|
|||||||||
|
(in thousands)
|
|||||||||||
|
Current income tax expense (benefit)
|
|||||||||||
|
U.S. federal income tax
|
$
|
—
|
|
$
|
346
|
|
$
|
—
|
|
||
|
Benefit of U.S. federal operating loss carryforward
|
—
|
|
(301
|
)
|
—
|
|
|||||
|
State income tax
|
208
|
|
154
|
|
156
|
|
|||||
|
Canadian federal and provincial income taxes (benefits)
|
(1,013
|
)
|
5,596
|
|
30
|
|
|||||
|
Benefit of Canadian operating loss carryforwards
|
—
|
|
(854
|
)
|
—
|
|
|||||
|
Total current income tax expense (benefit)
|
(805
|
)
|
4,941
|
|
186
|
|
|||||
|
Deferred income tax expense (benefit)
|
|||||||||||
|
U.S. federal income tax
|
245
|
|
—
|
|
—
|
|
|||||
|
Canadian federal and provincial income taxes (benefits)
|
(199
|
)
|
814
|
|
—
|
|
|||||
|
Total change in deferred income tax expense
|
46
|
|
814
|
|
—
|
|
|||||
|
Provision for (benefit from) income taxes
|
$
|
(759
|
)
|
$
|
5,755
|
|
$
|
186
|
|
||
The components of our income (loss) before provision for income taxes and a reconciliation between income tax expense based on the U.S. statutory income tax rate and our effective income tax expense are presented below:
|
Years Ended December 31,
|
|||||||||||
|
2016
|
2015
|
2014
|
|||||||||
|
(in thousands)
|
|||||||||||
|
Domestic
|
$
|
27,367
|
|
$
|
3,222
|
|
$
|
(2,374
|
)
|
||
|
Foreign
|
(3,954
|
)
|
20,226
|
|
(5,118
|
)
|
|||||
|
Income (loss) before provision for income taxes
|
$
|
23,413
|
|
$
|
23,448
|
|
$
|
(7,492
|
)
|
||
|
Income tax expense (benefit) at the U.S. federal statutory rate
|
$
|
7,961
|
|
$
|
7,972
|
|
$
|
(2,547
|
)
|
||
|
Income (loss) attributable to partnership not subject to income tax
|
(8,718
|
)
|
247
|
|
933
|
|
|||||
|
Foreign income tax rate differential
|
397
|
|
(2,303
|
)
|
313
|
|
|||||
|
Other
|
(68
|
)
|
135
|
|
—
|
|
|||||
|
State income tax expense
|
201
|
|
125
|
|
156
|
|
|||||
|
Change in valuation allowance
|
(532
|
)
|
(421
|
)
|
1,331
|
|
|||||
|
Provision for (benefit from) income taxes
|
$
|
(759
|
)
|
$
|
5,755
|
|
$
|
186
|
|
||
We have adopted the provisions of ASU 2015-17. Accordingly, we have classified our net deferred income tax liabilities as non-current in our consolidated balance sheets at
December 31, 2016
and
2015
.
130
Our deferred income tax assets and liabilities reflect the income tax effect of differences between the carrying amounts of our assets and liabilities for financial reporting purposes and the amounts used for income tax purposes. Major components of deferred income tax assets and liabilities associated with our operations are as follows as of the dates indicated:
|
December 31, 2016
|
|||||||||||
|
U.S.
|
Foreign
|
Total
|
|||||||||
|
(in thousands)
|
|||||||||||
|
Deferred income tax assets
|
|||||||||||
|
Deferred revenues
|
$
|
89
|
|
$
|
—
|
|
$
|
89
|
|
||
|
Capital loss carryforwards
|
—
|
|
438
|
|
438
|
|
|||||
|
Operating loss carryforwards
|
257
|
|
—
|
|
257
|
|
|||||
|
Deferred income tax liabilities
|
|
|
|||||||||
|
Prepaid expenses
|
(592
|
)
|
—
|
|
(592
|
)
|
|||||
|
Property and equipment
|
—
|
|
(577
|
)
|
(577
|
)
|
|||||
|
Deferred income tax liability
|
(246
|
)
|
(139
|
)
|
(385
|
)
|
|||||
|
Valuation allowance
|
—
|
|
(438
|
)
|
(438
|
)
|
|||||
|
Deferred income tax liability, net
|
$
|
(246
|
)
|
$
|
(577
|
)
|
$
|
(823
|
)
|
||
|
December 31, 2015
|
|||||||||||
|
U.S.
|
Foreign
|
Total
|
|||||||||
|
(in thousands)
|
|||||||||||
|
Deferred income tax assets
|
|||||||||||
|
Deferred revenues
|
$
|
1,212
|
|
$
|
—
|
|
$
|
1,212
|
|
||
|
Capital loss carryforwards
|
—
|
|
424
|
|
424
|
|
|||||
|
Operating loss carryforwards
|
7
|
|
—
|
|
7
|
|
|||||
|
Deferred income tax liabilities
|
|||||||||||
|
Prepaid expenses
|
(673
|
)
|
—
|
|
(673
|
)
|
|||||
|
Property and equipment
|
—
|
|
(749
|
)
|
(749
|
)
|
|||||
|
Deferred income tax asset (liability)
|
546
|
|
(325
|
)
|
221
|
|
|||||
|
Valuation allowance
|
(546
|
)
|
(424
|
)
|
(970
|
)
|
|||||
|
Deferred income tax liability, net
|
$
|
—
|
|
$
|
(749
|
)
|
$
|
(749
|
)
|
||
Our available U.S. federal loss carryforward was approximately
$0.8 million
at December 31, 2016, and will begin expiring in
2036
. During the year ended
December 31, 2015
, we utilized all of our available loss carryforward of
$0.7 million
existing at
December 31, 2014
for U.S. federal income tax purposes. The Canadian loss carryforward was approximately
$4.4 million
and
$4.9 million
at
December 31, 2016
and
2015
, respectively, and will begin expiring in
2033
.
We are subject to examination by the taxing authorities for the years ended
December 31, 2016
,
2015
and
2014
. USD has agreed to indemnify us for all federal, state and local liabilities for periods preceding the closing date of our initial public offering. We did
no
t have any unrecognized income tax benefits or any income tax reserves for uncertain tax positions as of
December 31, 2016
and
2015
.
131
17. MAJOR CUSTOMERS AND CONCENTRATION OF CREDIT RISK
The following tables provide the percentage of total revenues attributable to a single customer from which 10% or more of total revenues are derived:
|
For the Year Ended December 31, 2016
|
||||||||||||
|
Total Revenues by Major Customer
(in thousands)
|
Percentage of Total Company Revenues
|
Percentage of Customer Revenues in Terminalling Services Segment
|
Percentage of Customer Revenues in Fleet Services Segment
|
|||||||||
|
Customer A
|
$
|
11,140
|
|
10.0
|
%
|
96
|
%
|
4
|
%
|
|||
|
Customer B
|
$
|
15,827
|
|
14.2
|
%
|
100
|
%
|
—
|
%
|
|||
|
Customer C
|
$
|
11,436
|
|
10.3
|
%
|
100
|
%
|
—
|
%
|
|||
|
Customer D
|
$
|
11,611
|
|
10.4
|
%
|
60
|
%
|
40
|
%
|
|||
|
Customer E
|
$
|
10,158
|
|
9.1
|
%
|
100
|
%
|
—
|
%
|
|||
|
Customer F
|
$
|
4,334
|
|
3.9
|
%
|
—
|
%
|
100
|
%
|
|||
|
Customer G
|
$
|
15,249
|
|
13.7
|
%
|
100
|
%
|
—
|
%
|
|||
|
For the Year Ended December 31, 2015
|
||||||||||||
|
Total Revenues by Major Customer
(in thousands)
|
Percentage of Total Company Revenues
|
Percentage of Customer Revenues in Terminalling Services Segment
|
Percentage of Customer Revenues in Fleet Services Segment
|
|||||||||
|
Customer A
|
$
|
12,207
|
|
14.9
|
%
|
98
|
%
|
2
|
%
|
|||
|
Customer B
|
$
|
11,428
|
|
14.0
|
%
|
100
|
%
|
—
|
%
|
|||
|
Customer C
|
$
|
9,890
|
|
12.1
|
%
|
90
|
%
|
10
|
%
|
|||
|
Customer D
|
$
|
10,402
|
|
12.7
|
%
|
50
|
%
|
50
|
%
|
|||
|
Customer E
|
$
|
8,763
|
|
10.7
|
%
|
100
|
%
|
—
|
%
|
|||
|
Customer F
|
$
|
8,859
|
|
10.8
|
%
|
—
|
%
|
100
|
%
|
|||
|
Customer G
|
$
|
1,846
|
|
2.3
|
%
|
100
|
%
|
—
|
%
|
|||
A substantial portion of our revenues are from a limited number of customers. Our revenues are derived mainly from railcar loading and unloading services for bulk liquid products, switching, other terminalling services, and railcar fleet services. The industry concentration of these customers may impact our overall exposure to credit risk, either positively or negatively, since our customers may be similarly affected by changes in commodity prices, regulation, and other economic factors. We seek high-quality customers with investment grade credit ratings and perform ongoing credit evaluations of our customers.
18. DERIVATIVE FINANCIAL INSTRUMENTS
Our net income and cash flows are subject to fluctuations resulting from changes in interest rates on our variable rate debt obligations and foreign currency exchange rates, particularly with respect to the U.S. dollar and the Canadian dollar. At
December 31, 2016
and
2015
, we did not employ any derivative financial instruments to manage our exposure to fluctuations in interest rates, although we may use derivative financial instruments, including swaps, options and other financial instruments with similar characteristics to manage this exposure in the future.
A significant portion of the cash flows we produce are derived from our Hardisty terminal operations in the province of Alberta, Canada, which generate cash flows denominated in Canadian dollars. As a result, fluctuations in the exchange rate between the Canadian dollar and the U.S. dollar could have a significant effect on our results of operations, cash flows and financial position. We endeavor to limit our foreign currency risk exposure with derivative financial instruments. Specifically, we utilize foreign currency collar derivative contracts, representing written call
132
options and purchased put options, forward contracts, including swaps, and other types of derivative financial instruments to reduce these risks. Economically, the derivatives set an effective exchange rate for a specified value of Canadian cash flows as set forth in the derivative contracts. All of our derivative financial instruments are employed in connection with an underlying asset, liability and/or forecasted transaction and are not entered into for speculative purposes.
In April 2016, we entered into
four
separate forward contracts with an aggregate notional amount of
C$33.5 million
to manage our exposure to fluctuations in the exchange rate between the Canadian dollar and the U.S. dollar resulting from our Canadian operations during the 2017 calendar year. Each forward contract effectively fixes the exchange rate we will receive for each Canadian dollar we sell to the counterparty. One of these forward contracts will settle at the end of each fiscal quarter during 2017 and secures an exchange rate where a Canadian dollar is exchanged for an amount between
0.7804
and
0.7809
U.S. dollars.
In June 2015, we entered into
four
separate collar arrangements with an aggregate notional value of C
$32.0 million
, which were scheduled to settle at the end of each fiscal quarter during 2016, each having a notional value ranging between
C$7.9 million
and
C$8.1 million
. These derivative contracts were executed to secure cash flows totaling C
$32.0 million
at an exchange rate range where a Canadian dollar was exchanged for an amount between
0.84
and
0.86
U.S. dollars.
In May 2014, we entered into collar arrangements with an aggregate notional value of C
$37.2 million
, which, similar to the derivative contracts discussed above, were scheduled to settle at the end of each fiscal quarter through December 31, 2015. These derivative contracts were executed to secure cash flows totaling C
$37.2 million
at an exchange rate range where a Canadian dollar was exchanged for an amount between
0.91
and
0.93
U.S. dollars.
Derivative Positions
We recorded all of our derivative financial instruments at their fair values within our consolidated balance sheets as follows at the dates indicated:
|
December 31,
|
|||||||
|
2016
|
2015
|
||||||
|
(in thousands)
|
|||||||
|
Other current assets
|
$
|
1,167
|
|
$
|
3,705
|
|
|
We have not designated our derivative financial instruments as hedges of our foreign currency rate exposures. As a result, changes in the fair value of these derivatives are recorded as "Loss (gain) associated with derivative instruments" in our consolidated statements of operations. The gains or losses associated with changes in the fair value of our foreign currency derivative contracts do not affect our cash flows until the underlying contract is settled by making or receiving a payment to or from the counterparty. In connection with our derivative activities, we recognized the following amounts during the periods presented:
|
Years Ended December 31,
|
|||||||||||
|
2016
|
2015
|
2014
|
|||||||||
|
(in thousands)
|
|||||||||||
|
Loss (gain) associated with derivative instruments
|
$
|
140
|
|
$
|
(5,161
|
)
|
$
|
(1,536
|
)
|
||
133
We determine the fair value of our derivative financial instruments using third party pricing information that is derived from observable market inputs, which we classify as level 2 with respect to the fair value hierarchy. The following tables present summarized information about the fair values of our outstanding foreign currency contracts:
|
December 31, 2016
|
||||||||||||
|
Notional
|
Forward Rate
(1)
|
Market Price
(1)
|
Fair Value
|
|||||||||
|
(in thousands)
|
||||||||||||
|
Forward contracts maturing in 2017
|
||||||||||||
|
March 31, 2017
|
C$
|
8,300,000
|
|
0.7804
|
0.7444
|
$
|
299
|
|
||||
|
June 30, 2017
|
C$
|
8,400,000
|
|
0.7805
|
0.7453
|
296
|
|
|||||
|
September 29, 2017
|
C$
|
8,400,000
|
|
0.7807
|
0.7462
|
290
|
|
|||||
|
December 29, 2017
|
C$
|
8,400,000
|
|
0.7809
|
0.7473
|
282
|
|
|||||
|
Total
|
$
|
1,167
|
|
|||||||||
|
(1)
|
Forward rates and market prices are denoted in amounts where a Canadian dollar is exchanged for the indicated amount of U.S. dollars. The forward rate represents the rate we will receive upon settlement and the market price represents the rate we would expect to pay had the contract been settled on
December 31, 2016
.
|
|
December 31, 2015
|
||||||||||||||
|
Notional
|
Strike Price
(1)
|
Market Price
(1)
|
Fair Value
|
|||||||||||
|
(in thousands)
|
||||||||||||||
|
Portion of option contracts maturing in 2016
|
||||||||||||||
|
Puts (purchased)
|
$
|
32,011,290
|
|
0.8400
|
|
0.7210
|
|
$
|
3,714
|
|
||||
|
Calls (written)
|
$
|
32,011,290
|
|
0.8600
|
|
0.7210
|
|
(9
|
)
|
|||||
|
Total
|
$
|
3,705
|
|
|||||||||||
|
(1)
|
Strike and market prices are denoted in amounts where a Canadian dollar is exchanged for the indicated amount of U.S. dollars.
|
We record the fair market value of our derivative financial instruments in our consolidated balance sheets as current and non-current assets or liabilities on a net basis by counterparty. The terms of the International Swaps and Derivatives Association Master Agreement, which governs our financial contracts and include master netting agreements, allow the parties to our derivative contracts to elect net settlement in respect of all transactions under the agreements. The effect of the rights of offset are presented in the tables below as of the dates indicated.
|
December 31, 2016
|
||||||||||||||||||||
|
Current assets
|
Non-current assets
|
Current liabilities
|
Non-current liabilities
|
Total
|
||||||||||||||||
|
(in thousands)
|
||||||||||||||||||||
|
Fair value of derivatives - gross presentation
|
$
|
1,167
|
|
$
|
—
|
|
$
|
—
|
|
$
|
—
|
|
$
|
1,167
|
|
|||||
|
Effects of netting arrangements
|
—
|
|
—
|
|
—
|
|
—
|
|
$
|
—
|
|
|||||||||
|
Fair value of derivatives - net presentation
|
$
|
1,167
|
|
$
|
—
|
|
$
|
—
|
|
$
|
—
|
|
$
|
1,167
|
|
|||||
|
December 31, 2015
|
||||||||||||||||||||
|
Current assets
|
Non-current assets
|
Current liabilities
|
Non-current liabilities
|
Total
|
||||||||||||||||
|
(in thousands)
|
||||||||||||||||||||
|
Fair value of derivatives - gross presentation
|
$
|
3,714
|
|
$
|
—
|
|
$
|
(9
|
)
|
$
|
—
|
|
$
|
3,705
|
|
|||||
|
Effects of netting arrangements
|
(9
|
)
|
—
|
|
9
|
|
—
|
|
$
|
—
|
|
|||||||||
|
Fair value of derivatives - net presentation
|
$
|
3,705
|
|
$
|
—
|
|
$
|
—
|
|
$
|
—
|
|
$
|
3,705
|
|
|||||
134
For more information on our accounting policies regarding derivatives, refer to the derivative financial instruments discussion in
Note 2 — Summary of Significant Accounting Policies
.
19. PARTNERS' CAPITAL
Our common units and subordinated units represent limited partner interests in us. The holders of common units and subordinated units are entitled to participate in partnership distributions and to exercise the rights and privileges available to limited partners under our partnership agreement.
Our Class A units are limited partner interests in us that entitle the holders to nonforfeitable distributions that are equivalent to the distributions paid to holders of our common units (excluding any arrearages of unpaid minimum quarterly distributions from prior quarters) and, as a result, are considered participating securities. Our Class A units do not have voting rights and vest in
four
equal annual installments over the
four
years following the consummation of our IPO only if we grow our annualized distributions each year. If we do not achieve positive distribution growth in any of these years, the Class A units that would otherwise vest for that year will be forfeited. The Class A units contain a conversion feature, which, upon vesting, provides for the conversion of the Class A units into common units based on a conversion factor that is tied to the level of our distribution growth for the applicable year. The conversion factor was
1.00
for the first vesting tranche and will not be more than
1.50
for the second vesting tranche,
1.75
for the third vesting tranche and
2.00
for the final vesting tranche. In February 2016, pursuant to the terms set forth in our partnership agreement, the first vesting tranche of
46,250
Class A units vested. We determined that, upon conversion, each vested Class A unit would receive
one
common unit based upon our distributions paid for the
four
preceding quarters. As a result,
46,250
Class A units were converted into
46,250
common units.
Our partnership agreement provides that, while any subordinated units remain outstanding, holders of our common units and Class A units will have the right to receive distributions of available cash from operating surplus each quarter in an amount equal to our minimum quarterly distribution per unit, plus (with respect to the common units) any arrearages in the payment of the minimum quarterly distribution on the common units from prior quarters, before any distributions of available cash from operating surplus may be made on the subordinated units.
Subordinated units convert into common units on a
one
-for-one basis in separate sequential tranches. Each tranche is comprised of
20.0 percent
of the subordinated units issued in conjunction with our IPO. A separate tranche is eligible to convert on or after December 31, 2015 (but no more frequently than once in any
twelve
-month period), provided on such date (i) distributions of available cash from operating surplus on each of the outstanding common units, Class A units, subordinated units and general partner units equaled or exceeded
$1.15
per unit (the annualized minimum quarterly distribution) for the
four
quarter period immediately preceding that date; (ii) the adjusted operating surplus generated during the
four
quarter period immediately preceding that date equaled or exceeded the sum of
$1.15
per unit (the annualized minimum quarterly distribution) on all of the common units, Class A units, subordinated units and general partner units outstanding during that period on a fully diluted basis; and (iii) there are no arrearages in the payment of the minimum quarterly distribution on our common units. For each successive tranche, the
four
quarter period specified in clauses (i) and (ii) above must commence after the
four
quarter period applicable to any prior tranche of subordinated units. In February 2016, pursuant to the terms set forth in our partnership agreement, we converted the first tranche of
2,092,709
of our subordinated units into common units upon satisfaction of the conditions established for conversion.
Pursuant to the terms of the USD Partners LP 2014 Long-Term Incentive Plan, which we refer to as the LTIP, our phantom unit awards, or Phantom Units, granted to directors and employees of our general partner and its affiliates, which we classify as equity, are converted into our common units upon vesting. Equity-classified Phantom Units totaling
111,545
vested during 2016, of which
99,513
were converted into our common units after
12,032
Phantom Units were withheld from participants for the payment of applicable employment-related withholding taxes. The conversion of these Phantom Units did not have any economic impact on Partners' Capital, as the economic impact is recognized over the vesting period. Additional information and discussion regarding our unit based compensation plans is included below in
Note 20 - Unit Based Compensation
.
135
The board of directors of our general partner has adopted a cash distribution policy pursuant to which we intend to distribute at least the minimum quarterly distribution of
$0.2875
per unit (
$1.15
per unit on an annualized basis) on all of our units to the extent we have sufficient available cash after the establishment of cash reserves and the payment of our expenses, including payments to our general partner and its affiliates. The board of directors of our general partner may change our distribution policy at any time and from time to time. Our partnership agreement does not require us to pay cash distributions on a quarterly or other basis. The amount of distributions we pay under our cash distribution policy and the decision to make any distribution is determined by our general partner.
20. UNIT BASED COMPENSATION
Class A units
In connection with our IPO and as provided for in our partnership agreement, we granted
250,000
non-voting Class A units to certain executive officers and other key employees of our general partner who provide services to us, of which
138,750
and
185,000
were outstanding as of
December 31, 2016
and
2015
. In February 2016, pursuant to the terms set forth in our partnership agreement, the first vesting tranche of
46,250
Class A units vested based upon our distributions paid for the
four
preceding quarters and were converted on a
one
-to-
one
basis into
46,250
common units. The average grant date fair value of all Class A units was
$25.71
per unit at
December 31, 2016
and
2015
.
|
Years Ended December 31,
|
||||||
|
2016
|
2015
|
|||||
|
Class A units outstanding at beginning of period
|
185,000
|
|
220,000
|
|
||
|
Vested
|
(46,250
|
)
|
—
|
|
||
|
Forfeited
|
—
|
|
(35,000
|
)
|
||
|
Class A units outstanding at end of period
|
138,750
|
|
185,000
|
|
||
Our Class A units vest over a
four
year period if established distribution target thresholds are attained each year of the
four
year vesting period. If distributions exceed the threshold by more than the target amount, the Class A units in that tranche vest and become convertible into more than
one
common unit (each Class A unit is convertible into a maximum number of additional common units of
1.25
to
2.0
times, depending on the tranche). The maximum number of common units available for issuance under the plan was
242,813
at
December 31, 2016
. Each of the Class A units have DERs, until they are forfeited, expire, or are terminated. However, distributions over the vesting period are not paid in arrears if the Class A units become convertible into more than
one
common unit.
We measure the compensation cost associated with the Class A units based on the fair value at the effective date of the grant, representing the October 9, 2014, date our common units began trading on the NYSE. We determined the fair value of our Class A units at the grant date to be
$25.71
per Class A unit based on the market price of the underlying common units on the date of our IPO, adjusted for vesting probabilities associated with the performance-based vesting requirements and the present value of the expected distributions. We assumed distribution rates ranging from
$0.24375
per quarter to
$0.4905
per quarter during the vesting period which we discounted assuming a
13%
annual cost of equity. For the years ended
December 31, 2016
and
2015
, we revised our assumptions regarding the vesting probabilities associated with the performance-based vesting requirements to reflect our current expectations regarding future quarterly distribution rates.
The ultimate percentage of units vesting in each tranche depends on a performance condition: specifically, the total distributions paid in the four quarters of the vesting period for each tranche. If distributions meet or fall below a threshold, the Class A units in that tranche are forfeited. If distributions exceed a threshold by less than a target amount, the Class A units in that tranche vest and become convertible into
one
common unit. If distributions exceed the threshold by the target amount or more, the Class A units in that tranche vest and become convertible into more than
one
common unit (
1.25
to
2.0
times common units per Class A unit, depending on the tranche). We did not assume any forfeitures in our initial determination of fair value, although we have reflected actual forfeitures in our determination of compensation expense with respect to the Class A units.
136
We estimated the expense for each tranche as the number of unit equity awards, multiplied by the per unit grant date fair value of those awards less actual forfeitures in the probable vesting scenario for each tranche (equaling the applicable conversion multiple times the value of the unit excluding the expected distributions paid over the vesting period (the common unit price at IPO less the present value of the expected distributions) plus the present value of the expected distributions for any tranches that vest). The estimated fair value of our Class A units is amortized over the
four
-year vesting period using the straight-line method. The Class A unit awards will convert into our common units upon vesting. We recognized approximately
$1.0 million
,
$1.3 million
and
$0.6 million
as compensation expense for the years ended
December 31, 2016
,
2015
and
2014
, respectively, related to the Class A units granted, which costs are included in “Selling, general and administrative” in our consolidated statements of operations.
Each holder of a Class A unit is entitled to nonforfeitable cash distributions equal to the product of the number of Class A units outstanding for the participant and the cash distribution per unit paid to our common unitholders. These distributions are included in “Distributions” as presented in our consolidated statements of cash flows and our consolidated statements of partners’ capital. However, any distributions paid on Class A units that have been forfeited are reclassified to unit based compensation expense when it is determined that the Class A units are not expected to vest. We did
no
t recognize any compensation expense for distributions paid on Class A units that are not expected to vest for the years ended
December 31, 2016
and
2014
, whereas for the year ended
December 31, 2015
, we recognized compensation expense in the amount of
$19 thousand
for distributions paid on Class A units that were forfeited.
Long-term Incentive Plan
In 2016 and 2015, the board of directors of our general partner, acting in its capacity as the general partner, approved grants of
576,373
and
419,551
Phantom Units, respectively, to directors and employees of our general partner and its affiliates under the USD Partners LP 2014 Long-Term Incentive Plan. The total number of our common units initially authorized for issuance under the LTIP was
1,654,167
, of which
715,791
remained available at
December 31, 2016
. The Phantom Units are subject to all of the terms and conditions of the LTIP and the Phantom Unit award agreements, which are collectively referred to as the Award Agreements. Award amounts for each of the grants were generally determined by reference to a specified dollar amount determined by an allocation formula which included a percentage multiplier of the grantee's base salary, among other factors, converted to a number of units based on the closing price of
one
of our common units preceding the grant date, as quoted on the NYSE.
Phantom Unit awards generally represent rights to receive our common units upon vesting. However, with respect to the awards granted to directors and employees of our general partner and its affiliates domiciled in Canada, for each Phantom Unit that vests a participant is entitled to receive cash for an amount equivalent to the closing market price of
one
of our common units on the vesting date. Each Phantom Unit granted under the Award Agreements includes an accompanying DER, which entitles each participant to receive payments at a per unit rate equal in amount to the per unit rate for any distributions we make with respect to our common units. The Award Agreements granted to employees of our general partner and its affiliates generally contemplate that the individual grants of Phantom Units will vest in
four
equal annual installments based on the grantee’s continued employment through the vesting dates specified in the Award Agreements, subject to acceleration upon the grantee’s death or disability, or involuntary termination in connection with a change in control of the Partnership or our general partner. Awards to independent directors of the board of our general partner typically vest over a
one year
period following the grant date.
137
The following table presents award activity for our Equity-classified Phantom Units:
|
Independent Director and Consultant Phantom Units
|
Employee Phantom Units
|
Weighted-Average Grant Date Fair Value Per Phantom Unit
|
|||||||
|
Phantom Unit awards at December 31, 2014
|
—
|
|
—
|
|
$
|
—
|
|
||
|
Granted
|
24,045
|
|
367,548
|
|
$
|
12.76
|
|
||
|
Vested
|
—
|
|
—
|
|
$
|
—
|
|
||
|
Forfeited
|
—
|
|
(17,572
|
)
|
$
|
12.90
|
|
||
|
Phantom Unit awards at December 31, 2015
|
24,045
|
|
349,976
|
|
$
|
12.75
|
|
||
|
Granted
|
64,830
|
|
472,912
|
|
$
|
6.41
|
|
||
|
Vested
|
(24,045
|
)
|
(87,500
|
)
|
$
|
12.66
|
|
||
|
Forfeited
|
—
|
|
(4,580
|
)
|
$
|
7.29
|
|
||
|
Phantom Unit awards at December 31, 2016
|
64,830
|
|
730,808
|
|
$
|
8.51
|
|
||
The following table presents award activity for our Liability-classified Phantom Units:
|
Independent Director and Consultant Phantom Units
|
Employee Phantom Units
|
Weighted-Average Grant Date Fair Value Per Phantom Unit
|
|||||||
|
Phantom Unit awards at December 31, 2014
|
—
|
|
—
|
|
$
|
—
|
|
||
|
Granted
|
10,256
|
|
17,702
|
|
$
|
12.78
|
|
||
|
Vested
(1)
|
—
|
|
(4,426
|
)
|
$
|
12.78
|
|
||
|
Phantom Unit awards at December 31, 2015
|
10,256
|
|
13,276
|
|
$
|
12.78
|
|
||
|
Granted
|
21,610
|
|
17,021
|
|
$
|
6.39
|
|
||
|
Vested
(1)(2)
|
(10,256
|
)
|
(8,682
|
)
|
$
|
11.34
|
|
||
|
Phantom Unit awards at December 31, 2016
|
21,610
|
|
21,615
|
|
$
|
7.70
|
|
||
|
(1)
|
Phantom Units granted to employees domiciled in Canada vested on
December 31, 2015
and
December 31, 2016
, at the closing price for our common units as quoted on the NYSE. We paid
$32 thousand
for Phantom Units granted to employees domiciled in Canada that vested on
December 31, 2015
, and
$137 thousand
for such Phantom Units that vested on
December 31, 2016
.
|
|
(2)
|
Phantom Unit grants to Directors and independent consultants domiciled in Canada vested on February 16, 2016, at the closing price for our common units as quoted on the NYSE, resulting in our payment of
$64 thousand
for the vested Phantom Units.
|
The fair value of each Phantom Unit on the grant date is equal to the closing market price of our common units on the grant date. We account for the Phantom Unit grants to independent directors and employees of our general partner and its affiliates domiciled in Canada that are paid out in cash upon vesting, throughout the requisite vesting period, by revaluing the unvested Phantom Units outstanding at the end of each reporting period and recording a charge to compensation expense in “Selling, general and administrative” in our consolidated statements of operations and recognizing a liability in "Other current liabilities" in our consolidated balance sheets. With respect to the Phantom Units granted to employees of our general partner and its affiliates domiciled in the United States, we amortize the initial grant date fair value over the requisite service period using the straight-line method with a charge to compensation expense in “Selling, general and administrative” in our consolidated statements of operations, with an offset to common units within the Partners' Capital section of our consolidated balance sheet. With respect to the Phantom Units granted to consultants and independent directors of our general partner and its affiliates domiciled in the United States, we revalue the unvested Phantom Units outstanding at the end of each reporting period throughout the requisite service period and record a charge to compensation expense in “Selling, general and administrative” in our consolidated statements of operations, with an offset to common units within the Partners' Capital section of our consolidated balance sheets.
138
For the years ended
December 31, 2016
and
2015
, we recognized
$3.1 million
and
$1.2 million
of compensation expense associated with outstanding Phantom Units. As of
December 31, 2016
, we have unrecognized compensation expense associated with our outstanding Phantom Units totaling
$5.3 million
, which we expect to recognize over a weighted average period of
2.5 years
. We have elected to account for actual forfeitures as they occur rather than using an estimated forfeiture rate to determine the number of awards we expect to vest.
We made payments to holders of the Phantom Units pursuant to the associated DERs we granted to them under the Award Agreements as follows:
|
Years Ended December 31,
|
|||||||
|
2016
|
2015
|
||||||
|
(in thousands)
|
|||||||
|
Equity-classified Phantom Units
(1)
|
$
|
868
|
|
$
|
327
|
|
|
|
Liability-classified Phantom Units
|
56
|
|
24
|
|
|||
|
Total
|
$
|
924
|
|
$
|
351
|
|
|
|
(1)
|
For the years ended
December 31, 2016
and
2015
, we reclassified
$3 thousand
and
$5 thousand
, respectively to
unit based compensation expense for DERs paid in relation to Phantom Units that have been forfeited.
|
21. SUPPLEMENTAL CASH FLOW INFORMATION
The following table provides supplemental cash flow information for the periods indicated:
|
For the Years Ended December 31,
|
|||||||||||
|
2016
|
2015
|
2014
|
|||||||||
|
(in thousands)
|
|||||||||||
|
Cash paid for income taxes
|
$
|
845
|
|
$
|
3,995
|
|
$
|
101
|
|
||
|
Cash paid for interest
|
$
|
8,722
|
|
$
|
3,695
|
|
$
|
3,588
|
|
||
22. DISCONTINUED OPERATIONS
On December 12, 2012, USDG sold all of its membership interests in
five
of its subsidiaries previously included in our Terminalling services segment, the Sale, to a large energy transportation, terminalling and pipeline company, which we refer to as the Acquirer.
During the year ended
December 31, 2014
, we received approximately
$29.5 million
that was held in escrow related to the Sale. We did not have any events that occurred in
2016
or
2015
related to discontinued operations and we do not expect any events to occur in future years.
Continuing Cash Flows from Discontinued Operations
In conjunction with the Sale, we ceased the operations of another subsidiary, USDS, which primarily provided loading and unloading services to the Acquirer, pursuant to a service agreement. Effective at the closing date of the Sale, USDS assigned or terminated any obligations it had in relation to its operations, but continued to receive indirect cash flows. We have not participated in any revenue producing activities with respect to USDS and the cash flows terminated upon the expiration of the assigned service agreement on February 15, 2015. For the years ended
December 31, 2016
,
2015
and
2014
, we did
no
t receive any amounts with respect to the assigned service agreement.
23. SUBSEQUENT EVENTS
Distribution to Partners
On
February 1, 2017
, the board of directors of USD Partners GP LLC, acting in its capacity as our general partner, declared a quarterly cash distribution payable of
$0.3300
per unit, or
$1.32
per unit on an annualized basis, for the three months ended
December 31, 2016
. The distribution represents an increase of
$0.0075
per unit or
2.3%
over the prior quarter distribution per unit, and is
14.8%
over our minimum quarterly distribution per unit. We paid the distribution
139
on
February 17, 2017
, to unitholders of record at the close of business on
February 13, 2017
. We paid
$3.6 million
to our public common unitholders,
$46 thousand
to the Class A unitholders, an aggregate of
$3.8 million
to USDG as the holder of our common units and our subordinated units and
$152 thousand
to USD Partners GP LLC for their general partner interest.
Long-term Incentive Plan
In February and March of 2017, awards of
290,597
Phantom Units vested. The following table provides details of these vested awards:
|
Phantom Units Vested
|
Common Units Issued
(1)
|
Cash Paid
(2)
|
|||||||
|
U.S. domiciled directors and independent consultants
|
64,830
|
|
64,830
|
|
$
|
—
|
|
||
|
U.S. domiciled employee
|
204,157
|
|
124,985
|
|
—
|
|
|||
|
Canadian domiciled directors and independent consultants
|
21,610
|
|
—
|
|
276,608
|
|
|||
|
290,597
|
|
189,815
|
|
$
|
276,608
|
|
|||
|
(1)
|
Upon vesting,
one
common unit is issued for each equity classified Phantom Unit that vests. Employees have the option of using a portion of their vested Phantom Units to satisfy any tax liability resulting from the vesting and as a result, the actual number of common units issued may be less than the number of phantom units that vest.
|
|
(2)
|
Each Liability-classified Phantom Unit that vests is redeemed in cash for an amount equivalent to the closing market price of one of our common units on the vesting date, which was
$12.80
.
|
In
February 2017
, the board of directors of USD Partners GP LLC, acting in its capacity as our general partner approved the grant of
687,099
Phantom Units to directors and employees of our general partner and its affiliates under the LTIP. The Phantom Units are subject to all of the terms and conditions of the LTIP and the Phantom Unit award agreements, or the Award Agreements. Following the February and March 2017 Phantom Unit award activity, we have approximately
129,474
Phantom Units available for grant pursuant to the LTIP. Phantom Unit awards generally represent rights to receive our common units, or with respect to awards granted to individuals domiciled in Canada, cash equal to the fair value of our common units, upon vesting. The Award Agreements granted to employees of our general partner generally vest in
four
equal annual installments. Awards to independent directors of the board of our general partner vest over a
one year
period following the grant date.
Vesting of Class A units
On February 20, 2017, pursuant to the terms set forth in our partnership agreement, the second tranche of
46,250
Class A units vested. We determined the Class A unit conversion amount to be
one
and one-half of our common units for each vested Class A unit based upon our distributions paid for the four preceding quarters. As a result,
46,250
Class A units were converted into
69,375
common units.
Subordinated Units Conversion
On
February 20, 2017
, pursuant to the terms set forth in our partnership agreement, we converted the second subordinated unit tranche of
2,092,709
subordinated units into our common units upon satisfaction of the conditions established for conversion.
Revolving Credit Facility Activity
Subsequent to
December 31, 2016
, we borrowed an additional
$5.0 million
and repaid
$4.0 million
under the terms of our existing
$300 million
Revolving Credit Facility. Our borrowings under the Revolving Credit Facility bear interest at either a base rate and Canadian prime rate plus an applicable margin ranging from
1.25%
to
2.25%
, or at LIBOR or CDOR plus an applicable margin ranging from
2.25%
to
3.25%
. The Revolving Credit Facility agreement, as amended, provides for borrowings of up to
$300 million
, expandable to
$400 million
as the Term Loan Facility is repaid, and expires on October 15, 2019. In addition, we repaid
C$10.0 million
(the equivalent of
$7.6 million
) on our Term Loan Facility. Subsequent to this activity, we had amounts outstanding of
$214.0 million
under the Revolving Credit Facility and
$2.7 million
under the Term Loan Facility.
140
Customer Contract Expiration and Renewal
A major customer of our Casper terminal, whose terminalling services agreement with us expires in the third quarter of
2017
, if not otherwise renewed or extended, did not exercise its option to extend the agreement for an additional three-year term. Although we are in active discussions with this customer, as well as other existing and potential new customers, for the provision of terminalling services following the expiration of this agreement, we can make no assurances regarding the outcome of these discussions. We cannot currently estimate the impact this event may have on our financial condition, but among other outcomes, it could result in a non-cash impairment loss of the carrying value of our intangible assets for customer service agreements.
24. QUARTERLY FINANCIAL DATA (Unaudited)
|
First
|
Second
|
Third
|
Fourth
|
||||||||||||
|
(in thousands, except per unit amounts)
|
|||||||||||||||
|
2016 Quarters
|
|||||||||||||||
|
Operating revenue
|
$
|
26,357
|
|
$
|
27,871
|
|
$
|
28,343
|
|
$
|
28,554
|
|
|||
|
Operating expense
(1)
|
$
|
18,834
|
|
$
|
18,454
|
|
$
|
18,843
|
|
$
|
22,354
|
|
|||
|
Operating income
|
$
|
7,523
|
|
$
|
9,417
|
|
$
|
9,500
|
|
$
|
6,200
|
|
|||
|
Net income
|
$
|
2,150
|
|
$
|
5,235
|
|
$
|
12,831
|
|
$
|
3,956
|
|
|||
|
Net income attributable to limited partner ownership interests in USD Partners LP
|
$
|
2,107
|
|
$
|
5,131
|
|
$
|
12,575
|
|
$
|
3,877
|
|
|||
|
Net income per limited partner unit, basic and diluted
|
$
|
0.09
|
|
$
|
0.23
|
|
$
|
0.49
|
|
$
|
0.17
|
|
|||
|
2015 Quarters
|
|||||||||||||||
|
Operating revenue
|
$
|
13,508
|
|
$
|
20,395
|
|
$
|
21,797
|
|
$
|
26,063
|
|
|||
|
Operating expense
|
$
|
12,743
|
|
$
|
14,588
|
|
$
|
14,746
|
|
$
|
17,232
|
|
|||
|
Operating income
|
$
|
765
|
|
$
|
5,807
|
|
$
|
7,051
|
|
$
|
8,831
|
|
|||
|
Net income
|
$
|
2,041
|
|
$
|
2,652
|
|
$
|
6,325
|
|
$
|
6,675
|
|
|||
|
Net income attributable to limited partner ownership interests in USD Partners LP
|
$
|
2,000
|
|
$
|
2,599
|
|
$
|
6,198
|
|
$
|
6,542
|
|
|||
|
Net income per limited partner unit, basic and diluted
|
$
|
0.09
|
|
$
|
0.13
|
|
$
|
0.30
|
|
$
|
0.30
|
|
|||
|
(1)
|
Operating expense for the fourth quarter of 2016 includes a non-cash impairment loss of approximately
$3.5 million
, to write down the noncurrent assets of the San Antonio rail terminal to fair market value.
|
141
None.
DISCLOSURE CONTROLS AND PROCEDURES
As required by Rule 13a-15(b) of the Securities Exchange Act of 1934, as amended, or the Exchange Act, we have evaluated, under the supervision and with the participation of our management, including our principal executive officer and principal financial officer, the effectiveness of the design and operation of our disclosure controls and procedures (as defined in Rules 13a-15(e) and 15d-15(e) under the Exchange Act) as of the end of the period covered by this report. Our disclosure controls and procedures are designed to provide reasonable assurance that the information required to be disclosed by us in reports that we file or submit under the Exchange Act is accumulated and communicated to our management, including our principal executive officer and principal financial officer, as appropriate, to allow for timely decisions regarding required disclosure and to ensure information is recorded, processed, summarized and reported within the time periods specified in the rules and forms of the SEC. Based upon that evaluation, our principal executive officer and principal financial officer concluded that our disclosure controls and procedures were effective as of the end of the period covered by this Annual Report at the reasonable assurance level.
INTERNAL CONTROL OVER FINANCIAL REPORTING
Management’s Annual Report on Internal Control Over Financial Reporting
Management of the Partnership is responsible for establishing and maintaining adequate internal control over financial reporting as such term is defined in Exchange Act Rule 13a-15(f).
The Partnership’s internal control over financial reporting is a process designed under the supervision and with the participation of our principal executive and principal financial officers, and effected by the board of directors of our general partner, management and other personnel, to provide reasonable assurance regarding the reliability of financial reporting and the preparation of the financial statements for external purposes in accordance with generally accepted accounting principles.
Our internal control over financial reporting includes policies and procedures that:
|
•
|
Pertain to the maintenance of records that in reasonable detail accurately and fairly reflect transactions and dispositions of assets of the Partnership;
|
|
•
|
Provide reasonable assurance that transactions are recorded as necessary to permit preparation of financial statements in accordance with generally accepted accounting principles, and that receipts and expenditures of the Partnership are being made only in accordance with the authorizations of the Partnership’s management and directors; and
|
|
•
|
Provide reasonable assurance regarding prevention or timely detection of unauthorized acquisition, use or disposition of the Partnership's assets that could have a material effect on the Partnership's financial statements.
|
Because of its inherent limitations, internal control over financial reporting may not prevent or detect misstatements. Also, projections of any evaluation of effectiveness to future periods are subject to the risk that controls may become inadequate because of changes in conditions, or that the degree of compliance with our policies or procedures may deteriorate.
Management assessed the effectiveness of the Partnership’s internal control over financial reporting as of
December 31, 2016
, with the participation of our principal executive and principal financial officers, based on the framework established in Internal Control—Integrated Framework (2013) issued by the Committee of Sponsoring Organizations of the Treadway Commission, or COSO. Based on this assessment, management concluded that the Partnership maintained effective internal control over financial reporting as of
December 31, 2016
.
142
ATTESTATION REPORT OF THE INDEPENDENT REGISTERED PUBLIC ACCOUNTING FIRM
This Annual Report does not include an attestation report of our independent registered public accounting firm on our internal control over financial reporting because Section 103 of the Jumpstart Our Business Startups Act of 2012 provides that an emerging growth company ("EGC") is not required to provide an auditor’s report on internal control over financial reporting under Section 404(b) of the Sarbanes-Oxley Act for as long as we qualify as an EGC.
CHANGES IN INTERNAL CONTROL OVER FINANCIAL REPORTING
We did not make any changes in our internal control over financial reporting during the three months ended December 31, 2016, that have materially affected, or are reasonably likely to materially affect, our internal control over financial reporting.
None.
143
EXECUTIVE OFFICERS AND DIRECTORS
We are managed by the directors and executive officers of our general partner, USD Partners GP LLC. Our general partner is not elected by our unitholders and will not be subject to re-election by our unitholders in the future. USD indirectly owns all of the membership interests in our general partner. Our general partner has a board of directors, and our unitholders are not entitled to elect the directors or directly or indirectly to participate in our management or operations. Our general partner will be liable, as general partner, for all of our debts (to the extent not paid from our assets), except for indebtedness or other obligations that are made specifically nonrecourse to it. Whenever possible, we intend to incur indebtedness that is nonrecourse to our general partner.
Our general partner’s board of directors has nine directors, three of whom are independent as defined under the independence standards established by the NYSE and the Exchange Act. Our general partner's board of directors has affirmatively determined that Ms. O’Hagan, Mr. Smith and Mr. Wood are independent as described in the rules of the NYSE and the Exchange Act. The NYSE does not require a listed publicly traded partnership, such as ours, to have a majority of independent directors on the board of directors of our general partner, or to establish a compensation committee or a nominating committee.
Set forth below is information concerning the directors and executive officers of our general partner, USD Partners GP LLC. Directors are elected by the sole member of our general partner and hold office until their successors have been elected or qualified or until their earlier death, resignation, removal or disqualification. Executive officers are appointed by, and serve at the discretion of, the board of directors. The following table shows information for the executive officers and directors of USD Partners GP LLC:
|
Name
|
Age
|
Position
|
||
|
Dan Borgen
|
55
|
Chairman of the Board, Chief Executive Officer and President
|
||
|
Paul Tucker
|
76
|
Executive Vice President, Chief Integration & Relationship Officer
|
||
|
Josh Ruple
|
36
|
Senior Vice President, Chief Operating Officer
|
||
|
Adam Altsuler
|
43
|
Vice President, Chief Financial Officer
|
||
|
Chris Robbins
|
44
|
Vice President, Chief Accounting Officer
|
||
|
Keith Benson
|
44
|
General Counsel
|
||
|
Schuyler Coppedge
|
43
|
Director
|
||
|
Mike Curry
|
63
|
Director
|
||
|
Douglas Kimmelman
|
56
|
Director
|
||
|
Thomas Lane
|
60
|
Director
|
||
|
Jane O’Hagan
|
53
|
Director
|
||
|
Brad Sanders
|
59
|
Director
|
||
|
Stacy Smith
|
48
|
Director
|
||
|
Jeff Wood
|
46
|
Director
|
||
Dan Borgen
. Mr. Borgen has been Chief Executive Officer and President of our general partner since June 2014 and became Chairman of the Board of our general partner prior to the close of our IPO. Mr. Borgen is a co-founder of USD and its predecessor companies and has served as chairman, CEO and President of USD since its inception. Additionally, Mr. Borgen served as President of U.S. Right-of-Way Corporation, a private company, since 1993. Prior to USD, Mr. Borgen worked for 11 years in investment banking in mergers and acquisitions, portfolio management and strategic planning. He began his career with a private investment firm focused on the oil and gas industry. Mr. Borgen has served on the board of directors of several corporations and currently serves on the board of Vertex Energy Inc., an environmental services company that recycles industrial waste streams and off-specification commercial chemical products. Active in several community organizations, he is chair of the USD Foundation and a trustee of Boys and Girls
144
Club of America. Mr. Borgen received a degree in Petroleum Management and Finance from the University of Oklahoma. He was recognized by Goldman Sachs as one of 100 Most Intriguing Entrepreneurs in 2013 and was a finalist for Ernst and Young’s 2014 Gulf Coast Entrepreneur of the Year. Mr. Borgen’s experience in founding and leading USD and its predecessors provides the board with broad business and leadership expertise in the financial and energy industries.
Paul Tucker
. Mr. Tucker has been Executive Vice President and Chief Integration & Relationship Officer of our general partner and for USD since January 1, 2017. In this role, Mr. Tucker is primarily responsible for developing and maintaining USD's and our large network of strategic relationships and for facilitating the integration of processes, practices and culture throughout current and future facilities. Mr. Tucker previously served as Senior Vice President and Chief Operating Officer of our general partner since June 2014 and for USD since its inception. Mr. Tucker’s career in the rail transportation industry spans over 41 years and includes key senior leadership roles with the Union Pacific and Missouri Pacific railroads and the Port Terminal Railroad Association (PTRA). Mr. Tucker’s career also includes service on the board of directors of the Texas City Terminal (TCT), the Galveston, Houston and Henderson (GH&H), the Wichita Terminal Association (WTA) and the Houston Belt and Terminal (HBT) railroads, on which he also served on the Executive Committee. Mr. Tucker received a BA in Psychology from Henderson State University and received post-graduate executive leadership development at the University of Pittsburgh and Eckerd College, St. Petersburg, Florida.
Josh Ruple
. Mr. Ruple has been Senior Vice President and Chief Operating Officer of our general partner and for USD since January 1, 2017. In this role, Mr. Ruple is responsible for all operations and project development activities in support of USD and our commercial development vision, mission and tactical growth strategies. Mr. Ruple previously served as Vice President, Project Development Group of USD since June 2014. From July 2013 through June 2014, Mr. Ruple was the Senior Development Manager for TransDevelopment Group, a developer of specialized transportation facilities for shippers and carriers in the rail, highway, and marine cargo industries. From March 2011 through December 2013, Mr. Ruple was the Vice President Construction Services for Powerhouse Retail Services, a national provider of retail construction and maintenance services. From August 2004 through March 2011, Mr. Ruple worked at the BNSF Railway in positions of increasing responsibility, most recently as Senior Manager of Facility Development. Mr. Ruple received a BS in Civil and Environmental Engineering from the University of Utah and is an active member of both professional and public community organizations.
Adam Altsuler
. Mr. Altsuler has been Vice President and Chief Financial Officer of our general partner since June 2014. Mr. Altsuler joined USD in April 2014 as Vice President, Finance with a primary focus on corporate finance, capital markets and investor relations activities. From 2009 to 2014, Mr. Altsuler served in various leadership roles at Eagle Rock Energy Partners, a master limited partnership headquartered in Houston, Texas, most recently serving as Vice President and Treasurer. Prior to joining Eagle Rock, Mr. Altsuler was an Investment Analyst at Kenmont Investments, an energy-focused hedge fund located in Houston, where he managed the fund’s master limited partnership investment portfolio from 2007 to 2009. Prior to Kenmont, Mr. Altsuler worked the majority of his career in investment banking with Donaldson, Lufkin and Jenrette/Credit Suisse First Boston and a boutique investment bank in Dallas and San Francisco. Mr. Altsuler graduated from the University of Texas at Austin with a BBA in Finance and received an MBA from Rice University, graduating Beta Gamma Sigma.
Chris Robbins
. Mr. Robbins has been Vice President and Chief Accounting Officer of our general partner since June 2014. Mr. Robbins joined USD in August 2007 as Chief Accounting Officer and became Vice President, Chief Financial and Accounting Officer in June 2014. Mr. Robbins is primarily focused on corporate finance, accounting and reporting, planning and tax. Prior to joining USD, Mr. Robbins served as Director of Finance for SGS Group’s North American Oil, Gas & Chemicals Division from 1997 to 2007. Mr. Robbins is a Certified Public Accountant, Chartered Global Management Accountant, and holds a BS in Accounting from Grove City College in Pennsylvania.
Keith Benson.
Mr. Benson became General Counsel of our general partner and Co-General Counsel of USD in March 2015. From January 2008 through February 2015, Mr. Benson was a partner with the international law firm of Latham & Watkins LLP in their Houston and San Francisco offices. Mr. Benson’s practice focused on public company representation, corporate governance, capital markets and mergers & acquisitions, with a focus on midstream and upstream energy companies, master limited partnerships and real estate investment trusts. From July 2000 through
145
December 2007, Mr. Benson was an associate with Latham & Watkins LLP and from October 1998 through June 2000 Mr. Benson was an associate with the law firm of Cahill, Gordon & Reindel LLP. Mr. Benson received a JD with high honors from Rutgers School of Law and a BA in Political Science from The College of New Jersey.
Schuyler Coppedge.
Mr. Coppedge has been a member of the board of directors of our general partner since September 2016. Mr. Coppedge is a Partner at Energy Capital Partners. He is involved in all areas of the firm’s investment activities, with a particular emphasis on renewable and fossil generation and environmental and oil field services. Mr. Coppedge serves on the boards of STEAG-SCR Tech, ProPetro Holding Corp and Terra-Gen, LLC and serves as a board observer to NCSG Crane & Heavy Haul Corporation. Prior to realization, Mr. Coppedge served on the board of FirstLight Power Enterprises, Inc. Before joining Energy Capital in 2005, Mr. Coppedge spent over six years at JP Morgan in New York and London in the firm’s Energy Investment Banking Division. At JP Morgan, Mr. Coppedge was involved in numerous financing and merger and acquisition transactions across various business segments of the energy sector. Mr. Coppedge received a BA from Middlebury College and an MBA from the Wharton School at the University of Pennsylvania.
Mike Curry
. Mr. Curry has been a member of the board of directors of our general partner since June 2014. Mr. Curry is co-founder of USD and its predecessor companies, and currently serves as Executive Vice President and Head of Finance and Risk for USD. From 2006 to June 2014, Mr. Curry served as Chief Financial Officer of USD. Throughout the years he has been extensively involved with and directed numerous aspects of USD, including strategic planning, project development, construction and heading finance. Prior to USD, Mr. Curry served as Treasurer and Chief Accounting Officer for integrated oil and gas producer An-Son Corp., located in Oklahoma City, from 1982 to 1985 and was employed by Arthur Andersen & Co. from 1978 to 1981. Mr. Curry is a Certified Public Accountant and holds a Master’s Degree in Accountancy from the University of Illinois. Mr. Curry’s experience and involvement with USD from its founding to its present day operations, along with his accounting background, bring the board financial, strategic and operational expertise and leadership.
Douglas Kimmelman
. Mr. Kimmelman has been a member of the board of directors of our general partner since October 2014. Mr. Kimmelman founded Energy Capital Partners in April 2005 and serves as its Senior Partner. Mr. Kimmelman currently serves on the boards of CE2 Carbon Capital, LLC, PLH Group, Inc. and Nesco Holdings, LP. Prior to founding Energy Capital Partners, Mr. Kimmelman spent 22 years with Goldman Sachs, starting in 1983 in the firm’s Pipeline and Utilities Department within the Investment Banking Division. He remained exclusively focused on the energy and utility sectors in the Investment Banking Division until 2002, when he transferred to the firm’s J. Aron commodity group. He was named a General Partner of the firm in 1996. From 2002 to 2005, Mr. Kimmelman played a leadership role at Goldman Sachs in building a power generation asset portfolio through the J. Aron commodity group. Mr. Kimmelman received a BA in Economics from Stanford University and an MBA from the Wharton School at the University of Pennsylvania. Mr. Kimmelman’s experience as founder and Senior Partner of Energy Capital Partners and knowledge of the energy industry provide the board with extensive financial and business leadership.
Thomas Lane
.
Mr. Lane has been a member of the board of directors of our general partner since October 2014. Mr. Lane is Vice Chairman of Energy Capital Partners. He is involved in all areas of the firm’s investment activities, with a particular emphasis on the midstream sector. Mr. Lane serves on the boards of Summit Midstream Partners, LLC and Summit Midstream Partners, L.P. (NYSE: SMLP). Prior to realization, Mr. Lane served on the board of FirstLight Power Enterprises, Inc. and Cardinal Gas Storage Partners, LLC. Prior to joining Energy Capital Partners in 2005, Mr. Lane worked for 17 years in the Investment Banking Division at Goldman Sachs. As a Managing Director at Goldman Sachs, Mr. Lane had senior-level coverage responsibility for electric and gas utilities, independent power companies and midstream gas companies throughout the United States. Mr. Lane received a BA in Economics from Wheaton College and an MBA from the University of Chicago. Mr. Lane provides the board with broad knowledge of the energy industry in addition to his financial, business and leadership expertise.
Jane O’Hagan, ICD.D
.
Ms. Jane O’Hagan has been a member of the board of directors of our general partner since October 2014. Ms. O’Hagan is an independent director of our general partner and serves as Chairman of the conflicts committee and as a member of the audit committee. Prior to joining the board of directors of our general partner, Ms. O’Hagan served as Executive Vice President and Chief Marketing Officer of Canadian Pacific Railway
146
Limited, or CP Rail, from 2010 to 2014, and as Senior Vice President of Strategy & Yield from 2008 to 2009. She served as a Vice President of Strategy and External Affairs of CP Rail from 2005 to 2008 and also served as Assistant Vice-President, Strategy and Research from 2002 to 2005. Prior to her roles at CP Rail, Ms. O’Hagan was the principal health care consultant for Organomics, Inc. from 2001 to 2002. Prior to her role at Organomics, Ms. O’Hagan was a consultant and Vice President of Strategy & Business Development at the Greater Baltimore Medical Center from 1995 to 2001. Ms. O’Hagan also serves as a board member of Descartes System Group of Waterloo, Ontario. Ms. O'Hagan is formerly a Director and Joint Chair of Lanzhou Pacific Logistics in Beijing, China, the first Sino-foreign railway joint venture logistics enterprise invested in by CP Rail and the China Railway Container Transport Co., Ltd. Ms. O’Hagan also represented CP Rail on the Province of British Columbia’s Asia Pacific Gateway Executive Council from 2004 until May 2014. In December 2012, Ms. O’Hagan was named one of Canada’s 2012 Top 100 Most Powerful Women by the Women Executive Network, an organization dedicated to recognizing the achievements of women who hold senior positions in Canada’s corporate community. Ms. O’Hagan holds a Bachelor of Arts (Hons.) and a Bachelor of Administrative and Commercial Studies from the University of Western Ontario. Ms. O'Hagan is also a holder of the Institute of Corporate Directors Director designation, which she achieved in June 2016. We believe Ms. O’Hagan’s extensive experience in the rail industry qualifies her to be a member of the board.
Brad Sanders
. Mr. Sanders has been a member of the board of directors of our general partner since October 2014. Mr. Sanders joined USD as Executive Vice President, Head of Market Strategy for USD in May 2014 and became Executive Vice President, Chief Commercial Officer in October 2014. Mr. Sanders’ main focus at USD is working with the leadership team to identify, develop and execute strategic commercial and market opportunities. Prior to USD, Mr. Sanders spent 32 years at Koch Industries where he was primarily responsible for building and managing several of Koch’s global trading businesses, including businesses in the crude oil, NGLs, distillates, gasoline and gasoline components, and plastics value chains. He is a 1979 graduate of the University of Kansas with a degree in business. He is a current Trustee for KU Endowment and a current member for the KU Endowment Investment Committee. Mr. Sanders provides the board with strategic planning and business development leadership and expertise in the energy industry.
Stacy Smith.
Mr. Smith has been a member of the board of directors of our general partner since October 2015. Mr. Smith co-founded in February 2013 and remains a partner of Trinity Investment Group, a firm which invests in private equity transactions, public equity securities and other assets. Since 2013, Mr. Smith has also served as managing partner of SCW Capital, LP, an equity hedge fund co-founded by Mr. Smith. In 1997, Mr. Smith co-founded Walker Smith Capital, a Dallas-based small- and mid-cap equity hedge fund, where he was a partner and served as a portfolio manager until December 2012. Mr. Smith currently serves on the boards of directors of Independent Bank Group, a bank holding company, to which he was elected in February 2013, and WhiteHorse Finance, Inc., an externally managed, non-diversified, closed-end management investment company, to which he was elected in August 2015. Mr. Smith received a bachelor of business administration in finance and accounting from the University of Texas at Austin. Mr. Smith brings extensive experience in finance and corporate governance to the board of directors of our general partner in addition to his knowledge of the energy and financial institution industries.
Jeff Wood.
Mr. Wood has been a member of the board of directors of our general partner since January 2015 and serves as chairman of the audit committee and as a member of the conflicts committee. Mr. Wood currently serves as the Senior Vice President and Chief Financial Officer of Black Stone Minerals, L.P., a publicly traded master limited partnership (MLP) and one of the largest oil and natural gas mineral and royalty companies in the United States. Previously, Mr. Wood served as Executive Vice President and Chief Financial Officer of Siluria Technologies, Inc., a leading innovator of process technologies for the energy and petrochemical industries. Before joining Siluria, Mr. Wood served as Senior Vice President and Chief Financial Officer of Eagle Rock Energy Partners, LP, a publicly traded MLP, from 2009 through 2014. Prior to that, Mr. Wood was one of the founding principals of the Lehman Brothers’ MLP Investment Fund, which focused on direct investments in the MLP sector. He also spent 10 years with the Natural Resources Investment Banking team at Lehman Brothers where he primarily focused on MLP transactions. Mr. Wood began his career at Price Waterhouse in its audit and compliance practice.
Board Leadership Structure
The chief executive officer of our general partner serves as the chairman of the board. The board of directors of our general partner has no policy with respect to the separation of the offices of chairman of the board of directors and
147
chief executive officer. Instead, that relationship is defined and governed by the amended and restated limited liability company agreement of our general partner, which permits the same person to hold both offices. Directors of the board of directors of our general partner are designated or elected by USD. Accordingly, unlike holders of common stock in a corporation, our unitholders have only limited voting rights on matters affecting our business or governance, subject in all cases to any specific unitholder rights contained in our partnership agreement.
Energy Capital Partners Investment in USD
On September 19, 2014, Energy Capital Partners made a significant investment in USD and indicated an intention to invest over an additional $1.0 billion of equity capital in USD, subject to market and other conditions, to support future growth and expansion plans.
In connection with Energy Capital Partners’ investment, USD repurchased a substantial portion of Goldman Sachs’ investment in USD and used the remaining proceeds to fund growth projects and strengthen its balance sheet to allow for additional flexibility to pursue its goal of providing energy infrastructure solutions.
Special Approval Rights of Energy Capital Partners
For so long as Energy Capital Partners is able to appoint more than one member to USD’s board of directors, USD will not, and will not permit its subsidiaries, including us and our general partner, to take or agree to take any of the following actions (or take or agree to take any action that is reasonably likely to require or result in any of the following actions) without the affirmative vote of Energy Capital Partners (or, with respect to distributions by us or our subsidiaries, the members of our general partner’s board of directors appointed by Energy Capital Partners):
|
•
|
any sale of USD, any subsidiary of USD, including us, or any of their assets (other than asset sales in the ordinary course of business), including by way of merger, consolidation, public offering or otherwise, other than to USD or a wholly owned subsidiary of USD;
|
|
•
|
(A) any capital contribution or issuance of or redemption of securities of USD or any subsidiary of USD, including us, (B) any issuance of profits interests in USD, (C) any distributions, except distributions by us and our subsidiaries (which distributions shall be subject to the affirmative vote of the members of our general partner’s board of directors appointed by Energy Capital Partners), (D) any incurrence or refinancing of indebtedness (whether directly, through a guaranty or otherwise) outside of the ordinary course of business, other than any incurrence or refinancing of indebtedness by us or our subsidiaries (which incurrences and refinancings shall be subject to the affirmative vote of the members of our general partner’s board of directors appointed by Energy Capital Partners), (E) any acquisition of securities of any other entity in excess of the lesser of the consolidated earnings before interest, taxes, depreciation and amortization of USD Group LLC or $50 million or (F) any making of any loan or advance to any entity other than a wholly owned subsidiary of USD;
|
|
•
|
the approval, modification or revocation of any budget or a material deviation from or a material expenditure not part of any such budget (including any material change with respect to the nature of any budgeted capital expenditure), other than the approval, modification or revocation of any budget related to us or our subsidiaries (which approvals, modifications or revocations shall be subject to the affirmative vote of the members of our general partner’s board of directors appointed by Energy Capital Partners);
|
|
•
|
(A) amending the organizational documents of USD in a manner adverse to the holders of the common membership interests of USD, (B) amending the organizational documents of any subsidiary of USD, including us, (C) expanding the purpose of any of USD or any of its subsidiaries, including us, (D) causing or taking any action with the purpose or effect of causing the bankruptcy, liquidation, dissolution or winding up of USD or any of its subsidiaries, (E) making any material change to USD or any of its subsidiaries’ federal tax treatment, (F) entering into or amending any transaction with any member of USD or their affiliates or (G) creating or materially amending any employee incentive plan; or
|
|
•
|
the determination of significant regulatory issues or litigation, including any decision to initiate, forego or settle any material litigation or arbitration, or the entering into discussions, or negotiations, with any governmental authority in connection with any investigation, proceedings or threatened investigation or proceedings, or any material inquiry.
|
148
Energy Capital Partners’ Right to Sell USD or Its Interests in USD
At any time following the fifth anniversary of the date of Energy Capital Partners’ investment in USD, Energy Capital Partners, upon giving written notice, shall have the right to compel USD to effect the total sale of Energy Capital Partners’ interests in USD (an ECP Exit). Such a sale could include an acquisition by the remaining owners of USD of Energy Capital Partners’ interests in USD or an initial public offering of USD. If the ECP Exit has not been completed within 180 days of the date USD receives notice of Energy Capital Partners’ desire to sell, Energy Capital Partners shall have the right to compel USD to effect a total sale of USD pursuant to an auction process on terms and conditions determined by, and in a process managed by, the members of USD’s board of directors that are appointed by Energy Capital Partners, provided that certain conditions in connection with the sale are met.
Board Role in Risk Oversight
Our corporate governance guidelines provide that the board of directors of our general partner is responsible for reviewing the process for assessing the major risks facing us and the options for their mitigation. This responsibility is largely satisfied by our audit committee, which is responsible for reviewing and discussing with management and our registered public accounting firm our major risk exposures and the policies that management has implemented to monitor such exposures.
Communication with the Board of Directors
A holder of our common units or other interested party who wishes to communicate with the non-management directors or independent directors of our general partner may do so by writing to: Independent Directors, c/o Corporate Secretary, USD Partners GP LLC, at 811 Main Street, Suite 2800, Houston, Texas 77002. Communications will be relayed to the intended recipient of the board of directors except in instances where it is deemed unnecessary or inappropriate to do so. Any communications withheld will nonetheless be recorded and available for any director who wishes to review them.
SECTION 16(a) BENEFICIAL OWNERSHIP REPORTING COMPLIANCE
Section 16(a) of the Exchange Act requires our directors, executive officers and 10% beneficial owners to file with the SEC reports of ownership and changes in ownership of our equity securities and to furnish us with copies of all reports filed. To our knowledge, based solely on a review of the copies of such reports furnished to us and written representations that no other reports were required, we believe that all reporting obligations of our general partner's officers, directors and greater than 10% unitholders under Section 16(a) were satisfied during the year ended
December 31, 2016
, except for one late Form 3 filed by Mr. Coppedge, related to his designation to the board of directors of our general partner by Energy Capital Partners in September 2016.
CODE OF BUSINESS CONDUCT AND ETHICS AND CORPORATE GOVERNANCE GUIDELINES
We have adopted a Code of Business Conduct and Ethics applicable to the directors and senior officers of our general partner including the principal executive officer, principal financial officer and principal accounting officer of USD Partners GP LLC. A copy of the Code of Business Conduct and Ethics is available on our website at
www.usdpartners.com
. We post on our website any amendments to or waivers of our Code of Business Conduct and Ethics, and we intend to satisfy any disclosure requirements that may arise under Form 8-K relating to this information through such postings. Additionally, this material is available in print, free of charge, to any person who requests the information. Persons wishing to obtain this printed material should submit a request to Corporate Secretary, c/o USD Partners GP LLC, 811 Main Street, Suite 2800, Houston, Texas 77002.
We also have a statement of Corporate Governance Guidelines that sets forth the expectation of how our board of directors should function and its position with respect to key corporate governance issues. A copy of the Corporate Governance Guidelines is available on our website at
www.usdpartners.com
. We post on our website any amendments to our Corporate Governance Guidelines, and we intend to satisfy any disclosure requirements that may otherwise arise under Form 8-K relating to these amendments through such postings. Additionally, this material is available in print, free of charge, to any person who requests the information. Persons wishing to obtain this printed material should submit a request to Corporate Secretary, c/o USD Partners GP LLC, 811 Main Street, Suite 2800, Houston, Texas 77002.
149
AUDIT COMMITTEE
Our general partner has an audit committee currently comprised of three board members, Jane O'Hagan, Stacy Smith and Jeff Wood, who are independent as the term is used in Section 10A of the Exchange Act, and are not relying upon any exemptions from the foregoing independence requirements. Mr. Wood serves as chair of the committee.
The audit committee provides independent oversight with respect to our internal controls, accounting policies, financial reporting, internal audit function and the report of the independent registered public accounting firm. Our audit committee also has the sole authority for retaining and terminating our independent registered public accounting firm, approving all auditing services and related fees and the terms thereof, and pre-approving any non-audit services to be rendered by our independent registered public accounting firm. Our audit committee is also responsible for confirming the independence and objectivity of our independent registered public accounting firm. Our independent registered public accounting firm has unrestricted access to our audit committee.
The charter of the audit committee is available on our website at
www.usdpartners.com.
The charter of the audit committee complies with the listing standards of the NYSE currently applicable to us. This material is available in print, free of charge, to any person who requests the information. Persons wishing to obtain this printed material should submit a request to Corporate Secretary, c/o USD Partners GP LLC, 811 Main Street, Suite 2800, Houston, Texas 77002.
The board of directors of our general partner has determined that Jeff Wood, who serves as chairman of the audit committee, qualifies as an “audit committee financial expert” as defined in Item 407(d)(5)(ii) of Regulation S-K and that each of the members of the audit committee are independent as defined by Section 303A of the listing standards of the NYSE.
The audit committee of our general partner has established procedures for the receipt, retention and treatment of complaints we receive regarding accounting, internal accounting controls or auditing matters and the confidential, anonymous submission by our employees of concerns regarding questionable accounting or auditing matters. Persons wishing to communicate with our audit committee may do so by writing to the Chairman, Audit Committee, c/o USD Partners GP LLC, 811 Main Street, Suite 2800, Houston, Texas 77002.
AUDIT COMMITTEE REPORT
The audit committee of our general partner oversees the Partnership’s financial reporting process on behalf of the board of directors. Management has the primary responsibility for the financial statements and the reporting process, including the systems of internal controls.
In fulfilling its oversight responsibilities, the audit committee reviewed and discussed with management the audited financial statements contained in this Annual Report on Form 10-K.
The Partnership’s independent registered public accounting firm, BDO USA, LLP, is responsible for expressing an opinion on the conformity of the audited financial statements with accounting principles generally accepted in the United States of America. The audit committee reviewed with BDO USA, LLP the firm’s judgment as to the quality, not just the acceptability, of the Partnership’s accounting principles and such other matters as are required to be discussed with the audit committee under the standards of the Public Company Accounting Oversight Board, or PCAOB.
The audit committee discussed with BDO USA, LLP the matters required to be discussed by PCAOB Auditing Standard No. 16, Communications with Audit Committees. The audit committee received written disclosures and the letter from BDO USA, LLP required by applicable requirements of the PCAOB regarding BDO USA, LLP’s communications with the audit committee concerning independence, and has discussed with BDO USA, LLP its independence from management and the Partnership.
150
Based on the reviews and discussions referred to above, the audit committee recommended to the board of directors that the audited financial statements be included in this Annual Report on Form 10-K for the year ended December 31, 2016, for filing with the SEC.
Jeff Wood,
Chairman
Jane O'Hagan
Stacy Smith
CONFLICTS COMMITTEE
Our general partner has established a conflicts committee to review specific matters that may involve conflicts of interest in accordance with the terms of our partnership agreement. Our conflicts committee will determine if the resolution of the conflict of interest is fair and reasonable to us. The conflicts committee will be comprised of at least two members of the board of directors of our general partner. Jane O’Hagan, Stacy Smith and Jeff Wood currently serve as members of the conflicts committee. The members of our conflicts committee may not be officers or employees of our general partner or directors, officers, or employees of its affiliates, and must meet the independence and experience standards established by the NYSE and the Exchange Act to serve on an audit committee of a board of directors. In addition, the members of our conflicts committee may not own any interest in our general partner or any interest in us or our subsidiaries other than common units or awards under our incentive compensation plan. We anticipate that once appointed to our general partner’s board of directors, any additional independent members appointed to our audit committee will also serve on the conflicts committee. Any matters approved by our conflicts committee will be presumed to have been approved in good faith, will be deemed to be approved by all of our partners and will not be a breach by our general partner of any duties it may owe us or our unitholders.
The charter of the conflicts committee is available on our website at
www.usdpartners.com.
This material is available in print, free of charge, to any person who requests the information. Persons wishing to obtain this printed material should submit a request to Corporate Secretary, c/o USD Partners GP LLC, 811 Main Street, Suite 2800, Houston, Texas 77002.
EXECUTIVE SESSIONS OF NON-MANAGEMENT DIRECTORS
In accordance with our Corporate Governance Guidelines, the non-management members of the board of directors of our general partner meet in executive session without management participation at each meeting. In addition, the independent directors of our general partner meet separately in executive session at least once per year. These executive sessions are chaired by the chairman of the audit committee of the board, who is presently Jeff Wood, or in his absence by an independent director chosen by the chairman. Interested parties may communicate directly with the independent directors by submitting a communication in care of Mr. Wood at Corporate Secretary, c/o USD Partners GP LLC, 811 Main Street, Suite 2800, Houston, Texas 77002.
151
General
We and our general partner were formed in June 2014 and did not pay or accrue any obligations with respect to compensation for directors or officers prior to our initial public offering in October 2014. In addition, we do not directly employ any of the persons responsible for managing our business. Our general partner, under the direction of its board of directors, is responsible for managing our operations and for obtaining the services of the employees that operate our business. However, we sometimes refer to the employees and officers of our general partner as our employees and officers in this report.
As an "emerging growth company," or EGC, as defined under the applicable rules of the SEC, we are not required to include a Compensation Discussion and Analysis section and have elected to comply with the scaled disclosure requirements applicable to EGCs. This executive compensation disclosure provides an overview of the executive compensation paid to the named executive officers, or NEOs, identified below for their services to us in
2016
. For
2016
, we determined the NEOs to be as follows:
|
•
|
Dan Borgen, Principal Executive Officer and Director
|
|
•
|
Paul Tucker, Senior Vice President, Chief Operating Officer
|
|
•
|
Keith Benson, General Counsel
|
Effective January 1, 2017, Paul Tucker became the Executive Vice President and Chief Integration & Relationship Officer of our Sponsor and our general partner.
For
2016
and all prior periods, all of the individuals who served as executive officers of our business were employed by USD or its affiliates other than us and, in addition to their responsibilities related to our business, also performed services for USD that were unrelated to us. Except with respect to our Class A units and with respect to awards granted under our USD Partners LP 2014 Long-Term Incentive Plan, or LTIP, all responsibility and authority for compensation-related decisions for the NEOs remains with USD and its affiliates, and such decisions are not subject to any approval by us, our general partner’s board of directors or any committees thereof. Other than the Class A units or awards granted under the LTIP, USD and its affiliates have the ultimate decision-making authority with respect to the total compensation of their and their subsidiaries’ executive officers and their employees. We incur a fixed annual cash charge for the services rendered to us and our general partner by the NEO’s, the amount of which is set forth under the terms of the omnibus agreement. We also reimburse USD and its affiliates a separate amount in respect of the salaries and matching contributions associated with 401(k) deferrals of our NEOs based upon the percentage of time that an NEO estimates is devoted to us and our subsidiaries for a given year. Compensation related to Class A units and awards granted under the LTIP are presented in the tables below at the fair value of the units on the grant date, although for financial reporting purposes, such amounts are recognized as compensation expense ratably over the vesting period, typically a four-year period.
Summary Compensation Table
The following table summarizes total compensation for services rendered to us by the NEOs during
2016
and
2015
. All of our NEOs provide services to both us and USD and its affiliates other than us. Cash amounts paid for services to us (which amounts are shown in the “Salary” column of the table below) include the fixed fees that we pay to USD for the services of each of the NEOs under the terms of the omnibus agreement as well as the portion of the base salary that is separately allocated to us and reimbursed by us to USD. The NEOs also received other compensation from USD for services unrelated to us.
152
SUMMARY COMPENSATION TABLE
|
Name and Principal Position
|
Salary
(1)
|
Unit
Awards
(2)
|
All Other Compensation
(3)
|
Total
|
|||||
|
Year
|
($)
|
($)
|
($)
|
($)
|
|||||
|
Dan Borgen
|
2016
|
330,750
|
|
378,588
|
|
—
|
|
709,338
|
|
|
Principal Executive Officer and Director
|
2015
|
151,636
|
|
400,116
|
|
2,310
|
|
554,062
|
|
|
Paul Tucker
|
2016
|
63,216
|
|
194,684
|
|
1,643
|
|
259,543
|
|
|
Senior Vice President, Chief Operating Officer
|
2015
|
136,260
|
|
379,540
|
|
1,748
|
|
517,548
|
|
|
Keith Benson
|
2016
|
232,422
|
|
184,090
|
|
—
|
|
416,512
|
|
|
General Counsel
|
2015
|
42,500
|
|
372,690
|
|
1,530
|
|
416,720
|
|
|
(1)
|
The amounts presented reflect the portion of the fixed fee and variable amounts that we pay to USD for the NEOs’ services under Schedule C and as otherwise set forth under the terms of the omnibus agreement, as well as the portion of the base salary that is separately allocated to us and reimbursed by us to USD.
|
|
(2)
|
The amounts presented for
2016
and
2015
represent the grant date fair value of Phantom Unit awards granted pursuant to our LTIP. Each Phantom Unit is the economic equivalent of one of our common units, and awards vest in four equal annual installments commencing on the one-year anniversary of the issuance date, subject to vesting acceleration in certain circumstances as discussed below under the heading “
Potential Payments Upon Termination or Change in Control.
” The value attributed to each Phantom Unit is $6.39 for the Phantom Unit awards granted in
2016
and $12.78 for the Phantom Unit awards granted in
2015
, in each case representing the closing price of our common units as stated on the NYSE on February 25, 2016, and February 13, 2015 (our closing price on the last trading day before the awards were granted on February 16, 2015), respectively, except for the awards for Mr. Benson, which were granted on March 2, 2015, at which time the closing price of our common units was $12.92 as stated on the NYSE. For additional information about our Phantom Unit awards and the LTIP, refer to the discussion included in
Note 20 — Unit Based Compensation
of our financial statements included in Part II, Item 8 of this Annual Report.
|
|
(3)
|
The amounts presented represent the amounts we are charged for the matching contributions made by USD associated with 401(k) deferrals of each NEO based upon the percentage of time that an NEO estimates is devoted directly to our subsidiaries for the specified year.
|
Narrative Disclosure to Summary Compensation Table
Neither we, our general partner, nor any of our subsidiaries have employees. USD is contractually obligated to provide its and its subsidiaries’ employees and other personnel necessary for us to conduct our operations. This includes all of our executive officers. The executive officer compensation is paid by USD or its applicable affiliate. We pay USD a fixed and a variable amounts each month for the services of our executive officers.
Our general partner’s board of directors has adopted the LTIP on our behalf. Substantially all officers, employees, consultants and directors of our general partner and its affiliates who contribute to our business are eligible to receive awards under the LTIP. Awards under the LTIP are approved by our general partner’s board of directors. Our general partner’s board of directors has granted awards of Phantom Units pursuant to the LTIP, which represent the right to receive our common units or, in the discretion of the board, cash payments based on the value of our common units. The following table sets forth the Phantom Units granted to our NEOs for the respective year:
153
|
Name
|
Year
|
Phantom Unit Award
|
|
|
Dan Borgen
|
2016
|
59,247
|
|
|
2015
|
31,308
|
|
|
|
Paul Tucker
|
2016
|
30,467
|
|
|
2015
|
29,698
|
|
|
|
Keith Benson
|
2016
|
28,809
|
|
|
2015
|
28,846
|
|
|
The Phantom Units vest in four equal annual installments over a four-year period, subject to accelerated vesting in certain circumstances. For more information about accelerated vesting of the Phantom Units, see the discussion below under the heading “
Potential Payments Upon Termination or Change in Control
.” In addition, the Phantom Unit awards to our NEOs were granted with corresponding distribution equivalent rights, or DERs, which represent the right to receive payments in an amount equal to any distributions made by us with respect to our common units underlying the Phantom Units. The distribution equivalent rights remain outstanding until the earlier of the vesting or forfeiture of the related Phantom Unit.
Prior to our IPO, our general partner also granted Class A units in us to certain of our NEOs and certain other key employees as discussed below.
Class A Unit Awards
In August 2014, our general partner’s board of directors granted Class A unit awards to our NEOs as follows: Mr. Borgen - 55,000 Class A units and Mr. Tucker - 10,000 Class A units. The Class A units are limited partner interests in our partnership that entitle the holder to distributions that are equivalent to the distributions paid in respect of our common units (excluding any arrearages of unpaid minimum quarterly distributions from prior quarters). The Class A units vest in four equal annual installments over a four-year period (each of which we refer to as a Class A Vesting Tranche), subject to us growing our annualized distributions each year. If we do not achieve positive distribution growth in any of these years, the Class A units in the Class A Vesting Tranche that would otherwise vest for that year will be forfeited. The Class A units are also subject to vesting acceleration in certain circumstances. For more information about vesting acceleration of the Class A units, see the discussion below under the heading “
Potential Payments Upon Termination or Change in Control
.”
The Class A units convert into our common units upon vesting. The number of common units into which the Class A units will convert upon vesting is tied to the level of our distribution growth for the applicable year. If the Class A units in a Class A Vesting Tranche vest, but we grow our annualized distribution by less than 10%, the Class A units in that Class A Vesting Tranche will convert into common units one-for-one. If we grow our annualized distribution by 10% or more, the Class A units in that Class A Vesting Tranche will convert into common units based on a conversion factor of 1.25 for the first Class A Vesting Tranche, 1.5 for the second Class A Vesting Tranche, 1.75 for the third Class A Vesting Tranche and 2.0 for the last Class A Vesting Tranche. In February 2016, the first Class A Vesting Tranche vested and was converted into common units on a one-for-one basis.
154
Outstanding Equity Awards at Fiscal Year-End 2016
The following table shows outstanding equity awards for our NEOs. All values are shown as of December 31, 2016.
|
Unit Awards
|
||||
|
Phantom Units
|
Class A units
|
|||
|
Name
|
Number of shares or units of stock that have not vested
(1)
(#)
|
Market value of shares or units of stock that have not vested
(2)
($)
|
Equity Incentive Plan Awards: Number of Unearned Shares, Units or
Other Rights That Have Not Vested (3) (#) |
Equity Incentive Plan Awards: Market or Payout of Value of Unearned
Shares, Units or Other Rights That Have Not Vested (2) ($) |
|
Dan Borgen
|
82,728
|
1,307,102
|
41,250
|
651,750
|
|
Paul Tucker
|
52,740
|
833,292
|
7,500
|
118,500
|
|
Keith Benson
|
50,443
|
796,999
|
—
|
—
|
|
(1)
|
The Phantom Units were granted in February 2015 and 2016 for Messrs. Borgen and Tucker and March 2015 and February 2016 for Mr. Benson. Each Phantom Unit represents the economic equivalent of one of our common units, and awards vest in four equal annual installments commencing on the one-year anniversary of the issuance date, subject to continued employment. Refer to the discussion included in
Note 20 — Unit Based Compensation
of our financial statements included in Part II, Item 8 of this Annual Report.
|
|
(2)
|
The value is based on the closing market price of a common unit on December 30, 2016, the last trading day for
2016
, of
$15.80
per unit. The amounts shown for the Class A units assume that the Class A units would convert into our common units at a ratio of one-for-one.
|
|
(3)
|
The Class A units were granted on August 18, 2014, and vest in four equal annual installments (with the first installment having vested on February 22, 2016, the first business day following the payment of our regular quarterly distribution in respect of the calendar quarter ended December 31, 2015), subject to continued employment and to us achieving the distribution growth required for the applicable tranche to vest. For additional information, please refer to the discussion above under the heading “
Class A Unit Awards
” and the discussion included in
Note 20 — Unit Based Compensation
of our financial statements included in Part II, Item 8 of this Annual Report.
|
Potential Payments Upon Termination or Change in Control
None of our NEOs have entered into any employment, severance or similar agreements in relation to their services to us or our general partner and, except with respect to the Class A units and Phantom Units issued pursuant to our LTIP, as of
December 31, 2016
, there were no arrangements pursuant to which our NEOs would receive any payments or benefits in connection with a change in control of us.
The terms of the Class A units that were granted to our NEOs provide that if (i) the executive’s employment is terminated without cause or due to his death or disability, (ii) the executive resigns his employment for good reason or (iii) there is a change in control of our partnership, the Class A units will fully vest and convert into common units based on the maximum conversion factor that could have applied to such Class A units. For additional information, please refer to the discussion above under the heading “
Class A Unit Awards.
”
The Phantom Unit awards granted pursuant to the LTIP generally contemplate that the individual grants of Phantom Units will vest in
four
equal annual installments based on the grantee’s continued employment through the vesting dates, subject to acceleration upon (i) the grantee’s death or disability, (ii) upon a change in control of the Partnership or our general partner that also results in the grantee's involuntary termination, or (iii) upon termination of the grantee's service without cause (as defined in the LTIP) or resignation for good reason, in either case following a change in control of the Partnership or our general partner. The board of directors of our general partner may also accelerate the vesting of the Phantom Units in its discretion within 60 days following the grantee's termination for any reason other than cause.
“Cause” when defined for purposes of the Class A units generally means (i) an act of gross negligence or willful misconduct that adversely affects USD or its affiliates, (ii) an act of fraud, theft or embezzlement, (iii) a conviction of
155
guilty or nolo contendere plea with respect to certain crimes, (iv) a breach of applicable material policies or agreements or (v) the refusal to perform reasonable duties following notice and opportunity to cure. “Good reason” for purposes of the Class A units is generally defined as (x) a material diminution in duties or responsibilities, (y) a material diminution in base salary or (z) a relocation of principal place of employment by more than 50 miles, in each case subject to a notice and cure right for us or our affiliates.
2016
Director Compensation Table
As a partnership, we are managed by our general partner. The members of the board of directors of our general partner perform for us the functions of a board of directors of a business corporation. Our general partner has implemented a director compensation policy for members of the board of directors who are not officers, employees or paid consultants or advisors of us or our general partner or USD or Energy Capital Partners. We are allocated 100% of the director compensation of such board members. Such directors are expected to receive an annual compensation package valued at approximately $200,000. For
2016
, approximately one-third of this amount was paid in the form of a cash retainer and the remaining two-thirds was provided in the form of a unit based award (with distribution equivalent rights) under the USD Partners LP 2014 Long-Term Incentive Plan. The Phantom Units (with distribution equivalent rights) granted to the directors are subject to the same terms and conditions, including vesting acceleration, as the grants to our NEOs, except the awards vest over a one-year period (instead of a four-year period) following the grant date. Such directors also receive reimbursement for out-of-pocket expenses associated with attending board or committee meetings and director and officer liability insurance coverage. Officers, employees or paid consultants or advisors of us or our general partner or its affiliates who also serve as directors do not receive additional compensation for their service as directors. All directors are indemnified by us for actions associated with being a director to the fullest extent permitted under Delaware law and are reimbursed for all expenses incurred in attending to his or her duties as a director.
DIRECTOR COMPENSATION
|
Name
|
Fees Earned or Paid in Cash
(1)
($)
|
Unit Awards
(2)
($)
|
Total
($)
|
|
Jane O'Hagan
|
66,667
|
138,088
|
204,755
|
|
Stacy Smith
|
66,667
|
138,088
|
204,755
|
|
Jeff Wood
|
66,667
|
138,088
|
204,755
|
|
(1)
|
The amounts reflected in this column represent the director cash retainer payments made during
2016
.
|
|
(2)
|
Each of Ms. O'Hagan, Mr. Smith and Mr. Wood were granted 21,610 Phantom Unit awards on February 25, 2016, pursuant to our LTIP, with a fair value of $6.39 per unit, which amount is based on the closing price of one of our common units on the day of the grant. At
December 31, 2016
, Ms. O'Hagan, Mr. Smith and Mr. Wood each held 21,610 Phantom Units. Each of the Phantom Units granted will vest in total on the one-year anniversary of the grant date.
|
Compensation Committee Interlocks and Insider Participation
As discussed above, the board of directors of our general partner is not required to maintain and does not maintain a compensation committee.
Mr. Borgen and Mr. Sanders do not participate in the determination of their respective compensation as officers of our general partner.
|
Item 12.
|
Security Ownership of Certain Beneficial Owners and Management and Related Stockholder Matters
|
The following tables set forth information with respect to persons known to us to be the beneficial owners of more than 5% of any class of our units, and NEOs, directors and executive officers of USD Partners GP LLC as a group. The amounts and percentage of units beneficially owned are reported on the basis of regulations of the SEC governing the determination of beneficial ownership of securities. Under the rules of the SEC, a person is deemed to be a “beneficial owner” of a security if that person has or shares “voting power,” which includes the power to vote or to direct the voting
156
of such security, or “investment power,” which includes the power to dispose of or to direct the disposition of such security. The percentage of units beneficially owned is based on a total of
16,537,498
common units,
92,500
Class A units and
6,278,127
subordinated units outstanding. In computing the number of common units beneficially owned by a person and the percentage ownership of that person, common units subject to options or warrants held by that person that are currently exercisable or exercisable within 60 days of
March 3, 2017
, if any, are deemed outstanding, but are not deemed outstanding for computing the percentage ownership of any other person. Except as indicated by footnote, the persons named in the table below have sole voting and investment power with respect to all units shown as beneficially owned by them, subject to community property laws where applicable.
SECURITY OWNERSHIP OF CERTAIN BENEFICIAL OWNERS
The following table sets forth information as of
March 3, 2017
, with respect to persons, other than the NEOs, directors and executive officers of USD Partners GP LLC as a group, known to us to be the beneficial owners of more than 5% of any class of our units:
|
Name of Beneficial Owner
(1)
|
Common Units Beneficially Owned
|
Subordinated Units Beneficially Owned
|
Percentage of Total Common Units, Class A Units and Subordinated Units Beneficially Owned
|
||||||
|
US Development Group LLC
(2)
|
5,278,963
|
|
6,278,127
|
|
50.4
|
%
|
|||
|
USD Holdings LLC
(3)
|
2,401,928
|
|
2,856,548
|
|
23.0
|
%
|
|||
|
Energy Capital Partners III
(4)(5)
|
36,953
|
|
43,947
|
|
0.4
|
%
|
|||
|
Energy Capital Partners III-A
(4)(5)
|
1,251,114
|
|
1,487,916
|
|
12.0
|
%
|
|||
|
Energy Capital Partners III-B (USD IP)
(4)(5)
|
791,844
|
|
941,719
|
|
7.6
|
%
|
|||
|
Energy Capital Partners III-C (USD IP)
(4)(5)
|
517,338
|
|
615,256
|
|
4.9
|
%
|
|||
|
Advisory Research, Inc.
(6)
|
3,178,869
|
|
—
|
|
13.9
|
%
|
|||
|
Nuveen Energy MLP Total Return Fund
(7)
|
980,540
|
|
—
|
|
4.3
|
%
|
|||
(1)
Unless otherwise indicated, the address for each beneficial owner is 811 Main Street, Suite 2800, Houston, Texas 77002.
(2)
USD, through its 100% ownership of USD Group LLC (which owns 100% of our general partner), is the indirect owner of
5,278,963
common units,
6,278,127
subordinated units and
461,136
general partner units. USD is the parent company of USD Group LLC who holds the common units and subordinated units directly and is the sole owner of the member interests of our general partner. USD Group LLC is managed by USD. USD is managed by a seven person board of directors that includes Dan Borgen, Mike Curry, James Hutson-Wiley, Schuyler Coppedge, Douglas Kimmelman, Thomas Lane and Alan Crown. The board of directors of USD exercises voting and dispositive power over the units held by USD Group LLC, and acts by majority vote. Please read
Item 13. Certain Relationships and Related Transactions, and Director Independence.
Messrs. Borgen, Coppedge, Curry, Hutson-Wiley, Kimmelman, Lane and Crown are thus not deemed to have beneficial ownership of the units owned by USD Group LLC.
|
(3)
|
USD Holdings, LLC is a
45.5%
member of USD and may therefore be deemed to indirectly beneficially own
2,401,928
common units,
2,856,548
subordinated units and
209,817
general partner units held by USD. As holders of a 45.5% voting interest of USD, USD Holdings, LLC is entitled to elect three directors of USD. USD Holdings LLC is managed by its managers, Mike Curry, Dan Borgen and James Hutson-Wiley. Neither Messrs. Curry, Borgen nor Hutson-Wiley are deemed to beneficially own, and they disclaim beneficial ownership of, any common units or subordinated units beneficially owned by our general partner or USD.
|
|
(4)
|
The address for this beneficial owner or entity is 51 John F. Kennedy Parkway, Suite 200, Short Hills, New Jersey 07078.
|
|
(5)
|
The Energy Capital Partners funds are members of USD, collectively holding a
49.2%
interest in USD, and may therefore be deemed to indirectly collectively beneficially own
2,597,249
common units,
3,088,838
subordinated units and
226,878
general partner units held by USD. Energy Capital Partners III, LLC is the direct or indirect general partner of each of the Energy Capital Partners funds and is deemed to indirectly beneficially own the securities
|
157
held by the Energy Capital Partners funds, but disclaims such ownership except to the extent of its pecuniary interest therein. As holders of a
49.2%
voting interest of USD, the Energy Capital Partners funds are entitled to elect three directors of USD and have veto rights over certain actions by USD and its subsidiaries. Douglas Kimmelman, Thomas Lane and Schuyler Coppedge are each a member of the board of directors of our general partner as representatives of Energy Capital Partners. In addition, Mr. Kimmelman is a managing member and partner, and Mr. Lane is a managing member and Vice Chairman, at Energy Capital Partners III, LLC, the general partner of the general partner of the Energy Capital Partners funds. None of Mr. Kimmelman, Mr. Lane nor Mr. Coppedge are deemed to beneficially own, and they disclaim beneficial ownership of, any common units or subordinated units beneficially owned by our general partner or USD.
|
(6)
|
Based solely on a Schedule 13G/A filed by Advisory Research, Inc. ("ARI") on February 14, 2017. The Schedule 13G/A states that ARI has shared voting power over 3,178,869 of the common units and shared dispositive power over all 3,185,224 of the common units. The Schedule 13G/A states that ARI, a wholly-owned subsidiary of Piper Jaffray Companies and an investment adviser registered under Section 203 of the Investment Advisers Act of 1940, is the beneficial owner of the 3,185,224 common units as a result of acting as investment adviser to various clients. The Schedule 13G/A states that Piper Jaffray Companies may be deemed to be the beneficial owner of these 3,185,224 common units through control of ARI. However, Piper Jaffray Companies disclaims beneficial ownership of such common units. The address of the ARI is 180 N Stetson Ave., Suite 5500, Chicago, IL 60601 and the address of Piper Jaffray Companies is 800 Nicollet Mall, Suite 800, Minneapolis, MN 55402.
|
|
(7)
|
Based solely on a Schedule 13G/A filed by Advisory Research, Inc. ("ARI") on February 14, 2017. The Schedule 13G/A states that Nuveen Energy MLP Total Return Fund has shared voting and dispositive power over 980,540 of the common units. The Schedule 13G/A states that Nuveen Energy MLP Total Return Fund is an investment company registered under section 8 of the Investment Company Act of 1940, is the beneficial owner of 980,540 common units as a result of acting as an investment company. The Schedule 13G/A states that Nuveen Energy MLP Total Return Fund may be deemed to be the beneficial owner of these 980,540 common units. However, Nuveen Energy MLP Total Return Fund disclaims beneficial ownership of such common units. The address of Nuveen Energy MLP Total Return Fund is 333 West Wacker Dr., Chicago IL 60606.
|
SECURITY OWNERSHIP OF MANAGEMENT AND DIRECTORS
The following table sets forth information as of
March 3, 2017
, with respect to each class of our units beneficially owned by the NEOs, directors and executive officers of USD Partners GP LLC as a group:
|
Name of Beneficial Owner
(1)
|
Common Units Beneficially Owned
|
Class A Units Beneficially Owned
|
Percentage of Total Common Units, Class A Units and Subordinated Units Beneficially Owned
|
|||||
|
Dan Borgen
(2)
|
105,808
|
|
27,500
|
|
*
|
|||
|
Schuyler Coppedge
|
—
|
|
—
|
|
*
|
|||
|
Mike Curry
(3)
|
18,649
|
|
—
|
|
*
|
|||
|
Douglas Kimmelman
|
50,000
|
|
—
|
|
*
|
|||
|
Thomas Lane
|
50,000
|
|
—
|
|
*
|
|||
|
Jane O'Hagan
(4)
|
—
|
|
—
|
|
*
|
|||
|
Brad Sanders
(5)
|
175,157
|
|
20,000
|
|
*
|
|||
|
Stacy Smith
(6)
|
45,213
|
|
—
|
|
*
|
|||
|
Jeff Wood
(7)
|
33,166
|
|
—
|
|
*
|
|||
|
Paul Tucker
(8)
|
42,948
|
|
5,000
|
|
*
|
|||
|
Keith Benson
(9)
|
6,038
|
|
—
|
|
*
|
|||
|
All Directors and Executive Officers as a group (14 Persons)
(11)
|
579,700
|
|
75,000
|
|
2.9%
|
|||
|
*
|
Less than 1.0%.
|
158
|
(1)
|
Unless otherwise indicated, the address for each beneficial owner is 811 Main Street, Suite 2800, Houston, Texas 77002.
|
|
(2)
|
Excludes
152,902
phantom units granted under the LTIP. The phantom units generally vest in equal annual installments over a four year service period commencing on the one year anniversary of the grant.
|
|
(3)
|
Excludes
59,762
phantom units granted under the LTIP. The phantom units generally vest in equal annual installments over a four year service period commencing on the one year anniversary of the grant.
|
|
(4)
|
Excludes
8,333
phantom units granted under the LTIP. The phantom units will vest on February 16, 2018.
|
|
(5)
|
Excludes
146,983
phantom units granted under the LTIP. The phantom units generally vest in equal annual installments over a four year service period commencing on the one year anniversary of the grant.
|
|
(6)
|
Excludes
8,333
phantom units granted under the LTIP. The phantom units will vest on February 16, 2018.
|
|
(7)
|
Excludes
8,333
phantom units granted under the LTIP. The phantom units will vest on February 16, 2018.
|
|
(8)
|
Excludes
73,148
phantom units granted under the LTIP. The phantom units vest in equal annual installments over a four year service period commencing on the one year anniversary of the grant.
|
|
(9)
|
Excludes
66,710
phantom units granted under the LTIP. The phantom units generally vest in equal annual installments over a four year service period commencing on the one year anniversary of the grant.
|
|
(10)
|
Excludes
675,926
phantom units granted under the LTIP.
|
SECURITIES AUTHORIZED FOR ISSUANCE UNDER EQUITY COMPENSATION PLANS
The following table provides information as of
December 31, 2016
, with respect to common units that may be issued under the LTIP:
|
Plan category
|
Number of securities to be issued upon exercise of outstanding options, warrants and rights
(1)
|
Weighted average exercise price of outstanding options, warrants and rights
|
Number of securities remaining available for future issuance under equity compensation
plans
(2)
|
||||
|
Equity compensation plans approved by security holders
|
838,863
|
—
|
129,474
|
||||
|
Equity compensation plans not approved by security holders
|
—
|
—
|
—
|
||||
|
Total
|
838,863
|
—
|
129,474
|
||||
|
(1)
|
Reflects the number of previously granted equity incentive awards, representing Phantom Units outstanding at
December 31, 2016
, issued pursuant to the LTIP and includes 43,225 Phantom Units issued pursuant to the LTIP that upon vesting entitle the participant to receive cash for an amount equivalent to the closing market price for one of our common units on the vesting date multiplied by the number of vested Phantom Units.
|
|
(2)
|
Reflects the remaining equity incentive awards, representing Phantom Units that are convertible into common units available for issuance pursuant to the LTIP.
|
As of
March 3, 2017
, USD Group LLC owns
11,557,090
common units and subordinated units representing an aggregate
49.4%
limited partner interest in us. In addition, as of
March 3, 2017
, our general partner owns
461,136
general partner units representing a
2.0%
general partner interest in us.
159
CASH DISTRIBUTIONS
During the year ended
December 31, 2016
, we paid the following aggregate cash distributions to USDG as a holder of our common units and all of our subordinated units and to USD Partners GP LLC for their general partner interest.
|
Distribution Declaration Date
|
Record Date
|
Distribution
Payment Date
|
Amount Paid to
USDG
|
Amount Paid to
USD Partners GP LLC
|
||||||||
|
(in thousands)
|
||||||||||||
|
February 4, 2016
|
February 15, 2016
|
February 19, 2016
|
$
|
3,467
|
|
$
|
138
|
|
||||
|
April 28, 2016
|
May 9, 2016
|
May 13, 2016
|
3,554
|
|
142
|
|
||||||
|
July 28, 2016
|
August 8, 2016
|
August 12, 2016
|
3,640
|
|
145
|
|
||||||
|
October 27, 2016
|
November 7, 2016
|
November 14, 2016
|
3,727
|
|
149
|
|
||||||
|
$
|
14,388
|
|
$
|
574
|
|
|||||||
CONFLICTS OF INTEREST
Conflicts of interest exist and may arise in the future as a result of the relationships between our general partner and its affiliates, including USD, on the one hand, and us and our limited partners, on the other hand. The directors and officers of our general partner have fiduciary duties to manage our general partner in a manner beneficial to USD. At the same time, our general partner has a duty to manage our partnership in a manner it believes is in our best interests. Our partnership agreement specifically defines the remedies available to unitholders for actions taken that, without these defined liability standards, might constitute breaches of fiduciary duty under applicable Delaware law. The Delaware Revised Uniform Limited Partnership Act, which we refer to as the Delaware Act, provides that Delaware limited partnerships may, in their partnership agreements, expand, restrict or eliminate the fiduciary duties otherwise owed by the general partner to the limited partners and the partnership.
Whenever a conflict arises between our general partner or its affiliates, on the one hand, and us or our limited partners, on the other hand, the resolution or course of action in respect of such conflict of interest shall be permitted and deemed approved by all our limited partners and shall not constitute a breach of our partnership agreement, of any agreement contemplated thereby or of any duty, if the resolution or course of action in respect of such conflict of interest is:
|
•
|
approved by the conflicts committee of our general partner, although our general partner is not obligated to seek such approval; or
|
|
•
|
approved by the holders of a majority of the outstanding common units, excluding any such units owned by our general partner or any of its affiliates, although our general partner is not obligated to seek such approval.
|
Our general partner may, but is not required to, seek the approval of such resolutions or courses of action from the conflicts committee of its board of directors or from the holders of a majority of the outstanding common units as described above. If our general partner does not seek approval from the conflicts committee or from holders of common units as described above and the board of directors of our general partner takes or declines the course of action taken with respect to the conflict of interest, then it will be presumed that, in making its decision, the board of directors of our general partner acted in good faith, and in any proceeding brought by or on behalf of us or any of our unitholders, the person bringing or prosecuting such proceeding will have the burden of overcoming such presumption. Unless the resolution of a conflict is specifically provided for in our partnership agreement, the board of directors of our general partner or the conflicts committee of the board of directors of our general partner may consider any factors they determine in good faith to consider when resolving a conflict. An independent third-party is not required to evaluate the resolution. Under our partnership agreement, a determination, other action or failure to act by our general partner, the board of directors of our general partner or any committee thereof (including the conflicts committee) will be deemed to be “in good faith” unless our general partner, the board of directors of our general partner or any committee thereof (including the conflicts committee) believed such determination, other action or failure to act was adverse to the interests of the partnership. Please read
Item 10. Directors, Executive Officers and Corporate Governance—Conflicts Committee
for information about the conflicts committee of our general partner's board of directors.
160
REVIEW, APPROVAL OR RATIFICATION OF TRANSACTIONS WITH RELATED PERSONS
The board of directors of our general partner have adopted a related party transactions policy that provides that the board of directors of our general partner or its authorized committee will review on at least a quarterly basis all related person transactions that are required to be disclosed under SEC rules and, when appropriate, initially authorize or ratify all such transactions. In the event that the board of directors of our general partner or its authorized committee considers ratification of a related person transaction and determines not to so ratify, the code of business conduct and ethics provides that our management will make all reasonable efforts to cancel or annul the transaction.
The related party transactions policy provides that, in determining whether or not to recommend the initial approval or ratification of a related person transaction, the board of directors of our general partner or its authorized committee should consider all of the relevant facts and circumstances available, including (if applicable) but not limited to: (i) whether there is an appropriate business justification for the transaction; (ii) the benefits that accrue to us as a result of the transaction; (iii) the terms available to unrelated third parties entering into similar transactions; (iv) the impact of the transaction on a director’s independence (in the event the related person is a director, an immediate family member of a director or an entity in which a director or an immediate family member of a director is a partner, shareholder, member or executive officer); (v) the availability of other sources for comparable products or services; (vi) whether it is a single transaction or a series of ongoing, related transactions; and (vii) whether entering into the transaction would be consistent with the code of business conduct and ethics.
TRANSACTIONS WITH RELATED PERSONS
We believe the terms and provisions of our related party agreements are fair to us; however, such agreements and transactions may not be as favorable to us as we could have obtained from unaffiliated third parties. Refer to Part II, Item 8.
Financial Statements and Supplementary Data,
Note 13. Transactions with Related Parties
for a
comprehensive discussion and disclosure of our transactions with related parties.
Omnibus Agreement Transactions
Pursuant to the omnibus agreement entered into by us with USD and USD Group LLC, we incurred charges of
$5.8 million
, which are recorded in "Selling, general and administrative - related party" in our consolidated statement of operations.
The omnibus agreement also addresses the following matters:
|
•
|
our right of first offer to acquire certain USD-retained Hardisty development projects, as well as other additional midstream infrastructure that USD and USDG may construct or acquire in the future;
|
|
•
|
our obligation to reimburse USDG for any out-of-pocket costs and expenses incurred by USDG in providing general and administrative services (which reimbursement is in addition to certain expenses of our general partner and its affiliates that are reimbursed under our partnership agreement), as well as any other out-of-pocket expenses incurred by USDG on our behalf; and,
|
|
•
|
an indemnity by USD for certain environmental and other liabilities, and our obligation to indemnify USD and its subsidiaries for events and conditions associated with the operation of our assets that occur after the closing of our IPO and for environmental liabilities related to our assets to the extent USD is not required to indemnify us.
|
So long as USD controls our general partner, the omnibus agreement will remain in full force and effect. If USD ceases to control our general partner, either party may terminate the omnibus agreement, provided that the indemnification obligations will remain in full force and effect in accordance with their terms.
From time to time, in the ordinary course of business, USD and its affiliates may receive vendor payments or other amounts due to us or our subsidiaries. In addition, we may make payments to vendors and other unrelated parties on behalf of USD and its affiliates for which they routinely reimburse us. We had a receivable balance at
December 31, 2016
of
$0.2 million
related to these transactions.
161
Related Party Sales to USD Marketing LLC
Information about related party sales to USD Marketing LLC is presented below:
|
For the Year Ended December 31, 2016
|
|||
|
(in thousands)
|
|||
|
Terminalling services — related party
|
$
|
6,933
|
|
|
Fleet leases — related party
|
3,560
|
|
|
|
Fleet services — related party
|
1,116
|
|
|
|
Freight and other reimbursables — related party
|
—
|
|
|
|
$
|
11,609
|
|
|
Other Agreements with USD and Related Parties
Terminal Services Agreement
We have entered into a terminal services agreement with USD Marketing LLC, a wholly owned subsidiary of USD, to provide terminalling services at our Hardisty terminal. This agreement has an initial contract term of five years that commenced on October 1, 2014. The terms and conditions of this agreement are similar to the terms and conditions of third-party terminal services agreements at the Hardisty terminal. Please read
Item 1. Business-Business Segments -Hardisty Terminal
. The aggregate payment under this agreement will be approximately $40.0 million Canadian dollars over the agreement’s five-year term.
Variable Interest Entities
We entered into purchase, assignment and assumption agreements to assign payment and performance obligations for certain operating lease agreements as well as customer fleet service payments related to these operating leases with the VIEs. Prior to July 1, 2016, a member of the board of directors of USD exercised control over the VIEs as its managing member. Subsequent to June 30, 2016, the managing member transferred ownership of the VIEs to a party that is unaffiliated with USD or us. As a result, for periods following June 30, 2016, we no longer treat the VIEs as related parties.
For the six month period prior to July 1, 2016, our related party sales to the VIEs totaled
$0.8 million
.
Development Rights and Cooperation Agreement
In connection with the transfer and conveyance of the undeveloped land under the Purchase and Sale Agreement described above, our subsidiary that owns the Hardisty terminal entered into a Development Rights and Cooperation Agreement with USD pursuant to which:
|
•
|
our subsidiary granted to USD the right to develop, construct and operate certain development projects in, on, over, across and under the property on which the Hardisty terminal is located, including the exclusive right to develop and construct such expansions for a period of seven years after the closing of our IPO;
|
|
•
|
our subsidiary granted to USD the right to use (both on a temporary and permanent basis) certain portions of the property on which the Hardisty terminal is located in connection with the development, construction and operation of USD's development projects;
|
|
•
|
our subsidiary will cooperate with USD in connection with the development, construction and operation of USD's development projects at the Hardisty terminal;
|
|
•
|
our subsidiary will enter into such further agreements or instruments with or for the benefit of USD and any land owned by USD (including the undeveloped land being acquired by USD under the Purchase and Sale Agreement described above) and will grant further rights in, on, over, across and under the property on which the Hardisty terminal is located to or for the benefit of USD and any land owned by USD (including
|
162
the undeveloped land being acquired by USD under the Purchase and Sale Agreement described above), as USD may reasonably request in connection with certain development projects;
|
•
|
USD's development projects at the Hardisty terminal will be at the sole cost and expense of USD, and will be subject to the observance by USD of certain customary construction-related requirements and obligations; and
|
|
•
|
all improvements constructed or installed by USD in connection with USD's development projects at the Hardisty terminal will be owned by USD and USD will be entitled to grant liens on such improvements and/or in and to any rights acquired by USD under the Development Rights and Cooperation Agreement.
|
Director Independence
See
Item 10. Directors, Executive Officers and Corporate Governance
, for information regarding director independence required by Item 407(a) of Regulation S-K.
The following table sets forth the aggregate fees billed for professional services rendered by BDO USA, LLP
("BDO"), our principal independent auditors, for each of the last two fiscal years.
|
For the year ended December 31,
|
|||||||
|
2016
|
2015
|
||||||
|
(in millions)
|
|||||||
|
Audit fees
(1)
|
$
|
0.6
|
|
$
|
0.5
|
|
|
|
Audit-related fees
(2)
|
—
|
|
—
|
|
|||
|
Tax fees
(3)
|
—
|
|
—
|
|
|||
|
All other fees
(4)
|
—
|
|
—
|
|
|||
|
Total
|
$
|
0.6
|
|
$
|
0.5
|
|
|
|
(1)
|
Audit fees consist of fees billed for professional services rendered for the audit of our consolidated financial statements, reviews of our interim consolidated financial statements, audits of USD and various joint ventures for statutory requirements.
|
|
(2)
|
Audit-related fees represent fees for assurance and related services. BDO did not provide any audit-related services to us during the last two fiscal years.
|
|
(3)
|
BDO did not provide any tax services to us during the last two fiscal years.
|
|
(4)
|
All other fees represent fees for services not classifiable under the categories listed in the above table. No such services were rendered by BDO to us during the last two fiscal years.
|
Engagements for services provided by BDO are subject to pre-approval by the audit committee of the board of directors for USD Partners GP LLC. All services in 2016 were pre-approved by the audit committee.
163
The following documents are filed as a part of this report:
(1)
Financial Statements.
The following financial statements and supplementary data are incorporated by reference in Part II, Item 8.
Financial Statements and Supplementary Data
of this Annual Report.
|
a.
|
Report of BDO USA, LLP, Independent Registered Public Accounting Firm.
|
|
b.
|
Consolidated Statements of Operations for the years ended December 31, 2016, 2015 and 2014.
|
|
c.
|
Consolidated Statements of Comprehensive Income (Loss) for the years ended December 31, 2016, 2015 and 2014.
|
|
d.
|
Consolidated Statements of Cash Flows for the years ended December 31, 2016, 2015 and 2014.
|
|
e.
|
Consolidated Balance Sheets as of December 31, 2016 and 2015.
|
|
f.
|
Consolidated Statements of Partners’ Capital for the years ended December 31, 2016, 2015 and 2014.
|
|
g.
|
Notes to the Consolidated Financial Statements.
|
(2)
Financial Statement Schedules.
All schedules have been omitted because they are not applicable, the required information is shown in the consolidated financial statements or Notes thereto or the required information is immaterial.
(3)
Exhibits.
Reference is made to the “Index of Exhibits” following the signature pages, which is hereby incorporated into this Item.
None.
164
SIGNATURES
Pursuant to the requirements of Section 13 or 15(d) of the Securities Exchange Act of 1934, the Registrant has duly caused this report to be signed on its behalf by the undersigned, thereunto duly authorized.
|
USD P
ARTNERS
LP
(Registrant)
|
|||
|
By:
|
USD Partners GP LLC,
its General Partner
|
||
|
Date:
|
March 9, 2017
|
By:
|
/s/ Dan Borgen
|
|
Dan Borgen
Chief Executive Officer and President
|
|||
165
POWER OF ATTORNEY
KNOW ALL BY THESE PRESENTS, that each of the undersigned officers and directors of USD Partners GP LLC, a Delaware limited liability company and general partner of USD Partners LP, a Delaware limited partnership (the "Registrant"), does hereby constitute and appoint Dan Borgen, Adam Altsuler and Keith Benson, and each of them, as his true and lawful attorney or attorneys-in-fact, with full power of substitution and revocation, for each of the undersigned and in the name, place, and stead of each of the undersigned, to sign on behalf of each of the undersigned any and all amendments to the Annual Report on Form 10-K, and to file the same, with all exhibits thereto, and other documents in connection therewith including, without limitation, a Form 12b-25 with the Securities and Exchange Commission, granting to said attorney or attorneys-in-fact, and each of them, full power and authority to do so and perform each and every act and thing requisite and necessary to be done in and about the premises, as fully to all intents and purposes as the undersigned might or could do in person, hereby ratifying and confirming all that said attorney or attorneys-in-fact or any of them or their substitute or their substitutes may lawfully do or cause to be done by virtue thereof.
Pursuant to the requirements of the Securities Exchange Act of 1934, this report has been signed below by the following persons on behalf of the Registrant and in the capacities indicated.
|
Signature
|
Title
|
Date
|
||
|
/s/ Dan Borgen
|
Chairman of the Board, Chief Executive Officer and President
(Principal Executive Officer)
|
March 9, 2017
|
||
|
Dan Borgen
|
||||
|
/s/ Adam Altsuler
|
Vice President, Chief Financial Officer
(Principal Financial Officer)
|
March 9, 2017
|
||
|
Adam Altsuler
|
||||
|
/s/ Chris Robbins
|
Vice President, Chief Accounting Officer
(Principal Accounting Officer)
|
March 9, 2017
|
||
|
Chris Robbins
|
||||
|
/s/ Schuyler Coppedge
|
Director
|
March 9, 2017
|
||
|
Schuyler Coppedge
|
||||
|
/s/ Mike Curry
|
Director
|
March 9, 2017
|
||
|
Mike Curry
|
||||
|
/s/ Douglas Kimmelman
|
Director
|
March 9, 2017
|
||
|
Douglas Kimmelman
|
||||
|
/s/ Thomas Lane
|
Director
|
March 9, 2017
|
||
|
Thomas Lane
|
||||
|
/s/ Jane O’Hagan
|
Director
|
March 9, 2017
|
||
|
Jane O’Hagan
|
||||
|
/s/ Brad Sanders
|
Director
|
March 9, 2017
|
||
|
Brad Sanders
|
||||
|
/s/ Stacy Smith
|
Director
|
March 9, 2017
|
||
|
Stacy Smith
|
||||
|
/s/ Jeff Wood
|
Director
|
March 9, 2017
|
||
|
Jeff Wood
|
||||
166
Index of Exhibits
Each exhibit identified below is filed as a part of this Annual Report.
|
Exhibit Number
|
Description
|
|
|
2.1††
|
Membership Interest Purchase Agreement between Casper Crude to Rail Holdings, LLC and USDP CCR LLC dated October 12, 2015 (incorporated by reference herein to Exhibit 2.1 to the Current Report on Form 8-K (File No. 001-36674) filed on October 13, 2015).
|
|
|
3.1
|
Certificate of Limited Partnership of USD Partners LP (incorporated by reference herein to Exhibit 3.1 to the Registration Statement on Form S-1 (File No. 333-198500) filed on August 29, 2014, as amended).
|
|
|
3.2
|
Second Amended and Restated Agreement of Limited Partnership of USD Partners LP dated October 15, 2014, by and between USD Partners GP LLC and USD Group LLC (incorporated by reference herein to Exhibit 3.1 to the Current Report on Form 8-K (File No. 001-36674) filed on October 21, 2014).
|
|
|
10.1
|
Contribution Conveyance and Assumption Agreement dated as of October 15, 2014, by and among U.S. Development Group, LLC, USD Group LLC, USD Partners GP LLC, USD Partners LP and USD Logistics Operations LP (incorporated by reference herein to Exhibit 10.1 to the Current Report on Form 8-K (File No. 001-36674) filed on October 21, 2014).
|
|
|
10.2
|
Omnibus Agreement dated as of October 15, 2014, by and among U.S. Development Group, LLC, USD Group LLC, USD Partners GP LLC, USD Partners LP and USD Logistics Operations LP (incorporated by reference herein to Exhibit 10.2 to the Current Report on Form 8-K (File No. 001-36674) filed on October 21, 2014).
|
|
|
10.3
|
Credit Agreement, dated as of October 15, 2014, among USD Partners LP and USD Terminals Canada ULC, as borrowers, Citibank, N.A., as administrative agent, swing line lender and l/c issuer, U.S. Bank National Association, as an l/c issuer and the lenders from time to time party thereto (incorporated by reference herein to Exhibit 10.3 to the Current Report on Form 8-K (File No. 001-36674) filed on October 21, 2014).
|
|
|
10.4#
|
USD Partners LP 2014 Long-Term Incentive Plan (incorporated by reference herein to Exhibit 10.4 to the Current Report on Form 8-K (File No. 001-36674) filed on October 21, 2014).
|
|
|
10.5
|
Offer to Purchase and Agreement to Purchase and Sale, dated October 15, 2014 (incorporated by reference herein to Exhibit 10.5 to the Current Report on Form 8-K (File No. 001-36674) filed on October 21, 2014).
|
|
|
10.6
|
Development Rights and Cooperation Agreement between USD Terminals Canada ULC, as Current Operator, and USD Terminals Canada II ULC, as Developer, dated as of October 16, 2014 (incorporated by reference herein to Exhibit 10.6 to the Current Report on Form 8-K (File No. 001-36674) filed on October 21, 2014).
|
|
|
10.7#
|
Form of USD Partners LP Long-Term Incentive Plan Phantom Unit Agreement (U.S.) (incorporated by reference to Exhibit 10.1 to the Current Report on Form 8-K (File No. 001-36674) filed on February 20, 2015).
|
|
|
10.10†
|
Services Agreement Between USD Terminals Canada ULC and USD Marketing LLC, effective July 7, 2014 (incorporated by reference to Exhibit 10.6 to the Registration Statement on Form S-1 (File No. 333-1985) filed on August 29, 2014).
|
|
|
10.11
|
Facilities Connection Agreement Between USD Terminals Canada Inc. and Gibson Energy Partnership, dated June 4, 2013 (incorporated by reference to Exhibit 10.5 to the Registration Statement on Form S-1 (File No. 333-1985) filed on September 22, 2014).
|
|
|
10.12#
|
Form of Phantom Unit Award Agreement (incorporated by reference herein to Exhibit 10.1 to the Current Report on Form 8-K (File No. 001-36674) filed on February 20, 2015).
|
|
|
10.13
|
First Amendment to the Credit Agreement dated November 13, 2015, among USD Partners LP and USD Terminals Canada ULC, as borrowers, Citibank, N.A., as administrative agent, swing line lender and l.c. issuer, U.S. Bank National Association, as an l.c. issuer and the lenders from time to time party thereto (incorporated by reference herein to Exhibit 10.1 of the Quarterly Report on Form 10-Q (File No. 001-36674) filed on November 13, 2015).
|
|
|
10.14
|
Registration Rights Agreement between USD Partners LP and Cogent Energy Solutions, LLC dated November 17, 2015 (incorporated by reference herein to Exhibit 10.1 to the Current Report on Form 8-K (File No. 001-36674) filed on November 17, 2015).
|
|
|
10.15
|
Agreement among Cogent Energy Solutions, LLC, Randy Balhorn, Steve Magness, USD Group, LLC and USDP CCR LLC dated November 17, 2015 (incorporated by reference herein to Exhibit 10.2 to the Current Report on Form 8-K (File No. 001-36674) filed on November 17, 2015).
|
|
|
10.16
|
Transition Services Agreement between Cogent Energy Solutions, LLC and Casper Crude to Rail, LLC dated November 17, 2015(incorporated by reference herein to Exhibit 10.3 to the Current Report on Form 8-K (File No. 001-36674) filed on November 17, 2015).
|
|
|
21.1*
|
Subsidiaries of the Registrant.
|
|
|
23.1*
|
Consent of BDO USA, LLP.
|
|
|
24.1*
|
Powers of Attorney (included on the signature page to this Annual Report).
|
|
167
|
Exhibit Number
|
Description
|
|
|
31.1*
|
Certification of Chief Executive Officer Pursuant to Section 302 of the Sarbanes-Oxley Act of 2002.
|
|
|
31.2*
|
Certification of Chief Financial Officer Pursuant to Section 302 of the Sarbanes-Oxley Act of 2002.
|
|
|
32.1*
|
Certification of Chief Executive Officer Pursuant to Section 906 of the Sarbanes-Oxley Act of 2002.
|
|
|
32.2*
|
Certification of Chief Financial Officer Pursuant to Section 906 of the Sarbanes-Oxley Act of 2002.
|
|
|
101.INS*
|
XBRL Instance Document.
|
|
|
101.SCH*
|
XBRL Taxonomy Extension Schema Document.
|
|
|
101.CAL*
|
XBRL Taxonomy Extension Calculation Linkbase Document.
|
|
|
101.DEF*
|
XBRL Taxonomy Extension Definition Linkbase Document.
|
|
|
101.LAB*
|
XBRL Taxonomy Extension Label Linkbase Document.
|
|
|
101.PRE*
|
XBRL Taxonomy Extension Presentation Linkbase Document.
|
|
|
*
|
Filed or furnished herewith.
|
|
#
|
Management contract or compensatory plan arrangement required to be filed as an exhibit to this Annual Report pursuant to Item 15(b) of Form 10-K.
|
|
†
|
Certain portions have been omitted pursuant to a confidential treatment request. Omitted information has been separately filed with the Securities and Exchange Commission.
|
|
††
|
The registrant has omitted the schedules to this exhibit pursuant to the provisions of Regulation S-K, Item 601(b)(2). The registrant shall supplementary furnish a copy of the omitted schedules to the Securities and Exchange Commission upon request.
|
Copies of Exhibits may be obtained upon written request of any Unitholder to Investor Relations, USD Partners LP, 811 Main Street, Suite 2800, Houston, Texas 77002.
168
TABLE OF CONTENTS
Part IItem 1. BusinessItem 1A. Risk FactorsItem 2. PropertiesItem 3. Legal ProceedingsItem 4. Mine Safety DisclosuresPart IIItem 5. Market For Registrant S Common Equity, Related Unitholder Matters and Issuer Purchase Of Equity SecuritiesItem 6. Selected Financial DataItem 7. Management S Discussion and Analysis Of Financial Condition and Results Of OperationsItem 8. Financial Statements and Supplementary DataPart Ii, Item 8. Financial Statements and Supplementary Data Of This Annual Report on Form 10-kItem 7A. Quantitative and Qualitative Disclosures About Market RiskItem 9. Changes in and Disagreements with Accountants on Accounting and Financial DisclosureItem 9A. Controls and ProceduresItem 9B. Other InformationPart IIIItem 10. Directors, Executive Officers and Corporate GovernanceItem 11. Executive CompensationItem 12. Security Ownership Of Certain Beneficial Owners and Management and Related Stockholder MattersItem 13. Certain Relationships and Related Transactions, and Director IndependenceItem 1. Business-business Segments -hardisty TerminalItem 14. Principal Accountant Fees and ServicesPart IVItem 15. Exhibits and Financial Statement SchedulesItem 16. Form 10-k Summary