US FOODS HOLDING CORP.
UNITED STATES
SECURITIES AND EXCHANGE COMMISSION
Washington, D.C. 20549
FORM 10-K
(Mark One)
|
☒
|
ANNUAL REPORT PURSUANT TO SECTION 13 OR 15(d) OF THE SECURITIES EXCHANGE ACT OF 1934
|
For the fiscal year ended
December 29, 2018
OR
|
☐
|
TRANSITION REPORT PURSUANT TO SECTION 13 OR 15(d) OF THE SECURITIES EXCHANGE ACT OF 1934
|
Commission File No. 001-37786

US FOODS HOLDING CORP.
(Exact name of registrant as specified in its charter)
|
Delaware
|
24-0347906
|
|
(State or other jurisdiction of
incorporation or organization)
|
(I.R.S. Employer
Identification Number)
|
9399 W. Higgins Road, Suite 100
Rosemont, IL 60018
(847) 720-8000
(Address, including Zip Code, and telephone number, including area code, of registrant’s principal executive offices)
Securities registered pursuant to Section 12(b) of the Act:
|
Title of Each Class
|
Name of Each Exchange on Which
Registered
|
|
|
Common Stock, par value $0.01 per share
|
New York Stock Exchange
|
|
Securities registered pursuant to Section 12(g) of the Act: None
Indicate by check mark if the registrant is a well-known seasoned issuer, as defined in Rule 405 of the Securities Act. Yes ☒ No ☐
Indicate by check mark if the registrant is not required to file reports pursuant to Section 13 or Section 15(d) of the Act. Yes ☐ No ☒
Indicate by check mark whether the registrant (1) has filed all reports required to be filed by Section 13 or 15(d) of the Securities Exchange Act of 1934 during the preceding 12 months (or for such shorter period that the registrant was required to file such reports), and (2) has been subject to such filing requirements for the past 90 days. Yes ☒ No ☐
Indicate by check mark whether the registrant has submitted electronically every Interactive Data File required to be submitted pursuant to Rule 405 of Regulation S-T during the preceding 12 months (or for such shorter period that the registrant was required to submit such files). Yes ☒ No ☐
Indicate by check mark if disclosure of delinquent filers pursuant to Item 405 of Regulation S-K is not contained herein, and will not be contained, to the best of registrant’s knowledge, in definitive proxy or information statements incorporated by reference in Part III of this Form 10-K or any amendment to this Form 10-K
.
☐
Indicate by check mark whether the registrant is a large accelerated filer, an accelerated filer, a non-accelerated filer, a smaller reporting company, or an emerging growth company. See the definitions of “large accelerated filer,” “accelerated filer,” “smaller reporting company,” and “emerging growth company” in Rule 12b-2 of the Exchange Act.
|
Large accelerated filer
|
☒
|
Accelerated filer
|
☐
|
|
Non-accelerated filer
|
☐
|
Smaller reporting company
|
☐
|
|
Emerging growth company
|
☐
|
||
If an emerging growth company, indicate by check mark if the Registrant has elected not to use the extended transition period for complying with any new or revised financial accounting standards provided pursuant to Section 13(a) of the Exchange Act. ☐
Indicate by check mark whether the registrant is a shell company (as defined in Rule 12b-2 of the Exchange Act). Yes ☐ No ☒
At June 29, 2018, the last business day of the registrant’s most recently completed second fiscal quarter, the aggregate market value of the registrant's common stock held by non-affiliates was
$8.2 billion
(based on the reported closing sale price of the registrant’s common stock on such date on the New York Stock Exchange).
217,611,476
of the registrant’s common stock were outstanding as of
February 8, 2019
.
DOCUMENTS INCORPORATED BY REFERENCE
Portions of the registrant’s definitive proxy statement to be filed with the Securities and Exchange Commission pursuant to Regulation 14A under the Securities Exchange Act of 1934, relating to the registrant’s Annual Meeting of Stockholders to be held on
May 1, 2019
, are incorporated herein by reference for purposes of Items 10, 11, 12, 13 and 14 of Part III of this Annual Report on Form 10-K. The definitive proxy statement will be filed with the Securities and Exchange Commission not later than 120 days after the registrant’s fiscal year ended
December 29, 2018
.

US Foods Holding Corp.
Annual Report on Form 10-K
TABLE OF CONTENTS
|
Page No.
|
|||
|
PART I.
|
|||
|
Item 1.
|
|||
|
Item 1A.
|
|||
|
Item 1B.
|
|||
|
Item 2.
|
|||
|
Item 3.
|
|||
|
Item 4.
|
|||
|
PART II
|
|||
|
Item 5.
|
|||
|
Item 6.
|
|||
|
Item 7.
|
|||
|
Item 7A.
|
|||
|
Item 8.
|
|||
|
Item 9.
|
|||
|
Item 9A.
|
|||
|
Item 9B.
|
|||
|
PART III
|
|||
|
Item 10.
|
|||
|
Item 11.
|
|||
|
Item 12.
|
|||
|
Item 13.
|
|||
|
Item 14.
|
|||
|
PART IV
|
|||
|
Item 15.
|
|||
|
Item 16.
|
|||
Basis of Presentation
We operate on a 52 or 53 week fiscal year, with all periods ending on a Saturday. When a 53-week fiscal year occurs, we report the additional week in the fiscal fourth quarter. The fiscal years ended
December 29, 2018
,
December 30, 2017
,
December 31, 2016
,
January 2, 2016
and
December 27, 2014
are also referred to herein as fiscal years
2018
,
2017
,
2016
,
2015
and
2014
, respectively. Our fiscal years
2018
,
2017
,
2016
and
2014
were 52-week fiscal years. Our fiscal year
2015
was a 53-week fiscal year.
Forward-Looking Statements
This Annual Report on Form 10-K (“Annual Report”) contains “forward-looking statements” within the meaning of the federal securities laws. Forward-looking statements include information concerning our liquidity and our possible or assumed future results of operations, including descriptions of our business strategies. These statements often include words such as “believe,” “expect,” “project,” “anticipate,” “intend,” “plan,” “estimate,” “target,” “seek,” “will,” “may,” “would,” “should,” “could,” “forecasts,” “mission,” “strive,” “more,” “goal,” or similar expressions. The statements are based on assumptions that we have made based on our experience in the industry as well as our perceptions of historical trends, current conditions, expected future developments, and other factors we think are appropriate. We believe these judgments are reasonable. However, you should understand that these statements are not guarantees of performance or results. Our actual results could differ materially from those expressed in the forward-looking statements.
There are a number of risks, uncertainties, and other important factors, many of which are beyond our control, that could cause our actual results to differ materially from the forward-looking statements contained in this Annual Report. These risks, uncertainties, and other important factors include, among others, the risks, uncertainties, and factors set forth in Item 1A of Part I, “Risk Factors,” and Item 7 of Part II, “Management’s Discussion and Analysis of Financial Condition and Results of Operations,” of this Annual Report.
In light of these risks, uncertainties and other important factors, the forward-looking statements in this Annual Report might not prove to be accurate, and you should not place undue reliance on them. All forward-looking statements attributable to us, or others acting on our behalf, are expressly qualified in their entirety by the cautionary statements above. All of these statements speak only as of the date made, and we undertake no obligation to publicly update or revise any forward-looking statements, whether because of new information, future events or otherwise, except as required by law.
Comparisons of results between current and prior periods are not intended to express any future trends, or indications of future performance, unless expressed as such, and should be viewed only as historical data.
1
PART I
|
Item 1.
|
Business
|
US Foods Holding Corp., a Delaware corporation, and its consolidated subsidiaries are referred to in this Annual Report as “we,” “our,” “us,” “the Company,” or “US Foods.” US Foods Holding Corp. conducts all of its operations through its wholly owned subsidiary US Foods, Inc. (“USF”) and its subsidiaries.
Our Company
We are among America’s great food companies and leading foodservice distributors. Built through organic growth and acquisitions, we trace our roots back over 150 years to a number of heritage companies with rich legacies in food innovation and customer service. These include Monarch Foods (established in 1853), Sexton (1883), PYA (1903), Rykoff (1911) and Kraft Foodservice (1976). US Foodservice was organized as a corporation in Delaware in 1989. In November 2011, we rebranded from “US Foodservice” to “US Foods.”
Our mission is to be
First In Food.
We strive to inspire and empower chefs and foodservice operators to bring great food experiences to consumers. This mission is supported by our strategy of
Great Food. Made Easy.
, which centers on providing our customers a broad and innovative offering of high-quality products, as well as a comprehensive suite of industry-leading e-commerce, technology, and business solutions. We operate as one business with standardized business processes, shared systems infrastructure, and an organizational model that optimizes national scale with local execution, allowing us to manage the business as a single operating segment. We have centralized activities where scale matters and our local field structure focuses on customer facing activities. As we say on our trucks, we are
Keeping Kitchens Cooking
across America.
We supply approximately
250,000
customer locations nationwide. These customer locations include independently owned single and multi-unit restaurants, regional restaurant concepts, national restaurant chains, hospitals, nursing homes, hotels and motels, country clubs, government and military organizations, colleges and universities, and retail locations. We provide approximately
400,000
fresh, frozen, and dry food stock-keeping units, or SKUs, as well as non-food items, sourced from approximately
5,000
suppliers. Approximately
4,000
sales associates manage customer relationships at local, regional, and national levels. They are supported by sophisticated marketing and category management capabilities, as well as a sales support team that includes world-class chefs and restaurant operations consultants, new business development managers and others that help us provide more comprehensive service to our customers. Our extensive network of
63
distribution facilities and fleet of approximately
6,000
trucks allow us to operate efficiently and provide high levels of customer service. This operating model allows us to leverage our nationwide scale and footprint while executing locally.
Our Business Strategy
While we serve many customer types, our strategy is primarily focused on independent restaurants, small and regional chains, and healthcare and hospitality customers. Among other factors, their expected growth, mix of product and category purchases, and adoption of value-added solutions make them attractive to us.
We offer innovative products and services that help chefs and operators succeed. Our e-commerce tools and mobile solutions make it easier for customers to do business with us. We execute on these elements of our strategy while delivering on the fundamental requirements that are important to all of our customers.
Growth from acquisitions remains an important part of our strategy. We believe there remain attractive acquisition opportunities for us that will allow us to grow with our target customer types and generate an attractive return on investment, including from the synergies we may capture from integration. As an example, in July 2018, we announced that we entered into a Stock Purchase Agreement with Services Group of America, Inc. (“SGA”) under which we agreed to acquire SGA’s Food Group of Companies, including Food Services of America, Inc., Systems Services of America, Inc., Amerifresh, Inc., Ameristar Meats, Inc. and Gampac Express, Inc. (collectively, the “SGA Food Group Companies”), for $1.8 billion in cash. The closing of the acquisition remains subject to customary conditions, including the receipt of required regulatory approvals.
2
Our Industry
The U.S. foodservice distribution industry has a large number of companies competing in the space, including local, regional, and national distributors. Foodservice distributors typically fall into three categories, representing differences in customer focus, product offering, and supply chain:
|
•
|
Broadline distributors which offer a “broad line” of products and services;
|
|
•
|
System distributors which carry products specified for large chains; and
|
|
•
|
Specialized distributors which primarily focus on specific product categories (e.g., meat or produce) or customer types.
|
A number of adjacent competitors also serve the U.S. foodservice distribution industry, including cash-and-carry retailers, commercial wholesale outlets and warehouse clubs, commercial website outlets, and grocery stores.
There is a high degree of customer overlap, particularly across the broadline, specialized and cash-and-carry categories, as many customers purchase from multiple distributors. Most buying decisions are based on the type of product offered, quality and price, and a distributor’s ability to completely and accurately fill orders and provide timely deliveries. Since switching costs are low, customers can make supplier and distribution channel changes quickly. Existing foodservice competitors can extend their shipping distances and add truck routes and warehouses relatively quickly to serve new markets or customers.
We believe, based upon industry trade data, that we are the second largest foodservice distributor in the U.S. by annual sales, with over $24 billion in net sales during fiscal 2018. Given our mix of products and services, we are considered a broadline distributor.
The U.S. foodservice distribution industry is comprised of different customer types of varying sizes, growth profiles, and product and service requirements.
|
•
|
Independent restaurants/small chains and regional chains.
Independent restaurants and small and regional chains typically differentiate themselves in the market based on the dining experience they provide to consumers and the quality and diversity of their menu. Many value business solutions that help them attract diners, improve the effectiveness of their menu offering, and drive efficiency in their operations.
|
|
•
|
Healthcare customers
. Healthcare customers generally fall into either acute care (e.g. hospital systems) or senior living (e.g. nursing homes and long-term care facilities). Healthcare customers have complex foodservice needs given their scale, need for menu diversity, and logistics considerations. Food is also not as central to their overall business as it is for a restaurant, but it is a key contributor to patient satisfaction. As a result, some healthcare providers utilize third party contract management companies to operate their foodservice facilities. Many use group purchasing organizations, or GPOs, as intermediaries in order to gain procurement scale. In our experience, healthcare customers purchasing directly, through GPOs, or through contract foodservice operators value strong relationships with their foodservice distributors, particularly those that bring national scale, a broad product offering, and strong transactional and logistics capabilities.
|
|
•
|
Hospitality customers.
Hospitality customers are a diverse group, ranging from large hotel chains and conference centers to local banquet halls, country clubs, casinos, and entertainment and sports complexes. Food is a key contributor to guest satisfaction for these customers, and they value solutions related to menu planning and efficiency improvements in their kitchens and restaurants. With complex foodservice needs, hospitality customers value streamlined purchasing processes and expect high service levels in fulfilling their orders.
|
|
•
|
National restaurant chains.
National chains tend to in-source most activities except distribution, where they often rely on system distributors primarily for freight and logistics.
|
In fiscal year
2018
, no single customer represented more than
3%
of our total customer sales. Sales to our top 50 customers/GPOs represented approximately
44%
of our net sales in fiscal year
2018
. We have relationships with GPOs that act as agents for their members in negotiating pricing, delivery and other terms. Some customers who are members of GPOs purchase their products directly from us under the terms negotiated by their GPOs. In fiscal year
2018
, GPO members accounted for about
26%
of our total customer purchases. GPO members are primarily
3
comprised of customers in the healthcare, hospitality, education, and government/military industries, as well as restaurant chains.
We believe that a broad array of value-added solutions offered by foodservice distributors makes customers more effective and efficient and can help foodservice distributors profitably grow their businesses. These services require distributors to invest in their capabilities, resulting in a higher cost-to-serve. When customers benefit from product and service solutions, they purchase a more attractive and profitable mix of items and tend to have stronger commercial relationships and loyalty.
We believe that the customer types that we target, which include independent restaurants, small and regional chains, and healthcare and hospitality customers, have greater growth prospects and/or benefit from the types of value-added solutions we offer to a greater extent than other customer types.
There are several important dynamics affecting the industry, including:
|
•
|
Evolving consumer tastes and preferences.
Consumers demand healthy and authentic food alternatives with fewer artificial ingredients, and they value locally harvested and sustainably manufactured products. In addition, many ethnic food offerings are becoming more mainstream as consumers show a greater willingness to try new flavors and cuisines. Changes in consumer preferences create opportunities for new and innovative products and for unique food-away-from-home destinations. This, in turn, is expected to create growth, expand margins, and produce better customer retention opportunities for those distributors with the flexibility to balance national scale and local preferences. We believe foodservice distributors will likely need broader product assortments, extended supplier networks, effective supply chain management capabilities, and strong food safety programs to meet these needs.
|
|
•
|
Generational shifts with millennials and baby boomers.
Given their purchasing power, millennials and baby boomers will continue to significantly influence food consumption and the food-away-from-home market. According to a U.S. Census Bureau survey, there were 83 million individuals born between 1982 and 2000 in the United States. That makes these millennials the largest demographic cohort. We believe they are key to driving growth in the broader U.S. food industry as their disposable income increases. Baby boomers continue to shape the industry as they remain in the workplace longer, which is expected to prolong their contribution to food-away-from-home expenditures.
|
|
•
|
Growing importance of e-commerce.
We see significant future growth in e-commerce and in the adoption of mobile technology solutions by foodservice operators. E-commerce solutions increase customer retention. They also deepen the relationship between foodservice distributors and customers, creating new insights and services that can make both more efficient. We think deeper, technology-enabled relationships with customers will accelerate the adoption of new products and increase customer loyalty. As a result, distributors that have invested in creating these capabilities have a competitive edge. We believe this trend will accelerate, as millennials and Generation Z become key influencers and decision-makers within the industry, particularly at the customer level. We believe foodservice distributors will need to strengthen technology, data analytics, and related capabilities to address these changes.
|
We believe that we have the scale, foresight and agility required to proactively address these trends and, in turn, benefit from higher growth, greater customer retention and improved profitability.
Products, Brands, and Other Intellectual Property
We have a broad assortment of product categories and brands to meet customers’ needs. In many categories, we offer products under a spectrum of private brands based on price and quality.
4
The table below presents the sales mix for our principal product categories for the
2018
,
2017
and
2016
fiscal years.
|
Fiscal Years
|
|||||||||||
|
2018
|
2017
|
2016
|
|||||||||
|
(in millions)
|
|||||||||||
|
Meats and seafood
|
$
|
8,635
|
|
$
|
8,692
|
|
$
|
8,121
|
|
||
|
Dry grocery products
|
4,239
|
|
4,266
|
|
4,127
|
|
|||||
|
Refrigerated and frozen grocery products
|
3,898
|
|
3,799
|
|
3,653
|
|
|||||
|
Dairy
|
2,520
|
|
2,533
|
|
2,380
|
|
|||||
|
Equipment, disposables and supplies
|
2,298
|
|
2,243
|
|
2,166
|
|
|||||
|
Beverage products
|
1,315
|
|
1,306
|
|
1,268
|
|
|||||
|
Produce
|
1,270
|
|
1,308
|
|
1,204
|
|
|||||
|
$
|
24,175
|
|
$
|
24,147
|
|
$
|
22,919
|
|
|||
We have registered the trademarks US Foods
®
, Food Fanatics
®
and Chef’Store
®
in connection with our overall US Foods brand strategy and our retail outlets. We have also registered or applied for trademark protection in the U.S. for the following brands in our brand portfolio:
|
Our Best-Quality Brands – Distinction and Superior Taste
|
|
|
• Chef’s Line
®
|
• Rykoff Sexton
®
|
|
• Metro Deli
®
|
• Stock Yards
®
|
|
Brands You Can Trust for Quality, Performance and Value
|
|||
|
• Cattleman’s Selection
®
|
• Harbor Banks
®
|
• Monogram
®
|
• Rituals
®
|
|
• Cross Valley Farms
®
|
• Hilltop Hearth
®
|
• Monogram
®
Clean Force
®
|
• Roseli
®
|
|
• Devonshire
®
|
• Molly’s Kitchen
®
|
• Optimax
®
|
• Superior
®
|
|
• del Pasado™
|
• Monarch
®
|
• Pacific Jade
®
|
• Thirster
®
|
|
• Glenview Farms
®
|
• Harvest Value
®
|
• Patuxent Farms
®
|
• Valu+Plus
®
|
Other than these trademarks, we do not believe that intellectual property is material to our business.
Suppliers
We purchase from approximately
5,000
individual suppliers, none of which accounted for more than 5% of our aggregate purchases in fiscal year
2018
. Our suppliers generally are large corporations selling national brand name and private brand products. Additionally, regional and local suppliers support targeted geographic initiatives and private label programs requiring regional and local distribution. We generally negotiate supplier agreements on a centralized basis.
Seasonality
Our business does not fluctuate significantly from quarter to quarter, and as a result, is not considered seasonal.
5
Working Capital
Our operations and strategic objectives require continuing capital investment, and our resources include cash provided by operations, as well as access to capital from bank borrowings and other types of debt and financing arrangements. See discussion in “Item 7. Management’s Discussion and Analysis of Financial Condition and Results of Operations” regarding our liquidity and capital resources.
Government Regulation
As a marketer and distributor of food products in the U.S., US Foods must comply with various laws and regulations from certain U.S. federal, state and local regulatory agencies. A summary of some of these laws and regulations is provided below.
Food Handling and Processing
We are subject to various U.S. federal, state and local laws and regulations relating to the manufacturing, handling, storage, transportation, sale and labeling of food products, including the applicable provisions of the Federal Food, Drug and Cosmetic Act, Bioterrorism Act, Food Safety Modernization Act (“FSMA”), Federal Meat Inspection Act, Poultry Products Inspection Act, Perishable Agricultural Commodities Act, Country of Origin Labeling Act, and regulations issued by the U.S. Food and Drug Administration (“FDA”) and the U.S. Department of Agriculture (“USDA”).
Our distribution facilities must be registered with the FDA biennially and are subject to periodic government agency inspections by federal and/or state authorities. We have a small number of processing facilities for some meat, poultry, seafood and produce products. These units are registered and inspected by the USDA (with respect to meat and poultry) and the FDA (with respect to produce and seafood).
We also distribute a variety of non-food products, such as food containers, kitchen equipment and cleaning materials, and are subject to various U.S. federal, state and local laws and regulations relating to the storage, transportation, distribution, sale and labeling of those non-food products, including requirements to provide information about the hazards of certain chemicals present in some of the products we distribute.
Our customers include several departments of the U.S. federal government, as well as certain state and local governmental entities. These customer relationships subject us to additional regulations applicable to government contractors.
Employment
The U.S. Department of Labor and its agencies, the Employee Benefits Security Administration, the Occupational Safety and Health Administration, and the Office of Federal Contract Compliance Programs, regulate our employment practices and standards for workers. We are also subject to laws that prohibit discrimination in employment based on non-merit categories, including Title VII of the Civil Rights Act and the Americans with Disabilities Act, and other laws relating to accessibility and the removal of barriers. Our workers’ compensation self-insurance is subject to regulation by the jurisdictions in which we operate.
Our facilities are subject to inspections under the Occupational Safety and Health Act with respect to our compliance with certain manufacturing, health and safety standards to protect our employees from accidents. We are also subject to the National Labor Relations Act, which governs the process for collective bargaining between employers and employees and protects the rights of both employers and employees in the workplace.
Trade
For the purchase of products produced, harvested or manufactured outside of the U.S., and for the shipment of products to customers located outside of the U.S., we are subject to applicable customs laws regarding the import and export of various products. Certain activities, including working with customs brokers and freight forwarders, are subject to applicable regulation by U.S. Customs and Border Protection, which is part of the Department of Homeland Security.
6
Ground Transportation
The U.S. Department of Transportation and its agencies, the Surface Transportation Board, the Federal Highway Administration, the Federal Motor Carrier Safety Administration, and the National Highway Traffic Safety Administration, regulate our trucking operations through the regulation of operations, safety, insurance and hazardous materials. We must comply with the safety and fitness regulations promulgated by the Federal Motor Carrier Safety Administration, including those relating to drug and alcohol testing and hours of service. Matters such as weight and dimension of equipment also fall under U.S. federal and state regulations.
Environmental
Our operations are also subject to a broad range of U.S. federal, state, and local environmental laws and regulations, as well as zoning and building regulations. Environmental laws and regulations cover a variety of procedures, including appropriately managing wastewater and stormwater; complying with clean air laws, including those governing vehicle emissions; properly handling and disposing of solid and hazardous wastes; protecting against and appropriately investigating and remediating spills and releases; and monitoring and maintaining underground and aboveground storage tanks for diesel fuel and other petroleum products.
Anticorruption
Because we are organized under the laws of a state in the U.S. and our principal place of business is in the U.S., we are considered a “domestic concern” under the Foreign Corrupt Practices Act (“FCPA”) and are covered by the anti-bribery provisions of the FCPA. The anti-bribery provisions of the FCPA prohibit any domestic concern and any officer, director, employee, or agent acting on behalf of the domestic concern from paying or authorizing payment of anything of value to: (i) influence any act or decision by a foreign official; (ii) induce a foreign official to do or omit to do any act in violation of his/her lawful duty; (iii) secure any improper advantage; or (iv) induce a foreign official to use his/her influence to assist the payor in obtaining or retaining business or directing business to another person.
Employees
As of
December 29, 2018
, we had approximately
25,000
employees, of which approximately
24,800
were full-time employees. Approximately
4,400
employees were members of local unions associated with the International Brotherhood of Teamsters and other labor organizations. Approximately one-third of our distribution facilities have employees represented by unions with collective bargaining agreements (“CBAs”).
During fiscal year
2018
,
11
CBAs covering approximately
900
employees were renegotiated. During fiscal
2019
,
15
CBAs covering approximately
1,400
employees will be subject to renegotiation. While we have experienced work stoppages in the past, we generally believe we have good relations with both union and non-union employees, and we believe we are a well-regarded employer in the communities in which we operate.
7
Executive Officers
|
Name
|
Age
|
Position
|
||
|
Pietro Satriano
|
56
|
Chairman and Chief Executive Officer
|
||
|
Dirk J. Locascio
|
46
|
Chief Financial Officer
|
||
|
Kristin M. Coleman
|
50
|
Executive Vice President, General Counsel and Chief Compliance Officer
|
||
|
Steven Guberman
|
54
|
Executive Vice President, Nationally Managed Business
|
||
|
Andrew Iacobucci
|
52
|
Chief Merchandising Officer and Interim Chief Supply Chain Officer
|
||
|
Jay A. Kvasnicka
|
51
|
Executive Vice President, Locally Managed Business and Field Operations
|
||
|
David Rickard
|
48
|
Executive Vice President, Strategy and Revenue Management
|
||
|
Keith D. Rohland
|
51
|
Chief Information Officer
|
||
|
David Works
|
51
|
Chief Human Resources Officer
|
||
Mr. Satriano
has served as Chief Executive Officer and a director of US Foods since July 2015. In December 2017, Mr. Satriano was elected Chairman of the Board of Directors. From February 2011 until July 2015, Mr. Satriano served as our Chief Merchandising Officer. Prior to joining US Foods, Mr. Satriano was President of LoyaltyOne Co., a Canadian provider of loyalty marketing and programs, from 2009 to 2011. From 2002 to 2008, he served in a number of leadership positions at Loblaw Companies Limited, a Canadian food retailer, including Executive Vice President, Loblaw Brands, and Executive Vice President, Food Segment. Mr. Satriano began his career in strategy consulting, first in Toronto, Canada with The Boston Consulting Group and then in Milan, Italy with the Monitor Company. Mr. Satriano currently serves on the board of directors of CarMax, Inc.
Mr. Locascio
has served as Chief Financial Officer since February 2017. Mr. Locascio served the Company as Senior Vice President, Financial Accounting and Analysis from November 2016 to February 2017, Senior Vice President, Operations Finance and Financial Planning from May 2015 to November 2016, and Senior Vice President, Financial Planning and Analysis from May 2013 to May 2015. Mr. Locascio joined US Foods in June 2009 as Senior Vice President, Corporate Controller. Prior to joining US Foods, Mr. Locascio held senior finance roles with United Airlines, a global airline, and Arthur Andersen LLP, a public accounting firm.
Ms. Coleman
has served as Executive Vice President, General Counsel and Chief Compliance Officer since February 2017. Ms. Coleman joined US Foods from Sears Holdings Corporation, a retailer, where she served as Senior Vice President, General Counsel and Corporate Secretary after joining in July 2014. Prior to joining Sears, she served as the Vice President, General Counsel and Corporate Secretary of Brunswick Corporation, a manufacturing company, from May 2009 to July 2014.
Mr. Guberman
has served as Executive Vice President, Nationally Managed Business since August 2016 and served as Chief Merchandising Officer from July 2015 to January 2017. Mr. Guberman served the Company as Senior Vice President, Merchandising and Marketing Operations from January 2012 to July 2015 and as Division President from August 2004 through December 2012. Mr. Guberman joined US Foods as part of its acquisition of Alliant Foodservice in 2001.
Mr. Iacobucci
has served as Chief Merchandising Officer since January 2017 and Interim Chief Supply Chain Officer since January 2019. Prior to joining US Foods, Mr. Iacobucci served as Executive Vice President, Merchandising for Ahold USA, Inc., a food retailer, from April 2016 to January 2017. Prior to joining Ahold, he served from February 2012 to November 2015 in several senior roles at Loblaw Companies Limited, a Canadian food retailer, including President, Discount Division.
Mr. Kvasnicka
has served as Executive Vice President, Locally Managed Business and Field Operations since August 2015 and Executive Vice President, Field Operations since September 2016. Mr. Kvasnicka served the Company as Region President from April 2013 to July 2015, and Division President from October 2011 to March 2013. Mr. Kvasnicka served as Vice President of Sales for the Stock Yards division, President of the Stock Yards division and in various other roles between 2005 and 2011. He was Vice President of Sales for the Minneapolis Division from 2003 to 2005. Mr. Kvasnicka joined US Foods as a part of its acquisition of Alliant Foodservice in 2001.
8
Mr. Rickard
has served as Executive Vice President, Strategy and Revenue Management since November 2015. Prior to joining US Foods, Mr. Rickard served from March 2014 to November 2015 as Vice President at Uline Corporation, a distributor of shipping, industrial, and packing materials, and was responsible for identifying, leading and implementing improvement initiatives across all aspects of the organization. From September 1997 to March 2014, Mr. Rickard was a Partner and Managing Director at the Boston Consulting Group, a consulting firm.
Mr. Rohland
has served as Chief Information Officer since April 2011. Prior to joining US Foods, Mr. Rohland served in several leadership positions at Citigroup, Inc., an investment bank and financial services provider, from March 2007 until April 2011, including Managing Director of Risk and Program Management. Prior to joining Citigroup, Mr. Rohland was Chief Information Officer for Volvo Car Corporation of Sweden, an automaker, from November 2005 to March 2007 and held a number of leadership positions at Ford Motor Company, also an automaker, from November 2003 to November 2005.
Mr. Works
has served as Chief Human Resources Officer since February 2018. Mr. Works joined US Foods from Hackensack Meridian Health, an integrated health care network, where he served as Chief Human Resources Officer after joining in July 2017. Prior to joining Hackensack, he served as President - Enterprise of Windstream Holdings, Inc., a voice and data communications provider, from December 2014 to August 2016, Executive Vice President and Chief Human Resources Officer of Windstream from February 2012 to December 2014, and Senior Vice President and President, Talent and Human Capital Services of Sears Holdings Corporation, a retailer, from September 2009 to January 2012.
Our Website and Availability of Information
Our corporate website is located at
www.usfoods.com
. We file annual, quarterly and special reports and other information with the Securities and Exchange Commission (“SEC”). Our filings with the SEC are available to the public on the SEC’s website at www.sec.gov. Those filings are also available to the public on, or accessible through, our corporate website for free via the “Investors” section at https://ir.usfoods.com/investors. The information contained on or accessible through our corporate website or any other website that we may maintain is not incorporated by reference into and is not part of this Annual Report.
9
|
Item 1A.
|
Risk Factors
|
We are subject to many risks and uncertainties. Some of these risks and uncertainties may cause our business, financial position, results of operations and cash flows to vary, and they may materially or adversely affect our financial performance. The risks and uncertainties described below in this Annual Report are not the only ones we face. Other risks and uncertainties, which are not currently known to us or which we currently believe are immaterial, may adversely affect our business, financial position, results of operations and cash flows.
Risks Relating to Our Business and Industry
Our business is a low-margin business, and our profitability is directly affected by cost deflation or inflation, commodity volatility and other factors.
The U.S. foodservice distribution industry is characterized by relatively high inventory turnover with relatively low profit margins. Volatile commodity costs have a direct impact on our industry. We make a significant portion of our sales at prices that are based on the cost of products we sell, plus a margin percentage or markup. As a result, our profit levels may be negatively affected during periods of product cost deflation, even though our gross profit percentage may remain relatively constant. Prolonged periods of product cost inflation also may reduce our profit margins and earnings, if product cost increases cannot be passed on to customers because they resist paying higher prices. In addition, periods of rapid inflation may have a negative effect on our business. There may be a lag between the time of the price increase and the time at which we are able to pass it along to customers, as well as the impact it may have on discretionary spending by consumers.
Competition in our industry is intense, and we may not be able to compete successfully.
The U.S. foodservice distribution industry is highly competitive. Foodservice distributors with a national footprint have great financial and other resources. Furthermore, there are a large number of local and regional distributors. These companies often align themselves with other smaller distributors through purchasing cooperatives and marketing groups. The goal is to enhance their geographic reach, private label offerings, overall purchasing power, cost efficiencies, and ability to meet customer distribution requirements. These distributors also rely on local presence as a source of competitive advantage, and they may have lower costs and other competitive advantages due to geographic proximity. Additionally, adjacent competition, such as cash-and-carry operations, commercial wholesale outlets, club stores and grocery stores, continue to serve the commercial foodservice market. We also experience competition from online direct food wholesalers. We generally do not have exclusive service agreements with our customers, and they may switch to other suppliers that offer lower prices or differentiated products or customer service. The cost of switching suppliers is very low, as are the barriers to entry into the U.S. foodservice distribution industry. We believe most purchasing decisions in the U.S. foodservice distribution industry are based on the quality and price of the product, plus a distributor’s ability to completely and accurately fill orders and provide timely deliveries.
Increased competition has caused the U.S. foodservice distribution industry to change as distributors seek to lower costs, further increasing pressure on the industry’s profit margins. Heightened competition among our suppliers, significant pricing initiatives and discount programs established by competitors, new entrants, and trends toward consolidation and vertical integration could create additional competitive pressures that reduce margins and adversely affect our business, financial condition, and results of operations.
We rely on third party suppliers, and our business may be affected by interruption of supplies or increases in product costs.
We obtain most of our foodservice and related products from third party suppliers. We typically do not have long-term contracts with suppliers. Although our purchasing volume can provide leverage when dealing with suppliers, suppliers may not provide the foodservice products and supplies we need in the quantities and at the time and prices requested. We do not control the actual production of most of the products we sell. This means we are also subject to delays caused by interruption in production and increases in product costs based on conditions outside our control. These conditions include work slowdowns, work interruptions, strikes or other job actions by employees of suppliers; severe weather; crop conditions; product recalls; transportation interruptions; unavailability of fuel or increases in fuel costs; competitive demands; and natural disasters, terrorist attacks or other catastrophic events (including, but not limited to, the outbreak of food-borne illnesses in the United States). Our inability to obtain
10
adequate supplies of foodservice and related products because of any of these or other factors could mean that we could not fulfill our obligations to our customers and, as a result, our customers may turn to other distributors.
Our relationships with our customers and GPOs may be materially diminished, terminated or otherwise changed, which could reduce our profitability.
Most of our customers buy from us pursuant to individual purchase orders, and we often do not enter into long-term agreements with these customers. Because these customers are not contractually obligated to continue purchasing products from us, we cannot be assured that the volume and/or number of our customers’ purchase orders will remain consistent or increase or that we will be able to maintain our existing customer base.
Further, some of our customers purchase their products under arrangements with GPOs. GPOs act as agents on behalf of their members by negotiating pricing, delivery, and other terms with us. Our customers who are members of GPOs purchase products directly from us on the terms negotiated by their GPO. GPOs use the combined purchasing power of their members to negotiate more favorable prices than their members would typically be able to negotiate on their own, and we have experienced some pricing pressure from customers which associate themselves with a GPO. While no single customer represented more than
3%
of our total net sales in fiscal year
2018
, approximately
26%
of our net sales in fiscal year
2018
were made to customers under terms negotiated by GPOs (including approximately
13%
of our net sales in fiscal year 2018 that were made to customers that are members of one GPO). If an independent restaurant customer which becomes a member of a GPO that has a contract with us, we may be forced to lower our prices to that customer, which would negatively impact our operating margin. In addition, if we are unable to maintain our relationships with GPOs, or if GPOs are able to negotiate more favorable terms for their members with our competitors, we could lose some or all of that business.
Market competition, customer requirements, customer financial condition and customer consolidation through mergers and acquisitions also could adversely affect our ability to continue or expand our relationships with customers and GPOs. There is no guarantee that we will be able to retain or renew existing agreements, maintain relationships with any of our customers or GPOs on acceptable terms or at all or collect amounts owed to us from insolvent customers. Our customer and GPO agreements are generally terminable upon advance written notice (typically ranging from 30 days to six months) by either us or the customer or GPO, which provides our customers and GPOs with the opportunity to renegotiate their contracts with us or to award more business to our competitors.
Significant decreases in the volume and/or number of our customers’ purchase orders, or the loss of one or more of our major customers or GPOs or our inability to grow to our current customer base, could adversely affect our business, financial condition, and results of operations.
If we fail to increase or maintain our sales to independent restaurant customers, our profitability may suffer.
Our most profitable customers are independent restaurants. We tend to work closely with these customers, providing them access to our customer value added tools and as a result are able to earn a higher operating margin on sales to them. Our ability to continue to gain market share of independent restaurant customers is critical to achieving increased operating profits. Changes in the buying practices of independent restaurant customers, including their ability to require us to sell to them at discounted rates, or decreases in our sales to this type of customer could have a material negative impact on our profitability.
We may fail to effectively integrate the businesses we acquire.
Historically, a portion of our growth has come through acquisitions. In July 2018, we announced that we agreed to acquire the SGA Food Group Companies for $1.8 billion in cash, the closing of which remains subject to receipt of required regulatory approvals and other customary conditions. To fund a substantial portion of the consideration, we entered into a commitment letter with JPMorgan Chase Bank, N.A., Bank of America, N.A. and Merrill Lynch, Pierce, Fenner & Smith Incorporated (collectively, the “Committed Parties”) under which the Committed Parties committed to provide us with a $1.5 billion senior secured term loan facility.
If we are unable to integrate acquired businesses successfully or realize anticipated synergies in a timely manner, we may not realize our projected return on investment and our business and results of operations may be adversely affected. Integrating acquired businesses may be more difficult in a region or market where we have limited expertise. A significant expansion of our business and operations, in terms of geography or magnitude, could strain our administrative and/or operational resources. Significant acquisitions may also require incurring additional debt.
11
This could increase our interest expense and make it difficult for us to obtain financing for other significant acquisitions or capital investments in the future.
We may be unable to achieve some or all of the benefits that we expect from our cost savings initiatives.
We may not be able to realize some or all of our expected cost savings. A variety of factors could cause us not to realize some of the expected cost savings, including, among others, delays in the anticipated timing of activities related to our cost savings initiatives, lack of sustainability in cost savings over time, and unexpected costs associated with operating our business. All of these factors could negatively affect our results of operations and financial condition.
Significant increases in fuel costs could hurt our business.
The high cost of fuel can negatively affect consumer confidence and discretionary spending. This may reduce the frequency and amount spent by consumers for food prepared away from home. The high cost of fuel may also increase the price we pay for products, as well as the costs we incur to deliver products to our customers. These factors may, in turn, negatively affect our sales, margins, operating expenses, and operating results. Although, from time to time, we enter into forward purchase commitments for some of our fuel requirements at prices equal to the then-current market price, these forward purchases may prove ineffective and result in us paying higher than market costs for part of our fuel.
An economic downturn, or other factors affecting consumer confidence, could reduce the amount of food prepared and consumed away from home, which could harm our business.
The U.S. foodservice distribution industry is sensitive to national, regional and local economic conditions. In the past, an uneven level of general U.S. economic activity, uncertainty in the financial markets, and slow job growth had a negative impact on consumer confidence and discretionary spending. A decline in economic activity or the frequency and amount spent by consumers for food prepared away from home, as well as other macroenvironmental factors which could decrease general consumer confidence (including volatile financial markets or an uncertain political environment), may could negatively impact our business and results of operations.
Changes in consumer eating habits could materially and adversely affect our business and results of operations.
Changes in consumer eating habits (such as a decline in consuming food away from home, a decline in portion sizes, or a shift in preferences toward restaurants that are not our customers) could reduce demand for our products and adversely affect our business and results of operations. Consumer eating habits could be affected by a number of factors, including changes in attitudes regarding diet and health or new information regarding the health effects of consuming certain foods. There is a growing consumer preference for sustainable, organic and locally grown products. Changing consumer eating habits also occur due to generational shifts. Millennials, the largest demographic group in the U.S. in terms of spend, generally seek new and different as well as more ethnic menu options and menu innovation. Millennials also generally value diversity. If consumer eating habits change significantly, we may be required to modify or discontinue sales of certain items in our product portfolio, and we may experience higher costs associated with the implementation of those changes. Changing consumer eating habits may reduce the frequency with which consumers purchase meals outside of the home. Additionally, changes in consumer eating habits may result in the enactment or amendment of laws and regulations that impact the ingredients and nutritional content of our food products, or laws and regulations requiring us to make additional disclosure regarding the nutritional content of our food products. Compliance with these laws and regulations, as well as others regarding the ingredients and nutritional content of our food products, may be costly and time-consuming. If we are not able to effectively respond to changes in consumer health perceptions or resulting new laws or regulations or to adapt our menu offerings to trends in eating habits, our business and results of operations could suffer.
Any negative media exposure or other event that harms our reputation could hurt our business and results of operations.
Maintaining a good reputation is critical to our business, particularly in selling our private label products. Any event that damages our reputation, justified or not, could quickly and negatively affect our business and results of operations. This includes adverse publicity about the quality, safety or integrity of our products. Reports, whether or
12
not they are true, of food-borne illnesses (such as e. coli, avian flu, bovine spongiform encephalopathy, hepatitis A, trichinosis or salmonella) and injuries caused by food tampering could severely injure our reputation. If patrons of our customers become ill from food-borne illnesses, the customers could be forced to temporarily close locations and our sales would correspondingly decrease. In addition, instances of food-borne illnesses or food tampering or other health concerns, even those unrelated to our products, can result in negative publicity about the U.S. foodservice distribution industry and adversely affect our business and results of operations.
We face risks related to labor relations and costs.
As of
December 29, 2018
, we had approximately
25,000
employees, of which approximately
4,400
were members of local unions associated with the International Brotherhood of Teamsters and other labor organizations. Our failure to effectively renegotiate any CBAs could result in work stoppages. From time to time, we may be subject to increased efforts to subject us to multi-location labor disputes, as individual labor agreements expire or labor disputes arise. This would place us at greater risk of being unable to continue to operate one or more facilities, delaying deliveries, possibly causing customers to seek alternative suppliers, or otherwise being materially adversely affected by labor disputes. When there are labor related issues at a facility represented by a local union, sympathy strikes may occur at other facilities that are represented by other local unions. While we believe we have generally satisfactory relationships with our employees, including the unions that represent some of our employees, a work stoppage due to our failure to renegotiate union contracts or for other reasons could have a material adverse effect on our business and results of operations.
Further, potential changes in labor legislation and case law could result in current non-union portions of our workforce, including our warehouse and delivery personnel, being subjected to greater organized labor influence. If additional portions of our workforce became subject to CBAs, this could result in increased costs of doing business as we would become subject to mandatory, binding arbitration or labor scheduling, costs and standards, which may reduce our operating flexibility.
We are subject to a wide range of labor costs. Because our labor costs are, as a percentage of net sales, higher than many other industries, even if we are able to successfully renegotiate CBAs and avoid work stoppages, we may be significantly impacted by labor cost increases. In addition, labor is a significant cost of many of our customers in the U.S. food-away-from-home industry. Any increase in their labor costs, including any increases in costs as a result of increases in minimum wage requirements, could reduce the profitability of our customers and reduce their demand for our products.
If we are unable to attract or retain a qualified and diverse workforce, our business could be negatively affected.
The success of our business depends on our ability to attract, train, develop and retain a highly skilled and diverse workforce. Recruiting and retention efforts, and actions to increase productivity, may not be successful, and we could encounter a shortage of qualified employee talent in the future. Changes in immigration laws and policies could also make it more difficult for us to recruit or relocate qualified employee talent to meet our business needs. A labor shortage could potentially increase labor costs, reduce our profitability and/or decrease our ability to effectively serve customers.
If our competitors implement a lower cost structure and offer lower prices to our customers, we may be unable to adjust our cost structure to compete profitably and retain those customers.
Over the last several decades, the U.S. food retail industry has undergone a significant change. Companies such as Wal-Mart and Costco have developed a lower cost structure, providing their customers with an everyday low-cost product offering. In addition, commercial wholesale outlets, such as Restaurant Depot, offer an additional low-cost option in the markets they serve. As a large-scale U.S. foodservice distributor, we have similar strategies to remain competitive in the marketplace by reducing our cost structure. However, to the extent more of our competitors adopt an everyday low price strategy, we would potentially be pressured to offer lower prices to our customers. That would require us to achieve additional cost savings to offset these reductions. If we are unable to change our cost structure and pricing practices rapidly enough to successfully compete in that environment, our business and results of operations may be adversely affected.
13
Changes in applicable tax laws and regulations and the resolution of tax disputes could negatively affect our financial results.
We are subject to income and other taxes in the U.S. and various state and local jurisdictions and changes in tax laws or regulations or tax rulings may have an adverse impact on our effective tax rate. The U.S. and many state and local jurisdictions where we do business have recently enacted or are actively considering changes in relevant tax, accounting and other laws, regulations and interpretations. For example, on December 22, 2017, the U.S. federal government enacted comprehensive tax legislation commonly referred to as the Tax Cuts and Jobs Act of 2017 (the “Tax Act”). The Tax Act made broad and complex changes to the U.S. federal income tax code, the impacts of which are described elsewhere in this Annual Report. Given the unpredictability of possible changes to U.S. federal and state and local tax laws and regulations, it is very difficult to predict their cumulative effect on our results of operations and cash flows, but new and changed laws and regulations could adversely impact our results of operations. We are also subject to the examination of our tax returns and other tax matters by the Internal Revenue Service (the “IRS”) and other state and local tax authorities and governmental bodies, for which we regularly assess the likelihood of an adverse outcome. If the ultimate determination of these examinations is that taxes are owed by us for an amount in excess of amounts previously accrued, our financial condition, results of operations and cash flows could be adversely affected.
Our business is subject to significant environmental, health and safety and other government regulation. Failure to comply with these regulations could lead to lawsuits, investigations and other liabilities and restrictions on our operations that could significantly and adversely affect our business.
Our operations are subject to a broad range of U.S. federal, state and local laws and regulations relating to the protection of the environment, health and safety. These laws and regulations govern many issues, including discharges to air, soil and water; the handling and disposal of hazardous substances; the investigation and remediation of contamination resulting from the release of petroleum products and other hazardous substances; employee health and safety; food safety; and fleet safety. In the course of our operations, we operate and maintain vehicle fleets, use and dispose of hazardous substances, and store fuel in on-site aboveground and underground storage tanks. At several current and former facilities, we are investigating and remediating known or suspected contamination from historical releases of fuel and other hazardous substances that is not currently the subject of any administrative or judicial proceeding, but we may be subject to administrative or judicial proceedings in the future for contamination related to releases of fuel or other hazardous substances. Some jurisdictions in which we operate have laws and regulations that affect the composition and operation of truck fleets, such as limits on diesel emissions and engine idling. A number of our facilities have ammonia or freon-based refrigeration systems, propane, and battery powered forklifts, which could cause injury or environmental damage. Proposed or recently enacted legal requirements, such as those requiring the phase-out of certain ozone-depleting substances or otherwise regulating greenhouse gas emissions, may require us to upgrade or replace equipment or may otherwise increase our operating costs. We are additionally subject to governmental regulation at the U.S. federal, state, and local levels in many other areas of our business, including trade, anticorruption, and employment. As an example, due to contracts we have with federal and state governmental entities, governmental agencies have, from time to time, conducted audits of or requested information regarding our pricing practices as part of investigations of providers of services under governmental contracts.
Failing to comply with applicable legal and regulatory requirements, or encountering disagreements with respect to our contracts subject to governmental regulation, could result in a number of adverse situations. These could include investigations; administrative, civil, or criminal penalties or fines; mandatory or voluntary product recalls; cease and desist orders against operations that are not in compliance; closing facilities or operations; debarments from contracting with governmental entities; and loss or modification of existing, or rejection of additional, licenses, permits, registrations, or approvals. These laws and regulations may change in the future. The costs of compliance and consequences of non-compliance could have a material adverse effect on our business, financial condition, or results of operations.
We may be subject to or affected by liability claims related to products we distribute and manufacture.
As a seller and manufacturer of food, we may be exposed to potential product liability claims in the event that the products we sell and/or manufacture cause injury or illness. We believe we have sufficient primary or excess umbrella liability insurance to cover product liability claims. We also generally seek contractual indemnification and insurance coverage from parties supplying products to us. If our current insurance does not continue to be available at a reasonable cost or is inadequate to cover all of our liabilities, or if our indemnification or insurance coverage is limited, as a practical matter, by the creditworthiness of the indemnifying party or the insured limits of our suppliers’
14
insurance coverage, the liability related to defective products we sell and/or manufacture could adversely affect our business and results of operations.
Adverse judgments or settlements resulting from legal proceedings in which we are or may be involved in the normal course of our business could limit our ability to operate our business and adversely affect our results of operations.
In the normal course of our business, we are involved in various legal proceedings. The outcome of these proceedings cannot be predicted. If any of these proceedings were determined adversely to us or require a settlement involving a payment of a material sum of money, it could materially and adversely affect our business and results of operations. Additionally, we could become the subject of future claims by third parties, including our employees, suppliers, customers, our investors, or regulators. Any significant adverse judgments or settlements could reduce our profits and limit our ability to operate our business.
We rely heavily on technology, and any disruption in existing technology or delay in implementing new technology could adversely affect our business.
Our ability to control costs and maximize profits, as well as to serve customers most effectively, depends on the reliability of our information technology systems and related data entry processes in our transaction intensive business. We rely on software and other information technology to manage significant aspects of our business, such as purchasing, order processing, warehouse/inventory management, truck loading and logistics and optimization of storage space. Any disruption to this information technology could negatively affect our customer service, decrease the volume of our business, and result in increased costs. We have invested and continue to invest in technology security initiatives, business continuity, and disaster recovery plans in order to insulate ourselves from technology disruption that could impair operations and profits.
Information technology evolves rapidly. To compete effectively, we are required to integrate new technologies in a timely and cost-effective manner. If competitors implement new technologies before we do, allowing them to provide lower priced or enhanced services of superior quality compared to those we provide, our business and results of operations could be adversely affected.
A cybersecurity incident or other technology disruptions could negatively affect our business and our relationships with customers.
We rely upon information technology networks and systems to process, transmit and store electronic information, to process online credit card payments, and to manage or support virtually all of our business processes and activities. We also use mobile devices, social networking and other online activities to connect with our employees, suppliers, business partners and customers. These uses give rise to cybersecurity risks, including security breach, espionage, system disruption, theft, online platform hijacking that could redirect online credit card payments to another credit card processing website, and inadvertent or unauthorized release of information. Our business involves the storage and transmission of numerous classes of sensitive and/or confidential information and intellectual property, including personal information of customers and suppliers, private information about employees, and financial and strategic information about us and our business partners. Further, we are also expanding and improving our information technologies, resulting in a larger technological presence and corresponding increase in exposure to cybersecurity risk. Additionally, while we have implemented measures to prevent security breaches and cyber incidents, our preventative measures and incident response efforts may not be entirely effective. The theft, destruction, loss, misappropriation, or release of sensitive and/or confidential information or intellectual property, or interference with our information technology systems or the technology systems of third parties on which we rely, could result in business disruption, negative publicity, brand damage, violation of privacy laws, loss of customers, potential liability, and competitive disadvantage, which in turn could adversely affect our business and results of operations.
Our retirement benefits could give rise to significant expenses and liabilities in the future.
We sponsor defined benefit pension and other postretirement plans. These pension and postretirement obligations give rise to costs that are dependent on various assumptions including those discussed in Note 18, Retirement Plans, in our consolidated financial statements. In addition to the plans we sponsor, we also contribute to various multiemployer pension plans administered by labor unions representing some of our employees. We make periodic
15
contributions to these plans to allow them to meet their pension benefit obligations to their participants. In the event that we withdraw from participating in one of these plans, then applicable law could require us to make additional withdrawal liability payments to the plan based on the applicable plan’s funding status.
In addition, in the ordinary course of our renegotiation of CBAs with labor unions that maintain these plans, we could decide to discontinue participation in a plan. In that event, we could also face withdrawal liability. We could also be treated as withdrawing from participation in one of these plans, if the number of our employees participating in these plans is reduced to a certain degree over certain periods of time. A reduction in the number of employees participating in these plans could occur as a result of changes in our business or operations, such as facility closures or consolidations. Some multiemployer plans, including ones to which we contribute, are reported to have significant underfunded liabilities, which could increase the size of our potential withdrawal liability. Any withdrawal liability payments that we are required to make, including for the reasons stated above, could adversely affect our financial condition or results of operations.
Extreme weather conditions and natural disasters, and other catastrophic events, may interrupt our business, or our customers’ businesses, which could have a material adverse effect on our business, financial condition, or results of operations.
Some of our facilities and our customers’ facilities are located in areas that may be subject to extreme, and occasionally prolonged, weather conditions, including, but not limited to, hurricanes, tornadoes, blizzards, and extreme cold. Extreme weather conditions may interrupt our operations in such areas. Furthermore, extreme weather conditions may interrupt or impede access to our customers’ facilities or otherwise reduce the number of consumers who visit our customers’ facilities, all of which could have an adverse effect on our business, financial condition, or results of operations.
In addition, our business could be affected by large-scale terrorist acts or the outbreak or escalation of armed hostilities (especially those directed against or otherwise involving the U.S.), the widespread outbreak of infectious diseases or the occurrence of other catastrophic events (including, but not limited to, the outbreak of food-borne illnesses in the U.S.). Any of these events could impair our ability to manage our business and/or cause disruption of economic activity, which could have an adverse effect on our business, financial condition, or results of operations.
We rely on trademarks, trade secrets, and other forms of intellectual property protections, which may not be adequate to protect us from misappropriation or infringement of our intellectual property.
We rely on a combination of trademark, trade secret and other intellectual property laws in the U.S. We have applied for registration of a limited number of trademarks in the U.S. and in certain other countries, some of which have been registered or issued. We cannot guarantee that our applications will be approved by the applicable governmental authorities, or that third parties will not seek to oppose or otherwise challenge our registrations or applications. We also rely on unregistered proprietary rights, including common law trademark protection. Third parties may use trademarks identical or confusingly similar to ours, or independently develop trade secrets or know-how similar or equivalent to ours. If our proprietary information is divulged to third parties, including our competitors, or our intellectual property rights are otherwise misappropriated or infringed, our business could be harmed or adversely affected.
Our products may infringe the intellectual property rights of others, which may cause us to incur unexpected costs or prevent us from selling our products.
We cannot be certain that our products do not and will not infringe intellectual property rights of others. We may be subject to legal proceedings and claims in the ordinary course of our business, including claims of alleged infringement of intellectual property rights of third parties by us or our customers in connection with their use of our products. Any such claims, whether or not meritorious, could result in costly litigation and divert the efforts of our management and personnel. Moreover, if we were found liable for infringement, we may be required to enter into licensing agreements (if available on acceptable terms or at all) or to pay damages and to cease making or selling certain products, which could cause us to incur significant costs and/or prevent us from selling or manufacturing certain products.
16
Risks Relating to Our Indebtedness
Our level of indebtedness could adversely affect our financial condition and our ability to raise additional capital or obtain financing in the future, react to changes in our business, and make required payments on our debt.
As of
December 29, 2018
, we had
$3,457 million
of indebtedness, net of
$11 million
of unamortized deferred financing costs.
Our level of indebtedness could have important consequences to us, including the following:
|
•
|
a substantial portion of our cash flows from operations must be dedicated to the payment of principal and interest on our indebtedness, thereby reducing the funds available to us for other purposes, including for working capital, capital expenditures, acquisitions, debt service requirements and general corporate purposes;
|
|
•
|
we are exposed to the risk of increased interest rates because approximately
41%
of the principal amount of our borrowings was at variable rates of interest as of
December 29, 2018
;
|
|
•
|
it may be difficult for us to satisfy our obligations to our lenders, resulting in possible defaults on and acceleration of such indebtedness;
|
|
•
|
we may be more vulnerable to general adverse economic and industry conditions;
|
|
•
|
we may be at a competitive disadvantage compared to our competitors with less debt or comparable debt at more favorable interest rates and they, as a result, may be better positioned to withstand economic downturns;
|
|
•
|
our ability to refinance indebtedness and obtain additional financing may be limited or the associated costs of refinancing and obtaining additional financing may increase; and
|
|
•
|
our flexibility to adjust to changing market conditions and ability to withstand competitive pressures could be limited, and we may be prevented from carrying out capital spending that is necessary or important to our growth strategy and efforts to improve operating margins of our business.
|
Our indebtedness may further increase from time to time and we may be able to incur substantial additional indebtedness, including secured debt, in the future for various reasons. Although the agreements governing our indebtedness contain restrictions on the incurrence of additional indebtedness, these restrictions are subject to a number of significant qualifications and exceptions and, under certain circumstances, the amount of indebtedness that could be incurred in compliance with these restrictions could be substantial. In order to fund a substantial portion of the consideration in our contemplated acquisition of the SGA Food Group Companies, the closing of which remains subject to receipt of required regulatory approvals and other customary conditions, we entered into a commitment letter under which the Committed Parties committed to provide us with a $1.5 billion senior secured term loan facility. Incurring substantial additional indebtedness could further exacerbate the risks associated with our level of indebtedness.
The agreements governing our indebtedness contain restrictions and limitations that could significantly impact our ability to operate our business.
The agreements governing our indebtedness contain covenants that, among other things, restrict our ability to do the following:
|
•
|
dispose of assets;
|
|
•
|
incur additional indebtedness (including guarantees of additional indebtedness);
|
|
•
|
pay dividends and make certain payments;
|
|
•
|
create liens on assets;
|
|
•
|
make investments (including entering joint ventures);
|
|
•
|
engage in certain business combination transactions;
|
|
•
|
engage in certain transactions with affiliates;
|
|
•
|
change the business conducted by us; and
|
|
•
|
amend specific debt agreements.
|
17
In addition, the agreements governing our indebtedness subject us to various financial covenants. Our ability to comply with these provisions in future periods will depend on our ongoing financial and operating performance, as discussed under the caption “Risks Related to Our Business and Industry,” above. Our ability to comply with these provisions in future periods will also depend substantially on the pricing of our products, our success at implementing cost reduction initiatives and our ability to successfully implement our overall business strategy.
The restrictions under the agreements governing our indebtedness may prevent us from taking actions that we believe would be in the best interest of our business, and may make it difficult for us to successfully execute our business strategy or effectively compete with companies that are not similarly restricted. We may also incur future debt obligations that might subject us to additional restrictive and financial covenants that could affect our financial and operational flexibility. We cannot assure that we will be granted waivers of or amendments to these obligations if for any reason we are unable to comply with them or that we will be able to refinance our debt on terms acceptable to us, or at all.
Our ability to comply with the covenants and restrictions contained in the agreements governing our indebtedness may be affected by economic, financial and industry conditions beyond our control. The breach of any of these covenants or restrictions could result in a default under the agreements governing our indebtedness that would permit the applicable lenders or note holders, as the case may be, to declare all amounts outstanding thereunder to be due and payable, together with accrued and unpaid interest. If we are unable to repay debt, lenders having secured obligations could proceed against the collateral securing the debt. In any such case, we may be unable to borrow under and may not be able to repay the amounts due under our indebtedness. This could have serious consequences to our financial condition and results of operations and could cause us to become bankrupt or insolvent.
Our ability to generate the significant amount of cash needed to pay interest and principal on our debt facilities and our ability to refinance all or a portion of our indebtedness or obtain additional financing depends on many factors beyond our control.
Our ability to make scheduled payments on, or to refinance our obligations under, our debt facilities depends on our financial and operating performance and prevailing economic and competitive conditions. Certain of these financial and business factors, many of which may be beyond our control, are described under the caption “Risks Related to our Business and Industry,” above.
If our cash flows and capital resources are insufficient to fund our debt service obligations, we may be forced to reduce or delay capital expenditures, sell assets, raise additional equity capital or restructure our debt. However, there is no assurance that such alternative measures may be successful or permitted under the agreements governing our indebtedness and, as a result, we may not be able to meet our scheduled debt service obligations. In the absence of such operating results and resources, we could face substantial liquidity problems and might be required to dispose of material assets or operations to meet our debt service and other obligations.
Our accounts receivable financing facility (the “ABS Facility”) and our asset-backed senior secured revolving loan facility (“ABL Facility”) both mature in 2020. Our senior secured term loan facility (the “Term Loan Facility”) will mature in 2023. Our 5.875% unsecured senior notes (the “Senior Notes”) will mature in 2024. We cannot assure that we will be able to refinance our indebtedness or obtain additional financing on satisfactory terms, or at all, particularly due to our level of indebtedness and the debt incurrence restrictions imposed by the agreements governing our indebtedness. Further, the cost and availability of credit are subject to changes in the economic environment. If conditions in major credit markets deteriorate, our ability to refinance our indebtedness or obtain additional financing on satisfactory terms, or at all, may be negatively affected.
Increases in interest rates and potential upcoming regulatory changes could increase the cost of servicing our debt and have an adverse effect on our results of operations and cash flows.
After considering interest rate swaps that fixed the interest rate on $1.1 billion of principal of our Term Loan
Facility
,
approximately
41%
of the principal amount of our debt bears interest at variable rates as of
December 29, 2018
. As a result, additional increases in interest rates would increase the cost of servicing our debt and could have an adverse effect on our results of operations and cash flows. The impact of such an increase could be more significant for us than it would be for some other companies because of our level of indebtedness.
18
In addition, in July 2017, the United Kingdom’s Financial Conduct Authority, which regulates the London Interbank Offered Rate (“LIBOR”), announced that it intends to phase out LIBOR by the end of 2021. It is unclear if LIBOR will cease to exist or if new methods of calculating LIBOR will be established such that it continues to exist. Each of our ABL Facility, ABS Facility, and Term Loan Facility utilizes U.S. dollar LIBOR as a factor in determining the applicable interest rate. As such, depending on the future of LIBOR, we may need to renegotiate certain terms of the agreements governing our indebtedness to replace U.S. dollar LIBOR with a new standard, which could increase the cost of servicing our debt and have an adverse effect on our results of operations and cash flows.
Risks Relating to Ownership of Our Common Stock
Our stock price may change significantly, and you may not be able to sell your shares of our common stock at or above the price you paid or at all, and you could lose all or part of your investment as a result.
The stock market routinely experiences periods of large or extreme volatility. In some instances, this volatility is unrelated or disproportionate to the operating performance of particular companies.
The trading price of our common stock may be adversely affected due to a number of factors, including those described under the caption “Risks Relating to Our Business and Industry,” above, and the following, many of which we cannot control:
|
•
|
results of operations that vary from the expectations of securities analysts and investors;
|
|
•
|
results of operations that vary from those of our competitors;
|
|
•
|
changes in expectations as to our or our industry’s future financial performance, including financial estimates and investment recommendations by securities analysts and investors, and the publication of research reports regarding the same;
|
|
•
|
declines in the market prices of stocks, trading volumes and company valuations, particularly those of foodservice distribution companies;
|
|
•
|
strategic actions by us or our competitors;
|
|
•
|
changes in preferences of our customers and purchasing habits of consumers;
|
|
•
|
announcements by us or our competitors of significant contracts, new products, acquisitions, joint marketing relationships, joint ventures, other strategic relationships, or capital commitments;
|
|
•
|
changes in general economic or market conditions or trends in our industry or markets;
|
|
•
|
changes in business or regulatory conditions;
|
|
•
|
future issuances or sales or purchases of our common stock or other securities;
|
|
•
|
investor perceptions or the investment opportunity associated with our common stock relative to other investment alternatives;
|
|
•
|
a default on our indebtedness or a downgrade in our or our competitors’ credit ratings;
|
|
•
|
the public’s response to press releases or other public announcements by us or third parties, including our filings with the SEC;
|
|
•
|
changes in senior management or other key personnel;
|
|
•
|
announcements relating to litigation;
|
|
•
|
guidance, if any, that we provide to the public, any changes in this guidance, or our failure to meet this guidance;
|
|
•
|
the sustainability of an active trading market for our common stock;
|
|
•
|
changes in accounting principles;
|
|
•
|
occurrences of extreme or inclement weather; and
|
|
•
|
other events or factors, including those resulting from natural disasters, war, or acts of terrorism, and responses to these events.
|
In the past, following periods of market volatility or material announcements or events, stockholders have instituted securities class action litigation against various companies. If we were involved in securities litigation, it could have
19
a substantial cost and divert resources and the attention of executive management from our business regardless of the outcome of such litigation.
Because we have no current plans to pay cash dividends on our common stock, you may not receive any return on investment unless you sell your common stock for a price greater than that which you paid for it.
We have no current plans to pay any cash dividends for the foreseeable future. The declaration, amount, and payment of any future dividends on shares of common stock will be at the sole discretion of our Board of Directors. Our Board of Directors may take into account general and economic conditions, our financial condition and results of operations, our available cash and current and anticipated cash needs, capital requirements, contractual, legal, tax, and regulatory restrictions, implications of the payment of dividends by us to our stockholders or by our subsidiaries to us, and such other factors as our Board of Directors may deem relevant. In addition, our ability to pay dividends is limited by covenants in the agreements governing our indebtedness and may be limited by covenants relating to any future indebtedness we or our subsidiaries incur. As a result, you may not receive any return on an investment in our common stock unless you sell our common stock for a price greater than that which you paid for it.
Anti-takeover provisions in our organizational documents and Delaware law could delay or prevent a change of control.
Certain provisions of our Restated Certificate of Incorporation (our “Certificate of Incorporation”) and our Third Amended and Restated Bylaws (our “Bylaws”), as well as the laws of the State of Delaware, our jurisdiction of incorporation, may have an anti-takeover effect and may delay, defer, or prevent a merger, acquisition, tender offer, takeover attempt, or other change of control transaction that a stockholder might consider in its interest, including those attempts that might result in a premium over the market price for the shares of our common stock held by stockholders.
Even in the absence of a takeover attempt, the existence of these provisions may adversely affect the prevailing market price of our common stock if the provisions are viewed as discouraging takeover attempts in the future. Certain provisions in our Certificate of Incorporation and Bylaws, as well as the laws of the State of Delaware, may also make it difficult for stockholders to replace or remove members of our Board of Directors. These provisions may facilitate management entrenchment that may delay, deter, render more difficult or prevent a change in control of the Company.
Our Certificate of Incorporation contains provisions limiting the personal liability of our directors for breaches of fiduciary duty under Delaware law.
Our Certificate of Incorporation contains provisions permitted under the laws of the State of Delaware relating to the liability of directors. These provisions eliminate a director’s personal liability to the fullest extent permitted by the laws of the State of Delaware for monetary damages resulting from a breach of fiduciary duty, except in circumstances involving:
|
•
|
breaches of the director’s duty of loyalty;
|
|
•
|
acts or omissions not in good faith or which involve intentional misconduct or a knowing violation of the law;
|
|
•
|
unlawful dividends; or
|
|
•
|
transactions from which the director derives an improper personal benefit.
|
The principal effect of the limitation on liability provision is that the consequences of a stockholder prosecuting an action for monetary damages against a director may be limited, unless the stockholder can demonstrate a basis for liability for which indemnification is not available under the laws of the State of Delaware. These provisions, however, should not limit or eliminate our rights or any stockholder’s rights to seek non-monetary relief, such as an injunction or rescission, in the event of a breach of a director’s fiduciary duty. These provisions will not alter a director’s liability under federal securities laws. The inclusion of this provision in our Certificate of Incorporation
20
may discourage or deter stockholders or management from bringing a lawsuit against directors for a breach of their fiduciary duties, even though such an action, if successful, might otherwise have benefited us and our stockholders.
|
Item 1B.
|
Unresolved Staff Comments
|
None.
Item 2. Properties
As of
January 31, 2019
, we maintained
79
primary operating facilities, including
63
distribution centers and other supporting facilities. Approximately
78%
were owned, and
22%
were leased. Our real estate includes our corporate headquarters in Rosemont, Illinois and our shared services center in Tempe, Arizona, both of which are leased. Our properties also include a number of local sales offices, trailer “drop-sites,” and vacant land not included in the count above. In addition, there is a minimal amount of surplus owned or leased property not included in the count above. Leases on these properties expire at various dates from
2019
to
2028
, although certain of these leases include options for renewal.
The following table lists our operating facilities, by state, and their aggregate square footage. The table reflects our material operating facilities, including distribution centers that may contain multiple locations or buildings and other supporting facilities. It does not include retail sales locations, Chef’Stores, or US Foods Culinary Equipment & Supply outlet locations. It also does not include closed locations, vacant properties or ancillary use properties, such as temporary storage, remote sales offices and parking lots. In addition, the table shows the square footage of our leased Rosemont headquarters and Tempe shared services center locations:
21
|
Location
|
Number of
Facilities
|
Square
Feet
|
|||||||
|
Alabama
|
2
|
|
438,804
|
|
|||||
|
Arizona
|
2
|
|
317,071
|
|
|||||
|
Arkansas
|
1
|
|
135,009
|
|
|||||
|
California
|
5
|
|
1,314,847
|
|
|||||
|
Colorado
|
1
|
|
314,883
|
|
|||||
|
Connecticut
|
1
|
|
239,899
|
|
|||||
|
Florida
|
5
|
|
1,194,226
|
|
|||||
|
Georgia
|
2
|
|
691,017
|
|
|||||
|
Illinois
|
3
|
|
528,295
|
|
|||||
|
Indiana
|
1
|
|
233,784
|
|
|||||
|
Iowa
|
1
|
|
114,250
|
|
|||||
|
Kansas
|
1
|
|
350,859
|
|
|||||
|
Louisiana
|
1
|
|
69,304
|
|
|||||
|
Michigan
|
1
|
|
276,003
|
|
|||||
|
Minnesota
|
3
|
|
414,963
|
|
|||||
|
Mississippi
|
1
|
|
287,356
|
|
|||||
|
Missouri
|
3
|
|
602,947
|
|
|||||
|
Nebraska
|
2
|
|
246,430
|
|
|||||
|
Nevada
|
4
|
|
840,219
|
|
|||||
|
New Hampshire
|
1
|
|
533,237
|
|
|||||
|
New Jersey
|
3
|
|
1,073,375
|
|
|||||
|
New Mexico
|
1
|
|
133,486
|
|
|||||
|
New York
|
3
|
|
388,683
|
|
|||||
|
North Carolina
|
3
|
|
954,736
|
|
|||||
|
North Dakota
|
2
|
|
221,314
|
|
|||||
|
Ohio
|
3
|
|
501,894
|
|
|||||
|
Oklahoma
|
1
|
|
308,307
|
|
|||||
|
Pennsylvania
|
6
|
|
1,179,319
|
|
|||||
|
South Carolina
|
2
|
|
1,220,499
|
|
|||||
|
South Dakota
|
1
|
|
47,400
|
|
|||||
|
Tennessee
|
2
|
|
602,270
|
|
|||||
|
Texas
|
4
|
|
963,732
|
|
|||||
|
Utah
|
1
|
|
267,180
|
|
|||||
|
Virginia
|
2
|
|
629,318
|
|
|||||
|
Washington
|
1
|
|
216,500
|
|
|||||
|
West Virginia
|
1
|
|
220,537
|
|
|||||
|
Wisconsin
|
2
|
|
354,127
|
|
|||||
|
Total
|
79
|
|
18,426,080
|
|
|||||
|
Owned
|
|
14,420,646
|
|
78
|
%
|
||||
|
Leased
|
|
4,005,434
|
|
22
|
%
|
||||
|
Headquarters: Rosemont, Illinois
|
337,331
|
|
|||||||
|
Shared Services Center: Tempe, Arizona
|
133,225
|
|
|||||||
22
|
Item 3.
|
Legal Proceedings
|
From time to time, we may be party to legal proceedings that arise in the ordinary course of our business. We do not believe there are any pending legal proceedings that, separately or in the aggregate, will have a material adverse effect on our results of operations, financial condition, or cash flows.
Item 4. Mine Safety Disclosures
None.
23
PART II
|
Item 5.
|
Market for Registrant’s Common Equity, Related Stockholder Matters and Issuer Purchases of Equity Securities
|
Our common stock began trading publicly on the New York Stock Exchange (“NYSE”) under the symbol “USFD” as of May 26, 2016. Prior to that time, there was no public market for our common stock. As of
January 28, 2019
, there were
23,721
holders of record of our common stock. This stockholder figure does not include a substantially greater number of “street” holders whose shares are held of record by banks, brokers and other financial institutions.
Unregistered Sales of Equity Securities
None.
Dividends
We have not paid any dividends on our common stock since our common stock began trading publicly on the NYSE.
We have no plans to pay dividends on our common stock currently or in the foreseeable future. The declaration, amount, and payment of any future dividends on shares of common stock will be at the sole discretion of our Board of Directors. Our Board of Directors may take into account the factors discussed in Item 1A of Part I, “Risk Factors-Risks Relating to Ownership of Our Common Stock.” Because US Foods Holding Corp. is a holding company and has no direct operations, it will be able to pay dividends only from funds received from its subsidiaries. In addition, our ability to pay dividends is limited by covenants in the agreements governing our existing indebtedness and may be further limited by the agreements governing additional indebtedness we or our subsidiaries incur in the future. See Item 7 of Part II, “Management’s Discussion and Analysis of Financial Condition and Results of Operations-Liquidity and Capital Resources-Indebtedness.”
24
Stock Performance Graph
The following stock performance graph compares the cumulative total stockholder return of the Company’s common stock since May 26, 2016, the date the Company’s common stock began trading on the NYSE, with the cumulative total return of the S&P 500 Index and the S&P Food and Staples Retailing Index. The graph assumes the investment of $100 in our common stock and each of such indices on May 26, 2016 and the reinvestment of dividends, if applicable. Performance data for the Company, the S&P 500 Index and the S&P Food and Staples Retailing Index is provided as of the last trading day of each of our last three fiscal years. This stock price performance graph is not indicative of future stock price performance.
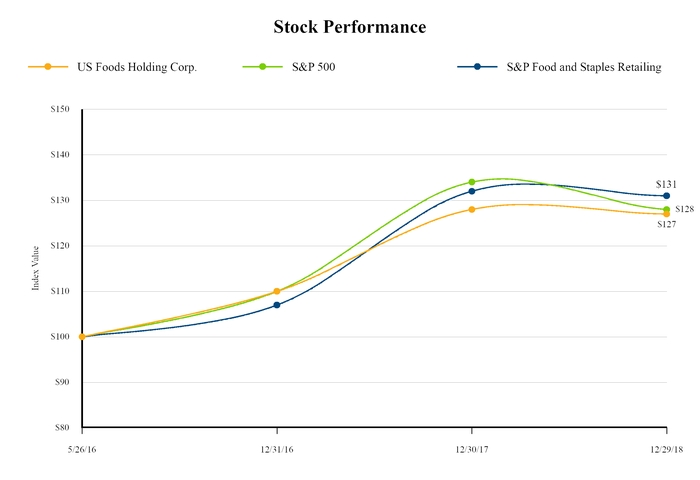
|
5/26/16
|
|
12/31/16
|
|
12/30/17
|
|
12/29/18
|
|
||||||||
|
US Foods Holding Corp.
|
$
|
100
|
|
$
|
110
|
|
$
|
128
|
|
$
|
127
|
|
|||
|
S&P 500
|
100
|
|
110
|
|
134
|
|
128
|
|
|||||||
|
S&P Food and Staples Retailing Index
|
100
|
|
107
|
|
132
|
|
131
|
|
|||||||
The stock performance graph above and related information shall not be deemed “soliciting material” or “filed” with the SEC or subject to the SEC’s proxy rules or to the liabilities of Section 18 of the Securities Exchange Act of 1934, as amended (the “Exchange Act”), and shall not be deemed to be incorporated by reference into any prior or future filings under the Securities Act of 1933, as amended (the “Securities Act”) or the Exchange Act, except to the extent that the Company specifically incorporates it by reference into any of those filings.
25
|
Item 6.
|
Selected Financial Data
|
The selected historical consolidated statements of operations data for fiscal years
2018
,
2017
and
2016
, and the related selected balance sheet data as of the fiscal years ended
2018
and
2017
, have been derived from our consolidated financial statements and related notes contained elsewhere in this Annual Report. The selected historical consolidated statements of operations data for fiscal years
2015
and
2014
and the selected balance sheet data as of the fiscal years ended
2016
,
2015
, and
2014
, have been derived from our consolidated financial statements not included in this Annual Report.
The following selected consolidated financial data should be read together with Item 7 of Part II, “Management’s Discussion and Analysis of Financial Condition and Results of Operations,” and our consolidated financial statements and related notes included in Item 8 of Part II.
The following tables set forth our selected financial data for the periods and as of the dates indicated:
|
Fiscal Year
|
|||||||||||||||||||
|
2018
|
2017*
|
2016*
|
2015*
|
2014*
|
|||||||||||||||
|
(in millions, except per share data)
|
|||||||||||||||||||
|
Consolidated Statements of Operations Data:
|
|||||||||||||||||||
|
Net sales
|
$
|
24,175
|
|
$
|
24,147
|
|
$
|
22,919
|
|
$
|
23,127
|
|
$
|
23,020
|
|
||||
|
Cost of goods sold
|
19,869
|
|
19,929
|
|
18,866
|
|
19,114
|
|
19,222
|
|
|||||||||
|
Gross profit
|
4,306
|
|
4,218
|
|
4,053
|
|
4,013
|
|
3,798
|
|
|||||||||
|
Operating expenses:
|
|||||||||||||||||||
|
Distribution, selling and administrative costs
|
3,647
|
|
3,631
|
|
3,581
|
|
3,651
|
|
3,553
|
|
|||||||||
|
Restructuring charges (benefit) and tangible asset impairments
|
1
|
|
(1
|
)
|
53
|
|
173
|
|
—
|
|
|||||||||
|
Total operating expenses
|
3,648
|
|
3,630
|
|
3,634
|
|
3,824
|
|
3,553
|
|
|||||||||
|
Operating income
|
658
|
|
588
|
|
419
|
|
189
|
|
245
|
|
|||||||||
|
Formerly Proposed Sysco Acquisition termination fees—net
|
—
|
|
—
|
|
—
|
|
288
|
|
—
|
|
|||||||||
|
Other (income) expense—net
|
(13
|
)
|
14
|
|
5
|
|
(1
|
)
|
(7
|
)
|
|||||||||
|
Interest expense—net
|
175
|
|
170
|
|
229
|
|
285
|
|
289
|
|
|||||||||
|
Loss on extinguishment of debt
|
—
|
|
—
|
|
54
|
|
—
|
|
—
|
|
|||||||||
|
Income (loss) before income taxes
|
496
|
|
404
|
|
131
|
|
193
|
|
(37
|
)
|
|||||||||
|
Income tax provision (benefit)
|
89
|
|
(40
|
)
|
(79
|
)
|
25
|
|
36
|
|
|||||||||
|
Net income (loss)
|
$
|
407
|
|
$
|
444
|
|
$
|
210
|
|
$
|
168
|
|
$
|
(73
|
)
|
||||
|
Earnings (loss) per share:
|
|||||||||||||||||||
|
Basic
|
$
|
1.88
|
|
$
|
2.00
|
|
$
|
1.05
|
|
$
|
0.99
|
|
$
|
(0.43
|
)
|
||||
|
Diluted
(1)
|
$
|
1.87
|
|
$
|
1.97
|
|
$
|
1.03
|
|
$
|
0.98
|
|
$
|
(0.43
|
)
|
||||
|
Weighted-average number of shares used in per share amounts:
|
|||||||||||||||||||
|
Basic
|
216.1
|
|
222.4
|
|
200.1
|
|
169.6
|
169.5
|
|||||||||||
|
Diluted
(1)
|
217.8
|
|
225.7
|
|
204.0
|
|
171.1
|
169.5
|
|||||||||||
|
Other Data:
|
|||||||||||||||||||
|
Cash flows—operating activities
|
$
|
609
|
|
$
|
749
|
|
$
|
549
|
|
$
|
555
|
|
$
|
402
|
|
||||
|
Cash flows—investing activities
|
(232
|
)
|
(356
|
)
|
(762
|
)
|
(271
|
)
|
(118
|
)
|
|||||||||
|
Cash flows—financing activities
|
(391
|
)
|
(405
|
)
|
(180
|
)
|
(110
|
)
|
(120
|
)
|
|||||||||
|
Capital expenditures
|
235
|
|
221
|
|
164
|
|
187
|
|
147
|
|
|||||||||
|
EBITDA
(2)
|
1,011
|
|
952
|
|
782
|
|
876
|
|
664
|
|
|||||||||
|
Adjusted EBITDA
(2)
|
1,103
|
|
1,058
|
|
972
|
|
875
|
|
866
|
|
|||||||||
|
Adjusted net income
(2)
|
442
|
|
312
|
|
321
|
|
154
|
|
126
|
|
|||||||||
|
Free cash flow
(3)
|
374
|
|
528
|
|
385
|
|
368
|
|
255
|
|
|||||||||
26
|
As of Fiscal Year
|
|||||||||||||||||||
|
2018
|
2017*
|
2016*
|
2015*
|
2014*
|
|||||||||||||||
|
(in millions)
|
|||||||||||||||||||
|
Balance Sheet Data:
|
|||||||||||||||||||
|
Cash, cash equivalents and restricted cash
|
$
|
105
|
|
$
|
119
|
|
$
|
131
|
|
$
|
524
|
|
$
|
350
|
|
||||
|
Total assets
|
9,186
|
|
9,037
|
|
8,944
|
|
9,239
|
|
9,023
|
|
|||||||||
|
Total debt
|
3,457
|
|
3,757
|
|
3,782
|
|
4,745
|
|
4,714
|
|
|||||||||
|
Total shareholders’ equity
|
3,229
|
|
2,751
|
|
2,538
|
|
1,873
|
|
1,622
|
|
|||||||||
|
(*)
|
Prior year amounts may be rounded to conform with the current year presentation or may not add due to rounding.
|
|
(1)
|
When there is a loss for the applicable period, weighted average fully diluted shares outstanding was not used in the computation as the effect would be antidilutive.
|
|
(2)
|
EBITDA, Adjusted EBITDA, and Adjusted net income are financial measures that are not in accordance with accounting principles generally accepted in the United States of America (“GAAP”). These non-GAAP measures are used by management to measure operating performance. EBITDA is defined as net income (loss), plus interest expense—net, income tax provision (benefit), and depreciation and amortization. Adjusted EBITDA is defined as EBITDA adjusted for (1) Former Sponsor (as defined below) fees; (2) restructuring (benefit) charges and tangible asset impairments; (3) share-based compensation expense; (4) the non-cash impact of last-in first-out (“LIFO”) reserve adjustments; (5) loss on extinguishment of debt; (6) pension settlements; (7) business transformation costs; (8) Formerly Proposed Sysco
Acquisition related costs, as further described below; (9) Formerly Proposed Sysco
Acquisition termination fees—net, as further described below; and (10) other gains, losses, or charges as specified in t
he agreements governing our indebtedness.
Adjusted net income is defined as net income (loss) excluding the items used to calculate Adjusted EBITDA listed above and further adjusted for the tax effect of the exclusions and discrete tax items. EBITDA, Adjusted EBITDA, and Adjusted net income as presented in this Annual Report are supplemental measures of our performance that are not required by, or presented in accordance with, GAAP. They are not measurements of our performance under GAAP and should not be considered as alternatives to net income (loss) or any other performance measures derived in accordance with GAAP.
|
|
(3)
|
Free cash flow is a non-GAAP financial measure that is defined as cash flows provided by operating activities less capital expenditures. Free cash flow is used by management as a supplemental measure of our liquidity. For additional information, see the discussion under the caption “Non-GAAP Reconciliations” below.
|
Non-GAAP Reconciliations
We provide EBITDA, Adjusted EBITDA, Adjusted net income, and Free cash flow as supplemental measures to GAAP regarding our operational performance. These non-GAAP financial measures exclude the impact of certain items and, therefore, have not been calculated in accordance with GAAP.
We believe EBITDA and Adjusted EBITDA provide meaningful supplemental information about our operating performance because they exclude amounts that we do not consider part of our core operating results when assessing our performance. Items excluded from Adjusted EBITDA include restructuring (benefit) charges and tangible asset impairments, loss on extinguishment of debt, fees of Clayton, Dubilier & Rice, LLC (“CD&R”) and Kohlberg Kravis Roberts & Co., L.P. (“KKR” and, together with CD&R, the “Former Sponsors”), share-based compensation expense, the non-cash impact of LIFO reserve adjustments, pension settlements, business transformation costs (costs associated with the redesign of systems and processes), Formerly Proposed Sysco Acquisition related costs, as further described below, Formerly Proposed Sysco Acquisition termination fees-net, as further described below, and other items as specified in the agreements governing our indebtedness.
We believe that Adjusted net income is a useful measure of operating performance for both management and investors because it excludes items that are not reflective of our core operating performance and provides an additional view of our operating performance including depreciation, amortization, interest expense, and income taxes on a consistent basis from period to period. Adjusted net income is net income (loss) excluding such items as restructuring (benefit) charges and tangible asset impairments, loss on extinguishment of debt, Former Sponsor fees, as further described below, share-based compensation expense, the non-cash impact of LIFO reserve adjustments, pension settlements, business transformation costs (costs associated with redesign of systems and process), and other items as specified in the agreements governing our indebtedness, and adjusted for the tax effect of the exclusions and discrete tax items. We believe that Adjusted net income may be used by investors, analysts and other interested parties to facilitate period-over-period comparisons and provides additional clarity as to how factors and trends impact our operating performance.
27
Management uses these non-GAAP financial measures (1) to evaluate our historical and prospective financial performance as well as our performance relative to our competitors as they assist in highlighting trends, (2) to set internal sales targets and spending budgets, (3) to measure operational profitability and the accuracy of forecasting, (4) to assess financial discipline over operational expenditures, and (5) as an important factor in determining variable compensation for management and employees. EBITDA and Adjusted EBITDA are also used in connection with certain covenants and activity restrictions under the agreements governing our indebtedness. We also believe these and similar non-GAAP financial measures are frequently used by securities analysts, investors, and other interested parties to evaluate companies in our industry.
We use free cash flow to review the liquidity of our operations. We measure free cash flow as cash flows provided by operating activities less capital expenditures. We believe that free cash flow is a useful financial metric to assess our ability to pursue business opportunities and investments. Free cash flow is not a measure of our liquidity under GAAP and should not be considered as an alternative to cash flows provided by operating activities.
We caution readers that amounts presented in accordance with our definitions of EBITDA, Adjusted EBITDA, Adjusted net income, and free cash flow may not be the same as similar measures used by other companies. Not all companies and analysts calculate EBITDA, Adjusted EBITDA, Adjusted net income or free cash flow in the same manner. We compensate for these limitations by using these non-GAAP financial measures as supplements to GAAP financial measures and by presenting the reconciliations of the non-GAAP financial measures to their most comparable GAAP financial measures.
The following table reconciles EBITDA, Adjusted EBITDA, Adjusted net income and free cash flow to the most directly comparable GAAP financial performance and liquidity measures for the periods indicated:
|
Fiscal Year
|
|||||||||||||||||||
|
2018
|
2017*
|
2016*
|
2015*
|
2014*
|
|||||||||||||||
|
(in millions)
|
|||||||||||||||||||
|
Net income (loss)
|
$
|
407
|
|
$
|
444
|
|
$
|
210
|
|
$
|
168
|
|
$
|
(73
|
)
|
||||
|
Interest expense—net
|
175
|
|
170
|
|
229
|
|
285
|
|
289
|
|
|||||||||
|
Income tax provision (benefit)
|
89
|
|
(40
|
)
|
(79
|
)
|
25
|
|
36
|
|
|||||||||
|
Depreciation and amortization expense
|
340
|
|
378
|
|
421
|
|
399
|
|
412
|
|
|||||||||
|
EBITDA
|
1,011
|
|
952
|
|
782
|
|
876
|
|
664
|
|
|||||||||
|
Adjustments:
|
|||||||||||||||||||
|
Former Sponsor fees
(1)
|
—
|
|
—
|
|
36
|
|
10
|
|
10
|
|
|||||||||
|
Restructuring charges (benefit) and tangible asset impairments
(2)
|
1
|
|
(1
|
)
|
53
|
|
173
|
|
—
|
|
|||||||||
|
Share-based compensation expense
(3)
|
28
|
|
21
|
|
18
|
|
16
|
|
12
|
|
|||||||||
|
Net LIFO reserve change
(4)
|
—
|
|
14
|
|
(18
|
)
|
(74
|
)
|
60
|
|
|||||||||
|
Loss on extinguishment of debt
(5)
|
—
|
|
—
|
|
54
|
|
—
|
|
—
|
|
|||||||||
|
Pension settlements
(6)
|
—
|
|
18
|
|
—
|
|
—
|
|
2
|
|
|||||||||
|
Business transformation costs
(7)
|
22
|
|
40
|
|
37
|
|
46
|
|
54
|
|
|||||||||
|
Formerly Proposed Sysco Acquisition termination fees—net
(8)
|
—
|
|
—
|
|
—
|
|
(288
|
)
|
—
|
|
|||||||||
|
Formerly Proposed Sysco Acquisition related costs
(9)
|
—
|
|
—
|
|
1
|
|
85
|
|
38
|
|
|||||||||
|
SGA acquisition related costs and other
(10)
|
41
|
|
14
|
|
10
|
|
31
|
|
26
|
|
|||||||||
|
Adjusted EBITDA
|
1,103
|
|
1,058
|
|
972
|
|
875
|
|
866
|
|
|||||||||
|
Depreciation and amortization expense
|
(340
|
)
|
(378
|
)
|
(421
|
)
|
(399
|
)
|
(412
|
)
|
|||||||||
|
Interest expense—net
|
(175
|
)
|
(170
|
)
|
(229
|
)
|
(285
|
)
|
(289
|
)
|
|||||||||
|
Income tax provision, as adjusted
(11)
|
(146
|
)
|
(198
|
)
|
(1
|
)
|
(37
|
)
|
(39
|
)
|
|||||||||
|
Adjusted net income
|
$
|
442
|
|
$
|
312
|
|
$
|
321
|
|
$
|
154
|
|
$
|
126
|
|
||||
|
Free cash flow
|
|||||||||||||||||||
|
Cash flows from operating activities
|
$
|
609
|
|
$
|
749
|
|
$
|
549
|
|
$
|
555
|
|
$
|
402
|
|
||||
|
Capital expenditures
|
(235
|
)
|
(221
|
)
|
(164
|
)
|
(187
|
)
|
(147
|
)
|
|||||||||
|
Free cash flow
|
$
|
374
|
|
$
|
528
|
|
$
|
385
|
|
$
|
368
|
|
$
|
255
|
|
||||
|
(*)
|
Prior year amounts may be rounded to conform with the current year presentation.
|
|
(1)
|
Consists of fees paid to the Former Sponsors for consulting and management advisory services. On June 1, 2016, the consulting agreements with each of the Former Sponsors were terminated for an aggregate termination fee of $31 million.
|
28
|
(2)
|
Consists primarily of facility related closing costs, including severance and related costs, tangible asset impairment charges and gains on sale, organizational realignment costs and estimated multiemployer pension withdrawal liabilities and settlements.
|
|
(3)
|
Share-based compensation expense for expected vesting of stock awards and share purchase plan.
|
|
(4)
|
Represents the non-cash impact of net LIFO reserve adjustments.
|
|
(5)
|
Includes fees paid to debt holders, third party costs, the write off of certain pre-existing unamortized deferred financing costs related to the 2016 and 2013 debt refinancing transactions; early redemption premium and the write-off of unamortized issue premium related to the June 2016 debt refinancing; and the loss related to the September 2016 defeasance of our commercial mortgage backed securities (the “CMBS Fixed Facility”). See Note 12, Debt, in our consolidated financial statements for a further description of the 2016 debt transactions.
|
|
(6)
|
Consists of settlement charges resulting from lump-sum payments to retirees and former employees participating in several Company sponsored pension plans. See Note 18, Retirement Plans, in our consolidated financial statements for a further description of the 2017 pension settlement charges.
|
|
(7)
|
Consists primarily of costs related to significant process and systems redesign across multiple functions.
|
|
(8)
|
Consists of net fees received in connection with the termination of the Agreement and Plan of Merger dated December 8, 2013 with Sysco Corporation (“Sysco”), through which Sysco would have acquired US Foods (the “Formerly Proposed Sysco Acquisition”).
|
|
(9)
|
Consists of costs related to the Formerly Proposed Sysco Acquisition, including certain employee retention costs.
|
|
(10)
|
2018 primarily consists of acquisition related costs related to the announced acquisition of SGA Food Group Companies. Prior year amounts include gains, losses or charges as specified under the agreements governing our indebtedness.
|
|
(11)
|
Represents our income tax provision (benefit) adjusted for the tax effect of pre-tax items excluded from Adjusted net income and the removal of applicable discrete tax items. Applicable discrete tax items include changes in tax laws or rates, changes related to prior year unrecognized tax benefits, discrete changes in valuation allowances, excess tax benefits associated with share-based compensation, and the tax benefits recognized in continuing operations due to the existence of a gain in other comprehensive income and loss in continuing operations. The tax effect of pre-tax items excluded from Adjusted net income is computed using a statutory tax rate after taking into account the impact of permanent differences and valuation allowances. We released a valuation allowance against federal and certain state net deferred tax assets in fiscal year 2016. We were required to reflect the portion of the valuation allowance release related to 2016 ordinary income in the estimated annual effective tax rate and the portion of the valuation allowance release related to future years’ income discretely in fiscal year 2016. We maintained a valuation allowance against federal and state net deferred tax assets for fiscal years 2014 and 2015. The result was an immaterial tax effect related to pre-tax items excluded from Adjusted net income for fiscal years 2014 through 2016.
|
A reconciliation between the GAAP income tax provision (benefit) and the income tax provision, as adjusted, is as follows:
|
Fiscal Year
|
|||||||||||||||||||
|
2018
|
2017*
|
2016*
|
2015*
|
2014*
|
|||||||||||||||
|
(in millions)
|
|||||||||||||||||||
|
GAAP income tax provision (benefit)
|
$
|
89
|
|
$
|
(40
|
)
|
$
|
(79
|
)
|
$
|
25
|
|
$
|
36
|
|
||||
|
Tax impact of pre-tax income adjustments
|
22
|
|
39
|
|
—
|
|
—
|
|
—
|
|
|||||||||
|
Discrete tax items
|
35
|
|
199
|
|
80
|
|
12
|
|
3
|
|
|||||||||
|
Income tax provision, as adjusted
|
$
|
146
|
|
$
|
198
|
|
$
|
1
|
|
$
|
37
|
|
$
|
39
|
|
||||
(*) Prior year amounts may be rounded to conform with the current year presentation.
29
|
Item 7.
|
Management’s Discussion and Analysis of Financial Condition and Results of Operations
|
The following discussion and analysis is intended to help the reader understand the Company, our financial condition and results of operations and our present business environment. It should be read together with Item 6 of Part II, “Selected Financial Data,” and our consolidated financial statements and related notes contained elsewhere in this Annual Report. The following discussion and analysis contain certain financial measures that are not required by, or presented in accordance with, GAAP. We believe these non-GAAP measures provide meaningful supplemental information about our operating performance, because they exclude amounts that our management does not consider part of core operating results when assessing our performance and underlying trends. Information regarding reconciliations of and the rationale for these measures is discussed in “Non-GAAP Reconciliations” in Item 6 of Part II, “Selected Financial Data.”
Operating Metrics
Case growth
— Case growth, by customer type (e.g., independent restaurants) is reported as of a point in time. Customers periodically are reclassified, based on changes in size or other characteristics, and when those changes occur, the respective customer’s historical volume follows its new classification.
Organic growth
— Organic growth includes growth from operating business that has been reflected in our results of operations for at least 12 months.
Industry Trends
Within the foodservice distribution industry, there have recently been mixed sales results among different customer types having varying sizes and growth profiles and differing product and service requirements. Independent restaurants, a customer type of strategic focus for us, grew during 2018. We believe we have capitalized on innovative product offerings and our e-commerce and technology solutions to grow our mix with independent restaurants, and have made gains in this area. National chain restaurants experienced mild industry growth during 2018; however, we experienced declines with this customer type from strategically planned exits from certain national chain business.
Highlights
Our case volume in
2018
decreased
1.2%
. Strategically planned national chain customer exits were partially offset by organic independent restaurant case growth and growth due to acquisitions completed in 2017. Net sales increased slightly due to year over year inflation, as a significant portion of our business is based on markups over cost, and net sales from acquisitions offset the decline in case volume.
Gross profit increased
$88 million
, or
2.1%
, to
$4,306 million
in
2018
. As a percentage of net sales, gross profit was
17.8%
as compared to
17.5%
in 2017. This increase was primarily attributable to the impact of margin expansion initiatives and year over year LIFO inventory reserve adjustments.
Total operating expenses increased
$18 million
, or
0.5%
, to
$3,648 million
in
2018
, primarily as a result of acquisition related costs and higher payroll and related costs, which were partially offset by lower amortization expense.
Outlook
With favorable trends in consumer confidence and the unemployment rate, we expect positive growth in the U.S. foodservice distribution industry in
2019
. General economic trends and conditions, including demographic changes, inflation, deflation, consumer confidence, and disposable income, coupled with changing tastes and preferences, influence the amount that consumers spend on food-away-from-home, which can affect our customers and, in turn, our sales. On balance, we believe that these general trends will support positive real growth in food-away-from-home consumption and the growth of the U.S. foodservice distribution industry sales, particularly to our target customer types. We expect competitive pressures to remain high and a moderate amount of inflation in
2019
. Given that a large portion of our business is based on a contracted margin percentage or markups over cost, sudden inflation or prolonged deflation could negatively impact our sales and gross profit. We
30
expect sales to our independent restaurant customers, which generally have higher margins, to continue to be an increasing proportion of our sales mix. Favorable customer mix, additional volume from acquisitions and other sourcing initiatives should also continue to contribute to our ability to expand our margins. In July 2018, we announced that we agreed to acquire the SGA Food Group Companies for $1.8 billion in cash, the closing of which remains subject to receipt of required regulatory approvals and other customary conditions. Additionally, we believe our investments in a common technology platform, efficient transactional and operational model, e-commerce and analytic tools that support our team-based selling approach, coupled with product innovation, will enable us to continue to leverage our costs, maintain our sales, and differentiate us from our competitors.
Our strategy includes continued focus on executing our growth strategies, adding value for and differentiating ourselves with our customers, and driving continued operational improvement in the business.
31
Results of Operations
The following table presents selected consolidated results of operations of our business for the last three fiscal years:
|
Fiscal Year
|
|||||||||||
|
2018
|
2017*
|
2016*
|
|||||||||
|
(in millions)
|
|||||||||||
|
Consolidated Statements of Operations:
|
|||||||||||
|
Net sales
|
$
|
24,175
|
|
$
|
24,147
|
|
$
|
22,919
|
|
||
|
Cost of goods sold
|
19,869
|
|
19,929
|
|
18,866
|
|
|||||
|
Gross profit
|
4,306
|
|
4,218
|
|
4,053
|
|
|||||
|
Operating expenses:
|
|||||||||||
|
Distribution, selling and administrative costs
|
3,647
|
|
3,631
|
|
3,581
|
|
|||||
|
Restructuring charges (benefit) and tangible asset impairments
|
1
|
|
(1
|
)
|
53
|
|
|||||
|
Total operating expenses
|
3,648
|
|
3,630
|
|
3,634
|
|
|||||
|
Operating income
|
658
|
|
588
|
|
419
|
|
|||||
|
Other (income) expense—net
|
(13
|
)
|
14
|
|
5
|
|
|||||
|
Interest expense—net
|
175
|
|
170
|
|
229
|
|
|||||
|
Loss on extinguishment of debt
|
—
|
|
—
|
|
54
|
|
|||||
|
Income before income taxes
|
496
|
|
404
|
|
131
|
|
|||||
|
Income tax provision (benefit)
|
89
|
|
(40
|
)
|
(79
|
)
|
|||||
|
Net income
|
$
|
407
|
|
$
|
444
|
|
$
|
210
|
|
||
|
Percentage of Net Sales:
|
|||||||||||
|
Gross profit
|
17.8
|
%
|
17.5
|
%
|
17.7
|
%
|
|||||
|
Distribution, selling and administrative costs
|
15.1
|
%
|
15.0
|
%
|
15.6
|
%
|
|||||
|
Operating expense
|
15.1
|
%
|
15.0
|
%
|
15.9
|
%
|
|||||
|
Operating income
|
2.7
|
%
|
2.4
|
%
|
1.8
|
%
|
|||||
|
Net income
|
1.7
|
%
|
1.8
|
%
|
0.9
|
%
|
|||||
|
Adjusted EBITDA
(1)
|
4.6
|
%
|
4.4
|
%
|
4.2
|
%
|
|||||
|
Other Data:
|
|||||||||||
|
Cash flows—operating activities
|
$
|
609
|
|
$
|
749
|
|
$
|
549
|
|
||
|
Cash flows—investing activities
|
(232
|
)
|
(356
|
)
|
(762
|
)
|
|||||
|
Cash flows—financing activities
|
(391
|
)
|
(405
|
)
|
(180
|
)
|
|||||
|
Capital expenditures
|
235
|
|
221
|
|
164
|
|
|||||
|
EBITDA
(1)
|
1,011
|
|
952
|
|
782
|
|
|||||
|
Adjusted EBITDA
(1)
|
1,103
|
|
1,058
|
|
972
|
|
|||||
|
Adjusted net income
(1)
|
442
|
|
312
|
|
321
|
|
|||||
|
Free cash flow
(2)
|
374
|
|
528
|
|
385
|
|
|||||
|
(*)
|
Prior year amounts may be rounded to conform with the current year presentation.
|
|
(1)
|
EBITDA, Adjusted EBITDA, and Adjusted net income are non-GAAP measures used by management to measure operating performance. EBITDA is defined as net income (loss), plus interest expense—net, income tax provision (benefit), and depreciation and amortization. Adjusted EBITDA is defined as EBITDA adjusted for (1) Former Sponsor fees; (2) restructuring (benefit) charges and tangible asset impairments; (3) share-based compensation expense; (4) the non-cash impact of LIFO reserve adjustments; (5) loss on extinguishment of debt; (6) pension settlements; (7) business transformation costs; and (8) other gains, losses, or charges as specified in the agreements governing our indebtedness. Adjusted net income is defined as net income (loss) excluding the items used to calculate Adjusted EBITDA listed above and further adjusted for the tax effect of the exclusions and discrete tax items. EBITDA, Adjusted EBITDA, and Adjusted net income as presented in this Annual Report are supplemental measures of our performance that are not required by—or presented in accordance with—GAAP. They are not measurements of our performance under GAAP and should not be considered as alternatives to net income (loss) or any other performance measures derived in accordance with GAAP.
|
|
(2)
|
Free cash flow is a non-GAAP measure that is defined as cash flows provided by operating activities less capital expenditures. Free cash flow is used by management as a supplemental measure of our liquidity. We believe that free cash flow is a useful financial metric to assess our ability to pursue business opportunities and investments. Free cash flow is not a measure of our liquidity under GAAP and should not be considered as an alternative to cash flows provided by operating activities.
|
32
See additional information regarding the reconciliation of these measures in “Non-GAAP Reconciliations” in Item 6 of Part II, “Selected Financial Data.”
Fiscal Years Ended
December 29, 2018
and
December 30, 2017
Highlights
|
•
|
Total case volume decreased
1.2%
and independent restaurant case volume increased
3.8%
in
2018
.
|
|
•
|
Net sales of
$24,175 million
were slightly higher as compared to
2017
.
|
|
•
|
Operating income increased
$70 million
, or
11.9%
, to
$658 million
in
2018
. As a percentage of net sales, operating income increased to
2.7%
in
2018
, as compared to
2.4%
in
2017
.
|
|
•
|
Net income was
$407 million
in
2018
, as compared to
$444 million
in
2017
.
|
|
•
|
Adjusted EBITDA increased
$45 million
, or
4.3%
, to
$1,103 million
in
2018
. As a percentage of net sales, Adjusted EBITDA increased to
4.6%
in
2018
, as compared to
4.4%
in
2017
.
|
Net Sales
Total case volume decreased
1.2%
in
2018
. The decrease reflected select planned chain customer exits, which were partially offset by growth with independent restaurants. Organic case volume decreased
1.6%
in
2018
, reflecting similar customer trends.
Net sales of
$24,175 million
in
2018
were slightly higher as compared to the prior year. A
1.3%
, or $320 million, increase in the overall net sales rate per case, was partially offset by a
1.2%
, or $292 million, decrease in case volume. Acquisitions completed in 2017 increased net sales by approximately
$137 million
, or
0.4%
, in
2018
. Sales of private brands represented approximately
35%
and
34%
of total net sales in
2018
and
2017
, respectively.
The overall net sales rate per case increased
1.3%
compared to
2017
, which increase was mostly comprised of inflation. We experienced year over year inflation in the beef and grocery categories, which benefited net sales, as a significant portion of our business is based on markups over cost.
Gross Profit
Gross profit increased
$88 million
, or
2.1%
, to
$4,306 million
in
2018
. As a percentage of net sales, gross profit increased
0.3%
in
2018
, from
17.5%
in
2017
to
17.8%
in
2018
, primarily due to the favorable rate impact from margin expansion initiatives and year over year LIFO adjustments. Our LIFO method of inventory costing resulted in de minimis expense in
2018
compared to expense of
$14 million
in
2017
, which was driven by lower product inflation in certain categories in
2018
compared to
2017
.
Operating Expenses
Operating expenses, comprised of distribution, selling and administrative costs and restructuring charges (benefit), increased
$18 million
, or
0.5%
, to
$3,648 million
in
2018
. Operating expenses as a percentage of net sales were
15.1%
in
2018
, up from
15.0%
in
2017
. The increase includes $32 million of 2018 acquisition related costs, $17
million of additional depreciation expense related to recent property and equipment additions and $14
million of higher diesel fuel costs, which were partially offset by a reduction in amortization expense of $55
million, driven primarily by the completed amortization of the customer relationship intangible asset initially recognized in connection with the acquisition of the Company by the Former Sponsors in 2007.
Operating Income
Operating income increased
$70 million
, or
11.9%
, to
$658 million
in
2018
. Operating income as a percentage of net sales was
2.7%
in
2018
, up from
2.4%
in
2017
. The change was due to the relevant factors discussed above.
33
Other (Income) Expense-Net
Other (income) expense-net includes components of net periodic (credits) benefit costs, exclusive of the service cost component associated with our defined benefit and other postretirement plans. We recognized other income of
$13 million
in
2018
, primarily due to the improved funded status of our defined benefit and other postretirement retirement plans as of December 30, 2017. The
$14 million
of expense incurred in
2017
was primarily due to settlement charges resulting from a voluntary lump sum offer to former participants in our defined benefit pension plan.
Interest Expense—Net
Interest expense—net increased
$5 million
in
2018
, primarily due to the general increase in benchmark interest rates in
2018
compared to
2017
, and partially offset by lower debt levels in
2018
.
Income Taxes
On December 22, 2017, the U.S. federal government enacted the Tax Act. The Tax Act made broad and complex changes to the U.S. tax code, including, but not limited to, (1) a reduction of the U.S. federal corporate tax rate; and (2) bonus depreciation that permits full expensing of qualified property.
The Tax Act reduced the corporate tax rate to 21%,
which was
effective January 1, 2018.
Our effective tax rate for
2018
of
18%
varied from the
21%
federal statutory rate,
primarily as a result of state income taxes and the recognition of a tax benefit of
$21 million
. This tax benefit primarily related to (1) the reduction of an unrecognized tax benefit due to the receipt of an affirmative written consent from the IRS to change a method of accounting, (2) a tax benefit of
$6 million
, primarily related to excess tax benefits associated with share-based compensation and (3) a tax benefit of
$8 million
resulting from the adjustments to finalize provisional amounts recorded as of December 30, 2017 related to the reduction of the federal corporate tax rate.
The effective tax rate for
2017
of (10)% varied from the
35%
federal statutory rate, primarily from a tax benefit of
$173 million
related to the aforementioned reduction in the federal corporate tax rate, and a benefit of
$26 million
related to excess tax benefits associated with share-based compensation,
which were
partially offset by state income taxes.
See Note 21, Income Taxes, in our consolidated financial statements for a reconciliation of our effective tax rates to the statutory rate.
Net Income
Our net income was
$407 million
in
2018
, compared to
$444 million
in
2017
. The decrease in net income was due to the relevant factors discussed above.
Fiscal Years Ended
December 30, 2017
and
December 31, 2016
Highlights
|
•
|
Total case volume increased
2.9%
and independent restaurant case volume increased
5.2%
in
2017
.
|
|
•
|
Net sales increased
$1,228 million
, or
5.4%
, to
$24,147 million
in
2017
.
|
|
•
|
Operating income increased
$169 million
, or
40.3%
, to
$588 million
in
2017
. As a percentage of net sales, operating income increased to
2.4%
in
2017
, compared to
1.8%
in
2016
.
|
|
•
|
Net income was
$444 million
in
2017
, as compared to
$210 million
in
2016
.
|
|
•
|
Adjusted EBITDA increased
$86 million
, or
8.8%
, to
$1,058 million
in
2017
. As a percentage of net sales, Adjusted EBITDA increased
4.4%
in
2017
, compared to
4.2%
in
2016
.
|
Net Sales
Total case growth in
2017
was
2.9%
. The increase reflected growth with independent restaurants, healthcare, and hospitality, which was partially offset by declines in education. Organic case volume increased
1.7%
and reflected similar customer growth trends and some planned exits from national chains.
34
Net sales increased
$1,228 million
, or
5.4%
, to
$24,147 million
in
2017
, comprised of a 2.9%, or $675 million, increase in case volume and a 2.5%, or $553 million, increase in the overall net sales rate per case. Acquisitions increased net sales by approximately $387 million, or 1.6%, in
2017
. Sales of private brands represented approximately
34%
and
33%
of total net sales in
2017
and
2016
, respectively.
The overall net sales rate per case increase of
2.5%
in
2017
compared to
2016
, which was mostly attributable to inflation, as a significant portion of our business is based on markups over cost. We experienced year over year inflation in the grocery, poultry, seafood, pork, and fresh produce product categories, partially offset by deflation in beef.
Gross Profit
Gross profit increased
$165 million
, or
4.1%
, to
$4,218 million
in
2017
due to higher volume and margin expansion initiatives. As a percentage of net sales, gross profit decreased
0.2%
from
17.7%
in
2016
to
17.5%
in
2017
. Gross profit from acquisitions was offset by lower organic margins, including higher inbound freight costs, and the adverse impact of year over year LIFO adjustments. Our LIFO method of inventory costing resulted in
$14 million
of expense in 2017 compared to a benefit of
$18 million
in
2016
, which was driven by product inflation in
2017
compared to deflation in
2016
.
Distribution, Selling and Administrative Costs
Distribution, selling and administrative costs increased
$50 million
, or
1.4%
, to
$3,631 million
in
2017
. The increase includes $90 million from salaries and wages, which was primarily driven by wage inflation and volume, and $11 million due to the absence of a net insurance benefit in the prior year related to a facility tornado loss. The additional volume contributed to $11 million of additional repairs and maintenance inclusive of our vehicle fleet and additional insurance costs on the fleet portfolio. In
2017
, we also experienced $7 million of higher bad debt provisions, $5 million of additional IT costs, and approximately $11 million of other net costs that were not individually significant. These increases were partially offset by the absence of $36 million of costs incurred under a consulting and management agreement with the Former Sponsors in 2016, including a $31 million contract termination fee incurred concurrently with our initial public offering (“IPO”), and $46 million of lower depreciation and amortization in
2017
primarily driven by the completed amortization of the customer relationship intangible asset initially recognized upon acquisition of the Company by the Former Sponsors in 2007.
As a percentage of net sales, distribution, selling and administrative costs decreased
0.6%
to
15.0%
in
2017
, compared to
15.6%
in
2016
. This decrease was primarily attributable to the absence of the Former Sponsor termination fee and lower amortization discussed above. We also experienced improvement in the rate of distribution, selling and administrative costs as a percent of net sales due to net sales inflation experienced during
2017
.
Restructuring (Benefit) Charges and Tangible Asset Impairments
Restructuring charges decreased
$54 million
to a benefit of
$1 million
in
2017
. During
2017
, net costs of $2 million were recognized related to initiatives launched in 2016 to centralize certain field procurement and replenishment activities and reduce corporate and administrative costs.
These costs were offset by a $3
million gain on the sale of a distribution facility that closed in 2016.
During 2016, we incurred a net charge of $53 million associated with our plan to streamline our field operations model, the closure of a distribution facility, and certain other corporate and administrative cost reduction initiatives. Included in the charge was a benefit of $4 million related to a favorable settlement of substantially all of our multiemployer pension withdrawal liabilities related to previously closed facilities. Finally, we also incurred $3 million related to a lease termination settlement, which is included in the $53 million net charge.
Operating Expenses
Operating expenses, comprised of distribution, selling and administrative costs and restructuring (benefit) charges, decreased
$4 million
, or
0.1%
, to
$3,630 million
in
2017
. Operating expenses as a percentage of net sales were
15.0%
in
2017
, down from
15.9%
in
2016
. The change was due to the relevant factors discussed above.
35
Operating Income
Operating income increased
$169 million
, or
40.3%
, to
$588 million
in
2017
. Operating income as a percent of net sales was
2.4%
in
2017
, up from
1.8%
in
2016
. The change was due to the relevant factors discussed above.
Other (Income) Expense-Net
Other (income) expense-net includes components of net periodic (credits) benefit costs, exclusive of the service cost component associated with our defined benefit and other postretirement plans. We incurred
$14 million
and
$5 million
of net expense in
2017
and
2016
, respectively, primarily due to non-cash settlement charges resulting from lump sum payments to former participants in our defined benefit pension plan.
Interest Expense—Net
Interest expense—net decreased $59 million, primarily due to the reduction of substantial debt with the proceeds from our 2016 IPO and the defeasance and refinancing of certain other debt during 2016. For additional information, see Note 12, Debt, in our consolidated financial statements.
Loss on Extinguishment of Debt
As discussed in Note 12, Debt, in our consolidated financial statements, we incurred a
$54 million
loss on extinguishment of debt in 2016 related to the June 2016 debt redemption and refinancing and the CMBS Fixed Facility defeasance.
Income Taxes
On December 22, 2017, the U.S. federal government enacted the Tax Act. The Tax Act made broad and complex changes to the U.S. federal income tax code, including, but not limited to, (1) a reduction of the U.S. federal corporate income tax rate and (2) the full expensing of qualified property. The Tax Act reduced the U.S. federal corporate income tax rate to 21%, effective January 1, 2018.
Consequently, we have reduced our deferred tax liabilities by
$173 million
and recognized a deferred income tax benefit of
$173 million
for fiscal year 2017.
We released the previously recorded valuation allowance against our federal net deferred tax assets and certain of our state net deferred tax assets in 2016, as we determined it was more likely than not the deferred tax assets would be realized. We maintained a valuation allowance on certain state net operating loss and tax credit carryforwards expected to expire unutilized as a result of insufficient forecasted taxable income in the carryforward period or limited utilization. The decision to release the valuation allowance was made after management considered all available evidence, both positive and negative, including, but not limited to, historical operating results, cumulative income in recent years, forecasted earnings, and a reduction of uncertainty regarding forecasted earnings, as a result of developments in certain customer and strategic initiatives during 2016.
Our effective tax rate for
2017
of
(10.0)%
varied from the
35%
federal statutory rate, primarily
as a result of
a tax benefit of
$173 million
related to the aforementioned reduction in the U.S. federal corporate income tax rate, and a tax benefit of
$26 million
related to excess tax benefits associated with share-based compensation, which were partially offset by state income taxes. Our effective tax rate for
2016
of
(60)%
varied from the
35%
federal statutory rate primarily as a result of a change in the valuation allowance. During 2016, the valuation allowance decreased $128 million, primarily as a result of the year-to-date pre-tax income and the partial release of the valuation allowance.
See Note 21, Income Taxes, in our consolidated financial statements for a reconciliation of our effective tax rates to the statutory rate.
Net Income
Our net income was
$444 million
in
2017
, compared to
$210 million
in
2016
. The improvement in net income was due to the relevant factors discussed above.
36
Liquidity and Capital Resources
Our ongoing operations and strategic objectives require working capital and continuing capital investment. Our primary sources of liquidity include cash provided by operations, as well as access to capital from bank borrowings and other types of debt and financing arrangements.
Indebtedness
As of
December 29, 2018
, the aggregate carrying value of our indebtedness was
$3,457 million
, net of
$11 million
of unamortized deferred financing costs.
As of
December 29, 2018
, we had aggregate commitments for additional borrowings under our ABL Facility and our ABS Facility of
$1,372 million
, of which
$1,302 million
was available based on our borrowing base.
The ABL Facility provides for loans of up to $1,300 million, with its capacity limited by our borrowing base. As of
December 29, 2018
, we had outstanding borrowings of
$81 million
and had issued letters of credit totaling
$372 million
under the ABL Facility. There was available capacity on the ABL Facility of
$847 million
at
December 29, 2018
, based on our borrowing base.
The maximum capacity under the ABS Facility is $800 million, with its capacity limited by our borrowing base. Borrowings under the ABS Facility were
$275 million
at
December 29, 2018
. At our option, we can request additional ABS Facility borrowings up to the maximum commitment, provided sufficient eligible receivables are available as collateral. There was available capacity on the ABS Facility of
$455 million
at
December 29, 2018
, based on our borrowing base.
The Term Loan Facility had a carrying value of
$2,145 million
as of
December 29, 2018
, net of
$6 million
of unamortized deferred financing costs. On June 22, 2018, we amended the Term Loan Facility to lower the interest rate margins on outstanding borrowings, among other things.
During 2017, we entered into four-year interest rate swaps with a notional amount of $1.1
billion, reducing to $825
million in the fourth year. These swaps effectively converted approximately half of the principal amount of the Term Loan
Facility
from a variable to a fixed rate loan. We effectively pay an aggregate rate of
3.71%
on the notional amount covered by the interest rate swaps, comprised of a rate of 1.71% plus a spread of
2.00%
. For the remaining portion of the principal amount of the Term Loan
Facility
,
the interest rate is an alternative base rate (“ABR”) plus
1.00%
, or LIBOR plus
2.00%
, which we may periodically elect at our option.
As of
December 29, 2018
, our Senior Notes had a carrying value of
$595 million
, net of
$5 million
of unamortized deferred financing costs. The Senior Notes bear interest at 5.875% and mature on June 15, 2024. On or after June 15, 2019, the Senior Notes are redeemable, at our option, in whole or in part at a price of 102.938% of their remaining principal amount, plus accrued and unpaid interest, if any, to the redemption date. On or after June 15, 2020 and June 15, 2021, the optional redemption price for the Senior Notes declines to 101.469% and 100.0%, respectively, of their remaining principal amount, plus accrued and unpaid interest, if any, to the redemption date. Prior to June 15, 2019, up to 40% of the Senior Notes may be redeemed with the aggregate proceeds from certain equity offerings at a redemption premium of 105.875%.
As of
December 29, 2018
, we also had
$352 million
of obligations under capital leases for transportation equipment and building leases.
The
ABL Facility and
the ABS Facility mature in 2020.
The Term Loan Facility and the Senior Notes mature in 2023 and 2024, respectively, with scheduled principal payments of
$2.1 billion
and $600 million, respectively. As economic conditions permit, we will consider further opportunities to repurchase, refinance or otherwise reduce our debt obligations on favorable terms. Any further potential debt reduction or refinancing could require significant use of our other available liquidity and capital resources.
We believe that the combination of cash generated from operations, together with availability under the agreements governing our indebtedness and other financing arrangements, will be adequate to permit us to meet our debt service obligations, ongoing costs of operations, working capital needs, and capital expenditure requirements for the next 12 months.
Our credit facilities, loan agreements, and indentures contain customary covenants. These include, among other things, covenants that restrict USF’s ability to incur certain additional indebtedness, create or permit liens on assets,
37
pay dividends, or engage in mergers or consolidations. For additional information, see Item 1A of Part I, “Risk Factors-Risks Relating to Our Indebtedness.” As of
December 29, 2018
, USF had
$991 million
of restricted payment capacity under these covenants, and approximately
$2,238 million
of its net assets were restricted after taking into consideration the net deferred tax assets and intercompany balances that eliminate in consolidation.
Certain of our agreements governing our indebtedness also contain customary events of default. These include, without limitation, the failure to pay interest or principal when it is due under the agreements, cross default provisions, the failure of representations and warranties contained in the agreements to be true, and certain insolvency events. If an event of default occurs and remains uncured, the principal amounts outstanding, together with all unpaid interest and other amounts owed, may be declared immediately due and payable by the lenders. Were such an event to occur, we would be forced to seek new financing that may not be on as favorable terms as our current facilities. Our ability to refinance our indebtedness on favorable terms
, or at all,
is directly affected by the current economic and financial conditions. In addition, our ability to incur secured indebtedness (which may enable us to achieve more favorable terms than the incurrence of unsecured indebtedness) depends
in part on the value of our assets. This, in turn, is dependent
on the strength of our cash flows, results of operations, economic and market conditions and other factors. As of
December 29, 2018
, we were in compliance with all of our debt covenants.
Our future financial and operating performance, ability to service or refinance our debt, and ability to comply with covenants and restrictions contained in the agreements governing our indebtedness will be subject to: (1) future economic conditions, (2) the financial health of our customers and suppliers, and (3) financial, business, and other factors, many of which are beyond our control.
Every quarter, we review rating agency changes for all of the lenders that have a continuing obligation to provide us with funding. We are not aware of any facts that indicate our lenders will not be able to comply with the contractual terms of their agreements with us. We continue to monitor the credit markets generally and the strength of our lender counterparties.
From time to time, we repurchase or otherwise retire our debt and take other steps to reduce our debt or otherwise improve our leverage. These actions may include open market repurchases, negotiated repurchases, and other retirements of outstanding debt. The amount of debt that may be repurchased or otherwise retired, if any, will depend on market conditions, our debt trading levels, our cash position, and other considerations.
SGA Food Group Acquisition
On July 28, 2018, we entered into a Stock Purchase Agreement with SGA under which we agreed to acquire the SGA’s Food Group of Companies for
$1.8 billion
in cash. The closing of the contemplated transaction is subject to customary conditions, including the receipt of required regulatory approvals. To fund a substantial portion of the consideration, we also entered into a commitment letter under which the Committed Parties committed to provide USF with a
$1.5 billion
senior secured term loan facility.
Cash Flows
The following table presents condensed highlights from our Consolidated Statements of Cash Flows for fiscal years
2018
,
2017
and
2016
:
|
Fiscal Year
|
|||||||||||
|
2018
|
2017*
|
2016*
|
|||||||||
|
(in millions)
|
|||||||||||
|
Net income
|
$
|
407
|
|
$
|
444
|
|
$
|
210
|
|
||
|
Changes in operating assets and liabilities, net of business acquisitions
|
(235
|
)
|
7
|
|
(84
|
)
|
|||||
|
Other adjustments
|
437
|
|
298
|
|
423
|
|
|||||
|
Net cash provided by operating activities
|
609
|
|
749
|
|
549
|
|
|||||
|
Net cash used in investing activities
|
(232
|
)
|
(356
|
)
|
(762
|
)
|
|||||
|
Net cash used in financing activities
|
(391
|
)
|
(405
|
)
|
(180
|
)
|
|||||
|
Net decrease in cash, cash equivalents and restricted cash
|
(14
|
)
|
(12
|
)
|
(393
|
)
|
|||||
|
Cash, cash equivalents and restricted cash—beginning of year
|
119
|
|
131
|
|
524
|
|
|||||
|
Cash, cash equivalents and restricted cash—end of year
|
$
|
105
|
|
$
|
119
|
|
$
|
131
|
|
||
(*) Prior year amounts may be rounded to conform with the current year presentation.
38
Operating Activities
Cash flows provided by operating activities decreased
$140 million
to
$609 million
in
2018
. The year over year decrease was primarily driven by a $35 million incremental contribution to our defined benefit pension plan, higher income tax payments and other working capital changes in 2018.
Cash flows provided by operating activities increased
$200 million
to
$749 million
in
2017
. The year over year increase was primarily driven by an improvement in operating income and lower interest costs due to our
2016
debt redemption, defeasance, and refinancings.
Investing Activities
Cash flows used in investing activities in
2018
included investments of
$235 million
in property and equipment for fleet replacement, investments in information technology, and new construction and/or expansion of distribution facilities.
During
2017
, business acquisitions included three broadline distributors and two specialty distributors. Total consideration consisted of cash of
$182 million
. The
$221 million
of cash spending on property and equipment was up from the prior year primarily due to investments in information technology, investments in distribution facilities, including warehouse equipment, and the timing of payments for certain fleet assets acquired at the end of 2016. Cash flows used in investing activities in 2017 were partially offset by $25 million from property and equipment sales, primarily consisting of a distribution facility sale, and $22 million in proceeds from the redemption of a self-funded industrial revenue bond. See “Financing Activities” below, for discussion of the offsetting cash outflow.
During 2016, business acquisitions included two broadline distributors and two specialty distributors. Total net consideration consisted of cash of $122 million, plus $8 million for the estimated fair value of contingent consideration. We also purchased a noncontrolling interest valued at approximately $8 million in a technology company that provides point-of-sale business intelligence to restaurants and serves to support our sales initiatives. In 2016, approximately $164 million of purchases were made for property and equipment. Proceeds from sales of property and equipment included $12 million from sales of closed facilities. Cash flows used in investing activities in 2016 also included the purchase of $485 million of U.S. government securities that were subsequently used to defease our $472 million principal CMBS Fixed Facility.
Capital expenditures in
2018
,
2017
, and
2016
included fleet replacement and investments in information technology to improve our business, as well as new construction and/or expansion of distribution facilities. Additionally, we entered into
$101 million
,
$91 million
, and
$80 million
of capital lease obligations for fleet replacement in
2018
,
2017
, and
2016
, respectively.
We expect total capital additions in
2019
to be between
$335 million
and
$345 million
, inclusive of approximately
$75 million
in fleet capital leases. We expect to fund our capital expenditures with available cash or cash generated from operations.
Financing Activities
Cash flows used in financing activities of
$391 million
in
2018
included
$304 million
of net payments on our revolving credit facilities and $113 million of scheduled payments on non-revolving debt and capital leases. Financing activities in
2018
also included
$19 million
of proceeds from the exercise of employee stock options and
$19 million
of proceeds from share purchases under our employee stock purchase plan, partially offset by the remittance of
$6 million
of employee tax withholdings paid in connection with vested equity awards.
Cash flows used in financing activities of $405 million in 2017 included $15 million of net payments on our revolving credit facilities, repayment of a $22 million self-funded industrial revenue bond, see “Investing Activities” above, for discussion of the offsetting cash inflow, and $85 million of scheduled payments on non-revolving debt and capital leases. Financing activities in 2017 also included $18 million and $16 million of proceeds from the exercise of employee stock options and share purchases under our employee stock purchase plan, respectively. This cash inflow was partially offset by the remittance of $28 million of employee tax withholdings for vesting and net share-settled equity awards.
During 2017, we completed four secondary offerings of our common stock held primarily by investment funds associated with or designated by the
Former
Sponsors. We did not receive any proceeds from the offerings. The December 4, 2017 offering also included our repurchase of 10,000,000 shares of our common stock
from the
39
underwriter
for $280
million, utilizing borrowings from our revolving credit facilities.
The shares of our common stock that were repurchased by the Company were retired, as the Company does not maintain treasury shares.
Cash flows used in financing activities of $180 million in 2016 included net proceeds from our IPO of $1,114 million and net proceeds from debt issuances and refinancing transactions. We used the proceeds from these transactions to redeem the $1,348 million in principal of our 8.5% Senior Notes due June 30, 2019 (the “Old Senior Notes”), plus an early redemption premium of $29 million, and to purchase the U.S. government securities that were subsequently used to defease our CMBS Fixed Facility. In addition to the early redemption premium, we incurred approximately $26 million of other debt financing costs and fees in connection with the debt refinancing transactions and defeasance. Prior to the IPO, we paid a $666 million one-time special cash distribution to our shareholders, of which $657 million was paid to the Former Sponsors. We funded the distribution through a $75 million borrowing under the ABS Facility, a $239 million borrowing under the ABL Facility and $352 million in available cash.
Retirement Plans
We have a qualified retirement plan and a nonqualified retirement plan that pay benefits to certain employees at retirement, generally using formulas based on a participant’s years of qualified service and eligible compensation. In addition, we maintain several postretirement health and welfare plans that provide benefits for eligible retirees and their dependents. We contributed
$71 million
to our defined benefit and other postretirement plans in
2018
, of which
$35 million
represented an additional, voluntary contribution to the defined benefit plan.
Certain employees are eligible to participate in our 401(k) savings plan. This plan provides that, under certain circumstances and subject to applicable IRS limits, we may match participant contributions of up to 100% of the first 3% of a participant’s eligible compensation and 50% of the next 2% of a participant’s eligible compensation, for a maximum employer matching contribution of 4%. We made employer matching contributions to the 401(k) plan of
$47 million
,
$46 million
, and
$44 million
in
2018
,
2017
, and
2016
, respectively.
We also contribute to various multiemployer benefit plans under certain CBAs. Our contributions to these plans were
$35 million
,
$34 million
, and
$33 million
in
2018
,
2017
, and
2016
, respectively.
Contractual Obligations
The following table includes information about our significant contractual obligations as of
December 29, 2018
that affect our liquidity and capital needs. The table includes information about payments due under specified contractual obligations and the maturity profile of our consolidated debt, operating leases and other long-term liabilities.
|
Payments Due by Period
|
|||||||||||||||||||
|
Less Than
|
More Than
|
||||||||||||||||||
|
Total
|
1 Year
|
1-3 Years
|
3-5 Years
|
5 Years
|
|||||||||||||||
|
Recorded Contractual Obligations:
|
|||||||||||||||||||
|
Debt, including capital lease
obligations
|
$
|
3,468
|
|
$
|
106
|
|
$
|
542
|
|
$
|
2,175
|
|
$
|
645
|
|
||||
|
Financing lease obligation
(1)
|
20
|
|
3
|
|
8
|
|
9
|
|
—
|
|
|||||||||
|
Self-insured liabilities
(2)
|
169
|
|
40
|
|
41
|
|
22
|
|
66
|
|
|||||||||
|
Pension plans and other postretirement benefits
contributions
(3)
|
8
|
|
1
|
|
2
|
|
2
|
|
3
|
|
|||||||||
|
Unrecorded Contractual Obligations:
|
|||||||||||||||||||
|
Interest payments on debt
(4)
|
691
|
|
159
|
|
288
|
|
227
|
|
17
|
|
|||||||||
|
Operating leases
|
132
|
|
31
|
|
54
|
|
40
|
|
7
|
|
|||||||||
|
Multiemployer contractual minimum pension
contributions
(5)
|
18
|
|
4
|
|
7
|
|
7
|
|
—
|
|
|||||||||
|
Purchase obligations
(6)
|
826
|
|
777
|
|
40
|
|
9
|
|
—
|
|
|||||||||
|
Total contractual cash obligations
|
$
|
5,332
|
|
$
|
1,121
|
|
$
|
982
|
|
$
|
2,491
|
|
$
|
738
|
|
||||
40
|
(1)
|
Represents installment payments on a real estate lease obligation through 2023.
|
|
(2)
|
Represents the estimated undiscounted payments on our self-insurance programs for general, fleet and workers compensation liabilities. Actual payments may differ from these estimates.
|
|
(3)
|
Represents estimated contributions and benefit payments for Company sponsored pension and other postretirement benefit plans. Estimates beyond
2019
are not available for the Company's defined benefit pension plan.
|
|
(4)
|
Represents future interest payments on fixed rate debt, capital leases, a financing lease obligation, and
$1.4 billion
of variable rate debt at interest rates as of
December 29, 2018
. The amounts shown in the table include interest payments under interest rate swap agreements.
|
|
(5)
|
Represents minimum contributions to the Central States Teamsters Southeast and Southwest Area Pension Fund through 2023.
|
|
(6)
|
Represents purchase obligations for purchases of product in the normal course of business, for which all significant terms have been confirmed, information technology commitments and forward fuel and electricity purchase obligations. The balance does not include
2019
capital additions expected to be between
$335 million
to
$345 million
, inclusive of approximately
$75 million
in fleet capital leases. See "Investing Activities" above.
|
Other long-term liabilities at
December 29, 2018
as disclosed in Note 13, Accrued Expenses and Other Long-Term Liabilities, in our consolidated financial statements, consist primarily of an uncertain tax position liability of
$31 million
, inclusive of interest and penalties, for which the timing of payment is uncertain, and a
$8 million
non-cash fair value adjustment recorded in purchase accounting for off-market operating leases, each of which has been excluded from the table above.
Off-Balance Sheet Arrangements
As of
December 29, 2018
, we entered into
$298 million
of letters of credit in favor of certain commercial insurers securing our obligations with respect to our self-insurance programs. Additionally, we entered into
$73 million
of letters of credit to secure our obligations with respect to certain real estate leases, and
$1 million
of letters of credit for other obligations.
Except as disclosed above, we have no off-balance sheet arrangements that currently have or are reasonably likely to have a material effect on our consolidated financial condition, changes in financial condition, results of operations, liquidity, capital expenditures or capital resources.
Critical Accounting Policies and Estimates
Except as otherwise set forth, we have prepared the financial information in this Annual Report in accordance with GAAP. Preparing these consolidated financial statements requires us to make estimates and assumptions that affect the reported amounts of assets and liabilities, the disclosure of contingent assets and liabilities at the date of the financial statements, and the reported amounts of revenues and expenses during these reporting periods. We base our estimates and judgments on historical experience and other factors we believe are reasonable under the circumstances. These assumptions form the basis for making judgments about the carrying value of assets and liabilities that are not readily apparent from other sources. Our most critical accounting policies and estimates pertain to the valuation of goodwill and other intangible assets, vendor consideration and income taxes.
Valuation of Goodwill and Other Intangible Assets
Goodwill and other intangible assets include the cost of the acquired business in excess of the fair value of the tangible net assets recorded in connection with each acquisition. Other intangible assets include customer relationships, non-compete agreements, the brand names comprising our portfolio of private brands, and trademarks. We assess goodwill and other intangible assets with indefinite lives for impairment each year, or more frequently if events or changes in circumstances indicate an asset may be impaired. For goodwill and indefinite-lived intangible assets, our policy is to assess for impairment at the beginning of each fiscal third quarter. For other intangible assets with definite lives, we assess for impairment only if events occur that indicate that the carrying amount of an asset may not be recoverable.
For goodwill, the reporting unit used in assessing impairment is the Company’s one business segment as described in Note 25, Business Information, in our consolidated financial statements.
Our
2018
assessment for impairment of
41
goodwill was performed
using a qualitative approach to determine whether it is more likely than not that the fair value of goodwill is less than its carrying value. In performing the qualitative assessment, we identified and considered the significance of relevant key factors, events, and circumstances that affect the fair value of its goodwill. These factors include external factors such as macroeconomic, industry, and market conditions, as well as entity-specific factors, such as actual and planned financial performance. Based on our qualitative fiscal year
2018
annual impairment analysis for goodwill, we concluded that it is more likely than not that the fair value of goodwill exceeded its carrying value.
Our fair value estimates of the brand name and trademark indefinite-lived intangible assets are based on a relief from royalty method. The fair value of each intangible asset is determined for comparison to the corresponding carrying value. If the carrying value of the asset exceeds its fair value, an impairment loss is recognized in an amount equal to the excess.
The fair value of our trademark indefinite-lived intangible asset and brand name indefinite-lived intangible asset exceeded their respective carrying values by substantial margins. These margins would not be materially impacted by a 50 basis point increase in the discount rate. The recoverability of our indefinite-lived intangible assets could be impacted if estimated future cash flows are not achieved.
Due to the many variables inherent in estimating fair value and the relative size of the goodwill and indefinite-lived intangible assets, differences in assumptions could have a material effect on the results of the Company’s impairment analysis in future periods.
Vendor Consideration
We participate in various rebate and promotional incentives with our suppliers, primarily through purchase-based programs. Consideration under these incentives is estimated during the year based on purchasing activity, as our obligations under the programs are fulfilled primarily when products are purchased. Consideration is typically received in the form of invoice deductions, or less often in the form of cash payments. Changes in the estimated amount of incentives earned are treated as changes in estimates and are recognized in the period of change. Historically, adjustments to our estimates for vendor consideration or related allowances have not been significant.
Income Taxes
We account for income taxes under the asset and liability method, which requires the recognition of deferred tax assets and liabilities for the expected future tax consequences of events that have been included in the consolidated financial statements. Under this method, deferred tax assets and liabilities are determined based on the differences between the consolidated financial statements and tax basis of assets and liabilities using enacted tax rates in effect for the year in which the differences are expected to reverse. The effect of a change in tax rates on deferred tax assets and liabilities is recognized in income in the period that includes the enactment date. We record net deferred tax assets to the extent we believe these assets will more likely than not be realized.
An uncertain tax position is recognized when it is more likely than not that the position will be sustained upon examination, including resolutions of any related appeals or litigation processes, based on the technical merits. Uncertain tax positions are recorded at the largest amount that is more likely than not to be sustained. We adjust the amounts recorded for uncertain tax positions when our judgment changes as a result of the evaluation of new information not previously available. These differences are reflected as increases or decreases to income tax expense in the period in which they are determined.
At this time, we believe it is reasonably possible that the liability for unrecognized tax benefits will decrease by approximately
$1 million
in the next 12 months as a result of the completion of tax audits or the expiration of the statute of limitations.
Recent Accounting Pronouncements
For a discussion of recent accounting pronouncements, refer to Note 3, Recent Accounting Pronouncements, in our consolidated financial statements.
42
|
Item 7A.
|
Quantitative and Qualitative Disclosures about Market Risk
|
We are exposed to certain risks arising from both our business operations and overall economic conditions. We principally manage our exposures to a wide variety of business and operational risks through managing our core business activities. We manage economic risks, including interest rate, liquidity, and credit risk, primarily by managing the amount, sources, and duration of our debt funding. During 2017, we entered into derivative financial instruments to assist in managing our exposure to variable interest rate terms on certain
borrowings.
We do not enter into derivatives or other financial instruments for trading or speculative purposes.
Interest Rate Risk
Market risk is the possibility of loss from adverse changes in market rates and prices, such as interest rates and commodity prices. As of
December 29, 2018
, after considering interest rate swaps that fixed the interest rate on
$1.1 billion
of principal of our variable rate Term Loan
Facility
, approximately
41%
of the principal amount of our debt bore interest at floating rates based on LIBOR or ABR, as defined in our credit agreements. A 1%
change in the applicable rate would cause the interest expense on our floating rate debt to change by approximately
$14 million
per year (see Note 12, Debt, in our consolidated financial statements).
Fuel Price Risk
We are also exposed to risk due to fluctuations in the price and availability of diesel fuel. Increases in the cost of diesel fuel can negatively affect consumer spending, raise the prices we pay for products, and increase the costs we incur to deliver products to our customers. To minimize fuel cost risk, we enter into forward purchase commitments for a portion of our projected diesel fuel requirements. As of
December 29, 2018
, we had diesel fuel forward purchase commitments totaling
$100 million
through June 2020. These lock in approximately
50%
of our projected diesel fuel purchase needs for the contracted periods. Our remaining fuel purchase needs will occur at market rates. Using published market price projections for diesel and estimated fuel consumption needs, a 10% unfavorable change in diesel prices from the projected market prices could result in approximately
$11 million
in additional fuel cost on such uncommitted volumes.
43
|
Item 8.
|
Financial Statements and Supplementary Data
|
INDEX TO CONSOLIDATED FINANCIAL STATEMENTS
|
Page No.
|
||
|
Audited Consolidated Financial Statements
|
||
44
REPORT OF INDEPENDENT REGISTERED PUBLIC ACCOUNTING FIRM
To the Shareholders and the Board of Directors of US Foods Holding Corp.
Opinion on the Financial Statements
We have audited the accompanying consolidated balance sheets of US Foods Holding Corp. and subsidiaries (the "Company") as of December 29, 2018 and December 30, 2017, the related consolidated statements of comprehensive income, shareholders' equity, and cash flows, for each of the three fiscal years in the period ended December 29, 2018 and the related notes (collectively referred to as the "financial statements"). In our opinion, the financial statements present fairly, in all material respects, the financial position of the Company as of December 29, 2018 and December 30, 2017, and the results of its operations and its cash flows for each of the three fiscal years in the period ended December 29, 2018, in conformity with accounting principles generally accepted in the United States of America.
We have also audited, in accordance with the standards of the Public Company Accounting Oversight Board (United States) (PCAOB), the Company's internal control over financial reporting as of December 29, 2018, based on criteria established in
Internal Control — Integrated Framework (2013)
issued by the Committee of Sponsoring Organizations of the Treadway Commission and our report dated February 14, 2019, expressed an unqualified opinion on the Company's internal control over financial reporting.
Basis for Opinion
These financial statements are the responsibility of the Company's management. Our responsibility is to express an opinion on the Company's financial statements based on our audits. We are a public accounting firm registered with the PCAOB and are required to be independent with respect to the Company in accordance with the U.S. federal securities laws and the applicable rules and regulations of the Securities and Exchange Commission and the PCAOB.
We conducted our audits in accordance with the standards of the PCAOB. Those standards require that we plan and perform the audit to obtain reasonable assurance about whether the financial statements are free of material misstatement, whether due to error or fraud. Our audits included performing procedures to assess the risks of material misstatement of the financial statements, whether due to error or fraud, and performing procedures that respond to those risks. Such procedures included examining, on a test basis, evidence regarding the amounts and disclosures in the financial statements. Our audits also included evaluating the accounting principles used and significant estimates made by management, as well as evaluating the overall presentation of the financial statements. We believe that our audits provide a reasonable basis for our opinion.
/s/ DELOITTE & TOUCHE LLP
Chicago, Illinois
February 14, 2019
We have served as the Company's auditor since 2006.
45
|
US FOODS HOLDING CORP.
|
|||||||
|
CONSOLIDATED BALANCE SHEETS
|
|||||||
|
(In millions, except par value)*
|
|||||||
|
December 29, 2018
|
December 30, 2017
|
||||||
|
ASSETS
|
|||||||
|
CURRENT ASSETS:
|
|||||||
|
Cash and cash equivalents
|
$
|
104
|
|
$
|
119
|
|
|
|
Accounts receivable, less allowances of $29 and $26
|
1,347
|
|
1,302
|
|
|||
|
Vendor receivables, less allowances of $3
|
106
|
|
97
|
|
|||
|
Inventories—net
|
1,279
|
|
1,208
|
|
|||
|
Prepaid expenses
|
106
|
|
80
|
|
|||
|
Assets held for sale
|
7
|
|
5
|
|
|||
|
Other current assets
|
30
|
|
8
|
|
|||
|
Total current assets
|
2,979
|
|
2,819
|
|
|||
|
PROPERTY AND EQUIPMENT—Net
|
1,842
|
|
1,801
|
|
|||
|
GOODWILL
|
3,967
|
|
3,967
|
|
|||
|
OTHER INTANGIBLES—Net
|
324
|
|
364
|
|
|||
|
DEFERRED TAX ASSETS
|
7
|
|
21
|
|
|||
|
OTHER ASSETS
|
67
|
|
65
|
|
|||
|
TOTAL ASSETS
|
$
|
9,186
|
|
$
|
9,037
|
|
|
|
LIABILITIES AND EQUITY
|
|||||||
|
CURRENT LIABILITIES:
|
|||||||
|
Cash overdraft liability
|
$
|
157
|
|
$
|
154
|
|
|
|
Accounts payable
|
1,359
|
|
1,289
|
|
|||
|
Accrued expenses and other current liabilities
|
454
|
|
451
|
|
|||
|
Current portion of long-term debt
|
106
|
|
109
|
|
|||
|
Total current liabilities
|
2,076
|
|
2,003
|
|
|||
|
LONG-TERM DEBT
|
3,351
|
|
3,648
|
|
|||
|
DEFERRED TAX LIABILITIES
|
298
|
|
263
|
|
|||
|
OTHER LONG-TERM LIABILITIES
|
232
|
|
372
|
|
|||
|
Total liabilities
|
5,957
|
|
6,286
|
|
|||
|
COMMITMENTS AND CONTINGENCIES (Note 22)
|
|
|
|||||
|
SHAREHOLDERS’ EQUITY:
|
|||||||
|
Common stock, $0.01 par value—600 shares authorized;
217 and 215 issued and outstanding as of
December 29, 2018 and December 30, 2017, respectively
|
2
|
|
2
|
|
|||
|
Additional paid-in capital
|
2,780
|
|
2,720
|
|
|||
|
Retained earnings
|
531
|
|
124
|
|
|||
|
Accumulated other comprehensive loss
|
(84
|
)
|
(95
|
)
|
|||
|
Total shareholders’ equity
|
3,229
|
|
2,751
|
|
|||
|
TOTAL LIABILITIES AND EQUITY
|
$
|
9,186
|
|
$
|
9,037
|
|
|
(*) Prior year amounts may be rounded to conform with the current year presentation.
See Notes to Consolidated Financial Statements.
46
|
US FOODS HOLDING CORP.
|
|||||||||||
|
CONSOLIDATED STATEMENTS OF COMPREHENSIVE INCOME
|
|||||||||||
|
(In millions, except share and per share data)*
|
|||||||||||
|
Fiscal Years Ended
|
|||||||||||
|
December 29, 2018
|
December 30, 2017
|
December 31, 2016
|
|||||||||
|
NET SALES
|
$
|
24,175
|
|
$
|
24,147
|
|
$
|
22,919
|
|
||
|
COST OF GOODS SOLD
|
19,869
|
|
19,929
|
|
18,866
|
|
|||||
|
Gross profit
|
4,306
|
|
4,218
|
|
4,053
|
|
|||||
|
OPERATING EXPENSES:
|
|||||||||||
|
Distribution, selling and administrative costs
|
3,647
|
|
3,631
|
|
3,581
|
|
|||||
|
Restructuring charges (benefit)
|
1
|
|
(1
|
)
|
53
|
|
|||||
|
Total operating expenses
|
3,648
|
|
3,630
|
|
3,634
|
|
|||||
|
OPERATING INCOME
|
658
|
|
588
|
|
419
|
|
|||||
|
OTHER (INCOME) EXPENSE—Net
|
(13
|
)
|
14
|
|
5
|
|
|||||
|
INTEREST EXPENSE—Net
|
175
|
|
170
|
|
229
|
|
|||||
|
LOSS ON EXTINGUISHMENT OF DEBT
|
—
|
|
—
|
|
54
|
|
|||||
|
Income before income taxes
|
496
|
|
404
|
|
131
|
|
|||||
|
INCOME TAX PROVISION (BENEFIT)
|
89
|
|
(40
|
)
|
(79
|
)
|
|||||
|
NET INCOME
|
407
|
|
444
|
|
210
|
|
|||||
|
OTHER COMPREHENSIVE INCOME (LOSS)—Net of tax:
|
|||||||||||
|
Changes in retirement benefit obligations
|
6
|
|
16
|
|
(45
|
)
|
|||||
|
Unrecognized gain on interest rate swaps
|
5
|
|
8
|
|
—
|
|
|||||
|
COMPREHENSIVE INCOME
|
$
|
418
|
|
$
|
468
|
|
$
|
165
|
|
||
|
EARNINGS PER SHARE
|
|||||||||||
|
Basic
|
$
|
1.88
|
|
$
|
2.00
|
|
$
|
1.05
|
|
||
|
Diluted
|
$
|
1.87
|
|
$
|
1.97
|
|
$
|
1.03
|
|
||
|
WEIGHTED AVERAGE COMMON SHARES OUTSTANDING
|
|||||||||||
|
Basic
|
216,112,021
|
|
222,383,038
|
|
200,129,868
|
|
|||||
|
Diluted
|
217,825,545
|
|
225,663,785
|
|
204,024,726
|
|
|||||
(*) Prior year amounts may be rounded to conform with the current year presentation.
See Notes to Consolidated Financial Statements.
47
|
US FOODS HOLDING CORP.
|
||||||||||||||||||||||
|
CONSOLIDATED STATEMENTS OF SHAREHOLDERS’ EQUITY
|
||||||||||||||||||||||
|
(In millions)*
|
||||||||||||||||||||||
|
Number of
Common
Shares
|
Common
Shares at
Par Value
|
Additional
Paid-In
Capital
|
Accumulated
Earnings
(Deficit)
|
Accumulated Other
Comprehensive Loss
|
Total
Shareholders'
Equity
|
|||||||||||||||||
|
BALANCE-January 2, 2016
|
167
|
|
$
|
1
|
|
$
|
2,292
|
|
$
|
(346
|
)
|
$
|
(74
|
)
|
$
|
1,873
|
|
|||||
|
Settlements/reclassifications of redeemable common stock
|
3
|
|
—
|
|
43
|
|
—
|
|
—
|
|
43
|
|
||||||||||
|
Share-based compensation expense
|
—
|
|
—
|
|
15
|
|
—
|
|
—
|
|
15
|
|
||||||||||
|
Net proceeds from initial public offering
|
51
|
|
1
|
|
1,113
|
|
—
|
|
—
|
|
1,114
|
|
||||||||||
|
Cash distribution to shareholders ($3.94 per share - Note 15)
|
—
|
|
—
|
|
(666
|
)
|
—
|
|
—
|
|
(666
|
)
|
||||||||||
|
Proceeds from employee share purchase plan
|
—
|
|
—
|
|
3
|
|
—
|
|
—
|
|
3
|
|
||||||||||
|
Common stock and share-based awards settled
|
—
|
|
—
|
|
(9
|
)
|
—
|
|
—
|
|
(9
|
)
|
||||||||||
|
Changes in retirement benefit obligations, net of income tax
|
—
|
|
—
|
|
—
|
|
—
|
|
(45
|
)
|
(45
|
)
|
||||||||||
|
Net income
|
—
|
|
—
|
|
—
|
|
210
|
|
—
|
|
210
|
|
||||||||||
|
BALANCE-December 31, 2016
|
221
|
|
$
|
2
|
|
$
|
2,791
|
|
$
|
(136
|
)
|
$
|
(119
|
)
|
$
|
2,538
|
|
|||||
|
Share-based compensation expense
|
—
|
|
—
|
|
19
|
|
—
|
|
—
|
|
19
|
|
||||||||||
|
Proceeds from employee share purchase plan
|
1
|
|
—
|
|
16
|
|
—
|
|
—
|
|
16
|
|
||||||||||
|
Exercise of stock options
|
2
|
|
—
|
|
18
|
|
—
|
|
—
|
|
18
|
|
||||||||||
|
Net share-settled stock options
|
1
|
|
—
|
|
—
|
|
—
|
|
—
|
|
—
|
|
||||||||||
|
Tax withholding payments for
net share-settled equity awards
|
—
|
|
—
|
|
(28
|
)
|
—
|
|
—
|
|
(28
|
)
|
||||||||||
|
Common stock repurchased
|
(10
|
)
|
—
|
|
(96
|
)
|
(184
|
)
|
—
|
|
(280
|
)
|
||||||||||
|
Changes in retirement benefit obligations, net of income tax
|
—
|
|
—
|
|
—
|
|
—
|
|
16
|
|
16
|
|
||||||||||
|
Unrecognized gain on interest rate swaps, net of income tax
|
—
|
|
—
|
|
—
|
|
—
|
|
8
|
|
8
|
|
||||||||||
|
Net income
|
—
|
|
—
|
|
—
|
|
444
|
|
—
|
|
444
|
|
||||||||||
|
BALANCE-December 30, 2017
|
215
|
|
$
|
2
|
|
$
|
2,720
|
|
$
|
124
|
|
$
|
(95
|
)
|
$
|
2,751
|
|
|||||
|
Share-based compensation expense
|
—
|
|
—
|
|
28
|
|
—
|
|
—
|
|
28
|
|
||||||||||
|
Proceeds from employee share purchase plan
|
1
|
|
—
|
|
19
|
|
—
|
|
—
|
|
19
|
|
||||||||||
|
Exercise of stock options
|
1
|
|
—
|
|
19
|
|
—
|
|
—
|
|
19
|
|
||||||||||
|
Tax withholding payments for
net share-settled equity awards
|
—
|
|
—
|
|
(6
|
)
|
—
|
|
—
|
|
(6
|
)
|
||||||||||
|
Changes in retirement benefit obligations, net of income tax
|
—
|
|
—
|
|
—
|
|
—
|
|
6
|
|
6
|
|
||||||||||
|
Unrecognized gain on interest rate swaps, net of income tax
|
—
|
|
—
|
|
—
|
|
—
|
|
5
|
|
5
|
|
||||||||||
|
Net income
|
—
|
|
—
|
|
—
|
|
407
|
|
—
|
|
407
|
|
||||||||||
|
BALANCE-December 29, 2018
|
217
|
|
$
|
2
|
|
$
|
2,780
|
|
$
|
531
|
|
$
|
(84
|
)
|
$
|
3,229
|
|
|||||
(*) Prior year amounts may be rounded to conform with the current year presentation.
See Notes to Consolidated Financial Statements.
48
|
US FOODS HOLDING CORP.
|
|||||||||||
|
CONSOLIDATED STATEMENTS OF CASH FLOWS
|
|||||||||||
|
(In millions)*
|
|||||||||||
|
Fiscal Years Ended
|
|||||||||||
|
December 29, 2018
|
December 30, 2017
|
December 31, 2016
|
|||||||||
|
CASH FLOWS FROM OPERATING ACTIVITIES:
|
|||||||||||
|
Net income
|
$
|
407
|
|
$
|
444
|
|
$
|
210
|
|
||
|
Adjustments to reconcile net income to net cash provided by operating activities:
|
|||||||||||
|
Depreciation and amortization
|
340
|
|
378
|
|
421
|
|
|||||
|
Gain on disposal of property and equipment, net
|
(1
|
)
|
(4
|
)
|
(6
|
)
|
|||||
|
Tangible asset impairment charges
|
1
|
|
2
|
|
—
|
|
|||||
|
Loss on extinguishment of debt
|
—
|
|
—
|
|
54
|
|
|||||
|
Amortization of deferred financing costs
|
7
|
|
6
|
|
7
|
|
|||||
|
Amortization of Senior Notes original issue premium
|
—
|
|
—
|
|
(2
|
)
|
|||||
|
Insurance proceeds related to operating activities
|
—
|
|
—
|
|
10
|
|
|||||
|
Insurance benefit in net income
|
—
|
|
—
|
|
(10
|
)
|
|||||
|
Deferred tax provision (benefit)
|
45
|
|
(123
|
)
|
(80
|
)
|
|||||
|
Share-based compensation expense
|
28
|
|
21
|
|
18
|
|
|||||
|
Provision for doubtful accounts
|
17
|
|
18
|
|
11
|
|
|||||
|
Changes in operating assets and liabilities, net of business acquisitions:
|
|||||||||||
|
(Increase) decrease in receivables
|
(71
|
)
|
(67
|
)
|
22
|
|
|||||
|
(Increase) decrease in inventories
|
(72
|
)
|
40
|
|
(101
|
)
|
|||||
|
Increase in prepaid expenses and other assets
|
(45
|
)
|
(24
|
)
|
—
|
|
|||||
|
Increase in accounts payable and cash overdraft liability
|
79
|
|
17
|
|
131
|
|
|||||
|
(Decrease) increase in accrued expenses and other liabilities
|
(126
|
)
|
41
|
|
(136
|
)
|
|||||
|
Net cash provided by operating activities
|
609
|
|
749
|
|
549
|
|
|||||
|
CASH FLOWS FROM INVESTING ACTIVITIES:
|
|||||||||||
|
Acquisition of businesses—net of cash
|
—
|
|
(182
|
)
|
(122
|
)
|
|||||
|
Proceeds from sales of property and equipment
|
3
|
|
25
|
|
17
|
|
|||||
|
Purchases of property and equipment
|
(235
|
)
|
(221
|
)
|
(164
|
)
|
|||||
|
Investments in marketable securities and other
|
—
|
|
—
|
|
(493
|
)
|
|||||
|
Proceeds from redemption of industrial revenue bonds
|
—
|
|
22
|
|
—
|
|
|||||
|
Net cash used in investing activities
|
(232
|
)
|
(356
|
)
|
(762
|
)
|
|||||
|
CASH FLOWS FROM FINANCING ACTIVITIES:
|
|||||||||||
|
Proceeds from debt borrowings
|
4,178
|
|
2,550
|
|
2,707
|
|
|||||
|
Proceeds from debt refinancing
|
—
|
|
—
|
|
2,214
|
|
|||||
|
Principal payments on debt and capital leases
|
(4,595
|
)
|
(2,651
|
)
|
(4,141
|
)
|
|||||
|
Repayment of industrial revenue bonds
|
—
|
|
(22
|
)
|
—
|
|
|||||
|
Redemption of Old Senior Notes
|
—
|
|
—
|
|
(1,377
|
)
|
|||||
|
Payment for debt financing costs and fees
|
(1
|
)
|
(1
|
)
|
(26
|
)
|
|||||
|
Net proceeds from initial public offering
|
—
|
|
—
|
|
1,114
|
|
|||||
|
Cash distribution to shareholders
|
—
|
|
—
|
|
(666
|
)
|
|||||
|
Contingent consideration paid for business acquisitions
|
(5
|
)
|
(6
|
)
|
—
|
|
|||||
|
Proceeds from employee share purchase plan
|
19
|
|
16
|
|
3
|
|
|||||
|
Proceeds from exercise of stock options
|
19
|
|
18
|
|
—
|
|
|||||
|
Tax withholding payments for net share-settled equity awards
|
(6
|
)
|
(28
|
)
|
—
|
|
|||||
|
Proceeds from common stock sales
|
—
|
|
—
|
|
3
|
|
|||||
|
Common stock repurchased
|
—
|
|
(280
|
)
|
—
|
|
|||||
|
Common stock and share-based awards settled
|
—
|
|
(1
|
)
|
(11
|
)
|
|||||
|
Net cash used in financing activities
|
(391
|
)
|
(405
|
)
|
(180
|
)
|
|||||
|
NET DECREASE IN CASH, CASH EQUIVALENTS AND RESTRICTED CASH
|
(14
|
)
|
(12
|
)
|
(393
|
)
|
|||||
|
CASH, CASH EQUIVALENTS AND RESTRICTED CASH—Beginning of year
|
119
|
|
131
|
|
524
|
|
|||||
|
CASH, CASH EQUIVALENTS AND RESTRICTED CASH—End of year
|
$
|
105
|
|
$
|
119
|
|
$
|
131
|
|
||
|
SUPPLEMENTAL DISCLOSURES OF CASH FLOW INFORMATION:
|
|||||||||||
|
Cash paid during the year for:
|
|||||||||||
|
Interest (net of amounts capitalized)
|
$
|
160
|
|
$
|
158
|
|
$
|
223
|
|
||
|
Income taxes paid—net
|
78
|
|
11
|
|
5
|
|
|||||
|
NON-CASH INVESTING AND FINANCING ACTIVITIES
|
|||||||||||
|
Property and equipment purchases included in accounts payable
|
28
|
|
31
|
|
50
|
|
|||||
|
Capital lease additions
|
101
|
|
91
|
|
80
|
|
|||||
|
Cashless exercise of equity awards
|
2
|
|
30
|
|
—
|
|
|||||
|
Contingent consideration payable for acquisition of businesses
|
—
|
|
4
|
|
8
|
|
|||||
|
Marketable securities transferred in connection with the legal
defeasance of the CMBS Fixed Loan Facility
|
—
|
|
—
|
|
485
|
|
|||||
|
CMBS Fixed Loan Facility defeasance
|
—
|
|
—
|
|
472
|
|
|||||
(*) Prior year amounts may be rounded to conform with the current year presentation.
See Notes to Consolidated Financial Statements.
49
US FOODS HOLDING CORP.
NOTES TO CONSOLIDATED FINANCIAL STATEMENTS
(Amounts in tables in millions, except share and per share data, unless otherwise noted)
1. OVERVIEW AND BASIS OF PRESENTATION
US Foods Holding Corp., a Delaware corporation, and its consolidated subsidiaries are referred to in these consolidated financial statements as “we,” “our,” “us,” the “Company,” or “US Foods.” US Foods Holding Corp. conducts all of its operations through its wholly owned subsidiary US Foods, Inc. (“USF”) and its subsidiaries. All of the Company’s indebtedness, as further described in Note 12, Debt, is a direct obligation of USF and its subsidiaries.
Business Description
—The Company, through USF, operates in
one
business segment in which it markets and distributes fresh, frozen and dry food and non-food products to foodservice customers throughout the United States. These customers include independently owned single and multi-unit restaurants, regional concepts, national restaurant chains, hospitals, nursing homes, hotels and motels, country clubs, government and military organizations, colleges and universities, and retail locations.
Basis of Presentation
—The Company operates on a 52 or 53 week fiscal year, with all periods ending on a Saturday. When a 53-week fiscal year occurs, the Company reports the additional week in the fiscal fourth quarter. The fiscal years ended
December 29, 2018
,
December 30, 2017
, and
December 31, 2016
, also referred to herein as fiscal years
2018
,
2017
, and
2016
, respectively, were 52-week fiscal years. Prior year amounts in tables may be rounded to conform with the current year presentation in millions.
|
|
Initial Public Offering
—On
June 1, 2016
, the Company closed its initial public offering (“IPO”) selling
51,111,111
shares of common stock for a cash offering price of
$23.00
per share (
$21.9075
per share net of underwriter discounts and commissions and before offering expenses). The net proceeds of the IPO were used to redeem
$1,090 million
principal of the Company’s
8.5%
Senior Notes due
June 30, 2019
(the “Old Senior Notes”) and pay the related
$23 million
early redemption premium.
|
|
2.
|
SUMMARY OF SIGNIFICANT ACCOUNTING POLICIES
|
Principles of Consolidation
—The Company's consolidated financial statements include the accounts of US Foods and its wholly owned subsidiary, USF, and its subsidiaries. Intercompany transactions have been eliminated in consolidation.
Use of Estimates
—The Company's consolidated financial statements are prepared in accordance with accounting principles generally accepted in the United States of America (“GAAP”). This requires management to make estimates and assumptions that affect the reported amounts of assets and liabilities and disclosure of contingent assets and liabilities at the date of the financial statements and the reported amounts of revenues and expenses during the reporting period. Actual results could differ from these estimates.
Cash and Cash Equivalents
—The Company considers all highly liquid investments purchased with a maturity of three or fewer months to be cash equivalents.
Accounts Receivable
—Accounts receivable represent amounts due from customers in the ordinary course of business and are recorded at the invoiced amount and do not bear interest. Receivables are presented net of the allowance for doubtful accounts in the Company's accompanying Consolidated Balance Sheets. The Company evaluates the collectability of its accounts receivable and determines the appropriate allowance for doubtful accounts based on a combination of factors. When the Company determines that a loss is probable, a specific allowance for doubtful accounts is recorded, reducing the receivable to the net amount we reasonably expect to collect. In addition, allowances are recorded for all other receivables based on historic collection trends, write-offs and the aging of receivables. The Company uses specific criteria to determine uncollectible receivables to be written off, including bankruptcy, accounts referred to outside parties for collection, and accounts past due over specified periods.
Vendor Consideration and Receivables
—The Company participates in various rebate and promotional incentives with its suppliers, primarily through purchase-based programs. Consideration earned is estimated during the year as the Company’s obligations under the programs are fulfilled, which is primarily when products are purchased. Changes in the estimated amount of incentives earned are recognized in the period of change.
Vendor consideration is typically deducted from invoices or collected in cash within
30
days of being earned. Vendor receivables represent the uncollected balance of the vendor consideration. Since collections occur primarily
50
from deducting the consideration from the amounts due to the vendor, the Company does not experience significant collectability issues. The Company evaluates the collectability of its vendor receivables based on specific vendor information and vendor collection history.
Inventories
—The Company’s inventories, consisting mainly of food and other foodservice-related products, are primarily considered finished goods. Inventory costs include the purchase price of the product, freight charges to deliver it to the Company’s warehouses, and depreciation and labor related to processing facilities and equipment, and are net of certain cash or non-cash consideration received from vendors. The Company assesses the need for valuation allowances for slow-moving, excess and obsolete inventories by estimating the net recoverable value of such goods based upon inventory category, inventory age, specifically identified items, and overall economic conditions.
The Company records inventories at the lower of cost or market using the last-in, first-out (“LIFO”) method. The base year values of beginning and ending inventories are determined using the inventory price index computation method. This “links” current costs to original costs in the base year when the Company adopted LIFO. The LIFO balance sheet reserves were
$130 million
at both
December 29, 2018
and
December 30, 2017
. As a result of net changes in LIFO reserves, cost of goods sold increased
$14 million
for fiscal year
2017
and decreased
$18 million
in fiscal year
2016
.
Property and Equipment
—Property and equipment are stated at cost. Depreciation of property and equipment is calculated using the straight-line method over the estimated useful lives of the assets, which range from
three
to
40
years. Property and equipment under capital leases and leasehold improvements are amortized on a straight-line basis over the shorter of the remaining term of the related lease or the estimated useful lives of the assets.
Routine maintenance and repairs are charged to expense as incurred. Applicable interest charges incurred during the construction of new facilities or development of software for internal use are capitalized as one of the elements of cost and are amortized over the useful life of the respective assets.
Property and equipment held and used by the Company are tested for recoverability whenever events or changes in circumstances indicate that the carrying amount of an asset or asset group may not be recoverable. For purposes of evaluating the recoverability of property and equipment, the Company compares the carrying value of the asset or asset group to the estimated, undiscounted future cash flows expected to be generated by the long-lived asset or asset group. If the future cash flows do not exceed the carrying value, the carrying value is compared to the fair value of such asset. If the carrying value exceeds the fair value, an impairment charge is recorded for the excess.
The Company also assesses the recoverability of its closed facilities actively marketed for sale. If a facility’s carrying value exceeds its fair value, less an estimated cost to sell, an impairment charge is recorded for the excess. Assets held for sale are not depreciated.
Impairments are recorded as a component of restructuring and tangible asset impairments in the Company's Consolidated Statements of Comprehensive Income, and a reduction of the asset’s carrying value in the Company's Consolidated Balance Sheets.
Goodwill and Other Intangible Assets
—Goodwill and other intangible assets include the cost of the acquired business in excess of the fair value of the net tangible assets acquired. Other intangible assets include customer relationships, noncompete agreements, the brand names comprising our portfolio of exclusive brands, and trademarks. As required, we assess goodwill and intangible assets with indefinite lives for impairment annually, or more frequently if events occur that indicate an asset may be impaired. For goodwill and indefinite-lived intangible assets, our policy is to assess for impairment at the beginning of each fiscal third quarter. For other intangible assets with definite lives, we assess for impairment only if events occur that indicate that the carrying amount of an asset may not be recoverable. All goodwill is assigned to the consolidated Company as the reporting unit.
Self-Insurance Programs
—The Company estimates its liabilities for claims covering general, fleet, and workers’ compensation. Amounts in excess of certain levels, which range from
$1 million
to
$10 million
per occurrence, are insured as a risk reduction strategy, to mitigate catastrophic losses. The workers’ compensation liability is discounted, as the amount and timing of cash payments is reliably determinable given the nature of benefits and the level of historic claim volume to support the actuarial assumptions and judgments used to derive the expected loss payment pattern. The amount accrued is discounted using an interest rate that approximates the U.S. Treasury rate consistent with the duration of the liability. The inherent uncertainty of future loss projections could cause actual claims to differ from our estimates.
We are self-insured for group medical claims not covered under collective bargaining agreements. The Company accrues its self-insured medical liability, including an estimate for incurred but not reported claims, based on known claims and past claims history. These accruals are included in accrued expenses and other long-term liabilities in the Company's Consolidated Balance Sheets.
51
Share-Based Compensation
—Certain directors, officers and employees participate in the 2016 US Foods Holding Corp. Omnibus Incentive Plan (the “2016 Plan”) which provides a means through which the Company may grant equity and equity incentive awards of US Foods common stock. Certain officers and employees also hold outstanding equity awards granted pursuant to the 2007 Stock Incentive Plan for Key Employees of USF Holding Corp. and its Affiliates, as amended (the “2007 Plan”), which terminated according to its terms on December
21,
2017. The termination of the 2007 Plan has no effect on any outstanding awards; however,
no
future equity awards may be granted under the 2007 Plan. Additionally, most of the Company’s employees are eligible to participate in the US Foods Holding Corp. Amended and Restated Employee Stock Purchase Plan (the “Stock Purchase Plan”), which allows for the purchase of US Foods common stock at a discount of up to
15%
of the fair market value of a share at periodic acquisition dates. Shares issued to satisfy employee share-based award programs come from shares reserved for issuance under the respective award programs. The Company does not maintain treasury shares, as shares repurchased by the Company are retired upon reacquisition.
The Company measures compensation expense for stock-based awards at fair value at the date of grant, and recognizes compensation expense over the service period for awards expected to vest. Forfeitures are recognized as incurred. Fair value is the closing price per share for the Company’s common stock as reported on the New York Stock Exchange. Prior to the IPO, the grant date fair value was measured at the end of each fiscal quarter using the combination of a market and income approach. The computed value was applied to all stock and stock award activity in the subsequent quarter.
Compensation expense for the Stock Purchase Plan represents the difference between the fair market value at acquisition date and the employee purchase price.
Redeemable Common Stock
—Redeemable common stock is a security with redemption features that are outside the control of the issuer, is not classified as an asset or liability in conformity with GAAP, and is not mandatorily redeemable. Prior to the IPO, common stock owned by management and key employees, including vested restricted shares and vested restricted stock units, was subject to certain redemption features and, accordingly was classified as redeemable common stock. In connection with the IPO, the management stockholder’s agreement was amended, and common stock no longer has a redemption feature that is outside the Company’s control that could require the Company to redeem these shares. Accordingly, the amounts previously reflected in redeemable common stock were reclassified to shareholders’ equity during the second quarter of 2016.
Business Acquisitions
—The Company accounts for business acquisitions under the acquisition method. Assets acquired and liabilities assumed are recorded at fair value as of the acquisition date. The operating results of the acquired companies are included in the Company’s consolidated financial statements from the date of acquisition.
Cost of Goods Sold
—Cost of goods sold includes amounts paid to vendors for products sold, net of vendor consideration, including in-bound freight necessary to bring the products to the Company’s distribution facilities. Depreciation related to processing facilities and equipment is presented in cost of goods sold. Because the majority of the inventories are finished goods, depreciation related to warehouse facilities and equipment is presented in distribution, selling and administrative costs. See “Inventories” above for discussion of the LIFO impact on cost of goods sold.
Shipping and Handling Costs
—Shipping and handling costs, which include costs related to the selection of products and their delivery to customers, are presented in distribution, selling and administrative costs. Shipping and handling costs were
$1.7 billion
in
2018
and
$1.6 billion
in
2017
and in
2016
.
Income Taxes
—The Company accounts for income taxes under the asset and liability method. This requires the recognition of deferred tax assets and liabilities for the expected future tax consequences of events that have been included in the Company's consolidated financial statements. Under this method, deferred tax assets and liabilities are determined based on the differences between the financial statement carrying amounts and tax basis of assets and liabilities, using enacted tax rates in effect for the year in which the differences are expected to reverse. The effect of a change in tax rates on deferred tax assets and liabilities is recognized in income during the period that includes the enactment date. Net deferred tax assets are recorded to the extent the Company believes these assets will more likely than not be realized.
An uncertain tax position is recognized when it is more likely than not that the position will be sustained upon examination, including resolutions of any related appeals or litigation processes, based on the technical merits. Uncertain tax positions are recorded at the largest amount that is more likely than not to be sustained. The Company adjusts the amounts recorded for uncertain tax positions when its judgment changes, as a result of evaluating new information not previously available. These differences are reflected as increases or decreases to income tax expense in the period in which they are determined.
52
Derivative Financial Instruments
— The Company utilizes derivative financial instruments to assist in managing its exposure to variable interest rates on certain
borrowings.
The Company does not enter into derivatives or other financial instruments for trading or speculative purposes. Interest rate swaps, designated as cash flow hedges, are recorded in the Company’s Consolidated Balance Sheet at fair value.
In the normal course of business, the Company enters into forward purchase agreements to procure fuel, electricity and product commodities related to its business. These agreements often meet the definition of a derivative. However, the Company does not measure its forward purchase commitments at fair value as the amounts under contract meet the physical delivery criteria in the normal purchase exception under GAAP guidance.
Concentration Risks
—Financial instruments that subject the Company to concentrations of credit risk consist primarily of cash equivalents and accounts receivable. The Company’s cash equivalents are invested primarily in money market funds at major financial institutions. Credit risk related to accounts receivable is dispersed across a larger number of customers located throughout the United States. The Company attempts to reduce credit risk through initial and ongoing credit evaluations of its customers’ financial condition. There were no receivables from any
one
customer representing more than
5%
of our consolidated gross accounts receivable at
December 29, 2018
.
|
3.
|
RECENT ACCOUNTING PRONOUNCEMENTS
|
Recently Adopted Accounting Pronouncements
In August 2017, the Financial Accounting Standards Board (“FASB”) issued Accounting Standards Update (“ASU”) No. 2017-12,
Derivatives and Hedging (Topic 815): Targeted Improvements to Accounting for Hedging Activities,
to better align a company’s risk management activities and financial reporting for hedging relationships, simplify the hedge accounting requirements, and improve the disclosures of hedging arrangements. ASU 2017-12 was further amended in October 2018 by ASU 2018-16,
Derivatives and Hedging (Topic 815): Inclusion of the Secured Overnight Financing Rate (SOFR) Overnight Index Swap (OIS) Rate as a Benchmark Interest Rate for Hedge Accounting
.
This guidance is effective for fiscal years, and interim periods within those fiscal years, beginning after December 15, 2018, with early adoption permitted. The Company’s only hedging activities are its interest rate swaps designated as cash flow hedges. As discussed in Note 22, Commitments and Contingencies, the Company does not measure its forward purchase commitments for fuel and electricity at fair value, as the amounts under contract meet the physical delivery criteria in the normal purchase exception in Accounting Standards Codification (“ASC”) 815,
Derivatives and Hedging
. The Company prospectively adopted this guidance at the beginning of fiscal year 2018, with no impact to its financial position or results of operations.
In May 2017, the FASB issued ASU No. 2017-09,
Compensation
—
Stock Compensation (Topic 718): Scope of Modification Accounting
.
This ASU provides guidance on determining which changes to the terms and conditions of share-based payment awards require an entity to apply modification accounting. This ASU should be applied prospectively to an award modified on or after the adoption date. This guidance is effective for fiscal years, and interim periods within those fiscal years, beginning after December 15, 2017. The Company adopted this guidance at the beginning of fiscal year 2018, with no impact to its financial position or results of operations, as the Company has not modified any share-based payment awards since adoption.
In March 2017, the FASB issued ASU No. 2017-07,
Compensation—Retirement Benefits (Topic 715): Improving the Presentation of Net Periodic Pension Cost and Net Periodic Postretirement Benefit Cost.
This ASU requires an employer to report the service cost component of net periodic pension cost and net periodic postretirement benefit cost in the same line item as other compensation costs arising from services rendered by the pertinent employees during the period. It also requires the other components of net periodic pension cost and net periodic postretirement benefit cost to be presented in the statement of comprehensive income separately from the service cost component and outside of operating income. Additionally, only the service cost component is eligible for capitalization, when applicable. This guidance is effective for fiscal years, and interim periods within those fiscal years, beginning after December 15, 2017. The amendments in this update require retrospective presentation in the statement of comprehensive income. The amendments allow a practical expedient that permits an employer to use the amounts disclosed in its pension and other postretirement benefit plan note for the prior comparative periods as the estimation basis for applying the retrospective presentation requirements. The Company retrospectively adopted this guidance at the beginning of fiscal year 2018. For fiscal years
2017
and
2016
,
$14 million
and
$5 million
, respectively, of net periodic benefit credits, other than the service cost components, were reclassified to other (income) expense—net, in the Company's Consolidated Statement of Comprehensive Income.
In January 2017, the FASB issued ASU No. 2017-04,
Intangibles—Goodwill and Other (Topic 350): Simplifying the Test for Goodwill Impairment,
which simplifies the subsequent measurement of goodwill by eliminating Step 2 from the goodwill impairment test. The amendment also eliminates the requirement for any reporting unit with a
53
zero or negative carrying amount to perform a qualitative assessment and, if it fails that qualitative test, to perform Step 2 of the goodwill impairment test. An entity has the option to perform the qualitative assessment for a reporting unit to determine if the quantitative impairment test is necessary. This guidance is effective for the annual or any interim goodwill impairment tests for fiscal years beginning after December 15, 2019, with early adoption permitted. The Company adopted this guidance as of the first day of its fiscal third quarter of 2018, in conjunction with its annual impairment assessment for goodwill, with no impact to its financial position or results of operations. See Note 10, Goodwill and Other Intangibles, for a discussion of the Company's fiscal year 2018 annual impairment analysis.
In November 2016, the FASB issued ASU No. 2016-18,
Statement of Cash Flows (Topic 230): Restricted Cash
, which clarifies the presentation of restricted cash on the statement of cash flows. Amounts generally described as restricted cash and restricted cash equivalents should be included with cash and cash equivalents when reconciling the beginning and ending cash balances on the statement of cash flows. The Company retrospectively adopted this standard at the beginning of fiscal year 2018, resulting in immaterial increases in the beginning and ending balances of cash, cash equivalents and restricted cash in the Company’s Consolidated Statement of Cash Flows for fiscal year 2017 and 2016. Restricted cash was immaterial at
December 29, 2018
and
December 30, 2017
.
In January 2016, the FASB issued ASU No. 2016-01,
Financial Instruments – Overall (Subtopic 825-10): Recognition and Measurement of Financial Assets and Financial Liabilities
,
to amend the guidance on the classification and measurement of financial instruments. ASU No. 2016-01 was further amended in February 2018 by ASU No. 2018-03,
Technical Corrections and Improvements to Financial Instruments—Overall (Subtopic 825-10)—Recognition and Measurement of Financial Assets and Financial Liabilities
. The new guidance requires entities to measure equity investments that do not result in consolidation and are not accounted for under the equity method at fair value and recognize any changes in fair value in net income. The new guidance also amends certain disclosure requirements associated with the fair value of financial instruments.
The Company adopted the guidance in this ASU at the beginning of fiscal year 2018, with no impact to its financial position or results of operations.
In May 2014, the FASB issued ASU No. 2014-09,
Revenue from Contracts with Customers,
and has issued subsequent amendments which have been introduced as ASC Topic 606. Topic 606, as amended, replaces Topic 605, the previous revenue recognition guidance. The new standard’s core principle is for companies to recognize revenue to depict the transfer of goods or services to customers in amounts that reflect the consideration (that is, payment) to which the Company expects to be entitled in exchange for those goods or services. The new standard also results in enhanced disclosures about revenue, provides guidance for transactions that were not previously addressed comprehensively (for example, service revenue and contract modifications) and improves guidance for multiple-element arrangements. The Company adopted this standard at the beginning of fiscal year 2018, with no significant impact
to its financial position or results of operations
, using the modified retrospective method. See Note 4, Revenue Recognition.
Recently Issued Accounting Pronouncements
In February 2018, the FASB issued ASU No. 2018-02,
Income Statement, Reporting Comprehensive Income (Topic 220), Reclassification of Certain Tax Effects From Accumulated Other Comprehensive Income
. This ASU permits an entity to reclassify the income tax effects of the Tax Cuts and Jobs Act of 2017 (the “Tax Act”) on items within accumulated other comprehensive income to retained earnings. The Company adopted this standard at the beginning of fiscal year 2019 and elected not to reclassify the income tax effects of the Tax Act from accumulated other comprehensive income to retained earnings.
In February 2016, the FASB issued ASU No. 2016-02,
Leases (Topic 842),
which supersedes ASC 840,
Leases
. The FASB has issued subsequent amendments to improve and clarify the implementation guidance of Topic 842. The new standard requires an entity to recognize leases on the balance sheet and to disclose key information about the entity's leasing arrangements. The Company adopted this standard at the beginning of fiscal year 2019 using the modified retrospective transition approach, including certain practical expedients, for all leases existing at December 30, 2018, the effective and initial application date. The estimated impact of the adoption to the Company's consolidated financial statements included the recognition of operating lease liabilities of approximately
$100 million
with corresponding right-of-use assets of approximately the same amount based on the present value of the remaining lease payments for existing operating leases. This standard is not expected to have a material impact on the Company's results of operations. The Company has revised its relevant policies and procedures, as applicable, to meet the new accounting, reporting and disclosure requirements of Topic 842 and has updated internal controls accordingly.
54
In August 2018, the FASB issued ASU No. 2018-15,
Intangibles-Goodwill and Other-Internal-Use Software (Subtopic 350-40): Customer’s Accounting for Implementation Costs Incurred in a Cloud Computing Arrangement That Is a Service Contract
, which provides new guidance on the accounting for implementation, set-up, and other upfront costs incurred in a hosted cloud computing arrangement. Under the new guidance, entities will apply the same criteria for capitalizing implementation costs as they would for an internal-use software license arrangement. This guidance is effective for fiscal years, and interim periods within those fiscal years, beginning after December 15, 2019, with early adoption permitted. This ASU can be adopted prospectively to eligible costs incurred on or after the date of adoption or retrospectively. The Company does not expect the adoption of the new guidance under the standard to materially affect its financial position or results of operations.
In June 2016, the FASB issued ASU No. 2016-13,
Financial Instruments—Credit Losses (Topic 326): Measurement of Credit Losses on Financial Instruments,
which requires entities to use a forward looking, expected loss model to estimate credit losses. It also requires additional disclosure related to credit quality of trade and other receivables, including information related to management’s estimate of credit allowances. ASU 2016-13 was further amended in November 2018 by ASU 2018-19,
Codification Improvements to Topic 236, Financial Instrument-Credit Losses.
This guidance is effective for fiscal years, and interim periods within those fiscal years, beginning after December 15, 2019, with early adoption permitted. The Company does not expect the adoption of the provisions of the new standard to materially affect its financial position or results of operations.
|
4.
|
REVENUE RECOGNITION
|
In accordance with ASC 606,
Revenue from Contracts with Customers
, revenue is recognized when a customer obtains control of promised goods or services. The Company adopted this standard at the beginning of fiscal year 2018, with no significant impact
to its financial position or results of operations
, using the modified retrospective method. The amount of revenue recognized reflects the consideration to which the Company expects to be entitled to receive in exchange for these goods or services. To achieve this core principle, the Company applies the following five steps:
|
1)
|
Identify the contract with a customer
|
A contract with a customer exists when (i) the Company enters into an enforceable contract with a customer that defines each party’s rights regarding the goods or services to be transferred and identifies the payment terms related to these goods or services, (ii) the contract has commercial substance and (iii) the Company determines that collection of substantially all consideration for goods or services that are transferred is probable based on the customer’s intent and ability to pay the promised consideration. For the Company, the contract is the approved sales order, which may also be supplemented by other agreements that formalize various terms and conditions with customers, including restaurant chains, government organizations or group purchase organizations. The Company applies judgment in determining the customer’s ability and intention to pay, which is based on a variety of factors including the customer’s historical payment experience or, in the case of a new customer, published credit and financial information pertaining to the customer.
|
2)
|
Identify the performance obligation in the contract
|
Performance obligations promised in a contract are identified based on the goods or services that will be transferred to the customer. For the Company, this includes the delivery of food and food-related products, which provides immediate benefit to the customer. While certain additional services may be identified within a contract, we have concluded that those services are individually immaterial in the context of the contract with the customer and therefore not assessed as performance obligations.
|
3)
|
Determine the transaction price
|
The transaction price is determined based on the consideration to which the Company will be entitled in exchange for transferring goods or services to the customer, and is generally stated on the approved sales order. Variable consideration, which typically includes volume-based rebates or discounts, is estimated utilizing the most likely amount method.
|
4)
|
Allocate the transaction price to performance obligations in the contract
|
Since our contracts contain a single performance obligation, delivery of food and food-related products, the transaction price is allocated to that single performance obligation.
55
|
5)
|
Recognize revenue when or as the Company satisfies a performance obligation
|
The Company recognizes revenue from the sale of food and food-related products when title and risk of loss passes and the customer accepts the goods, which occurs at delivery. Customer sales incentives such as volume-based rebates or discounts are treated as a reduction of sales at the time the sale is recognized. Sales taxes invoiced to customers and remitted to governmental authorities are excluded from net sales. Shipping and handling costs are treated as fulfillment costs and presented in distribution, selling and administrative costs. At
December 29, 2018
, the Company does not have any material outstanding performance obligations, contract assets and liabilities or capitalized contract acquisition costs. Customer receivables, which are included in Accounts receivable, less allowances in the Company’s Consolidated Balance Sheets, were
$1.3 billion
at both
December 29, 2018
and
December 30, 2017
.
The following table presents the sales mix for the Company’s principal product categories for the last three fiscal years:
|
2018
|
2017
|
2016
|
|||||||||
|
Meats and seafood
|
$
|
8,635
|
|
$
|
8,692
|
|
$
|
8,121
|
|
||
|
Dry grocery products
|
4,239
|
|
4,266
|
|
4,127
|
|
|||||
|
Refrigerated and frozen grocery products
|
3,898
|
|
3,799
|
|
3,653
|
|
|||||
|
Dairy
|
2,520
|
|
2,533
|
|
2,380
|
|
|||||
|
Equipment, disposables and supplies
|
2,298
|
|
2,243
|
|
2,166
|
|
|||||
|
Beverage products
|
1,315
|
|
1,306
|
|
1,268
|
|
|||||
|
Produce
|
1,270
|
|
1,308
|
|
1,204
|
|
|||||
|
$
|
24,175
|
|
$
|
24,147
|
|
$
|
22,919
|
|
|||
|
5.
|
BUSINESS ACQUISITIONS
|
There were
no
business acquisitions completed during fiscal year
2018
.
Acquisitions completed during fiscal year
2017
included
three
broadline and
two
specialty distributors for aggregate cash consideration of approximately
$182 million
.
Business acquisitions periodically provide for contingent consideration, including earnout payments
in the event certain operating results are achieved during a defined post-closing period. During
fiscal year
2018
,
the Company paid approximately
$5 million
of contingent consideration related to
2017
and 2016 business acquisitions. During fiscal year
2017
, the Company paid approximately
$8 million
of earnout contingent consideration related to 2016 business acquisitions, of which
$6 million
was included as part of the fair value of the acquisition date assets and liabilities, and is reflected in the Company’s Consolidated Statement of Cash Flows in cash flows from financing activities. As of
December 29, 2018
, the Company had no material outstanding contingent consideration for business acquisitions.
The
2017
acquisitions, reflected in the Company’s consolidated financial statements commencing from the date of acquisition, did not materially affect the Company’s results of operations or financial position and, therefore, pro forma financial information has not been provided. The
2017
acquisitions were integrated into the Company’s foodservice distribution network and funded primarily with cash from operations.
The Company finalized the purchase accounting for the 2017 acquisitions during fiscal year 2018.
56
The following table summarizes the purchase price allocations for the
2017
business acquisitions as follows:
|
2017
|
|||
|
Accounts receivable
|
$
|
17
|
|
|
Inventories
|
25
|
|
|
|
Other current assets
|
1
|
|
|
|
Property and equipment
|
29
|
|
|
|
Goodwill
|
59
|
|
|
|
Other intangible assets
|
72
|
|
|
|
Accounts payable
|
(8
|
)
|
|
|
Accrued expenses and other current liabilities
|
(6
|
)
|
|
|
Deferred income taxes
|
(7
|
)
|
|
|
Cash paid for acquisitions
|
$
|
182
|
|
|
6.
|
ALLOWANCE FOR DOUBTFUL ACCOUNTS
|
A summary of the activity in the allowance for doubtful accounts for the last three fiscal years is as follows:
|
2018
|
2017
|
2016
|
|||||||||
|
Balance at beginning of year
|
$
|
26
|
|
$
|
25
|
|
$
|
23
|
|
||
|
Charged to costs and expenses
|
17
|
|
18
|
|
11
|
|
|||||
|
Customer accounts written off—net of recoveries
|
(14
|
)
|
(17
|
)
|
(9
|
)
|
|||||
|
Balance at end of year
|
$
|
29
|
|
$
|
26
|
|
$
|
25
|
|
||
This table excludes the vendor receivable related allowance for doubtful accounts of
$3 million
at both
December 29, 2018
and
December 30, 2017
and
$2 million
at
December 31, 2016
.
|
7.
|
ACCOUNTS RECEIVABLE FINANCING PROGRAM
|
Under its accounts receivable financing facility dated as of August 27, 2012, as amended (the “ABS Facility”), USF sells, on a revolving basis, its eligible receivables to a wholly owned, special purpose, bankruptcy remote subsidiary (the “Receivables Company”). The Receivables Company, in turn, grants a continuing security interest in all of its rights, title and interest in the eligible receivables to the administrative agent, for the benefit of the lenders as defined by the ABS Facility. The Company consolidates the Receivables Company and, consequently, the transfer of the receivables is a transaction internal to the Company and the receivables have not been derecognized from the Company’s Consolidated Balance Sheets. On a daily basis, cash from accounts receivable collections is remitted to the Company as additional eligible receivables are sold to the Receivables Company. If, on a weekly settlement basis, there are not sufficient eligible receivables available as collateral, the Company is required to either provide cash collateral or, in lieu of providing cash collateral, it can pay down its borrowings on the ABS Facility to cover the shortfall. Due to sufficient eligible receivables available as collateral,
no
cash collateral was held at
December 29, 2018
or
December 30, 2017
. Included in the Company’s accounts receivable balance as of
December 29, 2018
and
December 30, 2017
was approximately
$1.0 billion
of receivables held as collateral in support of the ABS Facility. See Note 12, Debt, for a further description of the ABS Facility.
|
8.
|
ASSETS HELD FOR SALE
|
The Company classifies its closed facilities as assets held for sale at the time management commits to a plan to sell the facility, the facility is actively marketed and available for immediate sale, and the sale is expected to be completed within one year. Due to market conditions, certain facilities may be classified as assets held for sale for more than one year as the Company continues to actively market the facilities at reasonable prices.
During fiscal year 2018, the Company closed a distribution facility and transferred its business activities to another of the Company's distribution facilities. During fiscal year
2017
, two closed distribution facilities were sold for aggregate proceeds of
$22 million
, resulting in a
$3 million
gain. Additionally, an excess
57
portion of a parcel of land, purchased earlier in the year, was transferred to assets held for sale, along with an operating facility that was closed due to the consolidation of operations into a recently acquired facility.
The changes in assets held for sale for fiscal years
2018
and
2017
were as follows:
|
2018
|
2017
|
||||||
|
Balance at beginning of year
|
$
|
5
|
|
$
|
21
|
|
|
|
Transfers in
|
3
|
|
4
|
|
|||
|
Assets sold
|
—
|
|
(19
|
)
|
|||
|
Tangible asset impairment charges
|
(1
|
)
|
(1
|
)
|
|||
|
Balance at end of the year
|
$
|
7
|
|
$
|
5
|
|
|
|
9.
|
PROPERTY AND EQUIPMENT
|
Property and equipment consisted of the following:
|
December 29, 2018
|
December 30, 2017
|
Range of
Useful Lives
|
|||||||
|
Land
|
$
|
323
|
|
$
|
313
|
|
|||
|
Buildings and building improvements
|
1,252
|
|
1,190
|
|
10–40 years
|
||||
|
Transportation equipment
|
1,031
|
|
949
|
|
5–10 years
|
||||
|
Warehouse equipment
|
418
|
|
384
|
|
5–12 years
|
||||
|
Office equipment, furniture and software
|
858
|
|
803
|
|
3–7 years
|
||||
|
Construction in process
|
77
|
|
88
|
|
|||||
|
3,959
|
|
3,727
|
|
||||||
|
Less accumulated depreciation and amortization
|
(2,117
|
)
|
(1,926
|
)
|
|||||
|
Property and equipment—net
|
$
|
1,842
|
|
$
|
1,801
|
|
|||
Transportation equipment included
$544 million
and
$444 million
of capital lease assets at
December 29, 2018
and
December 30, 2017
, respectively. Buildings and building improvements included
$36 million
and
$97 million
of capital lease assets at
December 29, 2018
and
December 30, 2017
, respectively. Accumulated amortization of capital lease assets was
$247 million
and
$181 million
at
December 29, 2018
and
December 30, 2017
, respectively. Interest capitalized was
$2 million
for fiscal years
2018
and
2017
.
Depreciation and amortization expense of property and equipment, including amortization of capital lease assets, was
$300 million
,
$283 million
and
$266 million
for fiscal years
2018
,
2017
and
2016
, respectively.
|
10.
|
GOODWILL AND OTHER INTANGIBLES
|
Goodwill includes the cost of acquired businesses in excess of the fair value of the tangible net assets acquired. Other intangible assets include customer relationships, noncompete agreements, the brand names comprising the Company’s portfolio of exclusive brands, and trademarks. Brand names and trademarks are indefinite-lived intangible assets, and accordingly, are not subject to amortization.
Customer relationships and noncompete agreements are intangible assets with definite lives, and are carried at the acquired fair value less accumulated amortization. Customer relationships and noncompete agreements are amortized over the estimated useful lives (
two
to
four
years). Amortization expense was
$40 million
,
$95 million
and
$155 million
for fiscal years
2018
,
2017
and
2016
, respectively. The weighted-average remaining useful life of all customer relationship intangibles was approximately
2 years
at
December 29, 2018
. Amortization of these customer relationship assets is estimated to be
$39 million
for fiscal year
2019
,
$24 million
fiscal year
2020
and
$6 million
fiscal year
2021
.
58
Goodwill and Other intangibles consisted of the following:
|
December 29, 2018
|
December 30, 2017
|
||||||
|
Goodwill
|
$
|
3,967
|
|
$
|
3,967
|
|
|
|
Other intangibles—net
|
|||||||
|
Customer relationships—amortizable:
|
|||||||
|
Gross carrying amount
|
$
|
154
|
|
$
|
154
|
|
|
|
Accumulated amortization
|
(85
|
)
|
(46
|
)
|
|||
|
Net carrying value
|
69
|
|
108
|
|
|||
|
Noncompete agreements—amortizable:
|
|||||||
|
Gross carrying amount
|
3
|
|
4
|
|
|||
|
Accumulated amortization
|
(1
|
)
|
(1
|
)
|
|||
|
Net carrying value
|
2
|
|
3
|
|
|||
|
Brand names and trademarks—not amortizing
|
253
|
|
253
|
|
|||
|
Total other intangibles—net
|
$
|
324
|
|
$
|
364
|
|
|
The Company assesses goodwill and other intangible assets with indefinite lives for impairment annually, or more frequently if events occur that indicate an asset may be impaired. For goodwill and indefinite-lived intangible assets, the Company’s policy is to assess for impairment at the beginning of each fiscal third quarter. For intangible assets with definite lives, the Company assesses impairment only if events occur that indicate that the carrying amount of an asset may not be recoverable. The Company completed its most recent annual impairment assessment for goodwill and indefinite-lived intangible assets as of July 1, 2018, the first day of the third quarter of
2018
, with
no
impairments noted.
For goodwill, the reporting unit used in assessing impairment is the Company’s
one
business segment as described in Note 25, Business Information. The Company performed the annual goodwill impairment assessment using a qualitative approach to determine whether it is more likely than not that the fair value of goodwill is less than its carrying value. In performing the qualitative assessment, the Company identified and considered the significance of relevant key factors, events, and circumstances that affect the fair value of its goodwill. These factors include external factors such as market conditions, macroeconomic, and industry, as well as entity-specific factors, such as actual and planned financial performance. Based upon the Company’s qualitative fiscal
2018
annual goodwill impairment analysis, the Company concluded that it is more likely than not that the fair value of goodwill exceeded its carrying value and there is no risk of impairment.
The Company’s fair value estimates of the brand names and trademarks indefinite-lived intangible assets are based on a relief-from-royalty method. The fair value of these intangible assets is determined for comparison to the corresponding carrying value. If the carrying value of these assets exceeds its fair value, an impairment loss is recognized in an amount equal to the excess. Based upon the Company’s fiscal
2018
annual impairment analysis, the Company concluded the fair value of its brand names and trademarks exceeded its carrying value.
Due to the many variables inherent in estimating fair value and the relative size of the recorded indefinite-lived intangible assets, differences in assumptions may have a material effect on the results of the Company’s impairment analysis in future periods.
|
11.
|
FAIR VALUE MEASUREMENTS
|
The Company follows the accounting standards for fair value, where fair value is a market-based measurement, not an entity-specific measurement. The Company’s fair value measurements are based on the assumptions that market participants would use in pricing the asset or liability. As a basis for considering market participant assumptions in fair value measurements, fair value accounting standards establish a fair value hierarchy which prioritizes the inputs used in measuring fair value as follows:
|
•
|
Level 1—observable inputs, such as quoted prices in active markets
|
59
|
•
|
Level 2—observable inputs other than those included in Level 1, such as quoted prices for similar assets and liabilities in active or inactive markets that are observable either directly or indirectly, or other inputs that are observable or can be corroborated by observable market data
|
|
•
|
Level 3—unobservable inputs for which there is little or no market data, which require the reporting entity to develop its own assumptions
|
Any transfers of assets or liabilities between Level 1, Level 2, and Level 3 of the fair value hierarchy will be recognized at the end of the reporting period in which the transfer occurs. There were no transfers between fair value levels in any of the periods presented below.
The Company’s assets and liabilities measured at fair value on a recurring basis as of
December 29, 2018
and
December 30, 2017
, aggregated by the level in the fair value hierarchy within which those measurements fall, were as follows:
|
December 29, 2018
|
|||||||||||||||
|
Level 1
|
Level 2
|
Level 3
|
Total
|
||||||||||||
|
Assets
|
|||||||||||||||
|
Money market funds
|
$
|
1
|
|
$
|
—
|
|
$
|
—
|
|
$
|
1
|
|
|||
|
Interest rate swaps
|
—
|
|
19
|
|
—
|
|
19
|
|
|||||||
|
$
|
1
|
|
$
|
19
|
|
$
|
—
|
|
$
|
20
|
|
||||
|
December 30, 2017
|
|||||||||||||||
|
Level 1
|
Level 2
|
Level 3
|
Total
|
||||||||||||
|
Assets
|
|||||||||||||||
|
Money market funds
|
$
|
1
|
|
$
|
—
|
|
$
|
—
|
|
$
|
1
|
|
|||
|
Interest rate swaps
|
—
|
|
13
|
|
—
|
|
13
|
|
|||||||
|
$
|
1
|
|
$
|
13
|
|
$
|
—
|
|
$
|
14
|
|
||||
|
Liabilities
|
|||||||||||||||
|
Contingent consideration payable for business acquisitions
|
$
|
—
|
|
$
|
—
|
|
$
|
1
|
|
$
|
1
|
|
|||
There were no significant assets or liabilities on the Company's Consolidated Balance Sheets measured at fair value on a nonrecurring basis.
Recurring Fair Value Measurements
Money Market Funds
Money market funds include highly liquid investments with a maturity of three or fewer months. They are valued using quoted market prices in active markets and are classified under Level 1 within the fair value hierarchy.
Derivative Financial Instruments
The Company uses interest rate swaps, designated as cash flow hedges, to manage its exposure to interest rate movements in connection with its variable-rate Term Loan Facility (as defined in Note 12, Debt).
On August 1, 2017, USF entered into
four
-year interest rate swap agreements with a notional amount of
$1.1 billion
, reducing to
$825 million
in the fourth year. These swaps effectively converted approximately half of the principal amount of the Term Loan Facility from a variable to a fixed rate loan. After giving effect to the June 22, 2018 amendment to the Term Loan Facility, the Company now effectively pays an aggregate rate of
3.71%
on the notional amount covered by the interest rate swaps, comprised of a rate of
1.71%
plus a spread of
2.00%
(See Note 12, Debt).
60
The Company records its interest rate swaps in its Consolidated Balance Sheets at fair value, based on projections of cash flows and future interest rates. The determination of fair value includes the consideration of any credit valuation adjustments necessary, giving consideration to the creditworthiness of the respective counterparties or the Company, as appropriate. The following table presents t
he balance sheet location and fair value of the interest rate swaps at
December 29, 2018
and
December 30, 2017
:
|
Fair Value
|
|||||||||
|
Balance Sheet Location
|
December 29, 2018
|
December 30, 2017
|
|||||||
|
Derivatives designated as hedging instruments
|
|||||||||
|
Interest rate swaps
|
Other current assets
|
$
|
8
|
|
$
|
1
|
|
||
|
Interest rate swaps
|
Other noncurrent assets
|
11
|
|
12
|
|
||||
|
Total
|
$
|
19
|
|
$
|
13
|
|
|||
Gains and losses on the interest rate swaps are initially recorded in accumulated o
ther comprehensive loss and reclassified to interest expense during the period in which the hedged transaction affects income. The following table presents the effect of the Company’s interest rate swaps in its Consolidated Statement of Comprehensive Income for the fiscal years ended
December 29, 2018
and
December 30, 2017
:
|
Derivatives in Cash Flow Hedging Relationships
|
Amount of Gain Recognized in Accumulated
Other Comprehensive Loss, net of tax
|
Location of Amounts Reclassified from Accumulated Other Comprehensive Loss
|
Amount of (Gain) Loss Reclassified from Accumulated Other Comprehensive Loss to Income,
net of tax
|
||||||
|
For the year ended December 29, 2018
|
|||||||||
|
Interest rate swaps
|
$
|
7
|
|
Interest expense—net
|
$
|
(2
|
)
|
||
|
For the year ended December 30, 2017
|
|||||||||
|
Interest rate swaps
|
$
|
6
|
|
Interest expense—net
|
$
|
2
|
|
||
During the next twelve months, the Company estimates that
$9 million
will be reclassified from accumulated other comprehensive loss to income.
Credit Risk-Related Contingent Features—
The interest rate swap agreements contain a provision whereby the Company could be declared in default on its hedging obligations if more than
$75 million
of the Company’s other indebtedness is accelerated. As of
December 29, 2018
, none of our indebtedness was accelerated.
We review counterparty credit risk and currently are not aware of any facts that indicate our counterparties will not be able to comply with the contractual terms of their agreements.
Contingent Consideration Relating to Business Acquisitions
As discussed in Note 5, Business Acquisitions, contingent consideration may be paid under an earnout arrangement in connection with a business acquisition in the event certain operating results are achieved during a defined post-closing period. The amount included in the above table for fiscal year
2017
, classified under Level 3 within the fair value hierarchy, represents the estimated fair value of the earnout liability for the respective period. This earnout liability was settled in fiscal year
2018
. We estimated the fair value of the earnout liability based on financial projections of the acquired businesses and estimated probability of achievement. Changes in fair value resulting from changes in the estimated amount of contingent consideration are included in distribution, selling and administrative costs in the Company's Consolidated Statements of Comprehensive Income.
Other Fair Value Measurements
The carrying value of cash, restricted cash, accounts receivable, bank checks outstanding, accounts payable and accrued expenses approximate their fair values due to their short-term maturities.
The fair value of the Company’s total debt approximated its carrying value of
$3.5 billion
and
$3.8 billion
as of
December 29, 2018
and
December 30, 2017
, respectively. The
December 29, 2018
and
December 30, 2017
61
fair value of the Company’s
5.875%
unsecured Senior Notes due
June 15, 2024
(the “Senior Notes”), estimated at
$0.6 billion
, at the end of each period, was classified under Level 2 of the fair value hierarchy, with fair value based upon the closing market price at the end of the reporting period. The fair value of the balance of the Company’s debt is primarily classified under Level 3 of the fair value hierarchy, with fair value estimated based upon a combination of the cash outflows expected under these debt facilities, interest rates that are currently available to the Company for debt with similar terms, and estimates of the Company’s overall credit risk.
|
12.
|
DEBT
|
Total debt consisted of the following:
|
Debt Description
|
Maturity
|
Interest Rate at December 29, 2018
|
December 29, 2018
|
December 30, 2017
|
|||||||
|
ABL Facility
|
October 20, 2020
|
7.00%
|
$
|
81
|
|
$
|
80
|
|
|||
|
ABS Facility
|
September 21, 2020
|
3.52%
|
275
|
|
580
|
|
|||||
|
Term Loan Facility (net of $6 and $10
of unamortized deferred financing costs) |
June 27, 2023
|
4.34%
|
2,145
|
|
2,157
|
|
|||||
|
Senior Notes (net of $5 and $6
of unamortized deferred financing costs) |
June 15, 2024
|
5.88%
|
595
|
|
594
|
|
|||||
|
Obligations under capital leases
|
2019–2025
|
2.31% - 6.19%
|
352
|
|
336
|
|
|||||
|
Other debt
|
2021–2031
|
5.75% - 9.00%
|
9
|
|
10
|
|
|||||
|
Total debt
|
3,457
|
|
3,757
|
|
|||||||
|
Current portion of long-term debt
|
(106
|
)
|
(109
|
)
|
|||||||
|
Long-term debt
|
$
|
3,351
|
|
$
|
3,648
|
|
|||||
At
December 29, 2018
, after considering interest rate swaps that fixed the interest rate on
$1.1 billion
of principal of the Term Loan Facility, as described in Note 11, Fair Value Measurements, approximately
41%
of the Company’s total debt was at a floating rate.
Principal payments to be made on outstanding debt, exclusive of deferred financing costs, as of
December 29, 2018
, were as follows:
|
2019
|
$
|
106
|
|
|
2020
|
455
|
|
|
|
2021
|
87
|
|
|
|
2022
|
72
|
|
|
|
2023
|
2,103
|
|
|
|
Thereafter
|
645
|
|
|
|
$
|
3,468
|
|
|
The following is a description of each of the Company’s debt instruments outstanding as of
December 29, 2018
:
ABL Facility—
The Amended and Restated ABL Credit Agreement, dated as of October 20, 2015, as further amended, sets forth USF’s asset backed senior secured revolving loan facility (the “ABL Facility”) and provides for loans under its two tranches: ABL Tranche A-1 and ABL Tranche A, with its capacity limited by a borrowing base. The maximum borrowing available is
$1,300 million
, with ABL Tranche A-1 at
$100 million
, and ABL Tranche A at
$1,200 million
.
62
As of
December 29, 2018
, USF had
$81 million
of outstanding borrowings, and had issued letters of credit totaling
$372 million
, under the ABL Facility. Outstanding letters of credit included: (1)
$298 million
issued in favor of certain commercial insurers securing USF’s obligations with respect to its self-insurance program, (2)
$73 million
issued to secure USF’s obligations with respect to certain real estate leases, and (3)
$1 million
issued for other obligations. There was available capacity on the ABL Facility of
$847 million
at
December 29, 2018
. As of
December 29, 2018
, on Tranche A-1 borrowings, USF may periodically elect to pay interest at an alternative base rate (“ABR”), as defined in the ABL Facility, plus
1.50%
or the London Interbank Offered Rate (“LIBOR”) plus
2.50%
. On Tranche A borrowings, USF can periodically elect to pay interest at ABR plus
0.25%
or LIBOR plus
1.25%
. The interest rate spreads are the lowest provided for in the agreement, based upon USF’s consolidated secured leverage ratio, as defined in the agreement. The ABL Facility also carries letter of credit fees of
1.25%
and an unused commitment fee of
0.25%
. The weighted-average interest rate on outstanding borrowings for the ABL Facility was
5.12%
and
4.29%
for fiscal years
2018
and
2017
, respectively.
ABS Facility—
Under the ABS Facility, USF sells, on a revolving basis, its eligible receivables to the Receivables Company. See Note 7, Accounts Receivable Financing Program.
The maximum capacity under the ABS Facility is
$800 million
. Borrowings under the ABS Facility were
$275 million
at
December 29, 2018
. The Company, at its option, can request additional borrowings up to the maximum commitment, provided sufficient eligible receivables are available as collateral. There was available capacity on the ABS Facility of
$455 million
at
December 29, 2018
based on receivables eligible as collateral. The ABS Facility bears interest at LIBOR plus
1.00%
, and carries an unused commitment fee of
0.35%
. The weighted-average interest rate on outstanding borrowings for the ABS Facility was
3.00%
and
2.18%
for fiscal years
2018
and
2017
, respectively.
Term Loan Facility—
The Credit Agreement, dated as of May 11, 2011, as amended, provides USF with a senior secured term loan facility (the “Term Loan Facility”) with an outstanding balance of
$2.1 billion
at
December 29, 2018
. Principal repayments of
$5.5 million
are payable quarterly with the balance due at maturity. The debt may require mandatory repayments if certain assets are sold, as set forth in the agreement.
On June 22, 2018, the Term Loan Facility was further amended to lower the interest rate margins under the Term Loan Facility to
2.00%
for LIBOR borrowings and
1.00%
for ABR borrowings, among other things. The table above reflects the
December 29, 2018
interest rate on the unhedged portion of the Term Loan Facility. With respect to the portion of the Term Loan Facility subject to interest rate hedging agreements (
$1.1 billion
as of
December 29, 2018
), the June 22, 2018 amendment reduced the effective interest rate to
3.71%
.
In connection with the June 22, 2018 amendment of the Term Loan Facility, under accounting guidance, the Company applied modification accounting to the majority of the continuing lenders as the terms were not substantially different from the terms that applied to those lenders prior to the amendment. For the remaining lenders, the Company applied debt extinguishment accounting. The Company recorded a debt extinguishment loss of
$3 million
in interest expense, consisting primarily of a write-off of unamortized deferred financing costs related to the June 22, 2018 amendment. Unamortized deferred financing costs of
$7 million
at June 30, 2018 were carried forward and will be amortized through June 27, 2023, the maturity date of the Term Loan Facility.
The Term Loan Facility was also amended on February 17, 2017 and November 30, 2017 (the “2017 Amendments”), in each case to reduce the interest rate spread on outstanding borrowings, among other things.
In connection with the 2017 Amendments of the Term Loan Facility, under accounting guidance, the Company applied modification accounting to the majority of the continuing lenders as the terms were not substantially different from the terms that applied to those lenders prior to the amendment. For the remaining lenders, the Company applied debt extinguishment accounting. The Company recorded a debt extinguishment loss of
$2 million
in interest expense, consisting primarily of write-offs of unamortized deferred financing costs related to the 2017 Amendments.
Senior Notes—
The Senior Notes due 2024, with a carrying value of
$595 million
at
December 29, 2018
, net of
$5 million
of unamortized deferred financing costs, bear interest at
5.875%
. On or after June 15, 2019, this debt is redeemable, at USF’s option, in whole or in part at a price of
102.938%
of the remaining principal, plus accrued and unpaid interest, if any, to the redemption date. On June 15, 2020 and June 15, 2021, the optional redemption price for the debt declines to
101.469%
and
100.0%
, respectively, of the remaining principal amount, plus accrued and unpaid interest, if any, to the redemption date. Prior to June 15, 2019, up to
40%
of the debt may be redeemed with the aggregate proceeds from equity offerings, as defined in the Senior Notes indenture, as supplemented, at a redemption premium of
105.875%
.
63
Capital Leases–
Obligations under capital leases of
$352 million
at
December 29, 2018
consist of amounts due for transportation equipment and building leases.
2016 Debt Transactions and Loss on Extinguishment
IPO Proceeds
As discussed in Note 1, Overview and Basis of Presentation, in June 2016, US Foods completed its IPO. Net proceeds of
$1,114 million
were used to redeem
$1,090 million
in principal of USF’s Old Senior Notes and pay the related
$23 million
early redemption premium. The balance of the Old Senior Notes was redeemed with proceeds from the June 2016 refinancings further discussed below.
June 2016 Refinancings
In June 2016, USF entered into a series of transactions to refinance the
$2,042 million
principal of its Term Loan Facility, redeem the remaining
$258 million
principal of its Old Senior Notes and pay the related
$6 million
early redemption premium. The aggregate principal amount outstanding of the Term Loan Facility was increased to
$2,200 million
. Additionally, USF issued
$600 million
in principal amount of Senior Notes.
The debt redemption and refinancing transactions completed in June 2016 resulted in a loss on extinguishment of debt of
$42 million
, consisting of a
$29 million
early redemption premium related to the Old Senior Notes,
$7 million
of lender and third party fees, and a
$6 million
write-off of certain pre-existing unamortized deferred financing costs and premiums related to the refinanced and redeemed facilities.
CMBS Fixed Facility Defeasance
On September 23, 2016, USF, through a wholly owned subsidiary, legally defeased the commercial mortgage backed securities facility (the “CMBS Fixed Facility”), scheduled to mature on August 1, 2017. The CMBS Fixed Facility had an outstanding balance of
$471 million
net of unamortized deferred financing costs of
$1 million
. The cash outlay for the defeasance of
$485 million
represented the purchase price of U.S. government securities that would generate sufficient cash flow to fund interest payments from the effective date of the defeasance through, and including the repayment of, the
$472 million
principal for the CMBS Fixed Facility on February 1, 2017, the earliest date the loan could be prepaid. The defeasance resulted in a loss on extinguishment of debt of approximately
$12 million
, consisting of the difference between the purchase price of the U.S. government securities, not attributable to accrued interest through the effective date of the defeasance, and the outstanding principal of the CMBS Fixed Facility, and other costs of
$1 million
, consisting of unamortized deferred financing costs and other third party costs.
Security Interests
Substantially all of the Company’s assets are pledged under the various agreements governing our indebtedness. Debt under the ABS Facility is secured by certain designated receivables and, in certain circumstances, by restricted cash. The ABL Facility is secured by certain other designated receivables not pledged under the ABS Facility, as well as inventory and tractors and trailers owned by the Company. Additionally, the lenders under the ABL Facility have a second priority interest in the assets pledged under the Term Loan Facility. USF’s obligations under the Term Loan Facility are secured by all of the capital stock of USF and its direct and indirect wholly owned domestic subsidiaries, as defined in the agreements, and substantially all non-real estate assets of USF and its subsidiaries not pledged under the ABS Facility or the ABL Facility. Additionally, the lenders under the Term Loan Facility have a second priority interest in the inventory and tractors and trailers pledged under the ABL Facility. USF’s interest rate swap obligations are secured by the collateral securing the ABL Facility. Pursuant to the terms of the interest rate swap agreement between each of the interest rate swap counterparties and USF, each of the interest rate swap counterparties has agreed that its right to receive payment from the sale of the collateral is subordinate to the rights of the lenders under the ABL Facility. USF is not required to provide additional collateral to its hedge counterparties.
Restrictive Covenants
USF's credit facilities, loan agreements and indentures contain customary covenants. These include, among other things, covenants that restrict USF’s ability to incur certain additional indebtedness, create or permit liens on assets, pay dividends, or engage in mergers or consolidations. As of
December 29, 2018
, USF had
$991 million
of restricted payment capacity under these covenants, and approximately
$2,238 million
of its net assets were
64
restricted after taking into consideration the net deferred tax assets and intercompany balances that eliminate in consolidation.
Certain agreements governing our indebtedness also contain customary events of default. Those include, without limitation, the failure to pay interest or principal when it is due under the agreements, cross default provisions, the failure of representations and warranties contained in the agreements to be true when made, and certain insolvency events. If an event of default occurs and remains uncured, the principal amounts outstanding, together with all accrued unpaid interest and other amounts owed, may be declared immediately due and payable by the lenders. Were such an event to occur, the Company would be forced to seek new financing that may not be on as favorable terms as its current facilities. The Company’s ability to refinance its indebtedness on favorable terms, or at all, is directly affected by the current economic and financial conditions. In addition, the Company’s ability to incur secured indebtedness (which may enable it to achieve more favorable terms than the incurrence of unsecured indebtedness) depends in part on the value of its assets. This, in turn, is dependent on the strength of its cash flows, results of operations, economic and market conditions, and other factors.
|
13.
|
ACCRUED EXPENSES AND OTHER LONG-TERM LIABILITIES
|
Accrued expenses and other long-term liabilities consisted of the following.
|
December 29, 2018
|
December 30, 2017
|
||||||
|
Accrued expenses and other current liabilities:
|
|||||||
|
Salary, wages and bonus expenses
|
$
|
132
|
|
$
|
161
|
|
|
|
Operating expenses
|
75
|
|
68
|
|
|||
|
Workers’ compensation, general and fleet liability
|
39
|
|
49
|
|
|||
|
Group medical liability
|
28
|
|
29
|
|
|||
|
Customer rebates and other selling expenses
|
96
|
|
85
|
|
|||
|
Property and sales tax
|
30
|
|
28
|
|
|||
|
Interest payable
|
13
|
|
6
|
|
|||
|
Other
|
41
|
|
25
|
|
|||
|
Total accrued expenses and other current liabilities
|
$
|
454
|
|
$
|
451
|
|
|
|
Other long-term liabilities:
|
|||||||
|
Workers’ compensation, general and fleet liability
|
$
|
120
|
|
$
|
121
|
|
|
|
Accrued pension and other postretirement benefit obligations
|
40
|
|
130
|
|
|||
|
Financing lease obligation
|
21
|
|
24
|
|
|||
|
Uncertain tax positions
|
31
|
|
81
|
|
|||
|
Other
|
20
|
|
16
|
|
|||
|
Total Other long-term liabilities
|
$
|
232
|
|
$
|
372
|
|
|
Self-Insured Liabilities —
The Company is self-insured for general liability, fleet liability and workers’ compensation claims. Claims in excess of certain levels are insured. The workers’ compensation liability, included in the table above under “workers’ compensation, general liability and fleet liability,” is recorded at present value. This table summarizes self-insurance liability activity for the last three fiscal years:
|
2018
|
2017
|
2016
|
|||||||||
|
Balance at beginning of the year
|
$
|
170
|
|
$
|
164
|
|
$
|
172
|
|
||
|
Charged to costs and expenses
|
56
|
|
64
|
|
59
|
|
|||||
|
Reinsurance recoverable
|
7
|
|
8
|
|
—
|
|
|||||
|
Payments
|
(74
|
)
|
(66
|
)
|
(67
|
)
|
|||||
|
Balance at end of the year
|
$
|
159
|
|
$
|
170
|
|
$
|
164
|
|
||
|
Discount rate
|
2.50
|
%
|
1.98
|
%
|
1.47
|
%
|
|||||
65
Estimated future payments for self-insured liabilities are as follows:
|
2019
|
$
|
40
|
|
|
2020
|
24
|
|
|
|
2021
|
17
|
|
|
|
2022
|
12
|
|
|
|
2023
|
10
|
|
|
|
Thereafter
|
66
|
|
|
|
Total self-insured liability
|
169
|
|
|
|
Less amount representing interest
|
(10
|
)
|
|
|
Present value of self-insured liability
|
$
|
159
|
|
|
14.
|
RESTRUCTURING LIABILITIES
|
The following table summarizes the changes in the restructuring liabilities for the last three fiscal years:
|
Severance and Related Costs
|
Facility Closing Costs
|
Total
|
|||||||||
|
Balance at January 2, 2016
|
$
|
119
|
|
$
|
—
|
|
$
|
119
|
|
||
|
Current year charges
|
71
|
|
3
|
|
74
|
|
|||||
|
Change in estimate
|
(21
|
)
|
—
|
|
(21
|
)
|
|||||
|
Payments and usage—net of accretion
|
(147
|
)
|
(2
|
)
|
(149
|
)
|
|||||
|
Balance at December 31, 2016
|
22
|
|
1
|
|
23
|
|
|||||
|
Current year charges
|
7
|
|
—
|
|
7
|
|
|||||
|
Change in estimate
|
(5
|
)
|
—
|
|
(5
|
)
|
|||||
|
Payments and usage—net of accretion
|
(20
|
)
|
—
|
|
(20
|
)
|
|||||
|
Balance at December 30, 2017
|
4
|
|
1
|
|
5
|
|
|||||
|
Current year charges
|
1
|
|
—
|
|
1
|
|
|||||
|
Payments and usage—net of accretion
|
(4
|
)
|
—
|
|
(4
|
)
|
|||||
|
Balance at December 29, 2018
|
$
|
1
|
|
$
|
1
|
|
$
|
2
|
|
||
The Company periodically closes or consolidates distribution facilities and implements initiatives in its ongoing efforts to reduce costs and improve operating effectiveness. In connection with these activities, the Company incurs various costs including multiemployer pension withdrawal liabilities and settlements, severance and other employee separation costs that are included in the above table.
2018
Activities
During fiscal year 2018,
$1 million
was recognized primarily for severance and related costs associated with a 2018 distribution facility closure and additional costs for current year and prior year initiatives.
2017
Activities
During fiscal year
2017
, the Company incurred a net charge of
$2 million
, primarily for severance and related costs associated with its efforts to streamline its corporate back office organization and centralize replenishment activities.
2016
Activities
During fiscal year
2016
, the Company incurred a net charge of
$50 million
for severance and related costs associated with its efforts to streamline its field operations model, streamline its corporate back office organization, centralize replenishment activities and complete the closure of a distribution facility. The Company also incurred
$3 million
in facility closing costs related to a lease termination settlement.
66
|
15.
|
RELATED PARTY TRANSACTIONS
|
During fiscal year 2017, the Company completed four secondary offerings of its common stock held primarily by investment funds associated with or designated by Clayton, Dubilier & Rice, LLC (“CD&R”) and Kohlberg Kravis Roberts & Co., L.P. (“KKR” and, together with CD&R, the “Former Sponsors”). Following the completion of the final offering in December 2017, the Former Sponsors no longer held any shares of the Company’s common stock. The Company did not receive any proceeds from the offerings. The December 2017 offering also included the Company’s repurchase of
10,000,000
shares of common stock from the underwriter at
$28.00
per share, which was the price the underwriter purchased the shares from the Former Sponsors in the offering. The
$280 million
paid for the share repurchase reduced additional paid-in capital
$96 million
, with the remaining
$184 million
recognized in retained earnings as a constructive dividend.
The closing of the Company’s share repurchase occurred substantially concurrently with the closing of the offering, and the repurchased shares were retired. In accordance with terms of the prior registration rights agreement with the Former Sponsors, the Company incurred approximately
$5 million
of expenses in connection with the offerings, approximately
$1 million
of which was incurred in 2016. Underwriting discounts and commissions were paid by the selling stockholders.
KKR Capital Markets LLC (“KKR Capital Markets”), an affiliate of KKR, received a de minimis fee for services rendered in connection with the February 2017 amendment of the Term Loan Facility. Additionally, KKR Capital Markets received underwriter discounts and commissions of
$5 million
in connection with the Company’s IPO, and
$1 million
for services rendered in connection with the Company's June 2016 debt refinancing transactions.
The Company was previously a party to consulting agreements with each of the Former Sponsors pursuant to which each Former Sponsor provided the Company with ongoing consulting and management advisory services and received fees and reimbursement of related out of pocket expenses. On June 1, 2016, the consulting agreements with each of the Former Sponsors were terminated. For fiscal year 2016, the Company recorded
$36 million
in fees and expenses, including an aggregate termination fee of
$31 million
. All fees paid to the Former Sponsors, including the termination fees, were reported in distribution, selling and administrative costs in the Company's Consolidated Statements of Comprehensive Income.
On January 8, 2016, the Company paid a
$666 million
, or
$3.94
per share, one-time special cash distribution to its stockholders of record as of January 4, 2016, of which
$657 million
was paid to the Former Sponsors. The distribution was funded with cash on hand and approximately
$314 million
of additional borrowings under the Company’s credit facilities.
The Company has no plans to pay dividends currently, or in the foreseeable future, and has never paid dividends on its common stock, other than the January 2016 one-time special cash distribution. Any decision to declare and pay dividends in the future will be made at the sole discretion of our Board of Directors.
|
16.
|
SHARE-BASED COMPENSATION, COMMON STOCK ISSUANCES AND COMMON STOCK
|
Since June 2016, the Company has granted stock-based awards to its directors, officers and other eligible employees under the US Foods Holding Corp. 2016 Omnibus Incentive Plan (the “2016 Plan”). Up to
9 million
shares of common stock are available for issuance under the 2016 Plan. Prior to June 2016, share-based awards were granted to the Company’s directors, officers and other eligible employees under the 2007 Stock Incentive Plan (the “2007 Plan”). The 2007 Plan terminated according to its terms on December 21, 2017, which meant that no shares were available for future issues under that plan. However, the termination of the 2007 Plan had no effect on any previously granted and outstanding stock-based awards.
Total compensation expense related to share-based arrangements was
$28 million
,
$21 million
and
$18 million
for fiscal years
2018
,
2017
and
2016
, respectively, and is reflected in distribution, selling and administrative costs in the Company's Consolidated Statement of Comprehensive Income.
No
share-based compensation cost was capitalized as part of the cost of an asset during those years. The total income tax benefit associated with share-based compensation recorded in the Company's Consolidated Statement of Comprehensive Income was
$6 million
,
$7 million
and
$6 million
for fiscal years
2018
,
2017
and
2016
, respectively.
Common Stock Issuances
—Certain employees purchased shares of our common stock, pursuant to a management stockholder’s agreement associated with the 2007 Plan. These shares are subject to the terms and conditions (including certain restrictions on transfer) of each management stockholder’s agreement, other documents signed at the time of purchase, and pursuant to the applicable law.
67
In August 2016, the Company established the US Foods Holding Corp. Employee Stock Purchase Plan (the “ESPP”) to provide its eligible employees with the opportunity to acquire common shares of the Company. In May 2018, the ESPP was amended and restated to increase the number of shares available for purchase under the plan from
1,250,000
to
4,750,000
.
The ESPP provides participants with a discount of
15%
of the fair market value of the common stock on the date of purchase, and as such, the plan is considered compensatory for tax purposes. The Company recorded
$3 million
,
$3 million
and
$1 million
of stock-based compensation expense for fiscal years
2018
,
2017
and
2016
, respectively, associated with the ESPP.
Stock Options
—The Company has granted to certain directors, officers and employees time-based options (“Time Options”) and performance-based options (“Performance Options” and, together with the Time Options, the “Options”) to purchase shares of our common stock. These Options are subject to the terms and conditions set forth in the relevant incentive plan documents and stock option agreements pursuant to which they were granted. The Options also contain certain anti-dilution provisions.
The Time Options vest and become exercisable ratably over periods of
three
to
four
years, either on the anniversary date of the grant or the last day of each fiscal year, beginning with the fiscal year issued. Compensation expense related to Time Options was
$7 million
in fiscal year
2018
and
$4 million
for fiscal years
2017
and
2016
.
The Performance Options also vest and become exercisable ratably over
four
years, either on the anniversary date of the grant or the last day of each fiscal year, beginning with the fiscal year issued, provided that the Company achieves an annual financial performance target established by the Compensation Committee of our Board of Directors (the “Committee”). Awards granted prior to 2016 were subject to annual and, if applicable, cumulative performance targets for each of the four fiscal years, which were established by the Committee at the beginning of each respective fiscal year. As a result, under GAAP, the Performance Options were deemed to have been granted each year on the date when the annual financial performance target for the respective tranche of the option was established by the Committee. Performance Options granted prior to the 2016 award contain a catch-up vesting provision to the extent that the applicable annual financial performance target is not met.
The Company recorded compensation expense of
$1 million
,
$3 million
and
$4 million
for fiscal years
2018
,
2017
and
2016
, respectively, for the expected vesting of the Performance Options.
The Options are nonqualified, with exercise prices equal to the estimated fair value of a share of common stock at the date of the grant. Exercise prices range from
$8.51
to
$33.56
per share and generally have a
10
-year life. The fair value of each Option is estimated as of the date of grant using a Black-Scholes option-pricing model.
The weighted-average assumptions for Options granted in fiscal years
2018
,
2017
and
2016
are included in the following table.
|
2018
|
2017
|
2016
|
||||||
|
Expected volatility
|
35.7
|
%
|
31.8
|
%
|
28.8
|
%
|
||
|
Expected dividends
|
—
|
|
—
|
|
—
|
|
||
|
Risk-free interest rate
|
2.6
|
%
|
1.9
|
%
|
1.5
|
%
|
||
|
Expected term (in years)
|
5.4
|
|
5.8
|
|
5.9
|
|
||
Expected volatility is calculated leveraging the historical volatility of public companies similar to US Foods. The assumed dividend yield is
zero
, because the Company has not historically paid dividends. However, as further discussed in Note 15, Related Party Transactions, the Company paid a one-time, special cash distribution to stockholders before the IPO in January 2016. The risk-free interest rate is the implied zero-coupon yield for U.S. Treasury securities having a maturity approximately equal to the expected term, as of the grant date. Due to a lack of relevant historical data, the simplified approach was used to determine the expected term of the options.
68
The summary of Options outstanding and changes during fiscal year
2018
are presented below.
|
Time
Options
|
Performance
Options
|
Total
Options
|
Weighted-
Average Fair Value
|
Weighted-
Average Exercise Price
|
Weighted-
Average Remaining Contractual Years
|
|||||||||||||
|
Outstanding at December 30, 2017
|
3,009,552
|
|
1,605,417
|
|
4,614,969
|
|
$
|
7.47
|
|
$
|
18.79
|
|
||||||
|
Granted
|
680,863
|
|
365,381
|
|
1,046,244
|
|
$
|
14.55
|
|
$
|
28.69
|
|
||||||
|
Exercised
|
(726,989
|
)
|
(699,135
|
)
|
(1,426,124
|
)
|
$
|
6.55
|
|
$
|
14.34
|
|
||||||
|
Forfeited
|
(249,862
|
)
|
(48,831
|
)
|
(298,693
|
)
|
$
|
10.50
|
|
$
|
26.59
|
|
||||||
|
Outstanding at December 29, 2018
|
2,713,564
|
|
1,222,832
|
|
3,936,396
|
|
$
|
9.45
|
|
$
|
22.44
|
|
7.1
|
|||||
|
Vested and exercisable at December 29, 2018
|
1,103,649
|
|
883,591
|
|
1,987,240
|
|
$
|
7.55
|
|
$
|
17.97
|
|
6.1
|
|||||
The weighted-average grant date fair value of Options granted for fiscal years
2018
,
2017
and
2016
was
$14.55
,
$11.08
and
$6.28
, respectively.
During fiscal year
2018
, Options were exercised with a total intrinsic value of
$28 million
, representing the excess of fair value over exercise price.
During fiscal year
2017
, Options were exercised with a total intrinsic value of
$86 million
, representing the excess of fair value over exercise price.
During fiscal year 2016, Options were exercised by terminated employees for a cash outflow of
$4 million
, representing the excess of fair value over exercise price.
As of
December 29, 2018
, there were
$12 million
of total unrecognized compensation costs related to unvested Options expected to vest, which is expected to be recognized over a weighted-average period of
two
years.
Restricted Shares
—Certain officers and employees were granted restricted shares (the “Restricted Shares”) in fiscal years
2018
,
2017
and
2016
granted under the 2016 Plan. Prior to 2017, the Restricted Shares contained time-based vesting (the “Time-Based Restricted Shares”) and non-forfeitable dividend rights, none of which remain unvested. In fiscal year
2018
and
2017
, the restricted shares were subject to performance conditions (the “Performance Restricted Shares”) and contained forfeitable dividend rights.
The Performance Restricted Shares were granted assuming the maximum award amount and vest on the third anniversary of the grant date if specific performance goals over a three-year performance period are achieved. The number of shares eligible to vest on the vesting date range from
zero
to
200%
of the target award amount, based on the achievement of the performance goals. The fair value of the Performance Restricted Shares is measured using the fair market value of our common stock on the date of grant and recognized over the three-year vesting period for the portion of the award that is expected to vest. Compensation expense for the Performance Restricted Shares is remeasured at the end of each reporting period, based on management’s evaluation of whether it is probable that performance conditions will be met.
The summary of unvested Performance Restricted Shares outstanding and changes during fiscal year
2018
is presented below:
|
Performance Restricted
Shares
|
Weighted-
Average
Fair
Value
|
||||||
|
Unvested at December 30, 2017
|
$
|
241,313
|
|
$
|
30.39
|
|
|
|
Granted
|
249,314
|
|
$
|
33.56
|
|
||
|
Vested
|
—
|
|
$
|
—
|
|
||
|
Forfeited
|
(41,804
|
)
|
$
|
31.90
|
|
||
|
Unvested at December 29, 2018
|
$
|
448,823
|
|
$
|
32.01
|
|
|
The weighted-average grant date fair value for the Performance Restricted Shares granted in fiscal years
2018
,
2017
and
2016
was
$33.56
,
$30.39
and
$14.58
, respectively. Compensation expense for the Restricted Shares was
$2 million
,
$1 million
and
$2 million
for fiscal years
2018
,
2017
and
2016
, respectively. At
December 29, 2018
, there was
$4 million
of unrecognized compensation expense related to the Performance Restricted Shares that is expected to be recognized over a weighted average period of
two
years.
69
Restricted Stock Units
—Certain directors, officers and employees have been granted time-based restricted stock units (the “Time-Based RSUs”) and/or performance-based restricted stock units (the “Performance RSUs” and, collectively with the Time-Based RSUs, the “RSUs”) pursuant to the 2007 Plan and, after the IPO, pursuant to the 2016 Plan. The RSUs contain certain anti-dilution provisions. The Time-Based RSUs generally vest ratably over
three
to
four
years, starting on the anniversary date of grant. For fiscal years
2018
,
2017
and
2016
, the Company recognized
$12 million
,
$6 million
and
$4 million
, respectively, in compensation expense related to the Time-Based RSUs.
Prior to fiscal year 2017, the Performance RSUs vested ratably over four years, either on the anniversary of the date of grant, or the last day of each fiscal year (beginning with the fiscal year in which they were granted), based on the achievement of an annual operating performance target applicable to each tranche. For grants of Performance RSUs made prior to fiscal year 2016, those targets also provided for catch-up vesting if the respective annual financial performance target was not achieved but a subsequent cumulative financial performance target was achieved. Beginning in fiscal year 2017, the Performance RSUs vest at the end of a three-year vesting period based on achievement of certain, pre-established year over year Adjusted EBITDA growth and return on invested capital goals during a three-year performance period. The number of shares earned at the end of the vesting period range from
zero
to
200%
based on the relative achievement of the performance goals.
The fair value of each share underlying the Performance RSUs is measured at the fair market value of our common stock on the date of grant and recognized over the vesting period for the portion of the award that is expected to vest. Compensation expense for the Performance RSUs is remeasured at the end of each reporting period, based on management’s evaluation of whether it is probable that the performance conditions will be met.
The Company recognized
$3 million
of compensation expense in fiscal year
2018
for Performance RSUs that are expected to vest. The Company recognized
$3 million
of compensation expense in fiscal year 2017 for the Performance RSUs that, at the end of fiscal year 2017 were expected to vest. The Company recognized
$4 million
of compensation expense in fiscal year
2016
for the Performance RSUs that, at the end of fiscal year 2016, were expected to vest.
A summary of unvested RSUs outstanding and changes during fiscal year
2018
is presented below.
|
Time-Based
RSUs
|
Performance
RSUs
|
Total
RSUs
|
Weighted-
Average
Fair
Value
|
|||||||||
|
Unvested at December 30, 2017
|
909,292
|
|
276,553
|
|
1,185,845
|
|
$
|
26.79
|
|
|||
|
Granted
|
564,951
|
|
269,116
|
|
834,067
|
|
$
|
33.48
|
|
|||
|
Vested
|
(310,495
|
)
|
(127,276
|
)
|
(437,771
|
)
|
$
|
25.91
|
|
|||
|
Forfeited
|
(126,907
|
)
|
(61,677
|
)
|
(188,584
|
)
|
$
|
29.45
|
|
|||
|
Unvested at December 29, 2018
|
1,036,841
|
|
356,716
|
|
1,393,557
|
|
$
|
30.71
|
|
|||
The weighted-average grant date fair values for the RSUs granted in fiscal years
2018
,
2017
, and
2016
was
$33.48
,
$29.77
and
$18.75
, respectively.
At
December 29, 2018
, there was
$27 million
of unrecognized compensation cost related to the RSUs that is expected to be recognized over a weighted-average period of
two
years.
Equity Appreciation Rights
—The Company has an Equity Appreciation Rights (“EAR”) plan for certain employees. Each EAR represents one phantom share of our common stock. The EARs also contain certain anti-dilution provisions. The EARs vest and become payable at the time of a participant's involuntary termination of employment or a change in control of the Company, in each case, as defined in the applicable agreement. EARs are forfeited upon voluntary termination of the participant’s employment. The EARs are settled in cash upon vesting and, accordingly, are considered liability instruments.
No
EARs were granted during fiscal years
2018
,
2017
and
2016
. Compensation expense for the EARs which vested for participants whose employment was involuntarily terminated during fiscal years
2018
,
2017
and
2016
was de minimis.
70
As the EARs are liability instruments, the fair value of the awards is re-measured each reporting period until the award vests and is settled. Since vesting of all outstanding EARs is contingent upon performance conditions, as defined in the EAR plan, which are not considered probable,
no
compensation expense has been recorded to date for the outstanding EARs, except for that related to participants whose employment was involuntarily terminated, and as such,
no
liability has been recognized. As of
December 29, 2018
, there were a total of
344,359
EARs outstanding with a weighted average exercise price of
$9.81
per share.
|
17.
|
LEASES
|
The Company leases various warehouse and office facilities and certain equipment under operating and capital lease agreements that expire at various dates, and in some instances contain renewal provisions. The Company expenses operating lease costs, including any scheduled rent increases, rent holidays or landlord concessions, on a straight-line basis over the lease term. The Company also has a financing lease obligation on a distribution facility through 2023.
Future minimum lease payments under the above mentioned noncancelable lease agreements, together with contractual sublease income, as of
December 29, 2018
, were as follows:
|
Financing Lease
Obligation
|
Capital Leases
|
Operating Leases
|
Sublease Income
|
Net
|
|||||||||||||||
|
2019
|
$
|
4
|
|
$
|
95
|
|
$
|
31
|
|
$
|
(1
|
)
|
$
|
129
|
|
||||
|
2020
|
5
|
|
84
|
|
29
|
|
—
|
|
118
|
|
|||||||||
|
2021
|
5
|
|
71
|
|
25
|
|
—
|
|
101
|
|
|||||||||
|
2022
|
5
|
|
54
|
|
22
|
|
—
|
|
81
|
|
|||||||||
|
2023
|
5
|
|
43
|
|
18
|
|
—
|
|
66
|
|
|||||||||
|
Thereafter
|
—
|
|
38
|
|
7
|
|
—
|
|
45
|
|
|||||||||
|
Total minimum lease payments (receipts)
|
24
|
|
385
|
|
$
|
132
|
|
$
|
(1
|
)
|
$
|
540
|
|
||||||
|
Less amount representing interest
|
(4
|
)
|
(33
|
)
|
|||||||||||||||
|
Present value of minimum lease payments
|
$
|
20
|
|
$
|
352
|
|
|||||||||||||
Total operating lease expense, included in distribution, selling and administrative costs in the Company’s Consolidated Statements of Comprehensive Income, was
$46 million
,
$44 million
and
$43 million
for fiscal years
2018
,
2017
and
2016
, respectively.
|
18.
|
RETIREMENT PLANS
|
The Company has defined benefit and defined contribution retirement plans for its employees, and provides certain postretirement health and welfare benefits to eligible retirees and their dependents. Also, the Company contributes to various multiemployer plans under certain of its collective bargaining agreements.
Company Sponsored Defined Benefit Plans
—The Company maintains a qualified retirement plan and a nonqualified retirement plan (“Retirement Plans”) that pay benefits to certain employees at retirement, using formulas based on a participant’s years of service and compensation. The Company also maintains postretirement health and welfare plans for certain employees. Amounts related to the defined benefit and other postretirement plans recognized in the Company's consolidated financial statements are determined on an actuarial basis.
71
The components of net periodic pension benefit (credits) costs for the last three fiscal years were as follows:
|
2018
|
2017
|
2016
|
|||||||||
|
Components of net periodic pension (credits) benefit costs:
|
|||||||||||
|
Service cost
|
$
|
2
|
|
$
|
2
|
|
$
|
4
|
|
||
|
Interest cost
|
36
|
|
40
|
|
41
|
|
|||||
|
Expected return on plan assets
|
(52
|
)
|
(48
|
)
|
(48
|
)
|
|||||
|
Amortization of net loss
|
3
|
|
4
|
|
8
|
|
|||||
|
Settlements
|
—
|
|
18
|
|
4
|
|
|||||
|
Net periodic pension (credits) benefit costs
|
$
|
(11
|
)
|
$
|
16
|
|
$
|
9
|
|
||
Other postretirement (credits) benefit costs were de minimis for fiscal years
2018
,
2017
and
2016
.
The service cost component of net periodic (credits) benefit costs is included in distribution, selling and administrative costs, while the other components of net periodic (credits) benefit costs are included in other income—net, respectively, in the Company's Consolidated Statements of Comprehensive Income.
The Company contributed approximately
$71 million
to its defined benefit and other postretirement plans during fiscal year 2018, of which
$35 million
represented an additional, voluntary contribution to the defined benefit plan. As a result of the incremental voluntary contribution, the Company remeasured its defined benefit pension liability as of May 31, 2018, resulting in a reduction in the benefit obligation of
$33 million
, with a corresponding benefit to accumulated other comprehensive loss. The remeasurement had an immaterial impact on the 2018 annual net periodic (credits) benefit costs.
The Company incurred non-cash settlement charges of
$18 million
and
$4 million
for fiscal years
2017
and
2016
, respectively, resulting from lump sum benefit payments.
No
non-cash settlement charges were incurred in
2018
. All lump sum benefit payments were paid from plan assets.
72
Changes in plan assets and benefit obligations recorded in accumulated other comprehensive loss for pension benefits for the last three fiscal years were as follows:
|
2018
|
2017
|
2016
|
|||||||||
|
Changes recognized in accumulated other comprehensive loss:
|
|||||||||||
|
Actuarial gain (loss)
|
$
|
6
|
|
$
|
—
|
|
$
|
(63
|
)
|
||
|
Prior year correction
(1)
|
—
|
|
—
|
|
(22
|
)
|
|||||
|
Amortization of net loss
|
3
|
|
4
|
|
8
|
|
|||||
|
Settlements
|
—
|
|
18
|
|
4
|
|
|||||
|
Net amount recognized
|
$
|
9
|
|
$
|
22
|
|
$
|
(73
|
)
|
||
|
(1)
|
I
n the second quarter of fiscal year 2016, the Company recorded a
$22 million
increase to its pension obligation, with a corresponding increase to accumulated other comprehensive loss, to correct a computational error related to a 2015 pension plan freeze. The Company determined the error did not materially impact the financial statements for any of the periods reported.
|
Changes in plan assets and benefit obligations recorded in accumulated other comprehensive loss for other postretirement benefits for the last three fiscal years were de minimis.
The funded status of the defined benefit plans for the last three fiscal years was as follows:
|
Pension Benefits
|
|||||||||||
|
2018
|
2017
|
2016
|
|||||||||
|
Change in benefit obligation:
|
|||||||||||
|
Benefit obligation at beginning of year
|
$
|
976
|
|
$
|
966
|
|
$
|
863
|
|
||
|
Service cost
|
2
|
|
2
|
|
4
|
|
|||||
|
Interest cost
|
36
|
|
40
|
|
41
|
|
|||||
|
Actuarial (gain) loss
|
(97
|
)
|
76
|
|
73
|
|
|||||
|
Prior year correction
|
—
|
|
—
|
|
22
|
|
|||||
|
Settlements
|
—
|
|
(87
|
)
|
(16
|
)
|
|||||
|
Benefit disbursements
|
(46
|
)
|
(21
|
)
|
(21
|
)
|
|||||
|
Benefit obligation at end of year
|
871
|
|
976
|
|
966
|
|
|||||
|
Change in plan assets:
|
|||||||||||
|
Fair value of plan assets at beginning of year
|
851
|
|
799
|
|
742
|
|
|||||
|
Return on plan assets
|
(40
|
)
|
124
|
|
58
|
|
|||||
|
Employer contribution
|
71
|
|
36
|
|
36
|
|
|||||
|
Settlements
|
—
|
|
(87
|
)
|
(16
|
)
|
|||||
|
Benefit disbursements
|
(46
|
)
|
(21
|
)
|
(21
|
)
|
|||||
|
Fair value of plan assets at end of year
|
836
|
|
851
|
|
799
|
|
|||||
|
Net funded status
|
$
|
(35
|
)
|
$
|
(125
|
)
|
$
|
(167
|
)
|
||
The fiscal year
2018
pension benefits actuarial gain of
$97 million
was primarily due to an increase in the discount rate. The
2017
and
2016
pension benefits actuarial losses of
$76 million
and
$73 million
, respectively, were primarily due to decreases in discount rates.
73
|
Other Postretirement Plans
|
|||||||||||
|
2018
|
2017
|
2016
|
|||||||||
|
Change in benefit obligation:
|
|||||||||||
|
Benefit obligation at beginning of year
|
$
|
7
|
|
$
|
7
|
|
$
|
7
|
|
||
|
Benefit disbursements
|
(1
|
)
|
(1
|
)
|
(1
|
)
|
|||||
|
Other
|
—
|
|
1
|
|
1
|
|
|||||
|
Benefit obligation at end of year
|
6
|
|
7
|
|
7
|
|
|||||
|
Change in plan assets:
|
|||||||||||
|
Fair value of plan assets at beginning of year
|
—
|
|
—
|
|
—
|
|
|||||
|
Employer contribution
|
1
|
|
1
|
|
1
|
|
|||||
|
Benefit disbursements
|
(1
|
)
|
(1
|
)
|
(1
|
)
|
|||||
|
Fair value of plan assets at end of year
|
—
|
|
—
|
|
—
|
|
|||||
|
Net funded status
|
$
|
(6
|
)
|
$
|
(7
|
)
|
$
|
(7
|
)
|
||
Service cost, interest cost and actuarial (gain) loss for other postretirement benefits were de minimis for fiscal years
2018
,
2017
and
2016
.
|
Pension Benefits
|
|||||||||||
|
2018
|
2017
|
2016
|
|||||||||
|
Amounts recognized in the consolidated
balance sheets consist of the following:
|
|||||||||||
|
Accrued benefit obligation—current
|
$
|
—
|
|
$
|
(1
|
)
|
$
|
(1
|
)
|
||
|
Accrued benefit obligation—noncurrent
|
(35
|
)
|
(124
|
)
|
(166
|
)
|
|||||
|
Net amount recognized in the consolidated
balance sheets
|
$
|
(35
|
)
|
$
|
(125
|
)
|
$
|
(167
|
)
|
||
|
Amounts recognized in accumulated other
comprehensive loss consist of the following:
|
|||||||||||
|
Net loss
|
$
|
190
|
|
$
|
199
|
|
$
|
221
|
|
||
|
Net loss recognized in accumulated other
comprehensive loss
|
$
|
190
|
|
$
|
199
|
|
$
|
221
|
|
||
|
Additional information:
|
|||||||||||
|
Accumulated benefit obligation
|
$
|
869
|
|
$
|
974
|
|
$
|
963
|
|
||
|
Other Postretirement Plans
|
|||||||||||
|
2018
|
2017
|
2016
|
|||||||||
|
Amounts recognized in the consolidated
balance sheets consist of the following:
|
|||||||||||
|
Accrued benefit obligation—current
|
$
|
(1
|
)
|
$
|
(1
|
)
|
$
|
(1
|
)
|
||
|
Accrued benefit obligation—noncurrent
|
(5
|
)
|
(6
|
)
|
(6
|
)
|
|||||
|
Net amount recognized in the consolidated
balance sheets
|
$
|
(6
|
)
|
$
|
(7
|
)
|
$
|
(7
|
)
|
||
|
Amounts recognized in accumulated other
comprehensive loss consist of the following:
|
|||||||||||
|
Gain, net of prior service cost
|
$
|
1
|
|
$
|
1
|
|
$
|
1
|
|
||
|
Net gain recognized in accumulated other
comprehensive loss
|
$
|
1
|
|
$
|
1
|
|
$
|
1
|
|
||
74
|
Pension Benefits
|
|||
|
Amounts expected to be amortized from
accumulated other comprehensive loss in the
next fiscal year:
|
|||
|
Net loss
|
$
|
4
|
|
|
Net expected to be amortized
|
$
|
4
|
|
Amounts expected to be amortized from accumulated other comprehensive loss in the next fiscal year for other postretirement benefits are expected to be de minimis.
Weighted average assumptions used to determine benefit obligations at period-end and net pension costs for the last three fiscal years were as follows:
|
Pension Benefits
|
||||||||
|
2018
|
2017
|
2016
|
||||||
|
Benefit obligation:
|
||||||||
|
Discount rate
|
4.35
|
%
|
3.70
|
%
|
4.25
|
%
|
||
|
Annual compensation increase
|
3.60
|
%
|
3.60
|
%
|
3.60
|
%
|
||
|
Net cost:
|
||||||||
|
Discount rate
|
3.70
|
%
|
4.25
|
%
|
4.64
|
%
|
||
|
Expected return on plan assets
|
6.00
|
%
|
6.00
|
%
|
6.50
|
%
|
||
|
Annual compensation increase
|
3.60
|
%
|
3.60
|
%
|
3.60
|
%
|
||
|
Other Postretirement Plans
|
||||||||
|
2018
|
2017
|
2016
|
||||||
|
Benefit obligation—discount rate
|
4.35
|
%
|
3.70
|
%
|
4.25
|
%
|
||
|
Net cost—discount rate
|
3.70
|
%
|
4.25
|
%
|
4.40
|
%
|
||
The measurement date for the defined benefit and other postretirement benefit plans was December 31 for
2018
,
2017
and
2016
. The Company applies the practical expedient under ASU No. 2015-4 to measure defined benefit retirement obligations and related plan assets as of the month-end that is closest to its fiscal year-end.
The mortality assumptions used to determine the pension benefit obligation as of December 31, 2018 are based on the RP-2014 base mortality table with the MP-2018 mortality improvement scale published by the Society of Actuaries.
A health care cost trend rate is used in the calculations of postretirement medical benefit plan obligations. The assumed healthcare trend rates for the last three fiscal years were as follows:
|
2018
|
2017
|
2016
|
||||||
|
Immediate rate
|
6.30
|
%
|
6.70
|
%
|
7.40
|
%
|
||
|
Ultimate trend rate
|
4.50
|
%
|
4.50
|
%
|
4.50
|
%
|
||
|
Year the rate reaches the ultimate trend rate
|
2037
|
|
2037
|
|
2037
|
|
||
A
1%
change in the rate would result in a change to the postretirement medical plan obligation of less than
$1 million
. Retirees covered under these plans are responsible for the cost of coverage in excess of the subsidy, including all future cost increases.
In determining the discount rate, the Company determines the implied rate of return on a hypothetical portfolio of high-quality fixed-income investments, for which the timing and amount of cash outflows approximates the estimated pension plan payouts. The discount rate assumption is reviewed annually and revised as appropriate.
75
The expected long-term rate of return on plan assets is derived from a mathematical asset model. This model incorporates assumptions on the various asset class returns, reflecting a combination of historical performance analysis and the forward-looking views of the financial markets regarding the yield on long-term bonds and the historical returns of the major stock markets. The rate of return assumption is reviewed annually and revised as deemed appropriate.
The investment objective for the Company sponsored plans is to provide a common investment platform. Investment managers, overseen by the US Foods, Inc. Benefits Administration Committee, are expected to adopt and maintain an asset allocation strategy for the plans’ assets designed to address the Retirement Plans’ liability structure. The Company has developed an asset allocation policy and rebalancing policy. The Benefits Administration Committee reviews the major asset classes, through consultation with its investment consultants, periodically to determine if the plan assets are performing as expected. The Company’s 2018 strategy initially targeted a mix of
50%
equity securities and
50%
long-term debt securities and cash equivalents. During 2018, the Company revised its target to a mix of
35%
equity securities and
65%
long-term debt securities and cash equivalents. The actual mix of investments at
December 29, 2018
was
30%
equity securities and
70%
long-term debt securities and cash equivalents. The Company plans to manage the actual mix of investments to achieve its target mix.
The following table sets forth the fair value of our defined benefit plans’ assets by asset fair value hierarchy level.
|
Asset Fair Value as of December 29, 2018
|
|||||||||||||||
|
Level 1
|
Level 2
|
Level 3
|
Total
|
||||||||||||
|
Cash and cash equivalents
|
$
|
5
|
|
$
|
—
|
|
$
|
—
|
|
$
|
5
|
|
|||
|
Equities:
|
|||||||||||||||
|
Domestic
|
34
|
|
—
|
|
—
|
|
34
|
|
|||||||
|
International
|
1
|
|
—
|
|
—
|
|
1
|
|
|||||||
|
Mutual fund:
|
|||||||||||||||
|
International equities
|
21
|
|
—
|
|
—
|
|
21
|
|
|||||||
|
Long-term debt securities:
|
|||||||||||||||
|
Corporate debt securities:
|
|||||||||||||||
|
Domestic
|
—
|
|
236
|
|
—
|
|
236
|
|
|||||||
|
International
|
—
|
|
33
|
|
—
|
|
33
|
|
|||||||
|
U.S. government securities
|
—
|
|
8
|
|
—
|
|
8
|
|
|||||||
|
Other
|
—
|
|
2
|
|
—
|
|
2
|
|
|||||||
|
$
|
61
|
|
$
|
279
|
|
$
|
—
|
|
340
|
|
|||||
|
Common collective trust funds:
|
|||||||||||||||
|
Cash equivalents
|
9
|
|
|||||||||||||
|
Domestic equities
|
156
|
|
|||||||||||||
|
International equities
|
40
|
|
|||||||||||||
|
Treasury STRIPS
|
291
|
|
|||||||||||||
|
Total investments measured at net asset value
as a practical expedient
|
496
|
|
|||||||||||||
|
Total defined benefit plans’ assets
|
$
|
836
|
|
||||||||||||
76
|
Asset Fair Value as of December 30, 2017
|
|||||||||||||||
|
Level 1
|
Level 2
|
Level 3
|
Total
|
||||||||||||
|
Cash and cash equivalents
|
$
|
8
|
|
$
|
—
|
|
$
|
—
|
|
$
|
8
|
|
|||
|
Equities:
|
|||||||||||||||
|
Domestic
|
34
|
|
—
|
|
—
|
|
34
|
|
|||||||
|
International
|
1
|
|
—
|
|
—
|
|
1
|
|
|||||||
|
Mutual funds:
|
|||||||||||||||
|
Domestic equities
|
37
|
|
—
|
|
—
|
|
37
|
|
|||||||
|
International equities
|
32
|
|
—
|
|
—
|
|
32
|
|
|||||||
|
Long-term debt securities:
|
|||||||||||||||
|
Corporate debt securities:
|
|||||||||||||||
|
Domestic
|
—
|
|
224
|
|
—
|
|
224
|
|
|||||||
|
International
|
—
|
|
26
|
|
—
|
|
26
|
|
|||||||
|
U.S. government securities
|
—
|
|
155
|
|
—
|
|
155
|
|
|||||||
|
Government agencies securities
|
—
|
|
8
|
|
—
|
|
8
|
|
|||||||
|
Other
|
—
|
|
4
|
|
—
|
|
4
|
|
|||||||
|
$
|
112
|
|
$
|
417
|
|
$
|
—
|
|
529
|
|
|||||
|
Common collective trust funds:
|
|||||||||||||||
|
Cash equivalents
|
10
|
|
|||||||||||||
|
Domestic equities
|
249
|
|
|||||||||||||
|
International equities
|
63
|
|
|||||||||||||
|
Total investments measured at net asset value
as a practical expedient
|
322
|
|
|||||||||||||
|
Total defined benefit plans’ assets
|
$
|
851
|
|
||||||||||||
A description of the valuation methodologies used for assets measured at fair value is as follows:
|
•
|
Cash and cash equivalents are valued at original cost plus accrued interest.
|
|
•
|
Equities are valued at the closing price reported on the active market on which individual securities are traded.
|
|
•
|
Mutual funds are valued at the closing price reported on the active market on which individual funds are traded.
|
|
•
|
Long-term debt securities are valued at the estimated price a dealer will pay for the individual securities.
|
|
•
|
Common collective trust funds are measured at the net asset value at the
December 31
,
2018
and
2017
measurement dates. This class represents investments in common collective trust funds that invest in:
|
|
◦
|
Equity securities, which may include common stocks, options and futures in actively managed funds; and
|
|
◦
|
Treasury STRIPS (Separate Trading of Registered Interest and Principal of Securities) representing zero coupon Treasury securities with long-term maturities.
|
77
Estimated future benefit payments, under Company sponsored plans as of
December 29, 2018
, were as follows:
|
Pension Benefits
|
Other Postretirement Plans
|
||||||
|
2019
|
$
|
49
|
|
$
|
1
|
|
|
|
2020
|
48
|
|
1
|
|
|||
|
2021
|
48
|
|
1
|
|
|||
|
2022
|
47
|
|
1
|
|
|||
|
2023
|
45
|
|
1
|
|
|||
|
Subsequent five years
|
232
|
|
2
|
|
|||
Due to the
$35 million
additional, voluntary contribution to the defined benefit plan during fiscal year
2018
, the Company does not expect to make a significant contribution to the Retirement Plans in fiscal year
2019
.
Other Company Sponsored Benefit Plans
—Certain employees are eligible to participate in the Company's 401(k) savings plan. This plan provides that, under certain circumstances and subject to applicable IRS limits, the Company may match participant contributions of up to
100%
of the first
3%
of a participant’s eligible compensation, and
50%
of the next
2%
of a participant’s eligible compensation, for a maximum employer matching contribution of
4%
. The Company made employer matching contributions to the 401(k) plan of
$47 million
,
$46 million
and
$44 million
for fiscal years
2018
,
2017
and
2016
, respectively. The Company, at its discretion, may make additional contributions to the 401(k) plan. The Company made
no
discretionary contributions under the 401(k) plan in fiscal years
2018
,
2017
and
2016
.
Multiemployer Pension Plans
—The Company also contributes to various multiemployer pension plans under the terms of collective bargaining agreements that cover certain of its union-represented employees. The Company does not administer these multiemployer pension plans.
The risks of participating in multiemployer pension plans differ from traditional single-employer defined benefit plans as follows:
|
•
|
Assets contributed to a multiemployer pension plan by one employer may be used to provide benefits to the employees of other participating employers.
|
|
•
|
If a participating employer stops contributing to a multiemployer pension plan, the unfunded obligations of the plan may be borne by the remaining participating employers.
|
|
•
|
If the Company elects to stop participation in a multiemployer pension plan, or
if the number of the Company’s employees participating in a plan is reduced to a certain degree over certain periods of time,
the Company may be required to pay a withdrawal liability based upon the underfunded status of the plan.
|
The Company’s participation in multiemployer pension plans for the year ended
December 29, 2018
, is outlined in the tables below. The Company considers significant plans to be those plans to which the Company contributed more than
5%
of total contributions to the plan in a given plan year, or for which the Company believes its estimated withdrawal liability, should it decide to voluntarily withdraw from the plan, may be material to the Company. For each plan that is considered individually significant to the Company, the following information is provided.
|
•
|
The EIN/Plan Number column provides the Employee Identification Number (“EIN”) and the three-digit plan number (“PN”) assigned to a plan by the Internal Revenue Service (“IRS”).
|
|
•
|
The most recent Pension Protection Act (“PPA”) zone status available for
2018
and
2017
is for the plan years beginning in 2017 and 2016, respectively. The zone status is based on information provided to participating employers by each plan and is certified by the plan’s actuary. A plan in the red zone has been determined to be in critical status, or critical and declining status, based on criteria established under the Internal Revenue Code (the “Code”), and is generally less than
65%
funded. Plans are generally considered “critical and declining” if they are projected to become insolvent within
20
years. A plan in the yellow zone has been determined to be in endangered status, based on criteria established under the Code, and is generally less than
80%
but more than
65%
funded. A plan in the green zone has been determined to be neither in critical status nor in endangered status, and is generally at least
80%
funded.
|
78
|
•
|
The FIP/RP Status Pending/Implemented column indicates plans for which a financial improvement plan (“FIP”) or a rehabilitation plan (“RP”) is either pending or has been implemented. In addition to regular plan contributions, participating employers may be subject to a surcharge if the plan is in the red zone.
|
|
•
|
The Surcharge Imposed column indicates whether a surcharge has been imposed on participating employers contributing to the plan.
|
|
•
|
The Expiration Dates column indicates the expiration dates of the collective-bargaining agreements to which the plans are subject.
|
|
Pension Fund
|
EIN/
Plan Number
|
PPA
Zone Status
|
FIP/RP Status
Pending/
Implemented
|
Surcharge
Imposed
|
Expiration Dates
|
|||||||
|
2018
|
2017
|
|||||||||||
|
Minneapolis Food Distributing
Industry Pension Plan
|
41-6047047/001
|
Green
|
Green
|
Implemented
|
No
|
4/1/21
|
||||||
|
Teamster Pension Trust Fund of
Philadelphia and Vicinity
|
23-1511735/001
|
Yellow
|
Yellow
|
Implemented
|
No
|
2/13/22
|
||||||
|
Local 703 I.B. of T. Grocery and
Food Employees’ Pension Plan (1) |
36-6491473/001
|
Green
|
Green
|
N/A
|
No
|
6/30/18
|
||||||
|
United Teamsters Trust Fund A
|
13-5660513/001
|
Yellow
|
Yellow
|
Implemented
|
No
|
5/30/19
|
||||||
|
Warehouse Employees Local
169 and Employers Joint
Pension Fund
(2)
|
23-6230368/001
|
Red
|
Red
|
Implemented
|
No
|
2/13/22
|
||||||
|
(1)
|
The collective bargaining agreement for this pension fund is operating under an extension.
|
|
(2)
|
Local 169 filed a Notice of Critical and Declining Status in 2017.
|
The following table provides information about the Company’s contributions to its multiemployer pension plans. For plans that are not individually significant to the Company, the total amount of the Company's contributions is aggregated. Prior year contribution amounts have been reclassified to other funds (below) for plans no longer considered significant in 2018.
|
Contributions
(1)(2)
|
Contributions That
Exceed 5% of
Total Plan Contributions
(3)
|
||||||||||||||||
|
2018
|
2017
|
2016
|
2017
|
2016
|
|||||||||||||
|
Pension Fund
|
|||||||||||||||||
|
Minneapolis Food Distributing Industry Pension Plan
|
5
|
|
5
|
|
5
|
|
Yes
|
|
Yes
|
|
|||||||
|
Teamster Pension Trust Fund of Philadelphia and Vicinity
|
4
|
|
4
|
|
3
|
|
No
|
|
No
|
|
|||||||
|
Local 703 I.B. of T. Grocery and Food Employees’
Pension Plan
|
2
|
|
1
|
|
1
|
|
Yes
|
|
Yes
|
|
|||||||
|
United Teamsters Trust Fund A
|
2
|
|
2
|
|
2
|
|
Yes
|
|
Yes
|
|
|||||||
|
Warehouse Employees Local 169 and Employers
Joint Pension Fund
|
1
|
|
1
|
|
1
|
|
Yes
|
|
Yes
|
|
|||||||
|
Other Funds
|
21
|
|
21
|
|
21
|
|
—
|
|
—
|
|
|||||||
|
$
|
35
|
|
$
|
34
|
|
$
|
33
|
|
|||||||||
|
(1)
|
Contributions made to these plans during the Company’s fiscal year, which may not coincide with the plans’ fiscal years.
|
|
(2)
|
Contributions do not include payments related to multiemployer pension plan withdrawals/settlements.
|
|
(3)
|
Indicates whether the Company was listed in the respective multiemployer pension plan Form 5500 for the applicable plan year as having made more than
5%
of total contributions to the plan.
|
79
If the Company elects to voluntarily withdraw from a multiemployer pension plan, it may be responsible for its proportionate share of the respective plan’s unfunded vested liability. Based on the latest information available from plan administrators, the Company estimates its aggregate withdrawal liability from the multiemployer pension plans in which it participates to be approximately
$110 million
as of
December 29, 2018
. Actual withdrawal liabilities incurred by the Company, if it were to withdraw from one or more plans, could be materially different from the estimates noted here, based on better or more timely information from plan administrators or other changes affecting the respective plan’s funded status.
|
19.
|
EARNINGS PER SHARE
|
The Company computes earnings per share (“EPS”) in accordance with ASC 260,
Earnings per Share.
Basic EPS is computed by dividing net income available to common stockholders by the weighted-average number of shares of common stock outstanding.
Diluted EPS is computed using the weighted average number of shares of common stock, plus the effect of potentially dilutive securities. Stock options, non-vested restricted shares with forfeitable dividend rights, non-vested restricted stock units and employee stock purchase plan deferrals are considered potentially dilutive securities.
The following table sets forth the computation of basic and diluted earnings per share:
|
2018
|
2017
|
2016
|
|||||||||
|
Numerator:
|
|||||||||||
|
Net income
|
$
|
407
|
|
$
|
444
|
|
$
|
210
|
|
||
|
Denominator:
|
|||||||||||
|
Weighted-average common shares
outstanding
|
216,112,021
|
|
222,383,038
|
|
200,129,868
|
|
|||||
|
Dilutive effect of share-based awards
|
1,713,524
|
|
3,280,747
|
|
3,894,858
|
|
|||||
|
Weighted-average dilutive shares
outstanding
|
217,825,545
|
|
225,663,785
|
|
204,024,726
|
|
|||||
|
Basic earnings per share
|
$
|
1.88
|
|
$
|
2.00
|
|
$
|
1.05
|
|
||
|
Diluted earnings per share
|
$
|
1.87
|
|
$
|
1.97
|
|
$
|
1.03
|
|
||
80
|
20.
|
CHANGES IN ACCUMULATED OTHER COMPREHENSIVE LOSS
|
The following table presents changes in accumulated other comprehensive loss, by component, for the last three fiscal years:
|
2018
|
2017
|
2016
|
|||||||||
|
Accumulated other comprehensive loss components
|
|||||||||||
|
Retirement benefit obligations:
|
|||||||||||
|
Balance at beginning of year
(1)
|
$
|
(103
|
)
|
$
|
(119
|
)
|
$
|
(74
|
)
|
||
|
Other comprehensive income (loss) before reclassifications
|
6
|
|
1
|
|
(64
|
)
|
|||||
|
Reclassification adjustments:
|
|||||||||||
|
Amortization of net loss
(2) (3)
|
3
|
|
4
|
|
8
|
|
|||||
|
Settlements
(2) (3)
|
—
|
|
18
|
|
4
|
|
|||||
|
Prior year correction
(4)
|
—
|
|
—
|
|
(22
|
)
|
|||||
|
Total before income tax
|
9
|
|
22
|
|
(74
|
)
|
|||||
|
Income tax provision (benefit)
|
3
|
|
6
|
|
(29
|
)
|
|||||
|
Current year comprehensive income (loss), net of tax
|
6
|
|
16
|
|
(45
|
)
|
|||||
|
Balance at end of year
(1)
|
$
|
(97
|
)
|
$
|
(103
|
)
|
$
|
(119
|
)
|
||
|
Interest rate swaps:
|
|||||||||||
|
Balance at beginning of year
(1)
|
$
|
8
|
|
$
|
—
|
|
$
|
—
|
|
||
|
Change in fair value of interest rate swaps
|
10
|
|
11
|
|
—
|
|
|||||
|
Amounts reclassified to interest expense
|
(3
|
)
|
2
|
|
—
|
|
|||||
|
Total before income tax
|
7
|
|
13
|
|
—
|
|
|||||
|
Income tax provision
|
2
|
|
5
|
|
—
|
|
|||||
|
Current year comprehensive income, net of tax
|
5
|
|
8
|
|
—
|
|
|||||
|
Balance at end of year
(1)
|
$
|
13
|
|
$
|
8
|
|
$
|
—
|
|
||
|
Accumulated other comprehensive loss at end of year
(1)
|
$
|
(84
|
)
|
$
|
(95
|
)
|
$
|
(119
|
)
|
||
|
(1)
|
Amounts are presented net of tax.
|
|
(2)
|
Included in the computation of net periodic benefit costs. See Note 18, Retirement Plans, for additional information.
|
|
(3)
|
Included in other (income) expense—net in the Company's Consolidated Statements of Comprehensive Income.
|
|
(4)
|
In the second quarter of fiscal year 2016, the Company recorded a
$22 million
increase to its pension obligation, with a corresponding increase to accumulated other comprehensive loss, to correct a computational error related to a 2015 pension plan freeze.
|
|
21.
|
INCOME TAXES
|
The income tax provision (benefit) for the fiscal years
2018
,
2017
and
2016
consisted of the following:
|
2018
|
2017
|
2016
|
|||||||||
|
Current:
|
|||||||||||
|
Federal
|
$
|
32
|
|
$
|
74
|
|
$
|
1
|
|
||
|
State
|
12
|
|
9
|
|
—
|
|
|||||
|
Current income tax provision
|
44
|
|
83
|
|
1
|
|
|||||
|
Deferred:
|
|||||||||||
|
Federal
|
31
|
|
(133
|
)
|
(15
|
)
|
|||||
|
State
|
14
|
|
10
|
|
(65
|
)
|
|||||
|
Deferred income tax provision (benefit)
|
45
|
|
(123
|
)
|
(80
|
)
|
|||||
|
Total income tax provision (benefit)
|
$
|
89
|
|
$
|
(40
|
)
|
$
|
(79
|
)
|
||
81
The Company’s effective income tax rates for the fiscal years ended
December 29, 2018
,
December 30, 2017
and
December 31, 2016
were
18.0%
,
(10.0)%
and
(60.0)%
, respectively. The determination of the Company’s overall effective tax rate requires the use of estimates. The effective tax rate reflects the income earned and taxed in U.S. federal and various state jurisdictions based on enacted tax law, permanent differences between book and tax items, tax credits and the Company’s change in relative contribution to income for each jurisdiction. Changes in tax laws and rates may affect recorded deferred tax assets and liabilities and the Company’s effective tax rate in the future.
On December 22, 2017, the U.S. federal government enacted comprehensive tax legislation referred to herein as the Tax Act. The Tax Act made broad and complex changes to the U.S. federal income tax code, including, but not limited to (1) a reduction of the U.S. federal corporate tax rate and (2) the full expensing of qualified property.
The Securities and Exchange Commission staff issued Staff Accounting Bulletin 118 (“SAB 118”), which provides guidance on accounting for the tax effects of the Tax Act. SAB 118 provides a measurement period that should not extend beyond one year from the Tax Act enactment date for companies to complete the accounting under ASC 740,
Income Taxes
. In accordance with SAB 118, a company must reflect the income tax effects of those aspects of the Tax Act for which the accounting under ASC 740,
Income Taxes
is complete. To the extent that a company’s accounting for certain income tax effects of the Tax Act is incomplete but it is able to determine a reasonable estimate, it must record a provisional estimate in the financial statements. If a company cannot determine a provisional estimate to be included in the financial statements, it should continue to apply ASC 740
,
Income Taxes
on the basis of the provisions of the tax laws that were in effect immediately before the enactment of the Tax Act.
The Tax Act reduced the federal corporate income tax rate to
21%
, effective January 1, 2018 and provided for bonus depreciation that allows for full expensing of qualified assets placed into service after September 27, 2017. For the fiscal year ended
December 30, 2017
, the Company recorded provisional amounts of the impact of the corporate tax rate reduction and bonus depreciation that allows for the full expensing of qualified property. Consequently, the Company recorded a provisional decrease to deferred tax liabilities of
$173 million
with a corresponding adjustment to deferred income tax benefit of
$173 million
for the fiscal year 2017 related to the reduction of the federal corporate income tax rate. Additionally, the Company recorded a provisional increase in net deferred tax liabilities of
$4 million
with a corresponding adjustment of
$4 million
to other long-term liabilities for the fiscal year 2017 related to bonus depreciation that allowed for the full expensing of qualified property.
For fiscal year 2018, the Company recorded adjustments to finalize provisional amounts recorded as of December 30, 2017. The Company recognized a decrease to deferred tax liabilities of
$7 million
and a decrease to current taxes payable of
$1 million
with a corresponding adjustment to income tax benefit of
$8 million
related to the reduction of the federal corporate income tax rate. The
$8 million
income tax benefit was primarily the result of the
$35 million
of incremental contributions to the Company’s defined benefit and other postretirement plans and changes in the method of accounting reflected in the 2017 tax returns as filed.
As of
December 29, 2018
, the Company has completed its accounting of the tax effects of the Tax Act.
82
The reconciliation of the provision (benefit) for income taxes from continuing operations at the U.S. federal statutory income tax rate (
21%
in 2018, and
35%
in 2017 and 2016, respectively) to the Company’s income tax provision (benefit) for the fiscal years
2018
,
2017
and
2016
is shown below.
|
2018
|
2017
|
2016
|
|||||||||
|
Federal income taxes computed at statutory rate
|
$
|
104
|
|
$
|
141
|
|
$
|
46
|
|
||
|
State income taxes, net of federal income tax benefit
|
20
|
|
16
|
|
2
|
|
|||||
|
Stock-based compensation
|
(6
|
)
|
(26
|
)
|
(3
|
)
|
|||||
|
Non-deductible expenses
|
3
|
|
5
|
|
5
|
|
|||||
|
Change in the valuation allowance for deferred tax assets
|
1
|
|
(1
|
)
|
(128
|
)
|
|||||
|
Net operating loss expirations
|
3
|
|
1
|
|
2
|
|
|||||
|
Tax credits
|
(6
|
)
|
(3
|
)
|
(3
|
)
|
|||||
|
Change in unrecognized tax benefits
|
(21
|
)
|
(1
|
)
|
1
|
|
|||||
|
Change in U.S. federal statutory tax rate
|
(8
|
)
|
(173
|
)
|
—
|
|
|||||
|
Other
|
(1
|
)
|
1
|
|
(1
|
)
|
|||||
|
Total income tax provision (benefit)
|
$
|
89
|
|
$
|
(40
|
)
|
$
|
(79
|
)
|
||
Temporary differences and carryforwards that created significant deferred tax assets and liabilities were as follows:
|
December 29, 2018
|
December 30, 2017
|
||||||
|
Deferred tax assets:
|
|||||||
|
Allowance for doubtful accounts
|
$
|
8
|
|
$
|
7
|
|
|
|
Accrued employee benefits
|
13
|
|
7
|
|
|||
|
Restructuring reserves
|
3
|
|
5
|
|
|||
|
Workers’ compensation, general and fleet liabilities
|
40
|
|
43
|
|
|||
|
Deferred financing costs
|
2
|
|
2
|
|
|||
|
Postretirement benefit obligations
|
9
|
|
23
|
|
|||
|
Net operating loss carryforwards
|
73
|
|
86
|
|
|||
|
Other accrued expenses
|
13
|
|
10
|
|
|||
|
Total gross deferred tax assets
|
161
|
|
183
|
|
|||
|
Less valuation allowance
|
(30
|
)
|
(29
|
)
|
|||
|
Total net deferred tax assets
|
131
|
|
154
|
|
|||
|
Deferred tax liabilities:
|
|||||||
|
Property and equipment
|
(121
|
)
|
(92
|
)
|
|||
|
Inventories
|
(39
|
)
|
(30
|
)
|
|||
|
Intangibles
|
(262
|
)
|
(274
|
)
|
|||
|
Total deferred tax liabilities
|
(422
|
)
|
(396
|
)
|
|||
|
Net deferred tax liability
|
$
|
(291
|
)
|
$
|
(242
|
)
|
|
The net deferred tax liabilities presented in the Company's Consolidated Balance Sheets were as follows.
|
December 29, 2018
|
December 30, 2017
|
||||||
|
Noncurrent deferred tax assets
|
$
|
7
|
|
$
|
21
|
|
|
|
Noncurrent deferred tax liability
|
(298
|
)
|
(263
|
)
|
|||
|
Net deferred tax liability
|
$
|
(291
|
)
|
$
|
(242
|
)
|
|
83
As of
December 29, 2018
, the Company had tax affected state net operating loss carryforwards of
$73 million
, which will expire at various dates from
2019
to
2038
. The Company’s net operating loss carryforwards expire as follows:
|
State
|
|||
|
2019-2023
|
$
|
33
|
|
|
2024-2028
|
26
|
|
|
|
2029-2033
|
9
|
|
|
|
2034-2038
|
5
|
|
|
|
$
|
73
|
|
|
The Company also has state credit carryforwards of
$16 million
.
The U.S. federal and state net operating loss carryforwards in the income tax returns filed included unrecognized tax benefits taken in prior years. The net operating losses for which a deferred tax asset is recognized for financial statement purposes in accordance with ASC 740,
Income Taxes,
are presented net of these unrecognized tax benefits.
Because of the change of ownership provisions of the Tax Reform Act of 1986, use of a portion of the Company’s domestic net operating losses and tax credit carryforwards may be limited in future periods. Further, a portion of the carryforwards may expire before being applied to reduce future income tax liabilities.
We released the previously recorded valuation allowance against our U.S. federal net deferred tax assets and certain of our state net deferred tax assets in fiscal year 2016 as we determined it was more likely than not that the deferred tax assets would be realized. We maintained a valuation allowance on certain state net operating loss and tax credit carryforwards expected to expire unutilized as a result of insufficient forecasted taxable income in the carryforward period or the utilization of which is subject to limitation. The decision to release the valuation allowance was made after management considered all available evidence, both positive and negative, including but not limited to, historical operating results, cumulative income in recent years, forecasted earnings, and a reduction of uncertainty regarding forecasted earnings as a result of developments in certain customer and strategic initiatives during fiscal year 2016.
A summary of the activity in the valuation allowance for the fiscal years
2018
,
2017
and
2016
is as follows:
|
2018
|
2017
|
2016
|
|||||||||
|
Balance at beginning of year
|
$
|
29
|
|
$
|
24
|
|
152
|
|
|||
|
Expense (benefit) recognized
|
1
|
|
5
|
|
(128
|
)
|
|||||
|
Balance at end of year
|
$
|
30
|
|
$
|
29
|
|
$
|
24
|
|
||
The calculation of the Company’s tax liabilities involves uncertainties in the application of complex tax laws and regulations in U.S. federal and state jurisdictions. The Company (1) records unrecognized tax benefits as liabilities in accordance with ASC 740,
Income Taxes
and (2) adjusts these liabilities when the Company’s judgment changes because of the evaluation of new information not previously available. Because of the complexity of some of these uncertainties, the ultimate resolution may result in a payment that is materially different from the current estimate of liabilities for unrecognized tax benefits. These differences will be reflected as increases or decreases to income tax expense in the period in which new information is available. The Company recognizes an uncertain tax position when it is more likely than not that the position will be sustained upon examination, including resolution of any related appeals or litigation processes, based on the technical merits.
84
Reconciliation of the beginning and ending amount of unrecognized tax benefits as of fiscal years
2018
,
2017
, and
2016
was as follows:
|
Balance at January 2, 2016
|
$
|
45
|
|
|
Gross increases due to positions taken in prior years
|
5
|
|
|
|
Decreases due to lapses of statute of limitations
|
(1
|
)
|
|
|
Balance at December 31, 2016
|
49
|
|
|
|
Gross increases due to positions taken in prior years
|
72
|
|
|
|
Gross decreases due to positions taken in prior years
|
(4
|
)
|
|
|
Gross decreases due to positions taken in current year
|
(5
|
)
|
|
|
Decreases due to changes in tax rates
|
(4
|
)
|
|
|
Balance at December 30, 2017
|
108
|
|
|
|
Gross increases due to positions taken in prior years
|
2
|
|
|
|
Gross decreases due to positions taken in prior years
|
(64
|
)
|
|
|
Decreases due to lapses of statute of limitations
|
(1
|
)
|
|
|
Decreases due to changes in tax rates
|
(5
|
)
|
|
|
Balance at December 29, 2018
|
$
|
40
|
|
The Company believes it is reasonably possible that the liability for unrecognized tax benefits will decrease by approximately
$1 million
in the next 12 months as a result of the completion of tax audits or the expiration of the statute of limitations.
Included in the balance of unrecognized tax benefits at the end of fiscal years
2018
,
2017
and
2016
was
$36 million
,
$60 million
and
$43 million
, respectively, of tax benefits that, if recognized, would affect the effective tax rate. The Company recognizes interest related to unrecognized tax benefits in interest expense and penalties in operating expenses. The Company had accrued interest and penalties of approximately
$5 million
as of
December 29, 2018
and
December 30, 2017
.
The Company files U.S. federal and state income tax returns in jurisdictions with varying statutes of limitations. Our 2007 through 2017 U.S. federal income tax years, and various state income tax years from 2000 through 2016, remain subject to income tax examinations by the relevant taxing authorities. Prior to 2007, the Company was owned by Royal Ahold N.V. (“Ahold”). Ahold indemnified the Company for 2007 pre-closing consolidated U.S. federal and certain combined state income taxes, and the Company is responsible for all other taxes, interest and penalties.
|
22.
|
COMMITMENTS AND CONTINGENCIES
|
Purchase Commitments
—The Company enters into purchase orders with vendors and other parties in the ordinary course of business and has a limited number of purchase contracts with certain vendors that require it to buy a predetermined volume of products. As of
December 29, 2018
, the Company had
$651 million
of purchase orders and purchase contract commitments to be purchased in fiscal year
2019
and
$70 million
of information technology commitments through September 2023 that are not recorded in the Company's Consolidated Balance Sheets.
To minimize fuel cost risk, the Company enters into forward purchase commitments for a portion of its projected diesel fuel requirements. At
December 29, 2018
, the Company had diesel fuel forward purchase commitments totaling
$100 million
through June 2020. Additionally, as of
December 29, 2018
, the Company had electricity forward purchase commitments totaling
$5 million
through March 2021. The Company does not measure its forward purchase commitments for fuel and electricity at fair value, as the amounts under contract meet the physical delivery criteria in the normal purchase exception under GAAP guidance.
SGA Food Group Acquisition
—On July 28, 2018, USF entered into a Stock Purchase Agreement with Services Group of America, Inc. (“SGA”) under which USF agreed to acquire SGA’s Food Group of Companies, including Food Services of America, Inc., Systems Services of America, Inc., Amerifresh, Inc., Ameristar Meats, Inc. and Gampac Express, Inc. (collectively, the “SGA Food Group Companies”), for
$1.8 billion
in cash. The closing of the acquisition remains subject to customary conditions, including the receipt of required regulatory approvals. To fund a substantial portion of the consideration, USF also entered into a
85
commitment letter with JPMorgan Chase Bank, N.A., Bank of America, N.A. and Merrill Lynch, Pierce, Fenner & Smith Incorporated (collectively, the “Committed Parties”) under which the Committed Parties committed to provide USF with a
$1.5 billion
senior secured term loan facility.
Legal Proceedings
—The Company is party to a number of legal proceedings arising in the normal course of business. These legal proceedings, whether pending, threatened or unasserted, if decided adversely to or settled by the Company, may result in liabilities material to its financial position, results of operations, or cash flows. The Company has recognized provisions with respect to the proceedings, where appropriate, in its Consolidated Balance Sheets. It is possible that the Company could be required to make expenditures, in excess of the established provisions, in amounts that cannot be reasonably estimated. However, the Company believes that the ultimate resolution of these proceedings will not have a material adverse effect on its consolidated financial position, results of operations or cash flows.
|
23.
|
US FOODS HOLDING CORP. CONDENSED FINANCIAL INFORMATION
|
These condensed parent company financial statements should be read in conjunction with the Company's consolidated financial statements. Under terms of the agreements governing its indebtedness, the net assets of USF, our wholly owned subsidiary, are restricted from being transferred to US Foods Holding Corp.
in the form of loans, advances or dividends with the exception of income tax payments, share-based compensation settlements and minor administrative costs. As of
December 29, 2018
, USF had
$991 million
of restricted payment capacity under these covenants, and approximately
$2,238 million
of its net assets were restricted after taking into consideration the net deferred tax assets and intercompany balances that eliminate in consolidation. See Note 16, Share-Based Compensation, Common Stock Issuances and Common Stock, for a discussion of the Company’s equity related transactions. In the condensed parent company financial statements below, the investment in the operating subsidiary, USF, is accounted for using the equity method.
Condensed Parent Company Balance Sheets
(In millions, except par value)
|
December 29, 2018
|
December 30, 2017
|
||||||
|
ASSETS
|
|||||||
|
Investment in subsidiary
|
$
|
3,235
|
|
$
|
2,847
|
|
|
|
TOTAL ASSETS
|
$
|
3,235
|
|
$
|
2,847
|
|
|
|
LIABILITIES AND EQUITY
|
|||||||
|
Deferred tax liabilities
|
$
|
1
|
|
$
|
25
|
|
|
|
Other liabilities
|
5
|
|
71
|
|
|||
|
Total liabilities
|
6
|
|
96
|
|
|||
|
COMMITMENTS AND CONTINGENCIES (Note 22)
|
|
|
|||||
|
SHAREHOLDERS’ EQUITY
|
|||||||
|
Common stock, $0.01 par value—600 shares authorized;
217 and 215 issued and outstanding as of
December 29, 2018 and December 30, 2017, respectively
|
2
|
|
2
|
|
|||
|
Additional paid-in capital
|
2,780
|
|
2,720
|
|
|||
|
Retained earnings
|
531
|
|
124
|
|
|||
|
Accumulated other comprehensive loss
|
(84
|
)
|
(95
|
)
|
|||
|
Total shareholders’ equity
|
3,229
|
|
2,751
|
|
|||
|
TOTAL LIABILITIES AND EQUITY
|
$
|
3,235
|
|
$
|
2,847
|
|
|
86
Condensed Parent Company Statements of Comprehensive Income
|
Fiscal Years Ended
|
|||||||||||
|
December 29, 2018
|
December 30, 2017
|
December 31, 2016
|
|||||||||
|
OPERATING EXPENSES
|
$
|
—
|
|
$
|
—
|
|
$
|
5
|
|
||
|
Loss before income taxes
|
—
|
|
—
|
|
(5
|
)
|
|||||
|
INCOME TAX (BENEFIT) PROVISION
|
(31
|
)
|
(5
|
)
|
104
|
|
|||||
|
Income (loss) before equity in net earnings of subsidiary
|
31
|
|
5
|
|
(109
|
)
|
|||||
|
EQUITY IN NET EARNINGS OF SUBSIDIARY
|
376
|
|
439
|
|
319
|
|
|||||
|
NET INCOME
|
407
|
|
444
|
|
210
|
|
|||||
|
OTHER COMPREHENSIVE INCOME (LOSS)—Net of tax:
|
|||||||||||
|
Changes in retirement benefit obligations
|
6
|
|
16
|
|
(45
|
)
|
|||||
|
Unrecognized gain on interest rate swaps
|
5
|
|
8
|
|
—
|
|
|||||
|
COMPREHENSIVE INCOME
|
$
|
418
|
|
$
|
468
|
|
$
|
165
|
|
||
Condensed Parent Company Statements of Cash Flows
|
Fiscal Years Ended
|
|||||||||||
|
December 29, 2018
|
December 30, 2017
|
December 31, 2016
|
|||||||||
|
CASH FLOWS FROM OPERATING ACTIVITIES:
|
|||||||||||
|
Net income
|
$
|
407
|
|
$
|
444
|
|
$
|
210
|
|
||
|
Adjustments to reconcile net income to net cash (used in)
provided by operating activities:
|
|||||||||||
|
Equity in net earnings of subsidiary
|
(376
|
)
|
(439
|
)
|
(319
|
)
|
|||||
|
Deferred income tax (benefit) provision
|
(23
|
)
|
(77
|
)
|
106
|
|
|||||
|
Changes in operating assets and liabilities:
|
|||||||||||
|
Decrease (increase) in other assets
|
—
|
|
1
|
|
(1
|
)
|
|||||
|
Decrease in intercompany payable
|
—
|
|
—
|
|
(7
|
)
|
|||||
|
(Decrease) increase in accrued expenses and other liabilities
|
(8
|
)
|
71
|
|
—
|
|
|||||
|
Net cash used in operating activities
|
—
|
|
—
|
|
(11
|
)
|
|||||
|
CASH FLOWS FROM INVESTING ACTIVITIES:
|
|||||||||||
|
Investment in subsidiary
|
—
|
|
—
|
|
(1,114
|
)
|
|||||
|
Cash distribution from subsidiary
|
—
|
|
280
|
|
374
|
|
|||||
|
Net cash provided by (used in) investing activities
|
—
|
|
280
|
|
(740
|
)
|
|||||
|
CASH FLOWS FROM FINANCING ACTIVITIES:
|
|||||||||||
|
Net proceeds from initial public offering
|
—
|
|
—
|
|
1,114
|
|
|||||
|
Cash distribution to shareholders
|
—
|
|
—
|
|
(666
|
)
|
|||||
|
Proceeds from common stock sales
|
—
|
|
—
|
|
3
|
|
|||||
|
Common stock repurchased
|
—
|
|
(280
|
)
|
—
|
|
|||||
|
Net cash (used in) provided by financing activities
|
—
|
|
(280
|
)
|
451
|
|
|||||
|
NET DECREASE IN CASH AND CASH EQUIVALENTS
|
—
|
|
—
|
|
(300
|
)
|
|||||
|
CASH AND CASH EQUIVALENTS—Beginning of year
|
—
|
|
—
|
|
300
|
|
|||||
|
CASH AND CASH EQUIVALENTS—End of year
|
$
|
—
|
|
$
|
—
|
|
$
|
—
|
|
||
87
|
24.
|
QUARTERLY FINANCIAL INFORMATION (Unaudited)
|
Financial information for each quarter in the fiscal years ended
December 29, 2018
and
December 30, 2017
, is set forth below:
|
First
Quarter
|
Second
Quarter
|
Third
Quarter
|
Fourth
Quarter
|
Fiscal Year
|
|||||||||||||||
|
Fiscal Year Ended December 29, 2018
|
|||||||||||||||||||
|
Net sales
|
$
|
5,823
|
|
$
|
6,158
|
|
$
|
6,153
|
|
$
|
6,041
|
|
$
|
24,175
|
|
||||
|
Cost of goods sold
|
4,831
|
|
5,044
|
|
5,045
|
|
4,949
|
|
19,869
|
|
|||||||||
|
Gross profit
|
992
|
|
1,114
|
|
1,108
|
|
1,092
|
|
4,306
|
|
|||||||||
|
Operating expenses
|
889
|
|
908
|
|
929
|
|
922
|
|
3,648
|
|
|||||||||
|
Other income—net
|
(3
|
)
|
(3
|
)
|
(3
|
)
|
(4
|
)
|
(13
|
)
|
|||||||||
|
Interest expense—net
|
43
|
|
48
|
|
42
|
|
42
|
|
175
|
|
|||||||||
|
Income before income taxes
|
63
|
|
161
|
|
140
|
|
132
|
|
496
|
|
|||||||||
|
Income tax (benefit) provision
|
(4
|
)
|
35
|
|
26
|
|
32
|
|
89
|
|
|||||||||
|
Net income
|
$
|
67
|
|
$
|
126
|
|
$
|
114
|
|
$
|
100
|
|
$
|
407
|
|
||||
|
Earnings per share:
(1)
|
|||||||||||||||||||
|
Basic
|
$
|
0.31
|
|
$
|
0.58
|
|
$
|
0.53
|
|
$
|
0.46
|
|
$
|
1.88
|
|
||||
|
Diluted
|
$
|
0.31
|
|
$
|
0.58
|
|
$
|
0.52
|
|
$
|
0.46
|
|
$
|
1.87
|
|
||||
|
Fiscal Year Ended December 30, 2017
|
|||||||||||||||||||
|
Net sales
|
$
|
5,788
|
|
$
|
6,159
|
|
6,204
|
|
$
|
5,996
|
|
$
|
24,147
|
|
|||||
|
Cost of goods sold
|
4,797
|
|
5,105
|
|
5,106
|
|
4,921
|
|
19,929
|
|
|||||||||
|
Gross profit
|
991
|
|
1,054
|
|
1,098
|
|
1,075
|
|
4,218
|
|
|||||||||
|
Operating expenses
|
915
|
|
927
|
|
909
|
|
879
|
|
3,630
|
|
|||||||||
|
Other (income) expense—net
|
(1
|
)
|
1
|
|
(1
|
)
|
15
|
|
14
|
|
|||||||||
|
Interest expense—net
|
42
|
|
41
|
|
43
|
|
44
|
|
170
|
|
|||||||||
|
Income before income taxes
|
35
|
|
85
|
|
147
|
|
137
|
|
404
|
|
|||||||||
|
Income tax provision (benefit)
|
8
|
|
20
|
|
51
|
|
(119
|
)
|
(40
|
)
|
|||||||||
|
Net income
|
$
|
27
|
|
$
|
65
|
|
$
|
96
|
|
$
|
256
|
|
$
|
444
|
|
||||
|
Earnings per share:
(1)
|
|||||||||||||||||||
|
Basic
|
$
|
0.12
|
|
$
|
0.29
|
|
$
|
0.43
|
|
$
|
1.16
|
|
$
|
2.00
|
|
||||
|
Diluted
|
$
|
0.12
|
|
$
|
0.29
|
|
$
|
0.42
|
|
$
|
1.15
|
|
$
|
1.97
|
|
||||
|
(1)
|
The quarterly earnings per share information is computed separately for each period. Therefore, the sum of such quarterly per share amounts may differ from the total year.
|
|
25.
|
BUSINESS INFORMATION
|
The Company’s consolidated results represent the results of its
one
business segment based on how the Company’s chief operating decision maker, the Chief Executive Officer, views the business for purposes of evaluating performance and making operating decisions.
The Company markets and distributes fresh, frozen and dry food and non-food products to foodservice customers throughout the United States. The Company uses a centralized management structure, and its strategies and initiatives are implemented and executed consistently across the organization to maximize value to the organization as a whole. The Company uses shared resources for sales, procurement, and general and administrative activities across each of its distribution centers and operations. The Company’s distribution centers form a single network to reach its customers; it is common for a single customer to make purchases from several different distribution centers. Capital projects, whether for cost savings or generating incremental revenue, are evaluated based on estimated economic returns to the organization as a whole.
88
No single customer accounted for more than
3%
of the Company’s consolidated net sales for fiscal years
2018
,
2017
and
2016
. However, customers who are members of
one
group purchasing organization accounted for approximately
13%
of the Company's consolidated net sales for fiscal years
2018
and
2017
, and
12%
of the Company's consolidated net sales in fiscal year
2016
.
89
|
Item 9.
|
Changes in and Disagreements with Accountants on Accounting and Financial Disclosure
|
None.
|
Item 9A.
|
Controls and Procedures
|
Evaluation of Disclosure Controls and Procedures
As of
December 29, 2018
, the end of the period covered by this Annual Report, an evaluation was carried out under the supervision and with the participation of US Foods Holding Corp.'s management, including our Chief Executive Officer and our Chief Financial Officer, of our "disclosure controls and procedures" (as defined in Rule 13a-15(e) under the Securities Exchange Act of 1934). Based upon that evaluation, our Chief Executive Officer and Chief Financial Officer concluded that the Company's disclosure controls and procedures were effective to ensure that information required to be disclosed in the reports we file with the SEC is recorded, processed, summarized and reported within the time periods specified in the SEC’s rules and forms and that information required to be disclosed is accumulated and communicated to the Company’s management, including our Chief Executive Officer and Chief Financial Officer, as appropriate to allow timely decisions regarding required disclosure.
Report of Management on Internal Control over Financial Reporting dated
February 14, 2019
Management of
US Foods Holding Corp.
and its subsidiaries (the "Company") is responsible for establishing and maintaining adequate internal control over financial reporting as defined in Rules 13a-15(f) and 15d-15(f) under the Securities Exchange Act of 1934. The Company's internal control over financial reporting is a process designed to provide reasonable assurance regarding the reliability of financial reporting and the preparation of financial statements for external purposes in accordance with accounting principles generally accepted in the United States. Internal control over financial reporting includes those policies and procedures that (i) pertain to the maintenance of records that, in reasonable detail, accurately and fairly reflect the transactions and dispositions of the assets of the Company, (ii) provide reasonable assurance that transactions are recorded as necessary to permit preparation of financial statements in accordance with generally accepted accounting principles, and that receipts and expenditures of the Company are being made only in accordance with authorizations of management and directors of the Company, and (iii) provide reasonable assurance regarding prevention or timely detection of unauthorized acquisition, use, or disposition of the Company's assets that could have a material effect on the Company's financial statements.
Internal control over financial reporting includes the controls themselves, monitoring and internal auditing practices, and actions taken to correct deficiencies as identified. Because of its inherent limitations, internal control over financial reporting may not prevent or detect misstatements. Also, projections of any evaluation of effectiveness to future periods are subject to the risk that controls may become inadequate because of changes in conditions or that the degree of compliance with the policies or procedures may deteriorate.
Management assessed the effectiveness of the Company's internal control over financial reporting as of
December 29, 2018
. Management based this assessment on criteria for effective internal control over financial reporting described in
Internal Control—Integrated Framework (2013)
issued by the Committee of Sponsoring Organizations of the Treadway Commission. Management's assessment included an evaluation of the design of the Company's internal control over financial reporting and testing of the operational effectiveness of its internal control over financial reporting. Management reviewed the results of its assessment with the Audit Committee of the Company's Board of Directors.
Based on this assessment, management determined that, as of
December 29, 2018
, the Company maintained effective internal control over financial reporting. Deloitte & Touche LLP, an independent registered public accounting firm, which audited and reported on the consolidated financial statements of the Company included in this report, has issued an attestation report on the effectiveness of our internal control over financial reporting as of
December 29, 2018
.
Changes in Internal Control Over Financial Reporting
There were no changes in our internal controls over financial reporting during the fourth fiscal quarter of
2018
that have materially affected, or are reasonably likely to materially affect, our internal control over financial reporting.
90
REPORT OF INDEPENDENT REGISTERED PUBLIC ACCOUNTING FIRM
To the Shareholders and the Board of Directors of US Foods Holding Corp.
Opinion on Internal Control over Financial Reporting
We have audited the internal control over financial reporting of US Foods Holding Corp. and its subsidiaries (the “Company”) as of
December 29, 2018
, based on criteria established in
Internal Control — Integrated Framework (2013)
issued by the Committee of Sponsoring Organizations of the Treadway Commission (“COSO”). In our opinion, the Company maintained, in all material respects, effective internal control over financial reporting as of
December 29, 2018
, based on criteria established in
Internal Control — Integrated Framework (2013)
issued by COSO.
We have also audited, in accordance with the standards of the Public Company Accounting Oversight Board (United States) (PCAOB), the consolidated financial statements as of and for the fiscal year ended
December 29, 2018
, of the Company and our report dated
February 14, 2019
, expressed an unqualified opinion on those financial statements.
Basis for Opinion
The Company’s management is responsible for maintaining effective internal control over financial reporting and for its assessment of the effectiveness of internal control over financial reporting included in the accompanying Report of Management on Internal Control over Financial Reporting dated
February 14, 2019
.
Our responsibility is to express an opinion on the Company’s internal control over financial reporting based on our audit. We are a public accounting firm registered with the PCAOB and are required to be independent with respect to the Company in accordance with the U.S. federal securities laws and the applicable rules and regulations of the Securities and Exchange Commission and the PCAOB.
We conducted our audit in accordance with the standards of the PCAOB. Those standards require that we plan and perform the audit to obtain reasonable assurance about whether effective internal control over financial reporting was maintained in all material respects. Our audit included obtaining an understanding of internal control over financial reporting, assessing the risk that a material weakness exists, testing and evaluating the design and operating effectiveness of internal control based on the assessed risk, and performing such other procedures as we considered necessary in the circumstances. We believe that our audit provides a reasonable basis for our opinion.
Definition and Limitations of Internal Control over Financial Reporting
A company’s internal control over financial reporting is a process designed to provide reasonable assurance regarding the reliability of financial reporting and the preparation of financial statements for external purposes in accordance with generally accepted accounting principles. A company’s internal control over financial reporting includes those policies and procedures that (1) pertain to the maintenance of records that, in reasonable detail, accurately and fairly reflect the transactions and dispositions of the assets of the company; (2) provide reasonable assurance that transactions are recorded as necessary to permit preparation of financial statements in accordance with generally accepted accounting principles, and that receipts and expenditures of the company are being made only in accordance with authorizations of management and directors of the company; and (3) provide reasonable assurance regarding prevention or timely detection of unauthorized acquisition, use, or disposition of the company’s assets that could have a material effect on the financial statements.
Because of its inherent limitations, internal control over financial reporting may not prevent or detect misstatements. Also, projections of any evaluation of effectiveness to future periods are subject to the risk that controls may become inadequate because of changes in conditions, or that the degree of compliance with the policies or procedures may deteriorate.
/s/ DELOITTE & TOUCHE LLP
Chicago, Illinois
February 14, 2019
91
|
Item 9B.
|
Other Information
|
None.
92
PART III
|
Item 10.
|
Directors, Executive Officers and Corporate Governance
|
The information required by this item with respect to members of the Board of Directors and with respect to the Audit Committee will be included in our definitive proxy statement for our
2019
Annual Meeting of Stockholders (our “2019 Proxy Statement”) under the captions “Election of Directors” and “Corporate Governance-Meetings of the Board and its Committees-Audit Committee” and is incorporated herein by reference. The information required by this item with respect to our Corporate Governance Guidelines and our Code of Conduct will be included in our 2019 Proxy Statement under the caption “Corporate Governance-Corporate Governance Materials” and is incorporated herein by reference. The information required by this item with respect to compliance with Section 16(a) of the Securities and Exchange Act of 1934 will be included in our 2019 Proxy Statement under the caption “Security Ownership of Certain Beneficial Owners, Directors and Officers-Section 16(a) Beneficial Ownership Reporting Compliance” and is incorporated herein by reference. See Item 1 of Part I, “Business-Executive Officers” for the information required by this item with respect to our executive officers.
|
Item 11.
|
Executive Compensation
|
The information required by this item will be included in our
2019
Proxy Statement under the captions “Compensation Discussion and Analysis,” “Compensation Committee Report,” “Executive Compensation,” and “Director Compensation” and is incorporated herein by reference, provided that the Compensation Committee Report shall not be deemed to be “filed” with this Annual Report.
|
Item 12.
|
Security Ownership of Certain Beneficial Owners and Management and Related Stockholder Matters
|
The information required by this item with respect to security beneficial ownership will be included in our
2019
Proxy Statement under the caption “Security Ownership of Certain Beneficial Owners, Directors and Officers” and is incorporated herein by reference.
The information required by this item with respect to equity compensation plan information will be included in our
2019
Proxy Statement under the caption “Equity Compensation Plan Information” and is incorporated herein by reference.
|
Item 13.
|
Certain Relationships and Related Transactions, and Director Independence
|
The information required by this item will be included in our
2019
Proxy Statement under the captions “Election of Directors” and “Corporate Governance” and is incorporated herein by reference.
|
Item 14.
|
Principal Accounting Fees and Services
|
The information required by this item will be included in our
2019
Proxy Statement under the caption “Ratification of Appointment of Independent Registered Public Accounting Firm” and is incorporated herein by reference.
93
Part IV
|
Item 15.
|
Exhibits and Financial Statement Schedules
|
|
(a)
|
1. Financial Statements:
|
The following financial statements of US Foods Holding Corp. and subsidiaries are included in Item 8:
|
2.
|
Financial Statement Schedules
|
Schedules have been omitted because they are inapplicable, not required, or the information is included elsewhere in the financial statements or notes thereto.
|
3.
|
Exhibits
|
The following exhibits are filed as part of this Annual Report or are incorporated by reference.
|
Exhibit No.
|
Description
|
|
|
2.1†
|
||
|
3.1
|
||
|
3.2
|
||
|
4.1
|
||
|
4.2
|
||
|
4.3
|
||
|
10.1.1
|
||
94
|
Exhibit No.
|
Description
|
|
|
10.1.2
|
||
|
10.2
|
||
|
10.3.1
|
||
|
10.3.2
|
||
|
10.3.3
|
||
|
10.3.4
|
||
|
10.3.5
|
||
|
10.3.6
|
||
|
10.4
|
||
|
10.5*
|
||
|
10.6*
|
||
|
10.7*
|
||
|
10.8*
|
||
95
|
Exhibit No.
|
Description
|
|
|
10.9*
|
||
|
10.10*
|
||
|
10.11*
|
||
|
10.12*
|
||
|
10.13*
|
||
|
10.14*
|
||
|
10.15*
|
||
|
10.16*
|
||
|
10.17*
|
||
|
21.1
|
||
|
23.1
|
||
|
31.1
|
||
|
31.2
|
||
|
32.1
|
||
|
32.2
|
||
|
101
|
Interactive Data file.
|
|
|
*
|
Indicates a management contract or compensatory plan or arrangement required to be filed as an exhibit pursuant to Item 15(b) of Form 10-K.
|
|
†
|
Schedules and exhibits have been omitted pursuant to Item 601(b)(2) of Regulation S-K. US Foods Holding Corp. hereby undertakes to furnish copies of any of the omitted schedules and exhibits upon request by the Securities and Exchange Commission.
|
96
|
Item 16.
|
Form 10-K Summary
|
None.
97
SIGNATURES
Pursuant to the requirements of Section 13 or 15(d) of the Securities Exchange Act of 1934, the registrant has duly caused this report to be signed on its behalf by the undersigned, thereunto duly authorized.
|
US FOODS HOLDING CORP.
(Registrant)
|
|
|
By:
|
/s/
PIETRO SATRIANO
|
|
Name:
|
Pietro Satriano
|
|
Title:
|
Chairman and Chief Executive Officer (Principal Executive Officer)
|
|
Date:
|
February 14, 2019
|
Pursuant to the requirements of the Securities Exchange Act of 1934, this report has been signed below by the following persons on behalf of the Registrant and in the capacities and on the dates indicated.
|
Signature
|
Title
|
Date
|
||
|
/s/ PIETRO SATRIANO
|
Chairman and Chief Executive Officer
|
February 14, 2019
|
||
|
Pietro Satriano
|
(Principal Executive Officer)
|
|||
|
/s/ DIRK J. LOCASCIO
|
Chief Financial Officer
|
February 14, 2019
|
||
|
Dirk J. Locascio
|
(Principal Financial Officer and Principal
Accounting Officer)
|
|||
|
/s/ CHERYL A. BACHELDER
|
Director
|
February 14, 2019
|
||
|
Cheryl A. Bachelder
|
||||
|
/s/ COURT D. CARRUTHERS
|
Director
|
February 14, 2019
|
||
|
Court D. Carruthers
|
||||
|
/s/ ROBERT M. DUTKOWSKY
|
Director
|
February 14, 2019
|
||
|
Robert M. Dutkowsky
|
||||
|
/s/SUNIL GUPTA
|
Director
|
February 14, 2019
|
||
|
Sunil Gupta
|
||||
|
/s/ JOHN A. LEDERER
|
Director
|
February 14, 2019
|
||
|
John A. Lederer
|
||||
|
/s/ CARL ANDREW PFORZHEIMER
|
Director
|
February 14, 2019
|
||
|
Carl Andrew Pforzheimer
|
||||
|
/s/ DAVID M. TEHLE
|
Director
|
February 14, 2019
|
||
|
David M. Tehle
|
||||
|
/s/ ANN E. ZIEGLER
|
Director
|
February 14, 2019
|
||
|
Ann E. Ziegler
|
||||
98
TABLE OF CONTENTS
Part IItem 1. BusinessItem 1A. Risk FactorsItem 1B. Unresolved Staff CommentsItem 2. PropertiesItem 3. Legal ProceedingsItem 4. Mine Safety DisclosuresPart IIItem 5. Market For Registrant S Common Equity, Related Stockholder Matters and Issuer Purchases Of Equity SecuritiesItem 6. Selected Financial DataItem 7. Management S Discussion and Analysis Of Financial Condition and Results Of OperationsItem 7A. Quantitative and Qualitative Disclosures About Market RiskItem 8. Financial Statements and Supplementary DataItem 9. Changes in and Disagreements with Accountants on Accounting and Financial DisclosureItem 9A. Controls and ProceduresItem 9B. Other InformationPart IIIItem 10. Directors, Executive Officers and Corporate GovernanceItem 11. Executive CompensationItem 12. Security Ownership Of Certain Beneficial Owners and Management and Related Stockholder MattersItem 13. Certain Relationships and Related Transactions, and Director IndependenceItem 14. Principal Accounting Fees and ServicesPart IVItem 15. Exhibits and Financial Statement SchedulesItem 16. Form 10-k Summary