UNIVERSAL TECHNICAL INSTITUTE INC
10-Ks and 10-Qs
|
|
|
|
|
|
|
|
|
|
|
|
|
|
|
|
|
|
|
|
|
|
|
|
|
|
|
|
|
|
|
|
|
|
|
|
|
|
|
|
|
|
|
|
|
|
|
|
|
|
|
|
|
|
|
|
|
|
|
__________________________________________________________________________________________
__________________________________________________________________________________________
U. S. SECURITIES AND EXCHANGE COMMISSION
WASHINGTON, D.C. 20549
_____________________________________________
Form 10-K
(Mark One)
þ
ANNUAL REPORT PURSUANT TO SECTION 13 OR 15(d) OF THE SECURITIES EXCHANGE ACT OF 1934
For the fiscal year ended
September 30, 2018
¨
TRANSITION REPORT PURSUANT TO SECTION 13 OR 15(d) OF THE SECURITIES EXCHANGE ACT OF 1934
_____________________________________________
Commission File Number 1-31923
_____________________________________________
UNIVERSAL TECHNICAL INSTITUTE, INC.
(Exact name of registrant as specified in its charter)
|
Delaware
|
|
|
|
86-0226984
|
|
(State or other jurisdiction of
incorporation or organization)
|
|
|
|
(IRS Employer Identification No.)
|
16220 North Scottsdale Road, Suite 500
Scottsdale, Arizona 85254
(Address of principal executive offices)
(623) 445-9500
(Registrant’s telephone number, including area code)
Securities registered pursuant to Section 12(b) of the Act:
|
Title of each class:
|
Name of each exchange on which registered:
|
|
|
Common Stock, $0.0001 par value
|
New York Stock Exchange
|
|
Indicate by check mark if the registrant is a well-known seasoned issuer, as defined in Rule 405 of the Securities Act. Yes
¨
No
þ
Indicate by check mark if the registrant is not required to file reports pursuant to Section 13 or Section 15(d) of the Act. Yes
¨
No
þ
Indicate by check mark whether the registrant (1) has filed all reports required to be filed by Section 13 or 15(d) of the Securities Exchange Act of 1934 during the preceding 12 months (or for such shorter period that the registrant was required to file such reports), and (2) has been subject to such filing requirements for the past 90 days. Yes
þ
No
¨
Indicate by check mark whether the registrant has submitted electronically every Interactive Data File required to be submitted pursuant to Rule 405 of Regulation S-T (§232.405 of this chapter) during the preceding 12 months (or for such shorter period that the registrant was required to submit such files). Yes
þ
No
¨
Indicate by check mark if disclosure of delinquent filers pursuant to Item 405 of Regulation S-K (§229.405) is not contained herein, and will not be contained, to the best of registrant's knowledge, in definitive proxy or information statements incorporated by reference in Part III of this Form 10-K or any amendment to this Form 10-K.
þ
Indicate by check mark whether the registrant is a large accelerated filer, an accelerated filer, a non-accelerated filer, a smaller reporting company, or an emerging growth company. See the definitions of “large accelerated filer,” “accelerated filer,” “smaller reporting company,” and "emerging growth company" in Rule 12b-2 of the Exchange Act.
Large accelerated filer
¨
Accelerated filer
þ
Non-accelerated filer
¨
Smaller reporting company
¨
Emerging growth company
¨
If an emerging growth company, indicate by check mark if the registrant has elected not to use the extended transition period for complying with any new or revised financial accounting standards provided pursuant to Section 13(a) of the Exchange Act.
¨
Indicate by check mark whether the registrant is a shell company (as defined in Rule 12b-2 of the Act). Yes
¨
No
þ
At
November 21, 2018
,
25,303,898
shares of common stock were outstanding. The aggregate market value of the shares of common stock held by non-affiliates of the registrant on the last business day of the registrant's most recently completed second fiscal quarter (March 31, 2018) was approximately $52,600,000 (based upon the closing price of the common stock on such date as reported by the New York Stock Exchange). For purposes of this calculation, the registrant has excluded the market value of all common stock beneficially owned by all executive officers and directors of the registrant.
Documents Incorporated by Reference
Portions of the registrant's definitive proxy statement for the 2019 Annual Meeting of Stockholders are incorporated by reference into Part III of this Annual Report on Form 10-K.
|
Page
|
|||
|
ITEM 1.
|
|||
|
ITEM 1A.
|
|||
|
ITEM 1B.
|
|||
|
ITEM 2.
|
|||
|
ITEM 3.
|
|||
|
ITEM 4.
|
|||
|
ITEM 5.
|
|||
|
ITEM 6.
|
|||
|
ITEM 7.
|
|||
|
ITEM 7A.
|
|||
|
ITEM 8.
|
|||
|
ITEM 9.
|
|||
|
ITEM 9A.
|
|||
|
ITEM 9B.
|
|||
i
|
Page
|
|||
|
ITEM 10.
|
|||
|
ITEM 11.
|
|||
|
ITEM 12.
|
|||
|
ITEM 13.
|
|||
|
ITEM 14.
|
|||
|
ITEM 15.
|
|||
ii
Special Note Regarding Forward-Looking Statements
This Annual Report on Form 10-K and the documents incorporated by reference herein contain forward-looking statements within the meaning of Section 21E of the Securities Exchange Act of 1934, as amended (Exchange Act) and Section 27A of the Securities Act of 1933, as amended (Securities Act), which include information relating to future events, future financial performance, strategies, expectations, competitive environment, regulation and availability of resources. From time to time, we also provide forward-looking statements in other materials we release to the public as well as verbal forward-looking statements. These forward-looking statements include, without limitation, statements regarding: proposed new programs; scheduled openings of new campuses and campus expansions; expectations that regulatory developments, or agency interpretations of such regulatory developments or other matters will not have a material adverse effect on our consolidated financial position, results of operations or liquidity; statements concerning projections, predictions, expectations, estimates or forecasts as to our business, financial and operational results and future economic performance; and statements of management’s goals, strategies and objectives and other similar expressions. Such statements give our current expectations or forecasts of future events; they do not relate strictly to historical or current facts. Words such as “may,” “will,” “should,” “could,” “would,” “predicts,” “potential,” “continue,” “expects,” “anticipates,” “future,” “intends,” “plans,” “believes,” “estimates,” and similar expressions, as well as statements in future tense, identify forward-looking statements. However, not all forward-looking statements contain these identifying words.
We cannot guarantee that any forward-looking statement will be realized, although we believe we have been prudent in our plans and assumptions. Achievement of future results is subject to risks, uncertainties and potentially inaccurate assumptions. Many events beyond our control may determine whether results we anticipate will be achieved. Should known or unknown risks or uncertainties materialize, or should underlying assumptions prove inaccurate, actual results could differ materially from past results and those anticipated, estimated or projected. Among the factors that could cause actual results to differ materially are the factors discussed under Item 1A, "Risk Factors". You should bear this in mind as you consider forward-looking statements.
Except as required by law, we undertake no obligation to publicly update or revise forward-looking statements, whether as a result of new information, future events or otherwise. You are advised, however, to consult any further disclosures we make on related subjects in our Form 10-Q and 8-K reports to the Securities and Exchange Commission
(SEC).
1
Overview
We are the leading provider of postsecondary education for students seeking careers as professional automotive, diesel, collision repair, motorcycle and marine technicians as well as welders and CNC machining technicians as measured by total average full-time enrollment and graduates. We offer certificate, diploma or degree programs at
13
campuses across the United States under the banner of several well-known brands, including Universal Technical Institute (UTI), Motorcycle Mechanics Institute and Marine Mechanics Institute (collectively, MMI) and NASCAR Technical Institute (NASCAR Tech). Additionally, we offer manufacturer specific advanced training programs, including student-paid electives, at our campuses and manufacturer or dealer sponsored training at certain campuses and dedicated training centers. We have provided technical education for 53 years.
For the
year ended September 30, 2018
, our average full-time enrollment was
10,418
.
Business Model
We work closely with leading original equipment manufacturers (OEMs) and employers to understand their needs for qualified service professionals. Through our industry relationships, we are able to continuously refine and expand our programs and curricula. We believe our industry-oriented educational philosophy and national presence have enabled us to develop valuable industry relationships, which provide us with significant competitive strength and support our market leadership.
We are a primary provider of manufacturer specific advanced training (MSAT) programs, and we have relationships with over 30 OEMs, including the following, and their associated brands:
|
American Honda Motor Company, Inc.
|
|
Mercedes-Benz USA, LLC
|
|
BMW of North America, LLC
|
|
Mercury Marine, a division of Brunswick Corporation
|
|
BMW Motorrad of North America, LLC
|
|
Navistar International Corporation
|
|
Bombardier Produits Recreatifs (BRP), Inc.
|
|
Nissan North America, Inc.
|
|
Cummins Rocky Mountain, LLC, a subsidiary of Cummins, Inc.
|
|
Peterbilt Motors Company
|
|
Daimler Trucks North America
|
|
Porsche Cars of North America, Inc.
|
|
Fiat Chrylser Automobiles (FCA) US LLC (fka Chrysler Group LLC)
|
|
Suzuki Motor of America, Inc.
|
|
Ford Motor Company
|
|
Toyota Motor Sales, U.S.A., Inc.
|
|
General Motors Company
|
|
Volvo Cars of North America, LLC
|
|
Harley-Davidson Motor Company
|
|
Volvo Penta of the Americas, Inc.
|
|
Kawasaki Motors Corporation, U.S.A.
|
|
Yamaha Motor Corporation, USA
|
|
KTM North America, Inc.
|
|
|
Participating manufacturers typically assist us in the development of course content and curricula, while providing us with vehicles, equipment, specialty tools and parts at reduced prices or at no charge. In some instances, they offer tuition reimbursement and other hiring incentives to our graduates. Our collaboration with OEMs enables us to provide highly specialized education to our students, resulting in enhanced employment opportunities and the potential for higher wages for our graduates.
2
Our industry partners and their dealers benefit from a supply of technicians who are certified or credentialed by the manufacturer as graduates of the MSAT programs. The MSAT programs offer a cost-effective alternative for sourcing and developing technicians for both OEMs and their dealers. These relationships also support the development of incremental revenue opportunities from training the OEMs’ existing employees.
In addition to the OEMs, our industry relationships also extend to after-market retailers, fleet service providers and enthusiast organizations. Other target groups for relationship-building, such as parts and tools suppliers, provide us with a variety of strategic and financial benefits that include equipment sponsorship, new product support, licensing and branding opportunities and financial sponsorship for our campuses and students.
Business Strategy
Our goal is to continue to be the leading provider of postsecondary education for students seeking careers as professional automotive, diesel, collision repair, motorcycle and marine technicians as well as welders and CNC machining technicians and the leading supplier of entry-level skilled technicians for the industries we serve. We continue to evolve our business model to provide our students with accessible, affordable training with a focus on bringing education to the students. We intend to pursue the following business strategies to attain these goals:
Strengthen industry relationships
Our relationships with leading OEMs and other strategic partners are important to our business. We deliver value to these partners and employers by functioning as an efficient hiring source and low cost training option for new and existing technicians. These relationships give us direct input on the latest needs and requirements of employers, which not only guides our prospective student recruitment, but also strengthens our curricula and our students’ opportunities for employment and earnings potential after graduation. In addition, our partners and the OEM dealers support our students through manufacturer-paid courses, scholarships and tuition reimbursement programs.
Recruit, train and identify employment opportunities for more students
Our student recruitment efforts are focused on three primary markets for prospective students and are conducted through three admissions channels:
High School: Field-based representatives develop and maintain relationships with high school guidance counselors, teachers and administrators as well as local employers. These representatives generate student interest in pursuing the technician career path and UTI’s training programs through career presentations and workshops at high schools, career fairs and inviting students and their influencers on field trips and tours of our campuses and local employers’ businesses.
Adult: Campus-based representatives serve adult career-seeking or career changing students who typically inquire with our schools as a result of our advertising campaigns.
Military: Our military representatives are strategically located throughout the country and focus on building relationships with military installations in order to serve the needs of transitioning soldiers and military veterans. Additionally, we have a centralized team of military representatives who are dedicated to serving and assisting veterans throughout the U.S.
We collaborate with employers to help prospective students and their families understand the potential career opportunities that may be available during and after completing one of our programs. As competition for the graduates we train grows, employers are increasingly partnering with us to raise awareness of the benefits of a technician career path for prospective students. Employer testimonials are featured in our marketing materials.
3
Additionally, employers host special events for our prospective students at their locations and participate in open houses at our campuses, highlighting the high-tech jobs and career opportunities available to our graduates.
Our national multi-media marketing strategies are designed to drive new student growth by building brand awareness and differentiation, enhancing the appeal of the skilled trades, and generating inquiries from qualified prospective students.
We continue to optimize our national and local marketing initiatives, tools and systems with the goals of cost-efficiency, balancing the volume and quality of inquiries and attracting prospective students with a high propensity to attend our programs. Partnering with employers and focusing on our marketing strategies is part of an effort to increase positive perception of technical careers and our programs. We are working to build relationships on military bases, in high schools, with local and state businesses and education and policy leaders to educate them on the value we create for our students, local employers, the economy and the community.
We have implemented new processes, technology and tools to support our national network of admissions representatives in responding to new student inquiries and keeping them engaged as they apply for, enroll in and start school. We provide graduate-based incentive compensation for our admissions representatives, which rewards them for students who successfully complete our programs.
Improve educational value proposition and affordability
Educational value
Our strategy is to provide students with an excellent return on their educational investment by working with our industry partners to offer manufacturer-specific training that is tailored to industry standards and requirements, improves students’ opportunities to find employment and maximizes their earnings potential in a secure, growing industry. We actively engage transportation industry partners in defining our core curriculum and improving and expanding MSAT courses. We regularly evaluate program offerings, schedules and locations that are most appealing to students and aligned with employer expectations, and update and expand our core and MSAT courses to align our training programs with current industry requirements.
These unique course offerings make our students more valuable to employers by giving them training that is consistent with industry needs and rapidly changing technology and the opportunity to earn a variety of industry-recognized certifications and credentials. As a result, we believe we are well positioned to better meet the industry’s demand for skilled technicians.
Our Automotive and Diesel Technology II curricula is designed around manufacturers’ needs and fulfills student demand for hands-on, instructor led training in multiple learning environments. We intend to continue integrating this curricula and methodologies at new and existing campuses that offer Automotive and Diesel Technology programs. We continue to prioritize implementation of the Automotive and Diesel Technology II curricula at new campus locations.
We provide relevant services to assist students with possible tuition financing options, educational and career counseling, opportunities while attending school for part-time work and housing assistance and, ultimately, graduate employment. Our national employment services team develops job opportunities and outreach, while our local employment services teams instruct active students on employment search and interviewing skills, facilitate employer visits to campuses, provide access to reference materials and assist with the composition of resumes.
Affordability
Increased price sensitivity and aversion to debt continue to negatively impact prospective students’ willingness and ability to invest in an education, especially when jobs are plentiful in an economic cycle. We have
4
opened more conveniently located campuses that allow students to commute, and we provide a flexible curriculum that allows students to work while attending school. We are focused on making our training more affordable and accessible through financing options, proprietary loans, institutional grants and scholarships based on need and merit and employer funded tuition reimbursement; we assist students in applying for any grants or scholarships available for which they meet qualifications and we engage employers in developing tuition reimbursement programs for employees in good standing. We also offer financing tools and guidance for students.
In response to growing demand for trained technicians, our industry partners and employers are increasingly willing to participate in the cost of education by providing our students with scholarship money and relocation assistance to attend school and by offering our graduates tuition reimbursement plans and competitive compensation and benefit packages, including signing bonuses, relocation grants and toolboxes. These programs make our training more affordable for students and provide tangible examples of the opportunities available to our graduates.
We are working with high schools across the nation to increase course articulation programs, which allow students who have completed courses accredited by the ASE Education Foundation (ASEEF), formerly known as National Automotive Technical Education Foundation, to transfer these credits to our programs. These additional credits can reduce students’ tuition and the time needed to complete our programs.
Additionally, we regularly review and revise key business processes with the goals of eliminating costs and waste, driving efficiency and allowing us to continue to improve value and affordability for our students. Our goal is to align costs with student populations without compromising the quality of our education.
Invest in strategies to return to profitable growth
We are pursuing strategies designed to return to profitable long-term growth and have secured the capital necessary to execute these initiatives, while meeting the requirements and expectations of regulators and our accreditor.
Through organic growth and, potentially, strategic acquisition of campus locations, we are expanding our national footprint by adding smaller campuses in locations where there is strong demand from students and employers, including those students who would not relocate to one of our existing campuses. Additionally, we are continuing to transform our existing campus footprint by reducing the size of campuses with excess capacity, or by offering new OEM courses, adding complementary skilled trade programs, such as our welding and CNC machining programs, or negotiating facility use agreements.
We are also building the capability to develop and deliver innovative digital training and continuing technical education solutions to our students and industry customers that builds on our expertise in developing training programs for hands-on technical applications.
Industry Background
The market for qualified service technicians is large and growing. In the most recent data available, the United States Department of Labor (U.S. DOL) estimated that in 2016 there were approximately 749,900 employed automotive technicians in the United States, and this number was expected to increase by 6.1% from 2016 to 2026. Other 2016 estimates provided by the U.S. DOL indicate that the number of technicians in the other industries we serve, including diesel, collision and motorcycle are expected to increase over this ten-year period by 9.2%, 8.5% and 0.3%, respectively. Marine repair is expected to decrease over this ten-year period by -0.5%. The need for technicians is due to a variety of factors, including technological advancement in the industries into which our graduates enter, a continued increase in the number of automobiles, trucks, motorcycles and boats in service, the increasing lifespan of late-model automobiles and light trucks and an aging workforce that has begun to retire. As a result of these factors, the U.S. DOL estimates that an average of approximately 125,200 new job openings will
5
exist annually for new entrants from 2016 to 2026 in these fields, according to data we reviewed. In addition to the increase in demand for newly qualified technicians, manufacturers, dealer networks, transportation companies and governmental entities with large fleets are outsourcing their training functions, seeking preferred education providers who can offer high quality curricula and have a national presence to meet the employment and advanced training needs of their national dealer networks.
The U.S. DOL estimated that in 2016 there were approximately 404,800 employed welders, cutters, solderers and brazers in the United States, and this number was expected to increase by 5.6% from 2016 to 2026. The U.S. DOL estimates that an average of approximately 45,800 new job openings will exist annually for new entrants from 2016 to 2026 in this field, according to data we reviewed.
The U.S. DOL estimated that in 2016 there were approximately 145,700 employed computer-controlled machine tool operators in the United States, and this number was expected to increase by 1.1% from 2016 to 2026. The U.S. DOL estimates that an average of approximately 14,500 new job openings will exist annually for new entrants from 2016 to 2026 in this field, according to data we reviewed.
Schools and Programs
Through our campus-based school system, we offer specialized technical education programs under the banner of several well-known brands, including Universal Technical Institute (UTI), Motorcycle Mechanics Institute and Marine Mechanics Institute (collectively, MMI) and NASCAR Technical Institute (NASCAR Tech). The majority of our programs are designed to be completed in 33 to 102 weeks and culminate in a certificate, diploma or associate of occupational studies degree, depending on the program and campus. Tuition ranges from approximately $17,900 to $55,450
per program, depending on the nature and length of the program. Longer programs generally reflect multiple elective manufacturer courses. Our campuses are accredited and our certificate, diploma and degree programs are eligible for federal student financial assistance funds under the Higher Education Act of 1965, as amended (HEA), commonly referred to as Title IV Programs, which are administered by the U.S. Department of Education (ED). Our programs are also eligible for financial aid from federal sources other than Title IV Programs, such as the programs administered by the U.S. Department of Veterans Affairs (VA) and under the Workforce Investment Act.
6
Our schools and programs are summarized in the following table:
|
Date
|
|||
|
Training
|
|||
|
Location
|
Brand
|
Commenced
|
Principal Programs
|
|
Arizona (Avondale)*
|
UTI
|
1965
|
Automotive; Diesel; Welding
|
|
Arizona (Phoenix)
|
MMI
|
1973
|
Motorcycle
|
|
California (Long Beach)*
|
UTI
|
2015
|
Automotive; Diesel; Collision Repair and Refinishing
|
|
California (Rancho Cucamonga)*
|
UTI
|
1998
|
Automotive; Diesel; Welding
|
|
California (Sacramento)*
|
UTI
|
2005
|
Automotive; Diesel; Collision Repair and Refinishing
|
|
Florida (Orlando)*
|
UTI/MMI
|
1986
|
Automotive; Diesel; Motorcycle; Marine
|
|
Illinois (Lisle)
|
UTI
|
1988
|
Automotive; Diesel
|
|
Massachusetts (Norwood)
|
UTI
|
2005
|
Automotive; Diesel
|
|
New Jersey (Bloomfield)*
|
UTI
|
2018
|
Automotive; Diesel
|
|
North Carolina (Mooresville)
|
NASCAR Tech
|
2002
|
Automotive; Automotive with NASCAR; CNC Machining
|
|
Pennsylvania (Exton)
|
UTI
|
2004
|
Automotive; Diesel
|
|
Texas (Dallas/Ft. Worth)*
1
|
UTI
|
2010
|
Automotive; Diesel
|
|
Texas (Houston)
|
UTI
|
1983
|
Automotive; Diesel; Collision Repair and Refinishing
|
* Indicates a campus location that offers our Automotive Technology and Diesel Technology II curricula.
1
We intend to begin teaching our Welding Technology program at our Dallas/Ft. Worth, Texas campus in the second quarter of 2019.
Universal Technical Institute (UTI)
UTI offers automotive, diesel and industrial, and collision repair and refinishing programs that are accredited by the ASEEF. In order to apply for ASEEF accreditation, a school must meet the ASEEF curriculum requirements and also must have graduated its first class. We offer certificate, diploma and associate degree level programs, with degree level credentials currently only offered at our Avondale, Arizona; Dallas/Ft. Worth, Texas; Rancho Cucamonga, California and Sacramento, California campuses. We plan to expand degree level offerings to select existing and new campus locations, subject to applicable regulatory approvals. We offer the following programs under the UTI brand:
|
•
|
Automotive Technology
. Established in 1965, the Automotive Technology program is designed to teach students how to diagnose, service and repair automobiles. In 2010, we began offering this program as Automotive Technology II in a blended learning format which combines daily instructor-led theory and hands-on lab training complimented by instructor-led web-based learning. Automotive Technology II is currently offered at our Avondale, Arizona; Long Beach, California; Rancho Cucamonga, California; Sacramento, California; Orlando, Florida; Bloomfield, New Jersey and Dallas/Ft. Worth, Texas campuses. The program generally ranges from 33 to 66 weeks in duration and tuition ranges from approximately $23,500 to $45,200. Graduates of this program are qualified to work as entry-level service technicians in automotive dealer service departments or automotive repair facilities.
|
7
|
•
|
Diesel Technology
. Established in 1968, the Diesel Technology program is designed to teach students how to diagnose, service and repair diesel systems and industrial equipment. In 2010, we began offering this program as Diesel Technology II in the blended learning format described above. Diesel Technology II is currently offered at our Avondale, Arizona; Long Beach, California; Rancho Cucamonga, California; Sacramento, California; Orlando, Florida; Bloomfield, New Jersey and Dallas/Ft. Worth, Texas campuses. The program generally ranges from 45 to 57 weeks in duration and tuition ranges from approximately $31,600 to $40,200. Graduates of this program are qualified to work as entry-level service technicians in medium and heavy truck facilities, truck dealerships, or in service and repair facilities for equipment utilized in various industrial applications, including materials handling, construction, transport refrigeration or farming.
|
|
•
|
Automotive and Diesel Technology
. Established in 1970, the Automotive/Diesel Technology program is designed to teach students how to diagnose, service and repair automobiles and diesel systems. Automotive and Diesel Technology is currently offered at our Lisle, Illinois; Norwood, Massachusetts; Exton, Pennsylvania and Houston, Texas campuses. In 2010, we began offering this program as Automotive and Diesel Technology II in the blended learning format described above; Automotive and Diesel Technology II is currently offered at our Avondale, Arizona; Long Beach, California; Rancho Cucamonga, California; Sacramento, California; Orlando, Florida; Bloomfield, New Jersey and Dallas/Ft. Worth, Texas. The program generally ranges from 75 to 90 weeks in duration and tuition ranges from approximately $43,250 to $55,450
.
Graduates of this program are qualified to work as entry-level service technicians in automotive repair facilities, automotive dealer service departments, diesel engine repair facilities, medium and heavy truck facilities, truck dealerships, or in service and repair facilities for marine diesel engines and equipment utilized in various industrial applications, including materials handling, construction, transport refrigeration or farming.
|
|
•
|
Collision Repair and Refinishing Technology (CRRT)
. Established in 1999, the CRRT program is designed to teach students how to repair non-structural and structural automobile damage as well as how to prepare cost estimates on all phases of repair and refinishing. The program generally ranges from 51 to 54 weeks in duration and tuition ranges from approximately $33,950 to $38,950. Graduates of this program are qualified to work as entry-level technicians at OEM dealerships and independent repair facilities.
|
|
•
|
Welding Technology
.
Established in 2017, our Welding Technology program is designed to teach students how to weld various materials using a wide range of welding processes. The program’s curriculum was built in partnership with Lincoln Electric, a global leader in the welding industry. Welding Technology is offered at our Rancho Cucamonga, California campus. We began teaching our Welding Technology program at our Avondale, Arizona campus in January 2018.
The program is 36 weeks in duration and tuition ranges from approximately $19,950 to $20,450. Graduates of this program are qualified to work as entry-level welders in the construction, structural, pipe, mechanical contracting and fabrication industries. The training prepares graduates to apply for American Welding Society certification.
|
Motorcycle Mechanics Institute and Marine Mechanics Institute (collectively, MMI)
|
•
|
Motorcycle
. Established in 1973, the MMI motorcycle program is designed to teach students how to diagnose, service and repair motorcycles and all-terrain vehicles. The program generally ranges from 42 to 102 weeks in duration and tuition ranges from approximately $19,450 to $47,050
.
Graduates of this program are qualified to work as entry-level service technicians in motorcycle dealerships and independent repair facilities. We have agreements relating to specific motorcycle training and elective programs with American Honda Motor Company, Inc.; BMW Motorrad of North America, LLC; Harley-Davidson Motor Company; Kawasaki Motors Corporation, U.S.A.; Suzuki
|
8
Motor of America, Inc. and Yamaha Motor Corporation, USA, and MMI is also supported by KTM North America, Inc. We have agreements for dealer training with American Honda Motor Company, Inc. and Harley-Davidson Motor Company. These motorcycle manufacturers support us through their endorsement of our curricula content, assisting with our course development, providing equipment and product donations and instructor training. Certain of these agreements are verbal and may be terminated without cause by either party at any time.
|
•
|
Marine.
Established in 1991, the MMI marine program is designed to teach students how to diagnose, service and repair boats. The program is 51 weeks in duration and tuition is approximately $28,150
.
Graduates of this program are qualified to work as entry-level service technicians for marine dealerships and independent repair shops, as well as for marinas, boat yards and yacht clubs. MMI is supported by several marine manufacturers, and we have agreements relating to marine OEM courses with American Honda Motor Company, Inc.; Mercury Marine, a division of Brunswick Corporation; Suzuki Motor of America, Inc.; Volvo Penta of the Americas, Inc. and Yamaha Motor Corporation, USA. We have agreements for dealer training with American Honda Motor Company Inc. and Mercury Marine, a division of Brunswick Corporation. These marine manufacturers support us through their endorsement of our curricula content, assisting with course development, equipment and product donations and instructor training. Certain of these agreements are verbal and may be terminated without cause by either party at any time.
|
Students who complete the MMI marine program can also pursue provisional certification as factory-certified technicians for Mercury Marine outboard products at no additional cost. Students must complete core Mercury University requirements, which are an embedded component of the MMI marine program, and complete online distance-learning courses in order to achieve the provisional certification. The certification becomes active upon employment with a Mercury Marine dealership within two years of graduation. MMI is the only career technical education school in the country with which Mercury Marine is offering this certification program.
NASCAR Technical Institute (NASCAR Tech)
|
•
|
NASCAR Tech.
Established in 2002, NASCAR Tech offers the same type of automotive training as other UTI locations, along with additional NASCAR-specific elective courses. In the NASCAR-specific elective courses, students have the opportunity to learn first-hand with NASCAR engines and equipment and to acquire specific skills required for entry-level positions in automotive and racing-related career opportunities. The programs generally range from 48 to 78 weeks in duration and tuition ranges from $35,250 to $50,700. Graduates of the Automotive Technology program and the Automotive Technology with NASCAR (the NASCAR program) at NASCAR Tech are qualified to work as entry-level service technicians in automotive repair facilities or automotive dealer service departments. Graduates from the NASCAR program have additional opportunities to work in racing-related industries. Of the students who elected to take the NASCAR-specific elective courses and graduated during 2017, approximately 19% accepted employment opportunities in racing-related industries. The overall employment rate for our NASCAR Tech campus was 85% for 2017 graduates. See "Business - Graduate Employment" included elsewhere in this Report on Form 10-K for further information on our employment rates.
|
|
•
|
Computer Numeric Control (CNC) Machining and Manufacturing Technology
.
Established in 2017, our CNC Machining and Manufacturing Technology program is designed to teach students how to produce precision parts used in high-performance engines and a wide variety of trucks, motorcycles, cars and boats, and also in industrial applications, aerospace components and medical and surgical equipment. The program’s curriculum of CNC classes is aligned with standards established by the National Institute for Metalworking Skills (NIMS) and prepares graduates to take the NIMS assessments and examinations for CNC machine operators. CNC Machining and
|
9
Manufacturing Technology is offered at our NASCAR Tech campus. The program is 36 weeks in duration and tuition is approximately $17,900. Graduates of this program are qualified to work as entry-level CNC operators in the manufacturing and mechanical fabrication industries.
Manufacturer Specific Advanced Training (MSAT) Programs
We offer advanced training programs in the form of manufacturer-paid post-graduate MSAT programs, and in the form of student-paid MSAT courses which may be added to a student’s core Automotive, Diesel or Motorcycle program.
The manufacturer-paid MSATs are paid for by the manufacturer and/or its dealers in return for a commitment by the student to work for a dealer of that manufacturer for a certain period of time upon completion of the program. For both types of programs, the manufacturer typically assists us in the development of course content and curricula, while providing us with vehicles, equipment, specialty tools and parts at reduced prices or at no charge. This specialized training enhances the student’s skills with a particular manufacturer’s technology resulting in enhanced employment opportunities and potential for higher wages for our graduates.
We consistently evaluate new and existing OEM relationships to determine those programs that have the best outcomes for our students. This may lead to the termination of relationships that do not result in the best outcomes for our students after graduation.
Manufacturer-Paid MSATs
Our manufacturer-paid MSATs are intended to offer in-depth instruction on specific manufacturers’ products, qualifying a graduate for employment with a dealer seeking highly specialized, entry-level technicians with brand-specific skills. Students who are highly ranked graduates of an automotive or diesel program may apply to be selected for these programs. The programs range from 12 to 23 weeks in duration. Pursuant to written agreements, we offer the following manufacturer-paid MSAT programs using vehicles, equipment, specialty tools and curricula provided by the OEMs:
|
•
|
BMW of North America, LLC.
We provide BMW’s Service Technician Education Program (STEP). STEP programs are provided at our Avondale, Arizona and Orlando, Florida campuses and at the BMW training centers in Ontario, California and Woodcliff Lake, New Jersey. This agreement expires on December 31, 2018 and may be terminated for cause by either party.
|
|
•
|
Mercedes-Benz USA, LLC.
We provide the Mercedes-Benz DRIVE
Program at the MBUSA training centers in Grapevine, Texas; Jacksonville, Florida and Long Beach, California. This agreement expires on December 31, 2019 and may be terminated without cause by either party.
|
|
•
|
Navistar International Corporation.
We provide the International Truck Education Program at our Lisle, Illinois and Sacramento, California campuses. This agreement expires December 31, 2020 and may be renewed annually by mutual agreement.
|
|
•
|
Nissan North America, Inc.
We provide the INFINITI Technician Training Academy at our Long Beach, California campus. This agreement expires on January 31, 2019 and may be terminated without cause by either party.
|
|
•
|
Peterbilt Motors Company.
We provide the Peterbilt Technician Institute program at our Dallas/Ft. Worth, Texas; Exton, Pennsylvania and Lisle, Illinois campuses. This agreement expires on December 31, 2020 and may be terminated without cause by either party.
|
|
•
|
Porsche Cars of North America, Inc.
We provide the Porsche Technician Apprenticeship Program at the Porsche training centers in Atlanta, Georgia; Easton, Pennsylvania and Eastvale, California.
This agreement expires September 30, 2020 and may be renewed by mutual agreement.
|
10
|
•
|
Volvo Cars of North America, LLC.
We provide Volvo’s Service Automotive Factory Education program training at our Avondale, Arizona campus. This agreement expires on December 31, 2018 and may be renewed annually by mutual agreement.
|
Student-Paid MSATs
Pursuant to written agreements, we offer the following student-paid MSAT programs for the following OEMs using vehicles, equipment, specialty tools and curricula provided by the OEMs:
|
•
|
Cummins, Inc.
We provide power generation training through the Cummins Technician Apprentice Program at our Avondale, Arizona campus.
|
|
•
|
Cummins Rocky Mountain, LLC, a subsidiary of Cummins, Inc.
We provide the Cummins Technician Qualification Program at our Avondale, Arizona; Exton, Pennsylvania and Houston, Texas campuses.
|
|
•
|
Daimler Trucks North America.
We provide the Daimler Trucks Finish First Program at our Avondale, Arizona and Lisle, Illinois campuses.
|
|
•
|
Fiat Chrysler Automobiles (FCA) US LLC.
We provide the Mopar Technical Education Curriculum program at our NASCAR Tech campus in Mooresville, North Carolina.
|
|
•
|
Ford Motor Company.
We provide the Ford Accelerated Credential Training Program at all UTI campuses except our Bloomfield, New Jersey, Dallas/Ft. Worth, Texas and Long Beach, California campuses.
|
|
•
|
General Motors Company.
We provide the GM Technician Career Training Program at our Avondale, Arizona campus.
|
|
•
|
Nissan North America, Inc.
We provide the Nissan Automotive Technician Training Program at our Houston, Texas; Mooresville, North Carolina; Long Beach, California and Orlando, Florida campuses.
|
|
•
|
Toyota Motor Sales, U.S.A., Inc.
We provide the Toyota Professional Automotive Technician Program at our Lisle, Illinois; Exton, Pennsylvania and Sacramento, California campuses.
|
Dealer/Industry Training
Technicians in all of the industries we serve are in regular need of training or certification on new technologies. Manufacturers outsource a portion of this training to education providers such as UTI. Additionally, certain manufacturers outsource instructor staffing for their own training programs. We currently provide dealer technician training or instructor staffing services to manufacturers such as the following: American Honda Motor Company, Inc.; BMW of North America, LLC; Ford Motor Company; General Motors Company, through Raytheon Professional Services LLC; Harley-Davidson Motor Company and Mercury Marine, a division of Brunswick Corporation.
Industry Relationships
We have a network of industry relationships that provide a wide range of strategic and financial benefits, including product/financial support, licensing and manufacturer training.
|
•
|
Product/Financial Support
. Product/financial support is an integral component of our business strategy and is present throughout our schools. In these relationships, sponsors provide their products, including equipment and supplies, at reduced or no cost to us, in return for our use of those products in the classroom. Additionally, they may provide financial sponsorship either to us or to our students.
|
11
Product/financial support is an attractive marketing opportunity for sponsors because our classrooms provide them with early access to the future end-users of their products. As students become familiar with a manufacturer’s products during training, they may be more likely to continue to use the same products upon graduation. Our product support relationships allow us to minimize the equipment and supply costs in each of our classrooms and significantly reduce the capital outlay necessary for operating and equipping our campuses.
An example of a product/financial support relationship is:
|
◦
|
Snap-on Tools
. We have a strategic agreement with Snap-on Tools, a premier tool provider to the industries we serve. Upon graduation from certain certificate, diploma or degree programs, students receive a Career Starter Tool Set Voucher, redeemable for a choice of a Snap-on tool set having an approximate retail value of $1,000. The Snap-on tool set can be useful as a student establishes their career. We purchase these tool sets from Snap-on Tools at a discount from their list price pursuant to a written agreement which expires in October 2022. In the context of this relationship, we have granted Snap-on Tools exclusive access to our campuses to display tool related advertising, and we have agreed to use Snap-on Tools equipment to train our students. We receive credits from Snap-on Tools for student tool kits that we purchase and any additional purchases made by our students. We can then redeem those credits in multiple ways, which historically has been to purchase Snap-on Tools equipment and tools for our campuses at the full retail list price. The renewal executed in October 2017 also allows us to redeem our credits for a portion of the tool sets we purchase.
|
|
•
|
Licensing
. Licensing agreements enable us to establish meaningful relationships with key industry brands. We pay a licensing fee and, in return, receive the right to use a particular industry participant’s name, logo or trademark in our promotional materials and on our campuses. We believe that our current and potential students generally identify favorably with the recognized brand names licensed to us, enhancing our reputation and the effectiveness of our marketing efforts.
|
An example of a licensing arrangement is:
|
◦
|
NASCAR
. We have a licensing arrangement with NASCAR and we are its exclusive education provider for automotive technicians. The agreement expires on December 31, 2024 and may be terminated for cause by either party at any time prior to its expiration. This relationship provides us with access to the network of NASCAR sponsors, presenting us with the opportunity to enhance our product support relationships. In July 2002, NASCAR Technical Institute opened in Mooresville, North Carolina where students have the opportunity to take NASCAR-specific elective courses that were developed through a collaboration of NASCAR crew chiefs and motorsports industry leaders. Students also have the opportunity to learn first-hand with NASCAR engines and equipment and to acquire specific skills required for entry-level positions in automotive and racing-related career opportunities.
|
See Note 13 of the notes to our Consolidated Financial Statements within Part II, Item 8 of this Report on Form 10-K for further discussion of licensing agreements.
|
•
|
Manufacturer Training
. Manufacturer training relationships provide benefits to us that impact each of our education programs. These relationships support entry-level training tailored to the needs of a specific manufacturer, as well as continuing education and training of experienced technicians. In both the entry-level and continuing education programs, students receive training on a given manufacturer’s products. In return, the manufacturer supplies vehicles, equipment, specialty tools and parts at reduced prices or at no charge and assistance in developing curricula. Students who
|
12
receive the entry-level training may earn manufacturer certification to work on that manufacturer’s products when they complete the program. The manufacturer certification typically leads to both improved employment opportunities and the potential for higher wages. The continuing education programs for experienced technicians are paid for by the manufacturer and often take place in our facilities, allowing the manufacturer to avoid the costs associated with establishing its own dedicated facility. Manufacturer training relationships lower the capital investment necessary to equip our classrooms and provide us with a significant marketing advantage. In addition, through these relationships, manufacturers are able to increase the pool of skilled technicians available to service and repair their products.
Examples of manufacturer training relationships include:
|
◦
|
Student-paid MSAT program:
Nissan North America, Inc.
We offer the Nissan Automotive Technician Training elective program at our Houston, Texas; Long Beach, California; Mooresville, North Carolina and Orlando, Florida campuses. The Nissan Program uses training and course materials as well as training vehicles and equipment provided by Nissan North America Inc.
|
|
◦
|
Dealer technician training program paid for by the manufacturer or dealer:
American Honda Motor Company, Inc.
We provide marine and motorcycle training for experienced American Honda technicians utilizing training materials and curricula provided by American Honda. Our instructors provide marine and motorcycle dealer training at American Honda-authorized training centers across the United States. Additionally, American Honda supports our campus Hon Tech training program by donating equipment and providing curricula.
|
|
◦
|
Manufacturer-paid MSAT program:
Porsche Cars of North America, Inc
. We have a written agreement with Porsche Cars of North America, Inc. whereby we provide the Porsche Technician Apprenticeship Program at the Porsche training centers in Atlanta, Georgia, Easton, Pennsylvania and Eastvale, California using vehicles, equipment, specialty tools and curricula provided by Porsche.
The written agreement expires September 30, 2020 and may be renewed by mutual agreement.
|
|
•
|
Industry Employer Incentives
. OEM and non-OEM large national employers of our graduates compete for newly trained technicians to fill their technician shortage. In response to this, industry employers have worked with us to create more comprehensive recruitment and retention strategies which benefit our students and graduates. The strategies continue to evolve, but common techniques include tuition reimbursement programs (TRIP) for qualifying students and graduates, where employers pay back some or all of a graduate's student loan, as well as tool incentives, relocation packages, mentorship programs and part-time employment opportunities while attending school. Tuition reimbursement amounts range from $1,000 to full student loan reimbursement. This industry support lowers the cost for students to attend our programs and begin their careers as technicians while also allowing industry employers to increase the pool of skilled technicians to fill their open positions.
|
Examples of industry employer incentives include:
|
◦
|
Penske Automotive Group.
Penske Automotive Group offers tuition reimbursement, tool reimbursement and tenure bonuses.
|
|
◦
|
AutoNation.
AutoNation's Eastern Region offers tuition reimbursement and relocation assistance, or a sign-on bonus and tool allowance.
|
13
|
◦
|
Crown Lift Trucks
. Crown Lift Trucks offers tuition reimbursement.
|
|
◦
|
Ryder Systems, Inc.
Ryder Systems, Inc. offers tuition reimbursement, a quarterly incentive program and a new hire mentorship program.
|
Student Recruitment Model
Our student recruitment efforts begin with our commitment to positive outcomes, both for our students and our industry relationships. Our responsibility to present job-ready graduates to employers requires that we recruit, enroll and train prospective students who have the drive and potential to successfully pursue a career in their field of training. We use a multi-touch media approach that involves national and local outreach to generate the quality and quantity of prospective students necessary for our three primary admissions channels to enroll and start students.
Marketing and Advertising.
Our marketing strategies are designed to identify potential students who would benefit from our programs and pursue successful careers upon graduation. We leverage an integrated inquiry generation platform that focuses on generating awareness and engagement, both nationally and locally, where our website acts as the primary hub of our campaigns, to inform and educate potential students on the nature of our educational programs and the employment opportunities that could be available to them. Currently, we advertise on television, internet search, social media, display, online video and other internet-based content, radio, billboards and in magazines. We use events, sponsorships, social media, direct mail, email, texting and telephonic response to reach prospective students.
Recruitment.
Our recruiting policy is intended to maximize the efficiency of our admissions representatives by focusing on the students most likely to succeed in our programs and in their chosen field. Our admissions representatives are provided with training and tools to assist any prospective student.
|
•
|
High School Students
. Our field-based representatives recruit prospective students primarily from high schools across the country with assigned territories covering the United States and U.S. territories. Our field-based admissions representatives generate the majority of their inquiries by conducting career education workshops at high schools. Typically, the field-based admissions representatives enroll high school students during an application interview conducted at the homes of prospective students.
|
Our reputation in local, regional and national business communities, endorsements from high school instructors and guidance counselors and the recommendations of satisfied graduates and employers are some of our most effective recruiting tools. Accordingly, we strive to build relationships with the people who influence the career decisions of prospective students, such as vocational instructors and high school guidance counselors. We conduct seminars for high school career counselors and instructors at our training facilities and campuses as a means of further educating these individuals on the merits of our technical training programs. We also participate in national skills competitions as judges and offer STEM (Science, Technology, Engineering and Math) curriculum integration assistance to secondary education instructors. Our representatives focus on expanding high school relationships and increasing access to high schools beyond the traditional vocational programs and into academic classes. Our programs align with STEM principles, and we actively work to increase this awareness in high school educators and prospective students. We offer a summer program at certain campuses for high school students who are entering their junior or senior year. This program allows the student to take a specific course, or courses, in advance of enrolling in a UTI program. When the student enrolls and starts in a full-time program at one of our campuses, he or she receives credit for the courses previously completed.
14
|
•
|
Adult Students
. Our campus-based representatives recruit adult career-seeker or career-changer students. These representatives respond to student inquiries generated from national, regional and local advertising and promotional activities. Since adults tend to start our programs throughout the year instead of in the fall as is most typical of traditional school calendars or for recent high school graduates, these students help balance our enrollment throughout the year.
|
|
•
|
Military Personnel
. Our military representatives are strategically located throughout the country and focus on building relationships with military installations. Additionally, we have a centralized team of military representatives who are dedicated to serving and assisting veterans throughout the U.S. We develop relationships with military personnel and provide information about our training programs by delivering career presentations to transitioning service members who are approaching their date of separation or have recently separated from the military as a means of further educating these individuals on the merits of our technical training programs. We continue to offer introductory motorcycle mechanics classes at Fort Bliss in El Paso, Texas. These classes are designed to introduce motorcycle theory to active military personnel and expose them to the opportunity to transfer to an MMI campus to complete their program after they are discharged from the military. This continues to be part of our ongoing initiative to serve the needs of transitioning veterans and military personnel. When the student enrolls and starts in a full-time program at one of our MMI campuses, he or she receives credit for the courses previously completed.
|
Student Admissions and Retention
We currently employ field, military and campus-based admissions representatives who work directly with prospective students to facilitate the enrollment process. Enrollment applications are reviewed by a central enrollment office for accuracy and completion before students are enrolled into the program of study. Different programs have varying admissions standards.
Applicants must provide proof of one of the following: high school graduation or its equivalent; certification of high school equivalency (G.E.D. or approved State Equivalency Exam); successful completion of a degree program at the postsecondary level or successful completion of officially recognized home schooling. Certain states require official transcripts or G.E.D. test scores instead of the certificates.
To maximize the likelihood of student retention and graduation, our admissions process is intended to identify students who have the desire and ability to succeed in their chosen program. We have student services professionals and other resources that provide various student services, including orientation, tutoring, student housing assistance, and academic, financial, personal and employment advisement. We have established processes to identify students who may be in need of assistance to succeed in and complete their chosen program.
Enrollment
We enroll students throughout the year and courses start every three to six weeks. For the
year ended September 30, 2018
, our average full-time enrollment was
10,418
, representing a decrease of approximately
4.3%
as compared to
10,889
for the
year ended September 30, 2017
. At September 30, 2018, our ending full-time enrollment was
11,931
, a decrease of
1.1%
from our ending full-time enrollment of
12,059
at September 30, 2017.
Currently, our student body is geographically diverse, with approximately 50% of our students having relocated to attend our programs. Due to the seasonality of our business and normal fluctuations in student populations, we would expect volatility in our quarterly results. See "Seasonality" within Part II, Item 7 of this Report on Form 10-K for further discussion of seasonal fluctuations in revenues and operating results.
15
Graduate Employment
As described in “Business - Schools and Programs” included elsewhere in this Report on Form 10-K, our programs prepare graduates for careers in industries using the training we provide, primarily as automotive, diesel, collision repair, motorcycle, marine and CNC machining technicians and as welders. Identifying employment opportunities and preparing our graduates for these careers is critical to our ability to help our graduates benefit from their education. Accordingly, we dedicate significant resources to maintaining an effective employment team. Our campus-based staff facilitates several career development processes, including instruction and coaching for interview skills, interview etiquette and professionalism. Additionally, the employment team provides students with reference materials and assistance with the composition of resumes. Finally, we place emphasis on and devote significant time to assisting students with part-time and graduate job searches.
We also have a centralized department whose focus is to build and maintain relationships with potential and existing national employers and develop graduate job opportunities and, where possible, relocation assistance, sign-on bonuses, tool packages and tuition reimbursement plans with our OEMs and other industry employers. Together, the campuses and centralized department coordinate and host career fairs, industry awareness presentations, interview days and employer visits to our campus locations. We believe that our graduate employment services provide our students with a compelling value proposition and enhance the employment opportunities for our graduates.
Our employment rate for
2017
and
2016
graduates who were employed within one year of graduation was
84
%
and
86%
, respectively. The employment calculation is based on all graduates, including those that completed MSAT programs, from October 1, 2016 to September 30, 2017 and October 1, 2015 to September 30, 2016, respectively, excluding graduates not available for employment because of continuing education, military service, medical reasons, incarceration, death or international student status. We count a graduate as employed based on a verified understanding of the graduate’s job duties to assess and confirm that the graduate’s primary job responsibilities are in his or her field of study. We verify employment by sending written verification requests to the graduate and/or the employer. The verifications must include employer name, job duties, job title, hire date and employer contact. Once we receive written verification from either source, the graduate is classified as employed in field as long as all verification requirements are met. In instances where we are unable to obtain written verification, we also classify graduates as employed in field if we are able to obtain verbal verification, collecting the same information as noted above, from both the graduate and the employer. We periodically review a sample of employment verifications to ensure accuracy.
For
2017
, we had
8,539
total graduates, of which
8,086
were available for employment. Of those graduates available for employment,
6,818
were employed within one year of their graduation date, for a total of 84
%
. For
2016
, we had
9,150
total graduates, of which
8,621
were available for employment. Of those graduates available for employment,
7,387
were employed within one year of their graduation date, for a total of
86%
. For discussion of current year graduate employment results, see “Management's Discussion and Analysis - Graduate Employment” included elsewhere in this Report on Form 10-K.
Faculty and Employees
Faculty members are hired nationally in accordance with established criteria, applicable accreditation standards and applicable state regulations. Members of our faculty are primarily industry professionals and are hired based on their prior work and educational experience. We require a specific level of industry experience in order to enhance the quality of the programs we offer and to address current and industry-specific issues in the course content. We provide intensive instructional training and continuing education to our faculty members to maintain the quality of instruction in all fields of study. A majority of our existing instructors have a minimum of five
years' experience in the industry and an average of eight years of experience teaching at UTI, ranging from less than 1 year to 34 years. Our average student-to-teacher ratio is approximately 19-to-1.
16
Each school’s support team typically includes a campus president, an education director, a financial aid director, a student services director, an employment services director, a controller and a facilities director. As of
September 30, 2018
, we had approximately 1,800 full-time employees, including approximately 520 student support employees and approximately 650 full-time instructors.
Our employees are not represented by labor unions and are not subject to collective bargaining agreements. We have encountered in the past, and may encounter in the future, employees who desire to seek union representation at new or existing campuses. We have never experienced a work stoppage and we believe that we have good relationships with our employees.
Competition
The for-profit, postsecondary education industry is highly competitive and highly fragmented, with no one provider controlling significant market share. We compete with other institutions that are eligible to receive Title IV funding, including not-for-profit public and private schools, community colleges and all for-profit institutions which offer automotive, diesel, collision repair, motorcycle, marine, welding, CNC machining and closely related skilled trades training programs. Our competition differs in each market depending on the curriculum that we offer and the availability of other choices, including job prospects. We face a number of competitive factors, including the employment market, community colleges, other career-oriented and technical schools, and the military.
Prospective students may choose to forego additional education and enter the workforce directly, especially during periods when the unemployment rate declines or remains stable as it has in recent years. This may include employment with our industry partners or with other manufacturers and employers of our graduates. We compete with local community colleges for students seeking programs that are similar to ours, mainly due to local accessibility, low tuition rates and in certain cases free tuition. Public institutions are generally able to charge lower tuition than our schools, due in part to government subsidies and other financial sources not available to for-profit schools. There is no single community college that is a significant competitor; rather, the sector as a whole provides competition. Within the for-profit career-oriented and technical school sector, some of our national and regional competitors are Lincoln Technical Institute, Tulsa Welding School and University of Northwestern Ohio. We consider other single location institutions with a larger local presence near one of our campuses as competitors as well. Competition is generally based on location, tuition rates, the type of programs offered, the quality of instruction and instructional facilities, graduate employment rates, reputation and recruiting. Additionally, the military often recruits or retains potential students when branches of the military offer enlistment or re-enlistment bonuses. The 2017 National Defense Authorization Act increased enlistment targets for the Army, Guard and the Reserve.
According to provisional data available through the National Center for Education Statistics (NCES), for the twelve months ended June 30, 2017, we had 8,781 graduates; Lincoln Technical Institute had 2,966 graduates and University of Northwestern Ohio had 1,193 graduates in transportation technician training programs similar to ours. This data also shows that no individual community college had a number of graduates commensurate with ours in similar programs. Further, we partner with over 30 OEMs to provide manufacturer specific advanced training. We believe that we have the largest number of OEM branded training programs. These OEMs provide vehicles, equipment, specialty tools and curricula that lead to increased training and employment opportunities for our students, including the potential for brand specific certifications. For additional information regarding the benefits of the relationships with OEMs, see “Business - Business Model” and “Business - Business Strategy” included elsewhere in this report on Form 10-K. We believe that our industry relationships, brand recognition and national presence provide significant benefits to our students, our graduates and their employers while differentiating us from other technical training schools.
17
Environmental Matters
We use hazardous materials at our training facilities and campuses and generate small quantities of regulated waste, including, but not limited to, used oil, antifreeze, transmission fluid, paint, solvents and car batteries. As a result, our facilities and operations are subject to a variety of environmental laws and regulations governing, among other things, the use, storage and disposal of solid and hazardous substances and waste, and the clean-up of contamination at our facilities or off-site locations to which we send or have sent waste for disposal. Certain of our campuses are required to obtain permits for our air emissions. In the event we do not maintain compliance with any of these laws and regulations, or if we are responsible for a spill or release of hazardous materials, we could incur significant costs for clean-up, damages, and fines or penalties.
Available Information
Our Annual Report on Form 10-K, Quarterly Reports on Form 10-Q, Current Reports on Form 8-K and amendments to those reports filed or furnished pursuant to Section 13(a) or 15(d) of the Exchange Act are available on our website at
www.uti.edu
under the “Investors - Financial Information - SEC Filings” captions, as soon as reasonably practicable after we electronically file such material with, or furnish it to, the SEC. Reports of our executive officers, directors and any other persons required to file securities ownership reports under Section 16(a) of the Exchange Act are also available through our website. Information contained on our website is not a part of this Report and is not incorporated herein by reference.
In Part III of this Report on Form 10-K, we “incorporate by reference” certain information from parts of other documents filed with the SEC, specifically our proxy statement for the 2019 Annual Meeting of Stockholders. The SEC allows us to disclose important information by referring to it in that manner. Please refer to such information. We anticipate that on or about January 14, 2019, our proxy statement for the 2019 Annual Meeting of Stockholders will be filed with the SEC and available on our website at
www.uti.edu
under the “Investors - Financial Information - SEC Filings” captions.
Information relating to our corporate governance, including our Code of Conduct for all of our employees and our Supplemental Code of Ethics for our Chief Executive Officer and senior financial officers, and information concerning Board Committees, including Committee charters, is available on our website at
www.uti.edu
under the “Investors - Corporate Governance” captions. We will provide copies of any of the foregoing information without charge upon written request to Universal Technical Institute, Inc., 16220 North Scottsdale Road, Suite 500, Scottsdale, Arizona 85254, Attention: Investor Relations.
The SEC maintains an Internet site at www.sec.gov that contains reports, proxy and information statements, and other information statements regarding issuers that file electronically with the SEC.
Regulatory Environment
Our institutions participate in a variety of government-sponsored financial aid programs that assist students in paying their cost of education. The largest source of such support is the federal programs of student financial assistance under Title IV of the HEA. This support, commonly referred to as Title IV Programs, is administered by ED. In
2018
, we derived approximately 71%
of our revenues, on a cash basis as defined by ED, from Title IV Programs, as calculated under the 90/10 rule.
To participate in Title IV Programs, an institution must be authorized to offer its programs of instruction by relevant state education agencies, be accredited by an accrediting commission recognized by ED and be certified as an eligible institution by ED. To participate in veterans' benefits programs, including the Post-9/11 GI Bill, the Montgomery GI Bill, the Reserve Education Assistance Program (REAP) and VA Vocational Rehabilitation, an institution must comply with certain requirements established by the VA. Additionally, certain states and their attorneys general require additional authorization to operate our institutions or for our students to receive state
18
funding. Furthermore, we are subject to oversight by other federal agencies including the Consumer Financial Protection Bureau (CFPB), the SEC, the Federal Trade Commission, the Internal Revenue Service and the Departments of Veterans Affairs, Defense, Treasury, Labor and Justice. For these reasons, our institutions are subject to extensive regulatory requirements imposed by all of these entities.
State Authorization and Regulation
Each of our institutions must be authorized by the applicable state education agency where the institution is located to operate and offer a postsecondary education program to its students. Our institutions are subject to extensive, ongoing regulation by each of these states. Additionally, our institutions are required to be authorized by the applicable state education agencies of certain other states in which our institutions recruit students. Currently, each of our institutions is authorized by the applicable state education agency or agencies.
The level of regulatory oversight varies substantially from state to state and is extensive in some states. State laws typically establish standards for instruction, qualifications of faculty, location and nature of facilities and equipment, administrative procedures, marketing, recruiting, student outcomes reporting, disclosure obligations to students, limitations on mandatory arbitration clauses in enrollment agreements, financial operations and other operational matters. State laws and regulations may limit our ability to offer educational programs and to award certificates, diplomas or degrees. Some states prescribe standards of financial responsibility that are not consistent with those required by ED and some mandate that institutions post surety bonds. Currently, we have posted surety bonds on behalf of our institutions and admissions representatives with multiple states of approximately $19.5 million. We believe that each of our institutions is in substantial compliance with state education agency requirements.
States often change their requirements in response to ED regulations or to implement requirements that may impact institutional and student success, and our institutions must respond quickly to remain in compliance. Also, from time to time, states may transition authority between state agencies and we must comply with the new state agency’s rules, procedures and other documentation requirements. Changes in state requirements have resulted in changes to our recruiting and other operations in those states and have increased our costs of doing business. If any one of our campuses were to lose its authorization from the education agency of the state in which the campus is located, that campus would be unable to offer its programs and we could be forced to close that campus. If one of our campuses were to lose its authorization from a state other than the state in which the campus is located, that campus would not be able to recruit students in that state.
Accreditation
Accreditation is a non-governmental process through which an institution voluntarily submits to ongoing qualitative reviews by an organization of peer institutions. Accrediting commissions examine the academic quality of the institution’s instructional programs, and a grant of accreditation is generally viewed as confirmation that the institution’s programs meet generally accepted academic standards and practices. Accrediting commissions also review the administrative and financial operations of the institutions they accredit to ensure that each institution has the resources necessary to perform its educational mission, implement continuous improvement processes and support student success.
19
Accreditation by an ED-recognized commission is required for an institution to be certified to participate in Title IV Programs. In order to be recognized by ED, an accrediting agency must adopt specific standards for its review of educational institutions and must undergo a periodic process for renewal of its ED recognition. The renewal process begins with a review and analysis by ED staff of written application materials submitted by the accrediting agency. The application materials and ED’s staff analysis are then submitted to the National Advisory Committee on Institutional Quality and Integrity (NACIQI) for consideration.
All of our institutions are accredited by the Accrediting Commission of Career Schools and Colleges (ACCSC), a national accrediting agency recognized by ED. In August 2016, NACIQI recommended that ED renew its recognition of ACCSC for a period of five years; in October 2016, ED accepted this recommendation and renewed ACCSC's recognition for a period of five years.
We believe that each of our institutions is in substantial compliance with ACCSC accreditation standards. If any one of our institutions lost its accreditation, students attending that institution would no longer be eligible to receive Title IV Program funding, we could lose our state authorization in states that require accreditation and we could be forced to close that institution. Our campuses' grants of accreditation expire as detailed below; a school that is faithfully engaged in the renewal of accreditation process and is meeting all of the requirements of that process continues to be accredited if the school's term of accreditation has exceeded the period of time last granted by ACCSC.
|
Campus
|
||
|
Mooresville, North Carolina; NASCAR Technical Institute (NASCAR Tech)
|
December 2018
|
|
|
Avondale, Arizona
|
February 2019
|
|
|
Orlando, Florida
|
February 2019
|
|
|
Houston, Texas
|
February 2019
|
|
|
Lisle, Illinois
|
February 2019
|
|
|
Rancho Cucamonga, California
|
February 2019
|
|
|
Phoenix, Arizona; Motorcycle Mechanics Institute (MMI)
|
May 2019
|
|
|
Bloomfield, New Jersey
|
May 2020
|
|
|
Long Beach, California
|
September 2022
|
|
|
Exton, Pennsylvania
|
October 2022
|
|
|
Dallas/Ft. Worth, Texas
|
March 2023
|
|
|
Norwood, Massachusetts*
|
July 2023
|
|
|
Sacramento, California*
|
December 2023
|
|
* Schools that achieve School of Excellence status after July 1, 2015 are awarded a six-year term of accreditation.
The procedures of our accrediting agency for the renewal of accreditation of a campus require a team of professionals to conduct an on-site visit at the campus and issue a Team Summary Report, which includes an assessment of the school’s compliance with accrediting standards. In October 2018, we received a Team Summary Report from the ACCSC from its visit to our Mooresville, North Carolina campus and there were no findings.
In July 2018, our Sacramento, California and Norwood, Massachusetts campuses received the “School of Excellence” designation by ACCSC. The School of Excellence Award recognizes ACCSC-accredited institutions for their commitment to the expectations and rigors of ACCSC accreditation, as well as the efforts made by the institution in maintaining high levels of achievement among their students. In order to be eligible for the School of Excellence Award, an ACCSC-accredited institution must meet the conditions of renewing
20
accreditation without any finding of non-compliance, satisfy all requirements necessary to be in good standing with ACCSC and demonstrate that the majority of the schools’ student graduation and graduate employment rates for all programs offered meet or exceed the average rates of graduation and employment among all ACCSC-accredited institutions. Institutions are only eligible for the School of Excellence designation in the year in which they complete a renewal of accreditation. Our Avondale, Arizona; Phoenix, Arizona; Rancho Cucamonga, California; Lisle, Illinois; Mooresville, North Carolina; Exton, Pennsylvania; Dallas/Ft. Worth Texas and Houston, Texas campuses have previously received School of Excellence designation in the year in which they were eligible.
We received an initial two-year grant of accreditation from ACCSC for our Bloomfield, New Jersey campus on May 8, 2018. The campus will be eligible for a five-year grant of accreditation in May 2020.
In December 2017, we also received formal notification from ACCSC granting continuing accreditation with a stipulation for our Long Beach, California campus. As required by the stipulation, we submitted our response, which included a new leave of absence policy reflecting feedback received from ACCSC on January 22, 2018. On February 23, 2018, we received formal notification from ACCSC that we had satisfied the requirements of the stipulation.
In March 2017, ACCSC conducted an unannounced site visit at our Houston, Texas campus. One program in the automotive division did not achieve the graduation benchmark set by ACCSC and the campus was placed on heightened monitoring status in June 2017, which involved a detailed review of the school's Annual Report submission. In September 2018, the campus was removed from heightened monitoring status.
Our 2018 annual report has been completed and submitted to ACCSC. Two of our approximately 115 approved programs did not meet the employment rate requirements. Both of the programs that were below the benchmark requirements did not meet the requirements as a result of a small number of students in the program. Both programs below benchmark will be discontinued. Consistent with our goal of providing our students with an excellent return on their investment, we are eliminating longer programs that have minimal enrollment and higher cost to students. In June 2017, we implemented enhanced internal reporting to provide earlier visibility to cohort outcomes, which has allowed us to respond more effectively to early indications of risk.
Nature of Federal and State Support for Postsecondary Education
The federal government provides a substantial part of its support for postsecondary education through Title IV Programs in the form of grants and loans to students who can use those funds at any institution that has been certified as eligible to participate by ED. Most aid under Title IV Programs is awarded on the basis of financial need, generally defined as the difference between the cost of attending the institution and the amount a student can reasonably contribute to that cost. All recipients of Title IV Program funds must maintain a satisfactory grade point average and make academic progress, as defined by ED, towards the completion of their program of study as well as meet other eligibility requirements. In addition, each institution must ensure that Title IV Program funds are properly accounted for and disbursed in the correct amounts to eligible students, as well as provide a variety of disclosures and reports on recipient data and program expenditures.
During 2018, based on their individual eligibility under the following Title IV Programs, our students received grants and loans from the William D. Ford Federal Direct Loan (DL) program, the Federal Pell Grant (Pell) program and the Federal Supplemental Educational Opportunity Grant (FSEOG) program. The Federal Perkins Loan (Perkins) program, in which we had previously participated, officially ended as of September 30, 2017. Therefore, no new Perkins loans were made to our students during 2018.
21
Federal Title IV Programs
DL.
Under the DL program, ED makes loans to students or their parents. Borrowers repay these loans to ED according to the terms and conditions of the program. Students with financial need continue to qualify for interest subsidies on subsidized loans while in school up through 150% of the published length of the student's program. Students with subsidized loans also qualify for interest subsidies while in the 6-month grace period and during periods of deferment. Non-need-based unsubsidized loans are also available to eligible students or their parents. Students and parents with unsubsidized loans do not qualify for interest subsidies. In
2018
, we derived approximately 55% of our revenues, on a cash basis, from the DL program.
Pell
. Under the Pell program, ED makes grants to students who demonstrate financial need based on the federal Free Application for Federal Student Aid. In
2018
, we derived approximately 19% of our revenues, on a cash basis, from the Pell program.
FSEOG
. FSEOG grants are designed to supplement Pell grants for students with the greatest financial need. Institutions must provide matching funding equal to 25% of all awards made under this program. In
2018
, we derived less than 1% of our revenues, on a cash basis, from the FSEOG program.
Perkins
. The Federal Perkins Loan Program had previously been subject to a September 30, 2015 end date. On December 18, 2015, President Obama signed the Federal Perkins Loan Program Extension Act of 2015 into law, which allowed an extension of the program to make loans to undergraduate borrowers until September 30, 2017, after which point new Perkins loans were prohibited. No new Perkins loans were made to students during 2018.
Other Federal and State Programs
Some of our students receive financial aid from federal sources other than Title IV Programs, such as the programs administered by the VA, the Department of Defense (DOD) and under the Workforce Investment Act. Additionally, some states provide financial aid to our students in the form of grants, loans or scholarships. The eligibility requirements for federal and state financial aid vary by funding agency and program.
Since June 2012, institutions participating in the Cal Grant program funded by the state of California are required to achieve a three-year cohort default rate of less than 15.5% and a graduation rate above 30% to remain eligible for the Cal Grant program. Our Rancho Cucamonga and Long Beach, California campuses are currently eligible to participate in the Cal Grant program. In 2018, the rate for our Universal Technical Institute of Phoenix institution met the 15.5% eligibility requirement, which enables us to apply for participation in the Cal Grant program at our Sacramento campus with the 2018-2019 award year.
Veterans' Benefits
. Since October 1, 2011, the Post-9/11 GI Bill has been effective for both degree and non-degree granting institutions of higher learning, allowing eligible veterans to use their Post-9/11 GI Bill benefits. Additionally, veterans use benefits such as the Montgomery GI Bill, the REAP and VA Vocational Rehabilitation at our campuses. We derived approximately 17% of our revenues, on a cash basis, from veterans' benefits programs in 2018. To participate in veterans' benefits programs, including the Post-9/11 GI Bill, the Montgomery GI Bill, the REAP, and VA Vocational Rehabilitation, an institution must comply with certain requirements established by the VA. These criteria require, among other things, that the institution:
|
•
|
report on the enrollment status of eligible students;
|
|
•
|
maintain student records and make such records available for inspection;
|
|
•
|
follow current VA rules; and
|
22
|
•
|
comply with applicable limits on the percentage of students receiving certain veterans' benefits on a program and campus basis.
|
If we fail to comply with these requirements, we could lose our eligibility to participate in veterans' benefits programs.
The VA imposes limitations on the percentage of students per program receiving benefits under certain veterans’ benefits programs, unless the program qualifies for certain exemptions. If the VA determines that a program is out of compliance with these limitations, the VA will continue to provide benefits to current students, but new students will not be eligible to use their veterans' benefits for an affected program until we demonstrate compliance. Additionally, the VA requires a campus be in operation for two years before it can apply to participate in VA benefit programs. With the exception of our newest Bloomfield, New Jersey campus, which opened in August 2018, all of our campuses are eligible to participate in VA education benefit programs.
The VA shares responsibility for VA benefit approval and oversight with designated State Approving Agencies (SAAs). SAAs play a critical role in evaluating institutions and their programs to determine if they meet VA benefit eligibility requirements. Processes and approval criteria as well as interpretation of applicable requirements can vary from state to state. Therefore, approval in one state does not necessarily result in approval in all states. If we are unable to secure approvals in one or more states, or if the process for obtaining an approval takes significant time, we could be required to alter the delivery methodology or structure of the program or experience delays in or the loss of a portion of VA funding. Students receiving VA funding may not have the same flexibility in scheduling their coursework.
During 2012, President Obama signed an Executive Order directing the DOD, Veterans Affairs and Education to establish “Principles of Excellence” (Principles), based on certain guidelines set forth in the Executive Order, to apply to educational institutions receiving federal funding for service members, veterans and family members. As requested, we provided written confirmation of our intent to comply with the Principles to the VA in June 2012. We are required to comply with the Principles to continue recruitment activities on military installations. Additionally, there is a requirement to possess a memorandum of understanding (MOU) with the U.S. DOD as well as with certain individual installations. Our access to bases for student recruitment has become more limited due to recent changes in the Transition Assistance Program (Transition Goals, Plans, Success) and increased enforcement of the MOU requirement. Each of our institutions has an MOU with the U.S. DOD. We have MOUs with certain key individual installations and are pursuing MOUs at additional locations; however, some installations will not provide MOUs to institutions that do not teach at the installation. We continue to strengthen and develop relationships with our existing contacts and with new contacts in order to maintain and rebuild our access to military installations.
Regulation of Federal Student Financial Aid Programs
To participate in Title IV Programs, an institution must be authorized to offer its programs by the relevant state education agencies, be accredited by an accrediting commission recognized by ED and be certified as eligible by ED. ED will certify an institution to participate in Title IV Programs only after the institution has demonstrated compliance with the HEA and ED’s extensive regulations regarding institutional eligibility. An institution must also demonstrate its compliance to ED on an ongoing basis. All of our institutions are certified to participate in Title IV Programs.
23
ED’s Title IV program standards are applied primarily on an institutional basis, with an institution defined by ED as a main campus and its additional locations, if any. Each institution is assigned a unique Office of Post-Secondary Education Identification Number (OPEID). Under this definition for ED purposes we have the following three institutions:
|
Institution
|
|
|
Universal Technical Institute of Arizona
|
|
|
Main campus
|
|
|
Universal Technical Institute, Avondale, Arizona
|
|
|
Additional campuses
|
|
|
Universal Technical Institute, Lisle, Illinois
|
|
|
Universal Technical Institute, Long Beach, California
|
|
|
Universal Technical Institute, Rancho Cucamonga, California
|
|
|
NASCAR Technical Institute, Mooresville, North Carolina
|
|
|
Universal Technical Institute, Norwood, Massachusetts
|
|
|
Institution
|
|
|
Universal Technical Institute of Phoenix
|
|
|
Main campus
|
|
|
Universal Technical Institute DBA Motorcycle Mechanics Institute,
Motorcycle & Marine Mechanics Institute, Phoenix, Arizona |
|
|
Additional campuses
|
|
|
Universal Technical Institute, Sacramento, California
|
|
|
Universal Technical Institute, Orlando, Florida
|
|
|
Divisions
|
|
|
Motorcycle Mechanics Institute, Orlando, Florida
|
|
|
Marine Mechanics Institute, Orlando, Florida
|
|
|
Automotive, Orlando, Florida
|
|
24
|
Institution
|
|
|
Universal Technical Institute of Texas
|
|
|
Main campus
|
|
|
Universal Technical Institute, Houston, Texas
|
|
|
Additional campuses
|
|
|
Universal Technical Institute, Exton, Pennsylvania
|
|
|
Universal Technical Institute, Dallas/Ft. Worth, Texas
|
|
|
Universal Technical Institute, Bloomfield, New Jersey
|
|
The substantial amount of federal funds disbursed through Title IV Programs, the large number of students and institutions participating in those programs and instances of fraud and abuse have prompted ED to exercise significant regulatory oversight over institutions participating in Title IV Programs. Accrediting commissions and state agencies also oversee compliance with both their respective standards and certain Title IV Program requirements. As a result, each of our institutions is subject to detailed oversight and review and must comply with a complex framework of laws and regulations. Because ED periodically revises its regulations and changes its interpretation of existing laws and regulations, we cannot predict with certainty how the Title IV Program requirements will be applied in all circumstances.
Significant factors relating to Title IV Programs that could adversely affect us include the following:
Congressional Action
. Political and budgetary concerns significantly affect Title IV Programs. Congress has historically reauthorized the HEA approximately every five to six years. The HEA was reauthorized, amended and signed into law most recently on August 14, 2008. Although there have been introductions of House bills related to reauthorization, such as the Promoting Real Opportunity, Success and Prosperity Through Education Reform (PROSPER) Act (H.R. 4508), which passed out of the House Committee on Education and the Workforce on December 12, 2017, and opposing bill Aim Higher Act (H.R. 6543) introduced by House Democrats on July 24, 2018, there is no indication that these bills will gain traction absent Senate companion bills during 2018. On May 31, 2018, Sen. Lamar Alexander (R-TN), chairman of the Senate Health, Education, Labor, and Pensions (HELP) Committee, indicated his committee will not produce higher education legislation during 2018. Congress reviews and determines federal appropriations for Title IV Programs at least annually.
The Dodd-Frank Wall Street Reform and Consumer Protection Act of 2010 established the CFPB, which became active during 2012. The CFPB is tasked with overseeing large banks and certain other types of nonbank financial companies, including alternative loan providers, for compliance with federal consumer financial protection laws. It is possible that our proprietary loan program will be subject to such review.
Accreditation & Academic Definitions.
On October 15, 2018, ED published a notice in the Federal Register announcing its intent to establish a negotiated rulemaking committee and three subcommittees to develop proposed regulations related to several matters, including, but not limited to, requirements for accrediting agencies in their oversight of member institutions and programs; criteria used by ED to recognize accrediting agencies; simplification of ED’s recognition and review of accrediting agencies; clarification of the core oversight responsibilities amongst accrediting agencies, states and ED; clarification of the permissible arrangements between an institution of higher education and another organization to provide a portion of an educational program; roles and responsibilities of institutions and accrediting agencies in the teach-out process; regulatory changes required to ensure equitable treatment of brick-and-mortar and distance education programs; regulatory changes required to enable expansion of direct assessment programs, distance education, and competency-based education; regulatory changes required to clarify disclosure and other requirements of state authorization; emphasizing the
25
importance of institutional mission in evaluating its policies, programs and outcomes; simplification of state authorization requirements related to distance education; defining “regular and substantive interaction” as it relates to distance education and correspondence courses; defining the term “credit hour;” defining the requirements related to the length of educational programs and entry level requirements for the occupation; and other matters. The committee and subcommittees are scheduled to meet during the first three months of 2019. At this time, we cannot provide any assurances as to the timing, content or impact of any final regulations arising from this planned negotiated rulemaking process.
Incentive Compensation.
In 2010, ED issued revised regulations pertaining to incentive compensation, which became effective July 1, 2011. Those regulations provide that an institution participating in Title IV Programs may not provide any commission, bonus or other incentive payment based in any part, directly or indirectly, on success in securing enrollments or the award of financial aid to any person or entity engaged in any student recruiting or admission activities or in making decisions regarding the awarding of Title IV Program funds. When it issued the regulations, ED also stated that it does not intend to provide private guidance to individual institutions on their specific compensation practices, but that it may issue additional broadly applicable guidance to all institutions from time to time.
ED published guidance in November 2015 that eliminated certain restrictions on incentive compensation for admissions representatives. Specifically, ED reconsidered its previous interpretation and stated that its regulations do not prohibit compensation for admissions representatives that is based upon students’ graduation from, or completion of, educational programs. Compensation based on enrolling students continues to be prohibited. ED also stated that in assessing the legality of a compensation structure, ED will evaluate whether compensation labeled as graduation-based or completion-based compensation is in substance enrollment-based compensation. We have made adjustments to the compensation practices for our admissions representatives which we believe comply with ED's November 2015 guidance. The transition period for the new compensation structure will continue through calendar year 2018. We will continue to evaluate other compensation options under these regulations and guidance.
Because the current regulations differ significantly from prior regulations, and because of the imprecise nature of many aspects of these regulations and ED's published guidance, it is not clear how ED will apply these regulations in all circumstances. Although we cannot guarantee that ED will not take a position that some aspect of our compensation practices is not in compliance with these regulations, we believe that our compensation plans are in substantial compliance with the regulations.
ED's revisions to the regulations continue to adversely affect our ability to compensate our employees and our compensation practices for third parties.
Gainful Employment.
The HEA generally requires for-profit institutions to provide programs of training that prepare students for gainful employment in a recognized occupation in order for the students enrolled in those programs to qualify for Title IV Program assistance.
On October 31, 2014, ED published final gainful employment regulations which established additional Title IV Program eligibility requirements on certain educational programs required to lead to gainful employment.
Most parts of the new rule were effective on July 1, 2015, with the exception of new disclosure requirements that were intended to replace prior disclosure requirements and were originally scheduled to take effect on a later date as discussed below.
On June 16, 2017, ED announced its intent to convene a negotiated rulemaking committee to develop proposed regulations to revise the gainful employment regulations. ED convened meetings from December 2017 through March 2018, but negotiators failed to reach consensus on all key elements of the proposal. ED published a proposed rule on August 14, 2018, on which it accepted public comment through September 13, 2018. The proposed rule would eliminate the existing Gainful Employment regulations. ED stated in the notice of proposed rulemaking that it plans instead, among other things, to publish program-level outcomes data using the existing government website called the College Scorecard, or on a new federal website. ED has indicated the proposed
26
regulations will not be published in final form by November 1, 2018, as would typically be required for them to take effect on July 1, 2019. Regulations published after November 1, 2018 and prior to November 1, 2019 typically would take effect on July 1, 2020. We cannot provide any assurances as to the timing and content of any such final regulations.
Certification
The rule requires an institution's most senior executive officer to certify, as a condition of continued Title IV Program eligibility, that each of the institution’s eligible gainful employment programs satisfies certain new ED certification requirements that focus primarily on the approval of the program by relevant regulatory or governing bodies such as institutional accreditors and, if applicable, programmatic accreditors and state licensing agencies.
Disclosure
The rule identifies up to 16 different items, as determined by ED, that institutions must disclose to prospective students and the public about each of their programs, using a disclosure template provided by ED, while providing ED the right to expand the list as it deems necessary. ED issued a disclosure template in January 2018 for institutions to provide required disclosures and required institutions to update their disclosures using the template by April 6, 2018. The template requires institutions to provide various data for each of its programs, including, among other things, program cost, length, on-time graduation rates, placement rates, typical student debt and monthly payment, and typical fields of employment. Until July 1, 2017, institutions were required to continue to comply with the existing disclosure requirements previously described. In June 2017, ED announced that institutions would be required to provide a completed disclosure template, or a link thereto, on their gainful employment program web pages by July 1, 2017, but would not be required until July 1, 2018 to include the disclosure template, or a link thereto, in the gainful employment program promotional materials and to directly distribute the disclosure template to prospective students prior to enrollment. On June 18, 2018, ED published a notice in the Federal Register further delaying the requirement to distribute the disclosure template directly to students and to include the GE disclosure on all promotional materials until July 1, 2019. Institutions continue to be required to provide the completed GE disclosure template on their gainful employment web pages. On November 8, 2018, ED published proposed revisions to the GE disclosure template and requested public comments to the revisions by or before January 7, 2019.
Reporting
The rule requires institutions to annually report to ED information required to calculate the DE rates and certain potential disclosure items, including information about the institution's gainful employment programs, the enrollment status of students in those programs and the debt incurred by those students.
Warnings
The rule requires institutions to provide student warnings with respect to any program that ED identifies as in jeopardy of losing Title IV eligibility when the next set of DE rates becomes final. If required, these warnings must be provided to all active and prospective students and the institution must maintain records that document its efforts to distribute the warning. Warnings must include a number of elements including a statement that the program has not met ED’s gainful employment standards and Title IV eligibility may be terminated, options available to the student should Title IV eligibility be lost and guidance on the institution’s plans to continue the program, offer refunds, or transfer credit should Title IV eligibility be lost. Based on our final DE rates for the 2015 debt measurement year, none of our programs are currently required to provide these separate warnings.
Defense to Repayment Regulations.
The current regulations on borrower defense to repayment were published on November 1, 2016, with an effective date of July 1, 2017. On October 24, 2017, ED published an interim regulation that delayed until July 1, 2018 the effective date of the majority of the regulations. On February 14, 2018, a final rule was published in the Federal Register delaying until July 1, 2019 the effective date of the
27
regulations. On September 12, 2018, a U.S. District Court judge issued an opinion concluding among other things that the delay in the effective date was unlawful. On October 16, 2018, the judge issued an order declining to extend a stay preventing the regulations from taking effect. Consequently, the November 1, 2016 regulations are now in effect. We cannot provide any assurance as to whether or when ED will issue guidance regarding the implementation of the current regulations or whether ongoing litigation challenging the regulations could result in a future stay or invalidation of some or all of the regulations.
The Department held negotiated rulemaking sessions beginning on November 13 to 15, 2017 and ending on February 15, 2018 with the objective of modifying the defense to repayment regulations. However, no consensus was reached on proposed regulations. ED subsequently published a notice of proposed rulemaking on July 31, 2018 that included proposed regulations for public comment. ED announced that it will not meet the November 1, 2018 deadline to publish final regulations. If the Department publishes final regulations after November 1, 2018 and prior to November 1, 2019, the rules typically would not go into effect until July 1, 2020 unless the Department is able to provide for early implementation. The proposed regulations would, among other things, modify the current procedures and standards for borrowers to assert through an ED-administered process a defense to the borrowers’ obligation to repay certain Title IV loans based on certain acts or omissions by the institution or a covered party; maintain, but shorten, the list of events that could result in ED deeming the institution to fail ED’s financial responsibility standards and requiring a letter of credit or other form of acceptable financial protection and the acceptance of other conditions or requirements; require the institution to notify ED of an extensive list of financial events, including, but not limited to, liabilities incurred from a final judgment in a judicial or administrative determination; address the treatment of operational leases and long-term debt in the calculation of an institution’s composite score under ED’s financial responsibility standards; amend certain regulations related to the discharge of student loans based on the school’s closure or a false claim of high school completion under certain circumstances; and generally permit the use of arbitration clauses and class action waivers while requiring certain disclosures to students. We cannot provide any assurances as to the timing, content or ultimate effective date of any such regulations.
Borrower Defense and Other Discharges
The current regulations establish amended procedures and standards for borrowers, either individually or as a group, to assert through an ED-administered process a defense to the borrowers’ obligation to repay certain Title IV loans first disbursed prior to July 1, 2017 based on certain acts or omissions of the institution that relate to the making of the loan for enrollment at the school or the provision of educational services for which the loan was provided that would give rise to a cause of action against the school.
The regulations also expand the types of defenses available for borrowers, either individually or as a group, to assert through a new ED-administered process for loans first disbursed on or after July 1, 2017 based on certain acts or omissions that relate to the making of a Direct Loan for enrollment at the school or the provision of educational services for which the loan was provided and which fall into one of the following categories:
|
•
|
The borrower, whether as an individual or as a member of a class, or a governmental agency, has obtained against the school a nondefault, favorable contested judgment based on state or federal law in a court of administrative tribunal.
|
|
•
|
The institution failed to perform its obligations under the terms of a contract with the student.
|
|
•
|
The school or any of its representatives or any institution, organization, or person with whom the school has an agreement to provide educational programs, or to provide marketing, advertising, recruiting or admissions services, made a substantial misrepresentation (as defined by ED regulations) that the borrower reasonably relied on to the borrower’s detriment when the borrower decided to attend, or to continue attending, the school or decided to take out a Direct Loan. The rules also expand the existing regulatory definition of a misrepresentation.
|
28
The regulations establish separate procedures for claims initiated for individual borrowers and claims initiated for groups of borrowers as well as separate procedures in the event that the institution is open or closed. The rules establish varying, borrower-favorable statutes of limitations for the initiation of claims and, in some cases, impose an unlimited statute of limitations. The procedures provide for evaluation of the claims either by an ED official or hearing official and provide for school participation in the process. The procedures in some cases enable ED to consolidate borrower claims with common facts and to present the borrowers’ claims during the process.
If the ED official or hearing official approves the borrower’s defense to repayment through the applicable administrative process established in the proposed regulations, ED may discharge the borrower’s obligation to repay some or all of the borrower’s student loans, may return to the borrower amounts already paid by the borrower toward the discharged portion of the loan, and may initiate a separate proceeding to collect the discharged and returned amounts from the institution.
Financial Protection Requirements
The current regulations revise the financial responsibility regulations to expand the list of actions or events that would require an institution to provide ED with a letter of credit or other form of acceptable financial protection and potentially be subject to other conditions and requirements. The specified list of events is extensive and includes events that ED contends might result in actual or potential debts, liabilities or losses and other events that ED contends might result in the institution being unable to meet all of its financial obligations and otherwise provide the administrative resources necessary to comply with the Title IV programs. The current regulations require institutions to notify ED and current and prospective students within specified timeframes of the occurrence of one or more of these events.
With respect to events that might result in actual or potential debts, liabilities or losses, the current regulations identify the following events that could result in ED deeming the institution to fail ED’s financial responsibility standards and requiring a letter of credit or other form of acceptable financial protection and the acceptance of other conditions or requirements:
|
•
|
the institution is required to pay any debt or incur any liability arising from a final judgment in a judicial proceeding or from an administrative proceeding or determination, or from a settlement;
|
|
•
|
the institution is being sued in an action that has been pending for 120 days and that was brought by a federal or state authority for financial relief on claims related to making a Direct Loan for enrollment at the institution or the provision of educational services;
|
|
•
|
the institution is being sued in other litigation and the institution’s motion for summary judgment has been denied or was not filed with the court;
|
|
•
|
the institution is closing any or all of its locations and is required by its accrediting agency to submit a teach-out plan;
|
|
•
|
the institution has one or more gainful employment programs with gainful employment rates that could result in the programs becoming ineligible based on their rates for the next award year; or
|
|
•
|
if the institution’s composite score is less than 1.5, any withdrawal of owner’s equity from the institution occurs by any means, including by declaring a dividend, unless the transfer is to an entity included in the affiliated entity group on whose basis the institution’s composite score was calculated.
|
29
If one or more of these events occur, ED recalculates the institution’s composite score by estimating the amount of actual and potential losses resulting from the events and determining whether the recalculated composite score is less than 1.0 and the institution fails the financial responsibility standards as a result. The regulations establish severe rules for calculating and presuming the recognition of the potential losses that might arise from the above-referenced events. For example, with certain exceptions, the regulations estimate the potential losses from pending lawsuits to equal the amount of relief claimed in the complaint or in any final written demand letter from the claimant. With respect to closing locations and to programs that could lose eligibility based on gainful employment rates, the regulations estimate potential losses to equal the amount of Title IV funds received by the institution for the location and programs during the most recently completed award year. For a withdrawal of owner’s equity, the regulations estimate potential losses to equal the amount transferred to an entity other than the institution.
The current regulations could require us to submit a letter of credit or other form of acceptable financial protection and accept other conditions or requirements if we pay dividends to shareholders if our composite score is less than 1.5 and the dividend amounts in combination with estimated losses associated with other events covered by the rules would reduce our composite score below 1.0 as recalculated by ED. On June 24, 2016, we entered into a Securities Purchase Agreement with Coliseum Holdings I, LLC, pursuant to which Coliseum purchased shares of our Series A Preferred Stock. Under the related Certificate of Designations, dividends on the Series A Preferred Stock accrue from the date of original issuance at a rate of 7.5% per annum on the liquidation preference then in effect (Cash Dividend). If we do not declare and pay the dividend, the liquidation preference will be increased to an amount equal to the liquidation preference in effect at the start of the applicable dividend period plus an amount equal to such then applicable liquidation preference multiplied by 9.5% per annum (Accrued Dividend). Cash Dividends, if declared, are payable semi-annually in arrears on September 30 and March 31, of each year. If applicable, the Accrued Dividend will begin to accrue and be cumulative on the same schedule as set forth above for Cash Dividends and will also be compounded on each applicable subsequent dividend date. Consequently, our inability to pay dividends on a timely basis could increase the cost of paying those dividends when they are paid in the future.
The regulations also identify the following events that ED contends might result in the institution being unable to meet all of its financial obligations and otherwise provide the administrative resources necessary to comply with the Title IV programs, and that could result in ED deeming the institution to fail ED’s financial responsibility standards, thus requiring a letter of credit or other form of acceptable financial protection and the acceptance of other conditions or requirements: failure to comply with the 90/10 Rule for the most recently completed fiscal year; SEC warning that it may suspend trading on the institution’s stock; failure to file certain reports with the SEC; the exchange on which the institution’s stock is traded notifying the institution that it is not in compliance with exchange requirements or that its stock is delisted; cohort default rates of at least 30 percent for its two most recent rates; certain significant fluctuations in Title IV funding; certain citations for failure to comply with state agency requirements; failure to comply with yet to be developed ED financial stress tests; high annual dropout rates; placement of the institution on probation or issuance of a show-cause or similar action by its accrediting agency; certain violations of loan agreements; expected or pending claims for borrower relief discharges and certain other events that ED might identify as reasonably likely to have a material adverse effect on the financial condition, business or results of operations of the institutions.
If ED deems the institution to fail the financial responsibility standards based on one or more of the aforementioned events listed in the regulations or based on the institution’s failure to comply with other requirements in the financial responsibility regulations, ED may permit the institution to continue participating in the Title IV programs under a provisional certification and would require the institution to submit a letter of credit or other form of financial protection, comply with the zone requirements and potentially accept other conditions or restrictions. The regulations state that the letter of credit must equal 10% of the total amount of Title IV funds received by the institution during its most recently completed fiscal year plus any additional amount that ED determines is necessary to fully cover any estimated losses unless the institution demonstrates that the additional amount is unnecessary to protect, or is contrary to, the Federal interest. The regulations state that ED maintains
30
the full amount of financial protection until ED determines that the institution has a composite score of 1.0 or greater based on a review of the institution’s audited financial statements for the fiscal year in which all losses from the aforementioned events have been fully recognized or if the recalculated composite score is 1.0 or greater and the aforementioned events have ceased to exist.
Student Loan Repayment Rates
The current regulations require proprietary institutions with student loan repayment rates, as defined in the regulations, below prescribed thresholds to provide an ED-prepared warning to prospective and enrolled students, as well as placement of the warning on its website and in all promotional materials and advertisements.
Prohibition on Pre-Dispute Contractual Provisions
The current regulations prohibit the use and reliance upon certain contractual provisions regarding dispute resolution processes, such as pre-dispute arbitration agreements or class action waivers, and require certain notifications, contract provisions and disclosures by institutions regarding students’ ability to participate in certain class action lawsuits or to initiate certain lawsuits instead of through arbitration. The rules require institutions to submit to ED copies of certain records in connection with any claim filed in arbitration by or against the school concerning a borrower defense claim and any claim filed in a lawsuit by the school against the student or by any party against the school concerning a borrower defense claim.
The “90/10 Rule.”
A for-profit institution loses its eligibility to participate in Title IV Programs if it derives more than 90% of its revenue from Title IV Programs for two consecutive fiscal years as calculated under a cash basis formula mandated by ED. The HEA and ED regulations set forth specific requirements for the calculation of the Title IV Program revenue percentage, mandate expanded disclosure requirements in how an institution presents the calculation and impose negative consequences if an institution exceeds the 90% limit in a single fiscal year.
The HEA provides that an institution will lose its Title IV Program eligibility for a period of at least two institutional fiscal years if it exceeds the 90% threshold for two consecutive institutional fiscal years. The loss of such eligibility would begin on the first day following the conclusion of the second consecutive year in which the institution exceeded the 90% limit and, as such, any Title IV Program funds already received by the institution and its students during a period of ineligibility would have to be returned to ED or a lender, if applicable. Additionally, if an institution exceeds the 90% level for a single year, ED will place the institution on provisional certification for a period of at least two years, could impose other restrictions or conditions on the institution's Title IV eligibility, and, under ED’s amended financial responsibility regulations that were scheduled to take effect on July 1, 2017, but then were further delayed until July 1, 2019 by ED action that was subsequently invalidated by federal court orders as of October 16, 2018, could conclude that the institution lacks financial responsibility and is required to submit a letter of credit or other form of financial protection.
The HEA sets specific standards for certain elements in the calculation of an institution’s percentage under the 90/10 Rule, including, among other things, the treatment of institutional loans and revenue received from students who are enrolled in educational programs that are not eligible for Title IV Program funding.
As of
September 30, 2018
, our institutions’ annual Title IV percentages as calculated under the 90/10 rule ranged from approximately 69% to 72%. We regularly monitor compliance with this requirement to minimize the risk that any of our institutions would derive more than the allowable maximum percentage of its revenue from Title IV Programs for any fiscal year.
Federal Student Loan Defaults
. To remain eligible to participate in Title IV Programs, institutions must maintain federal student loan cohort default rates below specified levels. ED calculates an institution’s cohort
31
default rate on an annual basis. Under the current calculation, the cohort default rate is derived from student borrowers who first enter loan repayment during a federal fiscal year (FFY) ending September 30 and subsequently default on those loans within the two following years; parent borrowers are excluded from the calculation. This represents a three-year measuring period. An institution whose cohort default rate is 30% or more for three consecutive FFYs or greater than 40% for any given FFY loses eligibility to participate in some or all Title IV Programs. This sanction is effective for the remainder of the FFY in which the institution lost its eligibility and for the two subsequent FFYs. None of our institutions had a three-year cohort default rate of 30% or greater for 2015, 2014 or 2013, the three most recent FFYs with published rates.
The following tables set forth the FFEL/DL cohort default rates for our institutions:
|
Three-Year Cohort Default Rates for
|
|||||
|
Institution
|
Cohort Years Ended September 30,
(1)
|
||||
|
2015
|
2014
|
2013
|
|||
|
Universal Technical Institute of Arizona
|
14.9%
|
13.9%
|
14.5%
|
||
|
Universal Technical Institute of Phoenix
|
15.0%
|
18.3%
|
18.9%
|
||
|
Universal Technical Institute of Texas
|
17.4%
|
15.8%
|
18.6%
|
||
|
All proprietary postsecondary institutions
|
15.6%
|
15.5%
|
15.0%
|
||
|
(1) Based on information published by ED.
|
|||||
An institution whose three-year cohort default rate is 15% or greater for any one of the three preceding years is subject to a 30-day delay in receiving the first disbursement on federal student loans for first-time borrowers. As of
September 30, 2018
, Universal Technical Institute of Phoenix and Universal Technical Institute of Texas were subject to delayed disbursements. An institution whose cohort default rate is 30% or greater, but less than or equal to 40%, for two of the three most recent federal fiscal years may be placed on provisional certification status by ED for up to three years. Under ED’s financial responsibility regulations that were amended with an effective date of July 1, 2017, but then were further delayed until July 1, 2019 by ED action that was subsequently invalidated by federal court orders as of October 16, 2018, an institution whose two most recent official cohort default rates are 30 percent or greater may fail ED’s financial responsibility regulations and be required to submit a letter of credit or other financial protection and be subject to other conditions and restrictions.
Perkins Loan Defaults.
An institution with a Perkins program cohort default rate that is greater than 15.0% for any federal award year, which is the twelve month period from July 1 through June 30, may be placed on provisional certification. The most recent Perkins cohort default rates reported by our institutions are based on Perkins borrowers who entered repayment during the federal award year ended June 30, 2017, who then defaulted on their Perkins loans prior to July 1, 2018. The resulting 2017-2018 Perkins cohort default rate for Universal Technical Institute of Arizona was 2.9%. The Perkins cohort default rates for Universal Technical Institute of Texas and Universal Technical Institute of Phoenix for the same period were 12.5% and 22.2%, respectively. However, because there were fewer than 30 Perkins loan borrowers for these two institutions who entered repayment during the 2016-2017 year, ED required a consolidation of the three most recently reported Perkins data years to calculate an official Perkins cohort default rate. The resulting 3-year consolidated rates for Universal Technical Institute of Texas and Universal Technical Institute of Phoenix were 11.1% and 22.9%, respectively. Although the Perkins 3-year consolidated cohort default rate is greater than 15% for Universal Technical Institute of Phoenix, we have not been advised of any provisional certification status. If we are placed on provisional certification status for any reason, ED will require us to obtain prior approval for changes to our programs and locations and may more closely view any application we file for recertification, new locations, new or revised educational programs, acquisitions
32
of other institutions, increases in degree level or other significant changes. Further, for an institution that is provisionally certified, ED may revoke the institution’s certification without advance notice or advance opportunity to challenge the action.
An institution with a Perkins cohort default rate of 50% or greater for three consecutive federal award years loses eligibility to participate in the Perkins program and must liquidate its loan portfolio. None of our institutions had a Perkins cohort default rate of 50% or greater for any of the last three federal award years. The Perkins program was ended by Congress effective September 30, 2017; thus no new Perkins loans will be made.
Financial Responsibility Standards.
All institutions participating in Title IV Programs must satisfy specific ED standards of financial responsibility. ED evaluates institutions for compliance with these standards each year, based on the institution’s annual audited financial statements, as well as following a change of control of the institution.
The institution’s financial responsibility is measured by its composite score which is calculated by ED based on three ratios:
|
•
|
the equity ratio which measures the institution’s capital resources, ability to borrow and financial viability;
|
|
•
|
the primary reserve ratio which measures the institution’s ability to support current operations from expendable resources; and
|
|
•
|
the net income ratio which measures the institution’s ability to operate at a profit.
|
ED assigns a strength factor to the results of each of these ratios on a scale from negative 1.0 to positive 3.0, with negative 1.0 reflecting financial weakness and positive 3.0 reflecting financial strength. ED then assigns a weighting percentage to each ratio and adds the weighted scores for the three ratios together to produce a composite score for the institution. The composite score must be at least 1.5 for the institution to be deemed financially responsible without the need for further oversight. In addition to having an acceptable composite score, an institution must, among other things, meet all of its financial obligations including required refunds to students and any Title IV Program liabilities and debts, be current in its debt payments, comply with certain past performance requirements and not receive an adverse, qualified, or disclaimed opinion by its accountants in its audited financial statements. If ED determines that an institution does not satisfy its financial responsibility standards, depending on the resulting composite score and other factors, that institution may establish its financial responsibility on an alternative basis.
If an institution's composite score is below 1.5, but is at least 1.0, the institution is in a category classified by ED as the zone. Under ED regulations, institutions in the zone solely because their composite score is less than 1.5 are still considered to be financially responsible, but require additional oversight by ED in the form of cash monitoring and other participation requirements. Institutions in the zone typically are permitted by ED to continue to participate in the title IV programs under one of two alternatives: 1) the “Zone Alternative” under which an institution is required to make disbursements to students under a payment method other than ED’s standard repayment, typically the Heightened Cash Monitoring 1 (HCM1) payment method; to notify ED within 10 days after the occurrence of certain oversight and financial events and to comply with other operating conditions imposed by ED or 2) submit a letter of credit to ED equal to at least 50 percent of the Title IV funds received by the institutions during the most recent fiscal year. ED permits an institution to participate under the “Zone Alternative” for a period of up to three consecutive fiscal years. Under the “Zone Alternative” notification requirement, the institution must provide timely information to ED regarding any of the following oversight and financial events:
|
•
|
any adverse action, including a probation or similar action, taken against the institution by its accrediting agency, state authority or other federal agency;
|
33
|
•
|
any event that causes the institution to realize any liability that was noted as a contingent liability in the institution's most recent audited financial statements;
|
|
•
|
any violation by the institution of any loan agreement;
|
|
•
|
any failure of the institution to make a payment in accordance with its debt obligations that results in a creditor filing suit to recover funds under those obligations;
|
|
•
|
any withdrawal of owner's equity/net assets from the institution by any means, including by declaring a dividend;
|
|
•
|
any extraordinary losses as defined in accordance with generally accepted accounting principles; or
|
|
•
|
any filing of a petition by the institution for relief in bankruptcy court.
|
Under the current regulations that were scheduled to take effect on July 1, 2017, but then were further delayed until July 1, 2019 by ED action that was subsequently invalidated by federal court orders as of October 16, 2018, the list of information that an institution must provide timely to ED includes, in addition to the events described under the financial protection measures, any event that causes the institution, or a related entity, to realize any liability that was noted as a contingent liability in the institution’s or related entity’s most recent audited financial statements or any losses that are unusual in nature and infrequently occur or both as defined in accordance with certain specified accounting standards. The institution also would be required to notify ED of certain other events described in the current Defense to Repayment regulations. See “Regulation of Federal Student Financial Aid Programs - Defense To Repayment Regulations.” ED could impose a letter of credit or other conditions or requirements upon us in response to the reporting of any oversight or financial events.
Under the HCM1 payment method, the institution is required to make Title IV disbursements to eligible students and parents before it requests or receives funds for the amount of those disbursements from ED. As long as the student accounts are credited before the funding requests are initiated, an institution is permitted to draw down funds through ED’s electronic system for grants management and payments for the amount of disbursements made to eligible students. Unlike the Heightened Cash Monitoring 2 (HCM2) or reimbursement payment methods, the HCM1 payment method typically does not require institutions to submit documentation to ED and wait for ED approval before drawing down Title IV funds. ED may place an institution that is in the zone on the HCM2 or reimbursement methods of payment. An institution on the HCM1, HCM2 or reimbursement payment methods must pay any credit balances due to a student or parent before drawing down funds from ED for the amount of disbursements made to the student or parent.
If an institution's composite score is below 1.0, the institution is considered by ED to lack financial responsibility. If ED determines that an institution does not satisfy ED's financial responsibility standards, depending on its composite score and other factors, that institution may establish its financial responsibility on an alternative basis by, among other things:
|
•
|
posting a letter of credit in an amount equal to at least 50% of the total Title IV Program funds received by the institution during its most recently completed fiscal year, or
|
|
•
|
posting a letter of credit in an amount equal to at least 10% of such prior year's Title IV Program funds, accepting provisional certification for a period of no more than three years, complying with additional ED notification and operating requirements and conditions and agreeing to receive Title IV Program funds under an arrangement other than ED's standard advance funding arrangement.
|
If an institution is unable to establish financial responsibility on an alternative basis, the institution may be subject to financial penalties, restrictions on operations and loss of external financial aid funding. See "Risk Factors" included elsewhere in this Report on Form 10-K for additional information. If an institution does not establish its financial responsibility by the end of the period for which ED provisionally certified the institution, ED may
34
continue to provisionally certify the institution, but may require one or more persons or entities that exercise substantial control over the institution, as defined by ED regulations, to provide ED with financial protection for an amount determined by ED and to be jointly and severally liable for any liabilities that may arise from the institution’s participation in the Title IV programs.
The current regulations that were scheduled to take effect on July 1, 2017, but then were further delayed until July 1, 2019 by ED action that was subsequently invalidated by federal court orders as of October 16, 2018, amend the financial responsibility regulations to expand the list of actions or events that require an institution to provide ED with a letter of credit or other form of acceptable financial protection. The regulations also, among other things, may increase the amount of the letter of credit or other form of financial protection that an institution must provide to ED if the institution has a composite score below 1.0, no longer qualifies for the Zone Alternative, or does not comply with other applicable requirements of the financial responsibility regulations. The current regulations also would permit ED to recalculate an institution’s composite score to account for its estimate of actual or potential losses resulting from certain events identified in the new Defense to Repayment Regulations. See “Regulation of Federal Student Financial Aid Programs - Defense To Repayment Regulations.”
ED has historically evaluated the financial condition of our institutions on a consolidated basis based on the financial statements of Universal Technical Institute, Inc. as the parent company. ED’s regulations permit ED to examine the financial statements of Universal Technical Institute, Inc., the financial statements of each institution and the financial statements of any related party. For our 2018 fiscal year, we calculated our composite score to be 1.6
.
However, the composite score calculations and resulting requirements imposed on our institutions are subject to determination by ED once it receives and reviews our audited financial statements.
Return of Title IV Funds.
An institution participating in Title IV Programs must calculate the amount of unearned Title IV Program funds that have been disbursed to students who withdraw from their educational programs before completing them. The institution must return those unearned funds to ED or the appropriate lending institution in a timely manner, which is generally within 45 days from the date the institution determines that the student has withdrawn.
If an institution is cited in an audit or program review for returning Title IV Program funds late for 5% or more of the students in the audit or program review sample, the institution must post a letter of credit in favor of ED in an amount equal to 25% of the total Title IV Program funds that should have been returned in the previous fiscal year. Our 2018 Title IV compliance audits did not cite any of our institutions for exceeding the 5% late payment threshold.
Substantial Misrepresentation.
Under ED regulations, an institution participating in the Title IV Programs is prohibited from engaging in substantial misrepresentation of the nature of its educational programs, financial charges, graduate employability or its relationship with ED. A “misrepresentation” includes any false, erroneous, or misleading statement (whether made in writing, visually, orally, or through other means) that is made by an eligible institution, by one of its representatives, or by a third party that provides to the institution educational programs, marketing, advertising, recruiting, or admissions services and that is made to a student, prospective student, any member of the public, an accrediting or state agency, or to ED. ED regulations define a “substantial misrepresentation” to include any misrepresentation on which the person to whom it was made could reasonably be expected to rely, or has reasonably relied, to that person’s detriment. The definition of “substantial misrepresentation” is broad and, therefore, it is possible that a statement made by the institution or one of its service providers or representatives could be construed by ED to constitute a substantial misrepresentation. If ED determines that one of our institutions has engaged in substantial misrepresentation, ED may impose sanctions or other conditions upon the institution including, but not limited to, initiating an action to fine the institution or limit, suspend, or terminate its eligibility to participate in the Title IV Programs and may seek to discharge loans under the borrower defense to repayment regulations and impose liabilities upon the institution.
35
Institution Acquisitions
. When a company acquires an institution that is eligible to participate in Title IV Programs, that institution undergoes a change of ownership resulting in a change of control as defined by ED. Upon such a change of control, an institution’s eligibility to participate in Title IV Programs is generally suspended until it has applied for recertification by ED as an eligible institution under its new ownership, which requires that the institution also re-establish its state authorization and accreditation. ED may temporarily and provisionally certify an institution seeking approval of a change of control under certain circumstances while ED reviews the institution’s application. The time required for ED to act on such an application may vary substantially. ED’s recertification of an institution following a change of control is typically on a provisional basis. Our expansion plans are based, in part, on our ability to acquire additional institutions and have them certified by ED to participate in Title IV Programs following affirmation of state licensure and accreditation. Although we believe we will be able to obtain all necessary approvals from ED, ACCSC and the applicable state and federal agencies for our expansion plans, we cannot ensure that such approvals will be obtained at all or in a timely manner that will not delay or reduce the availability of Title IV Program funds for our students.
Change of Control
. In addition to institution acquisitions, other types of transactions can also cause a change of control. ED and most state education agencies and ACCSC have standards pertaining to the change of control of institutions, but these standards are not uniform. ED’s regulations describe some transactions that constitute a change of control, including the transfer of a controlling interest in the voting stock of an institution or the institution’s parent corporation. With respect to a publicly-traded corporation, ED regulations provide that a change of control occurs in one of two ways: (i) if there is an event that would obligate the corporation to file a Current Report on Form 8-K with the SEC disclosing a change of control or (ii) if the corporation has a “Controlling Stockholder”, as defined in ED regulations, that owns or controls through agreement at least 25% of the total outstanding voting stock of the corporation and is the largest stockholder of the corporation, and that stockholder ceases to own at least 25% of such stock or ceases to be the largest stockholder. These change of control standards are subject to interpretation by ED. Most of the states and our accrediting commission include the sale of a controlling interest of common stock in the definition of a change of control. A change of control under the definition of these agencies would require any affected institution to have its state authorization and accreditation reaffirmed by that agency. The requirements to obtain such reaffirmation from the states and our accrediting commission vary widely.
A change of control could occur as a result of future transactions in which our company or our institutions are involved. Some corporate re-organizations and some changes in the board of directors are examples of such transactions. Additionally, the potential adverse effects of a change of control could influence future decisions by us and our stockholders regarding the sale, purchase, transfer, issuance or redemption of our stock. If a future transaction would result in a change of control of our company or our institutions, we would pursue all necessary approvals from ED, ACCSC and the applicable federal and state agencies. However, we cannot ensure that all such approvals can be obtained at all or in a timely manner that will not delay or reduce the availability of Title IV Program funds for our students.
Opening Additional Institutions and Adding Educational Programs
. For-profit educational institutions must be authorized by their state education agencies, accredited by an accrediting commission recognized by ED and be fully operational for two years before applying to ED to participate in Title IV Programs. However, an institution that is certified to participate in Title IV Programs may establish an additional location and apply to participate in Title IV Programs at that location without regard to the two-year requirement, if such additional location satisfies all other applicable ED eligibility requirements. Our expansion plans are based, in part, on our ability to open new campuses as additional locations of our existing institutions and take into account ED’s approval requirements. Currently, all of our institutions are eligible to offer Title IV Program funding.
A student may use Title IV Program funds only to pay the costs associated with enrollment in an eligible educational program offered by an institution participating in Title IV Programs. Our expansion plans are based, in part, on our ability to add new educational programs at our existing institutions. Generally, an institution that is eligible to participate in Title IV Programs, and is not provisionally certified, may add a new educational program
36
without ED approval if the new program is licensed by the applicable state agency, accredited by an agency recognized by ED, prepare students for gainful employment in the same or related occupation as an educational program that ED has already approved, and meets certain other requirements. For programs required to lead to gainful employment in a recognized occupation, which includes all of our programs, the institution must also certify that the new program:
|
•
|
is approved by a recognized accrediting agency or is otherwise included in the institution's accreditation by its recognized accrediting agency;
|
|
•
|
is programmatically accredited if such accreditation is required by a federal government entity or by a governmental entity in the state in which the institution is located or in which the institution is otherwise required to obtain state approval; and
|
|
•
|
in the state in which the institution is located, or in which the institution is otherwise required to obtain state approval, satisfies the applicable education prerequisites for professional licensure or certification requirements in that state so that a student who completes the program and seeks employment in that state qualifies to take any licensure or certification examination that is needed for the student to practice or find employment in an occupation that the program prepares students to enter.
|
Some of the state education agencies and ACCSC also have requirements that may affect our institutions’ ability to open a new location, establish an additional location of an existing institution or begin offering a new or revised educational program. We do not believe that these standards will create significant obstacles to our expansion plans.
Administrative Capability
. ED assesses the administrative capability of each institution that participates in Title IV Programs under a series of separate standards listed in the regulations. Failure to satisfy any of the standards may lead ED to find the institution ineligible to participate in Title IV Programs, require the institution to repay Title IV Program funds, change the method of payment of Title IV Program funds or place the institution on provisional certification as a condition of its continued participation or take other actions against the institution.
Eligibility and Certification Procedures
.
The HEA specifies the manner in which ED reviews institutions for eligibility and certification to participate in Title IV Programs. Every educational institution seeking Title IV Program funding for its students must be certified to participate and is required to periodically renew this certification. Each institution must apply to ED for continued certification to participate in Title IV Programs before its current term of certification expires, or if it undergoes a change of control. Terms of certification are typically six years, but can be three years or shorter. Furthermore, an institution may come under ED review if it expands its activities in certain ways such as opening an additional location or raising the highest academic credential it offers. The Program Participation Agreement (PPA) document serves as ED’s formal authorization of an institution and its associated additional locations to participate in Title IV Programs for a specified period of time.
We received a fully recertified PPA for Universal Technical Institute of Texas in April 2018 which will expire March 31, 2022. In November 2018, we received a fully recertified PPA for Universal Technical Institute of Arizona and a fully recertified PPA for Universal Technical Institute of Phoenix. Both of the PPA's will expire on March 31, 2022. On July 31, 2018, ED issued the Final Program Review Determination letter for Universal Technical Institute of Arizona, indicating that the program review was satisfactorily closed.
Compliance with Regulatory Standards and Effect of Regulatory Violations
. Our institutions are subject to audits and program compliance reviews by various external agencies, including ED, ED’s Office of Inspector General, state education agencies, student loan guaranty agencies, the VA and ACCSC, as well as other federal and state agencies. Each of our institutions’ administration of Title IV Program funds must also be audited annually by independent accountants and the resulting audit report submitted to ED for review. If ED or another regulatory agency determined that one of our institutions improperly disbursed Title IV Program funds or violated a provision
37
of the HEA or ED’s regulations, that institution could be required to repay such funds and could be assessed an administrative fine. ED could also transfer the institution from the advance method of receiving Title IV Program funds to a cash monitoring or reimbursement system, which could negatively impact cash flow at an institution. Significant violations of Title IV Program requirements by us or any of our institutions could be the basis for a proceeding by ED to fine the affected institution or to limit, suspend or terminate the participation of the affected institution in Title IV Programs. Generally, such a termination extends for 18 months before the institution may apply for reinstatement of its participation.
In April 2015, ED completed an ordinary course program review of our administration of the Title IV programs in which we participate for our Avondale, Arizona institution main campus and additional locations of that institution. The site visit covered the 2013-2014 and 2014-2015 award years. An initial program review report dated September 22, 2017 was issued by ED in July 2018. The report contained nine findings that are not material because they are limited to errors identified in individual student records and to requests to update and strengthen certain financial aid-related disclosures and procedures. None of the findings require us to perform any retroactive file reviews of all of our students for any issues for any time period. We provided our response to ED within the stated deadline of 30 days from the date we received the report. ED reviewed our response to the report and issued its final program review determination letter on July 31, 2018. All findings were considered resolved by ED.
In connection with the issuance of our Series A Convertible Preferred Stock (Series A Preferred Stock) in June 2016, we received a request from ED to provide a monthly student roster and a biweekly cash flow projection. We began complying with these reporting requirements in July 2016.
There is no ED proceeding pending to fine any of our institutions or to limit, suspend or terminate any of our institutions' participation in Title IV Programs, and we have no written notice that any such proceeding is currently contemplated. Violations of Title IV Program requirements could also subject us or our institutions to other civil and criminal penalties.
We provide the following cautionary discussion of risks, uncertainties and possibly inaccurate assumptions relevant to our business. These are factors that, individually or in the aggregate, could cause our actual results to differ materially from expected and historical results. We note these factors for investors within the meaning of Section 21E of the Exchange Act and Section 27A of the Securities Act. You should understand that it is not possible to predict or identify all such factors. Consequently, you should not consider the following to be a complete discussion of all potential risks or uncertainties. You should consider carefully the risks and uncertainties described below in addition to other information contained in this Report on Form 10-K, including our consolidated financial statements and related notes.
Risks Related to Our Industry
Failure of our schools to comply with the extensive regulatory requirements for school operations could result in financial requirements or penalties, restrictions on our operations and loss of external financial aid funding.
In
2018
, we derived approximately 71% of our revenues, on a cash basis, from Title IV Programs, administered by ED. To participate in Title IV Programs, an institution must receive and maintain authorization by the appropriate state agencies, be accredited by an accrediting commission recognized by ED and be certified as an eligible institution by ED. As a result, our institutions are subject to extensive regulation by the state agencies, ACCSC and ED. Our institutions also are subject to the requirements of other federal and state regulatory agencies. These regulatory requirements cover the vast majority of our operations, including our educational programs, facilities, instructional and administrative staff, administrative procedures, marketing, recruiting, financial operations and financial condition. These regulatory requirements also affect our ability to acquire, expand or
38
open additional institutions or campuses, add new, or expand our existing educational programs and change our corporate structure and ownership. Most ED requirements are applied on an institutional basis, with an “institution” defined by ED as a main campus and its additional locations, if any. Under ED’s definition, we have three such institutions. The state agencies, ACCSC and ED periodically revise their requirements and modify their interpretations of existing requirements. ED has imposed new regulatory requirements, such as the gainful employment regulations, the defense to repayment regulations and the expanded financial responsibility regulations, that apply to our schools and plans to develop additional regulations that will apply to our schools. See "Risks Related to Our Industry - Compliance with the Title IV Program Integrity regulations, gainful employment regulations and ongoing negotiated rulemaking could materially and adversely affect our business" and “Risks Related to Our Industry - Failure to maintain eligibility to participate in Title IV Programs could materially and adversely affect our business - Financial Responsibility Standards.”
If our institutions failed to comply with any of these regulatory requirements, our regulatory agencies could impose monetary penalties; bring litigation against us; place limitations on our schools’ operations, such as restricting our ability to recruit or enroll students within certain states or imposing letter of credit requirements; terminate our schools’ ability to grant certificates, diplomas and degrees; revoke our schools’ accreditation; or terminate our schools’ eligibility to receive Title IV Program funds, each of which could adversely affect our cash flows, results of operations and financial condition, and impose significant operating restrictions upon us. Further, ED and other regulators have increased the frequency and severity of their enforcement actions against postsecondary schools which have resulted in the imposition of material liabilities, sanctions, letter of credit requirements and other restrictions and, in some cases, resulted in the loss of schools’ eligibility to receive Title IV funds or in closure of the schools. We cannot predict with certainty how all of these regulatory requirements will be applied or whether each of our schools will be able to comply with all of the requirements in the future. We believe that we have described the most significant regulatory risks that apply to our schools in the following paragraphs.
Failure to maintain eligibility to participate in Title IV Programs could materially and adversely affect our business.
To participate in Title IV Programs, an institution must be authorized to offer its programs by the relevant state education agencies, be accredited by an accrediting commission recognized by ED and be certified as eligible by ED. The substantial amount of federal funds disbursed through Title IV Programs, the large number of students and institutions participating in those programs and instances of fraud and abuse have prompted ED to exercise significant regulatory oversight over institutions participating in Title IV Programs. Accrediting commissions and state agencies also oversee compliance with both their respective standards and with Title IV Program requirements. As a result, each of our institutions is subject to detailed oversight and review and must comply with a complex framework of frequently changing laws and regulations and subjective regulatory interpretation of these obligations by various regulating entities. Because ED periodically revises its regulations and changes its interpretation of existing laws and regulations, we cannot predict with certainty how Title IV Program requirements will be applied in all circumstances. Additionally, given the complex nature of the regulations, the fact that they are subject to multiple interpretations, a stated department policy of providing limited or no interpretive guidance on certain issues and the large volume of Title IV transactions in which we are involved, it is reasonable to conclude that, from time to time, in the conduct of our business, we may inadvertently violate such regulations. In such an event, remedial action may be necessary, regulatory proceedings could occur and regulatory penalties could be assessed.
Significant factors relating to Title IV Program eligibility that could adversely affect us include the following:
State Authorization
A campus that grants certificates, diplomas or degrees must be authorized to offer postsecondary education programs in that state by the relevant education agency of the state in which it is located. The recruitment activity
39
of admissions representatives in states where we do not physically have a campus location may also trigger licensing requirements for campuses in those states. Requirements for authorization vary substantially among states. State authorization is also required for students to be eligible for funding under Title IV Programs. Loss of state authorization by any of our campuses from the education agency of the state in which the campus is located would end that campus’ eligibility to participate in Title IV Programs and could cause us to close the campus, which could have a material adverse effect on our cash flows, results of operations and financial condition. Loss of state authorization in a state where we do not physically have a campus location, but we do have admissions representatives recruiting students would mean that our admissions representatives could no longer recruit students in that state. See “Business - Regulatory Environment - State Authorization and Regulation” included elsewhere in this Report on Form 10-K for additional information.
Accreditation
A school must be accredited by an accrediting commission recognized by ED in order to participate in Title IV Programs. Loss of institutional accreditation by any of our institutions (or of any institution that we may acquire or open in the future) would end that institution’s participation in Title IV Programs and could cause us to close the institution, or seek a new accrediting entity. If an accrediting agency that accredits one of our institutions (or an institution that we may acquire or open in the future) loses its ED recognition, ED may provisionally certify the institution to continue participating in the Title IV Programs for a period of up to 18 months during which time the institution may attempt to obtain accreditation from another ED-recognized accrediting agency. Moreover, even if ED provisionally certifies the institution for up to 18 months, the loss of ED recognition by an institution’s accrediting agency could result in a more immediate loss of the institution’s state authorization and, in turn, loss of Title IV eligibility, programmatic accreditation, or eligibility to participate in certain federal or state financial assistance programs if accreditation by an ED-recognized accrediting agency is a precondition to such authorization, accreditation or eligibility.
The loss of accreditation by any of our current or future institutions, or the loss of ED recognition of an institution’s accrediting agency, could have a material adverse effect on our cash flows, results of operations and financial condition. See “Business - Regulatory Environment - Accreditation” included elsewhere in this Report on Form 10-K for additional information. A change in accreditation to a more restrictive or monitored status could restrict our ability to add new programs, open new campuses or increase recruitment activity.
The “90/10 Rule”
Under the “90/10 Rule,” a for-profit institution loses its eligibility to participate in Title IV Programs if it derives more than 90% of its revenue from those programs for two consecutive institutional fiscal years, under a cash-basis calculation mandated by ED. The period of ineligibility covers at least the next two succeeding fiscal years, and any Title IV Program funds already received by the institution and its students during the period of ineligibility would have to be returned to ED. If an institution exceeds the 90% level for a single year, ED will place the institution on provisional certification for a period of at least two years and could impose other restrictions or conditions on the institution's Title IV eligibility, including, under the current Defense to Repayment regulations that were scheduled to take effect on July 1, 2017, but then were further delayed until July 1, 2019 by ED action that was subsequently invalidated by federal court orders as of October 16, 2018, the requirement to submit to ED a letter of credit or other form of financial protection. If we are placed on provisional certification status for any reason, ED will require us to obtain prior approval for changes to our programs and locations and may more closely review any application we file for recertification, new locations, new educational programs, revisions to existing educational programs, acquisitions of other schools, increases in degree level or other significant changes. Furthermore, for an institution that is provisionally certified, ED may revoke the institution’s certification without advance notice or advance opportunity to challenge the action. In our
2018
fiscal year, under the regulatory formula prescribed by ED, each of our institutions derived approximately 70% to 72% of its revenues from Title IV Programs.
40
We received a letter from ED in September 2015 requesting additional documentation in connection with revisions to our methodology for performing prior year 90/10 calculations. We provided the requested documentation in September 2015 and have not received a further response from ED. While the revisions did not cause any of our institutions to exceed the 90% revenue threshold, it is possible that ED may take other actions against our institutions or require us to provide additional information. See “Business - Regulatory Environment - Regulation of Federal Student Financial Aid Programs - the '90/10 Rule'” included elsewhere in this Report on Form 10-K for additional information.
Multiple legislative proposals have been introduced in Congress that would increase the requirements of the 90/10 Rule, such as reducing the 90% maximum under the rule to 85% and/or including military and veterans' funding in the 90% portion of the calculation. If any of our institutions loses eligibility to participate in Title IV Programs, such a loss would adversely affect our students’ access to Title IV Program funds they need to pay their educational expenses, which could reduce our student population and would have a material adverse effect on our cash flows, results of operations and financial condition.
Federal Student Loan Defaults
An institution may lose its eligibility to participate in some or all Title IV Programs if its former students default on the repayment of their federal student loans in excess of specified levels. Based upon the most recent student loan default rates published by ED,
none of our institutions have federal student loan default rates that exceed the specified levels. If any of our institutions loses eligibility to participate in Title IV Programs because of high student loan default rates, such a loss would adversely affect our students’ access to various Title IV Program funds, which could reduce our student population and would have a material adverse effect on our cash flows, results of operations and financial condition. See “Business - Regulatory Environment - Regulation of Federal Student Financial Aid Programs - Federal Student Loan Defaults” included elsewhere in this Report on Form 10-K for additional information.
Financial Responsibility Standards
To participate in Title IV Programs, an institution must satisfy specific measures of financial responsibility prescribed by ED or post a letter of credit in favor of ED and possibly accept other conditions on its participation in Title IV Programs. The operating conditions that may be placed on a school that does not meet the standards of financial responsibility include being transferred from the advance payment method of receiving Title IV Program funds to either the reimbursement or the heightened cash monitoring system, which could result in a significant delay in the institution’s receipt of those funds, require the institution to pay credit balances due to students and parents before drawing down funds from ED for the amount of disbursements made to the student or parent, and increased administrative costs related to those funds. See “Business - Regulatory Environment - Regulation of Federal Student Financial Aid Programs - Financial Responsibility Standards” included elsewhere in this Report on Form 10-K for additional information. ED published amendments to the financial responsibility regulations to expand the list of actions or events that would require an institution to provide ED with a letter of credit or other form of acceptable financial protection. These amendments were delayed until July 1, 2019 by ED action that was subsequently invalidated by federal court orders as of October 16, 2018. ED is in the process of developing amended regulations on this topic. See “Regulation of Federal Student Financial Aid Programs - Defense to Repayment Proposed Regulations” included elsewhere in this Report on Form 10-K for additional information.
ED has historically evaluated the financial condition of our institutions on a consolidated basis based on the financial statements of Universal Technical Institute, Inc. as the parent company. ED’s regulations permit ED to examine the financial statements of Universal Technical Institute, Inc., the financial statements of each institution and the financial statements of any related party. For our
2018
fiscal year, we calculated our composite score to be 1.6. However, the composite score calculations and resulting requirements imposed on our institutions are subject to determination by ED once it receives and reviews our audited financial statements.
41
ED has not required us currently to post a letter of credit on behalf of any of our schools. ED has required us to provide certain information on a regular basis following our recent issuance of preferred stock. ED concluded that the transaction did not constitute a change in ownership resulting in a change of control requiring ED approval, but did require us to provide 13-week projected cash flow statements every two weeks and to provide a roster of our current students on a monthly basis. We began providing this information to ED on a regular basis on July 15, 2016.
We may be required to post letters of credit or to comply with limitations on our Title IV participation in the future, which could increase our costs of regulatory compliance or change the timing of receipt of Title IV Program funds. ED has imposed material letters of credit and limitations on some schools and also has denied the eligibility of other schools to continue participating in the Title IV Programs. Our inability to obtain a required letter of credit or the imposition of other limitations on our participation in Title IV Programs could limit or result in the loss of our students’ access to Title IV Program funds, which could reduce our student population and could have a material adverse effect on our cash flows, results of operations and financial condition.
Return of Title IV Funds
A school participating in Title IV Programs must correctly calculate and return funds received for students who withdraw before completing their educational programs whose aid exceeds the amount earned under Title IV Program guidelines. Returns must be completed in a timely manner, generally within 45 days of the date the school determines that the student has withdrawn. If the unearned funds are not properly calculated or timely returned, we may be required to post a letter of credit in favor of ED, pay interest on the late repayment of funds, or be otherwise sanctioned by ED, which could increase our cost of regulatory compliance and adversely affect our results of operations. Additionally, the failure to timely return Title IV Program funds also could result in the termination of eligibility to receive such funds going forward or the imposition of other sanctions. Any of these results could have a material adverse effect on our cash flows, results of operations and financial condition. Given the complex nature of the regulations applicable to Title IV refunds and the fact they are subject to multiple interpretations, and the large volume of such transactions in which we are involved, it is reasonable to conclude that, from time to time, in the conduct of our business, we may inadvertently violate such regulations. In such an event, remedial actions may be necessary, regulatory proceedings could occur and regulatory penalties could be assessed.
Substantial Misrepresentations
Under ED regulations, an institution participating in the Title IV Programs is prohibited from engaging in substantial misrepresentation of the nature of its educational programs, financial charges, graduate employability or its relationship with ED. A “misrepresentation” includes any false, erroneous, or misleading statement (whether made in writing, visually, orally, or through other means) that is made by an eligible institution, by one of its representatives, or by a third party that provides to the institution educational programs, marketing, advertising, recruiting, or admissions services and that is made to a student, prospective student, any member of the public, an accrediting or state agency, or to ED. ED regulations define a “substantial misrepresentation” to include any misrepresentation on which the person to whom it was made could reasonably be expected to rely, or has reasonably relied, to that person’s detriment. The definition of “substantial misrepresentation” is broad and, therefore, it is possible that a statement made by the institution or one of its service providers or representatives could be construed by ED to constitute a substantial misrepresentation. If ED determines that one of our institutions has engaged in substantial misrepresentation, ED may impose sanctions or other conditions upon the institution including, but not limited to, initiating an action to fine the institution or limit, suspend, or terminate its eligibility to participate in the Title IV Programs and may seek to discharge loans under the borrower defense to repayment regulations and impose liabilities upon the institution.
42
Administrative Capability
ED regulations specify extensive criteria an institution must satisfy to establish that it has the requisite “administrative capability” to participate in Title IV Programs. These criteria require, among other things, that the institutions:
|
•
|
comply with all Title IV Program regulations;
|
|
•
|
have capable and sufficient personnel to administer Title IV Programs;
|
|
•
|
have acceptable methods of defining and measuring the satisfactory academic progress of its students;
|
|
•
|
administer Title IV Programs with adequate checks and balances in its system of internal controls over financial reporting;
|
|
•
|
divide the function of authorizing and disbursing or delivering Title IV Program funds so that no office has the responsibility for both functions;
|
|
•
|
establish and maintain records required under Title IV Program regulations;
|
|
•
|
develop and apply an adequate system to identify and resolve discrepancies in information from sources regarding a student’s application for financial aid under Title IV Programs;
|
|
•
|
not have a student loan cohort default rate above specified levels;
|
|
•
|
refer to the Office of the Inspector General any credible information indicating that any applicant, student, employee or agent of the institution has been engaged in any fraud or other illegal conduct involving Title IV Programs;
|
|
•
|
not be, and not have any principal or affiliate who is, debarred or suspended from federal contracting or engaging in activity that is the cause of debarment or suspension;
|
|
•
|
provide adequate financial aid counseling to its students;
|
|
•
|
show no significant problems that affect the administrative ability of the institution;
|
|
•
|
develop and follow procedures to evaluate the validity of a student's high school completion;
|
|
•
|
timely submit all reports and financial statements required by the regulations; and
|
|
•
|
not otherwise appear to lack administrative capability.
|
If an institution fails to satisfy any of these criteria, ED may, among other things:
|
•
|
require the repayment of Title IV Program funds;
|
|
•
|
impose a less favorable payment system for the institution’s receipt of Title IV Program funds;
|
|
•
|
place the institution on provisional certification status; or
|
|
•
|
commence a proceeding to impose a fine or to limit, suspend or terminate the participation of the institution in Title IV Programs, or decline to renew the institution’s program participation agreement.
|
43
Moreover, ED could take one or more of the actions identified above based on an institution’s noncompliance with ED requirements or the pendency of an ongoing audit or review even if ED does not conclude that the institution lacks administrative capability. If we are placed on provisional certification status for any reason, ED will require us to obtain prior approval for changes to our programs and locations and may more closely review any application we file for recertification, new locations, new educational programs, revisions to existing educational programs, acquisitions of other schools, increases in degree level or other significant changes. Furthermore, for an institution that is provisionally certified, ED may revoke the institution’s certification without advance notice or advance opportunity to challenge the action.
If we fail to maintain administrative capability as defined by ED or otherwise fail to comply with ED requirements, we could lose our eligibility to participate in Title IV Programs or have that eligibility adversely conditioned, which could have a material adverse effect on our cash flows, results of operations and financial condition.
Compliance with the Title IV Program Integrity regulations, gainful employment regulations, the defense to repayment regulations and other current and future regulations arising out of ongoing negotiated rulemaking could materially and adversely affect our business.
Since the publication of the program integrity regulations in 2010, ED has issued interpretive guidance on the regulations in the form of multiple Dear Colleague Letters and electronic announcements to institutions. The letters and announcements provide sub-regulatory guidance on certain aspects of the regulations, which assists institutions with understanding the regulations in these areas. The laws and regulations governing certain of the requirements do not establish clear criteria for compliance, and ED has indicated that they do not intend to provide additional guidance on certain topics. In particular, the elimination of the 12 safe harbors regarding the incentive compensation prohibition significantly impacted our business. ED published guidance in November 2015 that eliminated certain restrictions on incentive compensation for admissions representatives. Specifically, ED reconsidered its previous interpretation and stated that its regulations do not prohibit compensation for admissions representatives that is based upon students’ graduation from, or completion of, educational programs. Compensation based on enrolling students, however, continues to be prohibited. For a description of additional information regarding these regulatory changes, see “Business - Regulatory Environment - Regulation of Federal Student Financial Aid Programs - Incentive Compensation” included elsewhere in this Report on Form 10-K. Although ED has not provided safe harbor language for compensation based on graduate metrics, we have made adjustments to the compensation practices for our admissions representatives which we believe are compliant with ED's November 2015 guidance. The transition period for the new compensation structure will continue through calendar year 2018. We will continue to evaluate other compensation options under these regulations and guidance.
ED published the final gainful employment rule on October 31, 2014, which took effect on July 1, 2015. The final rule includes debt to earning (DE) metrics and disclosure requirements as well as requirements for program certifications, reporting and disclosure of program information and warnings. This rule is currently in effect, although ED has proposed regulations that would repeal the current rule. For a summary of the final rules and ED’s proposal to repeal those rules, see “Business - Regulatory Environment - Regulation of Federal Student Financial Aid Programs - Gainful Employment” included elsewhere in this Report on Form 10-K.
Compliance with final rules could have a material adverse effect on the manner in which we conduct our business and our results of operations. In January 2017, ED issued to our schools final versions of the first set of DE rates to be issued under the new rule. Under these rates for the 2015 debt measure year, none of our programs had failing rates. Nine of our 12 educational programs achieved passing rates, and the other three programs were in the zone. The three programs in the zone are the Collision Repair, Automotive and Motorcycle programs at our Universal Technical Institute of Phoenix institution, which includes our MMI Phoenix, Arizona and Orlando, Florida campuses and our Sacramento, California campus. All of the programs at our Universal Technical Institute of Arizona and Universal Technical Institute of Texas institutions had passing draft DE rates. With respect to future DE rates, we are not able to develop reliable projections of our programs' performance under the final rule because
44
we do not have access to the SSA earnings data that is used in the calculations. ED has not issued completer lists to schools, which is the first step toward generating the data for calculating a second set of gainful employment rates. Further, ED’s agreement with the Social Security Administration to produce mean or median earnings data has expired and has not been renewed. The earnings data is used to calculate the debt-to-earnings rates. Consequently, we cannot predict when ED will begin the process of calculating and issuing new draft or final gainful employment rates in the future.
If a particular program ceased to be eligible for Title IV Program funding, in most cases it would not be practical to continue offering that program under our current business model, which could reduce our enrollment and have a material adverse effect on our cash flows, results of operations and financial condition. In order to prevent this, we may have to explore mitigation strategies which might include preemptively reducing program tuition in an attempt to ensure compliance. Because we cannot calculate the exact impact of such action on the program's DE rates, we may overestimate the required tuition reduction, which would have a negative impact on our tuition revenues. Conversely, we may underestimate the required tuition reduction and fail to improve the program's DE rates, which could result in the loss of Title IV eligibility. Additionally, a decrease in or loss of any non-loan financial aid available to our students, such as financial aid provided by states, as discussed below, could cause the students to incur more loan debt, which would negatively impact our DE rates. Finally, the disclosures and warnings required by the final rule could also negatively impact our enrollment and have a material adverse effect on our cash flows, results of operations and financial condition.
On November 1, 2016, ED published the current regulations in the Federal Register establishing new rules regarding, among other things, the ability of borrowers to obtain discharges of their obligations to repay certain Title IV loans and for ED to initiate a proceeding to collect from the institution the discharged and returned amounts and the extensive list of circumstances that may require institutions to provide letters of credit or other financial protection to ED. The new regulations, among other things:
|
•
|
Establish amended procedures and standards for borrowers, either individually or as a group, to assert through an ED-administered process a defense to the borrowers’ obligation to repay certain Title IV loans based on certain acts or omissions of the institution. The regulations also expand the types of defenses available for loans first disbursed on or after July 1, 2017. If ED approves the borrower’s defense to repayment through the applicable administrative process established in the proposed regulations, ED may discharge the borrower’s obligation to repay some or all of the borrower’s student loans and may initiate a separate proceeding to collect from the institution the discharged and returned amounts.
|
|
•
|
Revise the financial responsibility regulations to expand the list of actions or events that would require an institution to provide ED with a letter of credit or other form of acceptable financial protection and potentially be subject to other conditions and requirements. The specified list of events is extensive and includes, among other potential triggers, certain debts or liabilities arising from settlements or final judgments in judicial or administrative proceedings and certain lawsuits pending for 120 days and initiated by a federal or state authority against the institution with respect to Direct Loans or educational services; certain other lawsuits in which the institution’s summary judgment motion was denied or not filed, certain closures of one or more of the institution’s locations, one or more gainful employment programs with gainful employment rates that could result in the program becoming ineligible in the next award year, certain withdrawals of owner’s equity from the institution including by dividend, failure to comply with the 90/10 Rule for the most recently completed fiscal year, SEC warning that it may suspend trading on the institution’s stock, failure to file certain reports with the SEC, the exchange on which the institution’s stock is traded notifying the institution that it is not in compliance with exchange requirements or that its stock is delisted, cohort default rates of at least 30 percent for its two most recent rates, certain significant fluctuations in Title IV funding, certain citations for failure to comply with state agency requirements, failure to comply with yet to be developed ED financial stress tests, high annual dropout rates, the institution being placed on probation or issued a show-cause or similar action by its accrediting agency, certain violations of loan agreements, expected or pending claims for borrower relief discharges, and certain
|
45
other events that ED might identify as reasonably likely to have a material adverse effect on the financial condition, business or results of operations of the institutions.
|
•
|
Require proprietary institutions with student loan repayment rates, as defined in the regulations, below prescribed thresholds to provide an ED-prepared warning to prospective and enrolled students, as well as placement of the warning on its website and in all promotional materials and advertisements.
|
|
•
|
Prohibit the use and reliance upon certain contractual provisions regarding dispute resolution processes, such as pre-dispute arbitration agreements or class action waivers, and require certain notifications, contract provisions and disclosures by institutions regarding students’ ability to participate in certain class action lawsuits or initiate certain lawsuits instead of through arbitration.
|
For a more extended summary of the current regulations, see “Business - Regulatory Environment - Regulation of Federal Student Financial Aid Programs - Defense to Repayment Regulations” and “Business - Regulatory Environment - Financial Responsibility Regulations” included elsewhere in this Report on Form 10-K. The current regulations had a general effective date of July 1, 2017, which was delayed until July 1, 2019 by ED action that was subsequently invalidated by federal court orders as of October 16, 2018. ED published a notice of proposed rulemaking in the Federal Register on July 31, 2018 to amend these regulations, but announced that final regulations would not be published until after November 1, 2018. Accordingly, any final regulations that ED may publish after November 1, 2018 and prior to November 1, 2019 typically would not take effect until July 1, 2020 unless ED is able to establish an earlier date for implementation of the regulations. For a more extended summary of the proposed rules, see “Business - Regulatory Environment - Regulation of Federal Student Aid Programs - Defense to Repayment Regulations.” On October 15, 2018, ED also published a notice in the Federal Register announcing its intent to establish a negotiated rulemaking committee and three subcommittees to develop proposed regulations related to several matters. For a more extended summary of the topics expected to be negotiated, see “Business - Regulatory Environment - Regulation of Federal Student Aid Programs - Accreditation and Academic Definitions.”
We cannot provide any assurances as to the timing, content or ultimate effective date of any such regulations.
We have devoted significant effort to understanding the effects of these regulations on our business and to developing compliant solutions that are also congruent with our business, culture and mission to serve our students and industry relationships. However, the solutions related to implementation and compliance with these final rules, including, but not limited to, cash management, compensation, gainful employment and defense to repayment, may have a material adverse effect on the manner in which we conduct our business, our student populations and the nature of our programs and could have a material adverse effect on our cash flows, results of operations and financial condition. Interpretation of the regulations is subject to change if ED provides further guidance and clarification. The solutions may require further analysis based on the uncertainty noted above and any additional interpretive guidance that is provided. Existing or future understandings could be different from ED’s interpretations and thus lead to repayments, restrictions, fines or litigation.
The loss of funds from Veterans' Benefits programs could materially and adversely affect our business.
To participate in veterans' benefits programs, including the Post-9/11 GI Bill, the Montgomery GI Bill, the REAP, and VA Vocational Rehabilitation, an institution must comply with certain requirements established by the VA. If we fail to comply with these requirements, we could lose our eligibility to participate in veterans' benefits programs, which could reduce our student population. For additional information regarding this activity, see “Business - Regulatory Environment - Other Federal and State Programs - Veterans' Benefits” included elsewhere in this Report on Form 10-K.
46
Other considerations which could impact the funding we receive from veterans' benefits programs include the following:
|
•
|
Access to military installations.
Our access to military installations for student recruitment has become highly restricted due to the changes described in “Business - Regulatory Environment - Other Federal and State Programs” included elsewhere in this Report on Form 10-K. Restrictions on access necessary to continue to develop awareness of our programs with this population could reduce our enrollments.
|
|
•
|
90/10 rule changes.
Multiple legislative proposals have been introduced in Congress that would increase the requirements of the 90/10 Rule, such as reducing the 90% maximum under the rule to 85% and/or including military and veteran funding in the 90% portion of the calculation. Implementation of these proposals could have a negative impact on our 90/10 ratio, which could have a negative impact on our eligibility to participate in Title IV Programs. If any of our institutions loses eligibility to participate in Title IV Programs, such a loss would adversely affect our students’ access to Title IV Program funds they need to pay their educational expenses, which could reduce our student population and would have a material adverse effect on our cash flows, results of operations and financial condition.
|
|
•
|
Funding for veterans' benefits programs.
Funding for veterans' benefits programs is dependent upon Congressional appropriations. If appropriations are not maintained at the current level, or if an extended government shutdown were to occur, the VA might not be able to continue funding veterans' benefits.
|
|
•
|
State Approving Agencies.
The VA shares responsibility for VA benefit approval and oversight with designated SAAs. SAAs play a critical role evaluating institutions and their programs to determine if they meet VA benefit eligibility requirements. Processes and approval criterion as well as interpretation of applicable requirements can vary from state to state. Therefore, approval in one state does not necessarily result in approval in all states. If we are unable to secure approvals in one or more states, if the process for obtaining an approval takes significant time or if our approval is revoked, we could be required to alter the delivery methodology or structure of the program or experience delays in or the loss of a portion of VA funding, or could be required to return a portion of the funding received. Students receiving VA funding may not be able to receive the full benefit of our Automotive and Diesel Technology II curricula methodology, which could reduce our enrollments and have a material adverse effect on our cash flows, results of operations and financial condition.
|
Any loss of funds from veterans' benefits programs could reduce our student population and have a material adverse effect on our cash flows, results of operations and financial condition.
Congress may change the law or reduce funding for or place restrictions on the use of funds received through Title IV Programs, which could reduce our student population, revenues and/or profit margin.
Congress periodically revises the HEA and other laws, and enacts new laws, governing Title IV Programs and annually determines the funding level for each Title IV Program, and may make changes in the laws at any time. Congress most recently reauthorized the HEA in 2008, is actively working on another HEA reauthorization and is expected to revise and reauthorize the HEA, but it is unlikely that reauthorization will occur in 2018 and uncertain when the process will be completed. Any action by Congress that significantly reduces funding for Title IV Programs or the ability of our schools or students to receive funding through these programs or places restrictions on the use of funds received by an institution through these programs could reduce our student population and revenues. Such action may occur during HEA reauthorization, or such action could also occur as part of separate technical amendments to the HEA or during Congress' annual budget and appropriations cycle.
Congressional action may also require us to modify our practices in ways that could increase administrative costs, reduce the ability of students to finance their education at our schools, and materially decrease student enrollment and result in decreased profitability.
47
Continued Congressional examination of the for-profit education sector could result in legislation or further ED rulemaking restricting Title IV Program participation by for-profit schools in a manner that materially and adversely affects our business.
Congress has historically focused on for-profit education institutions, specifically regarding participation in Title IV Programs and U.S. DOD oversight of tuition assistance for military service members attending for-profit colleges. For a description of additional information regarding this activity, see “Business - Regulatory Environment - Regulation of Federal Student Financial Aid Programs - Congressional Action” included elsewhere in this Report on Form 10-K.
Continued Congressional activity could result in the enactment of more stringent legislation by Congress, further rulemakings affecting participation in Title IV Programs and other governmental actions, increasing regulation of the for-profit sector. Action by Congress may also increase our administrative costs and require us to modify our practices in order for our institutions to comply with Title IV Program requirements. In addition, concerns generated by this Congressional activity may adversely affect enrollment in for-profit educational institutions such as ours. Any laws that are adopted that limit our or our students’ participation in Title IV Programs or in programs to provide funds for active duty service members and veterans or the amount of student financial aid for which our students are eligible, or any decreases in enrollment related to the Congressional activity concerning this sector, could have a material adverse effect on our cash flows, results of operations and financial condition.
Our business could be harmed if we experience a disruption in our ability to process student loans under the Federal Direct Loan Program.
Because all Title IV Program student loans other than Perkins loans are now processed under the DL program, any processing disruptions by ED may impact our students’ ability to obtain student loans on a timely basis. If we experience a disruption in our ability to process student loans through the DL program, either because of administrative challenges on our part or the inability of ED to process the increased volume of loans through the DL program on a timely basis, our cash flows, results of operations and financial condition could be adversely and materially affected.
Government and regulatory agencies and third parties may conduct compliance reviews, bring claims or initiate litigation against us.
Because we operate in a highly regulated industry, we are subject to compliance reviews and claims of noncompliance by government agencies, regulatory agencies and third parties alleging noncompliance with applicable standards. These compliance reviews and claims could also result from our notification to an agency or third party based upon our own internal compliance review. We are also subject to various lawsuits, investigations and claims, covering a wide range of matters, including, but not limited to, alleged violations of federal and state laws, false claims made to the federal government and routine employment matters. While we are committed to strict compliance with all applicable laws, regulations and accrediting standards, if the results of government, regulatory or third party reviews or proceedings are unfavorable to us, or if we are unable to defend successfully against lawsuits or claims, we may be required to pay monetary damages or be subject to fines, limitations, loss of regulatory approvals or Title IV Program funding or other federal and state funding, injunctions or other penalties. We could also incur substantial legal costs in excess of our insurance coverage. Even if we adequately address issues raised by an agency review or successfully defend a lawsuit or claim, we may have to divert significant financial and management resources from our ongoing business operations to address issues raised by those reviews or defend those lawsuits or claims. Additionally, given the significant public scrutiny being placed on the sector, numerous state attorneys general have initiated investigations either of the operation of the for-profit schools in their state or of particular institutions operating in that state. Changes occurring at the federal level, as well as our
48
financial performance in recent years, may spur further action or additional reporting requirements by state attorneys general, congressional leadership or state licensing bodies.
We cannot predict the ultimate outcome of unsettled matters, and we may incur significant defense costs and other expenses in connection with them in excess of our insurance coverage related to these matters. We may be required to pay substantial damages, settlement costs or fines or penalties. Such costs and expenses could have a material adverse effect on our business, cash flows, results of operations and financial condition. An adverse outcome in any of these matters could also materially and adversely affect our licenses, accreditation and eligibility to participate in Title IV programs.
Our business and stock price could be adversely affected as a result of regulatory investigations of, or actions commenced against, us or other companies in our industry.
The operations of companies in the education and training services industry, including UTI, are subject to intense regulatory scrutiny. In some cases, allegations of wrongdoing on the part of such companies have resulted in formal or informal investigations by the U.S. Department of Justice, the SEC, state governmental agencies, ED and other federal agencies. These allegations have attracted adverse media coverage and have been the subject of legislative hearings and regulatory actions at both the federal and state levels, focusing not only on the individual schools but in some cases on the for-profit postsecondary education sector as a whole. These investigations of or regulatory actions against specific companies in the education and training services industry could have a negative impact on our industry as a whole and on our stock price. Furthermore, the outcome of such investigations and any accompanying adverse publicity could negatively affect student enrollment and heighten the risk of class action lawsuits against us, which could have a material adverse effect on our cash flows, results of operations and financial condition.
Changes in the state regulatory environment, including budget constraints and increased regulatory requirements, may affect our ability to obtain and maintain necessary authorizations or approvals from those states to conduct or change our operations.
Due to state budget constraints and changes in the regulatory environment in some of the states in which we operate, it is possible that some states may reduce the number of employees in, or curtail the operations of, the state education agencies that authorize our schools. A delay or refusal by any state education agency in approving any changes in our operations that require state approval, such as the opening of a new campus, the introduction of new programs or the revision of existing programs, a change of control or the hiring or placement of new admissions representatives, could prevent us from making such changes or delay our ability to make such changes, or could require substantial additional costs to accommodate such delay. State education agencies that authorize our schools continue to revise and/or issue new regulations requiring significant additional reporting and monitoring of student outcomes. Additionally, state education agencies may request additional information or supplemental reporting as a result of our recent financial performance.
The regulations and reporting requirements may lengthen the time to obtain necessary state approvals and require us to modify our operations in order to comply with the requirements. This could impose substantial additional costs on our institutions, which could have a material adverse effect on our cash flows, results of operations and financial condition.
Moreover, some states have added regulations that impose additional requirements on our schools and increase the complexity of existing requirements. For example, some states, such as California and Massachusetts, have added requirements for institutions to report institutional data to current and prospective students. California has added requirements to its existing rules for calculating job placement rates for graduates that are more exacting and difficult to substantiate. Other states have added, or may add in the future, new or more complex requirements applicable to our institutions. These requirements could create new compliance challenges and impose substantial
49
additional costs on our institutions which could have a material adverse effect on our cash flows, results of operations and financial condition.
Budget constraints in states that provide state financial aid to our students could reduce the amount of such financial aid that is available to our students, which could reduce our student population and negatively affect our 90/10 Rule calculation and other compliance metrics.
A significant number of states are facing budget constraints that are causing them to reduce state appropriations in a number of areas. Many of those states provide financial aid to our students. These and other states may decide to reduce or redirect the amount of state financial aid that they provide to students, but we cannot predict how significant any of these reductions will be or how long they will last. If the level of state funding available to our students decreases and our students are not able to secure alternative sources of funding, our student population could be reduced, which could have a material adverse effect on our profitability. The decrease or loss of this funding could also negatively impact our DE rates under the gainful employment rule, as well as our cohort default rates. Additionally, loss of state funding would negatively impact our 90/10 Rule calculation and the cost of our compliance with the 90/10 Rule, as this funding is counted in the non-Title IV Program funds portion of the ratio, and such loss would drive up the percentage of revenue attributable to Title IV Programs.
If we acquire an institution that participates in Title IV Programs or open an additional location, one or more of our regulators could decline to approve the acquired institution and/or additional location, or could impose material conditions or restrictions, which could prevent or limit the ability of the acquired institution and/or additional location to participate in Title IV Programs and, in turn, impair our ability to operate the acquired institution and/or the additional location as planned or to realize the anticipated benefits from the acquisition of that institution and/or opening of the additional location.
If we acquire an institution that participates in Title IV Program funding and/or open an additional location, we must obtain approval from ED and applicable state education agencies and accrediting commissions in order for the institution and/or additional location to be able to operate and participate in Title IV Programs. While we would attempt to ensure we will be able to receive such approval prior to acquiring an institution and/or opening an additional location, approval may be withheld. An acquisition can result in the temporary suspension of the acquired institution’s participation in Title IV Programs and opening an additional location can result in a delay of the campus’ participation in Title IV Programs unless we submit a timely and materially complete application for approval of the acquisition or the opening of the new location. Upon an acquisition, an institution must apply for a temporary certification from ED that remains in effect on a month-to-month basis while ED reviews the application and subject to the institution timely submitting required documentation to ED. If we were unable to timely establish or re-establish the state authorization, accreditation or ED certification of the acquired institution or obtain approval for the new location, our ability to operate the acquired institution and/or open the additional location as planned or to realize the anticipated benefits from the acquisition of that institution and/or the opening of the additional location could be impaired.
Further, ED and applicable state education agencies and accrediting agencies could impose material conditions or restrictions on us and the acquired institution and/or the additional location, including, but not limited to, a material letter of credit, limitations or prohibitions on the ability to add new campuses or add or change educational programs, placement of the institution on the heightened cash monitoring or reimbursement method of payment and reporting and notification requirements. Additionally, an acquired institution may have known or unknown instances of noncompliance with federal, state or accrediting agency requirements, including, but not limited to, noncompliance with gainful employment requirements or with requirements included in the defense to repayment regulations that could result in liabilities, sanctions, or material conditions or restrictions that we may inherit by acquiring the institution. Although we attempt to conduct thorough due diligence of institutions that we intend to acquire, our due diligence efforts may be unsuccessful and fail to identify noncompliance or other facts that could result in liabilities, sanctions, or material conditions or restrictions. The imposition of liabilities, sanctions, or material conditions or restrictions by one or more regulators could impair our ability to operate the
50
acquired institution and/or open the additional location as planned or to realize the anticipated benefits from the acquisition of that institution and/or the opening of the additional location.
If regulators do not approve or delay their approval of transactions involving a change of control of our company or any of our schools, our ability to participate in Title IV Programs may be impaired.
If we or any of our schools experience a change of control under the standards of applicable federal and state agencies, our accrediting commission or ED, we or the affected schools must seek the approval of the relevant regulatory agencies. These agencies do not have uniform criteria for what constitutes a change of control. Transactions or events that constitute a change of control include significant acquisitions or dispositions of our common stock or significant changes in the composition of our board of directors. Some of these transactions or events may be beyond our control. Our failure to obtain, or a delay in receiving, approval of any change of control from ED, our accrediting commission or any state in which our schools are located would impair our ability to participate in Title IV Programs, which would have a material adverse effect on our cash flows, results of operations and financial condition. Our failure to obtain, or a delay in obtaining, approval of any change of control from any state in which we do not have a school but in which we recruit students could require us to suspend our recruitment of students in that state until we receive the required approval. The potential adverse effects of a change of control with respect to participation in Title IV Programs could influence future decisions by us and our stockholders regarding the sale, purchase, transfer, issuance or redemption of our stock.
Risks Related to Our Business
If we fail to maintain our existing capacity, we may experience a deterioration of our profitability and operating margins.
We have underutilized capacity at a number of our campuses. Our ongoing efforts to fill or reduce existing capacity may strain our management, operations, employees or other resources. We may not be able to maintain our current capacity utilization rates, effectively manage our operations or achieve planned capacity utilization on a timely or profitable basis. If we are unable to improve our underutilized capacity, we may experience operating inefficiencies at a level that would result in higher than anticipated costs, which would adversely affect our profitability and operating margins.
Competition could decrease our market share and create tuition pricing concerns.
The postsecondary education market is highly competitive. We continue to experience a high level of competition for higher quality students not only from similar programs, but also from the overall employment market and the military. Prospective students may choose to forego additional education and enter the workforce directly, especially during periods when the unemployment rate declines or remains stable as it has in recent years. This may include employment with our industry partners or with other manufacturers and employers of our graduates. Some traditional public and private colleges and universities and community colleges, as well as other private career-oriented schools, offer programs that may be perceived by students to be similar to ours.
W
e compete with local community colleges for students seeking programs that are similar to ours, mainly due to local accessibility, low tuition rates and in certain cases free tuition. Public institutions are generally able to charge lower tuition than our schools, due in part to government subsidies and other financial sources not available to for-profit schools. Additionally, the military often recruits or retains potential students when branches of the military offer enlistment or re-enlistment bonuses.
We may limit tuition increases or increase spending in response to competition in order to retain or attract students or pursue new market opportunities; however, if we cannot effectively respond to competitor changes, it could reduce our enrollments and our student populations. We cannot be sure that we will be able to compete successfully against current or future competitors or that competitive pressures faced by us will not adversely affect our market share, revenues and operating margin.
51
Macroeconomic conditions, particularly low unemployment rates, could adversely affect our business.
We believe that our enrollment is affected by changes in economic conditions, although the nature and magnitude of this effect are uncertain and may change over time. Enrollment tends to be counter cyclical, and the strength or weakness of the economy directly impacts us. During periods when the unemployment rate declines or remains stable, prospective students have more employment options and recruiting new students has traditionally been more challenging. Affordability concerns associated with increased living expenses, relocation expenses and the availability of full- and part-time jobs for students attending classes have made it more challenging for us to attract and retain students. Additionally, the 2007-2009 recession had a negative impact on price sensitivity and on the ability and willingness of students and their families to incur debt.
Conversely, an increase in the unemployment rate and weaker macroeconomic conditions could reduce the willingness of employers to sponsor educational opportunities for their employees, and affect the ability of our students to find employment in the industries that we serve, any of which could have a material adverse effect on our cash flows, results of operations and financial condition.
Adverse market conditions for consumer and federally guaranteed student loans could negatively impact the ability of borrowers with little or poor credit history, such as many of our students, to borrow the necessary funds at an acceptable interest rate. These events could adversely affect the ability or willingness of our former students to repay student loans, which could increase our student loan cohort default rate and require increased time, attention and resources to manage these defaults.
Our financial performance depends in part on our ability to continue to develop awareness and acceptance of our programs among high school graduates, military personnel and adults seeking advanced training.
The awareness of our programs among high school graduates, military personnel and working adults seeking advanced training is critical to the continued acceptance and growth of our programs. Our inability to continue to develop awareness of our programs could reduce our enrollments, which could have a material adverse effect on our cash flows, results of operations and financial condition. The following are some of the factors that could prevent us from successfully marketing our programs:
|
•
|
availability of funding sources acceptable to our students;
|
|
•
|
recruitment of veterans or other potential students without formal education by our industry partners and other manufacturers;
|
|
•
|
our failure to maintain or expand our brand or other factors related to our marketing or advertising practices;
|
|
•
|
diminished access to high school student populations, including school district limitations on access to students by for-profit institutions;
|
|
•
|
reduced access to military bases and installations;
|
|
•
|
our inability to maintain relationships with automotive, diesel, collision repair, motorcycle and marine manufacturers and suppliers; and
|
|
•
|
student dissatisfaction with our programs and services.
|
52
Failure on our part to maintain and expand existing industry relationships and develop new industry relationships with our industry customers could impair our ability to attract and retain students.
We have extensive industry relationships that we believe afford us significant competitive strength and support our market leadership. These relationships enable us to support enrollment in our core programs by attracting students through brand name recognition and the associated prospect of high-quality employment opportunities. Additionally, these relationships allow us to diversify funding sources, expand the scope and increase the number of programs we offer and reduce our costs and capital expenditures due to the fact that, pursuant to the terms of the underlying contracts with OEMs, we provide a variety of specialized training programs and typically do so using tools, equipment and vehicles provided by the OEMs. These relationships also provide additional incremental revenue opportunities from training the employees of our industry customers. Our success depends in part on our ability to maintain and expand our existing industry relationships and to enter into new industry relationships. Certain of our existing industry relationships, including those with American Honda Motor Company, Inc.; Mercury Marine, a division of Brunswick Corporation; Volvo Penta of the Americas, Inc. and Yamaha Motor Corporation, USA,
are not memorialized in writing and are based on verbal understandings. As a result, the rights of the parties under these arrangements are less clearly defined than they would be had they been in writing. Additionally, certain of our written agreements may be terminated without cause by the OEM. Finally, certain of our existing industry relationship agreements expire within the next six months. We are currently negotiating to renew these agreements and intend to renew them to the extent we can do so on satisfactory terms. The reduction or elimination of, or failure to renew any of our existing industry relationships, or our failure to enter into new industry relationships, could impair our ability to attract and retain students, require additional capital expenditures or increase expenses and have a material adverse effect on our cash flows, results of operations and financial condition.
Our success depends in part on our ability to update and expand the content of existing programs and develop and integrate new programs in a cost-effective manner and on a timely basis.
Prospective employers of our graduates demand that their entry-level employees possess appropriate technological skills. These skills are becoming more sophisticated in line with technological advancements in the automotive, diesel, collision repair, motorcycle and marine industries. Accordingly, educational programs at our schools must keep pace with those technological advancements. Additionally, the method used to deliver curriculum has evolved to include online delivery. The updates to our existing programs and the development of new programs, and changes in the method in which we deliver them, may not be accepted by our students, prospective employers or the technical education market. Even if we are able to develop acceptable new programs, we may not be able to introduce these new programs as quickly as the industries we serve require or as quickly as our competitors. If we are unable to adequately respond to changes in market requirements due to unusually rapid technological changes or other factors, our ability to attract and retain students could be impaired and our graduate employment rates could suffer.
Additionally, if we are unable to address and respond to requirements for new or updated curricula such as training instructors to teach the curricula, obtaining the appropriate equipment to teach the curricula to our students, or obtaining the appropriate regulatory approvals, we may not be able to successfully roll out the curricula to our campuses in a timely and cost-effective manner. If we are not able to effectively and efficiently integrate curricula, this could have a material adverse effect on our cash flows, results of operations and financial condition.
Our proprietary loan program could have a negative effect on our results of operations.
Our proprietary loan program enables students who have utilized all available government-sponsored or other financial aid and have not been successful in obtaining private loans from other financial institutions, for independent students, or PLUS loans, for dependent students, to borrow a portion of their tuition if they meet certain criteria.
53
Under our proprietary loan program, the bank originates loans for our students who meet our specific credit criteria with the related proceeds to be used exclusively to fund a portion of their tuition. We then purchase all such loans from the bank at least monthly and assume all the related credit and collection risk. See Note 2 of the notes to our consolidated financial statements within Part IV of this Report on Form 10-K for further discussion of activity under our proprietary loan program.
Factors that may impact our ability to collect these loans include the following: current economic conditions; compliance with laws applicable to the origination, servicing and collection of loans; the quality of our loan servicers’ performance; a decline in graduate employment opportunities and the priority that the borrowers under this loan program attach to repaying these loans as compared to other obligations, particularly students who did not complete or were dissatisfied with their programs of study.
The portion of a student's tuition revenue related to the proprietary loan program is considered a form of variable consideration. We estimate the amount we ultimately expect to collect from the portion of tuition that is funded by the proprietary loan program, resulting in a note receivable. The estimated amount is determined at the inception of the contract, and we recognize the related revenue as the student progresses through school. Each reporting period, we update our assessment of the variable consideration associated with the proprietary loan program. Estimating the collection rate requires significant management judgment. If we are unable to accurately assess the variable consideration, our revenues and profitability may be adversely impacted.
Federal, state and local laws and general legal and equitable principles relating to the protection of consumers can apply to the origination, servicing and collection of the loans under our proprietary loan program. Any violation of various federal, state or local laws, including, in some instances, violations of these laws by parties not under our control, may result in losses on the loans or may limit our ability to collect all or part of the principal or interest on the loans. This may be the case even if we are not directly responsible for the violations by such parties.
Our proprietary loan program may also be subject to oversight by the CFPB, which could result in additional reporting requirements or increased scrutiny. Other proprietary postsecondary institutions have been subject to information requests from the CFPB with regard to their private student loan programs. The possibility of litigation, and the associated cost, are risks associated with our proprietary loan program. At least two proprietary education institutions have been subject to lawsuits under the Consumer Financial Protection Act of 2010; the institutions are accused of having unfair private student loan programs and of allegedly engaging in certain abusive practices, including interfering with students' ability to understand their debt obligations and failing to provide certain material information.
Changes in laws or public policy could negatively impact the viability of our proprietary loan program and cause us to delay or suspend the program. Additionally, depending on the terms of the loans, state consumer credit regulators may assert that our activities in connection with our proprietary loan program require us to obtain one or more licenses, registrations or other forms of regulatory approvals, any of which may not be able to be obtained in a timely manner, if at all. All of these factors could result in our proprietary loan program having a material adverse effect on our cash flows, results of operations and financial condition.
We rely on third parties to originate, process and service loans under our proprietary loan program. If these companies fail or discontinue providing such services, our business could be harmed.
A state chartered bank with a small market capitalization originates loans under our proprietary loan program. If the bank no longer provides service under the contract, we do not currently have an alternative bank to fulfill the demand. There are a limited number of banks that are willing to participate in a program such as our proprietary loan program. The time it could take us to replace the bank could result in an interruption in the loan origination process, which could result in a decrease in our student populations. Furthermore, a single company
54
processes loan applications and services the loans under our proprietary loan program. There is a 90-day termination clause in the contract under which they provide these services. If this company were to terminate the contract, we could experience an interruption in loan application processing or loan servicing, which could result in a decrease in our student populations.
We rely heavily on the reliability and performance of an internally developed student management and reporting system, and any difficulties in maintaining this system may result in service interruptions, decreased customer service or increased expenditures.
The software that underlies our student management and reporting has been developed primarily by our own employees. The reliability and continuous availability of this internal system and related integrations are critical to our business. Any interruptions that hinder our ability to timely deliver our services, or that materially impact the efficiency or cost with which we provide these services, or our ability to attract and retain computer programmers with knowledge of the appropriate computer programming language, would adversely affect our reputation and profitability and our ability to conduct business and prepare financial reports. Additionally, many of the software systems we currently use will need to be enhanced over time or replaced with equivalent commercial products, either of which could entail considerable effort and expense.
System disruptions and security threats to our computer networks, including breach of the personal information we collect, could have a material adverse effect on our business and our reputation.
Our computer systems as well as those of our service providers are vulnerable to interruption, malfunction or damage due to events beyond our control, including malicious human acts committed by foreign or domestic persons, natural disasters, and network and communications failures. We have established a written data breach incident response policy, which we test informally and formally at least annually. Additionally, we periodically perform vulnerability self-assessments and engage service providers to perform independent vulnerability assessments and penetration tests. However, despite network security measures, our servers and the servers at our service providers are potentially vulnerable to physical or electronic unauthorized access, computer hackers, computer viruses, malicious code, organized cyber attacks and other security problems and system disruptions. Increasing socioeconomic and political instability in some countries has heightened these risks. Despite the precautions we and our service providers have taken, our systems may still be vulnerable to these threats. A user who circumvents security measures could misappropriate proprietary information or cause interruptions or malfunctions in operations.
Additionally, the personal information that we collect subjects us to additional risks and costs that could harm our business and our reputation. We collect, retain and use personal information regarding our students and their families and our employees, including personally identifiable information, tax return information, financial data, bank account information and other data. Although we employ various network and business security measures to limit access to and use of such personal information, we cannot guarantee that a third party will not circumvent such security measures, resulting in the breach, loss or theft of the personal information of our students and their families and our employees. Possession and use of personal information in our operations also subjects us to legislative and regulatory burdens that could restrict our use of personal information and require notification of data breaches. A violation of any laws or regulations relating to the collection, retention or use of personal information could also result in the imposition of fines or lawsuits against us.
Sustained or repeated system failures or security breaches that interrupt our ability to process information in a timely manner or that result in a breach of proprietary or personal information could have a material adverse effect on our operations and our reputation. Although we maintain insurance in respect of these types of events, available insurance proceeds may not be adequate to compensate us for damages sustained due to these events.
55
We may not be able to retain our key personnel or hire and retain the personnel we need to sustain and grow our business.
Our success to date has depended, and will continue to depend, largely on the skills, efforts and motivation of our executive officers who generally have significant experience with our company and within the technical education industry. Our success also depends in large part upon our ability to attract and retain highly qualified faculty, campus presidents, administrators and corporate management. Due to the nature of our business and our operating results in recent years, we face significant competition in the attraction and retention of personnel who possess the skill sets that we seek. The for-profit education sector is under significant regulatory and government scrutiny, which may make it more difficult to attract and retain talent. Additionally, key personnel may leave us and subsequently compete against us. Because we do not currently carry “key man” life insurance, the loss of the services of any of our key personnel, or our failure to attract and retain other qualified and experienced personnel on acceptable terms, could impair our ability to successfully manage our business.
If we are unable to hire, retain and continue to develop and train our admissions representatives, the effectiveness of our student recruiting efforts would be adversely affected.
In order to support revenue growth and student enrollment, we need to hire and train new admissions representatives, as well as retain and continue to develop our existing admissions representatives, who are our employees dedicated to student recruitment. Our ability to develop a strong admissions representative team may be affected by a number of factors, including the following:
|
•
|
the competition we face from other companies in hiring;
|
|
•
|
consumer trends causing certain sectors (other than for-profit, postsecondary education) to experience significant growth in less regulated environments with the potential to offer higher compensation;
|
|
•
|
our ability to compensate admissions representatives while remaining compliant with ED regulations related to incentive compensation;
|
|
•
|
our ability to assimilate and motivate our admissions representatives;
|
|
•
|
our ability to effectively train our admissions representatives;
|
|
•
|
the length of time it takes new admissions representatives to become productive; and
|
|
•
|
our ability to effectively manage a multi-location educational organization.
|
If we are unable to hire, develop or retain quality admissions representatives, the effectiveness of our student recruiting efforts would be adversely affected.
Our financial performance depends in part on our ability to implement our strategic transformation plan.
We announced a strategic transformation plan in March 2018 that is intended to drive new student starts and completions and to enhance student success. An improvement in financial performance in the time frame we anticipate could be impacted by macroeconomic conditions and execution challenges, including, among others, identification and implementation of effective strategies in marketing, admissions and support services, our ability to control costs and our ability to integrate new personnel. Our ongoing efforts to implement the strategic transformation plan may strain our management, operations, employees or other resources. If we do not effectively implement the strategies, it may not create the anticipated financial benefits.
56
Failure on our part to effectively identify, establish and operate additional schools or campuses could reduce our ability to implement our growth strategy.
As part of our business strategy, we anticipate opening and operating new schools or campuses. Establishing new schools or campuses poses unique challenges and requires us to make investments in management and capital expenditures, incur marketing expenses and devote other resources that are different, and in some cases greater, than those required with respect to the operation of acquired schools. Accordingly, when we open new schools, initial investments could reduce our profitability. To open a new school or campus, we would be required to obtain appropriate state and accrediting commission approvals, which may be conditioned or delayed in a manner that could significantly affect our growth plans. Additionally, to be eligible for Title IV Program funding, a new school or campus would have to be certified by ED. We cannot be sure that we will be able to identify suitable expansion opportunities to maintain or accelerate our current growth rate or that we will be able to successfully integrate or profitably operate any new schools or campuses. Our failure to effectively identify, establish, license, accredit, obtain necessary approvals and manage the operations of newly established schools or campuses could slow our growth and make any newly established schools or campuses more costly to operate than we have historically experienced.
We may be unable to successfully complete or integrate future acquisitions.
We may consider selective acquisitions in the future. We may not be able to complete any acquisitions on favorable terms or, even if we do, we may not be able to successfully integrate the acquired businesses into our business. Integration challenges include, among others, regulatory approvals, significant capital expenditures, assumption of known and unknown liabilities, our ability to control costs and our ability to integrate new personnel. The successful integration of future acquisitions may also require substantial attention from our senior management and the senior management of the acquired schools, which could decrease the time that they devote to the day-to-day management of our business. If we do not successfully address risks and challenges associated with acquisitions, including integration, future acquisitions could harm, rather than enhance, our operating performance. Additionally, if we consummate an acquisition, our capitalization and results of operations may change significantly. A future acquisition could result in the incurrence of debt and contingent liabilities, an increase in interest expense, amortization expenses, goodwill and other intangible assets, charges relating to integration costs or an increase in the number of shares outstanding. In addition, our acquisition of a school is a change of ownership of that school, which may result in the temporary suspension of that school’s participation in federal student financial aid programs until it obtains ED’s approval. These results could have a material adverse effect on our cash flows, results of operations and financial condition or result in dilution to current stockholders.
We have recorded a significant amount of goodwill, which may become impaired and subject to a write-down.
Goodwill represents the excess of the cost of an acquired business over the estimated fair values of the assets acquired and liabilities assumed. Goodwill is reviewed at least annually for impairment, which might result from the deterioration in the operating performance of the acquired business, adverse market conditions, adverse changes in the applicable laws or regulations and a variety of other circumstances. Any resulting impairment charge is recognized as an expense in the period in which impairment is identified.
Our goodwill resulted primarily from the acquisition of our motorcycle and marine education business in 1998, and we recorded $8.2 million related to the goodwill allocated to our MMI Orlando, Florida campus that provides the related educational programs. Additionally, we recorded $0.8 million of goodwill related to the acquisition of BrokenMyth Studios, LLC (BMS) in February 2016.
During the year ended September 30, 2018, due to the deteriorating operating performance of BMS and a decline in projected operating performance identified during our mid-year budget review, we completed an interim test for impairment of the reporting unit. At June 30, 2018, we determined that the carrying value of this reporting unit exceeded its fair value, indicating goodwill impairment existed. The result of our valuation indicated that there
57
was no remaining implied value attributable to goodwill in our BMS acquisition, and accordingly, we expensed all $0.8 million of the goodwill associated with that acquisition for the year ended September 30, 2018. Additionally, we determined that related definite-lived intangible assets were impaired, and we expensed the remaining $0.4 million remaining book value for the year ended September 30, 2018. Both impairment charges are included in our selling, general and administrative expenses in our condensed consolidated statement of loss. Our total recorded goodwill was $8.2 million as of September 30, 2018. We perform our annual goodwill impairment assessment during the fourth quarter of each fiscal year. Actual experience may differ from the amounts included in our assessment, which could result in impairment of our goodwill in the future.
During the year ended September 30, 2018, we utilized a discounted cash flow model that incorporated estimated future cash flows for the next five years and an associated terminal value to determine the fair value of our MMI Orlando, Florida campus. Key management assumptions included in the cash flow model included future tuition revenues, operating costs, working capital changes, capital expenditures and a discount rate. Based upon our annual assessments, we determined that our goodwill was not impaired as of September 30, 2018 and that impairment charges were not required.
Our principal stockholder owns a significant percentage of our capital stock, is able to influence certain corporate matters and could in the future gain substantial control over our company.
As of September 30,
2018
, Coliseum Capital Management, LLC and its affiliates (Coliseum) beneficially owned, in the aggregate, approximately 14.4% of our outstanding common stock and 100% of our outstanding Series A Preferred Stock, which votes on an as-converted basis subject to a voting cap, as described below. The voting power of Coliseum, including the common stock and the as-converted preferred stock with the voting cap, was approximately 18.5% as of September 30,
2018
. Shares of Series A Preferred Stock are convertible to common stock at any time at the option of the holder upon regulatory approval.
Pursuant to the Certificate of Designations of Series A Preferred Stock (Certificate of Designations), the Series A Preferred Stock may be converted into common stock, subject to certain conditions. Until stockholder approval, as required under the listing standards of the NYSE, and approval of the applicable educational regulatory agencies (Required Approvals), including ED, is obtained, the Series A Preferred Stock beneficially owned by the holders of Series A Preferred Stock and their respective affiliates may only be converted into common stock to the extent that, after giving effect to such conversion, the amount of common stock the holder thereof together with its affiliates would beneficially own pursuant to such conversion, in the aggregate, is less than or equal to 4.99% of the common stock outstanding on the date of issuance of the Series A Preferred Stock (Conversion Cap). The Conversion Cap will not apply to the Series A Preferred Stock once we obtain the Required Approvals.
Holders of shares of Series A Preferred Stock are entitled to vote with the holders of shares of common stock and any other class or series similarly entitled to vote with the holders of common stock and not as a separate class, at any annual or special meeting of stockholders of our company, and may act by written consent in the same manner as the holders of common stock, on an as-converted basis. Prior to the receipt of the Required Approvals, the Series A Preferred Stock beneficially owned by each holder of Series A Preferred Stock, or any of its respective affiliates may only be voted to an extent not to exceed 4.99% of the aggregate voting power of all of our voting stock outstanding at the close of business on the issue date (Voting Cap). Additionally, a majority of the voting power of the Series A Preferred Stock must approve certain significant actions of our company, such as (i) amendments to our Certificate of Incorporation or bylaws in a manner adverse to the rights, preferences, privileges or voting powers of the Series A Preferred Stock, (ii) the creation or issuance of a series of stock, or other security convertible into a series of stock, with equal or greater rights than the Series A Preferred Stock, (iii) the issuance of equity securities, or securities convertible into equity, at a price that is 25% below fair market value at the time of issuance, (iv) subject to certain exceptions, the incurrence of indebtedness, (v) subject to certain exceptions, the sale or licensing of any material asset of our company, (vi) subject to certain exceptions, the consummation of acquisitions (of stock or assets), (vii) subject to certain exceptions, the payment of certain dividends or distributions with respect to a series of stock junior to the Series A Preferred Stock, (viii) the voluntary liquidation, dissolution
58
or winding-up of our company if the Series A Preferred Stock would not have the option to receive the liquidation preference then in effect upon such liquidation, dissolution or winding-up of our company or, (ix) subject to certain exceptions, any merger, consolidation, recapitalization, reclassification or other transaction in which substantially all of the common stock of our company is exchanged or converted into cash, securities or property and in which the holders of the Series A Preferred Stock shall not have the option to receive the full liquidation preference as a result of that transaction.
In the event that the Required Approvals are obtained in the future, Coliseum could gain substantial control over our company. For example, if the Required Approvals had been obtained as of September 30,
2018
, Coliseum’s aggregate voting power would have increased from 18.5% to 53.2%. As a consequence, Coliseum would be able to control matters requiring stockholder approval, including the election of directors. The interests of Coliseum may not always coincide with the interests of our other stockholders. For instance, this concentration of ownership may have the effect of delaying or preventing a change of control of our company otherwise favored by our other stockholders and could depress our stock price. Coliseum has the right to request that we seek the Required Approvals at any time.
If we are required to or elect to obtain the Required Approvals and if such approvals are not obtained within the 120 day time period set forth in the Certificate of Designations, the dividend rates with respect to the Cash Dividend and Accrued Dividend will be increased by 5.0% per year, not to exceed a maximum of 14.5% per year, subject to downward adjustment on obtaining the foregoing approvals.
Seasonal and other fluctuations in our results of operations could adversely affect the trading price of our common stock.
In reviewing our results of operations, you should not focus on quarter-to-quarter comparisons. Our results in any quarter may not indicate the results we may achieve in any subsequent quarter or for the full year. Our revenues normally fluctuate as a result of seasonal variations in our business, principally due to changes in total student population. Student population varies as a result of new student enrollments, graduations and student attrition. Historically, our schools have had lower student populations in our third fiscal quarter than in the remainder of our fiscal year because fewer students are enrolled during the summer months. Our expenses, however, do not generally vary at the same rate as changes in our student population and revenues and, as a result, such expenses do not fluctuate significantly on a quarterly basis. We expect quarterly fluctuations in results of operations to continue as a result of seasonal enrollment patterns. Such patterns may change, however, as a result of acquisitions, new school openings, new program introductions and increased enrollments of adult students. Additionally, our revenues for our first fiscal quarter are adversely affected by the fact that we do not recognize revenue during the calendar year-end holiday break, which falls primarily in that quarter. These fluctuations may result in volatility or have an adverse effect on the market price of our common stock.
If we fail to maintain effective internal control over financial reporting, we may not be able to accurately report our financial results or prevent fraud. As a result, current and potential stockholders could lose confidence in our financial reporting, which would harm our business and the trading price of our stock.
Internal control over financial reporting is a process designed by or under the supervision of our principal executive and principal financial officer to provide reasonable assurance regarding the reliability of financial reporting and the preparation of financial statements for external purposes in accordance with accounting principles generally accepted in the United States of America. Our internal control structure is also designed to provide reasonable assurance that fraud would be detected or prevented before our financial statements could be materially affected.
Because of inherent limitations, our internal controls over financial reporting may not prevent or detect all misstatements. Additionally, projections of any evaluation of effectiveness to future periods are subject to the
59
risks that our controls may become inadequate as a result of changes in conditions or the degree of compliance with our policies and procedures may deteriorate.
If our internal control over financial reporting was not effective, our historical financial statements could require restatement, which could negatively impact our reputation and lead to a decline in our stock price.
None.
Campuses and Other Properties
The following sets forth certain information relating to our campuses and corporate headquarters:
|
Location
|
Brand
|
Approximate Square Footage
|
Leased or Owned
|
Lease Expiration Date
|
||||||
|
Campuses:
|
Arizona (Avondale)
|
UTI
|
265,700
|
Leased
|
June 2024
|
|||||
|
Arizona (Phoenix)
|
MMI
|
116,700
|
Leased
|
December 2022
|
||||||
|
New Jersey (Bloomfield)
|
UTI
|
108,000
|
Leased
|
December 2030
|
||||||
|
California (Long Beach)
|
UTI
|
142,000
|
Leased
|
August 2030
|
||||||
|
California (Rancho Cucamonga)
|
UTI
|
147,300
|
Leased
|
September 2031
|
||||||
|
California (Sacramento)
|
UTI
|
231,600
|
Leased
|
March 2056
|
||||||
|
Florida (Orlando)
|
UTI/MMI
|
272,800
|
Leased
|
August 2022
|
||||||
|
Illinois (Lisle)
|
UTI
|
170,200
|
Leased
|
December 2032
|
||||||
|
Massachusetts (Norwood)
|
UTI
|
227,500
|
Leased
|
October 2022
|
||||||
|
North Carolina (Mooresville)
|
NASCAR Tech
|
146,000
|
Leased
|
September 2022
|
||||||
|
Pennsylvania (Exton)
|
UTI
|
186,900
|
Leased
|
December 2020
|
||||||
|
Texas (Dallas/Ft. Worth)
|
UTI
|
95,000
|
Owned
|
N/A
|
||||||
|
Texas (Houston)
|
UTI
|
212,800
|
Owned/Leased*
|
December 2018*
|
||||||
|
Corporate Headquarters:
|
Arizona (Scottsdale)
|
Headquarters
|
53,200
|
Leased
|
December 2019
|
|||||
*We own 163,200 square feet and lease the remaining 50,500 square feet. We will continue to occupy the owned space after the 50,500 square feet lease expires in December 2018.
Many of the leases are renewable for additional terms at our option.
In the ordinary conduct of our business, we are periodically subject to lawsuits, demands in arbitrations, investigations, regulatory proceedings or other claims, including, but not limited to, claims involving current and former students, routine employment matters, business disputes and regulatory demands. When we are aware of a claim or potential claim, we assess the likelihood of any loss or exposure. If it is probable that a loss will result and the amount of the loss can be reasonably estimated, we would accrue a liability for the loss. When a loss is not both probable and estimable, we do not accrue a liability. Where a loss is not probable but is reasonably possible,
60
including if a loss in excess of an accrued liability is reasonably possible, we determine whether it is possible to provide an estimate of the amount of the loss or range of possible losses for the claim. Because we cannot predict with certainty the ultimate resolution of the legal proceedings (including lawsuits, investigations, regulatory proceedings or claims) asserted against us, it is not currently possible to provide such an estimate. The ultimate outcome of pending legal proceedings to which we are a party may have a material adverse effect on our business, cash flows, results of operations or financial condition.
None.
EXECUTIVE OFFICERS OF UNIVERSAL TECHNICAL INSTITUTE, INC.
The executive officers of UTI are set forth in this table. All executive officers serve at the direction of the Board of Directors. Ms. McWaters also serves as a director of UTI.
|
Name
|
Age
|
Position
|
|
Kimberly J. McWaters
|
54
|
President and Chief Executive Officer
|
|
Scott Yessner
|
49
|
Interim Chief Financial Officer
|
|
Chad A. Freed
|
45
|
General Counsel, Executive Vice President of Corporate Development
|
|
Jerome A. Grant
|
55
|
Executive Vice President and Chief Operating Officer
|
|
Piper P. Jameson
|
57
|
Executive Vice President and Chief Marketing Officer
|
|
Eric Severson
|
54
|
Senior Vice President, Admissions
|
|
Sherrell E. Smith
|
55
|
Executive Vice President of Campus Operations & Services
|
|
Rhonda R. Turner
|
45
|
Senior Vice President, People Services
|
Kimberly J. McWaters has served as our Chief Executive Officer since October 2003 and as our President from 2000 to 2011 and subsequently from September 2016 to present. Ms. McWaters has served as a director on our Board since February 2005 and as the Chairman of our Board of Directors from December 2013 to September 2017. From 1984 to 2000, Ms. McWaters held several positions with UTI, including Vice President of Marketing and Vice President of Sales and Marketing. Ms. McWaters also serves as a director of Penske Automotive Group, Inc. and Mobile Mini, Inc. Ms. McWaters received a BS in Business Administration from the University of Phoenix.
Scott Yessner has served as our Interim Chief Financial Officer since May 2018. Prior to joining UTI, Mr. Yessner served as a consultant with Tatum, a Randstad company, and MBO Partners, Inc. from 2016 to 2018. Previously, Mr. Yessner was group CFO, Wealth and Corporate Banking with MUFG Union Bank and had CFO executive responsibility for accounting, SEC and regulatory reporting, treasury, strategy/M&A, FP&A, capital/external stakeholder management and governance from 2010 to 2013. In addition, he was group CFO for Wells Fargo Advisors/Wachovia Securities from 2008 to 2010. He has also held financial leadership roles at Jackson National Life Insurance Company from 1999 to 2003; The Balance Sheet Company from 2014 to 2015 and Countrywide Financial Corporation from 2005 to 2008. He received a Bachelor of Economics degree from the University of California, Los Angeles and is a certified public accountant.
Chad A. Freed has served as our General Counsel, Executive Vice President of Corporate Development since June 2015 and is also our Corporate Secretary. Mr. Freed served as Senior Vice President of Business Development from March 2009 to June 2015, as Senior Vice President, General Counsel from February 2005 to March 2009 and as inside legal counsel since March 2004. Prior to joining UTI, Mr. Freed was a Senior Associate in the Corporate Finance and Securities department at Bryan Cave LLP. Mr. Freed received his Juris Doctor from Tulane University and a BS in International Business and French from Pennsylvania State University.
61
Jerome A. Grant has served as our Executive Vice President and Chief Operating Officer since November 2017. Prior to joining UTI, Mr. Grant served as Senior Vice President, Chief Services Officer with McGraw-Hill Education, Inc. from June 2015 to April 2017. Prior to joining McGraw Hill, Mr. Grant served in several senior leadership roles with Pearson Education including SVP of Technology Strategy from 2014 to 2015; SVP of Digital Products from 2012 to 2014; President of Higher Education Business, Technology and the New York Institute of Finance from late 2000 through 2011; and VP of Sales in 1999 through 2000. Mr. Grant received a Bachelor of Business Administration degree in labor relations and marketing from the University of Wisconsin-Milwaukee.
Piper P. Jameson has served as our Executive Vice President and Chief Marketing Officer since February 2017. During her previous tenure with UTI from 1994 to 2005, she held several operational and executive positions including Senior Vice President, Marketing. Prior to her return to UTI, Ms. Jameson served as Chief Marketing Officer at Northern Arizona University - Extended Campuses and as the Executive Vice President and Chief Marketing Officer at Lincoln Educational Services. Ms. Jameson received a masters degree in Strategic Communication and Leadership from Seton Hall University and a BS in Marketing and Business Management from the University of Phoenix.
Eric Severson has served as our Senior Vice President of Admissions since July 2018. Prior to joining UTI from 1989 to 2017, Mr. Severson was with Pearson, the market leader in developing tools, content, technology products and services for the education industry, most recently as Executive Vice President, Higher Education Sales. He held a number of other senior leadership roles with Pearson and, prior to that, led sales teams with educational publisher, Prentice Hall. Mr. Severson received a BA in English from St. Olaf College.
Sherrell E. Smith has served as our Executive Vice President of Campus Operations & Services since April 2018. Mr. Smith served as Executive Vice President of Admissions and Operations from June 2015 to April 2018, and as Senior Vice President, Operations from August 2012 to June 2015. During his previous tenure with UTI from 1986 to 2009, Mr. Smith held several positions with UTI including Campus President, Regional Vice President of Operations, Senior Vice President of Operations and Education and Executive Vice President of Operations. Prior to his return to UTI, Mr. Smith advised a private equity firm on acquisition opportunities in the education field and served as the Chief Executive Officer of the American Institute of Technology. Mr. Smith received a BS in Management from Arizona State University.
Rhonda R. Turner has served as our Senior Vice President of People Services since June 2010. In addition to leading our People Services (Human Resources) function, from October 2014 through March 2016, Ms. Turner provided leadership for our Advanced Training Recruitment and Industry Employment functions. Prior to her current role, Ms. Turner served as Vice President of People Services from August 2009 to May 2010, as Vice President of People Services Partnerships & Training from January 2008 to July 2009 and as Director, People Services Partnerships, from January 2006 to December 2007. Prior to joining UTI, Ms. Turner served in human resources leadership positions at ConocoPhillips, Circle K and Main Street Restaurant Group, Inc., a TGI Friday’s franchisee. Ms. Turner received a BS in Human Resources Management from Arizona State University.
62
Market Information
Our common stock is listed on the New York Stock Exchange (NYSE) under the symbol “UTI”.
The closing price of our common stock as reported by the NYSE on
November 21, 2018
was
$2.79
per share. As of
November 21, 2018
, there were
29
holders of record of our common stock.
Dividends
On June 9, 2016, our Board of Directors voted to eliminate the quarterly cash dividend on our common stock. Any future common stock dividends require the approval of a majority of the voting power of the Series A Preferred Stock.
We continuously evaluate our cash position in light of growth opportunities, operating results and general market conditions.
63
Repurchase of Securities
On December 20, 2011, our Board of Directors authorized the repurchase of up to $25.0 million of our common stock in the open market or through privately negotiated transactions. As of September 30,
2018
, we have purchased an aggregate of 1,677,570 shares of our common stock for an aggregate purchase price of $15.3 million under this stock repurchase program. During the year ended September 30,
2018
, we made no purchases under this stock repurchase program. Any future repurchases under this stock repurchase program require the approval of a majority of the voting power of our Series A Preferred Stock.
The following table summarizes our share repurchases to settle individual employee tax liabilities. These are not included in the repurchase plan totals as they were approved in conjunction with restricted share awards, during each period in the three months ended September 30,
2018
. Shares from share repurchases in lieu of taxes are returned to the pool of shares issuable under our 2003 Incentive Compensation Plan.
|
ISSUER PURCHASES OF EQUITY SECURITIES
|
||||||||||||||
|
Period
|
(a) Total Number of Shares Purchased
|
(b) Average Price Paid per Share
|
(c) Total Number of Shares Purchased as Part of Publicly Announced Plans or Programs
|
(d) Approximate Dollar Value of Shares that May Yet Be Purchased Under the Plans Or Programs
(In thousands) |
||||||||||
|
Tax Withholdings
|
||||||||||||||
|
July 1-31, 2018
|
—
|
|
$
|
—
|
|
—
|
|
$
|
—
|
|
||||
|
August 1-31, 2018
|
—
|
|
$
|
—
|
|
—
|
|
$
|
—
|
|
||||
|
September 1-30, 2018
|
78,080
|
|
$
|
2.69
|
|
—
|
|
$
|
—
|
|
||||
|
Total
|
78,080
|
|
$
|
2.69
|
|
—
|
|
$
|
—
|
|
||||
64
Stock Performance Graph
The following Stock Performance Graph and related information shall not be deemed “soliciting material” or “filed” with the Securities and Exchange Commission, nor should such information be incorporated by reference into any future filings under the Securities Act or the Securities Exchange Act except to the extent that we specifically incorporate it by reference in such filing.
This graph compares total cumulative stockholder return on our common stock during the period from September 30, 2013 through September 30, 2018 with the cumulative return on the NYSE Stock Market Index (U.S. Companies) and a Peer Issuer Group Index. The peer issuer group consists of the companies identified below, which were selected on the basis of the similar nature of their business. The graph assumes that $100 was invested on September 30, 2013, and any dividends were reinvested on the date on which they were paid.
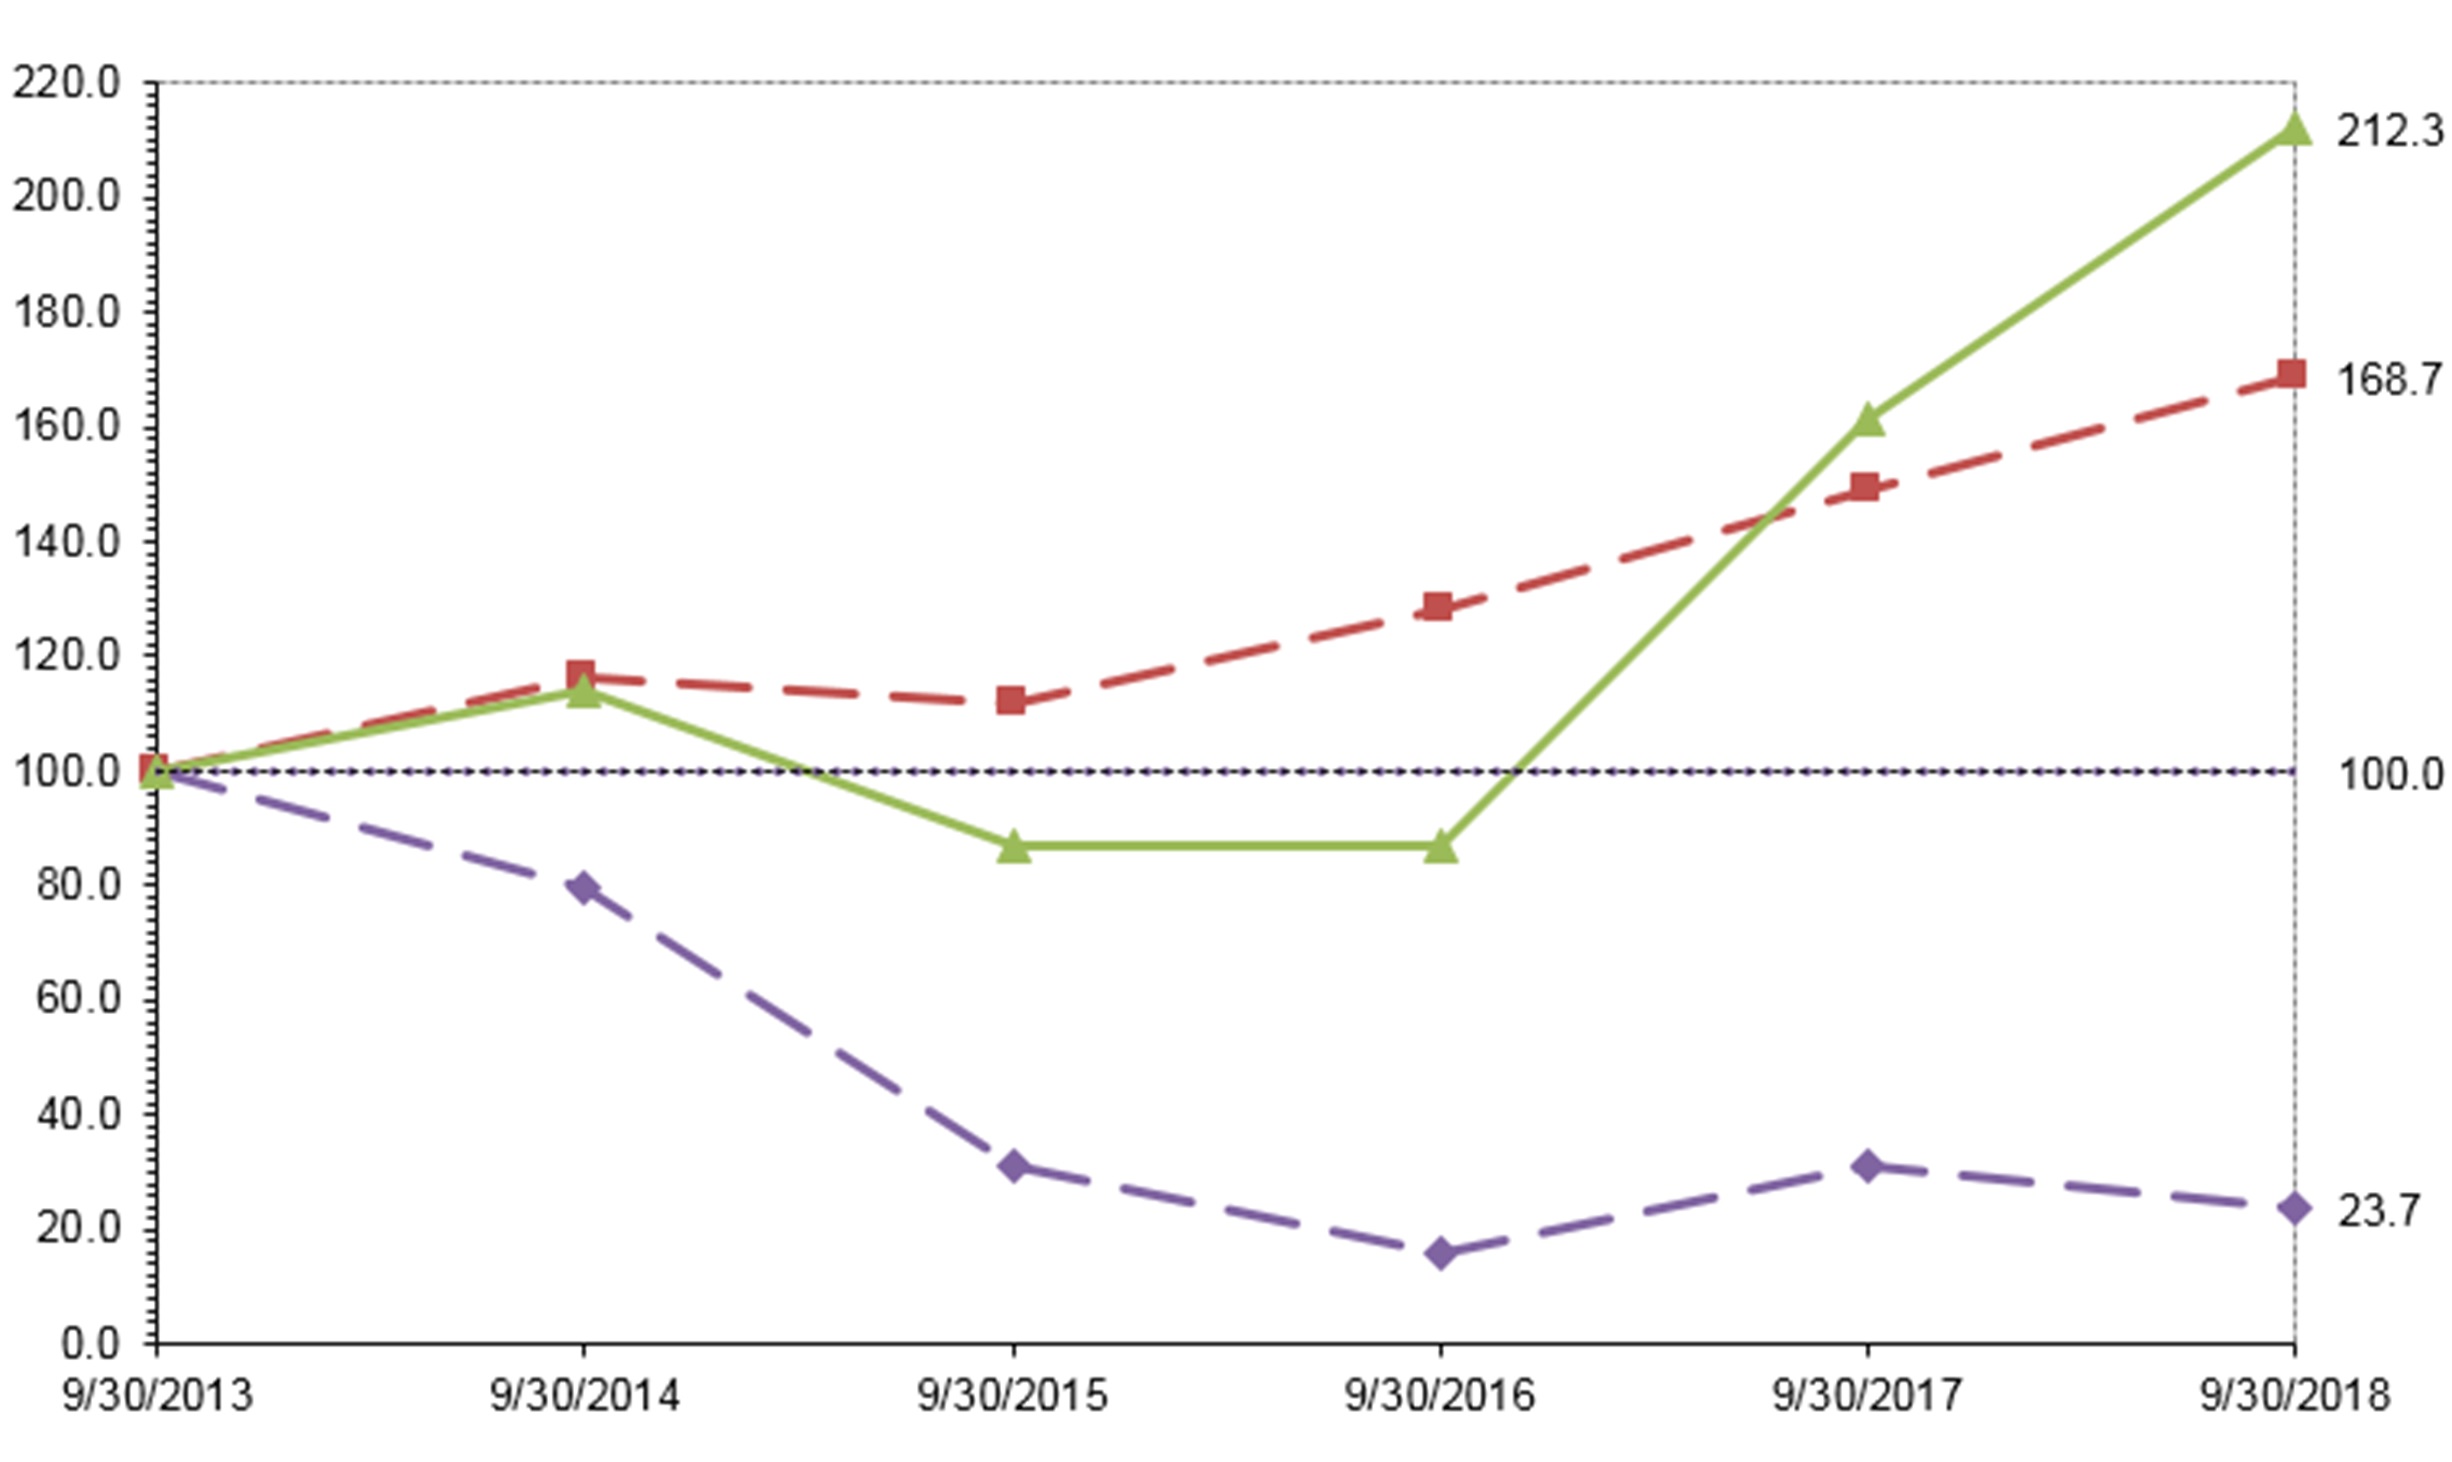
|
Symbol
|
CRSP Total Returns Index for:
|
09/2013
|
|
09/2014
|
|
09/2015
|
|
09/2016
|
|
09/2017
|
|
09/2018
|
|
|
u
|
Universal Technical Institute, Inc.
|
100.0
|
|
79.6
|
|
31.0
|
|
15.9
|
|
31.0
|
|
23.7
|
|
|
n
|
NYSE Stock Market (US Companies)
|
100.0
|
|
116.2
|
|
111.8
|
|
127.9
|
|
149.0
|
|
168.7
|
|
|
p
|
Peer Group
|
100.0
|
|
113.9
|
|
87.0
|
|
86.9
|
|
161.4
|
|
212.3
|
|
65
|
Companies in the Self-Determined Peer Group
|
||
|
Adtalem Global Education Inc.
|
Bridgepoint Education, Inc.
|
|
|
Career Education Corporation
|
Grand Canyon Education, Inc.
|
|
|
Lincoln Educational Services Corporation
|
Strayer Education, Inc.
|
|
|
Notes:
|
||||
|
A. The lines represent quarterly index levels derived from compounded daily returns that include all dividends.
|
||||
|
B. Peer group indices use beginning of period market capitalization weighting.
|
||||
|
C. If the quarterly interval, based on the fiscal year-end, is not a trading day, the preceding trading day is used.
|
||||
|
D. The index level for all series was set to $100 on September 30, 2013.
|
||||
|
Prepared by Zacks Investment Research, Inc. Used with permission. All rights reserved.
|
||||
66
The following table sets forth our selected consolidated financial and operating data as of and for the periods indicated. You should read the selected financial data set forth below together with “Management’s Discussion and Analysis of Financial Condition and Results of Operations” and our consolidated financial statements included elsewhere in this Report on Form 10-K. The selected consolidated statement of operations data and the selected consolidated balance sheet data as of and for the years ended September 30,
2018
,
2017
,
2016
,
2015
and
2014
have been derived from our audited consolidated financial statements.
|
Year Ended September 30,
|
||||||||||||||||||||
|
2018
|
2017
|
2016
|
2015
|
2014
|
||||||||||||||||
|
($'s in thousands, except per share amounts)
|
||||||||||||||||||||
|
Statement of Operations Data:
(1)
|
||||||||||||||||||||
|
Revenues
(2)
|
$
|
316,965
|
|
$
|
324,263
|
|
$
|
347,146
|
|
$
|
362,674
|
|
$
|
378,393
|
|
|||||
|
Operating expenses:
|
||||||||||||||||||||
|
Educational services and facilities
(3) (12)
|
182,589
|
|
181,027
|
|
194,395
|
|
194,416
|
|
200,054
|
|
||||||||||
|
Selling, general and administrative
(3) (4)
|
169,651
|
|
145,060
|
|
171,374
|
|
177,481
|
|
172,002
|
|
||||||||||
|
Total operating expenses
(3) (4) (12)
|
352,240
|
|
326,087
|
|
365,769
|
|
371,897
|
|
372,056
|
|
||||||||||
|
Income (loss) from operations
(2)
(3) (4) (12)
|
(35,275
|
)
|
(1,824
|
)
|
(18,623
|
)
|
(9,223
|
)
|
6,337
|
|
||||||||||
|
Interest (expense) income, net
(5) (11)
|
(1,885
|
)
|
(2,481
|
)
|
(3,196
|
)
|
(2,125
|
)
|
(1,624
|
)
|
||||||||||
|
Equity in earnings of unconsolidated affiliate
(6)
|
385
|
|
484
|
|
342
|
|
527
|
|
471
|
|
||||||||||
|
Other income, net
|
1,078
|
|
1,090
|
|
(49
|
)
|
140
|
|
563
|
|
||||||||||
|
Income (loss) before taxes
(2) (3) (12)
|
(35,697
|
)
|
(2,731
|
)
|
(21,526
|
)
|
(10,681
|
)
|
5,747
|
|
||||||||||
|
Income tax expense (benefit)
(7)
|
(3,015
|
)
|
5,397
|
|
26,170
|
|
(1,532
|
)
|
3,710
|
|
||||||||||
|
Net income (loss)
(4) (7)
|
$
|
(32,682
|
)
|
$
|
(8,128
|
)
|
$
|
(47,696
|
)
|
$
|
(9,149
|
)
|
$
|
2,037
|
|
|||||
|
Preferred stock dividends
(8)
|
|
5,250
|
|
|
5,250
|
|
|
1,424
|
|
|
—
|
|
|
—
|
|
|||||
|
Income (loss) available for distribution
(8)
|
|
$
|
(37,932
|
)
|
|
$
|
(13,378
|
)
|
|
$
|
(49,120
|
)
|
|
$
|
(9,149
|
)
|
|
$
|
2,037
|
|
|
Net income (loss) per share:
|
||||||||||||||||||||
|
Basic
|
$
|
(1.51
|
)
|
$
|
(0.54
|
)
|
$
|
(2.02
|
)
|
$
|
(0.38
|
)
|
$
|
0.08
|
|
|||||
|
Diluted
|
$
|
(1.51
|
)
|
$
|
(0.54
|
)
|
$
|
(2.02
|
)
|
$
|
(0.38
|
)
|
$
|
0.08
|
|
|||||
|
Weighted average shares (in thousands):
|
||||||||||||||||||||
|
Basic
|
25,115
|
|
24,712
|
|
24,313
|
|
24,391
|
|
24,640
|
|
||||||||||
|
Diluted
|
25,115
|
|
24,712
|
|
24,313
|
|
24,391
|
|
24,920
|
|
||||||||||
|
Cash dividends declared per common share
|
$
|
—
|
|
$
|
—
|
|
$
|
0.04
|
|
$
|
0.32
|
|
$
|
0.40
|
|
|||||
|
Other Data:
(1)
|
||||||||||||||||||||
|
Depreciation and amortization
(6) (9)
|
$
|
15,688
|
|
$
|
16,886
|
|
$
|
17,749
|
|
$
|
19,155
|
|
$
|
20,474
|
|
|||||
|
Number of campuses
|
13
|
|
12
|
|
12
|
|
12
|
|
11
|
|
||||||||||
|
Average enrollments
|
10,418
|
|
10,889
|
|
12,026
|
|
13,207
|
|
14,357
|
|
||||||||||
|
Balance Sheet Data:
(1)
|
||||||||||||||||||||
|
Cash and cash equivalents
(8) (10) (11)
|
$
|
58,104
|
|
$
|
50,138
|
|
$
|
119,045
|
|
$
|
29,438
|
|
$
|
38,985
|
|
|||||
|
Current assets
(7) (8) (10)
|
$
|
116,795
|
|
$
|
146,826
|
|
$
|
161,949
|
|
$
|
108,057
|
|
$
|
127,532
|
|
|||||
|
Working capital
(8)
|
$
|
24,333
|
|
$
|
60,437
|
|
$
|
67,389
|
|
$
|
11,563
|
|
$
|
25,197
|
|
|||||
|
Total assets
(4) (6) (7)
|
$
|
282,278
|
|
$
|
274,102
|
|
$
|
297,159
|
|
$
|
274,302
|
|
$
|
288,069
|
|
|||||
|
Total shareholders' equity
(8)
|
$
|
126,645
|
|
$
|
125,776
|
|
$
|
136,614
|
|
$
|
113,475
|
|
$
|
133,192
|
|
|||||
|
(1)
|
In 2018, we opened a campus in Bloomfield, New Jersey, which contributed to the fluctuations in operations
|
67
and financial position during 2018. In 2015, we opened a campus in Long Beach, California, which contributed to the fluctuation in operations and financial position during 2015, 2016 and 2017.
|
(2)
|
The decline in our average full-time enrollment from 2014 to 2018 contributed to the decrease in revenues, income (loss) from operations, and income (loss) before taxes.
|
We adopted ASC 606 using the modified retrospective method as of October 1, 2017. This approach was applied to all contracts not completed as of October 1, 2017. The adoption of the new standard resulted in a change in the timing of revenue recognition as it relates to our proprietary loan program.
|
(3)
|
In September and November 2016, we completed reductions in workforce impacting approximately 145 employees, which decreased operating expenses and decreased loss from operations and loss before taxes in 2017.
|
|
(4)
|
In 2015, we recorded a non-cash impairment charge of $12.4 million to write off goodwill for our MMI Phoenix, Arizona campus based on our annual impairment test.
|
|
(5)
|
In 2015 and 2014, we began recording interest expense related to amortization of the financing obligations for our Long Beach, California campus and for our Lisle, Illinois campus, respectively.
|
|
(6)
|
In October 2014, we entered into a 15-year lease agreement for a build-to-suit facility related to the design and construction of a new campus in Long Beach, California. We recorded approximately $20.3 million in property and equipment and a financing obligation of approximately $12.3 million as of September 30, 2015 related to this lease agreement.
|
In 2014, we entered into amended lease agreements for certain buildings on our Orlando, Florida campus, which extended the lease terms, modified the scheduled rental payments and allowed us to expand the square footage of one building. Construction occurred during June through October 2014. For accounting purposes, we were considered the owner during the construction period, and during that period, the existing building and the addition were considered one unit of account. Accordingly, as of September 30, 2014, we recorded the existing building and a corresponding short-term financing obligation of approximately $4.6 million on our consolidated balance sheet. The facility was placed into service effective November 1, 2014. We determined that we do not have continuing involvement after the construction period was complete, and that the lease will be accounted for as an operating lease. Accordingly, the asset and the corresponding short-term financing obligation were derecognized from our consolidated balance sheet.
Pursuant to various agreements to relocate our Glendale Heights, Illinois to and design and build a campus in Lisle, Illinois in 2012, we invested approximately $4.0 million to acquire an equity interest of approximately 28% in a related joint venture. As of September 30, 2014, we recorded $33.5 million in property and equipment with a corresponding financing obligation. We recognize our proportionate share of the joint venture's net income or loss during each accounting period and any return of capital as a change in our investment.
|
(7)
|
In 2016, we recorded a full valuation allowance on our deferred tax assets which impacted income tax expense by $34.2 million for the year ended September 30, 2016.
|
On December 22, 2017, the Tax Cuts and Jobs Act was enacted. As a result of the Tax Cuts and Jobs Act, we reversed approximately $2.8 million of the valuation allowance on our deferred tax assets during the three months ended December 31, 2017, as such assets are now offset by the deferred tax liability related to our goodwill before the full valuation allowance was applied to the deferred tax asset.
68
|
(8)
|
In 2016, we paid common stock cash dividends of $0.02 per share in December and March totaling $1.0 million. On June 9, 2016, our Board of Directors voted to eliminate the quarterly cash dividend on our common stock. In 2015, we paid cash dividends of $0.10 per share in December, March and June totaling $7.3 million. In 2014, we paid quarterly cash dividends of $0.10 per share totaling $9.9 million.
|
In 2016, we sold 700,000 shares of Series A Preferred Stock for $70.0 million in cash. We paid preferred stock cash dividends of $5.3 million during the years ended September 30, 2018 and September 30, 2017, respectively, and $1.4 million during the year ended September 30, 2016.
In 2015 and 2014, we used cash and cash equivalents to repurchase approximately $6.6 million and $1.4 million, respectively, of our common shares.
|
(9)
|
Excludes depreciation of training equipment obtained in exchange for services of $1.4 million, $1.3 million, $1.3 million, $1.2 million and $1.2 million for the years ended September 30,
2018
,
2017
,
2016
,
2015
and
2014
, respectively.
|
|
(10)
|
In 2015, we purchased the majority of the buildings and land for our Houston, Texas campus. The purchase price of $9.4 million, excluding fees, was allocated between buildings ($7.7 million) and land ($1.7 million) based on the ratio of appraised values, which decreased cash and current assets. At the time of purchase, we had leasehold improvements related to the purchased building recorded at $5.0 million in historical cost and $4.3 million of accumulated depreciation. The historical cost and accumulated depreciation for these assets were removed from the related classification and the net book value was recorded into building and building improvements. The buildings and building improvements are being depreciated over a useful life of 30 years.
|
|
(11)
|
In the third quarter of 2017, we began investing in various bond funds, which decreased cash and cash equivalents and increased interest income. In the first quarter of 2018, we liquidated our investment in trading securities; as a result, there was no unrealized gain on trading securities at September 30, 2018.
|
|
(12)
|
In October 2017, we entered into lease agreements for a new campus in Bloomfield, New Jersey, which opened in August 2018. One of the leases was amended in May 2018. The leases have an initial term of approximately 12 years. We determined the leases are operating leases, which increased operating expenses and increased loss from operations and loss before taxes in 2018.
|
69
You should read the following discussion together with the "Selected Financial Data" and the consolidated financial statements and the related notes included elsewhere in this Report on Form 10-K. This discussion contains forward-looking statements that are based on our current expectations, estimates and projections about our business and operations. Our actual results may differ materially from those currently anticipated and expressed in such forward-looking statements as a result of a number of factors, including those we discuss under “Risk Factors” and elsewhere in this Report on Form 10-K.
General Overview
We are the leading provider of postsecondary education for students seeking careers as professional automotive, diesel, collision repair, motorcycle and marine technicians as well as welders and CNC machining technicians as measured by total average full-time enrollment and graduates. We offer certificate, diploma or degree programs at 13 campuses across the United States. Additionally, we offer MSAT programs, including student-paid electives, at our campuses and manufacturer or dealer sponsored training at certain campuses and dedicated training centers. We have provided technical education for 53 years.
Our revenues consist primarily of student tuition and fees derived from the programs we provide after reductions are made for discounts and scholarships that we sponsor and for refunds for students who wi
t
hdraw from our programs prior to specified dates. Tuition and fee revenue is recognized ratably over the term of the course or program offered. Approximately 98% of our revenues for each of the years ended September 30, 2018, 2017 and 2016 consisted of tuition. We supplement our tuition revenues with additional revenues from sales of textbooks and program supplies and other revenues, which are recognized as the transfer of goods or services occurs. Through our proprietary loan program, we, in substance, provide the students who participate in this program with extended payment terms for a portion of their tuition. Under ASC 606, the portion of tuition revenue related to the proprietary loan program is considered a form of variable consideration. We estimate the amount we ultimately expect to collect from the portion of tuition that is funded by the proprietary loan program, resulting in a note receivable. Estimating the collection rate requires significant management judgment. The estimated amount is determined at the inception of the contract and we recognize the related revenue as the student progresses through school. Each reporting period, we update our assessment of the variable consideration associated with the proprietary loan program. Accordingly, we recognize tuition and loan origination fees financed by the loan and any related interest revenue under the effective interest method required under the loan based on this collection rate. We also provide dealer technician training or instructor staffing services to manufacturers, and we recognize revenue as the transfer of services occurs. Tuition revenue and fees generally vary based on the average number of students enrolled and average tuition charged per program.
Average full-time enrollments vary depending on, among other factors, the number of continuing students at the beginning of a period, new student enrollments during the period, students who have previously withdrawn but decide to re-enroll during the period, graduations and withdrawals during the period. Our average full-time enrollments are influenced by: the attractiveness of our program offerings to high school graduates and potential adult students; the effectiveness of our marketing efforts; the depth of our industry relationships; the strength of employment markets and long term career prospects; the quality of our instructors and student services professionals; the persistence of our students; the length of our education programs; the availability of federal and alternative funding for our programs; the number of graduates of our programs who elect to attend the advanced training programs we offer and general economic conditions. Our introduction of additional program offerings at existing campuses and opening additional campuses is expected to influence our average full-time enrollment. We currently offer start dates at our campuses that range from every three to six weeks throughout the year in our core programs. The number of start dates of advanced training programs varies by the duration of those programs and the needs of the manufacturers which sponsor them.
70
Our tuition charges vary by type and length of our programs and the program level, such as core or advanced training. We implemented tuition rate increases of up to 2.5%, 3.0% and 3.0% for each of the years ended
September 30, 2018
,
2017
and
2016
, respectively. We regularly evaluate our tuition pricing based on individual campus markets, the competitive environment and ED regulations.
Most students at our campuses rely on funds received under various government-sponsored student financial aid programs, predominantly Title IV Programs and various veterans' benefits programs, to pay a substantial portion of their tuition and other education-related expenses. Approximately
65%
of our revenues, on a cash basis, were collected from funds distributed under Title IV Programs for the year ended
September 30, 2018
. This percentage differs from our Title IV percentage as calculated under the 90/10 rule due to the prescribed treatment of certain Title IV stipends under the rule. Additionally, approximately
17%
of our revenues, on a cash basis, were collected from funds distributed under various veterans' benefits programs for the year ended
September 30, 2018
.
We extend credit for tuition and fees, for a limited period of time, to the majority of our students. Our credit risk is mitigated through the students’ participation in federally funded financial aid and veterans' benefit programs unless students withdraw prior to the receipt by us of Title IV or veterans' benefit funds for those students. The financial aid and veterans' benefits programs are subject to political and budgetary considerations. There is no assurance that such funding will be maintained at current levels. Extensive and complex regulations govern the financial assistance programs in which our students participate. Our administration of these programs is periodically reviewed by various regulatory agencies. Any regulatory violation could be the basis for the initiation of potential adverse actions, including a suspension, limitation, placement on reimbursement status or termination proceeding, which could have a material adverse effect on our business.
If any of our institutions were to lose its eligibility to participate in federal student financial aid or veterans' benefit programs, the students at that institution, and other locations of that institution, would lose access to funds derived from those programs and would have to seek alternative sources of funds to pay their tuition and fees. The receipt of financial aid and veterans benefit funds reduces the students’ amounts due to us and has no impact on revenue recognition, as the transfer relates to the source of funding for the costs of education which may occur through Title IV, veterans benefit or other funds and resources available to the student. Additionally, we bear all credit and collection risk for the portion of our student tuition that is funded through our proprietary loan program.
We categorize our operating expenses as (i) educational services and facilities and (ii) selling, general and administrative.
Major components of educational services and facilities expenses include faculty and other campus administration employees compensation and benefits, facility rent, maintenance, utilities, depreciation and amortization of property and equipment used in the provision of educational services, tools, training aids, royalties under our licensing arrangements and other costs directly associated with teaching our programs and providing educational services to our students.
Selling, general and administrative expenses include compensation and benefits of employees who are not directly associated with the provision of educational services, such as: executive management; finance and central accounting; information technology; legal; human resources; marketing and student enrollment expenses, including compensation and benefits of personnel employed in marketing and student admissions; costs of professional services; bad debt expense; costs associated with the implementation and operation of our student management and reporting system; rent for our corporate office headquarters; depreciation and amortization of property and equipment that is not used in the provision of educational services and other costs that are incidental to our operations. All marketing and student enrollment expenses are recognized in the period incurred. Costs related to the opening of new facilities, excluding related capital expenditures, are expensed in the period incurred or when services are provided.
71
2018
Overview
Operations
Lower student population levels as we began
2018
resulted in a
4.3%
decline
in our average full-time enrollment to
10,418
students for the year ended
September 30, 2018
. We started
10,705
students during the year ended
September 30, 2018
, which represents an
increase
of
1.2%
as compared to a
decrease
of
6.4%
for the year ended
September 30, 2017
. The
increase
in starts was primarily the result of the transformation plan initiatives and continued execution on the metro campus strategy.
Several factors continue to challenge our ability to start new students, including the following:
|
•
|
Unemployment; during periods when the unemployment rate declines or remains stable as it has in recent years, prospective students have more employment options;
|
|
•
|
Adverse media coverage, legislative hearings, regulatory actions and investigations by attorneys general and various agencies related to allegations of wrongdoing on the part of other companies within the education and training services industry, which have cast the industry in a negative light;
|
|
•
|
Competition for prospective students continues to increase from within our sector and from market employers, as well as with traditional postsecondary educational institutions; and
|
|
•
|
The state of the general macro-economic environment and its impact on price sensitivity and the ability and willingness of students and their families to incur debt.
|
During 2018, we announced and began implementation of a multi-year transformation plan. This plan included a comprehensive evaluation of our business by a top-tier consulting firm, which identified opportunities for growth with select investments in marketing, admissions and student services. In addition to the transformation plan, we continue to focus on existing key strategies, including:
|
•
|
Expanding into new geographic markets either organically or through strategic acquisitions; we opened a new campus in Bloomfield, New Jersey in August 2018;
|
|
•
|
Offering new programs, such as expanding our welding program to our Dallas Ft. Worth, Texas campus, and offering associate level degree programs at additional campus locations;
|
|
•
|
Adding and renewing contracts with OEM partners and other employers to provide career opportunities and tuition reimbursement for our graduates;
|
|
•
|
Identifying and executing on a variety of affordability initiatives, including employer financial support and institutional scholarships and grants; and
|
|
•
|
Shifting perceptions and building advocacy with key policy makers and influencers.
|
ED published guidance in November 2015 that eliminated certain restrictions on incentive compensation for admissions representatives. Specifically, ED reconsidered its previous interpretation and stated that its regulations do not prohibit compensation for admissions representatives that is based upon students’ graduation from, or completion of, educational programs. Compensation based on enrolling students, however, continues to be prohibited. Please see further discussion in “Business - Regulatory Environment - Regulation of Federal Student Financial Aid Programs - Incentive Compensation” included elsewhere in this Report on Form 10-K. We have made adjustments to the compensation practices for our admissions representatives which we believe will be compliant with ED's November 2015 guidance. The transition period for the new compensation structure will
72
continue through calendar year 2018. We will continue to evaluate other compensation options under these regulations and guidance.
Our revenues for the year ended September 30,
2018
were
$317.0 million
, a decline of
$7.3 million
, or
2.3%
, from the prior year. We had an operating loss of
$35.3 million
compared to
$1.8 million
for the same period in the prior year. The decrease in our operating results were due in part to the decline in revenues, and the decline in our average full-time enrollment. The decrease in revenue was partially offset by tuition rate increases. Operating results were also impacted by an increase in contract services, advertising, compensation and related costs, student expenses, professional services expense and goodwill and intangible asset impairment expense. We incurred a net loss of
$32.7 million
compared to
$8.1 million
in the prior year. During the year ended September 30, 2018, we had an income tax benefit of $3.0 million compared to $5.4 million in income tax expense for the same period in the prior year. The income tax benefit for the year was due primarily to the release of certain valuation allowance, as impacted by the provisions of the Tax Cuts and Jobs Act.
Veterans' Benefits
The percentage of our revenues, on a cash basis, which were collected from funds distributed under various veterans' benefits programs was approximately 17%, 19% and 19% for the years ended
September 30, 2018
,
2017
and
2016
, respectively.
There continues to be Congressional activity around the requirements of the 90/10 Rule, such as reducing the 90% maximum under the rule to 85% or including military and veteran funding in the 90% portion of the calculation. Potential changes to the 90/10 Rule could negatively impact our eligibility to participate in Title IV Programs. A loss of eligibility would adversely affect our students’ access to Title IV Program funds they need to pay their educational expenses.
As described in “Business - Regulatory Environment - Other Federal and State Programs - Veterans' Benefits” included elsewhere in this Report on Form 10-K, we are subject to limitations on the percentage of students per program receiving benefits under certain veterans’ benefits programs, unless the program qualifies for certain exemptions. If the VA determines that an institution is out of compliance with the applicable limit, the VA will continue to provide benefits to current students but will not provide benefits to newly enrolled students until the institution demonstrates compliance.
Our access to military installations for student recruitment has become more limited due to changes in the Transition Assistance Program (Transition Goals, Plans, Success) and increased enforcement of the requirement to possess an MOU with certain individual military installations. Each of our institutions has an MOU with the U.S. DOD. We have MOUs with certain key individual installations and are pursuing MOUs at additional locations. We continue to strengthen and develop relationships with our existing contacts and with new contacts in order to maintain and rebuild our access to military installations.
Graduate Employment
Identifying employment opportunities and preparing our graduates for these careers is critical to our ability to help our graduates benefit from their education. Accordingly, we dedicate significant resources to maintaining an effective employment team, as described in "Business - Graduate Employment" included in Part I, Item 1 of this Report on Form 10-K. We believe that our graduate employment services provide our students with a compelling value proposition and enhance the employment opportunities for our graduates. The rate has increased for our Marine and Motorcycle programs, and has remained consistent for our Collision Repair program. The rate has slightly declined for our Automotive and Diesel Technology and this program continues to face challenges, including graduates who receive higher compensating jobs outside their field of study, changing regulatory standards and guidance on employment classification and availability for employment and fewer internal resources dedicated to employment verification following our reductions in force during 2016.
73
Our employment rate for
2017
graduates was
84
%
, compared to 86% for 2016 graduates. The employment calculation is based on all graduates, including those that completed MSAT programs, from October 1, 2016 to September 30, 2017 and October 1, 2015 to September 30, 2016, respectively, excluding graduates not available for employment because of continuing education, military service, health, incarceration, death or international student status. Graduates are counted as employed based on a verified understanding of the graduate's job duties to assess and confirm that the graduate's primary job responsibilities are in his or her field of study. See Business - Graduate Employment" in this Report on Form 10-K for further discussion of our graduate employment activities. For
2017
, we had
8,539
total graduates, of which
8,086
were available for employment. Of those graduates available for employment,
6,818
were employed within one year of their graduation date, for a total of 84
%
. For
2016
, we had
9,150
total graduates, of which
8,621
were available for employment. Of those graduates available for employment,
7,387
were employed within one year of their graduation date, for a total of
86%
.
Regulatory Environment
For a detailed discussion of the regulatory environment and related risks, see “Business - Regulatory Environment”, and Item 1A, “Risk Factors”, included elsewhere in this Report on Form 10-K.
Accreditation
The procedures of our accrediting agency for the renewal of accreditation of a campus require a team of professionals to conduct an on-site visit at the campus and issue a Team Summary Report, which includes an assessment of the school’s compliance with accrediting standards.
In July 2018, our Norwood, Massachusetts and Sacramento, California campuses received the “School of Excellence” designation by ACCSC. The School of Excellence Award recognizes ACCSC-accredited institutions for their commitment to the expectations and rigors of ACCSC accreditation, as well as the efforts made by the institution in maintaining high levels of achievement among their students. In order to be eligible for the School of Excellence Award, an ACCSC-accredited institution must meet the conditions of renewing accreditation without any finding of non-compliance, satisfy all requirements necessary to be in good standing with ACCSC and demonstrate that the majority of the schools’ student graduation and graduate employment rates for all programs offered meet or exceed the average rates of graduation and employment among all ACCSC-accredited institutions. Institutions are only eligible for the School of Excellence designation in the year in which they complete a renewal of accreditation.
We received an initial two-year grant of accreditation from ACCSC for our Bloomfield, New Jersey campus on May 8, 2018. The campus will be eligible for a five-year grant of accreditation in May 2020.
In December 2017, we also received formal notification from ACCSC granting continuing accreditation with a stipulation for our Long Beach, California campus. As required by the stipulation, we submitted our response, which included a new leave of absence policy reflecting feedback received from ACCSC on January 22, 2018. On February 23, 2018, we received formal notification from ACCSC that we had satisfied the requirements of the stipulation.
In June 2017, our Exton, Pennsylvania and Dallas/Ft. Worth, Texas campuses received the “School of Excellence” designation by ACCSC. The School of Excellence Award recognizes ACCSC-accredited institutions for their commitment to the expectations and rigors of ACCSC accreditation, as well as the efforts made by the institution in maintaining high-levels of achievement among their students. In order to be eligible for the School of Excellence Award, an ACCSC-accredited institution must meet the conditions of renewing accreditation without any finding of non-compliance, satisfy all requirements necessary to be in good standing with ACCSC and demonstrate that the majority of the schools’ student graduation and graduate employment rates for all programs offered meet or exceed the average rates of graduation and employment among all ACCSC-accredited institutions. Additionally, each of these campuses received a six-year renewal of accreditation instead of the standard five-year renewal.
74
In March 2017, ACCSC conducted an unannounced site visit at our Houston, Texas campus. One program in the automotive division did not achieve the graduation benchmark set by ACCSC and was placed on heightened monitoring status effective June 9, 2017, which involved a detailed review of the school's Annual Report submission. In September 2018, the campus was removed from heightened monitoring status.
Regulation of Federal Student Financial Aid Programs
Gainful Employment.
On June 16, 2017, ED announced its intent to convene a negotiated rulemaking committee to develop proposed regulations to revise the gainful employment regulations. ED convened meetings from December 2017 through March 2018, but negotiators failed to reach consensus on all key elements of the proposal. ED published a proposed rule on August 14, 2018, on which it accepted public comment through September 13, 2018. The proposed rule would eliminate the existing Gainful Employment regulations. ED stated in the notice of proposed rulemaking that it plans instead, among other things, to publish program-level outcomes data using the existing government website called the College Scorecard, or on a new federal website. ED did not publish the proposed regulations in final form by November 1, 2018, as would typically be required for them to take effect on July 1, 2019. Regulations published after November 1, 2018 and prior to November 1, 2019 typically would take effect on July 1, 2020. We cannot provide any assurances as to the timing and content of any such final regulations.
On June 30, 2017, ED announced the extension of the compliance date for certain gainful employment disclosure requirements from July 1, 2017 to July 1, 2018. ED stated that institutions are still required to comply with other gainful employment disclosure requirements by July 1, 2017. ED has not issued completer lists to schools, which is the first step toward generating the data for calculating a second set of gainful employment rates. Further, ED’s agreement with the Social Security Administration to produce mean or median earnings data has expired and has not been renewed. The earnings data is used to calculate the debt-to-earnings rates. Consequently, we cannot predict when ED will begin the process of calculating and issuing new draft or final gainful employment rates in the future. While we have implemented a mitigation strategy for those programs identified as in the zone, because we cannot calculate the exact impact of such action on a program's debt to earnings rates, we may overestimate the required tuition reduction, which would have a negative impact on our tuition revenues. Conversely, we may underestimate the required tuition reduction and fail to improve the program's debt to earnings rates.
Borrower Defense to Repayment Regulations.
In November 2016, ED published final regulations establishing new rules regarding, among other things, the ability of borrowers to obtain discharges of their obligations to repay certain Title IV loans and for ED to initiate a proceeding to collect from the institution the discharged and returned amounts and the extensive list of circumstances that may require institutions to provide letters of credit or other financial protection to ED. These regulations are discussed at “Business - Regulation of Federal Student Financial Aid Programs - Defense to Repayment Regulations” included elsewhere in this Report on Form 10-K. The current regulations had a general effective date of July 1, 2017, which was delayed until July 1, 2019 by ED action that was subsequently invalidated by federal court orders as of October 16, 2018. ED published a notice of proposed rulemaking in the Federal Register on July 31, 2018 to amend these regulations, but announced that final regulations would not be published until after November 1, 2018. Accordingly, any final regulations that ED may publish after November 1, 2018 and prior to November 1, 2019 typically would not take effect until July 1, 2020 unless ED is able to establish an earlier date for implementation of the regulations. The proposed regulations would, among other things, modify the current procedures and standards for borrowers to assert through an ED-administered process a defense to the borrowers’ obligation to repay certain Title IV loans based on certain acts or omissions by the institution or a covered party; maintain, but shorten, the list of events that could result in ED deeming the institution to fail ED’s financial responsibility standards and requiring a letter of credit or other form of acceptable financial protection and the acceptance of other conditions or requirements; require the institution to notify ED of an extensive list of financial events, including, but not limited to, liabilities incurred from a final judgment in a judicial or administrative determination; address the treatment of operational
75
leases and long-term debt in the calculation of an institution’s composite score under ED’s financial responsibility standards; amend certain regulations related to the discharge of student loans based on the school’s closure or a false claim of high school completion under certain circumstances; generally permit the use of arbitration clauses and class action waivers while requiring certain disclosures to students. We cannot provide any assurances as to the timing, content or ultimate effective date of any such regulations.
Compliance with Regulatory Standards and Effect of Regulatory Violations
. In April 2015, ED completed an ordinary course program review of our administration of the Title IV programs in which we participate for our Avondale, Arizona institution main campus and additional locations of that institution. The site visit covered the 2013-2014 and 2014-2015 award years. An initial program review report dated September 22, 2017 was issued by ED in July 2018. The report contained nine findings that are not material because they are limited to errors identified in individual student records and to requests to update and strengthen certain financial aid-related disclosures and procedures. None of the findings required us to perform any retroactive file reviews of all of our students for any issues for any time period. We provided our response to ED within the stated deadline of 30 days from the date we received the report. ED reviewed our response to the report and issued its final program review determination letter on July 31, 2018. All findings were considered resolved by ED.
90/10 Rule.
A for-profit institution loses its eligibility to participate in Title IV Programs if it derives more than 90% of its revenue from Title IV Programs for two consecutive fiscal years as calculated under a cash basis formula mandated by ED. The loss of such eligibility would begin on the first day following the conclusion of the second consecutive year in which the institution exceeded the 90% limit and, as such, any Title IV Program funds already received by the institution and its students during a period of ineligibility would have to be returned to ED or a lender, if applicable. Additionally, if an institution exceeds the 90% level for a single year, ED will place the institution on provisional certification for a period of at least two years, and could impose other restrictions or conditions on the institution's Title IV eligibility. For the years ended September 30,
2018
,
2017
and
2016
approximately
71%
, 71% and 72% respectively, of our revenues, on a cash basis, were derived from funds distributed under Title IV Programs, as calculated under the 90/10 rule.
2019 Outlook
For the year ending September 30, 2019, we expect new student starts to grow in the mid to high single digits. The average student population for the year ending September 30, 2019 is anticipated to be up in the low single digits as a result of the transformation plan initiatives and the Bloomfield, New Jersey campus. We expect full-year revenue to range between $322 million and $332 million, as compared to $317 million in 2018 due to the expected increase in the average student population.
We expect our operating expenses will range between $337 million and $347 million compared to $352.2 million in fiscal 2018. The planned decrease in operating expenses are driven by marketing efficiencies and broad expense management.
We expect an operating loss of between $10 million and $15 million largely due to further investments in marketing and admissions to support start growth and the planned expansion of the company’s welding program.
We expect to be free cash flow positive in fiscal 2019 with an ending cash balance at or above the same level as year-end 2018. Free cash flow is cash from operating activities less capital expenditures. We believe our strong cash position supports our ability to continue a disciplined capital deployment strategy in high ROI investments and our regulatory financial ratio.
EBITDA, unadjusted, is expected to be positive, and range between $5 million and $11 million. This figure is unadjusted for the final payment made in October 2018 to the company's former transformation consultant of $4 million.
76
Capital expenditures are expected to be between $8 million and $10 million.
Results of Operations
The following table sets forth selected statements of operations data as a percentage of revenues for each of the periods indicated.
|
|
Year Ended September 30,
|
||||||||
|
|
2018
|
2017
|
2016
|
||||||
|
Revenues
|
100.0
|
%
|
100.0
|
%
|
100
|
%
|
|||
|
Operating expenses:
|
|||||||||
|
Educational services and facilities
|
57.6
|
%
|
55.8
|
%
|
56.0
|
%
|
|||
|
Selling, general and administrative
|
53.5
|
%
|
44.8
|
%
|
49.4
|
%
|
|||
|
Total operating expenses
|
111.1
|
%
|
100.6
|
%
|
105.4
|
%
|
|||
|
Income (loss) from operations
|
(11.1
|
)%
|
(0.6
|
)%
|
(5.4
|
)%
|
|||
|
Interest income (expense), net
|
(0.6
|
)%
|
(0.8
|
)%
|
(0.9
|
)%
|
|||
|
Other income
|
0.4
|
%
|
0.6
|
%
|
0.1
|
%
|
|||
|
Total other income (expense)
|
(0.2
|
)%
|
(0.2
|
)%
|
(0.8
|
)%
|
|||
|
Income (loss) before income taxes
|
(11.3
|
)%
|
(0.8
|
)%
|
(6.2
|
)%
|
|||
|
Income tax expense (benefit)
|
(1.0
|
)%
|
1.7
|
%
|
7.5
|
%
|
|||
|
Net loss
|
(10.3
|
)%
|
(2.5
|
)%
|
(13.7
|
)%
|
|||
|
Preferred stock dividends
|
1.7
|
%
|
1.6
|
%
|
0.4
|
%
|
|||
|
Loss available for distribution
|
(12.0
|
)%
|
(4.1
|
)%
|
(14.1
|
)%
|
|||
Year Ended September 30, 2018
Compared to
Year Ended September 30, 2017
Revenues
.
Our revenues for the
year ended September 30, 2018
were
$317.0 million
, a
decrease
of
$7.3 million
, or
2.3%
, as compared to revenues of
$324.3 million
for the
year ended September 30, 2017
. The
4.3%
decrease in our average full-time enrollment resulted in a decrease in revenues of approximately $13.7 million. Our revenues were impacted by an increase in tuition discounts of $2.7 million, primarily attributable to our institutional grant program. We recognized $5.7 million on an accrual basis related to revenues and interest under our proprietary loan program for the year ended September 30, 2018, as compared to $8.0 million recognized on a cash basis for the year ended September 30, 2017. The decrease in revenue was partially offset by an increase of $0.7 million in industry training revenue and tuition rate increases of up to 2.5%, depending on the program.
Educational services and facilities expenses
. Our educational services and facilities expenses for the year ended
September 30, 2018
were
$182.6 million
, representing an increase of
$1.6 million
, or
0.9%
, as compared to
$181.0 million
for the year ended
September 30, 2017
.
77
The following table sets forth the significant components of our educational services and facilities expenses:
|
Year Ended September 30,
|
||||||||
|
2018
|
2017
|
|||||||
|
(In thousands)
|
||||||||
|
Salaries expense
|
$
|
78,941
|
|
$
|
80,575
|
|
||
|
Employee benefits and tax
|
16,621
|
|
17,016
|
|
||||
|
Bonus expense
|
286
|
|
1,169
|
|
||||
|
Stock-based compensation
|
—
|
|
166
|
|
||||
|
Compensation and related costs
|
95,848
|
|
98,926
|
|
||||
|
Student expenses
|
3,181
|
|
1,290
|
|
||||
|
Supplies and maintenance
|
8,552
|
|
7,687
|
|
||||
|
Other educational services and facilities expense
|
23,295
|
|
21,953
|
|
||||
|
Occupancy costs
|
36,561
|
|
35,693
|
|
||||
|
Depreciation and amortization expense
|
15,152
|
|
15,478
|
|
||||
|
$
|
182,589
|
|
$
|
181,027
|
|
|||
Compensation and related costs decreased
$3.1 million
for the year ended September 30,
2018
, as compared to the prior year:
|
•
|
Salaries expense decreased $1.7 million, largely attributable to a decrease in the number of employees needed to support our lower average student population. Additionally, severance expense decreased by $0.7 million due to expense in the prior year period related to the November 2016 reduction in workforce. The decreases were partially offset by the annual merit increase.
|
|
•
|
Bonus expense decreased $0.9 million due to an adjustment recorded to reflect anticipated zero attainment on one of our bonus plans. During the prior year period, we paid holiday bonuses to employees in lieu of annual merit increases.
|
Student expenses increased $1.9 million during the year ended September 30, 2018 due to increased housing grants offered as part of the transformation plan initiatives.
Supplies and maintenance expense increased $0.9 million during the year ended September 30,
2018
due to the opening of our Bloomfield, New Jersey campus and real estate consolidation efforts at our Houston, Texas campus.
Occupancy costs increased $0.9 million during the year ended September 30, 2018 primarily due to the addition of our Bloomfield, New Jersey campus.
Selling, general and administrative expenses
.
Our selling, general and administrative expenses for the year ended
September 30, 2018
were
$169.7 million
, representing an increase of
$24.6 million
, or
17.0%
, as compared to
$145.1 million
for the year ended
September 30, 2017
.
78
The following table sets forth the significant components of our selling, general and administrative expenses:
|
|
Year Ended September 30,
|
|||||||
|
2018
|
2017
|
|||||||
|
|
(In thousands)
|
|||||||
|
Salaries expense
|
$
|
59,780
|
|
$
|
57,613
|
|
||
|
Employee benefits and tax
|
14,560
|
|
13,170
|
|
||||
|
Bonus expense
|
8,155
|
|
3,061
|
|
||||
|
Stock-based compensation
|
1,864
|
|
2,829
|
|
||||
|
Compensation and related costs
|
84,359
|
|
76,673
|
|
||||
|
Contract services expense
|
10,855
|
|
4,490
|
|
||||
|
Advertising expense
|
44,789
|
|
38,561
|
|
||||
|
Other selling, general and administrative expenses
|
20,850
|
|
18,878
|
|
||||
|
Professional services expense
|
4,201
|
|
2,940
|
|
||||
|
Goodwill and intangible asset impairment expense
|
1,164
|
|
—
|
|
||||
|
Depreciation and amortization expense
|
1,922
|
|
2,691
|
|
||||
|
Bad debt expense
|
1,511
|
|
827
|
|
||||
|
$
|
169,651
|
|
$
|
145,060
|
|
|||
Compensation and related costs increased
$7.7 million
for the year ended September 30,
2018
, as compared to the prior year:
|
•
|
Salaries expense increased $2.2 million, primarily due to the addition of selective key personnel to support transformation efforts along with merit increases.
|
|
•
|
Employee benefits and tax increased $1.4 million, primarily due to an increase in self-insurance medical claims and an increase in employee headcount.
|
|
•
|
Bonus expense increased $5.1 million, primarily as a result of increased expense related to our graduate-based incentive compensation program for our admissions representatives. The transition period for our admissions compensation structure will continue through calendar year 2018. During this transition period, we will continue to accrue for and begin to pay out graduate-based bonuses prior to realizing a decrease in salaries expense for our admissions representatives.
|
|
•
|
Stock-based compensation decreased $0.9 million, primarily due to a lower level of grants during 2018 as compared to 2017 and a change to market-based awards.
|
Contract services expense increased $6.4 million for the year ended September 30, 2018. The increase is primarily attributable to our engagement of a consulting firm to advise on the optimization of our marketing and admissions processes. We engaged this consulting firm to assist in the implementation of our transformation plan discussed above.
Advertising expense increased $6.2 million for the year ended September 30,
2018
, as compared to the prior year. The increase was attributable to local marketing efforts and new strategies from the transformation plan. Advertising expense as a percentage of revenues for the year ended September 30,
2018
was approximately 14.1%. We anticipate our advertising expense will be in the range of 14.0% to 15.0% of revenue for the year ending September 30, 2019.
79
Professional services expense increased $1.3 million for the year ended September 30, 2018, due to our adoption of ASC 606 effective October 1, 2017 as well as other services.
We recorded a goodwill impairment charge of $0.8 million and an intangible asset impairment charge of $0.4 million at June 30, 2018 to write off the full carrying value of goodwill and intangible assets for BMS. These non-cash charges had no impact on liquidity or cash flows from operations.
Other expense.
Our other expense for the year ended September 30,
2018
was
$0.4 million
, a decrease of
$0.5 million
as compared to
$0.9 million
for the year ended September 30,
2017
. The decrease is attributable to increased interest income on our securities and cash equivalents.
Income taxes
.
Our income tax benefit for the year ended September 30,
2018
was
$3.0 million
, or
8.4%
of pre-tax loss, compared to income tax expense of
$5.4 million
, or
197.6%
of pre-tax loss, for the year ended September 30,
2017
. The income tax benefit for the year September 30, 2018 was due primarily to the release of certain valuation allowance, as impacted by the provisions of the Tax Cuts and Jobs Act. We will maintain a valuation allowance on our deferred tax assets until sufficient positive evidence exists to support its reversal. The effective income tax rate in each period also differed from the federal statutory tax rate as a result of state income taxes, net of related federal income tax benefits. See Note 12 of the notes to our Consolidated Financial Statements within Part II, Item 8 of this Report on Form 10-K for further discussion.
As discussed in Note 12, certain deductions and losses are subject to an annual Section 382 limitation. The limitation will affect the timing of when these deductions and losses can be used and may cause us to make income tax payments even if a pre-tax loss is recorded in future periods. The limitation may also cause the deductions and losses to expire unused.
Net loss.
As a result of the foregoing, we reported net loss for the year ended September 30,
2018
of
$32.7 million
, as compared to
$8.1 million
for the year ended September 30,
2017
.
Preferred stock dividends.
On June 24,
2016, we sold 700,000 shares of Series A Preferred Stock for $70.0 million in cash, less $1.2 million in issuance costs. Pursuant to this sale, we paid preferred stock cash dividends totaling $5.3 million during the years ended September 30, 2018 and September 30, 2017, respectively. See Note 14 of the notes to our Consolidated Financial Statements within Part II, Item 8 of this Report on Form 10-K for further discussion of the preferred stock transaction.
Loss available for distribution.
Loss available for distribution refers to net loss reduced by dividends on our Series A Preferred Stock. As a result of the foregoing, we reported a loss available for distribution for the year ended September 30,
2018
of
$37.9 million
, as compared to
$13.4 million
for the year ended September 30,
2017
.
Year Ended September 30, 2017 Compared to Year Ended September 30, 2016
Revenues.
Our revenues for the year ended September 30, 2017 were $324.3 million, a decrease of $22.8 million, or 6.6%, as compared to revenues of $347.1 million for the year ended September 30, 2016. The 9.2% decrease in our average full-time enrollment resulted in a decrease in revenues of approximately $32.6 million. Additionally, there were two fewer earning days in 2017, which resulted in a decline of approximately $2.5 million in revenue. The decrease was partially offset by tuition rate increases of up to 3%, depending on the program. Our revenues for the years ended September 30, 2017 and 2016 excluded $16.3 million and $18.7 million, respectively, of tuition related to students participating in our proprietary loan program. We recognized $8.0 million and $7.2 million of revenues and interest under the proprietary loan program for the years ended September 30, 2017 and 2016, respectively. Revenues for our Long Beach, California campus, which opened in August 2015, were $18.3 million for the year ended September 30, 2017 as compared to $12.2 million for the year ended September 30,
80
2016. Additionally, industry training revenue increased by $2.4 million compared to the prior year primarily due to increased dealer training.
Educational services and facilities expenses.
Our educational services and facilities expenses for the year ended September 30, 2017 were $181.0 million, representing a decrease of $13.4 million, or 6.9%, as compared to $194.4 million for the year ended September 30, 2016.
The following table sets forth the significant components of our educational services and facilities expenses:
|
Year Ended September 30,
|
||||||||
|
2017
|
2016
|
|||||||
|
(In thousands)
|
||||||||
|
Salaries expense
|
$
|
80,575
|
|
$
|
88,240
|
|
||
|
Employee benefits and tax
|
17,016
|
|
17,763
|
|
||||
|
Bonus expense
|
1,169
|
|
1,145
|
|
||||
|
Stock-based compensation
|
166
|
|
280
|
|
||||
|
Compensation and related costs
|
98,926
|
|
107,428
|
|
||||
|
Occupancy costs
|
35,693
|
|
36,292
|
|
||||
|
Depreciation and amortization expense
|
15,478
|
|
16,548
|
|
||||
|
Other educational services and facilities expense
|
13,349
|
|
14,097
|
|
||||
|
Supplies and maintenance
|
7,687
|
|
8,924
|
|
||||
|
Tools and training aids expense
|
6,442
|
|
6,606
|
|
||||
|
Contract services expense
|
3,452
|
|
4,500
|
|
||||
|
$
|
181,027
|
|
$
|
194,395
|
|
|||
Compensation and related costs decreased $8.5 million for the year ended September 30, 2017, as compared to the prior year:
• Salaries expense decreased $7.6 million, largely attributable to a decrease in the number of employees related to the reductions in workforce undertaken in September and November 2016, which primarily impacted non-instructor positions and related salaries expense. Partially offsetting this decrease was an increase of $0.8 million in salaries expense for our Long Beach, California campus, which opened in August 2015.
• Employee benefits and tax decreased $0.8 million due to the reduction in employee headcount and other changes to employee benefits. The decrease was partially offset by an increase in self-insurance medical claims.
Depreciation and amortization expense decreased $1.0 million during the year ended September 30, 2017 as a higher percentage of our fixed assets are fully depreciated.
Supplies and maintenance expense decreased $1.2 million during the year ended September 30, 2017 primarily as a result of cost savings efforts across our campus locations. The decrease was attributable to a higher level of spending in the prior year related to classroom renovations at certain campus locations and purchases related to the opening of our Long Beach, California campus, as well as increased focus on cost control initiatives during the current year.
Contract services expense decreased $1.0 million during the year ended September 30, 2017 primarily as a result of a decreased need for interpreter services.
81
Selling, general and administrative expenses.
Our selling, general and administrative expenses for the year ended September 30, 2017 were $145.1 million, representing a decrease of $26.3 million, or 15.4%, as compared to $171.4 million for the year ended September 30, 2016.
The following table sets forth the significant components of our selling, general and administrative expenses:
|
|
Year Ended September 30,
|
|||||||
|
2017
|
2016
|
|||||||
|
|
(In thousands)
|
|||||||
|
Salaries expense
|
$
|
57,613
|
|
$
|
71,153
|
|
||
|
Employee benefits and tax
|
13,170
|
|
15,817
|
|
||||
|
Bonus expense
|
3,061
|
|
4,793
|
|
||||
|
Stock-based compensation
|
2,829
|
|
4,624
|
|
||||
|
Compensation and related costs
|
76,673
|
|
96,387
|
|
||||
|
Advertising expense
|
38,561
|
|
41,191
|
|
||||
|
Other selling, general and administrative expenses
|
21,818
|
|
24,684
|
|
||||
|
Contract services expense
|
4,490
|
|
5,416
|
|
||||
|
Depreciation and amortization expense
|
2,691
|
|
2,543
|
|
||||
|
Bad debt expense
|
827
|
|
1,153
|
|
||||
|
$
|
145,060
|
|
$
|
171,374
|
|
|||
Compensation and related costs decreased $19.7 million for the year ended September 30, 2017, as compared to the prior year:
• Salaries expense decreased approximately $13.6 million, primarily due to savings realized following the September 2016 reduction in workforce and the restructuring of our campus admissions organization in June 2016. Additionally, severance expense decreased $3.6 million as compared to the prior year.
• Employee benefits and tax decreased $2.6 million due to the reduction in employee headcount and other changes to employee benefits. The decrease was partially offset by an increase in self-insurance medical claims.
• Bonus expense decreased $1.7 million, primarily due to minimal attainment on our largest bonus plan. This decrease was partially offset by the implementation in late 2016 of a graduate-based incentive compensation program for our admissions representatives.
• Stock-based compensation decreased $1.8 million, primarily due to a lower level of grants during 2016 and 2017.
Advertising expense decreased $2.6 million for the year ended September 30, 2017, as compared to the prior year. We have reduced or eliminated spending on certain channels in our media mix, reviewed our lead generation sources and eliminated lower-quality inquiries. Additionally, we invested approximately $1.5 million in additional success-based marketing initiatives. Advertising expense as a percentage of revenues for the year ended September 30, 2017 was approximately 11.9%.
Contract services expense decreased $0.9 million for the year ended September 30, 2017, due to a combination of decreased outplacement fees for terminated employees and the elimination of certain contracts with external vendors.
82
Other expense.
Our other expense for the year ended September 30, 2017 was $0.9 million, a decrease of $2.0 million as compared to $2.9 million for the year ended September 30, 2016. The year ended September 30, 2016 included an impairment charge of $0.8 million related to our investment in Pro-MECH. Additionally, the decrease is partially attributable to increased interest income and amortization of discounts on held to maturity securities as a result of higher investment balances during the year ended September 30, 2017.
Income taxes.
Our income tax expense for the year ended September 30, 2017 was $5.4 million, or 197.6% of pre-tax loss, compared to $26.2 million, or 121.6% of pre-tax loss, for the year ended September 30, 2016. The decrease in income tax expense was due primarily to the establishment of a valuation allowance on our deferred tax assets during the year ended September 30, 2016. We will maintain a valuation allowance on our deferred tax assets until sufficient positive evidence exists to support its reversal. The effective income tax rate in each period also differed from the federal statutory tax rate of 35% as a result of state income taxes, net of related federal income tax benefits.
Net Loss.
As a result of the foregoing, we reported net loss for the year ended September 30, 2017 of $8.1 million, as compared to $47.7 million for the year ended September 30, 2016.
Preferred stock dividends.
On June 24, 2016, we sold 700,000 shares of Series A Preferred Stock for $70.0 million in cash, less $1.2 million in issuance costs. Pursuant to this sale, we paid preferred stock cash dividends totaling $5.3 million during the year ended September 30, 2017 as compared to $1.4 million during the year ended September 30, 2016.
Loss available for distribution.
Loss available for distribution refers to net loss reduced by dividends on our Series A Preferred Stock. As a result of the foregoing, we reported a loss available for distribution for the year ended September 30, 2017 of $13.4 million, as compared to $49.1 million for the year ended September 30, 2016.
Non-GAAP financial measures
Our adjusted earnings before interest, tax, depreciation and amortization (adjusted EBITDA) for the years ended September 30,
2018
,
2017
and
2016
were
$(16.7) million
,
$17.9 million
and
$0.8 million
, respectively.
Adjusted EBITDA is a non-GAAP financial measure which is provided to supplement, but not substitute for, the most directly comparable GAAP measure. We choose to disclose this non-GAAP financial measure because it provides an additional analytical tool to clarify our results from operations and helps to identify underlying trends. Additionally, this measure helps compare our performance on a consistent basis across time periods. Management also utilizes EBITDA and free cash flow as performance measures internally. To obtain a complete understanding of our performance, these measures should be examined in connection with net income(loss) and net cash provided by (used in) operating activities, determined in accordance with GAAP. Since the items excluded from these measures are significant components in understanding and assessing financial performance under GAAP, these measures should not be considered to be an alternative to net income (loss) or net cash provided by (used in) operating activities as a measure of our operating performance or profitability. Exclusion of items in the non-GAAP presentation should not be construed as an inference that these items are unusual, infrequent or non-recurring. Other companies, including other companies in the education industry, may calculate non-GAAP financial measures differently than we do, limiting their usefulness as a comparative measure across companies. Investors are encouraged to use GAAP measures when evaluating our financial performance.
Information reconciling forward-looking EBITDA and free cash flow to the most directly comparable GAAP financial measure is unavailable to us without unreasonable effort. We are not able to provide a quantitative reconciliation of EBITDA or free cash flow to the most directly comparable GAAP financial measure because certain items required for such reconciliation are uncertain, outside of our control and/or cannot be reasonably predicted, such as the provision for (benefit from) income taxes. Preparation of such reconciliation would require a forward-looking statement of income and statement of cash flows prepared in accordance with GAAP, and such forward-looking financial statements are unavailable to us without unreasonable effort.
83
Adjusted EBITDA reconciles to net loss as follows:
|
|
Year Ended September 30,
|
|||||||||||
|
|
2018
|
2017
|
2016
|
|||||||||
|
|
||||||||||||
|
Net loss
|
$
|
(32,682
|
)
|
$
|
(8,128
|
)
|
$
|
(47,696
|
)
|
|||
|
Interest expense, net
|
1,885
|
|
2,481
|
|
3,196
|
|
||||||
|
Income tax expense (benefit)
|
(3,015
|
)
|
5,397
|
|
26,170
|
|
||||||
|
Depreciation and amortization
(1)
|
17,074
|
|
18,169
|
|
19,091
|
|
||||||
|
EBITDA
|
$
|
(16,738
|
)
|
$
|
17,919
|
|
$
|
761
|
|
|||
(1)
Includes depreciation of training equipment obtained in exchange for services of
$1.4 million
,
$1.3 million
and
$1.3 million
for the years ended September 30,
2018
,
2017
and
2016
, respectively.
Student retention/completion rate
Our consolidated student retention/completion rate is based on new students that began one of our programs during a fiscal year and completed or are still attending as of September 30 of the following fiscal year. The following table sets forth our consolidated student retention/completion rate during each of the periods indicated:
|
Year Ended September 30,
|
|||||||||
|
2018
|
2017
|
2016
|
|||||||
|
Consolidated student retention/completion
|
68
|
%
|
67
|
%
|
66
|
%
|
|||
Liquidity and Capital Resources
Based on past performance and current expectations, we believe that our cash flows from operations, cash on hand and investments will satisfy our working capital needs, capital expenditures, commitments and other liquidity requirements associated with our existing commitments and other liquidity requirements associated with our existing operations as well as the expansion of programs at existing campuses through the next 12 months.
We believe that the strategic use of our cash resources includes subsidizing funding alternatives for our students. Additionally, we evaluate the repurchase of our common stock, consideration of strategic acquisitions, expansion of programs at existing campuses, opening additional campus locations and other potential uses of cash.
On June 9, 2016, our Board of Directors voted to eliminate the quarterly cash dividend on our common stock. On June 24, 2016, we issued 700,000 shares of Series A Preferred Stock for a total purchase price of $70.0 million. The proceeds from the offering are intended to be used to fund strategic long-term growth initiatives, including the expansion to new markets of campuses on a scale similar to our Long Beach, California, Bloomfield, New Jersey and Dallas/Ft. Worth, Texas campuses and the creation of new programs in existing markets with under-utilized campus facilities. We may use the proceeds to fund strategic acquisitions that complement our core business. To the extent that potential acquisitions are large enough to require financing beyond cash from operations, cash and cash equivalents and investments on hand or we need capital to fund operations, new campus openings or expansion of programs at existing campuses, we may enter into a credit facility, issue debt or issue additional equity. We paid preferred stock cash dividends of $5.3 million
during the years ended September 30, 2018 and September 30, 2017, respectively
.
To the extent that we enter into leasing transactions that result in financing obligations or capital leases, our interest expense would increase. Our aggregate cash and cash equivalents and current investments were
$58.1
84
million
and
$97.9 million
as of September 30,
2018
and
2017
, respectively.
Our principal source of liquidity is operating cash flows and existing cash and cash equivalents. A majority of our revenues are derived from Title IV Programs and various veterans benefits programs. Federal regulations dictate the timing of disbursements of funds under Title IV Programs. Students must apply for new funding for each academic year consisting of thirty-week periods. Loan funds are generally provided in two disbursements for each academic year. The first disbursement for first-time borrowers is usually received 30 days after the start of a student’s academic year and the second disbursement is typically received at the beginning of the sixteenth week from the start of the student’s academic year. Under our proprietary loan program, we bear all credit and collection risk and students are not required to begin repayment until six months after the student completes or withdraws from his or her program. These factors, together with the timing of when our students begin their programs, affect our operating cash flow.
Operating Activities
Our net cash used in operating activities were
$13.5 million
and
$10.0 million
for the years ended September 30, 2018 and 2017, respectively. Our net cash provided by operating activities was
$7.4 million
for the year ended September 30,
2016
. The cash used in operating activities in
2018
was primarily attributable to net loss of
$32.7 million
and adjustments of $17.1 million for non-cash and other items, partially offset by a cash inflow of $2.1 million related to the change in our operating assets and liabilities.
Changes in operating assets and liabilities
For the year ended September 30,
2018
, the changes in our operating assets and liabilities resulted in cash inflows of $2.1 million. The inflows were primarily attributable to changes in deferred rent, accounts payable and accrued expenses and notes receivable. The inflow was partially offset by changes in deferred revenue, receivables and prepaid expenses and other current assets.
The increase in deferred rent liability resulted in a cash inflow of $5.1 million and was primarily due to the Bloomfield, New Jersey campus partially offset by amortization of the deferred rent balance associated with our home office lease. The inflow in accounts payable and accrued expenses of $3.9 million was primarily related to changes in our graduate-based incentive compensation program for our admissions representatives. The change in notes receivable resulted in a cash inflow of $3.4 million and was due to payments received on loans exceeding new loan originations. Partially offsetting the cash inflows was a decrease in deferred revenue, which resulted in a cash outflow of $5.7 million and was primarily attributable to the timing of student starts, the number of students in school and where they were at period end in relation to completion of their program at September 30, 2018 compared to September 30, 2017. The increase in receivables resulted in a cash outflow of $2.7 million and was primarily attributable to the timing of cash receipts on behalf of our students. The increase in prepaid expenses and other current assets resulted in a cash outflow of $1.6 million primarily related to the timing of the payment made for general invoices compared to the prior year.
For the year ended September 30, 2017, the changes in our operating assets and liabilities resulted in cash outflows of $20.8 million. The outflows were primarily attributable to changes in restricted cash, accounts payable and accrued expenses, deferred revenue, receivables and deferred rent. The outflow was partially offset by a change in income tax from a receivable position to a payable position.
The outflow in restricted cash of $11.1 million was primarily related to the collateralization of surety bonds. The decrease in accounts payable and accrued expenses resulted in a cash outflow of $4.8 million due to decreases in accrued bonus due to minimal attainment on our largest bonus plan compared to prior year, accrued severance from the November 2016 reduction in workforce and accrued expenses primarily due to the timing of when we purchase loans from our tuition loan program. The decrease was partially offset by an increase in accrued advertising costs for marketing initiatives. The decrease in deferred revenue resulted in a cash outflow of $3.1
85
million and was primarily attributable to the timing of student starts, the number of students in school and where they were at period end in relation to completion of their program at September 30, 2017 compared to September 30, 2016. The increase in receivables resulted in a cash outflow of $3.0 million, and was primarily attributable to the timing of cash receipts on behalf of our students, and a decrease in our allowance for doubtful accounts. The decrease in deferred rent liability resulted in a cash outflow of $2.1 million and was primarily due to amortization of the deferred rent balance associated with our home office lease. Partially offsetting the cash outflows was a change in income tax from a receivable position to a payable position, which resulted in a cash inflow of $2.7 million and was primarily due to the loss carrybacks that occurred in the prior year and the timing of tax payments and refunds.
For the year ended September 30, 2016, the changes in our operating assets and liabilities resulted in cash inflows of $3.6 million. The inflows were primarily attributable to changes in receivables and accounts payable and accrued expenses. The decrease in receivables resulted in a cash inflow of $8.2 million, and was primarily attributable to the timing of cash receipts on behalf of our students, and a decrease in our allowance for doubtful accounts. The increase in accounts payable and accrued expenses resulted in a cash inflow of $1.9 million and was primarily due to the timing of invoices. Partially offsetting the increases was a change in income tax from a payable position to a receivable position, which resulted in a cash outflow of $3.4 million and was primarily due to loss carrybacks and the timing of tax payments and receipts.
Investing Activities
For the year ended September 30,
2018
, cash provided by investing activities was
$28.0 million
. We had cash inflows of $40.9 million and $7.7 million from proceeds received from sales of trading securities and proceeds received upon the maturity of our investments, respectively. We had cash outflows of $20.6 million related to the purchases of new training equipment for our Bloomfield, New Jersey campus and replacement training equipment for our ongoing operations.
For the year ending September 30, 2019, we anticipate investing in capital expenditures in the range of $8.0 to $9.0 million. Of this total, approximately $1.6 million is attributable to opening our Welding Technology program at our Dallas/Ft. Worth, Texas campus, with an additional $1.0 million related to course development.
For the year ended September 30, 2017, cash used in investing activities was $52.2 million. We had cash outflows for the purchase of trading securities and held to maturity investments of $42.7 million and $9.7 million, respectively. We had cash outflows of $8.2 million related to the purchases of new and replacement training equipment for our ongoing operations. We had cash inflows of $3.6 million and $2.7 million from proceeds received upon the maturity of our investments and proceeds received from sales of trading securities, respectively.
For the year ended September 30, 2016, cash provided by investing activities was $17.3 million. We had cash inflows of $27.7 million of proceeds received upon the maturity of our investments. We had cash outflows of $7.5 million related to the purchases of new and replacement training equipment for our ongoing operations. We had a cash outflow of $1.5 million related to the acquisition of BMS and a cash outflow of $1.0 million related to an investment in Pro-Mech.
Financing Activities
For the year ended September 30,
2018
, cash used in financing activities was
$6.6 million
. We had cash outflows related primarily to the payment of preferred stock dividends of $2.6 million on September 25, 2018 and on March 28, 2018, respectively. We also had cash outflows of $1.1 million related to the repayment of financing obligations.
86
For the year ended September 30, 2017, cash used in financing activities was $6.8 million and related primarily to the payment of preferred stock dividends of $2.6 million on September 25, 2017 and on March 28, 2017.
For the year ended September 30, 2016, cash provided by financing activities was $64.9 million and was primarily attributable to the net cash proceeds of $68.9 million for the issuance of preferred stock. We paid common stock cash dividends in October 2015, December 2015 and March 2016 of $0.02 per share, totaling $1.5 million. In June 2016, our Board of Directors voted to eliminate the quarterly cash dividend on our common stock. We paid $1.4 million for preferred stock cash dividends in September 2016.
Share Repurchase Program
On December 20, 2011, our Board of Directors authorized the repurchase of up to $25.0 million of our common stock in the open market or through privately negotiated transactions. The timing and actual number of shares purchased will depend on a variety of factors such as price, corporate and regulatory requirements, and prevailing market conditions. We may terminate or limit the share repurchase program at any time without prior notice. During the
year ended September 30, 2018
, we did not repurchase any shares. As of
September 30, 2018
, we have repurchased
1,677,570
shares at an average price per share of
$9.09
and a total cost of approximately
$15.3 million
under this program. Under the terms of the Purchase Agreement, stock purchases under this program require the approval of a majority of the voting power of the Series A Preferred Stock.
Contractual Obligations
The following table sets forth, as of September 30,
2018
, the aggregate amounts of our significant contractual obligations and commitments with definitive payment terms that will require cash outlays in the future.
|
Payments Due by Period
|
||||||||||||||||||||
|
Less than
|
1-3
|
3-5
|
More than
|
|||||||||||||||||
|
Total
|
1 year
|
years
|
years
|
5 years
|
||||||||||||||||
|
(In thousands)
|
||||||||||||||||||||
|
Operating leases, net of sublease income
(1)
|
$
|
151,514
|
|
$
|
28,018
|
|
$
|
51,315
|
|
$
|
31,559
|
|
$
|
40,622
|
|
|||||
|
Purchase obligations
(2)
|
37,963
|
|
25,258
|
|
6,920
|
|
3,520
|
|
2,265
|
|
||||||||||
|
Other long-term obligations
(3)
|
74,376
|
|
5,398
|
|
10,235
|
|
10,447
|
|
48,296
|
|
||||||||||
|
Total contractual commitments
|
$
|
263,853
|
|
$
|
58,674
|
|
$
|
68,470
|
|
$
|
45,526
|
|
$
|
91,183
|
|
|||||
|
(1)
|
Minimum rental commitments. These amounts do not include property taxes, insurance or normal recurring repairs and maintenance.
|
|
(2)
|
Includes all agreements to purchase goods or services of either a fixed or minimum quantity that are enforceable and legally binding. Additionally, purchase orders outstanding as of September 30,
2018
, employment contracts and minimum payments under licensing and royalty agreements are included.
|
|
(3)
|
Includes lease payments for our Lisle, Illinois and Long Beach, California campuses which are accounted for as financing obligations. See Note 9 of the notes to our Consolidated Financial Statements within Part II, Item 8 of this Report on Form 10-K for further discussion.
|
87
Off-Balance Sheet Arrangements
Each of our campuses must be authorized by the applicable state education agency in which the campus is located to operate and to grant certificates, diplomas or degrees to its students. Our campuses are subject to extensive, ongoing regulation by each of these states. Additionally, our campuses are required to be authorized by the applicable state education agencies of certain other states in which our campuses recruit students. Our insurers issue surety bonds for us on behalf of our campuses and admissions representatives with multiple states to maintain authorization to conduct our business. We are obligated to reimburse our insurers for any surety bonds that are paid by the insurers. As of September 30,
2018
, the total face amount of these surety bonds was approximately $19.5 million. During the year ended September 30, 2017, we renegotiated the bonds required to operate and collateralized approximately $11.5 million in bonds, which are reflected in restricted cash on our consolidated balance sheets.
Additionally, our consolidated balance sheets do not reflect our operating lease obligations described above in "Contractual Obligations" or our proprietary loan program described below in "Critical Accounting Estimates".
Related Party Transactions
Information concerning certain related party transactions is included in Note 13 of the notes to our Consolidated Financial Statements within Part II, Item 8 of this Report on Form 10-K.
For a description of additional information regarding related party transactions, see the information included in our proxy statement for the 2019 Annual Meeting of Stockholders under the heading “Certain Relationships and Related Transactions”.
Seasonality
Our revenues and operating results normally fluctuate as a result of seasonal variations in our business, principally due to changes in total student population and costs associated with opening or expanding our campuses. Our student population varies as a result of new student enrollments, graduations and student attrition. Historically, we have had lower student populations in our third quarter than in the remainder of our year because fewer students are enrolled during the summer months. Additionally, we have had higher student populations in our fourth quarter than in the remainder of the year because more students enroll during this period. Our expenses, however, do not vary significantly with changes in student population and revenues and, as a result, such expenses do not fluctuate significantly on a quarterly basis. We expect quarterly fluctuations in operating results to continue as a result of seasonal enrollment patterns. Such patterns may change, however, as a result of new school openings, new program introductions, increased enrollments of adult students or acquisitions. Furthermore, our revenues for the first quarter ending December 31 are impacted by the closure of our campuses for a week in December for a holiday break and during which we do not earn revenue.
Operating income is negatively impacted during the initial start up of new campus openings. We incur marketing and admissions costs as well as campus personnel costs in advance of the campus opening. Typically we begin to incur such costs approximately 12 to 15 months in advance of the campus opening with the majority of the costs being incurred in the nine month period prior to a campus opening.
88
|
Revenues
|
|||||||||||||||||||||
|
Year Ended September 30,
|
|||||||||||||||||||||
|
2018
|
2017
|
2016
|
|||||||||||||||||||
|
Three Month Period Ending:
|
Amount
|
Percent
|
Amount
|
Percent
|
Amount
|
Percent
|
|||||||||||||||
|
($'s in thousands)
|
|||||||||||||||||||||
|
December 31
|
$
|
81,156
|
|
25.6
|
%
|
$
|
84,179
|
|
26.0
|
%
|
$
|
89,773
|
|
25.9
|
%
|
||||||
|
March 31
|
80,663
|
|
25.5
|
%
|
82,497
|
|
25.4
|
%
|
88,192
|
|
25.4
|
%
|
|||||||||
|
June 30
|
74,890
|
|
23.6
|
%
|
76,258
|
|
23.5
|
%
|
82,266
|
|
23.7
|
%
|
|||||||||
|
September 30
|
80,256
|
|
25.3
|
%
|
81,329
|
|
25.1
|
%
|
86,915
|
|
25.0
|
%
|
|||||||||
|
$
|
316,965
|
|
100
|
%
|
$
|
324,263
|
|
100
|
%
|
$
|
347,146
|
|
100
|
%
|
|||||||
|
Income (Loss) from Operations
|
|||||||||||||||||||||
|
Year Ended September 30,
|
|||||||||||||||||||||
|
2018
|
2017
|
2016
|
|||||||||||||||||||
|
Three Month Period Ending:
|
Amount
|
Percent
|
Amount
|
Percent
|
Amount
|
Percent
|
|||||||||||||||
|
($'s in thousands)
|
|||||||||||||||||||||
|
December 31
|
$
|
(3,604
|
)
|
10.2
|
%
|
$
|
1,387
|
|
(76.0
|
)%
|
$
|
(2,193
|
)
|
11.8
|
%
|
||||||
|
March 31
|
(8,820
|
)
|
25.0
|
%
|
687
|
|
(37.7
|
)%
|
(5,770
|
)
|
31.0
|
%
|
|||||||||
|
June 30
|
(11,800
|
)
|
33.5
|
%
|
(2,784
|
)
|
152.6
|
%
|
(5,450
|
)
|
29.2
|
%
|
|||||||||
|
September 30
|
(11,051
|
)
|
31.3
|
%
|
(1,114
|
)
|
61.1
|
%
|
(5,210
|
)
|
28.0
|
%
|
|||||||||
|
$
|
(35,275
|
)
|
100
|
%
|
$
|
(1,824
|
)
|
100
|
%
|
$
|
(18,623
|
)
|
100
|
%
|
|||||||
The decline in revenues for each of the three month periods ended March 31, June 30 and September 30, 2018; March 31, June 30, September 30 and December 31, 2017; and December 31, 2016, as compared to the same periods in the prior year, was primarily due to a decrease in our student population in 2018 and 2017, respectively. The decrease in our student population also contributed to a decline in income (loss) from operations for the three month periods ended March 31, June 30 and September 30, 2018, and December 31, 2017, as compared to the same periods in the prior year.
For the three month periods ended March 31, June 30 and September 30, 2017, and December 31, 2016, income (loss) from operations improved as compared to the same periods in the prior year. The increases for the three month periods ended December 31, 2016, March 31, June 30 and September 30, 2017 were primarily attributable to cost control efforts from our Financial Improvement Plan.
Critical Accounting Estimates
Our discussion of our financial condition and results of operations is based upon our financial statements, which have been prepared in accordance with accounting principles generally accepted in the United States, or GAAP. During the preparation of these financial statements, we are required to make estimates and assumptions that affect the reported amounts of assets, liabilities, revenues and expenses and related disclosures of contingent assets and liabilities. On an ongoing basis, we evaluate our estimates and assumptions, including those related to revenue recognition, our proprietary loan program, allowance for uncollectible accounts, goodwill recoverability, self-insurance claim liabilities, income taxes and contingencies. We base our estimates on historical experience and on various other assumptions that we believe are reasonable under the circumstances. The results of our analysis form the basis for making judgments about the carrying values of assets and liabilities that are not readily apparent from other sources. Actual results may differ from these estimates under different assumptions or
89
conditions, and the impact of such differences may be material to our consolidated financial statements.
Our significant accounting policies are discussed in Note 2 of the notes to our Consolidated Financial Statements within Part II, Item 8 of this Report on Form 10-K. We believe that the following accounting estimates are the most critical to aid in fully understanding and evaluating our reported financial results, and they require management’s most subjective and complex judgments in estimating the effect of inherent uncertainties.
Revenue recognition.
Revenues consist primarily of student tuition and fees derived from the programs we provide after reductions are made for discounts and scholarships that we sponsor and for refunds for students who withdraw from our programs prior to specified dates. We apply the five-step model outlined in Accounting Standards Codification Topic 606, Revenue from Contracts from Customers (ASC 606).Tuition and fee revenue is recognized ratably over the term of the course or program offered. Approximately 98% of our revenues for each of the years ended September 30, 2018, 2017 and 2016 consisted of tuition. The majority of our core programs are designed to be completed in 33 to 102 weeks, and our advanced training programs range from 12 to 23 weeks in duration. We supplement our revenues with sales of textbooks and program supplies and other revenues, which are recognized as the transfer of goods or services occurs. Deferred revenue represents the excess of tuition and fee payments received as compared to tuition and fees earned and is reflected as a current liability in our consolidated balance sheets because it is expected to be earned within the next 12 months.
Through our proprietary loan program, we, in substance, provide the students who participate in this program with extended payment terms for a portion of their tuition. Based on historical collection rates, we believe a portion of these loans are collectible, which results in a change in accounting due to our adoption of ASC 606 on October 1, 2017. Accordingly, we recognize tuition and loan origination fees financed by the loan and any related interest revenue under the effective interest method required under the loan based on this collection rate.
Other.
We provide dealer technician training or instructor staffing services to manufacturers. Revenues are recognized as transfer of the services occurs.
Proprietary Loan Program.
In order to provide funding for students who are not able to fully finance the cost of their education under traditional governmental financial aid programs, commercial loan programs or other alternative sources, we established a private loan program with a bank.
Under the terms of the proprietary loan program, the bank originates loans for our students who meet our specific credit criteria with the related proceeds used exclusively to fund a portion of their tuition. We then purchase all such loans from the bank at least monthly and assume all of the related credit risk. The loans bear interest at market rates ranging from approximately 7% to 10%; however, principal and interest payments are not required until six months after the student completes or withdraws from his or her program. After the deferral period, monthly principal and interest payments are required over the related term of the loan. The repayment term is up to 10 years.
Under ASC 606, the portion of tuition revenue related to the proprietary loan program is considered a form of variable consideration. We estimate the amount we ultimately expect to collect from the portion of tuition that is funded by the proprietary loan program, resulting in a note receivable. Estimating the collection rate requires significant management judgment. The estimated amount is determined at the inception of the contract and we recognize the related revenue as the student progresses through school. Each reporting period, we update our assessment of the variable consideration associated with the proprietary loan program.
Allowance for uncollectible accounts.
We maintain an allowance for uncollectible accounts for estimated losses resulting from the inability, failure or refusal of our students to make required payments. We offer a variety of payment plans to help students pay that portion of their education expenses not covered by financial aid programs or alternate fund sources, which are unsecured and not guaranteed.
90
We use estimates that are subjective and require judgment in determining the allowance for doubtful accounts, which are principally based on accounts receivable, historical percentages of uncollectible accounts, customer credit worthiness and changes in payment history when evaluating the adequacy of the allowance for uncollectible accounts. We also monitor and consider external factors such as changes in the economic and regulatory environment. We use an internal group of collectors, augmented by third party collectors as deemed appropriate, in our collection efforts. When a student with Title IV loans withdraws, Title IV rules determine if we are required to return a portion of Title IV funds to the lender. We are then entitled to collect these funds from the students, but collection rates for these types of receivables is significantly lower than our collection rates for receivables for students who remain in our programs.
Although we believe that our allowance is adequate, if we underestimate the allowances required, additional allowances may be necessary, which would result in increased selling, general and administrative expenses in the period such determination is made.
Goodwill
.
Goodwill represents the excess of the cost of an acquired business over the estimated fair values of the assets acquired and liabilities assumed. Goodwill is reviewed at least annually for impairment, which might result from the deterioration in the operating performance of the acquired business, adverse market conditions, adverse changes in the applicable laws or regulations and a variety of other circumstances. Any resulting impairment charge would be recognized as an expense in the period in which impairment is identified.
Our goodwill resulted primarily from the acquisition of our motorcycle and marine education business in 1998, and we recorded $8.2 million related to the goodwill allocated to our MMI Orlando, Florida campus that provides the related educational programs. Additionally, we recorded $0.8 million of goodwill related to the acquisition of BrokenMyth Studios, LLC (BMS) in February 2016.
We perform our annual goodwill impairment assessment during the fourth quarter of each fiscal year.
In performing our impairment tests, we first consider the option to assess qualitative factors to determine whether it is more likely than not that the fair value of a reporting unit or intangible, as applicable, is less than its carrying amount. If we conclude that it is more likely than not that the fair value is less than the carrying amount based on our qualitative assessment, or that a qualitative assessment should not be performed, we proceed with the quantitative impairment tests to compare the estimated fair value of the reporting unit to the carrying value of its net assets.
The process of evaluating goodwill and indefinite-lived intangibles for impairment is subjective and requires significant judgment at many points during the analysis. If we elect to perform an optional qualitative analysis, we consider many factors including, but not limited to, general economic conditions, industry and market conditions, our market capitalization, financial performance and key business drivers, long-term operating plans and potential changes to significant assumptions used in the most recent fair value analysis for the reporting unit.
When performing a quantitative goodwill impairment test, we generally determine the fair value of reporting units using an income-based approach consisting of a discounted cash flow valuation method. The fair value determination consists primarily of using unobservable inputs under the fair value measurement standards, and we believe our related assumptions are consistent with a reasonable market participant view while employing the concept of highest and best use of the asset.
We believe the most critical assumptions and estimates in determining the estimated fair value of our reporting units include, but are not limited to, future tuition revenues, operating costs, working capital changes, capital expenditures and a discount rate. The assumptions used in determining our expected future cash flows consider various factors such as historical operating trends particularly in student enrollment and pricing and long-term operating strategies and initiatives.
91
2018
Impairment Testing
We completed our
2018
annual goodwill impairment tests and determined that there was no impairment related to our MMI Orlando, Florida campus. We performed a quantitative goodwill impairment test using the fair value method described above. Our goodwill resulted primarily from the acquisition of our motorcycle and marine education business in 1998. $8.2 million of goodwill is allocated to our MMI Orlando, Florida campus that provides the related educational programs. Our analysis included consideration of macro-economic and company-specific factors as well as the synergies we are beginning to realize as we integrate this reporting unit into our business. Actual experience may differ from the amounts included in our assessment, which could result in additional impairment of our goodwill in the future. Our total recorded goodwill was $8.2 million as of September 30, 2018.
During the year ended September 30, 2018, due to the deteriorating operating performance of BMS and a decline in projected operating performance identified during our mid-year budget review, at June 30, 2018, we completed an interim test for impairment of the reporting unit and determined that the carrying value of this reporting unit exceeded its fair value, indicating goodwill impairment existed. The result of our valuation indicated that there was no remaining implied value attributable to goodwill in our BMS acquisition, and accordingly, we expensed all $0.8 million of the goodwill associated with that acquisition for the year ended September 30, 2018. Additionally, we determined that related definite-lived intangible assets were impaired, and we expensed the remaining $0.4 million remaining book value for the year ended September 30, 2018. Both impairment charges are included in our selling, general and administrative expenses in our condensed consolidated statement of loss.
Self-Insurance.
We are self-insured for a number of risks, including claims related to employee health care and dental care and workers’ compensation. The accounting for our self-insured plans involves estimates and judgments to determine our ultimate liability related to reported claims and claims incurred but not reported. We consider our historical experience, severity factors, actuarial analysis and existing stop loss insurance in estimating our ultimate insurance liability. If our insurance claim trends were to differ significantly from our historic claim experience, we would make a corresponding adjustment to our insurance reserves.
Income taxes
. We are subject to the income tax laws of the United States, which are complex and subject to different interpretations by the taxpayer and the relevant governmental taxing authorities. As a result, significant judgments and interpretations are required in determining our provision for income taxes.
Each reporting period, we estimate the likelihood that we will be able to recover our deferred tax assets, which represent timing differences in the recognition of revenue and certain tax deductions for accounting and tax purposes. The realization of deferred tax assets is dependent, in part, upon future taxable income. In assessing the need for a valuation allowance, we consider all available evidence, including our historical profitability and projections of future taxable income. If, based on the weight of available evidence, it is more likely than not the deferred tax assets will not be realized, we record a valuation allowance. Such valuation allowance is maintained on our deferred tax assets until sufficient positive evidence exists to support its reversal in future periods. The weight given to the positive and negative evidence is commensurate with the extent to which the evidence may be objectively verified. Significant judgment is required to determine if, and the extent to which, valuation allowances should be recorded against deferred tax assets. Changes in the valuation allowance are included in our statement of operations as a charge or credit to income tax expense.
As a result of our assessment, income tax expense within our statements of loss was impacted by a decrease of $7.1 million and an increase of $6.2 million in the valuation allowance during the years ended September 30, 2018 and 2017, respectively. The amount of the deferred tax assets considered realizable, however, could be adjusted in future periods if estimates of future taxable income during the carryforward period are increased, if objective negative evidence in the form of cumulative losses is no longer present and if additional weight may be given to subjective evidence such as our projections for growth. We will continue to evaluate our valuation allowance in future periods for any change in circumstances that causes a change in judgment about the realizability of the deferred tax assets.
92
Although we believe that our estimates are reasonable, changes in tax laws or our interpretation of tax laws, and the outcome of future tax audits could significantly impact the amounts provided for income taxes in our consolidated financial statements. Additionally, actual operating results and the underlying amount and category of income in future years could render our current assessment of recoverable deferred tax assets inaccurate.
Contingencies.
In the ordinary conduct of our business, we are subject to occasional lawsuits, investigations and claims, including, but not limited to, claims involving students and graduates and routine employment matters. When we are aware of a claim or potential claim, we assess the likelihood of any loss or exposure. If it is probable that a loss will result and the amount of the loss can be reasonably estimated, we record a liability for the loss. If the loss is not probable or the amount of the loss cannot be reasonably estimated, we disclose the nature of the specific claim if the likelihood of a potential loss is reasonably possible and the amount involved is material. Generally, we expense legal fees as incurred. There can be no assurance that the ultimate outcome of any of the lawsuits, investigations or claims pending against us will not have a material adverse effect on our financial condition or results of operations.
Recent Accounting Pronouncements
Information concerning recently issued accounting pronouncements which are not yet effective is included in Note 3 of the notes to our Consolidated Financial Statements within Part II, Item 8 of this Report on Form 10-K. As indicated in Note 3, we are still evaluating the impact of the recently issued accounting pronouncements on our financial statements.
Our principal exposure to market risk relates to changes in interest rates. We invest our cash and cash equivalents in mutual funds that invest in U.S. treasury notes, U.S. treasury bills and repurchase agreements collateralized by U.S. treasury notes, U.S. treasury bills and pre-funded municipal bonds collateralized by escrowed-to-maturity U.S. treasury notes. As of September 30,
2018
, we held
$58.1 million
in cash and cash equivalents and no investments. For the year ended September 30,
2018
, we earned interest income of
$1.4 million
. We do not believe that reasonably possible changes in interest rates will have a material effect on our financial position, results of operations or cash flows.
As of September 30,
2018
, we did not have short-term or long-term borrowings.
Effect of Inflation
To date, inflation has not had a significant effect on our operations.
93
The following financial statements of the Company and its subsidiaries are included below on pages F-2 to F-49 of this report:
|
|
|
Page
Number
|
|
|
||
|
|
||
|
|
||
|
|
||
|
|
||
|
|
||
|
|
||
None.
Disclosure Controls and Procedures
Under the supervision and with the participation of our management, including our President and Chief Executive Officer and our Interim Chief Financial Officer, we have evaluated the effectiveness of the design and operation of our disclosure controls and procedures (as such term is defined in Rules 13a-15(e) and 15d-15(e) under the Exchange Act) as of September 30,
2018
, pursuant to Exchange Act Rule 13a-15. Based upon that evaluation, the President and Chief Executive Officer and the Interim Chief Financial Officer concluded that our disclosure controls and procedures as of September 30,
2018
were effective in ensuring that (i) information required to be disclosed by the Company in the reports that it files or submits under the Exchange Act is recorded, processed, summarized and reported, within the time periods specified in the SEC’s rules and forms and (ii) information required to be disclosed by the Company in the reports that it files or submits under the Exchange Act is accumulated and communicated to the Company’s management, including its principal executive and principal financial officers, or persons performing similar functions, as appropriate to allow timely decisions regarding required disclosure.
Changes in Internal Control Over Financial Reporting
We implemented the new revenue recognition standard as of October 1, 2017. As a result, we made the following significant modifications to our internal controls, including changes to accounting policies and procedures, operational processes and documentation practices:
|
•
|
Updated our policies and procedures related to recognizing revenue and added documentation processes related to meeting the new criteria for recognizing revenue.
|
|
•
|
Added controls for reviewing constrained variable consideration and reevaluating our significant contract judgments and estimates on a quarterly basis.
|
94
|
•
|
Added controls to address related required disclosures regarding revenue, including the disclosure of performance obligations and our significant judgments and estimates for determining the transaction price and when to recognize revenue.
|
Other than the items described above, there were no changes during the three months ended September 30, 2018 that have materially affected, or are reasonably likely to materially affect, our internal control over financial reporting.
Management’s Report on Internal Control Over Financial Reporting and our Independent Registered Public Accounting Firm’s report with respect to the effectiveness of our internal control over financial reporting are included on pages F-2 and F-3, respectively, of this Report on Form 10-K.
Limitations on Effectiveness of Controls and Procedures
Our management, including our President and Chief Executive Officer and our Interim Chief Financial Officer, does not expect that our disclosure controls and procedures or our internal controls over financial reporting will prevent all error and all fraud. A control system, no matter how well conceived and operated, can provide only reasonable, not absolute, assurance that the objectives of the control system are met. Further, the design of a control system must reflect the fact that there are resource constraints, and the benefits of controls must be considered relative to their costs. Because of the inherent limitations in all control systems, no evaluation of controls can provide absolute assurance that all control issues, misstatements, errors and instances of fraud, if any, within our company have been or will be prevented or detected. These inherent limitations include the realities that judgments in decision-making can be faulty and that breakdowns can occur because of simple error or mistake. Controls also can be circumvented by the individual acts of some persons, by collusion of two or more people or by management override of the controls. The design of any system of controls is based in part on certain assumptions about the likelihood of future events, and there can be no assurance that any design will succeed in achieving its stated goals under all potential future conditions. Projections of any evaluation of controls effectiveness to future periods are subject to risks that internal controls may become inadequate as a result of changes in conditions, or through the deterioration of the degree of compliance with policies or procedures.
Management’s Certifications
The Company has filed as exhibits to its Annual Report on Form 10-K for the year ended September 30,
2018
, filed with the SEC, the certifications of the President and Chief Executive Officer and the Interim Chief Financial Officer of the Company required by Section 302 of the Sarbanes-Oxley Act of 2002.
The Company has submitted to the NYSE the most recent Annual Chief Executive Officer Certification as required by Section 303A.12(a) of the NYSE Listed Company Manual.
None.
The information set forth in our proxy statement for the 2019 Annual Meeting of Stockholders under the headings “Election of Directors”; “Corporate Governance and Related Matters”; “Code of Conduct”; “Corporate Governance Guidelines” and “Section 16(a) Beneficial Ownership Reporting Compliance” is incorporated herein by reference. Information regarding executive officers of the Company is set forth under the caption “Executive Officers of Universal Technical Institute, Inc.” in Part I hereof.
95
The information set forth in our proxy statement for the 2019 Annual Meeting of Stockholders under the heading “Executive Compensation”, “Compensation Committee Interlocks” and “Compensation Committee Report” is incorporated herein by reference.
The information set forth in our proxy statement for the 2019 Annual Meeting of Stockholders under the headings “Equity Compensation Plan Information” and “Security Ownership of Certain Beneficial Owners and Management” is incorporated herein by reference.
The information set forth in our proxy statement for the 2019 Annual Meeting of Stockholders under the heading “Certain Relationships and Related Transactions” and “Corporate Governance and Related Matters” is incorporated herein by reference.
The information set forth in our proxy statement for the 2019 Annual Meeting of Stockholders under the heading “Fees Paid to Independent Registered Public Accounting Firm” and “Audit Committee Pre-Approval Procedures for Services Provided by the Independent Registered Public Accounting Firm” is incorporated herein by reference.
96
|
(a)
|
Documents filed as part of this Annual Report on Form 10-K:
|
|
(1)
|
The financial statements required to be included in this Annual Report on Form 10-K are included in Item 8 of this Report.
|
|
(2)
|
All other schedules have been omitted because they are not required, are not applicable, or the required information is shown on the financial statements or the notes thereto.
|
|
(3)
|
Exhibits:
|
|
Exhibit Number
|
Description
|
|
Restated Certificate of Incorporation of the Registrant. (Incorporated by reference to Exhibit 3.1 to the Registrant’s Annual Report on Form 10-K dated December 23, 2004.)
|
|
|
Amended and Restated Bylaws of the Registrant. (Incorporated by reference to Exhibit 3.2 to the Form 8-K filed by the Registrant on June 30, 2016.)
|
|
|
Certificate of Designation, Preferences and Rights of Series A Convertible Preferred Stock. (Incorporated by reference to Exhibit 3.1 to the Form 8-K filed by the Registrant on June 24, 2016.)
|
|
|
Certificate of Designation, Preferences and Rights of Series E Junior Participating Preferred Stock. (Incorporated by reference to Exhibit 3.1 to the Form 8-K filed by the Registrant on June 30, 2016.)
|
|
|
Specimen Certificate evidencing shares of common stock. (Incorporated by reference to Exhibit 4.1 to the Registrant’s Registration Statement on Form S-1 dated October 3, 2003, or an amendment thereto (No. 333-109430).)
|
|
|
Registration Rights Agreement, dated December 16, 2003, between the Registrant and certain stockholders signatory thereto. (Incorporated by reference to Exhibit 4.2 to the Registrant’s Registration Statement on Form S-1 dated October 3, 2003, or an amendment thereto (No. 333-109430).)
|
|
|
Registration Rights Agreement dated June 24, 2016 by and between the Registrant and Coliseum Holdings I, LLC. (Incorporated by reference to Exhibit 4.1 to the Form 8-K filed by the Registrant on June 24, 2016.)
|
|
|
Rights Agreement, dated as of June 29, 2016, by and between the Registrant and Computershare Inc., as Rights Agent. (Incorporated by reference to Exhibit 4.1 to the Form 8-K filed by the Registrant on June 30, 2016.)
|
|
|
Amendment to Rights Agreement, dated as of February 21, 2017, by and between the Registrant and Computershare Inc., as Rights Agent. (Incorporated by reference to Exhibit 4.1 to the Form 8-K filed by the Registrant on February 21, 2017.)
|
|
97
|
Exhibit Number
|
Description
|
|
Universal Technical Institute Executive Benefit Plan, effective March 1, 1997. (Incorporated by reference to Exhibit 10.2 to the Registrant’s Registration Statement on Form S-1 dated October 3, 2003, or an amendment thereto (No. 333-109430).)
|
|
|
Management 2002 Option Program. (Incorporated by reference to Exhibit 10.5 to the Registrant’s Registration Statement on Form S-1 dated October 3, 2003, or an amendment thereto (No. 333-109430).)
|
|
|
Universal Technical Institute, Inc. 2003 Incentive Compensation Plan (as amended March 1, 2017). (Formerly known as the 2003 Stock Incentive Plan). (Incorporated by reference to Exhibit 10.1 to the Form 8-K filed by the Registrant on March 3, 2017.)
|
|
|
Form of Restricted Stock Unit Agreement. (Incorporated by reference to Exhibit 10.1 to the Form 8-K filed by the Registrant on September 11, 2013.)
|
|
|
Form of Restricted Stock Unit Agreement. (Incorporated by reference to Exhibit 10.1 to the Form 8-K filed by the Registrant on September 10, 2014.)
|
|
|
Form of Performance Unit Award Agreement. (Incorporated by reference to Exhibit 10.4.3 to the Annual Report on Form 10-K filed by the Registrant on December 1, 2017.)
|
|
|
Form of Performance Unit Award Agreement. (Incorporated by reference to Exhibit 10.4.4 to the Annual Report on Form 10-K filed by the Registrant on December 1, 2017.)
|
|
|
Form of Performance Cash Award Agreement. (Incorporated by reference to Exhibit 10.4.5 to the Annual Report on Form 10-K filed by the Registrant on December 1, 2017.)
|
|
|
Form of Performance Cash Award Agreement. (Incorporated by reference to Exhibit 10.4.6 to the Annual Report on Form 10-K filed by the Registrant on December 1, 2017.)
|
|
|
Lease Agreement, dated July 2, 2001, as amended February 27, 2015, between Delegates LLC, as landlord, and The Clinton Harley Corporation, as tenant. (Incorporated by reference to Exhibit 10.14 to the Registrant’s Registration Statement on Form S-1 dated October 3, 2003, or an amendment thereto (No. 333-109430), and Exhibit 10.1 to the Form 10-Q filed by the Registrant on May 1, 2015.)
|
|
|
Form of Indemnification Agreement by and between the Registrant and its directors and officers. (Incorporated by reference to Exhibit 10.7 to the Form 8-K filed by the Registrant on August 6, 2014.)
|
|
|
Deferred Compensation Plan. (Incorporated by reference to Exhibit 10.1 to the Form 8-K filed by the Registrant on April 6, 2010.)
|
|
|
Employment Agreement, dated April 8, 2014, between the Registrant and Kimberly J. McWaters. (Incorporated by reference to Exhibit 10.1 to a Form 8-K filed by the Registrant on April 11, 2014.)
|
|
|
Offer Letter, dated as of August 2, 2012, between the Registrant and Sherrell E. Smith. (Incorporated by reference to Exhibit 10.1 to the Form 8-K filed by the Registrant on August 21, 2012.)
|
|
|
Addendum Letter, dated as of August 7, 2012, between the Registrant and Sherrell E. Smith. (Incorporated by reference to Exhibit 10.2 to the Form 8-K filed by the Registrant on August 21, 2012.)
|
|
|
Form of Retention/Recognition Bonus Agreement. (Incorporated by reference to Exhibit 10.1 to the Form 8-K filed by the Registrant on June 13, 2011.)
|
|
|
Universal Technical Institute, Inc. Severance Plan, as amended December 2014, (Incorporated by reference to Exhibit 10.1 to the Form 8-K filed by the Registrant on December 12, 2014.)
|
|
98
|
Securities Purchase Agreement dated June 24, 2016, between the Registrant and Coliseum Holdings I, LLC. (Incorporated by reference to Exhibit 10.1 to the Form 8-K filed by the Registrant on June 24, 2016.)
|
|
|
Consulting Agreement, dated as of March 16, 2018, by and between the Registrant and McKinsey & Company, Inc. (Incorporated by reference to Exhibit 10.1 to the Form 8-K filed by the Registrant on March 22, 2018.)
|
|
|
Subsidiaries of the Registrant. (Filed herewith.)
|
|
|
Consent of Deloitte & Touche LLP. (Filed herewith.)
|
|
|
Power of Attorney. (Included on signature page.)
|
|
|
Certification of Chief Executive Officer pursuant to Section 302 of the Sarbanes-Oxley Act of 2002. (Filed herewith.)
|
|
|
Certification of Chief Financial Officer pursuant to Section 302 of the Sarbanes-Oxley Act of 2002. (Filed herewith.)
|
|
|
Certification of Chief Executive Officer pursuant to 18 U.S.C. § 1350, as adopted pursuant to Section 906 of the Sarbanes-Oxley Act of 2002. (Filed herewith.)
|
|
|
Certification of Chief Financial Officer pursuant to 18 U.S.C. § 1350, as adopted pursuant to Section 906 of the Sarbanes-Oxley Act of 2002. (Filed herewith.)
|
|
|
101
|
The following financial information from our Annual Report on Form 10-K for the year ended September 30, 2018, formatted in Extensible Business Reporting Language (XBRL): (i) Consolidated Balance Sheets; (ii) Consolidated Statements of Loss; (iii)
Condensed Consolidated Statements of Comprehensive Loss;
(iv) Consolidated Statements of Shareholders’ Equity; (v) Consolidated Statements of Cash Flows; and (vi) Notes to Consolidated Financial Statements.
|
*Indicates a contract with management or compensatory plan or arrangement.
99
SIGNATURES
Pursuant to the requirements of Section 13 or 15(d) of the Securities Exchange Act of 1934, the registrant has duly caused this report to be signed on its behalf by the undersigned, thereunto duly authorized.
Date:
November 30, 2018
UNIVERSAL TECHNICAL INSTITUTE, INC.
By:
/s/ Kimberly J. McWaters
Kimberly J. McWaters
President and Chief Executive Officer
POWER OF ATTORNEY
KNOW ALL MEN BY THESE PRESENTS, that each person whose signature appears below constitutes and appoints Kimberly J. McWaters and Scott Yessner, or either of them, as his true and lawful attorneys-in-fact and agents, with full power of substitution and resubstitution, for him and in his name, place and stead, in any and all capacities, to sign any and all amendments to this Annual Report on Form 10-K and any documents related to this report and filed pursuant to the Securities Exchange Act of 1934, and to file the same, with all exhibits thereto, and other documents in connection therewith, with the Securities and Exchange Commission, granting unto said attorneys-in-fact and agents, full power and authority to do and perform each and every act and thing requisite and necessary to be done in connection therewith as fully to all intents and purposes as he might or could do in person, hereby ratifying and confirming all that said attorneys-in-fact and agents, or their substitute or substitutes may lawfully do or cause to be done by virtue hereof.
Pursuant to the requirements of the Securities Exchange Act of 1934, this report has been signed below by the following persons on behalf of the registrant in the capacities and on the dates indicated.
100
|
SIGNATURE
|
TITLE
|
DATE
|
||
|
/s/ Kimberly J. McWaters
Kimberly J. McWaters
|
President and Chief Executive Officer (Principal Executive Officer)
|
November 30, 2018
|
||
|
/s/ Scott Yessner
Scott Yessner
|
Interim Chief Financial Officer (Principal Financial Officer and Principal Accounting Officer)
|
November 30, 2018
|
||
|
/s/ Robert T. DeVincenzi
Robert T. DeVincenzi
|
Chairman of the Board
|
November 30, 2018
|
||
|
/s/ David A. Blaszkiewicz
David A. Blaszkiewicz
|
Director
|
November 30, 2018
|
||
|
/s/ Conrad A. Conrad
Conrad A. Conrad
|
Director
|
November 30, 2018
|
||
|
/s/ William J. Lennox, Jr.
William J. Lennox, Jr.
|
Director
|
November 30, 2018
|
||
|
/s/ Dr. Roderick Paige
Dr. Roderick Paige
|
Director
|
November 30, 2018
|
||
|
/s/ Roger S. Penske
Roger S. Penske
|
Director
|
November 30, 2018
|
||
|
/s/ Christopher S. Shackelton
Christopher S. Shackelton
|
Director
|
November 30, 2018
|
||
|
/s/ Linda J. Srere
Linda J. Srere
|
Director
|
November 30, 2018
|
||
|
/s/ Kenneth R. Trammell
Kenneth R. Trammell
|
Director
|
November 30, 2018
|
||
|
/s/ John C. White
John C. White
|
Director
|
November 30, 2018
|
||
101
UNIVERSAL TECHNICAL INSTITUTE, INC. AND SUBSIDIARIES
INDEX TO CONSOLIDATED FINANCIAL STATEMENTS
|
|
|
Page
Number
|
|
|
||
|
|
||
|
|
||
|
|
||
|
|
||
|
|
||
|
|
||
F- 1
MANAGEMENT’S REPORT ON INTERNAL CONTROL OVER FINANCIAL REPORTING
Our management is responsible for establishing and maintaining adequate internal control over financial reporting for the company and for assessing the effectiveness of internal control over financial reporting as such term is defined in Rule 13a-15(f) under the Securities Exchange Act of 1934, as amended. Internal control over financial reporting is a process to provide reasonable assurance regarding the reliability of our financial reporting and the preparation of financial statements for external purposes in accordance with accounting principles generally accepted in the United States.
Internal control over financial reporting includes policies and procedures that pertain to maintaining records that, in reasonable detail, accurately and fairly reflect our transactions and dispositions of the company’s assets; providing reasonable assurance that transactions are recorded as necessary to permit preparation of our financial statements in accordance with accounting principles generally accepted in the United States; providing reasonable assurance that receipts and expenditures of company assets are made in accordance with management and director authorization; and providing reasonable assurance regarding prevention or timely detection of unauthorized acquisition, use or disposition of company assets that could have a material effect on our financial statements.
Because of its inherent limitations, internal control over financial reporting may not prevent or detect misstatements. Also, projections of any evaluation of effectiveness to future periods are subject to risks that controls may become inadequate because of changes in conditions, or the degree of compliance with the policies or procedures may deteriorate.
Management conducted an evaluation of the effectiveness of our internal control over financial reporting based on the framework established in
“Internal Control — Integrated Framework (2013)”
issued by the Committee of Sponsoring Organizations of the Treadway Commission. Based on this evaluation, management concluded that the Company’s internal control over financial reporting was effective as of September 30,
2018
. We implemented the new revenue recognition standard as of October 1, 2017. As a result, we made the following significant modifications to our internal controls, including changes to accounting policies and procedures, operational processes and documentation practices:
|
•
|
Updated our policies and procedures related to recognizing revenue and added documentation processes related to meeting the new criteria for recognizing revenue.
|
|
•
|
Added controls for reviewing constrained variable consideration and reevaluating our significant contract judgments and estimates on a quarterly basis.
|
|
•
|
Added controls to address related required disclosures regarding revenue, including the disclosure of performance obligations and our significant judgments and estimates for determining the transaction price and when to recognize revenue.
|
Other than the items described above, there were no changes during the three months ended September 30, 2018 that have materially affected, or are reasonably likely to materially affect, our internal control over financial reporting.
The effectiveness of the Company’s internal control over financial reporting as of September 30,
2018
has been audited by Deloitte & Touche LLP, an independent registered public accounting firm, as stated in their report which appears herein.
F- 2
Report of Independent Registered Public Accounting Firm
To the Board of Directors and Shareholders of Universal Technical Institute, Inc.
Scottsdale, Arizona
We have audited the internal control over financial reporting of Universal Technical Institute, Inc. and subsidiaries (the "Company") as of September 30,
2018
, based on criteria established in
Internal Control - Integrated Framework (2013)
issued by the Committee of Sponsoring Organizations of the Treadway Commission. In our opinion, the Company maintained, in all material respects, effective internal control over financial reporting as of September 30, 2018, based on criteria established in
Internal Control - Integrated Framework (2013)
issued by COSO.
We have also audited, in accordance with the standards of the Public Company Accounting Oversight Board (United States) (PCAOB), the consolidated financial statements as of and for the year ended September 30, 2018, of the Company and our report dated November 30, 2018 expressed an unqualified opinion on those financial statements.
The Company’s management is responsible for maintaining effective internal control over financial reporting and for its assessment of the effectiveness of internal control over financial reporting, included in the accompanying Management’s Report on Internal Control Over Financial Reporting. Our responsibility is to express an opinion on the Company’s internal control over financial reporting based on our audit. We are a public accounting firm registered with the PCAOB and are required to be independent with respect to the Company in accordance with the U.S. federal securities laws and the applicable rules and regulations of the Securities and Exchange Commission and the PCAOB.
We conducted our audit in accordance with the standards of the PCAOB. Those standards require that we plan and perform the audit to obtain reasonable assurance about whether effective internal control over financial reporting was maintained in all material respects. Our audit included obtaining an understanding of internal control over financial reporting, assessing the risk that a material weakness exists, testing and evaluating the design and operating effectiveness of internal control based on the assessed risk, and performing such other procedures as we considered necessary in the circumstances. We believe that our audit provides a reasonable basis for our opinion.
A company’s internal control over financial reporting is a process designed to provide reasonable assurance regarding the reliability of financial reporting and the preparation of financial statements for external purposes in accordance with generally accepted accounting principles. A company’s internal control over financial reporting includes those policies and procedures that (1) pertain to the maintenance of records that, in reasonable detail, accurately and fairly reflect the transactions and dispositions of the assets of the company; (2) provide reasonable assurance that transactions are recorded as necessary to permit preparation of financial statements in accordance with generally accepted accounting principles, and that receipts and expenditures of the company are being made only in accordance with authorizations of management and directors of the company; and (3) provide reasonable assurance regarding prevention or timely detection of unauthorized acquisition, use, or disposition of the company’s assets that could have a material effect on the financial statements.
Because of its inherent limitations, internal control over financial reporting may not prevent or detect misstatements. Also, projections of any evaluation of effectiveness to future periods are subject to the risk that controls may become inadequate because of changes in conditions, or that the degree of compliance with the policies or procedures may deteriorate.
/s/ DELOITTE & TOUCHE LLP
Phoenix, Arizona
November 30, 2018
F- 3
Report of Independent Registered Public Accounting Firm
To the Board of Directors and Shareholders of Universal Technical Institute, Inc.
Scottsdale, Arizona
We have audited the accompanying consolidated balance sheets of Universal Technical Institute, Inc. and subsidiaries (the “Company”) as of September 30,
2018
and
2017
, and the related consolidated statements of loss, comprehensive loss, shareholders’ equity, and cash flows for each of the three years in the period ended September 30, 2018, and the related notes. In our opinion, the consolidated financial statements present fairly, in all material respects, the financial position of the Company as of September 30, 2018 and 2017, and the results of its operations and its cash flows for each of the three years in the period ended September 30, 2018, in conformity with accounting principles generally accepted in the United States of America.
We have also audited, in accordance with the standards of the Public Company Accounting Oversight Board (United States) (PCAOB), the Company's internal control over financial reporting as of September 30, 2018, based on criteria established in
Internal Control - Integrated Framework (2013)
issued by the Committee of Sponsoring Organizations of the Treadway Commission and our report dated November 30, 2018, expressed an unqualified opinion on the Company’s internal control over financial reporting.
These financial statements are the responsibility of the Company's management. Our responsibility is to express an opinion on the Company's financial statements based on our audits. We are a public accounting firm registered with the PCAOB and are required to be independent with respect to the Company in accordance with the U.S. federal securities laws and the applicable rules and regulations of the Securities and Exchange Commission and the PCAOB.
We conducted our audits in accordance with the standards of the PCAOB. Those standards require that we plan and perform the audit to obtain reasonable assurance about whether the financial statements are free of material misstatement, whether due to error or fraud. Our audits included performing procedures to assess the risks of material misstatement of the financial statements, whether due to error or fraud, and performing procedures that respond to those risks. Such procedures included examining, on a test basis, evidence regarding the amounts and disclosures in the financial statements. Our audits also included evaluating the accounting principles used and significant estimates made by management, as well as evaluating the overall presentation of the financial statements. We believe that our audits provide a reasonable basis for our opinion.
/s/ DELOITTE & TOUCHE LLP
Phoenix, Arizona
November 30, 2018
We have served as the Company's auditor since 2015.
F- 4
UNIVERSAL TECHNICAL INSTITUTE, INC. AND SUBSIDIARIES
|
September 30, 2018
|
September 30, 2017
|
|||||||
|
Assets
|
(In thousands)
|
|||||||
|
Current assets:
|
||||||||
|
Cash and cash equivalents
|
$
|
58,104
|
|
$
|
50,138
|
|
||
|
Restricted cash
|
14,055
|
|
14,822
|
|
||||
|
Trading securities
|
—
|
|
40,020
|
|
||||
|
Held-to-maturity investments, current portion
|
—
|
|
7,759
|
|
||||
|
Receivables, net
|
21,106
|
|
15,197
|
|
||||
|
Notes receivable, current portion
|
5,183
|
|
—
|
|
||||
|
Prepaid expenses
|
10,320
|
|
9,495
|
|
||||
|
Other current assets
|
8,027
|
|
9,395
|
|
||||
|
Total current assets
|
116,795
|
|
146,826
|
|
||||
|
Property and equipment, net
|
114,848
|
|
106,664
|
|
||||
|
Goodwill
|
8,222
|
|
9,005
|
|
||||
|
Notes receivable, less current portion
|
31,194
|
|
—
|
|
||||
|
Other assets
|
11,219
|
|
11,607
|
|
||||
|
Total assets
|
$
|
282,278
|
|
$
|
274,102
|
|
||
|
Liabilities and Shareholders’ Equity
|
||||||||
|
Current liabilities:
|
||||||||
|
Accounts payable and accrued expenses
|
$
|
46,617
|
|
$
|
37,481
|
|
||
|
Deferred revenue
|
38,236
|
|
41,338
|
|
||||
|
Accrued tool sets
|
2,397
|
|
2,764
|
|
||||
|
Financing obligation, current
|
1,319
|
|
1,106
|
|
||||
|
Income tax payable
|
—
|
|
490
|
|
||||
|
Other current liabilities
|
3,893
|
|
3,210
|
|
||||
|
Total current liabilities
|
92,462
|
|
86,389
|
|
||||
|
Deferred tax liabilities, net
|
329
|
|
3,141
|
|
||||
|
Deferred rent liability
|
12,003
|
|
6,887
|
|
||||
|
Financing obligation
|
40,715
|
|
42,035
|
|
||||
|
Other liabilities
|
10,124
|
|
9,874
|
|
||||
|
Total liabilities
|
155,633
|
|
148,326
|
|
||||
|
Commitments and contingencies (Note 13)
|
|
|
||||||
|
Shareholders’ equity:
|
||||||||
|
Common stock, $0.0001 par value, 100,000,000 shares authorized, 32,168,795 shares issued and 25,303,898 shares outstanding as of September 30, 2018 and 31,872,433 shares issued and 25,007,536 shares outstanding as of September 30, 2017
|
3
|
|
3
|
|
||||
|
Preferred stock, $0.0001 par value, 10,000,000 shares authorized; 700,000 shares of Series A Convertible Preferred Stock issued and outstanding as of September 30, 2018 and September 30, 2017, liquidation preference of $100 per share
|
—
|
|
—
|
|
||||
|
Paid-in capital - common
|
186,732
|
|
185,140
|
|
||||
|
Paid-in capital - preferred
|
68,853
|
|
68,853
|
|
||||
|
Treasury stock, at cost, 6,864,897 shares as of September 30, 2018 and September 30, 2017
|
(97,388
|
)
|
(97,388
|
)
|
||||
|
Retained deficit
|
(31,555
|
)
|
(30,832
|
)
|
||||
|
Accumulated other comprehensive income
|
—
|
|
—
|
|
||||
|
Total shareholders’ equity
|
126,645
|
|
125,776
|
|
||||
|
Total liabilities and shareholders’ equity
|
$
|
282,278
|
|
$
|
274,102
|
|
||
The accompanying notes are an integral part of these consolidated financial statements.
F- 5
UNIVERSAL TECHNICAL INSTITUTE, INC. AND SUBSIDIARIES
|
Year Ended September 30,
|
||||||||||||
|
|
2018
|
2017
|
2016
|
|||||||||
|
|
(In thousands, except per share amounts)
|
|||||||||||
|
Revenues
|
$
|
316,965
|
|
$
|
324,263
|
|
$
|
347,146
|
|
|||
|
Operating expenses:
|
||||||||||||
|
Educational services and facilities
|
182,589
|
|
181,027
|
|
194,395
|
|
||||||
|
Selling, general and administrative
|
169,651
|
|
145,060
|
|
171,374
|
|
||||||
|
Total operating expenses
|
352,240
|
|
326,087
|
|
365,769
|
|
||||||
|
Loss from operations
|
(35,275
|
)
|
(1,824
|
)
|
(18,623
|
)
|
||||||
|
Other (expense) income:
|
||||||||||||
|
Interest income
|
1,425
|
|
900
|
|
243
|
|
||||||
|
Interest expense
|
(3,310
|
)
|
(3,381
|
)
|
(3,439
|
)
|
||||||
|
Equity in earnings of unconsolidated affiliate
|
385
|
|
484
|
|
342
|
|
||||||
|
Other income (expense)
|
1,078
|
|
1,090
|
|
(49
|
)
|
||||||
|
Total other expense, net
|
(422
|
)
|
(907
|
)
|
(2,903
|
)
|
||||||
|
Loss before income taxes
|
(35,697
|
)
|
(2,731
|
)
|
(21,526
|
)
|
||||||
|
Income tax expense (benefit)
|
(3,015
|
)
|
5,397
|
|
26,170
|
|
||||||
|
Net loss
|
$
|
(32,682
|
)
|
$
|
(8,128
|
)
|
$
|
(47,696
|
)
|
|||
|
Preferred stock dividends
|
|
5,250
|
|
|
5,250
|
|
|
1,424
|
|
|||
|
Loss available for distribution
|
|
$
|
(37,932
|
)
|
|
$
|
(13,378
|
)
|
|
$
|
(49,120
|
)
|
|
Loss per share:
|
||||||||||||
|
Net loss per share - basic
|
$
|
(1.51
|
)
|
$
|
(0.54
|
)
|
$
|
(2.02
|
)
|
|||
|
Net loss per share - diluted
|
$
|
(1.51
|
)
|
$
|
(0.54
|
)
|
$
|
(2.02
|
)
|
|||
|
Weighted average number of shares outstanding:
|
||||||||||||
|
Basic
|
25,115
|
|
24,712
|
|
24,313
|
|
||||||
|
Diluted
|
25,115
|
|
24,712
|
|
24,313
|
|
||||||
The accompanying notes are an integral part of these consolidated financial statements.
F- 6
UNIVERSAL TECHNICAL INSTITUTE, INC. AND SUBSIDIARIES
CONSOLIDATED STATEMENTS OF COMPREHENSIVE LOSS
|
|
|
Year Ended September 30,
|
||||||||||
|
|
|
2018
|
|
2017
|
|
2016
|
||||||
|
|
|
(In thousands)
|
||||||||||
|
Net loss
|
|
$
|
(32,682
|
)
|
|
$
|
(8,128
|
)
|
|
$
|
(47,696
|
)
|
|
Other comprehensive loss (net of tax):
|
|
|
|
|
|
|
||||||
|
Equity interest in investee's unrealized losses on hedging derivatives, net of taxes
(1)
|
|
—
|
|
|
(18
|
)
|
|
(2
|
)
|
|||
|
Comprehensive loss
|
|
$
|
(32,682
|
)
|
|
$
|
(8,146
|
)
|
|
$
|
(47,698
|
)
|
(1)
The tax effect during the years ended September 30,
2018
,
2017
, and
2016
was not material.
The accompanying notes are an integral part of these consolidated financial statements.
F- 7
UNIVERSAL TECHNICAL INSTITUTE, INC. AND SUBSIDIARIES
CONSOLIDATED STATEMENTS OF SHAREHOLDERS’ EQUITY
|
|
Common Stock
|
Preferred Stock
|
Paid-in
Capital - Common |
Paid-in
Capital - Preferred |
Treasury Stock
|
Retained
Earnings (Deficit) |
Accumulated Other Comprehensive Income
|
Total
Shareholders’ Equity |
|||||||||||||||||||||||||||||||||
|
|
Shares
|
Amount
|
Shares
|
Amount
|
Shares
|
Amount
|
|||||||||||||||||||||||||||||||||||
|
|
(In thousands)
|
||||||||||||||||||||||||||||||||||||||||
|
Balance as of September 30, 2015
|
31,098
|
|
$
|
3
|
|
—
|
|
$
|
—
|
|
$
|
178,202
|
|
$
|
—
|
|
6,865
|
|
$
|
(97,388
|
)
|
$
|
32,638
|
|
$
|
20
|
|
$
|
113,475
|
|
|||||||||||
|
Net loss
|
—
|
|
—
|
|
—
|
|
—
|
|
—
|
|
—
|
|
—
|
|
—
|
|
(47,696
|
)
|
—
|
|
(47,696
|
)
|
|||||||||||||||||||
|
Issuance of Series A Convertible Preferred Stock
|
—
|
|
—
|
|
700
|
|
—
|
|
—
|
|
68,820
|
|
—
|
|
—
|
|
—
|
|
—
|
|
68,820
|
|
|||||||||||||||||||
|
Issuance of common stock under employee plans
|
565
|
|
—
|
|
—
|
|
—
|
|
—
|
|
—
|
|
—
|
|
—
|
|
—
|
|
—
|
|
—
|
|
|||||||||||||||||||
|
Shares withheld for payroll taxes
|
(174
|
)
|
—
|
|
—
|
|
—
|
|
(394
|
)
|
—
|
|
—
|
|
—
|
|
—
|
|
—
|
|
(394
|
)
|
|||||||||||||||||||
|
Stock-based compensation
|
—
|
|
—
|
|
—
|
|
—
|
|
4,807
|
|
—
|
|
—
|
|
—
|
|
—
|
|
—
|
|
4,807
|
|
|||||||||||||||||||
|
Common stock cash dividends declared
|
—
|
|
—
|
|
—
|
|
—
|
|
—
|
|
—
|
|
—
|
|
—
|
|
(972
|
)
|
—
|
|
(972
|
)
|
|||||||||||||||||||
|
Preferred stock cash dividends declared
|
—
|
|
—
|
|
—
|
|
—
|
|
—
|
|
—
|
|
—
|
|
—
|
|
(1,424
|
)
|
—
|
|
(1,424
|
)
|
|||||||||||||||||||
|
Equity interest in investee's unrealized losses on hedging derivatives, net of taxes
|
—
|
|
—
|
|
—
|
|
—
|
|
—
|
|
—
|
|
—
|
|
—
|
|
—
|
|
(2
|
)
|
(2
|
)
|
|||||||||||||||||||
|
Balance as of September 30, 2016
|
31,489
|
|
$
|
3
|
|
700
|
|
$
|
—
|
|
$
|
182,615
|
|
$
|
68,820
|
|
6,865
|
|
$
|
(97,388
|
)
|
$
|
(17,454
|
)
|
$
|
18
|
|
$
|
136,614
|
|
|||||||||||
|
Net loss
|
—
|
|
—
|
|
—
|
|
—
|
|
—
|
|
—
|
|
—
|
|
—
|
|
(8,128
|
)
|
—
|
|
(8,128
|
)
|
|||||||||||||||||||
|
Issuance of Series A Convertible Preferred Stock
|
—
|
|
—
|
|
—
|
|
—
|
|
—
|
|
33
|
|
—
|
|
—
|
|
—
|
|
—
|
|
33
|
|
|||||||||||||||||||
|
Issuance of common stock under employee plans
|
559
|
|
—
|
|
—
|
|
—
|
|
—
|
|
—
|
|
—
|
|
—
|
|
—
|
|
—
|
|
—
|
|
|||||||||||||||||||
|
Shares withheld for payroll taxes
|
(176
|
)
|
—
|
|
—
|
|
—
|
|
(595
|
)
|
—
|
|
—
|
|
—
|
|
—
|
|
—
|
|
(595
|
)
|
|||||||||||||||||||
|
Stock-based compensation
|
—
|
|
—
|
|
—
|
|
—
|
|
3,120
|
|
—
|
|
—
|
|
—
|
|
—
|
|
—
|
|
3,120
|
|
|||||||||||||||||||
|
Preferred stock cash dividends declared
|
—
|
|
—
|
|
—
|
|
—
|
|
—
|
|
—
|
|
—
|
|
—
|
|
(5,250
|
)
|
—
|
|
(5,250
|
)
|
|||||||||||||||||||
|
Equity interest in investee's unrealized losses on hedging derivatives, net of taxes
|
—
|
|
—
|
|
—
|
|
—
|
|
—
|
|
—
|
|
—
|
|
—
|
|
—
|
|
(18
|
)
|
(18
|
)
|
|||||||||||||||||||
|
Balance as of September 30, 2017
|
31,872
|
|
$
|
3
|
|
700
|
|
$
|
—
|
|
$
|
185,140
|
|
$
|
68,853
|
|
6,865
|
|
$
|
(97,388
|
)
|
$
|
(30,832
|
)
|
$
|
—
|
|
$
|
125,776
|
|
|||||||||||
|
Cumulative-effect adjustment (see Note 3)
|
—
|
|
—
|
|
—
|
|
—
|
|
—
|
|
—
|
|
—
|
|
—
|
|
37,209
|
|
—
|
|
37,209
|
|
|||||||||||||||||||
|
Net loss
|
—
|
|
—
|
|
—
|
|
—
|
|
—
|
|
—
|
|
—
|
|
—
|
|
(32,682
|
)
|
—
|
|
(32,682
|
)
|
|||||||||||||||||||
|
Issuance of common stock under employee plans
|
379
|
|
—
|
|
—
|
|
—
|
|
—
|
|
—
|
|
—
|
|
—
|
|
—
|
|
—
|
|
—
|
|
|||||||||||||||||||
|
Shares withheld for payroll taxes
|
(82
|
)
|
—
|
|
—
|
|
—
|
|
(223
|
)
|
—
|
|
—
|
|
—
|
|
—
|
|
—
|
|
(223
|
)
|
|||||||||||||||||||
|
Stock-based compensation
|
—
|
|
—
|
|
—
|
|
—
|
|
1,815
|
|
—
|
|
—
|
|
—
|
|
—
|
|
—
|
|
1,815
|
|
|||||||||||||||||||
|
Preferred stock cash dividends declared
|
—
|
|
—
|
|
—
|
|
—
|
|
—
|
|
—
|
|
—
|
|
—
|
|
(5,250
|
)
|
—
|
|
(5,250
|
)
|
|||||||||||||||||||
|
Balance as of September 30, 2018
|
32,169
|
|
$
|
3
|
|
700
|
|
$
|
—
|
|
$
|
186,732
|
|
$
|
68,853
|
|
6,865
|
|
$
|
(97,388
|
)
|
$
|
(31,555
|
)
|
$
|
—
|
|
$
|
126,645
|
|
|||||||||||
The accompanying notes are an integral part of these consolidated financial statements.
F- 8
UNIVERSAL TECHNICAL INSTITUTE, INC. AND SUBSIDIARIES
|
Year Ended September 30,
|
||||||||||||
|
|
2018
|
2017
|
2016
|
|||||||||
|
|
(In thousands)
|
|||||||||||
|
Cash flows from operating activities:
|
||||||||||||
|
Net loss
|
$
|
(32,682
|
)
|
$
|
(8,128
|
)
|
$
|
(47,696
|
)
|
|||
|
Adjustments to reconcile net loss to net cash provided by (used in) operating activities:
|
||||||||||||
|
Depreciation and amortization
|
13,006
|
|
14,204
|
|
15,067
|
|
||||||
|
Amortization of assets subject to financing obligation
|
2,682
|
|
2,682
|
|
2,682
|
|
||||||
|
Goodwill and intangible asset impairment expense
|
1,164
|
|
—
|
|
—
|
|
||||||
|
Impairment of investment in unconsolidated affiliate
|
—
|
|
—
|
|
815
|
|
||||||
|
Bad debt expense
|
1,511
|
|
827
|
|
1,153
|
|
||||||
|
Stock-based compensation
|
1,815
|
|
2,945
|
|
4,904
|
|
||||||
|
Deferred income taxes
|
(2,812
|
)
|
—
|
|
27,928
|
|
||||||
|
Equity in earnings of unconsolidated affiliate
|
(385
|
)
|
(484
|
)
|
(342
|
)
|
||||||
|
Training equipment credits earned, net
|
33
|
|
(1,198
|
)
|
(1,176
|
)
|
||||||
|
Other (gains) losses, net
|
122
|
|
(15
|
)
|
429
|
|
||||||
|
Changes in assets and liabilities:
|
||||||||||||
|
Restricted cash
|
(125
|
)
|
(11,126
|
)
|
165
|
|
||||||
|
Receivables
|
(2,695
|
)
|
(2,976
|
)
|
8,202
|
|
||||||
|
Notes receivable
|
3,393
|
|
—
|
|
—
|
|
||||||
|
Prepaid expenses and other current assets
|
(1,584
|
)
|
692
|
|
(2,009
|
)
|
||||||
|
Other assets
|
(116
|
)
|
84
|
|
(127
|
)
|
||||||
|
Accounts payable and accrued expenses
|
3,858
|
|
(4,759
|
)
|
1,855
|
|
||||||
|
Deferred revenue
|
(5,663
|
)
|
(3,153
|
)
|
(202
|
)
|
||||||
|
Income tax payable/receivable
|
(812
|
)
|
2,697
|
|
(3,394
|
)
|
||||||
|
Accrued tool sets and other current liabilities
|
1,014
|
|
556
|
|
489
|
|
||||||
|
Deferred rent liability
|
5,116
|
|
(2,100
|
)
|
(1,835
|
)
|
||||||
|
Other liabilities
|
(318
|
)
|
(726
|
)
|
476
|
|
||||||
|
Net cash provided by (used in) operating activities
|
(13,478
|
)
|
(9,978
|
)
|
7,384
|
|
||||||
|
Cash flows from investing activities:
|
||||||||||||
|
Purchase of property and equipment
|
(20,606
|
)
|
(8,190
|
)
|
(7,495
|
)
|
||||||
|
Proceeds from disposal of property and equipment
|
25
|
|
2
|
|
22
|
|
||||||
|
Purchase of held-to-maturity investments
|
—
|
|
(9,672
|
)
|
—
|
|
||||||
|
Proceeds received upon maturity of investments
|
7,739
|
|
3,565
|
|
27,709
|
|
||||||
|
Purchase of trading securities
|
(894
|
)
|
(42,696
|
)
|
—
|
|
||||||
|
Proceeds from sales of trading securities
|
40,902
|
|
2,747
|
|
—
|
|
||||||
|
Acquisitions
|
—
|
|
—
|
|
(1,500
|
)
|
||||||
|
Investment in joint venture
|
—
|
|
—
|
|
(1,000
|
)
|
||||||
|
Capitalized costs for intangible assets
|
(325
|
)
|
(575
|
)
|
(575
|
)
|
||||||
|
Return of capital contribution from unconsolidated affiliate
|
291
|
|
390
|
|
475
|
|
||||||
|
Restricted cash: other
|
892
|
|
2,258
|
|
(289
|
)
|
||||||
|
Net cash provided by (used in) investing activities
|
28,024
|
|
(52,171
|
)
|
17,347
|
|
||||||
|
Cash flows from financing activities:
|
||||||||||||
|
Proceeds from sale of preferred stock, net of issuance costs paid
|
—
|
|
—
|
|
68,886
|
|
||||||
|
Payment of preferred stock dividend
|
(5,250
|
)
|
(5,250
|
)
|
(1,424
|
)
|
||||||
|
Payment of common stock dividends
|
—
|
|
—
|
|
(1,457
|
)
|
||||||
|
Repayment of financing obligation
|
(1,107
|
)
|
(913
|
)
|
(736
|
)
|
||||||
|
Payment of payroll taxes on stock-based compensation through shares withheld
|
(223
|
)
|
(595
|
)
|
(393
|
)
|
||||||
|
Net cash provided by (used in) financing activities
|
(6,580
|
)
|
(6,758
|
)
|
64,876
|
|
||||||
|
Net increase (decrease) in cash and cash equivalents
|
7,966
|
|
(68,907
|
)
|
89,607
|
|
||||||
|
Cash and cash equivalents, beginning of period
|
50,138
|
|
119,045
|
|
29,438
|
|
||||||
|
Cash and cash equivalents, end of period
|
$
|
58,104
|
|
$
|
50,138
|
|
$
|
119,045
|
|
|||
F- 9
UNIVERSAL TECHNICAL INSTITUTE, INC. AND SUBSIDIARIES
CONSOLIDATED STATEMENTS OF CASH FLOWS, continued
|
Year Ended September 30,
|
||||||||||||
|
2018
|
2017
|
2016
|
||||||||||
|
(In thousands)
|
||||||||||||
|
Supplemental disclosure of cash flow information:
|
||||||||||||
|
Taxes paid
|
$
|
610
|
|
$
|
2,700
|
|
$
|
1,636
|
|
|||
|
Interest paid
|
$
|
3,310
|
|
$
|
3,382
|
|
$
|
3,439
|
|
|||
|
Training equipment obtained in exchange for services
|
$
|
3,240
|
|
$
|
1,897
|
|
$
|
2,738
|
|
|||
|
Depreciation of training equipment obtained in exchange for services
|
|
$
|
1,386
|
|
|
$
|
1,283
|
|
|
$
|
1,342
|
|
|
Change in accrued capital expenditures during the period
|
$
|
(1,042
|
)
|
$
|
(187
|
)
|
$
|
1,792
|
|
|||
|
Stock based compensation classified as liability instruments
|
$
|
—
|
|
$
|
—
|
|
$
|
175
|
|
|||
|
Vesting of stock based compensation liability
|
$
|
—
|
|
$
|
175
|
|
$
|
78
|
|
|||
The accompanying notes are an integral part of these consolidated financial statements.
F- 10
UNIVERSAL TECHNICAL INSTITUTE, INC. AND SUBSIDIARIES
NOTES TO CONSOLIDATED FINANCIAL STATEMENTS
($’s in thousands, except per share amounts)
1. Business Description
Universal Technical Institute, Inc. (“UTI” or, collectively, “we”, "us" and “our”) provides postsecondary education for students seeking careers as professional automotive, diesel, collision repair, motorcycle and marine technicians as well as welders and CNC machining technicians. We offer certificate, diploma or degree programs at
13
campuses and advanced training programs that are sponsored by the manufacturer or dealer at certain campuses and dedicated training centers. We work closely with leading OEMs and employers to understand their needs for qualified service professionals. Revenues generated from our schools consist primarily of tuition and fees paid by students. To pay for a substantial portion of their tuition, the majority of students rely on funds received from federal financial aid programs under Title IV Programs of the Higher Education Act of 1965, as amended (HEA), as well as various veterans' benefits programs. For further discussion, see "Concentration of Risk" under Note 2 and Note 18 “Governmental Regulation and Financial Aid”.
2. Summary of Significant Accounting Policies
Principles of Consolidation
The accompanying consolidated financial statements include the accounts of UTI and its wholly owned subsidiaries. All significant intercompany accounts and transactions have been eliminated.
Use of Estimates
The preparation of financial statements in accordance with accounting principles generally accepted in the United States requires management to make certain estimates and assumptions. Such estimates and assumptions affect the reported amounts of assets, liabilities, revenues and expenses and related disclosures of contingent assets and liabilities. On an ongoing basis, we evaluate our estimates and assumptions, including those related to revenue recognition, our proprietary loan program, allowance for uncollectible accounts, investments, property and equipment, goodwill recoverability, self-insurance claim liabilities, income taxes, contingencies and stock-based compensation. We base our estimates on historical experience and on various other assumptions that we believe are reasonable under the circumstances. The results of our analysis form the basis for making judgments about the carrying values of assets and liabilities that are not readily apparent from other sources. Actual results may differ from these estimates under different assumptions or conditions, and the impact of such differences may be material to our consolidated financial statements.
Revenue Recognition
Postsecondary education.
Revenues consist primarily of student tuition and fees derived from the programs we provide after reductions are made for discounts and scholarships that we sponsor and for refunds for students who withdraw from our programs prior to specified dates. We apply the five-step model outlined in Accounting Standards Codification Topic 606, Revenue from Contracts from Customers (ASC 606). Tuition and fee revenue is recognized ratably over the term of the course or program offered. Approximately
98%
of our revenues for each of the years ended
September 30, 2018
,
2017
and
2016
consisted of tuition. The majority of our core programs are designed to be completed in
33
to
102
weeks, and our advanced training programs range from
12
to
23
weeks in duration. We supplement our revenues with sales of textbooks and program supplies and other revenues, which are recognized as the transfer of goods or services occurs. Deferred revenue represents the excess of tuition and fee payments received as compared to tuition and fees earned and is reflected as a current liability in our consolidated balance sheets because it is expected to be earned within the next 12 months.
F- 11
UNIVERSAL TECHNICAL INSTITUTE, INC. AND SUBSIDIARIES
NOTES TO CONSOLIDATED FINANCIAL STATEMENTS
($’s in thousands, except per share amounts)
Through our proprietary loan program, we, in substance, provide the students who participate in this program with extended payment terms for a portion of their tuition. Based on historical collection rates, we believe a portion of these loans are collectible, which results in a change in accounting due to our adoption of ASC 606 on October 1, 2017. Accordingly, we recognize tuition and loan origination fees financed by the loan and any related interest revenue under the effective interest method required under the loan based on this collection rate. For additional discussion of this adoption, see Note 3.
Other.
We provide dealer technician training or instructor staffing services to manufacturers. Revenues are recognized as transfer of the services occurs.
Proprietary Loan Program
In order to provide funding for students who are not able to fully finance the cost of their education under traditional governmental financial aid programs, commercial loan programs or other alternative sources, we established a private loan program with a bank.
Under the terms of the proprietary loan program, the bank originates loans for our students who meet our specific credit criteria with the related proceeds used exclusively to fund a portion of their tuition. We then purchase all such loans from the bank at least monthly and assume all of the related credit risk. The loans bear interest at market rates ranging from approximately 7% to 10%; however, principal and interest payments are not required until six months after the student completes or withdraws from his or her program. After the deferral period, monthly principal and interest payments are required over the related term of the loan. The repayment term is up to 10 years.
The bank provides these services in exchange for a fee at a percentage of the principal balance of each loan and related fees. Under the terms of the related agreement, we transfer funds for loan purchases to a deposit account with the bank in advance of the bank funding the loan, which secures our related loan purchase obligation. Such funds are classified as restricted cash in our consolidated balance sheet.
All related expenses incurred with the bank or other service providers are expensed as incurred within educational services and facilities expense and were approximately
$1.3 million
,
$1.3 million
and
$1.5 million
for the years ended September 30,
2018
,
2017
, and
2016
respectively.
Under ASC 606, the portion of tuition revenue related to the proprietary loan program is considered a form of variable consideration. We estimate the amount we ultimately expect to collect from the portion of tuition that is funded by the proprietary loan program, resulting in a note receivable. Estimating the collection rate requires significant management judgment. The estimated amount is determined at the inception of the contract, and we recognize the related revenue as the student progresses through school. Each reporting period, we update our assessment of the variable collection rate associated with the proprietary loan program.
Prior to adopting ASC 606, we recognized revenue related to the proprietary loan program as cash was received. For additional discussion of this adoption, see Note 3.
F- 12
UNIVERSAL TECHNICAL INSTITUTE, INC. AND SUBSIDIARIES
NOTES TO CONSOLIDATED FINANCIAL STATEMENTS
($’s in thousands, except per share amounts)
Restricted Cash
Restricted cash includes the funds transferred in advance of loan purchases under our proprietary loan program, funds held for students from Title IV financial aid program funds that result in credit balances on a student’s account and funds held as collateral for certain of the surety bonds that our insurers issue on behalf of our campuses and admissions representatives with multiple states, which are required to maintain authorization to conduct our business. Changes in restricted cash that represent funds held for students or that result from changes in the collateralization required for surety bonds as described above are included in cash flows from operating activities on our consolidated statements of cash flows because these restricted funds are related to the core activity of our operations. All other changes in restricted cash are included in cash flows from investing activities on our consolidated statements of cash flows.
Allowance for Uncollectible Accounts
We maintain an allowance for uncollectible accounts for estimated losses resulting from the inability, failure or refusal of our students to make required payments. We offer a variety of payment plans to help students pay that portion of their education expenses not covered by financial aid programs or alternate fund sources, which are unsecured and not guaranteed. Management analyzes accounts receivable, historical percentages of uncollectible accounts, customer credit worthiness and changes in payment history when evaluating the adequacy of the allowance for uncollectible accounts. We use an internal group of collectors, augmented by third party collectors as deemed appropriate, in our collection efforts. Although we believe that our allowance is adequate, if the financial condition of our students deteriorates, resulting in an impairment of their ability to make payments, or if we underestimate the allowances required, additional allowances may be necessary, which would result in increased selling, general and administrative expenses in the period such determination is made.
Investments
Historically, we have invested in pre-funded municipal bonds, which are generally secured by escrowed-to-maturity U.S. Treasury notes. Municipal bonds represent debt obligations issued by states, cities, counties and other governmental entities, which earn interest that is exempt from federal income taxes. Additionally, we have invested in certificates of deposit issued by financial institutions and corporate bonds from large cap industrial and selected financial companies with a minimum credit rating of A. We held our investments until maturity and therefore classified these investments as held-to-maturity and reported them at amortized cost. Investments with an original maturity date of
90 days
or less at the time of purchase were classified as cash equivalents and investments with a maturity date greater than one year at the end of the period were classified as non-current.
We reviewed our held-to-maturity investments for impairment quarterly to determine if other-than-temporary declines in the carrying value have occurred for any individual investment. Other-than-temporary declines in the value of our held-to-maturity investments were recorded as expense in the period in which the determination was made. We determined that no other-than-temporary declines occurred in our held-to-maturity investments during the year ended September 30, 2017. At September 30, 2018, there are no investments reported.
F- 13
UNIVERSAL TECHNICAL INSTITUTE, INC. AND SUBSIDIARIES
NOTES TO CONSOLIDATED FINANCIAL STATEMENTS
($’s in thousands, except per share amounts)
During the third quarter of 2017, we invested in various bond funds. These investments were held principally for resale in the near term and were classified as trading securities. Trading securities were recorded at fair value based on the closing market price of the security. Realized and unrealized gains and losses for trading securities were recognized in earnings and included in other income, net in the consolidated statements of loss. During the first quarter of 2018, we liquidated our investment in trading securities.
Property and Equipment
Property, equipment and leasehold improvements are recorded at cost less accumulated depreciation and amortization. Depreciation and amortization expense are calculated using the straight-line method over the estimated useful lives of the related assets. Amortization of leasehold improvements is calculated using the straight-line method over the remaining useful life of the asset or term of lease, whichever is shorter. Costs relating to software developed for internal use and curriculum development are capitalized and amortized using the straight-line method over the related estimated useful lives. Such costs include direct costs of materials and services as well as payroll and related costs for employees who are directly associated with the projects. Maintenance and repairs are expensed as incurred.
We review the carrying value of our property and equipment for possible impairment whenever events or changes in circumstances indicate that the carrying amounts may not be recoverable. We evaluate our long-lived assets for impairment by examining estimated future cash flows. These cash flows are evaluated by using probability weighting techniques as well as comparisons of past performance against projections. Assets may also be evaluated by identifying independent market values. If we determine that an asset’s carrying value is impaired, we will write-down the carrying value of the asset to its estimated fair value and charge the impairment as an operating expense in the period in which the determination is made. There were no impairment charges required for the years ended September 30,
2018
,
2017
and
2016
.
Goodwill
Goodwill represents the excess of the cost of an acquired business over the estimated fair values of the assets acquired and liabilities assumed. Goodwill is reviewed at least annually for impairment, which may result from the deterioration in the operating performance of the acquired business, adverse market conditions, adverse changes in the applicable laws or regulations and a variety of other circumstances. Any resulting impairment charge would be recognized as an expense in the period in which impairment is identified.
Our goodwill resulted primarily from the acquisition of our motorcycle and marine education business in 1998, and we recorded
$8.2 million
related to the goodwill allocated to our MMI Orlando, Florida campus that provides the related educational programs. Additionally, we recorded
$0.8 million
of goodwill related to the acquisition of BrokenMyth Studios, LLC (BMS) in February 2016.
During the year ended September 30, 2018, due to the deteriorating operating performance of BMS and a decline in projected operating performance identified during our mid-year budget review, at June 30, 2018, we completed an interim test for impairment of the reporting unit and determined that the carrying value of this reporting unit exceeded its fair value, indicating goodwill impairment existed. The result of our valuation indicated that there was no remaining implied value attributable to goodwill in our BMS acquisition, and accordingly, we expensed all
$0.8 million
of the goodwill associated with that acquisition for the year ended September 30, 2018. Additionally, we determined that related definite-lived intangible assets were impaired, and we expensed the remaining
$0.4 million
remaining book value for the year ended September 30, 2018. Both impairment charges are included in our selling, general and administrative expenses in our condensed consolidated statement of loss. Our total recorded goodwill was
$8.2 million
as of September 30, 2018. We perform our annual goodwill impairment
F- 14
UNIVERSAL TECHNICAL INSTITUTE, INC. AND SUBSIDIARIES
NOTES TO CONSOLIDATED FINANCIAL STATEMENTS
($’s in thousands, except per share amounts)
assessment during the fourth quarter of each fiscal year. Actual experience may differ from the amounts included in our assessment, which could result in impairment of our goodwill in the future.
During the year ended September 30, 2018, we utilized a discounted cash flow model that incorporated estimated future cash flows for the next five years and an associated terminal value to determine the fair value of our MMI Orlando, Florida campus. Key management assumptions included in the cash flow model included future tuition revenues, operating costs, working capital changes, capital expenditures and a discount rate. Based upon our annual assessments, we determined that our goodwill was not impaired as of September 30, 2018 and that impairment charges were not required.
Self-Insurance Plans
We are self-insured for claims related to employee health and dental care and claims related to workers’ compensation. Liabilities associated with these plans are estimated by management with consideration of our historical loss experience, severity factors and independent actuarial analysis. Our claim liabilities are based on estimates, and while we believe the amounts accrued are adequate, the ultimate losses may differ from the amounts provided. Our recorded net liability related to self-insurance plans was
$3.3 million
as of September 30,
2018
.
Deferred Rent Liability
We lease the majority of our administrative and educational facilities under operating lease agreements. Some lease agreements contain tenant improvement allowances, free rent periods or rent escalation clauses. In instances where one or more of these items are included in a lease agreement, we record a deferred rent liability on the consolidated balance sheet and record rent expense evenly over the term of the lease.
Advertising Costs
Costs related to advertising are expensed as incurred and totaled approximately
$44.8 million
,
$38.6 million
and
$41.2 million
for the years ended September 30,
2018
,
2017
, and
2016
, respectively.
Stock-Based Compensation
Historically, we have issued restricted stock awards, restricted stock units and stock options. Restricted stock awards and restricted stock units are subject to vesting with service and performance conditions. We measure all share-based payments to employees at estimated fair value. We recognize the compensation expense for restricted stock awards and restricted stock units with only service conditions on a straight-line basis over the requisite service period. We did not grant stock options or restricted stock awards during the years ended September 30,
2018
,
2017
and
2016
. Shares issued under our equity compensation plans are new shares.
Compensation expense associated with restricted stock awards, restricted stock units and performance units is measured based on the grant date fair value of our common stock, discounted for non-participation in anticipated dividends during the vesting period. The requisite service period for restricted stock awards, restricted stock units and performance units is generally the vesting period.
We estimate the fair value of performance units using a Monte Carlo simulation which requires assumptions for expected volatility, risk-free rates of return, and dividend yields. Expected volatilities are derived using a method that calculates historical volatility over a period equal to the length of the measurement period for UTI. We use a risk-free rate of return that is equal to the yield of a zero-coupon U.S. Treasury bill that is commensurate with each measurement period, and we assume that any dividends paid were reinvested.
F- 15
UNIVERSAL TECHNICAL INSTITUTE, INC. AND SUBSIDIARIES
NOTES TO CONSOLIDATED FINANCIAL STATEMENTS
($’s in thousands, except per share amounts)
Stock-based compensation expense of
$1.9 million
,
$3.0 million
and
$4.9 million
(pre-tax) was recorded for the years ended September 30,
2018
,
2017
and
2016
, respectively. The tax benefit related to stock-based compensation recognized was
$0.5 million
,
$1.1 million
and
$1.9 million
for the years ended September 30,
2018
,
2017
and
2016
, respectively.
Income Taxes
We recognize deferred tax assets and liabilities for the estimated future tax consequences of events attributable to differences between the financial statement carrying amounts of existing assets and liabilities and their respective tax bases. We also recognize deferred tax assets for net operating loss and tax credit carryforwards. Deferred tax assets and liabilities are measured using enacted tax rates in effect for the year in which the differences are expected to be recovered or settled. Deferred tax assets are reduced through a valuation allowance if it is more likely than not that the deferred tax assets will not be realized.
Concentration of Risk
Financial instruments that potentially subject us to concentrations of credit risk consist principally of cash and cash equivalents, restricted cash, investments and receivables. As of September 30,
2018
, we held cash and cash equivalents of
$58.1 million
, restricted cash of
$14.1 million
and no investments.
We place our cash and cash equivalents and restricted cash with high quality financial institutions and limit the amount of credit exposure with any one financial institution. We mitigate the concentration risk of our investments by limiting the amount invested in any one issuer. We mitigate the risk associated with our investment in corporate bonds by requiring a minimum credit rating of A.
We extend credit for tuition and fees, for a limited period of time, to a majority of our students. A substantial portion is repaid through the student’s participation in federally funded financial aid programs. Transfers of funds from the financial aid programs to us are made in accordance with the ED requirements. Approximately
65%
of our revenues, on a cash basis, were collected from funds distributed under Title IV Programs for the year ended September 30,
2018
. This percentage differs from our Title IV percentage as calculated under the 90/10 rule due to the prescribed treatment of certain Title IV stipends under the rule. Additionally, approximately
17%
of our revenues, on a cash basis, were collected from funds distributed under various veterans benefits programs for the year ended September 30,
2018
.
The financial aid and veterans benefits programs are subject to political and budgetary considerations. There is no assurance that such funding will be maintained at current levels. Extensive and complex regulations govern the financial assistance programs in which our students participate. Our administration of these programs is periodically reviewed by various regulatory agencies. Any regulatory violation could be the basis for the initiation of potential adverse actions, including a suspension, limitation, placement on reimbursement status or termination proceeding, which could have a material adverse effect on our business. ED and other regulators have increased the frequency and severity of their enforcement actions against postsecondary schools which have resulted in the imposition of material liabilities, sanctions, letter of credit requirements and other restrictions and, in some cases, resulted in the loss of schools’ eligibility to receive Title IV funds or in closure of the schools.
If any of our institutions were to lose its eligibility to participate in federal student financial aid programs, the students at that institution would lose access to funds derived from those programs and would have to seek alternative sources of funds to pay their tuition and fees. Students obtain access to federal student financial aid through an ED prescribed application and eligibility certification process. Student financial aid funds are generally made available to students at prescribed intervals throughout their predetermined expected length of study. Students typically apply the funds received from the federal financial aid programs to pay their tuition and fees. The transfer
F- 16
UNIVERSAL TECHNICAL INSTITUTE, INC. AND SUBSIDIARIES
NOTES TO CONSOLIDATED FINANCIAL STATEMENTS
($’s in thousands, except per share amounts)
of funds is from the financial aid program to the student, who then uses those funds to pay for a portion of the cost of their education. The receipt of financial aid funds reduces the student’s amounts due to us and has no impact on revenue recognition, as the transfer relates to the source of funding for the costs of education, which may occur either through Title IV or other funds and resources available to the student.
Fair Value of Financial Instruments
The carrying value of cash equivalents, restricted cash, accounts receivable, accounts payable, accrued liabilities and deferred tuition approximates their respective fair value as of September 30,
2018
and
2017
due to the short-term nature of these instruments.
Comprehensive Income
During the year ended September 30, 2012, we invested
$4.0 million
to acquire an equity interest in a joint venture (JV) related to the lease of our Lisle, Illinois campus facility. Historically, the JV used an interest rate cap to manage interest rate risk associated with its floating rate debt. This derivative instrument was designated as a cash flow hedge based on the nature of the risk being hedged. As such, the effective portion of the gain or loss on the derivative was initially reported as a component of the JV’s accumulated other comprehensive income or loss, net of tax, and was subsequently reclassified into earnings when the hedged transaction affects earnings. Any ineffective portion of the gain or loss was recognized in the JV’s current earnings. Due to our equity method investment in the JV, when the JV reports a current year component of other comprehensive income (OCI), we, as an investor, likewise adjust our investment account for the change in investee equity. In addition, we adjust our OCI for our share of the JV’s currently reported OCI item. During the three months ended December 31, 2017, the JV refinanced the facility loan and discontinued its use of an interest rate cap.
Start-up Costs
Costs related to the start-up of new campuses are expensed as incurred.
3. Recent Accounting Pronouncements
Recently Adopted Accounting Pronouncements
In May 2014, the Financial Accounting Standards Board (FASB) issued Accounting Standards Update (ASU) 2014-09, which outlines a single comprehensive revenue model for entities to use in accounting for revenue arising from contracts with customers. The guidance supersedes most current revenue recognition guidance, including industry-specific guidance, and requires a company to recognize revenue to depict the transfer of goods or services to a customer at an amount that reflects the consideration it expects to receive in exchange for those goods or services. ASU 2014-09 is effective for fiscal years and interim periods within those years beginning after December 15, 2017, with early adoption permitted for periods beginning after December 15, 2016. The guidance permits two methods of adoption: retrospectively to each prior reporting period presented (full retrospective method), or retrospectively with the cumulative effect of initially applying the guidance recognized at the date of initial application (modified retrospective method). In 2016, the FASB issued further guidance that offers narrow scope improvements and clarifies certain implementation issues related to revenue recognition, including principal versus agent considerations and the identification of performance obligations and licensing. These additional updates have the same effective date.
We adopted ASC 606 using the modified retrospective method as of October 1, 2017. This approach was applied to all contracts not completed as of October 1, 2017. In addition to the enhanced footnote disclosures related to customer contracts, the most significant impact of the new standard related to the timing of revenue recognition for our proprietary loan program and the accounting for student program changes. We do not incur
F- 17
UNIVERSAL TECHNICAL INSTITUTE, INC. AND SUBSIDIARIES
NOTES TO CONSOLIDATED FINANCIAL STATEMENTS
($’s in thousands, except per share amounts)
significant costs to obtain or fulfill revenue contracts. There were no other significant changes to the accounting for tuition or other revenues.
Proprietary Loan Program Revenue Recognition
Prior to adopting the new revenue standard, we recognized revenue related to the proprietary loan program as cash was received. The adoption of the new standard resulted in a change in the timing of revenue recognition. Under ASC 606, the portion of tuition revenue related to the proprietary loan program is considered a form of variable consideration. Based on our historical collection rates, we estimate the amount we ultimately expect to collect from the portion of tuition that is funded by the proprietary loan program. Estimating the collection rate requires significant management judgment. The estimated amount is determined at the inception of the contract and reevaluated each reporting period, and we recognize the related revenue as the student progresses through school. The change in the timing of revenue recognition also resulted in the recognition of note receivables.
The cumulative impact of changing the timing of revenue recognition for the proprietary loan program as of October 1, 2017 was an increase in stockholders' equity of approximately
$37.2 million
and an increase in deferred revenue of
$2.6 million
, and a corresponding increase in notes receivable and related interest.
Program Changes
From time to time, a student may elect to “upgrade” or “downgrade” their program, which will change the program length and price. When a student changes their program, a new enrollment agreement is signed and a new financial aid package is completed for the student since this modification will impact the length of the program and/or the transaction price.
Prior to adopting the standard, when a student changed their program, we recorded any changes to the tuition price or program length through a cumulative catch up adjustment from the inception of the contract through the date of the change. Under ASC 606, we must assess the contract modification to determine if there has been an increase in price or scope. For those program changes that result in either an increase in price or scope, we will now record the change on a prospective basis. Based on our analysis, the cumulative change of accounting for program changes under ASC 606 was not material as of October 1, 2017.
Effective the first quarter of fiscal 2019:
In January 2017, the FASB issued ASU 2017-01,
Business Combinations (Topic 805): Clarifying the Definition of a Business.
ASU 2017-01 clarifies the definition of a business. If substantially all of the fair value of the gross assets acquired is concentrated in a single identifiable asset or group of similar identifiable assets, then the acquisition is not a business. In addition, a business must include at least one substantive process. The standard is to be applied on a prospective basis to purchases or disposals of a business or an asset. The effect of this new standard on our consolidated financial statements will be dependent on any future acquisitions.
In August 2016, the FASB issued ASU 2016-15,
Statement of Cash Flows (Topic 230) - Classification of Certain Cash Receipts and Cash Payments,
which clarifies how certain cash receipts and cash payments are presented and classified in the statement of cash flows. We do not expect the adoption of ASU 2016-15 to have a material impact on the consolidated statements of cash flows. Further, in November 2016, the FASB issued ASU 2016-18,
Statement of Cash Flows (Topic 230) - Restricted Cash.
This guidance requires restricted cash and cash equivalents to be included with cash and cash equivalents on the statement of cash flows. Based on the restricted cash balances on our consolidated balance sheets, we expect this standard to have an impact on the presentation of our consolidated statements of cash flows.
F- 18
UNIVERSAL TECHNICAL INSTITUTE, INC. AND SUBSIDIARIES
NOTES TO CONSOLIDATED FINANCIAL STATEMENTS
($’s in thousands, except per share amounts)
In January 2016, the FASB issued ASU 2016-01,
Financial Instruments-Overall (Subtopic 825-10): Recognition and Measurement of Financial Assets and Financial Liabilities.
ASU 2016-01 primarily impacts the accounting for equity investments other than those accounted for using the equity method of accounting, financial liabilities under the fair value option and the presentation and disclosure requirements for financial instruments. Additionally, the FASB clarified guidance related to the valuation allowance assessment when recognizing deferred tax assets resulting from unrealized losses on available-for-sale debt securities. The accounting for other financial instruments, such as loans, investments in debt securities and financial liabilities is largely unchanged. Based on our current portfolio of investments, the adoption of these standards is not expected to have a material impact on our financial statements.
In February 2018, the FASB issued ASU 2018-02,
Income Statement-Reporting Comprehensive Income (Topic 220): Reclassification of Certain Tax Effects from Accumulated Other Comprehensive Income.
ASU
2018-02 amends ASC 220 to allow a reclassification from accumulated other comprehensive income to retained earnings for stranded tax effects resulting from the "Tax Cuts and Jobs Act" and requires entities to provide certain disclosures regarding stranded tax effects. Early adoption is permitted. We do not expect this standard to have a material impact on our consolidated statements of comprehensive income or our consolidated statements of shareholder's equity.
Effective the first quarter of fiscal 2020:
In February 2016, the FASB issued ASU 2016-02,
Leases (Topic 842)
. ASU 2016-02 requires lessees to recognize a right-of-use asset and a lease liability on the balance sheet for substantially all leases, with the exception of short-term leases. Leases will be classified as either financing or operating, with classification affecting the pattern of expense recognition in the statement of income. In July 2018, the FASB issued ASU 2018-11,
Leases (Topic 842)
to provide entities with relief from the costs of implementing certain aspects of the new leasing standard. ASU 2018-11 allows entities to elect not to recast the comparative periods presented when transitioning to ASC 842. It also allows lessors to elect not to separate lease and nonlease components when certain conditions are met. We are currently evaluating the impact that the standard will have on our results of operations, financial condition and financial statement disclosures. We do expect this standard to have a material impact on our financial statements.
In August 2018, the FASB issued ASU 2018-13,
Fair Value Measurement (Topic 820).
ASU 2018-13 amends the disclosure requirements of ASC 820, changes the fair value measurement disclosure requirements of ASC 820 by adding new disclosure requirements, modifying existing disclosure requirement, and eliminating other disclosure requirements. Early adoption is permitted. We are currently evaluating the impact that the standard will have on our financial statement disclosures.
In August 2018, the FASB issued ASU 2018-15,
Intangibles—Goodwill and other Internal-use Software (Subtopic 350-40)
. ASU 2018-15 aligns the accounting for costs incurred to implement a cloud computing arrangement (CCA ) that is a service arrangement with the guidance on capitalizing costs associated with developing or obtaining internal-use software. Specifically, the ASU amends ASC 350 to include in its scope implementation costs of a CCA that is a service contract and clarifies that a customer should apply ASC 350-40 to determine which implementation costs should be capitalized in a CCA that is considered a service contract. Early adoption is permitted. The effect of this new standard on our consolidated financial statements will be dependent on our entry into any future cloud computing arrangements.
Effective the first quarter of fiscal 2021:
In June 2016, the FASB issued ASU 2016-13,
Financial Instruments—Credit Losses (Topic 326)
:
Measurement of Credit Losses on Financial Instruments
. ASU 2016-13 includes an impairment model (known as the current expected credit loss (CECL) model) that is based on expected losses rather than incurred losses. Under the new guidance, an entity recognizes as an allowance its estimate of expected credit losses (ECL), which the
F- 19
UNIVERSAL TECHNICAL INSTITUTE, INC. AND SUBSIDIARIES
NOTES TO CONSOLIDATED FINANCIAL STATEMENTS
($’s in thousands, except per share amounts)
FASB believes will result in more timely recognition of such losses. We are currently evaluating the impact that the update will have on our results of operations, financial condition and financial statement disclosures.
4. Revenue from Contracts with Customers
Adoption of ASC 606
We adopted ASC 606 effective October 1, 2017. As a result, we have changed our accounting for revenue recognition as detailed in Note 2. Except for the changes resulting from this adoption, we have consistently applied the accounting policies to all periods presented in these consolidated financial statements.
We applied ASC 606 using the modified retrospective method by recognizing the cumulative effect of initially applying ASC 606 as an adjustment to the opening balance of equity at October 1, 2017. Therefore, the comparative information has not been adjusted and continues to be reported under the prior guidance of ASC 605. The details of the significant changes and quantitative impact of the changes are disclosed in Note 3.
Nature of Goods and Services
See Note 2 for a description of the nature of revenues.
We provide postsecondary education and other services in the same geographical market, the U.S. The impact of economic factors on the nature, amount, timing and uncertainty of revenue and cash flows is consistent among our various postsecondary education programs. See Note 17 for disaggregated segment revenue information.
Contract Balances
Contract assets primarily relate to the Company’s rights to consideration for work completed in relation to its services performed but not billed at the reporting date. The contract assets are transferred to the receivables when the rights become unconditional. Currently, the Company does not have any contract assets which have not transferred to a receivable. The contract liabilities primarily relate to service contracts where we received payments but we have not yet satisfied the related performance obligations. The advance consideration received from customers for the services is a contract liability until services are provided to the customer.
The following table provides information about receivables and contract liabilities from contracts with customers:
|
|
|
September 30, 2018
|
|
September 30, 2017
|
||||
|
Receivables, which includes Tuition and Notes Receivable
|
|
$
|
46,372
|
|
|
$
|
10,268
|
|
|
Contract liabilities
|
|
$
|
38,236
|
|
|
$
|
41,338
|
|
During the
year ended September 30, 2018
, the contract liabilities balance included decreases for revenues recognized during the period and increases related to new students who started school during the period.
Transaction Price Allocated to the Remaining Performance Obligations
Tuition and fee revenue is recognized ratably over the term of the course or program offered. The majority of our programs are designed to be completed in 33 to 102 weeks, and our advanced training programs range from 12 to 23 weeks in duration.
F- 20
UNIVERSAL TECHNICAL INSTITUTE, INC. AND SUBSIDIARIES
NOTES TO CONSOLIDATED FINANCIAL STATEMENTS
($’s in thousands, except per share amounts)
Impacts on Financial Statements
In accordance with Topic 606, the disclosure of the impact of adoption to our consolidated statements of loss and balance sheets was as follows:
|
|
September 30, 2018
|
|||||||||||
|
As Reported
|
Adjustments
|
Balance Without ASC 606 Adoption
|
||||||||||
|
Consolidated Balance Sheet Data:
|
||||||||||||
|
Notes receivable, current portion
|
$
|
5,183
|
|
$
|
(5,183
|
)
|
$
|
—
|
|
|||
|
Total current assets
|
116,795
|
|
(5,183
|
)
|
111,612
|
|
||||||
|
Notes receivable, less current portion
|
31,194
|
|
(31,194
|
)
|
—
|
|
||||||
|
Total assets
|
282,278
|
|
(36,377
|
)
|
245,901
|
|
||||||
|
Deferred revenue
|
$
|
38,236
|
|
$
|
(1,408
|
)
|
$
|
36,828
|
|
|||
|
Total current liabilities
|
92,462
|
|
(1,408
|
)
|
91,054
|
|
||||||
|
Total liabilities
|
155,633
|
|
(1,408
|
)
|
154,225
|
|
||||||
|
Retained deficit
|
(31,555
|
)
|
(34,969
|
)
|
(66,524
|
)
|
||||||
|
Total shareholders' equity
|
126,645
|
|
(34,969
|
)
|
91,676
|
|
||||||
|
Total liabilities and shareholders' equity
|
282,278
|
|
(36,377
|
)
|
245,901
|
|
||||||
|
|
Year Ended September 30, 2018
|
||||||||
|
As Reported
|
Adjustments
|
Balance Without ASC 606 Adoption
|
|||||||
|
Consolidated Statement of Loss Data:
|
|||||||||
|
Revenues
|
316,965
|
|
2,241
|
|
319,206
|
|
|||
|
Loss from operations
|
(35,275
|
)
|
2,241
|
|
(33,034
|
)
|
|||
|
Loss before income taxes
|
(35,697
|
)
|
2,241
|
|
(33,456
|
)
|
|||
|
Net loss
|
(32,682
|
)
|
2,241
|
|
(30,441
|
)
|
|||
F- 21
UNIVERSAL TECHNICAL INSTITUTE, INC. AND SUBSIDIARIES
NOTES TO CONSOLIDATED FINANCIAL STATEMENTS
($’s in thousands, except per share amounts)
5. Receivables, net
Receivables, net consist of the following:
|
|
September 30,
|
|||||||
|
2018
|
2017
|
|||||||
|
Tuition receivables
|
$
|
12,205
|
|
$
|
12,150
|
|
||
|
Tax receivables
|
|
322
|
|
|
—
|
|
||
|
Other receivables
|
9,578
|
|
3,626
|
|
||||
|
Receivables
|
22,105
|
|
15,776
|
|
||||
|
Less allowance for uncollectible accounts
|
(999
|
)
|
(579
|
)
|
||||
|
$
|
21,106
|
|
$
|
15,197
|
|
|||
The allowance for uncollectible accounts is estimated using our historical write-off experience applied to the receivable balances for students who are no longer attending school due to graduation or withdrawal or who are in school and have receivable balances in excess of financial aid available to them. We write off receivable balances against the allowance for uncollectible accounts at the time we transfer the balance to a third party collection agency.
The following table summarizes the activity for our allowance for uncollectible accounts for the year ended September 30:
|
Balance at
Beginning of Period |
Additions to
Bad Debt Expense |
Write-offs of
Uncollectible Accounts |
Balance at
End of Period |
|||||||||||||
|
2018
|
$
|
579
|
|
$
|
1,511
|
|
$
|
(1,091
|
)
|
$
|
999
|
|
||||
|
2017
|
$
|
951
|
|
$
|
827
|
|
$
|
(1,199
|
)
|
$
|
579
|
|
||||
|
2016
|
$
|
1,820
|
|
$
|
1,153
|
|
$
|
(2,022
|
)
|
$
|
951
|
|
||||
6. Investments
During 2017, we invested in various bond funds. These investments were held principally for resale in the near term and were classified as trading securities. The trading securities were recorded at fair value based on the closing market price of the security. During the three months ended December 31, 2017, we liquidated our investment in trading securities; as a result, there was no unrealized gain on trading securities at
September 30, 2018
.
During 2017, our held-to-maturity securities consisted of corporate bonds from large cap industrial and selected financial companies with a minimum credit rating of A. We had the ability and intention to hold our investments until maturity and therefore classified these investments as held-to-maturity and reported them at amortized cost. At September 30, 2018, there are no investments reported in the consolidated balance sheets.
F- 22
UNIVERSAL TECHNICAL INSTITUTE, INC. AND SUBSIDIARIES
NOTES TO CONSOLIDATED FINANCIAL STATEMENTS
($’s in thousands, except per share amounts)
Amortized cost and fair value for investments classified as held-to-maturity at
September 30, 2017
were as follows:
|
Estimated
|
||||||||||||||||
|
|
Amortized
|
Gross Unrealized
|
Fair Market
|
|||||||||||||
|
|
Cost
|
Gains
|
Losses
|
Value
|
||||||||||||
|
Due in less than 1 year:
|
||||||||||||||||
|
Corporate bonds
|
$
|
7,759
|
|
$
|
—
|
|
$
|
(4
|
)
|
$
|
7,755
|
|
||||
|
$
|
7,759
|
|
$
|
—
|
|
$
|
(4
|
)
|
$
|
7,755
|
|
|||||
7. Fair Value Measurements
The accounting framework for determining fair value includes a hierarchy for ranking the quality and reliability of the information used to measure fair value, which enables the reader of the financial statements to assess the inputs used to develop those measurements. The fair value hierarchy consists of three tiers: Level 1, defined as quoted market prices in active markets for identical assets or liabilities; Level 2, defined as inputs other than Level 1 that are observable, either directly or indirectly, such as quoted prices for similar assets or liabilities, quoted prices in markets that are not active, model-based valuation techniques for which all significant assumptions are observable in the market or other inputs that are observable or can be corroborated by observable market data for substantially the full term of the assets or liabilities and Level 3, defined as unobservable inputs that are not corroborated by market data. Any transfers of investments between levels occurs at the end of the reporting period.
Assets measured or disclosed at fair value on a recurring basis consisted of the following:
|
|
|
Fair Value Measurements Using
|
||||||||||||||
|
|
September 30, 2018
|
Quoted Prices
in Active Markets for Identical Assets (Level 1) |
Significant
Other Observable Inputs (Level 2) |
Significant
Unobservable Inputs (Level 3) |
||||||||||||
|
Money market funds
|
$
|
36,387
|
|
$
|
36,387
|
|
$
|
—
|
|
$
|
—
|
|
||||
|
Notes receivable
|
36,377
|
|
—
|
|
—
|
|
36,377
|
|
||||||||
|
Total assets at fair value on a recurring basis
|
$
|
72,764
|
|
$
|
36,387
|
|
$
|
—
|
|
$
|
36,377
|
|
||||
|
|
|
Fair Value Measurements Using
|
||||||||||||||
|
|
September 30, 2017
|
Quoted Prices
in Active Markets for Identical Assets (Level 1) |
Significant
Other Observable Inputs (Level 2) |
Significant
Unobservable Inputs (Level 3) |
||||||||||||
|
Trading securities
|
$
|
40,020
|
|
$
|
40,020
|
|
$
|
—
|
|
$
|
—
|
|
||||
|
Money market funds
|
39,569
|
|
39,569
|
|
—
|
|
—
|
|
||||||||
|
Corporate bonds
|
7,755
|
|
7,755
|
|
—
|
|
—
|
|
||||||||
|
Total assets at fair value on a recurring basis
|
$
|
87,344
|
|
$
|
87,344
|
|
$
|
—
|
|
$
|
—
|
|
||||
Money market funds are reflected as cash and cash equivalents in our consolidated balance sheets.
F- 23
UNIVERSAL TECHNICAL INSTITUTE, INC. AND SUBSIDIARIES
NOTES TO CONSOLIDATED FINANCIAL STATEMENTS
($’s in thousands, except per share amounts)
8. Property and Equipment, net
Property and equipment, net consisted of the following:
|
Depreciable
Lives (in years) |
September 30,
2018 |
September 30,
2017 |
||||||||
|
Land
|
—
|
$
|
3,189
|
|
$
|
3,189
|
|
|||
|
Building and building improvements
|
30-35
|
81,304
|
|
79,712
|
|
|||||
|
Leasehold improvements
|
1-28
|
54,310
|
|
41,825
|
|
|||||
|
Training equipment
|
3-10
|
95,795
|
|
94,817
|
|
|||||
|
Office and computer equipment
|
3-10
|
36,714
|
|
36,458
|
|
|||||
|
Curriculum development
|
5
|
19,692
|
|
19,713
|
|
|||||
|
Software developed for internal use
|
1-5
|
12,251
|
|
11,772
|
|
|||||
|
Vehicles
|
5
|
1,400
|
|
1,269
|
|
|||||
|
Construction in progress
|
—
|
4,250
|
|
1,599
|
|
|||||
|
308,905
|
|
290,354
|
|
|||||||
|
Less accumulated depreciation and amortization
|
(194,057
|
)
|
(183,690
|
)
|
||||||
|
$
|
114,848
|
|
$
|
106,664
|
|
|||||
Depreciation expense related to our property and equipment was
$16.0 million
,
$16.9 million
and
$17.3 million
for the years ended September 30,
2018
,
2017
and
2016
, respectively. Amortization expense related to curriculum development and software developed for internal use was
$0.5 million
,
$0.7 million
and
$1.1 million
for the years ended September 30,
2018
,
2017
and
2016
, respectively.
The following amounts, which are included in the above table, represent assets financed by financing obligations:
|
September 30,
2018 |
September 30,
2017 |
|||||||
|
Assets financed by financing obligations, gross
|
$
|
45,816
|
|
$
|
45,816
|
|
||
|
Less accumulated depreciation and amortization
|
(11,526
|
)
|
(8,844
|
)
|
||||
|
Assets financed by financing obligation, net
|
$
|
34,290
|
|
$
|
36,972
|
|
||
9. Build-to-Suit Leases
We entered into build-to-suit facility lease agreements related to the design and construction of our Long Beach, California campus and the relocation of our Glendale Heights, Illinois campus to, and the design and construction of a new campus in, Lisle, Illinois. Under each agreement, we determined that we have continued involvement in the related facility after the construction period was completed. Therefore, the arrangements are accounted for as financing obligations. Accordingly, the asset and a corresponding financing obligation are included in our consolidated balance sheet. The asset is being depreciated over the initial lease term of
15
years for our Long Beach, California campus, and over the initial lease term of
18
years for our Lisle, Illinois campus. The financing obligation is amortized through the effective interest method in which a portion of the lease payments is recognized as interest expense, a portion is allocated to the imputed land lease and the remaining portion decreases the financing obligation.
F- 24
UNIVERSAL TECHNICAL INSTITUTE, INC. AND SUBSIDIARIES
NOTES TO CONSOLIDATED FINANCIAL STATEMENTS
($’s in thousands, except per share amounts)
Additionally, for each campus, we have an imputed operating lease related to our use of the land which is recognized from the time we entered into the agreement through the initial lease term. Construction for our Long Beach, California campus was completed during August 2015 and the facility was placed into service effective September 1, 2015. Construction for our Lisle, Illinois campus was completed during November 2013 and the facility was placed into service effective December 1, 2013.
Future minimum lease payments under the Lisle, Illinois and Long Beach, California leases as of September 30,
2018
are as follows:
|
Years ending September 30,
|
|
|||
|
2019
|
$
|
4,646
|
|
|
|
2020
|
4,772
|
|
||
|
2021
|
4,902
|
|
||
|
2022
|
5,035
|
|
||
|
2023
|
5,171
|
|
||
|
Thereafter
|
44,795
|
|
||
|
Total future minimum lease obligation
|
$
|
69,321
|
|
|
|
Less imputed interest on financing obligation
|
(26,727
|
)
|
||
|
Less imputed accrued land lease obligation
|
(560
|
)
|
||
|
Net present value of financing obligation
|
$
|
42,034
|
|
|
10. Investment in Unconsolidated Affiliate
In 2012, we invested
$4.0 million
to acquire an equity interest of approximately
28%
in a joint venture (JV) related to the lease of our Lisle, Illinois campus facility. In connection with this investment, we do not possess a controlling financial interest as we do not hold a majority of the equity interest, nor do we have the power to make major decisions without approval from the other equity member. Therefore, we do not qualify as the primary beneficiary. Accordingly, this investment is accounted for under the equity method of accounting and is included in other assets in our consolidated balance sheet. We recognize our proportionate share of the JV’s net income or loss during each accounting period as a change in our investment.
Historically, the JV used an interest rate cap to manage interest rate risk associated with its floating rate debt. This derivative instrument was designated as a cash flow hedge based on the nature of the risk being hedged. As such, the effective portion of the gain or loss on the derivative was initially reported as a component of the JV’s accumulated other comprehensive income or loss, net of tax, and was subsequently reclassified into earnings when the hedged transaction affects earnings. Any ineffective portion of the gain or loss was recognized in the JV’s current earnings. Due to our equity method investment in the JV, when the JV reports a current year component of other comprehensive income (OCI), we, as an investor, likewise adjust our investment account for the change in investee equity. In addition, we adjust our OCI for our share of the JV’s currently reported OCI item. During the three months ended December 31, 2017, the JV refinanced the facility loan and discontinued its use of an interest rate cap.
Our equity in earnings of unconsolidated affiliates was
$0.4 million
,
$0.5 million
and
$0.3 million
for the years ended September 30,
2018
,
2017
and
2016
, respectively.
F- 25
UNIVERSAL TECHNICAL INSTITUTE, INC. AND SUBSIDIARIES
NOTES TO CONSOLIDATED FINANCIAL STATEMENTS
($’s in thousands, except per share amounts)
Investment in our unconsolidated affiliate consists of the following:
|
September 30, 2018
|
September 30, 2017
|
|||||||||||||
|
Carrying Value
|
Ownership Percentage
|
Carrying Value
|
Ownership Percentage
|
|||||||||||
|
Investment in JV
|
$
|
4,206
|
|
27.972
|
%
|
$
|
4,112
|
|
27.972
|
%
|
||||
Investment in our unconsolidated affiliate included the following activity during the period:
|
Year ended September 30,
|
||||||||
|
2018
|
2017
|
|||||||
|
Balance at beginning of period
|
$
|
4,112
|
|
$
|
4,036
|
|
||
|
Equity in earnings of unconsolidated affiliate
|
385
|
|
484
|
|
||||
|
Return of capital contribution from unconsolidated affiliate
|
(291
|
)
|
(390
|
)
|
||||
|
Equity interest in investee's unrealized gains on hedging derivatives, net of taxes
|
|
—
|
|
|
(18
|
)
|
||
|
Balance at end of period
|
$
|
4,206
|
|
$
|
4,112
|
|
||
11. Accounts Payable and Accrued Expenses
Accounts payable and accrued expenses consisted of the following:
|
September 30, 2018
|
September 30, 2017
|
|||||||
|
Accounts payable
|
$
|
8,759
|
|
$
|
9,515
|
|
||
|
Accrued compensation and benefits
|
22,022
|
|
16,612
|
|
||||
|
Other accrued expenses
|
15,836
|
|
11,354
|
|
||||
|
$
|
46,617
|
|
$
|
37,481
|
|
|||
12. Income Taxes
Each reporting period, we estimate the likelihood that we will be able to recover our deferred tax assets, which represent timing differences in the recognition of revenue and certain tax deductions for accounting and tax purposes. The realization of deferred tax assets is dependent, in part, upon future taxable income. In assessing the need for a valuation allowance, we consider all available evidence, including our historical profitability and projections of future taxable income. If, based on the weight of available evidence, it is more likely than not the deferred tax assets will not be realized, we record a valuation allowance. Such valuation allowance is maintained on our deferred tax assets until sufficient positive evidence exists to support its reversal in future periods. The weight given to the positive and negative evidence is commensurate with the extent to which the evidence may be objectively verified. Significant judgment is required to determine if, and the extent to which, valuation allowances should be recorded against deferred tax assets.
During the three months ended March 31, 2016, there were several pieces of negative evidence that contributed to our conclusion that a valuation allowance was appropriate against all deferred tax assets that rely upon future taxable income for their realization. As a result of our assessment, we recorded a full valuation allowance during the three months ended March 31, 2016. The amount of the deferred tax assets considered
F- 26
UNIVERSAL TECHNICAL INSTITUTE, INC. AND SUBSIDIARIES
NOTES TO CONSOLIDATED FINANCIAL STATEMENTS
($’s in thousands, except per share amounts)
realizable, however, could be adjusted in future periods if estimates of future taxable income during the carryforward period are increased, if objective negative evidence in the form of cumulative losses is no longer present and if additional weight may be given to subjective evidence such as our projections for growth. We continue to have a full valuation allowance as of September 30, 2018 and will continue to evaluate our valuation allowance in future periods for any change in circumstances that causes a change in judgment about the realizability of the deferred tax assets.
Tax Cuts and Jobs Act
On December 22, 2017, the Tax Cuts and Jobs Act (the Act) was enacted. The Act makes significant changes to U.S. tax laws, including the following that are expected to be impactful to us: lower corporate tax rates; limitations on the amount of net operating losses that can be used to offset income beginning with our fiscal year ending September 30, 2019; the elimination of net operating loss carrybacks and the allowance of indefinite loss carryforwards; and the immediate expensing of short-lived capital investment, such as machinery and equipment.
As of December 31, 2017, we have adjusted our deferred tax liabilities and deferred tax assets, and the corresponding valuation allowance, for the expected impact of the provisions of the Act. As our net operating losses can now be carried forward indefinitely, our related deferred tax asset can be offset with the deferred tax liability related to goodwill, before a full valuation allowance was applied to the deferred tax asset. As a result, we released approximately
$2.8 million
of the existing valuation allowance during the three months ended December 31, 2017.
Section 382 Change in Ownership
Under Section 382 of the Internal Revenue Code (IRC), for income tax purposes only, we underwent a change in ownership as a result of a preferred stock issuance in June 2016. Under the IRC, a change in ownership occurs when a five percent shareholder, as measured by ownership value, increases their ownership in a loss corporation by more than 50 percentage points during the defined testing period; both common and preferred stock are included in the determination of ownership value. Since the purchaser of the preferred stock acquired ownership exceeding 50 percent of our total ownership value, this transaction qualified as a change in ownership under section 382 of the IRC only. Accordingly, certain deductions and losses will be subject to an annual Section 382 limitation. The limitation will affect the timing of when these deductions and losses can be used and may cause us to make income tax payments even if a pre-tax loss is recorded in future periods. The limitation may also cause the deductions and losses to expire unused.
The components of income tax expense (benefit) are as follows:
|
|
Year Ended September 30,
|
|||||||||||
|
2018
|
2017
|
2016
|
||||||||||
|
Current expense (benefit)
|
||||||||||||
|
United States federal
|
$
|
(125
|
)
|
$
|
4,153
|
|
$
|
(2,043
|
)
|
|||
|
State
|
(78
|
)
|
1,244
|
|
285
|
|
||||||
|
Total current expense (benefit)
|
(203
|
)
|
5,397
|
|
(1,758
|
)
|
||||||
|
Deferred (benefit) expense
|
||||||||||||
|
United States federal
|
(2,878
|
)
|
—
|
|
24,877
|
|
||||||
|
State
|
66
|
|
—
|
|
3,051
|
|
||||||
|
Total deferred (benefit) expense
|
(2,812
|
)
|
—
|
|
27,928
|
|
||||||
|
Total provision (benefit) for income taxes
|
$
|
(3,015
|
)
|
$
|
5,397
|
|
$
|
26,170
|
|
|||
F- 27
UNIVERSAL TECHNICAL INSTITUTE, INC. AND SUBSIDIARIES
NOTES TO CONSOLIDATED FINANCIAL STATEMENTS
($’s in thousands, except per share amounts)
The income tax provision differs from the tax that would result from application of the blended statutory federal tax rate of
24.5%
to pre-tax income for the year ended September 30, 2018 and
35.0%
to pre-tax income for the years ended September 30, 2017 and September 30, 2016. The reasons for the differences are as follows:
|
|
Year Ended September 30,
|
|||||||||||
|
2018
|
2017
|
2016
|
||||||||||
|
Income tax expense at statutory rate
|
$
|
(8,746
|
)
|
$
|
(956
|
)
|
$
|
(7,534
|
)
|
|||
|
State income taxes, net of federal tax benefit
|
(12
|
)
|
302
|
|
(531
|
)
|
||||||
|
Change in federal statutory rate
|
12,645
|
|
—
|
|
51
|
|
||||||
|
Increase (decrease) in valuation allowance
|
(7,066
|
)
|
6,192
|
|
34,184
|
|
||||||
|
Other, net
|
164
|
|
(141
|
)
|
—
|
|
||||||
|
Total income tax expense (benefit)
|
$
|
(3,015
|
)
|
$
|
5,397
|
|
$
|
26,170
|
|
|||
Beginning in December 2013, certain stock-based compensation awards granted to employees expired, which required a write-off of the related deferred tax asset through income tax expense as our pro forma windfall pool of available excess tax benefits was no longer sufficient to absorb the shortfall. As a result of the full valuation allowance recorded on our deferred tax assets during the three months ended March 31, 2016, any write-offs of deferred tax assets related to stock-based compensation will have no impact on income tax expense. In the year ended September 30, 2016, we wrote off
$1.8 million
of deferred tax assets related to stock-based compensation and reduced the corresponding valuation allowance by the same amount.
The components of the deferred tax assets (liabilities) recorded in the accompanying consolidated balance sheets were as follows:
|
|
September 30,
|
|||||||
|
2018
|
2017
|
|||||||
|
Gross deferred tax assets:
|
||||||||
|
Deferred compensation
|
$
|
1,253
|
|
$
|
1,976
|
|
||
|
Reserves and accruals
|
4,794
|
|
5,017
|
|
||||
|
Accrued tool sets
|
638
|
|
1,111
|
|
||||
|
Deferred revenue
|
9,185
|
|
27,056
|
|
||||
|
Deferred rent liability
|
189
|
|
455
|
|
||||
|
Net operating losses and tax credit carryforwards
|
5,389
|
|
416
|
|
||||
|
Depreciation and amortization of property and equipment
|
3,740
|
|
3,151
|
|
||||
|
Charitable contribution carryovers
|
804
|
|
665
|
|
||||
|
Deductions limited by Section 382
|
700
|
|
943
|
|
||||
|
Valuation allowance
|
(23,112
|
)
|
(38,407
|
)
|
||||
|
Total gross deferred tax assets
|
3,580
|
|
2,383
|
|
||||
|
Gross deferred tax liabilities:
|
||||||||
|
Amortization of goodwill and intangibles
|
(2,056
|
)
|
(3,141
|
)
|
||||
|
Prepaid and other expenses deductible for tax
|
(1,853
|
)
|
(2,383
|
)
|
||||
|
Total deferred tax liabilities, gross
|
(3,909
|
)
|
(5,524
|
)
|
||||
|
Net deferred tax liabilities
|
$
|
(329
|
)
|
$
|
(3,141
|
)
|
||
F- 28
UNIVERSAL TECHNICAL INSTITUTE, INC. AND SUBSIDIARIES
NOTES TO CONSOLIDATED FINANCIAL STATEMENTS
($’s in thousands, except per share amounts)
The following table summarizes the activity for the valuation allowance for the year ended September 30:
|
Balance at
Beginning of
Period
|
Additions
(Reductions)
to Income
Tax
Expense
|
Write-offs
(1)
|
Balance at
End of
Period
|
|||||||||||||
|
2018
|
$
|
38,407
|
|
$
|
(5,555
|
)
|
$
|
(9,740
|
)
|
$
|
23,112
|
|
||||
|
2017
|
$
|
32,828
|
|
$
|
6,192
|
|
$
|
(613
|
)
|
$
|
38,407
|
|
||||
|
2016
|
$
|
401
|
|
$
|
34,184
|
|
$
|
(1,757
|
)
|
$
|
32,828
|
|
||||
(1)
Of this total, approximately
$9.6 million
relates to our adoption of ASC 606 as of October 1, 2017.
As of
September 30, 2018
, we had approximately
$6.9 million
in deferred tax assets related to charitable contribution carryforwards, deductions limited by Section 382, as well as net operating loss and credit carryforwards. These attributes will expire in the years 2019 through 2039.
We file income tax returns for federal purposes and in many states. Our tax filings remain subject to examination by applicable tax authorities for a certain length of time, generally three to four years, following the tax year to which these filings relate.
13. Commitments and Contingencies
Operating Leases
We lease certain of our facilities and certain equipment under non-cancelable operating leases, some of which contain renewal options, escalation clauses and requirements to pay other fees associated with the leases. We recognize rent expense on a straight-line basis. Property at
one
of our campus locations is leased from a related party. Future minimum rental commitments as of September 30,
2018
for all non-cancelable operating leases are as follows:
|
Years ending September 30,
|
Gross
|
Sublease income
|
Net
|
||||||||
|
2019
|
$
|
28,945
|
|
$
|
(927
|
)
|
$
|
28,018
|
|
||
|
2020
|
27,287
|
|
(364
|
)
|
26,923
|
|
|||||
|
2021
|
24,471
|
|
(79
|
)
|
24,392
|
|
|||||
|
2022
|
22,808
|
|
(81
|
)
|
22,727
|
|
|||||
|
2023
|
8,853
|
|
(21
|
)
|
8,832
|
|
|||||
|
Thereafter
|
40,622
|
|
—
|
|
40,622
|
|
|||||
|
|
$
|
152,986
|
|
$
|
(1,472
|
)
|
$
|
151,514
|
|
||
Rent expense for operating leases was approximately
$29.1 million
,
$27.8 million
and
$27.9 million
for the years ended September 30,
2018
,
2017
and
2016
, respectively.
Rent expense includes rent paid to related parties, which was approximately
$2.0 million
,
$2.0 million
and
$2.0 million
for the years ended September 30,
2018
,
2017
and
2016
, respectively. Since 1991, certain of our properties have been leased from entities controlled by John C. White, an independent Director on our Board of Directors.
F- 29
UNIVERSAL TECHNICAL INSTITUTE, INC. AND SUBSIDIARIES
NOTES TO CONSOLIDATED FINANCIAL STATEMENTS
($’s in thousands, except per share amounts)
A portion of the property comprising our Orlando, Florida location is occupied pursuant to a lease with the John C. and Cynthia L. White 1989 Family Trust, with the lease term expiring on August 19, 2022. The annual base lease payments for the first year under this lease totaled approximately
$0.3 million
, with annual adjustments based on the higher of (i) an amount equal to
4%
of the total annual rent for the immediately preceding year or (ii) the percentage of increase in the Consumer Price Index.
Another portion of the property comprising our Orlando, Florida location is occupied pursuant to a lease with Delegates LLC, an entity controlled by the White Family Trust, with the lease term expiring on August 31, 2022. The beneficiaries of this trust are Mr. White’s children, and the trustee of the trust is not related to Mr. White. Annual base lease payments for the first year under this lease totaled approximately
$0.7 million
, with annual adjustments based on the higher of (i) an amount equal to
4%
of the total annual rent for the immediately preceding year or (ii) the percentage of increase in the Consumer Price Index.
Licensing Agreements
In 1999, we entered into a licensing agreement that gives us the right to use certain materials and trademarks in the development of our courses. The agreement was amended in November 2009. Under the terms of the amended agreement, we are required to pay a flat fee per student for each program a student completes. There are no minimum license fees required to be paid. The agreement terminates upon the written notice of either party providing not less than ninety days notification of intent to terminate. License fees related to this agreement were
$0.7 million
,
$0.9 million
and
$0.9 million
for the years ended September 30,
2018
,
2017
and
2016
, respectively, and were recorded in educational services and facilities expenses.
In May 2007, we entered into a licensing agreement that gives us the right to use certain trademarks, trade names, trade dress and other intellectual property in connection with the operation of our campuses and courses. The agreement was amended January 2015 and expires December 31, 2024. We are committed to pay royalties based upon minimum amounts specified in the agreement, throughout the term. The agreement required a minimum royalty payment of
$1.6 million
in calendar year 2018. The minimum royalty payments increase approximately
$0.05 million
every other calendar year thereafter. The expense related to these agreements was
$1.6 million
,
$1.6 million
and
$1.7 million
for the years ended September 30,
2018
,
2017
and
2016
, respectively, and was recorded in educational services and facilities expenses.
In July 2013, we entered into a training and materials agreement that gives us the right to use certain materials and trademarks in development of our courses. Under the terms of the agreement, we are required to pay a flat fee per student for each related program a student completes. There is an immaterial minimum annual fee required to be paid upon commencement of the program and annually thereafter. The agreement terminates upon the written notice of either party providing not less than
90 days
notification of intent to terminate. The expense related to this agreement was
$0.1 million
for the years ended September 30,
2018
,
2017
and 2016, respectively and was recorded in educational services and facilities expenses.
In April 2015, we entered into a licensing agreement that gives us the right to use certain trademarks in connection with the operation of our campuses and courses. The agreement has an initial term of four years, with options for three annual renewals totaling a seven year term. The maximum license fee over seven years is
$2.3 million
. The expense related to this agreement was
$0.4 million
,
$0.4 million
and
$0.5 million
for the years ended September 30,
2018
,
2017
and
2016
, respectively, and was recorded in educational services and facilities expenses.
Vendor Relationships
We have an agreement with a vendor that allows us to purchase promotional tool kits for our students at a discount from the vendor’s list price. In addition, we earn credits that are redeemable for equipment from the vendor that we use in our business. Credits are earned on our purchases as well as purchases made by students
F- 30
UNIVERSAL TECHNICAL INSTITUTE, INC. AND SUBSIDIARIES
NOTES TO CONSOLIDATED FINANCIAL STATEMENTS
($’s in thousands, except per share amounts)
enrolled in our programs. We have agreed to grant the vendor exclusive access to our campuses, to display advertising and to use their tools to train our students. The credits under this agreement may be redeemed in multiple ways, which historically has been for additional equipment at the full retail list price, which is more than we would be required to pay using cash. The renewal was executed in October 2017 and expires October 31, 2022. The renewal allows us to redeem our credits for a portion of the tool sets we purchase for our students. Any product credits remaining at termination will expire 60 days after the date of termination. A net prepaid expense with the vendor resulted from an excess of credits earned over credits used of
$6.8 million
and
$7.9 million
as of September 30,
2018
and
2017
, respectively.
Students are provided a Career Starter Tool Set Voucher which can be redeemed for a tool set near graduation. The cost of the tool sets, net of the credit, is accrued during the time period in which the students begin attending school until they have progressed to the point that the promotional tool set vouchers are provided. Our consolidated balance sheets include an accrued tool set liability of
$2.4 million
and
$2.8 million
as of September 30,
2018
and
2017
, respectively. Additionally, our liability to the vendor for vouchers redeemed by students was
$1.9 million
and
$1.7 million
as of September 30,
2018
and
2017
, respectively, and is included in accounts payable and accrued expenses in our consolidated balance sheets.
Executive Employment Agreements
We have employment agreements with key executives that provide for continued salary payments and benefits if the executives are terminated for reasons other than cause or in the event of a change in control, as defined in the agreements. The range of the aggregate commitment upon termination of employment under these agreements and existing equity award agreements as of September 30,
2018
is approximately
$1.8 million
to
$3.8 million
.
Change in Control Agreements
We have severance agreements with other executives that provide for continued salary payments if the employees are terminated for any reason within twelve months subsequent to a change in control. Under the terms of the agreements, these employees are entitled to between
six
and
twelve months
salary at their highest rate during the previous twelve months. In addition, the employees are eligible to receive the unearned portion of their target bonus in effect in the year termination occurs and would be eligible to receive medical benefits under the plans maintained by us at no cost. The aggregate amount of our commitments under these agreements as of September 30,
2018
is approximately
$9.4 million
.
Deferred Compensation Plans
We have established a deferred compensation plan (the Plan) effective April 1, 2010, into which certain members of management are eligible to defer a maximum of
75%
of their regular compensation and a maximum of
100%
of their incentive compensation. Non-employee members of our Board of Directors are eligible to defer up to
100%
of their cash compensation. The amounts deferred by the participant under this Plan are credited with earnings or losses based upon changes in values of participant elected notional investments. Each participant is fully vested in the amounts deferred.
We may make contributions at the discretion of our Board of Directors that will generally vest according to a
five
year vesting schedule. Distribution elections under the Plan may be for separation from service distribution or in-service distribution. We are not obligated to fund the Plan; however, we have purchased life insurance policies on the participants in order to fund the related benefits and such policies have been placed into a rabbi trust.
F- 31
UNIVERSAL TECHNICAL INSTITUTE, INC. AND SUBSIDIARIES
NOTES TO CONSOLIDATED FINANCIAL STATEMENTS
($’s in thousands, except per share amounts)
Our obligations under the Plan totaled
$4.4 million
as of September 30,
2018
and
2017
, respectively, and are included in other liabilities while the cash surrender value of the life insurance policies totaled
$5.3 million
and
$5.1 million
as of September 30,
2018
and
2017
, respectively, and are included in other assets in our consolidated balance sheets.
Surety Bonds
Each of our campuses must be authorized by the applicable state education agency in which the campus is located to operate and to grant certificates, diplomas or degrees to its students. Our campuses are subject to extensive, ongoing regulation by each of these states. Additionally, our campuses are required to be authorized by the applicable state education agencies of certain other states in which our campuses recruit students. Our insurers issue surety bonds for us on behalf of our campuses and admissions representatives with multiple states to maintain authorization to conduct our business. We are obligated to reimburse our insurers for any surety bonds that are paid by the insurers. As of September 30,
2018
, the total face amount of these surety bonds was approximately
$19.5 million
. During the year ended September 30, 2017, we renegotiated the bonds required to operate and collateralized
$11.5 million
in bonds, which is reflected in restricted cash on our consolidated balance sheets.
Legal
In the ordinary conduct of our business, we are periodically subject to lawsuits, demands in arbitration, investigations, regulatory proceedings or other claims, including, but not limited to, claims involving current or former students, routine employment matters, business disputes and regulatory demands. When we are aware of a claim or potential claim, we assess the likelihood of any loss or exposure. If it is probable that a loss will result and the amount of the loss can be reasonably estimated, we would accrue a liability for the loss. When a loss is not both probable and estimable, we do not accrue a liability. Where a loss is not probable but is reasonably possible, including if a loss in excess of an accrued liability is reasonably possible, we determine whether it is possible to provide an estimate of the amount of the loss or range of possible losses for the claim. Because we cannot predict with certainty the ultimate resolution of the legal proceedings (including lawsuits, investigations, regulatory proceedings or claims) asserted against us, it is not currently possible to provide such an estimate. The ultimate outcome of pending legal proceedings to which we are a party may have a material adverse effect on our business, cash flows, results of operations or financial condition.
14. Shareholders’ Equity
Common Stock
Holders of our common stock are entitled to receive dividends when and as declared by our Board of Directors and have the right to
one
vote per share on all matters requiring shareholder approval. On June 9, 2016, our Board of Directors voted to eliminate the quarterly cash dividend on our common stock.
Preferred Stock
Preferred Stock consists of
10,000,000
authorized preferred shares of
$0.0001
par value each. As of September 30,
2018
and
2017
,
700,000
shares of Series A Preferred Stock were issued and outstanding. The liquidation preference associated with the Series A Preferred Stock was
$100
per share at September 30, 2018 and 2017.
Series A Convertible Preferred Stock
On June 24, 2016, we entered into a Securities Purchase Agreement (Purchase Agreement) with Coliseum Holdings I, LLC (Purchaser) to sell to the Purchaser
700,000
shares of Series A Preferred Stock for a total purchase
F- 32
UNIVERSAL TECHNICAL INSTITUTE, INC. AND SUBSIDIARIES
NOTES TO CONSOLIDATED FINANCIAL STATEMENTS
($’s in thousands, except per share amounts)
price of
$70.0 million
. The proceeds from the offering are intended to be used to fund strategic long-term growth initiatives, including the expansion to new markets of campuses on a scale similar to our Long Beach, California, Bloomfield, New Jersey and Dallas/Ft. Worth, Texas campuses and the creation of new programs in existing markets with under-utilized campus facilities. Additionally, we may use the proceeds to fund strategic acquisitions that complement our core business. The Series A Preferred Stock is perpetual, and therefore does not have a maturity date. In conjunction with this purchase, we incurred
$1.2 million
in stock issuance costs, which were recorded as a reduction of the additional paid-in capital associated with the Series A Preferred Stock.
The description below provides a summary of certain material terms of the Series A Preferred Stock pursuant to the Purchase Agreement and set forth in the Certificate of Designations (Certificate) of the Series A Preferred Stock:
Rank
The Series A Preferred Stock will, with respect to dividend rights and rights upon liquidation, winding up or dissolution, rank senior to our common stock and each other junior class or series of shares that we may issue in the future. The Series A Preferred Stock will also rank junior to any future indebtedness.
Dividends
We may pay a cash dividend on each share of the Series A Preferred Stock at a rate of
7.5%
per year on the liquidation preference then in effect (Cash Dividend). Such dividend shall be paid before any dividends would be declared or paid to common stockholders or other junior stockholders.
If we do not pay a Cash Dividend, the liquidation preference shall be increased to an amount equal to the current liquidation preference in effect plus an amount reflecting that liquidation preference multiplied by the Cash Dividend rate then in effect plus 2.0% per year (Accrued Dividend).
Cash Dividends are payable semi-annually in arrears on September 30 and March 31 of each year, and will begin to accrue on the first day of the applicable dividend period. We paid Cash Dividends of
$5.3 million
during the years ended September 30,
2018
and September 30, 2017.
The Series A Preferred Stock includes participation rights such that, in the event that we pay a dividend or make a distribution on the outstanding common stock, we shall also pay to each holder of the Series A Preferred Stock a dividend on an as converted basis.
If we are required to or elect to obtain stockholder and regulatory approval and if such approval is not obtained within the time periods set forth in the Certificate, the dividend rates with respect to the Cash Dividend and Accrued Dividend will be increased by 5.0% per year, not to exceed a maximum of 14.5% per year, subject to downward adjustment on obtaining the foregoing approvals.
Liquidation Preference
In the event of voluntary or involuntary liquidation, dissolution or winding up of our company, holders of the Series A Preferred Stock are entitled to receive, before any distribution or payment to the holders of any common or junior stock, an amount per share of Series A Preferred Stock equal to the liquidation preference then in effect, which would include any Accrued Dividends. Alternatively, the holder may choose to receive the amount that would be payable per share of common stock issued upon conversion of the Series A Preferred Stock immediately prior to such liquidation event.
Mergers (regardless of whether we remain the surviving entity), sale of substantially all of our assets or any other recapitalization, reclassification or other transaction in which substantially all of our common stock is exchanged or converted into cash or other property are considered Deemed Liquidation Events. The agreement
F- 33
UNIVERSAL TECHNICAL INSTITUTE, INC. AND SUBSIDIARIES
NOTES TO CONSOLIDATED FINANCIAL STATEMENTS
($’s in thousands, except per share amounts)
provides that, in the case of a Deemed Liquidation Event, each holder of Series A Preferred Stock shall be entitled to receive the liquidation amount they would receive under a normal liquidation event; however, the liquidation amount must be in the same form of consideration as is payable to the holders of our common stock.
Voting
Holders of shares of Series A Preferred Stock will be entitled to vote with the holders of shares of common stock on an as-converted basis. The holders of the Series A Preferred Stock may vote only to an extent not to exceed
4.99%
of the aggregate voting power of all of our voting stock outstanding at the close of business on the issue date (Investor Voting Cap), until such time that we seek regulatory approval to remove this cap. Additionally, a majority of the voting power of the Series A Preferred Stock must approve certain significant actions, including, among others, the issuance of certain equity securities; the repurchase, redemption or acquisition of our common stock; the incurrence of debt; the payment of dividends or distributions to any junior stock prior to December 31, 2017; the consummation of certain acquisitions, mergers or other such transactions; and the sale of material assets.
Coliseum Capital Management, LLC, an affiliate of the Purchaser, and its affiliates also beneficially own 3,643,199 shares of our common stock, as reported in a form 13D/A filed with the SEC on June 28, 2016; this represents approximately 14.6% of our outstanding common stock. There is no voting limitation on this common stock.
Conversion
Conversion Rate and Conversion Price
The conversion rate for the Series A Preferred Stock will be calculated by dividing the current liquidation preference by the conversion price then in effect. The initial conversion price for the Series A Preferred Stock is
$3.33
per share. The conversion price is subject to adjustment upon the occurrence of certain common stock events, as defined in the Purchase Agreement, including stock splits, reverse stock splits or the issuance of common stock dividends.
Optional Conversion by Purchaser
Shares of Series A Preferred Stock are convertible to common stock at any time at the option of the holder. The Series A Preferred Stock may be converted only to the extent that the number of shares of common stock issued upon conversion does not exceed
4.99%
of the total share of common stock outstanding on the issue date (Conversion Cap). The Conversion Cap was calculated to be
1,225,227
shares on the issue date of June 24, 2016, and may be removed upon regulatory approval.
Optional Conversion by Our Company
If at any time following the third anniversary of the issuance of the Series A Preferred Stock, the volume weighted average price of our common stock equals or exceeds 2.5 times the conversion price of the Series A Preferred Stock for a period of 20 consecutive trading days (Conversion Trigger), we may, at our option and subject to obtaining any required stockholder and regulatory approvals, require that any or all of the then outstanding shares of Series A Preferred Stock be automatically converted into our common stock at the conversion rate. We may not elect such conversion during the closed trading window periods in which any director or executive officer of our company is prohibited by us to, directly or indirectly, purchase, sell or otherwise acquire or transfer any equity security of our company. If we are unable to obtain the necessary regulatory approvals to remove the Conversion Cap within 120 days of giving our notice of intent to convert, we will have the option to redeem all shares of the Series A Preferred Stock at a premium.
F- 34
UNIVERSAL TECHNICAL INSTITUTE, INC. AND SUBSIDIARIES
NOTES TO CONSOLIDATED FINANCIAL STATEMENTS
($’s in thousands, except per share amounts)
Optional Special Dividend and Conversion on Certain Change of Control
Upon a change of control, at the written election by holders of a majority of the then outstanding shares of Series A Preferred Stock, we shall declare and pay a special cash dividend in the amount equal to either 1.5 or 2.0 times the Cash Dividend rate, depending on the type of change in control, multiplied by the liquidation preference per share then in effect.
Redemption at the Option of Our Company
We have the ability to redeem the Series A Preferred Stock at any time after the third anniversary of the issue date, provided that the Conversion Trigger has not been met on the date of the redemption notice. Holders of the Series A Preferred Stock will be able to convert their shares into common stock if neither the Investor Voting Cap nor Conversion Cap is in effect. If they do not provide notice of conversion within 10 days of receipt of the redemption notice, the redemption will proceed at a price per share equal to the product of the current conversion rate and 2.5 times the conversion price. If either the Investor Voting Cap or Conversion Cap is in effect at the date of the notice of redemption, the holder may request that we obtain the necessary regulatory approval for its removal.
After the tenth anniversary of the issue date, we have the ability to redeem the Series A Preferred Stock in whole or in part at any time. Holders of the Series A Preferred Stock will then be able to convert their shares into common stock if neither the Investor Voting Cap nor Conversion Cap is in effect. If they do not provide notice of conversion within 10 days of receipt of the redemption notice, the redemption will proceed at a price per share equal to the current liquidation preference. If either the Investor Voting Cap or Conversion Cap is in effect at the date of the notice of redemption, the holder may request that we obtain the necessary regulatory approval for its removal.
Anti-dilution
The conversion price of the Series A Preferred Stock is subject to certain customary anti-dilution protections should we effect certain common stock events, such as stock splits, stock dividends or subdivisions, reclassifications or combinations of our common stock. In such events, the conversion price will be adjusted in a proportionate manner to the change in outstanding share of common stock immediately preceding and immediately after the event.
Reservation of Shares Issuable upon Conversion
We are required, at all times, to reserve and keep available out of our authorized and unissued shares of common stock the number of shares that would be issuable upon conversion of all Series A Preferred Stock, assuming that the Conversion Cap does not apply. If this reserve is not sufficient at any point to allow for full conversion, we shall be required to take action to increase our pool of authorized but unissued shares.
Under the Securities Act, we were not required to register the offer or sale of the Series A Preferred Stock to the Purchaser. In conjunction with the Purchase Agreement, the parties entered into a Registration Rights Agreement in order to grant the Purchaser certain demand and piggyback registration rights covering the purchased shares. In the event that the Purchaser requests such registration of the Series A Preferred Stock, the Registration Rights agreement provides that we shall bear all expenses associated with the registration, with the exception of underwriting discounts and commissions and brokerage fees.
F- 35
UNIVERSAL TECHNICAL INSTITUTE, INC. AND SUBSIDIARIES
NOTES TO CONSOLIDATED FINANCIAL STATEMENTS
($’s in thousands, except per share amounts)
Share Repurchase Program
On December 20, 2011, our Board of Directors authorized the repurchase of up to
$25.0 million
of our common stock in the open market or through privately negotiated transactions. The timing and actual number of shares purchased will depend on a variety of factors such as price, corporate and regulatory requirements and prevailing market conditions. We may terminate or limit the share repurchase program at any time without prior notice. During the
year ended September 30, 2018
, we did not repurchase shares. As of
September 30, 2018
, we have repurchased
1,677,570
shares at an average price per share of
$9.09
and a total cost of approximately
$15.3 million
under this program. Under the terms of the Purchase Agreement, stock purchases under this program require the approval of a majority of the voting power of the Series A Preferred Stock.
Stock Option and Incentive Compensation Plans
We have
two
stock-based compensation plans; the Management 2002 Stock Option Program (2002 Plan) and the 2003 Incentive Compensation Plan (2003 Plan).
The 2002 Plan was approved by our Board of Directors on April 1, 2002 and provided for the issuance of options to purchase
0.7 million
shares of our common stock. On February 25, 2003, our Board of Directors authorized an additional
0.1 million
options to purchase our common stock under the 2002 Plan.
Options issued under the 2002 Plan vest ratably each year over a
four
-year period. The expiration date of options granted under the 2002 Plan is the earlier of the
ten
-year anniversary of the grant date; the
one
-year anniversary of the termination of the participant’s employment by reason of death or disability;
30 days
after the date of the participant’s termination of employment if caused by reasons other than death, disability, cause, material breach or unsatisfactory performance or on the termination date if termination occurs for reasons of cause, material breach or unsatisfactory performance. We do not intend to grant any additional options under the 2002 Plan.
The 2003 Plan was approved by our Board of Directors and adopted effective December 22, 2003 upon consummation of our initial public offering and amended on February 28, 2007 and February 22, 2012 by our stockholders. The 2003 Plan, as amended, authorizes the issuance of various common stock awards, including stock options, restricted stock and stock units, for approximately
5.3 million
shares of our common stock.
As of
September 30, 2018
,
2.7 million
shares of common stock were reserved for issuance under the 2003 Plan, of which
1.9 million
shares are available for future grant.
Effective October 1, 2016, we adopted the March 2016 guidance issued by the FASB and account for forfeitures as they occur.
The following table summarizes the operating expense line and the impact on net loss in the consolidated statements of loss in which stock-based compensation expense has been recorded:
|
|
Year Ended September 30,
|
|||||||||||
|
2018
|
2017
|
2016
|
||||||||||
|
Educational services and facilities
|
$
|
—
|
|
$
|
166
|
|
$
|
280
|
|
|||
|
Selling, general and administrative
|
1,864
|
|
2,829
|
|
4,624
|
|
||||||
|
Total stock-based compensation expense
|
$
|
1,864
|
|
$
|
2,995
|
|
$
|
4,904
|
|
|||
|
Income tax benefit
|
$
|
466
|
|
$
|
1,144
|
|
$
|
1,873
|
|
|||
F- 36
UNIVERSAL TECHNICAL INSTITUTE, INC. AND SUBSIDIARIES
NOTES TO CONSOLIDATED FINANCIAL STATEMENTS
($’s in thousands, except per share amounts)
Restricted Stock Awards
Our restricted stock awards are issued at fair market value, which is based on the closing prices of our stock on the grant date, discounted for non-participation in anticipated dividends during the vesting period. The restrictions on these awards generally lapse ratably over a
four
or
five
year period based on the terms of the individual grant. The restrictions associated with our restricted stock awarded under the 2003 Plan will lapse upon the death, disability, or if, within
one year
following a change of control, employment is terminated without cause or for good reason. If employment is terminated for any other reason, all shares of restricted stock shall be forfeited upon termination.
The following table summarizes restricted stock activity under the 2003 Plan:
|
Number of Shares
(In thousands)
|
Weighted Average
Grant Date
Fair Value
per Share
|
||||||
|
Nonvested restricted stock outstanding as of September 30, 2017
|
4
|
|
$
|
10.84
|
|
||
|
Restricted stock vested
|
(4
|
)
|
$
|
10.84
|
|
||
|
Nonvested restricted stock outstanding as of September 30, 2018
|
—
|
|
$
|
—
|
|
||
As of September 30,
2018
, there was no unrecognized stock compensation expense related to restricted stock awards.
There were no restricted stock awards granted during the years ended September 30,
2018
,
2017
or
2016
.
Restricted Stock Units
Our restricted stock units are issued at fair market value, which is based on the closing prices of our stock on the grant date, discounted for non-participation in anticipated dividends during the vesting period. The restrictions on these units generally lapse ratably over a
four
or
five
year period based on the terms of the individual grant. The restrictions associated with our restricted stock units awarded under the 2003 Plan will lapse upon the death, disability, or if, within
one year
following a change of control, employment is terminated without cause or for good reason. If employment is terminated for any other reason, all shares of restricted stock shall be forfeited upon termination. The awards to our Chief Executive Officer and President were made pursuant to updated forms of award agreements that implement certain retirement vesting provisions of such executive's April 2014 employment agreement. The updated award agreement includes a provision for continued vesting for 12 months after a qualifying retirement, as defined by the executive's employment agreement and subject to compliance with certain covenants.
F- 37
UNIVERSAL TECHNICAL INSTITUTE, INC. AND SUBSIDIARIES
NOTES TO CONSOLIDATED FINANCIAL STATEMENTS
($’s in thousands, except per share amounts)
The following table summarizes restricted stock unit activity under the 2003 Plan:
|
Number of Shares
(In thousands) |
Weighted Average
Grant Date Fair Value per Share |
||||||
|
Nonvested restricted stock units outstanding as of September 30, 2017
|
523
|
|
$
|
3.71
|
|
||
|
Restricted stock units awarded
|
350
|
|
$
|
2.90
|
|
||
|
Restricted stock units vested
|
(206
|
)
|
$
|
4.51
|
|
||
|
Restricted stock units forfeited
|
(95
|
)
|
$
|
3.55
|
|
||
|
Nonvested restricted stock units outstanding as of September 30, 2018
|
572
|
|
$
|
2.95
|
|
||
As of September 30,
2018
, unrecognized stock compensation expense related to restricted stock awards was
$1.1 million
which is expected to be recognized over a weighted average period of
1.4 years
.
The following table summarizes the weighted average fair values of the restricted stock units granted:
|
|
Year Ended September 30,
|
|||||||||||
|
2018
|
2017
|
2016
|
||||||||||
|
Weighted average grant date fair value per share
|
$
|
2.90
|
|
$
|
3.41
|
|
$
|
2.30
|
|
|||
The assumed quarterly dividend rate was
$0.00
per share for restricted stock units granted during the years ended September 30,
2018
, 2017 and 2016 due to the elimination of the quarterly cash dividend by our Board of Directors on June 9, 2016.
Performance Units
The performance condition for performance units is compounded annual total shareholder return (TSR) for the measurement periods included in the grant. On the settlement date for each measurement period, participants will receive shares of our common stock equal to 0% to 150% of the performance units originally granted depending on the total stockholder return for that measurement period. The performance units vest subject to a market condition and on the settlement date which is expected to be no later than two and a half months after the end of each measurement period.
We estimate the fair value of performance units using a Monte Carlo simulation which requires assumptions for expected volatility, risk-free rates of return, and dividend yields. Expected volatilities are derived using a method that calculates historical volatility over a period equal to the length of the measurement period for UTI. We use a risk-free rate of return that is equal to the yield of a zero-coupon U.S. Treasury bill that is commensurate with each measurement period, and we assume that any dividends paid were reinvested.
To receive the performance units awarded for a measurement period, participants are required to be employed by us on the settlement date unless one of the following conditions is met. Upon death or disability of a participant, the participant will receive a pro-rated number of performance units reflecting actual performance through the vesting date and the number of months of the performance period during which the participant was employed. If an employee is terminated without cause or leaves for good reason within one year following certain changes in control, a determination of whether, and to what extent the performance condition has been achieved will be based on actual performance against the stated criteria through the separation date. If an employee is terminated without cause or leaves for good reason after the one-year anniversary of certain changes in control, the participant will
F- 38
UNIVERSAL TECHNICAL INSTITUTE, INC. AND SUBSIDIARIES
NOTES TO CONSOLIDATED FINANCIAL STATEMENTS
($’s in thousands, except per share amounts)
receive a pro-rated number of performance units reflecting actual performance through the separation date and the number of complete twelve-month periods of the performance period during which the participant was employed. If employment is terminated for any other reason, all unvested performance units shall be forfeited upon termination. The award to our President and Chief Executive Officer was made pursuant to updated forms of award agreements that implement certain retirement vesting provisions of such executive's April 2014 employment agreement. The updated award agreement includes a provision for continued vesting for 12 months after a qualifying retirement, as defined by the executive's employment agreement and subject to compliance with certain covenants.
The September 2017 grant includes a measurement period of 24 months. The performance units do not have voting rights or rights to dividends. Compensation expense for the performance units is recognized over the requisite period. All compensation expense for the grant will be recognized for participants who fulfill the requisite service period, regardless of whether the performance condition for issuing shares is satisfied.
The following table summarizes performance unit activity under the 2003 Plan:
|
Number of Shares
(In thousands) |
Weighted Average
Grant Date Fair Value per Share |
||||||
|
Nonvested performance units outstanding as of September 30, 2017
|
132
|
|
$
|
3.11
|
|
||
|
Performance units awarded
|
182
|
|
$
|
2.40
|
|
||
|
Performance units forfeited
|
(36
|
)
|
$
|
2.74
|
|
||
|
Nonvested performance units outstanding as of September 30, 2018
|
278
|
|
$
|
2.69
|
|
||
As of September 30, 2018, unrecognized stock compensation expense related to performance units was
$0.3 million
, which is expected to be recognized over a weighted average period of
1.6 years
.
15. Earnings per Share
Basic net income (loss) per share has historically been calculated by dividing net income (loss) attributable to common stock by the weighted average number of common shares outstanding for the period. Our Series A Preferred Stock is considered a participating security because, in the event that we pay a dividend or make a distribution on the outstanding common stock, we shall also pay each holder of the Series A Preferred Stock a dividend on an as-converted basis. As such, for periods subsequent to the issuance of the Series A Preferred Stock, we calculated basic earnings per share pursuant to the two-class method. The two-class method is an earnings allocation formula that determines earnings per share for common stock and participating securities according to dividend and participation rights in undistributed earnings.
Under this method, all earnings, distributed and undistributed, are allocated to common shares and participating securities based on their respective rights to receive dividends.
The Series A Preferred Stock is not included in the computation of basic earnings (loss) per share in periods in which we have a net loss, as the Series A Preferred Stock is not contractually obligated to share in our net losses.
The two-class method was not applicable for the years ended September 30,
2018
,
2017
and 2016.
Diluted earnings (loss) per share is
calculated using the more dilutive of the as-converted or the two-class method. The two-class method assumes conversion of all potential shares other than the participating securities.
Dilutive potential common shares include outstanding stock options, unvested restricted share awards and units and convertible preferred stock. For the years ended September 30,
2018
,
2017
and
2016
, diluted loss per share equaled basic loss per share as the assumed activity related to outstanding stock-based grants would have an anti-dilutive effect.
F- 39
UNIVERSAL TECHNICAL INSTITUTE, INC. AND SUBSIDIARIES
NOTES TO CONSOLIDATED FINANCIAL STATEMENTS
($’s in thousands, except per share amounts)
The following table summarizes the computation of basic and diluted earnings (loss) per share under the as-converted method:
|
|
Year Ended September 30,
|
|||||||||||
|
|
2018
|
2017
|
2016
|
|||||||||
|
(In thousands)
|
||||||||||||
|
Loss available for distribution
|
$
|
(37,932
|
)
|
$
|
(13,378
|
)
|
$
|
(49,120
|
)
|
|||
|
Weighted average number of shares
|
||||||||||||
|
Basic shares outstanding
|
25,115
|
|
24,712
|
|
24,313
|
|
||||||
|
Dilutive effect related to employee stock plans
|
—
|
|
—
|
|
—
|
|
||||||
|
Diluted shares outstanding
|
25,115
|
|
24,712
|
|
24,313
|
|
||||||
|
Net loss per share - basic
|
$
|
(1.51
|
)
|
$
|
(0.54
|
)
|
$
|
(2.02
|
)
|
|||
|
Net loss per share - diluted
|
$
|
(1.51
|
)
|
$
|
(0.54
|
)
|
$
|
(2.02
|
)
|
|||
The following table summarizes the potential weighted average shares of common stock that were excluded from the determination of our diluted shares outstanding as they were anti-dilutive:
|
Year Ended September 30,
|
|||||||||
|
2018
|
2017
|
2016
|
|||||||
|
(In thousands)
|
|||||||||
|
Outstanding stock-based grants
|
334
|
|
689
|
|
816
|
|
|||
|
Convertible preferred stock
|
21,021
|
|
21,021
|
|
5,629
|
|
|||
|
21,355
|
|
21,710
|
|
6,445
|
|
||||
16.
Defined Contribution Employee Benefit Plan
We sponsor a defined contribution 401(k) plan, under which our employees elect to withhold specified amounts from their wages to contribute to the plan and we have a fiduciary responsibility with respect to the plan. The plan provides for matching a portion of employees’ contributions at management’s discretion. All contributions and matches by us are invested at the direction of the employee in one or more mutual funds or cash. We made matching contributions of approximately
$1.0 million
,
$0.9 million
and
$0.7 million
for the years ended September 30,
2018
,
2017
and
2016
, respectively.
F- 40
UNIVERSAL TECHNICAL INSTITUTE, INC. AND SUBSIDIARIES
NOTES TO CONSOLIDATED FINANCIAL STATEMENTS
($’s in thousands, except per share amounts)
17. Segment Information
Our principal business is providing postsecondary education. We also provide manufacturer-specific training and these operations are managed separately from our campus operations. These operations do not currently meet the quantitative criteria for segments and therefore are reflected in the Other category. Our equity method investments and other non-Postsecondary Education operations are also included within the Other category. Corporate expenses are allocated to Postsecondary education and the Other category based on compensation expense. Depreciation and amortization includes amortization of assets subject to financing obligation.
Summary information by reportable segment is as follows:
|
Year Ended September 30,
|
||||||||||||
|
2018
|
2017
|
2016
|
||||||||||
|
Revenues
|
||||||||||||
|
Postsecondary education
|
$
|
300,753
|
|
$
|
308,884
|
|
$
|
334,156
|
|
|||
|
Other
|
16,218
|
|
16,273
|
|
12,990
|
|
||||||
|
Intersegment eliminations
|
(6
|
)
|
(894
|
)
|
—
|
|
||||||
|
Consolidated
|
$
|
316,965
|
|
$
|
324,263
|
|
$
|
347,146
|
|
|||
|
Loss from operations
|
||||||||||||
|
Postsecondary education
|
$
|
(31,707
|
)
|
$
|
(315
|
)
|
$
|
(13,980
|
)
|
|||
|
Other
|
(3,568
|
)
|
(1,509
|
)
|
(4,643
|
)
|
||||||
|
Consolidated
|
$
|
(35,275
|
)
|
$
|
(1,824
|
)
|
$
|
(18,623
|
)
|
|||
|
Depreciation and amortization
(1)
|
||||||||||||
|
Postsecondary education
|
$
|
14,978
|
|
$
|
16,502
|
|
$
|
17,222
|
|
|||
|
Other
|
710
|
|
384
|
|
527
|
|
||||||
|
Consolidated
|
$
|
15,688
|
|
$
|
16,886
|
|
$
|
17,749
|
|
|||
|
Net income (loss)
|
||||||||||||
|
Postsecondary education
|
$
|
(29,713
|
)
|
$
|
(8,422
|
)
|
$
|
(44,467
|
)
|
|||
|
Other
|
(2,969
|
)
|
294
|
|
(3,229
|
)
|
||||||
|
Consolidated
|
$
|
(32,682
|
)
|
$
|
(8,128
|
)
|
$
|
(47,696
|
)
|
|||
|
As of September 30,
|
||||||||||||
|
2018
|
2017
|
2016
|
||||||||||
|
Goodwill
|
||||||||||||
|
Postsecondary education
|
$
|
8,222
|
|
$
|
8,222
|
|
$
|
8,222
|
|
|||
|
Other
|
—
|
|
783
|
|
783
|
|
||||||
|
Consolidated
|
$
|
8,222
|
|
$
|
9,005
|
|
$
|
9,005
|
|
|||
|
Total assets
|
||||||||||||
|
Postsecondary education
|
$
|
275,427
|
|
$
|
266,370
|
|
$
|
289,688
|
|
|||
|
Other
|
6,851
|
|
7,732
|
|
7,471
|
|
||||||
|
Consolidated
|
$
|
282,278
|
|
$
|
274,102
|
|
$
|
297,159
|
|
|||
(1)
Excludes depreciation of training equipment obtained in exchange for services of $
1.4 million
, $
1.3 million
and $
1.3 million
for the years ended September 30,
2018
,
2017
and
2016
, respectively.
F- 41
UNIVERSAL TECHNICAL INSTITUTE, INC. AND SUBSIDIARIES
NOTES TO CONSOLIDATED FINANCIAL STATEMENTS
($’s in thousands, except per share amounts)
18. Government Regulation and Financial Aid
Our institutions are subject to extensive regulation by federal and state governmental agencies and accrediting bodies. In particular, HEA, and the regulations promulgated thereunder by ED, subject the institutions to significant regulatory scrutiny on the basis of numerous standards that schools must satisfy in order to participate in the various federal student financial assistance programs under Title IV of the HEA.
To participate in the Title IV Programs, an institution must be authorized to offer its programs of instruction by relevant state education agencies, be accredited by an accrediting commission recognized by ED and be certified as an eligible institution by ED. ED will certify an institution to participate in the Title IV Programs only after the institution has demonstrated compliance with the HEA and ED’s extensive regulations regarding institutional eligibility. An institution must also demonstrate its compliance to ED on an ongoing basis. The Program Participation Agreement (PPA) document serves as ED’s formal authorization of an institution and its associated additional locations to participate in Title IV Programs for a specified period of time. Universal Technical Institute of Texas was recertified in April 2018 and entered into a new PPA with ED which will expire April 2022.
In December 2016, we were advised by ED that our applications for Title IV program participation recertification with respect to our Universal Technical Institute of Arizona and Universal Technical Institute of Phoenix institutions had been processed. In December 2017, we submitted recertification applications for all of our institutions. We received a fully recertified PPA for Universal Technical Institute of Texas in March 2018. In November 2018, we received a fully recertified PPA for Universal Technical Institute of Arizona and a fully recertified PPA for Universal Technical Institute of Phoenix. Both of the PPA's will expire on March 31, 2022. On July 31, 2018, ED issued the Final Program Review Determination letter for Universal Technical Institute of Arizona, indicating that the program review was satisfactorily closed
.
State Authorization
Each of our institutions must be authorized by the applicable state education agency where the institution is located to operate and offer a postsecondary education program to its students. Our institutions are subject to extensive, ongoing regulation by each of these states. Additionally, our institutions are required to be authorized by the applicable state education agencies of certain other states in which our institutions recruit students. If any one of our campuses were to lose its authorization from the education agency of the state in which the campus is located, that campus would be unable to offer its programs and we could be forced to close that campus. If one of our campuses were to lose its authorization from a state other than the state in which the campus is located, that campus would not be able to recruit students in that state.
Accreditation
Accreditation is a non-governmental process through which an institution voluntarily submits to ongoing qualitative reviews by an organization of peer institutions. Accrediting commissions primarily examine the academic quality of the institution’s instructional programs. A grant of accreditation is generally viewed as confirmation that the institution’s programs meet generally accepted academic standards. Accrediting commissions also review the administrative and financial operations of the institutions they accredit to ensure that each institution has the resources necessary to perform its educational mission, implement continuous improvement processes and support student success.
F- 42
UNIVERSAL TECHNICAL INSTITUTE, INC. AND SUBSIDIARIES
NOTES TO CONSOLIDATED FINANCIAL STATEMENTS
($’s in thousands, except per share amounts)
Accreditation by an ED-recognized commission is required for an institution to be certified to participate in Title IV Programs. In order to be recognized by ED, accrediting commissions must adopt specific standards for their review of educational institutions. All of our institutions are accredited by the Accrediting Commission of Career Schools and Colleges, an accrediting commission recognized by ED.
An accrediting commission may place an institution on reporting status to monitor one or more specified areas of performance in relation to the accreditation standards. An institution placed on reporting status is required to report periodically to the accrediting commission on that institution’s performance in the area or areas specified by the commission.
Regulation of Federal Student Financial Aid Programs
Congress has historically focused on for-profit education institutions, specifically regarding participation in Title IV Programs and U.S. DOD oversight of tuition assistance for military service members attending for-profit colleges. Continued Congressional activity could result in the enactment of more stringent legislation by Congress, further rulemakings affecting participation in Title IV Programs and other governmental actions, increasing regulation of the for-profit sector. Action by Congress may also increase our administrative costs and require us to modify our practices in order for our institutions to comply with Title IV Program requirements. In addition, concerns generated by this Congressional activity may adversely affect enrollment in for-profit educational institutions such as ours.
Political and budgetary concerns significantly affect Title IV Programs. Congress most recently reauthorized the HEA in 2008, is actively working on another HEA reauthorization and is expected to revise and reauthorize the HEA, but it is unlikely that reauthorization will occur in 2018 and uncertain when the process will be completed. Significant factors relating to Title IV Programs that could adversely affect us include the following:
Gainful Employment
On June 16, 2017, ED announced its intent to convene a negotiated rulemaking committee to develop proposed regulations to revise the gainful employment regulations. ED convened meetings from December 2017 through March 2018, but negotiators failed to reach consensus on all key elements of the proposal. ED published a proposed rule on August 14, 2018, on which it accepted public comment through September 13, 2018. The proposed rule would eliminate the existing Gainful Employment regulations. ED stated in the notice of proposed rulemaking that it plans instead, among other things, to publish program-level outcomes data using the existing government website called the College Scorecard, or on a new federal website. ED has indicated the proposed regulations will not be published in final form by November 1, 2018, as would typically be required for them to take effect on July 1, 2019. Regulations published after November 1, 2018 and prior to November 1, 2019 typically would take effect on July 1, 2020.
On June 30, 2017, ED announced the extension of the compliance date for certain gainful employment disclosure requirements from July 1, 2017 to July 1, 2018. ED stated that institutions are still required to comply with other gainful employment disclosure requirements by July 1, 2017. ED has not issued completer lists to schools, which is the first step toward generating the data for calculating a second set of gainful employment rates. Further, ED’s agreement with the Social Security Administration to produce mean or median earnings data has expired and has not been renewed. The earnings data are used to calculate the debt-to-earnings rates. Consequently, we cannot predict when ED will begin the process of calculating and issuing new draft or final gainful employment rates in the future. While we have implemented a mitigation strategy for those programs identified as in the zone, because we cannot calculate the exact impact of such action on a program's debt to earnings rates, we may overestimate the required tuition reduction, which would have a negative impact on our tuition revenues.
F- 43
UNIVERSAL TECHNICAL INSTITUTE, INC. AND SUBSIDIARIES
NOTES TO CONSOLIDATED FINANCIAL STATEMENTS
($’s in thousands, except per share amounts)
Conversely, we may underestimate the required tuition reduction and fail to improve the program's debt to earnings rates.
Borrower Defense to Repayment Regulations
In November 2016, ED published final regulations establishing rules regarding, among other things, the ability of borrowers to obtain discharges of their obligations to repay certain Title IV loans and for ED to initiate a proceeding to collect from the institution the discharged and returned amounts and the extensive list of circumstances that may require institutions to provide letters of credit or other financial protection to ED. These regulations are discussed at “Business - Regulation of Federal Student Financial Aid Programs - Defense to Repayment Regulations” included elsewhere in this Report on Form 10-K. The regulations had a general effective date of July 1, 2017, which was delayed until July 1, 2019 by ED action that was subsequently invalidated by federal court orders as of October 16, 2018. ED published a notice of proposed rulemaking in the Federal Register on July 31, 2018 to amend these regulations, but announced that final regulations would not be published until after November 1, 2018. Accordingly, any final regulations that ED may publish after November 1, 2018 and prior to November 1, 2019 typically would not take effect until July 1, 2020 unless ED is able to establish an earlier date for implementation of the regulations. The proposed regulations would, among other things, modify the current procedures and standards for borrowers to assert through an ED-administered process a defense to the borrowers’ obligation to repay certain Title IV loans based on certain acts or omissions by the institution or a covered party; maintain, but shorten, the list of events that could result in ED deeming the institution to fail ED’s financial responsibility standards and requiring a letter of credit or other form of acceptable financial protection and the acceptance of other conditions or requirements; require the institution to notify ED of an extensive list of financial events including, but not limited to, liabilities incurred from a final judgment in a judicial or administrative determination; address the treatment of operational leases and long-term debt in the calculation of an institution’s composite score under ED’s financial responsibility standards; amend certain regulations related to the discharge of student loans based on the school’s closure or a false claim of high school completion under certain circumstances; generally permit the use of arbitration clauses and class action waivers while requiring certain disclosures to students. We cannot provide any assurances as to the timing, content or ultimate effective date of any such regulations.
90/10 Rule
A for-profit institution loses its eligibility to participate in Title IV Programs if it derives more than 90% of its revenue from Title IV Programs for two consecutive fiscal years as calculated under a cash basis formula mandated by ED. The loss of such eligibility would begin on the first day following the conclusion of the second consecutive year in which the institution exceeded the 90% limit and, as such, any Title IV Program funds already received by the institution and its students during a period of ineligibility would have to be returned to ED or a lender, if applicable. Additionally, if an institution exceeds the 90% level for a single year, ED will place the institution on provisional certification for a period of at least two years, and could impose other restrictions or conditions on the institution's Title IV eligibility. For the year ended September 30,
2018
, approximately
71%
of our revenues, on a cash basis, were derived from funds distributed under Title IV Programs, as calculated under the 90/10 rule.
Federal Student Loan Defaults
To remain eligible to participate in Title IV Programs, institutions must maintain federal student loan cohort default rates below specified levels. An institution whose cohort default rate is 30% or more for three consecutive federal fiscal years (FFYs) or 40% or more for any given FFY loses eligibility to participate in some or all Title IV Programs. This sanction is effective for the remainder of the FFY in which the institution lost its
F- 44
UNIVERSAL TECHNICAL INSTITUTE, INC. AND SUBSIDIARIES
NOTES TO CONSOLIDATED FINANCIAL STATEMENTS
($’s in thousands, except per share amounts)
eligibility and for the two subsequent FFYs. None of our institutions had a three-year FFEL/DL cohort default rate of 30% or greater for 2015, 2014 or 2013, the three most recent FFYs with published rates.
Financial Responsibility Standards
An institution’s financial responsibility is measured by its composite score, which is calculated by ED based on three ratios. ED assigns a strength factor to the results of each of these ratios on a scale from negative 1.0 to positive 3.0, with negative 1.0 reflecting financial weakness and positive 3.0 reflecting financial strength. ED then assigns a weighting percentage to each ratio and adds the weighted scores for the three ratios together to produce a composite score for the institution. The composite score must be at least 1.5 for the institution to be deemed financially responsible without the need for further oversight. In addition to having an acceptable composite score, an institution must, among other things, meet all of its financial obligations including required refunds to students and any Title IV Program liabilities and debts, be current in its debt payments, comply with certain past performance requirements and not receive an adverse, qualified, or disclaimed opinion by its accountants in its audited financial statements. If ED determines that an institution does not satisfy its financial responsibility standards, depending on the resulting composite score and other factors, that institution may establish its financial responsibility on an alternative basis.
If an institution's composite score is below 1.5, but is at least 1.0, the institution is in a category classified by ED as the zone. Under ED regulations, institutions in the zone solely because their composite score is less than 1.5 are still considered to be financially responsible, but require additional oversight by ED in the form of cash monitoring and other participation requirements. Institutions in the zone typically are permitted by ED to continue to participate in the title IV programs under one of two alternatives: 1) the “Zone Alternative” under which an institution is required to make disbursements to students under a payment method other than ED’s standard repayment, typically the Heightened Cash Monitoring 1 (HCM1) payment method; to notify ED within 10 days after the occurrence of certain oversight and financial events and to comply with other operating conditions imposed by ED or 2) submit a letter of credit to ED equal to at least 50 percent of the Title IV funds received by the institutions during the most recent fiscal year. ED permits an institution to participate under the “Zone Alternative” for a period of up to three consecutive fiscal years. Under the “Zone Alternative” notification requirement, the institution must provide timely information to ED regarding any of the following oversight and financial events:
|
•
|
any adverse action, including a probation or similar action, taken against the institution by its accrediting agency, state authority or other federal agency;
|
|
•
|
any event that causes the institution to realize any liability that was noted as a contingent liability in the institution's most recent audited financial statements;
|
|
•
|
any violation by the institution of any loan agreement;
|
|
•
|
any failure of the institution to make a payment in accordance with its debt obligations that results in a creditor filing suit to recover funds under those obligations;
|
|
•
|
any withdrawal of owner's equity/net assets from the institution by any means, including by declaring a dividend;
|
|
•
|
any extraordinary losses as defined in accordance with generally accepted accounting principles; or
|
|
•
|
any filing of a petition by the institution for relief in bankruptcy court.
|
Under the regulations that were scheduled to take effect on July 1, 2017, but then were further delayed until July 1, 2019 by ED action that was subsequently invalidated by federal court orders as of October 16, 2018,
F- 45
UNIVERSAL TECHNICAL INSTITUTE, INC. AND SUBSIDIARIES
NOTES TO CONSOLIDATED FINANCIAL STATEMENTS
($’s in thousands, except per share amounts)
the list of information that an institution must provide timely to ED is as follows: any event that causes the institution, or a related entity, to realize any liability that was noted as a contingent liability in the institution’s or related entity’s most recent audited financial statements or any losses that are unusual in nature and infrequently occur or both as defined in accordance with certain specified accounting standards. The institution also would be required to notify ED of certain other events described in the new Defense to Repayment regulations. ED could impose a letter of credit or other conditions or requirements upon us in response to the reporting of any oversight or financial events.
Under the HCM1 payment method, the institution is required to make Title IV disbursements to eligible students and parents before it requests or receives funds for the amount of those disbursements from ED. As long as the student accounts are credited before the funding requests are initiated, an institution is permitted to draw down funds through ED’s electronic system for grants management and payments for the amount of disbursements made to eligible students. Unlike the Heightened Cash Monitoring 2 (HCM2) or reimbursement payment methods, the HCM1 payment method typically does not require institutions to submit documentation to ED and wait for ED approval before drawing down Title IV funds. ED may place an institution that is in the zone on the HCM2 or reimbursement methods of payment. An institution on the HCM1, HCM2 or reimbursement payment methods must pay any credit balances due to a student or parent before drawing down funds from ED for the amount of disbursements made to the student or parent.
If an institution's composite score is below 1.0, the institution is considered by ED to lack financial responsibility. If ED determines that an institution does not satisfy ED's financial responsibility standards, depending on its composite score and other factors, that institution may establish its financial responsibility on an alternative basis by, among other things:
|
•
|
posting a letter of credit in an amount equal to at least 50% of the total Title IV Program funds received by the institution during its most recently completed fiscal year; or
|
|
•
|
posting a letter of credit in an amount equal to at least 10% of such prior year's Title IV Program funds, accepting provisional certification for a period of no more than three years, complying with additional ED notification and operating requirements and conditions and agreeing to receive Title IV Program funds under an arrangement other than ED's standard advance funding arrangement. Under new regulations that take effect on July 1, 2017, ED may increase this amount to account for ED’s determination of the additional amount of financial protection needed to fully cover any estimated losses.
|
If an institution is unable to establish financial responsibility on an alternative basis, the institution may be subject to financial penalties, restrictions on our operations and loss of external financial aid funding.
ED published final regulations that were scheduled to take effect on July 1, 2017, but then were further delayed until July 1, 2019 by ED action that was subsequently invalidated by federal court orders as of October 16, 2018, that amend the financial responsibility regulations to expand the list of actions or events that require an institution to provide ED with a letter of credit or other form of acceptable financial protection. The regulations also, among other things, may increase the amount of the letter of credit or other form of financial protection that an institution must provide to ED if the institution has a composite score below 1.0, no longer qualifies for the Zone Alternative, or does not comply with other applicable requirements of the financial responsibility regulations. The regulations also would permit ED to recalculate an institution’s composite score to account for its estimate of actual or potential losses resulting from certain events identified in the new Defense to Repayment Regulations. See “Regulation of Federal Student Financial Aid Programs - Defense To Repayment Regulations.”
ED has historically evaluated the financial condition of our institutions on a consolidated basis based on the financial statements of Universal Technical Institute, Inc. as the parent company. ED’s regulations permit ED
F- 46
UNIVERSAL TECHNICAL INSTITUTE, INC. AND SUBSIDIARIES
NOTES TO CONSOLIDATED FINANCIAL STATEMENTS
($’s in thousands, except per share amounts)
to examine the financial statements of Universal Technical Institute, Inc., the financial statements of each institution and the financial statements of any related party. For our 2018 fiscal year, we calculated our composite score to be 1.6. However, the composite score calculations and resulting requirements imposed on our institutions are subject to determination by ED once it receives and reviews our audited financial statements.
Return of Title IV Funds
An institution participating in Title IV Programs must calculate the amount of unearned Title IV Program funds that have been disbursed to students who withdraw from their educational programs before completing them. The institution must return those unearned funds to ED or the appropriate lending institution in a timely manner, which is generally within 45 days from the date the institution determines that the student has withdrawn. If an institution is cited in an audit or program review for returning Title IV Program funds late for 5% or more of the students in the audit or program review sample, the institution must post a letter of credit in favor of ED in an amount equal to 25% of the total Title IV Program funds that should have been returned in the previous fiscal year.
Because we operate in a highly regulated industry, we, like other industry participants, may be subject from time to time to investigations, claims of non-compliance, or lawsuits by governmental agencies or third parties, which allege statutory violations, regulatory infractions, or common law causes of action.
Compliance with Regulatory Standards and Effect of Regulatory Violations
Our institutions are subject to audits and program compliance reviews by various external agencies, including ED, ED’s Office of Inspector General, state education agencies, student loan guaranty agencies, the VA and ACCSC, as well as other federal and state agencies. Each of our institutions’ administration of Title IV Program funds must also be audited annually by independent accountants and the resulting audit report submitted to ED for review. If ED or another regulatory agency determined that one of our institutions improperly disbursed Title IV Program funds or violated a provision of the HEA or ED’s regulations, that institution could be required to repay such funds and could be assessed an administrative fine. ED could also transfer the institution from the advance method of receiving Title IV Program funds to a cash monitoring or reimbursement system, which could negatively impact cash flow at an institution. Significant violations of Title IV Program requirements by us or any of our institutions could be the basis for a proceeding by ED to fine the affected institution or to limit, suspend or terminate the participation of the affected institution in Title IV Programs. Generally, such a termination extends for 18 months before the institution may apply for reinstatement of its participation.
In April 2015, ED completed an ordinary course program review of our administration of the Title IV programs in which we participate for our Avondale, Arizona institution main campus and additional locations of that institution. The site visit covered the 2013-2014 and 2014-2015 award years. An initial program review report dated September 22, 2017 was issued by ED in July 2018. The report contained nine findings that are not material because they are limited to errors identified in individual student records and to requests to update and strengthen certain financial aid-related disclosures and procedures. None of the findings require us to perform any retroactive file reviews of all of our students for any issues for any time period. We provided our response to ED within the stated deadline of 30 days from the date we received the report. ED reviewed our response to the report and issued its final program review determination letter on July 31, 2018. All findings were considered resolved by ED.
Veterans' Benefits Programs
Since October 1, 2011, the Post-9/11 GI Bill has been effective for both degree and non-degree granting institutions of higher learning, allowing eligible veterans to use their Post-9/11 GI Bill benefits. Additionally, veterans use benefits such as the Montgomery GI Bill, the REAP and VA Vocational Rehabilitation at our campuses.
F- 47
UNIVERSAL TECHNICAL INSTITUTE, INC. AND SUBSIDIARIES
NOTES TO CONSOLIDATED FINANCIAL STATEMENTS
($’s in thousands, except per share amounts)
We derived approximately
17%
of our revenues, on a cash basis, from veterans' benefits programs in 2018. To participate in veterans' benefits programs, including the Post-9/11 GI Bill, the Montgomery GI Bill, the REAP, and VA Vocational Rehabilitation, an institution must comply with certain requirements established by the VA. These criteria require, among other things, that the institution:
|
•
|
report on the enrollment status of eligible students;
|
|
•
|
maintain student records and make such records available for inspection;
|
|
•
|
follow current VA rules; and
|
|
•
|
comply with applicable limits on the percentage of students receiving certain veterans benefits on a program or campus basis.
|
The VA shares responsibility for VA benefit approval and oversight with designated State Approving Agencies (SAAs). SAAs play a critical role in evaluating institutions and their programs to determine if they meet VA benefit eligibility requirements. Processes and approval criteria as well as interpretation of applicable requirements can vary from state to state. Therefore, approval in one state does not necessarily result in approval in all states.
During 2012, President Obama signed an Executive Order directing the Departments of Defense, Veterans Affairs and Education to establish “Principles of Excellence” (Principles), based on certain guidelines set forth in the Executive Order, to apply to educational institutions receiving federal funding for service members, veterans and family members. We are required to comply with the Principles to continue recruitment activities on military installations. Additionally, there is a requirement to possess a memorandum of understanding (MOU) with the U.S. DOD as well as with certain individual installations.
19. Quarterly Financial Summary (Unaudited)
|
Year ended September 30, 2018
|
First
Quarter (1) |
Second
Quarter (1) |
Third
Quarter (1) |
Fourth
Quarter (1) |
Fiscal
Year (1) |
|||||||||||||||
|
Revenues
|
$
|
81,156
|
|
$
|
80,663
|
|
$
|
74,890
|
|
$
|
80,256
|
|
$
|
316,965
|
|
|||||
|
Loss from operations
|
$
|
(3,604
|
)
|
$
|
(8,820
|
)
|
$
|
(11,800
|
)
|
$
|
(11,051
|
)
|
$
|
(35,275
|
)
|
|||||
|
Net loss
|
$
|
(1,135
|
)
|
$
|
(8,833
|
)
|
$
|
(11,713
|
)
|
$
|
(11,001
|
)
|
$
|
(32,682
|
)
|
|||||
|
Loss per share:
|
|
|
|
|
|
|||||||||||||||
|
Basic
|
$
|
(0.10
|
)
|
$
|
(0.40
|
)
|
$
|
(0.52
|
)
|
$
|
(0.49
|
)
|
$
|
(1.51
|
)
|
|||||
|
Diluted
|
$
|
(0.10
|
)
|
$
|
(0.40
|
)
|
$
|
(0.52
|
)
|
$
|
(0.49
|
)
|
$
|
(1.51
|
)
|
|||||
|
Year ended September 30, 2017
|
First
Quarter |
Second
Quarter (1) |
Third
Quarter (1) |
Fourth
Quarter (1) |
Fiscal
Year (1) |
|||||||||||||||
|
Revenues
|
$
|
84,179
|
|
$
|
82,497
|
|
$
|
76,258
|
|
$
|
81,329
|
|
$
|
324,263
|
|
|||||
|
Income (loss) from operations
|
$
|
1,387
|
|
$
|
687
|
|
$
|
(2,784
|
)
|
$
|
(1,114
|
)
|
$
|
(1,824
|
)
|
|||||
|
Net loss
|
$
|
(1,724
|
)
|
$
|
(1,730
|
)
|
$
|
(3,917
|
)
|
$
|
(757
|
)
|
$
|
(8,128
|
)
|
|||||
|
Loss per share:
|
|
|
|
|
|
|||||||||||||||
|
Basic
|
$
|
(0.12
|
)
|
$
|
(0.12
|
)
|
$
|
(0.21
|
)
|
$
|
(0.08
|
)
|
$
|
(0.54
|
)
|
|||||
|
Diluted
|
$
|
(0.12
|
)
|
$
|
(0.12
|
)
|
$
|
(0.21
|
)
|
$
|
(0.08
|
)
|
$
|
(0.54
|
)
|
|||||
F- 48
UNIVERSAL TECHNICAL INSTITUTE, INC. AND SUBSIDIARIES
NOTES TO CONSOLIDATED FINANCIAL STATEMENTS
($’s in thousands, except per share amounts)
(1)
During the three months ended March 31, 2016, we recorded a full valuation allowance on our deferred tax assets. We will maintain a valuation allowance on our deferred tax assets until sufficient positive evidence exists to support its reversal. See Note 12 for further discussion.
The summation of quarterly per share information does not equal amounts for the full year as quarterly calculations are performed on a discrete basis. Additionally, securities may have had an anti-dilutive effect during individual quarters but not for the full year.
20. Subsequent Event
Termination of Consulting Agreement
On October 17, 2018, we terminated our agreement with the consultant. The consultant provided services related to a strategic transformation plan. The consulting services covered marketing, admissions, future student processing, retention and cost savings initiatives. The consultant continued to perform its services under the agreement through October 31, 2018. Pursuant to the without cause termination provision in the agreement and our mutual agreement with the consultant, we will pay
$4.00 million
in full satisfaction of all amounts otherwise owed or due to the consultant, resulting in total payments made to the consultant under the agreement of
$8.6 million
. The termination fee payment to the consultant will be recorded and recognized as an expense in UTI’s first fiscal quarter of 2019. We will continue the transformation plan initiatives with UTI personnel.
F- 49
TABLE OF CONTENTS
Part IItem 1. BusinessItem 1A. Risk FactorsItem 1B. Unresolved Staff CommentsItem 2. PropertiesItem 3. Legal ProceedingsItem 4. Mine Safety DisclosuresPart IIItem 5. Market For Registrant S Common Equity, Related Stockholder Matters and Issuer Purchases Of Equity SecuritiesItem 6. Selected Financial DataItem 7. Management S Discussion and Analysis Of Financial Condition and Results Of OperationsItem 7A. Quantitative and Qualitative Disclosures About Market RiskItem 8. Financial Statements and Supplementary DataItem 9. Changes in and Disagreements with Accountants on Accounting and Financial DisclosureItem 9A. Controls and ProceduresItem 9B. Other InformationPart IIIItem 10. Directors, Executive Officers and Corporate GovernanceItem 11. Executive CompensationItem 12. Security Ownership Of Certain Beneficial Owners and Management and Related Stockholder MattersItem 13. Certain Relationships and Related Transactions, and Director IndependenceItem 14. Principal Accountant Fees and ServicesPart IVItem 15. Exhibits and Financial Statement Schedules