UNIVEST FINANCIAL CORP
10-Ks and 10-Qs
|
|
|
|
|
|
|
|
|
|
|
|
|
|
|
|
|
|
|
|
|
|
|
|
|
|
|
|
|
|
|
|
|
|
|
|
|
|
|
|
|
|
|
|
|
|
|
|
|
|
|
|
|
|
|
|
SECURITIES AND EXCHANGE COMMISSION
Washington, D.C. 20549
Form 10-K
ANNUAL REPORT PURSUANT TO SECTION 13 OR 15(d) OF
THE SECURITIES EXCHANGE ACT OF 1934
For the fiscal year ended
December 31, 2018
Commission File number 0-7617
UNIVEST FINANCIAL CORPORATION
(Exact name of registrant as specified in its charter)
|
Pennsylvania
|
23-1886144
|
|
|
(State or other jurisdiction of incorporation or organization)
|
(IRS Employer Identification No.)
|
|
|
14 North Main Street, Souderton, Pennsylvania
|
18964
|
|
|
(Address of principal executive offices)
|
(Zip Code)
|
|
|
Registrant’s telephone number, including area code
|
||
|
(215) 721-2400
|
||
|
Securities registered pursuant to Section 12(b) of the Act:
|
||
|
Title of class
|
Name of each exchange on which registered
|
|
|
Common Stock, $5 par value
|
The NASDAQ Stock Market
|
|
Securities registered pursuant to Section 12(g) of the Act: None
Indicate by check mark if the registrant is a well-known seasoned issuer, as defined in Rule 405 of the Securities Act. Yes
x
No
¨
Indicate by check mark if the registrant is not required to file reports pursuant to Section 13 or Section 15(d) of the Act. Yes
¨
No
x
Indicate by check mark whether the registrant (1) has filed all reports required to be filed by Section 13 or 15(d) of the Securities Exchange Act of 1934 during the preceding twelve months (or for such shorter period that the registrant was required to file such reports), and (2) has been subject to such filing requirements for the past 90 days. Yes
x
No
¨
Indicate by check mark whether the registrant has submitted electronically every Interactive Data File required to be submitted pursuant to Rule 405 of Regulation S-T during the preceding 12 months (or for such shorter period that the registrant was required to submit such files). Yes
x
No
¨
Indicate by check mark if disclosure of delinquent filers pursuant to Item 405 of Regulation S-K is not contained herein, and will not be contained, to the best of the registrant's knowledge, in definitive proxy or information statements incorporated by reference in Part III of this Form 10-K or any amendment to this Form 10-K
¨
Indicate by check mark whether the registrant is a large accelerated filer, an accelerated filer, a non-accelerated filer, a smaller reporting company, or an emerging growth company. See the definitions of “large accelerated filer,” “accelerated filer,” “smaller reporting company,” and "emerging growth company" in Rule 12b-2 of the Exchange Act. (Check one):
|
Large accelerated filer
x
|
Accelerated filer
|
¨
|
|
Non-accelerated filer
¨
|
Smaller reporting company
|
¨
|
|
Emerging growth company
|
¨
|
|
|
If an emerging growth company, indicate by check mark if the registrant has elected not to use the extended transition period for complying with new or revised financial accounting standards provided pursuant to Section 13(a) of the Exchange Act.
|
¨
|
|
Indicate by check mark whether the registrant is a shell company (as defined in Rule 12b-2 of the Exchange Act). Yes
¨
No
x
The approximate aggregate market value of voting stock held by non-affiliates of the registrant is
$790,045,535
as of
June 30, 2018
based on the
June 30, 2018
closing price of the Registrant's Common Stock of $27.50 per share.
Indicate the number of shares outstanding of each of the issuer’s classes of common stock, as of the latest practicable date.
|
Common Stock, $5 par value
|
29,289,730
|
|
|
(Title of Class)
|
(Number of shares outstanding at February 14, 2019)
|
|
DOCUMENTS INCORPORATED BY REFERENCE
Part I and Part III incorporate information by reference from the proxy statement for the annual meeting of shareholders on April 16, 2019.
UNIVEST FINANCIAL CORPORATION AND SUBSIDIARIES
TABLE OF CONTENTS
|
PART I
|
||
|
Item 1.
|
||
|
Item 1A.
|
||
|
Item 1B.
|
||
|
Item 2.
|
||
|
Item 3.
|
||
|
Item 4.
|
||
|
PART II
|
||
|
Item 5.
|
||
|
Item 6.
|
||
|
Item 7.
|
||
|
Item 7A.
|
||
|
Item 8.
|
||
|
Item 9.
|
||
|
Item 9A.
|
||
|
Item 9B.
|
||
|
PART III
|
||
|
Item 10.
|
||
|
Item 11.
|
||
|
Item 12.
|
||
|
Item 13.
|
||
|
Item 14.
|
||
|
PART IV
|
||
|
Item 15.
|
||
|
Item 16.
|
||
|
1
|
PART I
Forward-Looking Statements
The information contained in this report may contain forward-looking statements. When used or incorporated by reference in disclosure documents, the words “believe,” “anticipate,” “estimate,” “expect,” “project,” “target,” “goal” and similar expressions are intended to identify forward-looking statements within the meaning of section 27A of the Securities Act of 1933 and section 21E of the Securities Exchange Act of 1934. Such forward-looking statements are subject to certain risks, uncertainties and assumptions, including but not limited to those set forth below as well as the risk factors described in Item 1A. “Risk Factors”:
|
•
|
Operating, legal and regulatory risks;
|
|
•
|
Economic, political and competitive forces impacting various lines of business;
|
|
•
|
Legislative, regulatory and accounting changes;
|
|
•
|
Demand for our financial products and services in our market area;
|
|
•
|
Volatility in interest rates;
|
|
•
|
The composition and credit quality of our loan and investment portfolios;
|
|
•
|
Our ability to access cost-effective funding;
|
|
•
|
Our ability to continue to implement our business strategies;
|
|
•
|
Our ability to manage market risk, credit risk and operational risk;
|
|
•
|
Timing of revenue and expenditures;
|
|
•
|
Returns on investment decisions;
|
|
•
|
System failures or cyber-security breaches of our information technology infrastructure and those of our third-party service providers;
|
|
•
|
Our ability to retain key employees;
|
|
•
|
Other risks and uncertainties, including those occurring in the U.S. and world financial systems; and
|
|
•
|
The risk that our analysis of these risks and forces could be incorrect and/or that the strategies developed to address them could be unsuccessful.
|
Should one or more of these risks or uncertainties materialize, or should underlying assumptions prove incorrect, actual results may vary materially from those anticipated, estimated, expected or projected. These forward-looking statements speak only as of the date of the report. Univest Financial Corporation (the Corporation) expressly disclaims any obligation to publicly release any updates or revisions to reflect any change in the Corporation’s expectations with regard to any change in events, conditions or circumstances on which any such statement is based.
|
Item 1.
|
Business
|
General
The Corporation is a Pennsylvania corporation, organized in 1973 and registered as a bank holding company pursuant to the Bank Holding Company Act of 1956. Effective January 1, 2019, the name of the Corporation was changed from Univest Corporation of Pennsylvania to Univest Financial Corporation. The Corporation owns all of the capital stock of Univest Bank and Trust Co. (the Bank). The consolidated financial statements include the accounts of the Corporation and its wholly owned subsidiary, the Bank. The Corporation’s and the Bank’s legal headquarters are located at 14 North Main Street, Souderton, PA 18964. At
December 31, 2018
, the Corporation had total assets of
$5.0 billion
, net loans and leases of
$4.0 billion
, total deposits of
$3.9 billion
and total shareholders’ equity of
$624.1 million
.
The Bank is a Pennsylvania state-chartered bank and trust company. As a state-chartered member bank of the Federal Reserve System, the Bank is regulated primarily by the Pennsylvania Department of Banking and Securities and the Federal Reserve Bank of Philadelphia.
The Bank is engaged in domestic banking services for individuals, businesses, municipalities and non-profit organizations. Through its wholly-owned subsidiaries, the Bank provides a variety of financial services throughout its markets of operation. Effective January 1, 2019, the Bank's wealth management segment was re-branded under the Girard name with associated name changes of several subsidiaries while continuing to provide fiduciary services, investment management, and financial and retirement planning. The Bank is the parent company of Girard Investment Services, LLC (formerly Univest Investments, Inc.), a full-service registered broker-dealer and a licensed insurance agency, Girard Advisory Services, LLC (formerly Girard Partners Ltd.), a registered investment advisory firm, Girard Pension Services, LLC (formerly TCG Investment Advisory, Inc.), a registered investment advisor,
|
2
|
which provides investment consulting and management services to municipal entities. Girard Investments has two offices in Pennsylvania. Girard Advisory Services is headquartered in King of Prussia, Pennsylvania with a satellite office in Florida. The Bank is also the parent company of Univest Insurance, LLC, an independent insurance agency and Univest Capital, Inc., an equipment financing business. Univest Insurance has three offices in Pennsylvania and one in Maryland. The Bank's former subsidiary, Delview, Inc. was dissolved effective January 1, 2019.
At
December 31, 2018
, the Corporation has three reportable business segments: Banking, Wealth Management and Insurance. The Corporation determines its segments based primarily upon product and service offerings, through the types of income generated and the regulatory environment. This is strategically how the Corporation operates and has positioned itself in the marketplace. Accordingly, significant operating decisions are based upon analysis of each of these segments. For more detailed discussion and financial information on the business segments, see Note 22, “Segment Reporting” included in the Notes to the Consolidated Financial Statements included herein under Item 8.
Employees
At
December 31, 2018
, the Corporation and its subsidiaries employed approximately 841 individuals. None of these employees are covered by collective bargaining agreements, and the Corporation believes it enjoys good relations with its personnel.
Market Area
The Corporation is headquartered in Souderton, Pennsylvania, which is located in Southeastern Pennsylvania, approximately thirty-five miles north of Philadelphia. The Corporation provides banking and financial services to customers primarily in Bucks, Berks, Chester, Delaware, Lancaster, Lehigh, Montgomery, Northampton and Philadelphia counties in Pennsylvania and Atlantic and Cape May counties in New Jersey. The highest concentration of our deposits and loans are in Montgomery and Bucks counties where twenty-four out of our thirty-nine financial centers are located. The acquisition of Fox Chase Bancorp (Fox Chase) on July 1, 2016 expanded the Corporation's presence in Montgomery, Bucks, Philadelphia, and Chester counties in Pennsylvania and into Cape May County in New Jersey. During 2017, the Corporation opened a financial center in Northampton County and three financial centers in Lancaster County, Pennsylvania. During 2018, the Corporation opened an additional financial center in Lancaster County, Pennsylvania.
Montgomery and Bucks counties are two of the wealthiest counties in Pennsylvania. Significant types of employment industries include pharmaceuticals, health care, electronics, computer services, insurance, industrial machinery, retail, schools and universities and meat processing. Major companies throughout the two counties include Merck and Company, Abington Hospital-Jefferson Health, SmithKline Beecham, Hatfield Quality Meats, St. Mary Medical Center, Giant Food Stores LLC, Doylestown Hospital, Grand View Health, Central Bucks School District, Pennsbury School District and Northtec LLC. Unemployment rates at December 2018 were 3.1% in Montgomery County and 3.4% in Bucks County, lower than Pennsylvania’s state unemployment rate of 4.0% and the federal unemployment rate of 3.7%, according to the Bureau of Labor Statistics.
The Corporation ranks fifth in deposit market share in Montgomery County with thirteen financial centers and sixth in Bucks County with eleven financial centers, with 6.4% of total combined deposit market share in the two counties according to data provided by SNL Financial. Montgomery County’s population has grown 4% to 832,000 from the year 2010 to 2019, and is expected to grow another 1.9% through 2024, while Bucks County’s population has increased 0.7% to 630,000 during the same period, and is expected to grow 0.7% through 2024, according to SNL Financial. The median age is 41 years and 44 years in Montgomery and Bucks counties, respectively, consistent with the median age of 41 years in Pennsylvania and slightly higher than the median age in the United States of 38 years. County estimates project the median age to increase over the next two decades. The median yearly household income was $91,000 for Montgomery County and $87,000 for Bucks County during 2018 and is expected to increase 7% for Montgomery County and 7% for Bucks County through 2024, according to SNL Financial. The yearly median income for both counties is well above that of the Commonwealth of Pennsylvania of $62,000 and the United States at $63,000 during 2018.
Competition
The Corporation’s service areas are characterized by intense competition for banking business among commercial banks, savings institutions and other financial institutions. In competing with other banks, savings institutions and other financial institutions, the Bank seeks to provide personalized services and local decision making through management’s knowledge and awareness of its service area, customers and borrowers.
Other competitors, including credit unions, consumer finance companies, insurance companies, wealth management providers, leasing companies, financial technology companies and mutual funds, compete with certain lending and deposit gathering services
|
3
|
and insurance and wealth management services offered by the Bank and its operating segments.
Supervision and Regulation
The financial services industry in the United States, particularly entities that are chartered as banks, is highly regulated by federal and state laws that limit the types of businesses in which banks and their holding companies may engage, and which impose significant operating requirements and limitations on banking entities. The discussion below is only a brief summary of some of the significant laws and regulations that affect the Bank and the Corporation, and is not intended to be a complete description of all such laws.
The Bank is subject to supervision and is regularly examined by the Pennsylvania Department of Banking and Securities and the Federal Reserve Bank of Philadelphia. The Bank is also subject to examination by the Federal Deposit Insurance Corporation (FDIC).
The Corporation is a registered bank holding company, subject to the provisions of the Bank Holding Company Act of 1956, as amended. The Corporation is subject to the reporting requirements of the Board of Governors of the Federal Reserve System (the Board); and the Corporation, together with its subsidiaries, is subject to examination by the Board. The Federal Reserve Act limits the amount of credit that a member bank may extend to its affiliates, and the amount of its funds that it may invest in or lend on the collateral of the securities of its affiliates. Under the Federal Deposit Insurance Act, insured banks are subject to the same limitations.
The Corporation is subject to the Sarbanes-Oxley Act of 2002 (SOX). SOX adopted new standards of corporate governance and imposed additional requirements on the board of directors and management of public companies. SOX also requires that the chief executive officer and chief financial officer certify the accuracy of periodic reports filed with the Securities and Exchange Commission (SEC). Pursuant to Section 404 of SOX (SOX 404), management of the Corporation is required to furnish a report on internal control over financial reporting, identify any material weaknesses in its internal control over financial reporting and assert that such internal controls are effective. The Corporation has continued to be in compliance with SOX 404 during 2018. The Corporation must maintain effective internal controls, which requires an on-going commitment by management and oversight by the Corporation’s Audit Committee. The process has and will continue to require substantial resources in both financial costs and human capital.
Dodd-Frank Wall Street Reform and Consumer Protection Act of 2010 (Dodd-Frank Act).
The Dodd-Frank Act was signed into law on July 21, 2010. The Dodd-Frank Act made extensive changes in the regulation of financial institutions and their holding companies such as:
|
•
|
Centralized responsibility for consumer financial protection by the creation of a new agency, the Consumer Financial Protection Bureau, that has rulemaking authority for a wide range of consumer protection laws that apply to all banks and has broad powers to supervise and enforce consumer protection laws;
|
|
•
|
Increased the FDIC assessment for depository institutions with assets of $10 billion or more, changed the basis for determining FDIC premiums from insured deposits to consolidated assets less tangible capital and increased the minimum reserve ratio for the deposit insurance fund to 1.35% by September 30, 2020. On September 30, 2018, the deposit insurance fund reserve ratio reached 1.36%, exceeding the statutorily required minimum reserve ratio of 1.35%, ahead of the target date of September 30, 2020. The FDIC will not be lowering rates until a target ratio of 2.0% is reached. The FDIC will be giving small banks credits for their portion of assessments that contributed to the growth in the reserve ratio between 1.15% and 1.35%.
|
|
•
|
Permanently increased the federal deposit insurance coverage to $250 thousand and increased the Securities Investor Protection Corporation protection from $100 thousand to $250 thousand;
|
|
•
|
Provided for new disclosures and other requirements relating to executive compensation, proxy access by shareholders and corporate governance;
|
|
•
|
Provided for mortgage reform provisions regarding a customer’s ability to repay, restricting variable-rate lending by requiring the ability to repay be determined for variable-rate loans by using the maximum rate that will apply during the first five years of a variable-rate loan term, and making more loans subject to provisions for higher cost loans, new disclosures, and certain other revisions; and
|
|
4
|
|
•
|
Created a financial stability oversight council responsible for recommending to the Federal Reserve increasingly strict rules for capital, leverage, liquidity, risk management and other requirements as companies grow in size and complexity.
|
Basel III
In July 2013, the federal bank regulatory agencies adopted final rules revising the agencies’ capital adequacy guidelines and prompt corrective action rules, designed to enhance such requirements and implement the revised standards of the Basel Committee on Banking Supervision, commonly referred to as Basel III. Basel III generally implements higher minimum capital requirements, adds a common equity Tier 1 capital requirement, and establishes criteria that instruments must meet to be considered common equity Tier 1 capital, additional Tier 1 capital or Tier 2 capital. The minimum capital to risk-adjusted assets requirements include a common equity Tier 1 capital ratio of 4.5% (6.5% to be considered “well capitalized”) and a Tier 1 capital ratio of 6.0%, increased from 4.0% (and increased from 6.0% to 8.0% to be considered “well capitalized”); the total capital ratio remains at 8.0% under the rules (10.0% to be considered “well capitalized”). Under BASEL III, in order to avoid limitations on capital distributions (including dividend payments and certain discretionary bonus payments to executive officers), a banking organization must hold a capital conservation buffer comprised of common equity Tier 1 capital above its minimum risk-based capital requirements in an amount greater than 2.5% of total risk-weighted assets. BASEL III permits institutions, other than certain large institutions, to elect to continue to treat most components of accumulated other comprehensive income as permitted under the current general risk-based capital rules, and not reflect these items in common equity Tier 1 calculations (such as unrealized gains and losses on available-for-sale securities, amounts recorded in accumulated other comprehensive income attributed to defined benefit retirement plans resulting from the initial and subsequent application of the relevant U.S. generally accepted accounting principles and accumulated net gains and losses on cash flow hedges related to items that are reported on the balance sheet at fair value). The minimum capital requirements were effective on January 1, 2015. The capital conservation buffer requirements were phased in beginning January 1, 2016 through January 1, 2019. See Note 20, "Regulatory Matters" included in the Notes to the Consolidated Financial Statements included herein under Item 8 for further discussion.
Tax Cuts and Jobs Act
On December 22, 2017, H.R.1, commonly known as the Tax Cuts and Jobs Act (TCJA) was signed into law. The TCJA includes many provisions that affect the Corporation's income tax expense, including a reduction of the Corporation's federal tax rate from 35% to 21% effective January 1, 2018. As a result of the rate reduction, the Corporation was required to re-measure, through income tax expense in the period of enactment, the deferred tax assets and liabilities using the enacted rate at which they were expected to be recovered or settled. The re-measurement of the Corporation's net deferred tax asset resulted in additional 2017 income tax expense of $1.1 million. The Corporation completed the calculations of provisional items with the completion of the 2017 tax returns. The impact of the completed calculations to the re-measurement of the Corporation's net deferred tax asset resulted in an income tax benefit of $300 thousand which the Corporation recorded in 2018. See Note 11, "Income Taxes" included in the Notes to the Consolidated Financial Statements included herein under Item 8 for further discussion.
Economic Growth, Regulatory Relief, and Consumer Protection Act
On May 24, 2018, President Trump signed into law the Economic Growth, Regulatory Relief, and Consumer Protection Act (the Act), which was designed to ease certain restrictions imposed by the Dodd-Frank Act. Most of the changes made by the Act can be grouped into five general areas: mortgage lending; certain regulatory relief for “community” banks; enhanced consumer protections in specific areas, including subjecting credit reporting agencies to additional requirements; certain regulatory relief for large financial institutions, including increasing the threshold at which institutions are classified a systemically important financial institutions (from $50 billion to $250 billion) and therefore subject to stricter oversight, and revising the rules for larger institution stress testing; and certain changes to federal securities regulations designed to promote capital formation. Some of the key provisions of the Act as it relates to community banks and bank holding companies include, but are not limited to: (i) designating mortgages held in portfolio as “qualified mortgages” for banks with less than $10 billion in assets, subject to certain documentation and product limitations; (ii) exempting banks with less than $10 billion in assets from Volcker Rule requirements relating to proprietary trading; (iii) simplifying capital calculations for banks with less than $10 billion in assets by requiring federal banking agencies to establish a community bank leverage ratio of tangible equity to average consolidated assets of a ratio between 8% and 10%, and provide that banks that maintain tangible equity in excess of such ratio will be deemed to be in compliance with risk-based capital and leverage requirements; (iv) assisting smaller banks with obtaining stable funding by providing an exception for reciprocal deposits from FDIC restrictions on acceptance of brokered deposits; (v) raising the eligibility for use of short-form Call Reports from $1 billion to $5 billion in assets; and (vi) clarifying definitions pertaining to high volatility commercial real estate loans which require higher capital allocations, so that only loans with increased risk are subject to higher risk weightings. The Corporation continues to analyze the changes implemented by the Act, but does not believe that such changes will materially impact the Corporation’s business, operations, or financial results.
|
5
|
SEC Disclosure Update and Simplification
On August 17, 2018, the SEC issued Release No. 33-10532, "Disclosure Update and Simplification." This rule amends certain disclosure requirements that were redundant with or superseded by other SEC disclosure requirements or U.S. GAAP or for changes in the information environment. The changes are generally expected to reduce or eliminate some of a SEC registrant's disclosures in certain topics but some provisions require additional disclosures. The rule extends to interim periods the annual disclosure requirement under Regulation S-X of presenting changes in shareholders' equity for the current and comparative year-to-date interim periods. Under the amendments, an analysis of changes in each caption of shareholders' equity presented in the balance sheet must be provided in a note or separate statement. The analysis should include a reconciliation of the beginning balance to the ending balance for each period for which a statement of comprehensive income is required to be filed. The amendments are effective on November 5, 2018. The Corporation currently includes year-to-date changes in shareholders' equity in the Form 10-Q and will additionally provide the quarterly changes in shareholders' equity in the Form 10-Q for the quarter ending March 31, 2019. The Corporation continues to analyze the amended disclosure requirements under this rule, but does not believe that such changes will materially impact the Corporation’s disclosures.
Wealth Management and Insurance Businesses
The Corporation's wealth management and insurance businesses are subject to additional regulatory requirements. The securities brokerage activities of Girard Investment Services, LLC are subject to regulation by the SEC, the Financial Industry Regulatory Authority and the Securities Investor Protection Corporation. Girard Advisory Services, LLC and Girard Pension Services, LLC are registered investment advisory firms which are subject to regulation by the SEC. Univest Insurance, LLC is subject to Pennsylvania insurance laws and the regulations of the Pennsylvania Department of Insurance.
Credit and Monetary Policies
The Bank is affected by the fiscal and monetary policies of the federal government and its agencies, including the Federal Reserve Board of Governors. An important function of these policies is to curb inflation and control recessions through control of the supply of money and credit. The Board uses its powers to regulate reserve requirements of member banks, the discount rate on member-bank borrowings, interest rates on time and savings deposits of member banks, and to conduct open-market operations in United States Government securities to exercise control over the supply of money and credit. The policies have a direct effect on the amount of bank loans and deposits and on the interest rates charged on loans and paid on deposits, with the result that the policies have a material effect on bank earnings. Future policies of the Board and other authorities cannot be predicted, nor can their effect on future bank earnings.
The Bank is a member of the Federal Home Loan Bank System (FHLBanks), which consists of 11 regional Federal Home Loan Banks, and is subject to supervision and regulation by the Federal Housing Finance Agency. The FHLBanks provide a central credit facility primarily for member institutions. The Bank, as a member of the Federal Home Loan Bank of Pittsburgh (FHLB), is required to acquire and hold shares of capital stock in the FHLB. At
December 31, 2018
, the Bank owned
$13.6 million
in FHLB capital stock.
Acquisitions
The Corporation, through its business segments, provide financial solutions to individuals, businesses, municipalities and non-profit organizations. The Corporation prides itself on being a financial organization that continues to increase its scope of services while maintaining traditional beliefs and a determined commitment to the communities it serves. Over the past five years, the Corporation and its subsidiaries have experienced stable growth, both organically and through various acquisitions, to be the best integrated financial solutions provider in the market.
The acquisitions included:
|
•
|
Fox Chase Bancorp on July 1, 2016;
|
|
•
|
Valley Green Bank on January 1, 2015;
|
|
•
|
Sterner Insurance Associates on July 1, 2014; and
|
|
•
|
Girard Partners on January 1, 2014.
|
|
6
|
Securities and Exchange Commission Reports
The Corporation makes available free-of-charge its reports that are electronically filed with the SEC including its Report on Form 10-K, Quarterly Reports on Form 10-Q, Current Reports on Form 8-K and amendments to those reports on its website as a hyperlink to the SEC’s Electronic Data Gathering, Analysis and Retrieval (EDGAR) system. These reports are available as soon as reasonably practicable after the material is electronically filed. The Corporation’s website address is
www.univest.net
. Information included on the Corporation’s website is not part of this Annual Report on Form 10-K. The Corporation will provide at no charge a copy of the SEC Form 10-K annual report for the year
2018
to each shareholder who requests one in writing. Requests should be directed to: Megan Duryea Santana, Corporate Secretary, Univest Financial Corporation, P.O. Box 197, Souderton, PA 18964.
The SEC maintains an internet site that contains the Corporation's SEC filings electronically at
www.sec.gov
.
Item 1A. Risk Factors
An investment in the Corporation’s common stock is subject to risks inherent to the Corporation’s business. Before making an investment, you should carefully consider the risks and uncertainties described below, together with all of the other information included or incorporated by reference in this report. This report is qualified in its entirety by these risk factors.
Risks Related to the Banking Industry
The Corporation is subject to interest rate risk.
Our profitability is dependent to a large extent on our net interest income. Like most financial institutions, we are affected by changes in general interest rate levels and by other economic factors beyond our control. Although we believe we have implemented strategies to reduce the potential effects of changes in interest rates on our results of operations, any substantial and prolonged change in market interest rates could adversely affect our operating results.
Net interest income may decline in a particular period if:
|
•
|
In a declining interest rate environment, more interest-earning assets than interest-bearing liabilities re-price or mature, or
|
|
•
|
In a rising interest rate environment, more interest-bearing liabilities than interest-earning assets re-price or mature.
|
Our net interest income may decline based on our exposure to a difference in short-term and long-term interest rates. If the difference between the short-term and long-term interest rates shrinks or disappears, the difference between rates paid on deposits and received on loans could narrow significantly resulting in a decrease in net interest income. In addition to these factors, if market interest rates rise rapidly, interest rate adjustment caps may limit increases in the interest rates on adjustable rate loans, thus reducing our net interest income. Also, certain adjustable rate loans re-price based on lagging interest rate indices. This lagging effect may also negatively impact our net interest income when general interest rates continue to rise periodically. Increasing interest rates may also reduce the fair value of our fixed rate available-for-sale investment securities negatively impacting shareholders' equity.
The Corporation is subject to lending risk.
Risks associated with lending activities include, among other things, the impact of changes in interest rates and economic conditions, which may adversely impact the ability of borrowers to repay outstanding loans and the value of the associated collateral. Various laws and regulations also affect our lending activities, and failure to comply with such applicable laws and regulations could subject the Corporation to enforcement actions and civil monetary penalties.
At
December 31, 2018
, approximately 84.8% of our loan and lease portfolio consisted of commercial, financial and agricultural, commercial real estate and construction loans and leases which are generally perceived as having more risk of default than residential real estate and consumer loans. Commercial business, commercial real estate and construction loans are more susceptible to a risk of loss during a downturn in the business cycle. These types of loans involve larger loan balances to a single borrower or groups of related borrowers. Commercial real estate loans may be affected to a greater extent than residential loans by adverse conditions in real estate markets or the economy because commercial real estate borrowers’ ability to repay their loans depends on successful development of their properties, as well as the factors affecting residential real estate borrowers. An increase in nonperforming loans and leases could result in a net loss of earnings from these loans and leases, an increase in the provision for possible loan and lease losses, and an increase in loan and lease charge-offs. The risk of loan and lease losses increases if the economy worsens.
|
7
|
Commercial real estate loans secured by owner-occupied properties are dependent upon the successful operation of the borrower’s business. If the operating company suffers difficulties in terms of sales volume and/or profitability, the borrower’s ability to repay the loan may be impaired. Loans secured by properties where repayment is dependent upon payment of rent by third party tenants or the sale of the property may be impacted by loss of tenants, lower lease rates needed to attract new tenants or the inability to sell a completed project in a timely fashion and at a profit.
Commercial business loans and leases are typically based on the borrowers’ ability to repay the loans from the cash flows of their businesses. These loans may involve greater risk because the availability of funds to repay each loan depends substantially on the success of the business itself. The collateral securing the loans and leases often depreciates over time, is difficult to appraise and liquidate and fluctuates in value based on the success of the business. In addition, many commercial business loans have a variable rate which is indexed off of a floating rate such as Prime or LIBOR. If interest rates rise, the borrower's debt service requirement may increase, negatively impacting the borrower's ability to service their debt.
Risk of loss on a construction loan depends largely upon whether our initial estimate of the property’s value at completion of construction equals or exceeds the cost of the property construction (including interest). During the construction phase, a number of factors can result in delays and cost overruns. If estimates of value are inaccurate or if actual construction costs exceed estimates, the value of the property securing the loan may be insufficient to ensure full repayment when completed through a permanent loan, borrower liquidation of collateral or by seizure of collateral. Included in real estate-construction is track development financing. Risk factors related to track development financing include the demand for residential housing and the real estate valuation market. When projects move slower than anticipated, the properties may have significantly lower values than when the original underwriting was completed, resulting in lower collateral values to support the loan. Extended time frames also cause the interest carrying cost for projects to be higher than the builder projected, negatively impacting the builder’s profit and cash flow and, therefore, their ability to make principal and interest payments.
The Corporation’s allowance for possible loan and lease losses may be insufficient, and an increase in the allowance would reduce earnings.
We maintain an allowance for loan and lease losses. The allowance is established through a provision for loan and lease losses based on management’s evaluation of the risks inherent in our loan portfolio and the general economy. The allowance is based upon a number of factors, including the size and composition of the loan and lease portfolio, asset classifications, economic trends, industry experience and trends, industry and geographic concentrations, estimated collateral values, management’s assessment of the credit risk inherent in the portfolio, historical loan and lease loss experience and loan underwriting policies. In addition, we evaluate all loans and leases identified as impaired loans and augment the allowance based upon our estimation of the potential loss associated with those impaired loans and leases. Additions to our allowance for loan and lease losses decrease our net income.
If the evaluation we perform in connection with establishing loan and lease loss reserves is wrong, our allowance for loan and lease losses may not be sufficient to cover our losses, which would have an adverse effect on our operating results.
The regulators, in reviewing our loan and lease portfolio as part of a regulatory examination, may from time to time require us to increase our allowance for loan and lease losses, thereby negatively affecting our earnings, financial condition and capital ratios at that time. Moreover, additions to the allowance may be necessary based on changes in economic and real estate market conditions, new information regarding existing loans and leases, identification of additional impaired loans and leases and other factors, both within and outside of our control. Additions to the allowance could have a negative impact on our results of operations.
The Corporation is required to adopt the FASB's accounting standard which requires measurement of certain financial assets (including loans and certain investments) using the current expected credit losses (CECL) beginning in calendar year 2020.
Current GAAP requires an incurred loss methodology for recognizing credit losses that delays recognition until it is probable a loss has been incurred. The FASB's amendment replaces the current incurred loss methodology with a methodology that reflects expected credit losses and requires consideration of a broader range of reasonableness and supportable information to inform credit loss estimates. The Corporation is in the process of evaluating the impact of the adoption of this guidance on the Corporation's financial statements; however, it is anticipated that the allowance will increase upon the adoption of CECL and that the increased allowance level will decrease shareholders' equity and the Corporation's and Bank's regulatory capital ratios.
|
8
|
Our results of operations may be adversely affected by other-than-temporary impairment charges relating to our investment portfolio.
We may be required to record future impairment charges on our investment securities if they suffer declines in value that we consider other-than-temporary. Numerous factors, including the lack of liquidity for re-sales of certain investment securities, the absence of reliable pricing information for investment securities, adverse changes in the business climate, adverse regulatory actions or unanticipated changes in the competitive environment, could have a negative effect on our investment portfolio in future periods. Significant impairment charges could negatively impact our earnings and regulatory capital ratios.
Changes in economic conditions and the composition of our loan portfolio could lead to higher loan charge-offs or an increase in our provision for loan losses and may reduce our net income.
Changes in national and regional economic conditions could impact our loan portfolios. For example, an increase in unemployment, a decrease in real estate values or increases in interest rates, as well as other factors, could weaken the economies of the communities we serve. Weakness in the market areas we serve could depress our earnings and consequently our financial condition because customers may not demand our products or services, borrowers may not be able to repay their loans, the value of the collateral securing our loans to borrowers may decline and the quality of our loan portfolio may decline. Any of these scenarios could require us to charge off a higher percentage of our loans and/or increase our provision for loan and lease losses which would reduce our net income and capital levels.
The Corporation is subject to environmental liability risk associated with lending activities.
In the course of our business, we may foreclose and take title to real estate and could be subject to environmental liabilities with respect to these properties. The Corporation may be held liable to a governmental entity or to third parties for property damage, personal injury, investigation and clean-up costs incurred by these parties in connection with environmental contamination, or may be required to investigate or clean up hazardous or toxic substances, or chemical releases at a property. Our policies and procedures require environmental factors to be considered during the loan application process. An environmental review is performed before initiating any commercial foreclosure action; however, these reviews may not be sufficient to detect all potential environmental hazards. Possible remediation costs and liabilities could have a material adverse effect on our financial condition.
The Corporation is subject to extensive government regulation and supervision.
We are subject to extensive regulation, supervision, and examination by our primary federal regulators, the Pennsylvania Department of Banking and Securities and the Federal Reserve Bank of Philadelphia, and by the FDIC, the regulating authority that insures customer deposits. Also, as a member of the FHLB, the Bank must comply with applicable regulations of the Federal Housing Finance Agency and the FHLB. Regulation by these agencies is intended primarily for the protection of our depositors and the deposit insurance fund and not for the benefit of our shareholders. The Bank’s activities are also regulated under consumer protection laws applicable to our lending, deposit, and other activities. A large claim against the Bank under these laws could have a material adverse effect on our financial condition and results of operations.
In prior years, financial reform legislation has been enacted by Congress changing the bank regulatory framework, creating an independent consumer protection bureau and establishing more stringent capital standards for financial institutions and their holding companies. The legislation has, and may continue to result, in new regulations including those that affect lending, funding, trading and investment activities of financial institutions and their holding companies. Such additional regulation and oversight could have a material and adverse impact on us.
Consumers may decide not to use banks to complete their financial transactions.
The process of eliminating banks as intermediaries, known as “disintermediation,” could result in the loss of fee income as well as the loss of customer deposits and the related income generated from those deposits. The loss of these revenue streams could have an adverse effect on our financial condition and results of operations.
Risks Relating to Recent Economic Conditions and Governmental Response Efforts
The Corporation’s earnings are impacted by general business and economic conditions.
The Corporation’s operations and profitability are impacted by general business and economic conditions; these conditions include long-term and short-term interest rates, inflation, money supply, political issues, legislative and regulatory changes,
|
9
|
fluctuations in both debt and equity capital markets, broad trends in industry and finance, values of real estate and other collateral and the strength of the U.S. economy and the local economies in which we operate, all of which are beyond our control. Negative changes in these general business and economic conditions could have a material adverse effect on the Corporation's business, financial condition and results of operations.
We cannot predict the effect of recent legislative and regulatory initiatives, and they could increase our costs of doing business and adversely affect our results of operations and financial condition.
The Dodd-Frank Act has had a material impact on our operations and may continue to do so, particularly through increased compliance costs resulting from consumer and fair lending regulations. Other changes to statutes, regulations or regulatory policies could affect the Corporation in substantial and unpredictable ways. Such changes could subject the Corporation to additional costs, limit the types of financial services and products the Corporation may offer, limit the fees we may charge, increase the ability of non-banks to offer competing financial services and products, change regulatory capital requirements (such as BASEL III) and change deposit insurance assessments. Failure to comply with laws, regulations or policies could result in sanctions by regulatory agencies, civil money penalties and/or reputation damage, which could have a material adverse effect on the Corporation's business, financial condition and results of operations.
We borrow from the Federal Home Loan Bank, the Federal Reserve and correspondent banks, and these lenders could modify or terminate their current programs which could have an adverse effect on our liquidity and profitability.
We utilize the FHLB for overnight borrowings and term advances. We also borrow from the Federal Reserve and from correspondent banks under our federal funds lines of credit. The amount loaned to us is generally dependent on the value of the collateral pledged as well as the FHLB’s internal credit rating of the Bank. These lenders could reduce the percentages loaned against various collateral categories, could eliminate certain types of collateral and could otherwise modify or even terminate their loan programs, particularly to the extent they are required to do so, because of capital adequacy or other balance sheet concerns. Any change or termination of our borrowings from the FHLB, the Federal Reserve or correspondent banks would have an adverse effect on our liquidity and profitability.
We may need to raise additional capital in the future and such capital may not be available when needed or at all.
Federal regulatory agencies have the authority to change the Corporation's and Bank's capital requirements. In addition, BASEL III and new accounting rules, such as Lease Accounting (ASU No. 2016-02) and CECL (ASU No. 2016-13) will have a negative impact on our regulatory capital ratios. Accordingly, we may need to raise additional capital in the future to provide us with sufficient capital resources to meet our commitments and business needs. We may also at some point need to raise additional capital to support our continued growth. If we raise capital through the issuance of additional shares of our common stock or other securities, it would dilute the ownership interests of existing shareholders and may dilute the per share book value of our common stock. New investors may also have rights, preferences and privileges senior to our current shareholders, which may adversely impact our current shareholders. Our ability to raise additional capital, if needed, or at attractive prices, will depend on, among other things, conditions in the capital markets at that time, which are outside of our control, and our financial performance. An inability to raise additional capital on acceptable terms when needed could have a material adverse effect on our business, financial condition and results of operations.
Risks Related to Our Market and Business
The Corporation’s profitability is affected by economic conditions in Southeastern Pennsylvania and Southern New Jersey.
Unlike larger regional banks that operate in large geographies, the Corporation provides banking and financial services to customers primarily in Bucks, Berks, Chester, Delaware, Lancaster, Lehigh, Montgomery, Northampton and Philadelphia counties in Pennsylvania and Atlantic and Cape May counties in New Jersey. Because of our geographic concentration, a downturn in the local economy could make it more difficult to attract deposits and could cause higher rates of loss and delinquency on our loans than if the loans were more geographically diversified. Adverse economic conditions in the region, including, without limitation, declining real estate values, could cause our levels of nonperforming assets and loan losses to increase. Regional economic conditions have a significant impact on the ability of borrowers to repay their loans as scheduled. A sluggish economy could, therefore, result in losses that materially and adversely affect our financial condition and results of operations.
|
10
|
The Corporation operates in a highly competitive industry and market area which could adversely impact its business and results of operations.
We face substantial competition in all phases of our businesses from a variety of different competitors. Our competitors, including commercial banks, community banks, savings institutions, credit unions, consumer finance companies, insurance companies, securities dealers, brokers, mortgage bankers, investment advisors, money market mutual funds and other financial technology and financial institutions, compete with us for loans and deposits and insurance and wealth management services offered by us. Increased competition in our markets may result in reduced loans and deposits or may require us to pay higher prices when offering such products.
Many of these competing institutions have much greater financial and marketing resources than we have. Due to their size, many competitors can achieve larger economies of scale and may offer a broader range of products and services than we can. If we are unable to compete effectively in the offerings of our products and services, our business may be negatively affected.
Some of the financial services organizations with which we compete are not subject to the same degree of regulation or tax structure as is imposed on bank holding companies and federally insured financial institutions. As a result, these non-bank competitors have certain advantages over us in accessing funding and in providing various services. The banking business in our primary market areas is very competitive, and the level of competition and their pricing structure facing us may increase further, which may limit our asset growth and financial results.
The Corporation’s controls and procedures may fail or be circumvented.
Our management diligently reviews and updates the Corporation’s internal controls over financial reporting, disclosure controls and procedures, and corporate governance policies and procedures. Any failure or undetected circumvention of these controls could have a material adverse impact on our financial condition and results of operations.
Potential acquisitions may disrupt the Corporation’s business and dilute shareholder value.
We regularly evaluate opportunities to acquire and invest in banks and in other complementary businesses. As a result, we may engage in negotiations or discussions that, if they were to result in a transaction, could have a material effect on our operating results and financial condition, including short and long-term liquidity and capital structure. Our acquisition activities could be material to us. For example, we could issue additional shares of common stock in a purchase transaction, which could dilute current shareholders’ ownership interest. These activities could require us to use a substantial amount of cash, other liquid assets, and/or incur debt. In addition, if goodwill recorded in connection with our prior or potential future acquisitions were determined to be impaired, then we would be required to recognize a charge against our earnings, which could materially and adversely affect our results of operations during the period in which the impairment was recognized. Any potential charges for impairment related to goodwill would not impact cash flow, tangible capital or liquidity but would decrease shareholders' equity.
Our acquisition activities could involve a number of additional risks, including the risks of:
|
•
|
Incurring time and expense associated with identifying and evaluating potential acquisitions and negotiating potential transactions;
|
|
•
|
Using inaccurate estimates and judgments to evaluate credit, operations, management, and market risks with respect to the target institution or its assets;
|
|
•
|
The time and expense required to integrate the operations and personnel of the combined businesses;
|
|
•
|
Creating an adverse short-term effect on our results of operations; and
|
|
•
|
Losing key employees and customers or a reduction in our stock price as a result of an acquisition that is poorly received.
|
We may not be successful in overcoming these risks or any other problems encountered in connection with potential acquisitions. Our inability to overcome these risks could have an adverse effect on our ability to achieve our business strategy and could have an adverse effect on our financial condition and results of operations.
The Corporation may not be able to attract and retain skilled people.
We are dependent on the ability and experience of a number of key management personnel who have substantial experience with our operations, the financial services industry, and the markets in which we offer products and services. The loss of one or more senior executives or key managers may have an adverse effect on our businesses. We maintain change in control agreements
|
11
|
with certain executive officers to aid in our retention of these individuals. As we continue to grow businesses, our success depends on our ability to continue to attract, manage, and retain other qualified management personnel.
If we lose a significant portion of our low-cost deposits, it would negatively impact our liquidity and profitability.
Our profitability depends in part on our success in attracting and retaining a stable base of low-cost deposits. At
December 31, 2018
, 27% of our deposit base was comprised of noninterest-bearing deposits, of which 18% consisted of business deposits, which are primarily operating accounts for businesses, and 9% consisted of consumer deposits. The competition for these deposits in our markets is strong and customers are increasingly seeking investments with higher interest rates that are safe, including the purchase of U.S. Treasury securities and other government-guaranteed obligations, as well as the establishment of accounts at the largest, most-well capitalized banks. If we were to lose a significant portion of our low-cost deposits, it would negatively impact our liquidity and profitability.
The Corporation's information technology systems and the systems of third parties upon which the Corporation relies may experience a failure, interruption or breach in security which could negatively affect our operations and reputation.
The Corporation relies heavily on information technology systems to conduct its business, including the systems of third-party service providers.
Any failure, interruption, or breach in security or operational integrity of these systems could result in failures or disruptions in the Corporation’s customer relationship management and general ledger, deposit, loan, and other systems. While the Corporation has policies and procedures designed to prevent or limit the impact of any failure, interruption, or breach in our security systems (including privacy and cyber-attacks), there can be no assurance that such events will not occur or if they do occur, that they will be adequately addressed. Information security and cyber-security risks have increased significantly in recent years because of new technologies, the use of the Internet and other electronic delivery channels (including mobile devices) to conduct financial transactions. Accordingly, the Corporation may be required to expend additional resources to continue to enhance its protective measures or to investigate and remediate any information security vulnerabilities or exposures. The occurrence of any system failures, interruptions, or breaches in security could expose the Corporation to reputation risk, civil litigation, regulatory scrutiny and possible financial liability that could have a material adverse effect on our financial condition and results of operations.
The failure to maintain current technologies and the costs to update technology could negatively impact the Corporation's business and financial results.
Our future success depends, in part, on our ability to effectively embrace technology to better serve customers and reduce costs. The Corporation may be required to expand additional resources to employ this technology. Failure to keep pace with technological change could potentially have an adverse effect on our business operations and financial condition and results of operations.
The Corporation is subject to claims and litigation.
Customer claims and other legal actions, whether founded or unfounded, could result in financial or reputation damage and have a material adverse effect on our financial condition and results of operations if such claims are not resolved in a manner favorable to the Corporation.
Natural disasters, acts of war or terrorism and other external events could negatively impact the Corporation.
Natural disasters, acts of war or terrorism and other adverse external events could have a significant impact on the Corporation’s ability to conduct business. In addition, such events could affect the stability of the Corporation’s deposit base, impair the ability of borrowers to repay outstanding loans, impair the value of collateral securing loans, cause significant property damage, result in loss of revenue and/or cause the Corporation to incur additional expenses. Our management has established disaster recovery policies and procedures that are expected to mitigate events related to natural or man-made disasters; however, the occurrence of any such event and the impact of an overall economic decline resulting from such a disaster could have a material adverse effect on the Corporation’s financial condition and results of operations.
The Corporation depends on the accuracy and completeness of information about customers and counterparties.
In deciding whether to extend credit or enter into other transactions with customers and counterparties, we may rely on information furnished to us by or on behalf of customers and counterparties, including financial statements and other financial information. We also may rely on representations of customers and counterparties as to the accuracy and completeness of that information and, with respect to financial statements, on reports of independent auditors. For example, in deciding whether to extend credit to clients, we may assume that a customer’s audited financial statements conform to U.S. generally accepted accounting
|
12
|
principles (U.S. GAAP) and present fairly, in all material respects, the financial condition, results of operations and cash flows of the customer. Our earnings are significantly affected by our ability to properly originate, underwrite and service loans. Our financial condition, results of operations and capital could be negatively impacted to the extent we incorrectly assess the creditworthiness of our borrowers, fail to detect or respond to deterioration in asset quality in a timely manner, or rely on financial statements that do not comply with U.S. GAAP or are materially misleading.
Risks Related to the Wealth Management and Insurance Industries
Revenues and profitability from our wealth management business may be adversely affected by any reduction in assets under management, which could reduce fees earned.
The wealth management business derives the majority of its revenue from noninterest income, which consists of trust, investment advisory and brokerage and other servicing fees. Substantial revenues are generated from investment management contracts with clients. Under these contracts, the investment advisory fees paid to us are typically based on the market value of assets under management. Assets under management and supervision may decline for various reasons including declines in the market value of the assets in the funds and accounts managed or supervised, which could be caused by price declines in the securities markets generally or by price declines in specific market segments. Assets under management may also decrease due to redemptions and other withdrawals by clients or termination of contracts. This could be in response to adverse market conditions or in pursuit of other investment opportunities. If the assets under management we supervise decline and there is a related decrease in fees, it will negatively affect our results of operations.
We may not be able to attract and retain wealth management clients.
Due to strong competition, our wealth management business may not be able to attract and retain clients. Competition is strong because there are numerous well-established and successful investment management and wealth advisory firms including commercial banks and trust companies, investment advisory firms, mutual fund companies, stock brokerage firms, and other financial companies. Many of our competitors have greater resources than we have.
Our ability to successfully attract and retain wealth management clients is dependent upon our ability to compete with competitors’ investment products, level of investment performance, client services and marketing and distribution capabilities. If we are not successful, our results of operations and financial condition may be negatively impacted.
The wealth management industry is subject to extensive regulation, supervision and examination by regulators, and any enforcement action or adverse changes in the laws or regulations governing our business could decrease our revenues and profitability.
The wealth management business is subject to regulation by a number of regulatory agencies that are charged with safeguarding the integrity of the securities and other financial markets and with protecting the interests of customers participating in those markets. In the event of non-compliance with regulation, governmental regulators, including the SEC, and FINRA, may institute administrative or judicial proceedings that may result in censure, fines, civil penalties, the issuance of cease-and-desist orders or the deregistration or suspension of the non-compliant broker-dealer or investment adviser or other adverse consequences. The imposition of any such penalties or orders could have a material adverse effect on the wealth management segment's operating results and financial condition. We may be adversely affected as a result of new or revised legislation or regulations. Regulatory changes have imposed and may continue to impose additional costs, which could adversely impact our profitability.
Revenues and profitability from our insurance business may be adversely affected by market conditions, which could reduce insurance commissions and fees earned.
The revenues of our fee based insurance business are derived primarily from commissions from the sale of insurance policies, which commissions are generally calculated as a percentage of the policy premium. These insurance policy commissions can fluctuate as insurance carriers change the premiums on the insurance products we sell. Due to the cyclical nature of the insurance market and the impact of other market and macroeconomic conditions on insurance premiums, commission levels may vary. The reduction of these commission rates, along with general volatility and/or declines in premiums, may adversely impact our profitability.
|
13
|
Risks Related to Our Common Stock
An investment in the Corporation’s common stock is not an insured deposit.
The Corporation’s common stock is not a bank deposit, is not insured by the FDIC or any other deposit insurance fund, and is subject to investment risk, including the loss of some or all of your investment. Our common stock is subject to the same market forces that affect the price of common stock in any public company.
The Corporation’s stock price can be volatile.
The Corporation’s stock price can fluctuate in response to a variety of factors, some of which are not under our control. The factors that could cause the Corporation’s stock price to decrease include, but are not limited to:
|
•
|
Our past and future dividend practice;
|
|
•
|
Our financial condition, performance, creditworthiness and prospects;
|
|
•
|
Variations in our operating results or the quality of our assets;
|
|
•
|
Operating results that vary from the expectations of management, securities analysts and investors;
|
|
•
|
Changes in expectations as to our future financial performance;
|
|
•
|
Changes in financial markets related to market valuations of financial industry companies;
|
|
•
|
The operating and securities price performance of other companies that investors believe are comparable to us;
|
|
•
|
Future sales of our equity or equity-related securities;
|
|
•
|
The credit, mortgage and housing markets, the markets for securities relating to mortgages or housing, and developments with respect to financial institutions generally; and
|
|
•
|
Changes in global financial markets and global economies and general market conditions, such as interest or foreign exchange rates, stock, commodity or real estate valuations or volatility and other geopolitical, regulatory or judicial events.
|
While the Corporation’s common stock is listed for trading on the NASDAQ Global Select Market under the symbol “UVSP,” the trading volume has historically been less than that of larger financial services companies. Stock price volatility may make it more difficult for investors to sell their common stock when they want and at prices they find attractive.
A public trading market having the desired characteristics of depth, liquidity and orderliness depends on the presence in the marketplace of willing buyers and sellers of our common stock at any given time. This presence depends on the individual decisions of investors and general economic and market conditions over which we have no control. Given the relatively low trading volume of our common stock, significant sales of our common stock in the public market, or the perception that those sales may occur, could cause the trading price of our common stock to decline or to be lower than it otherwise might be in the absence of those sales or perceptions.
Anti-takeover provisions could negatively impact our shareholders.
Certain provisions in the Corporation’s Articles of Incorporation and Bylaws, as well as federal banking laws, regulatory approval requirements, and Pennsylvania law could make it more difficult for a third party to acquire the Corporation, even if doing so would be perceived to be beneficial to the Corporation’s shareholders.
There may be future sales or other dilution of the Corporation’s equity, which may adversely affect the market price of our common stock.
The Corporation is generally not restricted from issuing additional common stock, including any securities that are convertible into or exchangeable for, or that represent the right to receive, common stock. The issuance of any additional shares of common stock or preferred stock or securities convertible into, exchangeable for or that represent the right to receive common stock or the exercise of such securities could be substantially dilutive to shareholders of our common stock. Holders of our shares of common stock have no preemptive rights that entitle holders to purchase their pro rata share of any offering of shares of any class or series. The market price of our common stock could decline as a result of offerings or because of sales of shares of our common stock made after offerings or the perception that such sales could occur. Because our decision to issue securities in any future offering will depend on market conditions and other factors beyond our control, we cannot predict or estimate the amount, timing or nature of our future offerings. Thus, our shareholders bear the risk of our future offerings reducing the market price of our common stock and diluting their stock holdings in us.
|
14
|
The Corporation relies on dividends from our subsidiaries for most of our revenue.
The Corporation is a bank holding company and our operations are conducted by our subsidiaries from which we receive dividends. The ability of our subsidiaries to pay dividends is subject to legal and regulatory limitations, profitability, financial condition, capital expenditures and other cash flow requirements. The ability of the Bank to pay cash dividends to the Corporation is limited by its obligation to maintain sufficient capital and by other restrictions on its cash dividends that are applicable to state member banks in the Federal Reserve System. If the Bank is not permitted to pay cash dividends to the Corporation, it is unlikely that we would be able to pay cash dividends on our common stock.
|
Item 1B.
|
Unresolved Staff Comments
|
None.
|
Item 2.
|
Properties
|
The Corporation and its subsidiaries occupy
fifty-five
properties in Montgomery, Bucks, Philadelphia, Chester, Lehigh, Northampton, and Lancaster Counties in Pennsylvania, Cape May County in New Jersey, Calvert County in Maryland and Lee County in Florida, most of which are used principally as banking offices.
The following table detail the Corporation's properties as of
December 31, 2018
:
|
Property Address
|
Owned/Leased
|
|
|
Full Service Branches (Banking Segment):
|
||
|
195 East Butler Ave., Chalfont, PA 18914
|
Owned
|
|
|
4390 Davisville Rd., Hatboro, PA 19040
|
(3)
|
Owned
|
|
5871 Lower York Rd., Lahaska, PA 18931
|
Owned
|
|
|
Route 309 & Line Lexington Rd., Line Lexington, PA 18932
|
Owned
|
|
|
1950 John Fries Highway, Milford Square, PA 18935
|
Owned
|
|
|
Route 309 & Stump Rd., Montgomeryville, PA 18936
|
Owned
|
|
|
15 Swamp Rd., Newtown, PA 18940
|
Owned
|
|
|
921 West Ave., Ocean City, NJ 08226
|
Owned
|
|
|
401 Rhawn St., Philadelphia, PA 19111
|
Owned
|
|
|
415 Main St., Schwenksville, PA 19473
|
Owned
|
|
|
Township Line Rd. and Route 113, Schwenksville, PA 19473
|
Owned
|
|
|
10 W. Broad St., Souderton, PA 18964
|
Owned
|
|
|
500 Harleysville Pk., Souderton, PA 18964
|
Owned
|
|
|
Routes 113 and Bethlehem Pk., Souderton, PA 18964
|
Owned
|
|
|
1041 York Rd., Warminster, PA 18974
|
Owned
|
|
|
1 Fitzwatertown Rd., Willow Grove, PA 19090
|
Owned
|
|
|
574 Main St., Bethlehem, PA 18018
|
Leased
|
|
|
694 DeKalb Pk., Blue Bell, PA 19422
|
Leased
|
|
|
4250 Oregon Pk., Brownstown, PA 17508
|
Leased
|
|
|
1135 Georgetown Rd., Christiana, PA 17509
|
Leased
|
|
|
191 W. State St., Doylestown, PA 18901
|
Leased
|
|
|
321 Main St., East Greenville, PA 18041
|
Leased
|
|
|
23 W. Highland Ave., Philadelphia, PA 19118
|
Leased
|
|
|
1536 S. Broad St., Philadelphia, PA 19146
|
Leased
|
|
|
1642 Fairmount Ave., Philadelphia, PA 19130
|
Leased
|
|
|
3601 Market St., Philadelphia, PA 19104
|
Leased
|
|
|
7226 Germantown Ave., Philadelphia, PA 19119
|
Leased
|
|
|
216 Hartman Bridge Rd., Ronks, PA 17572
|
Leased
|
|
|
200 North High St., West Chester, PA 19380
|
(3)
|
Leased
|
|
90 Willow Valley Lakes Dr., Willow Street, PA 17584
|
Leased
|
|
|
5089 Hamilton Blvd., Allentown, PA 18106
|
Land Lease
|
|
|
2645 Street Rd., Bensalem, PA 19020
|
Land Lease
|
|
|
380 Water Loop Dr., Collegeville, PA 19426
|
Land Lease
|
|
|
5829 Easton Rd., Doylestown, PA 18901
|
Land Lease
|
|
|
15
|
|
1 Heritage Drive, Gordonville, PA 17529
|
Land Lease
|
|
|
2870 Shelly Rd., Harleysville, PA 19438
|
Land Lease
|
|
|
120 Forty Foot Rd., Hatfield, PA 19440
|
Land Lease
|
|
|
545 Constitution Ave., Perkasie, PA 18944
|
Land Lease
|
|
|
940 2nd Street Pk., Richboro, PA 18954
|
Land Lease
|
|
|
Corporate Headquarters:
|
||
|
14 North Main St., Souderton, PA 18964
|
(1) (2)
|
Owned
|
|
15 Washington Ave., Souderton, PA 18964
|
Owned
|
|
|
16 Harbor Pl., Souderton, PA 18964
|
Owned
|
|
|
Subsidiary Offices (Wealth Management Segment)
|
||
|
4600 Broadway, Allentown, PA 18104
|
(1) (3)
|
Leased
|
|
5237 Summerlin Commons Blvd., Fort Meyers, FL 33907
|
Leased
|
|
|
555 Croton Rd., King of Prussia, PA 19406
|
Leased
|
|
|
5000 Ritter Rd., Mechanicsburg, PA 17055
|
Leased
|
|
|
Subsidiary Offices (Insurance Segment)
|
||
|
6339 Beverly Hills Rd., Coopersburg, PA 18036
|
Owned
|
|
|
521 Main St., Lansdale, PA 19446
|
Owned
|
|
|
9120 Chesapeake Ave., Suite 300, North Beach, MD 20714
|
Leased
|
|
|
Glenloch Corporate Campus, 1473 Dunwoody Dr., West Chester, PA 19380
|
(1)
|
Owned
|
|
Other Offices:
|
||
|
3220 Tillman Dr., Suite 503, Bensalem, PA 19020
|
(1)
|
Leased
|
|
1317 2nd Ave., Cumberland, WI 54829
|
(1)
|
Leased
|
|
1980 S. Easton Rd., Doylestown, PA 18901
|
(1) (2) (3)
|
Leased
|
|
Greenfield Corporate Center, 1869 Charter Ln., Suite 301, Lancaster, PA 17601
|
(3)
|
Leased
|
|
2000 Market St., Suite 700, Philadelphia, PA 19103
|
(3)
|
Leased
|
(1) Banking Segment
(2) Wealth Management Segment
(3) Corporate banking
Additionally, the Bank provides banking services for the residents and employees of fourteen retirement home communities and has seven off-premise automated teller machines. The Bank provides banking services nationwide through the internet via its website
www.univest.net
.
|
Item 3.
|
Legal Proceedings
|
The Corporation is periodically subject to various pending and threatened legal actions, which involve claims for monetary relief. Based upon information presently available to the Corporation, it is the Corporation's opinion that any legal and financial responsibility arising from such claims will not have a material adverse effect on the Corporation's results of operations, financial position or cash flows.
|
Item 4.
|
Mine Safety Disclosures
|
Not Applicable.
|
16
|
PART II
|
Item 5.
|
Market for the Registrant's Common Equity, Related Stockholder Matters and Issuer Purchases of Equity Securities
|
The Corporation’s common stock is traded on the NASDAQ Global Select Market under the symbol “UVSP.” At February 14, 2019, the Corporation had
2,596
stockholders of record.
Broadridge Corporate Issuer Solutions, Inc. (Broadridge), serves as the Corporation’s transfer agent. Broadridge is located at 1155 Long Island Avenue, Edgewood, NY 11717. Shareholders can contact a representative by calling 866-321-8021.
Stock Performance Graph
The following chart compares the yearly percentage change in the cumulative shareholder return on the Corporation’s common stock during the five years ended
December 31, 2018
, with (1) the Total Return Index for the NASDAQ Stock Market (U.S. Companies) and (2) the Total Return Index for NASDAQ Bank Stocks. This comparison assumes $100.00 was invested on December 31,
2013
, in our common stock and the comparison groups and assumes the reinvestment of all cash dividends prior to any tax effect and retention of all stock dividends.
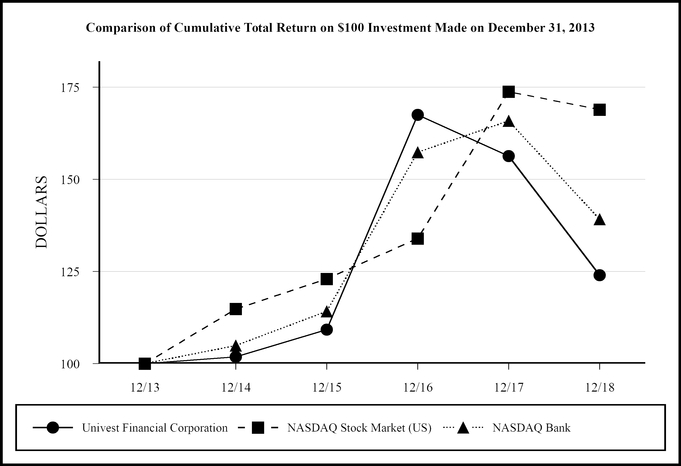
Five Year Cumulative Total Return Summary
|
2013
|
2014
|
2015
|
2016
|
2017
|
2018
|
|||||||
|
Univest Financial Corporation
|
100.00
|
|
101.84
|
|
109.22
|
|
167.48
|
|
156.30
|
|
124.00
|
|
|
NASDAQ Stock Market (US)
|
100.00
|
|
114.80
|
|
122.98
|
|
133.96
|
|
173.74
|
|
168.89
|
|
|
NASDAQ Banks
|
100.00
|
|
104.88
|
|
114.13
|
|
157.32
|
|
165.85
|
|
139.16
|
|
|
17
|
ISSUER PURCHASES OF EQUITY SECURITIES
The following table provides information on repurchases by the Corporation of its common stock during the fourth quarter of
2018
, under the Corporation's Board approved program:
|
Period
|
Total Number
of Shares Purchased |
Average
Price Paid per Share |
Total Number of
Shares Purchased as Part of Publicly Announced Plans or Programs |
Maximum Number of
Shares that May Yet Be Purchased Under the Plans or Programs |
||||||||
|
October 1 - 31, 2018
|
100,000
|
|
$
|
25.39
|
|
100,000
|
|
914,246
|
|
|||
|
November 1 - 30, 2018
|
—
|
|
—
|
|
—
|
|
914,246
|
|
||||
|
December 1 – 31, 2018
|
50,000
|
|
21.22
|
|
50,000
|
|
864,246
|
|
||||
|
Total
|
150,000
|
|
$
|
24.00
|
|
150,000
|
|
|||||
|
1.
|
Transactions are reported as of trade dates.
|
|
2.
|
On October 23, 2013, the Corporation’s Board of Directors approved a new stock repurchase plan for the repurchase of up to 800,000 shares, or approximately 5% of the shares outstanding. On May 27, 2015, the Corporation's Board of Directors approved an increase of 1,000,000 shares available for repurchase under the Corporation's share repurchase program, or approximately 5% of the Corporation's common stock outstanding as of May 27, 2015. The repurchased shares limit does not include normal treasury activity such as purchases to fund the dividend reinvestment, employee stock purchase and equity compensation plans. The program has no scheduled expiration date and the Board of Directors has the right to suspend or discontinue the program at any time.
|
|
18
|
|
Item 6.
|
Selected Financial Data
|
|
For the Years Ended December 31,
|
|||||||||||||||||||
|
(Dollars in thousands, except per share data)
|
2018
|
2017
|
2016
|
2015
|
2014
|
||||||||||||||
|
Earnings
|
|||||||||||||||||||
|
Interest income
|
$
|
190,488
|
|
$
|
163,015
|
|
$
|
126,607
|
|
$
|
101,983
|
|
$
|
76,192
|
|
||||
|
Interest expense
|
32,426
|
|
19,839
|
|
12,382
|
|
8,065
|
|
3,996
|
|
|||||||||
|
Net interest income
|
158,062
|
|
143,176
|
|
114,225
|
|
93,918
|
|
72,196
|
|
|||||||||
|
Provision for loan and lease losses
|
20,310
|
|
9,892
|
|
4,821
|
|
3,802
|
|
3,607
|
|
|||||||||
|
Net interest income after provision for loan and lease losses
|
137,752
|
|
133,284
|
|
109,404
|
|
90,116
|
|
68,589
|
|
|||||||||
|
Noninterest income
|
60,173
|
|
59,240
|
|
55,963
|
|
52,425
|
|
48,344
|
|
|||||||||
|
Noninterest expense
|
137,239
|
|
130,713
|
|
141,981
|
|
105,515
|
|
87,254
|
|
|||||||||
|
Net income before income taxes
|
60,686
|
|
61,811
|
|
23,386
|
|
37,026
|
|
29,679
|
|
|||||||||
|
Income taxes
|
10,143
|
|
17,717
|
|
3,881
|
|
9,758
|
|
7,448
|
|
|||||||||
|
Net income
|
$
|
50,543
|
|
$
|
44,094
|
|
$
|
19,505
|
|
$
|
27,268
|
|
$
|
22,231
|
|
||||
|
Financial Condition at Year End
|
|||||||||||||||||||
|
Cash and interest-earning deposits
|
$
|
109,420
|
|
$
|
75,409
|
|
$
|
57,825
|
|
$
|
60,799
|
|
$
|
38,565
|
|
||||
|
Investment securities
|
473,306
|
|
454,082
|
|
468,518
|
|
370,760
|
|
368,630
|
|
|||||||||
|
Net loans and leases held for investment
|
3,977,210
|
|
3,598,512
|
|
3,268,387
|
|
2,161,385
|
|
1,605,963
|
|
|||||||||
|
Assets
|
4,984,347
|
|
4,554,862
|
|
4,230,528
|
|
2,879,451
|
|
2,235,321
|
|
|||||||||
|
Deposits
|
3,885,933
|
|
3,554,919
|
|
3,257,567
|
|
2,394,360
|
|
1,861,341
|
|
|||||||||
|
Borrowings
|
429,672
|
|
355,590
|
|
417,780
|
|
73,588
|
|
41,974
|
|
|||||||||
|
Shareholders' equity
|
624,133
|
|
603,374
|
|
505,209
|
|
361,574
|
|
284,554
|
|
|||||||||
|
Per Common Share Data
|
|||||||||||||||||||
|
Average shares outstanding (in thousands)
|
29,370
|
|
26,862
|
|
23,098
|
|
19,663
|
|
16,235
|
|
|||||||||
|
Earnings per share – basic
|
$
|
1.72
|
|
$
|
1.64
|
|
$
|
0.85
|
|
$
|
1.39
|
|
$
|
1.37
|
|
||||
|
Earnings per share – diluted
|
1.72
|
|
1.64
|
|
0.84
|
|
1.39
|
|
1.37
|
|
|||||||||
|
Dividends declared per share
|
0.80
|
|
0.80
|
|
0.80
|
|
0.80
|
|
0.80
|
|
|||||||||
|
Book value (at year-end)
|
21.32
|
|
20.57
|
|
19.00
|
|
18.51
|
|
17.54
|
|
|||||||||
|
Dividends declared to net income
|
46.5
|
%
|
49.6
|
%
|
94.5
|
%
|
57.4
|
%
|
58.4
|
%
|
|||||||||
|
Profitability Ratios
|
|||||||||||||||||||
|
Return on average assets
|
1.07
|
%
|
1.01
|
%
|
0.56
|
%
|
0.98
|
%
|
1.01
|
%
|
|||||||||
|
Return on average equity
|
8.26
|
|
8.37
|
|
4.46
|
|
7.58
|
|
7.74
|
|
|||||||||
|
Average equity to average assets
|
12.92
|
|
12.10
|
|
12.50
|
|
12.96
|
|
13.03
|
|
|||||||||
|
Asset Quality Ratios
|
|||||||||||||||||||
|
Nonaccrual loans and leases (including nonaccrual, troubled debt restructured loans and lease modifications) to loans and leases held for investment
|
0.65
|
%
|
0.40
|
%
|
0.55
|
%
|
0.65
|
%
|
1.07
|
%
|
|||||||||
|
Nonperforming loans and leases to loans and leases held for investment
|
0.67
|
|
0.74
|
|
0.67
|
|
0.91
|
|
1.43
|
|
|||||||||
|
Net charge-offs to average loans and leases outstanding
|
0.33
|
|
0.17
|
|
0.18
|
|
0.33
|
|
0.47
|
|
|||||||||
|
Allowance for loan and lease losses to total loans and leases held for investment
|
0.73
|
|
0.60
|
|
0.53
|
|
0.81
|
|
1.27
|
|
|||||||||
|
Allowance for loan and lease losses to total loans and leases held for investment (excluding acquired loans at period-end)
|
0.81
|
|
0.70
|
|
0.73
|
|
0.94
|
|
1.27
|
|
|||||||||
|
Allowance for loan and lease losses to nonaccrual loans and leases
|
112.04
|
|
148.48
|
|
97.67
|
|
124.29
|
|
119.18
|
|
|||||||||
|
Allowance for loan and leases losses to nonperforming loans and leases
|
108.99
|
|
80.69
|
|
78.98
|
|
89.00
|
|
88.84
|
|
|||||||||
|
19
|
Item 7.
Management’s Discussion and Analysis of Financial Condition and Results of Operations
(All dollar amounts presented in tables are in thousands, except per share data. “BP” equates to “basis points”; “N/ M” equates to “not meaningful”; “—” equates to “zero” or “doesn’t round to a reportable number”; and “N/A” equates to “not applicable.” Certain prior period amounts have been reclassified to conform to the current-year presentation.)
The information contained in this report may contain forward-looking statements, including statements relating to Univest Financial Corporation (the Corporation) and its financial condition and results of operations that involve certain risks, uncertainties and assumptions. The Corporation’s actual results may differ materially from those anticipated, expected or projected as discussed in forward-looking statements. A discussion of forward-looking statements and factors that might cause such a difference includes those discussed in Part I, “Forward-Looking Statements,” Item 1A. “Risk Factors,” as well as those within this Management’s Discussion and Analysis (MD&A) of Financial Condition and Results of Operations and elsewhere in this report.
Critical Accounting Policies
The discussion below outlines the Corporation’s critical accounting policies. For further information regarding accounting policies, refer to Note 1, “Summary of Significant Accounting Policies” included in the Notes to the Consolidated Financial Statements under Item 8 of this Form 10-K.
Management, in order to prepare the Corporation’s financial statements in conformity with U.S. generally accepted accounting principles, is required to make estimates and assumptions that affect the amounts reported in the Corporation’s financial statements. There are uncertainties inherent in making these estimates and assumptions. Certain critical accounting policies, discussed below, could materially affect the results of operations and financial position of the Corporation should changes in circumstances require a change in related estimates or assumptions. The Corporation has identified the fair value measurement of investment securities available-for-sale, reserve for loan and lease losses and purchase accounting as areas with critical accounting policies.
Fair Value Measurement of Investment Securities Available-for-Sale:
The Corporation designates its investment securities as held-to-maturity, available-for-sale or trading. Each of these designations affords different treatment in the balance sheet and statement of income for market value changes affecting securities. Should evidence emerge that indicates that management’s intent or ability to manage the securities as originally asserted is not supportable, securities in the held-to-maturity or available-for-sale designations may be re-categorized so that adjustments to either the balance sheet or statement of condition may be required.
Fair values for securities are determined using independent pricing services and market-participating brokers. The Corporation’s independent pricing service utilizes evaluated pricing models that vary by asset class and incorporate available trade, bid and other market information for structured securities, cash flows and, when available, loan performance data. Because many fixed income securities do not trade on a daily basis, the pricing service’s evaluated pricing applications apply information as applicable through processes, such as benchmarking of like securities, sector groupings, and matrix pricing, to prepare evaluations. If at any time, the pricing service determines that it does have not sufficient verifiable information to value a particular security, the Corporation will utilize valuations from another pricing service. Management has a sufficient understanding of the third party service’s valuation models, assumptions and inputs used in determining the fair value of securities to enable management to maintain an appropriate system of internal control.
Reserve for Loan and Lease Losses:
Reserves for loan and lease losses are provided using techniques that specifically identify losses on impaired loans and leases, estimate losses on pools of homogeneous loans and leases, and estimate the amount of unallocated reserve necessary to account for losses that are present in the loan and lease portfolio but not yet currently identifiable. The adequacies of these reserves are sensitive to changes in current economic conditions that may affect the ability of borrowers to make contractual payments as well as the value of the collateral committed to secure such payments. Although management believes it uses the best information available to establish the allowance for loan losses, future adjustments to the allowance for loan losses may be necessary and the Corporation’s results of operations could be adversely affected if circumstances differ substantially from the assumptions used in making the determinations. Furthermore, while management believes it has established the allowance for loan losses in conformity with GAAP, our regulators, in reviewing the loan portfolio, may request us to increase our reserve for loan and lease losses based on judgments different from ours. In addition, because future events affecting borrowers and collateral cannot be predicted with certainty, the existing reserve for loan and lease losses may not be adequate or increases may be necessary should the quality of any loans deteriorate as a result of the factors discussed above. Any material increase in the allowance for loan losses would adversely affect the Corporation's financial condition and results of operations.
|
20
|
Purchase Accounting:
The Corporation accounts for its acquisitions using the purchase accounting method. Purchase accounting requires the total purchase price to be allocated to the estimated fair values of assets acquired and liabilities assumed, including certain intangible assets that must be recognized. The Corporation completed the acquisitions of Fox Chase in July 2016 and Valley Green in January 2015, which generated significant amounts of fair value adjustments to assets and liabilities. The fair value adjustments assigned to assets and liabilities, as well as their related useful lives, are subject to judgment and estimation by management. In many cases, determining the fair value of the acquired assets and assumed liabilities requires the Corporation to estimate cash flows expected to result from those assets and liabilities and to discount those cash flows at appropriate rates of interest, which requires the utilization of significant estimates and judgment in accounting for the acquisition.
The most significant fair value determination relates to the valuation of acquired loan portfolios. Level 3 inputs are utilized to value the portfolio and include the use of present value techniques employing cash flow estimates and incorporate assumptions that marketplace participants would use in estimating fair values. Specifically, management utilizes three separate fair value analyses which a market participant would employ in estimating the total fair value adjustment, which are: 1) interest rate loan fair value analysis; 2) general credit fair value analysis; and 3) specific credit fair value analysis. For loans acquired with evidence of credit quality deterioration, the Corporation prepares a specific credit fair value adjustment. Actual performance of loans could differ from management’s initial estimates. If a loan outperforms the original fair value estimate, the difference between the original estimate and the actual performance of the loan is accreted into net interest income. Therefore, the net interest margin may initially increase due to the discount accretion. The yields on acquired loans are expected to decline as the acquired loan portfolio pays down or matures and the discount decreases. This could result in higher net interest margins and interest income in current periods and lower net interest rate margins and lower interest income in future periods. For more information, see Note 1, “Summary of Significant Accounting Policies" included in the Notes to the Consolidated Financial Statements included herein under Item 8.
Valuation of intangible assets is generally based on the estimated cash flows related to those assets, while the initial value assigned to goodwill is the residual of the purchase price over the fair value of all identifiable assets acquired and liabilities assumed. The most significant other intangible asset is the core deposit intangible (CDI). In order to initially record the fair value of the CDI, the income approach is used. Estimates are based upon financial, economic, market and other conditions that exist at the time of the acquisition to develop the projected market interest rate, future interest and maintenance costs, and attrition rates. Useful lives are determined based on the expected future period of the benefit of the asset or liability, the assessment of which considers various characteristics of the asset or liability, including the historical cash flows.
Readers of the Corporation’s financial statements should be aware that the estimates and assumptions used in the Corporation’s current financial statements may need to be updated in future financial presentations for changes in circumstances, business or economic conditions in order to fairly represent the condition of the Corporation at that time.
General
The Corporation earns revenues primarily from the margins and fees generated from the lending and depository services to customers as well as fee-based income from trust, insurance, mortgage banking and investment services to customers. The Corporation seeks to achieve adequate and reliable earnings through business growth while maintaining adequate levels of capital and liquidity and limiting its exposure to credit and interest rate risk to Board of Directors approved levels. Growth is pursued through expansion of current customer relationships and development of additional relationships with new offices and strategic acquisitions.
The principal component of earnings for the Corporation is net interest income, the income earned on loans and investments less the cost of interest-bearing liabilities. The net interest margin, the ratio of net interest income to average earning assets, is impacted by several factors including market interest rates, economic conditions, loan and lease demand, and deposit activity. As interest rates increase, fixed-rate assets that banks hold will tend to decrease in value; conversely, as interest rates decline, fixed-rate assets that banks hold will tend to increase in value. The Corporation is in a slightly asset sensitive position and net interest income is projected to increase in a rising rate environment, however, actual results could be materially different than modeled, due to numerous factors influencing interest rates earned on new loans and investments as well as rates paid on new and existing deposits and new borrowings.
|
21
|
Executive Overview
The Corporation’s consolidated net income, earnings per share and return on average assets and average equity were as follows:
|
|
For the Years Ended December 31,
|
Amount of Change
|
Percent Change
|
||||||||||||||||||||||
|
(Dollars in thousands, except per share data)
|
2018
|
2017
|
2016
|
2018 to 2017
|
2017 to 2016
|
2018 to 2017
|
2017 to 2016
|
||||||||||||||||||
|
Net income
|
$
|
50,543
|
|
$
|
44,094
|
|
$
|
19,505
|
|
$
|
6,449
|
|
$
|
24,589
|
|
14.6
|
%
|
126.1
|
%
|
||||||
|
Net income per share:
|
|||||||||||||||||||||||||
|
Basic
|
$
|
1.72
|
|
$
|
1.64
|
|
$
|
0.85
|
|
$
|
0.08
|
|
$
|
0.79
|
|
4.9
|
|
92.9
|
|
||||||
|
Diluted
|
1.72
|
|
1.64
|
|
0.84
|
|
0.08
|
|
0.80
|
|
4.9
|
|
95.2
|
|
|||||||||||
|
Return on average assets
|
1.07
|
%
|
1.01
|
%
|
0.56
|
%
|
6 BP
|
|
45 BP
|
|
5.9
|
|
80.4
|
|
|||||||||||
|
Return on average equity
|
8.26
|
|
8.37
|
|
4.46
|
|
(11 BP)
|
|
391 BP
|
|
(1.3
|
)
|
87.7
|
|
|||||||||||
2018
versus
2017
The Corporation reported net income of
$50.5 million
, or
$1.72
diluted earnings per share, for
2018
compared to net income of
$44.1 million
, or
$1.64
diluted earnings per share for
2017
. The financial results for the year ended December 31, 2018 included a pre-tax charge to the provision for loan and lease losses of $10.9 million (after-tax charge of $8.6 million) which represented $0.29 diluted earnings per share, related to fraudulent activities by employees of a borrower. In addition, the financial results for the year ended
December 31, 2018
included tax-free bank owned life insurance (BOLI) death benefit of $446 thousand during the second quarter of 2018, which represented $0.02 diluted earnings per share, offset by restructuring costs related to financial center closures of $451 thousand, net of tax, or $0.02 diluted earnings per share, recognized in the first quarter of 2018. There were no restructuring costs during the year ended
December 31, 2017
. The financial results for the year ended
December 31, 2018
also included a reduction in the Corporation's statutory federal income tax rate from 35% to 21% effective January 1, 2018 in accordance with the Tax Cuts and Jobs Act of 2017 (TCJA).
The financial results for the year ended December 31, 2017 included a revaluation of the Corporation’s net deferred tax asset associated with the passage of the TCJA. The revaluation, which was recorded as additional income tax expense, was $1.1 million, or $0.04 diluted earnings per share in 2017. The financial results for the year ended
December 31, 2017
included a tax-free BOLI death benefit of $889 thousand recognized in the second quarter of 2017, which represented $0.03 diluted earnings per share.
2017
versus
2016
The Corporation reported net income of $44.1 million, or $1.64 diluted earnings per share, for 2017 compared to net income of $19.5 million, or $0.84 diluted earnings per share, for 2016. The financial results for the year ended December 31, 2017 included a re-measurement of the Corporation’s net deferred tax asset associated with the passage of the Tax Cuts and Jobs Act of 2017. The re-measurement, which was recorded as additional income tax expense during the fourth quarter of 2017, was $1.1 million, or $0.04 diluted earnings per share. The financial results for the year ended December 31, 2017 also included a tax-free bank owned life insurance death benefit of $889 thousand recognized in the second quarter of 2017, which represented $0.03 diluted earnings per share for the year ended December 31, 2017.
The financial results for the year ended December 31, 2016 included acquisition and integration costs related to the acquisition of Fox Chase plus restructuring costs related to facility closures and staffing rationalization of $11.8 million, net of tax, or $0.51 diluted earnings per share. There were no acquisition, integration costs or restructuring costs during the year ended December 31, 2017. The results for the year ended December 31, 2016 also included a charge of $1.2 million, net of tax, or $0.05 diluted earnings per share related to the Corporation’s agreement to settle its future obligations related to the acquisition of Girard Partners.
In December 2017, the Corporation completed its public offering of 2,645,000 shares of common stock at a price of $28.25 per share, which resulted in an increase in shareholders' equity of $70.5 million. In July 2016, the Corporation issued 6,857,529 shares of common stock related to the Fox Chase acquisition, which resulted in an increase in shareholders' equity of $144.1 million.
Results of Operations
The Corporation acquired Fox Chase on July 1, 2016. The comparative results of operations for 2017 versus 2016 include a full year of operations for the combined entities for the year ended December 31, 2017 and six months of combined operations for the year ended December 31, 2016.
|
22
|
Net Interest Income
Table 1 presents a summary of the Corporation’s average balances, tax-equivalent interest income, interest expense, the tax-equivalent yields earned on average assets, the cost of average liabilities, and shareholders’ equity on a tax-equivalent basis for the years ended
December 31, 2018
,
2017
and
2016
. The tax-equivalent net interest margin is tax-equivalent net interest income as a percentage of average interest-earning assets. The tax-equivalent net interest spread represents the weighted average tax-equivalent yield on interest-earning assets less the weighted average cost of interest-bearing liabilities. The effect of net interest-free funding sources represents the effect on the net interest margin of net funding provided by noninterest-earning assets, noninterest-bearing liabilities and shareholders’ equity. Table 2 analyzes the changes in the tax-equivalent net interest income for the periods broken down by their rate and volume components.
Table 1, Table 2, and the interest income and net interest income analysis contains tax-equivalent financial information and measures determined by methods other than in accordance with U.S. GAAP. The management of the Corporation uses this non-GAAP financial information and measures in its analysis of the Corporation's performance. This financial information and measures should not be considered a substitute for GAAP basis financial information or measures nor should they be viewed as a substitute for operating results determined in accordance with GAAP. Management believes the presentation of the non-GAAP financial information and measures provide useful information that is essential to a proper understanding of the financial results of the Corporation.
The statutory federal tax rate utilized in the respective tables and analyses was 21% for the year ended December 31, 2018 and 35% for the years ended December 31, 2017 and December 31, 2016.
2018
versus
2017
Reported net interest income for the year ended December 31, 2018 was
$158.1 million
,
an increase
of
$14.9 million
, or
10.4%
, from the prior year. Net interest income, on a tax-equivalent basis, for the year ended
December 31, 2018
was
$160.7 million
,
an increase
of
$11.9 million
, or
8.0%
, from the prior year. The increase in reported and tax-equivalent net interest income was primarily due to the growth in average loans of 10.4%, growth in interest free funding and 16.1% growth in average equity. The net interest margin on a tax-equivalent basis for the year ended
December 31, 2018
was
3.72%
compared to
3.78%
for
2017
which incorporates the utilization of a 21% tax rate for 2018 and 35% for 2017. The favorable impact of purchase accounting accretion was two basis points ($1.0 million) for the year ended December 31, 2018, compared to eight basis points ($3.0 million) for 2017.
2017
versus
2016
Net interest income on a tax-equivalent basis for the year ended December 31, 2017 was $148.8 million, an increase of $29.1 million, or 24.3%, from the prior year. The net interest margin on a tax-equivalent basis for the year ended December 31, 2017 was 3.78% compared to 3.82% for 2016. The increase in net interest income on a tax-equivalent basis was mainly due to the impact of the Fox Chase acquisition, which occurred on July 1, 2016, organic loan growth and increases in loan yields partially offset by deposit growth and higher deposit costs. The favorable impact of purchase accounting accretion was eight basis points ($3.0 million) for the year ended December 31, 2017, compared to nine basis points ($2.8 million) for 2016.
|
23
|
Table 1—Average Balances and Interest Rates—Tax-Equivalent Basis
|
|
For the Years Ended December 31,
|
|||||||||||||||||||||||||||||||
|
|
2018
|
2017
|
2016
|
|||||||||||||||||||||||||||||
|
(Dollars in thousands)
|
Average
Balance |
Income/
Expense |
Average
Rate |
Average
Balance |
Income/
Expense |
Average
Rate |
Average
Balance |
Income/
Expense |
Average
Rate |
|||||||||||||||||||||||
|
Assets:
|
||||||||||||||||||||||||||||||||
|
Interest-earning deposits with other banks
|
$
|
56,984
|
|
$
|
1,101
|
|
1.93
|
%
|
$
|
26,128
|
|
$
|
280
|
|
1.07
|
%
|
$
|
13,438
|
|
$
|
61
|
|
0.45
|
%
|
||||||||
|
U.S. government obligations
|
22,930
|
|
364
|
|
1.59
|
|
30,638
|
|
423
|
|
1.38
|
|
54,220
|
|
649
|
|
1.20
|
|
||||||||||||||
|
Obligations of states and political
subdivisions (1) |
69,842
|
|
2,330
|
|
3.34
|
|
82,487
|
|
3,498
|
|
4.24
|
|
97,325
|
|
4,172
|
|
4.29
|
|
||||||||||||||
|
Other debt and equity securities
|
363,840
|
|
9,024
|
|
2.48
|
|
350,527
|
|
6,920
|
|
1.97
|
|
254,508
|
|
4,731
|
|
1.86
|
|
||||||||||||||
|
Federal funds sold and other earning assets
|
30,786
|
|
1,965
|
|
6.38
|
|
27,893
|
|
1,500
|
|
5.38
|
|
16,370
|
|
790
|
|
4.83
|
|
||||||||||||||
|
Total interest-earning deposits, investments, federal funds sold and other earning assets
|
544,382
|
|
14,784
|
|
2.72
|
|
517,673
|
|
12,621
|
|
2.44
|
|
435,861
|
|
10,403
|
|
2.39
|
|
||||||||||||||
|
Commercial, financial and agricultural loans
|
793,028
|
|
39,156
|
|
4.94
|
|
749,563
|
|
33,278
|
|
4.44
|
|
552,322
|
|
21,964
|
|
3.98
|
|
||||||||||||||
|
Real estate—commercial and construction loans
|
1,689,983
|
|
78,498
|
|
4.64
|
|
1,519,883
|
|
68,166
|
|
4.48
|
|
1,146,293
|
|
52,232
|
|
4.56
|
|
||||||||||||||
|
Real estate—residential loans
|
870,846
|
|
41,270
|
|
4.74
|
|
765,493
|
|
34,563
|
|
4.52
|
|
633,886
|
|
28,101
|
|
4.43
|
|
||||||||||||||
|
Loans to individuals
|
30,242
|
|
1,866
|
|
6.17
|
|
28,050
|
|
1,636
|
|
5.83
|
|
30,501
|
|
1,654
|
|
5.42
|
|
||||||||||||||
|
Municipal loans and leases
(1)
|
316,280
|
|
12,049
|
|
3.81
|
|
282,475
|
|
12,856
|
|
4.55
|
|
261,057
|
|
11,556
|
|
4.43
|
|
||||||||||||||
|
Lease financings
|
76,561
|
|
5,514
|
|
7.20
|
|
75,383
|
|
5,533
|
|
7.34
|
|
75,914
|
|
6,168
|
|
8.12
|
|
||||||||||||||
|
Gross loans and leases
|
3,776,940
|
|
178,353
|
|
4.72
|
|
3,420,847
|
|
156,032
|
|
4.56
|
|
2,699,973
|
|
121,675
|
|
4.51
|
|
||||||||||||||
|
Total interest-earning assets
|
4,321,322
|
|
193,137
|
|
4.47
|
|
3,938,520
|
|
168,653
|
|
4.28
|
|
3,135,834
|
|
132,078
|
|
4.21
|
|
||||||||||||||
|
Cash and due from banks
|
45,979
|
|
44,424
|
|
37,050
|
|
||||||||||||||||||||||||||
|
Reserve for loan and lease losses
|
(25,154
|
)
|
(20,219
|
)
|
(17,147
|
)
|
||||||||||||||||||||||||||
|
Premises and equipment, net
|
61,006
|
|
64,583
|
|
53,036
|
|
||||||||||||||||||||||||||
|
Other assets
|
334,619
|
|
329,232
|
|
287,239
|
|
||||||||||||||||||||||||||
|
Total assets
|
$
|
4,737,772
|
|
$
|
4,356,540
|
|
$
|
3,496,012
|
|
|||||||||||||||||||||||
|
Liabilities:
|
||||||||||||||||||||||||||||||||
|
Interest-bearing checking deposits
|
$
|
461,676
|
|
1,924
|
|
0.42
|
|
$
|
437,678
|
|
527
|
|
0.12
|
|
$
|
386,176
|
|
362
|
|
0.09
|
|
|||||||||||
|
Money market savings
|
764,777
|
|
9,137
|
|
1.19
|
|
582,703
|
|
3,390
|
|
0.58
|
|
414,121
|
|
1,540
|
|
0.37
|
|
||||||||||||||
|
Regular savings
|
798,332
|
|
2,357
|
|
0.30
|
|
847,510
|
|
2,089
|
|
0.25
|
|
714,809
|
|
1,052
|
|
0.15
|
|
||||||||||||||
|
Time deposits
|
601,674
|
|
8,768
|
|
1.46
|
|
566,079
|
|
5,271
|
|
0.93
|
|
512,557
|
|
4,261
|
|
0.83
|
|
||||||||||||||
|
Total time and interest-bearing deposits
|
2,626,459
|
|
22,186
|
|
0.84
|
|
2,433,970
|
|
11,277
|
|
0.46
|
|
2,027,663
|
|
7,215
|
|
0.36
|
|
||||||||||||||
|
Short-term borrowings
|
144,312
|
|
2,420
|
|
1.68
|
|
105,552
|
|
904
|
|
0.86
|
|
103,238
|
|
748
|
|
0.72
|
|
||||||||||||||
|
Long-term debt
|
150,032
|
|
2,777
|
|
1.85
|
|
186,109
|
|
2,621
|
|
1.41
|
|
60,965
|
|
549
|
|
0.90
|
|
||||||||||||||
|
Subordinated notes
|
94,451
|
|
5,043
|
|
5.34
|
|
94,208
|
|
5,037
|
|
5.35
|
|
71,851
|
|
3,870
|
|
5.39
|
|
||||||||||||||
|
Total borrowings
|
388,795
|
|
10,240
|
|
2.63
|
|
385,869
|
|
8,562
|
|
2.22
|
|
236,054
|
|
5,167
|
|
2.19
|
|
||||||||||||||
|
Total interest-bearing liabilities
|
3,015,254
|
|
32,426
|
|
1.08
|
|
2,819,839
|
|
19,839
|
|
0.70
|
|
2,263,717
|
|
12,382
|
|
0.55
|
|
||||||||||||||
|
Noninterest-bearing deposits
|
1,069,805
|
|
973,253
|
|
751,592
|
|
||||||||||||||||||||||||||
|
Accrued expenses and other liabilities
|
40,516
|
|
36,361
|
|
43,605
|
|
||||||||||||||||||||||||||
|
Total liabilities
|
4,125,575
|
|
3,829,453
|
|
3,058,914
|
|
||||||||||||||||||||||||||
|
Shareholders’ Equity:
|
||||||||||||||||||||||||||||||||
|
Common stock
|
157,784
|
|
145,564
|
|
127,509
|
|
||||||||||||||||||||||||||
|
Additional paid-in capital
|
291,148
|
|
235,578
|
|
175,609
|
|
||||||||||||||||||||||||||
|
Retained earnings and other equity
|
163,265
|
|
145,945
|
|
133,980
|
|
||||||||||||||||||||||||||
|
Total shareholders’ equity
|
612,197
|
|
527,087
|
|
437,098
|
|
||||||||||||||||||||||||||
|
Total liabilities and shareholders’ equity
|
$
|
4,737,772
|
|
$
|
4,356,540
|
|
$
|
3,496,012
|
|
|||||||||||||||||||||||
|
Net interest income
|
$
|
160,711
|
|
$
|
148,814
|
|
$
|
119,696
|
|
|||||||||||||||||||||||
|
Net interest spread
|
3.39
|
|
3.58
|
|
3.66
|
|
||||||||||||||||||||||||||
|
Effect of net interest-free funding sources
|
0.33
|
|
0.20
|
|
0.16
|
|
||||||||||||||||||||||||||
|
Net interest margin
|
3.72
|
%
|
3.78
|
%
|
3.82
|
%
|
||||||||||||||||||||||||||
|
Ratio of average interest-earning assets to average interest-bearing liabilities
|
143.32
|
%
|
139.67
|
%
|
138.53
|
%
|
||||||||||||||||||||||||||
(1) The average rate for these categories utilizes a statutory federal tax rate of 21% for 2018 and 35% for 2017 and 2016, which reduces the reported Average Rate for 2018 as compared to 2017 and 2016.
Notes: For rate calculation purposes, average loan and lease categories include deferred fees and costs, purchase accounting adjustments, and unearned discount.
Nonaccrual loans and leases have been included in the average loan and lease balances.
Loans held for sale have been included in the average loan balances.
Tax-equivalent amounts for the years ended
December 31, 2018
,
2017
and
2016
have been calculated using the Corporation’s federal applicable rate of 21%, 35% and 35%, respectively.
|
24
|
Table 2—Analysis of Changes in Net Interest Income
The rate-volume variance analysis set forth in the table below compares changes in tax-equivalent net interest income for the year ended
December 31, 2018
compared to
2017
and for the year ended
December 31, 2017
compared to
2016
, indicated by their rate and volume components. The change in interest income/expense due to both volume and rate has been allocated proportionately.
|
|
For the Years Ended December 31, 2018 Versus 2017
|
For the Years Ended December 31, 2017 Versus 2016
|
|||||||||||||||||||||
|
(Dollars in thousands)
|
Volume
Change |
Rate
Change |
Total
|
Volume
Change |
Rate
Change |
Total
|
|||||||||||||||||
|
Interest income:
|
|||||||||||||||||||||||
|
Interest-earning deposits with other banks
|
$
|
488
|
|
$
|
333
|
|
$
|
821
|
|
$
|
89
|
|
$
|
130
|
|
$
|
219
|
|
|||||
|
U.S. government obligations
|
(117
|
)
|
58
|
|
(59
|
)
|
(313
|
)
|
87
|
|
(226
|
)
|
|||||||||||
|
Obligations of states and political subdivisions
|
(490
|
)
|
(678
|
)
|
(1,168
|
)
|
(626
|
)
|
(48
|
)
|
(674
|
)
|
|||||||||||
|
Other debt and equity securities
|
269
|
|
1,835
|
|
2,104
|
|
1,892
|
|
297
|
|
2,189
|
|
|||||||||||
|
Federal funds sold and other earning assets
|
167
|
|
298
|
|
465
|
|
611
|
|
99
|
|
710
|
|
|||||||||||
|
Interest on deposits, investments, federal funds sold and other earning assets
|
317
|
|
1,846
|
|
2,163
|
|
1,653
|
|
565
|
|
2,218
|
|
|||||||||||
|
Commercial, financial and agricultural loans
|
1,998
|
|
3,880
|
|
5,878
|
|
8,547
|
|
2,767
|
|
11,314
|
|
|||||||||||
|
Real estate—commercial and construction loans
|
7,832
|
|
2,500
|
|
10,332
|
|
16,860
|
|
(926
|
)
|
15,934
|
|
|||||||||||
|
Real estate—residential loans
|
4,955
|
|
1,752
|
|
6,707
|
|
5,886
|
|
576
|
|
6,462
|
|
|||||||||||
|
Loans to individuals
|
132
|
|
98
|
|
230
|
|
(138
|
)
|
120
|
|
(18
|
)
|
|||||||||||
|
Municipal loans and leases
|
1,430
|
|
(2,237
|
)
|
(807
|
)
|
978
|
|
322
|
|
1,300
|
|
|||||||||||
|
Lease financings
|
86
|
|
(105
|
)
|
(19
|
)
|
(43
|
)
|
(592
|
)
|
(635
|
)
|
|||||||||||
|
Interest and fees on loans and leases
|
16,433
|
|
5,888
|
|
22,321
|
|
32,090
|
|
2,267
|
|
34,357
|
|
|||||||||||
|
Total interest income
|
16,750
|
|
7,734
|
|
24,484
|
|
33,743
|
|
2,832
|
|
36,575
|
|
|||||||||||
|
Interest expense:
|
|||||||||||||||||||||||
|
Interest-bearing checking deposits
|
30
|
|
1,367
|
|
1,397
|
|
47
|
|
118
|
|
165
|
|
|||||||||||
|
Money market savings
|
1,316
|
|
4,431
|
|
5,747
|
|
773
|
|
1,077
|
|
1,850
|
|
|||||||||||
|
Regular savings
|
(130
|
)
|
398
|
|
268
|
|
226
|
|
811
|
|
1,037
|
|
|||||||||||
|
Time deposits
|
347
|
|
3,150
|
|
3,497
|
|
469
|
|
541
|
|
1,010
|
|
|||||||||||
|
Interest on time and interest-bearing deposits
|
1,563
|
|
9,346
|
|
10,909
|
|
1,515
|
|
2,547
|
|
4,062
|
|
|||||||||||
|
Short-term borrowings
|
421
|
|
1,095
|
|
1,516
|
|
16
|
|
140
|
|
156
|
|
|||||||||||
|
Long-term debt
|
(568
|
)
|
724
|
|
156
|
|
1,624
|
|
448
|
|
2,072
|
|
|||||||||||
|
Subordinated notes
|
14
|
|
(8
|
)
|
6
|
|
1,196
|
|
(29
|
)
|
1,167
|
|
|||||||||||
|
Interest on borrowings
|
(133
|
)
|
1,811
|
|
1,678
|
|
2,836
|
|
559
|
|
3,395
|
|
|||||||||||
|
Total interest expense
|
1,430
|
|
11,157
|
|
12,587
|
|
4,351
|
|
3,106
|
|
7,457
|
|
|||||||||||
|
Net interest income
|
$
|
15,320
|
|
$
|
(3,423
|
)
|
$
|
11,897
|
|
$
|
29,392
|
|
$
|
(274
|
)
|
$
|
29,118
|
|
|||||
|
25
|
Interest Income
2018
versus
2017
Interest income on a tax-equivalent basis for the year ended
December 31, 2018
was
$193.1 million
,
an increase
of
$24.5 million
, or
14.5%
, from
2017
. The increase in interest income (tax-equivalent) was primarily due to organic loan growth in commercial real estate, commercial business and residential real estate loans. In addition, loan yields increased as the Federal Reserve increased interest rates 100 basis points in 2018 and 75 basis points in 2017. The favorable impact of purchase accounting accretion on interest-earning assets was one basis point ($383 thousand) for 2018, compared to a favorable impact of two basis points ($888 thousand) for 2017.
2017
versus
2016
Interest income on a tax-equivalent basis for the year ended December 31, 2017 was $168.7 million, an increase of $36.6 million, or 27.7%, from 2016. The increase was mainly due to the impact of the Fox Chase acquisition and organic loan growth in commercial real estate, commercial business and residential real estate loans. In addition, loan yields increased slightly as the Federal Reserve increased interest rates a total of 100 basis points collectively in the fourth quarter of 2016 and 2017. The favorable impact of purchase accounting accretion on interest-earning assets was two basis points ($888 thousand) for 2017, compared to a favorable impact of five basis points ($1.4 million) for 2016.
Interest Expense
2018
versus
2017
Interest expense for the year ended
December 31, 2018
was
$32.4 million
,
an increase
of
$12.6 million
, or 63.4%, from 2017. The increase was primarily due to higher deposit and borrowing costs, which were impacted by the Federal Reserve interest rate increases in 2017 and 2018. The favorable impact of purchase accounting amortization on interest-bearing liabilities was two basis points ($654 thousand) for 2018, compared to a favorable impact of eight basis points ($2.1 million) for 2017.
2017
versus
2016
Interest expense for the year ended December 31, 2017 was $19.8 million, an increase of $7.5 million, or 60.2%, from 2016. The increase was primarily due to the impact of the Fox Chase acquisition, organic deposit growth and higher deposit costs. Deposits costs were impacted by the Federal Reserve interest rate increases in the fourth quarter of 2016 and 2017. The favorable impact of purchase accounting amortization on interest-bearing liabilities was eight basis points ($2.1 million) for 2017, compared to a favorable impact of six basis points ($1.4 million) for 2016.
Provision for Loan and Lease Losses
The provision for loan and leases losses for the years ended December 31,
2018
,
2017
, and
2016
was
$20.3 million
,
$9.9 million
, and
$4.8 million
, respectively. Net loan and lease charge-offs for the years ended December 31,
2018
,
2017
, and
2016
were $12.5 million, $5.8 million and $5.0 million, respectively. The increase in both the provision for loan and lease losses and loan and lease charge-offs in 2018 was primarily due to a commercial loan net charge-off of $10.9 million previously discussed in the Executive Overview.
The provision for loan and lease losses increased in 2017 due to the increased charge-offs and a $690.5 million increase in originated loans. During 2017, the Corporation charged-off $2.8 million and recognized $2.8 million in provision for loan and lease losses related to $5.0 million of software leases under a vendor referral program.
|
26
|
Noninterest Income
The following table presents noninterest income for the years ended
December 31, 2018
,
2017
and
2016
:
|
|
For the Years Ended December 31,
|
$ Change
|
% Change
|
||||||||||||||||||||||
|
(Dollars in thousands)
|
2018
|
2017
|
2016
|
2018 to 2017
|
2017 to 2016
|
2018 to 2017
|
2017 to 2016
|
||||||||||||||||||
|
Trust fee income
|
$
|
7,882
|
|
$
|
8,055
|
|
$
|
7,741
|
|
$
|
(173
|
)
|
$
|
314
|
|
(2.1
|
)%
|
4.1
|
%
|
||||||
|
Service charges on deposit accounts
|
5,632
|
|
5,482
|
|
4,691
|
|
150
|
|
791
|
|
2.7
|
|
16.9
|
|
|||||||||||
|
Investment advisory commission and fee income
|
15,098
|
|
13,454
|
|
11,424
|
|
1,644
|
|
2,030
|
|
12.2
|
|
17.8
|
|
|||||||||||
|
Insurance commission and fee income
|
15,658
|
|
14,788
|
|
14,603
|
|
870
|
|
185
|
|
5.9
|
|
1.3
|
|
|||||||||||
|
Other service fee income
|
9,332
|
|
8,656
|
|
7,836
|
|
676
|
|
820
|
|
7.8
|
|
10.5
|
|
|||||||||||
|
Bank owned life insurance income
|
3,174
|
|
3,988
|
|
2,931
|
|
(814
|
)
|
1,057
|
|
(20.4
|
)
|
36.1
|
|
|||||||||||
|
Net gain on sales of investment securities
|
10
|
|
48
|
|
518
|
|
(38
|
)
|
(470
|
)
|
(79.2
|
)
|
(90.7
|
)
|
|||||||||||
|
Net gain on mortgage banking activities
|
3,125
|
|
4,023
|
|
6,027
|
|
(898
|
)
|
(2,004
|
)
|
(22.3
|
)
|
(33.3
|
)
|
|||||||||||
|
Other income
|
262
|
|
746
|
|
192
|
|
(484
|
)
|
554
|
|
(64.9
|
)
|
N/M
|
||||||||||||
|
Total noninterest income
|
$
|
60,173
|
|
$
|
59,240
|
|
$
|
55,963
|
|
$
|
933
|
|
$
|
3,277
|
|
1.6
|
%
|
5.9
|
%
|
||||||
2018
versus
2017
Noninterest income for the year ended
December 31, 2018
was
$60.2 million
,
an increase
of
$933 thousand
, or
1.6%
, compared to 2017. Investment advisory commission and fee income increased $1.6 million, or 12.2%, for the year ended December 31, 2018, primarily due to new customer relationships and favorable market performance for the majority of 2018. Insurance commission and fee income increased $870 thousand, or 5.9%, for the year ended December 31, 2018, primarily due to an increase in group life and health premiums and an increase in contingent commission income of $371 thousand, which is largely recognized in the first quarter of the year. Other service fee income increased $676 thousand, or 7.8%, for the year ended December 31, 2018, primarily due to increases in debit card interchange income, mortgage servicing fees and human resource and payroll consulting services within the insurance line of business. Service charges on deposit accounts increased $150 thousand, or 2.7%, for the year ended December 31, 2018, primarily due to increased fee income on cash management accounts.
BOLI income decreased $814 thousand for the year ended December 31, 2018 primarily due to proceeds from death benefits of $446 thousand in 2018 as compared to $889 thousand in 2017 and a decrease in value of our non-qualified annuity portfolio of $109 thousand in 2018 compared to an increase of $343 thousand in 2017. The net gain on mortgage banking decreased $898 thousand, or 22.3%, for the year ended December 31, 2018, primarily due to a decrease in refinance mortgage volume, a shortage of housing supply and the Bank retaining, on balance-sheet, a higher percentage of its mortgage originations. Such on balance-sheet loans are predominantly hybrid adjustable-rate mortgages. Other income decreased $484 thousand, or 64.9%, for the year ended December 31, 2018, primarily due to a net loss of $355 thousand related to valuations and sales of other real estate owned and sales of closed branches as compared to a net loss of $31 thousand of such assets in the prior year.
2017
versus
2016
Noninterest income for the year ended December 31, 2017 was $59.2 million, an increase of $3.3 million, or 5.9%, compared to 2016. Trust fee income increased $314 thousand, or 4.1%, for the year ended December 31, 2017 primarily due to an increase in trust assets under management during 2017. Service charges on deposits increased $791 thousand, or 16.9%, for the year ended December 31, 2017 primarily due to fees on deposit accounts acquired from Fox Chase. Investment advisory commission and fee income increased $2.0 million, or 17.8%, for the year ended December 31, 2017 primarily due to new customer relationships and favorable market performance during 2017. Insurance commission and fee income increased $185 thousand, or 1.3%, for the year ended December 31, 2017. Insurance contingent commission income was $1.1 million for the year ended December 31, 2017, a decrease of $363 thousand from the year ended December 31, 2016. Excluding the decrease in contingent commission income, insurance commission and fee income increased $548 thousand or 4.2%. Other service fee income increased $820 thousand, or 10.5%, primarily due to interchange fee income, partially related to Fox Chase customers and an increase in mortgage servicing fee income mainly due to higher volume and lower amortization expense as a result of reduced loan prepayments. BOLI income increased $1.1 million for the year ended December 31, 2017, primarily due to proceeds from BOLI death benefits of $889 thousand
recognized in the second quarter of 2017 and policies acquired from Fox Chase. BOLI death benefits of $450 thousand were recognized in 2016. Other income increased $554 thousand for the year ended December 31, 2017, mainly due to an increase in swap fee income of $308 thousand and an increase in net gains on sales of other real estate owned of $524 thousand partially offset by the loss on the sale of a closed Fox Chase branch of $309 thousand.
|
27
|
These increases in noninterest income were partially offset by a decrease in the net gain on sale of securities of $470 thousand for the year ended December 31, 2017. In addition, the net gain on mortgage banking decreased $2.0 million, or 33.3%, for the year ended December 31, 2017 primarily due to a decrease in mortgage refinance volume and a shortage of housing supply.
Noninterest Expense
The following table presents noninterest expense for the years ended
December 31, 2018
,
2017
and
2016
:
|
|
For the Years Ended December 31,
|
$ Change
|
% Change
|
||||||||||||||||||||||
|
(Dollars in thousands)
|
2018
|
2017
|
2016
|
2018 to 2017
|
2017 to 2016
|
2018 to 2017
|
2017 to 2016
|
||||||||||||||||||
|
Salaries, benefits and commissions
|
$
|
80,609
|
|
$
|
75,992
|
|
$
|
69,244
|
|
$
|
4,617
|
|
$
|
6,748
|
|
6.1
|
%
|
9.7
|
%
|
||||||
|
Net occupancy
|
10,260
|
|
10,433
|
|
9,638
|
|
(173
|
)
|
795
|
|
(1.7
|
)
|
8.2
|
|
|||||||||||
|
Equipment
|
4,146
|
|
4,118
|
|
3,489
|
|
28
|
|
629
|
|
0.7
|
|
18.0
|
|
|||||||||||
|
Data processing
|
9,014
|
|
8,500
|
|
6,981
|
|
514
|
|
1,519
|
|
6.0
|
|
21.8
|
|
|||||||||||
|
Professional fees
|
5,391
|
|
5,325
|
|
4,547
|
|
66
|
|
778
|
|
1.2
|
|
17.1
|
|
|||||||||||
|
Marketing and advertising
|
1,800
|
|
1,485
|
|
2,015
|
|
315
|
|
(530
|
)
|
21.2
|
|
(26.3
|
)
|
|||||||||||
|
Deposit insurance premiums
|
1,836
|
|
1,636
|
|
1,713
|
|
200
|
|
(77
|
)
|
12.2
|
|
(4.5
|
)
|
|||||||||||
|
Intangible expenses
|
2,166
|
|
2,582
|
|
5,528
|
|
(416
|
)
|
(2,946
|
)
|
(16.1
|
)
|
(53.3
|
)
|
|||||||||||
|
Acquisition-related costs
|
—
|
|
—
|
|
10,257
|
|
—
|
|
(10,257
|
)
|
—
|
|
N/M
|
||||||||||||
|
Integration costs
|
—
|
|
—
|
|
5,667
|
|
—
|
|
(5,667
|
)
|
—
|
|
N/M
|
||||||||||||
|
Restructuring charges
|
571
|
|
—
|
|
1,731
|
|
571
|
|
(1,731
|
)
|
N/M
|
N/M
|
|||||||||||||
|
Other expense
|
21,446
|
|
20,642
|
|
21,171
|
|
804
|
|
(529
|
)
|
3.9
|
|
(2.5
|
)
|
|||||||||||
|
Total noninterest expense
|
$
|
137,239
|
|
$
|
130,713
|
|
$
|
141,981
|
|
$
|
6,526
|
|
$
|
(11,268
|
)
|
5.0
|
%
|
(7.9
|
)%
|
||||||
2018
versus
2017
Noninterest expense for the year ended
December 31, 2018
was
$137.2 million
,
an increase
of
$6.5 million
, or
5.0%
,
compared to 2017. Salaries, benefits and commissions increased $4.6 million, or 6.1%, for the year ended December 31, 2018, primarily attributable to additional staff hired to support revenue generation across all business lines, expansion of our financial center footprint in Lancaster County and annual merit increases. Data processing expense increased $514 thousand, or 6.0%, for the year ended December 31, 2018 primarily due to increased investments in customer relationship management software, internal infrastructure improvements and outsourced data processing solutions. Marketing and advertising expense increased $315 thousand, or 21.2%, for the year ended December 31, 2018 primarily related to deposit product campaigns and expenses related to re-branding our wealth management division during the fourth quarter of 2018. Other expense increased $804 thousand, or 3.9%, for the year ended December 31, 2018 primarily due to increases in Bank shares tax, loan processing expenses and increased corporate development expenses. Restructuring costs related to financial center closures and staffing rationalization were $571 thousand during the first quarter of 2018. There were no restructuring costs during the year ended December 31, 2017.
2017
versus
2016
Noninterest expense for the year ended December 31, 2017 was $130.7 million, a decrease of $11.3 million, or 7.9%
,
compared to 2016. Acquisition and integration costs related to the Fox Chase acquisition and restructuring costs were $17.7 million for the year ended December 31, 2016. There were no acquisition, integration costs or restructuring costs during the year ended December 31, 2017. In addition, intangible expense decreased $2.9 million for the year ended December 31, 2017 primarily as a result of the settlement of the Girard Partners acquisition earn-out in the fourth quarter of 2016 and the conclusion of the earn-out period for the Sterner Insurance Associates acquisition, which resulted in a reversal of a prior accrual of $303 thousand during the second quarter of 2017.
These decreases were partially offset by the following increases in noninterest expense for the year ended December 31, 2017. Salaries, benefits and commissions increased $6.7 million, or 9.7%, for the year ended December 31, 2017, primarily attributable to higher staffing levels resulting from the Fox Chase acquisition, additional staff hired to support revenue generation across all business lines and the expansion into Lancaster County. Premises and equipment expenses increased $1.4 million, or 10.8%, for the year ended December 31, 2017, primarily due to higher premises expense related to Fox Chase locations and continued expansion into Philadelphia, Lancaster County and the Lehigh Valley. Data processing expense increased $1.5 million, or 21.8%, for the year ended December 31, 2017 due to increased investments in customer relationship management software and outsourced data processing solutions as well as the addition of Fox Chase processing expense. Other expense decreased $529 thousand for the year ended December 31, 2017 primarily due to the cost of a pension settlement of $1.4 million in 2016 partially offset by an increase
|
28
|
of $1.1 million related to Bank shares tax as a result of a statutory rate increase in 2017 and the Bank’s growth following the Fox Chase acquisition.
Tax Provision
The provision for income taxes was
$10.1 million
,
$17.7 million
and
$3.9 million
for the years ended
December 31, 2018
,
2017
, and
2016
, respectively, at effective rates of
16.7%
,
28.7%
, and
16.6%
, respectively. The effective tax rates reflect the reduction in the statutory federal tax rate to 21% in 2018 compared to 35% in 2017 and 2016. Additionally, the effective tax rates reflect the excess tax benefits from equity compensation activity and the benefits of tax-exempt income from investments in municipal securities and loans and leases and bank-owned life insurance. For 2016, these benefits were partially offset by non-deductible merger expenses.
The Corporation's effective income tax rate for the year ended December 31, 2018 was favorably impacted by discrete tax benefits and proceeds from BOLI death benefits. Excluding these discrete items, the effective tax rate was 18.3% for the year ended December 31, 2018. The Corporation completed the calculations of provisional items with the completion of the 2017 tax returns. The impact of the completed calculations to the re-measurement of the Corporation's net deferred tax asset resulted in an income tax benefit of $300 thousand which the Corporation recorded in 2018.
The effective tax rate for 2017 was impacted by the TCJA due to the re-measurement of the Corporation's net deferred tax asset. The re-measurement adjustment of the net deferred tax asset was recorded as additional income tax expense of $1.1 million in the fourth quarter of 2017. In addition, the Corporation recognized a BOLI death benefit of $889 thousand in the second quarter of 2017 and a discrete tax benefit related to the vesting of restricted stock and exercise of stock options of $684 thousand for 2017 which provided a tax deduction greater than previously recorded. This change was in accordance with ASU No. 2016-09, which was implemented by the Corporation in the fourth quarter of 2016 and requires the impact of such equity-based compensation activities to be recorded as an adjustment to the income tax provision in the period incurred, rather than an adjustment to equity. Excluding these items, the effective tax rate was 28.5% for the year ended December 31, 2017.
Financial Condition
ASSETS
The following table presents assets at the dates indicated:
|
At December 31,
|
||||||||||||||
|
(Dollars in thousands)
|
2018
|
2017
|
$ Change
|
% Change
|
||||||||||
|
Cash and interest-earning deposits
|
$
|
109,420
|
|
$
|
75,409
|
|
$
|
34,011
|
|
45.1
|
%
|
|||
|
Investment securities
|
473,306
|
|
454,082
|
|
19,224
|
|
4.2
|
|
||||||
|
Federal Home Loan Bank, Federal Reserve Bank and other stock, at cost
|
28,337
|
|
27,204
|
|
1,133
|
|
4.2
|
|
||||||
|
Loans held for sale
|
1,754
|
|
1,642
|
|
112
|
|
6.8
|
|
||||||
|
Loans and leases held for investment
|
4,006,574
|
|
3,620,067
|
|
386,507
|
|
10.7
|
|
||||||
|
Reserve for loan and lease losses
|
(29,364
|
)
|
(21,555
|
)
|
(7,809
|
)
|
(36.2
|
)
|
||||||
|
Premises and equipment, net
|
59,559
|
|
61,797
|
|
(2,238
|
)
|
(3.6
|
)
|
||||||
|
Goodwill and other intangibles, net
|
184,549
|
|
186,468
|
|
(1,919
|
)
|
(1.0
|
)
|
||||||
|
Bank owned life insurance
|
111,599
|
|
108,246
|
|
3,353
|
|
3.1
|
|
||||||
|
Accrued interest receivable and other assets
|
38,613
|
|
41,502
|
|
(2,889
|
)
|
(7.0
|
)
|
||||||
|
Total assets
|
$
|
4,984,347
|
|
$
|
4,554,862
|
|
$
|
429,485
|
|
9.4
|
%
|
|||
Investment Securities
Total investment securities at
December 31, 2018
increased
$19.2 million
from
December 31, 2017
. Purchases of
$107.6 million
were partially offset by maturities and pay-downs of
$67.4 million
, calls of
$10.1 million
, sales of
$1.0 million
, net amortization of purchased premiums and discounts of
$2.5 million
and
decreases
in the fair value of available-for-sale investment securities of
$7.3 million
. The decrease in the fair value of available-for-sale securities was due to increased interest rates during the year.
|
29
|
Table 3—Investment Securities
The following table shows the carrying amount of investment securities at the dates indicated. Held-to-maturity, available-for-sale and equity security portfolios are combined.
|
At December 31,
|
|||||||||||
|
(Dollars in thousands)
|
2018
|
2017
|
2016
|
||||||||
|
U.S. government corporations and agencies
|
$
|
22,311
|
|
$
|
23,956
|
|
$
|
32,266
|
|
||
|
State and political subdivisions
|
65,415
|
|
78,297
|
|
88,350
|
|
|||||
|
Residential mortgage-backed securities
|
287,400
|
|
233,990
|
|
203,641
|
|
|||||
|
Collateralized mortgage obligations
|
2,888
|
|
3,602
|
|
4,554
|
|
|||||
|
Corporate bonds
|
93,127
|
|
107,176
|
|
128,008
|
|
|||||
|
Equity securities
|
2,165
|
|
7,061
|
|
11,699
|
|
|||||
|
Total investment securities
|
$
|
473,306
|
|
$
|
454,082
|
|
$
|
468,518
|
|
||
Table 4—Investment Securities (Yields)
The following table shows the maturity distribution and weighted average yields of the investment securities at the dates indicated. Expected maturities will differ from contractual maturities because debt issuers may have the right to call or prepay obligations without call or prepayment penalties. Therefore, the stated yield may not be recognized in future periods. Additionally, residential mortgage-backed securities, which are collateralized by residential mortgage loans, typically prepay at a rate faster than stated maturity. Equity securities have no stated maturity and the current dividend yields may not be recognized in future periods. The weighted average yield is calculated by dividing income, which has not been tax equated on tax-exempt obligations, within each contractual maturity range by the outstanding amount of the related investment. Held-to-maturity, available-for-sale and equity security portfolios are combined.
|
At December 31,
|
||||||||||||||||||||
|
(Dollars in thousands)
|
2018 Amount
|
2018 Yield
|
2017 Amount
|
2017 Yield
|
2016 Amount
|
2016 Yield
|
||||||||||||||
|
1 Year or less
|
$
|
28,654
|
|
1.58
|
%
|
$
|
14,213
|
|
1.44
|
%
|
$
|
36,044
|
|
1.08
|
%
|
|||||
|
After 1 Year to 5 Years
|
46,641
|
|
2.18
|
|
67,893
|
|
1.80
|
|
77,649
|
|
1.54
|
|
||||||||
|
After 5 Years to 10 Years
|
121,533
|
|
2.53
|
|
133,660
|
|
2.50
|
|
93,477
|
|
2.66
|
|
||||||||
|
After 10 Years
|
274,313
|
|
2.77
|
|
231,255
|
|
2.37
|
|
249,649
|
|
2.33
|
|
||||||||
|
No stated maturity
|
2,165
|
|
2.63
|
|
7,061
|
|
1.37
|
|
11,699
|
|
0.23
|
|
||||||||
|
Total
|
$
|
473,306
|
|
2.58
|
%
|
$
|
454,082
|
|
2.28
|
%
|
$
|
468,518
|
|
2.12
|
%
|
|||||
Federal Home Loan Bank, Federal Reserve Bank and other stock, at cost
The Bank is a member of the FHLB, and as such, is required to hold FHLB stock as a condition of membership as determined by the FHLB. The Bank is required to hold additional stock in the FHLB in relation to the level of outstanding borrowings. The Bank held FHLB stock of
$13.6 million
and
$12.5 million
at
December 31, 2018
and
2017
, respectively. FHLB stock increased
$1.1 million
mainly due to purchase requirements related to the increase in FHLB borrowing volume during the year.
At
December 31, 2018
and
2017
, the Bank held
$14.6 million
in Federal Reserve Bank stock as required by the Federal Reserve Bank.
Loans and Leases
Gross loans and leases held for investment at
December 31, 2018
increased
$386.5 million
, or 10.7%, from
December 31, 2017
. The growth in loans was primarily commercial real estate, commercial business and residential real estate loans. The loan growth in 2018 resulted from both new and existing customer relationships and $172.8 million in growth in the Corporation’s Lancaster portfolio to $434.2 million at December 31, 2017 as the Corporation continued to take advantage of opportunities as a result of market disruption caused by other bank acquisitions.
At
December 31, 2018
, there were no concentrations of loans or leases exceeding 10% of total loans and leases other than as disclosed in Table 5.
|
30
|
Table 5—Loan and Lease Portfolio
The following table presents the composition of the loan and lease portfolio at the dates indicated:
|
At December 31,
|
|||||||||||||||||||
|
(Dollars in thousands)
|
2018
|
2017
|
2016
|
2015
|
2014
|
||||||||||||||
|
Commercial, financial and agricultural
|
$
|
937,685
|
|
$
|
896,211
|
|
$
|
823,266
|
|
$
|
504,515
|
|
$
|
457,827
|
|
||||
|
Real estate-commercial
|
1,741,204
|
|
1,542,141
|
|
1,374,949
|
|
885,892
|
|
628,478
|
|
|||||||||
|
Real estate-construction
|
215,513
|
|
175,836
|
|
174,844
|
|
96,541
|
|
79,887
|
|
|||||||||
|
Real estate-residential
|
937,457
|
|
847,811
|
|
747,715
|
|
536,893
|
|
312,032
|
|
|||||||||
|
Loans to individuals
|
32,759
|
|
28,300
|
|
30,373
|
|
29,732
|
|
29,941
|
|
|||||||||
|
Lease financings
|
141,956
|
|
129,768
|
|
134,739
|
|
125,440
|
|
118,460
|
|
|||||||||
|
Total loans and leases held for investment, net of deferred income
|
$
|
4,006,574
|
|
$
|
3,620,067
|
|
$
|
3,285,886
|
|
$
|
2,179,013
|
|
$
|
1,626,625
|
|
||||
Table 6—Loan and Lease Maturities and Sensitivity to Changes in Interest Rates
The following table presents the maturity and interest rate sensitivity of the loan and lease portfolio at
December 31, 2018
:
|
(Dollars in thousands)
|
Total
|
Due in One Year or Less
|
Due after One Year to Five Years
|
Due After Five Years
|
|||||||||||
|
Commercial, financial and agricultural
|
$
|
937,685
|
|
$
|
616,856
|
|
$
|
206,884
|
|
$
|
113,945
|
|
|||
|
Real estate-commercial
|
1,741,204
|
|
471,118
|
|
1,073,646
|
|
196,440
|
|
|||||||
|
Real estate-construction
|
215,513
|
|
140,192
|
|
23,607
|
|
51,714
|
|
|||||||
|
Real estate-residential
|
937,457
|
|
284,882
|
|
346,677
|
|
305,898
|
|
|||||||
|
Loans to individuals
|
32,759
|
|
23,029
|
|
6,995
|
|
2,735
|
|
|||||||
|
Lease financings
|
141,956
|
|
49,179
|
|
91,535
|
|
1,242
|
|
|||||||
|
Total gross loans and leases held for investment
|
$
|
4,006,574
|
|
$
|
1,585,256
|
|
$
|
1,749,344
|
|
$
|
671,974
|
|
|||
|
Loans and leases with fixed predetermined interest rates
|
$
|
1,933,763
|
|
$
|
216,269
|
|
$
|
1,388,718
|
|
$
|
328,776
|
|
|||
|
Loans and leases with variable or floating interest rates
|
2,072,811
|
|
1,368,987
|
|
360,626
|
|
343,198
|
|
|||||||
|
Total gross loans and leases held for investment
|
$
|
4,006,574
|
|
$
|
1,585,256
|
|
$
|
1,749,344
|
|
$
|
671,974
|
|
|||
Asset Quality
The Bank's strategy for credit risk management focuses on having well-defined credit policies and uniform underwriting criteria and providing prompt attention to potential problem loans and leases. Performance of the loan and lease portfolio is monitored on a regular basis by Bank management and lending officers.
Loans and leases are deemed impaired when, based on current information and events, it is probable that the Bank will be unable to collect all proceeds due according to the contractual terms of the agreement or when a loan or lease is classified as a troubled debt restructuring. Factors considered by management in determining impairment include payment status, borrower cash flows, collateral value and the probability of collecting scheduled principal and interest payments when due.
When a loan or lease, including a loan or lease that is impaired, is classified as nonaccrual, the accrual of interest on such a loan or lease is discontinued. A loan or lease is typically classified as nonaccrual when the contractual payment of principal or interest has become 90 days past due or management has serious doubts about the further collectability of principal or interest, even though the loan or lease is currently performing. A loan or lease may remain on accrual status if it is in the process of collection and is either guaranteed or well secured. When a loan or lease is placed on nonaccrual status, unpaid interest credited to income is reversed and the amortization of net deferred fees and costs is suspended. Interest payments received on nonaccrual loans and leases are either applied against principal or reported as interest income, according to management’s judgment as to the ultimate collectability of principal.
Loans or leases are usually restored to accrual status when the obligation is brought current, has performed in accordance with the contractual terms for a reasonable period of time, and the ultimate collectability of the total contractual principal and interest is no longer in doubt.
At
December 31, 2018
, the recorded investment in loans and leases held for investment that were considered to be impaired was
$26.6 million
. The related reserve for loan and lease losses was
$1.4 million
. At
December 31, 2017
, the recorded investment in loans and leases that were considered to be impaired was
$29.7 million
. The related reserve for loan and lease losses was
$131
|
31
|
thousand
. During 2018, one commercial real estate loan in the amount of $12.3 million was placed on non-accrual status during the first quarter of 2018. At December 31, 2018, the loan had a carrying balance of $11.5 million due to pay-downs during 2018. This was partially offset by an accruing troubled debt restructured commercial real estate loans for another borrower totaling $10.3 million being returned to performing status during the first quarter of 2018 as the borrower was in compliance with the modified terms of the restructuring for the required time period. The impaired loan and lease balances consisted mainly of commercial real estate loans and business loans. Impaired loans and leases include nonaccrual loans and leases and accruing troubled debt restructured loans and lease modifications for which it is probable that not all principal and interest payments due will be collectible in accordance with the contractual terms. The amount of the specific reserve needed for these credits could change in future periods subject to changes in facts and judgments related to these credits. Specific reserves have been established based on current facts and management’s judgments about the ultimate outcome of these credits. For the years ended
December 31, 2018
,
2017
, and
2016
, additional interest income that would have been recognized under the original terms for impaired loans was
$1.7 million
,
$889 thousand
and
$909 thousand
, respectively. Interest income recognized on impaired loans for the years ended
December 31, 2018
,
2017
and
2016
was
$382 thousand
,
$1.1 million
and
$1.4 million
, respectively.
Other real estate owned was
$1.2 million
at
December 31, 2018
, compared to
$1.8 million
at
December 31, 2017
. During the year ended December 31, 2018, two residential properties with a carrying value of $403 thousand and two parcels of land with a carrying value of $74 thousand were transferred to other real estate owned and four residential properties with a carrying value of $423 thousand were sold for a net gain of $67 thousand. Additionally, the market value of a parcel of land was written down by $460 thousand based on an agreement to sell the property. The carrying value of four other properties were written down by $233 thousand to reflect current market conditions for the underlying properties.
|
32
|
Table 7—Nonaccrual and Past Due Loans and Leases; Troubled Debt Restructured Loans and Lease Modifications; Other Real Estate Owned; and Related Ratios
The following table details information pertaining to the Corporation’s nonperforming assets at the dates indicated. Nonperforming loans and assets exclude acquired credit impaired loans from Fox Chase and Valley Green.
|
At December 31,
|
|||||||||||||||||||
|
(Dollars in thousands)
|
2018
|
2017
|
2016
|
2015
|
2014
|
||||||||||||||
|
Nonaccrual loans and leases, including nonaccrual troubled debt restructured loans and lease modifications*:
|
|||||||||||||||||||
|
Loans held for investment:
|
|||||||||||||||||||
|
Commercial, financial and agricultural
|
$
|
3,365
|
|
$
|
4,448
|
|
$
|
5,746
|
|
$
|
6,915
|
|
$
|
5,002
|
|
||||
|
Real estate—commercial
|
18,214
|
|
4,285
|
|
5,651
|
|
4,314
|
|
4,413
|
|
|||||||||
|
Real estate—construction
|
106
|
|
365
|
|
—
|
|
—
|
|
5,931
|
|
|||||||||
|
Real estate—residential
|
4,353
|
|
3,820
|
|
5,983
|
|
2,514
|
|
1,611
|
|
|||||||||
|
Lease financings
|
170
|
|
1,599
|
|
536
|
|
440
|
|
380
|
|
|||||||||
|
Total nonaccrual loans and leases, including nonaccrual troubled debt restructured loans and lease modifications*
|
26,208
|
|
14,517
|
|
17,916
|
|
14,183
|
|
17,337
|
|
|||||||||
|
Accruing troubled debt restructured loans and lease modifications not included in the above
|
542
|
|
11,435
|
|
3,252
|
|
5,245
|
|
5,469
|
|
|||||||||
|
Accruing loans and leases 90 days or more past due:
|
|||||||||||||||||||
|
Real estate—residential
|
—
|
|
310
|
|
652
|
|
—
|
|
31
|
|
|||||||||
|
Loans to individuals
|
55
|
|
195
|
|
142
|
|
173
|
|
365
|
|
|||||||||
|
Lease financings
|
137
|
|
256
|
|
193
|
|
206
|
|
55
|
|
|||||||||
|
Total accruing loans and leases, 90 days or more past due
|
192
|
|
761
|
|
987
|
|
379
|
|
451
|
|
|||||||||
|
Total nonperforming loans and leases
|
26,942
|
|
26,713
|
|
22,155
|
|
19,807
|
|
23,257
|
|
|||||||||
|
Other real estate owned
|
1,187
|
|
1,843
|
|
4,969
|
|
1,276
|
|
955
|
|
|||||||||
|
Total nonperforming assets
|
$
|
28,129
|
|
$
|
28,556
|
|
$
|
27,124
|
|
$
|
21,083
|
|
$
|
24,212
|
|
||||
|
Nonaccrual loans and leases (including nonaccrual troubled debt restructured loans and lease modifications) / loans and leases held for investment
|
0.65
|
%
|
0.40
|
%
|
0.55
|
%
|
0.65
|
%
|
1.07
|
%
|
|||||||||
|
Nonperforming loans and leases / loans and leases held for investment
|
0.67
|
|
0.74
|
|
0.67
|
|
0.91
|
|
1.43
|
|
|||||||||
|
Nonperforming assets / total assets
|
0.56
|
|
0.63
|
|
0.64
|
|
0.73
|
|
1.09
|
|
|||||||||
|
Allowance for loan and lease losses
|
$
|
29,364
|
|
$
|
21,555
|
|
$
|
17,499
|
|
$
|
17,628
|
|
$
|
20,662
|
|
||||
|
Allowance for loan and lease losses / loans and leases held for investment
|
0.73
|
%
|
0.60
|
%
|
0.53
|
%
|
0.81
|
%
|
1.27
|
%
|
|||||||||
|
Allowance for loan and lease losses / loans and leases held for investment (excluding acquired loans at period-end)
|
0.81
|
|
0.70
|
|
0.73
|
|
0.94
|
|
1.27
|
|
|||||||||
|
Allowance for loan and lease losses / nonaccrual loans and leases
|
112.04
|
|
148.48
|
|
97.67
|
|
124.29
|
|
119.18
|
|
|||||||||
|
Allowance for loan and lease losses / nonperforming loans and leases
|
108.99
|
|
80.69
|
|
78.98
|
|
89.00
|
|
88.84
|
|
|||||||||
|
Acquired credit impaired loans
|
$
|
695
|
|
$
|
1,583
|
|
$
|
7,352
|
|
$
|
1,253
|
|
$
|
—
|
|
||||
|
Nonperforming loans and leases and acquired credit impaired loans / loans and leases held for investment
|
0.69
|
%
|
0.78
|
%
|
0.90
|
%
|
0.97
|
%
|
1.43
|
%
|
|||||||||
|
Nonperforming assets and acquired credit impaired loans / total assets
|
0.58
|
|
0.66
|
|
0.81
|
|
0.78
|
|
1.09
|
|
|||||||||
|
* Nonaccrual troubled debt restructured loans and lease modifications included in nonaccrual loans and leases in the above table
|
$
|
1,284
|
|
$
|
2,513
|
|
$
|
1,753
|
|
$
|
93
|
|
$
|
3,104
|
|
||||
The following table provides additional information on the Corporation’s nonaccrual loans held for investment:
|
At December 31,
|
|||||||||||||||
|
(Dollars in thousands)
|
2018
|
2017
|
2016
|
2015
|
|||||||||||
|
Total nonaccrual loans and leases, including nonaccrual troubled debt restructured loans and lease modifications
|
$
|
26,208
|
|
$
|
14,517
|
|
$
|
17,916
|
|
$
|
14,183
|
|
|||
|
Nonaccrual loans and leases with partial charge-offs
|
2,210
|
|
5,397
|
|
5,000
|
|
6,451
|
|
|||||||
|
Life-to-date partial charge-offs on nonaccrual loans and leases
|
1,320
|
|
4,107
|
|
2,857
|
|
3,853
|
|
|||||||
|
Charge-off rate of nonaccrual loans and leases with partial charge-offs
|
37.4
|
%
|
43.2
|
%
|
36.4
|
%
|
37.4
|
%
|
|||||||
|
Specific reserves on impaired loans
|
$
|
1,415
|
|
$
|
131
|
|
$
|
235
|
|
$
|
322
|
|
|||
|
33
|
Reserve for Loan and Lease Losses
The reserve for loan and lease losses is maintained at a level representing management's best estimate of known risks and inherent losses in the portfolio, based upon management's evaluation of the portfolio's collectability. Management evaluates the need to establish reserves against losses on loans and leases on a quarterly basis. When changes in the reserve are necessary, an adjustment is made.
The reserve for loan and lease losses consists of a reserve for impaired loans and leases and a general valuation allowance on the remainder of the originated portfolio. Although management determines the amount of each element of the reserve separately, the entire reserve for loan and lease losses is available for losses on the portfolio. The Corporation does not provide a reserve for loan loss for acquired loans unless additional deterioration of the portfolio is identified over the projections utilized in the initial fair value analysis. After the acquisition measurement period, the present value of any decreases in expected cash flows of acquired credit impaired loans will generally result in an impairment charge recorded as a provision for loan losses.
Reserve Required for Impaired Loans and Leases
A loan or lease is considered impaired when, based on current information and events, it is probable that the Bank will be unable to collect future payments of principal or interest as contractually due. The Bank applies its normal loan review procedures in determining if a loan is impaired, which includes reviewing the collectability of delinquent and internally classified loans on a regular basis and at least quarterly. In determining the likelihood of collecting principal and interest, the Bank considers all available and relevant information, including the borrower's actual and projected cash flows, balance sheet strength, liquidity and overall financial position. Additionally, all loans classified as troubled debt restructurings are considered impaired. When a loan is classified as impaired, an impairment analysis is performed within the quarter in which a loan is identified as impaired to determine if a specific reserve is needed. The Bank re-examines each impaired loan on a quarterly basis to determine if any adjustment to the valuation allowance or net carrying amount of a loan is required. The Bank recognizes charge-offs associated with impaired loans when all or a portion of a loan is considered to be uncollectible. In measuring impairment, the Bank determines whether or not the loan is collateral dependent. A loan is collateral dependent if repayment is expected to be provided solely by the underlying collateral, which includes repayment from the proceeds from the sale of the collateral, cash flows from the continued operation of the collateral, or both, and there are no other available and reliable repayment sources. To determine the initial amount of impairment for a collateral dependent loan, the Bank utilizes a recent appraisal, an agreement of sale or a letter of intent. If the fair value of the underlying collateral, less costs to sell, is less than the loan's carrying amount, the Bank adds a provision to the reserve for loan and lease losses in the amount of the difference between fair value, less costs to sell, and the loan or lease's carrying amount. In subsequent periods, the Bank takes into consideration current facts and circumstances in analyzing whether the fair value of the collateral has increased or decreased significantly such that a change to the corresponding valuation allowance is required. If current facts and circumstances are insufficient to determine fair value, the Bank obtains a new appraisal.
For loans that are not collateral dependent, the Bank establishes a specific reserve on impaired loans based on management's estimate of the discounted cash flows the Bank expects to receive from the borrower. Factors considered in evaluating such cash flows include: (1) the strength of the customer's personal or business cash flows and personal guarantees; (2) the borrower's effort to cure the delinquency; (3) the availability of other sources of repayment; (4) the type and value of collateral, if applicable; and (5) the strength of our collateral position, if applicable.
General Reserve on the Remainder of the Loan Portfolio
The Bank establishes a general reserve for loans and leases that are not considered impaired to recognize the inherent losses associated with lending activities. This general reserve is determined by segmenting the loan portfolio and assigning reserve factors to each category. The reserve factors are calculated using the Bank's historical losses and loss emergence periods, and are adjusted for significant factors that, in management's judgment, affect the collectability of the portfolio as of the evaluation date. These significant factors include:
|
•
|
Changes in lending policies and procedures, including changes in underwriting standards and collection, charge-off and recovery practices not considered elsewhere in estimating credit losses;
|
|
•
|
Changes in national, regional, and local economic and business conditions and developments that affect the collectability of the portfolio, including the condition of various market segments;
|
|
•
|
Changes in the size and composition of the portfolio and in the terms of loans;
|
|
•
|
Changes in the experience, ability, and depth of lending management and other relevant staff;
|
|
•
|
Changes in the volume and severity of past due loans, the volume of nonaccrual loans, and the volume and severity of adversely classified or graded loans;
|
|
34
|
|
•
|
Changes in the quality of the institution’s loan review system;
|
|
•
|
Changes in the value of underlying collateral for collateral-dependent loans;
|
|
•
|
The existence and effect of any concentrations of credit, and changes in the level of such concentrations; and
|
|
•
|
The effect of other external factors such as competition and legal and regulatory requirements on the level of estimated credit losses in the institution’s existing portfolio.
|
The Corporation maintains a reserve in other liabilities for off-balance sheet credit exposures that currently are unfunded in categories with historical loss experience. The reserve for these off-balance sheet credits was
$426 thousand
and
$390 thousand
at
December 31, 2018
and
2017
, respectively.
Table 8—Summary of Loan and Lease Loss Experience
The following table presents average loans and leases and summarizes loan and lease loss experience for the periods indicated.
|
For the Years Ended December 31,
|
|||||||||||||||||||
|
(Dollars in thousands)
|
2018
|
2017
|
2016
|
2015
|
2014
|
||||||||||||||
|
Average amount of loans and leases outstanding
|
$
|
3,776,940
|
|
$
|
3,420,847
|
|
$
|
2,699,973
|
|
$
|
2,080,817
|
|
$
|
1,580,835
|
|
||||
|
Loan and lease loss reserve at beginning of period
|
21,555
|
|
$
|
17,499
|
|
$
|
17,628
|
|
$
|
20,662
|
|
$
|
24,494
|
|
|||||
|
Charge-offs:
|
|||||||||||||||||||
|
Commercial, financial and agricultural loans
|
14,655
|
|
1,030
|
|
4,827
|
|
4,793
|
|
2,834
|
|
|||||||||
|
Real estate loans
|
71
|
|
1,798
|
|
1,007
|
|
2,353
|
|
4,644
|
|
|||||||||
|
Loans to individuals
|
353
|
|
317
|
|
395
|
|
549
|
|
796
|
|
|||||||||
|
Lease financings
|
572
|
|
3,992
|
|
759
|
|
801
|
|
576
|
|
|||||||||
|
Total charge-offs
|
15,651
|
|
7,137
|
|
6,988
|
|
8,496
|
|
8,850
|
|
|||||||||
|
Recoveries:
|
|
||||||||||||||||||
|
Commercial, financial and agricultural loans
|
2,140
|
|
801
|
|
1,454
|
|
1,032
|
|
247
|
|
|||||||||
|
Real estate loans
|
691
|
|
158
|
|
260
|
|
238
|
|
618
|
|
|||||||||
|
Loans to individuals
|
88
|
|
136
|
|
133
|
|
176
|
|
265
|
|
|||||||||
|
Lease financings
|
231
|
|
206
|
|
191
|
|
214
|
|
281
|
|
|||||||||
|
Total recoveries
|
3,150
|
|
1,301
|
|
2,038
|
|
1,660
|
|
1,411
|
|
|||||||||
|
Net charge-offs
|
12,501
|
|
5,836
|
|
4,950
|
|
6,836
|
|
7,439
|
|
|||||||||
|
Provision to loan and lease loss reserve
|
20,299
|
|
9,892
|
|
4,646
|
|
3,623
|
|
3,607
|
|
|||||||||
|
Provision for acquired credit impaired loans
|
11
|
|
—
|
|
175
|
|
179
|
|
—
|
|
|||||||||
|
Loan and lease loss reserve at end of period
|
$
|
29,364
|
|
$
|
21,555
|
|
$
|
17,499
|
|
$
|
17,628
|
|
$
|
20,662
|
|
||||
|
Ratio of net charge-offs to average loans and leases
|
0.33
|
%
|
0.17
|
%
|
0.18
|
%
|
0.33
|
%
|
0.47
|
%
|
|||||||||
During the second quarter of 2018, the Corporation charged-off $12.7 million related to a commercial loan borrower. During the fourth quarter of 2018, the Corporation recovered $1.8 million related to this previously charged-off loan. See Note 5, "Loans and Leases" of the consolidated financial statements included in Part II, Item 8 of this Form 10-K for additional information. During 2017, the Corporation charged-off $2.8 million related to $5.0 million of software leases under a vendor referral program. The decrease in charge-off activity in commercial, financial and agricultural loans during 2017 compared to 2016 was primarily due to improvements in asset quality.
Table 9—Loan and Lease Loss Reserves
The following table summarizes the allocation of the allowance for loan and lease losses and the percentage of loans and leases in each major loan category to total loans and leases held for investment at the dates indicated.
|
At December 31,
|
||||||||||||||||||||||||||||||||||
|
(Dollars in thousands)
|
2018
|
2017
|
2016
|
2015
|
2014
|
|||||||||||||||||||||||||||||
|
Commercial, financial and agricultural loans
|
$
|
7,983
|
|
23.4
|
%
|
$
|
6,742
|
|
24.8
|
%
|
$
|
7,037
|
|
25.1
|
%
|
$
|
6,418
|
|
23.2
|
%
|
$
|
6,920
|
|
28.1
|
%
|
|||||||||
|
Real estate loans
|
19,338
|
|
72.3
|
|
13,254
|
|
70.8
|
|
9,272
|
|
69.9
|
|
8,910
|
|
69.6
|
|
10,830
|
|
62.8
|
|
||||||||||||||
|
Loans to individuals
|
484
|
|
0.8
|
|
373
|
|
0.8
|
|
364
|
|
0.9
|
|
346
|
|
1.4
|
|
360
|
|
1.8
|
|
||||||||||||||
|
Lease financings
|
1,288
|
|
3.5
|
|
1,132
|
|
3.6
|
|
788
|
|
4.1
|
|
1,042
|
|
5.8
|
|
985
|
|
7.3
|
|
||||||||||||||
|
Unallocated
|
271
|
|
N/A
|
|
54
|
|
N/A
|
|
38
|
|
N/A
|
|
912
|
|
N/A
|
|
1,567
|
|
N/A
|
|
||||||||||||||
|
Total
|
$
|
29,364
|
|
100.0
|
%
|
$
|
21,555
|
|
100.0
|
%
|
$
|
17,499
|
|
100.0
|
%
|
$
|
17,628
|
|
100.0
|
%
|
$
|
20,662
|
|
100.0
|
%
|
|||||||||
The allowance for loan and lease losses to nonaccrual loans and leases,
including nonaccrual troubled debt restructured loans and lease modifications, was
112.04%
at
December 31, 2018
,
148.48%
at
December 31, 2017
and
97.67%
at
December 31, 2016
.
|
35
|
At
December 31, 2018
, the specific allowance on impaired loans was
$1.4 million
, or
5.3%
of the balance of impaired loans of
$26.6 million
. At
December 31, 2017
, the specific allowance on impaired loans was
$131 thousand
, or
0.5%
of the balance of impaired loans of
$28.5 million
. At
December 31, 2016
, the specific allowance on impaired loans was
$235 thousand
, or
0.5%
of the balance of impaired loans of
$43.9 million
.
The ratio of the reserve for loan and lease losses to total loans and leases was
0.73%
at
December 31, 2018
compared to
0.60%
at
December 31, 2017
and
0.53%
at December 31,
2016
. Excluding the loans acquired in the Fox Chase Bank and Valley Green Bank acquisitions, which were recorded at fair value, the ratio of the reserve for loan and lease losses to total loans and leases was
0.81%
at
December 31, 2018
,
0.70%
at December 31,
2017
and
0.73%
at December 31,
2016
. The allocated reserves for real estate loans increased by $6.1 million at December 31, 2018 compared to December 31, 2017, primarily due to growth in real estate loans and a $902 increase in specific reserves for impaired loans.
Goodwill and Other Intangible Assets
Goodwill and other intangible assets have been recorded on the books of the Corporation in connection with acquisitions. The Corporation has core deposit and customer-related intangibles and servicing rights, which are not deemed to have an indefinite life and therefore will continue to be amortized over their useful life using the present value of projected cash flows. The amortization of these intangible assets for the years ended
December 31, 2018
,
2017
and
2016
was
$3.4 million
,
$4.2 million
and
$4.1 million
, respectively. The Corporation also has goodwill with a net carrying value of
$172.6 million
at
December 31, 2018
and
2017
, which is deemed to be an indefinite intangible asset and is not amortized.
The Corporation completes a goodwill impairment analysis at least on an annual basis, or more often, if events and circumstances indicate that there may be impairment. The Corporation also completes an impairment test for other identifiable intangible assets on an annual basis or more often if events and circumstances indicate there may be impairment. There was no impairment of goodwill or identifiable intangibles recorded during
2016
through
2018
. There can be no assurance that future impairment assessments or tests will not result in a charge to earnings.
Bank Owned Life Insurance
The Bank purchases bank owned life insurance to protect itself against the loss of key employees due to death and to offset or finance the Corporation’s future costs and obligations to employees under its benefit plans. Bank owned life insurance increased
$3.4 million
from December 31, 2017 primarily due to $1.6 million of policies purchased during 2018 and BOLI income on the underlying policies.
LIABILITIES
The following table presents liabilities at the dates indicated:
|
At December 31,
|
||||||||||||||
|
(Dollars in thousands)
|
2018
|
2017
|
$ Change
|
% Change
|
||||||||||
|
Deposits
|
$
|
3,885,933
|
|
$
|
3,554,919
|
|
$
|
331,014
|
|
9.3
|
%
|
|||
|
Short-term borrowings
|
189,768
|
|
105,431
|
|
84,337
|
|
80.0
|
|
||||||
|
Long-term debt
|
145,330
|
|
155,828
|
|
(10,498
|
)
|
(6.7
|
)
|
||||||
|
Subordinated notes
|
94,574
|
|
94,331
|
|
243
|
|
0.3
|
|
||||||
|
Accrued interest payable and other liabilities
|
44,609
|
|
40,979
|
|
3,630
|
|
8.9
|
|
||||||
|
Total liabilities
|
$
|
4,360,214
|
|
$
|
3,951,488
|
|
$
|
408,726
|
|
10.3
|
%
|
|||
Deposits
Total deposits grew
$331.0 million
, or 9.3%, from
December 31, 2017
primarily due to increases in commercial, public funds and consumer time deposits.
|
36
|
Table 10—Deposits
The following table summarizes the average amount of deposits for the periods indicated:
|
(Dollars in thousands)
|
For the Years Ended December 31,
|
||||||||||
|
2018
|
2017
|
2016
|
|||||||||
|
Noninterest-bearing deposits
|
$
|
1,069,805
|
|
$
|
973,253
|
|
$
|
751,592
|
|
||
|
Interest-bearing checking deposits
|
461,676
|
|
437,678
|
|
386,176
|
|
|||||
|
Money market savings
|
764,777
|
|
582,703
|
|
414,121
|
|
|||||
|
Regular savings
|
798,332
|
|
847,510
|
|
714,809
|
|
|||||
|
Time deposits
|
601,674
|
|
566,079
|
|
512,557
|
|
|||||
|
Total average deposits
|
$
|
3,696,264
|
|
$
|
3,407,223
|
|
$
|
2,779,255
|
|
||
The following table summarizes the maturities of time deposits with balances of $100 thousand or more. Brokered deposits in the amount of
$107.8 million
at
December 31, 2018
are not included in total certificates of deposit of $100 thousand or more.
|
(Dollars in thousands)
|
At December 31, 2018
|
||
|
Due Three Months or Less
|
$
|
79,145
|
|
|
Due Over Three Months to Six Months
|
38,399
|
|
|
|
Due Over Six Months to Twelve Months
|
52,970
|
|
|
|
Due Over Twelve Months
|
112,854
|
|
|
|
Total
|
$
|
283,368
|
|
Borrowings
Total borrowings
increased
$74.1 million
from
December 31, 2017
primarily due to
an increase
in short-term borrowings of
$84.3 million
partially offset by the repayment of long-term commercial bank borrowings of $10.0 million.
Short-term borrowings at
December 31, 2018
consisted of FHLB borrowings, federal funds purchased and customer repurchase agreements on an overnight basis totaling
$189.8 million
. Long-term debt at
December 31, 2018
consisted of Federal Home Loan bank advances and commercial bank borrowings totaling
$145.3 million
and subordinated notes of
$94.6 million
. At
December 31, 2018
and
2017
, the Bank had outstanding short-term letters of credit with the FHLB totaling
$347.5 million
and
$234.2 million
, respectively, which were utilized to collateralize public funds deposits.
The following is a summary of borrowings by type. Short-term borrowings consist of overnight borrowings and term borrowings with an original maturity of one year or less. The long-term debt balances and weighted average interest rates include purchase accounting fair value adjustments, net of related amortization from the Fox Chase acquisition.
Table 11—Borrowings
The following table summarizes the Corporation's borrowing activity at the dates indicated:
|
(Dollars in thousands)
|
Balance at End of Year
|
Weighted Average Interest Rate
|
Maximum Amount Outstanding at Month End During the Year
|
Average Amount Outstanding During the Year
|
Weighted Average Interest Rate During the Year
|
||||||||||||
|
2018
|
|||||||||||||||||
|
Short-term borrowings
|
$
|
189,768
|
|
2.32
|
%
|
$
|
290,309
|
|
$
|
144,312
|
|
1.68
|
%
|
||||
|
Long-term debt
|
145,330
|
|
2.03
|
|
155,782
|
|
150,032
|
|
1.85
|
|
|||||||
|
Subordinated notes
|
94,574
|
|
5.33
|
|
94,574
|
|
94,451
|
|
5.34
|
|
|||||||
|
2017
|
|||||||||||||||||
|
Short-term borrowings
|
$
|
105,431
|
|
1.26
|
%
|
$
|
231,726
|
|
$
|
105,552
|
|
0.86
|
%
|
||||
|
Long-term debt
|
155,828
|
|
1.69
|
|
221,762
|
|
186,109
|
|
1.41
|
|
|||||||
|
Subordinated notes
|
94,331
|
|
5.35
|
|
94,331
|
|
94,208
|
|
5.35
|
|
|||||||
|
2016
|
|||||||||||||||||
|
Short-term borrowings
|
$
|
196,171
|
|
0.68
|
%
|
$
|
282,333
|
|
$
|
103,238
|
|
0.72
|
%
|
||||
|
Long-term debt
|
127,522
|
|
0.93
|
|
127,826
|
|
60,965
|
|
0.90
|
|
|||||||
|
Subordinated notes
|
94,087
|
|
5.27
|
|
94,087
|
|
71,851
|
|
5.39
|
|
|||||||
|
37
|
SHAREHOLDERS' EQUITY
The following table presents total shareholders’ equity at the dates indicated:
|
(Dollars in thousands)
|
At December 31,
|
|||||||||||||
|
2018
|
2017
|
$ Change
|
% Change
|
|||||||||||
|
Common stock
|
$
|
157,784
|
|
$
|
157,784
|
|
$
|
—
|
|
—
|
%
|
|||
|
Additional paid-in capital
|
292,401
|
|
290,133
|
|
2,268
|
|
0.8
|
|
||||||
|
Retained earnings
|
248,167
|
|
216,761
|
|
31,406
|
|
14.5
|
|
||||||
|
Accumulated other comprehensive loss
|
(28,416
|
)
|
(17,771
|
)
|
(10,645
|
)
|
(59.9
|
)
|
||||||
|
Treasury stock
|
(45,803
|
)
|
(43,533
|
)
|
(2,270
|
)
|
(5.2
|
)
|
||||||
|
Total shareholders’ equity
|
$
|
624,133
|
|
$
|
603,374
|
|
$
|
20,759
|
|
3.4
|
%
|
|||
The increase in shareholders' equity at
December 31, 2018
of
$20.8 million
from December 31,
2017
was primarily related to an increase in retained earnings of
$31.4 million
. Retained earnings was impacted by net income of
$50.5 million
and the reclassification of $3.9 million and $433 thousand from accumulated other comprehensive income related to the January 1, 2018 adoption of ASU 2016-01 and ASU 2018-02, respectively, partially offset by cash dividends declared of
$23.5 million
. Accumulated other comprehensive
loss
increased by
$10.6 million
from December 31, 2017 mainly attributable to decreases in the fair value of available-for-sale investment securities of
$5.8 million
, net of
tax
, and the reclassification of retained earnings from the previously discussed adoption of ASU 2016-01 and ASU 2018-02 (
$3.0 million
related to the defined benefit pension plans and $1.4 million related to investment securities). Treasury stock
increased
$2.3 million from December 31, 2017 primarily related to purchases of $3.6 million under the Corporation's share repurchase program partially offset by a reduction in treasury stock of $1.2 million related to the issuance of restricted stock.
Discussion of Segments
The Corporation has three operating segments: Banking, Wealth Management and Insurance. Detailed segment information appears in Note 22, "Segment Reporting" included in the Notes to the Consolidated Financial Statements under Item 8 of this Form 10-K (Note 22 in the Notes to the Consolidated Financial Statements).
Banking segment, as presented in Note 22 in the Notes to the Consolidated Financial Statements, reports a pre-tax income of $56.0 million in 2018, $59.0 million in 2017 and $31.5 million in 2016. See the section of this MD&A under the heading “Net Interest Income", “Interest Income”, “Interest Expense”, and “Provision for Loan and Lease Losses” for a discussion of the Banking Segment.
Wealth Management segment, as presented in Note 22 in the Notes to the Consolidated Financial Statements, reports a pre-tax income of $7.2 million in 2018, $6.7 million in 2017 and $2.4 million in 2016 and noninterest income of $23.2 million in 2018, $21.7 million in 2017 and $19.3 million in 2016. Noninterest income has increased primarily due to new customer relationships and favorable market performance throughout 2016, 2017 and most of 2018.
I
ntangible expense decreased $2.5 million for the year ended December 31, 2017 primarily as a result of the settlement of the Girard Partners acquisition earn-out in the fourth quarter of 2016. Wealth Management assets under management and supervision were $3.3 billion as of December 31, 2018, $3.5 billion as of December 31, 2017, and $3.2 billion as of December 31, 2016. The decrease in assets under management and supervision as of December 31, 2018, as compared to December 31, 2017, was primarily a result of the decrease in the equity markets in the fourth quarter of 2018.
Insurance segment, as presented in Note 22 in the Notes to the Consolidated Financial Statements, reports a pre-tax income of $7.2 million in 2018, $6.7 million in 2017 and $2.4 million in 2016 and noninterest income of $16.4 million in 2018, $15.3 million in 2017 and $15.2 million in 2016. Noninterest income has increased primarily due to increases in group life and health premiums, contingent commission income, and payroll and human resources consulting services.
Capital Adequacy
Capital guidelines, which banking regulators have adopted, assign minimum capital requirements for categories of assets depending on their assigned risks. The components of risk-based capital for the Corporation are Tier 1 and Tier 2. Minimum required total risk-based capital is 8.00%. In July 2013, the federal bank regulatory agencies adopted final rules revising the agencies’ capital adequacy guidelines and prompt corrective action rules, designed to enhance such requirements and implement the revised standards of the Basel Committee on Banking Supervision, commonly referred to as Basel III. The rules are discussed in Note 20, “Regulatory Matters,” included in the Notes to the Consolidated Financial Statements under Item 8 of this Form 10-K.
The Corporation adopted the new Basel III regulatory capital rules during the first quarter of 2015 under the transition rules,
|
38
|
primarily relating to regulatory deductions and adjustments impacting common equity tier 1 capital and tier 1 capital, to be phased in over a four-year period beginning January 1, 2015. Additionally under Basel III rules, the decision was made to opt-out of including accumulated other comprehensive income in regulatory capital. During 2018, the Corporation and the Bank were required to hold a capital conservation buffer greater than 1.875% above its minimum risk-based capital requirements in order to avoid limitations on capital distributions. The Corporation and the Bank were in compliance with these requirements for 2018. During 2019, the Corporation and the Bank must hold a capital conservation buffer greater than 2.50% above its minimum risk-based capital requirements in order to avoid limitations on capital distributions.
At
December 31, 2018
, the Corporation had a Tier 1 risk-based capital ratio of
10.88%
and total risk-based capital ratio of
13.70%
. At
December 31, 2017
, the Corporation had a Tier 1 capital ratio of
11.11%
and total risk-based capital ratio of
14.00%
. The Corporation continues to be in the “well-capitalized” category under regulatory standards. Details on the capital ratios can be found in Note 20, “Regulatory Matters,” included in the Notes to the Consolidated Financial Statements under Item 8 of this Form 10-K along with a discussion on dividend and other restrictions.
Asset/Liability Management
The primary functions of Asset/Liability Management are to assure adequate earnings, capital and liquidity while maintaining an appropriate balance between interest-earning assets and interest-bearing liabilities. Liquidity management involves the ability to meet the Corporation's cash flow requirements, including those of our customers. Management's objective with regard to interest rate risk is to understand the Corporation's sensitivity to changes in interest rates and develop and implement strategies to minimize volatility while maximizing net interest income.
The Corporation uses gap analysis and earnings at risk simulation modeling to quantify exposure to interest rate risk. The Corporation uses the gap analysis to identify and monitor long-term rate exposure and uses a simulation model to measure the short-term rate exposures. The Corporation runs various earnings simulation scenarios to quantify the impact of declining or rising interest rates on net interest income over a one-year and two-year horizon. The simulation uses expected cash flows and repricing characteristics for all financial instruments at a point in time and incorporates company developed, market-based assumptions regarding growth, pricing, and optionality such as prepayment speeds. As interest rates increase, fixed-rate assets that banks hold will tend to decrease in value; conversely, as interest rates decline, fixed-rate assets that banks hold will tend to increase in value.
Credit Risk
Extending credit exposes the Corporation to credit risk, which is the risk that the principal balance of a loan and any related interest will not be collected due to the inability of the borrower to repay the loan. The Corporation manages credit risk in the loan portfolio through adherence to consistent standards, guidelines and limitations established by the Board of Directors. Written loan policies establish underwriting standards, lending limits and other standards or limits as deemed necessary and prudent. While the Corporation has strict underwriting, review, and monitoring procedures in place, these procedures cannot eliminate all of the risks related to these lending activities.
The loan review department conducts ongoing, independent reviews of the lending process to ensure adherence to established policies and procedures, monitors compliance with applicable laws and regulations, provides objective measurement of the risk inherent in the loan portfolio, and ensures that proper documentation exists.
The Corporation focuses on both assessing the borrower’s capacity and willingness to repay and on obtaining sufficient collateral. Commercial, financial and agricultural loans are generally secured by the borrower’s assets and by personal guarantees. Commercial real estate loans are originated primarily within the Southeastern Pennsylvania and New Jersey market areas at prudent loan-to-value ratios and are often supported by a guarantee of the borrowers. Management closely monitors the composition and quality of the total commercial loan portfolio to ensure that any credit concentrations by borrower or industry are closely monitored.
The Corporation originates fixed-rate and adjustable-rate real estate-residential mortgage loans that are secured by the underlying 1- to 4-family residential properties for personal purposes. Credit risk exposure in this area of lending is minimized by the evaluation of the creditworthiness of the borrower, including debt-to-equity ratios, credit scores and adherence to underwriting policies that emphasize conservative loan-to-value ratios of generally no more than 80%. Residential mortgage loans granted in excess of the 80% loan-to-value ratio criterion are generally insured by private mortgage insurance.
Credit risk in the consumer loan portfolio is controlled by strict adherence to underwriting standards that consider debt-to-income levels and the creditworthiness of the borrower and, if secured, collateral values. In the home equity loan portfolio, combined loan-to-value ratios are generally limited to 80%, but increased to 85% for the Corporation’s strongest profile borrower. Other credit considerations and compensating factors may warrant higher combined loan-to-value ratios.
|
39
|
The primary risks that are involved with lease financing receivables are credit underwriting and borrower industry concentrations. The Corporation has strict underwriting, review, and monitoring procedures in place to mitigate this risk. Risk also lies in the residual value of the underlying equipment. Residual values are subject to judgments as to the value of the underlying equipment that can be affected by changes in economic and market conditions and the financial viability of the residual guarantors and insurers. To the extent not guaranteed or assumed by a third party, or otherwise insured against, the Corporation bears the risk of ownership of the leased assets. This includes the risk that the actual value of the leased assets at the end of the lease term will be less than the residual value. The Corporation greatly reduces this risk primarily by using $1.00 buyout leases, in which the entire cost of the leased equipment is included in the contractual payments, leaving no residual payment at the end of the lease term.
The Corporation closely monitors delinquencies as another means of maintaining asset quality. Collection efforts begin after a loan payment is missed, by attempting to contact all borrowers. If collection attempts fail, the Corporation will proceed to gain control of any and all collateral in a timely manner in order to minimize losses. While liquidation and recovery efforts continue, officers continue to work with the borrowers, if appropriate, to recover all monies owed to the Corporation.
Liquidity
The Corporation, in its role as a financial intermediary, is exposed to certain liquidity risks. Liquidity refers to the Corporation’s ability to ensure that sufficient cash flow and liquid assets are available to satisfy demand for loans, deposit withdrawals, repayment of borrowings and certificates of deposit at maturity, operating expense, and capital expenditures. The Corporation manages liquidity risk by measuring and monitoring liquidity sources and estimated funding needs on a daily basis. The Corporation has a contingency funding plan in place to address liquidity needs in the event of an institution-specific or a systemic financial crisis.
Sources of Funds
Core deposits continue to be the largest significant funding source for the Corporation. These deposits are primarily generated from a base of individuals, businesses, municipalities and non-profit customers located in our primary service areas. The Corporation faces increased competition for these deposits from a large array of financial market participants, including banks, credit unions, savings institutions, mutual funds, security dealers and others.
As part of its diversified funding strategy, the Corporation also utilizes a mix of short-term and long-term wholesale funding providers. Wholesale funding includes federal funds purchases from correspondent banks, secured borrowing lines from the Federal Home Loan Bank of Pittsburgh, the Federal Reserve Bank of Philadelphia and, at times, brokered deposits and other similar sources.
The Corporation, through the Bank, has a credit facility with the FHLB with a maximum borrowing capacity of approximately $
1.6 billion
. At
December 31, 2018
and
2017
, the carrying amount of overnight borrowings with the FHLB was
$108.3 million
and
$30.2 million
, respectively. At
December 31, 2018
and
2017
, the carrying amount of long-term borrowings with the FHLB was
$125.0 million
. At
December 31, 2018
and
2017
, the Bank had outstanding short-term letters of credit with the FHLB totaling
$347.5 million
and
$234.2 million
, respectively, which were utilized to collateralize public funds deposits. The maximum borrowing capacity with the FHLB changes as a function of qualifying collateral assets as well as the FHLB’s internal credit rating of the Bank.
The Corporation, through the Bank, maintains uncommitted federal fund lines with several correspondent banks that totaled
$367.0 million
at
December 31, 2018
and
2017
. At
December 31, 2018
and
2017
, the Corporation had outstanding federal funds purchased with these correspondent banks of
$60.0 million
and
$55.0 million
, respectively. Future availability under these lines is subject to the prerogatives of the granting banks and may be withdrawn at will.
The Corporation, through the Bank, holds collateral at the Federal Reserve Bank of Philadelphia in order to access the Discount Window Lending program. The collateral consisting of investment securities was valued at
$69.5 million
and
$52.0 million
at
December 31, 2018
and
2017
, respectively. At
December 31, 2018
and
2017
, the Corporation had no outstanding borrowings under this program.
The Corporation has a
$10.0 million
line of credit with a correspondent bank. At
December 31, 2018
and
2017
, the Corporation had no outstanding borrowings under this line.
Cash Requirements
The Corporation has cash requirements for various financial obligations, including contractual obligations and commitments that require cash payments. The following contractual obligations and commitments table presents, at
December 31, 2018
, significant
|
40
|
fixed and determinable contractual obligations and commitments to third parties. The most significant contractual obligation, in both the under and over one year time period, is for the Bank to repay its certificates of deposit and short-term and long-term borrowings. The Bank anticipates meeting these obligations by continuing to provide convenient depository and cash management services through its financial center network, thereby replacing these contractual obligations with similar fund sources at rates that are competitive in our market. The Bank will also use borrowings and brokered deposits to meet its obligations.
The table also shows the amounts and expected maturities of significant commitments at
December 31, 2018
. These commitments do not necessarily represent future cash requirements in that these commitments often expire without being drawn upon. Commitments to extend credit are the Bank’s most significant commitment in both the under and over one year time periods.
Contractual Obligations and Commitments
The Corporation enters into contractual obligations in the normal course of business as a source of funds for its asset growth and its asset/liability management and to meet required capital needs. These obligations require the Corporation to make cash payments over time as detailed in the table that follows.
The Corporation is party to financial instruments with off-balance sheet risk in the normal course of business to manage the Corporation’s exposure to fluctuation in interest rates and to support loan growth. These financial instruments include commitments to extend credit, standby and performance letters of credit and forward loan sale contracts. These financial instruments involve, to varying degrees, elements of credit and interest rate risk in excess of the amount recognized in the consolidated balance sheet. The contract or notional amounts of these financial instruments reflect the extent of involvement the Corporation has in particular classes of financial instruments.
The Corporation’s exposure to credit loss in the event of non-performance by the other party to the financial instrument for commitments to extend credit and standby and performance letters of credit is represented by the contractual amount of those instruments. The Corporation uses the same credit policies in making commitments and conditional obligations as it does for on-balance sheet instruments. Unless noted otherwise, the Corporation does not require and is not required to pledge collateral or other security to support financial instruments with credit risk. These commitments expire over time as detailed in Table 12.
Table 12—Contractual Obligations and Commitments
The following table sets forth contractual obligations and other commitments representing required and potential cash outflows, including interest payable, at
December 31, 2018
. The contractual amounts to be paid on variable rate obligations are affected by changes in the market interest rates. Future changes in the market interest rates could materially affect the contractual amounts to be paid.
|
Payments Due by Period
|
|||||||||||||||||||
|
(Dollars in thousands)
|
Total
|
Due in One Year or Less
|
Due after One Year to Three Years
|
Due after Three Years to Five Years
|
Due in Over Five Years
|
||||||||||||||
|
Short-term borrowings
|
$
|
189,768
|
|
$
|
189,768
|
|
$
|
—
|
|
$
|
—
|
|
$
|
—
|
|
||||
|
Long-term debt and interest
|
151,719
|
|
23,110
|
|
107,935
|
|
20,674
|
|
—
|
|
|||||||||
|
Subordinated notes (a)
|
133,815
|
|
4,800
|
|
8,523
|
|
11,634
|
|
108,858
|
|
|||||||||
|
Time deposits (b)
|
691,507
|
|
401,432
|
|
177,775
|
|
108,414
|
|
3,886
|
|
|||||||||
|
Operating leases
|
55,515
|
|
3,536
|
|
7,320
|
|
7,270
|
|
37,389
|
|
|||||||||
|
Standby, performance and other letters of credit
|
61,192
|
|
53,192
|
|
7,727
|
|
149
|
|
124
|
|
|||||||||
|
Commitments to extend credit (c)
|
1,276,745
|
|
376,770
|
|
209,307
|
|
96,117
|
|
594,551
|
|
|||||||||
|
Net asset/liability derivative loan commitments (d)
|
437
|
|
437
|
|
—
|
|
—
|
|
—
|
|
|||||||||
|
Other long-term obligations (e)
|
14,922
|
|
5,421
|
|
7,766
|
|
1,656
|
|
79
|
|
|||||||||
|
Total contractual obligations
|
$
|
2,575,620
|
|
$
|
1,058,466
|
|
$
|
526,353
|
|
$
|
245,914
|
|
$
|
744,887
|
|
||||
Notes: (a) Includes interest for fixed and variable rate components. As specified in the note agreements, the Corporation has the option to redeem the Notes in whole or in part at a redemption price equal to 100% of the principal amount of the redeemed Notes, plus accrued and unpaid interest to the date of the redemption.
|
(b)
|
Includes interest on both fixed and variable rate obligations. The interest expense is based upon the fourth quarter average interest rate.
|
|
(c)
|
Includes both revolving and straight lines of credit. Revolving lines are reported in the “Due in One Year or Less” category.
|
|
(d)
|
Includes the fair value of these contractual arrangements at December 31,
2018
.
|
(e) Represents obligations to the Corporation's third-party data processing provider and other vendors.
|
41
|
Interest Rate Sensitivity
Interest rate sensitivity is a function of the repricing characteristics of the Corporation's assets and liabilities. Minimizing the balance sheet's maturity and repricing risk is a continual focus in a changing interest rate environment. The Corporation uses a variety of techniques to assist in identifying the potential range of risk. A simulation model is utilized to prepare a maturity/repricing Gap analysis as well as an Earnings at Risk analysis under various interest rate scenarios.
The gap analysis identifies interest rate risk by identifying re-pricing gaps in the Corporation’s balance sheet. The model is based on expected cash flows and re-pricing characteristics for all financial instruments at a point in time and incorporates Corporation developed, market influenced assumptions regarding the impact of changing interest rates on these financial instruments. All assets and liabilities are modeled to reflect some level of behavioral optionality, such as prepayments on loans, early call features on investments or potential pricing change and/or product change to interest bearing deposits. The Corporation projects all non-interest bearing deposits to be considered non-rate sensitive. These assumptions are based upon historic behavior; however, they are inherently uncertain and thus cannot precisely predict the impact of changes in interest rates. While actual results will differ from simulated results due to customer behavioral change and/or market and regulatory influences, the following models are important tools to guide management.
Table 13—Interest Rate Sensitivity Gap Analysis
The following table presents the Corporation’s gap analysis at
December 31, 2018
:
|
(Dollars in thousands)
|
Within Three Months
|
After Three Months to Twelve Months
|
After One Year to Five Years
|
Over Five Years
|
Non-Rate Sensitive
|
Total
|
|||||||||||||||||
|
Assets:
|
|||||||||||||||||||||||
|
Cash and due from banks
|
$
|
—
|
|
$
|
—
|
|
$
|
—
|
|
$
|
—
|
|
$
|
61,573
|
|
$
|
61,573
|
|
|||||
|
Interest-earning deposits with other banks
|
47,847
|
|
—
|
|
—
|
|
—
|
|
—
|
|
47,847
|
|
|||||||||||
|
Investment securities
|
30,350
|
|
65,517
|
|
257,214
|
|
128,637
|
|
(8,412
|
)
|
473,306
|
|
|||||||||||
|
Federal Home Loan Bank, Federal Reserve Bank and other stock, at cost
|
—
|
|
—
|
|
—
|
|
—
|
|
28,337
|
|
28,337
|
|
|||||||||||
|
Loans held for sale
|
1,754
|
|
—
|
|
—
|
|
—
|
|
—
|
|
1,754
|
|
|||||||||||
|
Loans and leases, net of reserve for loan and lease losses
|
2,181,551
|
|
353,963
|
|
1,358,146
|
|
109,428
|
|
(25,878
|
)
|
3,977,210
|
|
|||||||||||
|
Other assets
|
—
|
|
—
|
|
—
|
|
—
|
|
394,320
|
|
394,320
|
|
|||||||||||
|
Total assets
|
$
|
2,261,502
|
|
$
|
419,480
|
|
$1,615,360
|
$238,065
|
$
|
449,940
|
|
$
|
4,984,347
|
|
|||||||||
|
Liabilities and shareholders' equity:
|
|||||||||||||||||||||||
|
Noninterest-bearing deposits
|
$
|
—
|
|
$
|
—
|
|
$
|
—
|
|
$
|
—
|
|
$
|
1,055,919
|
|
$
|
1,055,919
|
|
|||||
|
Interest-bearing demand deposits
|
1,377,171
|
|
—
|
|
—
|
|
—
|
|
—
|
|
1,377,171
|
|
|||||||||||
|
Savings deposits
|
784,720
|
|
—
|
|
—
|
|
—
|
|
(1,954
|
)
|
782,766
|
|
|||||||||||
|
Time deposits
|
148,837
|
|
245,493
|
|
272,402
|
|
3,519
|
|
(174
|
)
|
670,077
|
|
|||||||||||
|
Borrowings
|
209,768
|
|
10,000
|
|
210,000
|
|
—
|
|
(96
|
)
|
429,672
|
|
|||||||||||
|
Other liabilities
|
—
|
|
—
|
|
—
|
|
—
|
|
44,609
|
|
44,609
|
|
|||||||||||
|
Shareholders' equity
|
—
|
|
—
|
|
—
|
|
—
|
|
624,133
|
|
624,133
|
|
|||||||||||
|
Total liabilities and shareholders' equity
|
$
|
2,520,496
|
|
$
|
255,493
|
|
$
|
482,402
|
|
$
|
3,519
|
|
$
|
1,722,437
|
|
$
|
4,984,347
|
|
|||||
|
Interest rate swaps
|
$
|
18,839
|
|
$
|
—
|
|
$
|
—
|
|
$
|
—
|
|
$
|
—
|
|
||||||||
|
Incremental gap
|
$
|
(240,155
|
)
|
$
|
163,987
|
|
$
|
1,132,958
|
|
$
|
234,546
|
|
$
|
(1,272,497
|
)
|
||||||||
|
Cumulative gap
|
$
|
(240,155
|
)
|
$
|
(76,168
|
)
|
$
|
1,056,790
|
|
$
|
1,291,336
|
|
|||||||||||
|
Cumulative gap as a percentage of interest-earning assets
|
(5.3
|
)%
|
(1.7
|
)%
|
23.2
|
%
|
28.4
|
%
|
|||||||||||||||
The table above indicates that the Corporation should anticipate a greater amount of liabilities repricing over assets in the near term. However, this table and analysis is limited as it does not take into account the magnitude of repricing due to rate changes.
|
42
|
Table 14—Net Interest Income - Summary of Earnings at Risk Simulation
Management also performs a simulation of net interest income to measure interest rate exposure. The following table demonstrates the anticipated impact of an instantaneous and parallel interest rate shift, or "shock," to the yield curve on the Corporation’s net interest income over the next twelve months. This simulation incorporates the same assumptions noted above and assumes a static balance sheet with no incremental growth in interest-earning assets or interest-bearing liabilities over the next twelve months.
The changes to net interest income are shown in the below table at
December 31, 2018
. The results suggest the Corporation's year-end balance sheet is slightly asset sensitive as net interest income is projected to increase in a rising rate environment. The level of asset sensitivity decreased slightly from prior year-end results as a loan beta of 50% was recently added to new loan volume in the model to reflect competitive pricing in a changing rate environment. The changes to net interest income shown below are in compliance with the Corporation's policy guidelines.
|
Estimated Change in Net Interest Income Over Next 12 Months
|
||||||
|
(Dollars in thousands)
|
Amount
|
Percent
|
||||
|
Rate shock - Change in interest rates
|
||||||
|
+300 basis points
|
$
|
13,517
|
|
7.96
|
%
|
|
|
+200 basis points
|
8,687
|
|
5.11
|
|
||
|
+100 basis points
|
3,862
|
|
2.27
|
|
||
|
-100 basis points
|
(7,178
|
)
|
(4.23
|
)
|
||
|
-200 basis points
|
(15,829
|
)
|
(9.32
|
)
|
||
The down 200 basis points rate scenario was included in the above table as short-term rates have exceeded 2.00% during the latter half of 2018.
Recent Accounting Pronouncements
For information regarding recent accounting pronouncements, refer to Note 1, “Summary of Significant Accounting Policies” of this Form 10-K.
|
Item 7A.
|
Quantitative and Qualitative Disclosures About Market Risk
|
Market risk is the risk of loss from adverse changes in market prices and rates. In the normal course of its business activities including lending, investing, receiving deposits and borrowing funds, the Corporation is subject to changes in the economic value and/or earnings potential of the assets and liabilities due to changes in interest rates. The Corporation’s Investment Asset/Liability Management Committee, is responsible for managing interest rate risk in a manner so as to provide adequate and reliable earnings. This is accomplished through the establishment of policy limits on maximum risk exposures, as well as the regular and timely monitoring of reports designed to quantify risk and return levels. The Corporation’s Board of Directors establishes policies that govern interest rate risk management.
Information with respect to quantitative and qualitative disclosures about market risk can be found in Item 7, “Management’s Discussion and Analysis of Financial Condition and Results of Operations” including Liquidity and Interest Rate Sensitivity.
|
43
|
|
Item 8.
|
Financial Statements and Supplementary Data
|
The following audited consolidated financial statements and related documents are set forth in this Annual Report on Form 10-K on the following pages:
|
Page
|
|
|
44
|
Report of Independent Registered Public Accounting Firm
To the Shareholders and Board of Directors
Univest Financial Corporation:
Opinion on the Consolidated
Financial Statements
We have audited the accompanying consolidated balance sheets of Univest Financial Corporation and subsidiaries (the Company) as of December 31, 2018 and 2017, the related consolidated statements of income, comprehensive income, changes in shareholders’ equity, and cash flows for each of the years in the three‑year period ended December 31, 2018, and the related notes (collectively, the consolidated financial statements). In our opinion, the consolidated financial statements present fairly, in all material respects, the financial position of the Company as of December 31, 2018 and 2017, and the results of its operations and its cash flows for each of the years in the three‑year period ended December 31, 2018, in conformity with U.S. generally accepted accounting principles.
We also have audited, in accordance with the standards of the Public Company Accounting Oversight Board (United States) (PCAOB), the Company’s internal control over financial reporting as of December 31, 2018, based on criteria established in
Internal Control - Integrated Framework (2013)
issued by the Committee of Sponsoring Organizations of the Treadway Commission, and our report dated February 28, 2019 expressed an unqualified opinion on the effectiveness of the Company’s internal control over financial reporting.
Basis for Opinion
These consolidated financial statements are the responsibility of the Company’s management. Our responsibility is to express an opinion on these consolidated financial statements based on our audits. We are a public accounting firm registered with the PCAOB and are required to be independent with respect to the Company in accordance with the U.S. federal securities laws and the applicable rules and regulations of the Securities and Exchange Commission and the PCAOB.
We conducted our audits in accordance with the standards of the PCAOB. Those standards require that we plan and perform the audit to obtain reasonable assurance about whether the consolidated financial statements are free of material misstatement, whether due to error or fraud. Our audits included performing procedures to assess the risks of material misstatement of the consolidated financial statements, whether due to error or fraud, and performing procedures that respond to those risks. Such procedures included examining, on a test basis, evidence regarding the amounts and disclosures in the consolidated financial statements. Our audits also included evaluating the accounting principles used and significant estimates made by management, as well as evaluating the overall presentation of the consolidated financial statements. We believe that our audits provide a reasonable basis for our opinion.

We have served as the Company’s auditor since 2004.
Philadelphia, Pennsylvania
February 28, 2019
|
45
|
UNIVEST FINANCIAL CORPORATION
CONSOLIDATED BALANCE SHEETS
|
At December 31,
|
|||||||
|
(Dollars in thousands, except share data)
|
2018
|
2017
|
|||||
|
ASSETS
|
|||||||
|
Cash and due from banks
|
$
|
61,573
|
|
$
|
46,721
|
|
|
|
Interest-earning deposits with other banks
|
47,847
|
|
28,688
|
|
|||
|
Cash and cash equivalents
|
109,420
|
|
75,409
|
|
|||
|
Investment securities held-to-maturity (fair value
$141,575
and
$55,320
at
December 31, 2018
and
2017
, respectively)
|
142,634
|
|
55,564
|
|
|||
|
Investment securities available-for-sale
|
328,507
|
|
391,457
|
|
|||
|
Investments in equity securities
|
2,165
|
|
7,061
|
|
|||
|
Federal Home Loan Bank, Federal Reserve Bank and other stock, at cost
|
28,337
|
|
27,204
|
|
|||
|
Loans held for sale
|
1,754
|
|
1,642
|
|
|||
|
Loans and leases held for investment
|
4,006,574
|
|
3,620,067
|
|
|||
|
Less: Reserve for loan and lease losses
|
(29,364
|
)
|
(21,555
|
)
|
|||
|
Net loans and leases held for investment
|
3,977,210
|
|
3,598,512
|
|
|||
|
Premises and equipment, net
|
59,559
|
|
61,797
|
|
|||
|
Goodwill
|
172,559
|
|
172,559
|
|
|||
|
Other intangibles, net of accumulated amortization and fair value adjustments of
$25,203
and
$21,825
at
December 31, 2018
and
2017
, respectively
|
11,990
|
|
13,909
|
|
|||
|
Bank owned life insurance
|
111,599
|
|
108,246
|
|
|||
|
Accrued interest receivable and other assets
|
38,613
|
|
41,502
|
|
|||
|
Total assets
|
$
|
4,984,347
|
|
$
|
4,554,862
|
|
|
|
LIABILITIES
|
|||||||
|
Noninterest-bearing deposits
|
$
|
1,055,919
|
|
$
|
1,040,026
|
|
|
|
Interest-bearing deposits:
|
|||||||
|
Demand deposits
|
1,377,171
|
|
1,109,438
|
|
|||
|
Savings deposits
|
782,766
|
|
830,706
|
|
|||
|
Time deposits
|
670,077
|
|
574,749
|
|
|||
|
Total deposits
|
3,885,933
|
|
3,554,919
|
|
|||
|
Short-term borrowings
|
189,768
|
|
105,431
|
|
|||
|
Long-term debt
|
145,330
|
|
155,828
|
|
|||
|
Subordinated notes
|
94,574
|
|
94,331
|
|
|||
|
Accrued interest payable and other liabilities
|
44,609
|
|
40,979
|
|
|||
|
Total liabilities
|
4,360,214
|
|
3,951,488
|
|
|||
|
SHAREHOLDERS’ EQUITY
|
|||||||
|
Common stock, $5 par value: 48,000,000 shares authorized at
December 31, 2018
and
2017
;
31,556,799
shares issued at
December 31, 2018
and
2017
;
29,270,852
and
29,334,859
shares outstanding at
December 31, 2018
and
2017
, respectively
|
157,784
|
|
157,784
|
|
|||
|
Additional paid-in capital
|
292,401
|
|
290,133
|
|
|||
|
Retained earnings
|
248,167
|
|
216,761
|
|
|||
|
Accumulated other comprehensive loss, net of tax benefit
|
(28,416
|
)
|
(17,771
|
)
|
|||
|
Treasury stock, at cost;
2,285,947
and
2,221,940
shares at
December 31, 2018
and
2017
, respectively
|
(45,803
|
)
|
(43,533
|
)
|
|||
|
Total shareholders’ equity
|
624,133
|
|
603,374
|
|
|||
|
Total liabilities and shareholders’ equity
|
$
|
4,984,347
|
|
$
|
4,554,862
|
|
|
See accompanying notes to consolidated financial statements.
|
46
|
UNIVEST FINANCIAL CORPORATION
CONSOLIDATED STATEMENTS OF INCOME
|
|
For the Years Ended December 31,
|
||||||||||
|
(Dollars in thousands, except per share data)
|
2018
|
2017
|
2016
|
||||||||
|
Interest income
|
|||||||||||
|
Interest and fees on loans and leases:
|
|||||||||||
|
Taxable
|
$
|
166,304
|
|
$
|
143,176
|
|
$
|
110,119
|
|
||
|
Exempt from federal income taxes
|
9,889
|
|
8,442
|
|
7,545
|
|
|||||
|
Total interest and fees on loans and leases
|
176,193
|
|
151,618
|
|
117,664
|
|
|||||
|
Interest and dividends on investment securities:
|
|||||||||||
|
Taxable
|
9,388
|
|
7,343
|
|
5,380
|
|
|||||
|
Exempt from federal income taxes
|
1,841
|
|
2,274
|
|
2,712
|
|
|||||
|
Interest on deposits with other banks
|
1,101
|
|
280
|
|
61
|
|
|||||
|
Interest and dividends on other earning assets
|
1,965
|
|
1,500
|
|
790
|
|
|||||
|
Total interest income
|
190,488
|
|
163,015
|
|
126,607
|
|
|||||
|
Interest expense
|
|||||||||||
|
Interest on demand deposits
|
11,061
|
|
3,917
|
|
1,902
|
|
|||||
|
Interest on savings deposits
|
2,357
|
|
2,089
|
|
1,052
|
|
|||||
|
Interest on time deposits
|
8,768
|
|
5,271
|
|
4,261
|
|
|||||
|
Interest on short-term borrowings
|
2,420
|
|
904
|
|
748
|
|
|||||
|
Interest on long-term debt and subordinated notes
|
7,820
|
|
7,658
|
|
4,419
|
|
|||||
|
Total interest expense
|
32,426
|
|
19,839
|
|
12,382
|
|
|||||
|
Net interest income
|
158,062
|
|
143,176
|
|
114,225
|
|
|||||
|
Provision for loan and lease losses
|
20,310
|
|
9,892
|
|
4,821
|
|
|||||
|
Net interest income after provision for loan and lease losses
|
137,752
|
|
133,284
|
|
109,404
|
|
|||||
|
Noninterest income
|
|||||||||||
|
Trust fee income
|
7,882
|
|
8,055
|
|
7,741
|
|
|||||
|
Service charges on deposit accounts
|
5,632
|
|
5,482
|
|
4,691
|
|
|||||
|
Investment advisory commission and fee income
|
15,098
|
|
13,454
|
|
11,424
|
|
|||||
|
Insurance commission and fee income
|
15,658
|
|
14,788
|
|
14,603
|
|
|||||
|
Other service fee income
|
9,332
|
|
8,656
|
|
7,836
|
|
|||||
|
Bank owned life insurance income
|
3,174
|
|
3,988
|
|
2,931
|
|
|||||
|
Net gain on sales of investment securities
|
10
|
|
48
|
|
518
|
|
|||||
|
Net gain on mortgage banking activities
|
3,125
|
|
4,023
|
|
6,027
|
|
|||||
|
Other income
|
262
|
|
746
|
|
192
|
|
|||||
|
Total noninterest income
|
60,173
|
|
59,240
|
|
55,963
|
|
|||||
|
Noninterest expense
|
|||||||||||
|
Salaries, benefits and commissions
|
80,609
|
|
75,992
|
|
69,244
|
|
|||||
|
Net occupancy
|
10,260
|
|
10,433
|
|
9,638
|
|
|||||
|
Equipment
|
4,146
|
|
4,118
|
|
3,489
|
|
|||||
|
Data processing
|
9,014
|
|
8,500
|
|
6,981
|
|
|||||
|
Professional fees
|
5,391
|
|
5,325
|
|
4,547
|
|
|||||
|
Marketing and advertising
|
1,800
|
|
1,485
|
|
2,015
|
|
|||||
|
Deposit insurance premiums
|
1,836
|
|
1,636
|
|
1,713
|
|
|||||
|
Intangible expenses
|
2,166
|
|
2,582
|
|
5,528
|
|
|||||
|
Acquisition-related costs
|
—
|
|
—
|
|
10,257
|
|
|||||
|
Integration costs
|
—
|
|
—
|
|
5,667
|
|
|||||
|
Restructuring charges
|
571
|
|
—
|
|
1,731
|
|
|||||
|
Other expense
|
21,446
|
|
20,642
|
|
21,171
|
|
|||||
|
Total noninterest expense
|
137,239
|
|
130,713
|
|
141,981
|
|
|||||
|
Income before income taxes
|
60,686
|
|
61,811
|
|
23,386
|
|
|||||
|
Income taxes
|
10,143
|
|
17,717
|
|
3,881
|
|
|||||
|
Net income
|
$
|
50,543
|
|
$
|
44,094
|
|
$
|
19,505
|
|
||
|
Net income per share:
|
|||||||||||
|
Basic
|
$
|
1.72
|
|
$
|
1.64
|
|
$
|
0.85
|
|
||
|
Diluted
|
1.72
|
|
1.64
|
|
0.84
|
|
|||||
|
Dividends declared
|
0.80
|
|
0.80
|
|
0.80
|
|
|||||
See accompanying notes to consolidated financial statements.
|
47
|
UNIVEST FINANCIAL CORPORATION
CONSOLIDATED STATEMENTS OF COMPREHENSIVE INCOME
|
|
For the Years Ended December 31,
|
||||||||||||||||||||||||||||||||||
|
(Dollars in thousands)
|
2018
|
2017
|
2016
|
||||||||||||||||||||||||||||||||
|
Before
Tax Amount |
Tax
Expense (Benefit) |
Net of
Tax Amount |
Before
Tax Amount |
Tax
Expense (Benefit) |
Net of
Tax Amount |
Before
Tax Amount |
Tax
Expense (Benefit) |
Net of
Tax Amount |
|||||||||||||||||||||||||||
|
Income
|
$
|
60,686
|
|
$
|
10,143
|
|
$
|
50,543
|
|
$
|
61,811
|
|
$
|
17,717
|
|
$
|
44,094
|
|
$
|
23,386
|
|
$
|
3,881
|
|
$
|
19,505
|
|
||||||||
|
Other comprehensive income:
|
|||||||||||||||||||||||||||||||||||
|
Net unrealized (losses) gains on available-for-sale investment securities:
|
|||||||||||||||||||||||||||||||||||
|
Net unrealized holding (losses) gains arising during the period
|
(7,280
|
)
|
(1,529
|
)
|
(5,751
|
)
|
1,474
|
|
516
|
|
958
|
|
(6,245
|
)
|
(2,186
|
)
|
(4,059
|
)
|
|||||||||||||||||
|
Less: reclassification adjustment for net gains on sales realized in net income (1)
|
(10
|
)
|
(2
|
)
|
(8
|
)
|
(48
|
)
|
(17
|
)
|
(31
|
)
|
(518
|
)
|
(181
|
)
|
(337
|
)
|
|||||||||||||||||
|
Total net unrealized (losses) gains on available-for-sale investment securities
|
(7,290
|
)
|
(1,531
|
)
|
(5,759
|
)
|
1,426
|
|
499
|
|
927
|
|
(6,763
|
)
|
(2,367
|
)
|
(4,396
|
)
|
|||||||||||||||||
|
Net unrealized gains on interest rate swaps used in cash flow hedges:
|
|||||||||||||||||||||||||||||||||||
|
Net unrealized holding gains (losses) arising during the period
|
74
|
|
16
|
|
58
|
|
49
|
|
17
|
|
32
|
|
(86
|
)
|
(30
|
)
|
(56
|
)
|
|||||||||||||||||
|
Less: reclassification adjustment for net losses realized in net income (2)
|
15
|
|
3
|
|
12
|
|
182
|
|
64
|
|
118
|
|
308
|
|
108
|
|
200
|
|
|||||||||||||||||
|
Total net unrealized gains on interest rate swaps used in cash flow hedges
|
89
|
|
19
|
|
70
|
|
231
|
|
81
|
|
150
|
|
222
|
|
78
|
|
144
|
|
|||||||||||||||||
|
Defined benefit pension plans:
|
|||||||||||||||||||||||||||||||||||
|
Net unrealized losses arising during the period
|
(1,603
|
)
|
(337
|
)
|
(1,266
|
)
|
(14
|
)
|
(5
|
)
|
(9
|
)
|
(155
|
)
|
(54
|
)
|
(101
|
)
|
|||||||||||||||||
|
Less: amortization of net actuarial loss included in net periodic pension costs (3)
|
1,124
|
|
236
|
|
888
|
|
1,227
|
|
429
|
|
798
|
|
1,321
|
|
462
|
|
859
|
|
|||||||||||||||||
|
Less: accretion of prior service cost included in net periodic pension costs (3)
|
(283
|
)
|
(59
|
)
|
(224
|
)
|
(282
|
)
|
(99
|
)
|
(183
|
)
|
(283
|
)
|
(99
|
)
|
(184
|
)
|
|||||||||||||||||
|
Less: reclassification adjustment for net losses realized in net income (4)
|
—
|
|
—
|
|
—
|
|
—
|
|
—
|
|
—
|
|
1,434
|
|
502
|
|
932
|
|
|||||||||||||||||
|
Total defined benefit pension plans
|
(762
|
)
|
(160
|
)
|
(602
|
)
|
931
|
|
325
|
|
606
|
|
2,317
|
|
811
|
|
1,506
|
|
|||||||||||||||||
|
Other comprehensive (loss) income
|
(7,963
|
)
|
(1,672
|
)
|
(6,291
|
)
|
2,588
|
|
905
|
|
1,683
|
|
(4,224
|
)
|
(1,478
|
)
|
(2,746
|
)
|
|||||||||||||||||
|
Total comprehensive income
|
$
|
52,723
|
|
$
|
8,471
|
|
$
|
44,252
|
|
$
|
64,399
|
|
$
|
18,622
|
|
$
|
45,777
|
|
$
|
19,162
|
|
$
|
2,403
|
|
$
|
16,759
|
|
||||||||
(1) Included in net gain on sales of investment securities on the consolidated statements of income (before tax amount).
(2) Included in interest expense on demand deposits on the consolidated statements of income (before tax amount).
(3) These accumulated other comprehensive loss components are included in the computation of net periodic pension cost (before tax amount). See Note 12, "Retirement Plans and Other Postretirement Benefits" for additional details.
(4) Included in pension cost (before tax amount). See Note 12, "Retirement Plans and Other Postretirement Benefits" for additional details.
See accompanying notes to consolidated financial statements.
|
48
|
UNIVEST FINANCIAL CORPORATION
CONSOLIDATED STATEMENTS OF CHANGES IN SHAREHOLDERS’ EQUITY
|
(Dollars in thousands, except per share data)
|
Common
Shares Outstanding |
Common
Stock |
Additional
Paid-in Capital |
Retained
Earnings |
Accumulated
Other Comprehensive (Loss) Income |
Treasury
Stock |
Total
|
|||||||||||||||||||
|
Balance at December 31, 2015
|
19,530,930
|
|
$
|
110,271
|
|
$
|
121,280
|
|
$
|
193,446
|
|
$
|
(16,708
|
)
|
$
|
(46,715
|
)
|
$
|
361,574
|
|
||||||
|
Net income
|
—
|
|
—
|
|
—
|
|
19,505
|
|
—
|
|
—
|
|
19,505
|
|
||||||||||||
|
Other comprehensive loss, net of income tax benefit
|
—
|
|
—
|
|
—
|
|
—
|
|
(2,746
|
)
|
—
|
|
(2,746
|
)
|
||||||||||||
|
Cash dividends declared ($0.80 per share)
|
—
|
|
—
|
|
—
|
|
(18,435
|
)
|
—
|
|
—
|
|
(18,435
|
)
|
||||||||||||
|
Stock issued under dividend reinvestment and employee stock purchase plans
|
115,269
|
|
—
|
|
59
|
|
—
|
|
—
|
|
2,413
|
|
2,472
|
|
||||||||||||
|
Issuance of common stock, acquisition
|
6,857,529
|
|
34,288
|
|
109,858
|
|
—
|
|
—
|
|
—
|
|
144,146
|
|
||||||||||||
|
Exercise of stock options
|
261,050
|
|
—
|
|
59
|
|
—
|
|
—
|
|
4,909
|
|
4,968
|
|
||||||||||||
|
Stock-based compensation
|
—
|
|
—
|
|
2,084
|
|
—
|
|
—
|
|
—
|
|
2,084
|
|
||||||||||||
|
Purchases of treasury stock
|
(328,271
|
)
|
—
|
|
—
|
|
—
|
|
—
|
|
(8,359
|
)
|
(8,359
|
)
|
||||||||||||
|
Restricted stock awards granted, net of cancellations
|
152,846
|
|
—
|
|
(2,846
|
)
|
—
|
|
—
|
|
2,846
|
|
—
|
|
||||||||||||
|
Balance at December 31, 2016
|
26,589,353
|
|
$
|
144,559
|
|
$
|
230,494
|
|
$
|
194,516
|
|
$
|
(19,454
|
)
|
$
|
(44,906
|
)
|
$
|
505,209
|
|
||||||
|
Net income
|
—
|
|
—
|
|
—
|
|
44,094
|
|
—
|
|
—
|
|
44,094
|
|
||||||||||||
|
Other comprehensive income, net of income tax
|
—
|
|
—
|
|
—
|
|
—
|
|
1,683
|
|
—
|
|
1,683
|
|
||||||||||||
|
Cash dividends declared ($0.80 per share)
|
—
|
|
—
|
|
—
|
|
(21,849
|
)
|
—
|
|
—
|
|
(21,849
|
)
|
||||||||||||
|
Stock issued under dividend reinvestment and employee stock purchase plans
|
82,694
|
|
—
|
|
181
|
|
—
|
|
—
|
|
2,232
|
|
2,413
|
|
||||||||||||
|
Issuance of common stock, public offering
|
2,645,000
|
|
13,225
|
|
57,276
|
|
—
|
|
—
|
|
—
|
|
70,501
|
|
||||||||||||
|
Exercise of stock options
|
92,370
|
|
—
|
|
(119
|
)
|
—
|
|
—
|
|
1,795
|
|
1,676
|
|
||||||||||||
|
Stock-based compensation
|
—
|
|
—
|
|
3,166
|
|
—
|
|
—
|
|
—
|
|
3,166
|
|
||||||||||||
|
Purchases of treasury stock
|
(119,798
|
)
|
—
|
|
—
|
|
—
|
|
—
|
|
(3,519
|
)
|
(3,519
|
)
|
||||||||||||
|
Restricted stock awards granted, net of cancellations
|
45,240
|
|
—
|
|
(865
|
)
|
—
|
|
—
|
|
865
|
|
—
|
|
||||||||||||
|
Balance at December 31, 2017
|
29,334,859
|
|
$
|
157,784
|
|
$
|
290,133
|
|
$
|
216,761
|
|
$
|
(17,771
|
)
|
$
|
(43,533
|
)
|
$
|
603,374
|
|
||||||
|
Adjustment to initially apply ASU No. 2016-01 for equity securities measured at fair value (1)
|
—
|
|
—
|
|
—
|
|
433
|
|
(433
|
)
|
—
|
|
—
|
|
||||||||||||
|
Adjustment to initially apply ASU No. 2018-02 for reclassification of stranded net tax charges (1)
|
—
|
|
—
|
|
—
|
|
3,921
|
|
(3,921
|
)
|
—
|
|
—
|
|
||||||||||||
|
Net income
|
—
|
|
—
|
|
—
|
|
50,543
|
|
—
|
|
—
|
|
50,543
|
|
||||||||||||
|
Other comprehensive loss, net of income tax benefit
|
—
|
|
—
|
|
—
|
|
—
|
|
(6,291
|
)
|
—
|
|
(6,291
|
)
|
||||||||||||
|
Cash dividends declared ($0.80 per share)
|
—
|
|
—
|
|
—
|
|
(23,492
|
)
|
—
|
|
—
|
|
(23,492
|
)
|
||||||||||||
|
Stock issued under dividend reinvestment and employee stock purchase plans
|
84,466
|
|
—
|
|
152
|
|
1
|
|
—
|
|
2,142
|
|
2,295
|
|
||||||||||||
|
Exercise of stock options
|
59,750
|
|
—
|
|
(43
|
)
|
—
|
|
—
|
|
1,174
|
|
1,131
|
|
||||||||||||
|
Stock-based compensation
|
—
|
|
—
|
|
2,557
|
|
—
|
|
—
|
|
—
|
|
2,557
|
|
||||||||||||
|
Purchases of treasury stock
|
(233,977
|
)
|
—
|
|
—
|
|
—
|
|
—
|
|
(5,984
|
)
|
(5,984
|
)
|
||||||||||||
|
Restricted stock awards granted, net of cancellations
|
25,754
|
|
—
|
|
(398
|
)
|
—
|
|
—
|
|
398
|
|
—
|
|
||||||||||||
|
Balance at December 31, 2018
|
29,270,852
|
|
$
|
157,784
|
|
$
|
292,401
|
|
$
|
248,167
|
|
$
|
(28,416
|
)
|
$
|
(45,803
|
)
|
$
|
624,133
|
|
||||||
(1) See Note 1, "Summary of Significant Accounting Policies - Accounting Pronouncements Adopted in 2018" for additional information.
See accompanying notes to consolidated financial statements.
|
49
|
UNIVEST FINANCIAL CORPORATION
CONSOLIDATED STATEMENTS OF CASH FLOWS
|
|
For the Years Ended December 31,
|
||||||||||
|
(Dollars in thousands)
|
2018
|
2017
|
2016
|
||||||||
|
Cash flows from operating activities:
|
|||||||||||
|
Net income
|
$
|
50,543
|
|
$
|
44,094
|
|
$
|
19,505
|
|
||
|
Adjustments to reconcile net income to net cash provided by operating activities:
|
|||||||||||
|
Provision for loan and lease losses
|
20,310
|
|
9,892
|
|
4,821
|
|
|||||
|
Depreciation of premises and equipment
|
5,581
|
|
5,561
|
|
4,089
|
|
|||||
|
Net gain on sales of investment securities
|
(10
|
)
|
(48
|
)
|
(518
|
)
|
|||||
|
Net gain on mortgage banking activities
|
(3,125
|
)
|
(4,023
|
)
|
(6,027
|
)
|
|||||
|
Bank owned life insurance income
|
(3,174
|
)
|
(3,988
|
)
|
(2,931
|
)
|
|||||
|
Net amortization of investment securities premiums and discounts
|
1,602
|
|
1,838
|
|
1,853
|
|
|||||
|
Amortization, fair market value adjustments and capitalization of mortgage servicing rights
|
(196
|
)
|
(87
|
)
|
(521
|
)
|
|||||
|
Net accretion of acquisition accounting fair value adjustments
|
(1,037
|
)
|
(3,022
|
)
|
(2,779
|
)
|
|||||
|
Stock-based compensation
|
2,557
|
|
3,166
|
|
2,084
|
|
|||||
|
Intangible expenses
|
2,166
|
|
2,582
|
|
5,528
|
|
|||||
|
Other adjustments to reconcile net income to cash provided by operating activities
|
305
|
|
(80
|
)
|
659
|
|
|||||
|
Deferred tax (benefit) expense
|
(599
|
)
|
7,483
|
|
942
|
|
|||||
|
Originations of loans held for sale
|
(158,097
|
)
|
(188,072
|
)
|
(258,202
|
)
|
|||||
|
Proceeds from the sale of loans held for sale
|
161,357
|
|
196,813
|
|
262,948
|
|
|||||
|
Contributions to pension and other postretirement benefit plans
|
(3,264
|
)
|
(2,295
|
)
|
(2,261
|
)
|
|||||
|
Decrease (increase) in accrued interest receivable and other assets
|
4,547
|
|
(1,369
|
)
|
1,956
|
|
|||||
|
Increase in accrued interest payable and other liabilities
|
6,540
|
|
215
|
|
2,160
|
|
|||||
|
Net cash provided by operating activities
|
86,006
|
|
68,660
|
|
33,306
|
|
|||||
|
Cash flows from investing activities:
|
|||||||||||
|
Net cash paid due to acquisitions
|
—
|
|
—
|
|
(79,206
|
)
|
|||||
|
Net capital expenditures
|
(3,119
|
)
|
(3,961
|
)
|
(12,644
|
)
|
|||||
|
Proceeds from maturities, calls and principal repayments of securities held-to-maturity
|
11,526
|
|
23,265
|
|
21,000
|
|
|||||
|
Proceeds from maturities, calls and principal repayments of securities available-for-sale
|
54,702
|
|
64,954
|
|
72,541
|
|
|||||
|
Proceeds from sales of securities available-for-sale
|
1,010
|
|
7,069
|
|
77,290
|
|
|||||
|
Purchases of investment securities held-to-maturity
|
(99,132
|
)
|
(54,149
|
)
|
(5,071
|
)
|
|||||
|
Purchases of investment securities available-for-sale
|
(1,986
|
)
|
(33,334
|
)
|
(48,032
|
)
|
|||||
|
Proceeds from sales of money market mutual funds
|
11,225
|
|
29,948
|
|
38,386
|
|
|||||
|
Purchases of money market mutual funds
|
(6,482
|
)
|
(25,149
|
)
|
(32,444
|
)
|
|||||
|
Net increase in other investments
|
(1,133
|
)
|
(2,335
|
)
|
(11,773
|
)
|
|||||
|
Proceeds from sale of portfolio loans
|
—
|
|
—
|
|
2,435
|
|
|||||
|
Net increase in loans and leases
|
(398,240
|
)
|
(338,481
|
)
|
(337,961
|
)
|
|||||
|
Proceeds from sales of other real estate owned
|
490
|
|
3,996
|
|
885
|
|
|||||
|
Purchases of bank owned life insurance
|
(1,563
|
)
|
(7,271
|
)
|
—
|
|
|||||
|
Proceeds from bank owned life insurance
|
1,384
|
|
2,961
|
|
662
|
|
|||||
|
Net cash used in investing activities
|
(431,318
|
)
|
(332,487
|
)
|
(313,932
|
)
|
|||||
|
Cash flows from financing activities:
|
|||||||||||
|
Net increase in deposits
|
331,170
|
|
297,792
|
|
125,425
|
|
|||||
|
Net increase (decrease) in short-term borrowings
|
84,337
|
|
(90,740
|
)
|
123,207
|
|
|||||
|
Proceeds from issuance of long-term debt
|
10,000
|
|
95,000
|
|
20,000
|
|
|||||
|
Repayment of long-term debt
|
(20,000
|
)
|
(65,000
|
)
|
(15,000
|
)
|
|||||
|
Proceeds from issuance of subordinated notes
|
—
|
|
—
|
|
44,515
|
|
|||||
|
Payment of contingent consideration on acquisitions
|
(131
|
)
|
(5,413
|
)
|
(2,552
|
)
|
|||||
|
Proceeds from public offering of common stock
|
—
|
|
70,501
|
|
—
|
|
|||||
|
Purchases of treasury stock
|
(5,984
|
)
|
(3,519
|
)
|
(8,359
|
)
|
|||||
|
Stock issued under dividend reinvestment and employee stock purchase plans
|
2,295
|
|
2,413
|
|
2,472
|
|
|||||
|
Proceeds from exercise of stock options
|
1,131
|
|
1,676
|
|
4,968
|
|
|||||
|
Cash dividends paid
|
(23,495
|
)
|
(21,299
|
)
|
(17,024
|
)
|
|||||
|
Net cash provided by financing activities
|
379,323
|
|
281,411
|
|
277,652
|
|
|||||
|
Net decrease (increase) in cash and cash equivalents
|
34,011
|
|
17,584
|
|
(2,974
|
)
|
|||||
|
Cash and cash equivalents at beginning of year
|
75,409
|
|
57,825
|
|
60,799
|
|
|||||
|
Cash and cash equivalents at end of year
|
$
|
109,420
|
|
$
|
75,409
|
|
$
|
57,825
|
|
||
|
50
|
|
For the Years Ended December 31,
|
|||||||||||
|
2018
|
2017
|
2016
|
|||||||||
|
Supplemental disclosures of cash flow information:
|
|||||||||||
|
Cash paid for interest
|
$
|
30,875
|
|
$
|
21,493
|
|
$
|
13,982
|
|
||
|
Cash paid for income taxes, net of refunds
|
2,022
|
|
12,599
|
|
8,053
|
|
|||||
|
Non cash transactions:
|
|||||||||||
|
Transfer of loans to other real estate owned
|
$
|
477
|
|
$
|
729
|
|
$
|
2,347
|
|
||
|
Assets acquired through acquisitions
|
—
|
|
—
|
|
1,090,395
|
|
|||||
|
Liabilities assumed through acquisitions
|
—
|
|
—
|
|
911,316
|
|
|||||
See accompanying notes to consolidated financial statements.
|
51
|
UNIVEST FINANCIAL CORPORATION AND SUBSIDIARIES
Notes to Consolidated Financial Statements
(All dollar amounts presented in tables are in thousands, except per share data. “N/M” equates to “not meaningful”; “-” equates to “zero” or “doesn’t round to a reportable number”; and “N/A” equates to “not applicable”.)
Note 1. Summary of Significant Accounting Policies
Organization
Effective January 1, 2019, Univest Corporation of Pennsylvania changed its name to Univest Financial Corporation (the Corporation). The Corporation through its wholly owned subsidiary, Univest Bank and Trust Co. (the Bank), is engaged in domestic banking services for individuals, businesses, municipalities and non-profit organizations. Effective January 1, 2019, the Bank's wholly-owned subsidiary, Delview, Inc. was dissolved, with its wholly owned subsidiaries, transferring to the Bank upon dissolution. The Bank is the parent company of Girard Investment Services, LLC (formerly Univest Investments, Inc.), a full-service registered broker-dealer and a licensed insurance agency, Girard Advisory Services, LLC (formerly Girard Partners Ltd.), a registered investment advisory firm and Girard Pension Services, LLC (formerly TCG Investment Advisory, Inc.), a registered investment advisor, which provides investment consulting and management services to municipal entities. Effective January 1, 2019, the Bank's wealth management division was re-branded under the Girard name with the aforementioned name changes of several subsidiaries. The Bank is also the parent company of Univest Insurance, LLC, an independent insurance agency and Univest Capital, Inc., an equipment financing business. The Bank's subsidiaries serve to enhance the traditional banking services provided by the Bank.
At
December 31, 2018
, the Corporation has
three
reportable business segments: Banking, Wealth Management and Insurance. The Corporation determines the segments based primarily upon product and service offerings, through the types of income generated and the regulatory environment. This is strategically how the Corporation operates and has positioned itself in the marketplace. Accordingly, significant operating decisions are based upon analysis of each of these segments. For more detailed discussion and financial information on the business segments, see Note 22, “Segment Reporting.”
The Bank serves Bucks, Berks, Chester, Delaware, Lancaster, Lehigh, Montgomery, Northampton and Philadelphia Counties in Pennsylvania and Atlantic and Cape May Counties in New Jersey through
thirty-nine
banking offices and provides banking services to the residents and employees of
fourteen
retirement communities.
Principles of Consolidation
The consolidated financial statements include the accounts of the Corporation and its wholly owned subsidiaries, including the Bank as the Corporation’s primary subsidiary. All significant intercompany balances and transactions have been eliminated in consolidation. Certain prior period amounts have been reclassified to conform to the current-year presentation.
Use of Estimates
The preparation of the consolidated financial statements in conformity with U.S. generally accepted accounting principles (U.S. GAAP) requires management to make estimates and assumptions that affect the amounts reported in the financial statements and accompanying notes. Actual results could differ from those estimates. Material estimates that are particularly susceptible to significant changes include fair value measurement of investment securities available-for-sale, reserve for loan and lease losses and purchase accounting.
Interest-earning Deposits with Other Banks
Interest-earning deposits with other banks consist of deposit accounts with other financial institutions generally having maturities of
three months
or less. At times, such balances exceed the FDIC limits for insurance coverage.
Investment Securities
Securities are classified as investment securities held-to-maturity and carried at amortized cost if management has the positive intent and ability to hold the securities to maturity. Securities purchased with the intention of recognizing short-term profits are placed in the trading account and are carried at fair value. The Corporation did not have any trading account securities at
December 31, 2018
or
2017
. Securities classified as available-for-sale are those securities that the Corporation intends to hold for an indefinite period of time but not necessarily to maturity. Securities available-for-sale are carried at fair value with unrealized gains and losses, net of estimated income taxes, reflected in accumulated other comprehensive income, a separate component of shareholders' equity. Any decision to sell a security classified as available-for-sale would be based on various factors, including interest rates, changes in the maturity or mix of the Corporation's assets and liabilities, liquidity needs, regulatory capital considerations and other factors.
|
52
|
Management determines the appropriate classification of debt securities at the time of purchase and re-evaluates such designation as of each balance sheet date.
Purchase premiums and discounts are recognized in interest income using the interest method over the expected life of the securities. Due to volatility in the financial markets, there is the risk that any future fair value could vary from that disclosed in the accompanying financial statements. Realized gains and losses on the sale of investment securities are recorded on the trade date, determined using the specific identification method and are included in the consolidated statements of income.
Management evaluates debt securities, which are comprised of U.S. government, government sponsored agencies, municipalities, corporate bonds and other issuers, for other-than-temporary impairment by considering the current economic conditions, the length of time and the extent to which the fair value has been less than cost, market interest rates, creditworthiness of the issuer and the credit rating of each security. Unrealized losses on the Corporation’s investments in debt securities that are deemed temporary in nature are recognized in other comprehensive income, net of tax. Should it be determined that a security is impacted by deteriorating credit or if it is expected the value will not recover during the expected holding period, the credit portion of the loss is recognized in earnings. The Corporation does not have the intent to sell the debt securities and believes it is more likely than not, that it will not have to sell the securities before recovery of their cost basis.
The Corporation evaluates its equity securities for impairment. In addition, effective January 1, 2018, in accordance with ASU No. 2016-01, equity securities are measured at fair value with changes in fair value recognized in net income. See "Recent Accounting Pronouncements" for additional information.
Federal Home Loan Bank Stock, Federal Reserve Bank Stock and Certain Other Investments without Readily Determinable Fair Values
At
December 31, 2018
and
2017
, the Bank held
$14.6 million
, respectively, in Federal Reserve Bank stock as required by the Federal Reserve Bank. The Bank is a member of the FHLB, and as such, is required to hold FHLB stock as a condition of membership as determined by the FHLB. The Bank is required to hold additional stock in the FHLB in relation to the level of outstanding borrowings. The Bank held FHLB stock of
$13.6 million
and
$12.5 million
at
December 31, 2018
and
2017
, respectively. Because ownership is restricted, the fair values of these investments are not readily determinable. As such, these investments are recorded at cost and evaluated for other-than-temporary impairment. The Corporation determined there was
no
other-than-temporary impairment of its investments in these stocks at
December 31, 2018
or
2017
.
Loans Held for Sale
The Corporation originates mortgage loans for investment and for sale. At origination, a mortgage loan is identified as either for sale or for investment. Mortgage loans originated and intended for sale in the secondary market are carried at the lower of aggregate cost or estimated fair value. Net unrealized losses are recognized by charges to non-interest income. Cash payments and cash receipts resulting from acquisitions and sales of loans are classified as operating cash flows if those loans are acquired specifically for resale. Cash receipts resulting from sales of loans that were not specifically acquired for resale are classified as investing cash inflows regardless of a change in the purpose for holding those loans.
Loans and Leases
Loans and leases are stated at the principal amount, net of deferred fees and costs and unearned discounts. Loan commitments are made to accommodate the financial needs of the customers. These commitments represent off-balance sheet items that are unfunded. The Corporation uses the same credit policies in making commitments and conditional obligations as it does for on-balance sheet financial instruments. Accrual of interest income on loans and leases ceases when collectability of interest and/or principal is questionable. If it is determined that the collection of interest previously accrued is uncertain, such accrual is reversed and charged to current earnings. Loans and leases are considered past due based upon failure to comply with contractual terms.
A loan or lease is typically classified as nonaccrual when the contractual payment of principal or interest has become
90 days
past due or management has serious doubts about the further collectability of principal or interest, even though the loan or lease is currently performing. When a loan or lease, including a loan or lease that is impaired, is classified as nonaccrual, the accrual of interest on such a loan or lease is discontinued. A loan or lease may remain on accrual status if it is in the process of collection and is either guaranteed or well secured. When a loan or lease is placed on nonaccrual status, unpaid interest credited to income is reversed and the amortization of the deferred fees and costs is suspended. Interest payments received on nonaccrual loans and leases are either applied against principal or reported as interest income, according to management’s judgment as to the ultimate collectability of principal. Loans and leases are usually restored to accrual status when the obligation is brought current, has performed in accordance with the contractual terms for a reasonable period of time, and the ultimate collectability of the total contractual principal and interest is no longer in doubt. A loan or lease is considered impaired when, based on current information and events, it is probable that the Corporation will be unable to collect all amounts due, including principal and interest, according to the
|
53
|
contractual terms of the loan agreement or when a loan or lease is classified as a troubled debt restructuring. Interest on impaired loans and leases, which are not classified as nonaccrual, is recognized on the accrual basis.
Acquired Loans
Acquired loan portfolios are initially recorded at the acquisition date fair value. The fair value is based on guidance which defines fair value as the price that would be received to sell an asset or transfer a liability in an orderly transaction between market participants at the measurement date. Level 3 inputs are utilized to value the portfolio and include the use of present value techniques employing cash flow estimates and incorporate assumptions that marketplace participants would use in estimating fair values. In instances where reliable market information is not available, the Corporation uses assumptions in an effort to determine reasonable fair value. Specifically, management utilizes three separate fair value analyses which a market participant would employ in estimating the total fair value adjustment. The three separate fair valuation methodologies used are: 1) interest rate loan fair value analysis; 2) general credit fair value analysis; and 3) specific credit fair value analysis. There is no carryover related allowance for loan losses.
For loans acquired without evidence of credit quality deterioration, the fair value adjustments to reflect the fair value of the loans and the fair value adjustments to reflect the general credit risk of the loan portfolio are substantially recognized as interest income on a level yield amortization method based upon the expected life of the loan. Subsequent to the acquisition, the Corporation records a provision for loan losses for the acquired non-impaired loans only when additional deterioration of the portfolio is identified over the projections utilized in the initial fair value analysis.
For loans acquired with evidence of credit quality deterioration, the Corporation prepares a specific credit fair value adjustment. Management reviews the acquired loan portfolio for loans meeting the definition of an impaired loan with deteriorated credit quality. Loans meeting this definition are reviewed by comparing the contractual cash flows to expected collectible cash flows. The aggregate expected cash flows less the acquisition date fair value results in an accretable yield amount. The accretable discount amount is recognized over the life of the loans on a level yield basis as an adjustment to yield. Any disposals of loans, including sales of loans, payments in full or foreclosures result in the derecognition of the loan at its carrying value with differences in actual results reflected in interest income. After the acquisition measurement period, the present value of any decreases in expected cash flows of acquired credit impaired loans will generally result in an impairment charge recorded as a provision for loan losses, resulting in an increase to the allowance.
Loan and Lease Fees
Fees collected upon loan or lease origination and certain direct costs of originating loans and leases are deferred and recognized over the contractual lives of the related loans and leases as yield adjustments using the interest method. Upon prepayment or other disposition of the underlying loans and leases before their contractual maturities, any associated unearned fees or unamortized costs are recognized.
Reserve for Loan and Lease Losses
The reserve for loan and lease losses is maintained at a level representing management's best estimate of known risks and inherent losses in the portfolio, based upon management's evaluation of the portfolio's collectability. Management evaluates the need to establish reserves against losses on loans and leases on a quarterly basis. When changes in the reserve are necessary, an adjustment is made.
The reserve for loan and lease losses is adjusted through provisions for loan and lease losses charged against or credited to income. Loans deemed to be uncollectible are charged against the reserve for loan and lease losses, and any subsequent recoveries are credited to the reserve.
Reserve Required for Impaired Loans and Leases
A loan or lease is considered impaired when, based on current information and events, it is probable that the Bank will be unable to collect future payments of principal or interest as contractually due. The Bank applies its normal loan review procedures in determining if a loan is impaired, which includes reviewing the collectability of delinquent and internally classified loans on a regular basis and at least quarterly. In determining the likelihood of collecting principal and interest, the Bank considers all available and relevant information, including the borrower's actual and projected cash flows, balance sheet strength, liquidity and overall financial position. Additionally, all loans classified as troubled debt restructurings are considered impaired. When a loan is classified as impaired, an impairment analysis is performed within the quarter in which a loan is identified as impaired to determine if a valuation allowance is needed. The Bank re-examines each impaired loan on a quarterly basis to determine if any adjustment to the valuation allowance or net carrying amount of a loan is required. The Bank recognizes charge-offs associated with impaired loans when all or a portion of a loan is considered to be uncollectible. In measuring impairment, the Bank determines whether or not the loan is collateral dependent. A loan is collateral dependent if repayment is expected to be provided solely by the underlying collateral,
|
54
|
which includes repayment from the proceeds from the sale of the collateral, cash flows from the continued operation of the collateral, or both, and there are no other available and reliable repayment sources. To determine the initial amount of impairment for a collateral dependent loan, the Bank utilizes a recent appraisal, an agreement of sale or a letter of intent. If the fair value of the underlying collateral, less costs to sell, is less than the loan's carrying amount, the Bank adds a provision to the reserve for loan and lease losses in the amount of the difference between fair value, less costs to sell, and the loan or lease's carrying amount. In subsequent periods, the Bank takes into consideration current facts and circumstances in analyzing whether the fair value of the collateral has increased or decreased significantly such that a change to the corresponding valuation allowance is required. If current facts and circumstances are insufficient to determine fair value, the Bank obtains a new appraisal.
For loans that are not collateral dependent, the Bank establishes a specific reserve on impaired loans based on management's estimate of the discounted cash flows the Bank expects to receive from the borrower. Factors considered in evaluating such cash flows include: (1) the strength of the customer's personal or business cash flows and personal guarantees; (2) the borrower's effort to cure the delinquency; (3) the availability of other sources of repayment; (4) the type and value of collateral, if applicable; and (5) the strength of our collateral position, if applicable.
General Reserve on the Remainder of the Portfolio
The Bank establishes a general reserve for loans and leases that are not considered impaired to recognize the inherent losses associated with lending activities. This general reserve is determined by segmenting the loan portfolio and assigning reserve factors to each category. The reserve factors are calculated using the Bank's historical losses and loss emergence periods, and are adjusted for significant factors that, in management's judgment, affect the collectability of the portfolio as of the evaluation date. These significant factors include:
|
•
|
Changes in lending policies and procedures, including changes in underwriting standards and collection, charge-off and recovery practices not considered elsewhere in estimating credit losses;
|
|
•
|
Changes in national, regional, and local economic and business conditions and developments that affect the collectability of the portfolio, including the condition of various market segments;
|
|
•
|
Changes in the size and composition of the portfolio and in the terms of loans;
|
|
•
|
Changes in the experience, ability, and depth of lending management and other relevant staff;
|
|
•
|
Changes in the volume and severity of past due loans, the volume of nonaccrual loans, and the volume and severity of adversely classified or graded loans;
|
|
•
|
Changes in the quality of the institution’s loan review system;
|
|
•
|
Changes in the value of underlying collateral for collateral-dependent loans;
|
|
•
|
The existence and effect of any concentrations of credit, and changes in the level of such concentrations; and
|
|
•
|
The effect of other external factors such as competition and legal and regulatory requirements on the level of estimated credit losses in the institution’s existing portfolio.
|
The Corporation maintains a reserve in other liabilities for off-balance sheet credit exposures that currently are unfunded in categories with historical loss experience.
Premises and Equipment
Land is stated at cost, and premises and equipment are stated at cost less accumulated depreciation. Depreciation is computed on the straight-line method and charged to operating expenses over the estimated useful lives of the assets or, for leasehold improvements, over the expected life of the related lease if less than the estimated useful life of the asset. The estimated useful life for new buildings constructed on land owned is
forty years
. For
new buildings constructed on leased land or land improvements, the estimated useful life is the initial term including anticipated renewable terms, typically not exceeding twenty-five years
. The useful life of purchased existing buildings is the estimated remaining useful life at the time of the purchase. Furniture, fixtures and equipment have estimated useful lives ranging from
three
to
ten
years. When assets are retired, or otherwise disposed of, the cost and related accumulated depreciation are removed from the accounts.
Goodwill and Other Intangible Assets
The Corporation accounts for its acquisitions using the purchase accounting method. Purchase accounting requires the total purchase price to be allocated to the estimated fair values of assets acquired and liabilities assumed, including certain intangible assets that must be recognized. Typically, this allocation results in the purchase price exceeding the fair value of net assets acquired, which is recorded as goodwill. Core deposit intangibles are a measure of the value of checking, money market and savings deposits acquired in business combinations accounted for under the purchase method. Core deposit intangibles are amortized using the sum of the year’s digits over their estimated useful lives of up to
fifteen years
. Customer related intangibles are amortized over their estimated useful lives of
five
to
twelve
years. The Corporation completes a goodwill analysis at least on an annual basis or more often if events and circumstances indicate that there may be impairment. The Corporation also completes an impairment test for
|
55
|
other intangible assets on an annual basis or more often if events and circumstances indicate a possible impairment.
Mortgage servicing rights are recognized as separate assets when loans are sold and the servicing rights are retained. Capitalized mortgage servicing rights are reported in other intangible assets on the consolidated balance sheets and are amortized into noninterest income in proportion to, and over the period of, estimated net servicing income on a basis similar to the interest method and an accelerated amortization method for loan payoffs. Mortgage servicing rights are evaluated for impairment, on a quarterly basis, based upon the fair value of the servicing rights as compared to amortized cost. The Corporation estimates the fair value of mortgage servicing rights using discounted cash flow models that calculate the present value of estimated future net servicing income. The model uses readily available prepayment speed assumptions for the current interest rates of the portfolios serviced. Mortgage servicing rights are carried at the lower of amortized cost or estimated fair value. Impairment is recognized through a valuation allowance, to the extent that fair value is less than the unamortized capitalized amount. The Corporation also records servicing rights on Small Business Administration (SBA) loans.
Bank Owned Life Insurance
The Corporation has invested in bank-owned life insurance (BOLI). BOLI involves the purchasing of life insurance by the Corporation for certain employees. The Corporation is the owner and beneficiary of the policies, however certain policies include split-dollar endorsements. Under these endorsements, beneficiaries of the insured individuals are entitled to a portion of the proceeds from the policy upon death of the insured. The life insurance investment is carried at the net cash surrender value of the underlying policies. Changes in the net cash surrender value of these policies are reflected in noninterest income. Proceeds from and purchases of bank owned life insurance are reflected in the consolidated statements of cash flows under investing activities. The Corporation recognizes a liability for the future death benefit for certain endorsement split-dollar life insurance arrangements that provide an employee with a death benefit in a postretirement/termination period.
Other Real Estate Owned
Other real estate owned (OREO) represents properties acquired through customers’ loan defaults and is included in other assets. The real estate is originally stated at an amount equal to the fair value of the property, less estimated costs to sell. The fair value less cost to sell becomes the "original cost" of the OREO asset. The amount, if any, by which the carrying amount of the loan plus recorded accrued interest (the recorded loan amount) exceeds the fair value less cost to sell of the OREO, is charged against the reserve for loan and lease losses at the time of foreclosure or repossession. If the fair value less cost to sell of the OREO asset when taken into possession is greater than the recorded loan amount, the excess is first applied as a recovery against any prior charge-offs of the loan and any remaining gain is recorded as other noninterest income. Subsequently, OREO is reported at the lower of the original cost or the current fair value less cost to sell. Subsequent write-downs and any gain or loss upon the sale of OREO is recorded in other noninterest income. Capital improvement expenses associated with the construction or repair of the property are capitalized as part of the cost of the OREO asset; however, the capitalized expenses may not increase the OREO asset's recorded value to an amount greater than the asset's fair value after improvements and less cost to sell. Overages and subsequent carrying costs are expensed as incurred.
Derivative Financial Instruments
The Corporation recognizes all derivative financial instruments on its balance sheet at fair value. Derivatives that are not hedges must be adjusted to fair value through income. If a derivative is a hedge, depending on the nature of the hedge, changes in the fair value of the derivative are either offset against the change in fair value of the hedged assets, liabilities, or firm commitments through earnings, or recognized in other comprehensive income until the underlying transaction is recognized in earnings. The ineffective portion of a derivative's change in fair value is recognized in earnings immediately. To determine fair value, the Corporation uses third party pricing models that incorporate assumptions about market conditions and risks that are current at the reporting date.
The Corporation may use interest-rate swap agreements to modify interest rate characteristics from variable to fixed or fixed to variable in order to reduce the impact of interest rate changes on future net interest income. The Corporation accounts for its interest-rate swap contracts in cash flow hedging relationships by establishing and documenting the effectiveness of the instrument in offsetting the change in cash flows of assets or liabilities that are being hedged. To determine effectiveness, the Corporation performs an analysis to identify if changes in fair value of the derivative correlate to the equivalent changes in the forecasted interest receipts related to a specified hedged item. Recorded amounts related to interest-rate swaps are included in other assets or liabilities. Changes in the fair value of derivative instruments designated as hedges of future cash flows are recognized in accumulated other comprehensive income until the underlying forecasted transactions occur, at which time the deferred gains and losses are recognized in earnings. The change in fair value of the ineffective part of the instrument would be charged to earnings, potentially causing material fluctuations in reported earnings in the period of the change relative to comparable periods. In a fair value hedge, the fair values of the interest rate swap agreements and changes in the fair values of the hedged items are recorded in the Corporation’s consolidated balance sheet with the corresponding gain or loss being recognized in the consolidated statement of income. The
|
56
|
difference between changes in the fair values of interest rate swap agreements and the hedged items represents hedge ineffectiveness and is recorded in net interest income in the consolidated statement of income. The Corporation performs an assessment, both at the inception of the hedge and quarterly thereafter, to determine whether these derivatives are highly effective in offsetting changes in the value of the hedged items.
The Corporation has agreements with third-party financial institutions whereby the third-party financial institution enters into interest rate derivative contracts with loan customers referred to them by the Corporation. By the terms of the agreements, the third-party financial institution has recourse to the Corporation for any exposure created under each swap contract in the event the customer defaults on the swap agreement and the agreement is in a paying position to the third-party financial institution. The Corporation records the fair value of credit derivatives in other liabilities on the consolidated balance sheets. The Corporation recognizes changes in the fair value of credit derivatives, net of any fees received, in other noninterest income in the consolidated statements of income.
In connection with its mortgage banking activities, the Corporation enters into commitments to originate certain fixed-rate residential mortgage loans for customers, also referred to as interest rate locks. In addition, the Corporation enters into forward commitments for the future sale of mortgage loans to third-party investors to hedge the effect of changes in interest rates on the value of the interest rate locks. Forward loan sale commitments may also be in the form of commitments to sell individual mortgage loans at a fixed price at a future date. Both the interest rate locks and the forward loan sale commitments are accounted for as derivatives and carried at fair value, determined as the amount that would be necessary to settle each derivative financial instrument at the balance sheet date. Gross derivative assets and liabilities are recorded within other assets and other liabilities on the consolidated balance sheets, with changes in fair value during the period recorded within the net gain on mortgage banking activities on the consolidated statements of income.
Income Taxes
There are two components of income tax expense: current and deferred. Current income tax expense approximates cash to be paid or refunded for taxes for the applicable period. Deferred income taxes are provided for temporary differences between amounts reported for financial statement and tax purposes. Deferred income taxes are computed using the asset and liability method, such that deferred tax assets and liabilities are recognized for the expected future tax consequences of temporary differences between financial reporting amounts and the tax basis of existing assets and liabilities based on currently enacted tax laws and tax rates in effect for the periods in which the differences are expected to reverse. Deferred tax assets are subject to management’s judgment based upon available evidence that future taxes are “more likely than not” to be realized. If management determines that the Corporation is not more likely than not to realize some or all of the net deferred tax asset in the future, a charge to income tax expense may be required to reduce the value of the net deferred tax asset to the expected realizable value. Valuation allowances are established when necessary to reduce deferred tax assets to the amount expected to be realized. Penalties are recorded in noninterest expense in the year they are assessed and paid and are treated as a nondeductible expense for tax purposes. Interest is recorded in noninterest expense in the year it is assessed and paid and is treated as a deductible expense for tax purposes. On December 22, 2017, H.R.1, commonly known as the Tax Cuts and Jobs Act (Act) was signed into law. The Act reduced the Corporation's federal tax rate from 35% to 21% effective January 1, 2018. See Note 11, "Income Taxes" for additional information.
Retirement Plans and Other Postretirement Benefits
Substantially all employees who were hired before December 8, 2009 are covered by a noncontributory retirement plan. Effective December 31, 2009, the benefits previously accrued under the noncontributory retirement plan were frozen and the plan was amended and converted to a cash balance plan, with participants not losing any pension benefits already earned in the plan. Prior to the cash balance plan conversion effective December 31, 2009, the plan provided benefits based on a formula of each participant’s final average pay. Future benefits under the cash balance plan accrue by crediting participants annually with an amount equal to a percentage of earnings in that year based on years of credited service as defined in the plan. Employees hired on or after December 8, 2009 are not eligible to participate in the noncontributory retirement plan. The Corporation also provides supplemental executive retirement benefits to certain former executives, a portion of which is in excess of limits imposed on qualified plans by federal tax law. These plans are non-qualified benefit plans. These non-qualified benefit plans are not offered to new participants and all current participants are now retired. The Corporation provides certain postretirement healthcare and life insurance benefits for retired employees. The Corporation’s measurement date for plan assets and obligation is fiscal year-end. The Corporation recognizes on its consolidated balance sheet the funded status of its defined pension plans and changes in the funded status of the plan in the year in which the changes occur. An under-funded position would create a liability and an over-funded position would create an asset, with a correlating deferred tax asset or liability. The net impact would be an adjustment to equity as accumulated other comprehensive income (loss). The Corporation recognizes as a component of other comprehensive income (loss), net of tax, the actuarial gains and losses and the prior service costs and credits that arise during the period.
The Corporation sponsors a 401(k) deferred salary savings plan, which is a qualified defined contribution plan, and which covers all employees of the Corporation and its subsidiaries, and provides that the Corporation make matching contributions as
|
57
|
defined by the plan.
The Corporation sponsors a Supplemental Non-Qualified Pension Plan (SNQPP) which was established in 1981 prior to the existence of 401(k) deferred salary savings, employee stock purchase and long-term incentive plans and therefore is not offered to new participants. All current participants are now retired. These non-qualified plans are accounted for under guidance for deferred compensation arrangements.
Stock-Based Compensation
The fair value of share based awards is recognized as compensation expense over the vesting period based on the grant-date fair value of the awards. The Corporation uses the Black-Scholes Model to estimate the fair value of each option on the date of grant. The Black-Scholes Model estimates the fair value of employee stock options using a pricing model which takes into consideration the exercise price of the option, the expected life of the option, the current market price and its expected volatility, the expected dividends on the stock and the current risk-free interest rate for the expected life of the option. The Corporation grants stock options to employees with an exercise price equal to the fair value of the shares at the date of grant.
The Corporation grants both fixed and variable (performance-based) restricted stock. The performance-based restricted stock awards vest based upon the Corporation’s performance with respect to certain financial measures over a
three
-year period. The fair value of fixed restricted stock is equivalent to the fair value on the date of grant and is amortized over the vesting period. The fair value of the performance-based restricted stock is equivalent to the fair value on the date of grant and is amortized over the vesting period adjusted for a probability factor of achieving the performance goals.
Dividend Reinvestment and Employee Stock Purchase Plans
The Univest Dividend Reinvestment Plan allows for the issuance of
1,968,750
shares of common stock. During
2018
and
2017
,
57,838
and
60,602
shares, respectively, were issued under the dividend reinvestment plan, with
259,445
shares available for future purchase at
December 31, 2018
.
The 1996 Employee Stock Purchase Plan allows for the issuance of
984,375
shares of common stock. Employees may elect to make contributions to the plan in an aggregate amount not less than
2%
or more than
10%
of such employee’s total compensation. These contributions are then used to purchase stock during an offering period determined by the Corporation’s Employee Stock Purchase Plan Committee. The purchase price of the stock is
90%
of the closing sale price on the last trading day of each quarter. Compensation expense is recognized as the discount is greater than
5%
of the fair value. During
2018
and
2017
,
26,628
and
22,092
shares, respectively, were issued under the employee stock purchase plan, with
628,545
shares available for future purchase at
December 31, 2018
.
Marketing and Advertising Costs
The Corporation’s accounting policy is to expense marketing and advertising costs as incurred.
Statement of Cash Flows
The Corporation has defined those items included in the caption “Cash and due from banks” and "Interest-earning deposits with other banks" as cash and cash equivalents.
Assets under Management
Assets held by the Corporation in a fiduciary or agency capacity for its customers are not included in the consolidated financial statements since such items are not assets of the Corporation.
Earnings per Share
The Corporation uses the two-class method to calculate earnings per share as the unvested restricted stock issued under the Corporation's equity incentive plans are participating shares with nonforfeitable rights to dividends. Under the two-class method, earnings per common share are computed by dividing the sum of distributed earnings to common shareholders and undistributed earnings allocated to common shareholders by the weighted average number of common shares outstanding for the period. In applying the two-class method, undistributed earnings are allocated to both common shares and participating securities based on the number of weighted average shares outstanding during the period. Diluted earnings per share reflect additional common shares that would have been outstanding if options on common shares had been exercised, as well as any adjustment to income that would result from the assumed issuance. Potential common shares that may be issued by the Corporation relate solely to outstanding stock
|
58
|
options, and are determined using the treasury stock method. The effects of options to issue common stock are excluded from the computation of diluted earnings per share in periods in which the effect would be antidilutive.
Accounting Pronouncements Adopted in 2018
In February 2018, the Financial Accounting Standards Board (FASB) issued Accounting Standards Update (ASU) No. 2018-02,
"Income Statement – Reporting Comprehensive Income (Topic 220): Reclassification of Certain Tax Effects from Accumulated Other Comprehensive Income."
This ASU clarifies the accounting treatment of the reclassification of certain income tax effects within accumulated other comprehensive income as a result of the Tax Cuts and Jobs Act. The Corporation elected to early adopt this guidance effective January 1, 2018 for all stranded tax effects resulting from tax reform and reclassified stranded tax effects, totaling
$3.9 million
from accumulated other comprehensive income to retained earnings. The Corporation's policy for releasing income tax effects from accumulated other comprehensive income is to release such effects on an individual basis as each item is liquidated, sold or extinguished. See Note 14, "Accumulated Other Comprehensive (Loss) Income" for additional detail.
In March 2017, the FASB issued ASU No. 2017-07,
"Compensation – Retirement Benefits (Topic 715): Improving the Presentation of Net Periodic Pension Cost and Net Periodic Postretirement Benefit Cost."
The amendments in this ASU require that an employer that sponsors defined benefit pension plans and other postretirement plans present the service cost component in the same line item or items as other compensation costs arising from services rendered by the pertinent employees during the period. Other components of net benefit cost are required to be presented in the income statement separately from the service cost component and outside a subtotal of income from operations, if one is presented. If a separate line item or items are not used, the line item or items used in the income statement to present the other components of net benefit cost must be disclosed. The Corporation adopted this guidance effective January 1, 2018 with retrospective application for prior period presentation. Effective January 1, 2018, components of net benefit income other than the service cost component are presented in the Corporation's statement of income in other noninterest expense rather than in salaries, benefits and commission expense. Prior period components of net benefit income other than the service cost component were reclassed to other noninterest expense in the Corporation's statement of income.
In January 2016, the FASB issued ASU No. 2016-01,
“Financial Instruments – Overall (Subtopic 825-10): Recognition and Measurement of Financial Assets and Financial Liabilities."
This ASU addresses certain aspects of recognition, measurement, presentation and disclosure of financial instruments. The ASU requires equity investments to be measured at fair value with changes in fair value recognized in net income. At
December 31, 2017
, the Corporation had financial services equity securities with a carrying value of
$1.1 million
which included an unrealized net gain of
$666 thousand
. At
December 31, 2017
,
$433 thousand
was recorded in accumulated other comprehensive income which represented the unrealized net gain, net of incomes taxes, based on the Corporation's statutory tax rate at
December 31, 2017
. In addition, at
December 31, 2017
, the Corporation had money market mutual funds with a fair value and amortized cost of
$6.0 million
which were reclassified to equity securities under this guidance. The Corporation adopted this guidance effective January 1, 2018 with a cumulative-effect adjustment to the balance sheet as of January 1, 2018. The balance in accumulated other comprehensive income of
$433 thousand
was reclassified to retained earnings effective January 1, 2018. The carrying value of the equity securities, at January 1, 2018, did not change; however, any future increases or decreases in fair value is recorded as an increase or decrease to the carrying value and recognized in other noninterest income. During the year ended December 31,
2018
, the Corporation recognized a
$153 thousand
net
loss
on equity securities in other noninterest income.
In May 2014, the FASB issued ASU No. 2014-09, "
Revenue from Contracts with Customers (Topic 606)”
and subsequent related updates. The Corporation adopted the guidance effective January 1, 2018 using the modified retrospective method though no adjustments were made to retained earnings as a result of the adoption. The Corporation provided expanded disclosures related to recognition of revenue from contracts with customers. See Note 23, "Revenue from Contracts with Customers."
Recent Accounting Pronouncements Yet to Be Adopted
In February 2016, the FASB issued ASU No. 2016-02,
"Leases (Topic 842)"
and subsequent related updates to revise the accounting for leases. Under the new guidance, lessees will be required to recognize a lease liability and a right-of-use asset for all leases based on the present value of future lease payments. Lessor accounting activities are largely unchanged from existing lease accounting. Disclosures will be required by lessees and lessors to meet the objective of enabling users of financial statements to assess the amount, timing, and uncertainty of cash flows arising from leases. Early adoption is permitted. This new guidance is effective for the first interim period within annual periods beginning after December 15, 2018, or January 1, 2019 for the Corporation.
The Corporation will adopt this new guidance effective January 1, 2019, retrospectively at the beginning of the period of adoption through a cumulative-effect adjustment to retained earnings at January 1, 2019. The Corporation expects to elect the package of practical expedients permitted under the transition guidance which among other things, allows carry forward of the historical lease classification. All leases in which the Corporation is the lessee are classified as operating leases and continue to be
|
59
|
classified as such. The Corporation continues to separately account for lease and non-lease components as historically reported and expects to elect the hindsight practical expedient to determine the lease term for existing leases. The Corporation has implemented a third party lease accounting system to assist with the measurement of lease liabilities and related right-of-use assets, the post-implementation administration aspect of lease accounting, and the preparation of applicable disclosures related to the new guidance. The Corporation has identified and reviewed the lease contracts applicable to the new guidance that will impact the financial statements at the transition date. The Corporation expects to record approximately
$40.0 million
of operating lease liabilities and
$37.0 million
of related right-of-use assets at January 1, 2019. Additionally, existing deferred rent liability of approximately
$1.0 million
will be released through retained earnings effective January 1, 2019. The Corporation expects to record a cumulative effect adjustment to retained earnings of approximately
$1.5 million
, net of tax, at January 1, 2019, representing the difference between the value of the Corporation’s lease liabilities and related right-of-use assets, offset by the release of existing deferred rent liability. These estimates, based on our active lease portfolio, may change as the Corporation finalizes the implementation process, or due to changes in the lease portfolio, which could include changes in lease commencement dates or changes to renewal options and lease termination expectations. The initial and continued impact of the recording of operating lease assets will have a negative impact on all Corporation and Bank regulatory capital ratios.
In August 2017, the FASB issued ASU No. 2017-12,
“Derivatives and Hedging (Topic 815): Targeted Improvements to Accounting for Hedging Activities
" and subsequent related updates. The amendments in this update expand and refine hedge accounting for both non-financial and financial risk components and aligns the recognition and presentation of the effects of the hedging instrument and the hedged item in the financial statements. The ASU amends the presentation and disclosure requirements and changes how entities assess effectiveness. The ASU eliminates the requirement to separately measure and report hedge ineffectiveness and requires all items that affect earnings be presented in the same income statement line as the hedged items. The amendments in this guidance permit the use of the Overnight Index Swap rate based on Secured Overnight Financing Rate (SOFR) as a U.S. benchmark interest rate for hedge accounting purposes to facilitate the LIBOR to SOFR transition. This guidance is effective for fiscal years beginning after December 15, 2018, including interim periods within those fiscal years for public business entities, or January 1, 2019 for the Corporation. Early adoption is permitted, including an interim period. The amended presentation and disclosure guidance is required only prospectively. The Corporation will adopt this guidance on a modified retrospective basis through a cumulative-effect adjustment to retained earnings effective January 1, 2019. For the years ended December 31, 2018 and 2017, the Corporation recorded income of
$83 thousand
and
$0 thousand
, respectively, related to ineffectiveness for a cash flow hedge, which will be reclassified from retaining earnings in the amount of
$66 thousand
, net of tax, to accumulated other comprehensive income, effective January 1, 2019. The Corporation does not expect the adoption of this ASU will have a material impact on the Corporation's financial statements.
In March 2017, the FASB issued ASU No. 2017-08,
“Receivables – Nonrefundable Fees and Other Costs (Subtopic 310-20): Premium Amortization on Purchased Callable Debt Securities.”
This ASU shortens the amortization period for certain callable debt securities held at a premium. Specifically, the amendments require the premium to be amortized to the earliest call date rather than the maturity of the security.
Securities within the scope of this guidance are those that have explicit, non-contingent call features that are callable at fixed prices and on preset dates.
The amendments do not require an accounting change for securities held at a discount; the discount continues to be amortized to maturity. The guidance is effective for fiscal years beginning after December 15, 2018, including interim periods within those fiscal years, or January 1, 2019 for the Corporation. Early adoption is permitted, including an interim period. This ASU is to be applied on a modified retrospective basis through a cumulative-effect adjustment to retained earnings as of the beginning of the period of adoption. At
December 31, 2018
, the Corporation had
$11.3 million
of callable debt securities. Upon implementation, using the modified retrospective basis effective January 1, 2019, the Corporation expects to record a cumulative-effect adjustment resulting in a reduction in the unamortized premium balance for certain callable debt securities of approximately
$50 thousand
and a reduction in retained earnings of approximately
$40 thousand
, net of tax, for the incremental amortization. The Corporation does not expect the adoption of this ASU will have a material impact on the Corporation's financial statements.
In June 2016, the FASB issued ASU No. 2016-13, “
Financial Instruments – Credit Losses (Topic 326): Measurement of Credit Losses on Financial Instruments.”
This ASU requires businesses and other organizations to measure the current expected credit losses (CECL) on financial assets, such as loans, net investments in leases, certain debt securities, bond insurance and other receivables. The amendments affect entities holding financial assets and net investments in leases that are not accounted for at fair value through net income. Current GAAP requires an incurred loss methodology for recognizing credit losses that delays recognition until it is probable a loss has been incurred. The amendments in this ASU replace the incurred loss impairment methodology with a methodology that reflects expected credit losses and requires consideration of a broader range of reasonableness and supportable information to inform credit loss estimates. An entity should apply the amendments through a cumulative-effect adjustment to retained earnings as of the beginning of the first reporting period in which the guidance is effective (modified-retrospective approach). Acquired credit impaired loans for which the guidance in Accounting Standards Codification (ASC) Topic 310-30 has been previously applied should prospectively apply the guidance in this ASU. A prospective transition approach is required for debt securities for
|
60
|
which an other-than-temporary impairment has been recognized before the effective date. The ASU is effective for fiscal years beginning after December 15, 2019, and interim periods within those years for public business entities that are SEC filers, or January 1, 2020 for the Corporation. The Corporation is in the process of evaluating the impact of the adoption of this guidance on the Corporation's financial statements; however, it is anticipated that the reserve for loan and lease losses will increase upon adoption of CECL and that the increased reserve level will decrease shareholders' equity and regulatory capital and ratios.
In January 2017, the FASB issued ASU No. 2017-04,
"Intangibles – Goodwill and Other (Topic 350): Simplifying the Test for Goodwill Impairment."
This ASU eliminates Step 2 of the goodwill impairment test. Step 2 measures a goodwill impairment loss by comparing the implied fair value of a reporting unit’s goodwill with the carrying amount of that goodwill. Under the new guidance, an entity should perform its annual, or interim, goodwill impairment test by comparing the fair value of a reporting unit with its carrying amount. An entity should recognize an impairment charge for the amount by which the carrying amount exceeds the reporting unit’s fair value; however, the loss recognized should not exceed the total amount of goodwill allocated to that reporting unit. Additionally, an entity should consider income tax effects from any tax deductible goodwill on the carrying amount of the reporting unit when measuring the goodwill impairment loss, if applicable. An entity still has the option to perform the qualitative assessment for a reporting unit to determine if the quantitative impairment test is necessary. Public business entities that are SEC filers should adopt the amendments in this ASU for annual or interim goodwill impairment tests in fiscal years beginning after December 15, 2019, or for the Corporation's goodwill impairment test in 2020. Early adoption is permitted for goodwill impairment tests with measurement dates after January 1, 2017. The Corporation does not expect the adoption of this ASU will have a material impact on the Corporation's financial statements.
In August 2018, the FASB issued ASU No. 2018-14, "
Compensation – Retirement Benefits – Defined Benefit Plans – General (Subtopic 715-20): Disclosure Framework – Changes to the Disclosure Requirements for Defined Benefit Plans."
The amendments in this ASU modify the disclosure requirements for employers that sponsor defined benefit plans or other postretirement plans. Disclosures removed by this ASU include the following: 1) amounts in accumulated other comprehensive income expected to be recognized in net periodic benefit costs over the next fiscal year; 2) amount and timing of plan assets expected to be returned to the employer; and 3) the effects of a one percentage point change in assumed health care cost trend rates on the net periodic benefit costs and the benefit obligation for postretirement health care benefits. Additional disclosures required by this ASU include: 1) the weighted-average interest crediting rates used in an entity's cash balance pension plans and other similar plans and 2) explanations for reasons for significant changes in the benefit obligation or plan assets. All amendments should be applied retrospectively. This ASU is effective for fiscal years ending after December 15, 2020 or December 31, 2020 for the Corporation. The Corporation does not expect the adoption of this ASU will have a material impact on the Corporation's financial statement disclosures but will result in revised disclosures for retirement plans and other postretirement benefits.
In August 2018, the FASB issued ASU No. 2018-13, "
Fair Value Measurement (Topic 820): Disclosure Framework – Changes to the Disclosure Requirements for Fair Value Measurement."
This ASU applies to all entities that are required, under existing GAAP, to make disclosures about recurring or nonrecurring fair value measurements. Disclosures removed by this ASU are the amount and reasons for transfers between Level 1 and Level 2, the policy for timing of transfers between levels and the valuation processes for Level 3 measurements. This ASU modifies disclosures relating to investments in certain entities that calculate net asset value. Additional disclosures required by this ASU include: 1) change in unrealized gains and losses included in other comprehensive income for recurring Level 3 fair value measurements held at the end of the reporting period and 2) range and weighted average of significant unobservable inputs used to develop Level 3 fair value measurements. The prospective method of transition is required for the new disclosure requirements. The other amendments should be applied retrospectively. This ASU is effective for fiscal years beginning after December 15, 2019, including interim periods within those fiscal years or January 1, 2020 for the Corporation. Early adoption is permitted. The Corporation does not expect the adoption of this ASU will have a material impact on the Corporation's financial statements but will result in revised disclosures for fair value.
Prior Period Adjustments
In connection with preparing the consolidated financial statements for December 31, 2018, the statement of cash flows as originally presented for December 31, 2017 has been revised as a result of incorrect amounts in the “Originations of loans held for sale” and “Proceeds from the sale of loans held sale” line items within the “Net cash provided by operating activities” section of the consolidated statement of cash flows.
|
61
|
The Corporation will present these revised amounts for each of the affected periods, including in the Form 10-Q for March 31, 2017, the Form 10-Q for June 30, 2017, the Form 10-Q for September 30, 2017, the Form 10-Q for March 31, 2018, the Form 10-Q for June 30, 2018, and the Form 10-Q for September 30, 2018, in any future filings where the applicable information is presented on a comparative basis. The following table outlines the impact of the corrections to the consolidated statement of cash flows for each of the affected periods.
|
For the Three Months Ended,
|
For the Six Months Ended,
|
For the Nine Months Ended,
|
|||||||
|
March 31, 2018
|
June 30, 2018
|
September 30, 2018
|
|||||||
|
(Dollars in thousands)
|
As Reported
|
||||||||
|
Originations of loans held for sale
|
(28,468
|
)
|
(61,508
|
)
|
(95,665
|
)
|
|||
|
Proceeds from sales of loans held for sale
|
30,320
|
|
63,076
|
|
99,842
|
|
|||
|
Net cash provided by operating activities
|
1,852
|
|
1,568
|
|
4,177
|
|
|||
|
Adjustments
|
|||||||||
|
Originations of loans held for sale
|
(6,683
|
)
|
(13,187
|
)
|
(22,441
|
)
|
|||
|
Proceeds from sales of loans held for sale
|
6,683
|
|
13,187
|
|
22,441
|
|
|||
|
Net cash provided by operating activities
|
—
|
|
—
|
|
—
|
|
|||
|
As Adjusted
|
|||||||||
|
Originations of loans held for sale
|
(35,151
|
)
|
(74,695
|
)
|
(118,106
|
)
|
|||
|
Proceeds from sales of loans held for sale
|
37,003
|
|
76,263
|
|
122,283
|
|
|||
|
Net cash provided by operating activities
|
1,852
|
|
1,568
|
|
4,177
|
|
|||
|
For the Three Months Ended,
|
For the Six Months Ended,
|
For the Nine Months Ended,
|
For the Year Ended,
|
||||||||
|
March 31, 2017
|
June 30, 2017
|
September 30, 2017
|
December 31, 2017
|
||||||||
|
(Dollars in thousands)
|
As Reported
|
||||||||||
|
Originations of loans held for sale
|
(24,828
|
)
|
(64,035
|
)
|
(105,557
|
)
|
(143,993
|
)
|
|||
|
Proceeds from sales of loans held for sale
|
30,568
|
|
69,847
|
|
112,602
|
|
152,734
|
|
|||
|
Net cash provided by operating activities
|
5,740
|
|
5,812
|
|
7,045
|
|
8,741
|
|
|||
|
Adjustments
|
|||||||||||
|
Originations of loans held for sale
|
(12,642
|
)
|
(24,422
|
)
|
(35,424
|
)
|
(44,079
|
)
|
|||
|
Proceeds from sales of loans held for sale
|
12,642
|
|
24,422
|
|
35,424
|
|
44,079
|
|
|||
|
Net cash provided by operating activities
|
—
|
|
—
|
|
—
|
|
—
|
|
|||
|
As Adjusted
|
|||||||||||
|
Originations of loans held for sale
|
(37,470
|
)
|
(88,457
|
)
|
(140,981
|
)
|
(188,072
|
)
|
|||
|
Proceeds from sales of loans held for sale
|
43,210
|
|
94,269
|
|
148,026
|
|
196,813
|
|
|||
|
Net cash provided by operating activities
|
5,740
|
|
5,812
|
|
7,045
|
|
8,741
|
|
|||
We evaluated these cumulative errors on both a quantitative and qualitative basis under the guidance of ASC 250, "Accounting Changes and Error Corrections." We determined that the cumulative impact of the errors described above did not affect the net cash provided (used) by operating activities, investing activities or financing activities, the total increase (decrease) in cash and cash equivalents and does not represent a change to total assets, total liabilities, total equity, or net income and therefore did not have a material impact to previously issued financial statements.
|
62
|
Note 2. Earnings per Share
The following table sets forth the computation of basic and diluted earnings per share:
|
|
For the Years Ended December 31,
|
||||||||||
|
(Dollars and shares in thousands)
|
2018
|
2017
|
2016
|
||||||||
|
Numerator:
|
|||||||||||
|
Net income
|
$
|
50,543
|
|
$
|
44,094
|
|
$
|
19,505
|
|
||
|
Net income allocated to unvested restricted stock
|
(333
|
)
|
(409
|
)
|
(167
|
)
|
|||||
|
Net income allocated to common shares
|
$
|
50,210
|
|
$
|
43,685
|
|
$
|
19,338
|
|
||
|
Denominator:
|
|||||||||||
|
Weighted average shares outstanding
|
29,370
|
|
26,862
|
|
23,098
|
|
|||||
|
Average unvested restricted stock
|
(193
|
)
|
(256
|
)
|
(227
|
)
|
|||||
|
Denominator for basic earnings per share—
weighted-average shares outstanding
|
29,177
|
|
26,606
|
|
22,871
|
|
|||||
|
Effect of dilutive securities—employee stock options
|
82
|
|
102
|
|
60
|
|
|||||
|
Denominator for diluted earnings per share—
adjusted weighted-average shares outstanding
|
29,259
|
|
26,708
|
|
22,931
|
|
|||||
|
Basic earnings per share
|
$
|
1.72
|
|
$
|
1.64
|
|
$
|
0.85
|
|
||
|
Diluted earnings per share
|
$
|
1.72
|
|
$
|
1.64
|
|
$
|
0.84
|
|
||
|
Average anti-dilutive options excluded from computation of diluted earnings per share
|
319
|
|
169
|
|
280
|
|
|||||
Note 3. Restrictions on Cash and Due from Banks and Interest-earning Deposit Accounts
The Bank maintains reserve balances under Federal Reserve Bank requirements. The reserve requirement at
December 31, 2018
and
2017
was
$8.3 million
and
$6.7 million
, respectively, and was satisfied by vault cash held at the Bank’s branches. The average balances at the Federal Reserve Bank of Philadelphia were
$48.3 million
and
$24.5 million
for the years ended December 31,
2018
and
2017
, respectively.
The Corporation maintains interest-earning deposit accounts at other financial institutions and pledges certain deposits as collateral for credit derivatives and interest rate swap agreements. Deposits pledged at
December 31, 2018
and
2017
were
$0 thousand
and
$400 thousand
, respectively. See Note 16, "Derivative Instruments and Hedging Activities" for additional information.
|
63
|
Note 4. Investment Securities
The following table shows the amortized cost and the estimated fair value of the held-to-maturity securities and available-for-sale securities at
December 31, 2018
and
2017
, by contractual maturity within each type:
|
|
At December 31, 2018
|
At December 31, 2017
|
|||||||||||||||||||||||||||||
|
(Dollars in thousands)
|
Amortized
Cost |
Gross
Unrealized Gains |
Gross
Unrealized Losses |
Fair Value
|
Amortized
Cost |
Gross
Unrealized Gains |
Gross
Unrealized Losses |
Fair Value
|
|||||||||||||||||||||||
|
Securities Held-to-Maturity
|
|||||||||||||||||||||||||||||||
|
U.S. government corporations and agencies:
|
|||||||||||||||||||||||||||||||
|
After 1 year to 5 years
|
$
|
6,996
|
|
$
|
—
|
|
$
|
(104
|
)
|
$
|
6,892
|
|
$
|
6,995
|
|
$
|
—
|
|
$
|
(77
|
)
|
$
|
6,918
|
|
|||||||
|
6,996
|
|
—
|
|
(104
|
)
|
6,892
|
|
6,995
|
|
—
|
|
(77
|
)
|
6,918
|
|
||||||||||||||||
|
Residential mortgage-backed securities:
|
|||||||||||||||||||||||||||||||
|
After 5 years to 10 years
|
11,573
|
|
—
|
|
(135
|
)
|
11,438
|
|
8,944
|
|
—
|
|
(51
|
)
|
8,893
|
|
|||||||||||||||
|
Over 10 years
|
124,065
|
|
287
|
|
(1,107
|
)
|
123,245
|
|
39,625
|
|
44
|
|
(160
|
)
|
39,509
|
|
|||||||||||||||
|
135,638
|
|
287
|
|
(1,242
|
)
|
134,683
|
|
48,569
|
|
44
|
|
(211
|
)
|
48,402
|
|
||||||||||||||||
|
Total
|
$
|
142,634
|
|
$
|
287
|
|
$
|
(1,346
|
)
|
$
|
141,575
|
|
$
|
55,564
|
|
$
|
44
|
|
$
|
(288
|
)
|
$
|
55,320
|
|
|||||||
|
Securities Available-for-Sale
|
|||||||||||||||||||||||||||||||
|
U.S. government corporations and agencies:
|
|||||||||||||||||||||||||||||||
|
Within 1 year
|
$
|
15,108
|
|
$
|
—
|
|
$
|
(90
|
)
|
$
|
15,018
|
|
$
|
1,499
|
|
$
|
—
|
|
$
|
(3
|
)
|
$
|
1,496
|
|
|||||||
|
After 1 year to 5 years
|
303
|
|
—
|
|
(6
|
)
|
297
|
|
15,590
|
|
—
|
|
(125
|
)
|
15,465
|
|
|||||||||||||||
|
|
15,411
|
|
—
|
|
(96
|
)
|
15,315
|
|
17,089
|
|
—
|
|
(128
|
)
|
16,961
|
|
|||||||||||||||
|
State and political subdivisions:
|
|||||||||||||||||||||||||||||||
|
Within 1 year
|
5,900
|
|
4
|
|
(6
|
)
|
5,898
|
|
2,721
|
|
1
|
|
(6
|
)
|
2,716
|
|
|||||||||||||||
|
After 1 year to 5 years
|
15,459
|
|
36
|
|
(56
|
)
|
15,439
|
|
16,787
|
|
33
|
|
(44
|
)
|
16,776
|
|
|||||||||||||||
|
After 5 years to 10 years
|
43,923
|
|
318
|
|
(163
|
)
|
44,078
|
|
54,846
|
|
897
|
|
(73
|
)
|
55,670
|
|
|||||||||||||||
|
Over 10 years
|
—
|
|
—
|
|
—
|
|
—
|
|
3,120
|
|
15
|
|
—
|
|
3,135
|
|
|||||||||||||||
|
|
65,282
|
|
358
|
|
(225
|
)
|
65,415
|
|
77,474
|
|
946
|
|
(123
|
)
|
78,297
|
|
|||||||||||||||
|
Residential mortgage-backed securities:
|
|||||||||||||||||||||||||||||||
|
After 1 year to 5 years
|
5,799
|
|
3
|
|
(70
|
)
|
5,732
|
|
3,913
|
|
12
|
|
(26
|
)
|
3,899
|
|
|||||||||||||||
|
After 5 years to 10 years
|
49,904
|
|
6
|
|
(1,381
|
)
|
48,529
|
|
51,428
|
|
5
|
|
(852
|
)
|
50,581
|
|
|||||||||||||||
|
Over 10 years
|
100,873
|
|
26
|
|
(3,398
|
)
|
97,501
|
|
133,237
|
|
87
|
|
(2,383
|
)
|
130,941
|
|
|||||||||||||||
|
|
156,576
|
|
35
|
|
(4,849
|
)
|
151,762
|
|
188,578
|
|
104
|
|
(3,261
|
)
|
185,421
|
|
|||||||||||||||
|
Collateralized mortgage obligations:
|
|||||||||||||||||||||||||||||||
|
After 5 years to 10 years
|
1,677
|
|
—
|
|
(78
|
)
|
1,599
|
|
2,103
|
|
—
|
|
(82
|
)
|
2,021
|
|
|||||||||||||||
|
Over 10 years
|
1,305
|
|
—
|
|
(16
|
)
|
1,289
|
|
1,567
|
|
14
|
|
—
|
|
1,581
|
|
|||||||||||||||
|
|
2,982
|
|
—
|
|
(94
|
)
|
2,888
|
|
3,670
|
|
14
|
|
(82
|
)
|
3,602
|
|
|||||||||||||||
|
Corporate bonds:
|
|||||||||||||||||||||||||||||||
|
Within 1 year
|
7,806
|
|
—
|
|
(68
|
)
|
7,738
|
|
10,006
|
|
—
|
|
(5
|
)
|
10,001
|
|
|||||||||||||||
|
After 1 year to 5 years
|
18,508
|
|
1
|
|
(332
|
)
|
18,177
|
|
24,885
|
|
20
|
|
(147
|
)
|
24,758
|
|
|||||||||||||||
|
After 5 years to 10 years
|
16,146
|
|
—
|
|
(392
|
)
|
15,754
|
|
16,669
|
|
71
|
|
(296
|
)
|
16,444
|
|
|||||||||||||||
|
Over 10 years
|
60,000
|
|
—
|
|
(8,542
|
)
|
51,458
|
|
60,000
|
|
—
|
|
(4,027
|
)
|
55,973
|
|
|||||||||||||||
|
|
102,460
|
|
1
|
|
(9,334
|
)
|
93,127
|
|
111,560
|
|
91
|
|
(4,475
|
)
|
107,176
|
|
|||||||||||||||
|
Equity securities*
|
|||||||||||||||||||||||||||||||
|
No stated maturity
|
N/A
|
|
N/A
|
|
N/A
|
|
N/A
|
|
6,395
|
|
667
|
|
(1
|
)
|
7,061
|
|
|||||||||||||||
|
|
N/A
|
|
N/A
|
|
N/A
|
|
N/A
|
|
6,395
|
|
667
|
|
(1
|
)
|
7,061
|
|
|||||||||||||||
|
Total
|
$
|
342,711
|
|
$
|
394
|
|
$
|
(14,598
|
)
|
$
|
328,507
|
|
$
|
404,766
|
|
$
|
1,822
|
|
$
|
(8,070
|
)
|
$
|
398,518
|
|
|||||||
*Equity securities at
December 31, 2017
include
$6.0 million
of money market mutual funds and
$1.1 million
of financial services equity securities. In accordance with ASU 2016-01, beginning January 1, 2018, such amounts were reclassified from investment securities available-for-sale to investments in equity securities on the Corporation's Consolidated Balance Sheets.
Expected maturities may differ from contractual maturities because debt issuers may have the right to call or prepay obligations without call or prepayment penalties and mortgage-backed securities typically prepay at a rate faster than contractually due.
Securities with a carrying value of
$344.5 million
and
$345.1 million
at
December 31, 2018
and
2017
, respectively, were pledged to secure public deposits and other contractual obligations. In addition, securities of
$296 thousand
and
$1.8 million
were
|
64
|
pledged to secure credit derivatives and interest rate swaps at
December 31, 2018
and
2017
, respectively. See Note 16, "Derivative Instruments and Hedging Activities" for additional information.
The following table presents information related to sales of securities available-for-sale during the years ended
December 31, 2018
,
2017
and
2016
:
|
|
For the Years Ended December 31,
|
||||||||||
|
(Dollars in thousands)
|
2018
|
2017
|
2016
|
||||||||
|
Securities available-for-sale:
|
|||||||||||
|
Proceeds from sales
|
$
|
1,010
|
|
$
|
7,069
|
|
$
|
77,290
|
|
||
|
Gross realized gains on sales
|
10
|
|
74
|
|
600
|
|
|||||
|
Gross realized losses on sales
|
—
|
|
26
|
|
82
|
|
|||||
|
Tax expense related to net realized gains on sales
|
2
|
|
17
|
|
181
|
|
|||||
At
December 31, 2018
and
2017
, there were
no
investments in any single non-federal issuer representing more than
10%
of shareholders’ equity.
The following table shows the fair value of securities that were in an unrealized loss position at
December 31, 2018
and
2017
by the length of time those securities were in a continuous loss position. For the investment securities in an unrealized loss position, the Corporation has concluded, based on its analysis, that the unrealized losses are primarily caused by the movement of interest rates and current market conditions and are not an other-than-temporary impairment of the securities. The contractual terms of these investments do not permit the issuer to settle the securities at a price less than the par value of the investment. It is more likely than not that the Corporation will not be required to sell the investments before a recovery of carrying value.
|
|
Less than
Twelve Months |
Twelve Months
or Longer |
Total
|
||||||||||||||||||||
|
(Dollars in thousands)
|
Fair Value
|
Unrealized
Losses |
Fair Value
|
Unrealized
Losses |
Fair Value
|
Unrealized
Losses |
|||||||||||||||||
|
At December 31, 2018
|
|||||||||||||||||||||||
|
Securities Held-to-Maturity
|
|||||||||||||||||||||||
|
U.S. government corporations and agencies
|
$
|
—
|
|
$
|
—
|
|
$
|
6,892
|
|
$
|
(104
|
)
|
$
|
6,892
|
|
$
|
(104
|
)
|
|||||
|
Residential mortgage-backed securities
|
48,192
|
|
(472
|
)
|
34,501
|
|
(770
|
)
|
82,693
|
|
(1,242
|
)
|
|||||||||||
|
Total
|
$
|
48,192
|
|
$
|
(472
|
)
|
$
|
41,393
|
|
$
|
(874
|
)
|
$
|
89,585
|
|
$
|
(1,346
|
)
|
|||||
|
Securities Available-for-Sale
|
|||||||||||||||||||||||
|
U.S. government corporations and agencies
|
$
|
—
|
|
$
|
—
|
|
$
|
15,315
|
|
$
|
(96
|
)
|
$
|
15,315
|
|
$
|
(96
|
)
|
|||||
|
State and political subdivisions
|
9,311
|
|
(61
|
)
|
15,302
|
|
(164
|
)
|
24,613
|
|
(225
|
)
|
|||||||||||
|
Residential mortgage-backed securities
|
7,099
|
|
(106
|
)
|
141,924
|
|
(4,743
|
)
|
149,023
|
|
(4,849
|
)
|
|||||||||||
|
Collateralized mortgage obligations
|
1,289
|
|
(16
|
)
|
1,599
|
|
(78
|
)
|
2,888
|
|
(94
|
)
|
|||||||||||
|
Corporate bonds
|
16,896
|
|
(235
|
)
|
75,730
|
|
(9,099
|
)
|
92,626
|
|
(9,334
|
)
|
|||||||||||
|
Total
|
$
|
34,595
|
|
$
|
(418
|
)
|
$
|
249,870
|
|
$
|
(14,180
|
)
|
$
|
284,465
|
|
$
|
(14,598
|
)
|
|||||
|
At December 31, 2017
|
|||||||||||||||||||||||
|
Securities Held-to-Maturity
|
|||||||||||||||||||||||
|
U.S. government corporations and agencies
|
$
|
6,919
|
|
$
|
(77
|
)
|
$
|
—
|
|
$
|
—
|
|
$
|
6,919
|
|
$
|
(77
|
)
|
|||||
|
Residential mortgage-backed securities
|
40,881
|
|
(211
|
)
|
—
|
|
—
|
|
40,881
|
|
(211
|
)
|
|||||||||||
|
Total
|
$
|
47,800
|
|
$
|
(288
|
)
|
$
|
—
|
|
$
|
—
|
|
$
|
47,800
|
|
$
|
(288
|
)
|
|||||
|
Securities Available-for-Sale
|
|||||||||||||||||||||||
|
U.S. government corporations and agencies
|
$
|
5,213
|
|
$
|
(38
|
)
|
$
|
11,749
|
|
$
|
(90
|
)
|
$
|
16,962
|
|
$
|
(128
|
)
|
|||||
|
State and political subdivisions
|
18,457
|
|
(91
|
)
|
6,332
|
|
(32
|
)
|
24,789
|
|
(123
|
)
|
|||||||||||
|
Residential mortgage-backed securities
|
32,217
|
|
(210
|
)
|
141,371
|
|
(3,051
|
)
|
173,588
|
|
(3,261
|
)
|
|||||||||||
|
Collateralized mortgage obligations
|
—
|
|
—
|
|
2,021
|
|
(82
|
)
|
2,021
|
|
(82
|
)
|
|||||||||||
|
Corporate bonds
|
18,464
|
|
(1,016
|
)
|
71,957
|
|
(3,459
|
)
|
90,421
|
|
(4,475
|
)
|
|||||||||||
|
Equity securities
|
—
|
|
(1
|
)
|
4
|
|
—
|
|
4
|
|
(1
|
)
|
|||||||||||
|
Total
|
$
|
74,351
|
|
$
|
(1,356
|
)
|
$
|
233,434
|
|
$
|
(6,714
|
)
|
$
|
307,785
|
|
$
|
(8,070
|
)
|
|||||
At December 31, 2018, gross unrealized losses for securities available-for-sale in an unrealized loss position for twelve months or longer, totaled
$14.2 million
.
Four
federal agency bonds,
twenty-eight
investment grade corporate bonds,
121
federal agency residential mortgage securities,
nineteen
investment grade municipal bonds and
one
collateralized mortgage obligation bond had respective unrealized loss positions of
$96 thousand
,
$9.1 million
,
$4.7 million
,
$164 thousand
and
$78 thousand
, respectively. The
|
65
|
fair value of these
173
securities fluctuate with changes in market conditions which for these underlying securities is primarily due to changes in the interest rate environment. The Corporation does not intend to sell the securities in an unrealized loss position and is unlikely to be required to sell these securities before a recovery of fair value, which may be maturity. Upon review of the attributes of the individual securities, the Corporation concluded these securities were not other-than-temporarily impaired. The Corporation did not recognize any other-than-temporary impairment charges on debt securities for the years ended December 31,
2018
,
2017
and
2016
.
In conjunction with the adoption of ASU 2016-01, the Corporation recognized a
$153 thousand
net
loss
on equity securities during the year ended December 31,
2018
in other noninterest income and the net unrealized
loss
on equity securities held at
December 31, 2018
was
$153 thousand
. See Note 1, "Summary of Significant Accounting Policies - Accounting Pronouncements Adopted in 2018" for additional information.
Note 5. Loans and Leases
Summary of Major Loan and Lease Categories
|
At December 31, 2018
|
|||||||||||
|
(Dollars in thousands)
|
Originated
|
Acquired
|
Total
|
||||||||
|
Commercial, financial and agricultural
|
$
|
913,166
|
|
$
|
24,519
|
|
$
|
937,685
|
|
||
|
Real estate-commercial
|
1,507,579
|
|
233,625
|
|
1,741,204
|
|
|||||
|
Real estate-construction
|
215,513
|
|
—
|
|
215,513
|
|
|||||
|
Real estate-residential secured for business purpose
|
302,393
|
|
60,403
|
|
362,796
|
|
|||||
|
Real estate-residential secured for personal purpose
|
338,451
|
|
49,959
|
|
388,410
|
|
|||||
|
Real estate-home equity secured for personal purpose
|
177,523
|
|
8,728
|
|
186,251
|
|
|||||
|
Loans to individuals
|
32,617
|
|
142
|
|
32,759
|
|
|||||
|
Lease financings
|
141,956
|
|
—
|
|
141,956
|
|
|||||
|
Total loans and leases held for investment, net of deferred income
|
$
|
3,629,198
|
|
$
|
377,376
|
|
$
|
4,006,574
|
|
||
|
Unearned lease income, included in the above table
|
$
|
(15,118
|
)
|
$
|
—
|
|
$
|
(15,118
|
)
|
||
|
Net deferred costs, included in the above table
|
3,930
|
|
—
|
|
3,930
|
|
|||||
|
Overdraft deposits included in the above table
|
139
|
|
—
|
|
139
|
|
|||||
|
At December 31, 2017
|
|||||||||||
|
(Dollars in thousands)
|
Originated
|
Acquired
|
Total
|
||||||||
|
Commercial, financial and agricultural
|
$
|
833,100
|
|
$
|
63,111
|
|
$
|
896,211
|
|
||
|
Real estate-commercial
|
1,235,681
|
|
306,460
|
|
1,542,141
|
|
|||||
|
Real estate-construction
|
171,244
|
|
4,592
|
|
175,836
|
|
|||||
|
Real estate-residential secured for business purpose
|
250,800
|
|
91,167
|
|
341,967
|
|
|||||
|
Real estate-residential secured for personal purpose
|
260,654
|
|
60,920
|
|
321,574
|
|
|||||
|
Real estate-home equity secured for personal purpose
|
171,884
|
|
12,386
|
|
184,270
|
|
|||||
|
Loans to individuals
|
28,156
|
|
144
|
|
28,300
|
|
|||||
|
Lease financings
|
129,768
|
|
—
|
|
129,768
|
|
|||||
|
Total loans and leases held for investment, net of deferred income
|
$
|
3,081,287
|
|
$
|
538,780
|
|
$
|
3,620,067
|
|
||
|
Unearned lease income, included in the above table
|
$
|
(14,243
|
)
|
$
|
—
|
|
$
|
(14,243
|
)
|
||
|
Net deferred costs, included in the above table
|
4,669
|
|
—
|
|
4,669
|
|
|||||
|
Overdraft deposits included in the above table
|
222
|
|
—
|
|
222
|
|
|||||
Overdraft deposits are re-classified as loans and are included in the total loans and leases on the balance sheet.
The carrying amount of acquired loans at
December 31, 2018
totaled
$377.4 million
, including
$314.8 million
of loans from the Fox Chase acquisition and
$62.6 million
from the Valley Green Bank acquisition. At
December 31, 2018
, loans acquired with deteriorated credit quality, or acquired credit impaired loans, totaled
$695 thousand
representing
$63 thousand
from the Fox Chase acquisition and
$632 thousand
from the Valley Green Bank acquisition. Acquired credit impaired loans are accounted for in accordance with Accounting Standards Codification (ASC) Topic 310-30.
|
66
|
The outstanding principal balance and carrying amount for acquired credit impaired loans at
December 31, 2018
and
2017
were as follows:
|
(Dollars in thousands)
|
At December 31, 2018
|
At December 31, 2017
|
|||||
|
Outstanding principal balance
|
$
|
893
|
|
$
|
2,325
|
|
|
|
Carrying amount
|
695
|
|
1,583
|
|
|||
|
Reserve for loan losses
|
—
|
|
—
|
|
|||
The following table presents the changes in accretable yield on acquired credit impaired loans:
|
For the Years Ended December 31,
|
|||||||
|
(Dollars in thousands)
|
2018
|
2017
|
|||||
|
Beginning of period
|
$
|
11
|
|
$
|
50
|
|
|
|
Reclassification from nonaccretable discount
|
582
|
|
891
|
|
|||
|
Accretable yield amortized to interest income
|
(593
|
)
|
(926
|
)
|
|||
|
Disposals
|
—
|
|
(4
|
)
|
|||
|
End of period
|
$
|
—
|
|
$
|
11
|
|
|
The Corporation is a lessor of equipment under agreements expiring at various dates through the year
2029
. At
December 31, 2018
and
2017
, the schedule of minimum lease payments receivable is as follows:
|
At December 31,
|
|||||||
|
(Dollars in thousands)
|
2018
|
2017
|
|||||
|
Within 1 year
|
$
|
56,386
|
|
$
|
53,625
|
|
|
|
After 1 year through 2 years
|
44,027
|
|
41,351
|
|
|||
|
After 2 years through 3 years
|
30,150
|
|
27,411
|
|
|||
|
After 3 years through 4 years
|
18,123
|
|
15,557
|
|
|||
|
After 4 years through 5 years
|
7,085
|
|
5,375
|
|
|||
|
Thereafter
|
1,303
|
|
692
|
|
|||
|
Total future minimum lease payments receivable
|
157,074
|
|
144,011
|
|
|||
|
Less: Unearned income
|
(15,118
|
)
|
(14,243
|
)
|
|||
|
Total lease financing receivables, net of unearned income
|
$
|
141,956
|
|
$
|
129,768
|
|
|
|
67
|
Age Analysis of Past Due Loans and Leases
The following presents, by class of loans and leases, an aging of past due loans and leases, loans and leases which are current and the recorded investment in loans and leases 90 days or more past due which are accruing interest at
December 31, 2018
and
2017
:
|
(Dollars in thousands)
|
30-59
Days Past Due |
60-89
Days Past Due |
90 Days
or more Past Due |
Total
Past Due |
Current
|
Acquired Credit Impaired
|
Total Loans
and Leases Held for Investment |
Recorded
Investment 90 Days or more Past Due and Accruing Interest |
|||||||||||||||||||||||
|
At December 31, 2018
|
|||||||||||||||||||||||||||||||
|
Commercial, financial and agricultural
|
$
|
1,043
|
|
$
|
270
|
|
$
|
2,228
|
|
$
|
3,541
|
|
$
|
934,144
|
|
$
|
—
|
|
$
|
937,685
|
|
$
|
—
|
|
|||||||
|
Real estate—commercial real estate and construction:
|
|||||||||||||||||||||||||||||||
|
Commercial real estate
|
5,425
|
|
1,538
|
|
1,599
|
|
8,562
|
|
1,732,436
|
|
206
|
|
1,741,204
|
|
—
|
|
|||||||||||||||
|
Construction
|
2,163
|
|
106
|
|
—
|
|
2,269
|
|
213,244
|
|
—
|
|
215,513
|
|
—
|
|
|||||||||||||||
|
Real estate—residential and home equity:
|
|||||||||||||||||||||||||||||||
|
Residential secured for business purpose
|
2,497
|
|
777
|
|
1,164
|
|
4,438
|
|
357,932
|
|
426
|
|
362,796
|
|
—
|
|
|||||||||||||||
|
Residential secured for personal purpose
|
2,334
|
|
—
|
|
1,586
|
|
3,920
|
|
384,427
|
|
63
|
|
388,410
|
|
—
|
|
|||||||||||||||
|
Home equity secured for personal purpose
|
305
|
|
96
|
|
1,341
|
|
1,742
|
|
184,509
|
|
—
|
|
186,251
|
|
—
|
|
|||||||||||||||
|
Loans to individuals
|
207
|
|
29
|
|
55
|
|
291
|
|
32,468
|
|
—
|
|
32,759
|
|
55
|
|
|||||||||||||||
|
Lease financings
|
2,460
|
|
411
|
|
307
|
|
3,178
|
|
138,778
|
|
—
|
|
141,956
|
|
137
|
|
|||||||||||||||
|
Total
|
$
|
16,434
|
|
$
|
3,227
|
|
$
|
8,280
|
|
$
|
27,941
|
|
$
|
3,977,938
|
|
$
|
695
|
|
$
|
4,006,574
|
|
$
|
192
|
|
|||||||
|
At December 31, 2017
|
|||||||||||||||||||||||||||||||
|
Commercial, financial and agricultural
|
$
|
2,182
|
|
$
|
1,440
|
|
$
|
1,509
|
|
$
|
5,131
|
|
$
|
890,658
|
|
$
|
422
|
|
$
|
896,211
|
|
$
|
—
|
|
|||||||
|
Real estate—commercial real estate and construction:
|
|||||||||||||||||||||||||||||||
|
Commercial real estate
|
733
|
|
548
|
|
1,410
|
|
2,691
|
|
1,539,094
|
|
356
|
|
1,542,141
|
|
—
|
|
|||||||||||||||
|
Construction
|
1,970
|
|
—
|
|
365
|
|
2,335
|
|
173,501
|
|
—
|
|
175,836
|
|
—
|
|
|||||||||||||||
|
Real estate—residential and home equity:
|
|||||||||||||||||||||||||||||||
|
Residential secured for business purpose
|
1,651
|
|
315
|
|
1,355
|
|
3,321
|
|
338,061
|
|
585
|
|
341,967
|
|
162
|
|
|||||||||||||||
|
Residential secured for personal purpose
|
4,368
|
|
1,118
|
|
23
|
|
5,509
|
|
315,845
|
|
220
|
|
321,574
|
|
—
|
|
|||||||||||||||
|
Home equity secured for personal purpose
|
1,414
|
|
333
|
|
464
|
|
2,211
|
|
182,059
|
|
—
|
|
184,270
|
|
148
|
|
|||||||||||||||
|
Loans to individuals
|
221
|
|
139
|
|
195
|
|
555
|
|
27,745
|
|
—
|
|
28,300
|
|
195
|
|
|||||||||||||||
|
Lease financings
|
1,143
|
|
392
|
|
1,855
|
|
3,390
|
|
126,378
|
|
—
|
|
129,768
|
|
256
|
|
|||||||||||||||
|
Total
|
$
|
13,682
|
|
$
|
4,285
|
|
$
|
7,176
|
|
$
|
25,143
|
|
$
|
3,593,341
|
|
$
|
1,583
|
|
$
|
3,620,067
|
|
$
|
761
|
|
|||||||
|
68
|
Nonperforming Loans and Leases
The following presents, by class of loans and leases, nonperforming loans and leases at
December 31, 2018
and
2017
. Nonperforming loans exclude acquired credit impaired loans from Fox Chase and Valley Green.
|
At December 31,
|
|||||||||||||||||||||||||||||||
|
|
2018
|
2017
|
|||||||||||||||||||||||||||||
|
(Dollars in thousands)
|
Nonaccrual
Loans and Leases* |
Accruing
Troubled Debt Restructured Loans and Lease Modifications |
Loans and
Leases 90 Days or more Past Due and Accruing Interest |
Total Nonperforming
Loans and Leases |
Nonaccrual
Loans and Leases* |
Accruing
Troubled Debt Restructured Loans and Lease Modifications |
Loans and
Leases 90 Days or more Past Due and Accruing Interest |
Total Nonperforming
Loans and Leases |
|||||||||||||||||||||||
|
Commercial, financial and agricultural
|
$
|
3,365
|
|
$
|
382
|
|
$
|
—
|
|
$
|
3,747
|
|
$
|
4,448
|
|
$
|
921
|
|
$
|
—
|
|
$
|
5,369
|
|
|||||||
|
Real estate—commercial real estate and construction:
|
|||||||||||||||||||||||||||||||
|
Commercial real estate
|
18,214
|
|
—
|
|
—
|
|
18,214
|
|
4,285
|
|
10,266
|
|
—
|
|
14,551
|
|
|||||||||||||||
|
Construction
|
106
|
|
—
|
|
—
|
|
106
|
|
365
|
|
—
|
|
—
|
|
365
|
|
|||||||||||||||
|
Real estate—residential and home equity:
|
|||||||||||||||||||||||||||||||
|
Residential secured for business purpose
|
1,318
|
|
160
|
|
—
|
|
1,478
|
|
2,843
|
|
206
|
|
162
|
|
3,211
|
|
|||||||||||||||
|
Residential secured for personal purpose
|
1,587
|
|
—
|
|
—
|
|
1,587
|
|
466
|
|
42
|
|
—
|
|
508
|
|
|||||||||||||||
|
Home equity secured for personal purpose
|
1,448
|
|
—
|
|
—
|
|
1,448
|
|
511
|
|
—
|
|
148
|
|
659
|
|
|||||||||||||||
|
Loans to individuals
|
—
|
|
—
|
|
55
|
|
55
|
|
—
|
|
—
|
|
195
|
|
195
|
|
|||||||||||||||
|
Lease financings
|
170
|
|
—
|
|
137
|
|
307
|
|
1,599
|
|
—
|
|
256
|
|
1,855
|
|
|||||||||||||||
|
Total
|
$
|
26,208
|
|
$
|
542
|
|
$
|
192
|
|
$
|
26,942
|
|
$
|
14,517
|
|
$
|
11,435
|
|
$
|
761
|
|
$
|
26,713
|
|
|||||||
*
Includes nonaccrual troubled debt restructured loans and lease modifications of
$1.3 million
and
$2.5 million
at
December 31, 2018
and
December 31, 2017
, respectively.
Accruing troubled debt restructuring loans of
$11.4 million
at
December 31, 2017
includes balances of
$10.3 million
related to
one
borrower which were classified as troubled debt restructurings as the related loans were granted amortization period extensions. These troubled debt restructured loans were returned to performing status during the first quarter of 2018 as the borrower was in compliance with the modified terms of the restructurings for the required time period. At
December 31, 2018
, commercial real estate nonaccrual loans and leases includes an
$11.5 million
loan that was placed on nonaccrual status during the first quarter of 2018. A specific reserve of
$624 thousand
was recorded for this loan as of
December 31, 2018
.
Credit Quality Indicators
The following tables present by class, the recorded investment in loans and leases held for investment by credit quality indicator at
December 31, 2018
and
2017
.
The Corporation employs a ten (10) grade risk rating system related to the credit quality of commercial loans and residential real estate loans secured for a business purpose of which the first six categories are pass categories (credits not adversely rated).
The following is a description of the internal risk ratings and the likelihood of loss related to each risk rating. Loans with a relationship balance of less than
$1 million
are reviewed on a performance basis, with the primary monitored metrics being delinquency (60 days or more past due) and revolving stagnancy. Loans with relationships greater than
$1 million
are reviewed at least annually. Loan relationships exceeding
$15 million
or classified as special mention or substandard are reviewed at least quarterly, or more frequently based on management’s discretion.
|
1.
|
Cash Secured—No credit risk
|
|
2.
|
Fully Secured—Negligible credit risk
|
|
3.
|
Strong—Minimal credit risk
|
|
4.
|
Satisfactory—Nominal credit risk
|
|
5.
|
Acceptable—Moderate credit risk
|
|
6.
|
Pre-Watch—Marginal, but stable credit risk
|
|
7.
|
Special Mention—Potential weakness
|
|
8.
|
Substandard—Well-defined weakness
|
|
9.
|
Doubtful—Collection in-full improbable
|
|
10.
|
Loss—Considered uncollectible
|
|
69
|
Commercial Credit Exposure Credit Risk by Internally Assigned Grades
The following table presents classifications for originated loans:
|
(Dollars in thousands)
|
Commercial,
Financial and Agricultural |
Real Estate—
Commercial |
Real Estate—
Construction |
Real Estate—
Residential Secured for Business Purpose |
Total
|
||||||||||||||
|
At December 31, 2018
|
|||||||||||||||||||
|
Grade:
|
|||||||||||||||||||
|
1. Cash secured/ 2. Fully secured
|
$
|
2,783
|
|
$
|
—
|
|
$
|
27,783
|
|
$
|
—
|
|
$
|
30,566
|
|
||||
|
3. Strong
|
14,762
|
|
698
|
|
—
|
|
—
|
|
15,460
|
|
|||||||||
|
4. Satisfactory
|
20,133
|
|
21,790
|
|
—
|
|
—
|
|
41,923
|
|
|||||||||
|
5. Acceptable
|
627,585
|
|
1,118,288
|
|
78,855
|
|
251,099
|
|
2,075,827
|
|
|||||||||
|
6. Pre-watch
|
217,473
|
|
314,458
|
|
108,769
|
|
47,257
|
|
687,957
|
|
|||||||||
|
7. Special Mention
|
23,287
|
|
31,791
|
|
—
|
|
721
|
|
55,799
|
|
|||||||||
|
8. Substandard
|
7,143
|
|
20,554
|
|
106
|
|
3,316
|
|
31,119
|
|
|||||||||
|
9. Doubtful
|
—
|
|
—
|
|
—
|
|
—
|
|
—
|
|
|||||||||
|
10. Loss
|
—
|
|
—
|
|
—
|
|
—
|
|
—
|
|
|||||||||
|
Total
|
$
|
913,166
|
|
$
|
1,507,579
|
|
$
|
215,513
|
|
$
|
302,393
|
|
$
|
2,938,651
|
|
||||
|
At December 31, 2017
|
|||||||||||||||||||
|
Grade:
|
|||||||||||||||||||
|
1. Cash secured/ 2. Fully secured
|
$
|
2,521
|
|
$
|
—
|
|
$
|
20,420
|
|
$
|
—
|
|
$
|
22,941
|
|
||||
|
3. Strong
|
9,206
|
|
1,821
|
|
—
|
|
—
|
|
11,027
|
|
|||||||||
|
4. Satisfactory
|
30,283
|
|
26,950
|
|
—
|
|
274
|
|
57,507
|
|
|||||||||
|
5. Acceptable
|
593,205
|
|
960,258
|
|
76,899
|
|
215,750
|
|
1,846,112
|
|
|||||||||
|
6. Pre-watch
|
179,990
|
|
209,844
|
|
72,168
|
|
29,738
|
|
491,740
|
|
|||||||||
|
7. Special Mention
|
4,027
|
|
12,974
|
|
1,392
|
|
296
|
|
18,689
|
|
|||||||||
|
8. Substandard
|
13,868
|
|
23,834
|
|
365
|
|
4,742
|
|
42,809
|
|
|||||||||
|
9. Doubtful
|
—
|
|
—
|
|
—
|
|
—
|
|
—
|
|
|||||||||
|
10. Loss
|
—
|
|
—
|
|
—
|
|
—
|
|
—
|
|
|||||||||
|
Total
|
$
|
833,100
|
|
$
|
1,235,681
|
|
$
|
171,244
|
|
$
|
250,800
|
|
$
|
2,490,825
|
|
||||
The following table presents classifications for acquired loans:
|
(Dollars in thousands)
|
Commercial,
Financial and Agricultural |
Real Estate—
Commercial |
Real Estate—
Construction |
Real Estate—
Residential Secured for Business Purpose |
Total
|
||||||||||||||
|
At December 31, 2018
|
|||||||||||||||||||
|
Grade:
|
|||||||||||||||||||
|
1. Cash secured/ 2. Fully secured
|
$
|
—
|
|
$
|
—
|
|
$
|
—
|
|
$
|
—
|
|
$
|
—
|
|
||||
|
3. Strong
|
—
|
|
—
|
|
—
|
|
—
|
|
—
|
|
|||||||||
|
4. Satisfactory
|
—
|
|
—
|
|
—
|
|
—
|
|
—
|
|
|||||||||
|
5. Acceptable
|
21,468
|
|
145,722
|
|
—
|
|
51,066
|
|
218,256
|
|
|||||||||
|
6. Pre-watch
|
2,982
|
|
75,189
|
|
—
|
|
8,501
|
|
86,672
|
|
|||||||||
|
7. Special Mention
|
—
|
|
—
|
|
—
|
|
—
|
|
—
|
|
|||||||||
|
8. Substandard
|
69
|
|
12,714
|
|
—
|
|
836
|
|
13,619
|
|
|||||||||
|
9. Doubtful
|
—
|
|
—
|
|
—
|
|
—
|
|
—
|
|
|||||||||
|
10. Loss
|
—
|
|
—
|
|
—
|
|
—
|
|
—
|
|
|||||||||
|
Total
|
$
|
24,519
|
|
$
|
233,625
|
|
$
|
—
|
|
$
|
60,403
|
|
$
|
318,547
|
|
||||
|
At December 31, 2017
|
|||||||||||||||||||
|
Grade:
|
|||||||||||||||||||
|
1. Cash secured/ 2. Fully secured
|
$
|
1,120
|
|
$
|
—
|
|
$
|
—
|
|
$
|
—
|
|
$
|
1,120
|
|
||||
|
3. Strong
|
—
|
|
—
|
|
—
|
|
—
|
|
—
|
|
|||||||||
|
4. Satisfactory
|
125
|
|
482
|
|
—
|
|
—
|
|
607
|
|
|||||||||
|
5. Acceptable
|
49,949
|
|
183,490
|
|
—
|
|
73,402
|
|
306,841
|
|
|||||||||
|
6. Pre-watch
|
6,183
|
|
98,977
|
|
4,592
|
|
15,861
|
|
125,613
|
|
|||||||||
|
7. Special Mention
|
1,007
|
|
17,028
|
|
—
|
|
—
|
|
18,035
|
|
|||||||||
|
8. Substandard
|
4,727
|
|
6,483
|
|
—
|
|
1,904
|
|
13,114
|
|
|||||||||
|
9. Doubtful
|
—
|
|
—
|
|
—
|
|
—
|
|
—
|
|
|||||||||
|
10. Loss
|
—
|
|
—
|
|
—
|
|
—
|
|
—
|
|
|||||||||
|
Total
|
$
|
63,111
|
|
$
|
306,460
|
|
$
|
4,592
|
|
$
|
91,167
|
|
$
|
465,330
|
|
||||
|
70
|
Credit Exposure—Real Estate—Residential Secured for Personal Purpose, Real Estate—Home Equity Secured for Personal Purpose, Loans to Individuals, Lease Financing Credit Risk Profile by Payment Activity
The Corporation monitors the credit risk profile by payment activity for the following classifications of loans and leases: residential real estate loans secured for a personal purpose, home equity loans secured for a personal purpose, loans to individuals and lease financings. Nonperforming loans and leases are loans past due 90 days or more, loans and leases on nonaccrual of interest and troubled debt restructured loans and lease modifications. Performing loans and leases are reviewed only if the loan becomes 60 days or more past due. Nonperforming loans and leases are reviewed monthly. Performing loans and leases have a nominal to moderate risk of loss.
The following table presents classifications for originated loans:
|
(Dollars in thousands)
|
Real Estate—
Residential Secured for Personal Purpose |
Real Estate—
Home Equity Secured for Personal Purpose |
Loans to
Individuals |
Lease
Financings |
Total
|
||||||||||||||
|
At December 31, 2018
|
|||||||||||||||||||
|
Performing
|
$
|
337,762
|
|
$
|
177,139
|
|
$
|
32,562
|
|
$
|
141,649
|
|
$
|
689,112
|
|
||||
|
Nonperforming
|
689
|
|
384
|
|
55
|
|
307
|
|
1,435
|
|
|||||||||
|
Total
|
$
|
338,451
|
|
$
|
177,523
|
|
$
|
32,617
|
|
$
|
141,956
|
|
$
|
690,547
|
|
||||
|
At December 31, 2017
|
|||||||||||||||||||
|
Performing
|
$
|
260,589
|
|
$
|
171,527
|
|
$
|
27,961
|
|
$
|
127,913
|
|
$
|
587,990
|
|
||||
|
Nonperforming
|
65
|
|
357
|
|
195
|
|
1,855
|
|
2,472
|
|
|||||||||
|
Total
|
$
|
260,654
|
|
$
|
171,884
|
|
$
|
28,156
|
|
$
|
129,768
|
|
$
|
590,462
|
|
||||
The following table presents classifications for acquired loans:
|
(Dollars in thousands)
|
Real Estate—
Residential Secured for Personal Purpose |
Real Estate—
Home Equity Secured for Personal Purpose |
Loans to
Individuals |
Lease
Financings |
Total
|
||||||||||||||
|
At December 31, 2018
|
|||||||||||||||||||
|
Performing
|
$
|
49,061
|
|
$
|
7,664
|
|
$
|
142
|
|
$
|
—
|
|
$
|
56,867
|
|
||||
|
Nonperforming
|
898
|
|
1,064
|
|
—
|
|
—
|
|
1,962
|
|
|||||||||
|
Total
|
$
|
49,959
|
|
$
|
8,728
|
|
$
|
142
|
|
$
|
—
|
|
$
|
58,829
|
|
||||
|
At December 31, 2017
|
|||||||||||||||||||
|
Performing
|
$
|
60,477
|
|
$
|
12,084
|
|
$
|
144
|
|
$
|
—
|
|
$
|
72,705
|
|
||||
|
Nonperforming
|
443
|
|
302
|
|
—
|
|
—
|
|
745
|
|
|||||||||
|
Total
|
$
|
60,920
|
|
$
|
12,386
|
|
$
|
144
|
|
$
|
—
|
|
$
|
73,450
|
|
||||
Risks associated with lending activities include, among other things, the impact of changes in interest rates and economic conditions, which may adversely impact the ability of borrowers to repay outstanding loans, and impact the value of the associated collateral.
Commercial, financial and agricultural loans, commercial real estate loans, construction loans and residential real estate loans with a business purpose are generally perceived as having more risk of default than residential real estate loans with a personal purpose and consumer loans. These types of loans involve larger loan balances to a single borrower or groups of related borrowers. Commercial real estate loans may be affected to a greater extent than residential loans by adverse conditions in real estate markets or the economy because commercial real estate borrowers’ ability to repay their loans depends on successful development of their properties and factors affecting residential real estate borrowers.
Commercial, financial and agricultural business loans are typically based on the borrowers’ ability to repay the loans from the cash flow of their businesses. These loans may involve greater risk because the availability of funds to repay each loan depends substantially on the success of the business itself. In addition, the collateral securing the loans often depreciates over time, is difficult to appraise and liquidate and fluctuates in value based on the success of the business.
Risk of loss on a construction loan depends largely upon whether our initial estimate of the property’s value at completion of construction equals or exceeds the cost of the property construction (including interest). During the construction phase, a number of factors can result in delays and cost overruns. If estimates of value are inaccurate or if actual construction costs exceed estimates,
|
71
|
the value of the property securing the loan may be insufficient to ensure full repayment when completed through a permanent loan or by seizure of collateral. Included in real estate-construction is track development financing. Risk factors related to track development financing include the demand for residential housing and the real estate valuation market. When projects move slower than anticipated, the properties may have significantly lower values than when the original underwriting was completed, resulting in lower collateral values to support the loan. Extended time frames also cause the interest carrying cost for a project to be higher than the builder projected, negatively impacting the builder’s profit and cash flow and, therefore, their ability to make principal and interest payments.
Commercial real estate loans and residential real estate loans with a business purpose secured by owner-occupied properties are dependent upon the successful operation of the borrower’s business. If the operating company suffers difficulties in terms of sales volume and/or profitability, the borrower’s ability to repay the loan may be impaired. Loans secured by properties where repayment is dependent upon payment of rent by third party tenants or the sale of the property may be impacted by loss of tenants, lower lease rates needed to attract new tenants or the inability to sell a completed project in a timely fashion and at a profit.
The Corporation originates fixed-rate and adjustable-rate real estate-residential mortgage loans and home equity loans that are secured by the underlying 1-to-4 family residential properties for personal purposes. Credit risk exposure in this area of lending is minimized by the evaluation of the creditworthiness of the borrower, including debt-to-equity ratios, credit scores and adherence to underwriting policies.
Credit risk for direct consumer loans is controlled by strict adherence to underwriting standards that consider debt-to-income levels and the creditworthiness of the borrower and, if secured, collateral values. These loans are included within the portfolio of loans to individuals.
The primary risks that are involved with lease financing receivables are credit underwriting and borrower industry concentrations. The Corporation has strict underwriting, review, and monitoring procedures in place to mitigate this risk. Risk also lies in the residual value of the underlying equipment. Residual values are subject to judgments as to the value of the underlying equipment that can be affected by changes in economic and market conditions and the financial viability of the residual guarantors and insurers. To the extent not guaranteed or assumed by a third party, or otherwise insured against, the Corporation bears the risk of ownership of the leased assets. This includes the risk that the actual value of the leased assets at the end of the lease term will be less than the residual value.
The Corporation greatly reduces this risk primarily by using $1.00 buyout leases, in which the entire cost of the leased equipment is included in the contractual payments, leaving no residual payment at the end of the lease term.
|
72
|
Reserve for Loan and Lease Losses and Recorded Investment in Loans and Leases
The following presents, by portfolio segment, a summary of the activity in the reserve for loan and lease losses for the years ended
December 31, 2018
,
2017
and
2016
:
|
(Dollars in thousands)
|
Commercial,
Financial and Agricultural |
Real Estate—
Commercial and Construction |
Real Estate—
Residential Secured for Business Purpose |
Real Estate—
Residential and Home Equity Secured for Personal Purpose |
Loans to
Individuals |
Lease
Financings |
Unallocated
|
Total
|
|||||||||||||||||||||||
|
For the Year Ended December 31, 2018
|
|||||||||||||||||||||||||||||||
|
Reserve for loan and lease losses:
|
|||||||||||||||||||||||||||||||
|
Beginning balance
|
$
|
6,742
|
|
$
|
9,839
|
|
$
|
1,661
|
|
$
|
1,754
|
|
$
|
373
|
|
$
|
1,132
|
|
$
|
54
|
|
$
|
21,555
|
|
|||||||
|
Charge-offs
|
(14,655
|
)
|
(40
|
)
|
(31
|
)
|
—
|
|
(353
|
)
|
(572
|
)
|
N/A
|
|
(15,651
|
)
|
|||||||||||||||
|
Recoveries
|
2,140
|
|
333
|
|
280
|
|
78
|
|
88
|
|
231
|
|
N/A
|
|
3,150
|
|
|||||||||||||||
|
Provision
|
13,756
|
|
3,771
|
|
318
|
|
1,364
|
|
376
|
|
497
|
|
217
|
|
20,299
|
|
|||||||||||||||
|
Provision for acquired credit impaired loans
|
—
|
|
—
|
|
8
|
|
3
|
|
—
|
|
—
|
|
—
|
|
11
|
|
|||||||||||||||
|
Ending balance
|
$
|
7,983
|
|
$
|
13,903
|
|
$
|
2,236
|
|
$
|
3,199
|
|
$
|
484
|
|
$
|
1,288
|
|
$
|
271
|
|
$
|
29,364
|
|
|||||||
|
For the Year Ended December 31, 2017
|
|||||||||||||||||||||||||||||||
|
Reserve for loan and lease losses:
|
|||||||||||||||||||||||||||||||
|
Beginning balance
|
$
|
7,037
|
|
$
|
7,505
|
|
$
|
774
|
|
$
|
993
|
|
$
|
364
|
|
$
|
788
|
|
$
|
38
|
|
$
|
17,499
|
|
|||||||
|
Charge-offs
|
(1,030
|
)
|
(232
|
)
|
(1,370
|
)
|
(196
|
)
|
(317
|
)
|
(3,992
|
)
|
N/A
|
|
(7,137
|
)
|
|||||||||||||||
|
Recoveries
|
801
|
|
5
|
|
54
|
|
99
|
|
136
|
|
206
|
|
N/A
|
|
1,301
|
|
|||||||||||||||
|
(Recovery of provision) provision
|
(66
|
)
|
2,561
|
|
2,204
|
|
857
|
|
190
|
|
4,130
|
|
16
|
|
9,892
|
|
|||||||||||||||
|
(Recovery of provision) provision for acquired credit impaired loans
|
—
|
|
—
|
|
(1
|
)
|
1
|
|
—
|
|
—
|
|
—
|
|
—
|
|
|||||||||||||||
|
Ending balance
|
$
|
6,742
|
|
$
|
9,839
|
|
$
|
1,661
|
|
$
|
1,754
|
|
$
|
373
|
|
$
|
1,132
|
|
$
|
54
|
|
$
|
21,555
|
|
|||||||
|
For the Year Ended December 31, 2016
|
|||||||||||||||||||||||||||||||
|
Reserve for loan and lease losses:
|
|||||||||||||||||||||||||||||||
|
Beginning balance
|
$
|
6,418
|
|
$
|
6,572
|
|
$
|
763
|
|
$
|
1,575
|
|
$
|
346
|
|
$
|
1,042
|
|
$
|
912
|
|
$
|
17,628
|
|
|||||||
|
Charge-offs
|
(4,827
|
)
|
(307
|
)
|
(522
|
)
|
(178
|
)
|
(395
|
)
|
(759
|
)
|
N/A
|
|
(6,988
|
)
|
|||||||||||||||
|
Recoveries
|
1,454
|
|
101
|
|
71
|
|
88
|
|
133
|
|
191
|
|
N/A
|
|
2,038
|
|
|||||||||||||||
|
Provision (recovery of provision)
|
3,992
|
|
961
|
|
462
|
|
(489
|
)
|
280
|
|
314
|
|
(874
|
)
|
4,646
|
|
|||||||||||||||
|
Provision (recovery of provision) for acquired credit impaired loans
|
—
|
|
178
|
|
—
|
|
(3
|
)
|
—
|
|
—
|
|
—
|
|
175
|
|
|||||||||||||||
|
Ending balance
|
$
|
7,037
|
|
$
|
7,505
|
|
$
|
774
|
|
$
|
993
|
|
$
|
364
|
|
$
|
788
|
|
$
|
38
|
|
$
|
17,499
|
|
|||||||
N/A – Not applicable
Charge-offs for the year ended
December 31, 2018
included a charge-off of
$12.7 million
during the second quarter of 2018 for a commercial loan relationship related to fraudulent activities by employees of the borrower. The Bank owned a participating interest which originally totaled
$13.0 million
in an approximately
$80.0 million
commercial lending facility. The charge-off represented the entire principal amount owed to the Bank. During the fourth quarter of 2018, the Bank recovered
$1.8 million
from this previously charged-off loan. Total net charge-off for this loan for the year ended December 31, 2018 was
$10.9 million
.
|
73
|
The following presents, by portfolio segment, the balance in the reserve for loan and lease losses disaggregated on the basis of impairment method and the recorded investment in loans and leases disaggregated on the basis of impairment method at
December 31, 2018
and
2017
:
|
(Dollars in thousands)
|
Commercial,
Financial and Agricultural |
Real Estate—
Commercial and Construction |
Real Estate—
Residential Secured for Business Purpose |
Real Estate—
Residential and Home Equity Secured for Personal Purpose |
Loans to
Individuals |
Lease
Financings |
Unallocated
|
Total
|
|||||||||||||||||||||||
|
At December 31, 2018
|
|||||||||||||||||||||||||||||||
|
Reserve for loan and lease losses:
|
|||||||||||||||||||||||||||||||
|
Ending balance: individually evaluated for impairment
|
$
|
413
|
|
$
|
675
|
|
$
|
—
|
|
$
|
327
|
|
$
|
—
|
|
$
|
—
|
|
N/A
|
|
$
|
1,415
|
|
||||||||
|
Ending balance: collectively evaluated for impairment
|
7,570
|
|
13,183
|
|
2,233
|
|
2,872
|
|
484
|
|
1,288
|
|
271
|
|
27,901
|
|
|||||||||||||||
|
Ending balance: acquired non-credit impaired loans evaluated for impairment
|
—
|
|
45
|
|
3
|
|
—
|
|
—
|
|
—
|
|
—
|
|
48
|
|
|||||||||||||||
|
Total ending balance
|
$
|
7,983
|
|
$
|
13,903
|
|
$
|
2,236
|
|
$
|
3,199
|
|
$
|
484
|
|
$
|
1,288
|
|
$
|
271
|
|
$
|
29,364
|
|
|||||||
|
Loans and leases held for investment:
|
|||||||||||||||||||||||||||||||
|
Ending balance: individually evaluated for impairment
|
$
|
3,747
|
|
$
|
18,321
|
|
$
|
1,478
|
|
$
|
3,035
|
|
$
|
—
|
|
$
|
—
|
|
$
|
26,581
|
|
||||||||||
|
Ending balance: collectively evaluated for impairment
|
909,419
|
|
1,702,992
|
|
300,915
|
|
512,939
|
|
32,617
|
|
141,956
|
|
3,600,838
|
|
|||||||||||||||||
|
Loans measured at fair value
|
—
|
|
1,779
|
|
—
|
|
—
|
|
—
|
|
—
|
|
1,779
|
|
|||||||||||||||||
|
Acquired non-credit impaired loans
|
24,519
|
|
233,419
|
|
59,977
|
|
58,624
|
|
142
|
|
—
|
|
376,681
|
|
|||||||||||||||||
|
Acquired credit impaired loans
|
—
|
|
206
|
|
426
|
|
63
|
|
—
|
|
—
|
|
695
|
|
|||||||||||||||||
|
Total ending balance
|
$
|
937,685
|
|
$
|
1,956,717
|
|
$
|
362,796
|
|
$
|
574,661
|
|
$
|
32,759
|
|
$
|
141,956
|
|
$
|
4,006,574
|
|
||||||||||
|
At December 31, 2017
|
|||||||||||||||||||||||||||||||
|
Reserve for loan and lease losses:
|
|||||||||||||||||||||||||||||||
|
Ending balance: individually evaluated for impairment
|
$
|
31
|
|
$
|
99
|
|
$
|
1
|
|
$
|
—
|
|
$
|
—
|
|
$
|
—
|
|
N/A
|
|
$
|
131
|
|
||||||||
|
Ending balance: collectively evaluated for impairment
|
6,711
|
|
9,740
|
|
1,660
|
|
1,754
|
|
373
|
|
1,132
|
|
54
|
|
21,424
|
|
|||||||||||||||
|
Total ending balance
|
$
|
6,742
|
|
$
|
9,839
|
|
$
|
1,661
|
|
$
|
1,754
|
|
$
|
373
|
|
$
|
1,132
|
|
$
|
54
|
|
$
|
21,555
|
|
|||||||
|
Loans and leases held for investment:
|
|||||||||||||||||||||||||||||||
|
Ending balance: individually evaluated for impairment
|
$
|
7,079
|
|
$
|
16,919
|
|
$
|
3,465
|
|
$
|
1,019
|
|
$
|
—
|
|
$
|
1,250
|
|
$
|
29,732
|
|
||||||||||
|
Ending balance: collectively evaluated for impairment
|
826,021
|
|
1,388,048
|
|
247,335
|
|
431,519
|
|
28,156
|
|
128,518
|
|
3,049,597
|
|
|||||||||||||||||
|
Loans measured at fair value
|
—
|
|
1,958
|
|
—
|
|
—
|
|
—
|
|
—
|
|
1,958
|
|
|||||||||||||||||
|
Acquired non-credit impaired loans
|
62,689
|
|
310,696
|
|
90,582
|
|
73,086
|
|
144
|
|
—
|
|
537,197
|
|
|||||||||||||||||
|
Acquired credit impaired loans
|
422
|
|
356
|
|
585
|
|
220
|
|
—
|
|
—
|
|
1,583
|
|
|||||||||||||||||
|
Total ending balance
|
$
|
896,211
|
|
$
|
1,717,977
|
|
$
|
341,967
|
|
$
|
505,844
|
|
$
|
28,300
|
|
$
|
129,768
|
|
$
|
3,620,067
|
|
||||||||||
N/A – Not applicable
|
74
|
T
he Corporation does not provide a reserve for loan loss for acquired loans unless additional deterioration of the portfolio is identified over the projections utilized in the initial fair value analysis. After the acquisition measurement period, the present value of any decreases in expected cash flows of acquired credit impaired loans will generally result in an impairment charge recorded as a provision for loan loss.
Impaired Loans (excludes Lease Financings)
The following presents, by class of loans, the recorded investment and unpaid principal balance of impaired loans, the amounts of the impaired loans for which there is not a reserve for credit losses and the amounts for which there is a reserve for credit losses at
December 31, 2018
and
2017
. The impaired loans exclude acquired credit impaired loans.
|
At December 31,
|
|||||||||||||||||||||||
|
|
2018
|
2017
|
|||||||||||||||||||||
|
(Dollars in thousands)
|
Recorded
Investment |
Unpaid
Principal Balance |
Related
Reserve |
Recorded
Investment |
Unpaid
Principal Balance |
Related
Reserve |
|||||||||||||||||
|
Impaired loans with no related reserve recorded:
|
|||||||||||||||||||||||
|
Commercial, financial and agricultural
|
$
|
2,776
|
|
$
|
3,361
|
|
$
|
7,019
|
|
$
|
8,301
|
|
|||||||||||
|
Real estate—commercial real estate
|
6,578
|
|
7,516
|
|
15,621
|
|
16,507
|
|
|||||||||||||||
|
Real estate—construction
|
106
|
|
111
|
|
365
|
|
365
|
|
|||||||||||||||
|
Real estate—residential secured for business purpose
|
1,478
|
|
1,660
|
|
3,430
|
|
4,620
|
|
|||||||||||||||
|
Real estate—residential secured for personal purpose
|
863
|
|
911
|
|
508
|
|
566
|
|
|||||||||||||||
|
Real estate—home equity secured for personal purpose
|
1,373
|
|
1,404
|
|
511
|
|
523
|
|
|||||||||||||||
|
Total impaired loans with no related reserve recorded
|
$
|
13,174
|
|
$
|
14,963
|
|
$
|
27,454
|
|
$
|
30,882
|
|
|||||||||||
|
Impaired loans with a reserve recorded:
|
|||||||||||||||||||||||
|
Commercial, financial and agricultural
|
$
|
971
|
|
$
|
1,024
|
|
$
|
413
|
|
$
|
60
|
|
$
|
60
|
|
$
|
31
|
|
|||||
|
Real estate—commercial real estate
|
11,637
|
|
12,162
|
|
675
|
|
933
|
|
933
|
|
99
|
|
|||||||||||
|
Real estate—residential secured for business purpose
|
—
|
|
—
|
|
—
|
|
35
|
|
37
|
|
1
|
|
|||||||||||
|
Real estate—residential secured for personal purpose
|
724
|
|
724
|
|
252
|
|
—
|
|
—
|
|
—
|
|
|||||||||||
|
Real estate—home equity secured for personal purpose
|
75
|
|
75
|
|
75
|
|
—
|
|
—
|
|
—
|
|
|||||||||||
|
Total impaired loans with a reserve recorded
|
$
|
13,407
|
|
$
|
13,985
|
|
$
|
1,415
|
|
$
|
1,028
|
|
$
|
1,030
|
|
$
|
131
|
|
|||||
|
Total impaired loans:
|
|||||||||||||||||||||||
|
Commercial, financial and agricultural
|
$
|
3,747
|
|
$
|
4,385
|
|
$
|
413
|
|
$
|
7,079
|
|
$
|
8,361
|
|
$
|
31
|
|
|||||
|
Real estate—commercial real estate
|
18,215
|
|
19,678
|
|
675
|
|
16,554
|
|
17,440
|
|
99
|
|
|||||||||||
|
Real estate—construction
|
106
|
|
111
|
|
—
|
|
365
|
|
365
|
|
—
|
|
|||||||||||
|
Real estate—residential secured for business purpose
|
1,478
|
|
1,660
|
|
—
|
|
3,465
|
|
4,657
|
|
1
|
|
|||||||||||
|
Real estate—residential secured for personal purpose
|
1,587
|
|
1,635
|
|
252
|
|
508
|
|
566
|
|
—
|
|
|||||||||||
|
Real estate—home equity secured for personal purpose
|
1,448
|
|
1,479
|
|
75
|
|
511
|
|
523
|
|
—
|
|
|||||||||||
|
Total impaired loans
|
$
|
26,581
|
|
$
|
28,948
|
|
$
|
1,415
|
|
$
|
28,482
|
|
$
|
31,912
|
|
$
|
131
|
|
|||||
Impaired loans includes nonaccrual loans and accruing troubled debt restructured loans for which it is probable that not all principal and interest payments due will be collectible in accordance with the original contractual terms. These loans are individually measured to determine the amount of potential impairment. The loans are reviewed for impairment based on the fair value of the collateral for collateral dependent loans and for certain loans based on discounted cash flows using the loans’ initial effective interest rates.
|
75
|
The following presents by class of loans, the average recorded investment in impaired loans and an analysis of interest on impaired loans. A loan may remain on accrual status if it is an accruing troubled debt restructured loan or if it is in the process of collection and is either guaranteed or well secured. Therefore, interest income on accruing impaired loans is recognized using the accrual method.
|
For the Years Ended December 31,
|
|||||||||||||||||||||||||||||||||||
|
|
2018
|
2017
|
2016
|
||||||||||||||||||||||||||||||||
|
(Dollars in thousands)
|
Average
Recorded Investment |
Interest
Income Recognized* |
Additional
Interest Income That Would Have Been Recognized Under Original Terms |
Average
Recorded Investment |
Interest
Income Recognized* |
Additional
Interest Income That Would Have Been Recognized Under Original Terms |
Average
Recorded Investment |
Interest
Income Recognized* |
Additional
Interest Income That Would Have Been Recognized Under Original Terms |
||||||||||||||||||||||||||
|
Commercial, financial and agricultural
|
$
|
6,242
|
|
$
|
134
|
|
$
|
335
|
|
$
|
10,456
|
|
$
|
200
|
|
$
|
347
|
|
$
|
13,126
|
|
$
|
258
|
|
$
|
381
|
|
||||||||
|
Real estate—commercial real estate
|
19,665
|
|
222
|
|
1,073
|
|
20,054
|
|
792
|
|
289
|
|
26,698
|
|
1,106
|
|
272
|
|
|||||||||||||||||
|
Real estate—construction
|
123
|
|
—
|
|
8
|
|
253
|
|
—
|
|
19
|
|
—
|
|
—
|
|
—
|
|
|||||||||||||||||
|
Real estate—residential secured for business purpose
|
1,844
|
|
22
|
|
108
|
|
3,801
|
|
65
|
|
169
|
|
4,084
|
|
67
|
|
207
|
|
|||||||||||||||||
|
Real estate—residential secured for personal purpose
|
1,229
|
|
3
|
|
94
|
|
614
|
|
3
|
|
39
|
|
498
|
|
2
|
|
24
|
|
|||||||||||||||||
|
Real estate—home equity secured for personal purpose
|
1,112
|
|
1
|
|
85
|
|
406
|
|
—
|
|
26
|
|
440
|
|
—
|
|
25
|
|
|||||||||||||||||
|
Total
|
$
|
30,215
|
|
$
|
382
|
|
$
|
1,703
|
|
$
|
35,584
|
|
$
|
1,060
|
|
$
|
889
|
|
$
|
44,846
|
|
$
|
1,433
|
|
$
|
909
|
|
||||||||
|
*
|
Includes interest income recognized on a cash basis for nonaccrual loans of
$27 thousand
,
$4 thousand
and
$8 thousand
for the years ended
December 31, 2018
,
2017
and
2016
, respectively and interest income recognized on the accrual method for accruing impaired loans of
$355 thousand
,
$1.1 million
and
$1.4 million
for the years ended
December 31, 2018
,
2017
and
2016
, respectively.
|
The Bank maintains a reserve in other liabilities for off-balance sheet credit exposures that currently are unfunded. The reserve for these off-balance sheet credits was
$426 thousand
and
$390 thousand
at
December 31, 2018
and
2017
, respectively.
Impaired Leases
The Corporation had
no
impaired leases at
December 31, 2018
. The Corporation had impaired leases of
$1.3 million
at
December 31, 2017
with
no
related reserves which were paid off in full during the fourth quarter of 2018.
|
76
|
Troubled Debt Restructured Loans
The following presents, by class of loans, information regarding accruing and nonaccrual loans that were restructured during the years ended
December 31, 2018
and
2017
:
|
For the Years Ended December 31,
|
|||||||||||||||||||||||||||||
|
|
2018
|
2017
|
|||||||||||||||||||||||||||
|
(Dollars in thousands)
|
Number
of Loans |
Pre-
Restructuring Outstanding Recorded Investment |
Post-
Restructuring Outstanding Recorded Investment |
Related
Reserve |
Number
of Loans |
Pre-
Restructuring Outstanding Recorded Investment |
Post-
Restructuring Outstanding Recorded Investment |
Related
Reserve |
|||||||||||||||||||||
|
Accruing Troubled Debt Restructured Loans:
|
|||||||||||||||||||||||||||||
|
Real estate—commercial real estate
|
—
|
|
$
|
—
|
|
$
|
—
|
|
$
|
—
|
|
3
|
|
$
|
9,206
|
|
$
|
9,206
|
|
$
|
—
|
|
|||||||
|
Total
|
—
|
|
$
|
—
|
|
$
|
—
|
|
$
|
—
|
|
3
|
|
$
|
9,206
|
|
$
|
9,206
|
|
$
|
—
|
|
|||||||
|
Nonaccrual Troubled Debt Restructured Loans:
|
|||||||||||||||||||||||||||||
|
Commercial, financial and agricultural
|
—
|
|
$
|
—
|
|
$
|
—
|
|
$
|
—
|
|
2
|
|
$
|
1,127
|
|
$
|
1,127
|
|
$
|
—
|
|
|||||||
|
Real estate—commercial real estate
|
—
|
|
—
|
|
—
|
|
—
|
|
1
|
|
328
|
|
328
|
|
—
|
|
|||||||||||||
|
Real estate—residential secured for personal purpose
|
1
|
|
66
|
|
66
|
|
—
|
|
—
|
|
—
|
|
—
|
|
—
|
|
|||||||||||||
|
Total
|
1
|
|
$
|
66
|
|
$
|
66
|
|
$
|
—
|
|
3
|
|
$
|
1,455
|
|
$
|
1,455
|
|
$
|
—
|
|
|||||||
The Corporation grants concessions to existing borrowers primarily related to extensions of interest-only payment periods and an occasional payment modification. These modifications typically are for up to
one year
. The goal when restructuring a credit is to establish a reasonable period of time to provide cash flow relief to customers experiencing cash flow difficulties. Accruing troubled debt restructured loans are primarily comprised of loans on which interest is being accrued under the restructured terms, and the loans are current or less than
ninety days
past due.
|
77
|
The following presents, by class of loans, information regarding the types of concessions granted on accruing and nonaccrual loans that were restructured during the years ended
December 31, 2018
and
2017
:
|
|
Maturity Date
Extension |
Amortization Period Extension
|
Total Concessions
Granted |
|||||||||||||||||
|
(Dollars in thousands)
|
No. of
Loans |
Amount
|
No. of
Loans |
Amount
|
No. of
Loans |
Amount
|
||||||||||||||
|
For the Year Ended December 31, 2018
|
||||||||||||||||||||
|
Accruing Troubled Debt Restructured Loans:
|
||||||||||||||||||||
|
Total
|
—
|
|
$
|
—
|
|
—
|
|
$
|
—
|
|
—
|
|
$
|
—
|
|
|||||
|
Nonaccrual Troubled Debt Restructured Loans:
|
||||||||||||||||||||
|
Real estate—residential secured for personal purpose
|
—
|
|
$
|
—
|
|
1
|
|
$
|
66
|
|
1
|
|
$
|
66
|
|
|||||
|
Total
|
—
|
|
$
|
—
|
|
1
|
|
$
|
66
|
|
1
|
|
$
|
66
|
|
|||||
|
For the Year Ended December 31, 2017
|
||||||||||||||||||||
|
Accruing Troubled Debt Restructured Loans:
|
||||||||||||||||||||
|
Real estate—commercial real estate
|
—
|
|
$
|
—
|
|
3
|
|
$
|
9,206
|
|
3
|
|
$
|
9,206
|
|
|||||
|
Total
|
—
|
|
$
|
—
|
|
3
|
|
$
|
9,206
|
|
3
|
|
$
|
9,206
|
|
|||||
|
Nonaccrual Troubled Debt Restructured Loans:
|
||||||||||||||||||||
|
Commercial, financial and agricultural
|
—
|
|
$
|
—
|
|
2
|
|
$
|
1,127
|
|
2
|
|
$
|
1,127
|
|
|||||
|
Real estate—commercial real estate
|
1
|
|
328
|
|
—
|
|
—
|
|
1
|
|
328
|
|
||||||||
|
Total
|
1
|
|
$
|
328
|
|
2
|
|
$
|
1,127
|
|
3
|
|
$
|
1,455
|
|
|||||
There were
no
loans for which there were payment defaults within
twelve months
of the restructuring date during the years ended
December 31, 2018
and
2017
.
The following presents, by class of loans, information regarding consumer mortgages collateralized by residential real estate property that are in the process of foreclosure at
December 31, 2018
and
2017
:
|
(Dollars in thousands)
|
At December 31, 2018
|
At December 31, 2017
|
|||||
|
Real estate-residential secured for personal purpose
|
$
|
563
|
|
$
|
31
|
|
|
|
Real estate-home equity secured for personal purpose
|
1,134
|
|
—
|
|
|||
|
Total
|
$
|
1,697
|
|
$
|
31
|
|
|
The following presents foreclosed residential real estate property included in other real estate owned at
December 31, 2018
and
2017
.
|
(Dollars in thousands)
|
At December 31, 2018
|
At December 31, 2017
|
|||||
|
Foreclosed residential real estate
|
$
|
—
|
|
$
|
80
|
|
|
Note 6. Premises and Equipment
The following table reflects the components of premises and equipment:
|
At December 31,
|
|||||||
|
(Dollars in thousands)
|
2018
|
2017
|
|||||
|
Land and land improvements
|
$
|
15,683
|
|
$
|
15,402
|
|
|
|
Premises and improvements
|
53,707
|
|
54,643
|
|
|||
|
Furniture and equipment
|
32,068
|
|
33,675
|
|
|||
|
Total cost
|
101,458
|
|
103,720
|
|
|||
|
Less: accumulated depreciation
|
(41,899
|
)
|
(41,923
|
)
|
|||
|
Net book value
|
$
|
59,559
|
|
$
|
61,797
|
|
|
|
78
|
The following table summarizes rental expense charged to operations for the periods indicated:
|
For the Years Ended December 31,
|
|||||||||||
|
(Dollars in thousands)
|
2018
|
2017
|
2016
|
||||||||
|
Rental expense
|
$
|
3,866
|
|
$
|
3,938
|
|
$
|
3,791
|
|
||
|
Rental income
|
(207
|
)
|
(227
|
)
|
(138
|
)
|
|||||
|
Net rental expense
|
$
|
3,659
|
|
$
|
3,711
|
|
$
|
3,653
|
|
||
Note 7. Goodwill and Other Intangible Assets
The Corporation has core deposit and customer-related intangibles and servicing rights, which are not deemed to have an indefinite life and therefore will continue to be amortized over their useful life using the present value of projected cash flows. The amortization of intangible assets for the years ended
December 31, 2018
,
2017
and
2016
was
$3.4 million
,
$4.2 million
and
$4.1 million
, respectively. The Corporation also has goodwill which is deemed to be an indefinite intangible asset and is not amortized.
In accordance with ASC Topic 350, the Corporation performed a qualitative assessment of goodwill during the fourth quarter of 2018 and determined it was more likely than not that the fair value of the Corporation, including each of the identified reporting units, was more than its carrying amount; therefore, the Corporation did not need to perform the two-step impairment test for the Corporation or the reporting units.
The Corporation also completed an impairment test for other intangible assets during the fourth quarter of
2018
. There was
no
impairment of goodwill or other identifiable intangibles recorded during
2016
through
2018
.
Changes in the carrying amount of the Corporation's goodwill by business segment for the years ended
December 31, 2018
and
2017
were as follows:
|
(Dollars in thousands)
|
Banking
|
Wealth Management
|
Insurance
|
Consolidated
|
|||||||||||
|
Balance at December 31, 2016
|
$
|
138,476
|
|
$
|
15,434
|
|
$
|
18,649
|
|
$
|
172,559
|
|
|||
|
Addition to goodwill from acquisitions
|
—
|
|
—
|
|
—
|
|
—
|
|
|||||||
|
Balance at December 31, 2017
|
138,476
|
|
15,434
|
|
18,649
|
|
172,559
|
|
|||||||
|
Addition to goodwill from acquisitions
|
—
|
|
—
|
|
—
|
|
—
|
|
|||||||
|
Balance at December 31, 2018
|
$
|
138,476
|
|
$
|
15,434
|
|
$
|
18,649
|
|
$
|
172,559
|
|
|||
The following table reflects the components of intangible assets at the dates indicated:
|
At December 31, 2018
|
At December 31, 2017
|
||||||||||||||||||||||
|
(Dollars in thousands)
|
Gross Carrying Amount
|
Accumulated Amortization and Fair Value Adjustments
|
Net Carrying Amount
|
Gross Carrying Amount
|
Accumulated Amortization and Fair Value Adjustments
|
Net Carrying Amount
|
|||||||||||||||||
|
Amortized intangible assets:
|
|||||||||||||||||||||||
|
Covenants not to compete
|
$
|
710
|
|
$
|
710
|
|
$
|
—
|
|
$
|
710
|
|
$
|
580
|
|
$
|
130
|
|
|||||
|
Core deposit intangibles
|
6,788
|
|
3,143
|
|
3,645
|
|
6,788
|
|
2,135
|
|
4,653
|
|
|||||||||||
|
Customer related intangibles
|
12,381
|
|
10,804
|
|
1,577
|
|
12,381
|
|
9,828
|
|
2,553
|
|
|||||||||||
|
Servicing rights
|
17,314
|
|
10,546
|
|
6,768
|
|
15,855
|
|
9,282
|
|
6,573
|
|
|||||||||||
|
Total amortized intangible assets
|
$
|
37,193
|
|
$
|
25,203
|
|
$
|
11,990
|
|
$
|
35,734
|
|
$
|
21,825
|
|
$
|
13,909
|
|
|||||
The estimated aggregate amortization expense for core deposit and customer-related intangibles for each of the
five
succeeding fiscal years and thereafter follows:
|
Year
|
(Dollars in thousands)
|
Amount
|
||
|
2019
|
$
|
1,565
|
|
|
|
2020
|
1,200
|
|
||
|
2021
|
923
|
|
||
|
2022
|
666
|
|
||
|
2023
|
409
|
|
||
|
Thereafter
|
459
|
|
||
|
79
|
The Corporation has originated mortgage servicing rights, which are included in other intangible assets on the consolidated balance sheet. Mortgage servicing rights are amortized in proportion to, and over the period of, estimated net servicing income on a basis similar to the interest method and an accelerated amortization method for loan payoffs. Mortgage servicing rights are subject to impairment testing on a quarterly basis. The aggregate fair value of these rights was
$11.5 million
and
$10.0 million
at
December 31, 2018
and
2017
, respectively. The fair value of mortgage servicing rights was determined using a discount rate of
10.0%
at
December 31, 2018
and
2017
. The Corporation also records servicing rights on SBA loans. The value of these servicing rights was
$42 thousand
and
$21 thousand
at
December 31, 2018
and
2017
, respectively.
Changes in the servicing rights balance are summarized as follows:
|
|
For the Years Ended December 31,
|
||||||||||
|
(Dollars in thousands)
|
2018
|
2017
|
2016
|
||||||||
|
Beginning of period
|
$
|
6,573
|
|
$
|
6,485
|
|
$
|
5,877
|
|
||
|
Servicing rights capitalized
|
1,458
|
|
1,487
|
|
2,049
|
|
|||||
|
Acquired servicing rights
|
—
|
|
—
|
|
87
|
|
|||||
|
Amortization of servicing rights
|
(1,263
|
)
|
(1,399
|
)
|
(1,528
|
)
|
|||||
|
Changes in valuation allowance
|
—
|
|
—
|
|
—
|
|
|||||
|
End of period
|
$
|
6,768
|
|
$
|
6,573
|
|
$
|
6,485
|
|
||
|
Residential mortgage and SBA loans serviced for others
|
$
|
1,031,506
|
|
$
|
1,008,123
|
|
$
|
965,729
|
|
||
There was no activity in the valuation allowance for the years ended
December 31, 2018
,
2017
and
2016
.
The estimated amortization expense of servicing rights for each of the five succeeding fiscal years and thereafter is as follows:
|
Year
|
(Dollars in thousands)
|
Amount
|
||
|
2019
|
$
|
908
|
|
|
|
2020
|
801
|
|
||
|
2021
|
705
|
|
||
|
2022
|
619
|
|
||
|
2023
|
541
|
|
||
|
Thereafter
|
3,194
|
|
||
Note 8. Accrued Interest Receivable and Other Assets
The following table provides the details of accrued interest receivable and other assets:
|
At December 31,
|
|||||||
|
(Dollars in thousands)
|
2018
|
2017
|
|||||
|
Other real estate owned
|
$
|
1,187
|
|
$
|
1,843
|
|
|
|
Accrued interest receivable
|
14,255
|
|
12,362
|
|
|||
|
Accrued income and other receivables
|
3,933
|
|
3,872
|
|
|||
|
Fair market value of derivative financial instruments
|
679
|
|
601
|
|
|||
|
Other prepaid expenses
|
14,652
|
|
21,496
|
|
|||
|
Net federal deferred tax assets
|
3,585
|
|
1,174
|
|
|||
|
Other
|
322
|
|
154
|
|
|||
|
Total accrued interest and other assets
|
$
|
38,613
|
|
$
|
41,502
|
|
|
|
80
|
Note 9. Deposits
Deposits and their respective weighted average interest rate at
December 31, 2018
and
2017
consist of the following:
|
December 31,
|
|||||||||||||
|
2018
|
2017
|
||||||||||||
|
Weighted Average Interest Rate
|
Amount
|
Weighted Average Interest Rate
|
Amount
|
||||||||||
|
(Dollars in thousands)
|
|||||||||||||
|
Noninterest-bearing deposits
|
—
|
%
|
$
|
1,055,919
|
|
—
|
%
|
$
|
1,040,026
|
|
|||
|
Demand deposits
|
1.01
|
|
1,377,171
|
|
0.43
|
|
1,109,438
|
|
|||||
|
Savings deposits
|
0.33
|
|
782,766
|
|
0.26
|
|
830,706
|
|
|||||
|
Time deposits
|
1.76
|
|
670,077
|
|
1.12
|
|
574,749
|
|
|||||
|
Total
|
0.73
|
%
|
$
|
3,885,933
|
|
0.38
|
%
|
$
|
3,554,919
|
|
|||
The aggregate amount of time deposits in denominations of $100 thousand or more was
$283.4 million
at
December 31, 2018
and
$250.0 million
at
December 31, 2017
. Deposits are insured up to applicable limits by the Deposit Insurance Fund of the FDIC. Deposit insurance per account owner is currently up to $250 thousand. The aggregate amount of time deposits in denominations over $250 thousand was
$129.5 million
at
December 31, 2018
and
$118.4 million
at
December 31, 2017
.
At
December 31, 2018
, the scheduled maturities of time deposits are as follows:
|
Year
|
(Dollars in thousands)
|
Amount
|
||
|
Due in 2019
|
$
|
394,239
|
|
|
|
Due in 2020
|
128,518
|
|
||
|
Due in 2021
|
40,750
|
|
||
|
Due in 2022
|
32,995
|
|
||
|
Due in 2023
|
70,056
|
|
||
|
Thereafter
|
3,519
|
|
||
|
Total
|
$
|
670,077
|
|
|
|
81
|
Note 10. Borrowings
The following is a summary of borrowings by type. Short-term borrowings consist of overnight borrowings and term borrowings with an original maturity of one year or less. The long-term debt balances and weighted average interest rates include purchase accounting fair value adjustments, net of related amortization, from the Fox Chase acquisition.
|
Balance at End of Year
|
Weighted Average Interest Rate
|
Maximum Amount Outstanding at Month End During the Year
|
Average Amount Outstanding During the Year
|
Weighted Average Interest Rate During the Year
|
|||||||||||||
|
(Dollars in thousands)
|
|||||||||||||||||
|
2018
|
|||||||||||||||||
|
Short-term borrowings:
|
|||||||||||||||||
|
FHLB borrowings
|
$
|
108,300
|
|
2.62
|
%
|
$
|
261,240
|
|
$
|
85,601
|
|
2.01
|
%
|
||||
|
Federal funds purchased
|
60,000
|
|
2.60
|
|
65,003
|
|
36,591
|
|
1.88
|
|
|||||||
|
Customer repurchase agreements
|
21,468
|
|
0.05
|
|
28,323
|
|
22,120
|
|
0.05
|
|
|||||||
|
Long-term debt:
|
|||||||||||||||||
|
FHLB advances
|
$
|
125,000
|
|
1.92
|
%
|
$
|
125,031
|
|
$
|
120,983
|
|
1.80
|
%
|
||||
|
Security repurchase agreements
|
20,330
|
|
2.71
|
|
30,751
|
|
29,049
|
|
2.08
|
|
|||||||
|
Subordinated notes
|
$
|
94,574
|
|
5.33
|
%
|
$
|
94,574
|
|
$
|
94,451
|
|
5.34
|
%
|
||||
|
2017
|
|||||||||||||||||
|
Short-term borrowings:
|
|||||||||||||||||
|
FHLB borrowings
|
$
|
30,225
|
|
1.54
|
%
|
$
|
124,500
|
|
$
|
50,063
|
|
1.10
|
%
|
||||
|
Federal funds purchased
|
55,000
|
|
1.56
|
|
95,000
|
|
32,282
|
|
1.05
|
|
|||||||
|
Customer repurchase agreements
|
20,206
|
|
0.05
|
|
26,376
|
|
23,207
|
|
0.05
|
|
|||||||
|
Long-term debt:
|
|||||||||||||||||
|
FHLB advances
|
$
|
125,036
|
|
1.73
|
%
|
$
|
190,689
|
|
$
|
155,073
|
|
1.43
|
%
|
||||
|
Security repurchase agreements
|
30,792
|
|
1.52
|
|
31,234
|
|
31,036
|
|
1.30
|
|
|||||||
|
Subordinated notes
|
$
|
94,331
|
|
5.35
|
%
|
$
|
94,331
|
|
$
|
94,208
|
|
5.35
|
%
|
||||
The Corporation, through the Bank, has a credit facility with the FHLB with a maximum borrowing capacity of approximately
$1.6 billion
. Advances from the FHLB are secured by qualifying commercial real estate and residential mortgage loans, investments and other assets. At
December 31, 2018
and
2017
, the Bank had outstanding short-term letters of credit with the FHLB totaling
$347.5 million
and
$234.2 million
, respectively, which were utilized to collateralize public funds deposits. The maximum borrowing capacity with the FHLB changes as a function of the Bank’s qualifying collateral assets as well as the FHLB’s internal credit rating of the Bank.
The Corporation, through the Bank, maintains uncommitted federal fund credit lines with several correspondent banks totaling
$367.0 million
at
December 31, 2018
and
2017
. Future availability under these lines is subject to the prerogatives of the granting banks and may be withdrawn at will.
The Corporation, through the Bank, holds collateral at the Federal Reserve Bank of Philadelphia in order to access the Discount Window Lending program. The collateral consisting of investment securities was valued at
$69.5 million
and
$52.0 million
at
December 31, 2018
and
2017
, respectively. At
December 31, 2018
and
2017
, the Corporation had
no
outstanding borrowings under this program.
The Corporation has a
$10.0 million
line of credit with a correspondent bank. At
December 31, 2018
and
2017
, the Corporation had
no
outstanding borrowings under this line.
|
82
|
Long-term advances with the FHLB of Pittsburgh mature as follows:
|
(Dollars in thousands)
|
As of December 31, 2018
|
Weighted Average Rate
|
||||
|
2019
|
$
|
10,000
|
|
1.35
|
%
|
|
|
2020
|
40,000
|
|
1.70
|
|
||
|
2021
|
55,000
|
|
1.94
|
|
||
|
2022
|
10,000
|
|
2.09
|
|
||
|
2023
|
10,000
|
|
3.02
|
|
||
|
Thereafter
|
—
|
|
—
|
|
||
|
Total
|
$
|
125,000
|
|
1.92
|
%
|
|
Long-term debt under security repurchase agreements with large commercial banks mature as follows:
|
(Dollars in thousands)
|
As of December 31, 2018
|
Weighted Average Rate
|
||||
|
2019
|
$
|
10,114
|
|
2.72
|
%
|
|
|
2020
|
10,216
|
|
2.71
|
|
||
|
2021
|
—
|
|
—
|
|
||
|
2022
|
—
|
|
—
|
|
||
|
2023
|
—
|
|
—
|
|
||
|
Thereafter
|
—
|
|
—
|
|
||
|
Total
|
$
|
20,330
|
|
2.71
|
%
|
|
Long-term debt under security repurchase agreements totaling
$20.3 million
are variable based on the one-month LIBOR rate plus a spread.
Subordinated Debt
On July 1, 2016, the Corporation issued
$45.0 million
in aggregate principal amount of fixed-to-floating rate subordinated notes due 2026 (2016 Notes) in a private placement transaction to institutional accredited investors. The net proceeds of the offering approximated
$44.5 million
. The 2016 Notes bear interest at an annual fixed rate of
5.00%
from the date of issuance until June 30, 2021, or any early redemption date. From June 30, 2021 to the maturity date of June 30, 2026 (or any early redemption date), the 2016 Notes will bear interest at an annual rate equal to three-month LIBOR rate plus
3.90%
. Beginning with the interest payment date of June 30, 2021, the Corporation has the option on each interest payment date, subject to approval of the Federal Reserve Board, to redeem the 2016 Notes in whole or in part at a redemption price equal to
100%
of the principal amount of the redeemed 2016 Notes, plus accrued and unpaid interest to the date of the redemption. The Corporation may also redeem the 2016 Notes, in whole but not in part, at any time upon the occurrence of certain tax, regulatory capital and Investment Company Act of 1940 Act events, subject in each case to the approval of the Federal Reserve.
On
March 30, 2015
, the Corporation issued
$50.0 million
in aggregate principal amount of fixed-to-floating rate subordinated notes due 2025 (2015 Notes) in a private placement transaction to institutional accredited investors. The net proceeds of the offering
$49.3 million
, The 2015 Notes bear interest at an annual fixed rate of
5.10%
from the date of issuance until March 30, 2020, or any early redemption date. From March 30, 2020 to the maturity date of March 30, 2025 (or any early redemption date), the 2015 Notes will bear interest at an annual rate equal to the three-month LIBOR rate plus
3.544%
. Beginning with the interest payment date of March 30, 2020, the Corporation has the option on each interest payment date, subject to approval of the Federal Reserve Board, to redeem the 2015 Notes in whole or in part at a redemption price equal to
100%
of the principal amount of the redeemed 2015 Notes, plus accrued and unpaid interest to the date of the redemption. The Corporation may also redeem the 2015 Notes, in whole, at any time, or in part from time to time upon the occurrence of certain tax, regulatory capital and Investment Company Act of 1940 Act events, subject in each case to the approval of the Federal Reserve.
The subordinated notes qualify as Tier 2 capital for regulatory capital purposes for the first five years of the notes' terms. The Tier 2 capital benefit is phased out at 20% per year after the fifth year (from years six to ten) and have no benefit in the tenth year.
|
83
|
Note 11. Income Taxes
The provision for federal and state income taxes included in the accompanying consolidated statements of income consists of the following:
|
For the Years Ended December 31,
|
|||||||||||
|
(Dollars in thousands)
|
2018
|
2017
|
2016
|
||||||||
|
Current:
|
|||||||||||
|
Federal
|
$
|
9,770
|
|
$
|
9,273
|
|
$
|
2,400
|
|
||
|
State
|
972
|
|
961
|
|
539
|
|
|||||
|
Deferred:
|
|||||||||||
|
Federal
|
(862
|
)
|
7,350
|
|
909
|
|
|||||
|
State
|
263
|
|
133
|
|
33
|
|
|||||
|
$
|
10,143
|
|
$
|
17,717
|
|
$
|
3,881
|
|
|||
The provision for income taxes differs from the expected statutory provision as follows:
|
For the Years Ended December 31,
|
||||||||
|
|
2018
|
2017
|
2016
|
|||||
|
Expected provision at statutory rate
|
21.0
|
%
|
35.0
|
%
|
35.0
|
%
|
||
|
Difference resulting from:
|
||||||||
|
Tax exempt interest income, net of disallowance
|
(4.0
|
)
|
(6.1
|
)
|
(15.6
|
)
|
||
|
Increase in value of bank owned life insurance assets
|
(1.1
|
)
|
(2.2
|
)
|
(4.2
|
)
|
||
|
Stock-based compensation
|
(0.2
|
)
|
(1.0
|
)
|
(1.7
|
)
|
||
|
Non-deductible merger-related expenses
|
—
|
|
—
|
|
1.2
|
|
||
|
State income taxes, net of federal benefits
|
1.6
|
|
1.2
|
|
(1.5
|
)
|
||
|
Adjustment to deferred tax assets and liabilities for enacted changes in tax laws and rates
|
(0.5
|
)
|
1.7
|
|
—
|
|
||
|
Changes in valuation allowance
|
0.1
|
|
0.5
|
|
3.1
|
|
||
|
Other
|
(0.2
|
)
|
(0.4
|
)
|
0.3
|
|
||
|
Effective tax rate
|
16.7
|
%
|
28.7
|
%
|
16.6
|
%
|
||
On December 22, 2017, H.R.1, commonly known as the Tax Cuts and Jobs Act (TCJA), was signed into law. The TCJA includes many provisions that affected the Corporation's income tax expense, including reducing the Corporation's federal tax rate from 35% to 21% effective January 1, 2018. As a result of the rate reduction, the Corporation was required to re-measure, the deferred tax assets and liabilities using the enacted rate at which they were expected to be recovered or settled. The re-measurement of the Corporation's net deferred tax asset resulted in additional 2017 income tax expense of
$1.1 million
.
Also, on December 22, 2017, the U.S. Securities and Exchange Commission (SEC) released Staff Accounting Bulletin No. 118 (SAB 118) to address any uncertainty or diversity of views in practice in accounting for the income tax effects of the TCJA in situations where a registrant did not have the necessary information available, prepared, or analyzed in reasonable detail to complete this accounting in the reporting period that includes the enactment date. SAB 118 allowed for a measurement period not to extend beyond one year from the TCJA's enactment date to complete the necessary accounting.
The Corporation recorded provisional amounts of deferred income taxes using reasonable estimates in four areas where information necessary to complete the accounting was not available, prepared, or analyzed: 1) the Corporation's deferred tax liability for temporary differences between the tax and financial reporting basis of fixed assets is principally due to the accelerated depreciation under the TCJA which allows for full expensing of qualified property purchased and placed in service after September 27, 2017; 2) the Corporation's deferred tax asset for temporary differences associated with accrued compensation was awaiting final determinations of amounts that will be paid and deducted on the 2017 income tax returns; 3) the Corporation's deferred tax liability for temporary differences associated with equity investments in partnerships was awaiting receipt of Schedules K-1 from outside preparers, which was necessary to determine the 2017 tax impact from these investments; and 4) the Corporation's deferred tax liability for temporary differences related to its qualified pension plan is based upon actuarial reports from the Corporation's third party provider. However, the Corporation was still in the process of determining if a contribution related to the 2017 plan year was going to be made.
The Corporation did not make any adjustments to deferred tax assets, representing future deductions for accrued compensation that may be subject to new limitations under Internal Revenue Code Section 162(m) which, generally, limits the annual deduction for certain compensation paid to certain employees to $1.0 million. There was uncertainty in applying the newly-enacted rules to existing contracts, and the Corporation was seeking further clarifications before completing its analysis.
|
84
|
The Corporation completed the calculations of the provisional items above with the completion of the 2017 tax returns. The impact of the completed calculations to the re-measurement of the Corporation's net deferred tax asset resulted in an income tax benefit of
$300 thousand
which the Corporation recorded in 2018.
Retained earnings include
$6.0 million
at December 31,
2018
,
2017
and
2016
, which was originally generated by Fox Chase Bank (acquired in 2016), for which no provision for federal income tax has been made. This amount represents deductions for bad debt reserves for tax purposes, which were only allowed to savings institutions that met certain criteria prescribed by the Internal Revenue Code of 1986, as amended. The Small Business Job Protection Act of 1996 eliminated the special bad debt deduction granted solely to thrifts. Under the terms of the Small Business Job Protection Act, there would be no recapture of the pre-1988 (base year) reserves. However, these pre-1988 reserves would be subject to recapture under the rules of the Internal Revenue Code if the Corporation pays a cash dividend in excess of cumulative retained earnings or liquidates.
At December 31,
2018
and
2017
, the Corporation had
no
unrecognized tax benefits or accrued interest and penalties recorded. The Corporation does not expect the total amount of unrecognized tax benefits to significantly increase within the next twelve months. Interest and penalties are recorded in noninterest expense in the year they are assessed. For tax purposes, interest is treated as a deductible expense and penalties are treated as a non-deductible expense.
The Corporation and its subsidiaries are subject to U.S. federal income tax, as well as income tax of the state of Pennsylvania and various other state and local jurisdictions. The Corporation and its subsidiaries are generally no longer subject to examination by federal, state and local taxing authorities for years prior to December 31,
2015
.
Deferred income taxes reflect the tax effects of temporary differences between the carrying amounts of assets and liabilities for financial reporting purposes and the amounts used for income tax purposes. Deferred state taxes are combined with federal deferred taxes (net of the impact of deferred state tax on the deferred federal tax) and are shown in the table below by major category.
The Corporation has a state net operating loss carry-forward of
$59.8 million
which will begin to expire after
2019
if not utilized. A valuation allowance at
December 31, 2018
and
2017
was attributable to deferred tax assets generated in certain state jurisdictions for which management believes it is more likely than not that such deferred tax assets will not be realized. Other than the valuation allowance on certain state deferred tax assets, management has determined that no additional valuation allowance is necessary for deferred tax assets because it is more likely than not that these assets will be realized through future reversals of existing temporary differences and through future taxable income. The Corporation will continue to review the criteria related to the recognition of deferred tax assets on a regular basis.
The assets and liabilities giving rise to the Corporation’s deferred tax assets and liabilities are as follows:
|
At December 31,
|
|||||||
|
(Dollars in thousands)
|
2018
|
2017
|
|||||
|
Deferred tax assets:
|
|||||||
|
Allowance for loan and lease losses
|
$
|
6,410
|
|
$
|
4,643
|
|
|
|
Deferred compensation
|
1,734
|
|
2,110
|
|
|||
|
Actuarial adjustments on retirement benefits*
|
4,592
|
|
4,432
|
|
|||
|
State net operating losses
|
4,730
|
|
4,166
|
|
|||
|
Other-than-temporary impairments on equity securities
|
148
|
|
148
|
|
|||
|
Net unrealized holding losses on securities available-for-sale and swaps*
|
2,968
|
|
1,316
|
|
|||
|
Other deferred tax assets
|
1,368
|
|
1,243
|
|
|||
|
Gross deferred tax assets
|
21,950
|
|
18,058
|
|
|||
|
Valuation allowance
|
(3,830
|
)
|
(3,523
|
)
|
|||
|
Total deferred tax assets, net of valuation allowance
|
18,120
|
|
14,535
|
|
|||
|
Deferred tax liabilities:
|
|||||||
|
Mortgage servicing rights
|
1,463
|
|
1,415
|
|
|||
|
Retirement plans
|
5,263
|
|
4,304
|
|
|||
|
Deferred loan fees and costs
|
1,163
|
|
2,614
|
|
|||
|
Acquisition-related fair value adjustments
|
1,605
|
|
1,621
|
|
|||
|
Intangible assets
|
1,987
|
|
1,513
|
|
|||
|
Accounting method change adjustment
|
1,154
|
|
—
|
|
|||
|
Depreciation
|
937
|
|
1,102
|
|
|||
|
Other deferred tax liabilities
|
963
|
|
792
|
|
|||
|
Total deferred tax liabilities
|
14,535
|
|
13,361
|
|
|||
|
Net deferred tax assets
|
$
|
3,585
|
|
$
|
1,174
|
|
|
*
Represents the amount of deferred taxes recorded in accumulated other comprehensive income.
|
85
|
Note 12. Retirement Plans and Other Postretirement Benefits
Substantially all employees who were hired before
December 8, 2009
are covered by a noncontributory retirement plan. Employees hired on or after
December 8, 2009
are not eligible to participate in the noncontributory retirement plan. The Corporation also provides supplemental executive retirement benefits to certain former executives, a portion of which is in excess of limits imposed on qualified plans by federal tax law. These plans are non-qualified benefit plans. These non-qualified benefit plans are not offered to new participants and all current participants are now retired. Information on these plans are aggregated and reported under “Retirement Plans” within this footnote.
The Corporation also provides certain postretirement healthcare and life insurance benefits for retired employees. Information on these benefits is reported under “Other Postretirement Benefits” within this footnote.
The Corporation sponsors a 401(k) deferred salary savings plan, which is a qualified defined contribution plan, and which covers all employees of the Corporation and its subsidiaries, and provides that the Corporation makes matching contributions as defined by the plan. Expense recorded by the Corporation for the 401(k) deferred salary savings plan for the years ended
December 31, 2018
,
2017
and
2016
was
$1.4 million
,
$1.4 million
, and
$1.2 million
, respectively.
The Corporation sponsors a Supplemental Non-Qualified Pension Plan (SNQPP), which was established in 1981 prior to the existence of the 401(k) deferred salary savings plan, employee stock purchase plan and long-term incentive plans and therefore is not offered to new participants. All current participants are now retired. Expense recorded by the Corporation for the SNQPP for the years ended December 31,
2018
,
2017
and
2016
was
$215 thousand
,
$222 thousand
and
$52 thousand
, respectively.
Information with respect to the Retirement Plans and Other Postretirement Benefits follows:
|
Retirement Plans
|
Other Postretirement Benefits
|
||||||||||||||
|
(Dollars in thousands)
|
2018
|
2017
|
2018
|
2017
|
|||||||||||
|
Change in benefit obligation:
|
|||||||||||||||
|
Benefit obligation at beginning of year
|
$
|
50,364
|
|
$
|
47,389
|
|
$
|
2,611
|
|
$
|
2,968
|
|
|||
|
Service cost
|
560
|
|
524
|
|
88
|
|
48
|
|
|||||||
|
Interest cost
|
1,760
|
|
1,927
|
|
92
|
|
118
|
|
|||||||
|
Actuarial (gain) loss
|
(3,205
|
)
|
3,169
|
|
(404
|
)
|
(409
|
)
|
|||||||
|
Benefits paid
|
(2,611
|
)
|
(2,645
|
)
|
(104
|
)
|
(114
|
)
|
|||||||
|
Benefit obligation at end of year
|
$
|
46,868
|
|
$
|
50,364
|
|
$
|
2,283
|
|
$
|
2,611
|
|
|||
|
Change in plan assets:
|
|||||||||||||||
|
Fair value of plan assets at beginning of year
|
$
|
46,753
|
|
$
|
41,418
|
|
$
|
—
|
|
$
|
—
|
|
|||
|
Actual (loss) return on plan assets
|
(1,923
|
)
|
5,799
|
|
—
|
|
—
|
|
|||||||
|
Benefits paid
|
(2,611
|
)
|
(2,645
|
)
|
(104
|
)
|
(114
|
)
|
|||||||
|
Employer contribution and non-qualified benefit payments
|
3,160
|
|
2,181
|
|
104
|
|
114
|
|
|||||||
|
Fair value of plan assets at end of year
|
$
|
45,379
|
|
$
|
46,753
|
|
$
|
—
|
|
$
|
—
|
|
|||
|
Funded status
|
(1,489
|
)
|
(3,611
|
)
|
(2,283
|
)
|
(2,611
|
)
|
|||||||
|
Unrecognized net actuarial loss (gain)
|
22,141
|
|
21,256
|
|
(92
|
)
|
316
|
|
|||||||
|
Unrecognized prior service costs
|
(181
|
)
|
(464
|
)
|
—
|
|
—
|
|
|||||||
|
Net amount recognized
|
$
|
20,471
|
|
$
|
17,181
|
|
$
|
(2,375
|
)
|
$
|
(2,295
|
)
|
|||
The fair value of pension plan assets exceeded the accumulated benefit obligation at December 31, 2018 and 2017.
|
86
|
Components of net periodic benefit cost were as follows:
|
Retirement Plans
|
Other Post Retirement
Benefits |
||||||||||||||||||||||
|
(Dollars in thousands)
|
2018
|
2017
|
2016
|
2018
|
2017
|
2016
|
|||||||||||||||||
|
Service cost
|
$
|
560
|
|
$
|
524
|
|
$
|
661
|
|
$
|
88
|
|
$
|
48
|
|
$
|
46
|
|
|||||
|
Interest cost
|
1,760
|
|
1,927
|
|
2,071
|
|
92
|
|
118
|
|
133
|
|
|||||||||||
|
Expected (loss) return on plan assets
|
(3,287
|
)
|
(3,074
|
)
|
(3,041
|
)
|
—
|
|
—
|
|
—
|
|
|||||||||||
|
Amortization of net actuarial loss
|
1,120
|
|
1,185
|
|
1,296
|
|
4
|
|
42
|
|
25
|
|
|||||||||||
|
Accretion of prior service cost
|
(283
|
)
|
(282
|
)
|
(283
|
)
|
—
|
|
—
|
|
—
|
|
|||||||||||
|
Settlement cost
|
—
|
|
—
|
|
1,434
|
|
—
|
|
—
|
|
—
|
|
|||||||||||
|
Net periodic benefit (income) cost
|
$
|
(130
|
)
|
$
|
280
|
|
$
|
2,138
|
|
$
|
184
|
|
$
|
208
|
|
$
|
204
|
|
|||||
The components of net periodic benefit cost other than the service cost component are included in other noninterest expense in the consolidated statements of income.
In the fourth quarter of 2016, the Corporation offered to vested participants in the pension plan, who were no longer employees, the option of a one-time lump-sum payment in lieu of any future benefits that would have been payable from the plan. As a result, lump-sum payments from the plan were
$3.2 million
and exceeded the service cost and interest cost for the year triggering a settlement. The settlement was measured as of December 31, 2016 because the majority of lump sum payments occurred during December 2016. The settlement cost was
$1.4 million
. The amount represents a reclassification of accumulated other comprehensive income to pension expense (included in other noninterest expense in the statement of income) and had no impact on shareholders' equity.
|
(Dollars in thousands)
|
Retirement Plans
|
Other Postretirement Benefits
|
|||||
|
Expected amortization expense for
2019
:
|
|||||||
|
Amortization of net actuarial loss
|
$
|
1,175
|
|
$
|
—
|
|
|
|
Accretion of prior service cost
|
(181
|
)
|
—
|
|
|||
During
2019
, the Corporation expects to contribute approximately
$157 thousand
to the Retirement Plans and approximately
$89 thousand
to Other Postretirement Benefits.
The following benefits payments, which reflect expected future service, as appropriate, are expected to be paid:
|
(Dollars in thousands)
|
Retirement Plans
|
Other Postretirement Benefits
|
||||||
|
For the fiscal year ending:
|
||||||||
|
2019
|
$
|
2,836
|
|
$
|
89
|
|
||
|
2020
|
2,839
|
|
90
|
|
||||
|
2021
|
2,892
|
|
92
|
|
||||
|
2022
|
2,898
|
|
94
|
|
||||
|
2023
|
2,964
|
|
97
|
|
||||
|
Years 2024-2028
|
14,946
|
|
540
|
|
||||
Weighted-average assumptions used to determine benefit obligations at
December 31, 2018
and
2017
were as follows:
|
Retirement Plans
|
Other Postretirement Benefits
|
||||||||||
|
2018
|
2017
|
2018
|
2017
|
||||||||
|
Assumed discount rate
|
4.2
|
%
|
3.6
|
%
|
4.2
|
%
|
3.6
|
%
|
|||
|
Assumed salary increase rate
|
3.0
|
|
3.0
|
|
—
|
|
—
|
|
|||
The benefit obligation for all plans at
December 31, 2018
was based on the RP-2014 mortality table using the projection scale MP-2018 published by the Society of Actuaries.
|
87
|
Weighted-average assumptions used to determine net periodic costs for the years ended
December 31, 2018
and
2017
were as follows. The discount rate was determined utilizing the FTSE Pension Discount Curve. Historical investment returns is the basis used to determine the overall expected long-term rate of return on assets.
|
Retirement Plans
|
Other Postretirement Benefits
|
||||||||||
|
2018
|
2017
|
2018
|
2017
|
||||||||
|
Assumed discount rate
|
3.6
|
%
|
4.0
|
%
|
3.6
|
%
|
4.0
|
%
|
|||
|
Assumed long-term rate of investment return
|
7.0
|
|
7.5
|
|
—
|
|
—
|
|
|||
|
Assumed salary increase rate
|
3.0
|
|
3.0
|
|
—
|
|
—
|
|
|||
The Corporation's pension plan asset allocation at
December 31, 2018
and
2017
, by asset category was as follows:
|
Percentage of Plan Assets at December 31,
|
|||||
|
2018
|
2017
|
||||
|
Asset Category:
|
|||||
|
Equity securities
|
60
|
%
|
64
|
%
|
|
|
Debt securities
|
39
|
|
35
|
|
|
|
Other
|
1
|
|
1
|
|
|
|
Total
|
100
|
%
|
100
|
%
|
|
Plan assets include marketable equity securities, corporate and government debt securities, and certificates of deposit. The investment strategy is to keep a
60%
equity to
40%
fixed income mix to achieve the overall expected long-term rate of return of
7.0%
. Equity securities do not include any common stock of the Corporation.
The major categories of assets in the Corporation’s pension plan at year-end are presented in the following table. Assets are segregated by the level of the valuation inputs within the fair value hierarchy described in Note 17, “Fair Value Disclosures.”
|
Fair Value Measurements at December 31,
|
|||||||
|
(Dollars in thousands)
|
2018
|
2017
|
|||||
|
Level 1:
|
|||||||
|
Mutual funds
|
$
|
28,360
|
|
$
|
31,144
|
|
|
|
Short-term investments
|
666
|
|
515
|
|
|||
|
Level 2:
|
|||||||
|
U.S. government obligations
|
6,167
|
|
4,910
|
|
|||
|
Corporate bonds
|
6,031
|
|
5,974
|
|
|||
|
Level 3:
|
|||||||
|
Certificates of deposit
|
4,155
|
|
4,210
|
|
|||
|
Total fair value of plan assets
|
$
|
45,379
|
|
$
|
46,753
|
|
|
The following table provides a reconciliation of the beginning and ending balances for measurements in hierarchy Level 3 at
December 31, 2018
and
2017
:
|
(Dollars in thousands)
|
Balance at December 31, 2017
|
Total Unrealized (Losses) or Gains
|
Total Realized Gains or (Losses)
|
Purchases
|
Maturities/ Redemptions
|
Balance at December 31, 2018
|
|||||||||||||||||
|
Certificates of deposit
|
$
|
4,210
|
|
$
|
—
|
|
$
|
—
|
|
$
|
845
|
|
$
|
(900
|
)
|
$
|
4,155
|
|
|||||
|
Total Level 3 assets
|
$
|
4,210
|
|
$
|
—
|
|
$
|
—
|
|
$
|
845
|
|
$
|
(900
|
)
|
$
|
4,155
|
|
|||||
|
(Dollars in thousands)
|
Balance at December 31, 2016
|
Total Unrealized (Losses) or Gains
|
Total Realized Gains or (Losses)
|
Purchases
|
Maturities/ Redemptions
|
Balance at December 31, 2017
|
|||||||||||||||||
|
Certificates of deposit
|
$
|
4,565
|
|
$
|
—
|
|
$
|
—
|
|
$
|
535
|
|
$
|
(890
|
)
|
$
|
4,210
|
|
|||||
|
Total Level 3 assets
|
$
|
4,565
|
|
$
|
—
|
|
$
|
—
|
|
$
|
535
|
|
$
|
(890
|
)
|
$
|
4,210
|
|
|||||
|
88
|
Note 13. Stock-Based Incentive Plan
The Corporation has a shareholder approved 2013 Long-Term Incentive Plan, which replaced the expired 2003 Long-Term Incentive Plan. Under the 2013 Long-Term Incentive Plan, the Corporation may grant up to
3,698,974
options and restricted stock to employees and non-employee directors, which includes
330,625
shares as a result of the Corporation's common stock issuance in 2017,
857,191
shares as a result of the completion of the acquisition of Fox Chase in 2016 and
473,483
shares as a result of the completion of the acquisition of Valley Green Bank in 2015. The number of shares of common stock available for issuance under the plan is subject to adjustment, as described in the plan. This includes, in the event of any merger, reorganization, consolidation, recapitalization, stock dividend, or other change in corporate structure affecting the stock, substitution or adjustment shall be made in the aggregate number of shares reserved for issuance under the plan, in the number and option price of shares subject to outstanding options granted under the plan and in the number and price of shares subject to other awards, as described in the plan. The plan provides for the issuance of options to purchase common shares at prices not less than
100 percent
of the fair market value on the date of option grant and have a contractual term of
ten years
; and for restricted stock awards valued at not less than
100 percent
of the fair market value at the date of award grant. The options issued in 2018 become exercisable and vest at
33.3 percent
per year for each of the following
three years
and remain exercisable for a period not exceeding
ten years
from the date of grant. For the majority of the restricted stock awards, the shares vest based upon the Corporation’s performance with respect to certain financial measures over a
three
-year period. There were
2,631,983
share awards available for future grants at
December 31, 2018
under the plan. At
December 31, 2018
, there were
597,405
options to purchase common stock and
157,579
unvested restricted stock awards outstanding under the plan.
In December 2018, the Corporation's Board of Directors approved an Amended and Restated Univest 2013 Long-Term Incentive Plan to allow for the issuance of restricted stock units.
The following is a summary of the Corporation’s stock option activity and related information for the year ended
December 31, 2018
:
|
(Dollars in thousands, except per share data)
|
Shares Under Option
|
Weighted Average Exercise Price Per Share
|
Weighted Average Remaining Contractual Life (Years)
|
Aggregate Intrinsic Value at December 31,
2018
|
||||||||
|
Outstanding at December 31,
2017
|
512,735
|
|
$
|
21.90
|
|
|||||||
|
Granted
|
190,778
|
|
28.50
|
|
||||||||
|
Expired
|
(6,356
|
)
|
24.61
|
|
||||||||
|
Forfeited
|
(40,002
|
)
|
26.29
|
|
||||||||
|
Exercised
|
(59,750
|
)
|
18.92
|
|
||||||||
|
Outstanding at December 31,
2018
|
597,405
|
|
23.98
|
|
7.2
|
$
|
820
|
|
||||
|
Exercisable at December 31,
2018
|
253,175
|
|
20.36
|
|
5.5
|
670
|
|
|||||
The following is a summary of nonvested stock options at December 31,
2018
including changes during the year:
|
(Dollars in thousands, except per share data)
|
Nonvested Stock Options
|
Weighted Average Grant Date Fair Value
|
||||
|
Nonvested stock options at December 31,
2017
|
352,142
|
|
$
|
6.47
|
|
|
|
Granted
|
190,778
|
|
6.46
|
|
||
|
Vested
|
(158,688
|
)
|
6.43
|
|
||
|
Forfeited
|
(40,002
|
)
|
6.49
|
|
||
|
Nonvested stock options at December 31,
2018
|
344,230
|
|
6.48
|
|
||
The Corporation's estimate of the fair value of a stock option is based on expectations derived from historical experience and may not necessarily equate to its market value when fully vested. The life of the option is based on historical factors which include the contractual term, vesting period, exercise behavior and employee turnover. The risk-free rate for periods within the expected term of the option is based on the U.S. Treasury strip rate in effect at the time of grant. Expected volatility is based on the historical volatility of the Corporation’s stock over the expected life of the grant. The Corporation uses a straight-line accrual method to recognize stock-based compensation expense over the time-period it expects the options to vest.
|
89
|
The Corporation recognizes compensation expense for stock options over the requisite service period based on the grant-date fair value of the awards. The Corporation records forfeitures as they occur. The following aggregated assumptions were used to estimate the fair value of options granted for the periods indicated:
|
For the Years Ended December 31,
|
||||||||||||
|
2018
|
2017
|
2016
|
||||||||||
|
Actual
|
Actual
|
Range
|
Weighted Average
|
|||||||||
|
Expected option life in years
|
6.6
|
|
6.9
|
|
7.6
|
-
|
8.2
|
7.9
|
|
|||
|
Risk free interest rate
|
2.80
|
%
|
2.30
|
%
|
1.38%
|
-
|
1.89%
|
1.87
|
%
|
|||
|
Expected dividend yield
|
2.81
|
%
|
2.84
|
%
|
3.80%
|
-
|
4.19%
|
4.06
|
%
|
|||
|
Expected volatility
|
27.15
|
%
|
29.75
|
%
|
37.71%
|
-
|
46.22%
|
45.82
|
%
|
|||
|
Fair value of options
|
$6.46
|
$6.72
|
$5.40
|
-
|
$6.27
|
$6.23
|
||||||
The following is a summary of nonvested restricted stock awards at
December 31, 2018
including changes during the year:
|
(Dollars in thousands, except per share data)
|
Nonvested Share Awards
|
Weighted Average Grant Date Fair Value
|
||||
|
Nonvested share awards at December 31,
2017
|
229,026
|
|
$
|
21.93
|
|
|
|
Granted
|
59,953
|
|
28.39
|
|
||
|
Vested
|
(97,201
|
)
|
20.13
|
|
||
|
Forfeited
|
(34,199
|
)
|
22.73
|
|
||
|
Nonvested share awards at December 31,
2018
|
157,579
|
|
25.33
|
|
||
The fair value of restricted stock is equivalent to the fair value on the date of grant and is amortized over the vesting period. Certain information regarding restricted stock is summarized below for the periods indicated:
|
(Dollars in thousands, except per share data)
|
For the Years Ended December 31,
|
||||||||||
|
2018
|
2017
|
2016
|
|||||||||
|
Shares granted
|
59,953
|
|
61,823
|
|
176,255
|
|
|||||
|
Weighted average grant date fair value
|
$
|
28.39
|
|
$
|
28.08
|
|
$
|
20.60
|
|
||
|
Intrinsic value of awards vested
|
$
|
2,709
|
|
$
|
2,954
|
|
$
|
1,000
|
|
||
The total unrecognized compensation expense and the weighted average period over which unrecognized compensation expense is expected to be recognized related to nonvested stock options and nonvested restricted stock awards at
December 31, 2018
is presented below:
|
(Dollars in thousands)
|
Unrecognized Compensation Cost
|
Weighted-Average Period Remaining (Years)
|
|||
|
Stock options
|
$
|
1,222
|
|
1.8
|
|
|
Restricted stock awards
|
1,601
|
|
1.7
|
||
|
$
|
2,823
|
|
1.7
|
||
The following table presents information related to the Corporation’s compensation expense related to stock incentive plans recognized for the periods indicated:
|
For the Years Ended December 31,
|
|||||||||||
|
(Dollars in thousands)
|
2018
|
2017
|
2016
|
||||||||
|
Stock-based compensation expense:
|
|||||||||||
|
Stock options
|
$
|
1,020
|
|
$
|
910
|
|
$
|
577
|
|
||
|
Restricted stock awards
|
1,537
|
|
2,256
|
|
1,507
|
|
|||||
|
Employee stock purchase plan
|
68
|
|
64
|
|
67
|
|
|||||
|
Total
|
$
|
2,625
|
|
$
|
3,230
|
|
$
|
2,151
|
|
||
|
Tax benefit on nonqualified stock option expense, restricted stock awards and disqualifying dispositions of incentive stock options
|
$
|
620
|
|
$
|
1,432
|
|
$
|
1,135
|
|
||
|
90
|
There were
no
significant modifications or accelerations to options or restricted stock awards during the period
2016
through
2018
. The Corporation typically issues shares for stock option exercises and grants of restricted stock awards from its treasury stock.
Note 14. Accumulated Other Comprehensive Loss
The following table shows the components of accumulated other comprehensive loss, net of tax benefit, for the periods presented:
|
(Dollars in thousands)
|
Net Unrealized
(Losses) Gains on Available-for-Sale Investment Securities |
Net Change
Related to Derivatives Used for Cash Flow Hedges |
Net Change
Related to Defined Benefit Pension Plans |
Accumulated
Other Comprehensive (Loss) Income |
|||||||||||
|
Balance, December 31, 2015
|
$
|
(592
|
)
|
$
|
(285
|
)
|
$
|
(15,831
|
)
|
$
|
(16,708
|
)
|
|||
|
Net Change
|
(4,396
|
)
|
144
|
|
1,506
|
|
(2,746
|
)
|
|||||||
|
Balance, December 31, 2016
|
(4,988
|
)
|
(141
|
)
|
(14,325
|
)
|
(19,454
|
)
|
|||||||
|
Net Change
|
927
|
|
150
|
|
606
|
|
1,683
|
|
|||||||
|
Balance, December 31, 2017
|
(4,061
|
)
|
9
|
|
(13,719
|
)
|
(17,771
|
)
|
|||||||
|
Adjustment to initially apply ASU No. 2016-01 for equity securities measured at fair value (1)
|
(433
|
)
|
—
|
|
—
|
|
(433
|
)
|
|||||||
|
Adjustment to initially apply ASU No. 2018-02 for reclassification of stranded net tax charges (1)
|
(968
|
)
|
2
|
|
(2,955
|
)
|
(3,921
|
)
|
|||||||
|
Other comprehensive (loss) income
|
(5,759
|
)
|
70
|
|
(602
|
)
|
(6,291
|
)
|
|||||||
|
Balance, December 31, 2018
|
$
|
(11,221
|
)
|
$
|
81
|
|
$
|
(17,276
|
)
|
$
|
(28,416
|
)
|
|||
(1) See Note 1, "Summary of Significant Accounting Policies - Accounting Pronouncements Adopted in 2018" for additional information.
Note 15. Commitments and Contingencies
Lending Operations
The Corporation is a party to financial instruments with off-balance sheet risk in the normal course of business to meet the financing needs of customers. The Bank offers commercial, mortgage, and consumer credit products to customers in the normal course of business, which are detailed in Note 5. These products result in a diversified credit portfolio and are generally issued to borrowers within the Bank’s market area. Financial instruments with off-balance sheet risk include commitments to extend credit. These instruments involve, to varying degrees, elements of credit risk in excess of the amount recognized on the consolidated balance sheets.
The Corporation's exposure to credit loss in the event of nonperformance by the other party to the financial instrument for commitments to extend credit is represented by the contractual amount of those instruments. The Corporation uses the same credit policies in making commitments and conditional obligations as it does for on-balance sheet instruments. Commitments to extend credit are agreements to lend to a customer as long as there is no violation of any condition established in the contract. Since many of the commitments are expected to expire without being drawn upon, the total commitment amounts do not necessarily represent future cash requirements. Commitments generally have fixed expiration dates or other termination clauses and may require payment of a fee. Collateral is obtained based on management’s credit assessment of the customer.
Standby letters of credit and performance letters of credit commit the Bank to make payments on behalf of customers when certain specified future events occur. They are primarily issued to support commercial paper, medium and long-term notes and debentures, including industrial revenue obligations. The approximate term is usually
one year
but some can be up to
five years
. Historically, substantially all standby letters of credit expire unfunded. If funded, the majority of the letters of credit carry current market interest rates if converted to loans. Because letters of credit are generally un-assignable by either the Bank or the borrower, they only have value to the Bank and the borrower. The carrying amount is recorded as unamortized deferred fees and the exposure is considered in the reserve for credit risk. At
December 31, 2018
, the maximum potential amount of future payments under letters of credit is
$61.2 million
. The current carrying amount of the contingent obligation is
$289 thousand
. This arrangement has credit risk essentially the same as that involved in extending loans to customers and is subject to the Bank’s normal credit policies. Collateral is obtained based on management’s credit assessment of the customer.
|
91
|
The following schedule summarizes the Corporation’s off-balance sheet financial instruments at
December 31, 2018
:
|
(Dollars in thousands)
|
Contract/Notional Amount
|
||
|
Financial instruments representing credit risk:
|
|||
|
Commitments to extend credit
|
$
|
1,276,745
|
|
|
Performance letters of credit
|
31,039
|
|
|
|
Financial standby letters of credit
|
29,743
|
|
|
|
Other letters of credit
|
410
|
|
|
The Bank maintains a reserve in other liabilities for estimated losses associated with sold mortgages that may be repurchased. At
December 31, 2018
, the reserve for sold mortgages was
$299 thousand
.
Legal Proceedings
The Corporation is periodically subject to various pending and threatened legal actions, which involve claims for monetary relief. Based upon information presently available to the Corporation, it is the Corporation's opinion that any legal and financial responsibility arising from such claims will not have a material adverse effect on the Corporation's results of operations, financial position or cash flows.
Operating Leases
At
December 31, 2018
, the Corporation and its subsidiaries were obligated under non-cancelable leases for various premises. A summary of the future minimum rental commitments under non-cancelable operating leases with original or remaining terms greater than one year is as follows:
|
(Dollars in thousands)
|
|||
|
Year
|
Amount
|
||
|
2019
|
$
|
3,536
|
|
|
2020
|
3,632
|
|
|
|
2021
|
3,688
|
|
|
|
2022
|
3,660
|
|
|
|
2023
|
3,610
|
|
|
|
Thereafter
|
37,389
|
|
|
|
Total
|
$
|
55,515
|
|
Service Contracts
At
December 31, 2018
, the Corporation had contracts with third-party providers to manage the Corporation's network operations, data processing and other related services. The projected amount of the Corporation's future minimum payments due for contracts with original or remaining terms greater than one year is as follows:
|
(Dollars in thousands)
|
|||
|
Year
|
Amount
|
||
|
2019
|
$
|
5,421
|
|
|
2020
|
4,288
|
|
|
|
2021
|
3,478
|
|
|
|
2022
|
1,250
|
|
|
|
2023
|
406
|
|
|
|
Thereafter
|
79
|
|
|
|
Total
|
$
|
14,922
|
|
|
92
|
Note 16. Derivative Instruments and Hedging Activities
Interest Rate Swaps
The Corporation may use interest rate swap agreements to modify interest rate characteristics from variable to fixed or fixed to variable in order to reduce the impact of interest rate changes on future net interest income. Recorded amounts related to interest-rate swaps are included in other assets or liabilities. The Corporation’s credit exposure on interest rate swaps includes fair value and any collateral that is held by a third party. Changes in the fair value of derivative instruments designated as hedges of future cash flows are recognized in accumulated other comprehensive income until the underlying forecasted transactions occur, at which time the deferred gains and losses are recognized in earnings. For a qualifying fair value hedge, the gain or loss on the hedging instrument is recognized in earnings, and the change in fair value of the hedge item, to the extent attributable to the hedged risk, adjusts the carrying amount of the hedge item and is recognized in earnings.
In 2014, the Corporation entered into an amortizing interest rate swap classified as a cash flow hedge with a notional amount of
$20.0 million
to hedge a portion of the debt financing of a pool of
10
-year fixed rate loans with balances totaling
$29.1 million
, at time of the hedge, that were originated in 2013. A brokered money market demand account with a balance exceeding the amortizing interest rate swap balance is being used for the cash flow hedge. Under the terms of the swap agreement, the Corporation pays a fixed rate of
2.10%
and receives a floating rate of one-month LIBOR. The swap matures in November 2022. The Corporation performed an assessment of the hedge for effectiveness at the inception of the hedge and on a recurring basis to determine that the derivative has been and is expected to continue to be highly effective in offsetting changes in cash flows of the hedged item. The Corporation recorded ineffectiveness in other noninterest income of
$83 thousand
on the interest rate swap in 2018. At
December 31, 2018
, approximately
$62 thousand
in net deferred losses, net of tax, recorded in accumulated other comprehensive loss are expected to be reclassified into earnings during the next twelve months. This amount could differ from amounts actually recognized due to changes in interest rates, hedge de-designations, and the addition of other hedges subsequent to
December 31, 2018
. At
December 31, 2018
, the notional amount of the interest rate swap was
$17.1 million
, with a positive fair value of
$185 thousand
.
The Corporation has an interest rate swap classified as a fair value hedge with a current notional amount of
$1.3 million
to hedge a
10
-year fixed rate loan that is earning interest at
5.83%
. The Corporation pays a fixed rate of
5.83%
and receives a floating rate based on the one-month LIBOR plus 350 basis points. The swap matures in October 2021. The difference between changes in the fair values of the interest rate swap agreement and the hedged loan represents hedge ineffectiveness and is recorded in other noninterest income in the consolidated statements of operations.
The Corporation has an interest rate swap with a current notional amount of
$418 thousand
, for a
15
-year fixed rate loan that is earning interest at
7.43%
. The Corporation pays a fixed rate of
7.43%
and receives a floating rate based on the one-month LIBOR plus 224 basis points. The swap matures in April 2022. The interest rate swap is carried at fair value in accordance with FASB ASC 815 "Derivatives and Hedging." The loan is carried at fair value under the fair value option as permitted by FASB ASC 825 "Financial Instruments."
Credit Derivatives
The Corporation has agreements with third-party financial institutions whereby the third-party financial institution enters into interest rate derivative contracts with loan customers referred to them by the Corporation. By the terms of the agreements, the third-party financial institution has recourse to the Corporation for any exposure created under each swap contract in the event the customer defaults on the swap agreement and the agreement is in a paying position to the third-party financial institution. These transactions represent credit derivatives and are a customary arrangement that allows the Corporation to provide access to interest rate transactions for customers without creating the swap. The Corporation records the fair value of credit derivatives in other liabilities on the consolidated balance sheets. The Corporation recognizes changes in the fair value of credit derivatives, net of any fees received, in other noninterest income in the consolidated statements of income.
At
December 31, 2018
, the Corporation has
nineteen
variable-rate to fixed-rate interest rate swap transactions between the third-party financial institution and customers with a current notional amount of
$122.4 million
and remaining maturities ranging from
one
to
10
years. At
December 31, 2018
, the fair value of the swaps to the customers was a liability of
$72 thousand
and
$59.6 million
of notional amount of the swaps were in paying positions while
$62.8 million
are in a receiving position to the third-party financial institution.
The maximum potential payments by the Corporation to the third-party financial institution under these credit derivatives are not estimable as they are contingent on future interest rates and exchange rates, and the agreement does not provide for a limitation of the maximum potential payment amount.
|
93
|
Mortgage Banking Derivatives
Derivative loan commitments represent agreements for delayed delivery of financial instruments in which the buyer agrees to purchase and the seller agrees to deliver, at a specified future date, a specified instrument at a specified price or yield. The Corporation’s derivative loan commitments are commitments to sell loans secured by 1-to 4-family residential properties whose predominant risk characteristic is interest rate risk. The fair values of these derivative loan commitments are based upon the estimated amount the Corporation would receive or pay to terminate the contracts or agreements, taking into account current interest rates and, when appropriate, the current creditworthiness of the counterparties.
Derivatives Tables
The following table presents the notional amounts and fair values of derivatives designated as hedging instruments recorded on the consolidated balance sheets at
December 31, 2018
and
2017
. The Corporation pledges cash or securities to cover the negative fair value of derivative instruments. Cash collateral associated with derivative instruments are not added to or netted against the fair value amounts.
|
|
|
Derivative Assets
|
Derivative Liabilities
|
||||||||||||
|
(Dollars in thousands)
|
Notional
Amount |
Balance Sheet
Classification |
Fair
Value |
Balance Sheet
Classification |
Fair
Value |
||||||||||
|
At December 31, 2018
|
|||||||||||||||
|
Interest rate swap - cash flow hedge
|
$
|
17,076
|
|
Other assets
|
$
|
185
|
|
|
$
|
—
|
|
||||
|
Interest rate swap - fair value hedge
|
1,346
|
|
Other assets
|
4
|
|
|
—
|
|
|||||||
|
Total
|
$
|
18,422
|
|
$
|
189
|
|
$
|
—
|
|
||||||
|
At December 31, 2017
|
|||||||||||||||
|
Interest rate swap - cash flow hedge
|
$
|
17,836
|
|
Other assets
|
$
|
13
|
|
|
$
|
—
|
|
||||
|
Interest rate swap - fair value hedge
|
1,388
|
|
|
—
|
|
Other liabilities
|
12
|
|
|||||||
|
Total
|
$
|
19,224
|
|
$
|
13
|
|
$
|
12
|
|
||||||
The following table presents the notional amounts and fair values of derivatives not designated as hedging instruments recorded on the consolidated balance sheets at
December 31, 2018
and
2017
:
|
|
|
Derivative Assets
|
Derivative Liabilities
|
||||||||||||
|
(Dollars in thousands)
|
Notional
Amount |
Balance Sheet
Classification |
Fair
Value |
Balance Sheet
Classification |
Fair
Value |
||||||||||
|
At December 31, 2018
|
|||||||||||||||
|
Interest rate swap
|
$
|
418
|
|
|
$
|
—
|
|
Other liabilities
|
$
|
20
|
|
||||
|
Credit derivatives
|
122,410
|
|
|
—
|
|
Other liabilities
|
72
|
|
|||||||
|
Interest rate locks with customers
|
21,494
|
|
Other assets
|
490
|
|
|
—
|
|
|||||||
|
Forward loan sale commitments
|
23,227
|
|
|
—
|
|
Other liabilities
|
150
|
|
|||||||
|
Total
|
$
|
167,549
|
|
$
|
490
|
|
$
|
242
|
|
||||||
|
At December 31, 2017
|
|||||||||||||||
|
Interest rate swap
|
$
|
523
|
|
|
$
|
—
|
|
Other liabilities
|
$
|
38
|
|
||||
|
Credit derivatives
|
75,622
|
|
|
—
|
|
Other liabilities
|
36
|
|
|||||||
|
Interest rate locks with customers
|
27,411
|
|
Other assets
|
527
|
|
|
—
|
|
|||||||
|
Forward loan sale commitments
|
29,037
|
|
Other assets
|
61
|
|
|
—
|
|
|||||||
|
Total
|
$
|
132,593
|
|
$
|
588
|
|
$
|
74
|
|
||||||
|
94
|
The following table presents amounts included in the consolidated statements of income for derivatives designated as hedging instruments for the periods indicated:
|
|
Statement of Income Classification
|
For the Years Ended December 31,
|
|||||||||||
|
(Dollars in thousands)
|
2018
|
2017
|
2016
|
||||||||||
|
Interest rate swap—cash flow hedge—net interest payments
|
Interest expense
|
$
|
15
|
|
$
|
182
|
|
$
|
308
|
|
|||
|
Interest rate swap—cash flow hedge—ineffectiveness
|
Other noninterest income
|
83
|
|
—
|
|
—
|
|
||||||
|
Interest rate swap—fair value hedge—ineffectiveness
|
Other noninterest income
|
3
|
|
7
|
|
9
|
|
||||||
|
Total net gain (loss)
|
$
|
71
|
|
$
|
(175
|
)
|
$
|
(299
|
)
|
||||
The following table presents amounts included in the consolidated statements of income for derivatives not designated as hedging instruments for the periods indicated:
|
|
Statement of Income Classification
|
For the Years Ended December 31,
|
|||||||||||
|
(Dollars in thousands)
|
2018
|
2017
|
2016
|
||||||||||
|
Credit derivatives
|
Other noninterest income
|
$
|
262
|
|
$
|
403
|
|
$
|
93
|
|
|||
|
Interest rate locks with customers
|
Net loss on mortgage banking activities
|
(37
|
)
|
(274
|
)
|
(288
|
)
|
||||||
|
Forward loan sale commitments
|
Net (loss) gain on mortgage banking activities
|
(211
|
)
|
(196
|
)
|
359
|
|
||||||
|
Total net gain (loss)
|
$
|
14
|
|
$
|
(67
|
)
|
$
|
164
|
|
||||
The following table presents amounts included in accumulated other comprehensive (loss) income for derivatives designated as hedging instruments at
December 31, 2018
and
2017
:
|
|
Accumulated Other
Comprehensive Income |
At December 31,
|
|||||||
|
(Dollars in thousands)
|
2018
|
2017
|
|||||||
|
Interest rate swap—cash flow hedge
|
Fair value, net of taxes
|
$
|
80
|
|
$
|
9
|
|
||
|
Total
|
$
|
80
|
|
$
|
9
|
|
|||
Note 17. Fair Value Disclosures
Fair value is the price that would be received to sell an asset or paid to transfer a liability (an exit price) in an orderly transaction between market participants at the measurement date. The Corporation determines the fair value of financial instruments based on the fair value hierarchy. The Corporation maximizes the use of observable inputs and minimizes the use of unobservable inputs when measuring fair value. Observable inputs are inputs that market participants would use in pricing the asset or liability developed based on market data obtained from sources independent of the Corporation. Unobservable inputs are inputs that reflect the Corporation’s assumptions that market participants would use in pricing the asset or liability based on the best information available in the circumstances, including assumptions about risk. Three levels of inputs are used to measure fair value. A financial instrument’s level within the fair value hierarchy is based on the lowest level of input significant to the fair value measurement. Transfers between levels are recognized at the end of the reporting period.
Level 1: Valuations are based on quoted prices in active markets for identical assets or liabilities that the Corporation can access at the measurement date. Since valuations are based on quoted prices that are readily and regularly available in an active market, valuation of these products does not entail a significant degree of judgment.
Level 2: Valuations are based on quoted prices in markets that are not active or for which all significant inputs are observable, either directly or indirectly.
Level 3: Valuations are based on inputs that are unobservable and significant to the overall fair value measurement. Assets and liabilities utilizing Level 3 inputs include: financial instruments whose value is determined using pricing models, discounted cash flow methodologies, or similar techniques, as well as instruments for which the fair value calculation requires significant management judgment or estimation.
Following is a description of the valuation methodologies used for instruments measured at fair value on a recurring basis, as well as the general classification of such instruments pursuant to the valuation hierarchy.
|
95
|
Investment Securities
Where quoted prices are available in an active market for identical instruments, investment securities are classified within Level 1 of the valuation hierarchy. Level 1 investment securities include U.S. Treasury securities, most equity securities and money market mutual funds. Mutual funds are registered investment companies which are valued at net asset value of shares on a market exchange at the end of each trading day. Level 2 of the valuation hierarchy includes securities issued by U.S. Government sponsored enterprises, mortgage-backed securities, collateralized mortgage obligations, corporate and municipal bonds and certain equity securities. If quoted market prices are not available, then fair values are estimated by using pricing models, quoted prices of securities with similar characteristics or discounted cash flows. In cases where there is limited activity or less transparency around inputs to the valuation, investment securities are classified within Level 3 of the valuation hierarchy.
Fair values for securities are determined using independent pricing services and market-participating brokers. The Corporation’s independent pricing service utilizes evaluated pricing models that vary by asset class and incorporate available trade, bid and other market information for structured securities, cash flow and, when available, loan performance data. Because many fixed income securities do not trade on a daily basis, the pricing service’s evaluated pricing applications apply information as applicable through processes, such as benchmarking of like securities, sector groupings, and matrix pricing, to prepare evaluations. If at any time, the pricing service determines that it does have not sufficient verifiable information to value a particular security, the Corporation will utilize valuations from another pricing service. Management has a sufficient understanding of the third party service’s valuation models, assumptions and inputs used in determining the fair value of securities to enable management to maintain an appropriate system of internal control.
Certain corporate bonds owned by the Corporation are classified as Level 3 as they are not traded in active markets. The fair value of each bond is estimated by benchmarking similar transactions of structure, yield and credit which are owned by the Corporation and are actively traded in the market.
On a quarterly basis, the Corporation reviews changes, as submitted by the pricing service, in the market value of its security portfolio. Individual changes in valuations are reviewed for consistency with general interest rate movements and any known credit concerns for specific securities. If, upon the Corporation’s review or in comparing with another service, a material difference between pricing evaluations were to exist, the Corporation may submit an inquiry to the current pricing service regarding the data used to determine the valuation of a particular security. If the Corporation determines there is market information that would support a different valuation than from the current pricing service’s evaluation, the Corporation may utilize and change the security's valuation. There were no material differences in valuations noted at
December 31, 2018
.
Derivative Financial Instruments
The fair values of derivative financial instruments are based upon the estimated amount the Corporation would receive or pay to terminate the contracts or agreements, taking into account current interest rates and, when appropriate, the current creditworthiness of the counterparties. Interest rate swaps and mortgage banking derivative financial instruments are classified within Level 2 of the valuation hierarchy. Credit derivatives are valued based on credit worthiness of the underlying borrower which is a significant unobservable input and therefore classified in Level 3 of the valuation hierarchy.
Two
commercial loans, associated with interest rate swaps are classified in Level 3 of the valuation hierarchy since lending credit risk is not an observable input for these loans. The unrealized gain on the
two
loans was
$21 thousand
at
December 31, 2018
.
Contingent Consideration Liability
The Corporation estimates the fair value of the contingent consideration liability by using a discounted cash flow model of future contingent payments based on projected revenue related to the acquired business. The estimated fair value of the contingent consideration liability is reviewed on a quarterly basis and any valuation adjustments resulting from a change of estimated future contingent payments based on projected revenue of the acquired business affecting the contingent consideration liability will be recorded through noninterest expense. Due to the significant unobservable input related to the projected revenue, the contingent consideration liability is classified within Level 3 of the valuation hierarchy. An increase in the projected revenue may result in a higher fair value of the contingent consideration liability. Alternatively, a decrease in the projected revenue may result in a lower estimated fair value of the contingent consideration liability.
|
96
|
The following table presents the assets and liabilities measured at fair value on a recurring basis at
December 31, 2018
and
2017
, classified using the fair value hierarchy:
|
|
At December 31, 2018
|
||||||||||||||
|
(Dollars in thousands)
|
Level 1
|
Level 2
|
Level 3
|
Assets/
Liabilities at Fair Value |
|||||||||||
|
Assets:
|
|||||||||||||||
|
Available-for-sale securities:
|
|||||||||||||||
|
U.S. government corporations and agencies
|
$
|
—
|
|
$
|
15,315
|
|
$
|
—
|
|
$
|
15,315
|
|
|||
|
State and political subdivisions
|
—
|
|
65,415
|
|
—
|
|
65,415
|
|
|||||||
|
Residential mortgage-backed securities
|
—
|
|
151,762
|
|
—
|
|
151,762
|
|
|||||||
|
Collateralized mortgage obligations
|
—
|
|
2,888
|
|
—
|
|
2,888
|
|
|||||||
|
Corporate bonds
|
—
|
|
67,398
|
|
25,729
|
|
93,127
|
|
|||||||
|
Total available-for-sale securities
|
—
|
|
302,778
|
|
25,729
|
|
328,507
|
|
|||||||
|
Equity securities:
|
|||||||||||||||
|
Equity securities - financial services industry
|
924
|
|
—
|
|
—
|
|
924
|
|
|||||||
|
Money market mutual funds
|
1,241
|
|
—
|
|
—
|
|
1,241
|
|
|||||||
|
Total equity securities
|
2,165
|
|
—
|
|
—
|
|
2,165
|
|
|||||||
|
Loans*
|
—
|
|
—
|
|
1,779
|
|
1,779
|
|
|||||||
|
Interest rate swaps*
|
—
|
|
189
|
|
—
|
|
189
|
|
|||||||
|
Interest rate locks with customers*
|
—
|
|
490
|
|
—
|
|
490
|
|
|||||||
|
Total assets
|
$
|
2,165
|
|
$
|
303,457
|
|
$
|
27,508
|
|
$
|
333,130
|
|
|||
|
Liabilities:
|
|||||||||||||||
|
Contingent consideration liability
|
$
|
—
|
|
$
|
—
|
|
$
|
259
|
|
$
|
259
|
|
|||
|
Interest rate swaps*
|
—
|
|
20
|
|
—
|
|
20
|
|
|||||||
|
Credit derivatives*
|
—
|
|
—
|
|
72
|
|
72
|
|
|||||||
|
Forward loan sale commitments*
|
—
|
|
150
|
|
—
|
|
150
|
|
|||||||
|
Total liabilities
|
$
|
—
|
|
$
|
170
|
|
$
|
331
|
|
$
|
501
|
|
|||
|
|
At December 31, 2017
|
||||||||||||||
|
(Dollars in thousands)
|
Level 1
|
Level 2
|
Level 3
|
Assets/
Liabilities at Fair Value |
|||||||||||
|
Assets:
|
|||||||||||||||
|
Available-for-sale securities:
|
|||||||||||||||
|
U.S. government corporations and agencies
|
$
|
—
|
|
$
|
16,961
|
|
$
|
—
|
|
$
|
16,961
|
|
|||
|
State and political subdivisions
|
—
|
|
78,297
|
|
—
|
|
78,297
|
|
|||||||
|
Residential mortgage-backed securities
|
—
|
|
185,421
|
|
—
|
|
185,421
|
|
|||||||
|
Collateralized mortgage obligations
|
—
|
|
3,602
|
|
—
|
|
3,602
|
|
|||||||
|
Corporate bonds
|
—
|
|
79,190
|
|
27,986
|
|
107,176
|
|
|||||||
|
Total available-for-sale securities
|
—
|
|
363,471
|
|
27,986
|
|
391,457
|
|
|||||||
|
Equity securities:
|
|||||||||||||||
|
Equity securities - financial services industry
|
1,076
|
|
—
|
|
—
|
|
1,076
|
|
|||||||
|
Money market mutual funds
|
5,985
|
|
—
|
|
—
|
|
5,985
|
|
|||||||
|
Total equity securities
|
7,061
|
|
—
|
|
—
|
|
7,061
|
|
|||||||
|
Loans*
|
—
|
|
—
|
|
1,958
|
|
1,958
|
|
|||||||
|
Interest rate swaps*
|
—
|
|
13
|
|
—
|
|
13
|
|
|||||||
|
Interest rate locks with customers*
|
—
|
|
527
|
|
—
|
|
527
|
|
|||||||
|
Forward loan sale commitments*
|
—
|
|
61
|
|
—
|
|
61
|
|
|||||||
|
Total assets
|
$
|
7,061
|
|
$
|
364,072
|
|
$
|
29,944
|
|
$
|
401,077
|
|
|||
|
Liabilities:
|
|||||||||||||||
|
Contingent consideration liability
|
$
|
—
|
|
$
|
—
|
|
$
|
339
|
|
$
|
339
|
|
|||
|
Interest rate swaps*
|
—
|
|
50
|
|
—
|
|
50
|
|
|||||||
|
Credit derivatives*
|
—
|
|
—
|
|
36
|
|
36
|
|
|||||||
|
Total liabilities
|
$
|
—
|
|
$
|
50
|
|
$
|
375
|
|
$
|
425
|
|
|||
*Such financial instruments are recorded at fair value as further described in Note 16, "Derivative Instruments and Hedging Activities."
|
97
|
The following table includes a rollforward of corporate bonds, loans and credit derivatives for which the Corporation utilized Level 3 inputs to determine fair value on a recurring basis for year ended
December 31, 2018
and
2017
.
|
|
For the Year Ended December 31, 2018
|
||||||||||||||||||||||||||
|
(Dollars in thousands)
|
Balance at
December 31, 2017 |
Purchases/additions
|
Sales
|
Payments received
|
Premium amortization, net
|
(Decrease) increase in value
|
Balance at December 31, 2018
|
||||||||||||||||||||
|
Corporate bonds
|
$
|
27,986
|
|
$
|
—
|
|
$
|
—
|
|
$
|
—
|
|
$
|
—
|
|
$
|
(2,257
|
)
|
$
|
25,729
|
|
||||||
|
Loans
|
1,958
|
|
—
|
|
—
|
|
(148
|
)
|
—
|
|
(31
|
)
|
1,779
|
|
|||||||||||||
|
Credit derivatives
|
(36
|
)
|
(299
|
)
|
—
|
|
—
|
|
—
|
|
263
|
|
(72
|
)
|
|||||||||||||
|
Net total
|
$
|
29,908
|
|
$
|
(299
|
)
|
$
|
—
|
|
$
|
(148
|
)
|
$
|
—
|
|
$
|
(2,025
|
)
|
$
|
27,436
|
|
||||||
|
|
For the Year Ended December 31, 2017
|
||||||||||||||||||||||||||
|
(Dollars in thousands)
|
Balance at
December 31, 2016 |
Purchases/additions
|
Sales
|
Payments received
|
Premium amortization, net
|
(Decrease) increase in value
|
Balance at December 31, 2017
|
||||||||||||||||||||
|
Corporate bonds
|
$
|
28,778
|
|
$
|
—
|
|
$
|
—
|
|
$
|
—
|
|
$
|
—
|
|
$
|
(792
|
)
|
$
|
27,986
|
|
||||||
|
Loans
|
2,138
|
|
—
|
|
—
|
|
(137
|
)
|
—
|
|
(43
|
)
|
1,958
|
|
|||||||||||||
|
Credit derivatives
|
(9
|
)
|
(430
|
)
|
—
|
|
—
|
|
—
|
|
403
|
|
(36
|
)
|
|||||||||||||
|
Net total
|
$
|
30,907
|
|
$
|
(430
|
)
|
$
|
—
|
|
$
|
(137
|
)
|
$
|
—
|
|
$
|
(432
|
)
|
$
|
29,908
|
|
||||||
The following table presents the change in the balance of the contingent consideration liability related to acquisitions for which the Corporation utilized Level 3 inputs to determine fair value on a recurring basis for the years ended
December 31, 2018
and
2017
:
|
|
For the Year Ended December 31, 2018
|
||||||||||||||||||
|
(Dollars in thousands)
|
Balance at
December 31, 2017 |
Contingent
Consideration from New Acquisition |
Payment of
Contingent Consideration |
Adjustment
of Contingent Consideration |
Balance at December 31, 2018
|
||||||||||||||
|
Girard Partners
|
$
|
339
|
|
—
|
|
131
|
|
51
|
|
$
|
259
|
|
|||||||
|
Total contingent consideration liability
|
$
|
339
|
|
$
|
—
|
|
$
|
131
|
|
$
|
51
|
|
$
|
259
|
|
||||
|
|
For the Year Ended December 31, 2017
|
||||||||||||||||||
|
(Dollars in thousands)
|
Balance at
December 31, 2016 |
Contingent
Consideration from New Acquisition |
Payment of
Contingent Consideration |
Adjustment
of Contingent Consideration |
Balance at December 31, 2017
|
||||||||||||||
|
Sterner Insurance Associates
|
$
|
331
|
|
$
|
—
|
|
$
|
30
|
|
$
|
(301
|
)
|
$
|
—
|
|
||||
|
Girard Partners
|
5,668
|
|
—
|
|
5,383
|
|
54
|
|
339
|
|
|||||||||
|
Total contingent consideration liability
|
$
|
5,999
|
|
$
|
—
|
|
$
|
5,413
|
|
$
|
(247
|
)
|
$
|
339
|
|
||||
The Corporation may be required to periodically measure certain assets and liabilities at fair value on a non-recurring basis in accordance with GAAP. These adjustments to fair value usually result from the application of lower of cost or market accounting or impairment charges of individual assets. The following table represents assets measured at fair value on a non-recurring basis at
December 31, 2018
and
2017
:
|
|
At December 31, 2018
|
||||||||||||||
|
(Dollars in thousands)
|
Level 1
|
Level 2
|
Level 3
|
Assets at
Fair Value |
|||||||||||
|
Impaired loans held for investment
|
$
|
—
|
|
$
|
—
|
|
$
|
25,166
|
|
$
|
25,166
|
|
|||
|
Other real estate owned
|
—
|
|
—
|
|
1,187
|
|
1,187
|
|
|||||||
|
Total
|
$
|
—
|
|
$
|
—
|
|
$
|
26,353
|
|
$
|
26,353
|
|
|||
|
98
|
|
|
At December 31, 2017
|
||||||||||||||
|
(Dollars in thousands)
|
Level 1
|
Level 2
|
Level 3
|
Assets at
Fair Value |
|||||||||||
|
Impaired loans held for investment
|
$
|
—
|
|
$
|
—
|
|
$
|
28,351
|
|
$
|
28,351
|
|
|||
|
Impaired leases held for investment
|
—
|
|
—
|
|
1,250
|
|
1,250
|
|
|||||||
|
Other real estate owned
|
—
|
|
—
|
|
1,843
|
|
1,843
|
|
|||||||
|
Total
|
$
|
—
|
|
$
|
—
|
|
$
|
31,444
|
|
$
|
31,444
|
|
|||
The following table presents assets and liabilities and off-balance sheet items not measured at fair value on a recurring or non-recurring basis in the Corporation’s consolidated balance sheets but for which the fair value is required to be disclosed at
December 31, 2018
and
2017
. The disclosed fair values are classified using the fair value hierarchy.
|
|
At December 31, 2018
|
||||||||||||||||||
|
(Dollars in thousands)
|
Level 1
|
Level 2
|
Level 3
|
Fair
Value |
Carrying
Amount |
||||||||||||||
|
Assets:
|
|||||||||||||||||||
|
Cash and short-term interest-earning assets
|
$
|
109,420
|
|
$
|
—
|
|
$
|
—
|
|
$
|
109,420
|
|
$
|
109,420
|
|
||||
|
Held-to-maturity securities
|
—
|
|
141,575
|
|
—
|
|
141,575
|
|
142,634
|
|
|||||||||
|
Federal Home Loan Bank, Federal Reserve Bank and other stock
|
N/A
|
|
N/A
|
|
N/A
|
|
N/A
|
|
28,337
|
|
|||||||||
|
Loans held for sale
|
—
|
|
1,798
|
|
—
|
|
1,798
|
|
1,754
|
|
|||||||||
|
Net loans and leases held for investment
|
—
|
|
—
|
|
3,924,329
|
|
3,924,329
|
|
3,950,265
|
|
|||||||||
|
Servicing rights
|
—
|
|
—
|
|
11,496
|
|
11,496
|
|
6,768
|
|
|||||||||
|
Total assets
|
$
|
109,420
|
|
$
|
143,373
|
|
$
|
3,935,825
|
|
$
|
4,188,618
|
|
$
|
4,239,178
|
|
||||
|
Liabilities:
|
|||||||||||||||||||
|
Deposits:
|
|||||||||||||||||||
|
Demand and savings deposits, non-maturity
|
$
|
3,215,856
|
|
$
|
—
|
|
$
|
—
|
|
$
|
3,215,856
|
|
$
|
3,215,856
|
|
||||
|
Time deposits
|
—
|
|
664,738
|
|
—
|
|
664,738
|
|
670,077
|
|
|||||||||
|
Total deposits
|
3,215,856
|
|
664,738
|
|
—
|
|
3,880,594
|
|
3,885,933
|
|
|||||||||
|
Short-term borrowings
|
—
|
|
189,768
|
|
—
|
|
189,768
|
|
189,768
|
|
|||||||||
|
Long-term debt
|
—
|
|
144,021
|
|
—
|
|
144,021
|
|
145,330
|
|
|||||||||
|
Subordinated notes
|
—
|
|
95,113
|
|
—
|
|
95,113
|
|
94,574
|
|
|||||||||
|
Total liabilities
|
$
|
3,215,856
|
|
$
|
1,093,640
|
|
$
|
—
|
|
$
|
4,309,496
|
|
$
|
4,315,605
|
|
||||
|
Off-Balance-Sheet:
|
|||||||||||||||||||
|
Commitments to extend credit
|
$
|
—
|
|
$
|
(2,516
|
)
|
$
|
—
|
|
$
|
(2,516
|
)
|
$
|
—
|
|
||||
|
|
At December 31, 2017
|
||||||||||||||||||
|
(Dollars in thousands)
|
Level 1
|
Level 2
|
Level 3
|
Fair
Value |
Carrying
Amount |
||||||||||||||
|
Assets:
|
|||||||||||||||||||
|
Cash and short-term interest-earning assets
|
$
|
75,409
|
|
$
|
—
|
|
$
|
—
|
|
$
|
75,409
|
|
$
|
75,409
|
|
||||
|
Held-to-maturity securities
|
—
|
|
55,320
|
|
—
|
|
55,320
|
|
55,564
|
|
|||||||||
|
Federal Home Loan Bank, Federal Reserve Bank and other stock
|
N/A
|
|
N/A
|
|
N/A
|
|
N/A
|
|
27,204
|
|
|||||||||
|
Loans held for sale
|
—
|
|
1,676
|
|
—
|
|
1,676
|
|
1,642
|
|
|||||||||
|
Net loans and leases held for investment
|
—
|
|
—
|
|
3,547,451
|
|
3,547,451
|
|
3,566,953
|
|
|||||||||
|
Servicing rights
|
—
|
|
—
|
|
10,046
|
|
10,046
|
|
6,573
|
|
|||||||||
|
Total assets
|
$
|
75,409
|
|
$
|
56,996
|
|
$
|
3,557,497
|
|
$
|
3,689,902
|
|
$
|
3,733,345
|
|
||||
|
Liabilities:
|
|||||||||||||||||||
|
Deposits:
|
|||||||||||||||||||
|
Demand and savings deposits, non-maturity
|
$
|
2,980,170
|
|
$
|
—
|
|
$
|
—
|
|
$
|
2,980,170
|
|
$
|
2,980,170
|
|
||||
|
Time deposits
|
—
|
|
574,737
|
|
—
|
|
574,737
|
|
574,749
|
|
|||||||||
|
Total deposits
|
2,980,170
|
|
574,737
|
|
—
|
|
3,554,907
|
|
3,554,919
|
|
|||||||||
|
Short-term borrowings
|
—
|
|
105,431
|
|
—
|
|
105,431
|
|
105,431
|
|
|||||||||
|
Long-term debt
|
—
|
|
156,834
|
|
—
|
|
156,834
|
|
155,828
|
|
|||||||||
|
Subordinated notes
|
—
|
|
98,075
|
|
—
|
|
98,075
|
|
94,331
|
|
|||||||||
|
Total liabilities
|
$
|
2,980,170
|
|
$
|
935,077
|
|
$
|
—
|
|
$
|
3,915,247
|
|
$
|
3,910,509
|
|
||||
|
Off-Balance-Sheet:
|
|||||||||||||||||||
|
Commitments to extend credit
|
$
|
—
|
|
$
|
(2,414
|
)
|
$
|
—
|
|
$
|
(2,414
|
)
|
$
|
—
|
|
||||
|
99
|
The following valuation methods and assumptions were used by the Corporation in estimating the fair value for financial instruments measured at fair value on a non-recurring basis and financial instruments not measured at fair value on a recurring or non-recurring basis in the Corporation’s consolidated balance sheets but for which the fair value is required to be disclosed:
Cash and short-term interest-earning assets:
The carrying amounts reported in the balance sheet for cash and due from banks, interest-earning deposits with other banks, federal funds sold and other short-term investments is their stated value. Cash and short-term interest-earning assets are classified within Level 1 in the fair value hierarchy.
Held-to-maturity securities:
Fair values for the held-to-maturity investment securities are estimated by using pricing models or quoted prices of securities with similar characteristics and are classified in Level 2 in the fair value hierarchy.
Federal Home Loan Bank, Federal Reserve Bank and other stock:
It is not practical to determine the fair values of Federal
Home Loan Bank, Federal Reserve Bank and other stock, due to restrictions placed on their transferability.
Loans held for sale:
The fair value of the Corporation’s mortgage loans held for sale are generally determined using a pricing model based on current market information obtained from external sources, including interest rates, bids or indications provided by market participants on specific loans that are actively marketed for sale. These loans are primarily residential mortgage loans and are generally classified in Level 2 due to the observable pricing data. Loans held for sale are carried at the lower of cost or estimated fair value. There were
no
valuation adjustments for loans held for sale at
December 31, 2018
and
2017
.
Loans and leases held for investment:
As of
December 31, 2018
, the fair values for loans and leases held for investment are estimated using discounted cash flow analysis, using a discount rate based on current interest rates at which similar loans with similar terms would be made to borrowers, adjusted as appropriate to consider credit, liquidity and marketability factors to arrive at a fair value that represents the Corporation's exit price at which these instruments would be sold or transferred. As of
December 31, 2017
, the fair values for loans and leases held for investment were estimated using discounted cash flow analysis, using a discount rate based on current interest rates at which similar loans with similar terms would be made to borrowers and included components for credit risk, operating expense and embedded prepayment options. An overall valuation adjustment was made for specific credit risks in addition to general portfolio risk and is significant to the valuation. Loans and leases are classified within Level 3 in the fair value hierarchy since credit risk is not an observable input.
Impaired loans and leases held for investment:
For impaired loans and leases, the Corporation uses a variety of techniques to measure fair value, such as using the current appraised value of the collateral, agreements of sale, discounting the contractual cash flows, and analyzing market data that the Corporation may adjust due to specific characteristics of the loan/lease or collateral. At
December 31, 2018
, impaired loans held for investment had a carrying amount of
$26.6 million
with a valuation allowance of
$1.4 million
. At
December 31, 2017
, impaired loans held for investment had a carrying amount of
$28.5 million
with a valuation allowance of
$131 thousand
. The Corporation had
no
impaired leases at
December 31, 2018
.The Corporation had impaired leases of
$1.3 million
with
no
reserve at December 31,
2017
.
Servicing rights:
The Corporation estimates the fair value of mortgage servicing rights using discounted cash flow models that calculate the present value of estimated future net servicing income. The model uses readily available prepayment speed assumptions for the interest rates of the portfolios serviced. Mortgage servicing rights are classified within Level 3 in the fair value hierarchy based upon management’s assessment of the inputs. The Corporation reviews the mortgage servicing rights portfolio on a quarterly basis for impairment and the mortgage servicing rights are carried at the lower of amortized cost or estimated fair value. The Corporation also records servicing rights on small business administration (SBA) loans. At
December 31, 2018
and
December 31, 2017
, servicing rights had a carrying amount of
$6.8 million
and
$6.6 million
, respectively, with
no
valuation allowance.
Goodwill and other identifiable assets:
Certain non-financial assets subject to measurement at fair value on a non-recurring basis include goodwill and other identifiable intangible assets. In accordance with ASC Topic 350, the Corporation performed a qualitative assessment of goodwill during the fourth quarter of
2018
and determined it was more likely than not that the fair value of the Corporation, including each of the identified reporting units, was more than its carrying amount; therefore, the Corporation did not need to perform the two-step impairment test for the Corporation or the reporting units. The Corporation also completed an impairment test for other intangible assets during the fourth quarter of
2018
. There was
no
impairment of goodwill or identifiable intangibles recorded.
Other real estate owned:
The fair value of other real estate owned (OREO) is originally estimated based upon the appraised value less estimated costs to sell. The fair value less cost to sell becomes the "original cost" of the OREO asset. Subsequently, OREO is reported at the lower of the original cost or the current fair value less cost to sell. Capital improvement expenses associated with the construction or repair of the property are capitalized as part of the cost of the OREO asset; however, the capitalized expenses may not increase the OREO asset's recorded value to an amount greater than the asset's fair value after improvements and less cost
|
100
|
to sell. New appraisals are generally obtained on an annual basis if an agreement of sale does not exist. During
2018
,
five
properties had write-downs totaling
$693 thousand
,
four
properties were transferred into OREO with a fair value of $
477 thousand
and
four
properties were sold with total proceeds of
$490 thousand
for a net gain of
$67 thousand
. At
December 31, 2018
and
2017
, OREO had a carrying amount of
$1.2 million
and
$1.8 million
, respectively. Other real estate owned is classified within Level 3 of the valuation hierarchy due to the unique characteristics of the collateral for each loan.
Deposit liabilities:
The fair values for demand and savings accounts, with no stated maturities, is the amount payable on demand at the reporting date (carrying value) and are classified within Level 1 in the fair value hierarchy. The fair values for time deposits with fixed maturities are estimated by discounting the final maturity using interest rates currently offered for deposits with similar remaining maturities. Time deposits are classified within Level 2 in the fair value hierarchy.
Short-term borrowings:
The fair value of short-term borrowings are estimated using current market rates for similar borrowings and are classified within Level 2 in the fair value hierarchy.
Long-term debt:
The fair value of long-term debt is estimated by using discounted cash flow analysis, based on current market rates for debt with similar terms and remaining maturities. Long-term debt is classified within Level 2 in the fair value hierarchy.
Subordinated notes:
The fair value of subordinated notes are estimated by discounting the principal balance using the treasury yield curve for the term to the call date as the Corporation has the option to call the subordinated notes. The subordinated notes are classified within Level 2 in the fair value hierarchy.
Off-balance-sheet instruments:
Fair values for the Corporation’s off-balance-sheet instruments are based on the fees currently charged to enter into similar agreements, taking into account the remaining terms of the agreements and the counterparties’ credit standing and are classified within Level 2 in the fair value hierarchy.
Note 18. Restructuring Charges
During January 2018, the Corporation announced the closure of
two
owned financial centers and
one
leased financial center and reduced staff associated with these financial centers, resulting in accruing a loss of
$571 thousand
related to the Banking business segment. These financial centers were closed in April 2018. The remaining accrued restructuring expense at January 1, 2018 of
$23 thousand
related to 2016 restructuring charges.
A roll-forward of the remaining accrued restructuring expense is as follows:
|
(Dollars in thousands)
|
Severance expenses
|
Write-downs and retirements of fixed assets
|
Lease cancellations
|
Total
|
|||||||||||
|
Accrued at January 1, 2018
|
$
|
—
|
|
$
|
—
|
|
$
|
23
|
|
$
|
23
|
|
|||
|
Restructuring charges
|
366
|
|
48
|
|
157
|
|
571
|
|
|||||||
|
Payments
|
(344
|
)
|
—
|
|
(172
|
)
|
(516
|
)
|
|||||||
|
Non-cash settlement
|
—
|
|
(48
|
)
|
—
|
|
(48
|
)
|
|||||||
|
Accrued at December 31, 2018
|
$
|
22
|
|
$
|
—
|
|
$
|
8
|
|
$
|
30
|
|
|||
Note 19. Share Repurchase Plan
On October 23, 2013, the Corporation’s Board of Directors approved a stock repurchase plan for the repurchase of up to
800,000
shares of common stock, or approximately
5%
of the shares outstanding. On May 27, 2015, the Corporation's Board of Directors approved an increase of
1,000,000
shares in the common shares available for repurchase under the Corporation's share repurchase program, or approximately
5%
of the Corporation's common stock outstanding as of May 27, 2015. During the years ended
December 31, 2018
,
2017
and
2016
, the Corporation repurchased
150,000
,
0
and
66,000
shares of common stock at a cost of
$3.6 million
, $
0.0 million
and
$1.4 million
, respectively, under the share repurchase program. Shares available for future repurchases under the plan totaled
864,246
at
December 31, 2018
. Total shares outstanding at
December 31, 2018
were
29,270,852
. At
December 31, 2018
, the aggregate purchases recorded as treasury stock, at cost, on the Corporation's consolidated balance sheet was
$45.8 million
. The Corporation will repurchase shares of its common stock from time to time through open market purchases, tender offers, privately negotiated purchases or other means based on general market conditions, the trading price of the Corporation's common stock, tax considerations, alternative uses of capital and the Corporation's results of operation. The share repurchase program does not obligate the Corporation to acquire any particular amount of common stock. The program has no scheduled expiration date and the Board of Directors has the right to suspend or discontinue the program at any time.
|
101
|
Note 20. Regulatory Matters
The Corporation and the Bank are subject to various regulatory capital requirements administered by the federal banking agencies. The risk-based capital guidelines include both a definition of capital and a framework for calculating risk-weighted assets by assigning balance sheet assets and off-balance sheet items to broad risk categories. Failure to meet minimum capital requirements can initiate certain mandatory and possibly additional discretionary actions by regulators that, if undertaken, could have a direct material effect on the Corporation’s and the Bank’s financial statements. Capital adequacy guidelines, and additionally for the Bank the prompt corrective action regulations, involve quantitative measures of assets, liabilities, and certain off-balance-sheet items calculated under regulatory accounting practices. Capital amounts and classifications are also subject to qualitative judgments by regulators about components, risk weighting and other factors.
Quantitative measures established by regulation to ensure capital adequacy require the Corporation and the Bank to maintain minimum amounts and ratios (set forth in the following table) of Total capital, Tier 1 capital and Tier 1 common capital (as defined in the regulations) to risk-weighted assets (as defined), and of Tier 1 capital (as defined) to average assets (as defined), or leverage ratio.
In July 2013, the federal bank regulatory agencies adopted final rules revising the agencies’ capital adequacy guidelines and prompt corrective action rules, designed to enhance such requirements and implement the revised standards of the Basel Committee on Banking Supervision, commonly referred to as Basel III. The new minimum capital requirements were effective on January 1, 2015. Under the new rules, in order to avoid limitations on capital distributions (including dividend payments and certain discretionary bonus payments to executive officers), a banking organization must hold a capital conservation buffer comprised of common equity Tier 1 capital above its minimum risk-based capital requirements in an amount greater than
2.50%
of total risk-weighted assets. The capital conservation buffer requirements began to be phased in beginning January 1, 2016 and were fully applicable on January 1, 2019.
The Corporation adopted the new Basel III regulatory capital rules during the first quarter of 2015 under the transition rules, primarily relating to regulatory deductions and adjustments impacting common equity tier 1 capital and tier 1 capital, to be phased in over a
four
-year period beginning
January 1, 2015
. Under Basel III rules, the decision was made to opt-out of including accumulated other comprehensive income in regulatory capital. During 2019, the Corporation and the Bank must hold a capital conservation buffer greater than
2.50%
above its minimum risk-based capital requirements in order to avoid limitations on capital distributions. The Corporation's and Bank's intent is to maintain capital levels in excess of the capital conservation buffer which would require Tier 1 Capital to Risk Weighted Assets to exceed
8.50%
and Total Capital to Risk Weighted Assets to exceed
10.50%
beginning in the first quarter of 2019.
|
102
|
The Corporation's and Bank's actual and required capital ratios as of
December 31, 2018
and
December 31, 2017
under regulatory capital rules were as follows.
|
(Dollars in thousands)
|
Actual
|
For Capital Adequacy
Purposes |
To Be Well-Capitalized
Under Prompt Corrective Action Provisions |
|||||||||||||||||
|
Amount
|
Ratio
|
Amount
|
Ratio
|
Amount
|
Ratio
|
|||||||||||||||
|
At December 31, 2018
|
||||||||||||||||||||
|
Total Capital (to Risk-Weighted Assets):
|
||||||||||||||||||||
|
Corporation
|
$
|
604,213
|
|
13.70
|
%
|
$
|
352,764
|
|
8.00
|
%
|
$
|
440,955
|
|
10.00
|
%
|
|||||
|
Bank
|
506,728
|
|
11.54
|
|
351,220
|
|
8.00
|
|
439,026
|
|
10.00
|
|
||||||||
|
Tier 1 Capital (to Risk-Weighted Assets):
|
||||||||||||||||||||
|
Corporation
|
479,550
|
|
10.88
|
|
264,573
|
|
6.00
|
|
352,764
|
|
8.00
|
|
||||||||
|
Bank
|
476,639
|
|
10.86
|
|
263,415
|
|
6.00
|
|
351,220
|
|
8.00
|
|
||||||||
|
Tier 1 Common Capital (to Risk-Weighted Assets):
|
||||||||||||||||||||
|
Corporation
|
479,550
|
|
10.88
|
|
198,430
|
|
4.50
|
|
286,621
|
|
6.50
|
|
||||||||
|
Bank
|
476,639
|
|
10.86
|
|
197,561
|
|
4.50
|
|
285,367
|
|
6.50
|
|
||||||||
|
Tier 1 Capital (to Average Assets):
|
||||||||||||||||||||
|
Corporation
|
479,550
|
|
10.13
|
|
189,374
|
|
4.00
|
|
236,718
|
|
5.00
|
|
||||||||
|
Bank
|
476,639
|
|
10.12
|
|
188,487
|
|
4.00
|
|
235,609
|
|
5.00
|
|
||||||||
|
At December 31, 2017
|
||||||||||||||||||||
|
Total Capital (to Risk-Weighted Assets):
|
||||||||||||||||||||
|
Corporation
|
$
|
563,797
|
|
14.00
|
%
|
$
|
322,148
|
|
8.00
|
%
|
$
|
402,685
|
|
10.00
|
%
|
|||||
|
Bank
|
464,851
|
|
11.62
|
|
320,003
|
|
8.00
|
|
400,004
|
|
10.00
|
|
||||||||
|
Tier 1 Capital (to Risk-Weighted Assets):
|
||||||||||||||||||||
|
Corporation
|
447,228
|
|
11.11
|
|
241,611
|
|
6.00
|
|
322,148
|
|
8.00
|
|
||||||||
|
Bank
|
442,613
|
|
11.07
|
|
240,002
|
|
6.00
|
|
320,003
|
|
8.00
|
|
||||||||
|
Tier 1 Common Capital (to Risk-Weighted Assets):
|
||||||||||||||||||||
|
Corporation
|
447,228
|
|
11.11
|
|
181,208
|
|
4.50
|
|
261,745
|
|
6.50
|
|
||||||||
|
Bank
|
442,613
|
|
11.07
|
|
180,002
|
|
4.50
|
|
260,002
|
|
6.50
|
|
||||||||
|
Tier 1 Capital (to Average Assets):
|
||||||||||||||||||||
|
Corporation
|
447,228
|
|
10.48
|
|
170,753
|
|
4.00
|
|
213,441
|
|
5.00
|
|
||||||||
|
Bank
|
442,613
|
|
10.45
|
|
169,453
|
|
4.00
|
|
211,816
|
|
5.00
|
|
||||||||
At
December 31, 2018
and
December 31, 2017
, management believes that the Corporation and the Bank continued to meet all capital adequacy requirements to which they are subject. The Corporation, like other bank holding companies, currently is required to maintain Tier 1 Capital and Total Capital equal to at least
6.0%
and
8.0%
, respectively, of its total risk-weighted assets (including various off-balance-sheet items). The Bank, like other depository institutions, is required to maintain similar capital levels under capital adequacy guidelines. During 2018, the Corporation and the Bank was required to hold a capital conservation buffer comprised of common equity Tier I capital above its minimum risk-based capital requirements in an amount greater than
1.875%
of total risk-weighted assets in order to avoid limitations on capital distributions. For a depository institution to be considered “well capitalized” under the regulatory framework for prompt corrective action, Tier 1 and Total Capital ratios must be at least
8.0%
and
10.0%
on a risk-adjusted basis, respectively. At
December 31, 2018
, the Bank is categorized as “well capitalized” under the regulatory framework for prompt corrective action. There are no conditions or events that management believes have changed the Bank’s category. The Corporation will continue to analyze the impact of the phase in of the capital conservation buffer as well as the impact on new accounting rules, such as Lease Accounting (ASU No. 2016-02) and CECL (ASU No. 2016-13) on its regulatory capital ratios.
During December 2018, the Federal Reserve announced that a banking organization that experiences a reduction in retained earnings due the CECL adoption as of the beginning of the fiscal year in which CECL is adopted may elect to phase in the regulatory capital impact of adopting CECL. Transitional amounts would be calculated for the following items: retained earnings, temporary difference deferred tax assets and credit loss allowances eligible for inclusion in regulatory capital. When calculating regulatory capital ratios, 25% of the transitional amounts are phased in during the first year. An additional 25% of the transitional amounts are phased in over each of the next two years and at the beginning of the fourth year, the day-one effects of CECL are completely reflected in regulatory capital. The election must be made in the first reporting period that CECL is adopted. See Note 1, "Summary of Significant Accounting Policies - Accounting Pronouncements Yet to Be Adopted" for additional information.
Dividends and Other Restrictions
The primary source of the Corporation’s dividends paid to its shareholders is from the earnings of the Bank paid to the Corporation in the form of dividends.
|
103
|
The approval of the Federal Reserve Board of Governors is required for a state bank member in the Federal Reserve system to pay dividends if the total of all dividends declared in any calendar year exceeds the Bank’s net profits (as defined) for that year combined with its retained net profits for the preceding two calendar years. Under this formula, the Bank can declare dividends in
2019
without approval of the Federal Reserve Board of Governors of approximately
$55.7 million
plus an additional amount equal to the Bank’s net profits for
2019
up to the date of any such dividend declaration.
Federal Reserve Board policy applicable to the holding company also provides that, as a general matter, a bank holding company should inform the Federal Reserve and should eliminate, defer or significantly reduce the holding company’s dividends if the holding company’s net income for the preceding four quarters, net of dividends paid during the period, is not sufficient to fully fund the dividends, the holding company’s prospective rate of earnings retention is inconsistent with capital needs and overall current and prospective financial condition, or the holding company will not meet, or is in danger of not meeting, its minimum regulatory capital
adequacy ratios. Federal Reserve Board policy also provides that a bank holding company should inform the Federal Reserve reasonably in advance of declaring or paying a dividend that exceeds earnings for the period or that could result in a material adverse change to the organization’s capital structure.
The Federal Reserve Act requires that the extension of credit by the Bank to certain affiliates, including the Corporation (parent), be secured by readily marketable securities, that the extension of credit to any one affiliate be limited to
10%
of the Bank’s capital and surplus (as defined), and that extensions of credit to all such affiliates be limited to
20%
of the Bank’s capital and surplus.
Note 21. Related Party Transactions
In the ordinary course of business, the Corporation has made loans and commitments to extend credit to certain directors and executive officers of the Corporation and companies in which directors have an interest (Related Parties). These loans and commitments have been made on substantially the same terms, including interest rates and collateral, as those prevailing at the same time for comparable transactions with customers not related to the lender and did not involve more than the normal risk of collectability or present other unfavorable terms.
The following table provides a summary of activity for loans to Related Parties during the year ended
December 31, 2018
:
|
(Dollars in thousands)
|
|||
|
Balance at January 1,
2018
|
$
|
17,845
|
|
|
Additions
|
920
|
|
|
|
Amounts collected and other reductions
|
(15,875
|
)
|
|
|
Balance at December 31, 2018
|
$
|
2,890
|
|
The following table provides additional information regarding transactions with Related Parties:
|
(Dollars in thousands)
|
At December 31, 2018
|
||
|
Commitments to extend credit
|
$
|
869
|
|
|
Deposits received
|
3,977
|
|
|
Note 22. Segment Reporting
At
December 31, 2018
, the Corporation has
three
reportable business segments: Banking, Wealth Management and Insurance. The Corporation determines the segments based primarily upon product and service offerings, through the types of income generated and the regulatory environment. This is strategically how the Corporation operates and has positioned itself in the marketplace. Accordingly, significant operating decisions are based upon analysis of each of these segments. The parent holding company and intercompany eliminations are included in the "Other" segment.
The Corporation's Banking segment consists of commercial, consumer and mortgage banking, as well as lease financing. The Wealth Management segment consists of investment advisory services, retirement plan services, trust, municipal pension services and broker/dealer services. The Insurance segment consists of commercial lines, personal lines, benefits and human resources consulting.
|
104
|
Each segment generates revenue from a variety of products and services it provides. Examples of products and services provided for each reportable segment are indicated as follows:
|
●
|
The Banking segment provides financial services to individuals, businesses, municipalities and nonprofit organizations. These services include a full range of banking services such as deposit taking, loan origination and servicing, mortgage banking, other general banking services and equipment lease financing.
|
|
●
|
The Wealth Management segment offers trust and investment advisory services, guardian and custodian of employee benefits and other trust and brokerage services, as well as a registered investment advisory managing private investment accounts for both individuals and institutions.
|
|
●
|
The Insurance segment includes a full-service insurance brokerage agency offering commercial property and casualty insurance, group life and health coverage, employee benefit solutions, personal insurance lines and human resources consulting.
|
The following tables provide reportable segment-specific information and reconciliations to consolidated financial information for the years ended
December 31, 2018
,
2017
and
2016
.
|
(Dollars in thousands)
|
Banking
|
Wealth Management
|
Insurance
|
Other
|
Consolidated
|
||||||||||||||
|
For the Year Ended December 31, 2018
|
|||||||||||||||||||
|
Interest income
|
$
|
190,425
|
|
$
|
32
|
|
$
|
—
|
|
$
|
31
|
|
$
|
190,488
|
|
||||
|
Interest expense
|
27,383
|
|
—
|
|
—
|
|
5,043
|
|
32,426
|
|
|||||||||
|
Net interest income (expense)
|
163,042
|
|
32
|
|
—
|
|
(5,012
|
)
|
158,062
|
|
|||||||||
|
Provision for loan and lease losses
|
20,310
|
|
—
|
|
—
|
|
—
|
|
20,310
|
|
|||||||||
|
Noninterest income
|
20,815
|
|
23,179
|
|
16,442
|
|
(263
|
)
|
60,173
|
|
|||||||||
|
Intangible expenses
|
1,139
|
|
553
|
|
474
|
|
—
|
|
2,166
|
|
|||||||||
|
Restructuring charges
|
571
|
|
—
|
|
—
|
|
—
|
|
571
|
|
|||||||||
|
Other noninterest expense
|
106,947
|
|
14,845
|
|
12,419
|
|
291
|
|
134,502
|
|
|||||||||
|
Intersegment (revenue) expense*
|
(1,113
|
)
|
612
|
|
501
|
|
—
|
|
—
|
|
|||||||||
|
Income (expense) before income taxes
|
56,003
|
|
7,201
|
|
3,048
|
|
(5,566
|
)
|
60,686
|
|
|||||||||
|
Income tax expense (benefit)
|
9,085
|
|
1,913
|
|
752
|
|
(1,607
|
)
|
10,143
|
|
|||||||||
|
Net income (loss)
|
$
|
46,918
|
|
$
|
5,288
|
|
$
|
2,296
|
|
$
|
(3,959
|
)
|
$
|
50,543
|
|
||||
|
Total assets
|
$
|
4,895,732
|
|
$
|
39,090
|
|
$
|
30,117
|
|
$
|
19,408
|
|
$
|
4,984,347
|
|
||||
|
Capital expenditures
|
$
|
3,091
|
|
$
|
45
|
|
$
|
30
|
|
$
|
201
|
|
$
|
3,367
|
|
||||
|
For the Year Ended December 31, 2017
|
|||||||||||||||||||
|
Interest income
|
$
|
162,982
|
|
$
|
8
|
|
$
|
—
|
|
$
|
25
|
|
$
|
163,015
|
|
||||
|
Interest expense
|
14,802
|
|
—
|
|
—
|
|
5,037
|
|
19,839
|
|
|||||||||
|
Net interest income (expense)
|
148,180
|
|
8
|
|
—
|
|
(5,012
|
)
|
143,176
|
|
|||||||||
|
Provision for loan and lease losses
|
9,892
|
|
—
|
|
—
|
|
—
|
|
9,892
|
|
|||||||||
|
Noninterest income
|
21,838
|
|
21,707
|
|
15,320
|
|
375
|
|
59,240
|
|
|||||||||
|
Intangible expenses
|
1,507
|
|
674
|
|
401
|
|
—
|
|
2,582
|
|
|||||||||
|
Other noninterest expense
|
100,670
|
|
13,732
|
|
11,667
|
|
2,062
|
|
128,131
|
|
|||||||||
|
Intersegment (revenue) expense*
|
(1,059
|
)
|
585
|
|
474
|
|
—
|
|
—
|
|
|||||||||
|
Income (expense) before income taxes
|
59,008
|
|
6,724
|
|
2,778
|
|
(6,699
|
)
|
61,811
|
|
|||||||||
|
Income tax expense (benefit)
|
15,735
|
|
2,597
|
|
374
|
|
(989
|
)
|
17,717
|
|
|||||||||
|
Net income (loss)
|
$
|
43,273
|
|
$
|
4,127
|
|
$
|
2,404
|
|
$
|
(5,710
|
)
|
$
|
44,094
|
|
||||
|
Total assets
|
$
|
4,466,301
|
|
$
|
34,600
|
|
$
|
27,846
|
|
$
|
26,115
|
|
$
|
4,554,862
|
|
||||
|
Capital expenditures
|
$
|
7,731
|
|
$
|
38
|
|
$
|
222
|
|
$
|
612
|
|
$
|
8,603
|
|
||||
|
For the Year Ended December 31, 2016
|
|||||||||||||||||||
|
Interest income
|
$
|
126,571
|
|
$
|
5
|
|
$
|
—
|
|
$
|
31
|
|
$
|
126,607
|
|
||||
|
Interest expense
|
8,224
|
|
—
|
|
—
|
|
4,158
|
|
12,382
|
|
|||||||||
|
Net interest income (expense)
|
118,347
|
|
5
|
|
—
|
|
(4,127
|
)
|
114,225
|
|
|||||||||
|
Provision for loan and lease losses
|
4,821
|
|
—
|
|
—
|
|
—
|
|
4,821
|
|
|||||||||
|
Noninterest income
|
21,296
|
|
19,318
|
|
15,150
|
|
199
|
|
55,963
|
|
|||||||||
|
Intangible expenses
|
932
|
|
3,132
|
|
1,464
|
|
—
|
|
5,528
|
|
|||||||||
|
Acquisition-related and integration costs and restructuring charges
|
16,096
|
|
—
|
|
—
|
|
1,559
|
|
17,655
|
|
|||||||||
|
Other noninterest expense
|
88,065
|
|
12,980
|
|
11,924
|
|
5,829
|
|
118,798
|
|
|||||||||
|
Intersegment (revenue) expense*
|
(1,766
|
)
|
788
|
|
978
|
|
—
|
|
—
|
|
|||||||||
|
Income (expense) before income taxes
|
31,495
|
|
2,423
|
|
784
|
|
(11,316
|
)
|
23,386
|
|
|||||||||
|
Income tax expense (benefit)
|
6,510
|
|
857
|
|
348
|
|
(3,834
|
)
|
3,881
|
|
|||||||||
|
Net income (loss)
|
$
|
24,985
|
|
$
|
1,566
|
|
$
|
436
|
|
$
|
(7,482
|
)
|
$
|
19,505
|
|
||||
|
Capital expenditures
|
$
|
9,944
|
|
$
|
29
|
|
$
|
30
|
|
$
|
1,660
|
|
$
|
11,663
|
|
||||
*Includes an allocation of general and administrative expenses from both the parent holding company and the Bank. These expenses are generally allocated based upon number of employees and square footage utilized.
|
105
|
Note 23. Revenue from Contracts with Customers
In May 2014, the FASB issued ASU No. 2014-09, "Revenue from Contracts with Customers (Topic 606)” and subsequent related updates. The Corporation adopted the guidance effective January 1, 2018 using the modified retrospective method though no adjustments were made to retained earnings as a result of the adoption. The Corporation’s revenue is the sum of net interest income and noninterest income. Revenues are recognized when obligations under the terms of contracts with customers are satisfied, including the transfer of control of the promised goods or services to customers, in an amount that reflects the consideration the Corporation expects to be entitled to in exchange for those goods or services. The Corporation provides services to customers which have related performance obligations that are completed to recognize revenue. The Corporation's revenues are generally recognized either immediately upon the completion of the services or over time as the services are performed. Any services performed over time generally require services to be rendered each period and therefore progress in completing these services is measured based upon the passage of time.
The following tables disaggregate the Corporation's revenue by major source for the years ended December 31,
2018
,
2017
and
2016
.
|
(Dollars in thousands)
|
Banking
|
Wealth Management
|
Insurance
|
Other
|
Consolidated
|
||||||||||||||
|
For the Year Ended December 31, 2018
|
|||||||||||||||||||
|
Net interest income (1)
|
$
|
163,042
|
|
$
|
32
|
|
$
|
—
|
|
$
|
(5,012
|
)
|
$
|
158,062
|
|
||||
|
Noninterest income:
|
|||||||||||||||||||
|
Trust fee income
|
—
|
|
7,882
|
|
—
|
|
—
|
|
7,882
|
|
|||||||||
|
Service charges on deposit accounts
|
5,632
|
|
—
|
|
—
|
|
—
|
|
5,632
|
|
|||||||||
|
Investment advisory commission and fee income
|
—
|
|
15,098
|
|
—
|
|
—
|
|
15,098
|
|
|||||||||
|
Insurance commission and fee income
|
—
|
|
—
|
|
15,658
|
|
—
|
|
15,658
|
|
|||||||||
|
Other service fee income (2)
|
8,347
|
|
199
|
|
786
|
|
—
|
|
9,332
|
|
|||||||||
|
Bank owned life insurance income (1)
|
3,284
|
|
—
|
|
—
|
|
(110
|
)
|
3,174
|
|
|||||||||
|
Net gain on sales of investment securities (1)
|
10
|
|
—
|
|
—
|
|
—
|
|
10
|
|
|||||||||
|
Net gain on mortgage banking activities (1)
|
3,125
|
|
—
|
|
—
|
|
—
|
|
3,125
|
|
|||||||||
|
Other income (loss) (2)
|
417
|
|
—
|
|
(2
|
)
|
(153
|
)
|
262
|
|
|||||||||
|
Total noninterest income
|
$
|
20,815
|
|
$
|
23,179
|
|
$
|
16,442
|
|
$
|
(263
|
)
|
$
|
60,173
|
|
||||
|
(Dollars in thousands)
|
Banking
|
Wealth Management
|
Insurance
|
Other
|
Consolidated
|
||||||||||||||
|
For the Year Ended December 31, 2017
|
|||||||||||||||||||
|
Net interest income (1)
|
$
|
148,180
|
|
$
|
8
|
|
$
|
—
|
|
$
|
(5,012
|
)
|
$
|
143,176
|
|
||||
|
Noninterest income:
|
|||||||||||||||||||
|
Trust fee income
|
—
|
|
8,055
|
|
—
|
|
—
|
|
8,055
|
|
|||||||||
|
Service charges on deposit accounts
|
5,482
|
|
—
|
|
—
|
|
—
|
|
5,482
|
|
|||||||||
|
Investment advisory commission and fee income
|
—
|
|
13,454
|
|
—
|
|
—
|
|
13,454
|
|
|||||||||
|
Insurance commission and fee income
|
—
|
|
—
|
|
14,788
|
|
—
|
|
14,788
|
|
|||||||||
|
Other service fee income (2)
|
7,927
|
|
198
|
|
531
|
|
—
|
|
8,656
|
|
|||||||||
|
Bank owned life insurance income (1)
|
3,616
|
|
—
|
|
—
|
|
372
|
|
3,988
|
|
|||||||||
|
Net gain on sales of investment securities (1)
|
45
|
|
—
|
|
—
|
|
3
|
|
48
|
|
|||||||||
|
Net gain on mortgage banking activities (1)
|
4,023
|
|
—
|
|
—
|
|
—
|
|
4,023
|
|
|||||||||
|
Other income (2)
|
745
|
|
—
|
|
1
|
|
—
|
|
746
|
|
|||||||||
|
Total noninterest income
|
$
|
21,838
|
|
$
|
21,707
|
|
$
|
15,320
|
|
$
|
375
|
|
$
|
59,240
|
|
||||
|
106
|
|
(Dollars in thousands)
|
Banking
|
Wealth Management
|
Insurance
|
Other
|
Consolidated
|
||||||||||||||
|
For the Year Ended December 31, 2016
|
|||||||||||||||||||
|
Net interest income (1)
|
$
|
118,347
|
|
$
|
5
|
|
$
|
—
|
|
$
|
(4,127
|
)
|
$
|
114,225
|
|
||||
|
Noninterest income:
|
|||||||||||||||||||
|
Trust fee income
|
—
|
|
7,741
|
|
—
|
|
—
|
|
7,741
|
|
|||||||||
|
Service charges on deposit accounts
|
4,691
|
|
—
|
|
—
|
|
—
|
|
4,691
|
|
|||||||||
|
Investment advisory commission and fee income
|
—
|
|
11,424
|
|
—
|
|
—
|
|
11,424
|
|
|||||||||
|
Insurance commission and fee income
|
—
|
|
—
|
|
14,603
|
|
—
|
|
14,603
|
|
|||||||||
|
Other service fee income (2)
|
7,160
|
|
153
|
|
533
|
|
(10
|
)
|
7,836
|
|
|||||||||
|
Bank owned life insurance income (1)
|
2,749
|
|
—
|
|
—
|
|
182
|
|
2,931
|
|
|||||||||
|
Net gain on sales of investment securities (1)
|
494
|
|
—
|
|
—
|
|
24
|
|
518
|
|
|||||||||
|
Net gain on mortgage banking activities (1)
|
6,027
|
|
—
|
|
—
|
|
—
|
|
6,027
|
|
|||||||||
|
Other income (2)
|
175
|
|
—
|
|
14
|
|
3
|
|
192
|
|
|||||||||
|
Total noninterest income
|
$
|
21,296
|
|
$
|
19,318
|
|
$
|
15,150
|
|
$
|
199
|
|
$
|
55,963
|
|
||||
|
(1)
|
Net interest income as well as many other revenues for financial assets and liabilities including loans, leases, securities, and derivatives are excluded from the scope of the standard. Noninterest income streams that are out-of-scope of the standard include bank owned life insurance income, sales of investment securities and mortgage banking activities.
|
|
(2)
|
Other service fee income and other income include certain items that are in scope and certain items that are out of scope of the standard and are described further in the following paragraphs.
|
Banking Segment
The banking segment provides financial services to consumer and commercial customers and governmental units. These services include a full range of banking services such as deposit taking, loan origination and servicing, mortgage banking, other general banking services and equipment lease financing.
Service charges on deposit accounts
are generally earned on depository accounts for commercial and consumer customers and primarily includes fees for account services, overdraft and non-sufficient funds services, and cash management services for commercial customers. Account services include fees for event-driven services such as ATM transactions and fees for periodic account maintenance activities. Cash management services for commercial customers include fees for event-driven services such as lockbox processing and line sweep services and fees for periodic account maintenance activities. The Corporation's obligation for event-driven services is satisfied at the time of the event when the service is delivered, while the obligation for periodic services is satisfied over the course of each month. Obligations for overdraft services is satisfied at the time of the overdraft.
Other service fee income
is earned from commercial and consumer customers and primarily includes credit and debit card interchange and merchant revenues, mortgage servicing income, which is out of scope of the standard, and other deposit related service fee income such as wire transfers, check services and safe deposit boxes. Interchange and merchant revenues are recognized concurrently with the delivery of services on a monthly basis. Other deposit related service fee income include fees for event-driven services, such as wire transfers and check services, and fees for periodic services such as safe deposit box services. The obligation for event-driven services is satisfied at the time of the event when the service is delivered, while the obligation for periodic services is satisfied over the course of each month.
Other income
primarily includes net gains or losses from the sales of loans and leases, net gains or losses from the sales or disposition of fixed assets and net gains or losses on interest rate swaps, all of which are out of scope of the standard, and net gains or losses on sales and write-downs of other real estate owned. Net gains or losses on sales of other real estate owned are recognized at the point in time in which control of the other real estate owned is transferred.
Wealth Management Segment
The wealth management segment offers trust and investment advisory services, guardian and custodian of employee benefits and other trust and brokerage services, as well as a registered investment advisory managing private investment accounts for both individuals and institutions.
Trust fee income
is earned for providing trust, investment management and other related services. Obligations for trust and other related services are generally satisfied over time but may be satisfied at points in time for certain activities that are transactional in nature and obligations for investment management services are generally performed over time. Fees for trust fee income are
|
107
|
typically based on a tiered scale relative to the market value of assets under management and are recognized in conjunction with the delivery of services.
Investment advisory commission and fee income
include fees for financial planning, guardian and custodian of employee benefits, investment advisory, and brokerage services. Obligations for financial planning, guardian and custodian of employee benefits, and investment advisory services are generally satisfied over time and fees, typically based on a tiered scale relative to the market value of assets under management, are recognized in conjunction with the delivery of services. Brokerage services are typically event driven and are based on the size and number of transactions executed at the client’s direction and recognized on the trade date.
Insurance Segment
The insurance segment includes a full-service insurance brokerage agency offering commercial property and casualty insurance, group life and health coverage, employee benefit solutions, personal insurance lines and payroll and human resources consulting.
Insurance commission and fee income
is derived primarily from commissions from the sale of insurance policies, which are generally calculated as a percentage of the policy premium, and contingent income, which is calculated based on the performance of the policies held by each carrier. Obligations for the sale of insurance policies are generally satisfied at the point in time which the policy is executed and are recognized at the point in time in which the amounts are known and collection is reasonably assured. Obligations for contingent income are generally satisfied over time and are recognized at the point in time in which the amounts are known and collection is reasonably assured.
Other service fee income
is earned from payroll and human resources consulting services. These obligations are generally satisfied over time and are recognized on a periodic basis.
Note 24. Condensed Financial Information - Parent Company Only
Condensed financial statements of the Corporation, parent company only, follow:
|
(Dollars in thousands)
|
At December 31,
|
||||||
|
Balance Sheets
|
2018
|
2017
|
|||||
|
Assets:
|
|||||||
|
Cash
|
$
|
78,897
|
|
$
|
73,642
|
|
|
|
Interest-earning deposits with other banks
|
145
|
|
114
|
|
|||
|
Cash and cash equivalents
|
79,042
|
|
73,756
|
|
|||
|
Investments in securities
|
924
|
|
1,077
|
|
|||
|
Investments in subsidiaries, at equity in net assets:
|
|||||||
|
Bank
|
638,500
|
|
612,045
|
|
|||
|
Non-banks
|
—
|
|
—
|
|
|||
|
Other assets
|
18,340
|
|
32,399
|
|
|||
|
Total assets
|
$
|
736,806
|
|
$
|
719,277
|
|
|
|
Liabilities:
|
|||||||
|
Dividends payable
|
$
|
5,863
|
|
$
|
5,866
|
|
|
|
Subordinated notes
|
94,574
|
|
94,331
|
|
|||
|
Other liabilities
|
12,236
|
|
15,706
|
|
|||
|
Total liabilities
|
112,673
|
|
115,903
|
|
|||
|
Shareholders' equity:
|
624,133
|
|
603,374
|
|
|||
|
Total liabilities and shareholders' equity
|
$
|
736,806
|
|
$
|
719,277
|
|
|
|
108
|
|
(Dollars in thousands)
|
For the Years Ended December 31,
|
||||||||||
|
Statements of Income
|
2018
|
2017
|
2016
|
||||||||
|
Dividends from Bank
|
$
|
22,359
|
|
$
|
26,263
|
|
$
|
94,042
|
|
||
|
Dividends from non-bank
|
—
|
|
—
|
|
—
|
|
|||||
|
Net gain on sales of securities
|
—
|
|
3
|
|
23
|
|
|||||
|
Other income
|
26,631
|
|
24,740
|
|
18,663
|
|
|||||
|
Total operating income
|
48,990
|
|
51,006
|
|
112,728
|
|
|||||
|
Interest expense
|
5,043
|
|
5,037
|
|
4,158
|
|
|||||
|
Operating expenses
|
27,155
|
|
26,405
|
|
25,843
|
|
|||||
|
Income before income tax benefit and equity in undistributed income (loss) of subsidiaries
|
16,792
|
|
19,564
|
|
82,727
|
|
|||||
|
Income tax benefit
|
(1,607
|
)
|
(989
|
)
|
(3,834
|
)
|
|||||
|
Income before equity in undistributed income (loss) of subsidiaries
|
18,399
|
|
20,553
|
|
86,561
|
|
|||||
|
Equity in undistributed income (loss) of subsidiaries:
|
|||||||||||
|
Bank
|
32,144
|
|
23,541
|
|
(67,056
|
)
|
|||||
|
Non-banks
|
—
|
|
—
|
|
—
|
|
|||||
|
Net income
|
$
|
50,543
|
|
$
|
44,094
|
|
$
|
19,505
|
|
||
|
(Dollars in thousands)
|
For the Years Ended December 31,
|
||||||||||
|
Statements of Cash Flows
|
2018
|
2017
|
2016
|
||||||||
|
Cash flows from operating activities:
|
|||||||||||
|
Net income
|
$
|
50,543
|
|
$
|
44,094
|
|
$
|
19,505
|
|
||
|
Adjustments to reconcile net income to net cash provided by operating activities:
|
|||||||||||
|
Equity in undistributed net (income) loss of subsidiaries
|
(32,144
|
)
|
(23,541
|
)
|
67,056
|
|
|||||
|
Net gain on sales of securities
|
—
|
|
(3
|
)
|
(23
|
)
|
|||||
|
Bank owned life insurance income (expense)
|
109
|
|
(343
|
)
|
(182
|
)
|
|||||
|
Depreciation of premises and equipment
|
386
|
|
387
|
|
339
|
|
|||||
|
Stock based compensation
|
2,557
|
|
3,166
|
|
2,084
|
|
|||||
|
Contributions to pension and other postretirement benefit plans
|
(3,264
|
)
|
(2,295
|
)
|
(2,261
|
)
|
|||||
|
Decrease (increase) in other assets
|
14,205
|
|
(3,384
|
)
|
1,098
|
|
|||||
|
Increase in other liabilities
|
(865
|
)
|
4,101
|
|
213
|
|
|||||
|
Net cash provided by operating activities
|
31,527
|
|
22,182
|
|
87,829
|
|
|||||
|
Cash flow from investing activities:
|
|||||||||||
|
Investments in subsidiaries
|
—
|
|
—
|
|
(40,000
|
)
|
|||||
|
Proceeds from sales of securities
|
—
|
|
3
|
|
38
|
|
|||||
|
Outlays for business acquisitions
|
—
|
|
—
|
|
(87,683
|
)
|
|||||
|
Proceeds from bank owned life insurance
|
—
|
|
183
|
|
—
|
|
|||||
|
Other, net
|
(188
|
)
|
(364
|
)
|
(1,619
|
)
|
|||||
|
Net cash used in investing activities
|
(188
|
)
|
(178
|
)
|
(129,264
|
)
|
|||||
|
Cash flows from financing activities:
|
|||||||||||
|
Net decrease in short-term borrowings
|
—
|
|
—
|
|
(253
|
)
|
|||||
|
Proceeds from issuance of subordinated notes
|
—
|
|
—
|
|
44,515
|
|
|||||
|
Purchases of treasury stock
|
(5,984
|
)
|
(3,519
|
)
|
(8,359
|
)
|
|||||
|
Proceeds from public offering of common stock
|
—
|
|
70,501
|
|
—
|
|
|||||
|
Stock issued under dividend reinvestment and employee stock purchase plans
|
2,295
|
|
2,413
|
|
2,472
|
|
|||||
|
Proceeds from exercise of stock options
|
1,131
|
|
1,676
|
|
4,968
|
|
|||||
|
Cash dividends paid
|
(23,495
|
)
|
(21,299
|
)
|
(17,024
|
)
|
|||||
|
Net cash (used) provided by financing activities
|
(26,053
|
)
|
49,772
|
|
26,319
|
|
|||||
|
Net increase (decrease) in cash and due from financial institutions
|
5,286
|
|
71,776
|
|
(15,116
|
)
|
|||||
|
Cash and cash equivalents at beginning of year
|
73,756
|
|
1,980
|
|
17,096
|
|
|||||
|
Cash and cash equivalents at end of year
|
$
|
79,042
|
|
$
|
73,756
|
|
$
|
1,980
|
|
||
|
Supplemental disclosures of cash flow information:
|
|||||||||||
|
Cash paid during the year for:
|
|||||||||||
|
Interest
|
$
|
4,800
|
|
$
|
4,800
|
|
$
|
3,956
|
|
||
|
Income tax, net of refunds received
|
643
|
|
11,600
|
|
6,675
|
|
|||||
|
109
|
Note 25. Quarterly Financial Data (Unaudited)
The unaudited results of operations for the quarters for the years ended
December 31, 2018
and
2017
were as follows:
|
(Dollars and shares in thousands)
|
|||||||||||||||
|
2018 Quarterly Financial Data:
|
Fourth
|
Third
|
Second
|
First
|
|||||||||||
|
Interest income
|
$
|
51,239
|
|
$
|
49,255
|
|
$
|
46,460
|
|
$
|
43,534
|
|
|||
|
Interest expense
|
9,862
|
|
8,832
|
|
7,470
|
|
6,262
|
|
|||||||
|
Net interest income
|
41,377
|
|
40,423
|
|
38,990
|
|
37,272
|
|
|||||||
|
Provision for loan and lease losses
|
103
|
|
2,745
|
|
15,409
|
|
2,053
|
|
|||||||
|
Net interest income after provision for loan and lease losses
|
41,274
|
|
37,678
|
|
23,581
|
|
35,219
|
|
|||||||
|
Noninterest income
|
14,416
|
|
14,861
|
|
15,314
|
|
15,582
|
|
|||||||
|
Noninterest expense
|
33,396
|
|
34,371
|
|
34,347
|
|
35,125
|
|
|||||||
|
Income before income taxes
|
22,294
|
|
18,168
|
|
4,548
|
|
15,676
|
|
|||||||
|
Income taxes
|
3,922
|
|
3,204
|
|
191
|
|
2,826
|
|
|||||||
|
Net income
|
$
|
18,372
|
|
$
|
14,964
|
|
$
|
4,357
|
|
$
|
12,850
|
|
|||
|
Per share data:
|
|||||||||||||||
|
Weighted average shares outstanding - basic earnings per share
|
29,161
|
|
29,232
|
|
29,176
|
|
29,140
|
|
|||||||
|
Weighted average shares outstanding - diluted earnings per share
|
29,220
|
|
29,318
|
|
29,271
|
|
29,234
|
|
|||||||
|
|
|||||||||||||||
|
Basic earnings per share
|
$
|
0.63
|
|
$
|
0.51
|
|
$
|
0.15
|
|
$
|
0.44
|
|
|||
|
Diluted earnings per share
|
$
|
0.63
|
|
$
|
0.51
|
|
$
|
0.15
|
|
$
|
0.44
|
|
|||
|
Dividends per share
|
$
|
0.20
|
|
$
|
0.20
|
|
$
|
0.20
|
|
$
|
0.20
|
|
|||
The financial results for the fourth quarter of 2018 included a loan recovery of
$1.8 million
(after-tax recovery of
$1.5 million
) which represented
$0.05
diluted earnings per share. This recovery related to a loan the Corporation previously charged-off in the amount of
$12.7 million
(after-tax charge of
$10.1 million
), or
$0.34
diluted earnings per share, in the second quarter of 2018.
|
2017 Quarterly Financial Data:
|
Fourth
|
Third
|
Second
|
First
|
|||||||||||
|
Interest income
|
$
|
42,417
|
|
$
|
42,172
|
|
$
|
40,030
|
|
$
|
38,396
|
|
|||
|
Interest expense
|
5,711
|
|
5,285
|
|
4,730
|
|
4,113
|
|
|||||||
|
Net interest income
|
36,706
|
|
36,887
|
|
35,300
|
|
34,283
|
|
|||||||
|
Provision for loan and lease losses
|
1,992
|
|
2,689
|
|
2,766
|
|
2,445
|
|
|||||||
|
Net interest income after provision for loan and lease losses
|
34,714
|
|
34,198
|
|
32,534
|
|
31,838
|
|
|||||||
|
Noninterest income
|
14,152
|
|
14,109
|
|
16,009
|
|
14,970
|
|
|||||||
|
Noninterest expense
|
33,440
|
|
32,695
|
|
32,548
|
|
32,030
|
|
|||||||
|
Income before income taxes
|
15,426
|
|
15,612
|
|
15,995
|
|
14,778
|
|
|||||||
|
Income taxes
|
5,162
|
|
4,416
|
|
4,217
|
|
3,922
|
|
|||||||
|
Net income
|
$
|
10,264
|
|
$
|
11,196
|
|
$
|
11,778
|
|
$
|
10,856
|
|
|||
|
Per share data:
|
|||||||||||||||
|
Weighted average shares outstanding - basic earnings per share
|
27,254
|
|
26,437
|
|
26,380
|
|
26,345
|
|
|||||||
|
Weighted average shares outstanding - diluted earnings per share
|
27,356
|
|
26,542
|
|
26,477
|
|
26,448
|
|
|||||||
|
Basic earnings per share
|
$
|
0.37
|
|
$
|
0.42
|
|
$
|
0.44
|
|
$
|
0.41
|
|
|||
|
Diluted earnings per share
|
$
|
0.37
|
|
$
|
0.42
|
|
$
|
0.44
|
|
$
|
0.41
|
|
|||
|
Dividends per share
|
$
|
0.20
|
|
$
|
0.20
|
|
$
|
0.20
|
|
$
|
0.20
|
|
|||
The financial results for the fourth quarter of 2017 included a revaluation of the Corporation's net deferred tax asset associated with the passage of the TCJA. The revaluation, which was recorded as additional income tax expense, was
$1.1 million
, or
$0.04
diluted earnings per share.
|
110
|
|
Item 9.
|
Changes in and Disagreements with Accountants on Accounting and Financial Disclosure
|
None.
|
Item 9A.
|
Controls and Procedures
|
Disclosure Controls and Procedures
Management is responsible for the disclosure controls and procedures of the Corporation. Disclosure controls and procedures are controls and other procedures of an issuer that are designed to ensure that information required to be disclosed by the issuer in the reports that it files or submits under the Securities Exchange Act of 1934 is recorded, processed, summarized and reported within the time periods required by the SEC’s rules and forms. Disclosure controls and procedures include, without limitation, controls and procedures designed to ensure that information required to be so disclosed by an issuer is accumulated and communicated to the issuer’s management, including its principal executive and principal financial officers, or persons performing similar functions, as appropriate to allow timely decisions regarding required disclosure. As of the end of the period covered by this report, an evaluation was performed under the supervision and with the participation of the Corporation’s management, including the Chief Executive Officer (Principal Executive Officer) and Chief Financial Officer (Principal Financial and Accounting Officer), of the effectiveness of the design and operation of the Corporation’s disclosure controls and procedures. Based on that evaluation, the Corporation’s Chief Executive Officer and Chief Financial Officer concluded that the disclosure controls and procedures were effective as of
December 31, 2018
.
Management's Report on Internal Control over Financial Reporting
The management of the Univest Financial Corporation (the Corporation) is responsible for establishing and maintaining adequate internal control over financial reporting. The Corporation’s internal control system is designed to provide reasonable assurance regarding the reliability of financial reporting and the preparation of financial statements for external purposes in accordance with U.S. generally accepted accounting principles.
Because of its inherent limitations, internal control over financial reporting may not prevent or detect misstatements. Also, projections of any evaluation of effectiveness to future periods are subject to the risk that controls may become inadequate because of changes in conditions, or that the degree of compliance with the policies or procedures may deteriorate.
Management assessed the effectiveness of the Corporation’s internal control over financial reporting as of
December 31, 2018
, using the criteria set forth in
Internal Control - Integrated Framework
, published by the Committee of Sponsoring Organizations of the Treadway Commission (COSO) in 2013. Based on this assessment, management concluded that, as of
December 31, 2018
, the Corporation’s internal control over financial reporting is effective based on those criteria.
KPMG LLP, an independent registered public accounting firm, has audited the Corporation’s consolidated financial statements as of and for the year ended
December 31, 2018
and the effectiveness of the Corporation’s internal control over financial reporting as of
December 31, 2018
, as stated in their reports, which are included herein.
Changes in Internal Control Over Financial Reporting
There were no changes in the Corporation's internal control over financial reporting (as defined in Rule 13a-15(f)) during the quarter ended
December 31, 2018
that materially affected, or are reasonably likely to materially affect, the Corporation’s internal control over financial reporting.
|
111
|
Report of Independent Registered Public Accounting Firm
To the Shareholders and Board of Directors
Univest Financial Corporation:
Opinion on Internal Control Over Financial Reporting
We have audited Univest Financial Corporation and subsidiaries’ (the Company) internal control over financial reporting as of December 31, 2018 based on criteria established in
Internal Control - Integrated Framework (2013)
issued by the Committee of Sponsoring Organizations of the Treadway Commission. In our opinion, the Company maintained, in all material respects, effective internal control over financial reporting as of December 31, 2018, based on criteria established in
Internal Control - Integrated Framework (2013)
issued by the Committee of Sponsoring Organizations of the Treadway Commission.
We also have audited, in accordance with the standards of the Public Company Accounting Oversight Board (United States) (PCAOB), the consolidated balance sheets of the Company as of December 31, 2018 and 2017, the related consolidated statements of income, comprehensive income, changes in shareholders’ equity, and cash flows for each of the years in the three-year period ended December 31, 2018, and the related notes (collectively, the consolidated financial statements), and our report dated February 28, 2019 expressed an unqualified opinion on those consolidated financial statements.
Basis for Opinion
The Company’s management is responsible for maintaining effective internal control over financial reporting and for its assessment of the effectiveness of internal control over financial reporting, included in the accompanying
Management’s Report on Internal Control Over Financial Reporting
. Our responsibility is to express an opinion on the Company’s internal control over financial reporting based on our audit. We are a public accounting firm registered with the PCAOB and are required to be independent with respect to the Company in accordance with the U.S. federal securities laws and the applicable rules and regulations of the Securities and Exchange Commission and the PCAOB.
We conducted our audit in accordance with the standards of the PCAOB. Those standards require that we plan and perform the audit to obtain reasonable assurance about whether effective internal control over financial reporting was maintained in all material respects. Our audit of internal control over financial reporting included obtaining an understanding of internal control over financial reporting, assessing the risk that a material weakness exists, and testing and evaluating the design and operating effectiveness of internal control based on the assessed risk. Our audit also included performing such other procedures as we considered necessary in the circumstances. We believe that our audit provides a reasonable basis for our opinion.
Definition and Limitations of Internal Control Over Financial Reporting
A company’s internal control over financial reporting is a process designed to provide reasonable assurance regarding the reliability of financial reporting and the preparation of financial statements for external purposes in accordance with generally accepted accounting principles. A company’s internal control over financial reporting includes those policies and procedures that (1) pertain to the maintenance of records that, in reasonable detail, accurately and fairly reflect the transactions and dispositions of the assets of the company; (2) provide reasonable assurance that transactions are recorded as necessary to permit preparation of financial statements in accordance with generally accepted accounting principles, and that receipts and expenditures of the company are being made only in accordance with authorizations of management and directors of the company; and (3) provide reasonable assurance regarding prevention or timely detection of unauthorized acquisition, use, or disposition of the company’s assets that could have a material effect on the financial statements.
Because of its inherent limitations, internal control over financial reporting may not prevent or detect misstatements. Also, projections of any evaluation of effectiveness to future periods are subject to the risk that controls may become inadequate because of changes in conditions, or that the degree of compliance with the policies or procedures may deteriorate.
Philadelphia, Pennsylvania
February 28, 2019
|
112
|
|
Item 9B.
|
Other Information
|
None.
PART III
|
Item 10.
|
Directors, Executive Officers and Corporate Governance
|
Information required by Items 401, 405, 406 and 407(c)(3), (d)(4) and (d)(5), of Regulation S-K is incorporated herein by reference from the Corporation’s definitive proxy statement on Schedule 14A for the annual meeting of shareholders on
April 16, 2019
(
2019
Proxy), under the headings: “Election of Directors,” “Section 16(a) Beneficial Ownership Reporting Compliance,” “The Board, the Board’s Committees and Their Functions,” “Audit Committee,” “Code of Conduct,” and “Nominating and Governance Committee of the Board.”
The Corporation maintains in effect a Code of Conduct for Directors and a Code of Conduct for all officers and employees, which includes the CEO and senior financial officers. The codes of conduct are available on the Corporation’s website. The Corporation’s website also includes the charters for its audit committee, compensation committee, and nominating and governance committee as well as its corporate governance principles. These documents are located on the Corporation’s website at
www.univest.net
under “Investors Relations” in Governance Documents and are also available to any person without charge by sending a request to the Corporate Secretary at Univest Financial Corporation, P. O. Box 197, Souderton, PA 18964.
|
Item 11.
|
Executive Compensation
|
Information required by Item 402 and paragraphs (e)(4) and (e)(5) of Item 407 of Regulation S-K is incorporated herein by reference from the Corporation’s
2019
Proxy under the headings: “The Board, the Board’s Committees and Their Functions,” “Executive Compensation,” “Director Compensation,” “Compensation Committee Interlocks and Insider Participation,” and "Compensation Committee Report."
|
Item 12.
|
Security Ownership of Certain Beneficial Owners and Management and Related Stockholder Matters
|
Information required by Item 403 of Regulation S-K is incorporated herein by reference from the Corporation’s
2019
Proxy under the heading, “Security Ownership of Certain Beneficial Owners and Management."
Equity Compensation Plan Information
The Corporation has a shareholder approved Amended and Restated Univest 2013 Long-Term Incentive Plan (LTIP). Under the LTIP, the Corporation may grant options and share awards to employees and non-employee directors up to
3,698,974
shares of common stock, which includes
330,625
shares as a result of the Corporation's common stock issuance in 2017,
857,191
shares as a result of the completion of the acquisition of Fox Chase in 2016 and
473,483
shares as a result of the completion of the acquisition of Valley Green Bank in 2015. The number of shares of common stock available for issuance under the plan is subject to adjustment, as described in the plan. This includes, in the event of any merger, reorganization, consolidation, recapitalization, stock dividend, or other change in corporate structure affecting the stock, substitution or adjustment shall be made in the aggregate number of shares reserved for issuance under the plan, in the number and option price of shares subject to outstanding options granted under the plan and in the number and price of shares subject to other awards, as described in the plan.
The following table sets forth information regarding outstanding options and shares under equity compensation plans at
December 31, 2018
:
|
(a)
|
(b)
|
(c)
|
|||||||
|
Plan Category
|
Number of Securities to be Issued Upon Exercise of Outstanding Options, Warrants and Rights
|
Weighted-Average Exercise Price of Outstanding Options, Warrants and Rights
|
Number of Securities Remaining Available for Future Issuance Under Equity Compensation Plans (Excluding Securities Reflected in Column (a))
|
||||||
|
Equity compensation plan approved by security holders
|
597,405
|
|
$
|
23.98
|
|
2,631,983
|
|
||
|
Equity compensation plan not approved by security holders
|
—
|
|
—
|
|
—
|
|
|||
|
Total
|
597,405
|
|
$
|
23.98
|
|
2,631,983
|
|
||
|
113
|
|
Item 13.
|
Certain Relationships and Related Transactions, and Director Independence
|
Information required by Items 404 and 407(a) of Regulation S-K is incorporated herein by reference from the Corporation’s
2019
Proxy under the headings, “The Board, the Board’s Committees and Their Functions” and “Related Party Transactions.”
|
Item 14.
|
Principal Accounting Fees and Services
|
Information required by Item 9(e) of Schedule 14A is incorporated herein by reference from the Corporation’s
2019
Proxy under the headings: “Audit Committee” and “Independent Registered Public Accounting Firm Fees.”
PART IV
|
Item 15.
|
Exhibits and Financial Statement Schedules
|
|
(a)
|
1. & 2. Financial Statements and Schedules
|
|
The financial statements listed in the accompanying index to financial statements are filed as part of this annual report.
|
|
|
3. Listing of Exhibits
|
|
|
The exhibits listed on the accompanying index to exhibits are filed as part of this annual report.
|
|
|
(b)
|
Exhibits - The response to this portion of Item 15 is submitted as separate section.
|
|
(c)
|
Financial Statements Schedules - none.
|
|
114
|
UNIVEST FINANCIAL CORPORATION AND SUBSIDIARIES
INDEX TO FINANCIAL STATEMENTS AND FINANCIAL STATEMENTS SCHEDULES
[Item 15(a) 1. & 2.]
Annual Report of Shareholders
|
Page
|
|
Certain financial statement schedules are omitted since the required information is not present or is not present in amounts sufficient to require submission of the schedule, or because the information required is included in the financial statements and notes thereto.
|
115
|
UNIVEST FINANCIAL CORPORATION AND SUBSIDIARIES
INDEX OF EXHIBITS
[Item 15(a) 3. & 15(b)]
Description
|
(3.1)
|
||
|
(3.2)
|
||
|
(4.1)*
|
||
|
(4.2)*
|
||
|
(10.1)*
|
||
|
(10.2)*
|
||
|
(10.3)*
|
||
|
(10.4)*
|
||
|
(10.5)*
|
||
|
(21)
|
||
|
(23.1)
|
||
|
(31.1)
|
||
|
(31.2)
|
||
|
(32.1)**
|
||
|
(32.2)**
|
||
|
Exhibit 101.INS
|
XBRL Instance Document
|
|
|
Exhibit 101.SCH
|
XBRL Taxonomy Extension Schema Document
|
|
|
Exhibit 101.CAL
|
XBRL Taxonomy Extension Calculation Linkbase Document
|
|
|
Exhibit 101.LAB
|
XBRL Taxonomy Extension Label Linkbase Document
|
|
|
Exhibit 101.PRE
|
XBRL Taxonomy Extension Presentation Linkbase Document
|
|
|
Exhibit 101.DEF
|
XBRL Taxonomy Extension Definition Linkbase Document
|
|
* Denotes a compensatory plan or agreement.
** A certification furnished pursuant to this item will not be deemed "filed" for purposes of Section 18 of the Exchange Act (15 S.C. 78r), or otherwise subject to the liability of that section. Such certification will not be deemed to be incorporated by reference into any filing under the Securities Act or the Exchange Act.
|
Item 16.
|
Form 10-K Summary
|
None.
|
116
|
SIGNATURES
Pursuant to the requirements of Section 13 or 15(d) of the Securities Exchange Act of 1934, the registrant has duly caused this Annual Report to be signed on its behalf by the undersigned, thereunto duly authorized.
|
UNIVEST FINANCIAL CORPORATION
|
|
|
Registrant
|
|
|
By: /s/ Roger S. Deacon
|
|
|
Roger S. Deacon
Senior Executive Vice President and Chief Financial Officer
(Principal Financial and Accounting Officer)
|
|
|
February 28, 2019
|
|
Pursuant to the requirements of the Securities Exchange Act of 1934, this report has been signed below by the following persons on behalf of the registrant and in the capacities and on the dates indicated:
|
Signature
|
Title
|
Date
|
|
/s/ WILLIAM S. AICHELE
William S. Aichele
|
Chairman and Director
|
February 28, 2019
|
|
/s/ JEFFREY M. SCHWEITZER
Jeffrey M. Schweitzer
|
President, Chief Executive Officer
and Director
(Principal Executive Officer)
|
February 28, 2019
|
|
/s/ ROGER H. BALLOU
Roger H. Ballou
|
Director
|
February 28, 2019
|
|
/s/ TODD S. BENNING
Todd S. Benning |
Director
|
February 28, 2019
|
|
/s/ GLENN E. MOYER
Glenn E. Moyer
|
Director
|
February 28, 2019
|
|
/s/ K. LEON MOYER
K. Leon Moyer
|
Director
|
February 28, 2019
|
|
/s/
NATALYE PAQUIN
Natalye Paquin |
Director
|
February 28, 2019
|
|
/s/ THOMAS M. PETRO
Thomas M. Petro |
Director
|
February 28, 2019
|
|
/s/ MICHAEL L. TURNER
Michael L. Turner
|
Director
|
February 28, 2019
|
|
/s/ ROBERT C. WONDERLING
Robert C. Wonderling
|
Director
|
February 28, 2019
|
|
/s/ CHARLES H. ZIMMERMAN III
Charles H. Zimmerman III |
Director
|
February 28, 2019
|
|
117
|
TABLE OF CONTENTS
Part IItem 1. BusinessItem 1A. Risk FactorsItem 1B. Unresolved Staff CommentsItem 2. PropertiesItem 3. Legal ProceedingsItem 4. Mine Safety DisclosuresPart IIItem 5. Market For The Registrant's Common Equity, Related Stockholder Matters and Issuer Purchases Of Equity SecuritiesItem 6. Selected Financial DataItem 7. Management S Discussion and Analysis Of Financial Condition and Results Of OperationsItem 7A. Quantitative and Qualitative Disclosures About Market RiskItem 8. Financial Statements and Supplementary DataNote 1. Summary Of Significant Accounting PoliciesNote 2. Earnings Per ShareNote 3. Restrictions on Cash and Due From Banks and Interest-earning Deposit AccountsNote 4. Investment SecuritiesNote 5. Loans and LeasesNote 6. Premises and EquipmentNote 7. Goodwill and Other Intangible AssetsNote 8. Accrued Interest Receivable and Other AssetsNote 9. DepositsNote 10. BorrowingsNote 11. Income TaxesNote 12. Retirement Plans and Other Postretirement BenefitsNote 13. Stock-based Incentive PlanNote 14. Accumulated Other Comprehensive LossNote 15. Commitments and ContingenciesNote 16. Derivative Instruments and Hedging ActivitiesNote 17. Fair Value DisclosuresNote 18. Restructuring ChargesNote 19. Share Repurchase PlanNote 20. Regulatory MattersNote 21. Related Party TransactionsNote 22. Segment ReportingNote 23. Revenue From Contracts with CustomersNote 24. Condensed Financial Information - Parent Company OnlyNote 25. Quarterly Financial Data (unaudited)Item 9. Changes in and Disagreements with Accountants on Accounting and Financial DisclosureItem 9A. Controls and ProceduresItem 9B. Other InformationPart IIIItem 10. Directors, Executive Officers and Corporate GovernanceItem 11. Executive CompensationItem 12. Security Ownership Of Certain Beneficial Owners and Management and Related Stockholder MattersItem 13. Certain Relationships and Related Transactions, and Director IndependenceItem 14. Principal Accounting Fees and ServicesPart IVItem 15. Exhibits and Financial Statement SchedulesItem 16. Form 10-k Summary