UNIVEST FINANCIAL CORP
10-Ks and 10-Qs
|
|
|
|
|
|
|
|
|
|
|
|
|
|
|
|
|
|
|
|
|
|
|
|
|
|
|
|
|
|
|
|
|
|
|
|
|
|
|
|
|
|
|
|
|
|
|
|
|
|
|
|
|
|
|
|
UNITED STATES
SECURITIES AND EXCHANGE COMMISSION
Washington, D.C. 20549
Form
10-K
ANNUAL REPORT PURSUANT TO SECTION 13 OR 15(d) OF
THE SECURITIES EXCHANGE ACT OF 1934
For the fiscal year ended
December 31
, 2022
Commission File number
0-7617
(Exact name of registrant as specified in its charter)
|
|
|
|||||||
| (State or other jurisdiction of incorporation or organization) | (IRS Employer Identification No.) | |||||||
(Address of principal executive offices) (Zip code)
Registrant's telephone number, including area code: (215)
721-2400
| Securities registered pursuant to Section 12(b) of the Act: | ||||||||
| Title of class | Trading symbol | Name of each exchange on which registered | ||||||
|
|
|
|
||||||
Securities registered pursuant to Section 12(g) of the Act: None
Indicate by check mark if the registrant is a well-known seasoned issuer, as defined in Rule 405 of the Securities Act.
Yes
☒
No
☐
Indicate by check mark if the registrant is not required to file reports pursuant to Section 13 or Section 15(d) of the Act. Yes
☐
No
☒
Indicate by check mark whether the registrant (1) has filed all reports required to be filed by Section 13 or 15(d) of the Securities Exchange Act of 1934 during the preceding twelve months (or for such shorter period that the registrant was required to file such reports), and (2) has been subject to such filing requirements for the past 90 days.
Yes
☒
No
☐
Indicate by check mark whether the registrant has submitted electronically every Interactive Data File required to be submitted pursuant to Rule 405 of Regulation S-T during the preceding 12 months (or for such shorter period that the registrant was required to submit such files).
Yes
☒
No
☐
Indicate by check mark whether the registrant is a large accelerated filer, an accelerated filer, a non-accelerated filer, a smaller reporting company, or an emerging growth company. See the definitions of "large accelerated filer," "accelerated filer," "smaller reporting company," and "emerging growth company" in Rule 12b-2 of the Exchange Act.
|
|
☒ |
Accelerated filer
|
☐
|
||||||||
|
Non-accelerated filer
|
☐ | Smaller reporting company |
|
||||||||
| Emerging growth company |
|
||||||||||
| If an emerging growth company, indicate by check mark if the registrant has elected not to use the extended transition period for complying with any new or revised financial accounting standards provided pursuant to Section 13(a) of the Exchange Act. |
☐
|
||||||||||
Indicate by check mark whether the registrant has filed a report on and attestation to its management's assessment of the effectiveness of its internal control over financial reporting under Section 404(b) of the Sarbanes-Oxley Act (15 U.S.C. 7262(b)) by the registered public accounting firm that prepared or issued its audit report. Yes
☒
No
☐
If securities are registered pursuant to Section 12(b) of the Act, indicated by check mark whether the financial statements of the registrant included in the filing reflect the correction of an error to previously issued financial statements.
☐
Indicate by check mark whether any of those error corrections are restatements that required a recovery analysis of incentive-based compensation received by any of the registrant's executive officers during the relevant recovery period pursuant to § 240.10D-1(b).
☐
Indicate by check mark whether the registrant is a shell company (as defined in Rule 12b-2 of the Exchange Act). Yes
☐
No
☒
The approximate aggregate market value of voting stock held by non-affiliates of the registrant is $
734,239,958
as of June 30, 2022 based on the June 30, 2022 closing price of the Registrant's Common Stock of $25.44 per share.
Indicate the number of shares outstanding of each of the issuer’s classes of common stock, as of the latest practicable date.
| Common Stock, $5 par value |
|
|||||||
| (Title of Class) | (Number of shares outstanding at February 10, 2023) | |||||||
DOCUMENTS INCORPORATED BY REFERENCE
Part III incorporates information by reference from the proxy statement for the annual meeting of shareholders on April 26, 2023.
UNIVEST FINANCIAL CORPORATION AND SUBSIDIARIES
TABLE OF CONTENTS
| PART I | ||||||||
| Item 1. | ||||||||
| Item 1A. | ||||||||
| Item 1B. | ||||||||
| Item 2. | ||||||||
| Item 3. | ||||||||
| Item 4. | ||||||||
| PART II | ||||||||
| Item 5. | ||||||||
| Item 6. | ||||||||
| Item 7. | ||||||||
| Item 7A. | ||||||||
| Item 8. | ||||||||
| Item 9. | ||||||||
| Item 9A. | ||||||||
| Item 9B. | ||||||||
| Item 9C. | ||||||||
| PART III | ||||||||
| Item 10. | ||||||||
| Item 11. | ||||||||
| Item 12. | ||||||||
| Item 13. | ||||||||
| Item 14. | ||||||||
| PART IV | ||||||||
| Item 15. | ||||||||
| Item 16. | ||||||||
1
PART I
Forward-Looking Statements
The information contained in this report may contain forward-looking statements. When used or incorporated by reference in disclosure documents, the words "believe," "anticipate," "estimate," "expect," "project," "target," "goal" and similar expressions are intended to identify forward-looking statements within the meaning of Section 27A of the Securities Act of 1933 and Section 21E of the Securities Exchange Act of 1934. These forward-looking statements may include, but are not limited to: statements of our goals, intentions and expectations; statements regarding our business plans, prospects, growth and operating strategies; statements regarding the quality of our loan and investment portfolios; and estimates of our risks and future costs and benefits. These forward-looking statements are based on current beliefs and expectations of our management and are subject to significant business, economic and competitive uncertainties and contingencies, many of which are beyond our control. In addition, these forward-looking statements are subject to assumptions with respect to future business strategies and decisions that are subject to change. Certain of these risks, uncertainties and assumptions are set forth below as well as the risk factors described in Item 1A. "Risk Factors":
•
Operating, legal and regulatory risks;
•
Economic, political and competitive forces;
•
General economic conditions, either nationally or in our market areas, that are worse than expected included as a result of employment levels and labor shortages, and the effect of inflation, a potential recession or slowed economic growth caused by supply chain disruptions or otherwise;
•
Legislative, regulatory and accounting changes;
•
Monetary and fiscal policies of the U.S. government, including policies of the U.S. Treasury and the Board of Governors of the Federal Reserve System;
•
Demand for our financial products and services in our market area;
•
Major catastrophes such as earthquakes, floods or other natural or human disasters and infectious disease outbreaks, including the current coronavirus (COVID-19) pandemic, the related disruption to local, regional and global economic activity and financial markets, and the impact that any of the foregoing may have on us and our customers and other constituencies;
•
Inflation or volatility in interest rates that reduce our margins and yields, the fair value of financial instruments or our level of loan originations or prepayments on loans we have made and make;
•
Fluctuations in real estate values in our market area;
•
The composition and credit quality of our loan and investment portfolios;
•
Changes in the level and direction of loan delinquencies, classified and criticized loans and charge-offs and changes in estimates of the adequacy of the allowance for credit losses;
•
Changes in the economic assumptions utilized to calculate the allowance for credit losses;
•
Our ability to access cost-effective funding;
•
Our ability to implement our business strategies;
•
Our ability to manage market risk, credit risk and operational risk;
•
Timing and amount of revenue and expenditures;
•
Adverse changes in the securities markets;
•
The impact of any military conflict, terrorist act or other geopolitical acts;
•
Our ability to enter new markets successfully and capitalize on growth opportunities;
•
Competition for loans, deposits and employees;
•
System failures or cyber-security breaches of our information technology infrastructure and those of our third-party service providers;
•
The failure to maintain current technologies and/or to successfully implement future information technology enhancements;
•
Our ability to retain key employees;
•
Other risks and uncertainties, including those occurring in the U.S. and world financial systems; and
•
The risk that our analysis of these risks and forces could be incorrect and/or that the strategies developed to address them could be unsuccessful.
Should one or more of these risks or uncertainties materialize, or should underlying assumptions prove incorrect, actual results may vary materially from those anticipated, estimated, expected or projected. These forward-looking statements speak only as of the date of the report. Univest Financial Corporation (the Corporation) expressly disclaims any obligation to publicly release any updates or revisions to reflect any change in the Corporation's expectations with regard to any change in events, conditions or circumstances on which any such statement is based.
2
Item 1.
Business
General
The Corporation is a Pennsylvania corporation, organized in 1973, and registered as a bank holding company pursuant to the Bank Holding Company Act of 1956. The Corporation owns all of the capital stock of Univest Bank and Trust Co. (the Bank). The consolidated financial statements include the accounts of the Corporation and its wholly owned subsidiary, the Bank. The Corporation's and the Bank's headquarters are located at 14 North Main Street, Souderton, Pennsylvania 18964. At December 31, 2022, the Corporation had total assets of $7.2 billion, net loans and leases of $6.0 billion, total deposits of $5.9 billion and total shareholders' equity of $776.5 million.
The Bank is a Pennsylvania state-chartered bank and trust company. As a state-chartered member bank of the Federal Reserve System, the Bank is regulated primarily by the Pennsylvania Department of Banking and Securities and the Federal Reserve Bank of Philadelphia.
The Bank is engaged in domestic banking services for individuals, businesses, municipalities and non-profit organizations. Through its wholly-owned subsidiaries, the Bank provides a variety of financial services throughout its markets of operation. The Bank is the parent company of Girard Investment Services, LLC, a full-service registered introducing broker-dealer and a licensed insurance agency, Girard Advisory Services, LLC, a registered investment advisory firm and Girard Pension Services, LLC, a registered investment advisor, which provides investment consulting and management services to municipal entities. Girard Investments is headquartered in Souderton, Pennsylvania and Girard Advisory Services is headquartered in King of Prussia, Pennsylvania. The Bank is also the parent company of Univest Capital, Inc., an equipment financing business headquartered in Warminster, Pennsylvania, and Univest Insurance, LLC, an independent insurance agency headquartered in Lansdale, Pennsylvania.
Market Area
The Corporation's headquarters and main office is located in Souderton, Montgomery County, Pennsylvania, which is located in Southeastern Pennsylvania, approximately thirty-five miles north of Philadelphia. The Corporation provides banking and financial services to customers in 13 counties in the Southeastern and Central regions of Pennsylvania, three counties in New Jersey and we recently expanded into Western Pennsylvania and Maryland. The highest concentration of our deposits and loans are in Montgomery, Bucks and Philadelphia counties in Pennsylvania where 25 out of our 37 financial centers are located.
The following table details key demographics for our Montgomery, Bucks and Philadelphia markets compared to Pennsylvania and the national average.
| (Most recent available statistics) | Montgomery | Bucks | Philadelphia | Pennsylvania | National | |||||||||||||||||||||||||||
|
Unemployment rate
(1) (2)
|
2.6% | 2.9% | 4.5% | 3.5% | 3.5% | |||||||||||||||||||||||||||
|
Median Household Income
(3)
|
$104,000 | $102,000 | $51,000 | $71,000 | $74,000 | |||||||||||||||||||||||||||
|
Median Age
(3)
|
42 | 45 | 36 | 42 | 39 | |||||||||||||||||||||||||||
|
Population Growth (2010-2023)
(3)
|
8.4% | 3.6% | 3.7% | 2.2% | 8.3% | |||||||||||||||||||||||||||
(1) S&P Global - U.S. Department of Labor - Montgomery, Bucks, Philadelphia, & Pennsylvania unemployment rates are as of December 2022. Pennsylvania unemployment rate is not seasonally adjusted
(2) Bureau of Labor Statistics - National unemployment rates are as of December 2022, seasonally adjusted
(3) S&P Global - Demographic data is provided by Claritas based primarily on US Census data
Significant types of employment industries for the aforementioned markets include health care and social assistance, professional, scientific and technical services, manufacturing, retail trade, administrative and waste management and remediation services, accommodation and food services and educational services. As of June 30, 2022 (the latest date for which such information is available), the Corporation ranked fifth out of 34 financial institutions in deposit market share in Montgomery County with 12 financial centers, seventh out of 33 financial institutions in Bucks County with nine financial centers, thirteenth out of 40 financial institutions in Philadelphia County with five financial centers with 3.6% of total combined deposit market share in the three counties according to data provided by Federal Deposit Insurance Corporation (FDIC) Market Share Data.
Competition
The Corporation's service areas are characterized by intense competition for banking business among commercial banks,
3
savings institutions and other financial institutions. In competing with other banks, savings institutions and other financial institutions, the Bank seeks to provide personalized services and local decision making through management's knowledge and awareness of its service area, customers and borrowers.
Other competitors, including credit unions, consumer finance companies, insurance companies, wealth management providers, leasing companies, financial technology companies, specialty finance companies, technology companies and mutual funds, compete for certain lending and deposit gathering services and insurance and wealth management services offered by the Bank and its operating segments.
Human Capital Resources
At December 31, 2022, we employed 973 individuals, nearly all of whom are full-time and of which approximately 58% are women. None of these employees are covered by collective bargaining agreements, and the Corporation believes it enjoys good relations with its personnel. As an integrated full-service financial institution, approximately 66% of our employees are employed through our banking segment, 8% through our wealth management business, 11% through our insurance business and the remaining 15% of our employees serve in shared support functions for each of our three segments. The Corporation is a community- and employee-centric organization that puts our core values of tradition, integrity, excellence, community and spirituality into action while delivering an excellent customer experience. With a Mission Statement that challenges us to be a strong leader in our markets and active in our communities, being a responsible corporate citizen is at the core of how we operate.
Hiring and Promotion
The Corporation seeks to hire well-qualified employees who are also a good fit for our core values. Our selection and promotion processes are without bias and include the active recruitment of minorities and women. We currently source candidates using various methods, including social media, third party search firms, internal referral programs and connections with local schools. Whenever possible, we seek to fill positions by promotion and transfer within the organization. During 2022, we promoted 109 employees. As of December 31, 2022, 29% of our Senior Leadership Team members were women.
Training and Development
The training and development of our employees is a priority. In 2022, we invested more than $564 thousand in tools, training programs and continuing education to help our employees build their knowledge, skills and experience. We provide in-house training to employees on topics including leadership and professional development, cybersecurity, risk and compliance and technology. In addition, as part of "Univest University," we provide several certification programs including a Skill Builder Certification Program, a Supervisor Certification, a Leadership Certification and an Advanced Leadership Certification. These programs include courses that address communication skills, customer service, managing conflict, alternative management styles, business ethics and emotional intelligence. During the year ended December 31, 2022, we provided approximately 17,000 training hours to our employees.
In addition to our internal training efforts, we provide a Tuition Reimbursement Program, in which costs for undergraduate degree, graduate degree, and advanced intensive technical training programs from an accredited college or university are eligible for reimbursement up to $3,500 per year. We offer banking-related classes through the Pennsylvania Bankers Association at no cost to our employees.
Retention
Employee retention helps us operate efficiently and offers continuity to our customers and the community. We believe our commitment to living our core values, actively prioritizing concern for our employees' well-being, supporting our employees' career goals, offering competitive wages and providing valuable benefits aids in retention of our employees. Univest’s annual turnover rate of 19% continues to be well below the industry average of 28% according to the Bureau of Labor Statistics. At December 31, 2022, 17% of our current staff had been with us for 15 years or more.
Safety, Health and Welfare
The safety, health and wellness of our employees is consistently a top priority. We offer our employees financial wellness programs, team health challenges, weight management counseling, and behavioral health webinars to support mental health. We
4
provide our employees with access to the Calm app, which is a highly rated app for sleep, meditation and relaxation, at no cost to our employees.
We also provide our employees with memberships to Care.com to assist employees with finding suitable care for members of their household.
Benefits
On an ongoing basis, we further promote the health and wellness of our employees by strongly encouraging work-life balance. Our benefits package includes health care coverage, retirement benefits, life and disability insurance, wellness programs, paid time off and leave policies. A majority of our employees are offered a hybrid work arrangement (e.g. three days in the office and two days remote per week) which provides flexibility and work-life balance. We provide lower-wage earners with higher insurance subsidies. We also offer an Employee Assistance Program in which employees and members of their families may utilize counseling services freely and confidentially.
Diversity, Equity and Inclusion
Univest is committed to fostering, cultivating and preserving a culture of diversity, equity and inclusion. We embrace and encourage our employees' differences in age, color, disability, ethnicity, family or marital status, gender identity or expression, language, national origin, physical and mental ability, political affiliation, race, religion, sexual orientation, socio-economic status, veteran status, and other characteristics that make our employees unique. Univest's diversity initiatives are applicable, but not limited to: our practices and policies on recruitment and selection; compensation and benefits; professional development and training; promotions; transfers; social and recreational programs; layoffs; terminations; and the ongoing development of a work environment built on the premise of gender and diversity equity that encourages and enforces:
•
Respectful communication and cooperation between all employees;
•
Teamwork and employee participation, fostering representation of all groups and perspectives; and
•
Employer and employee contributions to the communities we serve to promote a greater understanding and respect for diversity.
All employees of Univest have a responsibility to treat others with dignity and respect. All employees are expected to exhibit conduct that reflects inclusion during work, at work functions on or off the work site, and at all other company-sponsored and participative events. All employees are also required to complete annual diversity awareness training to enhance their knowledge to fulfill this responsibility. Our Diversity, Equity and Inclusion (DEI) Committee was established to ensure that our workplace is a supportive environment with equal opportunities for everyone. The DEI Committee reports progress on our Diversity, Equity and Inclusion Strategic Plan to the Board of Directors quarterly. During 2022, the Corporation hired a DEI Manager to cultivate a supportive and inclusive work environment and implement inclusion programs. Regular employee communications, including a DEI newsletter, Univest United, were shared throughout the year to help drive awareness. This newsletter, among other things, serves to spotlight employees and their diverse backgrounds through their own personal stories. The Corporation also employs a DEI liaison is responsible for developing and creating content for the newsletter, as well as participating in local and/or national peer DEI networks and staying current on DEI developments.
Our DEI Learning & Development Committee created learning sessions that serve as a foundation for increasing awareness on diversity, equity and inclusion topics. During 2022, these sessions were attended by members of the Corporation's Board and all employees and facilitated by team members from throughout our organization. This content has been added to new hire orientation to ensure all future employees receive this important information. During 2022, we invested $123 thousand in these DEI initiatives.
Employee Engagement
Our President and Chief Executive Officer communicates with our entire organization on a weekly basis via email. These emails provide updates on key organizational initiatives, such as DEI matters, financial performance, and other focus areas. Additionally, we hold quarterly employee webcasts, during which senior management presents and employees have the opportunity to ask questions.
We continue to recognize employee milestones and acknowledge these achievements with in-person Service Awards that celebrate employees reaching a 5-year milestone. Our employees are also invited to attend holiday socials at locations across our service area.
5
Community Involvement
Our Connecting with Community volunteer initiative is one of the pillars of our philanthropy program. In 2022, we provided our employees with 25 Connecting with Community events to choose from in support of local charitable organizations. In addition to these Connecting with Community opportunities, we encourage our employees to volunteer independently so that they truly bring our community core value to life. In 2022, Univest employees volunteered 12,324 hours. In addition to being generous with their time, our employees also supported our annual fundraiser for the United Way. Through voluntary payroll deductions, Univest employees contributed more than $61 thousand. In 2022, the Corporation partnered with two financial education innovators to provide 4,362 students with access to interactive online courses that educate on critical financial topics, as well as post informative articles and videos on social media channels on financial topics, such as budgeting, saving for retirement and tips for first-time homebuyers. During 2022, the Corporation contributed $2.5 million to non-profit organizations to provide financial support to the communities it serves.
Supervision and Regulation
The financial services industry in the United States, particularly entities that are chartered as banks, is highly regulated by federal and state laws that limit the types of businesses in which banks and their holding companies may engage, and which impose significant operating requirements and limitations on banking entities. This regulatory framework is designed to protect depositors and consumers, the safety and soundness of depository institutions and their holding companies, and the stability of the banking system as a whole. This framework affects the activities and investments of the Corporation and its subsidiaries and gives the regulatory authorities broad discretion in connection with their supervisory, examination and enforcement activities and policies. The discussion below is only a brief summary of some of the significant laws and regulations that affect the Bank and the Corporation, and is not intended to be a complete description of all such laws.
The Bank is subject to supervision and is regularly examined by the Pennsylvania Department of Banking and Securities and the Federal Reserve Bank of Philadelphia. The Bank is also subject to examination by the FDIC. The agencies maintain significant enforcement authority including, but not limited to, the issuance of cease and desist orders and civil money penalties, removal of directors and officers and the appointment of a receiver or conservator for a bank in appropriate circumstances.
The Corporation is subject to the reporting requirements of the Board of Governors of the Federal Reserve System (the Board); and the Corporation, together with its subsidiaries, is subject to examination by the Board. The Federal Reserve Act limits the amount of credit that a member bank may extend to its affiliates, and the amount of its funds that it may invest in or lend on the collateral of the securities of its affiliates. Under the Federal Deposit Insurance Act, insured banks are subject to the same limitations.
Federal Securities Laws
Our common stock is registered with the SEC under Section 12(b) of the Securities Exchange Act of 1934, as amended (the Exchange Act). We are also subject to the proxy rules, tender offer rules, insider trading restrictions, annual and periodic reporting (discussion below), and other requirements of the Exchange Act.
Sarbanes-Oxley Act of 2002
The Corporation is subject to the Sarbanes-Oxley Act of 2002 (SOX). SOX created new standards of corporate governance and imposed additional requirements on the board of directors and management of public companies. SOX also requires that the chief executive officer and chief financial officer certify the accuracy of periodic reports filed with the Securities and Exchange Commission (SEC). Pursuant to Section 404 of SOX (SOX 404), management of the Corporation is required to furnish a report on internal control over financial reporting, identify any material weaknesses in its internal control over financial reporting and assert that such internal controls are effective. The Corporation has continued to be in compliance with SOX 404 during 2022. The Corporation must maintain effective internal controls, which requires an on-going commitment by management and oversight by the Corporation's Audit Committee. The process has and will continue to require substantial resources in both financial costs and human capital.
The USA PATRIOT Act
The USA Patriot Act gives the federal government powers to address terrorist threats through enhanced domestic security measures, expanded surveillance powers, increased information sharing and broadened anti-money laundering requirements. The USA Patriot Act also requires the federal banking agencies to take into consideration the effectiveness of controls designed to combat money-laundering activities in determining whether to approve a merger or other acquisition application of a member
6
institution. Accordingly, if we engage in a merger or other acquisition, our controls designed to combat money laundering would be considered as part of the application process. We have established policies, procedures and systems designed to comply with these regulations.
Capital Rules
The Corporation and the Bank are subject to various regulatory capital requirements administered by the federal banking agencies. The risk-based capital standards applicable to the Corporation and the Bank are based on the current standards of the Basel Committee on Banking Supervision, commonly referred to as Basel III. Under the Basel III rules, the minimum capital to risk-adjusted assets requirements include a common equity Tier 1 capital to risk weighted assets ratio of 4.5% (6.5% to be considered "well capitalized") and a Tier 1 capital to risk weighted assets ratio of 6.0%, (8.0% to be considered "well capitalized") and total capital to risk weighted assets ratio of 8.0% (10.0% to be considered "well capitalized"). The minimum required Tier 1 capital to average assets ratio is 4.0% (5.0% to be considered "well capitalized"). Under current rules, in order to avoid limitations on capital distributions (including dividend payments and certain discretionary bonus payments to executive officers), a banking organization must hold a capital conservation buffer comprised of common equity Tier 1 capital above its minimum risk-based capital requirements in an amount greater than 2.5% of total risk-weighted assets. See Note 21, "Regulatory Matters" included in the Notes to the Consolidated Financial Statements included herein under Item 8 for further discussion.
Federal law requires, among other things, that federal bank regulators take "prompt corrective action" with respect to institutions that do not meet minimum capital requirements.
Corporation as Source of Strength
The Board has issued a policy statement regarding dividends, by bank holding companies. In general, the Board's policies provide that dividends should be paid only out of current earnings and only if the prospective rate of earnings retention by the bank holding company appears consistent with the organization's capital needs, asset quality and overall financial condition. The Board's policies also require that a bank holding company serve as a source of financial strength to its subsidiary banks by standing ready to use available resources to provide adequate capital funds to those banks during periods of financial stress or adversity and by maintaining the financial flexibility and capital-raising capacity to obtain additional resources for assisting its subsidiary banks where necessary. The Dodd-Frank Act codified this policy. The ability of a bank holding company to pay dividends may be restricted if a subsidiary bank becomes undercapitalized or otherwise suffers financial difficulties. In addition, the Board's regulations and guidance require prior notice to the agency of a bank holding company's payment of dividends or repurchase of its stock under certain circumstances. These regulatory policies could affect the ability of the Corporation to pay dividends, repurchase its stock or otherwise engage in capital distributions. The Bank is also subject to limitations and requirements under state and federal law with respect to capital distributions, including payment of dividends to the Corporation.
Wealth Management and Insurance Businesses
The Corporation's wealth management and insurance businesses are subject to additional regulatory requirements. The securities brokerage activities of Girard Investment Services, LLC are subject to regulation by the SEC, the Financial Industry Regulatory Authority and the Securities Investor Protection Corporation. Girard Advisory Services, LLC and Girard Pension Services, LLC are registered investment advisory firms which are subject to regulation by the SEC. Univest Insurance, LLC and Girard Investment Services, LLC are licensed by the Pennsylvania Insurance Department and are subject to its laws and regulations.
Credit and Monetary Policies
The Bank is affected by the fiscal and monetary policies of the federal government and its agencies, including the Federal Reserve Board of Governors. An important function of these policies is to curb inflation and control recessions through control of the supply of money and credit. The Board uses its powers to regulate reserve requirements of member banks, the discount rate on member-bank borrowings, interest rates on time and savings deposits of member banks, and to conduct open-market operations in United States Government securities to exercise control over the supply of money and credit. The policies have a direct effect on the amount of bank loans and deposits and on the interest rates charged on loans and paid on deposits, with the result that the policies have a material effect on bank earnings. Future policies of the Board and other authorities cannot be predicted, nor can their effect on future bank earnings.
The Bank is a member of the Federal Home Loan Bank System (FHLBanks), which consists of 11 regional Federal Home
7
Loan Banks, and is subject to supervision and regulation by the Federal Housing Finance Agency. The FHLBanks provide a central credit facility primarily for member institutions. The Bank, as a member of the Federal Home Loan Bank of Pittsburgh (FHLB), is required to acquire and hold shares of capital stock in the FHLB.
Acquisitions
The Corporation, through its business segments, provide financial solutions to individuals, businesses, municipalities and non-profit organizations. The Corporation prides itself on being a financial organization that continues to increase its scope of services while maintaining a determined commitment to the communities it serves. The Corporation and its subsidiaries have experienced stable growth, both organically and through various acquisitions, to be the best integrated financial solutions provider in the market. The most recent acquisitions include certain assets of the Paul I. Sheaffer Insurance Agency on December 1, 2021, Fox Chase Bancorp on July 1, 2016 and Valley Green Bank on January 1, 2015.
Securities and Exchange Commission Reports
The Corporation makes available free-of-charge its reports that are electronically filed with the SEC including its Report on Form 10-K, Quarterly Reports on Form 10-Q, Current Reports on Form 8-K and amendments to those reports on its website as a hyperlink to the SEC's Electronic Data Gathering, Analysis and Retrieval (EDGAR) system. These reports are available as soon as reasonably practicable after the material is electronically filed. The Corporation's website address is
www.univest.net
. Information included on the Corporation's website is not part of this Annual Report on Form 10-K. The Corporation will provide at no charge a copy of the SEC Form 10-K annual report for the year 2022 to each shareholder who requests one in writing. Requests should be directed to: Megan Duryea Santana, Corporate Secretary, Univest Financial Corporation, P.O. Box 197, Souderton, PA 18964.
The SEC maintains an internet site that contains the Corporation's SEC filings electronically at
www.sec.gov
.
Item 1A.
Risk Factors
An investment in the Corporation's common stock is subject to risks inherent to the Corporation's business. Before making an investment, you should carefully consider the risks and uncertainties described below, together with all of the other information included or incorporated by reference in this report. This report is qualified in its entirety by these risk factors.
Risks Related to Market Interest Rates
The reversal of the historically low interest rate environment may adversely affect our net interest income and profitability.
The FRB decreased benchmark interest rates significantly, to near zero, in response to the COVID-19 pandemic. The FRB has reversed its policy of near zero interest rates given its concerns over inflation. Market interest rates have risen in response to the FRB's rate increases. These policies can thus affect the activities and results of operations of financial institutions. The actions of the FRB influence the rates of interest that we charge on loans and that we pay on borrowings and interest-bearing deposits. Rates of interest can also affect the value of our on-balance sheet and off-balance sheet financial instruments. Thus, the increase in market interest rates may have an adverse effect on our net interest income and profitability.
Our results of operations may be adversely affected by credit losses relating to our investment portfolio.
The Corporation maintains an investment portfolio, including available-for-sale and held-to-maturity securities. We may be required to record future charges to earnings if we determine a decline in fair value of these investments has resulted from credit losses or other factors. Numerous factors, including the lack of liquidity for resales of certain investment securities, the absence of reliable pricing information for investment securities, adverse changes in the business climate, adverse regulatory actions, any changes to the rating of the security by a rating agency, unanticipated changes in the competitive environment, changes in market interest rates and limited investor demand, could have a negative effect on our investment portfolio. Credit loss charges could negatively impact our earnings and regulatory capital ratios.
The Corporation is subject to interest rate risk.
Our profitability is dependent to a large extent on our net interest income. Like most financial institutions, we are affected by changes in general interest rate levels and by other economic factors beyond our control. Changes in interest rates influence not only the interest we receive on loans and investment securities and the amount of interest we pay on deposits and borrowings, but such changes could also affect our ability to originate loans and obtain deposits and the fair value of our
8
financial assets and liabilities. Although we have implemented strategies to reduce the potential effects of changes in interest rates on our results of operations, any substantial and prolonged change in market interest rates could adversely affect our operating results.
Net interest income may decline in a particular period if:
•
in a declining interest rate environment, more interest-earning assets than interest-bearing liabilities re-price or mature, or
•
in a rising interest rate environment, more interest-bearing liabilities than interest-earning assets re-price or mature.
Our net interest income may decline based on our exposure to a difference in short-term and long-term interest rates. If the difference between the short-term and long-term interest rates continue to shrink or disappears, the difference between rates paid on deposits and received on loans could narrow significantly resulting in a decrease in net interest income and our profitability. In addition to these factors, if market interest rates rise rapidly, interest rate adjustment caps may limit increases in the interest rates on adjustable rate loans, thus reducing our net interest income. Also, certain adjustable rate loans re-price based on lagging interest rate indices. This lagging effect may also negatively impact our net interest income when general interest rates continue to rise periodically.
Changes in the estimated fair value of debt securities may reduce stockholders' equity and net income
.
At December 31, 2022, the Corporation maintained a debt securities portfolio of $505.0 million, of which $350.3 million was classified as available-for-sale. The estimated fair value of the available-for-sale debt securities portfolio may change depending on the credit quality of the underlying issuer, market liquidity, changes in interest rates and other factors. Stockholders' equity is increased or decreased by the amount of the change in the unrealized gain or loss (difference between the estimated fair value and the amortized cost) of the available-for-sale debt securities portfolio, net of the related tax expense or benefit, under the category of accumulated other comprehensive income (loss). During the year ended December 31, 2022, we incurred other comprehensive losses of $38.8 million related to net changes in unrealized holding losses in the available-for-sale investment securities portfolio. A decline in the estimated fair value of this portfolio will result in a decline in reported stockholders' equity, as well as book value per common share. The decrease will occur even though the securities are not sold.
Risks Related to Our Lending Activities
The Corporation is subject to lending risk.
Risks associated with lending activities include, among other things, the impact of changes in interest rates and economic conditions, which may adversely impact the ability of borrowers to repay outstanding loans and the value of the associated collateral. Various laws and regulations also affect our lending activities, and failure to comply with such applicable laws and regulations could subject the Corporation to enforcement actions and civil monetary penalties.
At December 31, 2022, approximately 81.3% of our loan and lease portfolio, excluding Paycheck Protection Program (PPP) loans, consisted of commercial, financial and agricultural, commercial real estate and construction loans and leases, which are generally perceived as having more risk of default than residential real estate loans. Commercial business, commercial real estate and construction loans are more susceptible to a risk of loss during a downturn in the business cycle. These types of loans involve larger loan balances to a single borrower or groups of related borrowers. Commercial real estate loans may be affected to a greater extent than residential loans by adverse conditions in real estate markets or the economy because commercial real estate borrowers' ability to repay their loans depends on successful development of their properties and the successful operation of the borrower's business, as well as the factors affecting residential real estate borrowers.
Loans secured by properties where repayment is dependent upon payment of rent by third party tenants or the sale of the property may be impacted by loss of tenants, lower lease rates needed to attract new tenants or the inability to sell a completed project in a timely fashion and at a profit.
Commercial business loans and leases are typically affected by the borrowers' ability to repay the loans from the cash flows of their businesses. These loans may involve greater risk because the availability of funds to repay each loan depends substantially on the success of the business itself. The collateral securing the loans and leases often depreciates over time, is difficult to appraise and liquidate and fluctuates in value based on the success of the business. In addition, many commercial business loans have a variable rate that is indexed off of a floating rate such as the Prime Rate, London Interbank Offer Rate (LIBOR), Secured Overnight Financing Rate (SOFR) and Bloomberg Short Term Bank Yield Index (BSBY). If interest rates rise, the borrower's debt service requirement may increase, negatively impacting the borrower's ability to service their debt.
9
Risk of loss on a construction loan depends largely upon whether our initial estimate of the property's value at completion of construction equals or exceeds the cost of the property construction (including interest). During the construction phase, a number of factors can result in delays and cost overruns. If estimates of value are inaccurate or if actual construction costs exceed estimates, the value of the property securing the loan may be insufficient to ensure full repayment when completed. Included in real estate-construction is track development financing, which has greater risk because of the potential for diminished demand for residential housing and decreases in real estate valuations. When projects move slower than anticipated, the properties may have significantly lower values than when the original underwriting was completed, resulting in lower collateral values to support the loan. Extended time frames may also cause the interest carrying cost for projects to be higher than the builder projected, negatively impacting the builder's profit and cash flows and, therefore, their ability to make principal and interest payments.
An increase in nonperforming loans and leases from these types of loans could result in an increase in the provision for credit losses and an increase in loan and lease charge-offs. The risk of credit losses on loans and leases increases if the economy worsens.
The Corporation's allowance for possible credit losses on loans and leases may be insufficient, and an increase in the allowance would reduce earnings.
We maintain an allowance for credit losses on loans and leases. The allowance is established through a provision for credit losses on loans and leases based on management's evaluation of current expected credit losses in our loan portfolio factoring in current and forecasted economic conditions. The allowance is based upon a number of factors, including the size and composition of the loan and lease portfolio, asset classifications, economic trends, industry experience and trends, industry and geographic concentrations, estimated collateral values, management's assessment of the current expected credit losses in the portfolio, historical loan and lease loss experience and loan underwriting policies. In addition, we evaluate all loans and leases identified as not sharing similar risk characteristics with other pooled loans and leases and augment the allowance based upon our estimation of the potential loss associated with those individually analyzed loans and leases. Additions to our allowance for credit losses on loans and leases decrease our net income.
If the evaluation we perform in connection with establishing loan and lease loss reserves is wrong, our allowance for credit losses on loans and leases may not be sufficient to cover our losses, which would have an adverse effect on our operating results.
The regulators, in reviewing our loan and lease portfolio as part of a regulatory examination, may from time to time require us to increase our allowance for credit losses, loans and leases, thereby negatively affecting our earnings, financial condition and capital ratios at that time. Moreover, additions to the allowance may be necessary based on changes in economic and real estate market conditions, new information regarding existing loans and leases, identification of additional impaired loans and leases and other factors, both within and outside of our control. Additions to the allowance could have a negative impact on our results of operations.
Changes in economic conditions and the composition of our loan and lease portfolio could lead to higher loan charge-offs and/or an increase in our provision for credit losses, loans and leases, which may reduce our net income.
Changes in national and regional economic conditions could impact our loan and lease portfolios. For example, an increase in unemployment, an increase in inflation, potential recessionary conditions, a decrease in real estate values or changes in interest rates, as well as other factors, could weaken the economies of the communities we serve. Weakness in the market areas we serve could depress our earnings as customers may not demand our products or services, borrowers may not be able to repay their loans, the value of the collateral securing our loans to borrowers may decline and/or the quality of our loan portfolio may decline. Any of these scenarios could require us to charge off loans, which could result in an increase to our provision for credit losses on loans and leases, which would reduce our net income and capital levels.
The Corporation depends on the accuracy and completeness of information about customers and counterparties.
In deciding whether to extend credit or enter into other transactions with customers and counterparties, we rely on information furnished to us by or on behalf of customers and counterparties, including financial statements and other financial information. We also rely on representations of customers and counterparties as to the accuracy and completeness of that information and, with respect to financial statements, on reports of independent auditors. For example, in deciding whether to extend credit to clients, we may assume that a customer's audited financial statements conform to U.S. generally accepted accounting principles (U.S. GAAP) and present fairly, in all material respects, the financial condition, results of operations and cash flows of the customer. Our earnings are significantly affected by our ability to properly originate, underwrite and service
10
loans. Our financial condition, results of operations and capital could be negatively impacted to the extent we incorrectly assess the creditworthiness of our borrowers, fail to detect or respond to deterioration in asset quality in a timely manner, or rely on financial statements that do not comply with U.S. GAAP or are materially misleading.
The Corporation is subject to environmental liability risk associated with lending activities.
In the course of our business, we may foreclose and take title to real estate and could be subject to environmental liabilities with respect to these properties. The Corporation may be held liable to a governmental entity or to third parties for property damage, personal injury, investigation and clean-up costs incurred by these parties in connection with environmental contamination or the release of hazardous or toxic substances at a property. Our policies and procedures require environmental factors to be considered during the loan application process. An environmental review is performed before initiating any commercial foreclosure action; however, these reviews may not be sufficient to detect all potential environmental hazards. Possible remediation costs and liabilities could have a material adverse effect on our financial condition.
Risks Related to the COVID-19 Pandemic
The ongoing COVID-19 pandemic and measures intended to prevent its spread could adversely affect the Corporation's business activities, financial condition, and results of operations.
Global health concerns relating to the COVID-19 pandemic and related government actions taken to reduce the spread of the virus have affected the macroeconomic environment, both nationally and in the Corporation's market area. Federal and state agencies may pass measures to address the economic and social consequences of the pandemic that could impact the Corporation's financial results and have a destabilizing effect on financial markets, key market indices, and overall economic activity. Prolonged measures by public health or other governmental authorities encouraging or requiring significant restrictions on travel, assembly or other core business practices could harm the Bank's business and that of its customers, in particular small to medium-sized business customers. Although the Corporation has business continuity plans and other safeguards in place, there is no assurance that they will be effective. A decline in economic conditions generally and a prolonged negative impact on small to medium-sized businesses, in particular, due to the COVID-19 pandemic, could result in a material adverse effect on the Corporation's business, financial condition, and results of operations and may heighten many of the known risks described herein and in other filings with the SEC.
Risks Related to Our Operations
The Corporation's controls and procedures may fail or be circumvented.
Our management and board review and update the Corporation's internal controls over financial reporting, disclosure controls and procedures, and corporate governance policies and procedures. Any system of controls, however well designed and operated, is based in part on certain assumptions and can provide only reasonable, not absolute, assurances that the objectives of the system are met. Any failure to follow or circumvention of these controls, policies and procedures could have a material adverse impact on our financial condition and results of operations.
The Corporation may not be able to attract and retain skilled people.
We are dependent on the ability and experience of a number of key management personnel who have substantial experience with our operations, the financial services industry, and the markets in which we offer products and services. The loss of one or more senior executives or key managers may have an adverse effect on our businesses. We maintain change in control agreements and grant equity awards with time-based vesting with certain executive officers to aid in our retention of these individuals. Our success depends on our ability to continue to attract, manage, and retain other qualified management personnel.
If we lose a significant portion of our low-cost deposits, it would negatively impact our liquidity and profitability.
Our profitability depends in part on our success in attracting and retaining a stable base of low-cost deposits. At December 31, 2022, 35% of our deposit base was comprised of noninterest-bearing deposits, of which 26% consisted of business deposits, which are primarily operating accounts for businesses, and 9% consisted of consumer deposits. The competition for these deposits in our markets is strong and customers are increasingly seeking investments with higher interest rates that are safe, including the purchase of U.S. Treasury securities and other government-guaranteed obligations, as well as the establishment of accounts at the largest, most-well capitalized banks. If we were to lose a significant portion of our low-cost deposits, it would negatively impact our liquidity and profitability.
11
The Corporation's information technology systems, and the systems of third parties upon which the Corporation relies, may experience a failure, interruption or breach in security, which could negatively affect our operations and reputation.
The Corporation heavily relies on information technology systems, including the systems of third-party service providers, to conduct its business.
Any failure, interruption, or breach in security or operational integrity of these systems could result in failures or disruptions in the Corporation's customer relationship management and general ledger, deposit, loan, and other systems. While the Corporation has policies and procedures designed to prevent or limit the impact of any failure, interruption, or breach in our security systems (including cyber-attacks), there can be no assurance that such events will not occur or if they do occur, that they will be adequately addressed. Information security and cyber-security risks have increased significantly in recent years because of new technologies and the increased number of employees working remotely, the use of the Internet and other electronic delivery channels (including mobile devices) to conduct financial transactions. Accordingly, the Corporation may be required to expend additional resources to continue to enhance its protective measures or to investigate and remediate any information security vulnerabilities or exposures. The occurrence of any system failures, interruptions, or breaches in security could expose the Corporation to reputation risk, litigation, regulatory scrutiny and possible financial liability that could have a material adverse effect on our financial condition and results of operations.
Although the Corporation takes protective measures to maintain the confidentiality, integrity and availability of information, its computer systems, software and networks may be vulnerable to unauthorized access, loss or destruction of data (including confidential client information), account takeovers, unavailability of service, computer viruses or other malicious code, cyber-attacks and other events that could have an adverse security impact. Furthermore, the Corporation may not be able to ensure that all of its clients, suppliers, counterparties and other third parties have appropriate controls in place to protect themselves from cyber-attacks or to protect the confidentiality of the information that they exchange with us, particularly where such information is transmitted by electronic means. Although the Corporation has developed, and continues to invest in, systems and processes that are designed to detect and prevent security breaches and cyber-attacks, a breach of its systems and global payments infrastructure or those of our fintech partners and processors could result in: losses to the Corporation and its customers; loss of business and/or customers; damage to its reputation; the incurrence of additional expenses (including the cost of notification to consumers, credit monitoring and forensics, and fees and fines imposed by the card networks); disruption to its business; an inability to grow its online services or other businesses; additional regulatory scrutiny or penalties; and/or exposure to civil litigation and possible financial liability - any of which could have a material adverse effect on the Corporation’s business, financial condition and results of operations. Although the impact to date for these type of events has not had a material impact on us, we cannot be sure this will be the case in the future.
The failure to maintain current technologies and the costs to update technology could negatively impact the Corporation's business and financial results.
Our future success depends, in part, on our ability to effectively embrace technology to better serve customers and reduce costs. The Corporation may be required to expand additional resources to employ the latest technologies. Failure to keep pace with technological change could potentially have an adverse effect on our business operations and financial condition and results of operations.
We are a community bank and our ability to maintain our reputation is critical to the success of our business. The failure to do so may materially adversely affect our performance.
We are a community bank, and our reputation is one of the most valuable components of our business. A key component of our business strategy is to rely on our reputation for customer service and knowledge of local markets to expand our presence by capturing new business opportunities from existing and prospective customers in our market area and contiguous areas. Threats to our reputation can come from many sources, including adverse sentiment about financial institutions generally, unethical practices, employee misconduct, failure to deliver minimum standards of service or quality, compliance deficiencies, cybersecurity incidents and questionable or fraudulent activities of our customers. Negative publicity regarding our business, employees, or customers, with or without merit, may result in the loss of customers and employees, costly litigation and increased governmental regulation, all of which could adversely affect our business and operating results.
We borrow from the Federal Home Loan Bank, the Federal Reserve and correspondent banks, and these lenders could modify or terminate their current programs, which could have an adverse effect on our liquidity and profitability.
We utilize the FHLB for overnight borrowings and term advances. We also borrow from the Federal Reserve and from correspondent banks under our federal funds lines of credit. The amount loaned to us is generally dependent on the value of the collateral pledged as well as the FHLB's internal credit rating of the Bank. These lenders could reduce the percentages loaned against various collateral categories, could eliminate certain types of collateral and could otherwise modify or even terminate
12
their loan programs, particularly to the extent they are required to do so, because of capital adequacy or other balance sheet concerns. Any change or termination of our borrowings from the FHLB, the Federal Reserve or correspondent banks would have an adverse effect on our liquidity and profitability.
Other Risks Related to Our Business
Uncertainty surrounding the future of LIBOR may affect the fair value and return on the Corporation's financial instruments that use LIBOR as a reference rate.
The Corporation holds assets, liabilities, and derivatives that are indexed to the various tenors of LIBOR. The LIBOR yield curve is also utilized in our fair value calculations. The reform of major interest benchmarks led to the announcement that LIBOR would not be supported in its current form after June 30, 2023; however banking regulators have indicated that new contracts entered into before December 31, 2021 should either utilize a reference rate other than LIBOR or have robust fallback language that includes a clearly defined alternative reference rate after LIBOR’s discontinuation. Additionally, banking regulators have stated that the failure to adequately prepare for LIBOR's discontinuance could undermine financial stability and an institution's safety and soundness and create litigation, operational, and consumer protection risks. The Corporation believes the U.S. financial sector will maintain an orderly and smooth transition to new interest rate benchmarks, which the Corporation will evaluate and adopt if appropriate. While in the U.S., the Alternative Rates Committee of the FRB and Federal Reserve Bank of New York have identified the SOFR as an alternative U.S. dollar reference interest rate, we do not know the financial impact this rate index replacement may have, if at all.
Natural disasters, acts of war or terrorism and other external events could negatively impact the Corporation.
Natural disasters, acts of war or terrorism, the emergence of widespread health emergencies or pandemics and other adverse external events could have a significant impact on the Corporation's ability to conduct business. In addition, such events could affect the stability of the Corporation's deposit base, impair the ability of borrowers to repay outstanding loans, impair the value of collateral securing loans, cause significant property damage, result in loss of revenue and/or cause the Corporation to incur additional expenses. We have established disaster recovery policies and procedures that are expected to mitigate events related to natural or man-made disasters; however, the occurrence of any such event and the impact of an overall economic decline resulting from such a disaster could have a material adverse effect on the Corporation's financial condition and results of operations.
Risks Related to Economic Conditions
Inflation can have an adverse impact on our business and on our customers.
Inflation risk is the risk that the value of assets or income from investments will be worth less in the future as inflation decreases the value of money. Over the past year, in response to a pronounced rise in inflation, the FRB has raised certain benchmark interest rates to combat inflation. As discussed above under “Risks Related to Market Interest Rates – The Corporation is subject to interest rate risk,” as inflation increases and market interest rates rise the value of our investment securities, particularly those with longer maturities, would decrease, although this effect can be less pronounced for floating rate instruments. In addition, inflation generally increases the cost of goods and services we use in our business operations, such as electricity and other utilities, which increases our non-interest expenses. Furthermore, our customers are also affected by inflation and the rising costs of goods and services used in their households and businesses, which could have a negative impact on their ability to repay their loans with us. Sustained higher interest rates by the FRB to tame persistent inflationary price pressures could also push down asset prices and weaken economic activity. A deterioration in economic conditions in the United States and our markets could result in an increase in loan delinquencies and non-performing assets, decreases in loan collateral values and a decrease in demand for our products and services, all of which, in turn, would adversely affect our business, financial condition and results of operations.
The Corporation's earnings are impacted by general business and economic conditions.
The Corporation's operations and profitability are impacted by general business and economic conditions, including long-term and short-term interest rates, inflation, money supply, political issues, legislative, tax, accounting and regulatory changes, fluctuations in both debt and equity capital markets, broad trends in industry and finance, values of real estate and other collateral and the strength of the U.S. economy and the local economies in which we operate, all of which are beyond our control. Negative changes in these general business and economic conditions could have the following consequences, any of which could have a material adverse effect on the business, financial condition, liquidity and results of operations:
13
•
demand for the products and services may decline;
•
we may increase our allowance for credit losses;
•
loan delinquencies, problem assets, and foreclosures may increase;
•
collateral for loans, especially real estate, may decline in value, thereby reducing customers' borrowing power, and reducing the value of assets and collateral associated with existing loans; and
•
the net worth and liquidity of loan guarantors may decline, impairing their ability to honor commitments.
The Corporation's profitability is affected by economic conditions in Pennsylvania and New Jersey markets.
Unlike larger regional banks that operate in large geographies, the Corporation provides banking and financial services to customers primarily in 13 counties in the Southeastern and Central regions of Pennsylvania, three counties in New Jersey and recently expanded into Western Pennsylvania and Maryland. Because of our geographic concentration, a downturn in the local economy could make it more difficult to attract loans and deposits, and could cause higher losses and delinquencies on our loans than if the loans were more geographically diversified. Adverse economic conditions in the region, including, without limitation, declining real estate values or higher unemployment, could cause our levels of nonperforming assets and loan losses to increase. Regional economic conditions have a significant impact on the ability of borrowers to repay their loans as scheduled. A sluggish local economy could, therefore, result in losses that materially and adversely affect our financial condition and results of operations.
Risks Related to Regulation
Changes in laws and regulations and the cost of regulatory compliance with new laws and regulations may adversely affect our operations and/or increase our costs of operations.
We are subject to extensive regulation, supervision, and examination by our primary regulators, the Pennsylvania Department of Banking and Securities and the Federal Reserve Bank of Philadelphia, and by the FDIC, the regulating authority that insures customer deposits. Also, as a member of the FHLB, the Bank must comply with applicable regulations of the Federal Housing Finance Agency and the FHLB. Regulation by these agencies is intended primarily for the protection of our depositors and the deposit insurance fund and not for the benefit of our shareholders. The Bank's activities are also regulated under consumer protection laws applicable to our lending, deposit, and other activities. A material claim against the Bank under these laws or an enforcement action by our regulators could have a material adverse effect on our financial condition and results of operations. These regulations, along with the currently existing tax, accounting, securities, deposit insurance and monetary laws, rules, standards, policies, and interpretations, control the ways financial institutions conduct business, implement strategic initiatives, and prepare financial reporting and disclosures. Regulatory authorities have extensive discretion in their supervisory and enforcement activities, including the ability to impose restrictions on our operations and comment on the classification of our assets and the level of our allowance for credit losses. Changes in such regulation and oversight, whether in the form of regulatory or enforcement policy, new regulations, legislation or supervisory action, may have a material impact on our operations. Further, compliance with such regulation may increase our costs and limit our ability to pursue business opportunities.
We cannot predict the effect of legislative and regulatory initiatives, which could increase our costs of doing business and adversely affect our results of operations and financial condition.
Changes to statutes, regulations and/or regulatory or accounting policies could affect the Corporation in substantial and unpredictable ways. Such changes could subject the Corporation to additional costs, limit the types of financial services and products the Corporation may offer, limit the fees we may charge, increase the ability of non-banks to offer competing financial services and products, change regulatory capital requirements or the required size of our allowance for credit losses or change deposit insurance assessments, any of which would negatively impact our financial condition and result of operations. Failure to comply with laws, regulations or policies could result in sanctions by regulatory agencies, civil money penalties and/or reputation damage, which could have a material adverse effect on the Corporation's business, financial condition and results of operations.
Risks Related to the Wealth Management Industry
Revenues and profitability from our wealth management business may be adversely affected by any reduction in assets under management, which could reduce fees earned.
The wealth management business derives the majority of its revenue from noninterest income, which consists of trust, investment advisory and brokerage and other servicing fees. Substantial revenues are generated from investment management
14
contracts with clients. Under these contracts, the investment advisory fees paid to us are typically based on the market value of assets under management. Assets under management may decline for various reasons including declines in the market value of the assets in the funds and accounts managed, which could be caused by price declines in the securities markets generally or by price declines in specific market segments. Assets under management may also decrease due to redemptions and other withdrawals by clients or termination of contracts. This could be in response to adverse market conditions or in pursuit of other investment opportunities. If our assets under management decline and there is a related decrease in fees, it will negatively affect our results of operations.
We may not be able to attract and retain wealth management clients.
Due to strong competition, our wealth management business may not be able to attract and retain clients. Competition is strong because there are numerous well-established and successful investment management and wealth advisory firms including commercial banks and trust companies, investment advisory firms, mutual fund companies, stock brokerage firms, and other financial companies. Many of our competitors have greater resources than we have.
Our ability to successfully attract and retain wealth management clients is dependent upon our ability to compete with competitors' investment products, our level of investment performance, our client services and marketing and distribution capabilities. If we are not successful, our results of operations and financial condition may be negatively impacted.
The wealth management business is subject to extensive regulation, supervision and examination by regulators, and any enforcement action or adverse changes in the laws or regulations governing our business could decrease our revenues and profitability.
The wealth management business is subject to regulation by regulatory agencies that are charged with safeguarding the integrity of the securities and other financial markets and with protecting the interests of customers participating in those markets. In the event of non-compliance with regulation, governmental regulators, including the SEC and the Financial Industry Regulatory Authority, may institute administrative or judicial proceedings that may result in censure, fines, civil money penalties, the issuance of cease-and-desist orders, the deregistration or suspension of the non-compliant introducing broker-dealer or investment adviser or other adverse consequences. The imposition of any such penalties or orders could have a material adverse effect on the wealth management segment's operating results and financial condition. The wealth management business also may be adversely affected as a result of new or revised legislation or regulations. Regulatory changes have imposed and may continue to impose additional costs, which could adversely impact our profitability.
Risks Related to the Insurance Industry
Revenues and profitability from our insurance business may be adversely affected by market conditions, which could reduce insurance commissions and fees earned.
The revenues of our fee-based insurance business are derived primarily from commissions from the sale of insurance policies, which commissions are generally calculated as a percentage of the policy premium. These insurance policy commissions can fluctuate as insurance carriers change the premiums on the insurance products we sell. Due to the cyclical nature of the insurance market and the impact of other market and macroeconomic conditions on insurance premiums, commission levels may vary. The reduction of these commission rates, along with general volatility and/or declines in premiums, may adversely impact our profitability.
Risks Related to Competition
The Corporation operates in a highly competitive industry and market area, which could adversely impact its business and results of operations.
We face substantial competition in all phases of our businesses from a variety of different competitors. Our competitors, including commercial banks, community banks, savings institutions, credit unions, consumer finance companies, insurance companies, securities dealers, brokers, mortgage bankers, investment advisors, money market mutual funds and other financial technology and financial institutions, compete with us for loans and deposits and insurance and wealth management services offered by us. Increased competition in our markets may result in reduced loans and deposits or may negatively impact the pricing of such products.
Many of these competing institutions have much greater financial and marketing resources than we have. Due to their size, many competitors can achieve larger economies of scale and may offer a broader range of products and services than we can. If
15
we are unable to compete effectively in the offerings of our products and services, our business may be negatively affected. Additionally, these competitors may offer higher interest rates than the Corporation, which could decrease the deposits that the Corporation attracts or require the Corporation to increase its rates to retain existing deposits or attract new deposits. Increased deposit competition could adversely affect the Corporation’s ability to generate the funds necessary for lending operations. As a result, the Corporation may need to seek other sources of funds that may be more expensive to obtain which could increase the cost of funds and decrease profitability.
Some of the financial services organizations with which we compete are not subject to the same degree of regulation or tax structure as is imposed on bank holding companies and federally insured financial institutions. As a result, these non-bank competitors have certain advantages over us in providing lower-cost products, accessing funding and in providing various services. The banking business in our primary market areas is very competitive, and the level of competition and their pricing structure facing us may increase further, which may limit our asset growth and financial results.
Risks Related to Strategic Activities
The anticipated benefits of our digital initiatives may not be fully realized.
We have devoted substantial resources to our strategic digital initiatives. The success of these initiatives will depend on, among other things, our ability to upgrade our technology and digital solutions in a manner that improves experiences of customers and employees. If we are unable to successfully achieve this objective, the anticipated benefits of these initiatives may not be realized fully, or at all, or may take longer to realize than expected.
Additionally, the implementation of new technologies and digital solutions may cause business disruptions that affect our ability to maintain relationships with clients, customers, depositors and employees and could have an adverse effect on us for an undetermined period.
Our business strategy includes significant investment in growth plans, and our financial condition and results of operations could be negatively affected if we fail to grow or fail to manage our growth effectively.
We are expanding into the Western Pennsylvania and Maryland markets, and may further expand into additional markets as a result of our digital initiatives. Our growth initiatives require us to recruit experienced personnel. The failure to retain such personnel would place significant limitations on our ability to successfully execute our growth strategy. In addition, as we expand our lending beyond our current market areas, we could incur additional risk related to those new market areas. We may not be able to expand our market presence in our existing market areas or successfully enter new markets. A weak economy, low demand and competition for credit may impact our ability to successfully execute our growth plan and adversely affect our business, financial condition, results of operations, reputation and growth prospects. While we believe we have the executive management resources and internal systems in place to successfully manage our future growth, there can be no assurance growth opportunities will be available or that we will successfully manage our growth. We regularly evaluate potential growth and expansion opportunities. If appropriate opportunities present themselves, we may engage in other business growth initiatives or undertakings. We may not successfully identify appropriate opportunities, may not be able to negotiate or finance such activities and such activities, if undertaken, may not be successful.
We may need to raise additional capital in the future and such capital may not be available when needed or at all.
Federal regulatory agencies have the authority to change the Corporation's and Bank's capital requirements and new accounting rules could have a negative impact on our regulatory capital ratios. Accordingly, we may need to raise additional capital in the future to provide us with sufficient capital resources to meet our commitments and business needs. We may also at some point need to raise additional capital to support our continued growth. If we raise capital through the issuance of additional shares of our common stock or other securities, it would dilute the ownership interests of existing shareholders and may dilute the per share book value of our common stock. New investors may also have rights, preferences and privileges senior to our current shareholders, which may adversely impact our current shareholders. Our ability to raise additional capital, if needed, or at attractive prices, will depend on, among other things, conditions in the capital markets at that time, which are outside of our control, and our financial performance. An inability to raise additional capital on acceptable terms when needed could have a material adverse effect on our business, financial condition and results of operations.
Potential acquisitions may disrupt the Corporation's business and dilute shareholder value.
We regularly evaluate opportunities to acquire and invest in banks and in other complementary businesses. As a result, we may engage in negotiations or discussions that, if they were to result in a transaction, could have a material effect on our operating results and financial condition, including on our short and long-term liquidity and capital structure. Our acquisition activities could be material to us. For example, we could issue additional shares of common stock in a merger transaction,
16
which could dilute current shareholders' ownership interest and the per share book value of our common stock. Further, an acquisition could require us to use a substantial amount of cash, other liquid assets, and/or incur debt.
Our acquisition activities could involve a number of additional risks, including the risks of:
•
Incurring time and expense associated with identifying and evaluating and negotiating potential transactions;
•
Using estimates and judgments to evaluate credit, operations, management, and market risks with respect to the target institution or its assets, which later prove to be inaccurate;
•
The time and expense required to integrate the operations and personnel of the combined businesses;
•
Creating an adverse short-term effect on our results of operations;
•
Failing to realize related revenue synergies and/or cost savings within expected time frames; and
•
Losing key employees and customers or a reduction in our stock price as a result of an acquisition that is poorly received.
We may not be successful in overcoming these risks or any other problems encountered in connection with potential acquisitions. Our inability to overcome these risks could have an adverse effect on our ability to achieve our business strategy and could have an adverse effect on our financial condition and results of operations.
Risks Related to Our Common Stock
The Corporation's stock price can be volatile.
The Corporation's stock price can fluctuate in response to a variety of factors, some of which are not under our control. The factors that could cause the Corporation's stock price to decrease include, but are not limited to:
•
Our past and future dividend practice;
•
Our financial condition, performance, creditworthiness and prospects;
•
Variations in our operating results or the quality of our assets;
•
Operating results that vary from the expectations of management, securities analysts and investors;
•
Changes in expectations as to our future financial performance;
•
Changes in financial markets related to market valuations of financial industry companies;
•
The operating and securities price performance of other companies that investors believe are comparable to us;
•
Future sales of our equity or equity-related securities;
•
The credit, mortgage and housing markets, the markets for securities relating to mortgages or housing, and developments with respect to financial institutions generally; and
•
Changes in global financial markets and global economies and general market conditions, such as interest or foreign exchange rates, inflation, recessionary conditions, stock, commodity or real estate valuations or volatility and other geopolitical, regulatory or judicial events.
The limited liquidity of our common stock may limit your ability to trade our shares and may impact the value of our common stock.
While the Corporation's common stock is traded on the NASDAQ Global Select Market, the trading volume has historically been less than that of larger financial services companies. Stock price volatility may make it more difficult for investors to sell their common stock when they want and at prices they find attractive.
A public trading market having the desired characteristics of depth, liquidity and orderliness depends on the presence in the marketplace of willing buyers and sellers of our common stock at any given time. This presence depends on the individual decisions of investors and general economic and market conditions over which we have no control. Given the relatively low trading volume of our common stock, significant sales of our common stock in the public market, or the perception that those sales may occur, could cause the trading price of our common stock to decline or to be lower than it otherwise might be in the absence of those sales or perceptions.
Anti-takeover provisions could negatively impact our shareholders.
Certain provisions in the Corporation's Articles of Incorporation and Bylaws, as well as federal banking laws, regulatory approval requirements, and Pennsylvania law, could make it more difficult for a third party to acquire the Corporation, even if doing so would be perceived to be beneficial to the Corporation's shareholders.
17
There may be future sales or other dilution of the Corporation's equity, which may adversely affect the market price of our common stock.
The Corporation is generally not restricted from issuing additional common stock, including any securities that are convertible into or exchangeable for, or that represent the right to receive, common stock. The issuance of any additional shares of common stock or preferred stock or securities convertible into, exchangeable for or that represent the right to receive common stock or the exercise of such securities could be substantially dilutive to shareholders of our common stock. Holders of our shares of common stock have no preemptive rights that entitle holders to purchase their pro rata share of any offering of shares of any class or series. The market price of our common stock could decline as a result of offerings or because of sales of shares of our common stock made after offerings or the perception that such sales could occur. Because our decision to issue securities in any future offering will depend on market conditions and other factors beyond our control, we cannot predict or estimate the amount, timing or nature of our future offerings. Thus, our shareholders bear the risk of our future offerings reducing the market price of our common stock and diluting their stock holdings in us.
The Corporation relies on dividends from our subsidiaries for most of our revenue.
The Corporation is a bank holding company and our operations are conducted by our subsidiaries from which we receive dividends. The ability of our subsidiaries to pay dividends is subject to legal and regulatory limitations, profitability, financial condition, capital expenditures and other cash flow requirements. The ability of the Bank to pay cash dividends to the Corporation is limited by its obligation to maintain sufficient capital and by other restrictions on its cash dividends that are applicable to state member banks in the Federal Reserve System. If the Bank is not permitted to pay cash dividends to the Corporation, it is unlikely that we would be able to pay cash dividends on our common stock.
Item 1B.
Unresolved Staff Comments
None.
Item 2.
Properties
As of December 31, 2022, the Corporation and its subsidiaries occupied 52 properties, most of which are used principally as banking offices.
The following table details the Corporation's properties as of December 31, 2022:
| Property Address | County, State | Owned/Leased | ||||||||||||
| Full Service Branches (Banking Segment): | ||||||||||||||
| 195 East Butler Ave., Chalfont, PA 18914 | Bucks, PA | Owned | ||||||||||||
| 4390 Davisville Rd., Hatboro, PA 19040 | (3) | Montgomery, PA | Owned | |||||||||||
| 5871 Lower York Rd., Lahaska, PA 18931 | Bucks, PA | Owned | ||||||||||||
| Route 309 & Line Lexington Rd., Line Lexington, PA 18932 | Montgomery, PA | Owned | ||||||||||||
| 4601 Carlisle Pk, Mechanicsburg, PA 17050 | (2) (3) | Cumberland, PA | Owned | |||||||||||
| 1950 John Fries Highway, Milford Square, PA 18935 | Bucks, PA | Owned | ||||||||||||
| Route 309 & Stump Rd., Montgomeryville, PA 18936 | Montgomery, PA | Owned | ||||||||||||
| 15 Swamp Rd., Newtown, PA 18940 | Bucks, PA | Owned | ||||||||||||
| 921 West Ave., Ocean City, NJ 08226 | (3) | Cape May, NJ | Owned | |||||||||||
| 401 Rhawn St., Philadelphia, PA 19111 | Philadelphia, PA | Owned | ||||||||||||
| Township Line Rd. and Route 113, Schwenksville, PA 19473 | Montgomery, PA | Owned | ||||||||||||
| 10 W. Broad St., Souderton, PA 18964 | Montgomery, PA | Owned | ||||||||||||
| 500 Harleysville Pk., Souderton, PA 18964 | Montgomery, PA | Owned | ||||||||||||
| Routes 113 and Bethlehem Pk., Souderton, PA 18964 | Bucks, PA | Owned | ||||||||||||
| 1041 York Rd., Warminster, PA 18974 | Bucks, PA | Owned | ||||||||||||
| 2901 Whiteford Rd, York, PA 17402 | (3) | York, PA | Owned | |||||||||||
| 574 Main St., Bethlehem, PA 18018 | Northampton, PA | Leased | ||||||||||||
| 694 DeKalb Pk., Blue Bell, PA 19422 | Montgomery, PA | Leased | ||||||||||||
| 4250 Oregon Pk., Brownstown, PA 17508 | Lancaster, PA | Leased | ||||||||||||
| 1135 Georgetown Rd., Christiana, PA 17509 | Lancaster, PA | Leased | ||||||||||||
| 1980 S. Easton Rd, Doylestown, PA 18901 | (2) (3) | Bucks, PA | Leased | |||||||||||
| 321 Main St., East Greenville, PA 18041 | Montgomery, PA | Leased | ||||||||||||
| 1536 S. Broad St., Philadelphia, PA 19146 | Philadelphia, PA | Leased | ||||||||||||
18
| 1642 Fairmount Ave., Philadelphia, PA 19130 | Philadelphia, PA | Leased | ||||||||||||
| 3601 Market St., Philadelphia, PA 19104 | Philadelphia, PA | Leased | ||||||||||||
| 7226 Germantown Ave., Philadelphia, PA 19119 | (3) | Philadelphia, PA | Leased | |||||||||||
| 1103 Rocky Dr., Reading, PA 19609 | (2) (3) | Berks, PA | Leased | |||||||||||
| 216 Hartman Bridge Rd., Ronks, PA 17572 | Lancaster, PA | Leased | ||||||||||||
| 200 North High St., West Chester, PA 19380 | (3) | Chester, PA | Leased | |||||||||||
| 90 Willow Valley Lakes Dr., Willow Street, PA 17584 | Lancaster, PA | Leased | ||||||||||||
| 5089 Hamilton Blvd., Allentown, PA 18106 | Lehigh, PA | Land Lease | ||||||||||||
| 2645 Street Rd., Bensalem, PA 19020 | Bucks, PA | Land Lease | ||||||||||||
| 380 Water Loop Dr., Collegeville, PA 19426 | Montgomery, PA | Land Lease | ||||||||||||
| 1 Heritage Dr., Gordonville, PA 17529 | Lancaster, PA | Land Lease | ||||||||||||
| 2870 Shelly Rd., Harleysville, PA 19438 | Montgomery, PA | Land Lease | ||||||||||||
| 120 Forty Foot Rd., Hatfield, PA 19440 | Montgomery, PA | Land Lease | ||||||||||||
| 940 2nd Street Pk., Richboro, PA 18954 | Bucks, PA | Land Lease | ||||||||||||
| Corporate Headquarters: | ||||||||||||||
| 14 North Main St., Souderton, PA 18964 | (1) (3) | Montgomery, PA | Owned | |||||||||||
| 15 Washington Ave., Souderton, PA 18964 | Montgomery, PA | Owned | ||||||||||||
| 16 Harbor Pl., Souderton, PA 18964 | Montgomery, PA | Owned | ||||||||||||
| 1715 Sumneytown Pk., Lansdale, PA 19446 | Montgomery, PA | Leased | ||||||||||||
| Subsidiary Offices (Wealth Management Segment) | ||||||||||||||
| 4600 Broadway, Allentown, PA 18104 | (1) (3) | Lehigh, PA | Leased | |||||||||||
| 5237 Summerlin Commons Blvd., Fort Meyers, FL 33907 | Lee, FL | Leased | ||||||||||||
| 555 Croton Rd., King of Prussia, PA 19406 | (3) | Montgomery, PA | Leased | |||||||||||
| 41 West Broad Street, Souderton, PA 18964 | Montgomery, PA | Owned | ||||||||||||
| Subsidiary Offices (Insurance Segment) | ||||||||||||||
| 6339 Beverly Hills Rd., Coopersburg, PA 18036 | Lehigh, PA | Owned | ||||||||||||
| 3541 Old Philadelphia Pk, Intercourse, PA 17534 | Lancaster, PA | Owned | ||||||||||||
| 521 Main St., Lansdale, PA 19446 | Montgomery, PA | Owned | ||||||||||||
| 9120 Chesapeake Ave., Suite 101, North Beach, MD 20714 | Calvert, MD | Leased | ||||||||||||
| Other Offices: | ||||||||||||||
| Greenfield Corporate Center, 1869 Charter Ln., Suite 301, Lancaster, PA 17601 | (1) (3) | Lancaster, PA | Leased | |||||||||||
| 312 West Route 38 Ste 105, Moorestown, NJ 08057 | (3) | Burlington, NJ | Leased | |||||||||||
| 2000 Market St., Suite 700, Philadelphia, PA 19103 | (3) | Philadelphia, PA | Leased | |||||||||||
(1) Banking Segment
(2) Wealth Management Segment
(3) Corporate banking
Additionally, the Bank provides banking services for the residents and employees of 14 retirement home communities and has four off-premise automated teller machines. The Bank provides banking services nationwide through the internet via its website at
www.univest.net
. The Corporation's website and the information contained therein is not intended to be incorporated into this Annual Report on Form 10-K.
On February 13, 2023, the Bank opened an office located at 51 Dutilh Road, Cranberry, Pennsylvania, located in Butler County.
Item 3.
Legal Proceedings
The Corporation is periodically subject to various pending and threatened legal actions that involve claims for monetary relief. Based upon information presently available to the Corporation, it is the Corporation's opinion that any legal and financial responsibility arising from such claims will not have a material adverse effect on the Corporation's results of operations, financial position or cash flows.
Item 4.
Mine Safety Disclosures
Not Applicable.
19
PART II
Item 5.
Market for the Registrant's Common Equity, Related Stockholder Matters and Issuer Purchases of Equity Securities
The Corporation's common stock is traded on the NASDAQ Global Select Market under the symbol "UVSP." At February 10, 2023, the Corporation had 2,406 stockholders of record.
Stock Performance Graph
The following chart compares the yearly percentage change in the cumulative shareholder return on the Corporation's common stock during the five years ended December 31, 2022, with the following indices: (1) NASDAQ Bank Index, (2) KBW NASDAQ Bank Index, and (3) Russell 2000 Index. As of December 31, 2022, the Corporation replaced the NASDAQ Stock Market Index with the Russell 2000 Index and the KBW Nasdaq Bank Index as we concluded they more closely align with the size and industry of the Corporation. In accordance with SEC requirements, the NASDAQ Stock Market Index is also included in the table below as it was used as a comparative index in the prior year. This comparison assumes $100.00 was invested on December 31, 2017, in our common stock and the comparison groups and assumes the reinvestment of all cash dividends prior to any tax effect and retention of all stock dividends.
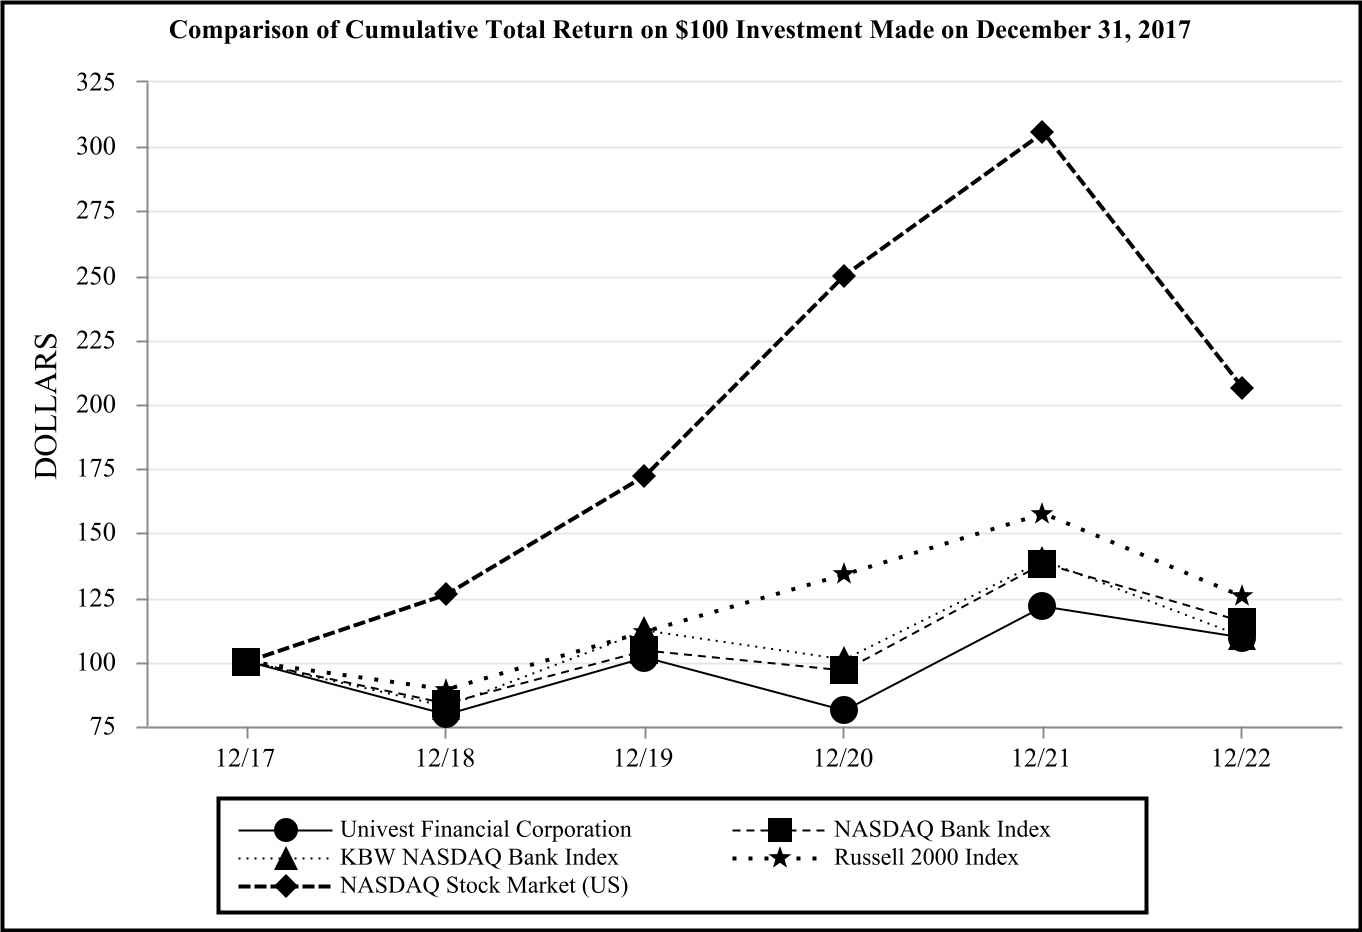
Five Year Cumulative Total Return Summary ($)
| 2017 | 2018 | 2019 | 2020 | 2021 | 2022 | |||||||||||||||
| Univest Financial Corporation | 100.00 | 79.34 | 101.60 | 81.13 | 121.35 | 109.49 | ||||||||||||||
| NASDAQ Bank Index | 100.00 | 83.91 | 104.35 | 96.65 | 138.07 | 115.72 | ||||||||||||||
| KBW NASDAQ Bank Index | 100.00 | 82.40 | 112.12 | 100.74 | 139.31 | 109.71 | ||||||||||||||
| Russell 2000 Index | 100.00 | 89.00 | 111.66 | 133.95 | 157.44 | 125.31 | ||||||||||||||
| NASDAQ Stock Market (US) | 100.00 | 126.08 | 172.34 | 250.01 | 305.53 | 206.30 | ||||||||||||||
20
ISSUER PURCHASES OF EQUITY SECURITIES
The following table provides information on repurchases by the Corporation of its common stock during the fourth quarter of 2022, under the Corporation's Board approved program:
| ISSUER PURCHASES OF EQUITY SECURITIES | |||||||||||||||||||||||
| Period |
Total Number
of Shares Purchased (1) |
Average
Price Paid per Share |
Total Number of
Shares Purchased as Part of Publicly Announced Plans or Programs |
Maximum Number of
Shares that May Yet Be Purchased Under the Plans or Programs |
|||||||||||||||||||
| October 1 - 31, 2022 | — | $ | — | — | 1,229,174 | ||||||||||||||||||
| November 1 - 30, 2022 | — | — | — | 1,229,174 | |||||||||||||||||||
| December 1 – 31, 2022 | — | — | — | 1,229,174 | |||||||||||||||||||
| Total | — | $ | — | — | |||||||||||||||||||
1.
On May 27, 2015, the Corporation's Board of Directors approved the repurchase of 1,000,000 shares, or approximately 5% of the Corporation's common stock outstanding as of May 27, 2015. On October 26, 2022, the Corporation's Board of Directors approved the repurchase of 1,000,000 additional shares, or approximately 3.4% of the Corporation's common stock outstanding as of September 30, 2022. The stock repurchase plan does not include normal treasury activity such as purchases to fund the dividend reinvestment, employee stock purchase and equity compensation plans. The program has no scheduled expiration date and the Board of Directors has the right to suspend or discontinue the program at any time.
In addition to the repurchases disclosed above, participants in the Corporation's stock-based incentive plans may have shares withheld to cover income taxes upon the vesting of restricted stock awards and may use a stock swap to exercise stock options. Shares withheld to cover income taxes upon the vesting of restricted stock awards and stock swaps to exercise stock options are repurchased pursuant to the terms of the applicable plan and not under the Corporation's share repurchase program. Shares repurchased pursuant to these plans during the three months ended December 31, 2022 were as follows:
| Period | Total Number of Shares Purchased | Average Price Paid per Share | |||||||||
| October 1 - 31, 2022 | — | $ | — | ||||||||
| November 1 - 30, 2022 | — | — | |||||||||
| December 1 – 31, 2022 | — | — | |||||||||
| Total | — | $ | — | ||||||||
Dividend Reinvestment and Employee Stock Purchase Plans
The Univest Dividend Reinvestment Plan allows for the issuance of 2,718,750 shares of common stock. During 2022 and 2021, 56,900 and 53,549 shares, respectively, were issued under the dividend reinvestment plan, with 749,355 shares available for future purchase at December 31, 2022.
The 1996 Employee Stock Purchase Plan allows for the issuance of 984,375 shares of common stock. Employees may elect to make contributions to the plan in an aggregate amount not less than 2% or more than 10% of such employee's total compensation. These contributions are then used to purchase stock during an offering period determined by the Corporation's Employee Stock Purchase Plan Committee. The purchase price of the stock is 90% of the closing sale price on the last trading day of each quarter. Compensation expense is recognized as the discount is greater than 5% of the fair value. During 2022 and 2021, 39,466 and 32,638 shares, respectively, were issued under the employee stock purchase plan, with 474,692 shares available for future issuance at December 31, 2022.
Item 6. [RESERVED]
21
Item 7.
Management's Discussion and Analysis of Financial Condition and Results of Operations
(All dollar amounts presented in tables are in thousands, except per share data. "BP" equates to "basis points"; "N/M" equates to "not meaningful"; "—" equates to "zero" or "doesn't round to a reportable number"; and "N/A" equates to "not applicable." Certain prior period amounts have been reclassified to conform to the current-year presentation.)
The information contained in this report may contain forward-looking statements, including statements relating to the Corporation and its financial condition and results of operations that involve certain risks, uncertainties and assumptions. The Corporation's actual results may differ materially from those anticipated, expected or projected as discussed in forward-looking statements. A discussion of forward-looking statements and factors that might cause such a difference includes those discussed in Part I, "Forward-Looking Statements," Item 1A. "Risk Factors," as well as those within this Management's Discussion and Analysis (MD&A) of Financial Condition and Results of Operations and elsewhere in this report.
Critical Accounting Policies
The discussion below outlines the Corporation's critical accounting policies. For further information regarding accounting policies, refer to Note 1, "Summary of Significant Accounting Policies" included in the Notes to the Consolidated Financial Statements under Item 8 of this Form 10-K.
Management, in order to prepare the Corporation's financial statements in conformity with U.S. generally accepted accounting principles, is required to make estimates and assumptions that affect the amounts reported in the Corporation's financial statements. There are uncertainties inherent in making these estimates and assumptions. Certain critical accounting policies could materially affect the results of operations and financial position of the Corporation should changes in circumstances require a change in related estimates or assumptions. The Corporation has identified the fair value measurement of investment securities available-for-sale and the calculation of the allowance for credit losses on loans and leases as critical accounting policies.
Fair Value Measurement of Investment Securities Available-for-Sale:
The Corporation designates its investment securities as held-to-maturity, available-for-sale or trading. Each of these designations affords different treatment on the balance sheet and statement of income for market value changes affecting securities. Should evidence emerge that indicates that management's intent or ability to manage the securities as originally asserted is not supportable, securities with the held-to-maturity or available-for-sale designations may be re-categorized so that adjustments to either the balance sheet or statement of income may be required.
Fair values for securities are determined using independent pricing services and market-participating brokers. The independent pricing service utilizes evaluated pricing models that vary by asset class and incorporate available trade, bid and other market information for structured securities, cash flows and, when available, loan performance data. Because many fixed income securities do not trade on a daily basis, the pricing service's evaluated pricing applications apply information as applicable through processes, such as benchmarking of like securities, sector groupings, and matrix pricing, to prepare evaluations. If at any time, the pricing service determines that it does not have sufficient verifiable information to value a particular security, the Corporation will utilize valuations from another pricing service. Management has a sufficient understanding of the third party service's valuation models, assumptions and inputs used in determining the fair value of securities to enable management to maintain an appropriate system of internal control.
Allowance for Credit Losses on Loan and Leases:
The Allowance for Credit Losses (ACL) on loans and leases are provided using techniques that estimate losses on pools of loans and leases that share similar risk characteristics and specifically identify losses on individual loans and leases that do not share similar risk characteristics with others. The adequacy of these allowances are sensitive to changes in current and forecasted economic conditions that may affect the ability of borrowers to make contractual payments as well as the value of the collateral securing such payments. Management utilizes a discounted cash flow (DCF) model to calculate the present value of the expected cash flows for pools of loans and leases that share similar risk characteristics and compares the results of this calculation to the amortized cost basis to determine its allowance for credit loss balance. The key assumptions used in the model are (1) probability of default, (2) loss given default, (3) prepayment and curtailment rates, (4) recovery delay (5) reasonable and supportable economic forecasts, (6) forecast reversion period, (7) expected recoveries on charged off loans, and (8) discount rate. Although management believes it uses the best information available to establish the ACL, future adjustments to the ACL may be necessary and the Corporation’s results of operations could be adversely affected if circumstances differ substantially from the assumptions used in making the determinations. While management believes it has established the ACL in conformity with GAAP, our regulators, in reviewing the loan portfolio, may request us to increase our ACL based on judgments different from ours. In addition, because future events affecting borrowers
22
and collateral cannot be predicted without uncertainty, the existing ACL may not be adequate or increases may be necessary should the quality of any loans or leases deteriorate or if there are changes to the assumptions noted above. Any material increase in the ACL would adversely affect the Corporation’s financial condition and results of operations.
Economic Factors
| At December 31, 2022 | At December 31, 2021 | Description of Economic Factors | |||||||||||||||
| Prepayment rates | 13.41 | % | 12.45 | % | Average total portfolio rate | ||||||||||||
| Curtailment rates | 28.71 | % | 27.77 | % | Average total portfolio rate | ||||||||||||
| Recovery delay | 30 months | 29 months | Average across all pools | ||||||||||||||
| Economic forecast | Moody's downside S2 weighted 55%, Baseline weighted 45% | Moody's downside weighted 80% S2, 20% S3 | Moody's US Macro Forecast Narratives for December 2022 & 2021 | ||||||||||||||
| Unemployment rates | 4.96 | % | 6.29 | % | Average of 4 quarter forecast period | ||||||||||||
| GDP rates | 0.12 | % | 2.13 | % | Average of 4 quarter forecast period | ||||||||||||
| House price index | (3.35) | % | 3.04 | % | Average of 4 quarter forecast period | ||||||||||||
Sensitivity Analysis
The below table indicates the impact to the allowance for credit losses on loans and leases if the factors described below were adjusted in the Corporation's CECL model.
| Increase (Decrease) ($) | Adjustment Factor | ||||||||||
| Prepayment rates | +/- 1,900 | If rates were adjusted across all pools by +/-100 basis points | |||||||||
| Curtailment rates | +/- 450 | If rates were adjusted across all pools by +/- 100 basis points | |||||||||
| Recovery delay | +/- 2,900 | If recovery delays were adjusted by +/- 3 months across all pools | |||||||||
| Economic forecast | (12,600) | If Baseline forecasts were used instead of the weighted Downside/Baseline scenarios | |||||||||
| Economic forecast | 11,100 | If S2 Downside forecasts were used instead of the weighted Downside/Baseline scenarios | |||||||||
| Economic forecast | 26,500 | If S3 Downside forecasts were used instead of the weighted Downside/Baseline scenarios | |||||||||
| Unemployment rates | 11,900 | If rates were increased across all pools by 100 basis points | |||||||||
| Unemployment rates | (11,000) | If rates were decreased across all pools by 100 basis points | |||||||||
| GDP rates | +/- 800 | If the GDP forecast inputs were adjusted by +/- 100 basis points | |||||||||
| House price index | +/- 140 | If the HPI forecast inputs were adjusted by +/- 100 basis points | |||||||||
| Reversion period | (600) | If the reversion period was increased by 2 quarters across all pools | |||||||||
| Reversion period | 350 | If the reversion period was decreased by 2 quarters across all pools | |||||||||
Readers of the Corporation’s financial statements should be aware that the estimates and assumptions used in the Corporation’s current financial statements may need to be updated in future financial presentations for changes in circumstances, business or economic conditions in order to fairly represent the condition of the Corporation at that time.
General
The Corporation earns revenues primarily from the margins and fees generated from the lending and depository services as well as fee-based income from trust, insurance, mortgage banking, treasury management and investment services. The Corporation seeks to achieve adequate and reliable earnings through business growth while maintaining adequate levels of capital and liquidity and limiting exposure to credit and interest rate risk.
23
Selected Financial Data
| For the Years Ended December 31, | |||||||||||||||||||||||||||||
| (Dollars in thousands, except per share data) | 2022 | 2021 | 2020 | 2019 | 2018 | ||||||||||||||||||||||||
| Earnings | |||||||||||||||||||||||||||||
| Interest income | $ | 252,193 | $ | 209,731 | $ | 203,945 | $ | 214,093 | $ | 190,488 | |||||||||||||||||||
| Interest expense | 33,896 | 21,348 | 29,584 | 44,861 | 32,426 | ||||||||||||||||||||||||
| Net interest income | 218,297 | 188,383 | 174,361 | 169,232 | 158,062 | ||||||||||||||||||||||||
| Provision (reversal of provision) for credit losses (1) | 12,198 | (10,132) | 40,794 | 8,511 | 20,310 | ||||||||||||||||||||||||
| Net interest income after provision for credit losses | 206,099 | 198,515 | 133,567 | 160,721 | 137,752 | ||||||||||||||||||||||||
| Noninterest income | 77,885 | 83,224 | 78,328 | 65,422 | 60,173 | ||||||||||||||||||||||||
| Noninterest expense | 186,774 | 167,409 | 154,998 | 146,090 | 137,239 | ||||||||||||||||||||||||
| Net income before income taxes | 97,210 | 114,330 | 56,897 | 80,053 | 60,686 | ||||||||||||||||||||||||
| Income taxes | 19,090 | 22,529 | 9,981 | 14,334 | 10,143 | ||||||||||||||||||||||||
| Net income | $ | 78,120 | $ | 91,801 | $ | 46,916 | $ | 65,719 | $ | 50,543 | |||||||||||||||||||
| Financial Condition at Year End | |||||||||||||||||||||||||||||
| Cash and cash equivalents | $ | 152,799 | $ | 890,150 | $ | 219,858 | $ | 125,128 | $ | 109,420 | |||||||||||||||||||
| Investment securities, net of allowance for credit losses (2) | 507,562 | 496,989 | 373,176 | 441,599 | 473,306 | ||||||||||||||||||||||||
| Net loans and leases held for investment | 6,044,226 | 5,238,093 | 5,223,797 | 4,351,505 | 3,977,210 | ||||||||||||||||||||||||
| Assets | 7,222,016 | 7,122,421 | 6,336,496 | 5,380,924 | 4,984,347 | ||||||||||||||||||||||||
| Deposits | 5,913,526 | 6,055,124 | 5,242,715 | 4,360,075 | 3,885,933 | ||||||||||||||||||||||||
| Borrowings | 440,401 | 213,980 | 311,421 | 263,596 | 429,672 | ||||||||||||||||||||||||
| Shareholders' equity | 776,500 | 773,794 | 692,472 | 675,122 | 624,133 | ||||||||||||||||||||||||
| Per Common Share Data | |||||||||||||||||||||||||||||
| Average shares outstanding (in thousands) | 29,393 | 29,403 | 29,244 | 29,300 | 29,370 | ||||||||||||||||||||||||
| Earnings per share – basic | $ | 2.66 | $ | 3.12 | $ | 1.60 | $ | 2.24 | $ | 1.72 | |||||||||||||||||||
| Earnings per share – diluted | 2.64 | 3.11 | 1.60 | 2.24 | 1.72 | ||||||||||||||||||||||||
| Dividends declared per share | 0.83 | 0.80 | 0.60 | 0.80 | 0.80 | ||||||||||||||||||||||||
| Book value (at year-end) | 26.53 | 26.23 | 23.64 | 23.01 | 21.32 | ||||||||||||||||||||||||
| Dividends declared to net income | 31.2 | % | 25.6 | % | 37.4 | % | 35.7 | % | 46.5 | % | |||||||||||||||||||
| Profitability Ratios | |||||||||||||||||||||||||||||
| Return on average assets | 1.12 | % | 1.38 | % | 0.78 | % | 1.26 | % | 1.07 | % | |||||||||||||||||||
| Return on average equity | 10.13 | 12.50 | 7.02 | 10.07 | 8.26 | ||||||||||||||||||||||||
| Average equity to average assets | 11.09 | 11.04 | 11.12 | 12.49 | 12.92 | ||||||||||||||||||||||||
| Efficiency ratio | 62.4 | 60.9 | 60.6 | 61.4 | 61.9 | ||||||||||||||||||||||||
| Asset Quality Ratios | |||||||||||||||||||||||||||||
| Nonaccrual loans and leases (including nonaccrual, troubled debt restructured loans and lease modifications) to loans and leases held for investment | 0.22 | % | 0.63 | % | 0.60 | % | 0.88 | % | 0.65 | % | |||||||||||||||||||
| Nonperforming loans and leases to loans and leases held for investment | 0.23 | 0.64 | 0.62 | 0.88 | 0.67 | ||||||||||||||||||||||||
| Nonperforming assets to total assets | 0.46 | 0.48 | 0.64 | 0.73 | 0.56 | ||||||||||||||||||||||||
| Net charge-offs to average loans and leases outstanding | 0.07 | — | 0.10 | 0.06 | 0.33 | ||||||||||||||||||||||||
| Allowance for credit losses, loans and leases to total loans and leases held for investment | 1.29 | 1.35 | 1.56 | 0.81 | 0.73 | ||||||||||||||||||||||||
| Allowance for credit losses, loans and leases to nonaccrual loans and leases | 591.66 | 216.57 | 262.03 | 91.58 | 112.04 | ||||||||||||||||||||||||
| Allowance for credit losses, loans and leases to nonperforming loans and leases | 553.37 | 213.05 | 250.61 | 91.12 | 108.99 | ||||||||||||||||||||||||
|
(1) The Corporation adopted CECL effective January 1, 2020. Amounts reported for 2018 and 2019 were previously referred to as provision for loan and lease losses in prior filings and accounted for under legacy accounting standards.
|
|||||||||||||||||||||||||||||
|
(2) The Corporation adopted CECL effective January 1, 2020. Investment securities at December 31, 2018 and 2019 did not include an allowance for credit loss.
|
|||||||||||||||||||||||||||||
24
Executive Overview
The Corporation's consolidated net income, earnings per share and return on average assets and average equity were as follows:
| For the Years Ended December 31, | Amount of Change | Percent Change | |||||||||||||||||||||||||||||||||||||||
| (Dollars in thousands, except per share data) | 2022 | 2021 | 2020 | 2022 to 2021 | 2021 to 2020 | 2022 to 2021 | 2021 to 2020 | ||||||||||||||||||||||||||||||||||
| Net income | $ | 78,120 | $ | 91,801 | $ | 46,916 | $ | (13,681) | $ | 44,885 | (14.9) | % | 95.7 | % | |||||||||||||||||||||||||||
| Net income per share: | |||||||||||||||||||||||||||||||||||||||||
| Basic | $ | 2.66 | $ | 3.12 | $ | 1.60 | $ | (0.46) | $ | 1.52 | (14.7) | 95.0 | |||||||||||||||||||||||||||||
| Diluted | 2.64 | 3.11 | 1.60 | (0.47) | 1.51 | (15.1) | 94.4 | ||||||||||||||||||||||||||||||||||
| Return on average assets | 1.12 | % | 1.38 | % | 0.78 | % | (26) BP | 60 BP | (18.8) | 76.9 | |||||||||||||||||||||||||||||||
| Return on average equity | 10.13 | % | 12.50 | % | 7.02 | % | (237) BP | 548 BP | (19.0) | 78.1 | |||||||||||||||||||||||||||||||
2022 Overview
The Corporation reported net income of $78.1 million, or $2.64 diluted earnings per share, for 2022 compared to net income of $91.8 million, or $3.11 diluted earnings per share, for 2021.
During the year ended December 31, 2022, the Corporation recorded CECL related charges of $12.2 million. The financial results for the year ended December 31, 2022 also included bank owned life insurance ("BOLI") death benefit claims of $977 thousand, or $0.03 diluted earnings per share.
During the year ended December 31, 2022, the Corporation recorded $3.8 million in expenses, or $0.10 diluted earnings per share, related to the development of a comprehensive digital platform, which will blend our core operating systems together and allow Univest to seamlessly deliver existing products and services, digitally, across an expanded footprint.
2021 Overview
The Corporation reported net income of $91.8 million, or $3.11 diluted earnings per share, for 2021 compared to net income of $46.9 million, or $1.60 diluted earnings per share, for 2020.
During the year ended December 31, 2021, the Corporation reversed CECL related charges of $10.1 million, of which $17.9 million (after-tax benefit of $14.2 million), or $0.48 diluted earnings per share, was attributable to favorable changes in economic-related assumptions within the CECL model partially offset by a $7.4 million increase in reserves for loans.
The financial results for the year ended December 31, 2021 included tax-free bank owned life insurance ("BOLI") death benefit claims of $1.1 million, or $0.04 diluted earnings per share, and income of $15.0 million, or $0.40 diluted earnings per share, within net interest income related to PPP loans, of which $10.4 million was the result of recognition of associated net deferred loan fees upon forgiveness and pay downs of PPP loans totaling $630.7 million.
Results of Operations
Net Interest Income
Net interest income is the difference between interest earned primarily on loans and leases and investment securities and interest paid on deposits, borrowings, long-term debt and subordinated notes. Net interest income is the principal source of the Corporation's revenue. Table 1 presents the Corporation's average balances, tax-equivalent interest income, interest expense, tax-equivalent yields earned on average assets, cost of average liabilities, and shareholders' equity on a tax-equivalent basis for the years ended December 31, 2022, 2021 and 2020. The tax-equivalent net interest margin is tax-equivalent net interest income as a percentage of average interest-earning assets. The tax-equivalent net interest spread represents the weighted average tax-equivalent yield on interest-earning assets less the weighted average cost of interest-bearing liabilities. The effect of net interest-free funding sources represents the effect on the net interest margin of net funding provided by noninterest-earning assets, noninterest-bearing liabilities and shareholders' equity. Table 2 analyzes the changes in the tax-equivalent net interest income for the periods broken down by their rate and volume components.
25
2022 versus 2021
Reported net interest income for the year ended December 31, 2022 was $218.3 million, an increase of $29.9 million, or 15.9%, from the prior year. Net interest income, on a tax-equivalent basis, for the year ended December 31, 2022 was $220.2 million, an increase of $29.7 million, or 15.6%, from the prior year. The increase in tax-equivalent net interest income was due to an increase in interest income of $42.2 million, primarily driven by increases in asset yields, including loans and investments, due to the rising interest rate environment, coupled with significant loan growth in commercial, commercial real estate and construction loans, offset by a decrease in PPP loan income of $14.2 million. These increases were offset by an increase of $12.5 million in the cost of interest-bearing deposits, due to the rising interest rate environment. The net interest margin on a tax-equivalent basis for the year ended December 31, 2022 was 3.38% compared to 3.06% for 2021. The net interest margin increase was attributable to loan growth, the rapid increase in interest rates and the asset sensitivity of the Corporation's balance sheet, offset by an increase in cost of funds.
2021 versus 2020
Reported net interest income for the year ended December 31, 2021 was $188.4 million, an increase of $14.0 million, or 8.0%, from the prior year. Net interest income, on a tax-equivalent basis, for the year ended December 31, 2021 was $190.5 million, an increase of $13.7 million, or 7.7%, from the prior year. The increase in reported and tax-equivalent net interest income was primarily due to an increase in PPP loan income of $7.0 million, an $8.2 million decrease in the cost of interest-bearing liabilities and growth in loans, primarily commercial real estate loans, partially offset by a decrease in loan yields, excluding PPP loans, and investment yields. The net interest margin on a tax-equivalent basis for the year ended December 31, 2021 was 3.06% compared to 3.16% for 2020. The net interest margin decrease was attributable to increased levels of excess liquidity in 2021 driven by strong deposit growth, primarily due to the various pandemic-related stimulus initiatives offset by the favorable impact of fully forgiven PPP loans.
26
Table 1—Average Balances and Interest Rates—Tax-Equivalent Basis
| For the Years Ended December 31, | |||||||||||||||||||||||||||||||||||||||||||||||||||||
| 2022 | 2021 | 2020 | |||||||||||||||||||||||||||||||||||||||||||||||||||
| (Dollars in thousands) |
Average
Balance |
Income/
Expense |
Average
Rate |
Average
Balance |
Income/
Expense |
Average
Rate |
Average
Balance |
Income/
Expense |
Average
Rate |
||||||||||||||||||||||||||||||||||||||||||||
| Assets: | |||||||||||||||||||||||||||||||||||||||||||||||||||||
| Interest-earning deposits with other banks | $ | 325,875 | $ | 1,920 | 0.59 | % | $ | 476,351 | $ | 661 | 0.14 | % | $ | 274,372 | $ | 574 | 0.21 | % | |||||||||||||||||||||||||||||||||||
| U.S. government obligations | 1,929 | 40 | 2.07 | 6,999 | 144 | 2.06 | 7,132 | 145 | 2.03 | ||||||||||||||||||||||||||||||||||||||||||||
|
Obligations of states and political
subdivisions* |
2,302 | 71 | 3.08 | 5,702 | 206 | 3.61 | 23,065 | 825 | 3.58 | ||||||||||||||||||||||||||||||||||||||||||||
| Other debt and equity securities | 510,961 | 11,392 | 2.23 | 393,762 | 5,992 | 1.52 | 371,814 | 7,697 | 2.07 | ||||||||||||||||||||||||||||||||||||||||||||
| Federal Home Loan Bank, Federal Reserve Bank and other stock | 27,784 | 1,627 | 5.86 | 26,844 | 1,417 | 5.28 | 29,726 | 1,746 | 5.87 | ||||||||||||||||||||||||||||||||||||||||||||
| Total interest-earning deposits, investments and other interest-earning assets | 868,851 | 15,050 | 1.73 | 909,658 | 8,420 | 0.93 | 706,109 | 10,987 | 1.56 | ||||||||||||||||||||||||||||||||||||||||||||
| Commercial, financial and agricultural loans | 955,816 | 43,064 | 4.51 | 840,133 | 28,142 | 3.35 | 817,489 | 30,657 | 3.75 | ||||||||||||||||||||||||||||||||||||||||||||
| Paycheck Protection Program loans | 7,939 | 797 | 10.04 | 281,484 | 15,032 | 5.34 | 342,920 | 8,072 | 2.35 | ||||||||||||||||||||||||||||||||||||||||||||
| Real estate—commercial and construction loans | 3,060,689 | 127,906 | 4.18 | 2,734,259 | 101,692 | 3.72 | 2,312,996 | 94,962 | 4.11 | ||||||||||||||||||||||||||||||||||||||||||||
| Real estate—residential loans | 1,219,275 | 47,472 | 3.89 | 1,077,952 | 40,045 | 3.71 | 1,007,915 | 42,047 | 4.17 | ||||||||||||||||||||||||||||||||||||||||||||
| Loans to individuals | 26,642 | 1,325 | 4.97 | 26,062 | 1,018 | 3.91 | 28,792 | 1,332 | 4.63 | ||||||||||||||||||||||||||||||||||||||||||||
| Municipal loans and leases* | 236,858 | 9,703 | 4.10 | 247,396 | 10,147 | 4.10 | 283,495 | 11,857 | 4.18 | ||||||||||||||||||||||||||||||||||||||||||||
| Lease financings | 144,046 | 8,791 | 6.10 | 115,189 | 7,363 | 6.39 | 95,194 | 6,498 | 6.83 | ||||||||||||||||||||||||||||||||||||||||||||
| Gross loans and leases | 5,651,265 | 239,058 | 4.23 | 5,322,475 | 203,439 | 3.82 | 4,888,801 | 195,425 | 4.00 | ||||||||||||||||||||||||||||||||||||||||||||
| Total interest-earning assets | 6,520,116 | 254,108 | 3.90 | 6,232,133 | 211,859 | 3.40 | 5,594,910 | 206,412 | 3.69 | ||||||||||||||||||||||||||||||||||||||||||||
| Cash and due from banks | 57,196 | 55,724 | 52,000 | ||||||||||||||||||||||||||||||||||||||||||||||||||
| Allowance for credit losses, loans and leases | (72,069) | (74,943) | (73,459) | ||||||||||||||||||||||||||||||||||||||||||||||||||
| Premises and equipment, net | 51,362 | 55,875 | 55,888 | ||||||||||||||||||||||||||||||||||||||||||||||||||
| Operating lease right-of-use asset | 30,443 | 32,758 | 34,277 | ||||||||||||||||||||||||||||||||||||||||||||||||||
| Other assets | 369,244 | 353,896 | 343,261 | ||||||||||||||||||||||||||||||||||||||||||||||||||
| Total assets | $ | 6,956,292 | $ | 6,655,443 | $ | 6,006,877 | |||||||||||||||||||||||||||||||||||||||||||||||
| Liabilities: | |||||||||||||||||||||||||||||||||||||||||||||||||||||
| Interest-bearing checking deposits | $ | 884,656 | $ | 5,010 | 0.57 | % | $ | 850,713 | $ | 2,007 | 0.24 | % | $ | 692,049 | $ | 2,173 | 0.31 | % | |||||||||||||||||||||||||||||||||||
| Money market savings | 1,389,226 | 13,835 | 1.00 | 1,366,762 | 3,574 | 0.26 | 1,113,039 | 5,551 | 0.50 | ||||||||||||||||||||||||||||||||||||||||||||
| Regular savings | 1,056,019 | 1,269 | 0.12 | 983,752 | 1,114 | 0.11 | 874,366 | 2,057 | 0.24 | ||||||||||||||||||||||||||||||||||||||||||||
| Time deposits | 443,845 | 5,308 | 1.20 | 498,638 | 6,178 | 1.24 | 572,103 | 9,835 | 1.72 | ||||||||||||||||||||||||||||||||||||||||||||
| Total time and interest-bearing deposits | 3,773,746 | 25,422 | 0.67 | 3,699,865 | 12,873 | 0.35 | 3,251,557 | 19,616 | 0.60 | ||||||||||||||||||||||||||||||||||||||||||||
| Short-term borrowings | 60,468 | 1,389 | 2.30 | 16,552 | 8 | 0.05 | 86,658 | 327 | 0.38 | ||||||||||||||||||||||||||||||||||||||||||||
| Long-term debt | 95,000 | 1,287 | 1.35 | 96,562 | 1,318 | 1.36 | 189,410 | 2,879 | 1.52 | ||||||||||||||||||||||||||||||||||||||||||||
| Subordinated notes | 105,356 | 5,798 | 5.50 | 137,896 | 7,149 | 5.18 | 134,949 | 6,762 | 5.01 | ||||||||||||||||||||||||||||||||||||||||||||
| Total borrowings | 260,824 | 8,474 | 3.25 | 251,010 | 8,475 | 3.38 | 411,017 | 9,968 | 2.43 | ||||||||||||||||||||||||||||||||||||||||||||
| Total interest-bearing liabilities | 4,034,570 | 33,896 | 0.84 | 3,950,875 | 21,348 | 0.54 | 3,662,574 | 29,584 | 0.81 | ||||||||||||||||||||||||||||||||||||||||||||
| Noninterest-bearing deposits | 2,068,086 | 1,891,330 | 1,599,333 | ||||||||||||||||||||||||||||||||||||||||||||||||||
| Operating lease liabilities | 33,508 | 36,001 | 37,557 | ||||||||||||||||||||||||||||||||||||||||||||||||||
| Accrued expenses and other liabilities | 48,629 | 42,781 | 39,212 | ||||||||||||||||||||||||||||||||||||||||||||||||||
| Total liabilities | 6,184,793 | 5,920,987 | 5,338,676 | ||||||||||||||||||||||||||||||||||||||||||||||||||
| Shareholders' Equity: | |||||||||||||||||||||||||||||||||||||||||||||||||||||
| Common stock | 157,784 | 157,784 | 157,784 | ||||||||||||||||||||||||||||||||||||||||||||||||||
| Additional paid-in capital | 299,121 | 297,189 | 296,023 | ||||||||||||||||||||||||||||||||||||||||||||||||||
| Retained earnings and other equity | 314,594 | 279,483 | 214,394 | ||||||||||||||||||||||||||||||||||||||||||||||||||
| Total shareholders' equity | 771,499 | 734,456 | 668,201 | ||||||||||||||||||||||||||||||||||||||||||||||||||
| Total liabilities and shareholders' equity | $ | 6,956,292 | $ | 6,655,443 | $ | 6,006,877 | |||||||||||||||||||||||||||||||||||||||||||||||
| Net interest income | $ | 220,212 | $ | 190,511 | $ | 176,828 | |||||||||||||||||||||||||||||||||||||||||||||||
| Net interest spread | 3.06 | 2.86 | 2.88 | ||||||||||||||||||||||||||||||||||||||||||||||||||
| Effect of net interest-free funding sources | 0.32 | 0.20 | 0.28 | ||||||||||||||||||||||||||||||||||||||||||||||||||
| Net interest margin | 3.38 | % | 3.06 | % | 3.16 | % | |||||||||||||||||||||||||||||||||||||||||||||||
| Ratio of average interest-earning assets to average interest-bearing liabilities | 161.61 | % | 157.74 | % | 152.76 | % | |||||||||||||||||||||||||||||||||||||||||||||||
*Obligations of states and political subdivisions and municipal loans and leases are tax-exempt earning assets.
Notes: For rate calculation purposes, average loan and lease categories include deferred fees and costs and purchase accounting adjustments.
Net interest income includes net deferred (costs)/fees (amortization)/accretion of $(1.8) million, $8.7 million and $893 thousand for the years ended December 31, 2022, 2021 and 2020, respectively.
Nonaccrual loans and leases have been included in the average loan and lease balances. Loans held for sale have been included in the average loan balances.
Tax-equivalent amounts for the years ended December 31, 2022, 2021 and 2020 have been calculated using the Corporation's federal applicable rate of 21%.
27
Table 2—Analysis of Changes in Net Interest Income
The rate-volume variance analysis set forth in the table below compares changes in tax-equivalent net interest income for the year ended December 31, 2022 compared to 2021 and for the year ended December 31, 2021 compared to 2020, indicated by their rate and volume components. The change in interest income/expense due to both volume and rate has been allocated proportionately.
| For the Years Ended December 31, 2022 Versus 2021 | For the Years Ended December 31, 2021 Versus 2020 | ||||||||||||||||||||||||||||||||||
| (Dollars in thousands) |
Volume
Change |
Rate
Change |
Total |
Volume
Change |
Rate
Change |
Total | |||||||||||||||||||||||||||||
| Interest income: | |||||||||||||||||||||||||||||||||||
| Interest-earning deposits with other banks | $ | (271) | $ | 1,530 | $ | 1,259 | $ | 324 | $ | (237) | $ | 87 | |||||||||||||||||||||||
| U.S. government obligations | (105) | 1 | (104) | (3) | 2 | (1) | |||||||||||||||||||||||||||||
| Obligations of states and political subdivisions | (109) | (26) | (135) | (626) | 7 | (619) | |||||||||||||||||||||||||||||
| Other debt and equity securities | 2,101 | 3,299 | 5,400 | 433 | (2,138) | (1,705) | |||||||||||||||||||||||||||||
| Federal Home Loan Bank, Federal Reserve Bank and other stock | 51 | 159 | 210 | (162) | (167) | (329) | |||||||||||||||||||||||||||||
| Interest on deposits, investments and other interest-earning assets | 1,667 | 4,963 | 6,630 | (34) | (2,533) | (2,567) | |||||||||||||||||||||||||||||
| Commercial, financial and agricultural loans | 4,245 | 10,677 | 14,922 | 830 | (3,345) | (2,515) | |||||||||||||||||||||||||||||
| Paycheck Protection Program loans | (21,354) | 7,119 | (14,235) | (1,672) | 8,632 | 6,960 | |||||||||||||||||||||||||||||
| Real estate—commercial and construction loans | 12,876 | 13,338 | 26,214 | 16,286 | (9,556) | 6,730 | |||||||||||||||||||||||||||||
| Real estate—residential loans | 5,421 | 2,006 | 7,427 | 2,810 | (4,812) | (2,002) | |||||||||||||||||||||||||||||
| Loans to individuals | 24 | 283 | 307 | (119) | (195) | (314) | |||||||||||||||||||||||||||||
| Municipal loans and leases | (444) | — | (444) | (1,486) | (224) | (1,710) | |||||||||||||||||||||||||||||
| Lease financings | 1,775 | (347) | 1,428 | 1,303 | (438) | 865 | |||||||||||||||||||||||||||||
| Interest and fees on loans and leases | 2,543 | 33,076 | 35,619 | 17,952 | (9,938) | 8,014 | |||||||||||||||||||||||||||||
| Total interest income | 4,210 | 38,039 | 42,249 | 17,918 | (12,471) | 5,447 | |||||||||||||||||||||||||||||
| Interest expense: | |||||||||||||||||||||||||||||||||||
| Interest-bearing checking deposits | 84 | 2,919 | 3,003 | 404 | (570) | (166) | |||||||||||||||||||||||||||||
| Money market savings | 59 | 10,202 | 10,261 | 1,084 | (3,061) | (1,977) | |||||||||||||||||||||||||||||
| Regular savings | 69 | 86 | 155 | 250 | (1,193) | (943) | |||||||||||||||||||||||||||||
| Time deposits | (673) | (197) | (870) | (1,153) | (2,504) | (3,657) | |||||||||||||||||||||||||||||
| Total time and interest-bearing deposits | (461) | 13,010 | 12,549 | 585 | (7,328) | (6,743) | |||||||||||||||||||||||||||||
| Short-term borrowings | 77 | 1,304 | 1,381 | (154) | (165) | (319) | |||||||||||||||||||||||||||||
| Long-term debt | (21) | (10) | (31) | (1,285) | (276) | (1,561) | |||||||||||||||||||||||||||||
| Subordinated notes | (1,770) | 419 | (1,351) | 152 | 235 | 387 | |||||||||||||||||||||||||||||
| Interest on borrowings | (1,714) | 1,713 | (1) | (1,287) | (206) | (1,493) | |||||||||||||||||||||||||||||
| Total interest expense | (2,175) | 14,723 | 12,548 | (702) | (7,534) | (8,236) | |||||||||||||||||||||||||||||
| Net interest income | $ | 6,385 | $ | 23,316 | $ | 29,701 | $ | 18,620 | $ | (4,937) | $ | 13,683 | |||||||||||||||||||||||
28
Provision for Credit Losses
The provision for credit losses for the years ended December 31, 2022 and 2020 was $12.2 million and $40.8 million, respectively. The reversal of provision for credit losses for the year ended December 31, 2021 was $10.1 million. Net loan and lease charge-offs for the years ended December 31, 2022, 2021, and 2020 were $3.9 million, $213 thousand and $4.6 million, respectively. The increase in charge-offs in 2022 was due to $3.3 million in charge-offs related to two commercial real estate loans totaling $5.8 million. See Executive Overview for additional information. The following table details information pertaining to the Corporation's allowance for credit losses on loans and leases as a percentage of loans and leases held for investment at the dates indicated.
| December 31, | |||||||||||||||||
| (Dollars in thousands) | 2022 | 2021 | 2020 | ||||||||||||||
| Allowance for credit losses, loans and leases | $ | 79,004 | $ | 71,924 | $ | 83,044 | |||||||||||
| Loans and leases held for investment | 6,123,230 | 5,310,017 | 5,306,841 | ||||||||||||||
| Allowance for credit losses, loans and leases / loans and leases held for investment | 1.29 | % | 1.35 | % | 1.56 | % | |||||||||||
Noninterest Income
The following table presents noninterest income for the years ended December 31, 2022, 2021 and 2020:
| For the Years Ended December 31, | $ Change | % Change | |||||||||||||||||||||||||||||||||||||||
| (Dollars in thousands) | 2022 | 2021 | 2020 | 2022 to 2021 | 2021 to 2020 | 2022 to 2021 | 2021 to 2020 | ||||||||||||||||||||||||||||||||||
| Trust fee income | $ | 7,743 | $ | 8,403 | $ | 7,703 | $ | (660) | $ | 700 | (7.9) | % | 9.1 | % | |||||||||||||||||||||||||||
| Service charges on deposit accounts | 6,175 | 5,504 | 4,845 | 671 | 659 | 12.2 | 13.6 | ||||||||||||||||||||||||||||||||||
| Investment advisory commission and fee income | 19,748 | 18,936 | 15,944 | 812 | 2,992 | 4.3 | 18.8 | ||||||||||||||||||||||||||||||||||
| Insurance commission and fee income | 19,065 | 16,357 | 16,087 | 2,708 | 270 | 16.6 | 1.7 | ||||||||||||||||||||||||||||||||||
| Other service fee income | 12,425 | 10,275 | 7,543 | 2,150 | 2,732 | 20.9 | 36.2 | ||||||||||||||||||||||||||||||||||
| Bank owned life insurance income | 3,787 | 3,981 | 2,940 | (194) | 1,041 | (4.9) | 35.4 | ||||||||||||||||||||||||||||||||||
| Net gain on sales of investment securities | 30 | 145 | 871 | (115) | (726) | (79.3) | (83.4) | ||||||||||||||||||||||||||||||||||
| Net gain on mortgage banking activities | 4,412 | 15,141 | 16,442 | (10,729) | (1,301) | (70.9) | (7.9) | ||||||||||||||||||||||||||||||||||
| Other income | 4,500 | 4,482 | 5,953 | 18 | (1,471) | 0.4 | (24.7) | ||||||||||||||||||||||||||||||||||
| Total noninterest income | $ | 77,885 | $ | 83,224 | $ | 78,328 | $ | (5,339) | $ | 4,896 | (6.4) | % | 6.3 | % | |||||||||||||||||||||||||||
2022 versus 2021
Noninterest income for the year ended December 31, 2022 was $77.9 million, a decrease of $5.3 millions, or 6.4%, compared to 2021.
Net gain on mortgage banking activities decreased $10.7 million, or 70.9%, for the year ended December 31, 2022, primarily due to a decrease in loan sales due to the higher interest rate environment and a contraction of gain on sale margins.
Insurance commission and fee income increased $2.7 million, or 16.6%, for the year ended December 31, 2022, primarily due to incremental revenue attributable to the acquisition of the Paul I. Sheaffer insurance agency in the fourth quarter of 2021.
Other service fee income increased $2.2 million, or 20.9%, for the year ended December 31, 2022, from the prior year. Servicing fees increased $1.3 million for the year ended December 31, 2022, driven by reduced amortization as a result of a decrease in prepayment speeds due to the higher interest rate environment. Additionally, interchange income increased $381 thousand for the year ended December 31, 2022, due to increased customer activity.
2021 versus 2020
Noninterest income for the year ended December 31, 2021 was $83.2 million, an increase of $4.9 million, or 6.3%, compared to 2020.
29
Investment advisory commission and fee income increased $3.0 million, or 18.8%, for the year ended December 31, 2021, due to increased assets under management driven by new customer relationships and favorable market conditions. BOLI income increased $1.0 million, or 35.4%, for the year ended December 31, 2021, primarily due to proceeds from BOLI death benefits of $1.1 million.
Other service fee income increased $2.7 million, or 36.2%, for the year ended December 31, 2021, from the prior year. Interchange income increased $1.2 million for the year ended December 31, 2021, due to increased customer activity. Mortgage
servicing fees increased $1.2 million for the year ended December 31, 2021, driven by an increase in retained servicing associated with elevated mortgage volume and reduced amortization due to decreased refinance activity and lower prepayment assumptions.
Net gain on mortgage banking activities decreased $1.3 million, or 7.9%, for the year ended December 31, 2021, due to a decrease in volume and contraction of margins.
Other income decreased $1.5 million, or 24.7%, for the year ended December 31, 2021. Fees on risk participation agreements for interest rate swaps decreased $3.5 million for the year ended December 31, 2021, driven by a decrease in customer demand. Gain on sale of small business administration (SBA) loans increased $1.3 million for the year ended December 31, 2021. This increase was reflective of the Corporation's continued commitment to delivering comprehensive financial solutions to small businesses through the expansion of the SBA lending team during the first half of 2021. Other income also increased $347 thousand driven by an increase in the fair value of equity securities during the year ended December 31, 2021.
Noninterest Expense
The following table presents noninterest expense for the years ended December 31, 2022, 2021 and 2020:
| For the Years Ended December 31, | $ Change | % Change | |||||||||||||||||||||||||||||||||||||||
| (Dollars in thousands) | 2022 | 2021 | 2020 | 2022 to 2021 | 2021 to 2020 | 2022 to 2021 | 2021 to 2020 | ||||||||||||||||||||||||||||||||||
| Salaries, benefits and commissions | $ | 115,806 | $ | 104,191 | $ | 93,208 | $ | 11,615 | $ | 10,983 | 11.1 | % | 11.8 | % | |||||||||||||||||||||||||||
| Net occupancy | 10,193 | 10,397 | 10,358 | (204) | 39 | (2.0) | 0.4 | ||||||||||||||||||||||||||||||||||
| Equipment | 3,904 | 3,899 | 3,841 | 5 | 58 | 0.1 | 1.5 | ||||||||||||||||||||||||||||||||||
| Data processing | 15,215 | 12,743 | 11,333 | 2,472 | 1,410 | 19.4 | 12.4 | ||||||||||||||||||||||||||||||||||
| Professional fees | 9,332 | 7,687 | 5,338 | 1,645 | 2,349 | 21.4 | 44.0 | ||||||||||||||||||||||||||||||||||
| Marketing and advertising | 2,462 | 2,063 | 1,975 | 399 | 88 | 19.3 | 4.5 | ||||||||||||||||||||||||||||||||||
| Deposit insurance premiums | 3,075 | 2,712 | 2,591 | 363 | 121 | 13.4 | 4.7 | ||||||||||||||||||||||||||||||||||
| Intangible expenses | 1,293 | 979 | 1,216 | 314 | (237) | 32.1 | (19.5) | ||||||||||||||||||||||||||||||||||
| Restructuring charges | 184 | — | 1,439 | 184 | (1,439) | N/M | N/M | ||||||||||||||||||||||||||||||||||
| Other expense | 25,310 | 22,738 | 23,699 | 2,572 | (961) | 11.3 | (4.1) | ||||||||||||||||||||||||||||||||||
| Total noninterest expense | $ | 186,774 | $ | 167,409 | $ | 154,998 | $ | 19,365 | $ | 12,411 | 11.6 | % | 8.0 | % | |||||||||||||||||||||||||||
2022 versus 2021
Noninterest expense for the year ended December 31, 2022 was $186.8 million, an increase of $19.4 million, or 11.6%, compared to 2021.
Salaries, benefits and commissions increased $11.6 million, or 11.1%, for the year ended December 31, 2022. This increase reflects the insurance acquisition in the fourth quarter of 2021, our expansion into Maryland and Western Pennsylvania and annual merit increases.
Data processing expense increased $2.5 million, or 19.4%, primarily due to continued investments in technology, general price increases, and $653 thousand in support of our digital transformation initiative, a comprehensive digital platform which will blend our core operating systems together and allow Univest to personalize experiences and seamlessly deliver existing products and services, digitally, across an expanded footprint.
30
Professional fees increased $1.6 million, or 21.4%, for the year ended December 31, 2022, primarily attributable to consulting fees totaling $3.0 million during 2022 in support of our digital transformation initiative. We had a $1.5 million investment in our Diversity, Equity and Inclusion training initiatives for the year ended December 31, 2021.
Other expense increased $2.6 million, or 11.3%, primarily driven by increases in travel and entertainment expenses of $907 thousand and $773 thousand of fraud losses.
2021 versus 2020
Noninterest expense for the year ended December 31, 2021 was $167.4 million, an increase of $12.4 million, or 8.0%, compared to 2020.
Salaries, benefits and commissions increased $11.0 million, or 11.8%, for the year ended December 31, 2021. The increase reflects our continued investment in revenue producing staff across all business lines and annual merit increases. Variable incentive compensation expenses increased $3.6 million from the prior year due to increased profitability. Additionally, the Corporation modified the vesting criteria for performance-based restricted stock grants in 2020 to better reflect the operating environment, which resulted in a benefit of $928 thousand in salaries, benefits and commissions in the fourth quarter of 2020.
Professional fees increased $2.3 million, or 44.0%, for the year ended December 31, 2021, primarily attributable to consulting fees totaling $1.5 million during 2021 in support of our Diversity, Equity and Inclusion program, training initiatives and treasury management product enhancements. Data processing expense increased $1.4 million, or 12.4%, primarily due to continued investments in our end-to-end loan origination solution for loans below $1.0 million, customer relationship management software, internal infrastructure improvements and outsourced data processing solutions.
Restructuring charges decreased $1.4 million for the year ended December 31, 2021. These charges related to the Corporation's financial center optimization plan announced in 2020. Other expense decreased $961 thousand, or 4.1%, primarily driven by extinguishment of long-term debt expense of $1.8 million for the year ended December 31, 2020, offset primarily by increases in interchange expense driven by increased customer activity.
Tax Provision
The provision for income taxes was $19.1 million, $22.5 million and $10.0 million for the years ended December 31, 2022, 2021 and 2020, respectively, at effective rates of 19.6%, 19.7% and 17.5%, respectively. The effective tax rates reflect the benefits of tax-exempt income from investments in municipal securities and loans and leases. Excluding this impact, the effective tax rate was 21.3% for the years ended December 31, 2022, 2021, and 2020.
Financial Condition
ASSETS
The following table presents assets at the dates indicated:
| At December 31, | |||||||||||||||||||||||
| (Dollars in thousands) | 2022 | 2021 | $ Change | % Change | |||||||||||||||||||
| Cash and cash equivalents | $ | 152,799 | $ | 890,150 | $ | (737,351) | (82.8) | % | |||||||||||||||
| Investment securities, net of allowance for credit losses | 507,562 | 496,989 | 10,573 | 2.1 | |||||||||||||||||||
| Federal Home Loan Bank, Federal Reserve Bank and other stock, at cost | 33,841 | 28,186 | 5,655 | 20.1 | |||||||||||||||||||
| Loans held for sale | 5,037 | 21,600 | (16,563) | (76.7) | |||||||||||||||||||
| Loans and leases held for investment | 6,123,230 | 5,310,017 | 813,213 | 15.3 | |||||||||||||||||||
| Allowance for credit losses, loans and leases | (79,004) | (71,924) | (7,080) | 9.8 | |||||||||||||||||||
| Premises and equipment, net | 50,939 | 56,882 | (5,943) | (10.4) | |||||||||||||||||||
| Operating lease right-of-use asset | 30,059 | 30,407 | (348) | (1.1) | |||||||||||||||||||
| Goodwill and other intangibles, net | 186,894 | 187,358 | (464) | (0.2) | |||||||||||||||||||
| Bank owned life insurance | 120,297 | 118,699 | 1,598 | 1.3 | |||||||||||||||||||
| Accrued interest receivable and other assets | 90,362 | 54,057 | 36,305 | 67.2 | |||||||||||||||||||
| Total assets | $ | 7,222,016 | $ | 7,122,421 | $ | 99,595 | 1.4 | % | |||||||||||||||
31
Cash and Interest-Earning Deposits
Cash and interest-earning deposits decreased $737.4 million, or 82.8%, from December 31, 2021, primarily due to decreased interest earning deposits at the Federal Reserve Bank of $780.9 million as such funds were used to fund loan growth and deposit outflows.
Investment Securities
Total investment securities at December 31, 2022 increased $10.6 million, or 2.1%, from December 31, 2021. Purchases of $130.8 million, primarily residential mortgage-backed securities, were partially offset by maturities and pay-downs of $63.6 million, decreases in the fair value of available-for-sale investment securities of $49.2 million, sales of $5.5 million, net amortization of purchased premiums and discounts of $1.5 million and a provision for credit losses of $211 thousand.
Table 3—Investment Securities
The following table shows the carrying amount of investment securities, net of allowance for credit losses, at the dates indicated. Held-to-maturity, available-for-sale and equity security portfolios are combined.
| At December 31, | |||||||||||||||||
| (Dollars in thousands) | 2022 | 2021 | 2020 | ||||||||||||||
| U.S. government corporations and agencies | $ | — | $ | 6,999 | $ | 6,998 | |||||||||||
| State and political subdivisions | 2,285 | 2,333 | 13,537 | ||||||||||||||
| Residential mortgage-backed securities | 418,115 | 391,089 | 258,422 | ||||||||||||||
| Collateralized mortgage obligations | 2,322 | 3,278 | 5,321 | ||||||||||||||
| Corporate bonds | 82,261 | 90,291 | 85,619 | ||||||||||||||
| Equity securities | 2,579 | 2,999 | 3,279 | ||||||||||||||
| Total investment securities | $ | 507,562 | $ | 496,989 | $ | 373,176 | |||||||||||
Table 4—Investment Securities (Yields)
The following table shows the maturity distribution and weighted average yields of investment securities at amortized cost at December 31, 2022. Expected maturities may differ from contractual maturities because debt issuers may have the right to call or prepay obligations without call or prepayment penalties. Therefore, the stated yield may not be recognized in future periods. Additionally, residential mortgage-backed securities, which are collateralized by residential mortgage loans, typically prepay at a rate faster than the stated maturity. The weighted average yield is calculated by dividing income, which has not been tax effected on tax-exempt obligations, within each contractual maturity range by the outstanding amount of the related investment. Held-to-maturity and available-for-sale portfolios are combined, net of allowance for credit losses.
| 1 Year or less | After 1 Year to 5 Years | After 5 Years to 10 Years | After 10 Years | ||||||||||||||||||||||||||||||||||||||||||||
| (Dollars in thousands) | Amortized Cost | Weighted Average Yield | Amortized Cost | Weighted Average Yield | Amortized Cost | Weighted Average Yield | Amortized Cost | Weighted Average Yield | |||||||||||||||||||||||||||||||||||||||
| State and political subdivisions | $ | — | — | % | $ | 2,327 | 2.51 | % | $ | — | — | % | $ | — | — | % | |||||||||||||||||||||||||||||||
| Residential mortgage-backed securities | — | — | 2,518 | 2.30 | 16,475 | 2.50 | 441,258 | 2.26 | |||||||||||||||||||||||||||||||||||||||
| Collateralized mortgage obligations | — | — | — | — | 324 | 2.70 | 2,257 | 1.54 | |||||||||||||||||||||||||||||||||||||||
| Corporate bonds | 1,000 | 4.67 | 30,679 | 2.67 | 60,000 | 3.60 | — | — | |||||||||||||||||||||||||||||||||||||||
| Total held-to- maturity and available-for-sale investment securities | $ | 1,000 | 4.67 | % | $ | 35,524 | 2.63 | % | $ | 76,799 | 3.36 | % | $ | 443,515 | 2.26 | % | |||||||||||||||||||||||||||||||
At December 31, 2022, the Corporation had no reportable investments in any single issuer representing more than 10% of shareholders' equity.
Loans and Leases
Gross loans and leases held for investment at December 31, 2022 increased $813.2 million, or 15.3%, from December 31, 2021. Gross loans and leases held for investment, excluding the $29.6 million decrease in PPP loans, increased $842.8 million, or 16.0%, from December 31, 2021. The growth in gross loans and leases held for investment, excluding PPP loans, was primarily due to increases in commercial, commercial real estate, construction, residential mortgage loans and lease financings.
32
Table 5—Loan and Lease Maturities and Sensitivity to Changes in Interest Rates
The following table presents the maturity schedule of the loan and lease portfolio at December 31, 2022. Loans with variable rates or floating interest rates include adjustable rate instruments that may have longer than one month, and in some instances, multiple years of a fixed rate interest period.
| (Dollars in thousands) | Total | Due in One Year or Less | Due after One Year to Five Years | Due After Five Years to Fifteen Years | Due After Fifteen Years | ||||||||||||||||||||||||
| Loans and leases with fixed predetermined interest rates: | |||||||||||||||||||||||||||||
| Commercial, financial and agricultural | $ | 268,820 | $ | 18,243 | $ | 203,773 | $ | 42,902 | $ | 3,902 | |||||||||||||||||||
| Paycheck Protection Program | 2,147 | — | 2,147 | — | — | ||||||||||||||||||||||||
| Real estate-commercial | 1,379,182 | 112,434 | 1,027,024 | 229,739 | 9,985 | ||||||||||||||||||||||||
| Real estate-construction | 54,931 | 2,526 | 26,915 | 25,159 | 331 | ||||||||||||||||||||||||
| Real estate-residential secured for business purpose | 230,853 | 28,565 | 178,078 | 24,210 | — | ||||||||||||||||||||||||
| Real estate-residential secured for personal purpose | 62,864 | 2,446 | 11,816 | 12,789 | 35,813 | ||||||||||||||||||||||||
| Real estate-home equity secured for personal purpose | 7,890 | 1,072 | 836 | 5,933 | 49 | ||||||||||||||||||||||||
| Loans to individuals | 9,009 | 4,759 | 3,372 | 585 | 293 | ||||||||||||||||||||||||
| Lease financings | 211,315 | 8,431 | 187,431 | 15,453 | — | ||||||||||||||||||||||||
| Loans and leases with fixed predetermined interest rates | $ | 2,227,011 | $ | 178,476 | $ | 1,641,392 | $ | 356,770 | $ | 50,373 | |||||||||||||||||||
| Loans and leases with variable or floating interest rates: | |||||||||||||||||||||||||||||
| Commercial, financial and agricultural | $ | 817,961 | $ | 723,741 | $ | 73,554 | $ | 20,666 | $ | — | |||||||||||||||||||
| Real estate-commercial | 1,648,773 | 900,749 | 672,715 | 74,121 | 1,188 | ||||||||||||||||||||||||
| Real estate-construction | 326,880 | 205,883 | 41,408 | 58,266 | 21,323 | ||||||||||||||||||||||||
| Real estate-residential secured for business purpose | 247,401 | 64,381 | 167,568 | 15,452 | — | ||||||||||||||||||||||||
| Real estate-residential secured for personal purpose | 667,531 | 24,849 | 58,612 | 584,070 | — | ||||||||||||||||||||||||
| Real estate-home equity secured for personal purpose | 168,809 | 167,698 | 1,111 | — | — | ||||||||||||||||||||||||
| Loans to individuals | 18,864 | 18,583 | 5 | 276 | — | ||||||||||||||||||||||||
| Loans with variable or floating interest rates | $ | 3,896,219 | $ | 2,105,884 | $ | 1,014,973 | $ | 752,851 | $ | 22,511 | |||||||||||||||||||
| Total gross loans and leases held for investment | $ | 6,123,230 | $ | 2,284,360 | $ | 2,656,365 | $ | 1,109,621 | $ | 72,884 | |||||||||||||||||||
Asset Quality
The Bank's strategy for credit risk management focuses on having well-defined credit policies and uniform underwriting criteria and providing prompt attention to potential problem loans and leases. Performance of the loan and lease portfolio is monitored on a regular basis by Bank management and lending officers.
Nonaccrual loans and leases and accruing troubled debt restructured loans are loans or leases for which it is probable that not all principal and interest payments due will be collectible in accordance with the original contractual terms. Factors considered by management in determining accrual status include payment status, borrower cash flows, collateral value and the probability of collecting scheduled principal and interest payments when due.
At December 31, 2022, nonaccrual loans and leases and accruing troubled debt restructured loans were $13.4 million and had a related allowance for credit losses on loans and leases of $2.8 million. At December 31, 2021, nonaccrual loans and leases and accruing troubled debt restructured loans were $33.3 million and had a related allowance for credit losses on loans and leases of $11 thousand. During the second quarter, a nonaccrual commercial real estate loan was transferred to other real estate owned with an initial carrying value of $18.3 million. Individual reserves have been established based on current facts and management's judgments about the ultimate outcome of these credits, including the most recent known data available on any related underlying collateral and the borrower's cash flows. The amount of the individual reserve needed for these credits could change in future periods subject to changes in facts and judgments related to these credits.
Net loan and lease charge-offs for the year ended December 31, 2022 were $3.9 million compared to net loan and lease charge-offs of $213 thousand for the year ended December 31, 2021.
33
Other real estate owned was $19.3 million at December 31, 2022, compared to $279 thousand at December 31, 2021 due to the transfer of a nonaccrual commercial real estate loan to other real estate owned noted above.
Table 6—Nonaccrual and Past Due Loans and Leases; Troubled Debt Restructured Loans and Lease Modifications; Other Real Estate Owned; and Related Ratios
The following table details information pertaining to the Corporation's nonperforming assets at the dates indicated.
| At December 31, | |||||||||||||||||
| (Dollars in thousands) | 2022 | 2021 | 2020 | ||||||||||||||
| Nonaccrual loans and leases, including nonaccrual troubled debt restructured loans and lease modifications* | $ | 13,353 | $ | 33,210 | $ | 31,692 | |||||||||||
| Accruing troubled debt restructured loans and lease modifications not included in the above | 49 | 51 | 53 | ||||||||||||||
| Accruing loans and leases, 90 days or more past due | 875 | 498 | 1,392 | ||||||||||||||
| Total nonperforming loans and leases | $ | 14,277 | $ | 33,759 | $ | 33,137 | |||||||||||
| Other real estate owned | 19,258 | 279 | 7,355 | ||||||||||||||
| Total nonperforming assets | $ | 33,535 | $ | 34,038 | $ | 40,492 | |||||||||||
| * Nonaccrual troubled debt restructured loans and lease modifications included in nonaccrual loans and leases in the above table | $ | 767 | $ | 758 | $ | 14,069 | |||||||||||
| Loans and leases held for investment | $ | 6,123,230 | $ | 5,310,017 | $ | 5,306,841 | |||||||||||
| Allowance for credit losses, loans and leases | 79,004 | 71,924 | 83,044 | ||||||||||||||
| Allowance for credit losses, loans and leases / loans and leases held for investment | 1.29 | % | 1.35 | % | 1.56 | % | |||||||||||
| Nonaccrual loans and leases (including nonaccrual troubled debt restructured loans and lease modifications) / loans and leases held for investment | 0.22 | % | 0.63 | % | 0.60 | % | |||||||||||
| Allowance for credit losses, loans and leases / nonaccrual loans and leases | 591.66 | % | 216.57 | % | 262.03 | % | |||||||||||
The following table provides additional information on the Corporation's nonaccrual loans held for investment:
| At December 31, | |||||||||||||||||||||||
| (Dollars in thousands) | 2022 | 2021 | 2020 | 2019 | |||||||||||||||||||
| Total nonaccrual loans and leases, including nonaccrual troubled debt restructured loans and lease modifications | $ | 13,353 | $ | 33,210 | $ | 31,692 | $ | 38,578 | |||||||||||||||
| Nonaccrual loans and leases with partial charge-offs | 928 | 1,429 | 4,227 | 1,966 | |||||||||||||||||||
| Life-to-date partial charge-offs on nonaccrual loans and leases | 448 | 536 | 2,377 | 1,320 | |||||||||||||||||||
| Specific reserves on individually analyzed loans | 2,765 | 11 | 585 | 2,108 | |||||||||||||||||||
34
Table 7—Loan Concentration
The following table provides summarized detail related to outstanding commercial loan balances, excluding PPP loans, segmented by industry description as of December 31, 2022:
| (Dollars in thousands) | December 31, 2022 | ||||||||||
| Industry Description | Total Outstanding Balance (excl PPP) | % of Commercial Loan Portfolio | |||||||||
| CRE - Retail | $ | 440,112 | 8.8 | % | |||||||
| Animal Production | 340,877 | 6.9 | |||||||||
| CRE - Office | 292,740 | 5.9 | |||||||||
| CRE - Multi-family | 277,157 | 5.6 | |||||||||
| CRE - 1-4 Family Residential Investment | 266,423 | 5.3 | |||||||||
| Hotels & Motels (Accommodation) | 191,735 | 3.9 | |||||||||
| CRE - Industrial / Warehouse | 174,357 | 3.5 | |||||||||
| Nursing and Residential Care Facilities | 169,443 | 3.4 | |||||||||
| Education | 163,310 | 3.3 | |||||||||
| Specialty Trade Contractors | 153,422 | 3.1 | |||||||||
| Homebuilding (tract developers, remodelers) | 149,935 | 3.0 | |||||||||
| Merchant Wholesalers, Durable Goods | 136,707 | 2.7 | |||||||||
| Motor Vehicle and Parts Dealers | 122,291 | 2.5 | |||||||||
| Credit Intermediation and Other Related Activities | 114,124 | 2.3 | |||||||||
| CRE - Mixed-Use - Residential | 109,812 | 2.2 | |||||||||
| Crop Production | 91,597 | 1.8 | |||||||||
| Administrative and Support Services | 79,600 | 1.6 | |||||||||
| CRE - Mixed-Use - Commercial | 77,790 | 1.6 | |||||||||
| Religious Organizations, Advocacy Groups | 74,980 | 1.5 | |||||||||
| Wood Product Manufacturing | 74,913 | 1.5 | |||||||||
| Rental and Leasing Services | 74,158 | 1.5 | |||||||||
| Food Manufacturing | 73,755 | 1.5 | |||||||||
| Food Services and Drinking Places | 68,056 | 1.4 | |||||||||
| Merchant Wholesalers, Nondurable Goods | 63,539 | 1.3 | |||||||||
| Personal and Laundry Services | 59,796 | 1.2 | |||||||||
| Repair and Maintenance | 56,870 | 1.1 | |||||||||
| Fabricated Metal Product Manufacturing | 55,546 | 1.1 | |||||||||
| Miniwarehouse / Self-Storage | 55,543 | 1.1 | |||||||||
| Amusement, Gambling, and Recreation Industries | 55,248 | 1.1 | |||||||||
| Private Equity & Special Purpose Entities | 53,818 | 1.1 | |||||||||
| Truck Transportation | 50,182 | 1.0 | |||||||||
| Industries with >$50 million in outstandings | $ | 4,167,836 | 83.8 | % | |||||||
| Industries with <$50 million in outstandings | $ | 806,965 | 16.2 | % | |||||||
| Total Commercial Loans | $ | 4,974,801 | 100.0 | % | |||||||
| Consumer Loans and Lease Financings | Total Outstanding Balance | ||||||||||
| Real Estate-Residential Secured for Personal Purpose | $ | 730,395 | |||||||||
| Real Estate-Home Equity Secured for Personal Purpose | 176,699 | ||||||||||
| Loans to Individuals | 27,873 | ||||||||||
| Lease Financings | 211,315 | ||||||||||
| Total Consumer Loans and Lease Financings | $ | 1,146,282 | |||||||||
| Total | $ | 6,121,083 | |||||||||
35
Table 8—Summary of Loan and Lease Loss Experience
The following table presents average loans and leases and loan and lease loss experience for the periods indicated.
| For the Years Ended December 31, | |||||||||||||||||||||||||||||||||||||||||||||||||||||
| 2022 | 2021 | 2020 | |||||||||||||||||||||||||||||||||||||||||||||||||||
| (Dollars in thousands) | Average Loans | Net Charge-offs (Recoveries) | Net Charge-offs (Recoveries) to Average Loans | Average Loans | Net Charge-offs (Recoveries) | Net Charge-offs (Recoveries) to Average Loans | Average Loans | Net Charge-offs (Recoveries) | Net Charge-offs (Recoveries) to Average Loans | ||||||||||||||||||||||||||||||||||||||||||||
| Commercial, financial and agricultural | $ | 1,026,167 | $ | 323 | 0.03 | % | $ | 909,682 | $ | 16 | — | % | $ | 906,823 | $ | 1,139 | 0.13 | % | |||||||||||||||||||||||||||||||||||
| Paycheck Protection Program | 7,939 | — | — | 281,484 | — | — | 342,920 | — | — | ||||||||||||||||||||||||||||||||||||||||||||
| Real estate-commercial | 2,863,580 | 3,276 | 0.11 | 2,589,585 | (204) | (0.01) | 2,210,610 | 2,818 | 0.13 | ||||||||||||||||||||||||||||||||||||||||||||
| Real estate-construction | 312,024 | — | — | 264,951 | — | — | 230,764 | — | — | ||||||||||||||||||||||||||||||||||||||||||||
| Real estate-residential secured for business purpose | 427,849 | (55) | (0.01) | 399,926 | 147 | 0.04 | 377,192 | 113 | 0.03 | ||||||||||||||||||||||||||||||||||||||||||||
| Real estate-residential secured for personal purpose | 626,102 | — | — | 521,240 | — | — | 464,967 | 181 | 0.04 | ||||||||||||||||||||||||||||||||||||||||||||
| Real estate-home equity secured for personal purpose | 168,289 | (38) | (0.02) | 160,176 | (64) | (0.04) | 172,905 | (15) | (0.01) | ||||||||||||||||||||||||||||||||||||||||||||
| Loans to individuals | 26,642 | 179 | 0.67 | 26,048 | 135 | 0.52 | 28,792 | 187 | 0.65 | ||||||||||||||||||||||||||||||||||||||||||||
| Lease financings | 192,673 | 210 | 0.11 | 169,383 | 183 | 0.11 | 153,828 | 225 | 0.15 | ||||||||||||||||||||||||||||||||||||||||||||
| Total | $ | 5,651,265 | $ | 3,895 | 0.07 | % | $ | 5,322,475 | $ | 213 | — | % | $ | 4,888,801 | $ | 4,648 | 0.10 | % | |||||||||||||||||||||||||||||||||||
During the year ended December 31, 2022, the Corporation recorded charge-offs of $3.3 million related to two commercial real estate loans totaling $5.8 million. During the second quarter of 2020, the Corporation recorded a charge-off of $2.7 million related to one commercial real estate loan totaling $11.7 million.
Table 9—Allowance for Credit Losses On Loans and Leases
The following table summarizes the allocation of the allowance for credit losses on loans and leases, and the percentage of loans and leases in each major loan category to total loans and leases held for investment at the dates indicated.
| At December 31, | |||||||||||||||||||||||||||||||||||
| 2022 | 2021 | ||||||||||||||||||||||||||||||||||
| (Dollars in thousands) | ACL | % of ACL to Total ACL | % of Loans to Total Loans | ACL | % of ACL to Total ACL | % of Loans to Total Loans | |||||||||||||||||||||||||||||
| Commercial, financial and agricultural | $ | 16,916 | 21.4 | % | 17.7 | % | $ | 13,536 | 18.8 | % | 18.0 | % | |||||||||||||||||||||||
| Paycheck Protection Program | 4 | — | — | 2 | — | 0.6 | |||||||||||||||||||||||||||||
| Real estate-commercial | 41,673 | 52.7 | 49.5 | 41,095 | 57.1 | 51.2 | |||||||||||||||||||||||||||||
| Real estate-construction | 4,952 | 6.3 | 6.2 | 4,575 | 6.4 | 5.3 | |||||||||||||||||||||||||||||
| Real estate-residential secured for business purpose | 7,054 | 8.9 | 7.8 | 6,482 | 9.0 | 7.7 | |||||||||||||||||||||||||||||
| Real estate-residential secured for personal purpose | 3,685 | 4.7 | 11.9 | 2,403 | 3.3 | 10.2 | |||||||||||||||||||||||||||||
| Real estate-home equity secured for personal purpose | 1,287 | 1.6 | 2.9 | 1,028 | 1.4 | 3.0 | |||||||||||||||||||||||||||||
| Loans to individuals | 351 | 0.4 | 0.5 | 363 | 0.5 | 0.5 | |||||||||||||||||||||||||||||
| Lease financings | 3,082 | 3.9 | 3.5 | 2,290 | 3.2 | 3.5 | |||||||||||||||||||||||||||||
| Unallocated | — | — | N/A | 150 | 0.2 | N/A | |||||||||||||||||||||||||||||
| Total | $ | 79,004 | 100.0 | % | 100.0 | % | $ | 71,924 | 100.0 | % | 100.0 | % | |||||||||||||||||||||||
At December 31, 2022, the allowance for credit losses on individually analyzed loans was $2.8 million, or 20.7% of the balance of individually analyzed loans of $13.4 million. At December 31, 2021, the allowance for credit losses on individually analyzed loans was $11 thousand, or 0.03% of the balance of individually analyzed loans of $33.1 million.
Goodwill and Other Intangible Assets
Goodwill and other intangible assets have been recorded on the books of the Corporation in connection with acquisitions. There was no impairment of goodwill or identifiable intangibles recorded during 2020 through 2022. There can be no assurance that future impairment assessments or tests will not result in a charge to earnings.
36
LIABILITIES
The following table presents liabilities at the dates indicated:
| At December 31, | |||||||||||||||||||||||
| (Dollars in thousands) | 2022 | 2021 | $ Change | % Change | |||||||||||||||||||
| Deposits | $ | 5,913,526 | $ | 6,055,124 | $ | (141,598) | (2.3) | % | |||||||||||||||
| Short-term borrowings | 197,141 | 20,106 | 177,035 | 880.5 | |||||||||||||||||||
| Long-term debt | 95,000 | 95,000 | — | — | |||||||||||||||||||
| Subordinated notes | 148,260 | 98,874 | 49,386 | 49.9 | |||||||||||||||||||
| Operating lease liabilities | 33,153 | 33,453 | (300) | (0.9) | |||||||||||||||||||
| Accrued interest payable and other liabilities | 58,436 | 46,070 | 12,366 | 26.8 | |||||||||||||||||||
| Total liabilities | $ | 6,445,516 | $ | 6,348,627 | $ | 96,889 | 1.5 | % | |||||||||||||||
Deposits
Total deposits decreased $141.6 million, or 2.3%, from December 31, 2021, primarily due to decreases in commercial, consumer and public fund deposits partially offset by an increase in brokered deposits. The decrease in deposits was primarily driven by our customers effectively deploying excess liquidity related to pandemic linked stimulus funds.
Table 10—Deposits
The following table summarizes the average amount of deposits for the periods indicated:
| For the Years Ended December 31, | |||||||||||||||||
| (Dollars in thousands) | 2022 | 2021 | 2020 | ||||||||||||||
| Noninterest-bearing deposits | $ | 2,068,086 | $ | 1,891,330 | $ | 1,599,333 | |||||||||||
| Interest-bearing checking deposits | 884,656 | 850,713 | 692,049 | ||||||||||||||
| Money market savings | 1,389,226 | 1,366,762 | 1,113,039 | ||||||||||||||
| Regular savings | 1,056,019 | 983,752 | 874,366 | ||||||||||||||
| Time deposits | 443,845 | 498,638 | 572,103 | ||||||||||||||
| Total average deposits | $ | 5,841,832 | $ | 5,591,195 | $ | 4,850,890 | |||||||||||
At December 31, 2022 and 2021, the Corporation had $3.3 billion and $3.4 billion, respectively, in uninsured deposits in excess of the FDIC insurance limit of $250,000. At December 31, 2022 and 2021, the Corporation had $95.0 million and $119.9 million, respectively, in time deposits in excess of $250,000 maturing disclosed in the table below. Brokered deposits in the amount of $35.3 million at December 31, 2022 are not included in time deposits more than $250,000. There were no brokered time deposits at December 31, 2021.
| (Dollars in thousands) | For the Years Ended December, 31 | ||||||||||
| Maturity Period | 2022 | 2021 | |||||||||
| Due Three Months or Less | $ | 18,689 | $ | 14,405 | |||||||
| Due Over Three Months to Six Months | 24,285 | 34,270 | |||||||||
| Due Over Six Months to Twelve Months | 33,119 | 36,296 | |||||||||
| Due Over Twelve Months | 18,899 | 34,924 | |||||||||
| Total | $ | 94,992 | $ | 119,895 | |||||||
Borrowings
Total borrowings increased $226.4 million from December 31, 2021 due to an increase of $125.0 million in short-term FHLB overnight borrowings, $60.0 million in federal funds purchased and $50.0 million in fixed-to-floating rate subordinated notes issued by the Corporation in the fourth quarter of 2022.
Short-term borrowings at December 31, 2022 included $125.0 million in short-term FHLB overnight borrowings, $60.0 million in federal funds purchased and $12.1 million of customer repurchase agreements. Long-term debt at December 31, 2022
37
included $95.0 million of FHLB advances and $148.3 million of subordinated notes. At December 31, 2022 and 2021, the Bank had outstanding short-term letters of credit with the FHLB totaling $690.5 million and $831.8 million, respectively, which were utilized to collateralize public fund deposits.
Other Liabilities
Other liabilities increased $12.4 million, or 26.8%, from December 31, 2021, primarily due to change in fair value of derivatives of $8.4 million. In May 2022, the Corporation entered into an interest rate swap classified as a cash flow hedge. At December 31, 2022, the notional amount of the interest rate swap was $250.0 million and the fair value was a liability of $8.6 million.
SHAREHOLDERS' EQUITY
The following table presents total shareholders' equity at the dates indicated:
| At December 31, | |||||||||||||||||||||||
| (Dollars in thousands) | 2022 | 2021 | $ Change | % Change | |||||||||||||||||||
| Common stock | $ | 157,784 | $ | 157,784 | $ | — | — | % | |||||||||||||||
| Additional paid-in capital | 300,808 | 299,181 | 1,627 | 0.5 | |||||||||||||||||||
| Retained earnings | 428,637 | 375,124 | 53,513 | 14.3 | |||||||||||||||||||
| Accumulated other comprehensive (loss) income | (62,104) | (16,353) | (45,751) | 279.8 | |||||||||||||||||||
| Treasury stock | (48,625) | (41,942) | (6,683) | 15.9 | |||||||||||||||||||
| Total shareholders' equity | $ | 776,500 | $ | 773,794 | $ | 2,706 | 0.3 | % | |||||||||||||||
The increase in shareholders' equity at December 31, 2022 of $2.7 million from December 31, 2021 was primarily related to an increase in retained earnings of $53.5 million. Retained earnings was impacted by net income of $78.1 million, partially offset by $24.4 million of cash dividends paid during the year. Accumulated other comprehensive loss increased by $45.8 million, primarily attributable to decreases in the fair value of available-for-sale investment securities of $38.8 million, net of tax and a decrease in the fair value of derivatives of $6.8 million, net of tax. Treasury stock increased by $6.7 million, primarily related to purchases of $11.4 million under the Corporation's share repurchase program, offset by $4.7 million of stock issued under the dividend reinvestment and employee stock purchase plans and stock-based incentive plan activity.
Discussion of Segments
The Corporation has three operating segments: Banking, Wealth Management and Insurance. Detailed segment information appears in Note 23, "Segment Reporting" included in the Notes to the Consolidated Financial Statements under Item 8 of this Form 10-K.
The Banking segment reported pre-tax income of $93.4 million in 2022, $112.3 million in 2021 and $53.3 million in 2020. See the section of this MD&A under the heading "Results of Operations" and "Financial Condition" for a discussion of the key items impacting the Banking Segment.
The Wealth Management segment reported pre-tax income of $8.0 million in 2022, $9.2 million in 2021 and $7.3 million in 2020, which included noninterest income of $27.7 million in 2022, $27.5 million in 2021 and $23.8 million in 2020. The pre-tax income decreased from 2021 primarily due to an increase in interest expense of $1.1 million on trust deposits as a result of the current interest rate environment. Noninterest income increased slightly from 2021 primarily driven by new client relationships offset by the impact of decreased assets under management and supervision driven by unfavorable market conditions. Noninterest income increased in 2021 from 2020 due to increased assets under management and supervision driven by favorable market conditions and new client relationships. Wealth Management assets under management and supervision were $4.2 billion as of December 31, 2022, $4.9 billion as of December 31, 2021 and $4.1 billion as of December 31, 2020.
The Insurance segment reported pre-tax income of $3.3 million in 2022, $3.4 million in 2021 and $4.1 million in 2020, which included noninterest income of $19.9 million in 2022, $17.0 million in 2021 and $16.7 million in 2020. The increase in noninterest income in 2022 compared to 2021 was driven by incremental revenue attributable to the insurance agency the Corporation acquired in the fourth quarter of 2021. The decrease in pre-tax income in 2022 compared to 2021 was primarily due to increases in salary expense as we continue to invest in revenue producing positions and increases in intangible expense amortization related to the previously referenced insurance agency acquisition. The decrease in pre-tax income in 2021 compared to 2020 was primarily due to increases in salary expense as we continue to invest in revenue producing positions.
38
Capital Adequacy
Capital guidelines assign minimum capital requirements for categories of assets depending on their assigned risks. The components of risk-based capital for the Corporation are Tier 1 and Tier 2.
At December 31, 2022, the Corporation had a Tier 1 risk-based capital ratio of 10.37% and total risk-based capital ratio of 13.67%. At December 31, 2021, the Corporation had a Tier 1 capital ratio of 11.08% and total risk-based capital ratio of 13.77%. The Corporation continues to be in the "well-capitalized" category under regulatory standards. Details on the capital ratios can be found in Note 21, "Regulatory Matters," included in the Notes to the Consolidated Financial Statements under Item 8 of this Form 10-K along with a discussion on dividend and other restrictions.
Asset/Liability Management
The primary functions of Asset/Liability Management are to ensure adequate earnings, capital and liquidity while maintaining an appropriate balance between interest-earning assets and interest-bearing liabilities. Management's objective with regard to interest rate risk is to understand the Corporation's sensitivity to changes in interest rates and develop and implement strategies to minimize volatility while maximizing net interest income.
The Corporation uses gap analysis and earnings at risk simulation modeling to quantify exposure to interest rate risk. The Corporation uses the gap analysis to identify and monitor long-term rate exposure and uses a simulation model to measure short-term rate exposure. The Corporation runs various earnings simulation scenarios to quantify the impact of declining or rising interest rates on net interest income over a one-year and two-year horizon. The simulation uses expected cash flows and repricing characteristics for all financial instruments at a point in time and incorporates company-developed, market-based assumptions regarding growth, pricing, and optionality such as prepayment speeds. As interest rates increase, fixed-rate assets tend to decrease in value; conversely, as interest rates decline, fixed-rate assets tend to increase in value.
Interest Rate Sensitivity
Interest rate sensitivity is a function of the repricing characteristics of the Corporation's assets and liabilities. Minimizing the balance sheet's maturity and repricing risk is a continual focus in a changing interest rate environment. The Corporation uses a variety of techniques to assist in identifying the potential range of risk, including a maturity/repricing gap analysis as well as an Earnings at Risk analysis under various interest rate scenarios.
The gap analysis identifies interest rate risk by identifying repricing gaps in the Corporation’s balance sheet. All assets and liabilities are modeled to reflect some level of behavioral optionality, such as prepayments on loans, early call features on investments or potential pricing change and/or product change to interest bearing deposits. The Corporation projects all non-interest bearing deposits to be considered non-rate sensitive. These assumptions are based upon historic behavior; however, they are inherently uncertain and thus cannot precisely predict the impact of changes in interest rates. While actual results will differ from simulated results due to customer behavioral change and/or market and regulatory influences, the following models are important tools to guide management.
39
Table 11—Interest Rate Sensitivity Gap Analysis
The following table presents the Corporation's gap analysis at December 31, 2022:
| (Dollars in thousands) | Within Three Months | After Three Months to Twelve Months | After One Year to Five Years | Over Five Years | Non-Rate Sensitive | Total | |||||||||||||||||||||||||||||
| Assets: | |||||||||||||||||||||||||||||||||||
| Cash and due from banks | $ | — | $ | — | $ | — | $ | — | $ | 84,176 | $ | 84,176 | |||||||||||||||||||||||
| Interest-earning deposits with other banks | 68,623 | — | — | — | — | 68,623 | |||||||||||||||||||||||||||||
| Investment securities, net of allowance for credit losses | 72,362 | 34,447 | 184,377 | 260,443 | (44,067) | 507,562 | |||||||||||||||||||||||||||||
| Federal Home Loan Bank, Federal Reserve Bank and other stock, at cost | — | — | — | — | 33,841 | 33,841 | |||||||||||||||||||||||||||||
| Loans held for sale | 5,037 | — | — | — | — | 5,037 | |||||||||||||||||||||||||||||
| Loans and leases, net of allowance for credit losses | 2,176,013 | 381,766 | 2,557,958 | 1,019,940 | (91,451) | 6,044,226 | |||||||||||||||||||||||||||||
| Other assets | — | — | — | — | 478,551 | 478,551 | |||||||||||||||||||||||||||||
| Total assets | $ | 2,322,035 | $ | 416,213 | $ | 2,742,335 | $ | 1,280,383 | $ | 461,050 | $ | 7,222,016 | |||||||||||||||||||||||
| Liabilities and shareholders' equity: | |||||||||||||||||||||||||||||||||||
| Noninterest-bearing deposits | $ | — | $ | — | $ | — | $ | — | $ | 2,047,263 | $ | 2,047,263 | |||||||||||||||||||||||
| Interest-bearing demand deposits | 2,321,748 | — | — | — | — | 2,321,748 | |||||||||||||||||||||||||||||
| Savings deposits | 1,025,431 | — | — | — | — | 1,025,431 | |||||||||||||||||||||||||||||
| Time deposits | 80,072 | 226,409 | 209,044 | 3,559 | — | 519,084 | |||||||||||||||||||||||||||||
| Borrowings | 220,401 | 10,000 | 210,000 | — | — | 440,401 | |||||||||||||||||||||||||||||
| Other liabilities | — | — | — | — | 91,589 | 91,589 | |||||||||||||||||||||||||||||
| Shareholders' equity | — | — | — | — | 776,500 | 776,500 | |||||||||||||||||||||||||||||
| Total liabilities and shareholders' equity | $ | 3,647,652 | $ | 236,409 | $ | 419,044 | $ | 3,559 | $ | 2,915,352 | $ | 7,222,016 | |||||||||||||||||||||||
| Interest rate swaps | $ | (250,000) | $ | — | $ | — | $ | — | $ | — | |||||||||||||||||||||||||
| Incremental gap | $ | (1,575,617) | $ | 179,804 | $ | 2,323,291 | $ | 1,276,824 | $ | (2,454,302) | |||||||||||||||||||||||||
| Cumulative gap | $ | (1,575,617) | $ | (1,395,813) | $ | 927,478 | $ | 2,204,302 | |||||||||||||||||||||||||||
| Cumulative gap as a percentage of interest-earning assets | (23.3 | %) | (20.7 | %) | 13.7 | % | 32.7 | % | |||||||||||||||||||||||||||
The table above indicates that the Corporation should anticipate a greater amount of liabilities repricing than assets in the next twelve months. However, this table and analysis is limited as it does not take into account the magnitude of repricing due to rate changes.
Table 12—Net Interest Income - Summary of Earnings at Risk Simulation
Management also performs a simulation of net interest income to measure interest rate exposure. The following table demonstrates the anticipated impact of an instantaneous and parallel interest rate shift, or "shock," to the yield curve on the Corporation's net interest income over the next twelve months. This simulation incorporates the same assumptions noted above and assumes a static balance sheet with no incremental growth in interest-earning assets or interest-bearing liabilities over the next twelve months.
40
The changes to net interest income are shown in the below table at December 31, 2022. The results suggest the Corporation's year-end balance sheet is slightly asset sensitive as net interest income is projected to increase in a rising rate environment. Actual results will likely be different than modeled due to numerous factors, including interest rates earned on new loans and investments as well as rates paid on new and existing deposits and new borrowings. The changes to net interest income shown below are in compliance with the Corporation's policy guidelines.
| Estimated Change in Net Interest Income Over Next 12 Months | |||||||||||
| (Dollars in thousands) | Amount | Percent | |||||||||
| Rate shock - Change in interest rates | |||||||||||
| +200 basis points | $ | 7,930 | 3.16 | % | |||||||
| +100 basis points | 1,309 | 0.52 | |||||||||
| -100 basis points | (13,560) | (5.40) | |||||||||
| -200 basis points | (24,347) | (9.70) | |||||||||
Credit Risk
Originating loans exposes the Corporation to credit risk, which is the risk that the principal balance of a loan and any related interest will not be collected due to the inability of the borrower to repay the loan. The Corporation manages credit risk in the loan portfolio through adherence to consistent standards, guidelines and limitations established by the Board of Directors. Written loan policies establish underwriting standards, lending limits and other standards or limits as deemed necessary and prudent. While the Corporation has strict underwriting, review, and monitoring procedures in place, these procedures cannot eliminate all of the risks related to these lending activities.
The Corporation's loan review department conducts ongoing, independent reviews of the lending process to ensure adherence to established policies and procedures, monitors compliance with applicable laws and regulations and provides objective measurement of the risk inherent in the loan portfolio.
The Corporation focuses on both assessing the borrower's capacity and willingness to repay and obtaining sufficient collateral. Commercial, financial and agricultural loans are generally secured by the borrower's assets and by personal guarantees. Commercial real estate, construction and residential real estate secured for business purposes loans are originated primarily within the Pennsylvania, Maryland, Delaware and New Jersey market areas at prudent loan-to-value ratios and are often supported by a guarantee of the borrowers. Management closely monitors the composition and quality of the total commercial loan portfolio to ensure that any credit concentrations by borrower or industry are identified and managed. See "Risk Factors" included herein under Item 1A for additional information on lending risk related to commercial loans.
The Corporation originates fixed-rate and adjustable-rate residential mortgage loans that are secured by the underlying 1- to 4-family residential properties for personal purposes. Credit risk exposure in this area of lending is minimized by the evaluation of the creditworthiness of the borrower, including debt-to-income ratios, credit scores and adherence to underwriting policies that emphasize conservative loan-to-value ratios of generally no more than 80%. Residential mortgage loans granted in excess of the 80% loan-to-value ratio are generally insured by private mortgage insurance.
Credit risk in the consumer loan portfolio is controlled by strict adherence to underwriting standards that consider debt-to-income levels and the creditworthiness of the borrower and, if secured, collateral values. In the home equity loan portfolio, combined loan-to-value ratios are generally limited to 80%, but may be increased to 85% for the Corporation's strongest profile borrowers. Other credit considerations and compensating factors may warrant higher combined loan-to-value ratios. These loans are included within the portfolio of loans to individuals.
The primary risks that are involved with lease financing receivables are credit underwriting and borrower industry concentrations. The Corporation has strict underwriting, review, and monitoring procedures in place to mitigate these risks. Risk also lies in the residual value of the underlying equipment. Residual values are subject to judgments as to the value of the underlying equipment that can be affected by changes in economic and market conditions and the financial viability of the residual guarantors and insurers. To the extent not guaranteed or assumed by a third party, or otherwise insured against, the Corporation bears the risk of ownership of the leased assets. This includes the risk that the actual value of the leased assets at the end of the lease term will be less than the residual value. The Corporation greatly reduces this risk primarily by using $1.00 buyout leases and equipment finance agreements, in which the entire cost of the leased equipment is included in the contractual payments, leaving no residual payment at the end of the lease term for the majority of the lease portfolio.
41
The Corporation closely monitors delinquencies as another means of maintaining asset quality. Collection efforts begin after a loan payment is missed, by attempting to contact all borrowers. If collection attempts fail, the Corporation will proceed to gain control of all collateral in a timely manner in order to minimize losses. While liquidation and recovery efforts continue, officers continue to work with the borrowers, if appropriate, to recover all monies owed to the Corporation.
Liquidity
The Corporation, in its role as a financial intermediary, is exposed to certain liquidity risks. Liquidity refers to the Corporation's ability to ensure that sufficient cash flows and liquid assets are available to satisfy demand for loans, deposit withdrawals, repayment of borrowings, certificates of deposit at maturity, operating expenses and capital expenditures. The Corporation manages liquidity risk by measuring and monitoring liquidity sources and estimated funding needs on a daily basis. The Corporation has a contingency funding plan in place to address liquidity needs in the event of an institution-specific or a systemic financial crisis.
Sources of Funds
Core deposits continue to be the largest significant funding source for the Corporation. These deposits are primarily generated from individuals, businesses, municipalities and non-profit customers located in our primary service areas. The Corporation faces increased competition for these deposits from a large array of financial market participants, including banks, credit unions, savings institutions, mutual funds, security dealers and others.
As part of its diversified funding strategy, the Corporation also utilizes a mix of short-term and long-term wholesale funding providers. Wholesale funding includes federal funds purchases from correspondent banks, secured borrowing lines from the Federal Home Loan Bank of Pittsburgh, the Federal Reserve Bank of Philadelphia and, at times, brokered deposits and other similar sources.
Cash Requirements
The Corporation has cash requirements for various financial obligations, including contractual obligations and commitments that require cash payments. The most significant contractual obligations, in both the under and over one-year time period, are for the Bank to repay certificates of deposit and long-term borrowings. The Bank anticipates meeting these obligations by utilizing on-balance sheet liquidity and continuing to provide convenient depository and cash management services through its financial center network, thereby replacing these contractual obligations with similar fund sources at rates that are competitive in our market. The Bank will also use borrowings and brokered deposits to meet its obligations.
Commitments to extend credit are the Bank's most significant commitment in both the under and over one-year time periods. These commitments do not necessarily represent future cash requirements in that these commitments often expire without being drawn upon.
Recent Accounting Pronouncements
For information regarding recent accounting pronouncements, refer to Note 1, "Summary of Significant Accounting Policies" of this Form 10-K.
Item 7A.
Quantitative and Qualitative Disclosures About Market Risk
Market risk is the risk of loss from adverse changes in market prices and rates. In the normal course of its business activities including lending, investing, receiving deposits and borrowing funds, the Corporation is subject to changes in the economic value and/or earnings potential of the assets and liabilities due to changes in interest rates. The Corporation's Investment Asset/Liability Management Committee is responsible for managing interest rate risk in a manner so as to provide adequate and reliable earnings. This is accomplished through the establishment of policy limits on maximum risk exposures, as well as the regular and timely monitoring of reports designed to quantify risk and return levels. The Corporation's Board of Directors establishes policies that govern interest rate risk management.
Information with respect to quantitative and qualitative disclosures about market risk can be found in Item 7, "Management’s Discussion and Analysis of Financial Condition and Results of Operations" including Liquidity and Interest Rate Sensitivity.
42
Item 8.
Financial Statements and Supplementary Data
The following audited consolidated financial statements and related documents are set forth in this Annual Report on Form 10-K on the following pages:
Auditor Name:
KPMG, LLP
Auditor Location:
Philadelphia, PA
Auditor Firm ID:
185
43
Report of Independent Registered Public Accounting Firm
To the Shareholders and Board of Directors
Univest Financial Corporation:
Opinion on the Consolidated Financial Statements
We have audited the accompanying consolidated balance sheets of Univest Financial Corporation and subsidiaries (the Company) as of December 31, 2022 and 2021, the related consolidated statements of income, comprehensive income, changes in shareholders’ equity, and cash flows for each of the years in the three-year period ended December 31, 2022, and the related notes (collectively, the consolidated financial statements). In our opinion, the consolidated financial statements present fairly, in all material respects, the financial position of the Company as of December 31, 2022 and 2021, and the results of its operations and its cash flows for each of the years in the three-year period ended December 31, 2022, in conformity with U.S. generally accepted accounting principles.
We also have audited, in accordance with the standards of the Public Company Accounting Oversight Board (United States) (PCAOB), the Company’s internal control over financial reporting as of December 31, 2022, based on criteria established in
Internal Control – Integrated Framework (2013)
issued by the Committee of Sponsoring Organizations of the Treadway Commission, and our report dated February 24, 2023 expressed an unqualified opinion on the effectiveness of the Company’s internal control over financial reporting.
Basis for Opinion
These consolidated financial statements are the responsibility of the Company’s management. Our responsibility is to express an opinion on these consolidated financial statements based on our audits. We are a public accounting firm registered with the PCAOB and are required to be independent with respect to the Company in accordance with the U.S. federal securities laws and the applicable rules and regulations of the Securities and Exchange Commission and the PCAOB.
We conducted our audits in accordance with the standards of the PCAOB. Those standards require that we plan and perform the audit to obtain reasonable assurance about whether the consolidated financial statements are free of material misstatement, whether due to error or fraud. Our audits included performing procedures to assess the risks of material misstatement of the consolidated financial statements, whether due to error or fraud, and performing procedures that respond to those risks. Such procedures included examining, on a test basis, evidence regarding the amounts and disclosures in the consolidated financial statements. Our audits also included evaluating the accounting principles used and significant estimates made by management, as well as evaluating the overall presentation of the consolidated financial statements. We believe that our audits provide a reasonable basis for our opinion.
Critical Audit Matter
The critical audit matter communicated below is a matter arising from the current period audit of the consolidated financial statements that was communicated or required to be communicated to the audit committee and that: (1) relates to accounts or disclosures that are material to the consolidated financial statements and (2) involved our especially challenging, subjective, or complex judgments. The communication of a critical audit matter does not alter in any way our opinion on the consolidated financial statements, taken as a whole, and we are not, by communicating the critical audit matter below, providing a separate opinion on the critical audit matter or on the accounts or disclosures to which it relates.
Valuation of the allowance for credit losses related to pooled loans
As discussed in Notes 1 and 5 to the consolidated financial statements, the Company’s allowance for credit losses on loans and leases was $79.0 million as of December 31, 2022, a portion of which is related to pooled loans (the collective ACL). The Company utilizes a discounted cash flow (DCF) model to calculate the present value of the expected cash flows for pools of loans that share similar risk characteristics and compares the results of this calculation to the amortized cost basis to determine its collective ACL balance. The contractual term used in projecting the cash flows of a loan is based on the maturity date of a loan and is adjusted for prepayment or curtailment assumptions which may shorten that contractual time period. The Company estimated the collective ACL using a model that incorporates probability of default (PD) and loss given default (LGD) components. The PD model component incorporates economic factors into forecasting within the DCF model utilizing a method which generates PD rate inputs by analyzing how one or more of the economic factors, chosen based on statistical correlation to a loan pool’s performance, change the default rate using a statistical regression analysis. The reasonable and supportable forecasts
44
and scenarios are based on the projected performance of the selected economic variables which are sourced from a third party. Management evaluated the likelihood of each scenario to determine a reasonable and supportable forecast, including the relevant economic factors (loss driver selection). Management utilizes a four quarter forecast period followed by a four quarter reversion to historical averages. The LGD model component is determined utilizing an estimation technique that derives a LGD input from segment specific risk curves that correlate LGD with PD. The effective interest rate of the underlying loans of the Company serves as the discount rate applied to the expected periodic cash flows. The collective ACL estimate also included consideration of the need for qualitative adjustments related to factors that are not fully captured in the quantitative model.
We identified the assessment of the collective ACL as a critical audit matter. Such assessment required complex auditor judgment, and specialized skills and knowledge in the industry due to significant measurement uncertainty. The assessment of the collective ACL encompassed the evaluation of the collective ACL methodology, including the assumptions used to estimate (1) the PD rate input and its key assumptions including loan pool segmentation, peer selection, the historical observation period, and loss driver selection, (2) the reasonable and supportable economic forecast and scenarios and (3) the LGD input. In addition, auditor judgment was required to evaluate the sufficiency of audit evidence obtained.
The following are the primary procedures we performed to address this critical audit matter. We evaluated the design and tested the operating effectiveness of certain internal controls related to the Company’s measurement of the collective ACL, including controls over the:
•
governance and oversight over the collective ACL methodology
•
development of the PD rate input and LGD rate input
•
determination of the key assumptions used to estimate the PD rate input, reasonable and supportable economic forecast and scenarios, and the LGD rate input
•
measurement and on-going monitoring of the collective ACL estimate.
We evaluated the Company’s process to develop the collective ACL estimate by testing certain sources of data, factors, and assumptions that the Company used and considered, including the relevance and reliability of such data, factors and assumptions. In addition, we involved credit risk professionals with specialized skills and knowledge who assisted in:
•
evaluating the Company's collective ACL methodology for compliance with U.S. generally accepted accounting principles
•
evaluating the assumptions used in determining the PD rate input, reasonable and supportable economic forecast, and LGD rate input, by inspecting management's model and methodology documentation and through comparisons against Company specific metrics and applicable industry and regulatory practices
•
determining whether loans are pooled by similar risk characteristics by comparing to the Company's business and environment and relevant industry practices.
We also assessed the sufficiency of the audit evidence obtained related to the collective ACL estimate by evaluating the:
•
cumulative results of the audit procedures
•
qualitative aspects of the Company's accounting practices
•
potential bias in the accounting estimate.

We have served as the Company's auditor since 2004.
Philadelphia, Pennsylvania
February 24, 2023
45
UNIVEST FINANCIAL CORPORATION
CONSOLIDATED BALANCE SHEETS
| At December 31, | |||||||||||
| (Dollars in thousands, except share data) | 2022 | 2021 | |||||||||
| ASSETS | |||||||||||
| Cash and due from banks | $ |
|
$ |
|
|||||||
| Interest-earning deposits with other banks |
|
|
|||||||||
| Cash and cash equivalents |
|
|
|||||||||
|
Investment securities held-to-maturity (fair value $
|
|
|
|||||||||
|
Investment securities available-for-sale (amortized cost $
|
|
|
|||||||||
| Investments in equity securities |
|
|
|||||||||
| Federal Home Loan Bank, Federal Reserve Bank and other stock, at cost |
|
|
|||||||||
| Loans held for sale |
|
|
|||||||||
| Loans and leases held for investment |
|
|
|||||||||
| Less: Allowance for credit losses, loans and leases |
(
|
(
|
|||||||||
| Net loans and leases held for investment |
|
|
|||||||||
| Premises and equipment, net |
|
|
|||||||||
| Operating lease right-of-use asset |
|
|
|||||||||
| Goodwill |
|
|
|||||||||
| Other intangibles, net of accumulated amortization |
|
|
|||||||||
| Bank owned life insurance |
|
|
|||||||||
| Accrued interest receivable and other assets |
|
|
|||||||||
| Total assets | $ |
|
$ |
|
|||||||
| LIABILITIES | |||||||||||
| Noninterest-bearing deposits | $ |
|
$ |
|
|||||||
| Interest-bearing deposits |
|
|
|||||||||
| Total deposits |
|
|
|||||||||
| Short-term borrowings |
|
|
|||||||||
| Long-term debt |
|
|
|||||||||
| Subordinated notes |
|
|
|||||||||
| Operating lease liabilities |
|
|
|||||||||
| Accrued interest payable and other liabilities |
|
|
|||||||||
| Total liabilities |
|
|
|||||||||
| SHAREHOLDERS' EQUITY | |||||||||||
|
Common stock, $
|
|
|
|||||||||
| Additional paid-in capital |
|
|
|||||||||
| Retained earnings |
|
|
|||||||||
| Accumulated other comprehensive loss, net of tax benefit |
(
|
(
|
|||||||||
|
Treasury stock, at cost;
|
(
|
(
|
|||||||||
| Total shareholders' equity |
|
|
|||||||||
| Total liabilities and shareholders' equity | $ |
|
$ |
|
|||||||
See accompanying notes to consolidated financial statements.
46
UNIVEST FINANCIAL CORPORATION
CONSOLIDATED STATEMENTS OF INCOME
| For the Years Ended December 31, | |||||||||||||||||
| (Dollars in thousands, except per share data) | 2022 | 2021 | 2020 | ||||||||||||||
| Interest income | |||||||||||||||||
| Interest and fees on loans and leases | $ |
|
$ |
|
$ |
|
|||||||||||
| Interest and dividends on investment securities: | |||||||||||||||||
| Taxable |
|
|
|
||||||||||||||
| Exempt from federal income taxes |
|
|
|
||||||||||||||
| Interest on deposits with other banks |
|
|
|
||||||||||||||
| Interest and dividends on other earning assets |
|
|
|
||||||||||||||
| Total interest income |
|
|
|
||||||||||||||
| Interest expense | |||||||||||||||||
| Interest on demand deposits |
|
|
|
||||||||||||||
| Interest on savings deposits |
|
|
|
||||||||||||||
| Interest on time deposits |
|
|
|
||||||||||||||
| Interest on short-term borrowings |
|
|
|
||||||||||||||
| Interest on long-term debt and subordinated notes |
|
|
|
||||||||||||||
| Total interest expense |
|
|
|
||||||||||||||
| Net interest income |
|
|
|
||||||||||||||
| Provision (reversal of provision) for credit losses |
|
(
|
|
||||||||||||||
| Net interest income after provision for credit losses |
|
|
|
||||||||||||||
| Noninterest income | |||||||||||||||||
| Trust fee income |
|
|
|
||||||||||||||
| Service charges on deposit accounts |
|
|
|
||||||||||||||
| Investment advisory commission and fee income |
|
|
|
||||||||||||||
| Insurance commission and fee income |
|
|
|
||||||||||||||
| Other service fee income |
|
|
|
||||||||||||||
| Bank owned life insurance income |
|
|
|
||||||||||||||
| Net gain on sales of investment securities |
|
|
|
||||||||||||||
| Net gain on mortgage banking activities |
|
|
|
||||||||||||||
| Other income |
|
|
|
||||||||||||||
| Total noninterest income |
|
|
|
||||||||||||||
| Noninterest expense | |||||||||||||||||
| Salaries, benefits and commissions |
|
|
|
||||||||||||||
| Net occupancy |
|
|
|
||||||||||||||
| Equipment |
|
|
|
||||||||||||||
| Data processing |
|
|
|
||||||||||||||
| Professional fees |
|
|
|
||||||||||||||
| Marketing and advertising |
|
|
|
||||||||||||||
| Deposit insurance premiums |
|
|
|
||||||||||||||
| Intangible expenses |
|
|
|
||||||||||||||
| Restructuring charges |
|
|
|
||||||||||||||
| Other expense |
|
|
|
||||||||||||||
| Total noninterest expense |
|
|
|
||||||||||||||
| Income before income taxes |
|
|
|
||||||||||||||
| Income tax expense |
|
|
|
||||||||||||||
| Net income | $ |
|
$ |
|
$ |
|
|||||||||||
| Net income per share: | |||||||||||||||||
| Basic | $ |
|
$ |
|
$ |
|
|||||||||||
| Diluted |
|
|
|
||||||||||||||
See accompanying notes to consolidated financial statements.
47
UNIVEST FINANCIAL CORPORATION
CONSOLIDATED STATEMENTS OF COMPREHENSIVE INCOME
| For the Years Ended December 31, | |||||||||||||||||||||||||||||||||||||||||||||||||||||
| (Dollars in thousands) | 2022 | 2021 | 2020 | ||||||||||||||||||||||||||||||||||||||||||||||||||
|
Before
Tax Amount |
Tax
Expense (Benefit) |
Net of
Tax Amount |
Before
Tax Amount |
Tax
Expense (Benefit) |
Net of
Tax Amount |
Before
Tax Amount |
Tax
Expense (Benefit) |
Net of
Tax Amount |
|||||||||||||||||||||||||||||||||||||||||||||
| Income | $ |
|
$ |
|
$ |
|
$ |
|
$ |
|
$ |
|
$ |
|
$ |
|
$ |
|
|||||||||||||||||||||||||||||||||||
| Other comprehensive (loss) income: | |||||||||||||||||||||||||||||||||||||||||||||||||||||
| Net unrealized (losses) gains on available-for-sale investment securities: | |||||||||||||||||||||||||||||||||||||||||||||||||||||
| Net unrealized holding (losses) gains arising during the period |
(
|
(
|
(
|
|
|
|
|
|
|
||||||||||||||||||||||||||||||||||||||||||||
| Provision for credit losses |
|
|
|
|
|
|
|
|
|
||||||||||||||||||||||||||||||||||||||||||||
| Less: reclassification adjustment for net gains on sales realized in net income (1) |
(
|
(
|
(
|
(
|
(
|
(
|
(
|
(
|
(
|
||||||||||||||||||||||||||||||||||||||||||||
| Total net unrealized (losses) gains on available-for-sale investment securities |
(
|
(
|
(
|
|
|
|
|
|
|
||||||||||||||||||||||||||||||||||||||||||||
| Net unrealized (losses) gains on interest rate swaps used in cash flow hedges: | |||||||||||||||||||||||||||||||||||||||||||||||||||||
| Net unrealized holding (losses) gains arising during the period |
(
|
(
|
(
|
|
|
|
(
|
(
|
(
|
||||||||||||||||||||||||||||||||||||||||||||
| Less: reclassification adjustment for net (gains) losses realized in net income (2) |
(
|
(
|
(
|
|
|
|
|
|
|
||||||||||||||||||||||||||||||||||||||||||||
| Total net unrealized (losses) gains on interest rate swaps used in cash flow hedges |
(
|
(
|
(
|
|
|
|
(
|
(
|
(
|
||||||||||||||||||||||||||||||||||||||||||||
| Defined benefit pension plans: | |||||||||||||||||||||||||||||||||||||||||||||||||||||
| Net unrealized (losses) gains arising during the period |
(
|
(
|
(
|
|
|
|
(
|
(
|
(
|
||||||||||||||||||||||||||||||||||||||||||||
| Less: amortization of net actuarial loss included in net periodic pension costs (3) |
|
|
|
|
|
|
|
|
|
||||||||||||||||||||||||||||||||||||||||||||
| Total defined benefit pension plans |
(
|
(
|
(
|
|
|
|
(
|
(
|
(
|
||||||||||||||||||||||||||||||||||||||||||||
| Other comprehensive (loss) income |
(
|
(
|
(
|
|
|
|
(
|
(
|
(
|
||||||||||||||||||||||||||||||||||||||||||||
| Total comprehensive income | $ |
|
$ |
|
$ |
|
$ |
|
$ |
|
$ |
|
$ |
|
$ |
|
$ |
|
|||||||||||||||||||||||||||||||||||
See accompanying notes to consolidated financial statements.
48
UNIVEST FINANCIAL CORPORATION
CONSOLIDATED STATEMENTS OF CHANGES IN SHAREHOLDERS' EQUITY
| (Dollars in thousands, except per share data) |
Common
Shares Outstanding |
Common
Stock |
Additional
Paid-in Capital |
Retained
Earnings |
Accumulated
Other Comprehensive (Loss) Income |
Treasury
Stock |
Total | ||||||||||||||||||||||||||||||||||
| Balance at December 31, 2019 |
|
$ |
|
$ |
|
$ |
|
$ |
(
|
$ |
(
|
$ |
|
||||||||||||||||||||||||||||
| Adjustment to initially apply ASU No. 2016-13 for CECL | — | — | — |
(
|
|
— |
(
|
||||||||||||||||||||||||||||||||||
| Net income | — | — | — |
|
— | — |
|
||||||||||||||||||||||||||||||||||
| Other comprehensive loss, net of income tax benefit | — | — | — | — |
(
|
— |
(
|
||||||||||||||||||||||||||||||||||
|
Cash dividends declared ($
|
— | — | — |
(
|
— | — |
(
|
||||||||||||||||||||||||||||||||||
| Stock-based compensation | — | — |
|
(
|
— | — |
|
||||||||||||||||||||||||||||||||||
| Stock issued under dividend reinvestment and employee stock purchase plans |
|
— |
(
|
— | — |
|
|
||||||||||||||||||||||||||||||||||
| Vesting of restricted stock units, net of shares withheld to cover taxes |
|
— |
(
|
— | — |
|
(
|
||||||||||||||||||||||||||||||||||
| Exercise of stock options |
|
— |
(
|
— | — |
|
|
||||||||||||||||||||||||||||||||||
| Cancellations of performance-based restricted stock awards |
(
|
— |
|
— | — |
(
|
— | ||||||||||||||||||||||||||||||||||
| Purchases of treasury stock |
(
|
— | — | — | — |
(
|
(
|
||||||||||||||||||||||||||||||||||
| Balance at December 31, 2020 |
|
$ |
|
$ |
|
$ |
|
$ |
(
|
$ |
(
|
$ |
|
||||||||||||||||||||||||||||
| Net income | — | — | — |
|
— | — |
|
||||||||||||||||||||||||||||||||||
| Other comprehensive income, net of income tax | — | — | — | — |
|
— |
|
||||||||||||||||||||||||||||||||||
|
Cash dividends declared ($
|
— | — | — |
(
|
— | — |
(
|
||||||||||||||||||||||||||||||||||
| Stock-based compensation | — | — |
|
(
|
— | — |
|
||||||||||||||||||||||||||||||||||
| Stock issued under dividend reinvestment and employee stock purchase plans |
|
— |
|
(
|
— |
|
|
||||||||||||||||||||||||||||||||||
| Vesting of restricted stock units, net of shares withheld to cover taxes |
|
— |
(
|
— | — |
|
(
|
||||||||||||||||||||||||||||||||||
| Exercise of stock options |
|
— |
|
— | — |
|
|
||||||||||||||||||||||||||||||||||
| Cancellations of performance-based restricted stock awards |
(
|
— |
|
— | — |
(
|
— | ||||||||||||||||||||||||||||||||||
| Purchases of treasury stock |
(
|
— | — | — | — |
(
|
(
|
||||||||||||||||||||||||||||||||||
| Balance at December 31, 2021 |
|
$ |
|
$ |
|
$ |
|
$ |
(
|
$ |
(
|
$ |
|
||||||||||||||||||||||||||||
| Net income | — | — | — |
|
— | — |
|
||||||||||||||||||||||||||||||||||
| Other comprehensive loss, net of income tax benefit | — | — | — | — |
(
|
— |
(
|
||||||||||||||||||||||||||||||||||
|
Cash dividends declared ($
|
— | — | — |
(
|
— | — |
(
|
||||||||||||||||||||||||||||||||||
| Stock-based compensation | — | — |
|
(
|
— | — |
|
||||||||||||||||||||||||||||||||||
| Stock issued under dividend reinvestment and employee stock purchase plans |
|
— |
|
|
— |
|
|
||||||||||||||||||||||||||||||||||
| Vesting of restricted stock units, net of shares withheld to cover taxes |
|
— |
(
|
— | — |
|
(
|
||||||||||||||||||||||||||||||||||
| Exercise of stock options |
|
— |
|
— | — |
|
|
||||||||||||||||||||||||||||||||||
| Purchases of treasury stock |
(
|
— | — | — | — |
(
|
(
|
||||||||||||||||||||||||||||||||||
| Balance at December 31, 2022 |
|
$ |
|
$ |
|
$ |
|
$ |
(
|
$ |
(
|
$ |
|
||||||||||||||||||||||||||||
See accompanying notes to consolidated financial statements.
49
UNIVEST FINANCIAL CORPORATION
CONSOLIDATED STATEMENTS OF CASH FLOWS
| For the Years Ended December 31, | |||||||||||||||||
| (Dollars in thousands) | 2022 | 2021 | 2020 | ||||||||||||||
| Cash flows from operating activities: | |||||||||||||||||
| Net income | $ |
|
$ |
|
$ |
|
|||||||||||
| Adjustments to reconcile net income to net cash provided by operating activities: | |||||||||||||||||
| Provision (reversal of provision) for credit losses |
|
(
|
|
||||||||||||||
| Depreciation of premises and equipment |
|
|
|
||||||||||||||
| Net gain on sales of investment securities |
(
|
(
|
(
|
||||||||||||||
| Net gain on mortgage banking activities |
(
|
(
|
(
|
||||||||||||||
| Bank owned life insurance income |
(
|
(
|
(
|
||||||||||||||
| Net amortization of investment securities premiums and discounts |
|
|
|
||||||||||||||
| Amortization, fair market value adjustments and capitalization of servicing rights |
(
|
(
|
|
||||||||||||||
| Net (accretion) amortization of acquisition accounting fair value adjustments |
(
|
(
|
|
||||||||||||||
| Stock-based compensation |
|
|
|
||||||||||||||
| Intangible expenses |
|
|
|
||||||||||||||
| Other adjustments to reconcile net income to cash used in by operating activities |
(
|
(
|
(
|
||||||||||||||
| Deferred tax (benefit) expense |
(
|
|
(
|
||||||||||||||
| Originations of loans held for sale |
(
|
(
|
(
|
||||||||||||||
| Proceeds from the sale of loans held for sale |
|
|
|
||||||||||||||
| Contributions to pension and other postretirement benefit plans |
(
|
(
|
(
|
||||||||||||||
| Increase in accrued interest receivable and other assets |
(
|
(
|
(
|
||||||||||||||
| Increase in accrued interest payable and other liabilities |
|
|
|
||||||||||||||
| Net cash provided by operating activities |
|
|
|
||||||||||||||
| Cash flows from investing activities: | |||||||||||||||||
| Net cash paid due to acquisitions |
|
(
|
|
||||||||||||||
| Proceeds from sale of premises and equipment |
|
|
|
||||||||||||||
| Purchases of premises and equipment |
(
|
(
|
(
|
||||||||||||||
| Proceeds from maturities, calls and principal repayments of securities held-to-maturity |
|
|
|
||||||||||||||
| Proceeds from maturities, calls and principal repayments of securities available-for-sale |
|
|
|
||||||||||||||
| Proceeds from sales of securities available-for-sale |
|
|
|
||||||||||||||
| Purchases of investment securities held-to-maturity |
(
|
(
|
(
|
||||||||||||||
| Purchases of investment securities available-for-sale |
(
|
(
|
(
|
||||||||||||||
| Proceeds from sales of money market mutual funds |
|
|
|
||||||||||||||
| Purchases of money market mutual funds |
(
|
(
|
(
|
||||||||||||||
| Net (increase) decrease in other investments |
(
|
(
|
|
||||||||||||||
| Proceeds from sale of loans originally held-for-investment |
|
|
|
||||||||||||||
| Net increase in loans and leases |
(
|
(
|
(
|
||||||||||||||
| Proceeds from sales of other real estate owned |
|
|
|
||||||||||||||
| Proceeds from bank owned life insurance |
|
|
|
||||||||||||||
| Net cash used in investing activities |
(
|
(
|
(
|
||||||||||||||
| Cash flows from financing activities: | |||||||||||||||||
| Net (decrease) increase in deposits |
(
|
|
|
||||||||||||||
| Net increase (decrease) in short-term borrowings |
|
|
(
|
||||||||||||||
| Proceeds from issuance of long-term debt |
|
|
|
||||||||||||||
| Repayment of long-term debt |
|
(
|
(
|
||||||||||||||
| Proceeds from issuance of subordinated notes |
|
|
|
||||||||||||||
| Subordinated notes issuance costs |
(
|
|
(
|
||||||||||||||
| Repayment of subordinated notes |
|
(
|
(
|
||||||||||||||
| Payment of contingent consideration on acquisitions |
|
(
|
(
|
||||||||||||||
| Payment for shares withheld to cover taxes on vesting of restricted stock units |
(
|
(
|
(
|
||||||||||||||
| Purchases of treasury stock |
(
|
(
|
(
|
||||||||||||||
| Stock issued under dividend reinvestment and employee stock purchase plans |
|
|
|
||||||||||||||
| Proceeds from exercise of stock options |
|
|
|
||||||||||||||
| Cash dividends paid |
(
|
(
|
(
|
||||||||||||||
50
| Net cash provided by financing activities |
|
|
|
||||||||||||||
| Net (decrease) increase in cash and cash equivalents |
(
|
|
|
||||||||||||||
| Cash and cash equivalents at beginning of year |
|
|
|
||||||||||||||
| Cash and cash equivalents at end of period | $ |
|
$ |
|
$ |
|
|||||||||||
| For the Years Ended December 31, | |||||||||||||||||
| 2022 | 2021 | 2020 | |||||||||||||||
| Supplemental disclosures of cash flow information: | |||||||||||||||||
| Cash paid for interest | $ |
|
$ |
|
$ |
|
|||||||||||
| Cash paid for income taxes, net of refunds |
|
|
|
||||||||||||||
| Non cash transactions: | |||||||||||||||||
| Transfer of loans to other real estate owned | $ |
|
$ |
|
$ |
|
|||||||||||
| Transfer of loans to loans held for sale |
|
|
|
||||||||||||||
| Contingent consideration recorded as goodwill |
|
|
|
||||||||||||||
See accompanying notes to consolidated financial statements.
51
UNIVEST FINANCIAL CORPORATION AND SUBSIDIARIES
Notes to Consolidated Financial Statements
(All dollar amounts presented in tables are in thousands, except share and per share data. "N/M" equates to "not meaningful"; "-" equates to "zero" or "doesn't round to a reportable number"; and "N/A" equates to "not applicable".)
Note 1.
Summary of Significant Accounting Policies
Organization
Univest Financial Corporation (the Corporation) through its wholly-owned subsidiary, Univest Bank and Trust Co. (the Bank), is engaged in domestic banking services for individuals, businesses, municipalities and non-profit organizations. The Bank is the parent company of Girard Investment Services, LLC, a full-service registered introducing broker-dealer and a licensed insurance agency, Girard Advisory Services, LLC, a registered investment advisory firm, and Girard Pension Services, LLC, a registered investment advisor, which provides investment consulting and management services to municipal entities. The Bank is also the parent company of Univest Insurance, LLC, an independent insurance agency, and Univest Capital, Inc., an equipment financing business. The Bank's subsidiaries enhance the traditional banking services provided by the Bank.
Principles of Consolidation
The consolidated financial statements include the accounts of the Corporation and its wholly-owned subsidiaries, including the Bank as the Corporation's primary subsidiary. All significant intercompany balances and transactions have been eliminated in consolidation. Certain prior period amounts have been reclassified to conform to the current-year presentation. Assets held by the Corporation in a fiduciary or agency capacity for its customers are not included in the consolidated financial statements since such items are not assets of the Corporation.
Earnings per Share
The Corporation uses the two-class method to calculate earnings per share as the unvested restricted stock awards outstanding under the Corporation's equity incentive plans are participating shares with nonforfeitable rights to dividends. Restricted stock awards granted prior to January 1, 2019 represent participating shares. Restricted stock units granted subsequent to January 1, 2019 do not contain nonforfeitable dividend rights and are therefore not participating shares. Under the two-class method, earnings per common share are computed by dividing the sum of distributed earnings to common shareholders and undistributed earnings allocated to common shareholders by the weighted average number of common shares outstanding for the period. In applying the two-class method, undistributed earnings are allocated to both common shares and participating securities based on the number of weighted average shares outstanding during the period. Potential common shares that may be issued by the Corporation relate to outstanding stock options and restricted stock units, and are determined using the treasury stock method. Diluted earnings per share reflect additional common shares that would have been outstanding if options on common shares had been exercised and restricted stock units had vested and the hypothetical repurchases of shares to find such restricted stock units, under the treasury stock method, is less than the average restricted stock units outstanding for the periods presented. The effects of options to issue common stock and unvested restricted stock units are excluded from the computation of diluted earnings per share in periods in which the effect would be antidilutive. Antidilutive options are those options with weighted average exercise prices in excess of the weighted average market value. Antidilutive restricted stock units are those with hypothetical repurchases of shares, under the treasury stock method, exceeding the average restricted stock units outstanding for the periods presented.
52
Cash and Cash Equivalents
The Corporation has defined those items included in the caption "Cash and due from banks" and "Interest-earning deposits with other banks" as cash and cash equivalents. Interest-earning deposits with other banks consist of deposit accounts with other financial institutions. At times, such balances exceed the FDIC limits for insurance coverage.
Investment Securities
Management determines the appropriate classification of debt securities at the time of purchase and re-evaluates such designation as of each balance sheet date. Securities are classified as investment securities held-to-maturity and carried at amortized cost if management has the positive intent and ability to hold the securities to maturity. Securities classified as available-for-sale are those securities that the Corporation intends to hold for an indefinite period of time but not necessarily to maturity. Securities available-for-sale are carried at fair value with unrealized gains and losses recorded in accumulated other comprehensive income, net of estimated income taxes. Any decision to sell a security classified as available-for-sale would be based on various factors, including interest rates, changes in the maturity or mix of the Corporation's assets and liabilities, liquidity needs, regulatory capital considerations and other factors. Securities purchased with the intention of recognizing short-term profits are placed in a trading account and are carried at fair value. The Corporation did not have any trading account securities at December 31, 2022 or 2021.
Purchase premiums and discounts are recognized in interest income using the interest method over the expected life of the securities except for premiums on callable debt securities, which are amortized to the next call date.
D
ue to volatility in the financial markets, there is the risk that any future fair value could vary from that disclosed in the accompanying financial statements. Realized gains and losses on the sale of investment securities are recorded on the trade date, determined using the specific identification method, and are included in the consolidated statements of income.
The Corporation measures expected credit losses on held-to-maturity debt securities, which are comprised of residential mortgage-backed securities. The Corporation's residential mortgage-backed security holdings are issued by U.S. government entities and agencies and are either explicitly or implicitly guaranteed by the U.S. government, are highly rated by major rating agencies and have a long history of no credit losses.
Accrued interest receivable on held-to-maturity debt securities totaled $
330
thousand at December 31, 2022 and is included within Accrued interest receivable and other assets. This amount is excluded from the estimate of expected credit losses. Held-to-maturity debt securities are typically classified as nonaccrual when the contractual payment of principal or interest has become 90 days past due or management has serious doubts about the further collectability of principal or interest. When held-to-maturity debt securities are placed on nonaccrual status, unpaid interest credited to income is reversed.
The Corporation measures expected credit losses on available-for-sale debt securities when the Corporation does not intend to sell, or when it is not more likely than not that it will be required to sell, the security before recovery of its amortized cost basis. If either of the criteria regarding intent or requirement to sell is met, the security's amortized cost basis is written down to fair value through income. For available-for-sale debt securities that do not meet the aforementioned criteria, the Corporation evaluates whether the decline in fair value has resulted from credit losses or other factors. In making this assessment, the Corporation considers the extent to which fair value is less than amortized cost, any changes to the rating of the security by a rating agency, and adverse conditions specifically related to the security, among other factors. If this evaluation indicates that a credit loss exists, the present value of cash flows expected to be collected from the security are compared to the amortized cost basis of the security. If the present value of cash flows expected to be collected is less than the amortized cost basis, a credit loss exists and an allowance for credit losses is recorded for the credit loss equal to the amount that the fair value is less than the amortized cost basis. Economic forecast data is utilized to calculate the present value of expected cash flows. The Corporation obtains its forecast data through a subscription to a widely recognized and relied upon company who publishes various forecast scenarios. Management evaluates the various scenarios to determine a reasonable and supportable scenario, and utilizes a single scenario, or a combination of scenarios, in the model. Any impairment that has not been recorded through an allowance for credit losses is recognized in other comprehensive income.
The allowance for credit losses on available-for-sale debt securities is included within Investment securities available-for-sale on the consolidated balance sheet. Changes in the allowance for credit losses are recorded within Provision for credit losses on the consolidated statement of income. Losses are charged against the allowance when the Corporation believes the collectability of an available-for-sale security is in jeopardy or when either of the criteria regarding intent or requirement to sell is met.
53
Accrued interest receivable on available-for-sale debt securities totaled $
1.0
million at December 31, 2022 and is included within Accrued interest receivable and other assets on the consolidated balance sheet. This amount is excluded from the estimate of expected credit losses. Available-for-sale debt securities are typically classified as nonaccrual when the contractual payment of principal or interest has become 90 days past due or management has serious doubts about the further collectability of principal or interest. When available-for-sale debt securities are placed on nonaccrual status, unpaid interest credited to income is reversed.
Equity securities are measured at fair value with changes in fair value recognized in net income.
Loans and Leases
Loans that the Corporation has the intent and ability to hold for the foreseeable future or until maturity or payoff are reported at amortized cost, which is the principal amount, net of deferred fees and costs, and the allowance for credit losses. Lease financings are stated at net investment amount, consisting of the present value of lease payments and unguaranteed residual value, plus initial direct costs.
A loan or lease is typically classified as nonaccrual when the contractual payment of principal or interest has become
90
days past due or management has serious doubts about the further collectability of principal or interest, even though the loan or lease is currently performing. When a loan or lease is classified as nonaccrual, the accrual of interest on such a loan or lease is discontinued. A loan or lease may remain on accrual status if it is in the process of collection and is either guaranteed or well secured. When a loan or lease is placed on nonaccrual status, unpaid interest credited to income is reversed and the amortization of the deferred fees and costs is suspended. Interest payments received on nonaccrual loans and leases are either applied against principal or reported as interest income, according to management's judgment as to the ultimate collectability of principal. Loans and leases are usually restored to accrual status when the obligation is brought current, has performed in accordance with the contractual terms for a reasonable period of time, and the ultimate collectability of the total contractual principal and interest is no longer in doubt.
A loan or lease is classified as a troubled debt restructuring when a concession has been granted to an existing borrower experiencing financial difficulties. The Corporation grants concessions to existing borrowers primarily related to extensions of interest-only payment periods and, occasionally, payment modifications. These modifications typically are for up to one year. The goal when restructuring a credit is to establish a reasonable period of time to provide cash flow relief to customers experiencing cash flow difficulties. Accruing troubled debt restructured loans are primarily comprised of loans on which interest is being accrued under the restructured terms, and the loans are current or less than 90 days past due.
Accrued interest receivable on loans and leases held for investment totaled $
20.9
million at December 31, 2022 and is included within Accrued interest receivable and other assets on the consolidated balance sheet. This amount is excluded from the estimate of expected credit losses.
54
Loan and Lease Fees
Fees collected upon loan or lease originations and certain direct costs of originating loans and leases are deferred and recognized over the contractual lives of the related loans and leases as yield adjustments using the interest method. Upon prepayment or other disposition of the underlying loans and leases before their contractual maturities, any associated unearned fees or unamortized costs are recognized. Initial direct costs, comprised of commissions paid that would not have been incurred if the lease had not been obtained, are deferred and amortized over the life of the contract, and are classified within net interest income.
Allowance for Credit Losses on Loans and Leases
The allowance for credit losses (ACL) on loans and leases is a valuation account that is used to present the net amount expected to be collected on a loan or lease. The ACL on loans and leases is measured on a collective (pooled) basis when similar risk characteristics exist. The ACL on loans and leases is adjusted through a provision for credit losses as a charge against, or credit to, earnings. Loans and leases deemed to be uncollectible are charged against the ACL on loans and leases, and any subsequent recoveries are credited to the ACL on loans and leases. Management evaluates the ACL on loans and leases on a quarterly basis and when changes in the reserve are necessary, an adjustment is made. The ACL on loans and leases is included within Allowance for credit losses, loans and leases on the consolidated balance sheet. Changes in the ACL on loans and leases are recorded within Provision for credit losses on the consolidated statements of income.
Management utilizes a discounted cash flow (DCF) model to calculate the present value of the expected cash flows for pools of loans and leases that share similar risk characteristics and compares the results of this calculation to the amortized cost basis of such loans and leases to determine its allowance for credit loss balance.
Management uses relevant available information, from internal and external sources, relating to past events, current conditions, and reasonable and supportable forecasts in calculating its ACL. Historical credit loss experience provides one of the bases for the estimation of expected credit losses. Management determines whether there is a need to make qualitative adjustments to historical loss information by monitoring certain factors including differences in current loan-specific risk characteristics as well as for changes in external or environmental conditions, or other relevant factors.
The contractual term used in projecting the cash flows of a loan is based on the maturity date of a loan, and is adjusted for prepayment or curtailment assumptions which may shorten that contractual time period. Options to extend are considered by management in determining the contractual term.
The key inputs to the DCF model are (1) probability of default, (2) loss given default, (3) prepayment and curtailment rates, (4) recovery delay, (5) reasonable and supportable economic forecasts, (6) forecast reversion period, (7) expected recoveries on charged off loans, and (8) discount rate.
Probability of Default (PD)
In order to incorporate economic factors into forecasting within the DCF model, management elected to use the Loss Driver method to generate the PD rate inputs. The Loss Driver method analyzes how one or more economic factors change the default rate using a statistical regression analysis. Management selects economic factors for each loan pool that have strong correlations to historical default rates, and reviews the economic factors selected on an annual basis. For the period ended December 31, 2022, the factors management selected were unemployment rate, GDP, and housing pricing index.
Loss Given Default (LGD)
Management elected to use the Frye Jacobs parameter for determining the LGD input, which is an estimation technique that derives a LGD input from segment specific risk curves that correlates LGD with PD.
Prepayment and Curtailment rates
Prepayment
Rates: Loan and lease level transaction data is used to calculate quarterly prepayment rates using available historical loan and lease level data. Those quarterly rates are annualized and the average of the annualized rates is used in the DCF calculation for fixed payment or term loans. Rates are calculated for each pool.
55
Curtailment Rates: Loan level transaction data is used to calculate annual curtailment rates using available historical loan level data. The average of the historical rates is used in the DCF model for interest only payment or line of credit type loans. Rates are calculated for each pool.
Recovery Delay
The recovery delay input within the DCF calculation represents an estimate of the period of time between when a modeled default occurs and the ultimate resolution of that default, specifically the portion of that default that does not result in a loss. Management analyzes historical recovery activity on previous default activity to subjectively determine an appropriate recovery delay for each pool.
Reasonable and Supportable Forecasts
The forecast data used in the DCF model is obtained via a subscription to a widely recognized and relied upon company who publishes various forecast scenarios. Management evaluates the various scenarios to determine a reasonable and supportable scenario and utilizes a single scenario, or a combination of scenarios, in the model.
Forecast Reversion Period
Management uses forecasts to predict how economic factors will perform and has determined to use a four quarter forecast period as well as a four quarter straight-line reversion period to historical averages (also commonly referred to as the mean reversion period).
Expected Recoveries on Charged-off Loans
Management performs an analysis to estimate recoveries that could be reasonably expected based on historical experience in order to account for expected recoveries on loans that have already been fully charged-off and are not included in the ACL calculation.
Discount Rate
The effective interest rate of the underlying loans and leases of the Corporation serves as the discount rate applied to the expected periodic cash flows. Management adjusts the effective interest rate used to discount expected cash flows to incorporate expected prepayments which can be reasonably estimated for each pool.
Individual Evaluation
Management evaluates individual instruments for expected credit losses when those instruments do not share similar risk characteristics with instruments evaluated using a collective (pooled) basis. Instruments will not be included in both collective and individual analyses. Individual analysis will establish a specific reserve for instruments in scope. All loans on nonaccrual status are individually evaluated for a specific reserve.
Management considers a financial asset as collateral-dependent when the debtor is experiencing financial difficulty and repayment is expected to be provided substantially through the sale or operation of the collateral, based on management's assessment as of the reporting date.
Premises and Equipment
Land is stated at cost, and premises and equipment are stated at cost less accumulated depreciation. Depreciation is computed on the straight-line method and charged to operating expenses over the estimated useful lives of the assets or, for leasehold improvements, over the shorter of the expected life of the related lease or the remaining estimated useful life of the asset. The estimated useful life for new buildings constructed on land owned is
forty years
. For
new buildings constructed on leased land or land improvements, the estimated useful life is the initial term
. The useful life of purchased existing buildings is the estimated remaining useful life at the time of the purchase. Furniture, fixtures and equipment have estimated useful lives ranging from
to
ten years
. When assets are retired, or otherwise disposed of, the cost and related accumulated depreciation are removed from the accounts.
56
Goodwill and Other Intangible Assets
The Corporation accounts for its acquisitions using the purchase accounting method. Purchase accounting requires the total purchase price to be allocated to the estimated fair values of assets acquired and liabilities assumed, including certain intangible assets that must be recognized. Typically, this allocation results in the purchase price exceeding the fair value of net assets acquired, which is recorded as goodwill. Core deposit intangibles are a measure of the value of checking, money market and savings deposits acquired in business combinations accounted for under the purchase method. Core deposit intangibles are amortized using the sum of the year's digits over their estimated useful lives of up to
fifteen years
. Customer-related intangibles are the value associated with the existing customer base acquired in business combinations accounted for under the purchase method. Customer-related intangibles are amortized over their estimated useful lives of
to
twelve years
. The Corporation performs an assessment of goodwill at least on an annual basis or more often if events and circumstances indicate that a goodwill impairment test should be performed. The Corporation also completes an impairment test for other intangible assets on an annual basis or more often if events and circumstances indicate a possible impairment. The Corporation has selected October 31
st
as the date to perform the annual impairment test.
Servicing rights are recognized as separate assets when loans are sold and the servicing rights are retained. Capitalized servicing rights are reported in other intangible assets on the consolidated balance sheets and are amortized into noninterest income in proportion to, and over the period of, estimated net servicing income on a basis similar to the interest method and an accelerated amortization method for loan payoffs. Servicing rights are evaluated for impairment, on a quarterly basis, based upon the estimated fair value of the rights as compared to their amortized cost. The Corporation estimates the fair value of servicing rights using discounted cash flow models that calculate the present value of estimated future net servicing income. The model uses readily available prepayment speed assumptions for the portfolios serviced. The impairment test stratifies servicing assets based on predominant risk characteristics of the underlying financial assets such as the term and interest rate. In conjunction with the impairment test, the Corporation records a valuation allowance when the fair value of the stratified servicing asset is less than amortized cost. Subsequent changes in the valuation of the assets are recorded as either an increase or a reduction of the valuation allowance, however, if the fair value exceeds amortized cost, such excess will not be recognized.
Other Real Estate Owned
Other real estate owned (OREO) represents properties that the Corporation has acquired through foreclosure by either accepting a deed in lieu of foreclosure, or by taking possession of assets that were used as loan collateral. The Corporation reports OREO at the lower of cost or fair value less cost to sell, adjusted periodically based on current appraisals, letters of intent or agreement of sale. Capital improvement expenses associated with the construction or repair of the property are capitalized as part of the cost of the OREO asset. Write-downs and any gain or loss upon the sale of OREO is recorded in Other income. OREO is reported in Accrued interest receivable and other assets on the consolidated balance sheet.
Retirement Plans and Other Postretirement Benefits
Substantially all employees who were hired before December 8, 2009 are covered by a non-contributory retirement plan. Effective December 31, 2009, the benefits previously accrued under the non-contributory retirement plan were frozen and the plan was amended and converted to a cash balance plan, with participants not losing any pension benefits already earned in the plan. Prior to the cash balance plan conversion, the plan provided benefits based on a formula of each participant's final average pay. Future benefits under the cash balance plan accrue by crediting participants annually with an amount equal to a percentage of earnings in that year based on years of credited service as defined in the plan. Employees hired on or after December 8, 2009 are not eligible to participate in the non-contributory retirement plan. The Corporation also maintains a non-qualified benefit plan that provides supplemental executive retirement benefits to certain former executives, a portion of which is in excess of limits imposed on qualified plans by federal tax law. This non-qualified benefit plan is not offered to new participants and all current participants are now retired. The Corporation provides certain postretirement healthcare and life insurance benefits for
57
retired employees. The Corporation's measurement date for plan assets and obligations is fiscal year-end. The Corporation recognizes on its consolidated balance sheet the funded status of its defined pension plans and changes in the funded status of the plan in the year in which the changes occur. An under-funded position would create a liability and an over-funded position would create an asset, with a correlating deferred tax asset or liability. The net impact would be an adjustment to equity as accumulated other comprehensive income (loss). The Corporation recognizes as a component of other comprehensive income (loss), net of tax, the actuarial gains and losses and the prior service costs and credits that arise during the period.
The Corporation sponsors a 401(k) deferred salary savings plan, which is a qualified defined contribution plan, and which covers all employees of the Corporation and its subsidiaries, and provides that the Corporation make matching contributions as defined by the plan.
The Corporation sponsors a Supplemental Non-Qualified Pension Plan, which was established in 1981 prior to the existence of 401(k) deferred salary savings, employee stock purchase and long-term incentive plans, and therefore is not offered to new participants. All current participants are now retired. This non-qualified plan is accounted for under guidance for deferred compensation arrangements.
Derivative Financial Instruments
The Corporation recognizes all derivative financial instruments on its consolidated balance sheet at fair value. Derivatives that are not hedges must be adjusted to fair value through income. If a derivative is a hedge, depending on the nature of the hedge, changes in the fair value of the derivative are either offset against the change in fair value of the hedged assets, liabilities, or firm commitments through earnings, or recognized in other comprehensive income until the underlying transaction is recognized in earnings. To determine fair value, the Corporation uses third-party pricing models that incorporate assumptions about market conditions and risks that are current at the reporting date.
The Corporation may use interest-rate swap agreements to modify interest rate characteristics from variable to fixed or fixed to variable in order to reduce the impact of interest rate changes on future net interest income. The Corporation accounts for its interest-rate swap contracts in cash flow hedging relationships by establishing and documenting the effectiveness of the instrument in offsetting the change in cash flows of assets or liabilities that are being hedged. To determine effectiveness, the Corporation performs an analysis to identify if changes in fair value of the derivative correlate to the equivalent changes in the forecasted interest receipts related to a specified hedged item. Recorded amounts related to interest-rate swaps are included in other assets or liabilities. The entire change in the fair values of the derivative instruments designated as hedges of future cash flows are recognized in accumulated other comprehensive income until the underlying forecasted transactions occur, at which time the deferred gains and losses are recognized in interest income. In a fair value hedge, the entire change in the fair values of the interest rate swap and hedged item included in the assessment of hedge effectiveness is recorded in interest income. The Corporation performs an assessment, both at the inception of the hedge and quarterly thereafter, to determine whether these derivatives are highly effective in offsetting changes in the value of the hedged items.
The Corporation has agreements with third-party financial institutions whereby the third-party financial institution enters into interest rate derivative contracts with loan customers referred to them by the Corporation. By the terms of the agreements, the third-party financial institution has recourse to the Corporation for any exposure created under each swap contract in the event the customer defaults on the swap agreement and the agreement is in a paying position to the third-party financial institution. The Corporation records the fair value of credit derivatives in other liabilities on the consolidated balance sheets. The Corporation recognizes changes in the fair value of credit derivatives, net of any fees received, in other noninterest income in the consolidated statements of income.
In connection with its mortgage banking activities, the Corporation enters into commitments to originate certain fixed-rate residential mortgage loans for customers, also referred to as interest rate locks. In addition, the Corporation enters into forward commitments for the future sale of mortgage loans to third-party investors to hedge the effect of changes in interest rates on the value of the interest rate locks. Forward loan sale commitments may also be in the form of commitments to sell individual mortgage loans at a fixed price at a future date. Both the interest rate locks and the forward loan sale commitments are accounted for as derivatives and carried at fair value. Gross derivative assets and liabilities are recorded within other assets and other liabilities on the consolidated balance sheets, with changes in fair value during the period recorded within the net gain on mortgage banking activities on the consolidated statements of income.
Off-balance Sheet Commitments and Reserve for Unfunded Commitments
Commitments are made to accommodate the financial needs of customers. The Corporation uses the same credit policies in making commitments and conditional obligations as it does for on-balance sheet financial instruments. The Corporation
58
maintains a reserve for off-balance sheet credit exposures that are currently unfunded. Management calculates funding rates using historical loan level data at the portfolio level. The current quarter's funding rate is subtracted from the maximum historical funding rate which is then applied to each pool's total available line of credit. The applicable ACL pool level loss rates for the current quarter are then applied to calculate the reserve for unfunded commitments liability each period.
The reserve for off-balance sheet credit exposures is included within Accrued expenses and other liabilities on the consolidated balance sheet. Changes in the reserve for off-balance sheet credit exposures are recorded within Provision for credit losses on the consolidated statement of income.
Lease Liabilities and Right-of-Use Assets
The Corporation and its subsidiaries are obligated under non-cancelable operating leases for premises for certain financial centers and other office locations. The Corporation determines if an arrangement is a lease at inception by assessing whether a contract contains a right to control an identified asset for a period of time in exchange for consideration. Operating leases are included in operating lease right-of-use assets and operating lease liabilities on the consolidated balance sheet. For purposes of calculating operating lease liabilities, lease terms include options to extend or terminate the lease when it is reasonably certain that the Corporation will exercise that option and begins when the Corporation has control and possession of the leased property, which may be before rental payments are due under the lease. Right-of use assets and operating lease liabilities are recognized based on the present value of lease payments, discounted using the Corporation's incremental borrowing rate, over the lease term at the possession date. The Corporation determines its incremental borrowing rate using publicly available information available for debt issuers with similar credit ratings as the Bank, as the substantial majority of the Corporation's leases are related to properties of the Bank. The Corporation separately accounts for lease and non-lease components such as property taxes, insurance, and maintenance costs. Operating lease expense for the Corporation's leases, which generally have escalating rental payments over the term of the lease, is recognized on a straight-line basis over the lease term.
Most leases include one or more options to renew, with renewal terms generally containing one or more five-year renewal options.
At December 31, 2022, the Corporation's leases have remaining terms of
14
months to
21
years.
Stock-Based Compensation
The fair value of share-based awards is recognized as compensation expense over the vesting period, on a straight-line basis, based on the grant-date fair value of the awards.
The fair value of restricted stock is equivalent to the fair value of the Corporation's common stock on the date of grant. The Corporation grants performance-based and service-based restricted stock. The performance-based restricted stock vests based upon the Corporation's performance with respect to certain financial measures over a
three-year
period and based on the passage of time. The service-based restricted stock vests based on the passage of time. The fair value of restricted stock is recognized as compensation expense over the vesting period and for performance-based restricted stock is adjusted for a probability factor of achieving the performance goals.
Revenue Recognition
The Corporation's revenue is the sum of net interest income and noninterest income. Revenues are recognized when obligations under the terms of contracts with customers are satisfied, including the transfer of control of the promised goods or
59
Accounting Pronouncements Adopted in 2022
In January 2020, the FASB issued ASU No. 2020-01, "
Investments—Equity Securities (Topic 321): Investments—Equity Method and Joint Ventures (Topic 323), and Derivatives and Hedging (Topic 815): Clarifying the Interactions between Topic 321, Topic 323, and Topic 815."
This ASU 2020-01 clarifies the interactions between ASC 321, ASC 323 and ASC 815 and addresses accounting for the transition into and out of the equity method and measuring certain purchased options and forward contracts to acquire investments. This ASU became effective on January 1, 2022 for the Corporation. The adoption of this ASU did not have a material impact on the Corporation's financial statements.
In August 2020, the FASB issued ASU No. 2020-06,
"Debt—Debt with Conversion and Other Options (Subtopic 470-20) and Derivatives and Hedging—Contracts in Entity’s Own Equity (Subtopic 815-40)
." This guidance simplifies the accounting for convertible debt and convertible preferred stock by removing the requirements to separately present certain conversion features in equity. In addition, the amendments in the ASU also simplify the guidance in ASC 815-40 by removing certain criteria that must be satisfied in order to classify a contract as equity, which is expected to decrease the number of freestanding instruments and embedded derivatives accounted for as assets or liabilities. Finally, the amendments revise the guidance on calculating earnings per share, requiring use of the if-converted method for all convertible instruments and require entities to presume share settlement for purposes of calculating diluted EPS when an instrument may be settled in cash or shares. This ASU became effective on January 1, 2022 for the Corporation. The adoption of this ASU did not have a material impact on the Corporation's financial statements.
In March 2022, the FASB issued ASU No. 2022-01,
"Derivatives and Hedging (Topic 815): Fair Value Hedging - Portfolio Layer Method."
ASU 2022-01 addresses and clarifies the guidance in ASC 815 on fair value hedge accounting of interest rate risk for portfolios of financial assets. This ASU amends the guidance in ASU 2017-12 that established the "last-of-layer" method for making the fair value hedge accounting for these portfolios more accessible. ASU 2022-01 renames that method the "portfolio layer" method and addresses feedback from stakeholders regarding its application. This ASU allows entities to designate multiple hedging relationships with a single closed portfolio, including both prepayable and non-prepayable financial assets, and therefore a larger portion of the interest rate risk associated with such a portfolio is eligible to be hedged.
This ASU is effective for fiscal years beginning after December 15, 2022 or January 1, 2023 for the Corporation, including interim periods within those fiscal years. Early adoption, however, is permitted if an entity has adopted the amendments in ASU 2017-12. The Corporation has elected to early adopt this ASU, and the adoption of this ASU did not have a material impact on the Corporation's financial statements.
Recent Accounting Pronouncements Yet to Be Adopted
In March 2022, the FASB issued ASU No. 2022-02,
"Financial Instruments - Credit Losses (Topic 326): Troubled Debt Restructurings and Vintage Disclosures."
The amendments eliminate the accounting guidance for troubled debt restructurings by creditors that have adopted CECL and enhance the disclosure requirements for modifications of receivables made with borrowers experiencing financial difficulty. In addition, the amendments require disclosure of current period gross write-offs by year of origination for financing receivables and net investment in leases in the existing vintage disclosures. This ASU is effective for fiscal years beginning after December 15, 2022 or January 1, 2023 for the Corporation, including interim periods within those fiscal years for entities that have adopted CECL. The Corporation will adopt this guidance on a modified retrospective basis effective January 1, 2023. The Corporation does not expect the adoption of this ASU will have a material impact on the Corporation's financial statements. Updated disclosure requirements related to the adoption of this guidance will be reflected in the March 31, 2023 Form 10-Q.
60
Note 2.
Earnings per Share
The following table sets forth the computation of basic and diluted earnings per share:
| For the Years Ended December 31, | |||||||||||||||||
| (Dollars and shares in thousands, except per share data) | 2022 | 2021 | 2020 | ||||||||||||||
| Numerator: | |||||||||||||||||
| Net income | $ |
|
$ |
|
$ |
|
|||||||||||
| Net income allocated to unvested restricted stock awards |
|
(
|
(
|
||||||||||||||
| Net income allocated to common shares | $ |
|
$ |
|
$ |
|
|||||||||||
| Denominator: | |||||||||||||||||
| Weighted average shares outstanding |
|
|
|
||||||||||||||
| Average unvested restricted stock awards |
|
(
|
(
|
||||||||||||||
|
Denominator for basic earnings per share
—weighted-average shares outstanding
|
|
|
|
||||||||||||||
| Effect of dilutive securities—employee stock options and restricted stock units |
|
|
|
||||||||||||||
|
Denominator for diluted earnings per share
—adjusted weighted-average shares outstanding
|
|
|
|
||||||||||||||
| Basic earnings per share | $ |
|
$ |
|
$ |
|
|||||||||||
| Diluted earnings per share | $ |
|
$ |
|
$ |
|
|||||||||||
| Average anti-dilutive options and restricted stock units excluded from computation of diluted earnings per share |
|
|
|
||||||||||||||
Note 3.
Restrictions on Cash and Due from Banks and Interest-earning Deposit Accounts
61
Note 4.
Investment Securities
The following tables show the amortized cost, the estimated fair value and the allowance for credit losses of the held-to-maturity securities and available-for-sale securities at December 31, 2022 and 2021, by contractual maturity within each type:
| At December 31, 2022 | |||||||||||||||||||||||||||||
| (Dollars in thousands) |
Amortized
Cost |
Gross
Unrealized Gains |
Gross
Unrealized Losses |
Allowance for Credit Losses | Fair Value | ||||||||||||||||||||||||
| Securities Held-to-Maturity | |||||||||||||||||||||||||||||
| Residential mortgage-backed securities: | |||||||||||||||||||||||||||||
| After 1 year to 5 years | $ |
|
$ |
|
$ |
(
|
$ |
|
$ |
|
|||||||||||||||||||
| After 5 years to 10 years |
|
|
(
|
|
|
||||||||||||||||||||||||
| Over 10 years |
|
|
(
|
|
|
||||||||||||||||||||||||
|
|
|
(
|
|
|
|||||||||||||||||||||||||
| Total | $ |
|
$ |
|
$ |
(
|
$ |
|
$ |
|
|||||||||||||||||||
| Securities Available-for-Sale | |||||||||||||||||||||||||||||
| State and political subdivisions: | |||||||||||||||||||||||||||||
| After 1 year to 5 years | $ |
|
$ |
|
$ |
(
|
$ |
|
$ |
|
|||||||||||||||||||
|
|
|
(
|
|
|
|||||||||||||||||||||||||
| Residential mortgage-backed securities: | |||||||||||||||||||||||||||||
| After 1 year to 5 years |
|
|
(
|
|
|
||||||||||||||||||||||||
| After 5 years to 10 years |
|
|
(
|
|
|
||||||||||||||||||||||||
| Over 10 years |
|
|
(
|
|
|
||||||||||||||||||||||||
|
|
|
(
|
|
|
|||||||||||||||||||||||||
| Collateralized mortgage obligations: | |||||||||||||||||||||||||||||
| After 5 years to 10 years |
|
|
(
|
|
|
||||||||||||||||||||||||
| Over 10 years |
|
|
(
|
|
|
||||||||||||||||||||||||
|
|
|
(
|
|
|
|||||||||||||||||||||||||
| Corporate bonds: | |||||||||||||||||||||||||||||
| Within 1 year |
|
|
|
|
|
||||||||||||||||||||||||
| After 1 year to 5 years |
|
|
(
|
(
|
|
||||||||||||||||||||||||
| After 5 years to 10 years |
|
|
(
|
(
|
|
||||||||||||||||||||||||
|
|
|
(
|
(
|
|
|||||||||||||||||||||||||
| Total | $ |
|
$ |
|
$ |
(
|
$ |
(
|
$ |
|
|||||||||||||||||||
62
| At December 31, 2021 | |||||||||||||||||||||||||||||
| (Dollars in thousands) |
Amortized
Cost |
Gross
Unrealized Gains |
Gross
Unrealized Losses |
Allowance for Credit Losses | Fair Value | ||||||||||||||||||||||||
| Securities Held-to-Maturity | |||||||||||||||||||||||||||||
| U.S. government corporations and agencies: | |||||||||||||||||||||||||||||
| Within 1 year | $ |
|
$ |
|
$ |
|
$ |
|
$ |
|
|||||||||||||||||||
|
|
|
|
|
|
|||||||||||||||||||||||||
| Residential mortgage-backed securities: | |||||||||||||||||||||||||||||
| After 5 years to 10 years |
|
|
|
|
|
||||||||||||||||||||||||
| Over 10 years |
|
|
(
|
|
|
||||||||||||||||||||||||
|
|
|
(
|
|
|
|||||||||||||||||||||||||
| Total | $ |
|
$ |
|
$ |
(
|
$ |
|
$ |
|
|||||||||||||||||||
| Securities Available-for-Sale | |||||||||||||||||||||||||||||
| State and political subdivisions: | |||||||||||||||||||||||||||||
| After 1 year to 5 years | $ |
|
$ |
|
$ |
|
$ |
|
$ |
|
|||||||||||||||||||
|
|
|
|
|
|
|||||||||||||||||||||||||
| Residential mortgage-backed securities: | |||||||||||||||||||||||||||||
| Within 1 year |
|
|
|
|
|
||||||||||||||||||||||||
| After 1 year to 5 years |
|
|
|
|
|
||||||||||||||||||||||||
| After 5 years to 10 years |
|
|
|
|
|
||||||||||||||||||||||||
| Over 10 years |
|
|
(
|
|
|
||||||||||||||||||||||||
|
|
|
(
|
|
|
|||||||||||||||||||||||||
| Collateralized mortgage obligations: | |||||||||||||||||||||||||||||
| After 5 years to 10 years |
|
|
|
|
|
||||||||||||||||||||||||
| Over 10 years |
|
|
(
|
|
|
||||||||||||||||||||||||
|
|
|
(
|
|
|
|||||||||||||||||||||||||
| Corporate bonds: | |||||||||||||||||||||||||||||
| Within 1 year |
|
|
|
|
|
||||||||||||||||||||||||
| After 1 year to 5 years |
|
|
(
|
(
|
|
||||||||||||||||||||||||
| After 5 years to 10 years |
|
|
(
|
(
|
|
||||||||||||||||||||||||
|
|
|
(
|
(
|
|
|||||||||||||||||||||||||
| Total | $ |
|
$ |
|
$ |
(
|
$ |
(
|
$ |
|
|||||||||||||||||||
Gross unrealized gains and losses on available-for-sale securities are recognized in accumulated other comprehensive income (loss) and changes in the allowance for credit loss are recorded in provision for credit loss expense. Expected maturities may differ from contractual maturities because debt issuers may have the right to call or prepay obligations without call or prepayment penalties and mortgage-backed securities typically prepay at a rate faster than contractually due.
Securities with a carrying value of $
429.4
million and $
281.7
million at December 31, 2022 and 2021, respectively, were pledged to secure public funds deposits and other contractual obligations. There were no pledged securities to secure credit derivatives and interest rate swaps at December 31, 2022. Securities of $
23.0
million were pledged to secure credit derivatives and interest rate swaps at December 31, 2021. See Note 18, "Derivative Instruments and Hedging Activities" for additional information.
The following table presents information related to sales of securities available-for-sale during the years ended December 31, 2022, 2021 and 2020:
| For the Years Ended December 31, | |||||||||||||||||
| (Dollars in thousands) | 2022 | 2021 | 2020 | ||||||||||||||
| Securities available-for-sale: | |||||||||||||||||
| Proceeds from sales | $ |
|
$ |
|
$ |
|
|||||||||||
| Gross realized gains on sales |
|
|
|
||||||||||||||
| Gross realized losses on sales |
|
|
|
||||||||||||||
| Tax expense related to net realized gains on sales |
|
|
|
||||||||||||||
63
At December 31, 2022 and 2021, there were
no
reportable investments in any single issuer representing more than
10
% of shareholders' equity.
The following table shows the fair value of securities that were in an unrealized loss position for which an allowance for credit losses has not been recorded at December 31, 2022 and 2021, by the length of time those securities were in a continuous loss position.
|
Less than
Twelve Months |
Twelve Months
or Longer |
Total | |||||||||||||||||||||||||||||||||
| (Dollars in thousands) | Fair Value |
Unrealized
Losses |
Fair Value |
Unrealized
Losses |
Fair Value |
Unrealized
Losses |
|||||||||||||||||||||||||||||
| At December 31, 2022 | |||||||||||||||||||||||||||||||||||
| Securities Held-to-Maturity | |||||||||||||||||||||||||||||||||||
| Residential mortgage-backed securities | $ |
|
$ |
(
|
$ |
|
$ |
(
|
$ |
|
$ |
(
|
|||||||||||||||||||||||
| Total | $ |
|
$ |
(
|
$ |
|
$ |
(
|
$ |
|
$ |
(
|
|||||||||||||||||||||||
| Securities Available-for-Sale | |||||||||||||||||||||||||||||||||||
| State and political subdivisions | $ |
|
$ |
(
|
$ |
|
$ |
|
$ |
|
$ |
(
|
|||||||||||||||||||||||
| Residential mortgage-backed securities |
|
(
|
|
(
|
|
(
|
|||||||||||||||||||||||||||||
| Collateralized mortgage obligations |
|
(
|
|
(
|
|
(
|
|||||||||||||||||||||||||||||
| Corporate bonds |
|
(
|
|
|
|
(
|
|||||||||||||||||||||||||||||
| Total | $ |
|
$ |
(
|
$ |
|
$ |
(
|
$ |
|
$ |
(
|
|||||||||||||||||||||||
| At December 31, 2021 | |||||||||||||||||||||||||||||||||||
| Securities Held-to-Maturity | |||||||||||||||||||||||||||||||||||
| Residential mortgage-backed securities | $ |
|
$ |
(
|
$ |
|
$ |
|
$ |
|
$ |
(
|
|||||||||||||||||||||||
| Total | $ |
|
$ |
(
|
$ |
|
$ |
|
$ |
|
$ |
(
|
|||||||||||||||||||||||
| Securities Available-for-Sale | |||||||||||||||||||||||||||||||||||
| Residential mortgage-backed securities | $ |
|
$ |
(
|
$ |
|
$ |
(
|
$ |
|
$ |
(
|
|||||||||||||||||||||||
| Collateralized mortgage obligations |
|
(
|
|
|
|
(
|
|||||||||||||||||||||||||||||
| Corporate bonds |
|
(
|
|
|
|
(
|
|||||||||||||||||||||||||||||
| Total | $ |
|
$ |
(
|
$ |
|
$ |
(
|
$ |
|
$ |
(
|
|||||||||||||||||||||||
At December 31, 2022, the fair value of held-to-maturity securities in an unrealized loss position for which an allowance for credit losses has not been recorded was $
134.1
million, including unrealized losses of $
20.7
million. These holdings were comprised of 84 federal agency mortgage-backed securities, which are U.S. government entities and agencies and are either explicitly or implicitly guaranteed by the U.S. government, are highly rated by major rating agencies and have a long history of no credit losses. The Corporation did not recognize any credit losses on held-to-maturity debt securities for the year ended December 31, 2022 or 2021. Accrued interest receivable on held-to-maturity debt securities totaled $
330
thousand at December 31, 2022 and is included within Accrued interest receivable and other assets on the consolidated balance sheet. This amount is excluded from the estimate of expected credit losses.
At December 31, 2022, the fair value of available-for-sale securities in an unrealized loss position for which an allowance for credit losses has not been recorded was $
266.8
million, including unrealized losses of $
42.4
million. These holdings were comprised of (1) 107 federal agency mortgage-backed securities, which are U.S. government entities and agencies and are either explicitly or implicitly guaranteed by the U.S. government, are highly rated by major rating agencies and have a long history of no credit losses, (2) two collateralized mortgage obligation bonds, (3) one state and political subdivisions bond and (4) one investment grade corporate bond. The Corporation does not intend to sell the securities in an unrealized loss position and is unlikely to be required to sell these securities before a recovery of fair value, which may be maturity. The Corporation concluded that the decline in fair value of these securities was not indicative of a credit loss. Accrued interest receivable on available-for-sale debt securities totaled $
1.0
million at December 31, 2022 and is included within Accrued interest receivable and other assets on the consolidated balance sheet. This amount is excluded from the estimate of expected credit losses.
64
The table below presents a rollforward by major security type for the years ended December 31, 2022 and 2021 of the allowance for credit losses on securities available-for-sale.
| (Dollars in thousands) | Corporate Bonds | ||||
| For the Year Ended December 31, 2022 | |||||
| Securities Available-for-Sale | |||||
| Beginning balance | $ |
(
|
|||
| Additions for securities for which no previous expected credit losses were recognized |
(
|
||||
| Change in securities for which a previous expected credit loss was recognized |
(
|
||||
| Ending balance | $ |
(
|
|||
| For the Year Ended December 31, 2021 | |||||
| Securities Available-for-Sale | |||||
| Beginning balance | $ |
(
|
|||
| Additions for securities for which no previous expected credit losses were recognized |
(
|
||||
| Change in securities for which a previous expected credit loss was recognized |
(
|
||||
| Ending balance | $ |
(
|
|||
At December 31, 2022, the fair value of available-for-sale securities in an unrealized loss position for which an allowance for credit losses has been recorded was $
80.8
million, including unrealized losses of $
9.4
million, and allowance for credit losses of $
1.1
million. These holdings were comprised of
39
investment grade corporate bonds which fluctuate in value based on changes in market conditions. For these securities, fluctuations were primarily due to changes in the interest rate environment. The Corporation does not have the intent to sell these securities and it is not likely that it will be required to sell the securities before their anticipated recovery. The underlying issuers continue to make timely principal and interest payments on the securities.
The Corporation recognized a $
198
thousand net loss and a $
161
thousand net gain on equity securities during the years ended December 31, 2022 and 2021, respectively, in other noninterest income. There were
no
sales of equity securities during the years ended December 31, 2022 or 2021.
Note 5.
Loans and Leases
Summary of Major Loan and Lease Categories
| At December 31, | |||||||||||
| (Dollars in thousands) | 2022 | 2021 | |||||||||
| Commercial, financial and agricultural | $ |
|
$ |
|
|||||||
| Paycheck Protection Program |
|
|
|||||||||
| Real estate-commercial |
|
|
|||||||||
| Real estate-construction |
|
|
|||||||||
| Real estate-residential secured for business purpose |
|
|
|||||||||
| Real estate-residential secured for personal purpose |
|
|
|||||||||
| Real estate-home equity secured for personal purpose |
|
|
|||||||||
| Loans to individuals |
|
|
|||||||||
| Lease financings |
|
|
|||||||||
| Total loans and leases held for investment, net of deferred income |
|
|
|||||||||
| Less: Allowance for credit losses, loans and leases |
(
|
(
|
|||||||||
| Net loans and leases held for investment | $ |
|
$ |
|
|||||||
| Imputed interest on lease financings, included in the above table | $ |
(
|
$ |
(
|
|||||||
| Net deferred costs, included in the above table |
|
|
|||||||||
| Overdraft deposits included in the above table |
|
|
|||||||||
65
Age Analysis of Past Due Loans and Leases
The following presents, by class of loans and leases held for investment, an aging of past due loans and leases, loans and leases which are current and nonaccrual loans and leases at December 31, 2022 and 2021:
| Accruing Loans and Leases | |||||||||||||||||||||||||||||||||||||||||||||||
| (Dollars in thousands) |
30-59
Days Past Due |
60-89
Days Past Due |
90 Days
or more Past Due |
Total
Past Due |
Current | Total Accruing Loans and Leases | Nonaccrual Loans and Leases |
Total Loans
and Leases Held for Investment |
|||||||||||||||||||||||||||||||||||||||
| At December 31, 2022 | |||||||||||||||||||||||||||||||||||||||||||||||
| Commercial, financial and agricultural | $ |
|
$ |
|
$ |
|
$ |
|
$ |
|
$ |
|
$ |
|
$ |
|
|||||||||||||||||||||||||||||||
| Paycheck Protection Program |
|
|
|
|
|
|
|
|
|||||||||||||||||||||||||||||||||||||||
| Real estate—commercial real estate and construction: | |||||||||||||||||||||||||||||||||||||||||||||||
| Commercial real estate |
|
|
|
|
|
|
|
|
|||||||||||||||||||||||||||||||||||||||
| Construction |
|
|
|
|
|
|
|
|
|||||||||||||||||||||||||||||||||||||||
| Real estate—residential and home equity: | |||||||||||||||||||||||||||||||||||||||||||||||
| Residential secured for business purpose |
|
|
|
|
|
|
|
|
|||||||||||||||||||||||||||||||||||||||
| Residential secured for personal purpose |
|
|
|
|
|
|
|
|
|||||||||||||||||||||||||||||||||||||||
| Home equity secured for personal purpose |
|
|
|
|
|
|
|
|
|||||||||||||||||||||||||||||||||||||||
| Loans to individuals |
|
|
|
|
|
|
|
|
|||||||||||||||||||||||||||||||||||||||
| Lease financings |
|
|
|
|
|
|
|
|
|||||||||||||||||||||||||||||||||||||||
| Total | $ |
|
$ |
|
$ |
|
$ |
|
$ |
|
$ |
|
$ |
|
$ |
|
|||||||||||||||||||||||||||||||
| Accruing Loans and Leases | |||||||||||||||||||||||||||||||||||||||||||||||
| (Dollars in thousands) |
30-59
Days Past Due |
60-89
Days Past Due |
90 Days
or more Past Due |
Total
Past Due |
Current | Total Accruing Loans and Leases | Nonaccrual Loans and Leases |
Total Loans
and Leases Held for Investment |
|||||||||||||||||||||||||||||||||||||||
| At December 31, 2021 | |||||||||||||||||||||||||||||||||||||||||||||||
| Commercial, financial and agricultural | $ |
|
$ |
|
$ |
|
$ |
|
$ |
|
$ |
|
$ |
|
$ |
|
|||||||||||||||||||||||||||||||
| Paycheck Protection Program |
|
|
|
|
|
|
|
|
|||||||||||||||||||||||||||||||||||||||
| Real estate—commercial real estate and construction: | |||||||||||||||||||||||||||||||||||||||||||||||
| Commercial real estate |
|
|
|
|
|
|
|
|
|||||||||||||||||||||||||||||||||||||||
| Construction |
|
|
|
|
|
|
|
|
|||||||||||||||||||||||||||||||||||||||
| Real estate—residential and home equity: | |||||||||||||||||||||||||||||||||||||||||||||||
| Residential secured for business purpose |
|
|
|
|
|
|
|
|
|||||||||||||||||||||||||||||||||||||||
| Residential secured for personal purpose |
|
|
|
|
|
|
|
|
|||||||||||||||||||||||||||||||||||||||
| Home equity secured for personal purpose |
|
|
|
|
|
|
|
|
|||||||||||||||||||||||||||||||||||||||
| Loans to individuals |
|
|
|
|
|
|
|
|
|||||||||||||||||||||||||||||||||||||||
| Lease financings |
|
|
|
|
|
|
|
|
|||||||||||||||||||||||||||||||||||||||
| Total | $ |
|
$ |
|
$ |
|
$ |
|
$ |
|
$ |
|
$ |
|
$ |
|
|||||||||||||||||||||||||||||||
66
Nonperforming Loans and Leases
The following presents, by class of loans and leases, nonperforming loans and leases at December 31, 2022 and 2021.
| At December 31, | |||||||||||||||||||||||||||||||||||||||||||||||
| 2022 | 2021 | ||||||||||||||||||||||||||||||||||||||||||||||
| (Dollars in thousands) |
Nonaccrual
Loans and Leases* |
Accruing
Troubled Debt Restructured Loans and Lease Modifications |
Loans and
Leases 90 Days or more Past Due and Accruing Interest |
Total Nonperforming
Loans and Leases |
Nonaccrual
Loans and Leases* |
Accruing
Troubled Debt Restructured Loans and Lease Modifications |
Loans and
Leases 90 Days or more Past Due and Accruing Interest |
Total Nonperforming
Loans and Leases |
|||||||||||||||||||||||||||||||||||||||
| Commercial, financial and agricultural | $ |
|
$ |
|
$ |
|
$ |
|
$ |
|
$ |
|
$ |
|
$ |
|
|||||||||||||||||||||||||||||||
| Real estate—commercial real estate and construction: | |||||||||||||||||||||||||||||||||||||||||||||||
| Commercial real estate |
|
|
|
|
|
|
|
|
|||||||||||||||||||||||||||||||||||||||
| Real estate—residential and home equity: | |||||||||||||||||||||||||||||||||||||||||||||||
| Residential secured for business purpose |
|
|
|
|
|
|
|
|
|||||||||||||||||||||||||||||||||||||||
| Residential secured for personal purpose |
|
|
|
|
|
|
|
|
|||||||||||||||||||||||||||||||||||||||
| Home equity secured for personal purpose |
|
|
|
|
|
|
|
|
|||||||||||||||||||||||||||||||||||||||
| Loans to individuals |
|
|
|
|
|
|
|
|
|||||||||||||||||||||||||||||||||||||||
| Lease financings |
|
|
|
|
|
|
|
|
|||||||||||||||||||||||||||||||||||||||
| Total | $ |
|
$ |
|
$ |
|
$ |
|
$ |
|
$ |
|
$ |
|
$ |
|
|||||||||||||||||||||||||||||||
* Includes nonaccrual troubled debt restructured loans of $
767
thousand and $
758
thousand at December 31, 2022 and December 31, 2021, respectively.
The following table presents the amortized cost basis of loans and leases held for investment on nonaccrual status and loans and leases held for investment 90 days or more past due and still accruing as of December 31, 2022 and 2021.
| (Dollars in thousands) | Nonaccrual With No ACL | Nonaccrual With ACL | Total Nonaccrual | Loans 90 Days or more Past Due and Accruing Interest | |||||||||||||||||||
| At December 31, 2022 | |||||||||||||||||||||||
| Commercial, financial and agricultural | $ |
|
$ |
|
$ |
|
$ |
|
|||||||||||||||
| Real estate-commercial |
|
|
|
|
|||||||||||||||||||
| Real estate-residential secured for business purpose |
|
|
|
|
|||||||||||||||||||
| Real estate-residential secured for personal purpose |
|
|
|
|
|||||||||||||||||||
| Real estate-home equity secured for personal purpose |
|
|
|
|
|||||||||||||||||||
| Loans to individuals |
|
|
|
|
|||||||||||||||||||
| Lease financings |
|
|
|
|
|||||||||||||||||||
| Total | $ |
|
$ |
|
$ |
|
$ |
|
|||||||||||||||
| At December 31, 2021 | |||||||||||||||||||||||
| Commercial, financial and agricultural | $ |
|
$ |
|
$ |
|
$ |
|
|||||||||||||||
| Real estate-commercial |
|
|
|
|
|||||||||||||||||||
| Real estate-residential secured for business purpose |
|
|
|
|
|||||||||||||||||||
| Real estate-residential secured for personal purpose |
|
|
|
|
|||||||||||||||||||
| Real estate-home equity secured for personal purpose |
|
|
|
|
|||||||||||||||||||
| Loans to individuals |
|
|
|
|
|||||||||||||||||||
| Lease financings |
|
|
|
|
|||||||||||||||||||
| Total | $ |
|
$ |
|
$ |
|
$ |
|
|||||||||||||||
For the year ended December 31, 2022, $
26
thousand of interest income was recognized on nonaccrual loans and leases.
67
The following table presents, by class of loans and leases, the amortized cost basis of collateral-dependent nonaccrual loans and leases and type of collateral as of December 31, 2022 and 2021.
| (Dollars in thousands) | Real Estate |
Other
(1)
|
None
(2)
|
Total | |||||||||||||||||||
| At December 31, 2022 | |||||||||||||||||||||||
| Commercial, financial and agricultural | $ |
|
$ |
|
$ |
|
$ |
|
|||||||||||||||
| Real estate-commercial |
|
|
|
|
|||||||||||||||||||
| Real estate-residential secured for business purpose |
|
|
|
|
|||||||||||||||||||
| Real estate-residential secured for personal purpose |
|
|
|
|
|||||||||||||||||||
| Real estate-home equity secured for personal purpose |
|
|
|
|
|||||||||||||||||||
| Lease financings |
|
|
|
|
|||||||||||||||||||
| Total | $ |
|
$ |
|
$ |
|
$ |
|
|||||||||||||||
| (Dollars in thousands) | Real Estate |
Other
(1)
|
None
(2)
|
Total | |||||||||||||||||||
| At December 31, 2021 | |||||||||||||||||||||||
| Commercial, financial and agricultural | $ |
|
$ |
|
$ |
|
$ |
|
|||||||||||||||
| Real estate-commercial |
|
|
|
|
|||||||||||||||||||
| Real estate-residential secured for business purpose |
|
|
|
|
|||||||||||||||||||
| Real estate-residential secured for personal purpose |
|
|
|
|
|||||||||||||||||||
| Real estate-home equity secured for personal purpose |
|
|
|
|
|||||||||||||||||||
| Lease financings |
|
|
|
|
|||||||||||||||||||
| Total | $ |
|
$ |
|
$ |
|
$ |
|
|||||||||||||||
(1) Collateral consists of business assets, including accounts receivable, personal property and equipment.
(2) Loans fully guaranteed by the SBA or fully reserved given lack of collateral.
Credit Quality Indicators
The Corporation categorizes risk based on relevant information about the ability of the borrower to service their debt. Loans with a relationship balance of less than $
1
million are reviewed when necessary based on their performance, primarily when such loans are delinquent. Loans with relationships greater than $
1
million are reviewed at least annually. Loan relationships with a higher risk profile or classified as special mention or substandard are reviewed at least quarterly. The Corporation reviews credit quality key risk indicators on at least an annual basis and last completed this review in conjunction with the period ended December 31, 2022. The following is a description of the internal risk ratings and the likelihood of loss related to the credit quality of commercial, financial and agricultural loans, Paycheck Protection Program loans, real estate- commercial loans, real estate-construction loans and real estate-residential secured for a business purpose loans.
1.
Pass—Loans considered satisfactory with no indications of deterioration
2.
Special Mention—Potential weakness that deserves management's close attention
3.
Substandard—Well-defined weakness or weaknesses that jeopardize the liquidation of the debt
4.
Doubtful—Collection or liquidation in-full, on the basis of current existing facts, conditions and values, highly questionable and improbable
68
Based on the most recent analysis performed, the following table presents the recorded investment in loans and leases held for investment for commercial, financial and agricultural loans, Paycheck Protection Program loans, real estate-commercial loans, real estate-construction loans and real estate-residential secured for a business purpose loans by credit quality indicator at December 31, 2022 and 2021.
| Term Loans Amortized Cost Basis by Origination Year | |||||||||||||||||||||||||||||||||||||||||||||||||||||
| (Dollars in thousands) | 2022 | 2021 | 2020 | 2019 | 2018 | Prior | Revolving Loans Amortized Cost Basis | Revolving Loans Converted to Term | Total | ||||||||||||||||||||||||||||||||||||||||||||
| At December 31, 2022 | |||||||||||||||||||||||||||||||||||||||||||||||||||||
| Commercial, financial and agricultural | |||||||||||||||||||||||||||||||||||||||||||||||||||||
| Risk Rating | |||||||||||||||||||||||||||||||||||||||||||||||||||||
| 1. Pass | $ |
|
$ |
|
$ |
|
$ |
|
$ |
|
$ |
|
$ |
|
$ |
|
$ |
|
|||||||||||||||||||||||||||||||||||
| 2. Special Mention |
|
|
|
|
|
|
|
|
|
||||||||||||||||||||||||||||||||||||||||||||
| 3. Substandard |
|
|
|
|
|
|
|
|
|
||||||||||||||||||||||||||||||||||||||||||||
| Total | $ |
|
$ |
|
$ |
|
$ |
|
$ |
|
$ |
|
$ |
|
$ |
|
$ |
|
|||||||||||||||||||||||||||||||||||
| Paycheck Protection Program | |||||||||||||||||||||||||||||||||||||||||||||||||||||
| Risk Rating | |||||||||||||||||||||||||||||||||||||||||||||||||||||
| 1. Pass | $ |
|
$ |
|
$ |
|
$ |
|
$ |
|
$ |
|
$ |
|
$ |
|
$ |
|
|||||||||||||||||||||||||||||||||||
| 2. Special Mention |
|
|
|
|
|
|
|
|
|
||||||||||||||||||||||||||||||||||||||||||||
| 3. Substandard |
|
|
|
|
|
|
|
|
|
||||||||||||||||||||||||||||||||||||||||||||
| Total | $ |
|
$ |
|
$ |
|
$ |
|
$ |
|
$ |
|
$ |
|
$ |
|
$ |
|
|||||||||||||||||||||||||||||||||||
| Real estate-commercial | |||||||||||||||||||||||||||||||||||||||||||||||||||||
| Risk Rating | |||||||||||||||||||||||||||||||||||||||||||||||||||||
| 1. Pass | $ |
|
$ |
|
$ |
|
$ |
|
$ |
|
$ |
|
$ |
|
$ |
|
$ |
|
|||||||||||||||||||||||||||||||||||
| 2. Special Mention |
|
|
|
|
|
|
|
|
|
||||||||||||||||||||||||||||||||||||||||||||
| 3. Substandard |
|
|
|
|
|
|
|
|
|
||||||||||||||||||||||||||||||||||||||||||||
| Total | $ |
|
$ |
|
$ |
|
$ |
|
$ |
|
$ |
|
$ |
|
$ |
|
$ |
|
|||||||||||||||||||||||||||||||||||
| Real estate-construction | |||||||||||||||||||||||||||||||||||||||||||||||||||||
| Risk Rating | |||||||||||||||||||||||||||||||||||||||||||||||||||||
| 1. Pass | $ |
|
$ |
|
$ |
|
$ |
|
$ |
|
$ |
|
$ |
|
$ |
|
$ |
|
|||||||||||||||||||||||||||||||||||
| 2. Special Mention |
|
|
|
|
|
|
|
|
|
||||||||||||||||||||||||||||||||||||||||||||
| 3. Substandard |
|
|
|
|
|
|
|
|
|
||||||||||||||||||||||||||||||||||||||||||||
| Total | $ |
|
$ |
|
$ |
|
$ |
|
$ |
|
$ |
|
$ |
|
$ |
|
$ |
|
|||||||||||||||||||||||||||||||||||
| Real estate-residential secured for business purpose | |||||||||||||||||||||||||||||||||||||||||||||||||||||
| Risk Rating | |||||||||||||||||||||||||||||||||||||||||||||||||||||
| 1. Pass | $ |
|
$ |
|
$ |
|
$ |
|
$ |
|
$ |
|
$ |
|
$ |
|
$ |
|
|||||||||||||||||||||||||||||||||||
| 2. Special Mention |
|
|
|
|
|
|
|
|
|
||||||||||||||||||||||||||||||||||||||||||||
| 3. Substandard |
|
|
|
|
|
|
|
|
|
||||||||||||||||||||||||||||||||||||||||||||
| Total | $ |
|
$ |
|
$ |
|
$ |
|
$ |
|
$ |
|
$ |
|
$ |
|
$ |
|
|||||||||||||||||||||||||||||||||||
| Totals By Risk Rating | |||||||||||||||||||||||||||||||||||||||||||||||||||||
| 1. Pass | $ |
|
$ |
|
$ |
|
$ |
|
$ |
|
$ |
|
$ |
|
$ |
|
$ |
|
|||||||||||||||||||||||||||||||||||
| 2. Special Mention |
|
|
|
|
|
|
|
|
|
||||||||||||||||||||||||||||||||||||||||||||
| 3. Substandard |
|
|
|
|
|
|
|
|
|
||||||||||||||||||||||||||||||||||||||||||||
| Total | $ |
|
$ |
|
$ |
|
$ |
|
$ |
|
$ |
|
$ |
|
$ |
|
$ |
|
|||||||||||||||||||||||||||||||||||
69
| Term Loans Amortized Cost Basis by Origination Year | |||||||||||||||||||||||||||||||||||||||||||||||
| (Dollars in thousands) | 2021 | 2020 | 2019 | 2018 | 2017 | Prior | Revolving Loans Amortized Cost Basis | Total | |||||||||||||||||||||||||||||||||||||||
| At December 31, 2021 | |||||||||||||||||||||||||||||||||||||||||||||||
| Commercial, financial and agricultural | |||||||||||||||||||||||||||||||||||||||||||||||
| Risk Rating | |||||||||||||||||||||||||||||||||||||||||||||||
| 1. Pass | $ |
|
$ |
|
$ |
|
$ |
|
$ |
|
$ |
|
$ |
|
$ |
|
|||||||||||||||||||||||||||||||
| 2. Special Mention |
|
|
|
|
|
|
|
|
|||||||||||||||||||||||||||||||||||||||
| 3. Substandard |
|
|
|
|
|
|
|
|
|||||||||||||||||||||||||||||||||||||||
| Total | $ |
|
$ |
|
$ |
|
$ |
|
$ |
|
$ |
|
$ |
|
$ |
|
|||||||||||||||||||||||||||||||
| Paycheck Protection Program | |||||||||||||||||||||||||||||||||||||||||||||||
| Risk Rating | |||||||||||||||||||||||||||||||||||||||||||||||
| 1. Pass | $ |
|
$ |
|
$ |
|
$ |
|
$ |
|
$ |
|
$ |
|
$ |
|
|||||||||||||||||||||||||||||||
| 2. Special Mention |
|
|
|
|
|
|
|
|
|||||||||||||||||||||||||||||||||||||||
| 3. Substandard |
|
|
|
|
|
|
|
|
|||||||||||||||||||||||||||||||||||||||
| Total | $ |
|
$ |
|
$ |
|
$ |
|
$ |
|
$ |
|
$ |
|
$ |
|
|||||||||||||||||||||||||||||||
| Real estate-commercial | |||||||||||||||||||||||||||||||||||||||||||||||
| Risk Rating | |||||||||||||||||||||||||||||||||||||||||||||||
| 1. Pass | $ |
|
$ |
|
$ |
|
$ |
|
$ |
|
$ |
|
$ |
|
$ |
|
|||||||||||||||||||||||||||||||
| 2. Special Mention |
|
|
|
|
|
|
|
|
|||||||||||||||||||||||||||||||||||||||
| 3. Substandard |
|
|
|
|
|
|
|
|
|||||||||||||||||||||||||||||||||||||||
| Total | $ |
|
$ |
|
$ |
|
$ |
|
$ |
|
$ |
|
$ |
|
$ |
|
|||||||||||||||||||||||||||||||
| Real estate-construction | |||||||||||||||||||||||||||||||||||||||||||||||
| Risk Rating | |||||||||||||||||||||||||||||||||||||||||||||||
| 1. Pass | $ |
|
$ |
|
$ |
|
$ |
|
$ |
|
$ |
|
$ |
|
$ |
|
|||||||||||||||||||||||||||||||
| 2. Special Mention |
|
|
|
|
|
|
|
|
|||||||||||||||||||||||||||||||||||||||
| 3. Substandard |
|
|
|
|
|
|
|
|
|||||||||||||||||||||||||||||||||||||||
| Total | $ |
|
$ |
|
$ |
|
$ |
|
$ |
|
$ |
|
$ |
|
$ |
|
|||||||||||||||||||||||||||||||
| Real estate-residential secured for business purpose | |||||||||||||||||||||||||||||||||||||||||||||||
| Risk Rating | |||||||||||||||||||||||||||||||||||||||||||||||
| 1. Pass | $ |
|
$ |
|
$ |
|
$ |
|
$ |
|
$ |
|
$ |
|
$ |
|
|||||||||||||||||||||||||||||||
| 2. Special Mention |
|
|
|
|
|
|
|
|
|||||||||||||||||||||||||||||||||||||||
| 3. Substandard |
|
|
|
|
|
|
|
|
|||||||||||||||||||||||||||||||||||||||
| Total | $ |
|
$ |
|
$ |
|
$ |
|
$ |
|
$ |
|
$ |
|
$ |
|
|||||||||||||||||||||||||||||||
| Totals By Risk Rating | |||||||||||||||||||||||||||||||||||||||||||||||
| 1. Pass | $ |
|
$ |
|
$ |
|
$ |
|
$ |
|
$ |
|
$ |
|
$ |
|
|||||||||||||||||||||||||||||||
| 2. Special Mention |
|
|
|
|
|
|
|
|
|||||||||||||||||||||||||||||||||||||||
| 3. Substandard |
|
|
|
|
|
|
|
|
|||||||||||||||||||||||||||||||||||||||
| Total | $ |
|
$ |
|
$ |
|
$ |
|
$ |
|
$ |
|
$ |
|
$ |
|
|||||||||||||||||||||||||||||||
The Corporation had no revolving loans which were converted to term loans included within recorded investment in loans and leases held for investment at December 31, 2021. The Corporation had no loans with a risk rating of Doubtful included within recorded investment in loans and leases held for investment at December 31, 2022 or 2021.
70
Based on the most recent analysis performed, the following table presents the recorded investment in loans and leases held for investment for real estate-residential secured for personal purpose loans, real estate-home equity secured for personal purpose loans, loans to individuals and lease financings by credit quality indicator at December 31, 2022 and 2021.
| Term Loans Amortized Cost Basis by Origination Year | |||||||||||||||||||||||||||||||||||||||||||||||
| (Dollars in thousands) | 2022 | 2021 | 2020 | 2019 | 2018 | Prior | Revolving Loans Amortized Cost Basis | Total | |||||||||||||||||||||||||||||||||||||||
| At December 31, 2022 | |||||||||||||||||||||||||||||||||||||||||||||||
| Real estate-residential secured for personal purpose | |||||||||||||||||||||||||||||||||||||||||||||||
| Payment Performance | |||||||||||||||||||||||||||||||||||||||||||||||
| 1. Performing | $ |
|
$ |
|
$ |
|
$ |
|
$ |
|
$ |
|
$ |
|
$ |
|
|||||||||||||||||||||||||||||||
| 2. Nonperforming |
|
|
|
|
|
|
|
|
|||||||||||||||||||||||||||||||||||||||
| Total | $ |
|
$ |
|
$ |
|
$ |
|
$ |
|
$ |
|
$ |
|
$ |
|
|||||||||||||||||||||||||||||||
| Real estate-home equity secured for personal purpose | |||||||||||||||||||||||||||||||||||||||||||||||
| Payment Performance | |||||||||||||||||||||||||||||||||||||||||||||||
| 1. Performing | $ |
|
$ |
|
$ |
|
$ |
|
$ |
|
$ |
|
$ |
|
$ |
|
|||||||||||||||||||||||||||||||
| 2. Nonperforming |
|
|
|
|
|
|
|
|
|||||||||||||||||||||||||||||||||||||||
| Total | $ |
|
$ |
|
$ |
|
$ |
|
$ |
|
$ |
|
$ |
|
$ |
|
|||||||||||||||||||||||||||||||
| Loans to individuals | |||||||||||||||||||||||||||||||||||||||||||||||
| Payment Performance | |||||||||||||||||||||||||||||||||||||||||||||||
| 1. Performing | $ |
|
$ |
|
$ |
|
$ |
|
$ |
|
$ |
|
$ |
|
$ |
|
|||||||||||||||||||||||||||||||
| 2. Nonperforming |
|
|
|
|
|
|
|
|
|||||||||||||||||||||||||||||||||||||||
| Total | $ |
|
$ |
|
$ |
|
$ |
|
$ |
|
$ |
|
$ |
|
$ |
|
|||||||||||||||||||||||||||||||
| Lease financings | |||||||||||||||||||||||||||||||||||||||||||||||
| Payment Performance | |||||||||||||||||||||||||||||||||||||||||||||||
| 1. Performing | $ |
|
$ |
|
$ |
|
$ |
|
$ |
|
$ |
|
$ |
|
$ |
|
|||||||||||||||||||||||||||||||
| 2. Nonperforming |
|
|
|
|
|
|
|
|
|||||||||||||||||||||||||||||||||||||||
| Total | $ |
|
$ |
|
$ |
|
$ |
|
$ |
|
$ |
|
$ |
|
$ |
|
|||||||||||||||||||||||||||||||
| Totals by Payment Performance | |||||||||||||||||||||||||||||||||||||||||||||||
| 1. Performing | $ |
|
$ |
|
$ |
|
$ |
|
$ |
|
$ |
|
$ |
|
$ |
|
|||||||||||||||||||||||||||||||
| 2. Nonperforming |
|
|
|
|
|
|
|
|
|||||||||||||||||||||||||||||||||||||||
| Total | $ |
|
$ |
|
$ |
|
$ |
|
$ |
|
$ |
|
$ |
|
$ |
|
|||||||||||||||||||||||||||||||
71
| Term Loans Amortized Cost Basis by Origination Year | |||||||||||||||||||||||||||||||||||||||||||||||
| (Dollars in thousands) | 2021 | 2020 | 2019 | 2018 | 2017 | Prior | Revolving Loans Amortized Cost Basis | Total | |||||||||||||||||||||||||||||||||||||||
| At December 31, 2021 | |||||||||||||||||||||||||||||||||||||||||||||||
| Real estate-residential secured for personal purpose | |||||||||||||||||||||||||||||||||||||||||||||||
| Payment Performance | |||||||||||||||||||||||||||||||||||||||||||||||
| 1. Performing | $ |
|
$ |
|
$ |
|
$ |
|
$ |
|
$ |
|
$ |
|
$ |
|
|||||||||||||||||||||||||||||||
| 2. Nonperforming |
|
|
|
|
|
|
|
|
|||||||||||||||||||||||||||||||||||||||
| Total | $ |
|
$ |
|
$ |
|
$ |
|
$ |
|
$ |
|
$ |
|
$ |
|
|||||||||||||||||||||||||||||||
| Real estate-home equity secured for personal purpose | |||||||||||||||||||||||||||||||||||||||||||||||
| Payment Performance | |||||||||||||||||||||||||||||||||||||||||||||||
| 1. Performing | $ |
|
$ |
|
$ |
|
$ |
|
$ |
|
$ |
|
$ |
|
$ |
|
|||||||||||||||||||||||||||||||
| 2. Nonperforming |
|
|
|
|
|
|
|
|
|||||||||||||||||||||||||||||||||||||||
| Total | $ |
|
$ |
|
$ |
|
$ |
|
$ |
|
$ |
|
$ |
|
$ |
|
|||||||||||||||||||||||||||||||
| Loans to individuals | |||||||||||||||||||||||||||||||||||||||||||||||
| Payment Performance | |||||||||||||||||||||||||||||||||||||||||||||||
| 1. Performing | $ |
|
$ |
|
$ |
|
$ |
|
$ |
|
$ |
|
$ |
|
$ |
|
|||||||||||||||||||||||||||||||
| 2. Nonperforming |
|
|
|
|
|
|
|
|
|||||||||||||||||||||||||||||||||||||||
| Total | $ |
|
$ |
|
$ |
|
$ |
|
$ |
|
$ |
|
$ |
|
$ |
|
|||||||||||||||||||||||||||||||
| Lease financings | |||||||||||||||||||||||||||||||||||||||||||||||
| Payment Performance | |||||||||||||||||||||||||||||||||||||||||||||||
| 1. Performing | $ |
|
$ |
|
$ |
|
$ |
|
$ |
|
$ |
|
$ |
|
$ |
|
|||||||||||||||||||||||||||||||
| 2. Nonperforming |
|
|
|
|
|
|
|
|
|||||||||||||||||||||||||||||||||||||||
| Total | $ |
|
$ |
|
$ |
|
$ |
|
$ |
|
$ |
|
$ |
|
$ |
|
|||||||||||||||||||||||||||||||
| Totals by Payment Performance | |||||||||||||||||||||||||||||||||||||||||||||||
| 1. Performing | $ |
|
$ |
|
$ |
|
$ |
|
$ |
|
$ |
|
$ |
|
$ |
|
|||||||||||||||||||||||||||||||
| 2. Nonperforming |
|
|
|
|
|
|
|
|
|||||||||||||||||||||||||||||||||||||||
| Total | $ |
|
$ |
|
$ |
|
$ |
|
$ |
|
$ |
|
$ |
|
$ |
|
|||||||||||||||||||||||||||||||
The Corporation had no revolving loans which were converted to term loans included within recorded investment in loans and leases held for investment at December 31, 2022 or 2021.
72
Allowance for Credit Losses on Loan and Leases and Recorded Investment in Loans and Leases
The following presents, by portfolio segment, a summary of the activity in the allowance for credit losses, loans and leases, for the years ended December 31, 2022, 2021 and 2020. There were no changes to the reasonable and supportable forecast period, the reversion period, or any significant methodology changes during the year ended December 31, 2022.
| (Dollars in thousands) | Beginning balance | Adjustment to initially apply ASU No. 2016-13 for CECL | Provision (reversal of provision) for credit losses | Charge-offs | Recoveries | Ending balance | |||||||||||||||||||||||||||||
| For the Year Ended December 31, 2022 | |||||||||||||||||||||||||||||||||||
| Allowance for credit losses, loans and leases: | |||||||||||||||||||||||||||||||||||
| Commercial, financial and agricultural | $ |
|
$ |
|
$ |
|
$ |
(
|
$ |
|
$ |
|
|||||||||||||||||||||||
| Paycheck Protection Program |
|
|
|
|
|
|
|||||||||||||||||||||||||||||
| Real estate-commercial |
|
|
|
(
|
|
|
|||||||||||||||||||||||||||||
| Real estate-construction |
|
|
|
|
|
|
|||||||||||||||||||||||||||||
| Real estate-residential secured for business purpose |
|
|
|
|
|
|
|||||||||||||||||||||||||||||
| Real estate-residential secured for personal purpose |
|
|
|
|
|
|
|||||||||||||||||||||||||||||
| Real estate-home equity secured for personal purpose |
|
|
|
|
|
|
|||||||||||||||||||||||||||||
| Loans to individuals |
|
|
|
(
|
|
|
|||||||||||||||||||||||||||||
| Lease financings |
|
|
|
(
|
|
|
|||||||||||||||||||||||||||||
| Unallocated |
|
|
(
|
N/A | N/A |
|
|||||||||||||||||||||||||||||
| Total | $ |
|
$ |
|
$ |
|
$ |
(
|
$ |
|
$ |
|
|||||||||||||||||||||||
| For the Year Ended December 31, 2021 | |||||||||||||||||||||||||||||||||||
| Allowance for credit losses, loans and leases: | |||||||||||||||||||||||||||||||||||
| Commercial, financial and agricultural | $ |
|
$ |
|
$ |
(
|
$ |
(
|
$ |
|
$ |
|
|||||||||||||||||||||||
| Paycheck Protection Program |
|
|
|
|
|
|
|||||||||||||||||||||||||||||
| Real estate-commercial |
|
|
(
|
(
|
|
|
|||||||||||||||||||||||||||||
| Real estate-construction |
|
|
|
|
|
|
|||||||||||||||||||||||||||||
| Real estate-residential secured for business purpose |
|
|
(
|
(
|
|
|
|||||||||||||||||||||||||||||
| Real estate-residential secured for personal purpose |
|
|
(
|
|
|
|
|||||||||||||||||||||||||||||
| Real estate-home equity secured for personal purpose |
|
|
(
|
|
|
|
|||||||||||||||||||||||||||||
| Loans to individuals |
|
|
(
|
(
|
|
|
|||||||||||||||||||||||||||||
| Lease financings |
|
|
|
(
|
|
|
|||||||||||||||||||||||||||||
| Unallocated |
|
|
|
N/A | N/A |
|
|||||||||||||||||||||||||||||
| Total | $ |
|
$ |
|
$ |
(
|
$ |
(
|
$ |
|
$ |
|
|||||||||||||||||||||||
| For the Year Ended December 31, 2020 | |||||||||||||||||||||||||||||||||||
| Allowance for credit losses, loans and leases: | |||||||||||||||||||||||||||||||||||
| Commercial, financial and agricultural | $ |
|
$ |
|
$ |
|
$ |
(
|
$ |
|
$ |
|
|||||||||||||||||||||||
| Real estate-commercial |
|
|
|
(
|
|
|
|||||||||||||||||||||||||||||
| Real estate-construction |
|
|
|
|
|
|
|||||||||||||||||||||||||||||
| Real estate-residential secured for business purpose |
|
|
|
(
|
|
|
|||||||||||||||||||||||||||||
| Real estate-residential secured for personal purpose |
|
(
|
|
(
|
|
|
|||||||||||||||||||||||||||||
| Real estate-home equity secured for personal purpose |
|
(
|
|
|
|
|
|||||||||||||||||||||||||||||
| Loans to individuals |
|
|
|
(
|
|
|
|||||||||||||||||||||||||||||
| Lease financings |
|
(
|
|
(
|
|
|
|||||||||||||||||||||||||||||
| Unallocated |
|
|
(
|
N/A | N/A |
|
|||||||||||||||||||||||||||||
| Total | $ |
|
$ |
|
$ |
|
$ |
(
|
$ |
|
$ |
|
|||||||||||||||||||||||
N/A – Not applicable
73
The following presents, by portfolio segment, the balance in the ACL on loans and leases disaggregated on the basis of whether the loan or lease was measured for credit loss as a pooled loan or lease or if it was individually analyzed for a reserve at December 31, 2022 and 2021:
| Allowance for credit losses, loans and leases | Loans and leases held for investment | ||||||||||||||||||||||||||||||||||||||||
| (Dollars in thousands) | Ending balance: individually analyzed | Ending balance: pooled | Total ending balance | Ending balance: individually analyzed | Ending balance: pooled | Loans measured at fair value | Total ending balance | ||||||||||||||||||||||||||||||||||
| At December 31, 2022 | |||||||||||||||||||||||||||||||||||||||||
| Commercial, financial and agricultural | $ |
|
$ |
|
$ |
|
$ |
|
$ |
|
$ |
|
$ |
|
|||||||||||||||||||||||||||
| Paycheck Protection Program |
|
|
|
|
|
|
|
||||||||||||||||||||||||||||||||||
| Real estate-commercial |
|
|
|
|
|
|
|
||||||||||||||||||||||||||||||||||
| Real estate-construction |
|
|
|
|
|
|
|
||||||||||||||||||||||||||||||||||
| Real estate-residential secured for business purpose |
|
|
|
|
|
|
|
||||||||||||||||||||||||||||||||||
| Real estate-residential secured for personal purpose |
|
|
|
|
|
|
|
||||||||||||||||||||||||||||||||||
| Real estate-home equity secured for personal purpose |
|
|
|
|
|
|
|
||||||||||||||||||||||||||||||||||
| Loans to individuals |
|
|
|
|
|
|
|
||||||||||||||||||||||||||||||||||
| Lease financings |
|
|
|
|
|
|
|
||||||||||||||||||||||||||||||||||
| Unallocated | N/A |
|
|
N/A | N/A | N/A | N/A | ||||||||||||||||||||||||||||||||||
| Total | $ |
|
$ |
|
$ |
|
$ |
|
$ |
|
$ |
|
$ |
|
|||||||||||||||||||||||||||
| At December 31, 2021 | |||||||||||||||||||||||||||||||||||||||||
| Commercial, financial and agricultural | $ |
|
$ |
|
$ |
|
$ |
|
$ |
|
$ |
|
$ |
|
|||||||||||||||||||||||||||
| Paycheck Protection Program |
|
|
|
|
|
|
|
||||||||||||||||||||||||||||||||||
| Real estate-commercial |
|
|
|
|
|
|
|
||||||||||||||||||||||||||||||||||
| Real estate-construction |
|
|
|
|
|
|
|
||||||||||||||||||||||||||||||||||
| Real estate-residential secured for business purpose |
|
|
|
|
|
|
|
||||||||||||||||||||||||||||||||||
| Real estate-residential secured for personal purpose |
|
|
|
|
|
|
|
||||||||||||||||||||||||||||||||||
| Real estate-home equity secured for personal purpose |
|
|
|
|
|
|
|
||||||||||||||||||||||||||||||||||
| Loans to individuals |
|
|
|
|
|
|
|
||||||||||||||||||||||||||||||||||
| Lease financings |
|
|
|
|
|
|
|
||||||||||||||||||||||||||||||||||
| Unallocated | N/A |
|
|
N/A | N/A | N/A | N/A | ||||||||||||||||||||||||||||||||||
| Total | $ |
|
$ |
|
$ |
|
$ |
|
$ |
|
$ |
|
$ |
|
|||||||||||||||||||||||||||
N/A – Not applicable
74
Troubled Debt Restructured Loans
The following presents, by class of loans, information regarding accruing and nonaccrual loans that were modified and classified as troubled debt restructurings during the years ended December 31, 2022 and 2021:
| For the Years Ended December 31, | |||||||||||||||||||||||||||||||||||
| 2022 | 2021 | ||||||||||||||||||||||||||||||||||
| (Dollars in thousands) |
Number
of Loans |
Pre-
Restructuring Outstanding Recorded Investment |
Post-
Restructuring Outstanding Recorded Investment |
Number
of Loans |
Pre-
Restructuring Outstanding Recorded Investment |
Post-
Restructuring Outstanding Recorded Investment |
|||||||||||||||||||||||||||||
| Accruing Troubled Debt Restructured Loans: | |||||||||||||||||||||||||||||||||||
| Total |
|
$ |
|
$ |
|
|
$ |
|
$ |
|
|||||||||||||||||||||||||
| Nonaccrual Troubled Debt Restructured Loans: | |||||||||||||||||||||||||||||||||||
| Real estate—commercial real estate |
|
|
|
|
$ |
|
$ |
|
|||||||||||||||||||||||||||
| Real estate—residential secured for business purpose |
|
|
|
|
|
|
|||||||||||||||||||||||||||||
| Total |
|
$ |
|
$ |
|
|
$ |
|
$ |
|
|||||||||||||||||||||||||
The following presents, by class of loans, information regarding the types of concessions granted on accruing and nonaccrual loans that were modified and classified as troubled debt restructurings during the years ended December 31, 2022 and 2021:
|
Maturity Date
Extension |
Amortization Period Extension |
Total Concessions
Granted |
|||||||||||||||||||||||||||||||||
| (Dollars in thousands) |
No. of
Loans |
Amount |
No. of
Loans |
Amount |
No. of
Loans |
Amount | |||||||||||||||||||||||||||||
| For the Year Ended December 31, 2022 | |||||||||||||||||||||||||||||||||||
| Accruing Troubled Debt Restructured Loans: | |||||||||||||||||||||||||||||||||||
| Total |
|
$ |
|
|
$ |
|
|
$ |
|
||||||||||||||||||||||||||
| Nonaccrual Troubled Debt Restructured Loans: | |||||||||||||||||||||||||||||||||||
| Real estate—residential secured for business purpose |
|
$ |
|
|
$ |
|
|
$ |
|
||||||||||||||||||||||||||
| Total |
|
$ |
|
|
$ |
|
|
$ |
|
||||||||||||||||||||||||||
| For the Year Ended December 31, 2021 | |||||||||||||||||||||||||||||||||||
| Accruing Troubled Debt Restructured Loans: | |||||||||||||||||||||||||||||||||||
| Total |
|
$ |
|
|
$ |
|
|
$ |
|
||||||||||||||||||||||||||
| Nonaccrual Troubled Debt Restructured Loans: | |||||||||||||||||||||||||||||||||||
| Real estate—commercial real estate |
|
$ |
|
|
$ |
|
|
$ |
|
||||||||||||||||||||||||||
| Total |
|
$ |
|
|
$ |
|
|
$ |
|
||||||||||||||||||||||||||
There were no accruing or nonaccrual troubled debt restructured loans for which there were payment defaults within twelve months of the restructuring date for the years ended December 31, 2022 or 2021.
The following presents the amount of consumer mortgages collateralized by residential real estate property that were in the process of foreclosure at December 31, 2022 or 2021.
| (Dollars in thousands) | At December 31, 2022 | At December 31, 2021 | |||||||||
| Real estate-residential secured for personal purpose | $ |
|
$ |
|
|||||||
| Real estate-home equity secured for personal purpose |
|
|
|||||||||
| Total | $ |
|
$ |
|
|||||||
There was no foreclosed residential real estate property included in other real estate owned at December 31, 2022 or 2021.
75
Lease Financings
The following presents the maturity analysis of lease financing receivables:
| (Dollars in thousands) | At December 31, 2022 | At December 31, 2021 | |||||||||
| 2022 | N/A | $ |
|
||||||||
| 2023 |
|
|
|||||||||
| 2024 |
|
|
|||||||||
| 2025 |
|
|
|||||||||
| 2026 |
|
|
|||||||||
| 2027 |
|
|
|||||||||
| Thereafter |
|
|
|||||||||
| Total future minimum lease payments receivable |
|
|
|||||||||
| Plus: Unguaranteed residual |
|
|
|||||||||
| Plus: Initial direct costs |
|
|
|||||||||
| Less: Imputed interest |
(
|
(
|
|||||||||
| Lease financings | $ |
|
$ |
|
|||||||
Note 6.
Premises and Equipment
The following table reflects the components of premises, equipment and computer software:
| At December 31, | |||||||||||
| (Dollars in thousands) | 2022 | 2021 | |||||||||
| Land and land improvements | $ |
|
$ |
|
|||||||
| Premises and improvements |
|
|
|||||||||
| Furniture, equipment and computer software |
|
|
|||||||||
| Total cost |
|
|
|||||||||
| Less: accumulated depreciation |
(
|
(
|
|||||||||
| Net book value | $ |
|
$ |
|
|||||||
Note 7.
Goodwill and Other Intangible Assets
The Corporation has goodwill from acquisitions which is deemed to be an indefinite intangible asset and is not amortized. In accordance with ASC Topic 350, goodwill is tested at least annually for impairment at the reporting unit level. The Corporation performs an annual test of goodwill for impairment during the fourth quarter of each year. The Corporation concluded there was
no
impairment of goodwill during 2020 through 2022.
Changes in the carrying amount of the Corporation's goodwill by business segment for the years ended December 31, 2022 and 2021 were as follows:
| (Dollars in thousands) | Banking | Wealth Management | Insurance | Consolidated | |||||||||||||||||||
| Balance at December 31, 2020 | $ |
|
$ |
|
$ |
|
$ |
|
|||||||||||||||
| Addition to goodwill from acquisitions |
|
|
|
|
|||||||||||||||||||
| Balance at December 31, 2021 |
|
|
|
|
|||||||||||||||||||
| Addition to goodwill from acquisitions |
|
|
|
|
|||||||||||||||||||
| Balance at December 31, 2022 | $ |
|
$ |
|
$ |
|
$ |
|
|||||||||||||||
The Corporation also has core deposit and customer-related intangibles, which are not deemed to have an indefinite life and therefore will continue to be amortized over their useful life using the present value of projected cash flows. The Corporation also performs an annual test of core deposit and customer-related intangibles for impairment during the fourth quarter of each
76
year. The Corporation concluded there was
no
impairment of core deposit and customer-related intangibles during 2020 through 2022.
The amortization of core deposit and customer-related intangibles for the years ended December 31, 2022, 2021 and 2020 was $
1.2
million, $
965
thousand and $
1.2
million, respectively.
The following table reflects the components of intangible assets at the dates indicated:
| At December 31, 2022 | At December 31, 2021 | ||||||||||||||||||||||||||||||||||
| (Dollars in thousands) | Gross Carrying Amount |
Accumulated Amortization
(1)
|
Net Carrying Amount | Gross Carrying Amount |
Accumulated Amortization
(1)
|
Net Carrying Amount | |||||||||||||||||||||||||||||
| Amortized intangible assets: | |||||||||||||||||||||||||||||||||||
| Core deposit intangibles | $ |
|
$ |
|
$ |
|
$ |
|
$ |
|
$ |
|
|||||||||||||||||||||||
| Customer-related intangibles |
|
|
|
|
|
|
|||||||||||||||||||||||||||||
| Servicing rights |
|
|
|
|
|
|
|||||||||||||||||||||||||||||
| Total amortized intangible assets | $ |
|
$ |
|
$ |
|
$ |
|
$ |
|
$ |
|
|||||||||||||||||||||||
(1) Included within accumulated amortization is a valuation allowance of $
5
thousand and $
13
thousand on servicing rights at December 31, 2022 and 2021, respectively.
The estimated aggregate amortization expense for core deposit and customer-related intangibles for each of the five succeeding fiscal years and thereafter follows:
| Year | (Dollars in thousands) | Amount | ||||||
| 2023 | $ |
|
||||||
| 2024 |
|
|||||||
| 2025 |
|
|||||||
| 2026 |
|
|||||||
| 2027 |
|
|||||||
| Thereafter |
|
|||||||
| Total | $ |
|
||||||
The aggregate fair value of servicing rights was $
16.8
million and $
11.3
million at December 31, 2022 and 2021, respectively. The fair value of these rights was determined using a discount rate ranging from
10.1
% to
12.0
% at December 31, 2022 and
10.2
% at December 31, 2021.
Changes in the servicing rights balance are summarized as follows:
| For the Years Ended December 31, | |||||||||||||||||
| (Dollars in thousands) | 2022 | 2021 | 2020 | ||||||||||||||
| Beginning of period | $ |
|
$ |
|
$ |
|
|||||||||||
| Servicing rights capitalized |
|
|
|
||||||||||||||
| Amortization of servicing rights |
(
|
(
|
(
|
||||||||||||||
| Changes in valuation allowance |
|
|
(
|
||||||||||||||
| End of period | $ |
|
$ |
|
$ |
|
|||||||||||
| Loans serviced for others | $ |
|
$ |
|
$ |
|
|||||||||||
77
Activity in the valuation allowance for servicing rights are summarized as follows:
| For the Years Ended December 31, | |||||||||||||||||
| (Dollars in thousands) | 2022 | 2021 | 2020 | ||||||||||||||
| Valuation allowance, beginning of period | $ |
(
|
$ |
(
|
$ |
|
|||||||||||
| Additions |
|
|
(
|
||||||||||||||
| Reductions |
|
|
|
||||||||||||||
| Valuation allowance, end of period | $ |
(
|
$ |
(
|
$ |
(
|
|||||||||||
The estimated amortization expense of servicing rights for each of the five succeeding fiscal years and thereafter is as follows:
| Year | (Dollars in thousand) | Amount | ||||||
| 2023 | $ |
|
||||||
| 2024 |
|
|||||||
| 2025 |
|
|||||||
| 2026 |
|
|||||||
| 2027 |
|
|||||||
| Thereafter |
|
|||||||
| Total | $ |
|
||||||
Note 8.
Accrued Interest Receivable and Other Assets
The following table provides the details of accrued interest receivable and other assets:
| At December 31, | |||||||||||
| (Dollars in thousands) | 2022 | 2021 | |||||||||
| Other real estate owned | $ |
|
$ |
|
|||||||
| Accrued interest receivable |
|
|
|||||||||
| Accrued income and other receivables |
|
|
|||||||||
| Fair market value of derivative financial instruments |
|
|
|||||||||
| Other prepaid expenses |
|
|
|||||||||
| Current income tax receivable |
|
|
|||||||||
| Net deferred tax assets |
|
|
|||||||||
| Other |
|
|
|||||||||
| Total accrued interest receivable and other assets | $ |
|
$ |
|
|||||||
Note 9.
Deposits
Deposits and their respective weighted average interest rate at December 31, 2022 and 2021 consisted of the following:
| December 31, | |||||||||||||||||||||||
| 2022 | 2021 | ||||||||||||||||||||||
| Weighted Average Interest Rate | Amount | Weighted Average Interest Rate | Amount | ||||||||||||||||||||
| (Dollars in thousands) | |||||||||||||||||||||||
| Noninterest-bearing deposits |
|
% | $ |
|
|
% | $ |
|
|||||||||||||||
| Demand deposits |
|
|
|
|
|||||||||||||||||||
| Savings deposits |
|
|
|
|
|||||||||||||||||||
| Time deposits |
|
|
|
|
|||||||||||||||||||
| Total |
|
% | $ |
|
|
% | $ |
|
|||||||||||||||
78
Deposits are insured up to applicable limits by the Deposit Insurance Fund of the FDIC, which is currently up to $250 thousand per account owner. The aggregate amount of time deposits in denominations over $250 thousand was $
95.0
million at December 31, 2022 and $
119.9
million at December 31, 2021.
At December 31, 2022, the scheduled maturities of time deposits were as follows:
| Year | (Dollars in thousands) | Amount | ||||||
| Due in 2023 | $ |
|
||||||
| Due in 2024 |
|
|||||||
| Due in 2025 |
|
|||||||
| Due in 2026 |
|
|||||||
| Due in 2027 |
|
|||||||
| Thereafter |
|
|||||||
| Total | $ |
|
||||||
Note 10.
Borrowings
The following is a summary of borrowings by type. Short-term borrowings consist of overnight borrowings and term borrowings with an original maturity of one year or less.
| Balance at End of Year | Weighted Average Interest Rate | Maximum Amount Outstanding at Month End During the Year | Average Amount Outstanding During the Year | Weighted Average Interest Rate During the Year | |||||||||||||||||||||||||
| (Dollars in thousands) | |||||||||||||||||||||||||||||
| 2022 | |||||||||||||||||||||||||||||
| Short-term borrowings: | |||||||||||||||||||||||||||||
| FHLB borrowings | $ |
|
|
% | $ |
|
$ |
|
|
% | |||||||||||||||||||
| Federal funds purchased |
|
|
|
|
|
||||||||||||||||||||||||
| Customer repurchase agreements |
|
|
|
|
|
||||||||||||||||||||||||
| Long-term debt: | |||||||||||||||||||||||||||||
| FHLB advances | $ |
|
|
% | $ |
|
$ |
|
|
% | |||||||||||||||||||
| Subordinated notes | $ |
|
|
% | $ |
|
$ |
|
|
% | |||||||||||||||||||
| 2021 | |||||||||||||||||||||||||||||
| Short-term borrowings: | |||||||||||||||||||||||||||||
| FHLB borrowings | $ |
|
|
% | $ |
|
$ |
|
|
% | |||||||||||||||||||
| Federal funds purchased |
|
|
|
|
|
||||||||||||||||||||||||
| Customer repurchase agreements |
|
|
|
|
|
||||||||||||||||||||||||
| Long-term debt: | |||||||||||||||||||||||||||||
| FHLB advances | $ |
|
|
% | $ |
|
$ |
|
|
% | |||||||||||||||||||
| Subordinated notes | $ |
|
|
% | $ |
|
$ |
|
|
% | |||||||||||||||||||
The Corporation, through the Bank, has a credit facility with the FHLB with a maximum borrowing capacity of approximately $
2.9
billion. All borrowings and letters of credit from the FHLB are secured by qualifying commercial real estate and residential mortgage loans, investments and other assets. At December 31, 2022 and 2021, the Bank had outstanding short-term letters of credit with the FHLB totaling $
690.5
million and $
831.8
million, respectively, which were utilized to collateralize public fund deposits and other secured deposits. The maximum borrowing capacity with the FHLB changes as a function of the Bank's qualifying collateral assets as well as the FHLB's internal credit rating of the Bank. The available borrowing capacity from the FHLB totaled $
1.9
billion at December 31, 2022.
79
The Corporation, through the Bank, holds collateral at the Federal Reserve Bank of Philadelphia to provide access to the Discount Window Lending program. The collateral, consisting of investment securities, was valued at $
98.1
million and $
28.8
million at December 31, 2022 and 2021, respectively. At December 31, 2022 and 2021, the Corporation had
no
outstanding borrowings under the Discount Window Lending program.
The Corporation has a $
10.0
million committed line of credit with a correspondent bank. At December 31, 2022 and 2021, the Corporation had
no
outstanding borrowings under this line.
The Corporation and the Bank had $
3.0
billion and $
2.5
billion of total committed borrowing capacity at December 31, 2022 and 2021, respectively, of which $
2.1
billion and $
1.6
billion was available as of December 31, 2022 and 2021, respectively. The Corporation, through the Bank, also maintained uncommitted funding sources from correspondent banks of $
410.0
million and $
400.0
million at December 31, 2022 and 2021, respectively, of which $
350.0
million and $
400.0
million were available as of December 31, 2022 and 2021, respectively. Future availability under these lines is subject to the prerogatives of the granting banks and may be withdrawn at will.
Long-term advances with the FHLB of Pittsburgh mature as follows:
| (Dollars in thousands) | As of December 31, 2022 | Weighted Average Rate | |||||||||
| 2023 | $ |
|
|
% | |||||||
| 2024 |
|
|
|||||||||
| 2025 |
|
|
|||||||||
| 2026 |
|
|
|||||||||
| 2027 |
|
|
|||||||||
| Thereafter |
|
|
|||||||||
| Total | $ |
|
|
% | |||||||
Subordinated Notes
On August 5, 2020, the Corporation issued $
100.0
million aggregate principal amount of
5.00
% fixed-to-floating rate subordinated notes due 2030 (the "2020 Notes") in an underwritten public offering. The net proceeds of the offering approximated $
98.4
million. The 2020 Notes bear interest at a fixed rate of
5.00
%, payable semi-annually in arrears commencing on February 15, 2021. The last interest payment date for the fixed rate period will be August 15, 2025. From and including August 15, 2025 to, but excluding, August 15, 2030 or the date of earlier redemption, the Notes will bear interest at an annual floating rate of interest equivalent to the expected Benchmark rate, which is expected to be the Three-Month Term SOFR, plus 495.2 basis points, payable quarterly in arrears, commencing on November 15, 2025. Notwithstanding the foregoing, if the Benchmark rate is less than zero, the Benchmark rate shall be deemed to be zero. The Corporation may redeem the 2020 Notes (i) in whole or in part beginning with the interest payment date of August 15, 2025, and on any interest payment date thereafter or (ii) in whole, but not in part, at any time within 90 days upon the occurrence of certain tax, regulatory capital and Investment Company Act of 1940 events. The redemption price for any redemption is 100% of the principal amount of the subordinated notes being redeemed, plus accrued and unpaid interest thereon to, but excluding, the date of redemption. Any redemption of the subordinated notes will be subject to the receipt of the approval of the Board of Governors of the Federal Reserve System to the extent then required under applicable laws or regulations.
On November 15, 2022, the Corporation issued $
50.0
million aggregate principal amount of
7.25
% fixed-to-floating rate subordinated notes due 2032 (the "2022 Notes") in an underwritten public offering. The net proceeds of the offering approximated $
49.0
million. The 2022 Notes bear interest at a fixed rate of
7.25
%, payable semi-annually in arrears commencing on May 15, 2023. The last interest payment date for the fixed rate period will be November 15, 2027. From and including November 15, 2027 to, but excluding, November 15, 2032 or the date of earlier redemption, the Notes will bear interest at an annual floating rate of interest equivalent to the expected Benchmark rate, which is expected to be the Three-Month Term SOFR, plus 309.8 basis points, payable quarterly in arrears, commencing on February 15, 2028. Notwithstanding the foregoing, if the Benchmark rate is less than zero, the Benchmark rate shall be deemed to be zero. The Corporation may redeem the 2022 Notes (i) in whole or in part beginning with the interest payment date of November 15, 2027, and on any interest payment date thereafter or (ii) in whole, but not in part, at any time within 90 days upon the occurrence of certain tax, regulatory capital and Investment Company Act of 1940 events. The redemption price for any redemption is 100% of the principal amount of the subordinated notes being redeemed, plus accrued and unpaid interest thereon to, but excluding, the date of redemption. Any redemption of the subordinated notes will be subject to the receipt of the approval of the Board of Governors of the Federal Reserve System to the extent then required under applicable laws or regulations.
80
Note 11.
Accrued Interest Payable and Other Liabilities
The following table provides the details of accrued interest payable and other liabilities:
| At December 31, | |||||||||||
| (Dollars in thousands) | 2022 | 2021 | |||||||||
| Accrued compensation costs | $ |
|
$ |
|
|||||||
| Retirement plans |
|
|
|||||||||
| Accrued interest payable |
|
|
|||||||||
| Accrued expenses and other payables |
|
|
|||||||||
| Other reserves |
|
|
|||||||||
| Contingent consideration liability |
|
|
|||||||||
| Other liabilities fair value of derivative financial instruments |
|
|
|||||||||
| Current income taxes payable |
|
|
|||||||||
| Accounts payable |
|
|
|||||||||
| Other |
|
|
|||||||||
| Total accrued interest payable and other liabilities | $ |
|
$ |
|
|||||||
Note 12.
Income Taxes
The provision for federal and state income taxes included in the accompanying consolidated statement of income consists of the following:
| For the Years Ended December 31, | |||||||||||||||||
| (Dollars in thousands) | 2022 | 2021 | 2020 | ||||||||||||||
| Current: | |||||||||||||||||
| Federal | $ |
|
$ |
|
$ |
|
|||||||||||
| State |
|
|
|
||||||||||||||
| Deferred: | |||||||||||||||||
| Federal |
(
|
|
(
|
||||||||||||||
| State |
(
|
|
(
|
||||||||||||||
| $ |
|
$ |
|
$ |
|
||||||||||||
The provision for income taxes differs from the expected statutory provision as follows:
| For the Years Ended December 31, | |||||||||||||||||
| 2022 | 2021 | 2020 | |||||||||||||||
| Expected provision at statutory rate |
|
% |
|
% |
|
% | |||||||||||
| Difference resulting from: | |||||||||||||||||
| Tax exempt interest income, net of disallowance |
(
|
(
|
(
|
||||||||||||||
| Increase in value of bank owned life insurance assets |
(
|
(
|
(
|
||||||||||||||
| Stock-based compensation |
(
|
(
|
|
||||||||||||||
| State income taxes, net of federal benefits |
|
|
|
||||||||||||||
| Changes in valuation allowance |
|
|
|
||||||||||||||
| Federal benefit of state deferred tax asset revaluation |
(
|
|
|
||||||||||||||
| Other |
|
|
(
|
||||||||||||||
| Effective tax rate |
|
% |
|
% |
|
% | |||||||||||
81
On August 16, 2022, the Inflation Reduction Act (the IRA) was signed into law. The IRA includes climate and energy provisions, introduces a 15% corporate alternative minimum tax (CAMT) on corporations whose average annual adjusted financial statement income exceeds $1 billion, and a 1% excise tax on stock repurchases made by publicly traded US corporations. Most provisions above are effective for tax years beginning after December 31, 2022. The Corporation has concluded its analysis of these provisions as of December 31, 2022 and determined they did not have a material impact of the Corporation's income taxes for 2022.
On July 8, 2022, the Commonwealth of Pennsylvania enacted a corporate income tax rate reduction. Beginning January 1, 2023, the corporate income tax rate decreases 1% for 2023 and will decrease 0.5% each year until it reaches 4.99% in 2031. As such, the Corporation revalued the deferred tax assets associated with the Commonwealth and adjusted the associated valuation allowance established against those DTAs.
On March 27, 2020, the CARES Act was enacted into law in response to the COVID-19 pandemic. The CARES Act contains numerous income tax provisions, such as enhanced interest reducibility, repeal of the 80% limitation with respect to net operating losses arising in taxable years 2018, 2019 and 2020, and additional depreciation deductions related to qualified improvement property. The Corporation has concluded its analysis of these provisions as of December 31, 2020 and determined they did not have a material impact on the Corporation's income taxes for 2020.
Retained earnings included $
6.0
million at December 31, 2022, 2021 and 2020, which was originally generated by Fox Chase Bank (acquired in 2016), for which no provision for federal income tax has been made. This amount represents deductions for bad debt reserves for tax purposes, which were only allowed to savings institutions that met certain criteria prescribed by the Internal Revenue Code of 1986, as amended. The Small Business Job Protection Act of 1996 eliminated the special bad debt deduction granted solely to thrifts. Under the terms of the Small Business Job Protection Act, there would be no recapture of the pre-1988 (base year) reserves. However, these pre-1988 reserves would be subject to recapture under the rules of the Internal Revenue Code if the Corporation pays a cash dividend in excess of cumulative retained earnings or liquidates.
At December 31, 2022 and 2021, the Corporation had
no
material unrecognized tax benefits or accrued interest and penalties recorded. The Corporation does not expect the total amount of unrecognized tax benefits to significantly increase within the next twelve months. Interest and penalties are recorded in noninterest expense in the year they are assessed. For tax purposes, interest is treated as a deductible expense and penalties are treated as a non-deductible expense.
The Corporation and its subsidiaries are subject to U.S. federal income tax, as well as income tax of the Commonwealth of Pennsylvania and various other state and local jurisdictions. The Corporation and its subsidiaries are generally no longer subject to examination by federal, state and local taxing authorities for years prior to December 31,
2019
. The Corporation is currently under examination by the state of Wisconsin for the tax years ended December 31, 2017 through 2020.
Deferred income taxes reflect the tax effects of temporary differences between the carrying amounts of assets and liabilities for financial reporting purposes and the amounts used for income tax purposes. Deferred state taxes are combined with federal deferred taxes (net of the impact of deferred state tax on the deferred federal tax) and are shown in the table below by major category.
The Corporation has a state net operating loss carry-forward of $
84.9
million which will begin to expire in
2023
if not utilized. A valuation allowance at December 31, 2022 and 2021 was attributable to deferred tax assets generated in certain state jurisdictions for which management believes it is more likely than not that such deferred tax assets will not be realized. Other than the valuation allowance on certain state deferred tax assets, management has determined that no additional valuation allowance is necessary for deferred tax assets because it is more likely than not that these assets will be realized through future reversals of existing temporary differences and through future taxable income. The Corporation will continue to review the criteria related to the recognition of deferred tax assets on a regular basis.
82
The assets and liabilities giving rise to the Corporation's deferred tax assets and liabilities are as follows:
| At December 31, | |||||||||||
| (Dollars in thousands) | 2022 | 2021 | |||||||||
| Deferred tax assets: | |||||||||||
| Allowance for credit losses, loans and leases | $ |
|
$ |
|
|||||||
| Deferred compensation |
|
|
|||||||||
| Actuarial adjustments on retirement benefits* |
|
|
|||||||||
| State net operating losses |
|
|
|||||||||
| Other-than-temporary impairments on equity securities |
|
|
|||||||||
| Net unrealized holding losses on securities available-for-sale and swaps* |
|
|
|||||||||
| Lease liability |
|
|
|||||||||
| Other deferred tax assets |
|
|
|||||||||
| Gross deferred tax assets |
|
|
|||||||||
| Valuation allowance |
(
|
(
|
|||||||||
| Total deferred tax assets, net of valuation allowance |
|
|
|||||||||
| Deferred tax liabilities: | |||||||||||
| Mortgage servicing rights |
|
|
|||||||||
| Retirement plans |
|
|
|||||||||
| Deferred loan fees and costs |
|
|
|||||||||
| Acquisition-related fair value adjustments |
|
|
|||||||||
| Intangible assets |
|
|
|||||||||
| Depreciation |
|
|
|||||||||
| Right of use asset |
|
|
|||||||||
| Other deferred tax liabilities |
|
|
|||||||||
| Total deferred tax liabilities |
|
|
|||||||||
| Net deferred tax assets | $ |
|
$ |
|
|||||||
*
Represents the amount of deferred taxes recorded in accumulated other comprehensive income.
83
Note 13.
Retirement Plans and Other Postretirement Benefits
Information with respect to the Retirement Plans and Other Postretirement Benefits follows:
| Retirement Plans | Other Postretirement Benefits | ||||||||||||||||||||||
| (Dollars in thousands) | 2022 | 2021 | 2022 | 2021 | |||||||||||||||||||
| Change in benefit obligation: | |||||||||||||||||||||||
| Benefit obligation at beginning of year | $ |
|
$ |
|
$ |
|
$ |
|
|||||||||||||||
| Service cost |
|
|
|
|
|||||||||||||||||||
| Interest cost |
|
|
|
|
|||||||||||||||||||
| Actuarial gain |
(
|
(
|
(
|
(
|
|||||||||||||||||||
| Benefits paid |
(
|
(
|
(
|
(
|
|||||||||||||||||||
| Benefit obligation at end of year | $ |
|
$ |
|
$ |
|
$ |
|
|||||||||||||||
| Change in plan assets: | |||||||||||||||||||||||
| Fair value of plan assets at beginning of year | $ |
|
$ |
|
$ |
|
$ |
|
|||||||||||||||
| Actual (loss) return on plan assets |
(
|
|
|
|
|||||||||||||||||||
| Benefits paid |
(
|
(
|
(
|
(
|
|||||||||||||||||||
| Employer contribution and non-qualified benefit payments |
|
|
|
|
|||||||||||||||||||
| Fair value of plan assets at end of year | $ |
|
$ |
|
$ |
|
$ |
|
|||||||||||||||
| Funded status |
|
|
(
|
(
|
|||||||||||||||||||
| Unrecognized net actuarial loss (gain) |
|
|
(
|
|
|||||||||||||||||||
| Net amount recognized | $ |
|
$ |
|
$ |
(
|
$ |
(
|
|||||||||||||||
The net actuarial (gain) loss for December 31, 2022 and 2021 was the result of changes in the discount rate, interest crediting rate, cash balance conversion rate and driven by mortality losses on retirees.
Components of net periodic benefit (income) cost were as follows:
| Retirement Plans | Other Postretirement Benefits | ||||||||||||||||||||||||||||||||||
| (Dollars in thousands) | 2022 | 2021 | 2020 | 2022 | 2021 | 2020 | |||||||||||||||||||||||||||||
| Service cost | $ |
|
$ |
|
$ |
|
$ |
|
$ |
|
$ |
|
|||||||||||||||||||||||
| Interest cost |
|
|
|
|
|
|
|||||||||||||||||||||||||||||
| Expected loss on plan assets |
(
|
(
|
(
|
|
|
|
|||||||||||||||||||||||||||||
| Amortization of net actuarial loss |
|
|
|
|
|
|
|||||||||||||||||||||||||||||
| Net periodic benefit (income) cost | $ |
(
|
$ |
(
|
$ |
|
$ |
|
$ |
|
$ |
|
|||||||||||||||||||||||
The components of net periodic benefit cost, other than the service cost component, are included in other noninterest expense in the consolidated statement of income.
| (Dollars in thousands) | Retirement Plans | Other Postretirement Benefits | |||||||||
| Expected amortization expense for 2023: | |||||||||||
| Amortization (accretion) of net actuarial loss (gain) | $ |
|
$ |
(
|
|||||||
During 2023, the Corporation expects to contribute approximately $
156
thousand to the Retirement Plans and approximately $
130
thousand to Other Postretirement Benefits.
84
The following benefits payments, which reflect expected future service, as appropriate, are expected to be paid:
| (Dollars in thousands) | Retirement Plans | Other Postretirement Benefits | ||||||||||||
| For the fiscal year ending: | ||||||||||||||
| 2023 | $ |
|
$ |
|
||||||||||
| 2024 |
|
|
||||||||||||
| 2025 |
|
|
||||||||||||
| 2026 |
|
|
||||||||||||
| 2027 |
|
|
||||||||||||
| Years 2028-2032 |
|
|
||||||||||||
| Total | $ |
|
$ |
|
||||||||||
Weighted-average assumptions used to determine benefit obligations at December 31, 2022 and 2021 were as follows:
| Retirement Plans | Other Postretirement Benefits | ||||||||||||||||||||||
| 2022 | 2021 | 2022 | 2021 | ||||||||||||||||||||
| Assumed discount rate |
|
% |
|
% |
|
% |
|
% | |||||||||||||||
| Assumed salary increase rate | 3%-6% | 3%-6% |
|
|
|||||||||||||||||||
The benefit obligation for all plans at December 31, 2022 was based on the Pri-2012 White Collar Dataset Mortality Table with scale MP-2021 fully generational published by the Society of Actuaries. The discount rate is based on matching the Plan's projected cash flows to the spot rates in FTSE Pension Above Median Double-A Curve as of the disclosure date. The assumed salary increase considers available service years from the valuation date through the participant's normal retirement date.
Weighted-average assumptions used to determine net periodic costs for the years ended December 31, 2022 and 2021 were as follows:
| Retirement Plans | Other Postretirement Benefits | ||||||||||||||||||||||
| 2022 | 2021 | 2022 | 2021 | ||||||||||||||||||||
| Assumed discount rate |
|
% |
|
% |
|
% |
|
% | |||||||||||||||
| Assumed long-term rate of investment return |
|
% |
|
% |
|
|
|||||||||||||||||
| Assumed salary increase rate | 3%-6% | 3%-6% |
|
|
|||||||||||||||||||
| Assumed cash balance interest crediting rate |
|
% |
|
% |
|
|
|||||||||||||||||
The net periodic costs for the years ended December 31, 2022 and 2021 was based on the Pri-2012 White Collar Mortality Table with scale MP-2021 fully generational published by the Society of Actuaries. The discount rate was based on matching the Plan's projected cash flows to the spot rates in FTSE Pension Above Median Double-A Curve as of the disclosure date. Historical investment returns is the basis used to determine the overall expected long-term rate of return on assets. The assumed salary increase considers available service years from the valuation date through the participant's normal retirement date.
The Corporation's pension plan asset allocation at December 31, 2022 and 2021, by asset category was as follows:
| Percentage of Plan Assets at December 31, | |||||||||||
| 2022 | 2021 | ||||||||||
| Asset Category: | |||||||||||
| Equity securities |
|
% |
|
% | |||||||
| Debt securities |
|
|
|||||||||
| Other |
|
|
|||||||||
| Total |
|
% |
|
% | |||||||
85
Plan assets include marketable equity securities, corporate and government debt securities, and certificates of deposit. The investment strategy is to keep a
60
% equity to
40
% fixed income mix to achieve the overall expected long-term rate of return of
6.5
%. Equity securities do not include any common stock of the Corporation.
The major categories of assets in the Corporation's pension plan at year-end are presented in the following table. Assets are segregated by the level of the valuation inputs within the fair value hierarchy described in Note 19, "Fair Value Disclosures."
| Fair Value Measurements at December 31, | |||||||||||
| (Dollars in thousands) | 2022 | 2021 | |||||||||
| Level 1: | |||||||||||
| Mutual funds | $ |
|
$ |
|
|||||||
| Short-term investments |
|
|
|||||||||
| Level 2: | |||||||||||
| U.S. government obligations |
|
|
|||||||||
| Corporate bonds |
|
|
|||||||||
| Certificates of deposit |
|
|
|||||||||
| Total fair value of plan assets | $ |
|
$ |
|
|||||||
The Corporation sponsors a 401(k) deferred salary savings plan, which is a qualified defined contribution plan, and which covers all employees of the Corporation and its subsidiaries, and provides that the Corporation makes matching contributions as defined by the plan.
Expense recorded by the Corporation for the 401(k) deferred salary savings plan was $
2.1
million, $
1.8
million and $
1.8
million for the years ended December 31, 2022, 2021 and 2020, respectively.
The Corporation sponsors a Supplemental Non-Qualified Pension Plan (SNQPP), which was established in 1981 prior to the existence of the 401(k) deferred salary savings plan, employee stock purchase plan and long-term incentive plans and therefore is not offered to new participants. All current participants are now retired. Expense recorded by the Corporation for the SNQPP for the years ended December 31, 2022, 2021 and 2020 was $
174
thousand, $
112
thousand and $
224
thousand, respectively.
Note 14.
Stock-Based Incentive Plan
The Corporation maintains the 2013 Long-Term Incentive Plan, which replaced the expired 2003 Long-Term Incentive Plan. In December 2018, the Corporation's Board of Directors approved an Amended and Restated Univest 2013 Long-Term Incentive Plan to permit the issuance of restricted stock units.
Beginning in 2019, the Corporation issued to directors and employees ("grantees") restricted stock units rather than restricted stock awards or stock options, which were issued to grantees in prior reporting periods. Restricted stock units differ from restricted stock awards in that Corporation stock is not issued to grantees at the date of the grant and the grantee does not have voting or dividend rights during the vesting period. In the following schedules, restricted stock units have been combined with restricted stock awards, as the determination of the value at the grant date and methodology for recording stock-based compensation expense is the same.
Under the Amended and Restated Univest 2013 Long-Term Incentive Plan, the Corporation may grant up to
3,732,632
options and restricted stock awards and units to employees and non-employee directors. The number of shares of common stock available for issuance under the plan is subject to adjustment, as described in the plan. This includes, in the event of any merger, reorganization, consolidation, recapitalization, stock dividend, or other change in corporate structure affecting the stock, substitution or adjustment in the aggregate number of shares reserved for issuance under the plan, in the number and option price of shares subject to outstanding options granted under the plan and in the number and price of shares subject to other awards, as described in the plan. The plan provides for the issuance of options to purchase common shares at prices not less than
100
percent of the fair market value on the date of option grant and have a contractual term of
ten years
. There were
2,253,706
share awards available for future grants at December 31, 2022 under the plan. At December 31, 2022, there were
294,111
options to purchase common stock and
408,264
unvested restricted stock units outstanding under the plan.
86
The following is a summary of the Corporation's stock option activity and related information for the year ended December 31, 2022:
| (Dollars in thousands, except per share data) | Shares Under Option | Weighted Average Exercise Price Per Share | Weighted Average Remaining Contractual Life (Years) | Aggregate Intrinsic Value at December 31, 2022 | |||||||||||||||||||
| Outstanding at December 31, 2021 |
|
$ |
|
||||||||||||||||||||
| Expired |
(
|
|
|||||||||||||||||||||
| Forfeited |
(
|
|
|||||||||||||||||||||
| Exercised |
(
|
|
|||||||||||||||||||||
| Outstanding at December 31, 2022 |
|
|
|
$ |
|
||||||||||||||||||
| Exercisable at December 31, 2022 |
|
|
|
|
|||||||||||||||||||
The following is a summary of nonvested restricted stock units at December 31, 2022 including changes during the year:
| (Dollars in thousands, except per share data) | Nonvested Stock Units | Weighted Average Grant Date Fair Value | |||||||||
| Nonvested stock units at December 31, 2021 |
|
$ |
|
||||||||
| Granted |
|
|
|||||||||
| Cancelled by performance factor |
(
|
|
|||||||||
| Vested |
(
|
|
|||||||||
| Cancelled/forfeited |
(
|
|
|||||||||
| Nonvested stock units at December 31, 2022 |
|
|
|||||||||
Certain information regarding restricted stock awards and units is summarized below for the periods indicated:
| For the Years Ended December 31, | |||||||||||||||||
| (Dollars in thousands, except per share data) | 2022 | 2021 | 2020 | ||||||||||||||
| Restricted stock units granted |
|
|
|
||||||||||||||
| Weighted average grant date fair value | $ |
|
$ |
|
$ |
|
|||||||||||
| Intrinsic value of units granted | $ |
|
$ |
|
$ |
|
|||||||||||
| Restricted stock awards and units vested |
|
|
|
||||||||||||||
| Weighted average grant date fair value | $ |
|
$ |
|
$ |
|
|||||||||||
| Intrinsic value of awards and units vested | $ |
|
$ |
|
$ |
|
|||||||||||
The total unrecognized compensation expense and the weighted average period over which unrecognized compensation expense is expected to be recognized related to nonvested restricted stock units at December 31, 2022 is presented below:
| (Dollars in thousands) | Unrecognized Compensation Cost | Weighted-Average Period Remaining (Years) | |||||||||
| Restricted stock units | $ |
|
|
||||||||
87
The following table presents information related to the Corporation's compensation expense related to stock incentive plans recognized for the periods indicated:
| For the Years Ended December 31, | |||||||||||||||||
| (Dollars in thousands) | 2022 | 2021 | 2020 | ||||||||||||||
| Stock-based compensation expense: | |||||||||||||||||
| Stock options | $ |
|
$ |
|
$ |
|
|||||||||||
| Restricted stock awards and units |
|
|
|
||||||||||||||
| Employee stock purchase plan |
|
|
|
||||||||||||||
| Total | $ |
|
$ |
|
$ |
|
|||||||||||
| Tax benefit on nonqualified stock option expense, restricted stock awards and disqualifying dispositions of incentive stock options | $ |
|
$ |
|
$ |
|
|||||||||||
Note 15.
Accumulated Other Comprehensive (Loss) Income
The following table shows the components of accumulated other comprehensive (loss) income, net of taxes, for the periods presented:
| (Dollars in thousands) |
Net Unrealized
(Losses) Gains on Available-for-Sale Investment Securities |
Net Change
Related to Derivatives Used for Cash Flow Hedges |
Net Change
Related to Defined Benefit Pension Plans |
Accumulated
Other Comprehensive (Loss) Income |
|||||||||||||||||||
| Balance, December 31, 2019 | $ |
(
|
$ |
(
|
$ |
(
|
$ |
(
|
|||||||||||||||
| Adjustment to initially apply ASU No. 2016-13 for CECL |
|
|
|
|
|||||||||||||||||||
| Other comprehensive income (loss) |
|
(
|
(
|
(
|
|||||||||||||||||||
| Balance, December 31, 2020 |
(
|
(
|
(
|
(
|
|||||||||||||||||||
| Other comprehensive income |
|
|
|
|
|||||||||||||||||||
| Balance, December 31, 2021 |
(
|
(
|
(
|
(
|
|||||||||||||||||||
| Other comprehensive loss |
(
|
(
|
(
|
(
|
|||||||||||||||||||
| Balance, December 31, 2022 | $ |
(
|
$ |
(
|
$ |
(
|
$ |
(
|
|||||||||||||||
Note 16.
Leases
The following table provides information with respect to the Corporation's operating leases:
| For the Years Ended December 31, | |||||||||||
| (Dollars in thousands) | 2022 | 2021 | |||||||||
| Operating lease cost | $ |
|
$ |
|
|||||||
| Short-term lease cost |
|
|
|||||||||
| Variable lease cost |
|
|
|||||||||
| Total lease cost | $ |
|
$ |
|
|||||||
| Cash paid for amounts included in the measurement of lease liabilities: | |||||||||||
| Operating cash flows from leases |
|
|
|||||||||
| At December 31, 2022 | At December 31, 2021 | ||||||||||
| Weighted-average remaining lease term in years |
|
|
|||||||||
| Weighted-average discount rate |
|
% |
|
% | |||||||
88
At December 31, 2022, maturities of lease liabilities are as follows:
| Year | (Dollars in thousands) | Amount | ||||||
| 2023 | $ |
|
||||||
| 2024 |
|
|||||||
| 2025 |
|
|||||||
| 2026 |
|
|||||||
| 2027 |
|
|||||||
| Thereafter |
|
|||||||
| Total lease payments |
|
|||||||
| Less: imputed interest |
(
|
|||||||
| Present value of lease liabilities | $ |
|
||||||
Note 17.
Commitments and Contingencies
Lending Operations
Commitments to extend credit, performance letters of credit, standby letters of credit, and other letters of credit are financial instruments issued by the Corporation to accommodate the financial needs of customers. The Corporation uses the same credit policies in issuing these financial instruments as it does for on-balance sheet financial instruments, including obtaining collateral when management's credit assessment of the customer deems it necessary. These financial instruments generally have fixed expiration dates and historically most of these financial instruments expire without being drawn upon. The Corporation maintains a reserve for off-balance sheet credit exposures that are currently unfunded.
Commitments to extend credit are agreements to lend to a customer if there is no violation of any condition established in the contract. The Corporation's exposure to credit loss in the event of nonperformance by the other party to the financial instrument for commitments to extend credit is represented by the contractual amount of those instruments.
Performance letters of credit and standby letters of credit commit the Bank to make payments on behalf of customers when certain specified future events occur. The Corporation's exposure to credit loss is essentially the same as the risk involved in extending loans to customers. At December 31, 2022, the maximum potential amount of future payments under letters of credit was $
58.5
million. The carrying amount of the contingent obligation at December 31, 2022 was $
268
thousand.
The following schedule summarizes the Corporation's off-balance sheet financial instruments at December 31, 2022:
| (Dollars in thousands) | Contract/Notional Amount | ||||
| Financial instruments representing credit risk: | |||||
| Commitments to extend credit | $ |
|
|||
| Performance letters of credit |
|
||||
| Financial standby letters of credit |
|
||||
| Other letters of credit |
|
||||
The Bank maintains a reserve in other liabilities for estimated losses associated with sold mortgages that may be repurchased. At December 31, 2022, the reserve for sold mortgages was $
330
thousand.
Legal Proceedings
The Corporation is periodically subject to various pending and threatened legal actions, that involve claims for monetary relief. Based upon information presently available to the Corporation, it is the Corporation's opinion that any legal and financial responsibility arising from such claims will not have a material adverse effect on the Corporation's results of operations, financial position or cash flows.
89
Note 18.
Derivative Instruments and Hedging Activities
Interest Rate Swaps
The Corporation periodically uses interest rate swap agreements to modify interest rate characteristics from variable to fixed or fixed to variable in order to reduce the impact of interest rate changes on future net interest income. The Corporation's credit exposure on interest rate swaps includes changes in fair value and any collateral that is held by a third party.
In May 2022, the Corporation entered into an interest rate swap classified as a cash flow hedge with a notional amount of $
250.0
million to hedge the interest payments received on a pool of variable rate loans. Under the terms of the swap agreement, the Corporation pays a variable rate equal to the Prime Rate and receives a fixed rate of
5.99
%. The swap matures in May 2026. The Corporation performed an assessment of the hedge for effectiveness at the inception of the hedge and performs an assessment on a recurring basis and determined that the derivative currently is and is expected to be highly effective in offsetting changes in cash flows of the hedged item. At December 31, 2022, approximately $
4.0
million, net of tax, which is recorded in accumulated other comprehensive loss is expected to be reclassified into earnings during the next twelve months. This amount could differ from amounts actually recognized due to changes in interest rates, hedge de-designations, and the addition of other hedges subsequent to December 31, 2022. At December 31, 2022, the notional amount of the interest rate swap was $
250.0
million and the fair value was a liability of $
8.6
million.
Credit Derivatives
The Corporation has agreements with third-party financial institutions whereby the third-party financial institution enters into interest rate derivative contracts with loan customers referred to them by the Corporation. By the terms of the agreements, the third-party financial institution has recourse to the Corporation for any exposure created under each swap contract in the event the customer defaults on the swap agreement and the agreement is in a paying position to the third-party financial institution. These transactions represent credit derivatives and are a customary arrangement that allows the Corporation to provide access to interest rate swap transactions for customers without issuing the swap.
At December 31, 2022, the Corporation had exposure to
127
variable-rate to fixed-rate interest rate swap transactions between the third-party financial institution and customers with a current notional amount of $
815.5
million and remaining maturities ranging from
16
months to
12
years. At December 31, 2022, the fair value of the Corporation's interest rate swap credit derivatives was a liability of $
360
thousand. At December 31, 2022, the fair value of the swaps to the customers was a net gain of $
74.3
million. At December 31, 2022, the Corporation's credit exposure related to the customer totaled $
833
thousand.
The maximum potential payments by the Corporation to the third-party financial institution under these credit derivatives are not estimable as they are contingent on future interest rates and the agreement does not provide for a limitation of the maximum potential payment amount.
Mortgage Banking Derivatives
Derivative loan commitments represent agreements for delayed delivery of financial instruments in which the buyer agrees to purchase and the seller agrees to deliver, at a specified future date, a specified instrument at a specified price or yield. The Corporation's derivative loan commitments are commitments to sell loans secured by 1-to 4-family residential properties whose predominant risk characteristic is interest rate risk.
90
Derivatives Tables
The following table presents the notional amounts and fair values of derivatives designated as hedging instruments recorded on the consolidated balance sheets at December 31, 2022 and 2021. The Corporation pledges cash or securities to cover the negative fair value of derivative instruments. Cash collateral associated with derivative instruments are not added to or netted against the fair value amounts.
| Derivative Assets | Derivative Liabilities | ||||||||||||||||||||||||||||
| (Dollars in thousands) |
Notional
Amount |
Balance Sheet
Classification |
Fair
Value |
Balance Sheet
Classification |
Fair
Value |
||||||||||||||||||||||||
| At December 31, 2022 | |||||||||||||||||||||||||||||
| Interest rate swap - cash flow hedge | $ |
|
$ |
|
Other liabilities | $ |
|
||||||||||||||||||||||
| Total | $ |
|
$ |
|
$ |
|
|||||||||||||||||||||||
| At December 31, 2021 | |||||||||||||||||||||||||||||
| Interest rate swap - cash flow hedge | $ |
|
$ |
|
Other liabilities | $ |
|
||||||||||||||||||||||
| Total | $ |
|
$ |
|
$ |
|
|||||||||||||||||||||||
The following table presents the notional amounts and fair values of derivatives not designated as hedging instruments recorded on the consolidated balance sheets at December 31, 2022 and 2021:
| Derivative Assets | Derivative Liabilities | ||||||||||||||||||||||||||||
| (Dollars in thousands) |
Notional
Amount |
Balance Sheet
Classification |
Fair
Value |
Balance Sheet
Classification |
Fair
Value |
||||||||||||||||||||||||
| At December 31, 2022 | |||||||||||||||||||||||||||||
| Credit derivatives | $ |
|
$ |
|
Other liabilities | $ |
|
||||||||||||||||||||||
| Interest rate locks with customers |
|
Other assets |
|
|
|||||||||||||||||||||||||
| Forward loan sale commitments |
|
Other assets |
|
|
|||||||||||||||||||||||||
| Total | $ |
|
$ |
|
$ |
|
|||||||||||||||||||||||
| At December 31, 2021 | |||||||||||||||||||||||||||||
| Interest rate swap | $ |
|
$ |
|
Other liabilities | $ |
|
||||||||||||||||||||||
| Credit derivatives |
|
|
Other liabilities |
|
|||||||||||||||||||||||||
| Interest rate locks with customers |
|
Other assets |
|
|
|||||||||||||||||||||||||
| Forward loan sale commitments |
|
Other assets |
|
|
|||||||||||||||||||||||||
| Total | $ |
|
$ |
|
$ |
|
|||||||||||||||||||||||
The following table presents amounts included in the consolidated statements of income for derivatives designated as hedging instruments for the periods indicated:
| Statement of Income Classification | For the Years Ended December 31, | ||||||||||||||||||||||
| (Dollars in thousands) | 2022 | 2021 | 2020 | ||||||||||||||||||||
| Interest rate swaps—cash flow hedge—net interest payments | Interest (income) expense | $ |
(
|
$ |
|
$ |
|
||||||||||||||||
| Total net gain (loss) | $ |
|
$ |
(
|
$ |
(
|
|||||||||||||||||
The following table presents amounts included in the consolidated statements of income for derivatives not designated as hedging instruments for the periods indicated:
| Statement of Income Classification | For the Years Ended December 31, | ||||||||||||||||||||||
| (Dollars in thousands) | 2022 | 2021 | 2020 | ||||||||||||||||||||
| Credit derivatives | Other noninterest income | $ |
|
$ |
|
$ |
|
||||||||||||||||
| Interest rate locks with customers | Net (loss) gain on mortgage banking activities |
(
|
(
|
|
|||||||||||||||||||
| Forward loan sale commitments | Net (loss) gain on mortgage banking activities |
(
|
|
(
|
|||||||||||||||||||
| Total net gain | $ |
|
$ |
|
$ |
|
|||||||||||||||||
91
The following table presents amounts included in accumulated other comprehensive (loss) income for derivatives designated as hedging instruments at December 31, 2022 and 2021:
|
Accumulated Other
Comprehensive Income |
At December 31, | ||||||||||||||||
| (Dollars in thousands) | 2022 | 2021 | |||||||||||||||
| Interest rate swap—cash flow hedge | Fair value, net of taxes | $ |
(
|
$ |
(
|
||||||||||||
| Total | $ |
(
|
$ |
(
|
|||||||||||||
Note 19.
Fair Value Disclosures
Fair value is the price that would be received to sell an asset or paid to transfer a liability (an exit price) in an orderly transaction between market participants at the measurement date. The Corporation determines the fair value of financial instruments based on the fair value hierarchy. The Corporation maximizes the use of observable inputs and minimizes the use of unobservable inputs when measuring fair value. Observable inputs are inputs that market participants would use in pricing the asset or liability developed based on market data obtained from sources independent of the Corporation. Unobservable inputs are inputs that reflect the Corporation's assumptions that market participants would use in pricing the asset or liability based on the best information available in the circumstances, including assumptions about risk. Three levels of inputs are used to measure fair value. A financial instrument's level within the fair value hierarchy is based on the lowest level of input significant to the fair value measurement. Transfers between levels are recognized at the end of the reporting periods.
Level 1: Valuations are based on quoted prices in active markets for identical assets or liabilities that the Corporation can access at the measurement date. Since valuations are based on quoted prices that are readily and regularly available in an active market, valuation of these products does not entail a significant degree of judgment.
Level 2: Valuations are based on quoted prices in markets that are not active or for which all significant inputs are observable, either directly or indirectly.
Level 3: Valuations are based on inputs that are unobservable and significant to the overall fair value measurement. Assets and liabilities utilizing Level 3 inputs include: financial instruments whose value is determined using pricing models, discounted cash-flow methodologies, or similar techniques, as well as instruments for which the fair value calculation requires significant management judgment or estimation.
Following is a description of the valuation methodologies used for instruments measured at fair value on a recurring basis, as well as the general classification of such instruments pursuant to the valuation hierarchy.
Investment Securities
Where quoted prices are available in an active market for identical instruments, investment securities are classified within Level 1 of the valuation hierarchy. Level 1 investment securities include U.S. Treasury securities, most equity securities and money market mutual funds. Mutual funds are registered investment companies which are valued at net asset value of shares on a market exchange at the end of each trading day. Level 2 of the valuation hierarchy includes securities issued by U.S. Government sponsored enterprises, mortgage-backed securities, collateralized mortgage obligations, corporate and municipal bonds and certain equity securities. If quoted market prices are not available, then fair values are estimated by using pricing models, quoted prices of securities with similar characteristics or discounted cash flows. In cases where there is limited activity or less transparency around inputs to the valuation, investment securities are classified within Level 3 of the valuation hierarchy.
Fair values for securities are determined using independent pricing services and market-participating brokers. The Corporation's independent pricing service utilizes evaluated pricing models that vary by asset class and incorporate available trade, bid and other market information for structured securities, cash flow and, when available, loan performance data. Because many fixed income securities do not trade on a daily basis, the pricing service's evaluated pricing applications apply information as applicable through processes, such as benchmarking of like securities, sector groupings, and matrix pricing, to prepare evaluations. If at any time, the pricing service determines that it does not have sufficient verifiable information to value a particular security, the Corporation will utilize valuations from another pricing service. Management has a sufficient understanding of the third-party service's valuation models, assumptions and inputs used in determining the fair value of securities to enable management to maintain an appropriate system of internal control.
On a quarterly basis, the Corporation reviews changes, as submitted by the pricing service, in the market value of its security portfolio. Individual changes in valuations are reviewed for consistency with general interest rate movements and any
92
known credit concerns for specific securities. If, upon the Corporation's review or in comparing with another service, a material difference between pricing evaluations were to exist, the Corporation may submit an inquiry to the current pricing service regarding the data used to determine the valuation of a particular security. If the Corporation determines there is market information that would support a different valuation than from the current pricing service's evaluation, the Corporation may utilize and change the security's valuation. There were no material differences in valuations noted at December 31, 2022.
Loans Held for Sale
The fair value of our loans held for sale is based on estimates using Level 2 inputs. These inputs are based on pricing information obtained from wholesale mortgage banks and brokers and applied to loans with similar interest rates and maturities.
Derivative Financial Instruments
The fair values of derivative financial instruments are based upon the estimated amount the Corporation would receive or pay to terminate the contracts or agreements, taking into account current interest rates and, when appropriate, the current creditworthiness of the counterparties. Interest rate swaps and mortgage banking derivative financial instruments are classified within Level 2 of the valuation hierarchy. Credit derivatives are valued based on credit worthiness of the underlying borrower which is a significant unobservable input and therefore classified in Level 3 of the valuation hierarchy.
Contingent Consideration Liability
The Corporation estimates the fair value of the contingent consideration liability by using a discounted cash flow model of future contingent payments based on projected revenue related to the acquired business. The estimated fair value of the contingent consideration liability is reviewed on a quarterly basis and any valuation adjustments resulting from a change of estimated future contingent payments based on projected revenue of the acquired business affecting the contingent consideration liability will be recorded through noninterest expense. Due to the significant unobservable input related to the projected revenue, the contingent consideration liability is classified within Level 3 of the valuation hierarchy. An increase in the projected revenue may result in a higher fair value of the contingent consideration liability. Alternatively, a decrease in the projected revenue may result in a lower estimated fair value of the contingent consideration liability.
93
The following table presents the assets and liabilities measured at fair value on a recurring basis at December 31, 2022 and 2021, classified using the fair value hierarchy:
| At December 31, 2022 | |||||||||||||||||||||||
| (Dollars in thousands) | Level 1 | Level 2 | Level 3 |
Assets/
Liabilities at Fair Value |
|||||||||||||||||||
| Assets: | |||||||||||||||||||||||
| Available-for-sale securities: | |||||||||||||||||||||||
| State and political subdivisions | $ |
|
$ |
|
$ |
|
$ |
|
|||||||||||||||
| Residential mortgage-backed securities |
|
|
|
|
|||||||||||||||||||
| Collateralized mortgage obligations |
|
|
|
|
|||||||||||||||||||
| Corporate bonds |
|
|
|
|
|||||||||||||||||||
| Total available-for-sale securities |
|
|
|
|
|||||||||||||||||||
| Equity securities: | |||||||||||||||||||||||
| Equity securities - financial services industry |
|
|
|
|
|||||||||||||||||||
| Money market mutual funds |
|
|
|
|
|||||||||||||||||||
| Total equity securities |
|
|
|
|
|||||||||||||||||||
| Loans held for sale |
|
|
|
|
|||||||||||||||||||
| Interest rate locks with customers* |
|
|
|
|
|||||||||||||||||||
| Forward loan sale commitments* |
|
|
|
|
|||||||||||||||||||
| Total assets | $ |
|
$ |
|
$ |
|
$ |
|
|||||||||||||||
| Liabilities: | |||||||||||||||||||||||
| Contingent consideration liability | $ |
|
$ |
|
$ |
|
$ |
|
|||||||||||||||
| Interest rate swaps* |
|
|
|
|
|||||||||||||||||||
| Credit derivatives* |
|
|
|
|
|||||||||||||||||||
| Total liabilities | $ |
|
$ |
|
$ |
|
$ |
|
|||||||||||||||
*Such financial instruments are recorded at fair value as further described in Note 18, "Derivative Instruments and Hedging Activities."
The $
360
thousand of credit derivatives liability represents the Credit Valuation Adjustment (CVA), which is obtained from real-time financial market data, of 127 interest rate swaps with a current notional amount of $
815.5
million. The December 31, 2022 CVA assumes a zero-deal recovery percentage based on the most recent index credit curve.
The contingent consideration liability resulting from the acquisition was $
1.6
million, which was calculated using a discount rate of 8.3%. The potential cash payments that could result from the contingent consideration arrangement for the Sheaffer acquisition range from $
0
to a maximum of $
1.9
million over the
-year period ending
November 30, 2024
.
94
| At December 31, 2021 | |||||||||||||||||||||||
| (Dollars in thousands) | Level 1 | Level 2 | Level 3 |
Assets/
Liabilities at Fair Value |
|||||||||||||||||||
| Assets: | |||||||||||||||||||||||
| Available-for-sale securities: | |||||||||||||||||||||||
| State and political subdivisions | $ |
|
$ |
|
$ |
|
$ |
|
|||||||||||||||
| Residential mortgage-backed securities |
|
|
|
|
|||||||||||||||||||
| Collateralized mortgage obligations |
|
|
|
|
|||||||||||||||||||
| Corporate bonds |
|
|
|
|
|||||||||||||||||||
| Total available-for-sale securities |
|
|
|
|
|||||||||||||||||||
| Equity securities: | |||||||||||||||||||||||
| Equity securities - financial services industry |
|
|
|
|
|||||||||||||||||||
| Money market mutual funds |
|
|
|
|
|||||||||||||||||||
| Total equity securities |
|
|
|
|
|||||||||||||||||||
| Loans* |
|
|
|
|
|||||||||||||||||||
| Loans held for sale |
|
|
|
|
|||||||||||||||||||
| Interest rate locks with customers* |
|
|
|
|
|||||||||||||||||||
| Total assets | $ |
|
$ |
|
$ |
|
$ |
|
|||||||||||||||
| Liabilities: | |||||||||||||||||||||||
| Contingent consideration liability | $ |
|
$ |
|
$ |
|
$ |
|
|||||||||||||||
| Interest rate swaps* |
|
|
|
|
|||||||||||||||||||
| Credit derivatives* |
|
|
|
|
|||||||||||||||||||
| Total liabilities | $ |
|
$ |
|
$ |
|
$ |
|
|||||||||||||||
*Such financial instruments are recorded at fair value as further described in Note 18, "Derivative Instruments and Hedging Activities."
The $
381
thousand of credit derivatives liability represents the CVA, which is obtained from real-time financial market data, of 125 interest rate swaps with a current notional amount of $
755.6
million. The December 31, 2021 CVA assumes a zero-deal recovery percentage based on the most recent index credit curve.
The contingent consideration liability resulting from the acquisition was $
1.6
million, which was calculated using a discount rate of 8.3%. The potential cash payments that could result from the contingent consideration arrangement for the Sheaffer acquisition range from $
0
to a maximum of $
1.9
million over the
-year period ending
November 30, 2024
.
The following table includes a rollforward of corporate bonds, loans and credit derivatives for which the Corporation utilized Level 3 inputs to determine fair value on a recurring basis for the years ended December 31, 2022 and 2021.
| For the Year Ended December 31, 2022 | |||||||||||||||||||||||||||||||||||
| (Dollars in thousands) | Balance at December 31, 2021 | Additions | Payments received | Increase in value | Transfer from Level 3 | Balance at December 31, 2022 | |||||||||||||||||||||||||||||
| Loans | $ |
|
$ |
|
$ |
(
|
$ |
|
$ |
|
$ |
|
|||||||||||||||||||||||
| Credit derivatives |
(
|
(
|
|
|
|
(
|
|||||||||||||||||||||||||||||
| Net total | $ |
(
|
$ |
(
|
$ |
(
|
$ |
|
$ |
|
$ |
(
|
|||||||||||||||||||||||
| For the Year Ended December 31, 2021 | |||||||||||||||||||||||||||||||||||
| (Dollars in thousands) |
Balance at
December 31, 2020 |
Additions | Payments received | (Increase) decrease in value | Transfer from Level 3 | Balance at December 31, 2021 | |||||||||||||||||||||||||||||
| Corporate bonds | $ |
|
$ |
|
$ |
|
$ |
|
(
|
$ |
|
||||||||||||||||||||||||
| Loans |
|
|
(
|
(
|
|
|
|||||||||||||||||||||||||||||
| Credit derivatives |
(
|
(
|
|
|
|
(
|
|||||||||||||||||||||||||||||
| Net total | $ |
|
$ |
(
|
$ |
(
|
$ |
|
$ |
(
|
$ |
(
|
|||||||||||||||||||||||
95
The following table presents the change in the balance of the contingent consideration liability related to acquisitions for which the Corporation utilized Level 3 inputs to determine fair value on a recurring basis for the years ended December 31, 2022 and 2021:
| For the Year Ended December 31, 2022 | |||||||||||||||||||||||||||||
| (Dollars in thousands) | Balance at December 31, 2021 |
Contingent
Consideration from New Acquisition |
Payment of
Contingent Consideration |
Adjustment
of Contingent Consideration |
Balance at December 31, 2022 | ||||||||||||||||||||||||
| Paul I. Sheaffer Insurance Agency | $ |
|
$ |
|
$ |
|
$ |
|
$ |
|
|||||||||||||||||||
| Total contingent consideration liability | $ |
|
$ |
|
$ |
|
$ |
|
$ |
|
|||||||||||||||||||
| For the Year Ended December 31, 2021 | |||||||||||||||||||||||||||||
| (Dollars in thousands) |
Balance at
December 31, 2020 |
Contingent
Consideration from New Acquisition |
Payment of
Contingent Consideration |
Adjustment
of Contingent Consideration |
Balance at December 31, 2021 | ||||||||||||||||||||||||
| Girard Partners | $ |
|
$ |
|
$ |
|
$ |
|
$ |
|
|||||||||||||||||||
| Paul I. Sheaffer Insurance Agency |
|
|
|
|
|
||||||||||||||||||||||||
| Total contingent consideration liability | $ |
|
$ |
|
$ |
|
$ |
|
$ |
|
|||||||||||||||||||
The Corporation may be required to periodically measure certain assets and liabilities at fair value on a non-recurring basis in accordance with GAAP. These adjustments to fair value usually result from the application of lower of cost or market accounting or changes in the value of loans held for investment analyzed on an individual basis. The following table represents assets measured at fair value on a non-recurring basis at December 31, 2022 and 2021:
| At December 31, 2022 | |||||||||||||||||||||||
| (Dollars in thousands) | Level 1 | Level 2 | Level 3 |
Assets at
Fair Value |
|||||||||||||||||||
| Individually analyzed loans held for investment | $ |
|
$ |
|
$ |
|
$ |
|
|||||||||||||||
| Other real estate owned |
|
|
|
|
|||||||||||||||||||
| Total | $ |
|
$ |
|
$ |
|
$ |
|
|||||||||||||||
| At December 31, 2021 | |||||||||||||||||||||||
| (Dollars in thousands) | Level 1 | Level 2 | Level 3 |
Assets at
Fair Value |
|||||||||||||||||||
| Individually analyzed loans held for investment | $ |
|
$ |
|
$ |
|
$ |
|
|||||||||||||||
| Other real estate owned |
|
|
|
|
|||||||||||||||||||
| Total | $ |
|
$ |
|
$ |
|
$ |
|
|||||||||||||||
96
The following table presents assets and liabilities not measured at fair value on a recurring or non-recurring basis in the Corporation's consolidated balance sheet but for which the fair value is required to be disclosed at December 31, 2022 and 2021. The disclosed fair values are classified using the fair value hierarchy.
| At December 31, 2022 | |||||||||||||||||||||||||||||
| (Dollars in thousands) | Level 1 | Level 2 | Level 3 |
Fair
Value |
Carrying
Amount |
||||||||||||||||||||||||
| Assets: | |||||||||||||||||||||||||||||
| Cash and short-term interest-earning assets | $ |
|
$ |
|
$ |
|
$ |
|
$ |
|
|||||||||||||||||||
| Held-to-maturity securities |
|
|
|
|
|
||||||||||||||||||||||||
| Federal Home Loan Bank, Federal Reserve Bank and other stock | N/A | N/A | N/A | N/A |
|
||||||||||||||||||||||||
| Net loans and leases held for investment |
|
|
|
|
|
||||||||||||||||||||||||
| Servicing rights |
|
|
|
|
|
||||||||||||||||||||||||
| Total assets | $ |
|
$ |
|
$ |
|
$ |
|
$ |
|
|||||||||||||||||||
| Liabilities: | |||||||||||||||||||||||||||||
| Deposits: | |||||||||||||||||||||||||||||
| Demand and savings deposits, non-maturity | $ |
|
$ |
|
$ |
|
$ |
|
$ |
|
|||||||||||||||||||
| Time deposits |
|
|
|
|
|
||||||||||||||||||||||||
| Total deposits |
|
|
|
|
|
||||||||||||||||||||||||
| Short-term borrowings |
|
|
|
|
|
||||||||||||||||||||||||
| Long-term debt |
|
|
|
|
|
||||||||||||||||||||||||
| Subordinated notes |
|
|
|
|
|
||||||||||||||||||||||||
| Total liabilities | $ |
|
$ |
|
$ |
|
$ |
|
$ |
|
|||||||||||||||||||
| At December 31, 2021 | |||||||||||||||||||||||||||||
| (Dollars in thousands) | Level 1 | Level 2 | Level 3 |
Fair
Value |
Carrying
Amount |
||||||||||||||||||||||||
| Assets: | |||||||||||||||||||||||||||||
| Cash and short-term interest-earning assets | $ |
|
$ |
|
$ |
|
$ |
|
$ |
|
|||||||||||||||||||
| Held-to-maturity securities |
|
|
|
|
|
||||||||||||||||||||||||
| Federal Home Loan Bank, Federal Reserve Bank and other stock | N/A | N/A | N/A | N/A |
|
||||||||||||||||||||||||
| Net loans and leases held for investment |
|
|
|
|
|
||||||||||||||||||||||||
| Servicing rights |
|
|
|
|
|
||||||||||||||||||||||||
| Total assets | $ |
|
$ |
|
$ |
|
$ |
|
$ |
|
|||||||||||||||||||
| Liabilities: | |||||||||||||||||||||||||||||
| Deposits: | |||||||||||||||||||||||||||||
| Demand and savings deposits, non-maturity | $ |
|
$ |
|
$ |
|
$ |
|
$ |
|
|||||||||||||||||||
| Time deposits |
|
|
|
|
|
||||||||||||||||||||||||
| Total deposits |
|
|
|
|
|
||||||||||||||||||||||||
| Short-term borrowings |
|
|
|
|
|
||||||||||||||||||||||||
| Long-term debt |
|
|
|
|
|
||||||||||||||||||||||||
| Subordinated notes |
|
|
|
|
|
||||||||||||||||||||||||
| Total liabilities | $ |
|
$ |
|
$ |
|
$ |
|
$ |
|
|||||||||||||||||||
The following valuation methods and assumptions were used by the Corporation in estimating the fair value for financial instruments measured at fair value on a non-recurring basis and financial instruments not measured at fair value on a recurring or non-recurring basis in the Corporation's consolidated balance sheets but for which the fair value is required to be disclosed:
Cash and short-term interest-earning assets:
The carrying amounts reported in the balance sheet for cash and due from banks, interest-earning deposits with other banks and other short-term investments is their stated value. Cash and short-term interest-earning assets are classified within Level 1 in the fair value hierarchy.
97
Held-to-maturity securities:
Fair values for the held-to-maturity investment securities are estimated by using pricing models or quoted prices of securities with similar characteristics and are classified in Level 2 in the fair value hierarchy.
Federal Home Loan Bank, Federal Reserve Bank and other stock:
It is not practical to determine the fair values of Federal
Home Loan Bank, Federal Reserve Bank and other stock, due to restrictions placed on their transferability.
Loans held for sale:
Loans held for sale are carried at the lower of cost or estimated fair value. The fair value of the Corporation's mortgage loans held for sale are generally determined using a pricing model based on current market information obtained from external sources, including interest rates, bids or indications provided by market participants on specific loans that are actively marketed for sale. These loans are primarily residential mortgage loans and are generally classified in Level 2 due to the observable pricing data.
Loans and leases held for investment:
The fair values for loans and leases held for investment are estimated using discounted cash flow analyses, using a discount rate based on current interest rates at which similar loans with similar terms would be made to borrowers, adjusted as appropriate to consider credit, liquidity and marketability factors to arrive at a fair value that represents the Corporation's exit price at which these instruments would be sold or transferred. Loans and leases are classified within Level 3 in the fair value hierarchy since credit risk is not an observable input.
Individually analyzed loans and leases held for investment:
For individually analyzed loans and leases, the Corporation uses a variety of techniques to measure fair value, such as using the current appraised value of the collateral, agreements of sale, discounting the contractual cash flows, and analyzing market data that the Corporation may adjust due to specific characteristics of the loan/lease or collateral. At December 31, 2022, individually analyzed loans held for investment had a carrying amount of $
13.4
million with a valuation allowance of $
2.8
million. At December 31, 2021, individually analyzed loans held for investment had a carrying amount of $
33.1
million with a valuation allowance of $
11
thousand. The Corporation had
no
individually analyzed leases at December 31, 2022 or 2021.
Servicing rights:
The Corporation estimates the fair value of servicing rights using discounted cash flow models that calculate the present value of estimated future net servicing income. The model uses readily available prepayment speed assumptions for the interest rates of the portfolios serviced. Servicing rights are classified within Level 3 in the fair value hierarchy based upon management's assessment of the inputs. The Corporation reviews the servicing rights portfolio on a quarterly basis for impairment and the servicing rights are carried at the lower of amortized cost or estimated fair value. At December 31, 2022, servicing rights had a net carrying amount of $
8.6
million, which included a valuation allowance of $
5
thousand. At December 31, 2021, servicing rights had a net carrying amount of $
7.9
million, which included a valuation allowance of $
13
thousand.
Goodwill and other identifiable assets:
Certain non-financial assets subject to measurement at fair value on a non-recurring basis include goodwill and other identifiable intangible assets. In accordance with ASC Topic 350, goodwill is tested at least annually for impairment at the reporting unit level. The Corporation performed its annual test of goodwill for impairment during the fourth quarter of 2022 and concluded there was
no
impairment of goodwill. There was
no
impairment of goodwill recorded during 2020 through 2021. The Corporation also completed an impairment test for other intangible assets during the fourth quarter of 2022 and concluded there was
no
impairment of other intangible assets. There was
no
impairment of other identifiable intangible assets recorded during 2020 through 2021.
Other real estate owned:
Other real estate owned (OREO) represents properties that the Corporation has acquired through foreclosure by either accepting a deed in lieu of foreclosure, or by taking possession of assets that were used as loan collateral. The Corporation reports OREO at the lower of cost or fair value less cost to sell, adjusted periodically based on a current appraisal or an executed agreement of sale. Capital improvement expenses associated with the construction or repair of the property are capitalized as part of the cost of the OREO asset. Write-downs and any gain or loss upon the sale of OREO is recorded in other noninterest income. OREO is reported in other assets on the consolidated balance sheet. At December 31, 2022 and 2021, OREO had a carrying amount of $
19.3
million and $
279
thousand, respectively. During the year ended December 31, 2022,
one
property was transferred to OREO with a carrying value of $
18.3
million. Other real estate owned is classified within Level 3 in the fair value hierarchy based on appraisals, letters of intent or agreement of sale received from third parties.
Deposit liabilities:
The fair values for demand and savings accounts, with no stated maturities, is the amount payable on demand at the reporting date (carrying value) and are classified within Level 1 in the fair value hierarchy. The fair values for time deposits with fixed maturities are estimated by discounting the final maturity using interest rates currently offered for deposits with similar remaining maturities. Time deposits are classified within Level 2 in the fair value hierarchy.
98
Short-term borrowings:
The fair value of short-term borrowings are estimated using current market rates for similar borrowings and are classified within Level 2 in the fair value hierarchy.
Long-term debt:
The fair value of long-term debt is estimated by using discounted cash flow analysis, based on current market rates for debt with similar terms and remaining maturities. Long-term debt is classified within Level 2 in the fair value hierarchy.
Subordinated notes:
The fair value of the subordinated notes are estimated by discounting the principal balance using the treasury yield curve for the term to the call date as the Corporation has the option to call the subordinated notes. The subordinated notes are classified within Level 2 in the fair value hierarchy.
Note 20.
Share Repurchase Plan
Note 21.
Regulatory Matters
The Corporation and the Bank are subject to various regulatory capital requirements administered by the federal banking agencies. Failure to meet minimum capital requirements can initiate certain mandatory and possibly additional discretionary actions by regulators that, if undertaken, could have a direct material effect on the Corporation's and the Bank's financial statements. Capital adequacy guidelines, and additionally for the Bank, the prompt corrective action regulations, involve quantitative measures of assets, liabilities, and certain off-balance-sheet items calculated under regulatory accounting practices. Capital amounts and classifications are also subject to qualitative judgments by regulators about components, risk weighting and other factors.
Quantitative measures established by regulation to ensure capital adequacy require the Corporation and the Bank to maintain minimum capital amounts and ratios are set forth in the following table. To comply with the regulatory definition of well capitalized, a depository institution must maintain minimum capital amounts and ratios as set forth in the following table.
Under current rules, in order to avoid limitations on capital distributions (including dividend payments and certain discretionary bonus payments to executive officers), a banking organization must hold a capital conservation buffer comprised of common equity Tier 1 capital above its minimum risk-based capital requirements in an amount greater than
2.50
% of total risk-weighted assets. The Corporation's and Bank's intent is to maintain capital levels in excess of the capital conservation buffer, which requires Tier 1 Capital to Risk Weighted Assets to exceed
8.50
% and Total Capital to Risk Weighted Assets to exceed
10.50
%. The Corporation and the Bank were in compliance with these requirements for 2022.
99
The Corporation's and Bank's actual and required capital ratios as of December 31, 2022 and December 31, 2021 under regulatory capital rules were as follows.
| Actual |
For Capital Adequacy
Purposes |
To Be Well-Capitalized
Under Prompt Corrective Action Provisions |
|||||||||||||||||||||||||||||||||
| (Dollars in thousands) | Amount | Ratio | Amount | Ratio | Amount | Ratio | |||||||||||||||||||||||||||||
| At December 31, 2022 | |||||||||||||||||||||||||||||||||||
| Total Capital (to Risk-Weighted Assets): | |||||||||||||||||||||||||||||||||||
| Corporation | $ |
|
|
% | $ |
|
|
% | $ |
|
|
% | |||||||||||||||||||||||
| Bank |
|
|
|
|
|
|
|||||||||||||||||||||||||||||
| Tier 1 Capital (to Risk-Weighted Assets): | |||||||||||||||||||||||||||||||||||
| Corporation |
|
|
|
|
|
|
|||||||||||||||||||||||||||||
| Bank |
|
|
|
|
|
|
|||||||||||||||||||||||||||||
| Tier 1 Common Capital (to Risk-Weighted Assets): | |||||||||||||||||||||||||||||||||||
| Corporation |
|
|
|
|
|
|
|||||||||||||||||||||||||||||
| Bank |
|
|
|
|
|
|
|||||||||||||||||||||||||||||
| Tier 1 Capital (to Average Assets): | |||||||||||||||||||||||||||||||||||
| Corporation |
|
|
|
|
|
|
|||||||||||||||||||||||||||||
| Bank |
|
|
|
|
|
|
|||||||||||||||||||||||||||||
| At December 31, 2021 | |||||||||||||||||||||||||||||||||||
| Total Capital (to Risk-Weighted Assets): | |||||||||||||||||||||||||||||||||||
| Corporation | $ |
|
|
% | $ |
|
|
% | $ |
|
|
% | |||||||||||||||||||||||
| Bank |
|
|
|
|
|
|
|||||||||||||||||||||||||||||
| Tier 1 Capital (to Risk-Weighted Assets): | |||||||||||||||||||||||||||||||||||
| Corporation |
|
|
|
|
|
|
|||||||||||||||||||||||||||||
| Bank |
|
|
|
|
|
|
|||||||||||||||||||||||||||||
| Tier 1 Common Capital (to Risk-Weighted Assets): | |||||||||||||||||||||||||||||||||||
| Corporation |
|
|
|
|
|
|
|||||||||||||||||||||||||||||
| Bank |
|
|
|
|
|
|
|||||||||||||||||||||||||||||
| Tier 1 Capital (to Average Assets): | |||||||||||||||||||||||||||||||||||
| Corporation |
|
|
|
|
|
|
|||||||||||||||||||||||||||||
| Bank |
|
|
|
|
|
|
|||||||||||||||||||||||||||||
At December 31, 2022 and December 31, 2021, management believes that the Corporation and the Bank continued to meet all capital adequacy requirements to which they are subject. At December 31, 2022, the Bank was categorized as "well capitalized" under the regulatory framework for prompt corrective action. There are no conditions or events since that management believes have changed the Bank's category.
In December 2018, the Federal Reserve announced that a banking organization that experiences a reduction in retained earnings due to the CECL adoption as of the beginning of the fiscal year in which CECL was adopted may elect to phase in the regulatory capital impact of adopting CECL. Transitional amounts are calculated for the following items: retained earnings, temporary difference deferred tax assets and credit loss allowances eligible for inclusion in regulatory capital. When calculating regulatory capital ratios, 25% of the transitional amounts are phased in during the first year. An additional 25% of the transitional amounts are phased in over each of the next two years and at the beginning of the fourth year, the day-one effects of CECL are completely reflected in regulatory capital.
Additionally, in March 2020, the Office of the Comptroller of the Currency, the U.S. Department of the Treasury, the Board of Governors of the Federal Reserve System, and the Federal Deposit Insurance Corporation announced the 2020 CECL interim final rule (IFR) designed to allow eligible firms to better focus on supporting lending to creditworthy households and businesses in light of the then-recent strains on the U.S. economy as a result of the coronavirus (COVID-19). The 2020 CECL IFR allows corporations that adopt CECL before December 31, 2020 to defer 100 percent of the day-one transitional amounts described above through December 31, 2021 for regulatory capital purposes. Additionally, the 2020 CECL IFR allows electing
100
firms to defer through December 31, 2021 the approximate portion of the post day-one allowance attributable to CECL relative to the incurred loss methodology. This is calculated by applying a 25% scaling factor to the CECL provision.
The Corporation adopted the transition guidance and the 2020 CECL IFR relief and applied these effects to regulatory capital.
Dividends and Other Restrictions
The primary sources of the Corporation's dividends paid to its shareholders is from cash held at the Corporation and the earnings of the Bank paid to the Corporation in the form of dividends.
The approval of the Federal Reserve Board of Governors is required for a state bank member in the Federal Reserve system to pay dividends if the total of all dividends declared in any calendar year exceeds the Bank's net profits (as defined) for that year combined with its retained net profits for the preceding two calendar years. Under this formula, the Bank can declare dividends in 2023 without approval of the Federal Reserve Board of Governors of approximately $
123.8
million plus an additional amount equal to the Bank's net profits for 2023 up to the date of any such dividend declaration.
Federal Reserve Board policy applicable to the holding company also provides that, as a general matter, a bank holding company should inform the Federal Reserve and should eliminate, defer or significantly reduce the holding company's dividends if the holding company's net income for the preceding four quarters, net of dividends paid during the period, is not sufficient to fully fund the dividends, the holding company's prospective rate of earnings retention is inconsistent with its capital needs and overall current and prospective financial condition, or the holding company will not meet, or is in danger of not meeting, its minimum regulatory capital adequacy ratios. Federal Reserve Board policy also provides that a bank holding company should inform the Federal Reserve reasonably in advance of declaring or paying a dividend that exceeds earnings for the period or that could result in a material adverse change to the organization's capital structure.
The Federal Reserve Act requires that the extension of credit by the Bank to certain affiliates, including the Corporation (parent), be secured by readily marketable securities, that the extension of credit to any one affiliate be limited to
10
% of the Bank's capital and surplus (as defined), and that extensions of credit to all such affiliates be limited to
20
% of the Bank's capital and surplus.
Note 22.
Related Party Transactions
In the ordinary course of business, the Corporation has made loans and commitments to extend credit to certain directors and executive officers of the Corporation and companies in which directors have an interest (Related Parties). These loans and commitments have been made on substantially the same terms, including interest rates and collateral requirements, as those prevailing at the same time for comparable transactions with customers not related to the lender and did not involve more than the normal risk of collectability or present other unfavorable terms.
The following table provides a summary of activity for loans to Related Parties during the year ended December 31, 2022:
| (Dollars in thousands) | |||||
| Balance at January 1, 2022 | $ |
|
|||
| Additions |
|
||||
| Amounts collected and other reductions |
(
|
||||
| Balance at December 31, 2022 | $ |
|
|||
The following table provides additional information regarding transactions with Related Parties:
| (Dollars in thousands) | At December 31, 2022 | ||||
| Commitments to extend credit | $ |
|
|||
| Deposits received |
|
||||
101
Note 23.
Segment Reporting
At December 31, 2022, the Corporation had
three
reportable business segments: Banking, Wealth Management and Insurance. The Corporation determines the segments based primarily upon product and service offerings, through the types of income generated and the regulatory environment. This is strategically how the Corporation operates and has positioned itself in the marketplace. Accordingly, significant operating decisions are based upon analysis of each of these segments. The parent holding company and intercompany eliminations are included in the "Other" segment.
Each segment generates revenue from a variety of products and services it provides. Examples of products and services provided for each reportable segment are indicated as follows:
| ● | The Banking segment provides financial services to individuals, businesses, municipalities and non-profit organizations. These services include a full range of banking services such as deposit taking, loan origination and servicing, mortgage banking, other general banking services and equipment lease financing. | ||||
| ● |
The Wealth Management segment offers investment advisory, financial planning, trust and brokerage services. The Wealth Management segment serves a diverse client base of private families and individuals, municipal pension plans, retirement plans, trusts and guardianships.
|
||||
| ● | The Insurance segment includes a full-service insurance brokerage agency offering commercial property and casualty insurance, employee benefit solutions, personal insurance lines and human resources consulting. | ||||
102
The following tables provide reportable segment-specific information and reconciliations to consolidated financial information for the years ended December 31, 2022, 2021 and 2020.
| (Dollars in thousands) | Banking | Wealth Management | Insurance | Other | Consolidated | ||||||||||||||||||||||||
| For the Year Ended December 31, 2022 | |||||||||||||||||||||||||||||
| Interest income | $ |
|
$ |
|
$ |
|
$ |
|
$ |
|
|||||||||||||||||||
| Interest expense |
|
|
|
|
|
||||||||||||||||||||||||
| Net interest income (expense) |
|
(
|
|
(
|
|
||||||||||||||||||||||||
| Provision for credit losses |
|
|
|
|
|
||||||||||||||||||||||||
| Noninterest income |
|
|
|
(
|
|
||||||||||||||||||||||||
| Noninterest expense |
|
|
|
|
|
||||||||||||||||||||||||
| Intersegment (revenue) expense* |
(
|
|
|
— | — | ||||||||||||||||||||||||
| Income (expense) before income taxes |
|
|
|
(
|
|
||||||||||||||||||||||||
| Income tax expense (benefit) |
|
|
|
(
|
|
||||||||||||||||||||||||
| Net income (loss) | $ |
|
$ |
|
$ |
|
$ |
(
|
$ |
|
|||||||||||||||||||
| Total assets | $ |
|
$ |
|
$ |
|
$ |
|
$ |
|
|||||||||||||||||||
| Net capital expenditures | $ |
(
|
$ |
|
$ |
|
$ |
|
$ |
(
|
|||||||||||||||||||
| For the Year Ended December 31, 2021 | |||||||||||||||||||||||||||||
| Interest income | $ |
|
$ |
|
$ |
|
$ |
|
$ |
|
|||||||||||||||||||
| Interest expense |
|
|
|
|
|
||||||||||||||||||||||||
| Net interest income (expense) |
|
(
|
|
(
|
|
||||||||||||||||||||||||
| Reversal of provision for credit losses |
(
|
|
|
|
(
|
||||||||||||||||||||||||
| Noninterest income |
|
|
|
|
|
||||||||||||||||||||||||
| Noninterest expense |
|
|
|
|
|
||||||||||||||||||||||||
| Intersegment (revenue) expense* |
(
|
|
|
— | — | ||||||||||||||||||||||||
| Income (expense) before income taxes |
|
|
|
(
|
|
||||||||||||||||||||||||
| Income tax expense (benefit) |
|
|
|
(
|
|
||||||||||||||||||||||||
| Net income (loss) | $ |
|
$ |
|
$ |
|
$ |
(
|
$ |
|
|||||||||||||||||||
| Total assets | $ |
|
$ |
|
$ |
|
$ |
|
$ |
|
|||||||||||||||||||
| Net capital expenditures | $ |
|
$ |
|
$ |
|
$ |
|
$ |
|
|||||||||||||||||||
| For the Year Ended December 31, 2020 | |||||||||||||||||||||||||||||
| Interest income | $ |
|
$ |
|
$ |
|
$ |
|
$ |
|
|||||||||||||||||||
| Interest expense |
|
|
|
|
|
||||||||||||||||||||||||
| Net interest income (expense) |
|
(
|
|
(
|
|
||||||||||||||||||||||||
| Provision for credit losses |
|
|
|
|
|
||||||||||||||||||||||||
| Noninterest income |
|
|
|
(
|
|
||||||||||||||||||||||||
| Noninterest expense |
|
|
|
|
|
||||||||||||||||||||||||
| Intersegment (revenue) expense* |
(
|
|
|
— | — | ||||||||||||||||||||||||
| Income (expense) before income taxes |
|
|
|
(
|
|
||||||||||||||||||||||||
| Income tax expense (benefit) |
|
|
|
(
|
|
||||||||||||||||||||||||
| Net income (loss) | $ |
|
$ |
|
$ |
|
$ |
(
|
$ |
|
|||||||||||||||||||
| Total assets | $ |
|
$ |
|
$ |
|
$ |
|
$ |
|
|||||||||||||||||||
| Net capital expenditures | $ |
|
$ |
|
$ |
|
$ |
|
$ |
|
|||||||||||||||||||
*Includes an allocation of general and administrative expenses from both the parent holding company and the Bank. These expenses are generally allocated based upon number of employees and square footage utilized.
103
Note 24.
Revenue from Contracts with Customers
The following tables disaggregate the Corporation's revenue by major source and reportable segment for the years ended December 31, 2022, 2021 and 2020.
| (Dollars in thousands) | Banking | Wealth Management | Insurance | Other | Consolidated | ||||||||||||||||||||||||
| For the Year Ended December 31, 2022 | |||||||||||||||||||||||||||||
| Net interest income (1) | $ |
|
$ |
(
|
$ |
|
$ |
(
|
$ |
|
|||||||||||||||||||
| Noninterest income: | |||||||||||||||||||||||||||||
| Trust fee income |
|
|
|
|
|
||||||||||||||||||||||||
| Service charges on deposit accounts |
|
|
|
|
|
||||||||||||||||||||||||
| Investment advisory commission and fee income |
|
|
|
|
|
||||||||||||||||||||||||
| Insurance commission and fee income |
|
|
|
|
|
||||||||||||||||||||||||
| Other service fee income (2) |
|
|
|
|
|
||||||||||||||||||||||||
| Bank owned life insurance income (1) |
|
|
|
|
|
||||||||||||||||||||||||
| Net gain on sales of investment securities (1) |
|
|
|
|
|
||||||||||||||||||||||||
| Net gain on mortgage banking activities (1) |
|
|
|
|
|
||||||||||||||||||||||||
| Other income (2) |
|
|
|
(
|
|
||||||||||||||||||||||||
| Total noninterest income | $ |
|
$ |
|
$ |
|
$ |
(
|
$ |
|
|||||||||||||||||||
| (Dollars in thousands) | Banking | Wealth Management | Insurance | Other | Consolidated | ||||||||||||||||||||||||
| For the Year Ended December 31, 2021 | |||||||||||||||||||||||||||||
| Net interest income (1) | $ |
|
$ |
(
|
$ |
|
$ |
(
|
$ |
|
|||||||||||||||||||
| Noninterest income: | |||||||||||||||||||||||||||||
| Trust fee income |
|
|
|
|
|
||||||||||||||||||||||||
| Service charges on deposit accounts |
|
|
|
|
|
||||||||||||||||||||||||
| Investment advisory commission and fee income |
|
|
|
|
|
||||||||||||||||||||||||
| Insurance commission and fee income |
|
|
|
|
|
||||||||||||||||||||||||
| Other service fee income (2) |
|
|
|
|
|
||||||||||||||||||||||||
| Bank owned life insurance income (1) |
|
|
|
|
|
||||||||||||||||||||||||
| Net gain on sales of investment securities (1) |
|
|
|
|
|
||||||||||||||||||||||||
| Net gain on mortgage banking activities (1) |
|
|
|
|
|
||||||||||||||||||||||||
| Other income (2) |
|
|
|
|
|
||||||||||||||||||||||||
| Total noninterest income | $ |
|
$ |
|
$ |
|
$ |
|
$ |
|
|||||||||||||||||||
| (Dollars in thousands) | Banking | Wealth Management | Insurance | Other | Consolidated | ||||||||||||||||||||||||
| For the Year Ended December 31, 2020 | |||||||||||||||||||||||||||||
| Net interest income (1) | $ |
|
$ |
(
|
$ |
|
$ |
(
|
$ |
|
|||||||||||||||||||
| Noninterest income: | |||||||||||||||||||||||||||||
| Trust fee income |
|
|
|
|
|
||||||||||||||||||||||||
| Service charges on deposit accounts |
|
|
|
|
|
||||||||||||||||||||||||
| Investment advisory commission and fee income |
|
|
|
|
|
||||||||||||||||||||||||
| Insurance commission and fee income |
|
|
|
|
|
||||||||||||||||||||||||
| Other service fee income (2) |
|
|
|
|
|
||||||||||||||||||||||||
| Bank owned life insurance income (1) |
|
|
|
|
|
||||||||||||||||||||||||
| Net gain on sales of investment securities (1) |
|
|
|
|
|
||||||||||||||||||||||||
| Net gain on mortgage banking activities (1) |
|
|
|
|
|
||||||||||||||||||||||||
| Other income (2) |
|
|
|
(
|
|
||||||||||||||||||||||||
| Total noninterest income | $ |
|
$ |
|
$ |
|
$ |
(
|
$ |
|
|||||||||||||||||||
104
(1)
Net interest income as well as many other revenues for financial assets and liabilities including loans, leases, securities, and derivatives are excluded from the scope of FASB ASC 606 "Revenue from Contracts with Customers" (FASB ASC 606). Noninterest income streams that are out of scope of FASB ASC 606 include bank owned life insurance income, sales of investment securities and mortgage banking activities.
(2)
Other service fee income and other income include certain items that are in scope and certain items that are out of scope of FASB ASC 606 as described further in the following paragraphs.
Banking Segment
Service charges on deposit accounts
are generally earned on depository accounts for commercial and consumer customers and primarily includes fees for account services, overdraft and non-sufficient funds services, and cash management services for commercial customers. Account services include fees for event-driven services such as ATM transactions and fees for periodic account maintenance activities. Cash management services for commercial customers include fees for event-driven services such as lockbox processing and line sweep services and fees for periodic account maintenance activities. The Corporation's obligation for event-driven services is satisfied at the time of the event when the service is delivered, while the obligation for periodic services is satisfied over the course of each month. Obligations for overdraft services are satisfied at the time of the overdraft.
Other service fee income
is earned from commercial and consumer customers and primarily includes credit and debit card interchange and merchant revenues, mortgage servicing income, which is out of scope of
FASB ASC 606
, and other deposit related service fee income such as wire transfers, check services and safe deposit boxes. Interchange and merchant revenues are recognized concurrently with the delivery of services on a monthly basis. Other deposit related service fee income include fees for event-driven services, such as wire transfers and check services, and fees for periodic services such as safe deposit box services. The obligation for event-driven services is satisfied at the time of the event when the service is delivered, while the obligation for periodic services is satisfied over the course of each month.
Other income
primarily includes net gains or losses from the sales of loans and leases, net gains or losses from the sales or disposition of fixed assets and net gains or losses on interest rate swaps, all of which are out of scope of
FASB ASC 606
, and net gains or losses on sales and write-downs of other real estate owned. Net gains or losses on sales of other real estate owned are recognized at the point in time in which control of the other real estate owned is transferred.
Wealth Management Segment
Trust fee income
is earned for providing trust, investment management and other related services. Obligations for trust and other related services are generally satisfied over time but may be satisfied at points in time for certain activities that are transactional in nature and obligations for investment management services are generally performed over time. Fees for trust fee income are typically based on a tiered scale relative to the market value of assets under management and are recognized in conjunction with the delivery of services.
Investment advisory commission and fee income
include fees for financial planning, guardian and custodian of employee benefits, investment advisory, and brokerage services. Obligations for financial planning, guardian and custodian of employee benefits, and investment advisory services are generally satisfied over time and fees, typically based on a tiered scale relative to the market value of assets under management, are recognized in conjunction with the delivery of services. Brokerage services are typically event driven and are based on the size and number of transactions executed at the client's direction and recognized on the trade date.
Insurance Segment
Insurance commission and fee income
is derived primarily from commissions from the sale of insurance policies, which are generally calculated as a percentage of the policy premium, and contingent income, which is calculated based on the performance of the policies held by each carrier. Obligations for the sale of insurance policies are generally satisfied at the point in time which the policy is executed and are recognized at the point in time in which the amounts are known and collection is reasonably assured. Obligations for contingent income are generally satisfied over time and are recognized at the point in time in which the amounts are known and collection is reasonably assured.
Other service fee income
is earned from payroll and human resources consulting services. These obligations are generally satisfied over time and are recognized on a periodic basis.
105
Note 25.
Condensed Financial Information - Parent Company Only
Condensed financial statements of the Corporation, parent company only, follow:
| (Dollars in thousands) | At December 31, | ||||||||||
| Balance Sheets | 2022 | 2021 | |||||||||
| Assets: | |||||||||||
| Cash | $ |
|
$ |
|
|||||||
| Interest-earning deposits with other banks |
|
|
|||||||||
| Cash and cash equivalents |
|
|
|||||||||
| Investments in securities |
|
|
|||||||||
| Investments in subsidiaries, at equity in net assets: | |||||||||||
| Bank |
|
|
|||||||||
| Non-banks |
|
|
|||||||||
| Other assets |
|
|
|||||||||
| Total assets | $ |
|
$ |
|
|||||||
| Liabilities: | |||||||||||
| Subordinated notes | $ |
|
$ |
|
|||||||
| Other liabilities |
|
|
|||||||||
| Total liabilities |
|
|
|||||||||
| Shareholders' equity: |
|
|
|||||||||
| Total liabilities and shareholders' equity | $ |
|
$ |
|
|||||||
| (Dollars in thousands) | For the Years Ended December 31, | ||||||||||||||||
| Statements of Income | 2022 | 2021 | 2020 | ||||||||||||||
| Dividends from Bank | $ |
|
$ |
|
$ |
|
|||||||||||
| Dividends from non-bank |
|
|
|
||||||||||||||
| Other income |
|
|
|
||||||||||||||
| Total operating income |
|
|
|
||||||||||||||
| Interest expense |
|
|
|
||||||||||||||
| Operating expenses |
|
|
|
||||||||||||||
| Income before income tax benefit and equity in undistributed income of subsidiaries |
|
|
|
||||||||||||||
| Income tax benefit |
(
|
(
|
(
|
||||||||||||||
| Income before equity in undistributed income of subsidiaries |
|
|
|
||||||||||||||
| Equity in undistributed income of subsidiaries: | |||||||||||||||||
| Bank |
|
|
|
||||||||||||||
| Non-banks |
|
|
|
||||||||||||||
| Net income | $ |
|
$ |
|
$ |
|
|||||||||||
106
| (Dollars in thousands) | For the Years Ended December 31, | ||||||||||||||||
| Statements of Cash Flows | 2022 | 2021 | 2020 | ||||||||||||||
| Cash flows from operating activities: | |||||||||||||||||
| Net income | $ |
|
$ |
|
$ |
|
|||||||||||
| Adjustments to reconcile net income to net cash provided by operating activities: | |||||||||||||||||
| Equity in undistributed net income of subsidiaries |
(
|
(
|
(
|
||||||||||||||
| Bank owned life insurance income |
(
|
(
|
(
|
||||||||||||||
| Depreciation of premises and equipment |
|
|
|
||||||||||||||
| Stock based compensation |
|
|
|
||||||||||||||
| Contributions to pension and other postretirement benefit plans |
(
|
(
|
(
|
||||||||||||||
| Decrease (increase) in other assets |
|
(
|
|
||||||||||||||
| (Decrease) increase in other liabilities |
(
|
|
(
|
||||||||||||||
| Net cash provided by operating activities |
|
|
|
||||||||||||||
| Cash flow from investing activities: | |||||||||||||||||
| Investments in subsidiaries |
(
|
|
|
||||||||||||||
| Proceeds from sales of securities |
|
|
|
||||||||||||||
| Other, net |
(
|
(
|
(
|
||||||||||||||
| Net cash used in investing activities |
(
|
(
|
(
|
||||||||||||||
| Cash flows from financing activities: | |||||||||||||||||
| Proceeds from issuance of subordinated notes |
|
|
|
||||||||||||||
| Repayment of subordinated debt |
|
(
|
(
|
||||||||||||||
| Payment for shares withheld to cover taxes on vesting of restricted stock units |
(
|
(
|
(
|
||||||||||||||
| Purchases of treasury stock |
(
|
(
|
(
|
||||||||||||||
| Stock issued under dividend reinvestment and employee stock purchase plans |
|
|
|
||||||||||||||
| Proceeds from exercise of stock options |
|
|
|
||||||||||||||
| Cash dividends paid |
(
|
(
|
(
|
||||||||||||||
| Net cash provided by (used in) financing activities |
|
(
|
|
||||||||||||||
| Net increase (decrease) in cash and due from financial institutions |
|
(
|
|
||||||||||||||
| Cash and cash equivalents at beginning of year |
|
|
|
||||||||||||||
| Cash and cash equivalents at end of period | $ |
|
$ |
|
$ |
|
|||||||||||
| Supplemental disclosures of cash flow information: | |||||||||||||||||
| Cash paid during the year for: | |||||||||||||||||
| Interest | $ |
|
$ |
|
$ |
|
|||||||||||
| Income tax, net of refunds received |
|
|
|
||||||||||||||
107
Item 9.
Changes in and Disagreements with Accountants on Accounting and Financial Disclosure
None.
Item 9A.
Controls and Procedures
Disclosure Controls and Procedures
Management is responsible for the disclosure controls and procedures of the Corporation. Disclosure controls and procedures are controls and other procedures of an issuer that are designed to ensure that information required to be disclosed by the issuer in the reports that it files or submits under the Securities Exchange Act of 1934 is recorded, processed, summarized and reported within the time periods required by the SEC's rules and forms. Disclosure controls and procedures include, without limitation, controls and procedures designed to ensure that information required to be so disclosed by an issuer is accumulated and communicated to the issuer's management, including its principal executive and principal financial officers, or persons performing similar functions, as appropriate to allow timely decisions regarding required disclosure. As of the end of the period covered by this report, an evaluation was performed under the supervision and with the participation of the Corporation's management, including the Chief Executive Officer (Principal Executive Officer) and Chief Financial Officer (Principal Financial and Accounting Officer), of the effectiveness of the design and operation of the Corporation’s disclosure controls and procedures. Based on that evaluation, the Corporation's Chief Executive Officer and Chief Financial Officer concluded that the disclosure controls and procedures were effective as of December 31, 2022.
Management's Report on Internal Control over Financial Reporting
The management of Univest Financial Corporation (the Corporation) is responsible for establishing and maintaining adequate internal control over financial reporting. The Corporation's internal control system is designed to provide reasonable assurance regarding the reliability of financial reporting and the preparation of financial statements for external purposes in accordance with U.S. generally accepted accounting principles.
Because of its inherent limitations, internal control over financial reporting may not prevent or detect misstatements. Also, projections of any evaluation of effectiveness to future periods are subject to the risk that controls may become inadequate because of changes in conditions, or that the degree of compliance with the policies or procedures may deteriorate.
Management assessed the effectiveness of the Corporation's internal control over financial reporting as of December 31, 2022, using the criteria set forth in
Internal Control - Integrated Framework
, published by the Committee of Sponsoring Organizations of the Treadway Commission (COSO) in 2013. Based on this assessment, management concluded that, as of December 31, 2022, the Corporation's internal control over financial reporting is effective based on those criteria.
KPMG LLP, an independent registered public accounting firm, has audited the Corporation's consolidated financial statements as of and for the year ended December 31, 2022 and the effectiveness of the Corporation's internal control over financial reporting as of December 31, 2022, as stated in their reports, which are included herein.
Changes in Internal Control Over Financial Reporting
There were no changes in the Corporation's internal control over financial reporting (as defined in Rule 13a-15(f)) during the quarter ended December 31, 2022 that materially affected, or are reasonably likely to materially affect, the Corporation's internal control over financial reporting.
108
Report of Independent Registered Public Accounting Firm
To the Shareholders and Board of Directors
Univest Financial Corporation:
Opinion on Internal Control Over Financial Reporting
We have audited Univest Financial Corporation and subsidiaries' (the Company) internal control over financial reporting as of December 31, 2022, based on criteria established in
Internal Control – Integrated Framework (2013)
issued by the Committee of Sponsoring Organizations of the Treadway Commission. In our opinion, the Company maintained, in all material respects, effective internal control over financial reporting as of December 31, 2022, based on criteria established in
Internal Control – Integrated Framework (2013)
issued by the Committee of Sponsoring Organizations of the Treadway Commission.
We also have audited, in accordance with the standards of the Public Company Accounting Oversight Board (United States) (PCAOB), the consolidated balance sheets of the Company as of December 31, 2022 and 2021, the related consolidated statements of income, comprehensive income, changes in shareholders’ equity, and cash flows for each of the years in the three-year period ended December 31, 2022, and the related notes (collectively, the consolidated financial statements), and our report dated February 24, 2023 expressed an unqualified opinion on those consolidated financial statements.
Basis for Opinion
The Company’s management is responsible for maintaining effective internal control over financial reporting and for its assessment of the effectiveness of internal control over financial reporting, included in the accompanying Management's Report on Internal Control Over Financial Reporting. Our responsibility is to express an opinion on the Company’s internal control over financial reporting based on our audit. We are a public accounting firm registered with the PCAOB and are required to be independent with respect to the Company in accordance with the U.S. federal securities laws and the applicable rules and regulations of the Securities and Exchange Commission and the PCAOB.
We conducted our audit in accordance with the standards of the PCAOB. Those standards require that we plan and perform the audit to obtain reasonable assurance about whether effective internal control over financial reporting was maintained in all material respects. Our audit of internal control over financial reporting included obtaining an understanding of internal control over financial reporting, assessing the risk that a material weakness exists, and testing and evaluating the design and operating effectiveness of internal control based on the assessed risk. Our audit also included performing such other procedures as we considered necessary in the circumstances. We believe that our audit provides a reasonable basis for our opinion.
Definition and Limitations of Internal Control Over Financial Reporting
A company’s internal control over financial reporting is a process designed to provide reasonable assurance regarding the reliability of financial reporting and the preparation of financial statements for external purposes in accordance with generally accepted accounting principles. A company’s internal control over financial reporting includes those policies and procedures that (1) pertain to the maintenance of records that, in reasonable detail, accurately and fairly reflect the transactions and dispositions of the assets of the company; (2) provide reasonable assurance that transactions are recorded as necessary to permit preparation of financial statements in accordance with generally accepted accounting principles, and that receipts and expenditures of the company are being made only in accordance with authorizations of management and directors of the company; and (3) provide reasonable assurance regarding prevention or timely detection of unauthorized acquisition, use, or disposition of the company’s assets that could have a material effect on the financial statements.
Because of its inherent limitations, internal control over financial reporting may not prevent or detect misstatements. Also, projections of any evaluation of effectiveness to future periods are subject to the risk that controls may become inadequate because of changes in conditions, or that the degree of compliance with the policies or procedures may deteriorate.
Philadelphia, Pennsylvania
February 24, 2023
109
Item 9B.
Other Information
None.
Item 9C.
Disclosure Regarding Foreign Jurisdictions that Prevent Inspections
Not applicable.
PART III
Item 10.
Directors, Executive Officers and Corporate Governance
Information required by Items 401, 405, 406 and 407(c)(3), (d)(4) and (d)(5), of Regulation S-K is incorporated herein by reference from the Corporation's definitive proxy statement on Schedule 14A for the annual meeting of shareholders on April 26, 2023 (2023 Proxy), under the headings: "Election of Directors and Alternate Director," "Delinquent Section 16(a) Reports," "The Board, the Board's Committees and Their Functions," and "Audit Committee."
The Corporation maintains in effect a Code of Conduct for Directors and a Code of Conduct for all officers and employees, which includes the CEO and senior financial officers. The codes of conduct are available on the Corporation's website. The Corporation's website also includes the charters for its audit committee, compensation committee, and nominating and governance committee as well as its corporate governance principles. These documents are located on the Corporation's website at
www.univest.net
under "Investors Relations" in Governance Documents and are also available to any person without charge by sending a request to the Corporate Secretary at Univest Financial Corporation, P. O. Box 197, Souderton, PA 18964.
Item 11.
Executive Compensation
Information required by Item 402 and paragraphs (e)(4) and (e)(5) of Item 407 of Regulation S-K is incorporated herein by reference from the Corporation's 2023 Proxy under the headings: "The Board, the Board's Committees and Their Functions," "Executive Compensation," "Director Compensation," and "Compensation Committee Report."
Item 12.
Security Ownership of Certain Beneficial Owners and Management and Related Stockholder Matters
Information required by Item 403 of Regulation S-K is incorporated herein by reference from the Corporation's 2023 Proxy under the heading, "Security Ownership of Certain Beneficial Owners and Management."
Equity Compensation Plan Information
The Corporation maintains a 2013 Long-Term Incentive Plan (LTIP), which was amended in December 2018 to permit the issuance of restricted stock units. Under the LTIP, the Corporation may grant options and share awards to employees and non-employee directors up to 3,732,632 shares of common stock.
The following table sets forth information regarding outstanding options and shares under equity compensation plans at December 31, 2022:
| (a) | (b) | (c) | |||||||||||||||
| Plan Category | Number of Securities to be Issued Upon Exercise of Outstanding Options, Warrants and Rights | Weighted-Average Exercise Price of Outstanding Options, Warrants and Rights | Number of Securities Remaining Available for Future Issuance Under Equity Compensation Plans (Excluding Securities Reflected in Column (a)) | ||||||||||||||
| Equity compensation plan approved by security holders | 294,111 | $ | 26.11 | 2,253,706 | |||||||||||||
| Equity compensation plan not approved by security holders | — | — | — | ||||||||||||||
| Total | 294,111 | $ | 26.11 | 2,253,706 | |||||||||||||
Item 13.
Certain Relationships and Related Transactions, and Director Independence
Information required by Items 404 and 407(a) of Regulation S-K is incorporated herein by reference from the Corporation's 2023 Proxy under the headings, "The Board, the Board's Committees and Their Functions" and "Related Party Transactions."
110
Item 14.
Principal Accounting Fees and Services
Information required by Item 9(e) of Schedule 14A is incorporated herein by reference from the Corporation's 2023 Proxy under the headings: "Audit Committee" and "Independent Registered Public Accounting Firm Fees."
PART IV
Item 15.
Exhibits and Financial Statement Schedules
| (a) | 1. & 2. Financial Statements and Schedules | ||||
| The financial statements listed in the accompanying index to financial statements are filed as part of this annual report. | |||||
| 3. Listing of Exhibits | |||||
| The exhibits listed on the accompanying index to exhibits are filed as part of this annual report. | |||||
| (b) | Exhibits - The response to this portion of Item 15 is submitted as separate section. | ||||
| (c) | Financial Statements Schedules - none. | ||||
111
UNIVEST FINANCIAL CORPORATION AND SUBSIDIARIES
INDEX TO FINANCIAL STATEMENTS AND FINANCIAL STATEMENTS SCHEDULES
[Item 15(a) 1. & 2.]
Annual Report of Shareholders
| Page | |||||
Certain financial statement schedules are omitted since the required information is not present or is not present in amounts sufficient to require submission of the schedule, or because the information required is included in the financial statements and notes thereto.
112
UNIVEST FINANCIAL CORPORATION AND SUBSIDIARIES
INDEX OF EXHIBITS
[Item 15(a) 3. & 15(b)]
Description
| (3.1) | ||||||||
| (3.2) | ||||||||
| (4.1) | ||||||||
| (4.2) | ||||||||
| (4.3) | ||||||||
| (4.4) | ||||||||
| (4.5) | ||||||||
| (4.6) | ||||||||
| (4.7) | ||||||||
| (4.8) | ||||||||
| (10.1)* |
Form of Change in Control Agreement, dated
O
ctober
2
6
, 2022, entered into between Univest Financial Corporation, Univest Bank and Trust Co. and each of Jeffrey M. Schweitzer, Michael S. Keim, Brian J. Richardson and Megan D. Santana, is incorporated by reference to Exhibit 10.1 of Form 8-K, filed with the SEC on
October
2
7
, 2022.
|
|||||||
| (10.2)* | ||||||||
| (10.3)* | ||||||||
| (10.4)* | ||||||||
| (10.5)* | ||||||||
| (21) | ||||||||
| (23.1) | ||||||||
| (31.1) | ||||||||
| (31.2) | ||||||||
| (32.1)** | ||||||||
| (32.2)** | ||||||||
| (101) | The following financial statements from the Corporation's Annual Report on Form 10-K for the year ended December 31, 2022, formatted in Inline XBRL: (i) Consolidated Balance Sheets, (ii) Consolidated Statements of Income, (iii) Consolidated Statements of Comprehensive Income, (iv) Consolidated Statements of Changes in Shareholders' Equity, (v) Consolidated Statements of Cash Flows, and (vi) Notes to the Consolidated Financial Statements, tagged as blocks of text and including detailed tags. | |||||||
| (104) | The cover page from the Corporation's Annual Report on Form 10-K for the year ended December 31, 2022, formatted in Inline XBRL. | |||||||
* Denotes a compensatory plan or agreement.
113
** A certification furnished pursuant to this item will not be deemed "filed" for purposes of Section 18 of the Exchange Act (15 S.C. 78r), or otherwise subject to the liability of that section. Such certification will not be deemed to be incorporated by reference into any filing under the Securities Act or the Exchange Act.
Item 16.
Form 10-K Summary
None.
114
SIGNATURES
Pursuant to the requirements of Section 13 or 15(d) of the Securities Exchange Act of 1934, the registrant has duly caused this Annual Report to be signed on its behalf by the undersigned, thereunto duly authorized.
| UNIVEST FINANCIAL CORPORATION | |||||
| Registrant | |||||
| By: /s/ Brian J. Richardson | |||||
|
Brian J. Richardson
Senior Executive Vice President and Chief Financial Officer
(Principal Financial and Accounting Officer)
|
|||||
| February 24, 2023 | |||||
Pursuant to the requirements of the Securities Exchange Act of 1934, this report has been signed below by the following persons on behalf of the registrant and in the capacities and on the dates indicated:
| Signature | Title | Date | ||||||
|
/s/ WILLIAM S. AICHELE
William S. Aichele
|
Chairman and Director | February 24, 2023 | ||||||
|
/s/ JEFFREY M. SCHWEITZER
Jeffrey M. Schweitzer
|
President, Chief Executive Officer
and Director
(Principal Executive Officer)
|
February 24, 2023 | ||||||
|
/s/ BRIAN J. RICHARDSON
Brian J. Richardson
|
Chief Financial Officer
(Principal Financial and Accounting Officer)
|
February 24, 2023 | ||||||
|
/s/ ROGER H. BALLOU
Roger H. Ballou
|
Director | February 24, 2023 | ||||||
|
/s/ JOSEPH P. BEEBE
Joseph P. Beebe
|
Director | February 24, 2023 | ||||||
|
/s/ TODD S. BENNING
Todd S. Benning
|
Director | February 24, 2023 | ||||||
|
/s/ SUZANNE KEENAN
Suzanne Keenan
|
Director | February 24, 2023 | ||||||
|
/s/ GLENN E. MOYER
Glenn E. Moyer
|
Director | February 24, 2023 | ||||||
|
/s/
NATALYE PAQUIN
Natalye Paquin
|
Director | February 24, 2023 | ||||||
|
/s/ THOMAS M. PETRO
Thomas M. Petro
|
Director | February 24, 2023 | ||||||
|
/s/ MICHAEL L. TURNER
Michael L. Turner
|
Director | February 24, 2023 | ||||||
|
/s/ ROBERT C. WONDERLING
Robert C. Wonderling
|
Director | February 24, 2023 | ||||||
|
/s/ CHARLES H. ZIMMERMAN III
Charles H. Zimmerman III
|
Director | February 24, 2023 | ||||||
115
TABLE OF CONTENTS
Part IItem 1. BusinessItem 1A. Risk FactorsItem 1B. Unresolved Staff CommentsItem 2. PropertiesItem 3. Legal ProceedingsItem 4. Mine Safety DisclosuresPart IIItem 5. Market For The Registrant's Common Equity, Related Stockholder Matters and Issuer Purchases Of Equity SecuritiesItem 6. [reserved]Item 7. Management's Discussion and Analysis Of Financial Condition and Results Of OperationsItem 7A. Quantitative and Qualitative Disclosures About Market RiskItem 8. Financial Statements and Supplementary DataNote 1. Summary Of Significant Accounting PoliciesNote 2. Earnings Per ShareNote 3. Restrictions on Cash and Due From Banks and Interest-earning Deposit AccountsNote 4. Investment SecuritiesNote 5. Loans and LeasesNote 6. Premises and EquipmentNote 7. Goodwill and Other Intangible AssetsNote 8. Accrued Interest Receivable and Other AssetsNote 9. DepositsNote 10. BorrowingsNote 11. Accrued Interest Payable and Other LiabilitiesNote 12. Income TaxesNote 13. Retirement Plans and Other Postretirement BenefitsNote 14. Stock-based Incentive PlanNote 15. Accumulated Other Comprehensive (loss) IncomeNote 16. LeasesNote 17. Commitments and ContingenciesNote 18. Derivative Instruments and Hedging ActivitiesNote 19. Fair Value DisclosuresNote 20. Share Repurchase PlanNote 21. Regulatory MattersNote 22. Related Party TransactionsNote 23. Segment ReportingNote 24. Revenue From Contracts with CustomersNote 25. Condensed Financial Information - Parent Company OnlyItem 9. Changes in and Disagreements with Accountants on Accounting and Financial DisclosureItem 9A. Controls and ProceduresItem 9B. Other InformationItem 9C. Disclosure Regarding Foreign Jurisdictions That Prevent InspectionsPart IIIItem 10. Directors, Executive Officers and Corporate GovernanceItem 11. Executive CompensationItem 12. Security Ownership Of Certain Beneficial Owners and Management and Related Stockholder MattersItem 13. Certain Relationships and Related Transactions, and Director IndependenceItem 14. Principal Accounting Fees and ServicesPart IVItem 15. Exhibits and Financial Statement SchedulesItem 16. Form 10-k Summary