VISA INC.
10-Ks and 10-Qs
|
|
|
|
|
|
|
|
|
|
|
|
|
|
|
|
|
|
|
|
|
|
|
|
|
|
|
|
|
|
|
|
|
|
|
|
|
|
|
|
|
|
|
|
|
|
|
|
|
|
|
|
|
UNITED STATES SECURITIES AND EXCHANGE COMMISSION
WASHINGTON, D.C. 20549
FORM 10-K
|
þ
|
ANNUAL REPORT PURSUANT TO SECTION 13 OR 15(d) OF THE SECURITIES EXCHANGE ACT OF 1934
|
For the fiscal year ended
September 30, 2013
OR
|
¨
|
TRANSITION REPORT PURSUANT TO SECTION 13 OR 15(d) OF THE SECURITIES EXCHANGE ACT OF 1934
|
For the transition period from to
Commission file number 001-33977
VISA INC.
(Exact name of Registrant as specified in its charter)
|
Delaware
|
|
26-0267673
|
|
(State or other jurisdiction
of incorporation or organization)
|
|
(IRS Employer
Identification No.)
|
|
P.O. Box 8999
San Francisco, California
|
|
94128-8999
|
|
(Address of principal executive offices)
|
|
(Zip Code)
|
Registrant’s telephone number, including area code: (650) 432-3200
Securities registered pursuant to Section 12(b) of the Act:
|
Title of each Class
|
|
Name of each exchange on which registered
|
|
Class A common stock, par value $.0001 per share
|
|
New York Stock Exchange
|
Securities registered pursuant to Section 12(g) of the Act:
Title of each Class
Class B common stock, par value $.0001 per share
Class C common stock, par value $.0001 per share
Indicate by check mark if the registrant is a well-known seasoned issuer, as defined in Rule 405 of the Securities Act. Yes
þ
No
¨
Indicate by check mark if the registrant is not required to file reports pursuant to Section 13 or 15(d) of the Act. Yes
¨
No
þ
Indicate by check mark whether the registrant (1) has filed all reports required to be filed by Section 13 or 15(d) of the Securities Exchange Act of 1934 during the preceding 12 months (or for such shorter period that the registrant was required to file such reports), and (2) has been subject to such filing requirements for the past 90 days. Yes
þ
No
¨
Indicate by check mark whether the registrant has submitted electronically and posted on its corporate website, if any, every Interactive Data File required to be submitted and posted pursuant to Rule 405 of Regulation S-T (§232.405 of this chapter) during the preceding 12 months (or for such shorter period that the registrant was required to submit and post such files). Yes
þ
No
¨
Indicate by check mark if disclosure of delinquent filers pursuant to Item 405 of Regulation S-K is not contained herein, and will not be contained to the best of registrant’s knowledge, in definitive proxy or information statements incorporated by reference in Part III of this Form 10-K or any amendment to this Form 10-K.
¨
Indicate by check mark whether the registrant is a large accelerated filer, an accelerated filer, or a non-accelerated filer. See the definitions of “large accelerated filer” “accelerated filer” and “smaller reporting company” in Rule 12b-2 of the Exchange Act. (Check one):
|
Large accelerated filer
þ
|
|
Accelerated filer
o
|
|
Non-accelerated filer
o
|
|
Smaller reporting company
o
|
|
(Do not check if a smaller reporting company)
|
|
|
Indicate by check mark whether the registrant is a shell company (as defined in Rule 12b-2 of the Exchange Act). Yes
¨
No
þ
The aggregate market value of the registrant’s class A common stock, par value $0.0001 per share, held by non-affiliates (using the New York Stock Exchange closing price as of
March 29, 2013
, the last business day of the registrant’s most recently completed second fiscal quarter) was approximately
$87.8 billion
. There is currently no established public trading market for the registrant’s class B common stock, par value $0.0001 per share, or the registrant’s class C common stock, par value $0.0001 per share.
As of
November 15, 2013
, there were
506,590,408
shares outstanding of the registrant’s class A common stock, par value $0.0001 per share,
245,513,385
shares outstanding of the registrant’s class B common stock, par value $0.0001 per share, and
26,695,266
shares outstanding of the registrant’s class C common stock, par value $0.0001 per share.
DOCUMENTS INCORPORATED BY REFERENCE
Portions of the Registrant’s Proxy Statement for the 2013 Annual Meeting of Stockholders are incorporated herein by reference in Part III of this Annual Report on Form 10-K to the extent stated herein. Such Proxy Statement will be filed with the Securities and Exchange Commission within 120 days of the Registrant’s fiscal year ended September 30, 2013.
TABLE OF CONTENTS
|
|
|
Page
|
|
Item 1
|
||
|
Item 1A
|
||
|
Item 1B
|
||
|
Item 2
|
||
|
Item 3
|
||
|
Item 4
|
||
|
Item 5
|
||
|
Item 6
|
||
|
Item 7
|
||
|
Item 7A
|
||
|
Item 8
|
||
|
Item 9
|
||
|
Item 9A
|
||
|
Item 9B
|
||
|
Item 10
|
||
|
Item 11
|
||
|
Item 12
|
||
|
Item 13
|
||
|
Item 14
|
||
|
Item 15
|
||
Unless the context indicates otherwise, reference to "Visa," "Company," "we," "us" or "our" refers to Visa Inc. and its subsidiaries.
"Visa" and our other trademarks referenced in this report are Visa's property. This report may contain additional trade names and trademarks of other companies. The use or display of other companies' trade names or trademarks does not imply our endorsement or sponsorship of, or a relationship with these companies.
2
Forward-Looking Statements:
This Annual Report on Form 10-K contains forward-looking statements within the meaning of the U.S. Private Securities Litigation Reform Act of 1995. Forward-looking statements generally are identified by words such as "believes," "estimates," "expects," "intends," "may," "projects," "could," "should," "will," "will continue" and other similar expressions. Examples of forward-looking statements include, but are not limited to, statements we make about our revenue, client incentives, operating margin, earnings per share, free cash flow, and the growth of those items.
By their nature, forward-looking statements: (i) speak only as of the date they are made; (ii) are not statements of historical fact or guarantees of future performance; and (iii) are subject to risks, uncertainties, assumptions or changes in circumstances that are difficult to predict or quantify. Therefore, actual results could differ materially and adversely from our forward-looking statements due to a variety of factors, including the following:
|
•
|
the impact of laws, regulations and marketplace barriers, including:
|
|
•
|
rules capping debit interchange reimbursement rates and expanding financial institutions' and merchants' choices among debit payment networks promulgated under the Dodd-Frank Wall Street Reform and Consumer Protection Act;
|
|
•
|
increased regulation in jurisdictions outside of the United States and in other product categories;
|
|
•
|
increased government support of national payment networks outside the United States; and
|
|
•
|
increased regulation on consumer privacy, data use and security;
|
|
•
|
developments in litigation and government enforcement, including those affecting interchange reimbursement fees, antitrust and tax;
|
|
•
|
new lawsuits, investigations or proceedings, or changes to our potential exposure in connection with pending lawsuits, investigations or proceedings;
|
|
•
|
economic factors, such as:
|
|
•
|
economic fragility in the Eurozone and the United States;
|
|
•
|
general economic, political and social conditions in mature and emerging markets globally;
|
|
•
|
material changes in cross-border activity, foreign exchange controls and fluctuations in currency exchange rates; and
|
|
•
|
material changes in our financial institution clients' performance compared to our estimates;
|
|
•
|
industry developments, such as competitive pressure, rapid technological developments and disintermediation from our payments network;
|
|
•
|
system developments, such as:
|
|
•
|
disruption of our transaction processing systems or the inability to process transactions efficiently;
|
|
•
|
account data breaches or increased fraudulent or other illegal activities involving Visa-branded cards or payment products; and
|
|
•
|
failure to maintain systems interoperability with Visa Europe;
|
|
•
|
costs arising if Visa Europe were to exercise its right to require us to acquire all of its outstanding stock;
|
|
•
|
the loss of organizational effectiveness or key employees;
|
|
•
|
the failure to integrate acquisitions successfully or to effectively develop new products and businesses;
|
|
•
|
natural disasters, terrorist attacks, military or political conflicts, and public health emergencies; and
|
various other factors discussed throughout this report, including but not limited to,
Item 1—Business
,
Item1A—Risk Factors
and
Item 7—Management's Discussion and Analysis of Financial Condition and Results of Operations
. You should not place undue reliance on such statements. Except as required by law, we do not intend to update or revise any forward-looking statements as a result of new information, future developments or otherwise.
3
|
ITEM 1.
|
Business
|
General Business Development
Visa Inc., which we refer to as Visa or the Company, is a global payments technology company that connects consumers, businesses, financial institutions and governments in more than 200 countries and territories to fast, secure and reliable electronic payments. We operate one of the world's most advanced processing networks —VisaNet — which facilitates authorization, clearing and settlement of payment transactions worldwide. It also offers fraud protection for account holders and assured payment for merchants. Visa is not a bank and does not issue cards, extend credit or set rates and fees for account holders on Visa-branded cards and payment products. In most cases, account holder and merchant relationships belong to, and are managed by, our financial institution clients.
Visa Inc. was incorporated in the State of Delaware in May 2007. In October 2007, we undertook a reorganization in which Visa U.S.A. Inc., Visa International Service Association, Visa Canada Corporation and Inovant LLC became direct or indirect subsidiaries of Visa Inc. Visa Europe Limited remains owned and governed by its European member financial institutions and is not a subsidiary of Visa Inc. Visa Inc. completed its initial public offering ("IPO") in March 2008.
Since fiscal 2010, we have completed several acquisitions to accelerate the growth of Visa's digital, eCommerce and mobile commerce offerings. These include: CyberSource Corporation, a leading provider of electronic payment, risk management and payment security solutions to online merchants; PlaySpan Inc., a leading provider of digital goods transactions in online games, digital media and social networks; and Fundamo, a leading provider of mobile financial services for mobile network operators and financial institutions in developing economies.
Business developments in fiscal 2013 included the following:
|
•
|
Leadership
. Charles W. Scharf joined the Company as Chief Executive Officer and became a member of our board of directors on November 1, 2012. Ryan McInerney joined the Company as President on June 3, 2013.
|
|
•
|
Product innovation
. Visa’s fundamental approach to innovation focuses on enhancing our current product platforms, enabling more Visa transactions in every channel, and extending the utility of our products and services to additional access points, such as eCommerce and mobile, new merchant segments and new geographies. We continue to invest in the development of eCommerce and mobile payment platforms, contact and contactless chip cards and devices, card product enhancements, authentication and security technologies and platforms, and money transfers.
|
In mature markets, Visa continues to expand in digital channels. V.me, Visa’s digital wallet service and acceptance mark, is now commercially available in the United States where it is featured on more than fifty merchant sites, and has also launched in Australia and Canada. We have also licensed payWave, Visa's mobile NFC payment technology, to third-party wallet providers to help ensure their solutions are enabled with Visa's payment functionality, and we have signed agreements with several mobile operators to extend payment functionality to their mobile subscribers. In addition, we continue to certify NFC-enabled smartphones from device manufacturers for use with payWave, and we have partnered with Samsung to preload payWave on Samsung’s NFC-enabled smartphones. To further support the enablement of NFC, Visa also offers the Visa Mobile Provisioning service — a solution that enables banks and mobile operators to securely provision mobile payment accounts on NFC-enabled smartphones.
In emerging markets, Visa is helping to expand electronic payment services to the unbanked and underserved. Visa introduced the world’s first bank-grade managed service, making it easy and cost-efficient for financial institutions and mobile operators to offer mobile financial services to their consumers. Visa’s new managed service solution already enables mobile money programs in India and Rwanda.
4
|
•
|
Client contracts.
In 2013, we partnered with one of our largest financial institution clients to customize a processing solution using VisaNet that is designed to accelerate the growth of electronic payments, deliver added value to merchants and provide a better experience for account holders.
|
|
•
|
Regulation
. Rules were implemented in the United States during 2011 and 2012 with respect to debit products under the Dodd-Frank Wall Street Reform and Consumer Protection Act (the "Dodd-Frank Act"), which regulates, among other things, debit interchange reimbursements rates, the availability of debit networks, financial institutions' and merchants' choices among these networks, and transaction routing. As a result, we have significantly modified our debit strategy and continue to renegotiate some portions of our contracts with our financial institution clients. In July 2013, a federal court invalidated these rules and ordered the U.S. Federal Reserve to revise them. However, that order has been stayed, and the rules have been left in place, pending the resolution of an expedited appeal filed by the Federal Reserve to the federal appeals court. See
Government Regulation
below.
|
|
•
|
Interchange multidistrict litigation settlement
. In 2012, we reached a settlement in the interchange multidistrict litigation, subject to final court approval and the adjudication of any appeals. We believe that this settlement ensures the long-term health and competitiveness of the payments industry in the United States. Certain merchants in the proposed settlement classes, however, have objected to the settlement and a number of merchants have filed opt-out claims. See
Item 1A—Risk Factors—Our retrospective responsibility plan may not adequately insulate us from the impact of settlements or final judgments
and
Item 8—Financial Statements and Supplementary Data
—
Note 20—Legal Matters
included elsewhere in this report.
|
Nature of Operations
Visa's mission is to accelerate the electronification of commerce. We operate an open-loop payments network in which Visa connects and manages the exchange of information and value between: (i) issuers — financial institutions that issue Visa-branded cards or payment products to account holders, and (ii) acquirers — financial institutions that contract with merchants to accept Visa-branded cards or payment products. We do not earn revenues from, or bear credit risk with respect to, interest or fees paid by account holders on Visa-branded cards or payment products. The issuers have the responsibility for issuing cards and other payment products, and determining the interest rates and fees paid by the account holders.
Interchange reimbursement fees represent a transfer of value between the financial institutions participating in our open-loop payments network. On purchase transactions, interchange reimbursement fees are paid by the acquirers to the issuers. We generally do not receive any revenue related to interchange reimbursement fees. In addition, we generally do not earn any revenue from the fees that merchants are charged for acceptance by the acquirers, including the merchant discount rate. The acquirers are typically responsible for soliciting merchants, and establishing and earning these fees.
5
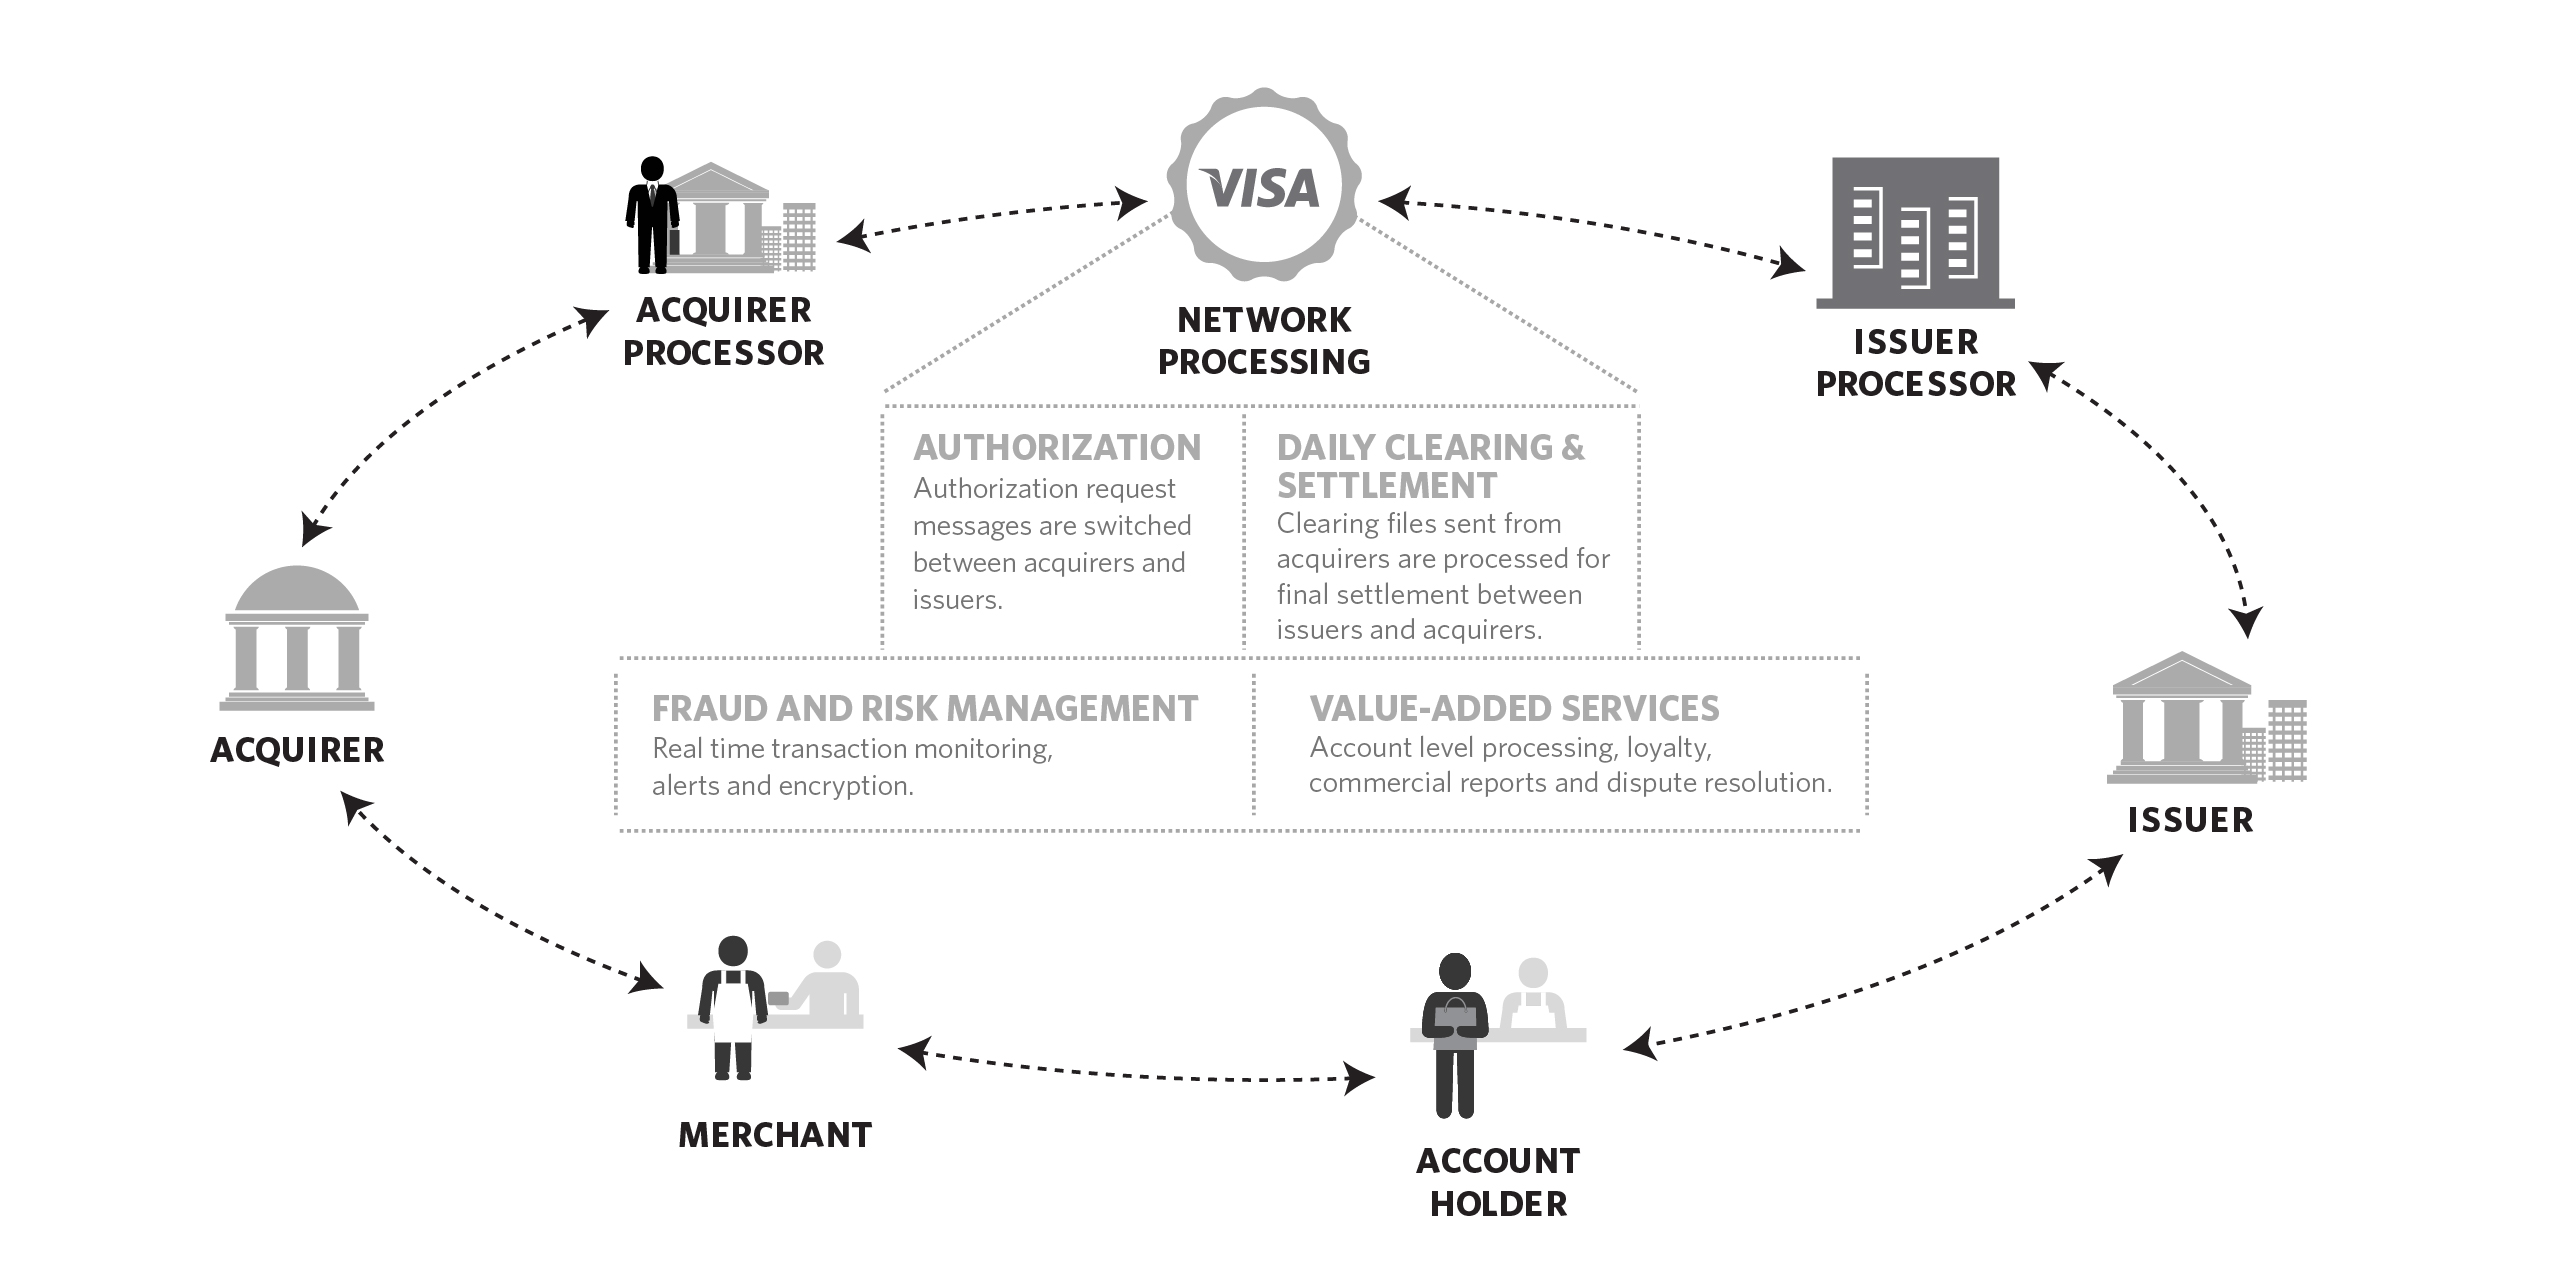
A typical Visa transaction begins when the account holder presents his or her Visa-branded card or payment product to a merchant as payment for goods or services. The transaction information is then transmitted electronically to the acquirer and routed through VisaNet to the issuer for authorization. Following authorization, a clearing file containing the final transaction data is submitted from the acquirer and processed for final settlement between the issuer and acquirer. The following diagram illustrates the processing steps involved in a typical transaction on VisaNet.
Our operating revenues are comprised principally of service revenues, data processing revenues and international transaction revenues, and are reduced by costs incurred under client incentive arrangements. The Company has one reportable segment, Payment Services.
|
•
|
Service revenues.
Service revenues consist of revenues earned for providing financial institution clients with support services for the delivery of Visa-branded payment products and solutions. Service revenues are primarily generated from payments volume on Visa-branded cards and payment products for purchased goods and services.
|
|
•
|
Data processing revenues.
Data processing revenues
consist of revenues earned for authorization, clearing, settlement, network access and other maintenance and support services that facilitate transaction and information processing among our financial institution clients globally and with Visa Europe. Data processing revenues are primarily generated from the number of transactions we process.
|
|
•
|
International transaction revenues.
International transaction revenues consist of revenues earned for cross-border transaction processing and currency conversion activities. Cross-border transactions arise when the country of origin of the issuer is different from that of the merchant. International transaction revenues are primarily generated by cross-border payments and cash volume.
|
|
•
|
Client incentives.
Client incentives consist of long-term contracts with financial institution clients and other business partners for various programs designed to build payments volume, increase Visa-branded card and product acceptance and win merchant routing transactions over our network. These incentives are primarily accounted for as reductions to operating revenues.
|
Although U.S. dollar settlements are settled within the same day and typically do not result in a receivable or payable balance, settlement currencies other than the U.S. dollar generally remain outstanding for one to two business days, resulting in amounts due from and to financial institution clients. These amounts are presented as settlement receivable and settlement payable on our consolidated balance sheets, respectively.
In order to maintain the integrity of and minimize disruptions to our payments network, we indemnify our financial institution clients for settlement losses suffered due to the failure of any other client to honor Visa-branded
6
cards and payment products processed in accordance with our operating regulations. The settlement indemnification applies to the amount of Visa payment transactions that have occurred, but have not yet settled. We maintain and regularly review global settlement risk policies and procedures to manage settlement exposure, which may require clients to post collateral if certain credit standards are not met. Cash equivalents collateral is reflected in customer collateral on our consolidated balance sheets as it is held in escrow in our name. All other collateral is excluded from the consolidated balance sheets. During the past ten years, Visa has incurred only one settlement indemnification loss for fifty thousand dollars in 2004.
Core Products and Services
Visa provides a wide variety of payment solutions that support payment products that issuers can offer to their account holders: (i) pay now with debit; (ii) pay ahead with prepaid; or (iii) pay later with credit products. Visa also offers a growing suite of innovative digital, eCommerce and mobile products and services. These services facilitate transactions on our network among account holders, merchants, financial institutions and governments in mature and emerging markets globally.
|
•
|
Debit
. Our debit payment solutions support issuers' payment products that draw on demand deposit accounts, such as checking accounts.
|
|
•
|
Prepaid.
Our prepaid payment solutions support issuers' payment products that access a pre-funded amount, allowing account holders to enjoy the convenience and security of a payment card in lieu of cash or checks.
|
|
•
|
Credit.
Our credit payment solutions support issuers' deferred payment and customized financing products.
|
Our core processing services involve the routing of payment information and related data to facilitate the authorization, clearing and settlement of transactions between our issuers and acquirers. VisaNet is built on a centralized architecture, enabling us to view and analyze each authorization transaction we process in real time and to provide value-added services, including information products, such as risk scoring and loyalty applications, while the transaction data is being routed through our network.
Visa's processing services continue to expand to address the needs of all participants in the evolving payments ecosystem, through such offerings as our merchant gateway and Visa Debit Processing Services ("DPS"). Merchant gateway services provided through our CyberSource subsidiaries enable gateway routing and other services that make it easier for eCommerce merchants to accept, process and reconcile payments, manage fraud and safeguard payment security online. DPS provides comprehensive issuer processing services for participating issuers of Visa debit, prepaid and ATM payment products. These and other services support our financial institution clients and their use of our products, and promote the growth and security of our payments network.
Processing Infrastructure
VisaNet consists of multiple synchronized processing centers, including two data centers in the United States, which are linked by a global telecommunications network and are engineered for redundancy. In addition, in accordance with the terms of the Framework Agreement among Visa Inc., Visa Europe Limited and others, Visa Europe's processing centers in the United Kingdom must maintain interoperability with Visa's synchronized system. Intelligent access points around the world complete the VisaNet global processing infrastructure and enable merchants and financial institutions worldwide to access our core processing and value-added services.
Visa also owns and manages additional data centers in the United States and internationally, including those we added with our acquisitions of CyberSource and PlaySpan. These facilities enable transaction services and provide uninterrupted connectivity for account holders, our financial institution clients and our processing partners.
Intellectual Property
Our portfolio of trademarks, in particular our Visa, Plus, the “Winged V” design and the “Dove” design marks are important to our business. Through agreements with our financial institution clients, we authorize the use of some of our trademarks in connection with their participation in our payments network. We own a number of patents and patent applications relating to payment solutions, transaction processing, security systems and other matters. We rely on a combination of patent, trademark, copyright and trade secret laws in the United States and other jurisdictions, as well as confidentiality procedures and contractual provisions, to protect our proprietary technology.
7
Seasonality
We generally do not experience any pronounced seasonality in our business. No individual quarter of fiscal 2013 or fiscal 2012 accounted for more than 30% of our operating revenues in those years.
Working Capital
Payments settlement due from and to our financial institution clients can represent a substantial daily working capital requirement. U.S. dollar settlements are typically settled within the same day and do not result in a receivable or payable balance, while settlement currencies other than the U.S. dollar generally remain outstanding for one to two business days, which is consistent with industry practice for such transactions.
Concentration of Business and Financial Information About Geographic Areas
For more information on the concentration of our operating revenues and other financial information, see
Item 8
—
Financial Statements and Supplementary Data
—
Note 13—Enterprise-wide Disclosures and Concentration of Business
included elsewhere in this report.
Competition
We compete in the global payment marketplace against all forms of payment. These include:
|
•
|
paper-based payments, principally cash and checks;
|
|
•
|
card-based payments, including credit, charge, debit, ATM, prepaid and private-label products;
|
|
•
|
eCommerce and mobile-based payments; and
|
|
•
|
other electronic payments, including wire transfers, electronic benefits transfers, automated clearing house ("ACH"), and electronic data interchange.
|
Based on payments volume, total volume and number of transactions, Visa is the largest retail electronic payments network in the world. The following chart compares our network with those of our major general purpose payment network competitors for calendar year 2012:
|
Company
|
Payments
Volume
|
Total
Volume
|
Total
Transactions
|
Cards
|
||||||||||
|
|
(billions)
|
(billions)
|
(billions)
|
(millions)
|
||||||||||
|
Visa Inc.
(1)
|
$
|
4,018
|
|
$
|
6,409
|
|
81.6
|
|
2,128
|
|
||||
|
MasterCard
(2)
|
$
|
2,693
|
|
$
|
3,647
|
|
46.3
|
|
1,158
|
|
||||
|
American Express
(2)
|
$
|
884
|
|
$
|
888
|
|
5.9
|
|
102
|
|
||||
|
Discover
(2)
|
$
|
122
|
|
$
|
130
|
|
2.1
|
|
62
|
|
||||
|
JCB
(2)
|
$
|
179
|
|
$
|
186
|
|
1.6
|
|
79
|
|
||||
|
Diners Club
(2)
|
$
|
27
|
|
$
|
28
|
|
0.2
|
|
6
|
|
||||
|
(1)
|
The data presented is provided by our financial institution clients. Previously submitted information may be updated and all data is subject to review by Visa.
|
|
(2)
|
MasterCard, American Express, JCB and Diners Club data sourced from The Nilson Report issue 1014 (March 2013) and Discover data sourced from The Nilson Report issue 1009 (January 2013). Includes all consumer and commercial credit, debit and prepaid cards. Some figures are estimates and currency figures are in U.S. dollars. MasterCard excludes Maestro and Cirrus figures. American Express includes figures for third-party issuers. Discover figures consist of U.S. data only and include third-party issuers. JCB figures include third-party issuers and other payment-related products.
|
Certain general purpose payment network competitors are more concentrated in specific geographic regions, such as JCB in Japan and Discover in the United States. Our competitors also have leading positions in certain countries. For example, China UnionPay remains the sole processor of domestic transactions and operates the sole domestic acceptance mark in China.
In the global debit network market segment, our Interlink and Visa Electron brands compete with Maestro, owned by MasterCard, and various regional and country-specific debit network brands, including STAR, NYCE and PULSE in the United States, EFTPOS in Australia, NETS in Singapore and Interac in Canada. In addition to our PLUS brand, the primary cash access card brands are Cirrus, owned by MasterCard, and many of the debit
8
network brands referenced above. In many countries, local debit brands provide the primary network, and our brands are used primarily to enable cross-border transactions, which typically constitute a small portion of our overall transaction volume.
The global payments industry continues to undergo dynamic change. We may face increasing competition from emerging players in the payment space, many of which are non-financial institution networks that have departed from the more traditional business model. The emergence of these potentially competitive networks has primarily been via the online channel with a focus on eCommerce and/or mobile technologies. PayPal, Google and Isis are examples. These providers compete with us directly in some cases, yet may also be significant partners and customers of ours.
We also face increasingly intense competitive pressure on the prices we charge our financial institution clients. We believe our fundamental value proposition of convenience, interoperability, accessibility and security offers us a key competitive advantage. We succeed in part because we understand the needs of the individual markets in which we operate. We do so by partnering with local financial institutions, merchants, governments, non-governmental organizations and business organizations to provide tailored solutions to meet their varied needs. We believe Visa is well-positioned competitively, due to our global brand, our broad set of Visa-branded payment products and our proven track record of processing payment transactions securely and reliably through VisaNet.
Employees
At September 30, 2013, we employed approximately 9,500 persons worldwide. We consider our relationships with our employees to be good.
Government Regulation
Interchange reimbursement fees
. We have historically set default debit interchange reimbursement rates in the United States and many other geographies. During fiscal 2012, the Federal Reserve implemented new rules under the Dodd-Frank Act, setting a cap on the maximum U.S. debit interchange reimbursement fee assessed for debit products issued by large financial institutions. These rules continue to have an adverse impact on our pricing, reduce the number and volume of U.S. debit transactions we process and decrease our associated revenues. As a result, we have significantly modified our debit strategy and continue to renegotiate some portions of our contracts with our financial institution clients. In July 2013, a federal court invalidated the newly implemented rules, finding that the Federal Reserve improperly considered certain costs in setting a cap on the maximum debit interchange reimbursement rate and that issuers must make at least two unaffiliated networks available for processing each electronic debit transaction, regardless of authorization method. Although the court ordered the Federal Reserve to revise the rules, it stayed that order, and the rules have been left in place pending the resolution of an expedited appeal filed by the Federal Reserve to the federal appeals court. See
Item 1A—Risk Factors—The Dodd-Frank Act may continue to have a material, adverse impact on our financial condition, revenues, results of operations, prospects for future growth and overall business
and
Item 7
—
Management's Discussion and Analysis of Financial Condition and Results of Operations
—
Overview
included elsewhere in this report.
Certain jurisdictions outside the United States also regulate debit interchange reimbursement rates in their regions. For example, the Reserve Bank of Australia regulates interchange reimbursement rates. In some jurisdictions, such as India, the governing authorities have begun to regulate other rates or practices such as the merchant discount rate. See
Item 1A—Risk Factors—Additional regulation of interchange reimbursement rates may have a material, adverse impact on our financial condition, revenues, results of operations, prospects for future growth and overall business
and
Item 8
—
Financial Statements and Supplementary Data
—
Note 20—Legal Matters
included elsewhere in this report.
Network exclusivity and routing
. We have historically had agreements under which issuers received incentives if they agreed to issue Visa-branded cards or payment products that are processed through VisaNet. Historically, issuers of some debit products outside the United States have chosen to include only our network. These various practices are referred to as network exclusivity. The Dodd-Frank Act limits the issuers' and our ability to impose rules for, or choose various forms of, network exclusivity and preferred routing in the U.S. debit network market segment. Other jurisdictions have enacted similar limitations. See
Item 1A—Risk Factors—The Dodd-Frank Act may continue to have a material, adverse impact on our financial condition, revenues, results of operations, prospects for future growth and overall business
included elsewhere in this report.
9
U.S. Consumer Financial Protection Bureau
. The Dodd-Frank Act created an independent Consumer Financial Protection Bureau with responsibility for most federal consumer protection laws in the area of financial services and new authority with respect to consumer protection issues, including those pertaining to us to some extent. The Bureau's future actions may make payment card or product transactions generally less attractive to issuers, acquirers, consumers and merchants.
No-surcharge rules
. We have historically implemented rules that prohibit merchants from charging higher prices to consumers who pay using their Visa-branded card or payment product instead of other means. As part of the settlement reached in the interchange multidistrict litigation, however, Visa has agreed to modifications of our rules to permit surcharging on credit transactions under certain circumstances. See
Item 8
—
Financial Statements and Supplementary Data
—
Note 20—Legal Matters
included elsewhere in this report. Eleven U.S. states as well as certain jurisdictions outside the United States have taken steps to limit these no-surcharge rules. In October 2013, a federal court granted declaratory relief and issued an order permanently enjoining the enforcement of New York's no-surcharge law, N.Y. Gen. Bus. Law section 518, based on the entry of a stipulated final judgment in a case brought by five retailers challenging the constitutionality of that law.
Data protection and information security
. In accordance with governing law, we devote substantial resources to maintain and continually refine our information security program in order to safeguard account holder information and provide account holder notification in the event of a security breach. In addition, the U.S. Federal Financial Institutions Examination Council periodically reviews certain of our operations in the United States to examine our compliance with data integrity, security and operational requirements and standards, as well as other requirements applicable to us because of our role as a service provider to financial institutions.
Anti-money laundering, anti-terrorism and sanctioned countries
. We are subject to increasingly expanding legal and regulatory requirements intended to help detect and prevent money laundering, terrorist financing, fraud and other illicit activity. We devote substantial internal and external resources and have implemented programs that are designed to prevent the use of our payments network in facilitating such illegal activity. In addition, some of our products and services may be subject to regulations promulgated and administered by the U.S. Department of the Treasury, Office of Foreign Assets Control ("OFAC"). These programs prohibit or restrict dealings with certain countries, their governments and, in certain circumstances, their nationals, as well as with specifically-designated individuals and entities such as narcotics traffickers, terrorists and terrorist organizations. We have developed and implemented policies, procedures, systems and internal controls that are designed to comply with OFAC requirements and comparable sanctions programs.
Government-imposed market participation influences and restrictions
. Our market reach remains limited by certain governments' influence on their domestic payments competition and/or their protection of domestic issuers or payment network processors. Regulators in an increasing number of countries around the world have received statutory authority to regulate certain aspects of the payments systems in these countries.
Regulation of Internet transactions.
Many jurisdictions have adopted or are considering regulations that require payments system participants, including our financial institution clients and us, to monitor, identify, filter, restrict or take other specific actions with regard to certain types of Internet payment transactions. For example, U.S. federal legislation has been enacted that requires payment system operators to implement a system that allows issuers to identify Internet gambling transactions so they have the option to decline such transaction requests. State governments have been interested in the potential blocking of Internet interstate sales of cigarettes and alcohol, or the collection of state and local sales taxes on such Internet purchases. Implementing such systems increases costs for our financial institution clients and us, and may reduce merchant acceptance of Visa-branded cards and payment products for these purchases.
The U.S. Congress continues to consider regulatory initiatives in the areas of Internet prescription drug purchases, copyright and trademark infringement and privacy, among others, that could impose additional compliance burdens on our financial institution clients and us. Some U.S. states are considering a variety of similar legislation. Various regulatory agencies also continue to examine a wide variety of issues, including identity theft, account management guidelines, privacy, disclosure rules, security and marketing that could affect our financial institution clients directly. These new requirements and developments may affect our financial institution clients' ability to offer existing products and services, extend credit via payment cards and products, and offer new types of payment programs, which could decrease our transaction volumes and revenues.
10
Available Information
We are subject to the reporting requirements of the Securities Exchange Act of 1934, as amended (the "Exchange Act") and its rules and regulations. The Exchange Act requires us to file periodic reports, proxy statements and other information with the U.S. Securities and Exchange Commission (the "SEC"). Copies of these reports, proxy statements and other information can be viewed at
http://www.sec.gov
or at the SEC Public Reference Room at 100 F Street, NE, Washington, D.C. 20549. Information on the operation of the Public Reference Room may be obtained by calling the SEC at 1-800-SEC-0330.
Our corporate website is accessible at
http://www.corporate.visa.com
. We make available, free of charge, on our investor relations website at
http://investor.visa.com
our annual reports on Form 10-K, our quarterly reports on Form 10-Q, our current reports on Form 8-K and any amendments to those reports as soon as reasonably practicable after they are electronically filed with, or furnished to, the SEC. The information contained on our corporate website, including the information contained on our investor relations website, is not incorporated by reference into this report or any other report filed with, or furnished to, the SEC.
Regulatory Risks
Additional regulation of interchange reimbursement rates may have a material, adverse impact on our financial condition, revenues, results of operations, prospects for future growth and overall business
.
We generally do not receive any revenue related to interchange reimbursement fees in a purchase transaction as those fees are paid by the acquirers to the issuers. They are, however, a factor on which we compete with other payments providers and are therefore an important determinant of the volume of transactions we process. Consequently, changes to these fees can substantially affect our revenues and the pace or breadth of overall payment electronification.
We have historically set default debit interchange reimbursement rates in the United States and many other geographies. However, the Dodd-Frank Act has limited our ability to establish default debit interchange reimbursement rates in the United States. See
—
The Dodd-Frank Act may continue to have a material, adverse impact on our financial condition, revenues, results of operations, prospects for future growth and overall business
. Interchange reimbursement rates have also become subject to continued or increased government regulation elsewhere, and regulatory authorities and central banks in a number of jurisdictions have reviewed or are reviewing these rates. In certain jurisdictions, interchange reimbursement rates, our operating regulations and related practices are subject to continuing or increased government regulation. These jurisdictions include, for example, Australia, Canada, Brazil, Europe, India, Malaysia, Russia and South Africa.
When we cannot set default interchange reimbursement rates at optimal levels, issuers and acquirers find our payments system less attractive. This lowers overall transaction volume and slows growth of transactions. It also may increase the attractiveness of other payments systems like competitors' closed-loop payments systems with direct connections to both merchants and consumers. In addition, we believe some issuers are charging new or higher fees to consumers. In some instances, this makes Visa-branded cards and payment products less desirable and reduces our transaction volumes and profitability. Some acquirers elect to charge higher discount rates to merchants, regardless of the level of Visa interchange reimbursement rate, leading merchants not to accept Visa-branded cards or payment products for payment or to steer account holders to alternate payment systems. In addition, some issuers and acquirers have obtained, and may continue to obtain, incentives from us and reductions in the rates that we charge in an effort to reduce the expense of their card programs. For these reasons, additional regulation of interchange reimbursement rates may have a material, adverse impact on our financial condition, revenues, results of operations, prospects for future growth and overall business.
Additional regulations that prohibit us from contracting with clients or requiring them to use only our network, or that deny them the option of selecting only our network, may decrease the number of transactions we process, and materially and adversely affect our financial condition, revenues, results of operations, prospects for future growth and overall business
.
In order to provide account holders a consistent experience and transparency into the network processing their transactions, we promote certain practices to ensure that Visa-branded cards are processed over our network. We have historically had agreements with some issuers under which they agree to issue certain payment cards that use
11
only the Visa network or receive incentives if they do so. In addition, certain issuers of some products have historically chosen to include only our network. We refer to these various practices as network exclusivity.
In addition, certain network or issuer rules or practices may be viewed as limiting the routing options of merchants when multiple debit networks co-reside on Visa debit cards. For example, Visa's rules require that an acquirer must process authorizations for all international transactions through VisaNet and that a member must clear international transactions through VisaNet. These are commonly referred to as routing rules.
The Dodd-Frank Act already limits our and issuers' ability to adopt network exclusivity and preferred routing in the debit area. See —
The Dodd-Frank Act may continue to have a material, adverse impact on our financial condition, revenues, results of operations, prospects for future growth and overall business
. Additional regulations like the Dodd-Frank Act in the United States and elsewhere could materially decrease the number of transactions we process. In order to retain that transaction volume, we would have to reduce the fees we charge to issuers or acquirers or increase the payments and other incentives we provide to issuers, acquirers or merchants. Any of these eventualities could have a material, adverse effect on our financial condition, revenues, results of operations, prospects for future growth and overall business.
The Dodd-Frank Act may continue to have a material, adverse impact on our financial condition, revenues, results of operations, prospects for future growth and overall business
.
As of October 1, 2011, in accordance with the Dodd-Frank Act, the Federal Reserve capped the maximum U.S. debit interchange reimbursement rate charged by large financial institutions at twenty-one cents plus five basis points, before applying an interim fraud adjustment up to an additional one cent. This amounted to a significant reduction from the average system-wide fees charged previously. The Federal Reserve also issued regulations requiring issuers to make at least two unaffiliated networks available for processing debit transactions on each debit card. The rules also prohibit us and issuers from restricting a merchant's ability to direct the routing of electronic debit transactions over any of the networks that an issuer has enabled to process those transactions.
In July 2013, a federal court invalidated these rules, finding that the Federal Reserve improperly considered certain costs in setting a cap on the maximum U.S. debit interchange reimbursement rate and that issuers must make at least two unaffiliated networks available for processing each electronic debit transaction, regardless of authorization method. The Federal Reserve has appealed that ruling. These regulations have adversely affected our U.S. debit business and associated revenues by creating negative pressure on our pricing, reduced the volume and number of U.S. debit payments we process, and diminished associated revenues. Although we believe we have absorbed the principal impact of the regulations as issued in October 2011, our business could continue to be affected, including if the Federal Reserve must issue new regulations.
These pressures have arisen through various channels. A number of our clients obtained fee reductions or increased incentives from us to offset their own lost revenue. Some reduced the number of debit cards they issued and investments they made in marketing and rewards programs. Some imposed new or higher fees on debit cards or demand deposit account relationships. Some elected to issue fewer cards enabled with Visa-affiliated networks. Many merchants have used the routing regulations to redirect transactions or steer account holders to other networks based on lowest cost or other factors. Other clients and merchants are likely to take similar actions in the future.
The Dodd-Frank Act created an independent Consumer Financial Protection Bureau, with responsibility for most federal consumer protection laws in the area of financial services and new authority with respect to consumer protection issues, including those pertaining to us to some extent. These actions may make payment card transactions less attractive to issuers, consumers and merchants by further regulating disclosures, payment card practices, fees, routing and other matters with respect to credit, debit and prepaid cards.
Some elements of the Dodd-Frank Act lack definition and create the potential for networks to pursue different strategies subject to their interpretation of the rules. Our interpretation may result in a pursuit of strategies that may be less effective than those of our competitors. Overall, the regulations and developments arising from the Dodd-Frank Act could continue to have a material, adverse effect on our financial condition, revenues, results of operations, prospects for future growth and overall business.
New laws or regulations in one jurisdiction or of one product offering may lead to new laws or regulations in other jurisdictions or of other product offerings
.
12
Regulators around the world increasingly note each other's approaches to the regulation of the payments industry. Consequently, a development in one country, state or region may influence regulatory approaches in another. The Dodd-Frank Act and the European Union Commission
'
s draft interchange regulation are developments with such potential. Similarly, new laws and regulations involving one product offering may cause lawmakers there to extend the regulations to other product offerings. For example, regulations affecting debit payments could eventually spread to credit payments.
The risks created by a new law or regulation have the potential to be replicated and to negatively affect our business in another region or in other product offerings. As a result, we may face differing rules and regulations in matters like interchange reimbursement rates, network exclusivity, preferred routing, dynamic currency conversion, point of sale transaction rules and practices, and operating regulations that may differ from country to country or by product offering.
If widely varying regulations come into existence worldwide, we may have difficulty rapidly adjusting our product offerings, services and fees, and other important aspects of our business in the various regions. In addition, adverse developments, regulations and litigation with respect to our industry or another industry may also, by association, negatively impact our reputation, or result in greater regulatory or legislative scrutiny or litigation against us. Any of these factors could materially and adversely affect our business, financial condition and results of operations.
Government actions may prevent us from competing effectively against providers of domestic payments services in certain countries, which may materially and adversely affect our ability to maintain or increase our revenues and extend our global brands
.
Governments in some countries provide resources or protection to select their domestic payment card networks, brands and processors. These governments may impose regulatory requirements that favor domestic providers or that mandate domestic payments processing be done entirely in that country. For example, China UnionPay continues to enjoy advantages over international networks, remains the sole processor of domestic transactions and operates the sole domestic acceptance mark in China. These actions could impede us from utilizing our global processing capabilities for our financial institution clients in those countries and substantially restrict our activities there. These actions could also force us to leave countries where we presently have activity and keep us from entering new markets. Although we are trying to effect change in these countries, we may not succeed. This could adversely affect our ability to maintain or increase our revenues and extend our global brands.
Regulation in the areas of consumer privacy and data use and security could decrease the number of Visa-branded cards issued, our payments volume and our revenues
.
Privacy, data use and security continue to receive heightened legislative and regulatory focus in the United States and elsewhere. For example, in many jurisdictions consumers must be notified in the event of a data breach and those jurisdictions who have these laws are continuing to increase the circumstances and the breadth of these notices. These measures may increase our and our clients' costs. They may also decrease the number of Visa-branded cards our clients issue. This would materially and adversely affect our profitability. In addition, our failure or the failure of our clients to comply with these laws and regulations could result in fines, sanctions, litigation and damage to our global reputation and our brands.
Evolving and increased global regulatory focus on the payments industry may result in costly new compliance burdens on our clients and on us, leading to increased costs and decreased payments volume and revenues
.
Regulation of the payments industry has evolved and increased significantly. Examples include:
|
•
|
Data protection and information security
. Aspects of our operations and business are subject to privacy and data protection regulation in the United States and elsewhere. Our financial institution clients in the United States are subject to similar requirements under the guidelines issued by the federal banking agencies. In addition, many U.S. states have enacted legislation requiring consumer notification in the event of a security breach.
|
|
•
|
Regulatory compliance
. We are subject to anti-money laundering laws and regulations, including the Bank Secrecy Act, as amended, including the USA PATRIOT Act of 2001. In addition, we are also subject to the economic and trade sanctions programs administered by OFAC that prohibit or restrict dealings with certain countries, their governments and, in certain circumstances, their nationals, as well as with
|
13
specifically-designated individuals and entities such as narcotics traffickers, terrorists and terrorist organizations. Some of our clients located outside of the United States may not be subject to these same laws, regulations and sanctions, and, as a result, may initiate transactions that, while permissible in their countries, are not permissible in the United States. We have policies, procedures, systems and controls in place to identify and address potentially impermissible transactions but in the event these controls should fail, we could be subject to penalties, reputational damage and loss of business.
|
•
|
Regulation of the price of credit
. Many jurisdictions in which Visa-branded cards are used have regulations that could increase the costs of card issuance or decrease the flexibility of issuers to charge market-based interest rates and fees on credit card accounts. These include the Credit CARD Act of 2009 in the United States and other proposed regulations under it. Proposed changes to the Truth in Lending Act of 1968, if implemented along with regulations required to be promulgated under the Credit CARD Act, could result in a decrease in our payments volume and revenues.
|
|
•
|
Increased central bank oversight.
Several central banks around the world have increased, or are seeking to increase, their formal oversight of the retail electronic payments industry, in some cases considering designating them as "systemically important payment systems" or "critical infrastructure." Any such oversight may lead to additional regulations by central banks and other government regulators. These could include new settlement procedures, cyber security requirements or other operational rules to address credit and operational risks. They could also include new criteria for financial institution client participation and merchant access to our payments system.
|
|
•
|
Safety and soundness regulation
. Recent banking regulations enacted in the United States and elsewhere may make some financial institutions less attracted to becoming an issuer of Visa-branded cards, because they may be subject to increased risk management or higher capital requirements.
|
|
•
|
Regulation of Internet transactions
. Proposed legislation in various jurisdictions may make it less desirable or more costly to complete Internet transactions using Visa-branded cards by affecting the legality of those transactions, the laws that govern the transactions, their taxation or the allocation of various intellectual property rights.
|
|
•
|
Money transfer regulations.
As we expand our product offerings, we may become subject to U.S. state money transfer regulations, which could increase our regulatory oversight and compliance costs.
|
Complying with these and other regulations increases our costs and can reduce our revenue opportunities. Our programs and policies are designed to comply with anti-money laundering, anti-terrorism and sanctions regulations, and we continue to review and enhance them. But, as regulations continue to evolve and regulatory oversight continues to increase, we cannot guarantee that our programs and policies will be deemed compliant by all applicable regulatory authorities. The impact of such regulations on our clients and on us may increase compliance costs and reduce the volume of payments we process. Moreover, such regulations can limit the types of products and services that we offer, the countries in which Visa-branded cards are used and the types of account holders and merchants who can obtain or accept Visa-branded cards. Any of these occurrences could materially and adversely affect our business, prospects for future growth, financial condition and results of operations.
Litigation Risks
Our retrospective responsibility plan may not adequately insulate us from the impact of settlements or final judgments
.
Our retrospective responsibility plan addresses monetary liabilities from settlements of, or final judgments in, the covered litigation, which is described in
Note 3—Retrospective Responsibility Plan
to our consolidated financial statements included in
Item 8
of this report. The retrospective responsibility plan consists of several related mechanisms to fund settlements or judgments in the covered litigation. These include an escrow account funded with a portion of the net proceeds of our IPO and any subsequent offerings of our shares of class A common stock (or deposits of cash into the escrow account in lieu of such offerings). They also include a loss sharing agreement and a judgment sharing agreement. In addition, our U.S. financial institution clients are obligated to indemnify us pursuant to Visa U.S.A. Inc.'s certificate of incorporation and bylaws and in accordance with their membership agreements. These mechanisms are unique, complicated and tiered, and if we cannot use one or more of them, this could have a material adverse effect on our financial condition and cash flows, or even cause us to become insolvent.
14
The principal remaining covered litigation involves interchange reimbursement rates. Since 2005, approximately fifty-five complaints, all but thirteen of which were styled as class actions, have been filed on behalf of merchants against us, MasterCard and/or other defendants, including certain financial institutions that issue Visa-branded payment cards and acquire Visa-branded payment transactions in the United States. We refer to this as the interchange multidistrict litigation. Among other allegations, the plaintiffs have alleged that Visa's setting of default interchange reimbursement rates violated federal and state antitrust laws. The lawsuits were transferred to a multidistrict litigation in the U.S. District Court for the Eastern District of New York.
The plaintiffs in the interchange multidistrict litigation seek damages for alleged overcharges in merchant discount rates as well as injunctive and other relief. The consolidated class action complaint alleges that the plaintiffs estimate that damages will range in the tens of billions of dollars. Because these lawsuits were brought under the U.S. federal antitrust laws, any actual damages would be trebled.
The allocation of any monetary judgment or a settlement among the defendants is governed by an omnibus agreement dated February 7, 2011. See
Note 3—Retrospective Responsibility Plan
and
Note 20—Legal Matters
to our consolidated financial statements included in
Item 8
of this report. Visa's portion of a settlement or judgment covered by the omnibus agreement would be allocated in accordance with specified provisions of our retrospective responsibility plan.
On October 19, 2012, we signed settlement agreements in these cases, which included an agreement to pay approximately $4.0 billion to the class plaintiffs. The court granted preliminary approval of the settlement agreement with the class plaintiffs on November 9, 2012. However, the agreement with the class plaintiffs remains subject to final court approval and the adjudication of any appeals. We cannot assure that the court will provide final approval of the settlement or that we will win any appeals. On December 10, 2012, Visa paid approximately $4.0 billion from the litigation escrow account into a settlement fund established pursuant to the definitive class settlement agreement.
A number of merchants have filed opt-out cases in various federal district courts. Some of these cases have already been transferred by the Judicial Panel on Multidistrict Litigation for coordinated or consolidated pre-trial proceedings to MDL 1720 and will be covered litigation under the retrospective responsibility plan. It is possible that some opt-out cases may not be transferred or otherwise included in MDL 1720 and will not be covered litigation. See
Note 3—Retrospective Responsibility Plan
to our consolidated financial statements included in
Item 8
of this report
.
Failure of our retrospective responsibility plan to insulate us adequately from the impact of such settlements or judgments could result in a material adverse effect on our financial condition and cash flows. Such a failure could even cause us to become insolvent. The retrospective responsibility plan addresses only the covered litigation. The plan generally does not cover other pending litigation or any litigation that we may face in the future, except for cases that include claims for damages relating to the period prior to our IPO that are transferred for pre-trial proceedings or otherwise included in the interchange multidistrict litigation. See
—
If we are found liable in other pending or future lawsuits, we may have to pay substantial damages
. In addition, non-monetary settlement terms and judgments in the covered litigation may require us to modify the way we do business. See —
Limitations on our business resulting from litigation may materially and adversely affect our revenues and profitability
. Therefore, even if our retrospective responsibility plan provides us with adequate funding to satisfy our obligations with respect to monetary liabilities from settlements of, and judgments in, the covered litigation, it will not insulate us from the monetary impact of pending or future litigation.
If we are found liable in other pending or future lawsuits, we may have to pay substantial damages
.
Like many other large companies, we are a defendant in a number of civil actions and investigations alleging violations of competition/antitrust law, consumer protection law or intellectual property law, among others. Examples of such claims are described more fully in
Note 20—Legal Matters
to our consolidated financial statements included in
Item 8
of this report. Some lawsuits involve complex claims that are subject to substantial uncertainties and unspecified damages; therefore, we cannot ascertain the probability of loss or estimate our liability. Accordingly, we have not established allowances for such legal proceedings.
Particularly in cases involving merchants and consumers, private plaintiffs often seek class action certification in cases against us due to the size and scope of our business. If we are found liable in a large class action lawsuit, such as the U.S. or Canadian merchant class action lawsuits, monetary damages could be significant. See
Note 20—Legal Matters
to our consolidated financial statements included in
Item 8
of this report.
15
If we are unsuccessful in our defense against any material pending or future legal proceedings, we may have to pay substantial damages. This could result in a material and adverse effect on our results of operations, cash flow and financial condition and could even cause us to become insolvent.
Limitations on our business resulting from litigation may materially and adversely affect our revenues and profitability
.
Certain limitations have been placed on our business in recent years because of litigation. We may also have to change our business practices in response to pending or future litigation. For example, under the settlement agreement in the interchange multidistrict litigation, we have agreed, among other things, to permit merchants to add surcharges to credit transactions in certain circumstances.
These and other settlements of, or judgments in, past, pending and future litigation could force us to limit the rates we charge, revise our rules about rates charged to consumers who use Visa-branded payment products, or make other modifications to our business. These modifications could materially and adversely affect our payments volume, revenues, operating results, prospects for future growth and overall business.
Tax examinations or disputes, or changes in the tax laws applicable to us, could materially increase our tax payments
.
We exercise significant judgment in calculating our worldwide provision for income taxes and other tax liabilities. Although we believe our tax estimates are reasonable, many factors may decrease their accuracy. We are currently under examination by the U.S. Internal Revenue Service and other tax authorities, and we may be subject to additional examinations in the future. Relevant tax authorities may disagree with our tax treatment of certain material items and thereby increase our tax liability. Failure to sustain our position in these matters could result in a material, adverse effect on our cash flow and financial position. In addition, changes in existing laws, such as recent proposals for fundamental U.S. and international tax reform, may also increase our effective tax rate. A substantial increase in our tax burden could have a material, adverse effect on our financial results. See also
Note 19—Income Taxes
to our consolidated financial statements included in
Item 8
of this report.
We have limited rights to enforce our agreement with Visa Europe, which includes indemnity obligations that could expose us to significant liabilities
.
In the event Visa Europe fails to meet its obligations under the Framework Agreement, our remedies are limited. We are unable to terminate the agreement even upon Visa Europe's material, uncured breach. We also have a call option to acquire Visa Europe, which can be triggered only under extremely limited circumstances. See
Note 2—Visa Europe
to our consolidated financial statements included in
Item 8
of this report.
Visa Europe is obligated to indemnify Visa Inc. and Visa International Service Association ("Visa International") in connection with the European Competition Proceedings, in our opinion, including payment of any fines that may be imposed. However, Visa Europe has expressed an "initial" view that it is not obligated to indemnify Visa Inc. or Visa International for any claim in the European Competition Proceedings, including claims asserted in both the European Commission matter and the U.K. Merchant Litigation. If Visa Europe continues in its refusal to indemnify us and we cannot enforce the indemnity, we could be exposed to significant liabilities which would not be covered under our retrospective responsibility plan. See
Note 20—Legal Matters
to our consolidated financial statements included in
Item 8
of this report.
In addition, under the Framework Agreement, we may be required to indemnify Visa Europe for losses resulting from all claims outside its region arising from our or their actions relating to the payments business. This obligation applies even if neither we nor any of our related parties or agents engaged in the actions giving rise to such claims. The indemnity obligation could expose us to significant liabilities for activities over which we have little or no control. Our retrospective responsibility plan would not cover these liabilities.
Business Risks
The intense pressure we face on client pricing may materially and adversely affect our revenues and profits
.
In order to stay competitive, we offer incentives to clients to increase payments volume, enter new market segments and expand their Visa-branded card base. These include up-front cash payments, fee discounts, credits, performance-based incentives, marketing and other support payments. We have continued to increase the use of incentives such as up-front cash payments and fee discounts in many countries, including the United States. In
16
addition, we offer incentives to certain merchants or acquirers to win routing in situations where our products are co-resident with other networks and merchants have a choice of network routing options.
The economic pressures on our clients arising from the Dodd-Frank Act have also increased our use of incentives. See —
The Dodd-Frank Act may continue to have a material, adverse impact on our financial condition, revenues, results of operations, prospects for future growth and overall business
.
As a result, the provision of certain products and services may be less profitable or unprofitable, which may materially and adversely affect our revenues and profits.
Pressure on client pricing also poses additional challenges for our business. If we continue to increase incentives to our clients, we will need to find ways to offset the financial impact by increasing payments volume, increasing the amount of fee-based services we provide or both. We may not succeed in doing so, particularly, in the current regulatory environment. In addition, we benefit from long-term contracts with certain clients, including those that are large contributors to our revenue. Continued pressure on our fees could prevent us from maintaining such agreements in the future on the same or favorable terms. We may also have to modify existing agreements in order to maintain relationships or comply with regulations. Finally, increased pricing pressure enhances the importance of cost containment and productivity initiatives in areas other than those surrounding client incentives, and we may not succeed in these efforts.
Intense competition in our industry may cause our business, financial condition, results of operations and prospects for future growth to suffer
.
The global payments industry is intensely competitive. Our payment programs compete against all forms of payment. These include cash, checks, and electronic and mobile transactions. In addition, our open-loop payments network competes against other alternate payment systems such as closed-loop systems. The Dodd-Frank Act has increased this competitive pressure.
Some of our competitors may develop substantially greater technology or have greater financial resources. They may offer a wider range of programs, products and services than we do, including more innovative ones. They may use advertising and marketing strategies that are more effective than ours, achieving broader brand recognition and merchant acceptance. They may also develop better security solutions or more favorable pricing arrangements.
Certain of our competitors operate with different business models, have different cost structures or participate selectively in different market segments. These include domestic networks in the United States, China, Canada and Australia. They may ultimately prove more successful or more adaptable to new regulatory, technological and other developments. In many cases, these competitors have the support of government mandates that prohibit, limit or otherwise hinder our ability to compete for or otherwise secure transactions within those countries and regions.
Traditional or nontraditional competitors may put us at a competitive disadvantage by leveraging services or products in areas in which we do not directly compete to win business in areas where we do compete. Our clients can reassess their commitments to us at any time or develop their own competitive services. The risk to maintaining or securing our clients' long-term commitments to our products has increased with the Dodd-Frank Act's restrictions on network exclusivity in the debit sector. We do not have exclusivity with our largest clients such as JPMorgan Chase and Bank of America. In certain circumstances, our clients may terminate these relationships on relatively short notice despite significant early termination fees. Because a significant portion of our operating revenues is concentrated among our largest clients, our operating revenues would decline significantly if we lost one or more of our clients. This could have a material adverse impact on our business, financial condition and results of operations. See
Note 13—Enterprise-wide Disclosures and Concentration of Business
to our consolidated financial statements included in
Item 8
of this report.
We expect there to be changes in the competitive landscape in the future. For example:
|
•
|
competitors, clients and others may develop products that compete with or replace the value-added services we provide to support our transaction processing;
|
|
•
|
parties that process our transactions in certain countries may try to eliminate our position in the payments value chain;
|
|
•
|
we may be asked to develop or customize certain aspects of our payment services for use by our customers, processors or other third parties;
|
17
|
•
|
participants in the payments industry may merge, form joint ventures or enter into other business combinations that strengthen their existing business propositions or create new, competing payment services;
|
|
•
|
competition may increase from alternate types of payment services, such as mobile payment services, eCommerce payment services and services that permit direct debit of consumer checking accounts or ACH payments; or
|
|
•
|
new players and intermediaries in the value chain may direct the payment decision
-
making or impair the value of the services we provide.
|
Our failure to compete effectively in light of any such developments could materially and adversely affect our business, financial condition, revenues, results of operations and prospects for future growth.
Disintermediation from the payments value chain would harm our business
.
Our position in the payments value chain is key to our business. Some of our competitors, including American Express, Discover, private-label card networks and certain alternate payments systems, operate closed-loop payments systems, with direct connections to both merchants and consumers without any intermediaries. These competitors seek to derive competitive advantages from this business model. Regulatory actions such as the Dodd-Frank Act may provide them with increased opportunity to do so. In addition, although other competitors are pursuing similar lines of business or adopting similar commercial models, they have not attracted the same level of legal or regulatory scrutiny of their pricing and business practices as operators of multi-party payments systems such as ours.
We also run the risk of disintermediation by virtue of increasing bilateral agreements between entities that would rather not use a payment network for processing payments. For example, merchants could process transactions directly with issuers, or processors could process transactions directly between issuers and acquirers.
Additional consolidation in the banking industry could result in us losing business and create pressure on the fees we charge our clients, which could materially and adversely affect our business, revenues, results of operations and prospects for future growth
.
Additional consolidation in the banking industry may result in the acquisition of one or more of our largest clients by an institution with a strong relationship with one of our competitors or with one of our competitors directly. This could result in the acquired financial institution's Visa business shifting to a competitor, resulting in a substantial loss of business to us.
Additional consolidation in the banking industry could also reduce the overall number of new and existing clients and could increase their negotiating power. This consolidation could lead new financial institution clients to seek greater pricing discounts or other incentives with us. In addition, more consolidation could prompt our existing clients to seek to renegotiate their pricing agreements with us to obtain more favorable terms. We may also be adversely affected by price compression should one of our clients absorb another financial institution and qualify for higher volume-based discounts on the combined volumes of the merged businesses. Pressure on the fees we charge our clients caused by such consolidation could materially and adversely affect our business, revenues, results of operations and prospects for future growth.
Merchants' continued focus on the costs associated with payment card acceptance may result in more litigation, regulation, regulatory enforcement, incentive arrangements and other initiatives
.
We rely in part on merchants and their relationships with our clients to maintain and expand the acceptance of Visa-branded payment cards. Consolidation in the retail industry is producing a group of larger merchants that is having a significant impact on all participants in the global payments industry. Some merchants have sought to reduce their costs associated with payment card acceptance by lobbying for new legislation and regulatory enforcement and by filing lawsuits. If they continue, we may face increased compliance and litigation expenses.
We also face competitive pressures on pricing. We and our clients negotiate pricing discounts and other incentive arrangements with certain large merchants to increase acceptance and usage of Visa-branded payment cards. If merchants continue to consolidate, we and our clients may have to increase the incentives provided to certain larger merchants. Some merchants also continue to invest in their own payment solutions, using both traditional and new technology platforms. Examples include closed-loop payment systems that are specific to a single merchant or multi-merchant solutions like the Merchant Customer Exchange, which is designed for a mobile
18
platform and has many merchant participants. Such programs may offer unique or specialized benefits to consumers, including discounts or customized offers. If merchants are able to drive broad consumer adoption and usage, it could adversely impact our transaction volume.
All of these factors could materially and adversely affect our revenues, results of operations, prospects for future growth and overall business. Competitive and regulatory pressures on pricing could make it difficult to offset the cost of these incentives.
Certain financial institutions have exclusive, or nearly exclusive, relationships with our competitors to issue payment cards, and these relationships may adversely affect our ability to maintain or increase our revenues
.
Certain financial institutions have longstanding exclusive, or nearly exclusive, relationships with our competitors to issue payment cards. These relationships may make it difficult or cost-prohibitive for us to conduct material amounts of business with them. In addition, these financial institutions may be more successful and may grow more quickly than our existing clients, which could put us at a competitive disadvantage and prevent us from growing our business and revenues.
Failure to maintain relationships with issuers, acquirers, merchants and account holders, and the failure of our financial institution clients to provide services on our behalf could materially and adversely affect our business
.
We depend and will continue to depend significantly on relationships with our financial institution clients and on their relationships with account holders and merchants to support and to compete effectively for our programs and services. We do not issue cards, extend credit to account holders or determine the interest rates or other fees charged to account holders using cards that carry our brands. Each issuer determines these competitive card features for their customers.
In the wake of the Dodd-Frank Act's changes to the network exclusivity rules, we have engaged and will continue to engage in significantly more discussions with merchants, acquirers and processors. We already engage in many co-branding efforts, in which we contract with merchants, who directly receive incentive funding from us. We also engage with merchants, acquirers and processors to provide funding to promote routing and acceptance growth. As these and other relationships become more prevalent and take on a greater importance to our business, our success will increasingly depend on our ability to sustain and grow these relationships.
Outside the United States, some governments only permit their domestic processing, which prohibits us from overseeing the end-to-end processing of the transactions. Therefore, we depend on our close working relationships with our clients in these regions to effectively manage the processing of transactions involving Visa-branded cards. Our inability to oversee the end-to-end processing for cards carrying our brands in these countries may put us at a competitive disadvantage by limiting our ability to ensure the quality of the services supporting our brands.
In addition, we depend on third parties to provide various services associated with our payments network on our behalf, and to the extent that such third-party vendors fail to perform or deliver adequate services, our business and reputation could be impaired.
Negative perception of our company in the marketplace may affect our brands and reputation, which are key assets of our business
.
Our brands and their attributes are key assets of our business. The ability to attract and retain account holders and financial institution clients to Visa-branded products depends highly upon the external perceptions of our company and our industry's quality of service, corporate responsibility, use and protection of account holder data, regulatory compliance, financial condition and other factors. Negative perception or publicity, particularly in light of the rapid, widespread use of social media channels, could cause damage to our brands and reputation. Our business may also be affected by actions taken by our clients, other third parties or circumstances that are outside our control:
|
•
|
Our clients may take actions that we do not believe to be in the best interests of our brands, such as adverse creditor practices.
|
|
•
|
Our limited control over the quality of service and promotion of our brands in Europe could affect our brands and reputation globally. While Visa Europe has very broad latitude to use our brands and
|
19
technology within its region, Visa Europe is not required to spend any minimum amount of money conducting research on brand performance, promoting or maintaining the strength of our brands.
|
•
|
We may be associated with adverse developments with respect to our industry, and with new rules and regulations concerning human rights conditions, our corporate responsibility regarding those conditions and resulting disclosure requirements.
|
|
•
|
Any negative perception of the United States arising from its political, economic, social or other positions could harm the perception of our company and our brands globally by associating Visa with those positions.
|
Any of these factors could require us to take on additional liabilities and costs, result in greater regulatory or legislative scrutiny, and materially and adversely affect our revenues, operating results, prospects for future growth and overall business.
Unprecedented economic events in financial markets around the world have affected and are likely to continue to affect our clients, merchants and account holders, and may potentially impact our prospects, profitability, revenue and overall business
.
The current threats to economic growth include geopolitical instability in the Middle East, which could affect oil prices, economic fragility in the Eurozone and in the United States, potential reduction or tapering of bond purchases by the U.S. Federal Reserve, higher interest rates hurting the housing markets, persistently weak job creation, political discord, spending cuts and debt defaults. While there continues to be some improvements in advanced economies, emerging economies continue to suffer with slower growth. Consumer spending continues to be impacted from consumer debt levels, excess housing inventory, deflation, changes in savings rates, continued equity market volatility, decreased export activity, lowered government spending and additional government intervention. Furthermore, continued challenges in the credit environment, bank instability, downgrades of sovereign, bank and commercial debt, political issues affecting the handling of national debt, and the uncertainty arising from new government policies all must be considered.
The fragility of the current situation would be exacerbated if additional negative economic developments or crises were to arise around the world. These include defaults on government debt, exhaustion of national economic stimulus packages, significant increases in oil prices, tax increases, a significant decline in the commercial real estate market and policy missteps. Most recently, the economic situations in the United States and various countries in Europe have been particularly unstable, arising from the real prospect of debt defaults. If such defaults occur, or if the measures taken to avert such defaults create their own instability, economic turmoil is likely to result, and the impact is likely to be global and highly significant.
The volatility of the current economic environment in advanced and emerging economies and the responses by financial institutions and governments may create new risks or increase the impact of existing ones. These include the following:
|
•
|
Depressed consumer and business confidence may continue to decrease account holder spending.
|
|
•
|
Uncertainty and volatility in the performance of our clients' businesses may reduce the accuracy of our estimates of our revenues, rebates, incentives and realization of prepaid assets.
|
|
•
|
Our clients may implement cost-reduction initiatives that reduce or eliminate payment card marketing budgets or increase requests for greater incentives or reduced fees from us, which may reduce our revenues.
|
|
•
|
Our clients may decrease spending for optional or enhanced services, affecting our revenue and reducing account holders' desire to use these products.
|
|
•
|
Our clients may increase account holder fees as a cost-recovery initiative, or as a result of regulatory action, decreasing their value proposition to consumers and reducing consumers' desire to use our products.
|
|
•
|
Government intervention or investments in our clients may negatively affect our business with those institutions or otherwise alter their business decisions.
|
20
|
•
|
Tightening of credit availability could affect the ability of participating financial institutions to lend to us under the terms of our credit facility.
|
|
•
|
The U.S. government's inability to meet its obligations or a possible further downgrade in the U.S. debt rating could adversely affect the liquidity of our investments, a substantial portion of which are in U.S. treasury and government securities.
|
|
•
|
Our clients may default on their settlement obligations, including for reasons unrelated to payment card activity, such as mortgage loan commitments.
|
|
•
|
Adverse fluctuations in foreign currency exchange rates could negatively affect the dollar value of our revenues and payments in foreign currencies.
|
|
•
|
The current economic environment could lead some clients to curtail or postpone near-term investments in growing their card portfolios, limit credit lines, modify fees and loyalty programs, or take other actions that adversely affect the growth of our volume and revenue streams from these clients.
|
|
•
|
Declines in stock prices or significant instability could cause consumer spending to decline materially.
|
Any of these developments could have a material adverse impact on our prospects, growth, revenue, profitability and overall business.
A decline in non-U.S. and cross-border activity and in multi-currency transactions could adversely affect our revenues and profitability, as we generate a significant portion of our revenue from such transactions
.
We generate a significant amount of our revenues from cross-border transactions, and our clients pay us fees in connection with them. Some of those fees differ when conversion from the merchant's currency to the issuer's billing currency is required. Thus, revenue from processing cross-border transactions for our clients fluctuates with cross-border activity and the need for transactions to be converted into a different currency.
In addition, Visa derives revenue from foreign currency exchange activities that result from our clients' settlement in different currencies. A reduction in multi-currency transactions may reduce the need for foreign currency exchange activities and adversely affect our revenues. Limitations or changes in our ability to set foreign currency exchange rates for multi-currency transactions as a result of regulation, litigation, competitive pressures or other reasons may also adversely affect our revenues.
Cross-border travel may be adversely affected by global geopolitical, economic, social and other conditions. These include the threat of terrorism, social or political instability, natural disasters, effects of climate change and outbreaks of diseases. The need for conversion of currencies declines as cross-border travel is impacted, which could adversely affect our revenues and profitability.
Moreover, if our clients decide to change practices (e.g., prohibit certain transactions or increase account holder fees associated with cross-border transactions) there could be a decline in account holder spending because their value proposition to the consumer could be reduced.
Transactions outside the United States represent an increasingly important part of our strategy, which we hope will continue to grow. However, a decline in non-U.S. and cross-border activity and multi-currency transactions will decrease the number of cross-border transactions we process and our revenues and profitability may be materially and adversely affected.
We risk loss or insolvency if our clients fail to fund settlement obligations for which we have provided indemnifications
.
We indemnify issuers and acquirers for any settlement loss they suffer due to the failure of another issuer or acquirer to fund its settlement obligations. In certain instances, we may indemnify issuers or acquirers even in situations in which a transaction is not processed by our system. This indemnification creates settlement risk for us due to the difference in timing between the date of a payment transaction and the date of subsequent settlement. While the term and amount of our indemnification obligations have no limit, our exposure under the indemnification is restricted to the amount of unsettled Visa payment transactions at any point in time.
Concurrent settlement failures involving more than one of our largest clients, several of our smaller clients or systemic operational failures lasting more than a single day could cause us to exceed our available financial resources. Any such failure could materially and adversely affect our business, financial condition and results of
21
operations. In addition, even if we have sufficient liquidity to cover a settlement failure, we may be unable to recover the amount of such payment. This could expose us to significant losses, and materially and adversely affect our financial condition, results of operations and cash flow.
We estimate settlement exposure under the indemnity based on the sum of three inputs. The first is average daily volumes during the quarter multiplied by the estimated number of days to settle plus a safety margin. The second is four months of rolling average chargebacks volume. The third is the total balance for outstanding Visa Travelers Cheques. We generally guarantee the payment of any validly issued Visa Travelers Cheque that has been negotiated in good faith and properly presented for payment in the event that the Cheque is not honored by its issuing institution. Additionally, from time to time, we review and revise our risk management methodology and inputs as necessary. See
Note 11—Settlement Guarantee Management
to our consolidated financial statements included in
Item 8
of this report.
Some of our clients are composed of groups of financial institutions. Some of these clients have elected to limit their responsibility for settlement losses arising from the failure of their constituent financial institutions in exchange for managing their constituent financial institutions in accordance with our credit risk policy. To the extent that any settlement failure resulting from a constituent financial institution exceeds the limits established by our credit risk policy, we would have to absorb the cost of such settlement failure, which could materially and adversely affect our cash flow.
If we cannot keep pace with rapid technological developments to provide new and innovative payment programs and services or with new laws and regulations, the use of our products, our revenues and net income could decline
.
Rapid, significant technological changes continue to confront the payments industry. These include developments in smart cards, eCommerce, mobile, and radio frequency and proximity payment devices, such as contactless cards. We cannot predict the effect of technological changes on our business. In addition to our own initiatives and innovations, we rely in part on third parties, including some of our competitors, for the development of and access to new technologies. We expect that new services and technologies applicable to the payments industry will continue to emerge. These new services and technologies may be superior to, or render obsolete, the technologies we currently use in our products and services. In addition, our ability to adopt new services and technologies that we develop may be inhibited by industry-wide standards, new laws and regulations, resistance to change from clients or merchants or third parties' intellectual property rights. Our success will depend in part on our ability to develop new technologies and adapt to technological changes and evolving industry standards.
If our transaction processing systems are disrupted or compromised, the perception of our brands, and our revenues or operating results could be materially and adversely affected
.
Our transaction processing systems may experience service interruptions or degradation because of processing or other technology malfunctions, fires, natural disasters, power losses, disruptions in long-distance or local telecommunications access, fraud, military or political conflicts, terrorist attacks, effects of climate change or other catastrophic events.
In addition, our visibility in the global payments industry may attract terrorists and hackers to conduct physical or computer-based attacks. The latter could include computer viruses, worms or other destructive or disruptive software, process breakdowns, denial-of-service attacks, malicious social engineering or other malicious activities, or any combination of the foregoing. Any of these incidents could result in a degradation or disruption of our services or damage to our properties, equipment and data. They could also compromise data security. See
—
Account data breaches involving card or other data processed, stored or transmitted by third parties or by us could adversely affect our reputation and revenues
. If such attacks are not detected immediately, their effect could be compounded. Finally, potential and actual attacks could also result in increased costs, both for recovery and for prevention against future attacks.
Additionally, we rely on service providers for the timely transmission of information across our global data network. If a service provider fails to provide the communications capacity or services we require because of a natural disaster, operational disruption, terrorism or any other reason, the failure could interrupt our services. Because of the centrality of our processing systems to our business, any interruption or degradation could adversely affect the perception of our brands' reliability and materially reduce our revenues or profitability.
22
Account data breaches involving card or other data processed, stored or transmitted by third parties or by us could adversely affect our reputation and revenues
.
Our clients, merchants, other service providers and we process, store or transmit account holder information in connection with Visa-branded cards and payment products. In addition, our clients may use third-party processors to process transactions generated by cards carrying our brands. Breach of the systems processing, storing or transmission of sensitive account holder data and other information could lead to fraudulent activity involving Visa-branded cards, reputational damage and claims against us. If we are sued in connection with any material data security breach, we could be involved in protracted litigation. If unsuccessful in defending such lawsuits, we may have to pay damages or change our business practices or pricing structure, any of which could have a material adverse effect on our revenues and profitability. In addition, any reputational damage resulting from an account data breach at one or more of our clients, merchants or other third parties could decrease the use and acceptance of Visa-branded cards, which could have a material adverse impact on our payments volume, revenues and future growth prospects. Finally, any data security breach could result in additional regulation, which could materially increase our compliance costs.
An increase in fraudulent or other illegal activity involving Visa-branded cards or payment products could lead to reputational damage to our brands and reduce the use and acceptance of Visa-branded cards or payment products
.
Criminals are using increasingly sophisticated methods to capture account holder information. They use this information to conduct fraudulent transactions and to engage in other forms of illegal activities involving our payment products. Outsourcing and specialization of functions within the payments system are increasing. As a result, more third parties are involved in processing transactions using Visa-branded cards or payment products. A rise in fraud levels and other illegal activities involving Visa-branded cards or payment products could lead to reputational damage to our brands. This could reduce the use and acceptance of Visa-branded cards and payment products, or lead to greater regulation, which could increase our compliance costs and materially and adversely affect our payments volume and revenues.
Failure to maintain interoperability with Visa Europe's systems could damage the business and global perception of the Visa brands
.
Visa and Visa Europe maintain mostly separate authorization, clearing and settlement systems. As a result, we have to ensure that the two systems can process every transaction involving both of our territories, regardless of where it originates. Visa Europe's independent system operations could present challenges to our business due to increasing costs and difficulty in maintaining the interoperability of our respective systems. Any inconsistency in the payment processing services and products between Visa Europe and us could negatively affect account holders from Visa Europe using payment products in the countries we serve or our account holders using payment products in Visa Europe's region. Failure to authorize, clear and settle inter-territory transactions quickly and accurately could harm our business and impair the global perception of our brands.
Structural and Organizational Risks
Due to the nature of our relationship and the terms we have agreed to with Visa Europe, we have little ability to control its operations in its region, and as a result, we may experience added costs and challenges in operating our business
.
Visa Europe's exclusive license of our trademarks and technologies under the Framework Agreement gives us little ability to control and oversee Visa Europe's operations in its region. If we want to change a global rule or to implement certain changes that may be viewed as unfavorable to Visa Europe and its members, Visa Europe is not required to implement the changes unless we agree to pay for the associated costs. This may result in added costs and expenses to our business. Furthermore, the licenses granted under the Framework Agreement may raise licensing, payment and associated tax treatment concerns.
Visa Europe may hinder our ability to acquire new businesses or to operate them effectively in its region. If the acquired business has operations in Visa Europe's region, Visa Europe may play a significant part in influencing our ongoing operational decisions and costs there. Finally, Visa Europe may undertake operational and litigation strategies, including, but not limited to, our ongoing litigation in the U.K. and our ongoing case with the European Commission, that may adversely impact our business and reputation globally.
If Visa Europe makes us acquire all of its outstanding stock under its put option, we are likely to incur substantial costs and may suffer a material and adverse effect on our operations and net income
.
23
We have granted Visa Europe a put option, which Visa Europe can exercise at any time and which would require us to purchase all outstanding capital stock from Visa Europe's members within 285 days. We are likely to incur a financial obligation of several billion dollars or more and may need to obtain third-party financing in order to meet our obligation through the issuance of either debt or equity. An equity offering, or the payment of part of the exercise price with our stock, would dilute the ownership interests of our stockholders. Sufficient financing might not be available to us within that time on reasonable terms. See
Note 2—Visa Europe
to our consolidated financial statements included in
Item 8
of this report.
We may also encounter difficulties in integrating Visa Europe's business and systems into our existing operations. If we cannot do so quickly and cost-effectively, the integration could divert the time and resources of senior management, disrupt our current operations and adversely affect our results of operations. In addition, we would become subject to any ongoing or future regulatory disputes as a result of EU regulations that govern the operations of Visa Europe.
We are required to record any change in the fair value of the put option on a quarterly basis. We record these adjustments through our consolidated statements of operations. Consequently, the adjustments affect our reported net income and earnings per share. These quarterly adjustments and their resulting impact on our reported statements of operations could be significant. The existence of these changes in the fair value of the put option could adversely affect our ability to raise capital and increase any associated costs.
If we cannot remain organizationally effective, we will be unable to address the opportunities and challenges presented by our strategy and the increasingly challenging competitive, economic and regulatory environment
.
We continue to centralize our management and operations. For us to succeed organizationally, we must effectively integrate our operations, actively work to ensure consistency throughout our enterprise, and incorporate a global perspective into our decisions and processes. If we fail to do so, we may be unable to expand as rapidly as we plan, and the results of our expansion may be unsatisfactory.
In addition, if we are unable to make decisions quickly, assess our risks, execute our strategy, and implement new governance, managerial and organizational processes, as needed, we may not be successful in this competitive, economic and regulatory environment.
We may be unable to attract and retain key management and other key employees
.
Our employees, particularly our key management, are vital to our success and difficult to replace. We may be unable to retain them or to attract other highly qualified employees, particularly if we do not offer employment terms competitive with the rest of the market. Failure to attract and retain highly qualified employees, or failure to develop and implement a viable succession plan, could result in inadequate depth of institutional knowledge or skill sets by key management and other key employees, which could adversely affect our business.
Acquisitions, strategic investments and entries into new businesses could disrupt our business and harm our financial condition and results of operations
.
Although we may continue to make strategic acquisitions or investments in complementary businesses, products or technologies, we may be unable to successfully finance, partner with or integrate them. We are also subject to the terms of the exclusive license granted to Visa Europe in most acquisitions and major investments that involve countries in Visa Europe's territory, which will impact our ability to expand or conduct business in those regions. Regulatory constraints, particularly competition regulations, may also affect the extent to which we can maximize the value of acquisitions or investments.
Furthermore, the integration of any acquisition or investment will take time and resources from our core business and disrupt our operations. We may spend time and money on acquisitions or investments that do not increase our revenues. Although we periodically evaluate potential acquisitions of and investments in businesses, products and technologies and anticipate continuing to make these evaluations, we cannot guarantee that they will be successful.
With the evolution of technology and the opening of new market segments, we may choose to participate in areas in which we have not engaged in the past, either through acquisitions or through organic development. These include digital, eCommerce and mobile payments. Our recent entry into these businesses requires additional
24
resources and presents an additional degree of risk, which could materially and adversely affect our operations and results.
Future sales of our class A common stock, or the end of transfer restrictions on our class B common stock, could result in dilution to holders of our existing class A common stock, which could adversely affect their rights and depress the market price of our class A common stock
.
The market price and voting power of our class A common stock could decline because of increases in the number of such shares outstanding. The market price of our class A common stock may also suffer from the perception that such an increase could occur, such as upon the issuance or conversion of certain securities to shares of our class A common stock under the retrospective responsibility plan. Specifically, upon the final resolution of our covered litigation, all class B common stock will become convertible into class A common stock.
If funds are released from escrow after the resolution of the litigation covered by our retrospective responsibility plan, the value of our class A common stock will be diluted
.
Under our retrospective responsibility plan, funds still in the escrow account after the resolution of all covered litigation will be released back to us. At that time, each share of class B common stock will become convertible into shares of class A common stock, benefiting the holders of class B common stock. This in turn will result in dilution of the interest of holders of class A common stock. The amount of funds released and the market price of our class A common stock will determine the extent of the dilution.
Holders of our class B and C common stock have voting rights concerning certain significant corporate transactions, and their interests in our business may be different from those of holders of our class A common stock
.
Although their voting rights are limited, holders of our class B and C common stock can vote on certain significant transactions. These include a proposed consolidation or merger, a decision to exit our core payments business and any other vote required under Delaware law. The holders of these shares may not have the same incentive to approve a corporate action that may be favorable to the holders of class A common stock, and their interests may otherwise conflict with holders of class A common stock.
Anti-takeover provisions in our governing documents and under Delaware law could delay or prevent a takeover attempt or a change in control
.
Provisions contained in our current certificate of incorporation, in our current bylaws and under Delaware law could delay or prevent a merger or acquisition that our stockholders may consider favorable. For instance, except for limited exceptions, no person may beneficially own more than 15% of our class A common stock (or 15% of our total outstanding common stock on an as-converted basis), unless our board of directors approves the acquisition of such shares in advance. In addition, except for common stock previously issued in connection with our reorganization to Visa Members, as defined in our current certificate of incorporation, no competitor or an affiliate of a competitor may hold more than 5% of our total outstanding common stock on an as-converted basis.
Our ability to pay regular dividends to holders of our common stock in the future is subject to the discretion of our board of directors and will be limited by our ability to generate sufficient earnings and cash flows
.
Since August 2008, we have paid cash dividends quarterly on our class A, B and C common stock. The payment of dividends, if any, is subject to the discretion of our board of directors after taking into account various factors, including, but not limited to, our financial condition, operating results, capital requirements, covenants in our debt instruments and other factors that our board of directors may deem relevant. If, as a result of these factors, we cannot generate sufficient earnings and cash flows from our business, we may not be able to pay dividends to our stockholders. Furthermore, if a dividend is declared or paid, an equivalent amount must be paid on each class or series of our common stock.
|
ITEM 1B.
|
Unresolved Staff Comments
|
Not applicable.
|
ITEM 2.
|
Properties
|
25
At September 30, 2013, we owned and leased approximately 3.0 million square feet of office and processing center space in 39 countries around the world, of which approximately 1.9 million square feet are owned and the remaining 1.1 million square feet are leased. Our corporate headquarters is located in Foster City, California, and consists of four buildings that we own, totaling 0.9 million square feet. We also own an office building in Miami, Florida, totaling approximately 0.2 million square feet.
In addition, we own and operate two primary processing centers with adjacent office facilities in the United States, totaling approximately 0.8 million square feet.
We believe that these facilities are suitable and adequate to support our ongoing business needs.
|
ITEM 3.
|
Legal Proceedings
|
Refer to
Note 20—Legal Matters
to our consolidated financial statements included in
Item 8
of this report.
|
ITEM 4.
|
Mine Safety Disclosures
|
Not applicable.
26
|
ITEM 5.
|
Market for Registrant's Common Equity, Related Stockholder Matters and Issuer Purchases of Equity Securities
|
Price Range of Common Stock
Our class A common stock has been listed on the New York Stock Exchange under the symbol “V” since March 19, 2008. At
September 30, 2013
, we had 355 stockholders of record of our class A common stock. The number of beneficial owners is substantially greater than the number of record holders, because a large portion of our class A common stock is held in "street name" by banks and brokers. The following table sets forth the intra-day high and low sale prices for our class A common stock in each of our last eight fiscal quarters:
|
Fiscal 2013
|
High
|
Low
|
|||||
|
First Quarter
|
$
|
152.51
|
|
$
|
134.87
|
|
|
|
Second Quarter
|
$
|
170.96
|
|
$
|
153.93
|
|
|
|
Third Quarter
|
$
|
185.23
|
|
$
|
161.27
|
|
|
|
Fourth Quarter
|
$
|
200.86
|
|
$
|
170.99
|
|
|
|
Fiscal 2012
|
High
|
Low
|
|||||
|
First Quarter
|
$
|
103.45
|
|
$
|
81.71
|
|
|
|
Second Quarter
|
$
|
120.70
|
|
$
|
98.33
|
|
|
|
Third Quarter
|
$
|
125.35
|
|
$
|
111.94
|
|
|
|
Fourth Quarter
|
$
|
136.65
|
|
$
|
119.10
|
|
|
There is currently no established public trading market for our class B or class C common stock. There were 1,688 and 994 holders of record of our class B common stock and class C common stock, respectively, as of
September 30, 2013
.
Dividend Declaration and Policy
During the fiscal years ended
September 30, 2013
and
2012
, we paid the following quarterly cash dividends per share of our class A common stock (determined in the case of class B and C common stock, on an as-converted basis) to all holders of record of our class A, B and C common stock.
|
Fiscal 2013
|
Dividend
Per Share
|
||
|
First Quarter
|
$
|
0.33
|
|
|
Second Quarter
|
$
|
0.33
|
|
|
Third Quarter
|
$
|
0.33
|
|
|
Fourth Quarter
|
$
|
0.33
|
|
|
Fiscal 2012
|
Dividend
Per Share
|
||
|
First Quarter
|
$
|
0.22
|
|
|
Second Quarter
|
$
|
0.22
|
|
|
Third Quarter
|
$
|
0.22
|
|
|
Fourth Quarter
|
$
|
0.22
|
|
Additionally, in
October 2013
, our board of directors declared a quarterly cash dividend of
$0.40
per share of class A common stock (determined in the case of class B and C common stock, on an as-converted basis) payable on
December 3, 2013
, to holders of record as of
November 15, 2013
of our class A, B and C common stock.
Subject to legally available funds, we expect to continue paying quarterly cash dividends on our outstanding class A, B and C common stock in the future. However, the declaration and payment of future dividends is at the sole discretion of our board of directors after taking into account various factors, including, but not limited to, our financial condition, settlement indemnifications, operating results, available cash and current and anticipated cash needs.
27
Issuer Purchases of Equity Securities
The table below sets forth the information with respect to purchases of the Company’s common stock made by or on behalf of the Company during the quarter ended
September 30, 2013
.
|
Period
|
(a)
Total
Number of
Shares
Purchased
(1)
|
(b)
Average
Price Paid
per Share
|
(c)
Total
Number of
Shares
Purchased
as Part of
Publicly
Announced
Plans or
Programs
(2)
|
(d)
Approximate
Dollar Value
of Shares that
May Yet Be
Purchased
Under the Plans or
Programs
(2)
|
||||||||||
|
July 1-31, 2013
|
745,148
|
|
$
|
183.69
|
|
744,500
|
|
$
|
1,424,252,596
|
|
||||
|
August 1-31, 2013
|
6,640,563
|
|
$
|
176.78
|
|
6,638,189
|
|
$
|
250,658,812
|
|
||||
|
September 1-30, 2013
|
—
|
|
$
|
—
|
|
—
|
|
$
|
250,658,812
|
|
||||
|
Total
|
7,385,711
|
|
$
|
177.47
|
|
7,382,689
|
|
|||||||
|
(1)
|
Includes 3,022 shares of class A common stock withheld at an average price of $182.50 per share (per the terms of grants under the Visa 2007 Equity Incentive Compensation Plan) to offset tax withholding obligations that occur upon vesting and release of restricted shares.
|
|
(2)
|
The figures in the table reflect transactions according to the trade dates. For purposes of our consolidated financial statements included in this Form 10-K, the impact of these repurchases is recorded according to the settlement dates. In October 2013, the Company's board of directors authorized an additional
$5.0 billion
share repurchase program.
|
28
EQUITY COMPENSATION PLAN INFORMATION
The table below presents information as of
September 30, 2013
, for the Visa 2007 Equity Incentive Compensation Plan, or the EIP, which was approved by our stockholders. We do not have any equity compensation plans that have not been approved by our stockholders, except as noted in note (2) in the table below. For a description of the awards issued under the EIP, see
Note 16—Share-based Compensation
to our consolidated financial statements included in
Item 8
of this report.
|
Plan Category
|
(a)
Number of shares
of class A
common stock issuable upon exercise of
outstanding options
|
Weighted-average
exercise price of
outstanding options
|
Number of shares of
class A
common stock
remaining available for
future issuance under
equity compensation
plans (excluding shares
reflected in column (a))
|
||||||
|
Equity compensation plans approved by stockholders
|
3,445,427
|
|
(1)
|
$
|
75.29
|
|
39,843,485
|
|
|
|
Equity compensation plans not approved by stockholders
|
471,779
|
|
(2)
|
$
|
49.67
|
|
—
|
|
|
|
Total
|
3,917,206
|
|
$
|
72.21
|
|
39,843,485
|
|
||
|
|
|
|
|
.
|
|||||
|
(1)
|
In addition to options, the EIP authorizes the issuance of restricted stock, restricted stock units, performance shares and other stock-based awards. The maximum number of shares issuable as of
September 30, 2013
, pursuant to outstanding restricted stock units and performance shares totals
649,682
and
459,899
, respectively.
|
|
(2)
|
These shares may be issued upon the exercise of options issued by Visa replacing certain CyberSource options outstanding at the time of the fiscal 2010 acquisition. These options were issued under certain provisions of the EIP, which permit Visa to issue options in connection with certain acquisition transactions.
|
|
ITEM 6.
|
Selected Financial Data
|
The following table presents selected Visa Inc. financial data for fiscal
2013
,
2012
,
2011
,
2010
and
2009
. The data below should be read in conjunction with
Item 7—Management's Discussion and Analysis of Financial Condition and Results of Operations
and
Item 8—Financial Statements and Supplementary Data
of this report.
Selected Financial Data
|
|
Fiscal Year Ended September 30,
|
|||||||||||||||||||
|
Statement of Operations Data
:
|
2013
|
2012
(1)
|
|
2011
|
2010
|
2009
|
||||||||||||||
|
|
(in millions, except per share data)
|
|||||||||||||||||||
|
Operating revenues
|
$
|
11,778
|
|
$
|
10,421
|
|
$
|
9,188
|
|
$
|
8,065
|
|
$
|
6,911
|
|
|||||
|
Operating expenses
|
$
|
4,539
|
|
$
|
8,282
|
|
$
|
3,732
|
|
$
|
3,476
|
|
$
|
3,373
|
|
|||||
|
Operating income
|
$
|
7,239
|
|
$
|
2,139
|
|
$
|
5,456
|
|
$
|
4,589
|
|
$
|
3,538
|
|
|||||
|
Net income attributable to Visa Inc.
|
$
|
4,980
|
|
$
|
2,144
|
|
$
|
3,650
|
|
$
|
2,966
|
|
$
|
2,353
|
|
|||||
|
Basic earnings per share—class A common stock
|
$
|
7.61
|
|
$
|
3.17
|
|
$
|
5.18
|
|
$
|
4.03
|
|
$
|
3.10
|
|
|||||
|
Diluted earnings per share—class A common stock
|
$
|
7.59
|
|
$
|
3.16
|
|
$
|
5.16
|
|
$
|
4.01
|
|
$
|
3.10
|
|
|||||
29
|
|
At September 30,
|
|||||||||||||||||||
|
Balance Sheet Data
:
|
2013
|
2012
(1)
|
|
2011
|
2010
|
2009
|
||||||||||||||
|
|
(in millions, except per share data)
|
|||||||||||||||||||
|
Total assets
|
$
|
35,956
|
|
$
|
40,013
|
|
$
|
34,760
|
|
$
|
33,408
|
|
$
|
32,281
|
|
|||||
|
Current portion of long-term debt
|
$
|
—
|
|
$
|
—
|
|
$
|
—
|
|
$
|
12
|
|
$
|
12
|
|
|||||
|
Current portion of accrued litigation
(2)
|
$
|
5
|
|
$
|
4,386
|
|
$
|
425
|
|
$
|
631
|
|
$
|
1,394
|
|
|||||
|
Long-term debt
|
$
|
—
|
|
$
|
—
|
|
$
|
—
|
|
$
|
32
|
|
$
|
44
|
|
|||||
|
Long-term accrued litigation
|
$
|
—
|
|
$
|
—
|
|
$
|
—
|
|
$
|
66
|
|
$
|
323
|
|
|||||
|
Total equity
|
$
|
26,870
|
|
$
|
27,630
|
|
$
|
26,437
|
|
$
|
25,014
|
|
$
|
23,193
|
|
|||||
|
Dividend declared and paid per common share
|
$
|
1.32
|
|
$
|
0.88
|
|
$
|
0.60
|
|
$
|
0.50
|
|
$
|
0.42
|
|
|||||
|
(1)
|
During fiscal 2012, we recorded: a one-time, non-cash tax benefit of $208 million related to the remeasurement of our net deferred tax liabilities; a covered litigation provision of $4.1 billion and related tax benefits; and the reversal of previously recorded tax reserves and interest, which increased net income by $326 million.
|
|
(2)
|
During fiscal 2013, we made payments from the litigation escrow account totaling
$4.4 billion
in connection with the covered litigation.
See
Note 3—Retrospective Responsibility Plan
and
Note 20—Legal Matters
to our consolidated financial statements included in
Item 8
of this report.
|
30
|
ITEM 7.
|
Management’s Discussion and Analysis of Financial Condition and Results of Operations
|
This management’s discussion and analysis provides a review of the results of operations, financial condition and liquidity and capital resources of Visa Inc. and its subsidiaries (“Visa,” “we,” “our” and the “Company”) on a historical basis and outlines the factors that have affected recent earnings, as well as those factors that may affect future earnings. The following discussion and analysis should be read in conjunction with the consolidated financial statements and related notes included in Item 8 of this report.
Overview
Visa is a global payments technology company that connects consumers, businesses, financial institutions and governments around the world to fast, secure and reliable electronic payments. We provide our financial institution clients with a global payments infrastructure and support services for the delivery of Visa-branded payment products, including credit, debit and prepaid. We facilitate global commerce through the transfer of value and information among financial institutions, merchants, consumers, businesses and government entities. Each of these constituencies has played a key role in the ongoing worldwide migration from paper-based to electronic forms of payment, and we believe that this transformation continues to yield significant growth opportunities, particularly outside the United States. We continue to explore additional opportunities to enhance our competitive position by expanding the scope of payment solutions we provide.
Overall economic conditions.
Our business is affected by overall economic conditions and consumer spending. Our business performance during fiscal 2013 reflects the impacts of a slow-moving global economic recovery.
Interchange multidistrict litigation.
On October 19, 2012, Visa, MasterCard, various U.S. financial institution defendants and the class plaintiffs signed a settlement agreement to resolve the class plaintiffs' claims in the interchange multidistrict litigation. The court entered the preliminary approval order of the settlement agreement on November 27, 2012. On December 10, 2012, Visa paid approximately $4.0 billion from the litigation escrow account into a settlement fund established pursuant to the definitive class settlement agreement. Certain merchants in the proposed settlement classes, however, have objected to the settlement and a number of merchants have filed opt-out claims. Until the settlement agreement is finally approved by the court and any appeals are finally adjudicated, no assurance can be provided that Visa will be able to resolve the class plaintiffs’ claims as contemplated by the settlement agreement. We also signed a settlement agreement to resolve the claims brought by a group of individual merchants which were consolidated with the interchange multidistrict litigation for coordination of pre-trial proceedings. Pursuant to the settlement agreement, we paid $350 million from the litigation escrow account to the individual merchants on October 29, 2012, and on November 6, 2012, the court entered an order dismissing the individual merchants' claims with prejudice. See
Note 3—Retrospective Responsibility Plan
and
Note 20—Legal Matters
to our consolidated financial statements.
Reduction in as-converted shares.
During
fiscal 2013
, we repurchased
33 million
shares of our class A common stock using
$5.4 billion
of cash on hand. In July 2013, our board of directors authorized a $1.5 billion share repurchase program to be in effect through July 2014. As of September 30, 2013, the July program had remaining authorized funds of
$251 million
. All share repurchase programs authorized prior to July 2013 have been completed. In
October 2013
, our board of directors authorized an additional
$5.0 billion
share repurchase program.
Adjusted financial results.
Our financial results for fiscal 2012 and 2011 reflect the impact of several significant items that we believe are not indicative of our financial performance in the prior or future years, as they either are non-recurring, have no cash impact or are related to amounts covered by the retrospective responsibility plan. As such, we believe the presentation of adjusted financial results excluding the following amounts provides a clearer understanding of our operating performance for the periods presented.
|
•
|
Reversal of tax reserves.
During fiscal 2012, we reversed all previously recorded tax reserves and accrued interest associated with uncertainties related to the deductibility of covered litigation expense recorded in fiscal 2007 through fiscal 2011. This increased our net income for fiscal 2012 by $326 million.
|
|
•
|
Litigation provision.
During fiscal 2012, we recorded a litigation provision of
$4.1 billion
and related tax benefits associated with the interchange multidistrict litigation, which is covered by the retrospective responsibility plan. See
Note 3—Retrospective Responsibility Plan
and
Note 20—Legal Matters
to our consolidated financial statements.
|
31
|
•
|
Deferred tax adjustment.
During fiscal 2012, our reported financial results benefited from a one-time, non-cash adjustment of $208 million related to the remeasurement of our net deferred tax liabilities attributable to changes in the California state apportionment rules.
|
|
•
|
Revaluation of Visa Europe put option.
During fiscal 2011, we recorded a decrease of $122 million in the fair value of the Visa Europe put option, which resulted in the recognition of non-cash, non-operating income in our financial results. This amount is not subject to income tax and therefore had no impact on our reported income tax provision.
|
The following tables present our adjusted financial results for the years ended September 30, 2012 and 2011. There were no comparable adjustments recorded during fiscal 2013.
|
Fiscal 2013
|
||||||||||||||
|
(in millions, except for percentages and per share data)
|
Operating Expenses
|
Operating Margin
(1)
|
Net Income Attributable to Visa Inc.
|
Diluted Earnings Per Share
(2)
|
||||||||||
|
As reported
|
$
|
4,539
|
|
61
|
%
|
$
|
4,980
|
|
$
|
7.59
|
|
|||
|
Diluted weighted-average shares outstanding
(as reported)
|
656
|
|
||||||||||||
|
Fiscal 2012
|
|||||||||||||||
|
(in millions, except for percentages and per share data)
|
Operating Expenses
|
Operating Margin
(1)
|
Net Income Attributable to Visa Inc.
|
Diluted Earnings Per Share
(2)
|
|||||||||||
|
As reported
|
$
|
8,282
|
|
21
|
%
|
$
|
2,144
|
|
$
|
3.16
|
|
||||
|
Reversal of tax reserves
|
—
|
|
—
|
|
(326
|
)
|
(0.48
|
)
|
|||||||
|
Litigation provision
|
(4,098
|
)
|
39
|
%
|
2,593
|
|
(3
|
)
|
3.82
|
|
|||||
|
Impact of deferred tax adjustment
|
—
|
|
—
|
|
(208
|
)
|
(0.31
|
)
|
|||||||
|
Adjusted
|
$
|
4,184
|
|
60
|
%
|
$
|
4,203
|
|
$
|
6.20
|
|
||||
|
Diluted weighted-average shares outstanding
(as reported)
|
678
|
|
|||||||||||||
|
Fiscal 2011
|
||||||||||||||
|
(in millions, except for percentages and per share data)
|
Operating Expenses
|
Operating Margin
(1)
|
Net Income Attributable to Visa Inc.
|
Diluted Earnings Per Share
(2)
|
||||||||||
|
As reported
|
$
|
3,732
|
|
59
|
%
|
$
|
3,650
|
|
$
|
5.16
|
|
|||
|
Revaluation of Visa Europe put option
|
—
|
|
—
|
|
(122
|
)
|
(0.17
|
)
|
||||||
|
Adjusted
|
$
|
3,732
|
|
59
|
%
|
$
|
3,528
|
|
$
|
4.99
|
|
|||
|
Diluted weighted-average shares outstanding
(as reported)
|
707
|
|
||||||||||||
|
(1)
|
Operating margin is calculated as operating income divided by total operating revenues.
|
|
(2)
|
Figures in the table may not recalculate exactly due to rounding. Diluted earnings per share figures are calculated based on whole numbers, not the rounded numbers presented.
|
|
(3)
|
The litigation provision adjustment to net income attributable to Visa Inc. is shown net of tax. The tax impact is determined by applying applicable federal and state tax rates to the litigation provision.
|
Nominal payments volume and transaction counts.
Payments volume is the primary driver for our service revenues, and the number of processed transactions is the primary driver for our data processing revenues. Compared to the prior year, overall payments volume grew in all categories worldwide except U.S. consumer debit, which has been negatively impacted by the Dodd-Frank Act beginning April 1, 2012. The number of processed transactions continues to increase at a healthy rate, reflecting the continuing worldwide shift to electronic currency.
32
The following tables present nominal payments volume.
(1)
|
|
United States
|
International
|
Visa Inc.
|
|||||||||||||||||||||||||||||
|
|
12 months
ended
June 30,
2013
(2)
|
12 months
ended
June 30,
2012
(2)
|
%
Change
|
12 months
ended
June 30,
2013
(2)
|
12 months
ended
June 30,
2012
(2)
|
%
Change
|
12 months
ended
June 30,
2013
(2)
|
12 months
ended
June 30,
2012
(2)
|
%
Change
|
|||||||||||||||||||||||
|
|
(in billions, except percentages)
|
|||||||||||||||||||||||||||||||
|
Nominal Payments Volume
|
|
|
|
|
|
|
|
|
|
|||||||||||||||||||||||
|
Consumer credit
|
$
|
789
|
|
$
|
710
|
|
11
|
%
|
$
|
1,498
|
|
$
|
1,375
|
|
9
|
%
|
$
|
2,287
|
|
$
|
2,085
|
|
10
|
%
|
||||||||
|
Consumer debit
(3)
|
1,046
|
|
1,045
|
|
—
|
%
|
392
|
|
329
|
|
19
|
%
|
1,438
|
|
1,375
|
|
5
|
%
|
||||||||||||||
|
Commercial and other
(3)
|
331
|
|
311
|
|
7
|
%
|
140
|
|
130
|
|
8
|
%
|
472
|
|
440
|
|
7
|
%
|
||||||||||||||
|
Total Nominal Payments Volume
|
$
|
2,166
|
|
$
|
2,066
|
|
5
|
%
|
$
|
2,030
|
|
$
|
1,834
|
|
11
|
%
|
$
|
4,197
|
|
$
|
3,900
|
|
8
|
%
|
||||||||
|
Cash volume
|
446
|
|
437
|
|
2
|
%
|
2,083
|
|
1,920
|
|
8
|
%
|
2,529
|
|
2,357
|
|
7
|
%
|
||||||||||||||
|
Total Nominal Volume
(4)
|
$
|
2,612
|
|
$
|
2,503
|
|
4
|
%
|
$
|
4,114
|
|
$
|
3,754
|
|
10
|
%
|
$
|
6,726
|
|
$
|
6,257
|
|
7
|
%
|
||||||||
|
|
United States
|
International
|
Visa Inc.
|
|||||||||||||||||||||||||||||
|
|
12 months
ended
June 30,
2012
(2)
|
12 months
ended
June 30,
2011
(2)
|
%
Change
|
12 months
ended
June 30,
2012
(2)
|
12 months
ended
June 30,
2011
(2)
|
%
Change
|
12 months
ended
June 30,
2012
(2)
|
12 months
ended
June 30,
2011
(2)
|
%
Change
|
|||||||||||||||||||||||
|
|
(in billions, except percentages)
|
|||||||||||||||||||||||||||||||
|
Nominal Payments Volume
|
|
|
|
|
|
|
|
|
|
|||||||||||||||||||||||
|
Consumer credit
|
$
|
710
|
|
$
|
641
|
|
11
|
%
|
$
|
1,375
|
|
$
|
1,191
|
|
15
|
%
|
$
|
2,085
|
|
$
|
1,832
|
|
14
|
%
|
||||||||
|
Consumer debit
(3)
|
1,045
|
|
1,038
|
|
1
|
%
|
329
|
|
265
|
|
25
|
%
|
1,375
|
|
1,303
|
|
6
|
%
|
||||||||||||||
|
Commercial and other
(3)
|
311
|
|
282
|
|
10
|
%
|
130
|
|
116
|
|
12
|
%
|
440
|
|
398
|
|
11
|
%
|
||||||||||||||
|
Total Nominal Payments Volume
|
$
|
2,066
|
|
$
|
1,962
|
|
5
|
%
|
$
|
1,834
|
|
$
|
1,571
|
|
17
|
%
|
$
|
3,900
|
|
$
|
3,533
|
|
10
|
%
|
||||||||
|
Cash volume
|
437
|
|
402
|
|
9
|
%
|
1,920
|
|
1,704
|
|
13
|
%
|
2,357
|
|
2,106
|
|
12
|
%
|
||||||||||||||
|
Total Nominal Volume
(4)
|
$
|
2,503
|
|
$
|
2,363
|
|
6
|
%
|
$
|
3,754
|
|
$
|
3,276
|
|
15
|
%
|
$
|
6,257
|
|
$
|
5,639
|
|
11
|
%
|
||||||||
|
(1)
|
Figures in the table may not recalculate exactly due to rounding. Percentage changes are calculated based on whole numbers, not the rounded numbers presented.
|
|
(2)
|
Service revenues in a given quarter are assessed based on payments volume in the prior quarter. Therefore, service revenues reported for the twelve months ended September 30, 2013, 2012 and 2011, were based on payments volume reported by our financial institution clients for the twelve months ended June 30, 2013, 2012 and 2011, respectively.
|
|
(3)
|
Includes prepaid volume.
|
|
(4)
|
Total nominal volume is the sum of total nominal payments volume and cash volume. Total nominal payments volume is the total monetary value of transactions for goods and services that are purchased on Visa-branded cards and payment products. Cash volume generally consists of cash access transactions, balance access transactions, balance transfers and convenience checks. Total nominal volume is provided by our financial institution clients, subject to review by Visa. From time to time, previously submitted volume information may be updated. Prior period updates are not material.
|
The table below provides the number of transactions processed by our VisaNet system, and billable transactions processed by CyberSource's network during the fiscal periods presented.
(1)
33
|
2013
|
2012
|
2011
|
2013 vs. 2012
% Change
(1)
|
2012 vs. 2011
% Change
(1)
|
||||||||||
|
(in millions, except percentages)
|
||||||||||||||
|
Visa processed transactions
(2)
|
58,472
|
|
53,324
|
|
50,922
|
|
10
|
%
|
5
|
%
|
||||
|
CyberSource billable transactions
(3)
|
6,533
|
|
5,182
|
|
4,137
|
|
26
|
%
|
25
|
%
|
||||
|
(1)
|
Figures in the table may not recalculate exactly due to rounding. Percentage changes are calculated based on whole numbers, not the rounded numbers presented.
|
|
(2)
|
Represents transactions involving Visa, Visa Electron, Interlink and PLUS cards processed on Visa's networks.
|
|
(3)
|
Transactions include, but are not limited to, authorization, settlement payment network connectivity, fraud management, payment security management, tax services and delivery address verification.
|
Results of Operations
Operating Revenues
Our operating revenues are primarily generated from payments volume on Visa-branded cards and payment products for purchased goods and services, as well as the number of transactions processed on our network. We do not earn revenues from, or bear credit risk with respect to, interest or fees paid by account holders on Visa-branded cards or payment products. Our issuing clients have the responsibility for issuing cards and other payment products, and determining the interest rates and fees paid by account holders. We generally do not earn revenues from the fees that merchants are charged for acceptance by the acquirers, including the merchant discount rate. Our acquiring clients are generally responsible for soliciting merchants, and establishing and earning these fees.
The following sets forth the components of our operating revenues:
Service revenues
consist mainly of revenues earned for providing financial institution clients with support services for the delivery of Visa-branded payment products and solutions. Current quarter service revenues are primarily assessed using a calculation of current pricing applied to the prior quarter's payments volume. Service revenues also include assessments designed to support ongoing acceptance and volume growth initiatives, which are recognized in the same period the related volume is transacted.
Data processing revenues
are earned for authorization, clearing, settlement, network access and other maintenance and support services that facilitate transaction and information processing among our financial institution clients globally and with Visa Europe. Data processing revenues are also earned for transactions processed by CyberSource's online payment gateway platform
.
Data processing revenues are recognized in the same period the related transactions occur or services are rendered.
International transaction revenues
are earned for cross-border transaction processing and currency conversion activities. Cross-border transactions arise when the country of origin of the issuer is different from that of the merchant. International transaction revenues are primarily generated by cross-border payments and cash volume.
Other revenues
consist mainly of license fees for use of the Visa brand, revenues earned from Visa Europe in connection with the Visa Europe Framework Agreement, fees from account holder services, licensing and certification, and other activities related to our acquired entities. Other revenues also include optional service or product enhancements, such as extended account holder protection and concierge services.
Client incentives
consist of long-term contracts with financial institution clients and other business partners for various programs designed to build payments volume, increase Visa-branded card and product acceptance and win merchant routing transactions over our network. These incentives are primarily accounted for as reductions to operating revenues.
Operating Expenses
Personnel
includes salaries, incentive compensation, share-based compensation, fringe benefits and contractor expense.
Network and processing
mainly represents expenses for the operation of our processing network, including maintenance, equipment rental and fees for other data processing services.
34
Marketing
includes expenses associated with advertising and marketing campaigns, sponsorships and other related promotions of the Visa brand.
Professional fees
mainly consist of fees for consulting, legal and other professional services.
Depreciation and amortization
includes depreciation expense for property and equipment, as well as amortization of purchased and internally developed software. Also included in this amount is amortization of finite-lived intangible assets primarily obtained through acquisitions.
General and administrative
mainly consists of travel activities, facilities costs, foreign exchange gains and losses and other corporate expenses in support of our business.
Litigation provision
is an estimate of litigation expense and is based on management's understanding of our litigation profile, the specifics of the cases, advice of counsel to the extent appropriate and management's best estimate of incurred loss as of the balance sheet date.
Non-operating Income
Non-operating income
mainly includes accrued interest and penalties related to reserves for uncertain tax positions; income, gains and losses earned on investments; and the change in the fair value of the Visa Europe put option.
Visa Inc. Fiscal 2013, 2012 and 2011
Operating Revenues
The following table sets forth our operating revenues earned in the United States, internationally and from Visa Europe. Revenues earned from Visa Europe are a result of our contractual arrangement with Visa Europe, as governed by the Framework Agreement that provides for trademark and technology licenses and bilateral services. See
Note 2—Visa Europe
to our consolidated financial statements.
|
|
Fiscal Year ended
September 30,
|
$ Change
|
% Change
(1)
|
||||||||||||||||||||||
|
|
2013
|
2012
|
2011
|
2013
vs.
2012
|
2012
vs.
2011
|
2013
vs.
2012
|
2012
vs.
2011
|
||||||||||||||||||
|
|
(in millions, except percentages)
|
||||||||||||||||||||||||
|
United States
|
$
|
6,379
|
|
$
|
5,720
|
|
$
|
5,135
|
|
$
|
659
|
|
$
|
585
|
|
12
|
%
|
11
|
%
|
||||||
|
International
|
5,177
|
|
4,478
|
|
3,846
|
|
699
|
|
632
|
|
16
|
%
|
16
|
%
|
|||||||||||
|
Visa Europe
|
222
|
|
223
|
|
207
|
|
(1
|
)
|
16
|
|
—
|
%
|
7
|
%
|
|||||||||||
|
Total Operating Revenues
|
$
|
11,778
|
|
$
|
10,421
|
|
$
|
9,188
|
|
$
|
1,357
|
|
$
|
1,233
|
|
13
|
%
|
13
|
%
|
||||||
|
(1)
|
Figures in the table may not recalculate exactly due to rounding. Percentage changes are calculated based on whole numbers, not the rounded numbers presented.
|
The increase in operating revenues mainly reflects continued growth in our underlying business drivers: nominal payments volume; processed transactions; and cross-border volume. Operating revenue growth also benefited from pricing modifications made on various services. These benefits were partially offset by volume loss and increases to client incentives implemented in the United States during the second half of fiscal 2012 as part of our strategy to mitigate the impacts of the Dodd-Frank Act.
Our operating revenues, primarily service revenues and international transaction revenues, are impacted by the overall strengthening or weakening of the U.S. dollar as payments volume and related revenues denominated in local currencies are converted to U.S. dollars. The effect of exchange rate movements in fiscal 2013, as partially mitigated by our hedging program, resulted in an overall decline of about one percentage point in total operating revenue growth compared to fiscal 2012. While we expect our hedging program to continue to mitigate this risk during
fiscal 2014
, a general strengthening of the U.S. dollar is expected to reduce total operating revenue growth by about two percentage points for fiscal 2014, net of offsetting hedges. See
Note 12—Derivative Financial Instruments
to our consolidated financial statements.
35
The following table sets forth the components of our total operating revenues.
|
|
Fiscal Year ended
September 30,
|
$ Change
|
% Change
(1)
|
||||||||||||||||||||||
|
|
2013
|
2012
|
2011
|
2013
vs.
2012
|
2012
vs.
2011
|
2013
vs.
2012
|
2012
vs.
2011
|
||||||||||||||||||
|
|
(in millions, except percentages)
|
||||||||||||||||||||||||
|
Service revenues
|
$
|
5,352
|
|
$
|
4,872
|
|
$
|
4,261
|
|
$
|
480
|
|
$
|
611
|
|
10
|
%
|
14
|
%
|
||||||
|
Data processing revenues
|
4,642
|
|
3,975
|
|
3,478
|
|
667
|
|
497
|
|
17
|
%
|
14
|
%
|
|||||||||||
|
International transaction revenues
|
3,389
|
|
3,025
|
|
2,674
|
|
364
|
|
351
|
|
12
|
%
|
13
|
%
|
|||||||||||
|
Other revenues
|
716
|
|
704
|
|
655
|
|
12
|
|
49
|
|
2
|
%
|
7
|
%
|
|||||||||||
|
Client incentives
|
(2,321
|
)
|
(2,155
|
)
|
(1,880
|
)
|
(166
|
)
|
(275
|
)
|
8
|
%
|
15
|
%
|
|||||||||||
|
Total Operating Revenues
|
$
|
11,778
|
|
$
|
10,421
|
|
$
|
9,188
|
|
$
|
1,357
|
|
$
|
1,233
|
|
13
|
%
|
13
|
%
|
||||||
|
(1)
|
Figures in the table may not recalculate exactly due to rounding. Percentage changes are calculated based on whole numbers, not the rounded numbers presented.
|
|
•
|
Service revenues
increased in
fiscal 2013
and
2012
primarily due to
8%
and
10%
growth in nominal payments volume, respectively. The growth in service revenues in
fiscal 2012
was greater than the growth in nominal payments volume due to a shift in the mix of our payments volume, primarily in volume related to Interlink, which is a debit product that does not generate any service revenues.
|
|
•
|
Data processing revenues
increased in
fiscal 2013
and
2012
due to overall growth in processed transactions of
10%
and
5%
, respectively, combined with pricing modifications that became effective in the third quarter of
fiscal 2012
as part of our strategy to mitigate the negative impacts from the Dodd-Frank Act.
|
|
•
|
International transaction revenues
increased in
fiscal 2013
and
2012
primarily reflecting
10%
and
11%
growth in nominal cross-border volume, respectively.
|
|
•
|
Other revenues
increased in
fiscal 2013
and
2012
due to an increase in license fees as a result of payments volume growth.
|
|
•
|
Client incentives
increased in
fiscal 2013
and
2012
, reflecting incentives incurred on long-term client contracts that were initiated or renewed during fiscal 2013 and 2012, respectively. These included a number of significant long-term merchant and acquirer contracts executed as part of our strategy to mitigate the impacts from the Dodd-Frank Act, as well as issuer contracts executed in fiscal 2013. Additionally, client incentives increased as a result of overall growth in global payments volume. Activity in fiscal 2012 also reflects certain one-time incentives incurred outside the United States. The amount of client incentives we record in future periods will vary based on changes in performance expectations, actual client performance, amendments to existing contracts or the execution of new contracts. We expect incentives as a percentage of gross revenues to be in the range of 16.5% to 17.5% for the full 2014 fiscal year.
|
36
Operating Expenses
The following table sets forth the components of our total operating expenses.
|
|
Fiscal Year ended
September 30,
|
$ Change
|
% Change
(1)
|
||||||||||||||||||||||
|
|
2013
|
2012
|
2011
|
2013
vs.
2012
|
2012
vs.
2011
|
2013
vs.
2012
|
2012
vs.
2011
|
||||||||||||||||||
|
|
(in millions, except percentages)
|
||||||||||||||||||||||||
|
Personnel
|
$
|
1,932
|
|
$
|
1,726
|
|
$
|
1,459
|
|
$
|
206
|
|
$
|
267
|
|
12
|
%
|
18
|
%
|
||||||
|
Marketing
|
876
|
|
873
|
|
870
|
|
3
|
|
3
|
|
—
|
%
|
—
|
%
|
|||||||||||
|
Network and processing
|
468
|
|
414
|
|
357
|
|
54
|
|
57
|
|
13
|
%
|
16
|
%
|
|||||||||||
|
Professional fees
|
412
|
|
385
|
|
337
|
|
27
|
|
48
|
|
7
|
%
|
14
|
%
|
|||||||||||
|
Depreciation and amortization
|
397
|
|
333
|
|
288
|
|
64
|
|
45
|
|
19
|
%
|
16
|
%
|
|||||||||||
|
General and administrative
|
451
|
|
451
|
|
414
|
|
—
|
|
37
|
|
—
|
%
|
9
|
%
|
|||||||||||
|
Litigation provision
|
3
|
|
4,100
|
|
7
|
|
(4,097
|
)
|
4,093
|
|
NM
|
|
NM
|
|
|||||||||||
|
Total Operating Expenses
(2)
|
$
|
4,539
|
|
$
|
8,282
|
|
$
|
3,732
|
|
$
|
(3,743
|
)
|
$
|
4,550
|
|
(45
|
)%
|
NM
|
|
||||||
|
(1)
|
Figures in the table may not recalculate exactly due to rounding. Percentage changes are calculated based on whole numbers, not the rounded numbers presented.
|
|
(2)
|
Excluding the litigation provision of $4.1 billion recorded in fiscal 2012, associated with litigation covered by the retrospective responsibility plan, operating expenses for fiscal 2012 were $4.2 billion, an increase of 12% over fiscal 2011 on an adjusted basis.
|
|
•
|
Personnel
increased in fiscal
2013
mainly due to increases in headcount reflecting our strategy to invest for future growth, particularly in key product and geography-specific initiatives, combined with severance charges incurred as a result of organizational restructuring that better aligns our costs and strategic priorities. The increase in fiscal
2012
is primarily due to increases in headcount, and reflects annualized costs from our acquisitions of PlaySpan and Fundamo in March 2011 and June 2011, respectively.
|
|
•
|
Marketing
remained relatively flat in fiscal
2013
and fiscal
2012
when compared to the respective prior year. Fiscal
2013
activity mainly reflected strategies to promote our core products, combined with a number of various campaigns, including the 2013 FIFA Confederation Cup and the 2014 Sochi Winter Olympics. Marketing in fiscal
2012
mainly reflected sponsorship of the 2012 London Summer Olympics, as well as spend in support of our new product initiatives.
|
|
•
|
Network and processing
in fiscal
2013
and
2012
increased mainly due to costs incurred for the operation of our processing network attributable to increased transaction volumes.
|
|
•
|
Professional fees
increased in fiscal
2013
and
2012
, primarily reflecting greater investment in technology projects.
|
|
•
|
Depreciation and amortization
increased in fiscal
2013
and
2012
, primarily due to additional depreciation from our ongoing investments in technology assets and infrastructure to support our core business as well as our eCommerce and mobile initiatives.
|
|
•
|
General and administrative
remained flat in fiscal 2013 after experiencing an increase in fiscal
2012
mainly due to travel activities in support of our international expansion, combined with the absence of unrealized foreign exchange gains recorded in fiscal 2011 upon the remeasurement of monetary assets and liabilities held by foreign subsidiaries into their functional currencies.
|
|
•
|
Litigation provision
in
fiscal
2012
reflects a
$4.1 billion
accrual related to the covered litigation. See
Note 3—Retrospective Responsibility Plan
and
Note 20—Legal Matters
to our consolidated financial statements.
|
Non-operating Income
Non-operating income in fiscal
2013
of
$18 million
decreased from
$68 million
in fiscal
2012
primarily due to the reversal in fiscal
2012
of previously accrued interest expense associated with tax reserves for uncertainties related to the deductibility of covered litigation expense. See
Note 19—Income Taxes
and
Note 20—Legal Matters
37
to our consolidated financial statements. The decrease in fiscal
2012
from
$200 million
in fiscal
2011
was primarily due to:
|
•
|
the absence of a $122 million non-cash adjustment to the fair market value of the Visa Europe put option recorded in fiscal 2011; and
|
|
•
|
the absence of a pre-tax gain of $85 million recognized in fiscal 2011 upon the sale of our investment in Visa Vale issuer Companhia Brasileira de Soluções e Serviços, or CBSS; offset by
|
|
•
|
the reversal of previously accrued interest expense discussed above.
|
Effective Income Tax Rate
The effective income tax rate of 31% in fiscal
2013
differs from the effective income tax rates of 3% and 36% in fiscal 2012 and 2011, respectively, mainly due to:
|
•
|
the decrease in overall ongoing state tax rate beginning in fiscal 2012 as a result of changes in California apportionment rules adopted in that year;
|
|
•
|
a tax benefit recognized in fiscal
2013
as a result of new guidance issued by the state of California regarding apportionment rules for years prior to fiscal 2012;
|
|
•
|
certain foreign tax credit benefits related to prior years recognized in fiscal 2013; and
|
|
•
|
the absence of the following in fiscal
2013
:
|
|
•
|
the fiscal
2012
reversal of previously recorded tax reserves associated with uncertainties related to the deductibility of covered litigation expense;
|
|
•
|
a fiscal
2012
one-time, non-cash benefit from the remeasurement of existing net deferred tax liabilities due to the changes in California apportionment rules adopted in that year;
|
|
•
|
the effect of applying the aforementioned fiscal
2012
tax benefits to a fiscal
2012
pre-tax income that was reduced by the
$4.1 billion
covered litigation provision; and
|
|
•
|
the nontaxable revaluation of the Visa Europe put option recorded in fiscal
2011
.
|
Adjusted effective income tax rate for fiscal 2012
. Our financial results for fiscal 2012 reflected the impact of several significant items that we believe are not indicative of our financial performance in that or future years, as they were either non-recurring, had no cash impact or were related to amounts covered by the retrospective responsibility plan. As such, we have presented our fiscal 2012 adjusted effective income tax rate in the table below, which we believe provides a clearer understanding of our operating performance for the fiscal year. Our adjusted effective income tax rate for fiscal 2012 excludes: the reversal of previously recorded tax reserves and accrued interest associated with uncertainties related to the deductibility of covered litigation expense; additional covered litigation provision recorded; and a one-time, non-cash benefit from the remeasurement of existing net deferred tax liabilities attributable to changes in the California state apportionment rules.
|
Fiscal Year Ended September 30, 2012
|
||||||||||
|
Income Before Income Taxes
|
Income Tax Provision
|
Effective Income Tax Rate
|
||||||||
|
(in millions, except for percentages)
|
||||||||||
|
As reported
|
$
|
2,207
|
|
$
|
65
|
|
3
|
%
|
||
|
Reversal of tax reserves
|
(43
|
)
|
283
|
|
||||||
|
Litigation provision
|
4,098
|
|
1,505
|
|
||||||
|
Remeasurement of net deferred tax liabilities
|
—
|
|
208
|
|
||||||
|
Adjusted
|
$
|
6,262
|
|
$
|
2,061
|
|
33
|
%
|
||
Liquidity and Capital Resources
Management of Our Liquidity
We regularly evaluate cash requirements for current operations, commitments, development activities and capital expenditures, and we may elect to raise additional funds for these purposes in the future through the issuance of either debt or equity. Our treasury policies provide management with the guidelines and authority to manage liquidity risk in a manner consistent with our corporate objectives.
The objectives of our treasury policies are to:
38
|
•
|
provide adequate liquidity to cover operating expenditures and liquidity contingency scenarios;
|
|
•
|
ensure payments on required litigation settlements;
|
|
•
|
ensure timely completion of payments settlement activities;
|
|
•
|
make planned capital investments in our business;
|
|
•
|
pay dividends and repurchase our shares at the discretion of our board of directors; and
|
|
•
|
optimize income earned by investing excess cash in securities that enable us to meet our working capital and liquidity needs.
|
Based on our current cash flow budgets and forecasts of our short-term and long-term liquidity needs, we believe that our projected sources of liquidity will be sufficient to meet our projected liquidity needs for more than the next 12 months. We will continue to assess our liquidity position and potential sources of supplemental liquidity in view of our operating performance, current economic and capital market conditions, and other relevant circumstances.
Cash Flow Data
The following table summarizes our cash flow activity for the fiscal years presented:
|
2013
|
2012
|
2011
|
|||||||||
|
|
(in millions)
|
||||||||||
|
Total cash provided by (used in):
|
|||||||||||
|
Operating activities
|
$
|
3,022
|
|
$
|
5,009
|
|
$
|
3,872
|
|
||
|
Investing activities
|
(1,164
|
)
|
(2,414
|
)
|
(2,299
|
)
|
|||||
|
Financing activities
|
(1,746
|
)
|
(2,655
|
)
|
(3,304
|
)
|
|||||
|
Effect of exchange rate changes on cash and cash equivalents
|
—
|
|
7
|
|
(9
|
)
|
|||||
|
Increase (decrease) in cash and cash equivalents
|
$
|
112
|
|
$
|
(53
|
)
|
$
|
(1,740
|
)
|
||
Operating activities.
Cash provided by operating activities was lower during
fiscal 2013
compared to prior year, reflecting payments from the litigation escrow account totaling
$4.4 billion
in connection with the covered litigation. As these payments were made from our litigation escrow account, they were also reflected as cash inflows under financing activities. See
Note 3—Retrospective Responsibility Plan
and
Note 20—Legal Matters
to our consolidated financial statements. The tax deduction related to these payments contributed to the
$1.5 billion
decline in overall income taxes paid during fiscal 2013 compared to prior year. Absent the above impacts, cash provided by operating activities would have totaled
$5.9 billion
, an increase over fiscal 2012, reflecting continued growth in operating revenues. We believe that cash flow generated from operating activities will be more than sufficient to meet our ongoing operational needs. Total cash provided by operating activities was higher during fiscal 2012 compared to fiscal 2011, primarily reflecting higher operating revenues in fiscal 2012.
Investing activities.
Cash used in investing activities was lower during fiscal 2013 compared to prior year, reflecting a decrease in purchases of available-for-sale investment securities, combined with greater proceeds received from maturities and sales of available-for-sale investment securities. See
Note 4—Fair Value Measurements and Investments
to our consolidated financial statements. Cash used in investing activities during fiscal 2012 and 2011 was relatively consistent, reflecting our continued investment in available-for-sale securities.
Financing activities.
Cash used in financing activities during fiscal 2013, 2012 and 2011 reflects our continued commitment to return excess cash to shareholders through reduction in the as-converted class A share count, either through purchases in the open market or deposits made into the litigation escrow, and increased dividends. Cash used in financing activities also reflects cash inflows relating to payments made in connection with the covered litigation from the litigation escrow account. See
Note 3—Retrospective Responsibility Plan
,
Note 14—Stockholders' Equity
and
Note 20—Legal Matters
to our consolidated financial statements.
Sources of Liquidity
Our primary sources of liquidity are cash on hand, cash flow from our operations, our investment portfolio, and access to various equity and borrowing arrangements. Funds from operations are maintained in cash and cash equivalents, and short-term or long-term available-for-sale investment securities based upon our funding requirements, our access to liquidity from these holdings, and the return that these holdings provide.
Cash and cash equivalents and short-term and long-term available-for-sale investment securities held by our foreign subsidiaries totaled
$4.3 billion
at
September 30, 2013
. If it were necessary to repatriate these funds for use
39
in the United States, we would be required to accrue and pay U.S. taxes on the amount of undistributed earnings in those subsidiaries, which we estimate to be approximately
$3.8 billion
. It is our intent to indefinitely reinvest the majority of these funds outside of the United States, and our current plans do not demonstrate a need to repatriate them to fund our operations in the United States.
Available-for-sale investment securities.
Our investment portfolio is designed to invest excess cash in securities which enables us to meet our working capital and liquidity needs. Our investment portfolio primarily consists of debt securities issued by the U.S. Treasury or U.S. government-sponsored agencies. The majority of these investments,
$2.8 billion
, are classified as non-current as they have stated maturities of more than one year from the balance sheet date. However, these investments are generally available to meet short-term liquidity needs.
Factors that may impact the liquidity of our investment portfolio include, but are not limited to, changes to credit ratings of the securities, uncertainty related to regulatory developments, actions by central banks and other monetary authorities, and the ongoing strength and quality of credit markets. We will continue to review our portfolio in light of evolving market and economic conditions. However, if current market conditions deteriorate, the liquidity of our investment portfolio may be impacted and we could determine that some of our investments are impaired, which could adversely impact our financial results. We have policies that limit the amount of credit exposure to any one financial institution or type of investment. See
Item 1A—Risk Factors
included elsewhere in this report.
Commercial paper program
. We maintain a commercial paper program to support our working capital requirements and for other general corporate purposes. On
February 7, 2013
, we replaced the existing
$500 million
program with a new commercial paper program. Under the new program, we are authorized to issue up to
$3.0 billion
in outstanding notes, with maturities up to
397
days from the date of issuance. We had no outstanding obligations under the new program at
September 30, 2013
. See
Note 9—Debt
to our consolidated financial statements.
Credit facility.
On
January 31, 2013
, we entered into an unsecured
$3.0 billion
revolving credit facility. This credit facility, which expires on January 30, 2014, replaced our existing
$3.0 billion
credit facility, which would have expired on
February 15, 2013
. The new credit facility contains covenants and events of default customary for facilities of this type. There were no borrowings under the new credit facility and we were in compliance with all related covenants at
September 30, 2013
. See
Note 9—Debt
to our consolidated financial statements.
Universal shelf registration statement.
In July 2012, we filed a registration statement with the SEC using a shelf registration process. As permitted by the registration statement, we may, from time to time, sell shares of debt or equity securities in one or more transactions. This registration statement expires in July 2015.
Litigation escrow account.
Pursuant to the terms of the retrospective responsibility plan, we maintain a litigation escrow account from which monetary liabilities from settlements of, or judgments in, the covered litigation will be payable. When we fund the litigation escrow account, the shares of class B common stock held by our stockholders are subject to dilution through an adjustment to the conversion rate of the shares of class B common stock to shares of class A common stock. See
Note 3—Retrospective Responsibility Plan
and
Note 20—Legal Matters
to our consolidated financial statements. The balance in this account at
September 30, 2013
, was
$49 million
and is reflected as restricted cash in our consolidated balance sheet. As these funds are restricted for the sole purpose of making payments related to the covered litigation matters, as described below under
Uses of Liquidity
, we do not rely on them for other operational needs.
Credit Ratings
At
September 30, 2013
, our credit ratings by Standard and Poor’s and Moody’s were as follows:
|
|
Standard and Poor’s
|
Moody’s
|
|||||
|
Debt type
|
Rating
|
Outlook
|
Rating
|
Outlook
|
|||
|
Short-term unsecured debt
|
A-1
|
Stable
|
P-1
|
Stable
|
|||
|
Long-term unsecured debt
|
A+
|
Stable
|
A1
|
Stable
|
|||
Various factors affect our credit ratings, including changes in our operating performance, the economic environment, conditions in the electronic payment industry, our financial position and changes in our business strategy. We do not currently foresee any reasonable circumstances under which our credit ratings would be significantly downgraded. If a downgrade were to occur, it could adversely impact, among other things, our future borrowing costs and access to capital markets.
40
Uses of Liquidity
Payments settlement.
Payments settlement due from and to our financial institution clients can represent a substantial daily liquidity requirement. U.S. dollar settlements are typically settled within the same day and do not result in a net receivable or payable balance, while settlement currencies other than the U.S. dollar generally remain outstanding for one to two business days, which is consistent with industry practice for such transactions. During
fiscal 2013
, however, we were only required to fund settlement-related working capital on a few days, including a peak net settlement receivable balance of $36 million. Our average daily net settlement position was a payable of $198 million.
Covered litigation.
We are parties to legal and regulatory proceedings with respect to a variety of matters, including certain litigation that we refer to as the covered litigation. As noted above, monetary liabilities from settlements of, or judgments in, the covered litigation are payable from the litigation escrow account. During
fiscal 2013
, we made
$4.4 billion
in covered litigation payments that were funded from the litigation escrow account, of which, $4.0 billion was paid into a settlement fund established pursuant to the definitive class settlement agreement in the interchange multidistrict litigation. Under the settlement agreement, if class members opt out of the damages portion of the class settlement, defendants are entitled to receive takedown payments of no more than 25% of the original cash payments made into the settlement fund, based on the percentage of payment card sales volume for a defined period attributable to merchants who opted out. See
Note 20—Legal Matters
to our consolidated financial statements. Upon final court approval of the settlement agreement, Visa's portion of the takedown payments, calculated to be
$1.1 billion
, will increase our current taxable income. The resulting increase in our current taxable income will increase our deferred tax asset and income tax payable by $387 million, which will have a negative impact on our free cash flow in the year the final court approval is rendered. See
Note 19—Income Taxes
to our consolidated financial statements. At
September 30, 2013
, the litigation escrow account had an available balance of
$49 million
. See
Note 3—Retrospective Responsibility Plan
to our consolidated financial statements.
Other litigation.
Judgments in and settlements of litigation, other than the covered litigation, could give rise to future liquidity needs.
Reduction in as-converted shares.
During
fiscal 2013
, we repurchased
33 million
shares of our class A common stock using
$5.4 billion
of operating cash on hand. At September 30, 2013, we had
$251 million
of remaining funds available for share repurchases under the current program authorized by the board of directors. In
October 2013
, our board of directors authorized an additional
$5.0 billion
share repurchase program. See
Note 14—Stockholders' Equity
to our consolidated financial statements.
Dividends
. During
fiscal 2013
, we paid
$864 million
in dividends. In
October 2013
, our board of directors declared a quarterly dividend in the aggregate amount of
$0.40
per share of class A common stock (determined in the case of class B and class C common stock on an as-converted basis). We expect to pay approximately
$255 million
in connection with this dividend on
December 3, 2013
. See
Note 14—Stockholders' Equity
to our consolidated financial statements. We expect to continue paying quarterly dividends in cash, subject to approval by our board of directors. Classes of B and C common stock will share ratably on an as-converted basis in such future dividends.
Visa Europe put option.
We have granted Visa Europe a perpetual put option which, if exercised, will require us to purchase all of the outstanding shares of capital stock of Visa Europe from its members. Visa Europe may exercise the put option at any time. The put option provides a formula for determining the purchase price of the Visa Europe shares, which subject to certain adjustments, applies Visa Inc.'s forward price-to-earnings multiple, or the "P/E ratio" (as defined in the option agreement) at the time the option is exercised to Visa Europe's adjusted sustainable income for the forward 12-month period, or the "adjusted sustainable income" (as defined in the option agreement). The calculation of Visa Europe's adjusted sustainable income under the terms of the put option agreement includes potentially material adjustments for cost synergies and other negotiated items. Upon exercise, the key inputs to this formula, including Visa Europe's adjusted sustainable income, will be the result of negotiation between us and Visa Europe. The put option provides an arbitration mechanism in the event that the two parties are unable to agree on the ultimate purchase price.
The fair value of the put option represents the value of Visa Europe's option, which, under certain conditions, could obligate us to purchase its member equity interest for an amount above fair value. At
September 30, 2013
, we determined the fair value of the put option liability to be approximately
$145 million
. While this amount represents the fair value of the put option at
September 30, 2013
, it does not represent the actual purchase price that we may be required to pay if the option is exercised. The purchase price we could be obligated to pay 285 days after exercise will represent a substantial financial obligation, which could be several billion dollars or more. We may
41
need to obtain third-party financing, either by borrowing funds or undertaking a subsequent equity offering in order to fund this payment. The amount of that potential obligation could vary dramatically based on, among other things, Visa Europe's adjusted sustainable income and our P/E ratio, in each case, as negotiated at the time the put option is exercised.
Given the perpetual nature of the put option and the various economic conditions which could be present at the time of exercise, our ultimate obligation in the event of exercise cannot be reliably estimated. The following table calculates our total obligation assuming, for illustrative purposes only, a range of P/E ratios for Visa Inc. and assuming that Visa Europe demonstrates $100 million of adjusted sustainable income at the date of exercise. The $100 million of assumed adjusted sustainable income provided below is for illustrative purposes only. This does not represent an estimate of the amount of adjusted sustainable income Visa Europe would have been able to demonstrate at
September 30, 2013
, or will be able to demonstrate at any point in time in the future. Should Visa Europe elect to exercise its option, we believe it is likely that it will implement changes in its business operations to move to a for-profit model in order to maximize its adjusted sustainable income and, as a result, to increase the purchase price. The table also provides the amount of increase or decrease in the payout, assuming the same range of estimated P/E ratios, for each $25 million of adjusted sustainable income above or below the assumed $100 million demonstrated at the time of exercise. At
September 30, 2013
, our estimated long-term P/E ratio was
16.9
x and the long-term P/E differential, the difference between this ratio and the estimated ratio applicable to Visa Europe, was
1.9
x. At
September 30, 2013
, the spot P/E ratio was
21.5
x and the spot P/E differential, the difference between this ratio and the estimated spot ratio applicable to Visa Europe, was
1.1
x. These ratios are for reference purposes only and are not necessarily indicative of the ratio or differential that could be applicable if the put option were exercised at any point in the future.
|
Visa Inc’s Forward
Price-to-Earnings Ratio
|
Payout Assuming
Adjusted Sustainable
Income of $100 million
(1)
|
Increase/Decrease in Payout
for Each $25 million of
Adjusted Sustainable
Income Above/Below $100 million
|
||||
|
(in millions)
|
(in millions)
|
|||||
|
25
|
$2,500
|
$625
|
||||
|
20
|
$2,000
|
$500
|
||||
|
15
|
$1,500
|
$375
|
||||
|
(1)
|
Given the large range of different economic environments and circumstances under which Visa Europe could decide to exercise its option, the ultimate purchase price could be several billion dollars or more.
|
Pension and other postretirement benefits.
We sponsor various qualified and non-qualified defined benefit pension plans that generally provide benefits based on years of service, age and eligible compensation. We also sponsor a postretirement benefit plan that provides postretirement medical benefits for retirees and dependents upon meeting minimum age and service requirements. Our policy with respect to our qualified pension plan is to contribute annually not less than the minimum required under the Employee Retirement Income Security Act. Our non-qualified pension and other postretirement benefit plans are funded on a current basis. We typically fund our qualified pension plan in September of each year. In fiscal 2013, 2012 and 2011, we made contributions to our pension and other postretirement plans of
$4 million
, $88 million, and $74 million, respectively. The lower contribution in fiscal 2013 was driven by a higher-than-expected rate of return on our plan assets during the year and an increase in the discount rate at September 30, 2013 compared to September 30, 2012. In
fiscal 2014
, given current projections and assumptions, we anticipate funding our defined benefit pension plans and other postretirement plan by approximately
$12 million
. The actual contribution amount will vary depending upon the funded status of the pension plan, movements in the discount rate, performance of the plan assets, and related tax consequences. See
Note 10—Pension, Postretirement and Other Benefits
to our consolidated financial statements.
Capital expenditures.
Our capital expenditures increased during
fiscal 2013
due to investments in technology, infrastructure and growth initiatives. We expect to continue investing in technology assets and payments system infrastructure to support our core business as well as our eCommerce and mobile initiatives.
Acquisitions.
There were no material acquisitions during
fiscal 2013
and 2012, compared to fiscal 2011, when we acquired PlaySpan and Fundamo for a total of $268 million, net of $22 million in cash received. We will continue to pursue our growth initiatives and to expand our product offerings through acquisitions and strategic partnerships in the future.
42
Fair Value Measurements—Financial Instruments
The assessment of fair value of our financial instruments is based on a fair value hierarchy that requires an entity to maximize the use of observable inputs and minimize the use of unobservable inputs when measuring fair value. Observable inputs are obtained from independent sources and can be validated by a third party, whereas unobservable inputs reflect assumptions regarding what a third party would use in pricing an asset or liability. As of
September 30, 2013
, our financial instruments measured at fair value on a recurring basis included approximately
$6.0 billion
of assets and
$160 million
of liabilities. Of these instruments,
$152 million
, or
2%
, had significant unobservable inputs, including the Visa Europe put option liability of
$145 million
, and
$7 million
of auction rate securities. See
Note 4—Fair Value Measurements and Investments
to our consolidated financial statements.
Off-Balance Sheet Arrangements
Our off-balance sheet arrangements are primarily comprised of guarantees and indemnifications. Visa has no off-balance sheet debt, other than lease and purchase order commitments, as discussed below and reflected in our contractual obligations table.
Indemnifications
We indemnify clients for settlement losses suffered due to the failure of any other clients to honor Visa-branded cards and payment products processed in accordance with our operating regulations. The amount of the indemnification is limited to the amount of unsettled Visa payment transactions at any point in time. We maintain global credit settlement risk policies and procedures to manage settlement risk, which may require clients to post collateral if certain credit standards are not met. See
Note 1—Summary of Significant Accounting Policies
and
Note 11—Settlement Guarantee Management
to our consolidated financial statements.
In the ordinary course of business, we enter into contractual arrangements with financial institutions and other clients under which we may agree to indemnify the client for certain types of losses incurred relating to the services we provide or otherwise relating to our performance under the applicable agreement.
Contractual Obligations
Our contractual commitments will have an impact on our future liquidity. The contractual obligations identified in the table below include both on- and off-balance sheet transactions that represent a material, expected or contractually committed future obligation as of September 30, 2013. We believe that we will be able to fund these obligations through cash generated from our operations and available credit facilities.
|
|
Payments Due by Period
|
||||||||||||||||||
|
|
Less than
1 Year
|
1-3
Years
|
3-5
Years
|
More than
5 Years
|
Total
|
||||||||||||||
|
|
(in millions)
|
||||||||||||||||||
|
Purchase orders
(1)
|
$
|
922
|
|
$
|
213
|
|
$
|
52
|
|
$
|
—
|
|
$
|
1,187
|
|
||||
|
Leases
(2)
|
100
|
|
120
|
|
55
|
|
82
|
|
357
|
|
|||||||||
|
Client incentives
(3)
|
2,835
|
|
3,969
|
|
2,406
|
|
1,705
|
|
10,915
|
|
|||||||||
|
Marketing and sponsorship
(4)
|
116
|
|
178
|
|
108
|
|
178
|
|
580
|
|
|||||||||
|
Dividends
(5)
|
255
|
|
—
|
|
—
|
|
—
|
|
255
|
|
|||||||||
|
Total
(6,7,8)
|
$
|
4,228
|
|
$
|
4,480
|
|
$
|
2,621
|
|
$
|
1,965
|
|
$
|
13,294
|
|
||||
|
(1)
|
Represents agreements to purchase goods and services that specify significant terms, including: fixed or minimum quantities to be purchased and fixed, minimum or variable price provisions, and the approximate timing of the transaction.
|
|
(2)
|
Includes operating leases for premises, equipment and software licenses, which range in terms from one to eighteen years.
|
|
(3)
|
Represents future cash payments for long-term contracts with financial institution clients and other business partners for various programs designed to build payments volume, increase Visa-branded card and product acceptance and win merchant routing transactions over our network. These agreements, which range in terms from one to thirteen years, can provide card issuance and/or conversion support, volume/growth targets and marketing and program support based on specific performance requirements. Payments under these agreements will generally be offset by revenues earned from higher corresponding payments and transaction volumes. These payment amounts are estimates and will change based on client performance, amendments to
|
43
existing contracts or execution of new contracts. Related amounts disclosed in
Note 17—Commitments and Contingencies
to our consolidated financial statements represent the associated expected reduction of revenue related to these agreements that we estimate we will record.
|
(4)
|
Visa is a party to contractual sponsorship agreements ranging from approximately three to sixteen years. These contracts are designed to help increase Visa-branded cards and volumes. Over the life of these contracts, Visa is required to make payments in exchange for certain advertising and promotional rights. In connection with these contractual commitments, Visa has an obligation to spend certain minimum amounts for advertising and marketing promotion over the life of the contract. For obligations where the individual years of spend are not specified in the contract, we have estimated the timing of when these amounts will be spent.
|
|
(5)
|
Includes expected dividend amount of
$255 million
as dividends were declared in
October 2013
and will be paid on
December 3, 2013
to all holders of record of Visa's common stock as of
November 15, 2013
.
|
|
(6)
|
We have liabilities for uncertain tax positions of $453 million. At September 30, 2013, we also accrued
$29 million
of interest and
$3 million
of penalties associated with our uncertain tax positions. We cannot determine the range of cash payments that will be made and the timing of the cash settlements, if any, associated with our uncertain tax positions. Therefore, no amounts related to these obligations have been included in the table.
|
|
(7)
|
Visa granted a perpetual put option to Visa Europe, which if exercised, will require us to purchase all of the outstanding shares of capital stock of Visa Europe from its members. Due to the perpetual nature of the instrument and the various economic conditions, which could exist when the put is exercised, the ultimate amount and timing of Visa's obligation, if any, cannot be reliably estimated. Therefore, no amounts related to this obligation have been included in the table. However, given the range of different economic environments and circumstances under which Visa Europe could exercise its option, the ultimate purchase price could be several billion dollars or more. The fair value of the Visa Europe put option itself totaling
$145 million
at September 30, 2013 has also been excluded from this table as it does not represent the amount, or an estimate of the amount, of Visa's obligation in the event of exercise. See the
Liquidity and Capital Resources
and
Critical Accounting Estimates
sections of this
Management's Discussion and Analysis of Financial Condition and Results of Operations
and
Note 2—Visa Europe
to our consolidated financial statements.
|
|
(8)
|
We evaluate the need to make contributions to our pension plan after considering the funded status of the pension plan, movements in the discount rate, performance of the plan assets and related tax consequences. Expected contributions to our pension plan have not been included in the table as such amounts are dependent upon the considerations discussed above, and may result in a wide range of amounts. See
Note 10—Pension, Postretirement and Other Benefits
to our consolidated financial statements and the
Liquidity and Capital Resources s
ection of this
Management's Discussion and Analysis of Financial Condition and Results of Operations.
|
Critical Accounting Estimates
Our consolidated financial statements are prepared in accordance with accounting principles generally accepted in the United States of America which require us to make judgments, assumptions and estimates that affect the amounts reported. See
Note 1—Summary of Significant Accounting Policies
to our consolidated financial statements. We have established policies and control procedures which seek to ensure that estimates and assumptions are appropriately governed and applied consistently from period to period. However, actual results could differ from our assumptions and estimates, and such differences could be material.
We believe that the following accounting estimates are the most critical to fully understand and evaluate our reported financial results, as they require our most subjective or complex management judgments, resulting from the need to make estimates about the effect of matters that are inherently uncertain and unpredictable.
Revenue Recognition
—
Client Incentives
Critical estimates.
We enter into incentive agreements with financial institution clients and other business partners for various programs designed to build payments volume, increase Visa-branded card and product acceptance and win merchant routing transactions over our network. These incentives are primarily accounted for as reductions to operating revenues; however, if a separate identifiable benefit at fair value can be established, they are accounted for as operating expenses. We generally capitalize advance incentive payments under these agreements if select criteria are met. The capitalization criteria include the existence of future economic benefits to Visa, the existence of legally enforceable recoverability language (e.g., early termination clauses), management's ability and intent to enforce the recoverability language and the ability to generate future earnings from the agreement in excess of amounts deferred. Capitalized amounts are amortized over the shorter of the period of contractual recoverability or the corresponding period of economic benefit. Incentives not yet paid are accrued
44
systematically and rationally based on management's estimate of each client's performance. These accruals are regularly reviewed and estimates of performance are adjusted as appropriate, based on changes in performance expectations, actual client performance, amendments to existing contracts or the execution of new contracts.
Assumptions and judgment.
Estimation of client incentives relies on forecasts of payments volume, card issuance and card conversion. Performance is estimated using customer-reported information, transactional information accumulated from our systems, historical information and discussions with our clients.
Impact if actual results differ from assumptions.
If our clients' actual performance or recoverable cash flows are not consistent with our estimates, client incentives may be materially different than initially recorded. Increases in incentive payments are generally driven by increased payments and transaction volume, which drive our net revenues. As a result, in the event incentive payments exceed estimates, such payments are not expected to have a material effect on our financial condition, results of operations or cash flows. The cumulative impact of a revision in estimates is recorded in the period such revisions become probable and estimable. For the year ended
September 30, 2013
, client incentives represented
16%
of gross operating revenues.
Fair Value
—
Visa Europe Put Option
Critical estimates.
We have granted Visa Europe a perpetual put option which, if exercised, will require us to purchase all of the outstanding shares of capital stock of Visa Europe from its members. The put option provides a formula for determining the purchase price of the Visa Europe shares, which, subject to certain adjustments, applies our forward price-to-earnings multiple, or the P/E ratio (as defined in the option agreement), at the time the option is exercised to Visa Europe's projected adjusted sustainable income for the forward 12-month period, or the adjusted sustainable income (as defined in the option agreement). The calculation of Visa Europe's adjusted sustainable income under the terms of the put option agreement includes potentially material adjustments for cost synergies and other negotiated items.
Upon exercise, the key inputs to this formula, including Visa Europe's adjusted sustainable income, will be the result of negotiation between us and Visa Europe. The put option provides an arbitration mechanism in the event that the two parties are unable to agree on the ultimate purchase price. See
Note 2—Visa Europe
to our consolidated financial statements for further detail regarding the calculation of the put exercise price under the agreement.
The fair value of Visa Europe's option was estimated to be approximately
$145 million
at
September 30, 2013
. While the put option is in fact non-transferable, this amount, recorded in our financial statements, represents our estimate of the amount we would be required to pay a third-party market participant to transfer the potential obligation in an orderly transaction. The fair value of the put option is computed by comparing the estimated strike price, under the terms of the put agreement, to the estimated fair value of Visa Europe. The fair value of Visa Europe is defined as the estimated amount a third-party market participant might pay in an arm's length transaction under normal business conditions. A probability of exercise assumption is applied to reflect the possibility that Visa Europe will never exercise its option.
While this amount represents the fair value of the put option at
September 30, 2013
, it does not represent the actual purchase price that we may be required to pay if the option is exercised, which could be several billion dollars or more. See the
Liquidity and Capital Resources
section of
Management's Discussion and Analysis of Financial Condition and Results of Operations
for further discussion.
Assumptions and judgment.
The most significant estimates used in the valuation of the put option are the assumed probability that Visa Europe will elect to exercise its option and the estimated differential between the forward price-to-earnings multiple applicable to our common stock, as defined in the put option agreement, and that applicable to Visa Europe on a stand-alone basis at the time of exercise, which we refer to as the P/E differential.
Probability of exercise—
Exercise of the put option is at the sole discretion of Visa Europe (on behalf of the Visa Europe shareholders pursuant to authority granted to Visa Europe, under its Articles of Association). We estimate the assumed probability of exercise based on reasonably available information including, but not limited to: (i) Visa Europe's stated intentions; (ii) indications that Visa Europe is preparing to exercise as reflected in its reported financial results; (iii) evaluation of market conditions, including the regulatory environment, that could impact the potential future profitability of Visa Europe; and (iv) qualitative factors applicable to Visa Europe's largest members, which could indicate a change in their need or desire to liquidate their investment holdings.
45
P/E differential—
The P/E differential is determined by estimating the relative difference in the forward price-to-earnings multiples applicable to our common stock, as defined in the put option agreement, and that applicable to Visa Europe at the time of exercise. For valuation purposes, the forward price-to-earnings multiple applicable to our common stock at the time of exercise is estimated by evaluating various quantitative measures and qualitative factors. Quantitatively, we estimate our P/E ratio by dividing the average stock price over the preceding 24 months (the “long-term P/E calculation”) and the last 30 trading dates (the “30-day P/E calculation”) prior to the measurement date by the median estimate of our net income per share for the 12 months starting with the next calendar quarter immediately following the reporting date. This median earnings estimate is obtained from the Institutional Brokers' Estimate System. We then determine the best estimate of our long-term price-to-earnings multiple for valuation purposes by qualitatively evaluating the 30-day P/E calculation as compared to the long-term P/E calculation. In this evaluation we examine both measures to determine whether differences, if any, are the result of a fundamental change in our long-term value or the result of short-term market volatility or other non-Company specific market factors that may not be indicative of our long-term forward P/E. We believe, given the perpetual nature of the put option, that a market participant would more heavily weigh long-term value indicators, as opposed to short-term indicators.
Factors that might indicate a fundamental change in long-term value include, but are not limited to, changes in the regulatory environment, client portfolios, long-term growth rates or new product innovations. A consistent methodology is applied to a group of comparable public companies used to estimate the forward price-to-earnings multiple applicable to Visa Europe. These estimates, therefore, are impacted by changes in stock prices and the financial market's expectations of our future earnings and those of comparable companies.
Other estimates of lesser significance include growth rates and foreign currency exchange rates applied in the calculation of Visa Europe's adjusted sustainable income. The valuation model assumes a large range of annual growth rates, reflecting the different economic environments and circumstances under which Visa Europe could decide to exercise its option. The lowest growth rates assumed reflect Visa Europe's current business model as an association, owned by its member banks, while the highest reflect a successful shift to a for-profit model in anticipation of its exercise. The scenarios with higher growth rates are assigned a significantly higher probability in the valuation model, as we believe a market participant would more heavily weigh these scenarios as it is likely that, should it choose to exercise its option, Visa Europe will seek to maximize the purchase price by adopting a for-profit business model in advance of exercising the put option. The foreign exchange rate used to translate Visa Europe's results from Euros to U.S. dollars reflects a blend of forward exchange rates observed in the marketplace. The assumed timing of exercise of the put option used in the various modeled scenarios is not an overly significant assumption in the valuation, as obligations calculated in later years are more heavily discounted in the calculation of present value.
Impact if actual results differ from assumptions.
In the determination of the fair value of the put option at
September 30, 2013
, we have assumed a
40%
probability of exercise by Visa Europe at some point in the future and an estimated long-term P/E differential at the time of exercise of approximately
1.9
x. The use of a probability of exercise that is
5%
higher than our estimate would have resulted in an increase of approximately
$18 million
in the value of the put option. An increase of 1.0x in the assumed P/E differential would have resulted in an increase of approximately
$84 million
in the value of the put option. The put option is exercisable at any time at the sole discretion of Visa Europe. As such, the put option liability is included in accrued liabilities in our consolidated balance sheet at
September 30, 2013
. Classification in current liabilities is not an indication of management's expectation of exercise and simply reflects the fact that this obligation could become payable within 12 months.
Legal and Regulatory Matters
Critical estimates.
We are currently involved in various legal proceedings, the outcomes of which are not within our complete control or may not be known for prolonged periods of time. Management is required to assess the probability of loss and amount of such loss, if any, in preparing our financial statements.
Assumptions and judgment.
We evaluate the likelihood of a potential loss from legal or regulatory proceedings to which we are a party. We record a liability for such claims when a loss is deemed probable and the amount can be reasonably estimated. Significant judgment may be required in the determination of both probability and whether an exposure is reasonably estimable. Our judgments are subjective based on the status of the legal or regulatory proceedings, the merits of our defenses and consultation with in-house and outside legal counsel. As additional information becomes available, we reassess the potential liability related to pending claims and may revise our estimates.
46
Our retrospective responsibility plan only addresses monetary liabilities from settlements of, or final judgments in, the covered litigation. The plan's mechanisms include the use of the litigation escrow account. The accrual related to the covered litigation could be either higher or lower than the litigation escrow account balance. We did not record an accrual for the covered litigation during fiscal 2013. See
Note 3—Retrospective Responsibility Plan
and
Note 20—Legal Matters
to our consolidated financial statements.
Impact if actual results differ from assumptions.
Due to the inherent uncertainties of the legal and regulatory processes in the multiple jurisdictions in which we operate, our judgments may be materially different than the actual outcomes, which could have material adverse effects on our business, financial conditions and results of operations. See
Note 20—Legal Matters
to our consolidated financial statements.
Income Taxes
Critical estimates.
In calculating our effective income tax rate, we make judgments regarding certain tax positions, including the timing and amount of deductions and allocations of income among various tax jurisdictions.
Assumptions and judgment.
We have various tax filing positions with regard to the timing and amount of deductions and credits, the establishment of liabilities for uncertain tax positions and the allocation of income among various tax jurisdictions. We are also required to inventory, evaluate and measure all uncertain tax positions taken or to be taken on tax returns and to record liabilities for the amount of such positions that may not be sustained, or may only be partially sustained, upon examination by the relevant taxing authorities.
Impact if actual results differ from assumptions.
Although we believe that our estimates and judgments are reasonable, actual results may differ from these estimates. Some or all of these judgments are subject to review by the taxing authorities. If one or more of the taxing authorities were to successfully challenge our right to realize some or all of the tax benefit we have recorded, and we were unable to realize this benefit, it could have a material and adverse effect on our financial results and cash flows.
|
ITEM 7A.
|
Quantitative and Qualitative Disclosures About Market Risk
|
Market risk is the potential economic loss arising from adverse changes in market factors. Our exposure to financial market risks results primarily from fluctuations in foreign currency exchange rates, interest rates and equity prices. Aggregate risk exposures are monitored on an ongoing basis.
Foreign Currency Exchange Rate Risk
Although most of our activities are transacted in U.S. dollars, we are exposed to adverse fluctuations in foreign currency exchange rates. Risks from foreign currency exchange rate fluctuations are primarily related to adverse changes in the U.S. dollar value of revenues generated from foreign currency-denominated transactions and adverse changes in the U.S. dollar value of payments in foreign currencies, primarily for expenses at our non-U.S. locations. We manage these risks by entering into foreign currency forward contracts that hedge exposures of the variability in the U.S. dollar equivalent of anticipated non-U.S. dollar denominated cash flows. Our foreign currency exchange rate risk management program reduces, but does not entirely eliminate, the impact of foreign currency exchange rate movements.
The aggregate notional amounts of our foreign currency forward contracts outstanding in our exchange rate risk management program, including contracts not designated for cash flow hedge accounting, were
$1.3 billion
and $739 million at
September 30, 2013
and
2012
, respectively. The aggregate notional amount outstanding at
September 30, 2013
, is fully consistent with our strategy and treasury policy aimed at reducing foreign exchange risk below a predetermined and approved threshold. However, actual results could materially differ from our forecast. The effect of a hypothetical
10%
change in the value of the U.S. dollar is estimated to create an additional fair value gain or loss of approximately
$85 million
on our foreign currency forward contracts outstanding at
September 30, 2013
. See
Note 1—Summary of Significant Accounting Policies
and
Note 12—Derivative Financial Instruments
to our consolidated financial statements.
We are also subject to foreign currency exchange risk in daily settlement activities. This risk arises from the timing of rate setting for settlement with clients relative to the timing of market trades for balancing currency positions. Risk in settlement activities is limited through daily operating procedures, including the utilization of Visa settlement systems and our interaction with foreign exchange trading counterparties.
47
Interest Rate Risk
Our investment portfolio assets are held in both fixed-rate and adjustable-rate securities. These assets are included in cash equivalents and short-term or long-term available-for-sale investments. Investments in fixed-rate instruments carry a degree of interest rate risk. The fair value of fixed-rate securities may be adversely impacted due to a rise in interest rates. Additionally, a falling-rate environment creates reinvestment risk because as securities mature, the proceeds are reinvested at a lower rate, generating less interest income. Historically, we have been able to hold investments until maturity. Neither our operating results or cash flows have been, nor are expected to be, materially impacted by a sudden change in market interest rates.
The fair value balances of our fixed-rate investment securities at
September 30, 2013
and
2012
were
$3.5 billion
and
$3.0 billion
, respectively. A hypothetical 100 basis point increase or decrease in interest rates would create an estimated change in fair value of approximately $38 million on our fixed-rate investment securities at
September 30, 2013
. The fair value balances of our adjustable-rate debt securities were
$1.1 billion
and
$923 million
at
September 30, 2013
and
2012
, respectively.
Visa Europe Put Option
We have a liability related to the put option with Visa Europe which is recorded at fair value at
September 30, 2013
. We are required to record any change in the fair value of the put option on a quarterly basis. In the determination of the fair value of the put option at
September 30, 2013
, we have assumed a
40%
probability of exercise by Visa Europe at some point in the future and a P/E differential, at the time of exercise, of approximately
1.9
x. The use of a probability of exercise
5%
higher than our estimate would have resulted in an increase of approximately
$18 million
in the value of the put option. An increase of 1.0x in the assumed P/E differential would have resulted in an increase of approximately
$84 million
in the value of the put option. See
Liquidity and Capital Resources
and
Critical Accounting Estimates
above.
Pension Plan Risk
Our U.S. defined benefit pension plan assets were
$1.1 billion
and
$973 million
and projected benefit obligations were
$897 million
and
$990 million
at
September 30, 2013
and
2012
, respectively. A material adverse decline in the value of pension plan assets and/or the discount rate for benefit obligations would result in a decrease in the funded status of the pension plan, an increase in pension cost and an increase in required funding. We will continue to monitor the performance of pension plan assets and market conditions as we evaluate the amount of our contribution to the pension plan for
fiscal 2014
, if any, which would be made in September 2014.
48
|
ITEM 8.
|
Financial Statements and Supplementary Data
|
VISA INC.
INDEX TO CONSOLIDATED FINANCIAL STATEMENTS
|
|
Page
|
|
As of September 30, 2013 and 2012 and for the years ended September 30, 2013, 2012 and 2011
|
|
49
Report of Independent Registered Public Accounting Firm
The Board of Directors and Stockholders
Visa Inc.:
We have audited the accompanying consolidated balance sheets of Visa Inc. and subsidiaries as of
September 30, 2013
and
2012
, and the related consolidated statements of operations, comprehensive income, changes in equity, and cash flows for each of the years in the three-year period ended
September 30, 2013
. We also have audited Visa Inc.’s internal control over financial reporting as of
September 30, 2013
, based on criteria established in
Internal Control – Integrated Framework (1992)
issued by the Committee of Sponsoring Organizations of the Treadway Commission (COSO). Visa Inc.’s management is responsible for these consolidated financial statements, for maintaining effective internal control over financial reporting, and for its assessment of the effectiveness of internal control over financial reporting, included in the accompanying Management’s Report on Internal Control over Financial Reporting. Our responsibility is to express an opinion on these consolidated financial statements and an opinion on the Company’s internal control over financial reporting based on our audits.
We conducted our audits in accordance with the standards of the Public Company Accounting Oversight Board (United States). Those standards require that we plan and perform the audits to obtain reasonable assurance about whether the financial statements are free of material misstatement and whether effective internal control over financial reporting was maintained in all material respects. Our audits of the consolidated financial statements included examining, on a test basis, evidence supporting the amounts and disclosures in the financial statements, assessing the accounting principles used and significant estimates made by management, and evaluating the overall financial statement presentation. Our audit of internal control over financial reporting included obtaining an understanding of internal control over financial reporting, assessing the risk that a material weakness exists, and testing and evaluating the design and operating effectiveness of internal control based on the assessed risk. Our audits also included performing such other procedures as we considered necessary in the circumstances. We believe that our audits provide a reasonable basis for our opinions.
A company’s internal control over financial reporting is a process designed to provide reasonable assurance regarding the reliability of financial reporting and the preparation of financial statements for external purposes in accordance with generally accepted accounting principles. A company’s internal control over financial reporting includes those policies and procedures that (1) pertain to the maintenance of records that, in reasonable detail, accurately and fairly reflect the transactions and dispositions of the assets of the company; (2) provide reasonable assurance that transactions are recorded as necessary to permit preparation of financial statements in accordance with generally accepted accounting principles, and that receipts and expenditures of the company are being made only in accordance with authorizations of management and directors of the company; and (3) provide reasonable assurance regarding prevention or timely detection of unauthorized acquisition, use, or disposition of the company’s assets that could have a material effect on the financial statements.
Because of its inherent limitations, internal control over financial reporting may not prevent or detect misstatements. Also, projections of any evaluation of effectiveness to future periods are subject to the risk that controls may become inadequate because of changes in conditions, or that the degree of compliance with the policies or procedures may deteriorate.
In our opinion, the consolidated financial statements referred to above present fairly, in all material respects, the financial position of Visa Inc. and subsidiaries as of
September 30, 2013
and
2012
, and the results of its operations and its cash flows for each of the years in the three-year period ended
September 30, 2013
, in conformity with U.S. generally accepted accounting principles. Also in our opinion, Visa Inc. maintained, in all material respects, effective internal control over financial reporting as of
September 30, 2013
, based on criteria established in
Internal Control – Integrated Framework (1992)
issued by the Committee of Sponsoring Organizations of the Treadway Commission.
/s/ KPMG LLP
San Francisco, California
November 21, 2013
50
VISA INC.
|
September 30,
2013 |
September 30,
2012 |
||||||
|
|
(in millions, except par value data)
|
||||||
|
Assets
|
|||||||
|
Cash and cash equivalents
|
$
|
2,186
|
|
$
|
2,074
|
|
|
|
Restricted cash—litigation escrow (Note 3)
|
49
|
|
4,432
|
|
|||
|
Investment securities (Note 4):
|
|||||||
|
Trading
|
75
|
|
66
|
|
|||
|
Available-for-sale
|
1,994
|
|
677
|
|
|||
|
Income tax receivable (Note 19)
|
142
|
|
179
|
|
|||
|
Settlement receivable
|
799
|
|
454
|
|
|||
|
Accounts receivable
|
761
|
|
723
|
|
|||
|
Customer collateral (Note 11)
|
866
|
|
823
|
|
|||
|
Current portion of client incentives
|
282
|
|
209
|
|
|||
|
Deferred tax assets (Note 19)
|
481
|
|
2,027
|
|
|||
|
Prepaid expenses and other current assets (Note 5)
|
187
|
|
122
|
|
|||
|
Total current assets
|
7,822
|
|
11,786
|
|
|||
|
Investment securities, available-for-sale (Note 4)
|
2,760
|
|
3,283
|
|
|||
|
Client incentives
|
89
|
|
58
|
|
|||
|
Property, equipment and technology, net (Note 6)
|
1,732
|
|
1,634
|
|
|||
|
Other assets (Note 5)
|
521
|
|
151
|
|
|||
|
Intangible assets, net (Note 7)
|
11,351
|
|
11,420
|
|
|||
|
Goodwill
|
11,681
|
|
11,681
|
|
|||
|
Total assets
|
$
|
35,956
|
|
$
|
40,013
|
|
|
|
Liabilities
|
|||||||
|
Accounts payable
|
$
|
184
|
|
$
|
152
|
|
|
|
Settlement payable
|
1,225
|
|
719
|
|
|||
|
Customer collateral (Note 11)
|
866
|
|
823
|
|
|||
|
Accrued compensation and benefits
|
523
|
|
460
|
|
|||
|
Client incentives
|
919
|
|
830
|
|
|||
|
Accrued liabilities (Note 8)
|
613
|
|
584
|
|
|||
|
Accrued litigation (Note 20)
|
5
|
|
4,386
|
|
|||
|
Total current liabilities
|
4,335
|
|
7,954
|
|
|||
|
Deferred tax liabilities (Note 19)
|
4,149
|
|
4,058
|
|
|||
|
Other liabilities (Note 8)
|
602
|
|
371
|
|
|||
|
Total liabilities
|
9,086
|
|
12,383
|
|
|||
|
Commitments and contingencies (Note 17)
|
|
|
|||||
See accompanying notes, which are an integral part of these consolidated financial statements.
51
VISA INC.
CONSOLIDATED BALANCE SHEETS—(Continued)
|
September 30,
2013 |
September 30,
2012 |
||||||
|
|
(in millions, except par value data)
|
||||||
|
Equity
|
|||||||
|
Preferred stock, $0.0001 par value, 25 shares authorized and none issued
|
$
|
—
|
|
$
|
—
|
|
|
|
Class A common stock, $0.0001 par value, 2,001,622 shares authorized, 508 and 535 shares issued and outstanding at September 30, 2013 and 2012, respectively (Note 14)
|
—
|
|
—
|
|
|||
|
Class B common stock, $0.0001 par value, 622 shares authorized, 245 shares issued and outstanding at September 30, 2013 and 2012 (Note 14)
|
—
|
|
—
|
|
|||
|
Class C common stock, $0.0001 par value, 1,097 shares authorized, 27 and 31 shares issued and outstanding at September 30, 2013 and 2012, respectively (Note 14)
|
—
|
|
—
|
|
|||
|
Additional paid-in capital
|
18,875
|
|
19,992
|
|
|||
|
Accumulated income
|
7,974
|
|
7,809
|
|
|||
|
Accumulated other comprehensive income (loss), net:
|
|||||||
|
Investment securities, available-for-sale
|
59
|
|
3
|
|
|||
|
Defined benefit pension and other postretirement plans
|
(60
|
)
|
(186
|
)
|
|||
|
Derivative instruments classified as cash flow hedges
|
23
|
|
13
|
|
|||
|
Foreign currency translation adjustments
|
(1
|
)
|
(1
|
)
|
|||
|
Total accumulated other comprehensive income (loss), net
|
21
|
|
(171
|
)
|
|||
|
Total equity
|
26,870
|
|
27,630
|
|
|||
|
Total liabilities and equity
|
$
|
35,956
|
|
$
|
40,013
|
|
|
See accompanying notes, which are an integral part of these consolidated financial statements.
52
VISA INC.
|
|
For the Years Ended
September 30,
|
||||||||||
|
|
2013
|
2012
|
2011
|
||||||||
|
|
(in millions, except per share data)
|
||||||||||
|
Operating Revenues
|
|||||||||||
|
Service revenues
|
$
|
5,352
|
|
$
|
4,872
|
|
$
|
4,261
|
|
||
|
Data processing revenues
|
4,642
|
|
3,975
|
|
3,478
|
|
|||||
|
International transaction revenues
|
3,389
|
|
3,025
|
|
2,674
|
|
|||||
|
Other revenues
|
716
|
|
704
|
|
655
|
|
|||||
|
Client incentives
|
(2,321
|
)
|
(2,155
|
)
|
(1,880
|
)
|
|||||
|
Total operating revenues
|
11,778
|
|
10,421
|
|
9,188
|
|
|||||
|
Operating Expenses
|
|||||||||||
|
Personnel
|
1,932
|
|
1,726
|
|
1,459
|
|
|||||
|
Marketing
|
876
|
|
873
|
|
870
|
|
|||||
|
Network and processing
|
468
|
|
414
|
|
357
|
|
|||||
|
Professional fees
|
412
|
|
385
|
|
337
|
|
|||||
|
Depreciation and amortization
|
397
|
|
333
|
|
288
|
|
|||||
|
General and administrative
|
451
|
|
451
|
|
414
|
|
|||||
|
Litigation provision (Note 20)
|
3
|
|
4,100
|
|
7
|
|
|||||
|
Total operating expenses
|
4,539
|
|
8,282
|
|
3,732
|
|
|||||
|
Operating income
|
7,239
|
|
2,139
|
|
5,456
|
|
|||||
|
Non-operating income
|
18
|
|
68
|
|
200
|
|
|||||
|
Income before income taxes
|
7,257
|
|
2,207
|
|
5,656
|
|
|||||
|
Income tax provision
|
2,277
|
|
65
|
|
2,010
|
|
|||||
|
Net income including non-controlling interest
|
4,980
|
|
2,142
|
|
3,646
|
|
|||||
|
Loss attributable to non-controlling interest
|
—
|
|
2
|
|
4
|
|
|||||
|
Net income attributable to Visa Inc.
|
$
|
4,980
|
|
$
|
2,144
|
|
$
|
3,650
|
|
||
See accompanying notes, which are an integral part of these consolidated financial statements.
53
VISA INC.
CONSOLIDATED STATEMENTS OF OPERATIONS—(Continued)
|
|
For the Years Ended
September 30,
|
||||||||||
|
|
2013
|
2012
|
2011
|
||||||||
|
|
(in millions, except per share data)
|
||||||||||
|
Basic earnings per share (Note 15)
|
|||||||||||
|
Class A common stock
|
$
|
7.61
|
|
$
|
3.17
|
|
$
|
5.18
|
|
||
|
Class B common stock
|
$
|
3.20
|
|
$
|
1.40
|
|
$
|
2.59
|
|
||
|
Class C common stock
|
$
|
7.61
|
|
$
|
3.17
|
|
$
|
5.18
|
|
||
|
Basic weighted-average shares outstanding (Note 15)
|
|||||||||||
|
Class A common stock
|
520
|
|
524
|
|
509
|
|
|||||
|
Class B common stock
|
245
|
|
245
|
|
245
|
|
|||||
|
Class C common stock
|
28
|
|
41
|
|
70
|
|
|||||
|
Diluted earnings per share (Note 15)
|
|||||||||||
|
Class A common stock
|
$
|
7.59
|
|
$
|
3.16
|
|
$
|
5.16
|
|
||
|
Class B common stock
|
$
|
3.19
|
|
$
|
1.39
|
|
$
|
2.58
|
|
||
|
Class C common stock
|
$
|
7.59
|
|
$
|
3.16
|
|
$
|
5.16
|
|
||
|
Diluted weighted-average shares outstanding (Note 15)
|
|||||||||||
|
Class A common stock
|
656
|
|
678
|
|
707
|
|
|||||
|
Class B common stock
|
245
|
|
245
|
|
245
|
|
|||||
|
Class C common stock
|
28
|
|
41
|
|
70
|
|
|||||
See accompanying notes, which are an integral part of these consolidated financial statements.
54
VISA INC.
CONSOLIDATED STATEMENTS OF COMPREHENSIVE INCOME
|
|
For the Years Ended
September 30,
|
||||||||||
|
|
2013
|
2012
|
2011
|
||||||||
|
|
(in millions)
|
||||||||||
|
Net income including non-controlling interest
|
$
|
4,980
|
|
$
|
2,142
|
|
$
|
3,646
|
|
||
|
Other comprehensive income (loss), net of tax:
|
|||||||||||
|
Investment securities, available-for-sale:
|
|||||||||||
|
Net unrealized gain (loss)
|
88
|
|
4
|
|
(1
|
)
|
|||||
|
Income tax effect
|
(33
|
)
|
(1
|
)
|
—
|
|
|||||
|
Reclassification adjustment for net loss (gain) realized in net income including non-controlling interest
|
1
|
|
—
|
|
(4
|
)
|
|||||
|
Income tax effect
|
—
|
|
—
|
|
2
|
|
|||||
|
Defined benefit pension and other postretirement plans
|
203
|
|
—
|
|
(117
|
)
|
|||||
|
Income tax effect
|
(77
|
)
|
—
|
|
46
|
|
|||||
|
Derivative instruments classified as cash flow hedges:
|
|||||||||||
|
Net unrealized gain
|
39
|
|
3
|
|
18
|
|
|||||
|
Income tax effect
|
(6
|
)
|
(1
|
)
|
(9
|
)
|
|||||
|
Reclassification adjustment for net (gain) loss realized in net income including non-controlling interest
|
(29
|
)
|
(14
|
)
|
62
|
|
|||||
|
Income tax effect
|
6
|
|
7
|
|
(13
|
)
|
|||||
|
Foreign currency translation adjustments
|
—
|
|
7
|
|
(9
|
)
|
|||||
|
Other comprehensive income (loss), net of tax
|
192
|
|
5
|
|
(25
|
)
|
|||||
|
Comprehensive income including non-controlling interest
|
5,172
|
|
2,147
|
|
3,621
|
|
|||||
|
Comprehensive loss attributable to non-controlling interest
|
—
|
|
2
|
|
4
|
|
|||||
|
Comprehensive income attributable to Visa Inc.
|
$
|
5,172
|
|
$
|
2,149
|
|
$
|
3,625
|
|
||
See accompanying notes, which are an integral part of these consolidated financial statements.
55
VISA INC.
CONSOLIDATED STATEMENTS OF CHANGES IN EQUITY
|
|
Common Stock
|
Additional
Paid-In
Capital
|
Accumulated
Income
(Deficit)
|
Accumulated
Other
Comprehensive
Income (Loss)
|
Non-
Controlling
Interest
|
Total
Equity
(Deficit)
|
||||||||||||||||||||||
|
|
Class A
|
Class B
|
Class C
|
|||||||||||||||||||||||||
|
|
(in millions, except per share data)
|
|||||||||||||||||||||||||||
|
Balance as of September 30, 2010
|
493
|
|
245
|
|
97
|
|
$
|
20,794
|
|
$
|
4,368
|
|
$
|
(151
|
)
|
$
|
3
|
|
$
|
25,014
|
|
|||||||
|
Net income attributable to Visa Inc.
|
3,650
|
|
3,650
|
|
||||||||||||||||||||||||
|
Loss attributable to non-controlling interest
|
(4
|
)
|
(4
|
)
|
||||||||||||||||||||||||
|
Other comprehensive loss, net of tax
|
(25
|
)
|
(25
|
)
|
||||||||||||||||||||||||
|
Comprehensive income including non-controlling interest
|
3,621
|
|
||||||||||||||||||||||||||
|
Issuance of restricted stock awards
|
1
|
|
—
|
|
||||||||||||||||||||||||
|
Vesting of restricted stock units and performance shares
|
1
|
|
||||||||||||||||||||||||||
|
Conversion of class C common stock upon sale into public market
|
50
|
|
(50
|
)
|
—
|
|
||||||||||||||||||||||
|
Share-based compensation (Note 16)
|
154
|
|
154
|
|
||||||||||||||||||||||||
|
Excess tax benefit for share-based compensation
|
18
|
|
18
|
|
||||||||||||||||||||||||
|
Cash proceeds from exercise of stock options
|
3
|
|
99
|
|
99
|
|
||||||||||||||||||||||
|
Restricted stock instruments settled in cash for taxes
|
(1
|
)
|
(22
|
)
|
(22
|
)
|
||||||||||||||||||||||
|
Cash dividends declared and paid, at a quarterly amount of $0.15 per as-converted share
|
(423
|
)
|
(423
|
)
|
||||||||||||||||||||||||
|
Repurchase of class A common stock
|
(27
|
)
|
(1,135
|
)
|
(889
|
)
|
(2,024
|
)
|
||||||||||||||||||||
|
Investment in partially-owned consolidated subsidiary
|
(1
|
)
|
1
|
|
—
|
|
||||||||||||||||||||||
|
Balance as of September 30, 2011
|
520
|
|
245
|
|
47
|
|
$
|
19,907
|
|
$
|
6,706
|
|
$
|
(176
|
)
|
$
|
—
|
|
$
|
26,437
|
|
|||||||
See accompanying notes, which are an integral part of these consolidated financial statements.
56
VISA INC.
CONSOLIDATED STATEMENTS OF CHANGES IN EQUITY—(Continued)
|
|
Common Stock
|
Additional
Paid-In
Capital
|
Accumulated
Income
(Deficit)
|
Accumulated
Other
Comprehensive
Income (Loss)
|
Non-
Controlling
Interest
|
Total
Equity
(Deficit)
|
||||||||||||||||||||||
|
|
Class A
|
Class B
|
Class C
|
|||||||||||||||||||||||||
|
|
(in millions, except per share data)
|
|||||||||||||||||||||||||||
|
Balance as of September 30, 2011
|
520
|
|
245
|
|
47
|
|
$
|
19,907
|
|
$
|
6,706
|
|
$
|
(176
|
)
|
$
|
—
|
|
$
|
26,437
|
|
|||||||
|
Net income attributable to Visa Inc.
|
2,144
|
|
2,144
|
|
||||||||||||||||||||||||
|
Loss attributable to non-controlling interest
|
(2
|
)
|
(2
|
)
|
||||||||||||||||||||||||
|
Other comprehensive income, net of tax
|
5
|
|
5
|
|
||||||||||||||||||||||||
|
Comprehensive income including non-controlling interest
|
2,147
|
|
||||||||||||||||||||||||||
|
Issuance of restricted stock awards
|
1
|
|
—
|
|
||||||||||||||||||||||||
|
Conversion of class C common stock upon sale into public market
|
16
|
|
(16
|
)
|
—
|
|
||||||||||||||||||||||
|
Share-based compensation (Note 16)
|
147
|
|
147
|
|
||||||||||||||||||||||||
|
Excess tax benefit for share-based compensation
|
71
|
|
71
|
|
||||||||||||||||||||||||
|
Cash proceeds from exercise of stock options
|
4
|
|
174
|
|
174
|
|
||||||||||||||||||||||
|
Restricted stock instruments settled in cash for taxes
(1)
|
—
|
|
(40
|
)
|
(40
|
)
|
||||||||||||||||||||||
|
Cash dividends declared and paid, at a quarterly amount of $0.22 per as-converted share
|
(595
|
)
|
(595
|
)
|
||||||||||||||||||||||||
|
Repurchase of class A common stock (Note 14)
|
(6
|
)
|
(264
|
)
|
(446
|
)
|
(710
|
)
|
||||||||||||||||||||
|
Purchase of non-controlling interest
|
(3
|
)
|
2
|
|
(1
|
)
|
||||||||||||||||||||||
|
Balance as of September 30, 2012
|
535
|
|
245
|
|
31
|
|
$
|
19,992
|
|
$
|
7,809
|
|
$
|
(171
|
)
|
$
|
—
|
|
$
|
27,630
|
|
|||||||
(1)
Decrease in class A common stock is less than 1 million shares.
See accompanying notes, which are an integral part of these consolidated financial statements.
57
VISA INC.
CONSOLIDATED STATEMENTS OF CHANGES IN EQUITY—(Continued)
|
|
Common Stock
|
Additional
Paid-In
Capital
|
Accumulated
Income
(Deficit)
|
Accumulated
Other
Comprehensive
Income (Loss)
|
Non-
Controlling
Interest
|
Total
Equity
(Deficit)
|
||||||||||||||||||||||
|
|
Class A
|
Class B
|
Class C
|
|||||||||||||||||||||||||
|
|
(in millions, except per share data)
|
|||||||||||||||||||||||||||
|
Balance as of September 30, 2012
|
535
|
|
245
|
|
31
|
|
$
|
19,992
|
|
$
|
7,809
|
|
$
|
(171
|
)
|
$
|
—
|
|
$
|
27,630
|
|
|||||||
|
Net income attributable to Visa Inc.
|
4,980
|
|
4,980
|
|
||||||||||||||||||||||||
|
Other comprehensive income, net of tax
|
192
|
|
192
|
|
||||||||||||||||||||||||
|
Comprehensive income including non-controlling interest
|
5,172
|
|
||||||||||||||||||||||||||
|
Issuance of restricted stock awards
|
1
|
|
—
|
|
||||||||||||||||||||||||
|
Conversion of class C common stock upon sale into public market
|
4
|
|
(4
|
)
|
—
|
|
||||||||||||||||||||||
|
Share-based compensation (Note 16)
|
179
|
|
179
|
|
||||||||||||||||||||||||
|
Excess tax benefit for share-based compensation
|
74
|
|
74
|
|
||||||||||||||||||||||||
|
Cash proceeds from exercise of stock options
|
1
|
|
108
|
|
108
|
|
||||||||||||||||||||||
|
Restricted stock instruments settled in cash for taxes
(1)
|
—
|
|
(64
|
)
|
(64
|
)
|
||||||||||||||||||||||
|
Cash dividends declared and paid, at a quarterly amount of $0.33 per as-converted share (Note 14)
|
(864
|
)
|
(864
|
)
|
||||||||||||||||||||||||
|
Repurchase of class A common stock (Note 14)
|
(33
|
)
|
(1,414
|
)
|
(3,951
|
)
|
(5,365
|
)
|
||||||||||||||||||||
|
Balance as of September 30, 2013
|
508
|
|
245
|
|
27
|
|
$
|
18,875
|
|
$
|
7,974
|
|
$
|
21
|
|
$
|
—
|
|
$
|
26,870
|
|
|||||||
(1)
Decrease in class A common stock is less than 1 million shares.
See accompanying notes, which are an integral part of these consolidated financial statements.
58
VISA INC.
|
|
For the Years Ended
September 30,
|
||||||||||
|
|
2013
|
2012
|
2011
|
||||||||
|
|
(in millions)
|
||||||||||
|
Operating Activities
|
|||||||||||
|
Net income including non-controlling interest
|
$
|
4,980
|
|
$
|
2,142
|
|
$
|
3,646
|
|
||
|
Adjustments to reconcile net income including non-controlling interest to net cash provided by operating activities:
|
|||||||||||
|
Amortization of client incentives
|
2,321
|
|
2,155
|
|
1,880
|
|
|||||
|
Share-based compensation
|
179
|
|
147
|
|
154
|
|
|||||
|
Excess tax benefit for share-based compensation
|
(74
|
)
|
(71
|
)
|
(18
|
)
|
|||||
|
Depreciation and amortization of property, equipment, technology and intangible assets
|
397
|
|
333
|
|
288
|
|
|||||
|
Deferred income taxes
|
1,527
|
|
(1,690
|
)
|
164
|
|
|||||
|
Litigation provision and accretion (Note 20)
|
3
|
|
4,101
|
|
18
|
|
|||||
|
Fair value adjustment for the Visa Europe put option
|
—
|
|
—
|
|
(122
|
)
|
|||||
|
Other
|
50
|
|
(8
|
)
|
(104
|
)
|
|||||
|
Change in operating assets and liabilities:
|
|||||||||||
|
Income tax receivable
|
37
|
|
(67
|
)
|
28
|
|
|||||
|
Settlement receivable
|
(345
|
)
|
(42
|
)
|
(4
|
)
|
|||||
|
Accounts receivable
|
(38
|
)
|
(161
|
)
|
(79
|
)
|
|||||
|
Client incentives
|
(2,336
|
)
|
(1,757
|
)
|
(1,857
|
)
|
|||||
|
Other assets
|
(543
|
)
|
41
|
|
(26
|
)
|
|||||
|
Accounts payable
|
40
|
|
(17
|
)
|
29
|
|
|||||
|
Settlement payable
|
506
|
|
270
|
|
36
|
|
|||||
|
Accrued and other liabilities
|
702
|
|
(227
|
)
|
129
|
|
|||||
|
Accrued litigation (Note 20)
|
(4,384
|
)
|
(140
|
)
|
(290
|
)
|
|||||
|
Net cash provided by operating activities
|
3,022
|
|
5,009
|
|
3,872
|
|
|||||
|
Investing Activities
|
|||||||||||
|
Purchases of property, equipment, technology and intangible assets
|
(471
|
)
|
(376
|
)
|
(353
|
)
|
|||||
|
Proceeds from disposal of property, equipment and technology
|
—
|
|
2
|
|
—
|
|
|||||
|
Investment securities, available-for-sale:
|
|||||||||||
|
Purchases
|
(3,164
|
)
|
(4,140
|
)
|
(1,910
|
)
|
|||||
|
Proceeds from sales and maturities
|
2,440
|
|
2,093
|
|
129
|
|
|||||
|
Purchases of / contributions to other investments
|
(3
|
)
|
(12
|
)
|
(13
|
)
|
|||||
|
Proceeds / distributions from other investments
|
34
|
|
22
|
|
116
|
|
|||||
|
Acquisitions, net of cash received
|
—
|
|
(3
|
)
|
(268
|
)
|
|||||
|
Net cash used in investing activities
|
(1,164
|
)
|
(2,414
|
)
|
(2,299
|
)
|
|||||
See accompanying notes, which are an integral part of these consolidated financial statements.
59
VISA INC.
CONSOLIDATED STATEMENTS OF CASH FLOWS—(Continued)
|
|
For the Years Ended
September 30,
|
||||||||||
|
|
2013
|
2012
|
2011
|
||||||||
|
|
(in millions)
|
||||||||||
|
Financing Activities
|
|||||||||||
|
Repurchase of class A common stock (Note 14)
|
(5,365
|
)
|
(710
|
)
|
(2,024
|
)
|
|||||
|
Dividends paid (Note 14)
|
(864
|
)
|
(595
|
)
|
(423
|
)
|
|||||
|
Deposits into litigation escrow account—retrospective responsibility plan (Note 3)
|
—
|
|
(1,715
|
)
|
(1,200
|
)
|
|||||
|
Payments from litigation escrow account—retrospective responsibility plan (Note 3)
|
4,383
|
|
140
|
|
280
|
|
|||||
|
Cash proceeds from exercise of stock options
|
108
|
|
174
|
|
99
|
|
|||||
|
Restricted stock and performance shares settled in cash for taxes
|
(64
|
)
|
—
|
|
—
|
|
|||||
|
Excess tax benefit for share-based compensation
|
74
|
|
71
|
|
18
|
|
|||||
|
Payments for earn-out related to PlaySpan acquisition
|
(12
|
)
|
(14
|
)
|
—
|
|
|||||
|
Principal payments on capital lease obligations
|
(6
|
)
|
(6
|
)
|
(10
|
)
|
|||||
|
Principal payments on debt
|
—
|
|
—
|
|
(44
|
)
|
|||||
|
Net cash used in financing activities
|
(1,746
|
)
|
(2,655
|
)
|
(3,304
|
)
|
|||||
|
Effect of exchange rate changes on cash and cash equivalents
|
—
|
|
7
|
|
(9
|
)
|
|||||
|
Increase (decrease) in cash and cash equivalents
|
112
|
|
(53
|
)
|
(1,740
|
)
|
|||||
|
Cash and cash equivalents at beginning of year
|
2,074
|
|
2,127
|
|
3,867
|
|
|||||
|
Cash and cash equivalents at end of year
|
$
|
2,186
|
|
$
|
2,074
|
|
$
|
2,127
|
|
||
|
Supplemental Disclosure
|
|||||||||||
|
Income taxes paid, net of refunds
|
$
|
595
|
|
$
|
2,057
|
|
$
|
1,731
|
|
||
|
Non-cash accruals related to purchases of property, equipment, technology and intangible assets
|
$
|
46
|
|
$
|
67
|
|
$
|
36
|
|
||
|
Interest payments on debt
|
$
|
—
|
|
$
|
—
|
|
$
|
3
|
|
||
See accompanying notes, which are an integral part of these consolidated financial statements.
60
VISA INC.
NOTES TO CONSOLIDATED FINANCIAL STATEMENTS
September 30, 2013
Note 1—Summary of Significant Accounting Policies
Organization
. In a series of transactions from October 1 to October 3, 2007, Visa Inc. ("Visa" or the "Company") undertook a reorganization in which Visa U.S.A. Inc. ("Visa U.S.A."), Visa International Service Association ("Visa International"), Visa Canada Corporation ("Visa Canada") and Inovant LLC ("Inovant") became direct or indirect subsidiaries of Visa and established the retrospective responsibility plan (the "October 2007 reorganization" or "reorganization"). See
Note 3—Retrospective Responsibility Plan
. The reorganization was reflected as a single transaction on October 1, 2007 using the purchase method of accounting with Visa U.S.A. as the accounting acquirer. Visa Europe Limited ("Visa Europe") did not become a subsidiary of Visa Inc., but rather remained owned and governed by its European member financial institutions. See
Note 2—Visa Europe
.
Visa is a global payments technology company that connects consumers, businesses, financial institutions and governments in more than 200 countries and territories to fast, secure and reliable electronic payments. Visa and its wholly-owned consolidated subsidiaries, including Visa U.S.A., Visa International, Visa Worldwide Pte. Limited (“VWPL”), Visa Canada, Inovant and CyberSource Corporation (“CyberSource”), operate one of the world's most advanced processing networks — VisaNet — which facilitates authorization, clearing and settlement of payment transactions worldwide. VisaNet also offers fraud protection for account holders and assured payment for merchants. Visa is not a bank and does not issue cards, extend credit or set rates and fees for account holders on Visa-branded cards and payment products. In most cases, account holder and merchant relationships belong to, and are managed by, Visa's financial institution clients. Visa provides a wide variety of payment solutions that support payment products that issuers can offer to their account holders: pay now with debit, pay ahead with prepaid or pay later with credit products. These services facilitate transactions on Visa's network among account holders, merchants, financial institutions and governments in mature and emerging markets globally.
Consolidation and basis of presentation
. The consolidated financial statements include the accounts of Visa and its consolidated entities and are presented in accordance with accounting principles generally accepted in the United States of America (“U.S. GAAP”). The Company consolidates its majority-owned and controlled entities, including variable interest entities (“VIEs”) for which the Company is the primary beneficiary. The Company's investments in VIEs have not been material to its consolidated financial statements as of and for the periods presented. Non-controlling interests are reported as a component of equity. All significant intercompany accounts and transactions are eliminated in consolidation.
Beginning in fiscal 2013, current income tax receivable is presented separately on the consolidated balance sheets. Previously, it had been included in the prepaid expenses and other current assets line. The Company also combined the interest income (expense), investment income and other lines on the consolidated statements of operations into one line entitled, "Non-operating income." All prior period information has been reclassified to conform to current period presentation.
The Company's activities are interrelated, and each activity is dependent upon and supportive of the other. All significant operating decisions are based on analysis of Visa as a single global business. Accordingly, the Company has one reportable segment, Payment Services.
Use of estimates
. The preparation of consolidated financial statements in conformity with U.S. GAAP requires management to make estimates and assumptions about future events. These estimates and assumptions affect the reported amounts of assets and liabilities and disclosure of contingent assets and liabilities at the date of the consolidated financial statements and reported amounts of revenues and expenses during the reporting period. Future actual results could differ materially from these estimates. The use of estimates in specific accounting policies is described further below as appropriate.
Cash and cash equivalents
. Cash and cash equivalents include cash and certain highly liquid investments with original maturities of 90 days or less from the date of purchase. Cash equivalents are primarily recorded at cost, which approximates fair value due to their generally short maturities.
Restricted cash—litigation escrow
. The Company maintains an escrow account from which settlements of, or judgments in, the covered litigation are paid. See
Note 3—Retrospective Responsibility Plan
and
Note 20—Legal Matters
for a discussion of the covered litigation. The escrow funds are held in money market investments, together
61
VISA INC.
NOTES TO CONSOLIDATED FINANCIAL STATEMENTS—(Continued)
September 30, 2013
with the interest earned, less applicable taxes payable, and classified as restricted cash on the consolidated balance sheets. Interest earned on escrow funds is included in non-operating income, on the consolidated statements of operations.
Investments and fair value.
The Company measures certain assets and liabilities at fair value. Fair value is the price that would be received to sell an asset or paid to transfer a liability in an orderly transaction between market participants at the measurement date. Fair value measurements are reported under a three-level valuation hierarchy. See
Note 4—Fair Value Measurements and Investments
.
The classification of the Company’s financial assets and liabilities within the hierarchy is as follows:
Level 1
—Inputs to the valuation methodology are unadjusted quoted prices in active markets for identical assets or liabilities. The Company’s Level 1 assets include money market funds, publicly-traded equity securities and U.S. Treasury securities.
Level 2
—Inputs to the valuation methodology can include: (1) quoted prices in active markets for similar (not identical) assets or liabilities; (2) quoted prices for identical or similar assets in non-active markets; (3) inputs other than quoted prices that are observable for the asset or liability; or (4) inputs that are derived principally from or corroborated by observable market data. The Company's Level 2 assets and liabilities include commercial paper, U.S. government-sponsored debt securities, corporate debt securities and foreign exchange derivative instruments.
Level 3
—Inputs to the valuation methodology are unobservable and cannot be corroborated by observable market data. The Company's Level 3 assets and liabilities include auction rate securities, the Visa Europe put option and the earn-out related to the PlaySpan acquisition.
Trading investment securities include mutual fund equity security investments related to various employee compensation and benefit plans. Trading activity in these investments is at the direction of the Company's employees. These investments are held in a trust and are not available for the Company's operational or liquidity needs. Interest and dividend income and changes in fair value are recorded in non-operating income, and offset in personnel expense on the consolidated statements of operations.
Available-for-sale investment securities include investments in debt and equity securities. These securities are recorded at cost at the time of purchase and are carried at fair value. The Company considers these securities to be available-for-sale to meet working capital and liquidity needs. Investments with original maturities of greater than 90 days and stated maturities of less than one year from the balance sheet date, or investments that the Company intends to sell within one year, are classified as current assets, while all other securities are classified as non-current assets. The majority of these investments are classified as non-current as they have stated maturities of more than one year from the balance sheet date. However, these investments are generally available to meet short-term liquidity needs. Unrealized gains and losses are reported in accumulated other comprehensive income or loss on the consolidated balance sheets until realized. The specific identification method is used to calculate realized gain or loss on the sale of marketable securities, which is recorded in non-operating income on the consolidated statements of operations. Dividend and interest income are recognized when earned and are included in non-operating income on the consolidated statements of operations.
The Company evaluates its debt and equity securities for other-than-temporary impairment, or OTTI, on an ongoing basis. When there has been a decline in fair value of a debt or equity security below the amortized cost basis, the Company recognizes OTTI if: (1) it has the intent to sell the security; (2) it is more likely than not that it will be required to sell the security before recovery of the amortized cost basis; or (3) it does not expect to recover the entire amortized cost basis of the security. The Company has not presented required separate disclosures because its gross unrealized loss positions in debt or equity securities for the periods presented are not material. The Company had
no
OTTI for available-for-sale securities during fiscal 2013 and 2011. The Company recognized
$4 million
of OTTI for available-for-sale securities during fiscal 2012.
The Company applies the equity method of accounting for investments in other entities when it holds between
20%
and
50%
ownership in the entity or when it exercises significant influence. Under the equity method, the Company’s share of each entity’s profit or loss is reflected in non-operating income on the consolidated statements of operations. The equity method of accounting is also used for flow-through entities such as limited partnerships
62
VISA INC.
NOTES TO CONSOLIDATED FINANCIAL STATEMENTS—(Continued)
September 30, 2013
and limited liability companies when the investment ownership percentage is equal to or greater than
5%
of outstanding ownership interests, regardless of whether the Company has significant influence over the investees.
The Company applies the cost method of accounting for investments in other entities when it holds less than
20%
ownership in the entity and does not exercise significant influence, or for flow-through entities when the investment ownership is less than
5%
and the Company does not exercise significant influence. These investments consist of equity holdings in non-public companies and are recorded in other assets on the consolidated balance sheets.
The Company regularly reviews investments accounted for under the cost and equity methods for possible impairment, which generally involves an analysis of the facts and changes in circumstances influencing the investment, expectations of the entity’s cash flows and capital needs, and the viability of its business model.
Financial instruments
. The Company considers the following to be financial instruments: cash and cash equivalents, restricted cash-litigation escrow, trading and available-for-sale investment securities, settlement receivable and payable, customer collateral, non-marketable equity investments, settlement risk guarantee, derivative instruments, the Visa Europe put option and the earn-out provision related to the PlaySpan acquisition. See
Note 4—Fair Value Measurements and Investments
.
Settlement receivable and payable
. The Company operates systems for authorizing, clearing and settling payment transactions worldwide. U.S. dollar settlements are typically settled within the same day and do not result in a receivable or payable balance, while settlement currencies other than the U.S. dollar generally remain outstanding for one to two business days, resulting in amounts due from and to clients. These amounts are presented as settlement receivable and settlement payable on the consolidated balance sheets, respectively.
Customer collateral
. The Company holds cash deposits and other non-cash assets from certain clients in order to ensure their performance of settlement obligations arising from Visa-branded cards and payment products processed in accordance with the Company's operating regulations. The cash collateral assets are restricted and fully offset by corresponding liabilities and both balances are presented on the consolidated balance sheets. Non-cash collateral assets are held on behalf of the Company by a third party and are not recorded on the consolidated balance sheets. See
Note 11—Settlement Guarantee Management
.
Client incentives.
The Company enters into long-term contracts with financial institution clients and other business partners for various programs designed to build payments volume, increase Visa-branded card and product acceptance and win merchant routing transactions over Visa's network. These incentives are primarily accounted for as reductions to operating revenues or as operating expenses if a separate identifiable benefit at fair value can be established. The Company generally capitalizes advance incentive payments under these agreements if select criteria are met. The capitalization criteria include the existence of future economic benefits to Visa, the existence of legally enforceable recoverability language (e.g., early termination clauses), management's ability and intent to enforce the recoverability language and the ability to generate future earnings from the agreement in excess of amounts deferred. Capitalized amounts are amortized over the shorter of the period of contractual recoverability or the corresponding period of economic benefit. Incentives not yet paid are accrued systematically and rationally based on management's estimate of each client's performance. These accruals are regularly reviewed and estimates of performance are adjusted, as appropriate, based on changes in performance expectations, actual client performance, amendments to existing contracts or the execution of new contracts. See
Note 17—Commitments and Contingencies
.
Property, equipment and technology, net
. Property, equipment and technology are recorded at historical cost less accumulated depreciation and amortization, which are computed on a straight-line basis over the asset’s estimated useful life. Depreciation and amortization of technology, furniture, fixtures and equipment are computed over estimated useful lives ranging from
2
to
7
years. Capital leases are amortized over the lease term and leasehold improvements are amortized over the shorter of the useful life of the asset or lease term. Building improvements are depreciated between
3
and
40
years, and buildings are depreciated over
40
years. Improvements that increase functionality of the asset are capitalized and depreciated over the asset’s remaining useful life. Land and construction-in-progress are not depreciated. Fully depreciated assets are retained in property, equipment and technology, net, until removed from service.
63
VISA INC.
NOTES TO CONSOLIDATED FINANCIAL STATEMENTS—(Continued)
September 30, 2013
Technology includes purchased and internally developed software, including technology assets obtained through acquisitions. Internally developed software represents software primarily used by the VisaNet electronic payment network and CyberSource platform. Internal and external costs incurred during the preliminary project stage are expensed as incurred. Qualifying costs incurred during the application development stage are capitalized. Once the project is substantially complete and ready for its intended use these costs are amortized on a straight-line basis over the technology's estimated useful life. Acquired technology assets are initially recorded at fair value and amortized on a straight-line basis over the estimated useful life.
The Company evaluates the recoverability of long-lived assets for impairment annually or more frequently if events or changes in circumstances indicate that the carrying amount of an asset or asset group may not be recoverable. If the sum of expected undiscounted net future cash flows is less than the carrying amount of an asset or asset group, an impairment loss is recognized to the extent that the carrying amount of the asset or asset group exceeds its fair value. See
Note 6—Property, Equipment and Technology, Net
.
Leases
. The Company enters into operating and capital leases for the use of premises, software and equipment. Rent expense related to operating lease agreements, which may or may not contain lease incentives, is primarily recorded on a straight-line basis over the lease term.
Intangible assets, net
. The Company records identifiable intangible assets at fair value on the date of acquisition and evaluates the useful life of each asset.
Finite-lived intangible assets primarily consist of customer relationships, reacquired rights, reseller relationships and tradenames obtained through acquisitions. Finite-lived intangible assets are amortized on a straight-line basis and are tested for recoverability if events or changes in circumstances indicate that their carrying amounts may not be recoverable. These intangibles have useful lives ranging from
1
to
15
years. No events or changes in circumstances indicate that impairment existed as of
September 30, 2013
. See
Note 7—Intangible Assets, Net
.
Indefinite-lived intangible assets consist of tradename, customer relationships and the Visa Europe franchise right acquired in the October 2007 reorganization. Intangible assets with indefinite useful lives are not amortized but are evaluated for impairment annually or more frequently if events or changes in circumstances indicate that impairment may exist. The Company tests each category of indefinite-lived intangible assets for impairment on an aggregate basis, which may require the allocation of cash flows and/or an estimate of fair value to the assets or asset group. Impairment exists if the fair value of the indefinite-lived intangible asset is less than the carrying value. The Company relies on a number of factors when completing impairment assessments, including a review of discounted net future cash flows, business plans and the use of present value techniques.
In July 2012, the Financial Accounting Standards Board ("FASB") issued Accounting Standard Update ("ASU") 2012-02, which allows an entity to first assess qualitative factors to determine whether it is necessary to perform a quantitative impairment test for indefinite-lived intangible assets. The Company adopted ASU 2012-02 effective October 1, 2012, and applied the new guidance in its annual impairment review of indefinite-lived intangible assets as of February 1, 2013. The adoption did not have a material impact on the consolidated financial statements.
The Company completed its annual impairment review of indefinite-lived intangible assets as of
February 1, 2013
, and concluded there was
no
impairment as of that date. No recent events or changes in circumstances indicate that impairment of the Company's indefinite-lived intangible assets existed as of
September 30, 2013
.
Goodwill
. Goodwill represents the excess of the purchase price over the fair value of the net assets acquired in a business combination. Goodwill is not amortized but is evaluated for impairment at the reporting unit level annually as of February 1, or more frequently if events or changes in circumstances indicate that impairment may exist.
The Company evaluated its goodwill for impairment on
February 1, 2013
, and concluded there was
no
impairment as of that date. No recent events or changes in circumstances indicate that impairment existed as of
September 30, 2013
.
64
VISA INC.
NOTES TO CONSOLIDATED FINANCIAL STATEMENTS—(Continued)
September 30, 2013
Accrued litigation
. The Company evaluates the likelihood of an unfavorable outcome in legal or regulatory proceedings to which it is a party and records a loss contingency when it is probable that a liability has been incurred and the amount of the loss can be reasonably estimated. These judgments are subjective, based on the status of such legal or regulatory proceedings, the merits of the Company's defenses and consultation with corporate and external legal counsel. Actual outcomes of these legal and regulatory proceedings may differ materially from the Company's estimates. Litigation accruals associated with settled obligations to be paid over periods longer than one year are recorded at the present value of future payment obligations. The obligation is accreted to its full payment value with the corresponding accretion charge included in non-operating income in the consolidated statements of operations. The Company expenses legal costs as incurred in professional fees in the consolidated statements of operations. See
Note 20—Legal Matters
.
Revenue recognition
. The Company's operating revenues are comprised principally of service revenues, data processing revenues, international transaction revenues and other revenues, reduced by costs incurred under client incentives arrangements. The Company recognizes revenue when the price is fixed or determinable, persuasive evidence of an arrangement exists, the service is performed and collectability of the resulting receivable is reasonably assured.
Service revenues consist of revenues earned for providing financial institution clients with support services for the delivery of Visa-branded payment products and solutions. Current quarter service revenues are primarily assessed using a calculation of current pricing applied to the prior quarter's payments volume. The Company also earns revenues from assessments designed to support ongoing acceptance and volume growth initiatives, which are recognized in the same period the related volume is transacted.
Data processing revenues consist of revenues earned for authorization, clearing, settlement, network access and other maintenance and support services that facilitate transaction and information processing among the Company's financial institution clients globally and with Visa Europe. Data processing revenues are also earned for transactions processed by CyberSource's online payment gateway platform. Data processing revenues are recognized in the same period the related transactions occur or services are rendered.
International transaction revenues are earned for cross-border transaction processing and currency conversion activities. Cross-border transactions arise when the country of origin of the issuer is different from that of the merchant. International transaction revenues are primarily generated by cross-border payments and cash volume.
Other revenues consist mainly of license fees for use of the Visa brand, revenues earned from Visa Europe in connection with the Visa Europe Framework Agreement (see
Note 2—Visa Europe
), fees from account holder services, licensing and certification and other activities related to the Company's acquired entities. Other revenues also include optional service or product enhancements, such as extended account holder protection and concierge services. Other revenues are recognized in the same period the related transactions occur or services are rendered.
Marketing.
The Company expenses costs for the production of advertising as incurred. The cost of media advertising is expensed when the advertising takes place. Sponsorship costs are recognized over the period in which the Company benefits from the sponsorship rights. Promotional items are expensed as incurred, when the related services are received, or when the related event occurs.
Income taxes
. The Company's income tax expense consists of two components: current and deferred. Current income tax expense represents taxes paid or payable for the current period. Deferred tax assets and liabilities are recognized to reflect the future tax consequences attributable to temporary differences between the financial statement carrying amounts and the respective tax basis of existing assets and liabilities, and operating loss and credit carryforwards. Deferred tax assets and liabilities are measured using enacted tax rates expected to apply to taxable income in the years in which those temporary differences are expected to be recovered or settled. In assessing whether deferred tax assets are realizable, management considers whether it is more likely than not that some portion or all of the deferred tax assets will not be realized. A valuation allowance is recorded for the portions that are not expected to be realized based on the level of historical taxable income, projections of future taxable income over the periods in which the temporary differences are deductible, and qualifying tax planning strategies.
65
VISA INC.
NOTES TO CONSOLIDATED FINANCIAL STATEMENTS—(Continued)
September 30, 2013
Where interpretation of the tax law may be uncertain, the Company recognizes, measures and discloses income tax uncertainties. The Company accounts for interest expense and penalties related to uncertain tax positions in non-operating income in the consolidated statements of operations. The Company files a consolidated federal income tax return and, in certain states, combined state tax returns. Foreign taxes paid have historically been deducted to reduce federal income taxes payable. The Company elects to claim foreign tax credits in any given year if such election is beneficial to the Company. See
Note 19—Income Taxes
.
Pension and other postretirement benefit plans
. The Company’s defined benefit pension and other postretirement benefit plans are actuarially evaluated, incorporating various critical assumptions including the discount rate and the expected rate of return on plan assets (for qualified pension plans). The discount rate is based on a "bond duration matching" methodology, which reflects the matching of projected plan obligation cash flows to an average of high-quality corporate bond yield curves whose duration matches the projected cash flows. The expected rate of return on pension plan assets considers the current and expected asset allocation, as well as historical and expected returns on each plan asset class. Any difference between actual and expected plan experience, including asset return experience, in excess of a
10%
corridor is recognized in net periodic pension cost over the expected average employee future service period, which is approximately
8
years for United States plans. Other assumptions involve demographic factors such as retirement age, mortality, attrition and the rate of compensation increases. The Company evaluates assumptions annually and modifies them as appropriate.
The Company recognizes the funded status of its benefit plans in its consolidated balance sheets as other assets, accrued liabilities and other liabilities. The Company recognizes settlement losses when it settles pension benefit obligations, including making lump-sum cash payments to plan participants in exchange for their rights to receive specified pension benefits, when certain thresholds are met. See
Note 10—Pension, Postretirement and Other Benefits
.
Foreign currency remeasurement and translation
. The Company's functional currency is the U.S. dollar for the majority of its foreign operations. Transactions denominated in currencies other than the applicable functional currency are converted to the functional currency at the exchange rate on the transaction date. At period end, monetary assets and liabilities are remeasured to the functional currency using exchange rates in effect at the balance sheet date. Non-monetary assets and liabilities are remeasured at historical exchange rates. Gains and losses related to conversion and remeasurement are recorded in general and administrative expense in the consolidated statements of operations.
For certain foreign operations, the Company's functional currency may be the local currency in which a foreign subsidiary executes its business transactions. Translation from the local currency to the U.S. dollar is performed for balance sheet accounts using exchange rates in effect at the balance sheet date and for revenue and expense accounts using an average exchange rate for the period. Resulting translation adjustments are reported as a component of accumulated other comprehensive income or loss on the consolidated balance sheets.
Derivative financial instruments
. The Company uses foreign exchange forward derivative contracts to reduce its exposure to foreign currency rate changes on non-functional currency denominated forecasted operational cash flows. Derivatives are carried at fair value on a gross basis in either prepaid and other current assets or accrued liabilities on the consolidated balance sheets. At September 30, 2013, derivatives outstanding mature within 12 months or less. Gains and losses resulting from changes in fair value of derivative instruments are accounted for either in accumulated other comprehensive income or loss on the consolidated balance sheets, or in the consolidated statements of operations (in the corresponding account where revenue or expense is hedged, or to general and administrative for hedge amounts determined to be ineffective) depending on whether they are designated and qualify for hedge accounting. Fair value represents the difference in the value of the derivative instruments at the contractual rate and the value at current market rates, and generally reflects the estimated amounts that the Company would receive or pay to terminate the contracts at the reporting date based on broker quotes for the same or similar instruments. The Company does not enter into derivative contracts for speculative or trading purposes. See
Note 12—Derivative Financial Instruments
.
Guarantees and indemnifications
. The Company recognizes an obligation at inception for guarantees and indemnifications that qualify for recognition, regardless of the probability of occurrence. The Company indemnifies financial institution clients from settlement losses suffered due to the failure of any other client to honor Visa-
66
VISA INC.
NOTES TO CONSOLIDATED FINANCIAL STATEMENTS—(Continued)
September 30, 2013
branded cards and payment products processed in accordance with Visa's operating regulations. The estimated fair value of the liability for settlement indemnification is included in accrued liabilities on the consolidated balance sheets and is described in
Note 11—Settlement Guarantee Management
. The Company
indemnifies Visa Europe for claims arising from the Company’s or Visa Europe’s activities that are brought outside of Visa Europe’s region, as described in
Note 2—Visa Europe
.
Share-based compensation
. The Company recognizes share-based compensation cost using the fair value method of accounting. The Company recognizes compensation cost for awards with only service conditions on a straight-line basis over the requisite service period, which is generally the vesting period. Compensation cost for performance and market-condition-based awards is recognized on a graded-vesting basis. The amount is initially estimated based on target performance and is adjusted as appropriate based on management's best estimate throughout the performance period. See
Note 16—Share-based Compensation
.
Earnings per share
. The Company calculates earnings per share using the two-class method to reflect the different rights of each class and series of outstanding common stock. The dilutive effect of incremental common stock equivalents is reflected in diluted earnings per share by application of the treasury stock method. See
Note 15—Earnings Per Share
.
Recently Issued Accounting Pronouncements
In June 2011, the FASB issued ASU 2011-05, which impacts the presentation of comprehensive income. The guidance requires components of other comprehensive income to be presented with net income to arrive at total comprehensive income. This ASU impacts presentation only and does not impact the underlying components of other comprehensive income or net income. In December 2011, the FASB issued an amendment to ASU 2011-05, which deferred the requirement to report the effect of significant reclassifications out of other comprehensive income on the respective line items in net income. All other components of ASU 2011-05 became effective October 1, 2012. Adoption did not have a material impact on the consolidated financial statements.
In February 2013, the FASB issued ASU 2013-02, which established the effective date for the requirement to report the effect of significant reclassifications out of accumulated other comprehensive income on the respective line items in net income. The standard impacts presentation only and does not impact the underlying components of other comprehensive income or net income. The Company will adopt the standard effective October 1, 2013. The adoption is not expected to have a material impact on the consolidated financial statements.
In January 2013, the FASB issued ASU 2013-01, which clarifies the scope of ASU 2011-11. As amended, ASU 2011-11 requires disclosure of the effect or potential effect of offsetting arrangements on a Company's financial position as well as enhanced disclosure of the rights of offset associated with a Company's recognized derivative instruments, including bifurcated embedded derivatives, repurchase agreements and reverse repurchase agreements, and securities borrowing and lending transactions. The amended standard impacts presentation only and is not expected to have a material impact on the consolidated financial statements. The Company will adopt the standard effective October 1, 2013.
In February 2013, the FASB issued ASU 2013-04, which provides guidance for the recognition, measurement and disclosure of obligations resulting from joint and several liability arrangements for which the total amount of the obligation is fixed at the reporting date. The Company will adopt the standard effective October 1, 2014. The adoption is not expected to have a material impact on the consolidated financial statements.
In March 2013, the FASB issued ASU 2013-05, which clarifies the applicable guidance for the release of the cumulative translation adjustment into net income when a parent either sells a part or all of its investment in a foreign entity, or no longer holds a controlling financial interest in a subsidiary or group of assets that is a nonprofit activity or a business within a foreign entity. The Company will adopt the standard effective October 1, 2014. The adoption is not expected to have a material impact on the consolidated financial statements.
In July 2013, the FASB issued ASU 2013-11, which provides guidance for the financial statement presentation of an unrecognized tax benefit when a net operating loss carryforward, a similar tax loss or a tax credit carryforward exists. The Company will adopt the standard effective October 1, 2014. The adoption is not expected to have a material impact on the consolidated financial statements.
67
VISA INC.
NOTES TO CONSOLIDATED FINANCIAL STATEMENTS—(Continued)
September 30, 2013
Note 2—Visa Europe
As part of Visa's October 2007 reorganization, Visa Europe exchanged its ownership interest in Visa International and Inovant for Visa common stock
,
a put-call option agreement and a Framework Agreement, as described below.
Visa Europe put option agreement.
The Company granted Visa Europe a perpetual put option, which if exercised, will require Visa to purchase all of the outstanding shares of capital stock of Visa Europe from its members. The Company is required to purchase the shares of Visa Europe no later than
285
days after exercise of the put option. The put option agreement provides a formula for determining the purchase price of the Visa Europe shares, which, subject to certain adjustments, applies Visa Inc.'s forward price-to-earnings multiple, or the P/E ratio (as defined in the option agreement), at the time the option is exercised to Visa Europe's adjusted sustainable income for the forward 12-month period (as defined in the option agreement), or the adjusted sustainable income. The calculation of Visa Europe's adjusted sustainable income under the terms of the put option agreement includes potentially material adjustments for cost synergies and other negotiated items. Upon exercise, the key inputs to this formula, including Visa Europe's adjusted sustainable income, will be the result of negotiation between the Company and Visa Europe. The put option agreement provides an arbitration mechanism in the event that the two parties are unable to agree on the ultimate purchase price.
The fair value of the put option represents the value of Visa Europe's option, which, under certain conditions, could obligate the Company to purchase its member equity interest for an amount above fair value. The fair value of the put option does not represent the actual purchase price that the Company may be required to pay if the option is exercised, which could be several billion dollars or more. While the put option is in fact non-transferable, its fair value represents the Company's estimate of the amount the Company would be required to pay a third-party market participant to transfer the potential obligation in an orderly transaction.
The fair value of the put option is computed by comparing the estimated strike price, under the terms of the put option agreement, to the estimated fair value of Visa Europe. The fair value of Visa Europe is defined as the estimated amount a third-party market participant might pay in an arm's-length transaction under normal business conditions. A probability of exercise assumption is applied to reflect the possibility that Visa Europe will never exercise its option.
The estimated fair value of the put option represents a Level 3 accounting estimate due to a lack of trading in active markets and a lack of observable inputs in measuring fair value. See
Note 4—Fair Value Measurements and Investments
. The valuation of the put option therefore requires substantial judgment. The most subjective of estimates applied in valuing the put option are the assumed probability that Visa Europe will elect to exercise its option and the estimated differential between the P/E ratio and the P/E ratio applicable to Visa Europe on a standalone basis at the time of exercise, which the Company refers to as the “P/E differential.”
Exercise of the put option is at the sole discretion of Visa Europe (on behalf of the Visa Europe shareholders pursuant to authority granted to Visa Europe, under its Articles of Association). The Company estimates the assumed probability of exercise based on reasonably available information including, but not limited to: (i) Visa Europe's stated intentions; (ii) indications that Visa Europe is preparing to exercise as reflected in its reported financial results; (iii) evaluation of market conditions, including the regulatory environment, that could impact the potential future profitability of Visa Europe; and (iv) qualitative factors applicable to Visa Europe's largest members, which could indicate a change in their need or desire to liquidate their investment holdings. Factors impacting the assumed P/E differential used in the calculation include material changes in the P/E ratio of Visa and those of a group of comparable companies used to estimate the forward price-to-earnings multiple applicable to Visa Europe.
The Company determined the fair value of the put option to be approximately
$145 million
at
September 30, 2013
and
2012
. In determining the fair value of the put option on these dates, the Company assumed a
40%
probability of exercise by Visa Europe at some point in the future and an estimated long-term P/E differential at the time of exercise of
1.9
x. Changes in the fair value of the put option are recorded as non-cash, non-operating income in the Company's consolidated statements of operations. During fiscal 2011, the Company reduced the value of the put option by
$122 million
, recording non-cash, non-operating income in the consolidated statement of operations. The decrease in the value of the put option reflected the overall decrease in Visa's P/E during fiscal
68
VISA INC.
NOTES TO CONSOLIDATED FINANCIAL STATEMENTS—(Continued)
September 30, 2013
2011 as compared to fiscal 2010, and does not reflect any change in the likelihood that Visa Europe will exercise its option.
The put option is exercisable at any time at the sole discretion of Visa Europe. As such, the put option liability is included in accrued liabilities on the Company's consolidated balance sheet at
September 30, 2013
. Classification in current liabilities is not an indication of management's expectation of exercise and simply reflects the fact that the obligation resulting from the exercise of the instrument could become payable within 12 months.
Visa call option agreement.
Visa Europe granted to Visa a perpetual call option under which the Company may be entitled to purchase all of the share capital of Visa Europe. The Company may exercise the call option in the event of certain triggering events. These triggering events involve the performance of Visa Europe measured as an unremediated decline in the number of merchants or ATM's in the Visa Europe region that accepts Visa-branded products. The Company believes the likelihood of these events occurring is remote.
The Framework Agreement.
The relationship between Visa and Visa Europe is governed by a Framework Agreement, which provides for trademark and technology licenses and bilateral services as described below.
The Company granted to Visa Europe exclusive, irrevocable and perpetual licenses to use the Visa trademarks and technology intellectual property owned by the Company and certain affiliates within the Visa Europe region for use in the field of financial services, payments, related information technology and information processing services and participation in the Visa system. Visa Europe may sublicense the Visa trademarks and technology intellectual property to its members and other sublicensees under agreed-upon circumstances.
The base fee for these irrevocable and perpetual licenses is recorded in other revenues and was approximately
$143 million
per year for fiscal
2013
,
2012
and
2011
. This fee is eligible for adjustment annually based on the annual growth of the gross domestic product of the European Union, although the adjustment can never reduce the annual fee below
$143 million
. The Company determined through an analysis of the fee rates implied by the economics of the agreement that the base fee, as adjusted in future periods based on the growth of the gross domestic product of the European Union, approximates fair value.
In addition to the licenses, Visa provides Visa Europe with authorization, clearing and settlement services for cross-border transactions involving Visa Europe's region and the rest of the world. Visa Europe must comply with certain agreed-upon global rules governing the interoperability of Visa's systems with the systems of Visa Europe as well as the use and interoperability of the Visa trademarks. The parties will also guarantee the obligations of their respective clients and members to settle transactions, manage certain relationships with sponsors, clients and merchants, and comply with rules relating to the operation of the Visa enterprise. Under the Framework Agreement, the Company indemnifies Visa Europe for claims arising from the Company’s or Visa Europe’s activities that are brought outside of Visa Europe’s region; and Visa Europe likewise indemnifies the Company for such claims brought within Visa Europe’s region. However, Visa Europe has expressed an “initial” view that it is not obligated to indemnify the Company for any claim relating to the European Competition Proceedings, including claims asserted in both the European Commission matter and the U.K. Merchant Litigation. See
Note 20—Legal Matters
. The Company continues to firmly believe that Visa Europe is obligated to indemnify the Company for all such claims.
The Company has not recorded liabilities associated with these obligations as the fair value of such obligations was determined to be insignificant at
September 30, 2013
and
2012
, respectively. The Company has determined that the value of services exchanged as a result of these various agreements approximates fair value at
September 30, 2013
and
2012
, respectively.
Note 3—Retrospective Responsibility Plan
The Company has established several related mechanisms designed to address potential liability under certain litigation referred to as the “covered litigation." These mechanisms are included in and referred to as the retrospective responsibility plan, or the plan, and consist of a litigation escrow agreement, the conversion feature of the Company's shares of class B common stock, the indemnification obligations of the Visa U.S.A. members, an interchange judgment sharing agreement and a loss sharing agreement.
Covered litigation consists of:
69
VISA INC.
NOTES TO CONSOLIDATED FINANCIAL STATEMENTS—(Continued)
September 30, 2013
|
•
|
the Discover Litigation
. Discover Financial Services Inc. v. Visa U.S.A. Inc., Case No. 04-CV-07844 (S.D.N.Y) (settled);
|
|
•
|
the American Express Litigation
. American Express Travel Related Services Co., Inc. v. Visa U.S.A. Inc. et al., No. 04-CV-0897 (S.D.N.Y.), which the Company refers to as the American Express litigation (settled);
|
|
•
|
the Attridge Litigation
. Attridge v. Visa U.S.A. Inc. et al., Case No. CGC-04-436920 (Cal. Super.);
|
|
•
|
the Interchange Multidistrict Litigation
. In re Payment Card Interchange Fee and Merchant Discount Antitrust Litigation, 1:05-md-01720-JG-JO (E.D.N.Y.) or MDL 1720, including all cases currently included in MDL 1720, any other case that includes claims for damages relating to the period prior to the Company's IPO that has been or is transferred for coordinated or consolidated pre-trial proceedings at any time to MDL 1720 by the Judicial Panel on Multidistrict Litigation or otherwise included at any time in MDL 1720 by order of any court of competent jurisdiction and Kendall v. Visa U.S.A., Inc. et al., Case No. CO4-4276 JSW (N.D. Cal.); and
|
|
•
|
any claim that challenges the reorganization or the consummation thereof; provided that such claim is transferred for coordinated or consolidated pre-trial proceedings at any time to MDL 1720 by the Judicial Panel on Multidistrict Litigation or otherwise included at any time in MDL 1720 by order of any court of competent jurisdiction.
|
Litigation escrow agreement.
In accordance with the litigation escrow agreement, the Company maintains an escrow account, from which settlements of, or judgments in, the covered litigation are paid. The amount of the escrow is determined by the board of directors and the Company's litigation committee, all members of which are affiliated with, or act for, certain Visa U.S.A. members. The escrow funds are held in money market investments along with the interest earned, less applicable taxes, and are classified as restricted cash on the consolidated balance sheets.
The following table sets forth the changes in the litigation escrow account:
|
Fiscal 2013
|
Fiscal 2012
|
||||||
|
|
(in millions)
|
||||||
|
Balance at October 1
|
$
|
4,432
|
|
$
|
2,857
|
|
|
|
Payments to settlement funds:
(1)
|
|||||||
|
Class plaintiffs
|
(4,033
|
)
|
—
|
|
|||
|
Individual plaintiffs
|
(350
|
)
|
—
|
|
|||
|
Payments to American Express
|
—
|
|
(140
|
)
|
|||
|
Deposits into the litigation escrow account
|
—
|
|
1,715
|
|
|||
|
Balance at September 30
|
$
|
49
|
|
$
|
4,432
|
|
|
|
(1)
|
These payments are associated with the interchange multidistrict litigation. The settlement with the class plaintiffs in these proceedings is subject to final court approval, which the Company cannot assure will be received, and to the adjudication of any appeals. See
Note 20—Legal Matters
.
|
An accrual for the covered litigation and a change to the litigation provision are recorded when loss is deemed to be probable and reasonably estimable. In making this determination, the Company evaluates available information, including but not limited to recommendations made by the litigation committee. The accrual related to the covered litigation could be either higher or lower than the litigation escrow account balance. The Company did not record an additional accrual for the covered litigation during fiscal 2013. See
Note 20—Legal Matters
.
Conversion feature.
Under the terms of the plan, when the Company funds the litigation escrow account, the shares of class B common stock are subject to dilution through an adjustment to the conversion rate of the shares of class B common stock to shares of class A common stock. This has the same effect on earnings per share as repurchasing the Company's class A common stock, by reducing the class B conversion rate and consequently the as-converted class A common stock share count. See
Note 14—Stockholders' Equity
.
Indemnification obligations
. To the extent that amounts available under the litigation escrow arrangement and other agreements in the plan are insufficient to fully resolve the covered litigation, the Company will use
70
VISA INC.
NOTES TO CONSOLIDATED FINANCIAL STATEMENTS—(Continued)
September 30, 2013
commercially reasonable efforts to enforce the indemnification obligations of Visa U.S.A.'s members for such excess amount, including but not limited to enforcing indemnification obligations pursuant to Visa U.S.A.'s certificate of incorporation and bylaws and in accordance with their membership agreements.
Interchange judgment sharing agreement.
Visa U.S.A. and Visa International have entered into an interchange judgment sharing agreement with certain Visa U.S.A. members that have been named as defendants in the interchange multidistrict litigation, which is described in
Note 20—Legal Matters
. Under this judgment sharing agreement, Visa U.S.A. members that are signatories will pay their membership proportion of the amount of a final judgment not allocated to the conduct of MasterCard.
Loss sharing agreement.
Visa has entered into a loss sharing agreement with Visa U.S.A., Visa International and certain Visa U.S.A. members. The loss sharing agreement provides for the indemnification of Visa U.S.A., Visa International and, in certain circumstances, Visa with respect to: (i) the amount of a final judgment paid by Visa U.S.A. or Visa International in the covered litigation after the operation of the interchange judgment sharing agreement, plus any amounts reimbursable to the interchange judgment sharing agreement signatories; or (ii) the damages portion of a settlement of a covered litigation that is approved as required under Visa U.S.A.'s certificate of incorporation by the vote of Visa U.S.A.'s specified voting members. The several obligation of each bank that is a party to the loss sharing agreement will equal the amount of any final judgment enforceable against Visa U.S.A., Visa International or any other signatory to the interchange judgment sharing agreement, or the amount of any approved settlement of a covered litigation, multiplied by such bank's then-current membership proportion as calculated in accordance with Visa U.S.A.'s certificate of incorporation.
Omnibus agreement.
Visa entered into an omnibus agreement with MasterCard and certain Visa U.S.A. members that confirmed and memorialized the signatories’ intentions with respect to the loss sharing agreement, the interchange judgment sharing agreement and other agreements relating to the interchange multidistrict litigation. The Visa portion of a settlement or judgment in the interchange multidistrict litigation covered by the omnibus agreement would be allocated in accordance with specified provisions of the retrospective responsibility plan. See
Note 20—Legal Matters
.
Fair Value Measurements
The Company measures certain assets and liabilities at fair value. See
Note 1—Summary of Significant Accounting Policies
.
71
VISA INC.
NOTES TO CONSOLIDATED FINANCIAL STATEMENTS—(Continued)
September 30, 2013
Assets and Liabilities Measured at Fair Value on a Recurring Basis
|
Fair Value Measurements at September 30
Using Inputs Considered as
|
|||||||||||||||||||||||
|
Level 1
|
Level 2
|
Level 3
|
|||||||||||||||||||||
|
2013
|
2012
|
2013
|
2012
|
2013
|
2012
|
||||||||||||||||||
|
(in millions)
|
|||||||||||||||||||||||
|
Assets
|
|||||||||||||||||||||||
|
Cash equivalents and restricted cash:
|
|||||||||||||||||||||||
|
Money market funds
|
$
|
1,071
|
|
$
|
5,676
|
|
|||||||||||||||||
|
Commercial paper
|
$
|
51
|
|
$
|
93
|
|
|||||||||||||||||
|
Investment securities, trading:
|
|||||||||||||||||||||||
|
Equity securities
|
75
|
|
66
|
|
|||||||||||||||||||
|
Investment securities, available-for-sale:
|
|||||||||||||||||||||||
|
U.S. government-sponsored debt securities
|
2,704
|
|
2,821
|
|
|||||||||||||||||||
|
U.S. Treasury securities
|
1,673
|
|
1,066
|
|
|||||||||||||||||||
|
Equity securities
|
101
|
|
2
|
|
|||||||||||||||||||
|
Corporate debt securities
|
269
|
|
63
|
|
|||||||||||||||||||
|
Auction rate securities
|
$
|
7
|
|
$
|
7
|
|
|||||||||||||||||
|
Prepaid and other current assets:
|
|||||||||||||||||||||||
|
Foreign exchange derivative instruments
|
23
|
|
13
|
|
|||||||||||||||||||
|
Total
|
$
|
2,920
|
|
$
|
6,810
|
|
$
|
3,047
|
|
$
|
2,990
|
|
$
|
7
|
|
$
|
7
|
|
|||||
|
Liabilities
|
|||||||||||||||||||||||
|
Accrued liabilities:
|
|||||||||||||||||||||||
|
Visa Europe put option
|
$
|
145
|
|
$
|
145
|
|
|||||||||||||||||
|
Earn-out related to PlaySpan acquisition
|
—
|
|
12
|
|
|||||||||||||||||||
|
Foreign exchange derivative instruments
|
$
|
15
|
|
$
|
11
|
|
|||||||||||||||||
|
Total
|
$
|
—
|
|
$
|
—
|
|
$
|
15
|
|
$
|
11
|
|
$
|
145
|
|
$
|
157
|
|
|||||
There were
no
significant transfers between Level 1 and Level 2 assets during fiscal
2013
.
Level 1 assets measured at fair value on a recurring basis.
Money market funds, publicly-traded equity securities and U.S. Treasury securities are classified as Level 1 within the fair value hierarchy, as fair value is based on quoted prices in active markets. The overall decrease in the Company's Level 1 assets primarily reflects payments from the litigation escrow account totaling
$4.4 billion
in connection with the covered litigation.
See
Note 3—Retrospective Responsibility Plan
and
Note 20—Legal Matters
.
Level 2 assets and liabilities measured at fair value on a recurring basis.
The fair value of U.S. government-sponsored debt securities and corporate debt securities, as provided by third-party pricing vendors, is based on quoted prices in active markets for similar, not identical, assets. The pricing data obtained from outside sources is reviewed internally for reasonableness, compared against benchmark quotes from independent pricing sources, then confirmed or revised accordingly. Commercial paper and foreign exchange derivative instruments are valued using inputs that are observable in the market or can be derived principally from or corroborated by observable market data. There were no substantive changes to the valuation techniques and related inputs used to measure fair value during fiscal
2013
.
Level 3 assets and liabilities measured at fair value on a recurring basis.
Auction rate securities are classified as Level 3 due to a lack of trading in active markets and a lack of observable inputs in measuring fair value. There were no substantive changes to the valuation techniques and related inputs used to measure fair value during fiscal
2013
.
Visa Europe put option agreement.
The Company has granted Visa Europe a perpetual put option which is carried at fair value in accrued liabilities on the consolidated balance sheets. The fair value of the put option was
72
VISA INC.
NOTES TO CONSOLIDATED FINANCIAL STATEMENTS—(Continued)
September 30, 2013
$145 million
at
September 30, 2013
and
2012
. Changes in fair value are recorded as non-cash, non-operating income in the Company's consolidated statements of operations. See
Note 2—Visa Europe
.
The liability is classified within Level 3 as the assumed probability that Visa Europe will elect to exercise its option and the estimated P/E differential are among several unobservable inputs used to value the put option.
Earn-out related to PlaySpan acquisition.
In connection with the PlaySpan acquisition, the Company initially recorded a liability of
$24 million
to reflect the fair value of a potential earn-out provision included in the purchase agreement. The liability was classified as Level 3 due to a lack of observable inputs, such as the likelihood of meeting certain future revenue targets and other milestones. The fair value of the earn-out was reduced to
zero
, reflecting payments made in full during fiscal
2013
, upon achieving certain revenue targets and other milestones.
A separate roll-forward of Level 3 investments measured at fair value on a recurring basis is not presented because the primary activities during fiscal
2013
and
2012
are already discussed above.
Assets Measured at Fair Value on a Nonrecurring Basis
Non-marketable equity investments and investments accounted for under the equity method
. These investments are classified as Level 3 due to the absence of quoted market prices, the inherent lack of liquidity, and the fact that inputs used to measure fair value are unobservable and require management's judgment. When certain events or circumstances indicate that impairment may exist, the Company revalues the investments using various assumptions, including the financial metrics and ratios of comparable public companies. The Company recognized a
$15 million
other-than-temporary impairment loss related to these investments during fiscal
2013
, compared with a
$2 million
impairment loss recognized during fiscal
2012
and
no
impairment charges during
fiscal 2011
. At
September 30, 2013
and
2012
, these investments totaled
$30 million
and
$86 million
, respectively. These assets are classified in other assets on the consolidated balance sheets. See
Note 5—Prepaid Expenses and Other Assets
.
Due to a change in the Company's relationship with one of its investees during fiscal 2013, the Company reclassified equity securities previously accounted for as an equity method investment, with a carrying value of
$12 million
, to long-term available-for-sale investment securities. The fair value of this investment at
September 30, 2013
was
$99 million
, resulting in the recognition of a pre-tax unrealized gain of
$87 million
in other comprehensive income.
Non-financial assets and liabilities.
Long-lived assets such as goodwill, indefinite-lived intangible assets, finite-lived intangible assets, and property, equipment and technology are considered non-financial assets. The Company does not have any non-financial liabilities measured at fair value on a non-recurring basis. Finite-lived intangible assets primarily consist of customer relationships, tradenames, and reseller relationships, all of which were obtained through acquisitions. See
Note 7—Intangible Assets, Net
.
If the Company were required to perform a quantitative assessment for impairment testing of goodwill and indefinite-lived intangible assets, the fair values would generally be estimated using an income approach. As the assumptions employed to measure these assets on a non-recurring basis are based on management's judgment using internal and external data, these fair value determinations are classified as Level 3 in the fair value hierarchy. The Company completed its annual impairment review of its indefinite-lived intangible assets and goodwill as of
February 1, 2013
, and concluded that there was no impairment. No recent events or changes in circumstances indicate that impairment existed at
September 30, 2013
. See
Note 1—Summary of Significant Accounting Policies
.
Other Financial Instruments not Measured at Fair Value
Certain financial instruments are not measured at fair value on the Company's consolidated balance sheet but require disclosure of their fair values, including cash, settlement receivable and payable, and customer collateral. The estimated fair value of such instruments at
September 30, 2013
, approximates their carrying value due to their generally short maturities.
73
VISA INC.
NOTES TO CONSOLIDATED FINANCIAL STATEMENTS—(Continued)
September 30, 2013
Investments
Trading Investment Securities
Trading investment securities include mutual fund equity security investments related to various employee compensation and benefit plans. Trading activity in these investments is at the direction of the Company's employees. These investments are held in trust and are not available for the Company's operational or liquidity needs. Interest and dividend income and changes in fair value are recorded in non-operating income, and offset in personnel expense on the consolidated statements of operations. As of
September 30, 2013
and
2012
, trading investment securities totaled
$75 million
and
$66 million
, respectively.
Available-for-sale Investment Securities
The amortized cost, unrealized gains and losses and fair value of available-for-sale investment securities are as follows:
|
September 30, 2013
|
September 30, 2012
|
||||||||||||||||||||||||||||||
|
Amortized
Cost
|
Gross Unrealized
|
Fair
Value
|
Amortized
Cost
|
Gross Unrealized
|
Fair
Value
|
||||||||||||||||||||||||||
|
Gains
|
Losses
|
Gains
|
Losses
|
||||||||||||||||||||||||||||
|
(in millions)
|
|||||||||||||||||||||||||||||||
|
U.S. government-sponsored debt securities
|
$
|
2,701
|
|
$
|
3
|
|
$
|
—
|
|
$
|
2,704
|
|
$
|
2,818
|
|
$
|
3
|
|
$
|
—
|
|
$
|
2,821
|
|
|||||||
|
U.S. Treasury securities
|
1,671
|
|
2
|
|
—
|
|
1,673
|
|
1,065
|
|
1
|
|
—
|
|
1,066
|
|
|||||||||||||||
|
Equity securities
|
14
|
|
88
|
|
(1
|
)
|
101
|
|
4
|
|
—
|
|
(1
|
)
|
3
|
|
|||||||||||||||
|
Corporate debt securities
|
269
|
|
—
|
|
—
|
|
269
|
|
63
|
|
—
|
|
—
|
|
63
|
|
|||||||||||||||
|
Auction rate securities
|
7
|
|
—
|
|
—
|
|
7
|
|
7
|
|
—
|
|
—
|
|
7
|
|
|||||||||||||||
|
Total
|
$
|
4,662
|
|
$
|
93
|
|
$
|
(1
|
)
|
$
|
4,754
|
|
$
|
3,957
|
|
$
|
4
|
|
$
|
(1
|
)
|
$
|
3,960
|
|
|||||||
|
Less: current portion of available-for-sale investment securities
|
(1,994
|
)
|
(677
|
)
|
|||||||||||||||||||||||||||
|
Long-term available-for-sale investment securities
|
$
|
2,760
|
|
$
|
3,283
|
|
|||||||||||||||||||||||||
The available-for-sale investment securities primarily include U.S. government-sponsored debt securities, U.S. Treasury securities and corporate debt securities. Available-for-sale debt securities are presented below in accordance with their stated maturities. The majority of these investments,
$2.8 billion
, are classified as non-current, as they have stated maturities of more than one year from the balance sheet date. However, these investments are generally available to meet short-term liquidity needs.
|
Amortized Cost
|
Fair Value
|
||||||
|
|
(in millions)
|
||||||
|
September 30, 2013:
|
|||||||
|
Due within one year
|
$
|
1,989
|
|
$
|
1,992
|
|
|
|
Due after 1 year through 5 years
|
2,652
|
|
2,654
|
|
|||
|
Due after 5 years through 10 years
|
—
|
|
—
|
|
|||
|
Due after 10 years
|
7
|
|
7
|
|
|||
|
Total
|
$
|
4,648
|
|
$
|
4,653
|
|
|
74
VISA INC.
NOTES TO CONSOLIDATED FINANCIAL STATEMENTS—(Continued)
September 30, 2013
Investment Income
Investment income is recorded as non-operating income in the Company's consolidated statements of operations and consisted of the following:
|
|
For the Years Ended
September 30,
|
||||||||||
|
|
2013
|
2012
|
2011
|
||||||||
|
|
(in millions)
|
||||||||||
|
Interest and dividend income on cash and investments
|
$
|
27
|
|
$
|
17
|
|
$
|
16
|
|
||
|
Gain on other investments
|
5
|
|
17
|
|
92
|
|
|||||
|
Investment securities, trading:
|
|||||||||||
|
Unrealized gains (losses), net
|
4
|
|
9
|
|
(5
|
)
|
|||||
|
Realized gains (losses), net
|
2
|
|
(1
|
)
|
1
|
|
|||||
|
Investment securities, available-for-sale:
|
|||||||||||
|
Realized (losses) gains, net
|
(1
|
)
|
—
|
|
4
|
|
|||||
|
Other-than-temporary impairment on investments
|
(15
|
)
|
(6
|
)
|
—
|
|
|||||
|
Investment income
|
$
|
22
|
|
$
|
36
|
|
$
|
108
|
|
||
The gain on other investments in fiscal 2011 primarily includes the pre-tax gain from the sale of the Company's equity interest in Visa Vale issuer Companhia Brasileira de Soluções e Serviços, or CBSS, of
$85 million
.
Note 5—Prepaid Expenses and Other Assets
Prepaid expenses and other current assets consisted of the following:
|
September 30,
2013 |
September 30,
2012 |
||||||
|
|
(in millions)
|
||||||
|
Prepaid expenses and maintenance
|
$
|
111
|
|
$
|
69
|
|
|
|
Foreign exchange derivative instruments—(See
|
23
|
|
13
|
|
|||
|
Other
|
53
|
|
40
|
|
|||
|
Total
|
$
|
187
|
|
$
|
122
|
|
|
Other non-current assets consisted of the following:
|
September 30,
2013 |
September 30,
2012 |
||||||
|
|
(in millions)
|
||||||
|
Non-current income tax receivable—
(
See
|
$
|
253
|
|
$
|
—
|
|
|
|
Pension assets—
(
See
|
192
|
|
23
|
|
|||
|
Other investments—
(
See
|
30
|
|
86
|
|
|||
|
Long-term prepaid expenses and other
|
46
|
|
42
|
|
|||
|
Total
|
$
|
521
|
|
$
|
151
|
|
|
|
(1)
|
The increase in non-current income tax receivable is mainly due to amended tax returns filed during
fiscal 2013
.
|
|
(2)
|
The increase in pension assets was mainly due to a higher-than-expected rate of return on pension assets during the year and an increase in the discount rate at
September 30, 2013
compared to
September 30, 2012
.
|
75
VISA INC.
NOTES TO CONSOLIDATED FINANCIAL STATEMENTS—(Continued)
September 30, 2013
|
(3)
|
The decrease in other investments was mainly due to the recognition of an other-than-temporary impairment loss and subsequent sale of an investment, combined with a reclassification of equity securities to long-term available-for-sale investment securities following a change in the Company's relationship with an investee.
|
Property, equipment and technology, net, consisted of the following:
|
September 30,
2013 |
September 30,
2012 |
||||||
|
|
(in millions)
|
||||||
|
Land
|
$
|
71
|
|
$
|
71
|
|
|
|
Buildings and building improvements
|
766
|
|
751
|
|
|||
|
Furniture, equipment and leasehold improvements
|
983
|
|
837
|
|
|||
|
Construction-in-progress
|
74
|
|
69
|
|
|||
|
Technology
|
1,545
|
|
1,353
|
|
|||
|
Total property, equipment and technology
|
3,439
|
|
3,081
|
|
|||
|
Accumulated depreciation and amortization
|
(1,707
|
)
|
(1,447
|
)
|
|||
|
Property, equipment and technology, net
|
$
|
1,732
|
|
$
|
1,634
|
|
|
Technology consists of both purchased and internally developed software. Internally developed software primarily represents software utilized by the VisaNet electronic payment network and CyberSource platform. At
September 30, 2013
and
2012
, accumulated amortization for technology was
$959 million
and
$812 million
, respectively.
At
September 30, 2013
, estimated future amortization expense on technology was as follows:
|
Fiscal (in millions)
|
2014
|
2015
|
2016
|
2017
|
2018 and
thereafter
|
Total
|
|||||||||||||||||
|
Estimated future amortization expense
|
$
|
175
|
|
$
|
162
|
|
$
|
129
|
|
$
|
85
|
|
$
|
35
|
|
$
|
586
|
|
|||||
Depreciation and amortization expense related to property, equipment and technology was
$328 million
,
$265 million
and
$225 million
for fiscal
2013
,
2012
and
2011
, respectively. Included in those amounts was amortization expense on technology of
$173 million
,
$132 million
and
$102 million
for fiscal
2013
,
2012
and
2011
, respectively.
At
September 30, 2013
and
2012
, the Company’s indefinite-lived intangible assets consisted of customer relationships of
$6.8 billion
, Visa tradename of
$2.6 billion
and a Visa Europe franchise right of
$1.5 billion
, all of which were acquired as part of the Company’s October 2007 reorganization. Customer relationships represent the value of relationships with clients outside of the United States, excluding the European Union. Tradenames represent the value of the Visa brand outside of the United States, excluding the European Union. Visa Europe’s franchise right represents the value of the right to franchise the use of the Visa brand, use of Visa technology and access to the overall Visa network in the European Union.
76
VISA INC.
NOTES TO CONSOLIDATED FINANCIAL STATEMENTS—(Continued)
September 30, 2013
Indefinite-lived and finite-lived intangible assets consisted of the following:
|
September 30, 2013
|
September 30, 2012
|
||||||||||||||||||||||
|
|
Gross
|
Accumulated
Amortization
|
Net
|
Gross
|
Accumulated
Amortization
|
Net
|
|||||||||||||||||
|
|
(in millions)
|
||||||||||||||||||||||
|
Finite-lived intangible assets:
|
|||||||||||||||||||||||
|
Customer relationships
|
$
|
339
|
|
$
|
(125
|
)
|
$
|
214
|
|
$
|
339
|
|
$
|
(84
|
)
|
$
|
255
|
|
|||||
|
Tradenames
|
192
|
|
(41
|
)
|
151
|
|
192
|
|
(28
|
)
|
164
|
|
|||||||||||
|
Reseller relationships
|
95
|
|
(36
|
)
|
59
|
|
95
|
|
(25
|
)
|
70
|
|
|||||||||||
|
Other
|
52
|
|
(8
|
)
|
44
|
|
52
|
|
(4
|
)
|
48
|
|
|||||||||||
|
Total finite-lived intangible assets
|
$
|
678
|
|
$
|
(210
|
)
|
$
|
468
|
|
$
|
678
|
|
$
|
(141
|
)
|
$
|
537
|
|
|||||
|
Indefinite-lived intangible assets
|
10,883
|
|
10,883
|
|
|||||||||||||||||||
|
Total intangible assets, net
|
$
|
11,351
|
|
$
|
11,420
|
|
|||||||||||||||||
Amortization expense related to finite-lived intangible assets was
$69 million
,
$68 million
and
$63 million
for fiscal
2013
,
2012
and
2011
, respectively. At
September 30, 2013
, estimated future amortization expense on finite-lived intangible assets is as follows:
|
Fiscal (in millions)
|
2014
|
2015
|
2016
|
2017
|
2018 and
thereafter
|
Total
|
|||||||||||||||||
|
Estimated future amortization expense
|
$
|
66
|
|
$
|
62
|
|
$
|
49
|
|
$
|
47
|
|
$
|
244
|
|
$
|
468
|
|
|||||
There was
no
impairment related to the Company’s indefinite-lived or finite-lived intangible assets during fiscal
2013
,
2012
or
2011
.
Note 8—Accrued and Other Liabilities
Accrued liabilities consisted of the following:
|
September 30,
2013 |
September 30,
2012 |
||||||
|
|
(in millions)
|
||||||
|
Accrued operating expenses
|
$
|
182
|
|
$
|
194
|
|
|
|
Visa Europe put option—(See
|
145
|
|
145
|
|
|||
|
Deferred revenue
|
60
|
|
59
|
|
|||
|
Accrued marketing and product expenses
|
27
|
|
22
|
|
|||
|
Accrued income taxes—(See
Note 19—Income Taxes
)
|
64
|
|
58
|
|
|||
|
Other
|
135
|
|
106
|
|
|||
|
Total
|
$
|
613
|
|
$
|
584
|
|
|
Other long-term liabilities consisted of the following:
|
September 30,
2013 |
September 30,
2012 |
||||||
|
|
(in millions)
|
||||||
|
Accrued income taxes—(See
Note 19—Income Taxes
)
(2)
|
$
|
453
|
|
$
|
171
|
|
|
|
Employee benefits
|
86
|
|
93
|
|
|||
|
Other
|
63
|
|
107
|
|
|||
|
Total
|
$
|
602
|
|
$
|
371
|
|
|
|
(1)
|
The put option is exercisable at any time at the sole discretion of Visa Europe with payment required
285
days thereafter. Classification in current liabilities is not an indication of management’s expectation of exercise and
|
77
VISA INC.
NOTES TO CONSOLIDATED FINANCIAL STATEMENTS—(Continued)
September 30, 2013
simply reflects the fact that the obligation resulting from the exercise of the instrument could become payable within 12 months.
|
(2)
|
The increase in accrued income taxes is primarily related to increases in unrecognized tax benefits.
|
Commercial paper program.
Visa maintains a commercial paper program to support its working capital requirements and for other general corporate purposes. On
February 7, 2013
, the Company replaced the existing
$500 million
program with a new commercial paper program. Under the new program, the Company is authorized to issue up to
$3.0 billion
in outstanding notes, with maturities up to
397
days from the date of issuance. The Company had
no
outstanding obligations under the new program at
September 30, 2013
.
Credit facility.
On
January 31, 2013
, the Company entered into an unsecured
$3.0 billion
revolving credit facility. This credit facility, which expires on
January 30, 2014
, replaced the Company's existing
$3.0 billion
credit facility, which would have expired on
February 15, 2013
. The new credit facility contains covenants and events of default customary for facilities of this type. The participating lenders in the new credit facility include affiliates of certain holders of the Company's class B and class C common stock and some of the Company's clients or affiliates of its clients. The new credit facility is maintained to provide liquidity in the event of settlement failures by the Company's clients, to back up the commercial paper program and for general corporate purposes.
Interest on borrowings under the Credit Facility would be charged at the London Interbank Offered Rate ("LIBOR") or an alternative base rate, in each case plus applicable margins that fluctuate based on the applicable credit rating of the Company's senior unsecured long-term debt. Visa also agreed to pay a commitment fee that fluctuates based on the credit rating of the Company's senior unsecured long-term debt. Currently, the applicable margin is
0.00%
to
0.75%
depending on the type of the loan, and the commitment fee is
0.05%
. There were
no
borrowings under this facility and the Company was in compliance with all related covenants at
September 30, 2013
.
The Company sponsors various qualified and non-qualified defined benefit pension and other postretirement benefit plans that provide for retirement and medical benefits for substantially all employees residing in the United States. The Company uses a September 30 measurement date for its pension and other postretirement benefit plans.
Defined benefit pension plans.
The defined benefit pension plan benefits are based on years of service, age and eligible compensation. Prior to January 1, 2011, employees hired before January 1, 2008 earned benefits based on their pay during their last five years of employment. Employees hired or rehired on or after January 1, 2008, earned benefits based on a cash balance formula. Effective January 1, 2011, all employees began accruing benefits under the cash balance formula and ceased accruing benefits under any other formula. An employee’s cash balance account is credited with an amount equal to
6%
of eligible compensation plus interest based on 30-year Treasury securities. The funding policy is to contribute annually no less than the minimum required contribution under ERISA.
Postretirement benefits plan.
The postretirement benefits plan provides medical benefits for retirees and dependents who meet minimum age and service requirements. Benefits are provided from retirement date until age 65. Retirees must contribute on a monthly basis for the same coverage that is generally available to active employees and their dependents. The Company’s contributions are funded on a current basis.
Summary of Plan Activities
78
VISA INC.
NOTES TO CONSOLIDATED FINANCIAL STATEMENTS—(Continued)
September 30, 2013
Change in Benefit Obligation:
|
|
Pension Benefits
|
Other
Postretirement Benefits
|
|||||||||||||
|
|
September 30,
|
September 30,
|
|||||||||||||
|
|
2013
|
2012
|
2013
|
2012
|
|||||||||||
|
|
(in millions)
|
||||||||||||||
|
Benefit obligation—beginning of fiscal year
|
$
|
990
|
|
$
|
839
|
|
$
|
32
|
|
$
|
38
|
|
|||
|
Service cost
|
43
|
|
38
|
|
—
|
|
—
|
|
|||||||
|
Interest cost
|
35
|
|
40
|
|
1
|
|
1
|
|
|||||||
|
Actuarial (gain) loss
|
(127
|
)
|
132
|
|
(4
|
)
|
(3
|
)
|
|||||||
|
Benefit payments
|
(44
|
)
|
(60
|
)
|
(4
|
)
|
(4
|
)
|
|||||||
|
Settlements
|
—
|
|
1
|
|
—
|
|
—
|
|
|||||||
|
Benefit obligation—end of fiscal year
|
$
|
897
|
|
$
|
990
|
|
$
|
25
|
|
$
|
32
|
|
|||
|
Accumulated benefit obligation
|
$
|
892
|
|
$
|
982
|
|
NA
|
|
NA
|
|
|||||
|
Change in Plan Assets:
|
|||||||||||||||
|
Fair value of plan assets—beginning of fiscal year
|
$
|
973
|
|
$
|
783
|
|
$
|
—
|
|
$
|
—
|
|
|||
|
Actual return on plan assets
|
126
|
|
166
|
|
—
|
|
—
|
|
|||||||
|
Company contribution
|
—
|
|
84
|
|
4
|
|
4
|
|
|||||||
|
Benefit payments
|
(44
|
)
|
(60
|
)
|
(4
|
)
|
(4
|
)
|
|||||||
|
Fair value of plan assets—end of fiscal year
|
$
|
1,055
|
|
$
|
973
|
|
$
|
—
|
|
$
|
—
|
|
|||
|
Funded status at end of fiscal year
|
$
|
158
|
|
$
|
(17
|
)
|
$
|
(25
|
)
|
$
|
(32
|
)
|
|||
|
Recognized in Consolidated Balance Sheets:
|
|||||||||||||||
|
Non-current asset
|
$
|
192
|
|
$
|
23
|
|
$
|
—
|
|
$
|
—
|
|
|||
|
Current liability
|
(8
|
)
|
(8
|
)
|
(4
|
)
|
(4
|
)
|
|||||||
|
Non-current liability
|
(26
|
)
|
(32
|
)
|
(21
|
)
|
(28
|
)
|
|||||||
|
Funded status at end of fiscal year
|
$
|
158
|
|
$
|
(17
|
)
|
$
|
(25
|
)
|
$
|
(32
|
)
|
|||
79
VISA INC.
NOTES TO CONSOLIDATED FINANCIAL STATEMENTS—(Continued)
September 30, 2013
Amounts recognized in accumulated other comprehensive income before tax:
|
|
Pension Benefits
|
Other
Postretirement Benefits
|
|||||||||||||
|
September 30,
|
September 30,
|
||||||||||||||
|
|
2013
|
2012
|
2013
|
2012
|
|||||||||||
|
|
(in millions)
|
||||||||||||||
|
Net actuarial loss (gain)
|
$
|
108
|
|
$
|
328
|
|
$
|
(6
|
)
|
$
|
(3
|
)
|
|||
|
Prior service credit
|
(23
|
)
|
(33
|
)
|
(11
|
)
|
(14
|
)
|
|||||||
|
Total
|
$
|
85
|
|
$
|
295
|
|
$
|
(17
|
)
|
$
|
(17
|
)
|
|||
Amounts from accumulated other comprehensive income to be amortized into net periodic benefit cost in
fiscal 2014
:
|
Pension Benefits
|
Other
Postretirement
Benefits
|
||||||
|
|
(in millions)
|
||||||
|
Actuarial loss (gain)
|
$
|
2
|
|
$
|
(1
|
)
|
|
|
Prior service credit
|
(9
|
)
|
(3
|
)
|
|||
|
Total
|
$
|
(7
|
)
|
$
|
(4
|
)
|
|
Benefit obligation and fair value of plan assets with obligations in excess of plan assets:
|
|
Pension Benefits
|
||||||
|
September 30,
|
|||||||
|
|
2013
|
2012
|
|||||
|
|
(in millions)
|
||||||
|
Accumulated benefit obligation in excess of plan assets
|
|||||||
|
Accumulated benefit obligation—end of year
|
$
|
(33
|
)
|
$
|
(39
|
)
|
|
|
Fair value of plan assets—end of year
|
$
|
—
|
|
$
|
—
|
|
|
|
Projected benefit obligation in excess of plan assets
|
|||||||
|
Benefit obligation—end of year
|
$
|
(34
|
)
|
$
|
(40
|
)
|
|
|
Fair value of plan assets—end of year
|
$
|
—
|
|
$
|
—
|
|
|
80
VISA INC.
NOTES TO CONSOLIDATED FINANCIAL STATEMENTS—(Continued)
September 30, 2013
Net periodic pension and other postretirement plan cost:
|
|
Pension Benefits
|
Other
Postretirement Benefits
|
|||||||||||||||||||||
|
Fiscal
|
|||||||||||||||||||||||
|
|
2013
|
2012
|
2011
|
2013
|
2012
|
2011
|
|||||||||||||||||
|
|
(in millions)
|
||||||||||||||||||||||
|
Service cost
|
$
|
43
|
|
$
|
38
|
|
$
|
41
|
|
$
|
—
|
|
$
|
—
|
|
$
|
—
|
|
|||||
|
Interest cost
|
35
|
|
40
|
|
38
|
|
1
|
|
1
|
|
1
|
|
|||||||||||
|
Expected return on assets
|
(61
|
)
|
(55
|
)
|
(54
|
)
|
—
|
|
—
|
|
—
|
|
|||||||||||
|
Amortization of:
|
|||||||||||||||||||||||
|
Prior service credit
|
(9
|
)
|
(9
|
)
|
(9
|
)
|
(3
|
)
|
(3
|
)
|
(3
|
)
|
|||||||||||
|
Actuarial loss (gain)
|
28
|
|
33
|
|
19
|
|
(1
|
)
|
—
|
|
(1
|
)
|
|||||||||||
|
Net benefit cost
|
$
|
36
|
|
$
|
47
|
|
$
|
35
|
|
$
|
(3
|
)
|
$
|
(2
|
)
|
$
|
(3
|
)
|
|||||
|
Settlement loss
|
—
|
|
3
|
|
2
|
|
—
|
|
—
|
|
—
|
|
|||||||||||
|
Total net periodic benefit cost
|
$
|
36
|
|
$
|
50
|
|
$
|
37
|
|
$
|
(3
|
)
|
$
|
(2
|
)
|
$
|
(3
|
)
|
|||||
Other changes in plan assets and benefit obligations recognized in other comprehensive income:
|
|
Pension Benefits
|
Other
Postretirement Benefits
|
|||||||||||||
|
2013
|
2012
|
2013
|
2012
|
||||||||||||
|
|
(in millions)
|
||||||||||||||
|
Current year actuarial (gain) loss
|
$
|
(191
|
)
|
$
|
21
|
|
$
|
(4
|
)
|
$
|
(3
|
)
|
|||
|
Amortization of actuarial (loss) gain
|
(28
|
)
|
(36
|
)
|
1
|
|
—
|
|
|||||||
|
Amortization of prior service credit
|
9
|
|
9
|
|
3
|
|
3
|
|
|||||||
|
Total recognized in other comprehensive income
|
$
|
(210
|
)
|
$
|
(6
|
)
|
$
|
—
|
|
$
|
—
|
|
|||
|
Total recognized in net periodic benefit cost and other comprehensive income
|
$
|
(174
|
)
|
$
|
44
|
|
$
|
(3
|
)
|
$
|
(2
|
)
|
|||
Weighted Average Actuarial Assumptions:
|
|
Fiscal
|
|||||||
|
|
2013
|
2012
|
2011
|
|||||
|
Discount rate for benefit obligation:
(1)
|
||||||||
|
Pension
|
4.81
|
%
|
3.85
|
%
|
4.70
|
%
|
||
|
Postretirement
|
2.76
|
%
|
2.21
|
%
|
3.39
|
%
|
||
|
Discount rate for net periodic benefit cost:
|
||||||||
|
Pension
|
3.85
|
%
|
4.70
|
%
|
5.25
|
%
|
||
|
Postretirement
|
2.21
|
%
|
3.39
|
%
|
3.45
|
%
|
||
|
Expected long-term rate of return on plan assets
(2)
|
7.00
|
%
|
7.50
|
%
|
7.50
|
%
|
||
|
Rate of increase in compensation levels for:
|
||||||||
|
Benefit obligation
|
4.50
|
%
|
4.50
|
%
|
4.50
|
%
|
||
|
Net periodic benefit cost
|
4.50
|
%
|
4.50
|
%
|
4.50
|
%
|
||
|
(1)
|
Based on a “bond duration matching” methodology, which reflects the matching of projected plan liability cash flows to an average of high-quality corporate bond yield curves whose duration matches the projected cash flows.
|
81
VISA INC.
NOTES TO CONSOLIDATED FINANCIAL STATEMENTS—(Continued)
September 30, 2013
|
(2)
|
Primarily based on the targeted allocation, and evaluated for reasonableness by considering such factors as: (i) actual return on plan assets; (ii) historical rates of return on various asset classes in the portfolio; (iii) projections of returns on various asset classes; and (iv) current and prospective capital market conditions and economic forecasts.
|
The assumed annual rate of future increases in health benefits for the other postretirement benefits plan is
8.5%
for
fiscal 2014
. The rate is assumed to decrease to
5%
by 2020 and remain at that level thereafter. These trend rates reflect management’s expectations of future rates. Increasing or decreasing the healthcare cost trend by
1%
would change the postretirement plan benefit obligation by less than
$1 million
.
Pension Plan Assets
Pension plan assets are managed with a long-term perspective to ensure that there is an adequate level of assets to support benefit payments to participants over the life of the pension plan. Pension plan assets are managed by external investment managers. Investment manager performance is measured against benchmarks for each asset class on a quarterly basis. An independent consultant assists management with investment manager selections and performance evaluations.
Pension plan assets are broadly diversified to maintain a prudent level of risk and to provide adequate liquidity for benefit payments. The Company generally evaluates and rebalances the pension plan assets, as appropriate, to ensure that allocations are consistent with target allocation ranges. The current target allocation for pension plan assets is as follows: equity securities of
50%
to
80%
, fixed income securities of
25%
to
35%
and other, primarily consisting of cash to meet near term expected benefit payments and expenses, of up to
7%
. At
September 30, 2013
, pension plan asset allocations for the above categories were
71%
,
26%
and
3%
, respectively, which were within target allocation ranges.
The following table sets forth by level, within the fair value hierarchy, the pension plan’s investments at fair value as of
September 30, 2013
and
2012
, including the impact of unsettled transactions:
|
Fair Value Measurements at September 30,
|
||||||||||||||||||||||||||||||||
|
Level 1
|
Level 2
|
Level 3
|
Total
|
|||||||||||||||||||||||||||||
|
2013
|
2012
|
2013
|
2012
|
2013
|
2012
|
2013
|
2012
|
|||||||||||||||||||||||||
|
(in millions)
|
||||||||||||||||||||||||||||||||
|
Cash equivalents
|
$
|
26
|
|
$
|
79
|
|
$
|
26
|
|
$
|
79
|
|
||||||||||||||||||||
|
Collective investment funds
|
$
|
—
|
|
$
|
391
|
|
—
|
|
391
|
|
||||||||||||||||||||||
|
Corporate debt securities
|
106
|
|
115
|
|
106
|
|
115
|
|
||||||||||||||||||||||||
|
Debt securities of U.S. Treasury and federal agencies
|
149
|
|
121
|
|
149
|
|
121
|
|
||||||||||||||||||||||||
|
Asset-backed securities
|
$
|
23
|
|
$
|
25
|
|
23
|
|
25
|
|
||||||||||||||||||||||
|
Equity securities
|
751
|
|
242
|
|
751
|
|
242
|
|
||||||||||||||||||||||||
|
Total
|
$
|
777
|
|
$
|
321
|
|
$
|
255
|
|
$
|
627
|
|
$
|
23
|
|
$
|
25
|
|
$
|
1,055
|
|
$
|
973
|
|
||||||||
Level 1 assets.
Cash equivalents (money market funds) and equity securities are classified as Level 1 within the fair value hierarchy, as fair value is based on quoted prices in active markets.
Level 2 assets.
The fair values of government-sponsored and corporate debt securities are based on quoted prices in active markets for similar assets as provided by third-party pricing vendors. This pricing data is reviewed internally for reasonableness through comparisons with benchmark quotes from independent third-party sources. Based on this review, the valuation is confirmed or revised accordingly. Collective investment funds are unregistered investment vehicles that commingle the assets of multiple fiduciary clients, such as pension and other employee benefits plans, to invest in portfolios of stocks, bonds or other securities. A single collective investment fund, previously held by the pension plan, was ultimately invested in common stocks of companies in the S&P 500 index, and as its own unit value was not directly observable, it was therefore classified as Level 2.
82
VISA INC.
NOTES TO CONSOLIDATED FINANCIAL STATEMENTS—(Continued)
September 30, 2013
Level 3 assets.
Asset-backed securities are bonds that are backed by various types of assets and primarily consist of mortgage-backed securities. Asset-backed securities are classified as Level 3 due to a lack of observable inputs in measuring fair value.
There were no transfers between Level 1 and Level 2 assets during
fiscal 2013
or
2012
. A separate roll-forward of Level 3 plan assets measured at fair value is not presented because activities during
fiscal 2013
and
2012
were immaterial.
Cash Flows
|
Pension
Benefits
|
Other
Postretirement
Benefits
|
||||||
|
Actual employer contributions
|
(in millions)
|
||||||
|
2013
|
$
|
—
|
|
$
|
4
|
|
|
|
2012
|
$
|
84
|
|
$
|
4
|
|
|
|
Expected employer contributions
|
|||||||
|
2014
|
$
|
8
|
|
$
|
4
|
|
|
|
Expected benefit payments
|
|||||||
|
2014
|
$
|
116
|
|
$
|
4
|
|
|
|
2015
|
$
|
105
|
|
$
|
4
|
|
|
|
2016
|
$
|
108
|
|
$
|
3
|
|
|
|
2017
|
$
|
100
|
|
$
|
3
|
|
|
|
2018
|
$
|
96
|
|
$
|
3
|
|
|
|
2019-2023
|
$
|
413
|
|
$
|
10
|
|
|
The lower contribution to pension benefits in fiscal 2013 was driven by a higher-than-expected rate of return on the Company's plan assets during the year and an increase in the discount rate at September 30, 2013 compared to September 30, 2012.
Other Benefits
The Company sponsors a defined contribution plan, or 401(k) plan, that covers substantially all of its employees residing in the United States. Personnel costs included
$44 million
,
$37 million
and
$34 million
in fiscal
2013
,
2012
and
2011
, respectively, for expenses attributable to the Company’s employees under the 401(k) plan. The Company’s contributions to this 401(k) plan are funded on a current basis, and the related expenses are recognized in the period that the payroll expenses are incurred.
The Company indemnifies its financial institution clients for settlement losses suffered due to failure of any other client to honor Visa-branded cards and payment products processed in accordance with Visa's operating regulations. This indemnification creates settlement risk for the Company due to the difference in timing between the date of a payment transaction and the date of subsequent settlement. Settlement at risk, or exposure, is estimated based on the sum of the following inputs: (1) average daily volumes during the quarter multiplied by the estimated number of days to settle plus a safety margin; (2) four months of rolling average chargebacks volume; and (3) the total balance for outstanding Visa Travelers Cheques.
The Company maintains and regularly reviews global settlement risk policies and procedures to manage settlement exposure, which may require clients to post collateral if certain credit standards are not met.
The Company's settlement exposure is limited to the amount of unsettled Visa payment transactions at any point in time. The Company's estimated maximum settlement exposure increased to approximately
$53.8 billion
at
September 30, 2013
, compared to
$49.3 billion
at
September 30, 2012
, as a result of continued growth in the Company's business. Of these amounts,
$3.0 billion
and
$3.5 billion
at
September 30, 2013
and
2012
, respectively,
83
VISA INC.
NOTES TO CONSOLIDATED FINANCIAL STATEMENTS—(Continued)
September 30, 2013
were covered by collateral. The decrease in covered collateral was primarily due to a change in the composition of clients required to post collateral based on the Company's settlement risk policies. The total available collateral balances presented below were greater than the settlement exposure covered by customer collateral held due to instances in which the available collateral exceeded the total settlement exposure for certain financial institutions at each date presented.
The Company maintained collateral as follows:
|
September 30,
2013 |
September 30,
2012 |
||||||
|
|
(in millions)
|
||||||
|
Cash equivalents
|
$
|
866
|
|
$
|
823
|
|
|
|
Pledged securities at market value
|
256
|
|
307
|
|
|||
|
Letters of credit
|
1,191
|
|
1,084
|
|
|||
|
Guarantees
|
1,411
|
|
2,022
|
|
|||
|
Total
|
$
|
3,724
|
|
$
|
4,236
|
|
|
Cash equivalents collateral is reflected in customer collateral on the consolidated balance sheets as it is held in escrow in the Company's name. All other collateral is excluded from the consolidated balance sheets. Pledged securities are held by third parties in trust for the Company and clients. Letters of credit are provided primarily by client financial institutions to serve as irrevocable guarantees of payment.
Guarantees are provided primarily by parent financial institutions to secure the obligations of their subsidiaries. The Company routinely evaluates the financial viability of institutions providing the guarantees.
The fair value of the settlement risk guarantee is estimated using a proprietary model which considers statistically derived loss factors based on historical experience, estimated settlement exposures at period end and a standardized grading process for clients (using, where available, third-party estimates of the probability of customer failure). Historically, the Company experienced minimum losses, which has contributed to an estimated probability-weighted value of the guarantee of approximately
$1 million
at
September 30, 2013
and
2012
. These amounts were reflected in accrued liabilities on the consolidated balance sheets.
The Company maintains a rolling cash flow hedge program with the objective of reducing exchange rate risk from forecasted net exposures of revenues derived from and payments made in non-functional currencies during the following twelve months. The aggregate notional amounts of the Company's derivative contracts outstanding in its hedge program were
$1.1 billion
and
$690 million
at
September 30, 2013
and
2012
, respectively. The growth in the notional value of the Company's hedge program is mainly due to an increase in Visa's forecasted net exposure, combined with the Company's decision to hedge a larger percentage of those forecasted net exposures. As of
September 30, 2013
, the Company’s cash flow hedges in an asset position totaled
$23 million
and were classified in prepaid expenses and other current assets on the consolidated balance sheet, while cash flow hedges in a liability position totaled
$13 million
and were classified in accrued liabilities on the consolidated balance sheet. These amounts are subject to master netting agreements, which provide the Company with a legal right to net settle multiple payable and receivable positions with the same counterparty, in a single currency through a single payment. However, the Company presents fair values on a gross basis on the consolidated balance sheets
.
See
Note 1—Summary of Significant Accounting Policies
.
To qualify for cash flow hedge accounting treatment, the Company formally documents, at inception of the hedge, all relationships between the hedging transactions and the hedged items, as well as the Company's risk management objective and strategy for undertaking various hedge transactions. The Company also formally assesses whether the derivatives that are used in hedging transactions are highly effective in offsetting changes in the cash flows of the hedged items and whether those derivatives may be expected to remain highly effective in future periods.
84
VISA INC.
NOTES TO CONSOLIDATED FINANCIAL STATEMENTS—(Continued)
September 30, 2013
The Company uses regression analysis to assess effectiveness prospectively and retrospectively. The effectiveness tests are performed on the foreign exchange forward contracts based on changes in the spot rate of the derivative instrument compared to changes in the spot rate of the forecasted hedged transaction. Forward points are excluded for effectiveness testing and measurement purposes. The excluded forward points are reported in earnings. For fiscal
2013
,
2012
and
2011
, the amounts by which earnings were reduced relating to excluded forward points were
$14 million
,
$16 million
and
$20 million
, respectively.
The effective portion of changes in the fair value of derivative contracts is recorded as a component of accumulated other comprehensive income or loss on the consolidated balance sheets. When the forecasted transaction occurs and is recognized in earnings, the amount in accumulated other comprehensive income or loss related to that hedge is reclassified to operating revenue or expense. The Company expects to reclassify
$29 million
pre-tax, to earnings during fiscal 2014.
The Company's derivative financial instruments are subject to both credit and market risk. The Company monitors the credit-worthiness of the financial institutions that are counterparties to its derivative financial instruments and does not consider the risks of counterparty nonperformance to be significant. The Company mitigates this risk by entering into master netting agreements which require each party to post collateral against its net liability position with the respective counterparty. As of
September 30, 2013
, the Company has posted and received collateral of
$4 million
and
$14 million
, respectively, with counterparties, which are included in prepaid and other current assets, and accrued liabilities, respectively, on the consolidated balance sheet. Notwithstanding the Company’s efforts to manage foreign exchange risk, there can be no absolute assurance that its hedging activities will adequately protect against the risks associated with foreign currency fluctuations. Credit and market risks related to derivative instruments were not considered significant at
September 30, 2013
.
Additional disclosures that demonstrate how derivative instruments and related hedged items affect an entity's financial position, financial performance and cash flows have not been presented because the impact of derivative instruments is immaterial to the overall consolidated financial statements.
The Company’s long-lived net property, equipment and technology assets are classified by major geographic areas as follows:
|
September 30,
2013 |
September 30,
2012 |
||||||
|
|
(in millions)
|
||||||
|
United States
|
$
|
1,621
|
|
$
|
1,539
|
|
|
|
International
|
111
|
|
95
|
|
|||
|
Total
|
$
|
1,732
|
|
$
|
1,634
|
|
|
Revenue by geographic market is primarily based on the location of the issuing financial institution. Revenues earned in the United States were approximately
54%
,
55%
and
56%
of total operating revenues in fiscal
2013
,
2012
and
2011
, respectively. No individual country, other than the United States, generated more than 10% of total operating revenues in these years.
A significant portion of Visa’s operating revenues is concentrated among its largest clients. Loss of business from any of these clients could have an adverse effect on the Company. The Company did not have any customer that generated greater than
10%
of its net operating revenues in fiscal
2013
,
2012
or
2011
.
Note 14—Stockholders' Equity
The number of shares of each class and the number of shares of class A common stock on an as-converted basis at
September 30, 2013
, are as follows:
85
VISA INC.
NOTES TO CONSOLIDATED FINANCIAL STATEMENTS—(Continued)
September 30, 2013
|
(in millions except conversion rate)
|
Shares
Outstanding
|
Conversion Rate Into Class A
Common Stock
|
As-converted Class A Common
Stock
(1)
|
||
|
Class A common stock
|
508
|
—
|
508
|
||
|
Class B common stock
|
245
|
0.4206
|
103
|
||
|
Class C common stock
|
27
|
1.0000
|
27
|
||
|
Total
|
638
|
||||
|
(1)
|
Figures in the table may not recalculate exactly due to rounding. As-converted class A common stock is calculated based on whole numbers, not the rounded numbers presented.
|
Reduction in as-converted class A common stock.
The following table presents share repurchases in the open market during the following fiscal years:
|
(in millions, except per share data)
|
2013
|
2012
|
|||||||
|
Shares repurchased in the open market
(1)
|
33
|
|
6
|
|
|||||
|
Weighted-average repurchase price per share
|
$
|
161.94
|
|
$
|
114.87
|
|
|||
|
Total cost
|
$
|
5,365
|
|
$
|
710
|
|
|||
|
(1)
|
All shares repurchased in the open market have been retired and constitute authorized but unissued shares.
|
In
July 2013
, the Company's board of directors authorized a
$1.5 billion
share repurchase program to be in effect through
July 2014
. As of September 30, 2013, the program had remaining authorized funds of
$251 million
. All share repurchase programs authorized prior to July 2013 have been completed. In October 2013, the Company's board of directors authorized a new
$5.0 billion
share repurchase program.
Under the terms of the retrospective responsibility plan, when the Company makes a deposit into the litigation escrow account, the shares of class B common stock are subject to dilution through an adjustment to the conversion rate of the shares of class B common stock to shares of class A common stock. These deposits have the same economic effect on earnings per share as repurchasing the Company's class A common stock, because they reduce the class B conversion rate and consequently the as-converted class A common stock share count.
The following table presents as-converted class B common stock after deposits into the litigation escrow account in fiscal 2012. There were
no
deposits into the litigation escrow account in fiscal 2013.
|
Fiscal 2012
|
|||||||
|
(in millions, except per share and conversion rate data)
|
July 2012
|
December 2011
|
|||||
|
Deposits under the retrospective responsibility plan
|
$
|
150
|
|
$
|
1,565
|
|
|
|
Effective price per share
(1)
|
$
|
125.50
|
|
$
|
101.75
|
|
|
|
Reduction in equivalent number of shares of class A common stock
|
1
|
|
15
|
|
|||
|
Conversion rate of class B common stock to class A common stock after deposits
|
0.4206
|
|
0.4254
|
|
|||
|
As-converted class B common stock after deposits
|
103
|
|
104
|
|
|||
|
(1)
|
Effective price per share calculated using the volume-weighted average price of the Company's class A common stock over a pricing period in accordance with the Company's current certificate of incorporation.
|
Class B common stock.
The class B common stock is not convertible or transferable until the date on which all of the covered litigation has been finally resolved. This transfer restriction is subject to limited exceptions, including transfers to other holders of class B common stock. After termination of the restrictions, the class B common stock will be convertible into class A common stock if transferred to a person that was not a Visa Member (as defined in the current certificate of incorporation) or similar person or an affiliate of a Visa Member or similar person. Upon such transfer, each share of class B common stock will automatically convert into a number of shares of class A common stock based upon the applicable conversion rate in effect at the time of such transfer.
86
VISA INC.
NOTES TO CONSOLIDATED FINANCIAL STATEMENTS—(Continued)
September 30, 2013
Adjustment of the conversion rate occurs upon: (i) the completion of any follow-on offering of class A common stock completed to increase the size of the litigation escrow account (or any cash deposit by the Company in lieu thereof) resulting in a further corresponding decrease in the conversion rate; or (ii) the final resolution of the covered litigation and the release of funds remaining on deposit in the litigation escrow account to the Company resulting in a corresponding increase in the conversion rate.
Class C common stock.
As of
September 30, 2013
, all of the shares of class C common stock have been released from transfer restrictions, and
125 million
shares have been converted from class C to class A common stock upon their sale into the public market.
Preferred stock.
Preferred stock may be issued as redeemable or non-redeemable, and it has preference over any class of common stock with respect to the payment of dividends and distribution of the Company’s assets in the event of a liquidation or dissolution. The Company had no shares of preferred stock outstanding during and at the end of fiscal
2013
and
2012
.
Voting rights.
Holders of class A common stock have the right to vote on all matters on which stockholders generally are entitled to vote. Holders of classes B and C common stock have no right to vote on any matters, except for certain defined matters, including any consolidation, merger, combination or any decision to exit the core payments business, in which case the holders of classes B and C common stock are entitled to cast a number of votes equal to the number of shares of classes B or C common stock held multiplied by the applicable conversion rate in effect on the record date.
Dividends declared.
In
October 2013
, the Company’s board of directors declared a quarterly cash dividend of
$0.40
per share of class A common stock (determined in the case of class B and class C common stock on an as-converted basis), which will be paid on
December 3, 2013
, to all holders of record of the Company’s classes A, B and C common stock as of
November 15, 2013
. The Company declared and paid
$864 million
in dividends in
fiscal 2013
at a quarterly rate of
$0.33
per share.
The following table presents earnings per share for fiscal
2013
.
(1)
|
Basic Earnings Per Share
|
Diluted Earnings Per Share
|
|||||||||||||||||||||
|
(in millions, except per share data)
|
||||||||||||||||||||||
|
Income
Allocation
(A)
(2)
|
Weighted-
Average
Shares
Outstanding (B)
|
Earnings per
Share =
(A)/(B)
|
Income
Allocation
(A)
(2)
|
Weighted-
Average
Shares
Outstanding (B)
|
Earnings per
Share =
(A)/(B)
|
|||||||||||||||||
|
Class A common stock
|
$
|
3,959
|
|
520
|
|
$
|
7.61
|
|
$
|
4,980
|
|
656
|
|
(3)
|
$
|
7.59
|
|
|||||
|
Class B common stock
|
786
|
|
245
|
|
$
|
3.20
|
|
$
|
784
|
|
245
|
|
$
|
3.19
|
|
|||||||
|
Class C common stock
|
216
|
|
28
|
|
$
|
7.61
|
|
$
|
215
|
|
28
|
|
$
|
7.59
|
|
|||||||
|
Participating securities
(4)
|
19
|
|
Not presented
|
|
Not presented
|
|
$
|
19
|
|
Not presented
|
|
Not presented
|
|
|||||||||
|
Net income attributable to Visa Inc.
|
$
|
4,980
|
|
|||||||||||||||||||
87
VISA INC.
NOTES TO CONSOLIDATED FINANCIAL STATEMENTS—(Continued)
September 30, 2013
The following table presents earnings per share for fiscal
2012
.
(1)
|
Basic Earnings Per Share
|
Diluted Earnings Per Share
|
|||||||||||||||||||||
|
(in millions, except per share data)
|
||||||||||||||||||||||
|
Income
Allocation
(A)
(2)
|
Weighted-
Average
Shares
Outstanding (B)
|
Earnings per
Share =
(A)/(B)
|
Income
Allocation
(A)
(2)
|
Weighted-
Average
Shares
Outstanding (B)
|
Earnings per
Share =
(A)/(B)
|
|||||||||||||||||
|
Class A common stock
|
$
|
1,664
|
|
524
|
|
$
|
3.17
|
|
$
|
2,144
|
|
678
|
|
(3)
|
$
|
3.16
|
|
|||||
|
Class B common stock
|
343
|
|
245
|
|
$
|
1.40
|
|
$
|
341
|
|
245
|
|
$
|
1.39
|
|
|||||||
|
Class C common stock
|
130
|
|
41
|
|
$
|
3.17
|
|
$
|
129
|
|
41
|
|
$
|
3.16
|
|
|||||||
|
Participating securities
(4)
|
7
|
|
Not presented
|
|
Not presented
|
|
$
|
7
|
|
Not presented
|
|
Not presented
|
|
|||||||||
|
Net income attributable to Visa Inc.
|
$
|
2,144
|
|
|||||||||||||||||||
The following table presents earnings per share for fiscal
2011
.
(1)
|
Basic Earnings Per Share
|
Diluted Earnings Per Share
|
||||||||||||||||||||||
|
(in millions, except per share data)
|
|||||||||||||||||||||||
|
Income
Allocation
(A)
(2)
|
Weighted-
Average
Shares
Outstanding (B)
|
Earnings per
Share =
(A)/(B)
|
Income
Allocation
(A)
(2)
|
Weighted-
Average
Shares
Outstanding (B)
|
Earnings per
Share =
(A)/(B)
|
||||||||||||||||||
|
Class A common stock
|
$
|
2,638
|
|
509
|
|
$
|
5.18
|
|
$
|
3,650
|
|
707
|
|
(3
|
)
|
$
|
5.16
|
|
|||||
|
Class B common stock
|
636
|
|
245
|
|
$
|
2.59
|
|
$
|
633
|
|
245
|
|
$
|
2.58
|
|
||||||||
|
Class C common stock
|
364
|
|
70
|
|
$
|
5.18
|
|
$
|
363
|
|
70
|
|
$
|
5.16
|
|
||||||||
|
Participating securities
(4)
|
12
|
|
Not presented
|
|
Not presented
|
|
$
|
12
|
|
Not presented
|
|
Not presented
|
|
||||||||||
|
Net income attributable to Visa Inc.
|
$
|
3,650
|
|
||||||||||||||||||||
|
(1)
|
Figures in the table may not recalculate exactly due to rounding. Earnings per share is calculated based on whole numbers, not the rounded numbers presented.
|
|
(2)
|
Net income attributable to Visa Inc. is allocated based on proportional ownership on an as-converted basis. The weighted-average numbers of shares of as-converted class B common stock used in the income allocation were
103 million
,
108 million
and
123 million
for fiscal 2013, 2012 and 2011
,
respectively.
|
|
(3)
|
Weighted-average diluted shares outstanding are calculated on an as-converted basis, and include incremental common stock equivalents, as calculated under the treasury stock method. The computation includes
2 million
common stock equivalents for fiscal 2013 and
3 million
for fiscal 2012 and fiscal 2011, because their effect would have been dilutive. The computation excludes less than
1 million
of common stock equivalents for fiscal 2013 and 2012, and
2 million
for fiscal 2011 because their effect would have been anti-dilutive.
|
|
(4)
|
Participating securities are unvested share-based payment awards that contain non-forfeitable rights to dividends or dividend equivalents, such as the Company's restricted stock awards, restricted stock units and earned performance-based shares.
|
The Company’s 2007 Equity Incentive Compensation Plan, or the EIP, authorizes the compensation committee of the board of directors to grant non-qualified stock options ("options"), restricted stock awards ("RSAs"), restricted stock units ("RSUs") and performance-based shares to its employees and non-employee directors, for up to
59 million
shares of class A common stock. Shares available for award may be either authorized and unissued or previously issued shares subsequently acquired by the Company. The EIP will continue to be in effect until all of the common stock available under the EIP is delivered and all restrictions on those shares have lapsed, unless the EIP is terminated earlier by the Company’s board of directors.
No
awards may be granted under the plan on or after
10
years from its effective date.
Share-based compensation cost is recorded net of estimated forfeitures on a straight-line basis for awards with service conditions only, and on a graded-vesting basis for awards with service, performance and market
88
VISA INC.
NOTES TO CONSOLIDATED FINANCIAL STATEMENTS—(Continued)
September 30, 2013
conditions. The Company’s estimated forfeiture rate is based on an evaluation of historical, actual and trended forfeiture data. For fiscal
2013
,
2012
, and
2011
, the Company recorded share-based compensation cost of
$179 million
,
$147 million
and
$154 million
, respectively, in personnel on its consolidated statements of operations. The amount of capitalized share-based compensation cost was immaterial during fiscal
2013
,
2012
and
2011
.
Options
Options issued under the EIP expire
10
years from the date of grant and vest ratably over
three
years from the date of grant, subject to earlier vesting in full under certain conditions.
During fiscal
2013
,
2012
and
2011
, the fair value of each stock option was estimated on the date of grant using a Black-Scholes option pricing model with the following weighted-average assumptions:
|
2013
|
2012
|
2011
|
||||||||||
|
Expected term (in years)
(1)
|
6.08
|
|
6.02
|
|
5.16
|
|
||||||
|
Risk-free rate of return
(2)
|
0.8
|
%
|
1.2
|
%
|
1.2
|
%
|
||||||
|
Expected volatility
(3)
|
29.3
|
%
|
34.9
|
%
|
33.4
|
%
|
||||||
|
Expected dividend yield
(4)
|
0.9
|
%
|
0.9
|
%
|
0.8
|
%
|
||||||
|
Fair value per option granted
|
$
|
39.03
|
|
$
|
29.65
|
|
$
|
27.50
|
|
|||
|
(1)
|
Based on a set of peer companies that management believes is generally comparable to Visa.
|
|
(2)
|
Based upon the zero coupon U.S. treasury bond rate over the expected term of the awards.
|
|
(3)
|
Based on the average of the Company’s implied and historical volatility. As the Company’s publicly-traded stock history is relatively short, historical volatility relies in part on the historical volatility of a group of peer companies that management believes is generally comparable to Visa. The relative weighting between Visa historical volatility and the historical volatility of the peer companies is based on the percentage of years Visa stock price information has been available since its initial public offering compared to the expected term. The expected volatilities ranged from
27%
to
29%
in fiscal
2013
.
|
|
(4)
|
Based on the Company’s annual dividend rate on the date of grant.
|
The following table summarizes the Company’s option activity for fiscal
2013
:
|
Options
|
Weighted-
Average
Exercise Price
Per Share
|
Weighted-
Average
Remaining
Contractual
Term
(in years)
|
Aggregate
Intrinsic
Value
(1)
(in millions)
|
|||||||
|
Outstanding at October 1, 2012
|
5,185,675
|
|
$
|
59.46
|
|
|||||
|
Granted
|
579,318
|
|
$
|
147.37
|
|
|||||
|
Forfeited
|
(51,766
|
)
|
$
|
109.35
|
|
|||||
|
Exercised
|
(1,796,021
|
)
|
$
|
58.56
|
|
|||||
|
Outstanding at September 30, 2013
|
3,917,206
|
|
$
|
72.21
|
|
5.7
|
$466
|
|||
|
Options exercisable at September 30, 2013
|
2,973,421
|
|
$
|
57.74
|
|
4.8
|
$397
|
|||
|
Options exercisable and expected to be vested at September 30, 2013
(2)
|
3,822,828
|
|
$
|
71.08
|
|
5.6
|
$459
|
|||
|
(1)
|
Calculated using the closing stock price on the last trading day of fiscal
2013
of
$191.10
, less the option exercise price, multiplied by the number of instruments.
|
|
(2)
|
Applies a forfeiture rate to unvested options outstanding at September 30, 2013 to estimate the number expected to vest in the future.
|
For the options exercised during fiscal
2013
,
2012
and
2011
, the total intrinsic value was
$176 million
,
$247 million
and
$77 million
, respectively, and the tax benefit realized was
$59 million
,
$86 million
and
$28 million
, respectively. As of
September 30, 2013
, there was
$15 million
of total unrecognized compensation cost related to unvested options, which is expected to be recognized over a weighted-average period of approximately
1.2
years.
89
VISA INC.
NOTES TO CONSOLIDATED FINANCIAL STATEMENTS—(Continued)
September 30, 2013
Restricted Stock Awards and Restricted Stock Units
RSAs and RSUs issued under the EIP primarily vest ratably over
three
years from the date of grant, subject to earlier vesting in full under certain conditions.
Upon vesting, the RSAs are settled in class A common stock on a one-for-one basis. During the vesting period, RSA award recipients are eligible to receive dividends and participate in the same voting rights as those granted to the holders of the underlying class A common stock. Upon vesting, RSUs can be settled in class A common stock on a one-for-one basis or in cash, or a combination thereof, at the Company’s option. The Company does not currently intend to settle any RSUs in cash. During the vesting period, RSU award recipients are eligible to receive dividend equivalents, but do not participate in the voting rights granted to the holders of the underlying class A common stock.
The fair value and compensation cost before estimated forfeitures for RSAs and RSUs is calculated using the closing price of class A common stock on the date of grant. The weighted-average grant-date fair value of RSAs granted during fiscal
2013
,
2012
and
2011
was
$147.18
,
$96.39
and
$79.80
, respectively. The weighted-average grant-date fair value of RSUs granted during fiscal
2013
,
2012
and
2011
was
$146.18
,
$96.97
and
$79.97
, respectively. The total grant-date fair value of RSAs and RSUs vested during fiscal
2013
,
2012
and
2011
was
$98 million
,
$81 million
and
$55 million
, respectively.
The following table summarizes the Company's RSA and RSU activity for fiscal
2013
:
|
|
Restricted Stock
|
Weighted-
Average
Grant Date
Fair Value
|
Weighted-
Average
Remaining
Contractual
Term
(in years)
|
Aggregate
Intrinsic
Value
(1)
(in millions)
|
|||||||||||||||||
|
|
Awards
|
Units
|
RSA
|
RSU
|
RSA
|
RSU
|
RSA
|
RSU
|
|||||||||||||
|
Outstanding at October 1, 2012
|
1,736,989
|
|
637,645
|
|
$
|
88.77
|
|
$
|
91.17
|
|
|||||||||||
|
Granted
|
895,659
|
|
329,322
|
|
$
|
147.18
|
|
$
|
146.18
|
|
|||||||||||
|
Vested
|
(834,269
|
)
|
(289,821
|
)
|
$
|
87.02
|
|
$
|
88.22
|
|
|||||||||||
|
Forfeited
|
(100,398
|
)
|
(27,464
|
)
|
$
|
109.62
|
|
$
|
112.27
|
|
|||||||||||
|
Outstanding at September 30, 2013
|
1,697,981
|
|
649,682
|
|
$
|
119.20
|
|
$
|
119.49
|
|
1.5
|
1.3
|
$324
|
$124
|
|||||||
|
(1)
|
Calculated by multiplying the closing stock price on the last trading day of fiscal
2013
of
$191.10
by the number of instruments.
|
At
September 30, 2013
, there was
$117 million
and
$38 million
of total unrecognized compensation cost related to unvested RSAs and RSUs, respectively, which is expected to be recognized over a weighted-average period of approximately
1.5
years for RSAs and
1.3
years for RSUs.
90
VISA INC.
NOTES TO CONSOLIDATED FINANCIAL STATEMENTS—(Continued)
September 30, 2013
Performance-based Shares
The following table summarizes the maximum number of performance-based shares which could be earned and related activity for fiscal
2013
:
|
Shares
|
Weighted-
Average
Grant Date
Fair Value
|
Weighted-
Average
Remaining
Contractual
Term
(in years)
|
Aggregate
Intrinsic
Value
(1)
(in millions)
|
|||||||
|
Outstanding at October 1, 2012
|
526,227
|
|
$
|
88.56
|
|
|||||
|
Granted
(2)
|
230,518
|
|
$
|
164.14
|
|
|||||
|
Vested and earned
|
(271,418
|
)
|
$
|
85.87
|
|
|||||
|
Unearned
|
(9,928
|
)
|
$
|
85.05
|
|
|||||
|
Forfeited
|
(15,500
|
)
|
$
|
129.36
|
|
|||||
|
Outstanding at September 30, 2013
|
459,899
|
|
$
|
126.24
|
|
1.0
|
$88
|
|||
|
(1)
|
Calculated by multiplying the closing stock price on the last trading day of
fiscal 2013
of
$191.10
by the number of instruments.
|
|
(2)
|
Represents the maximum number of performance-based shares which could be earned.
|
For the Company's performance-based shares, in addition to service conditions, the ultimate number of shares to be earned depends on the achievement of both performance and market conditions. The performance condition is based on the Company's earnings per share target. The market condition is based on the Company's total shareholder return ranked against that of other companies that are included in the Standard & Poor's 500 Index. The fair value of the performance-based shares, incorporating the market condition, is estimated on the grant date using a Monte Carlo simulation model. The grant-date fair value of performance-based shares in fiscal
2013
,
2012
and
2011
was
$164.14
,
$97.84
and
$85.05
per share, respectively. Earned performance shares granted in fiscal
2013
and
2012
vest approximately three years from the initial grant date. Earned performance shares granted in fiscal
2011
vest in two equal installments approximately two and three years from their respective grant dates. All performance awards are subject to earlier vesting in full under certain conditions.
Compensation cost for performance-based shares is initially estimated based on target performance. It is recorded net of estimated forfeitures and adjusted as appropriate throughout the performance period. At
September 30, 2013
, there was
$15 million
of total unrecognized compensation cost related to unvested performance-based shares, which is expected to be recognized over a weighted-average period of approximately
1.0
years.
Commitments.
The Company leases certain premises and equipment throughout the world with varying expiration dates. The Company incurred total rent expense of
$94 million
,
$89 million
and
$76 million
in fiscal
2013
,
2012
and
2011
, respectively. Future minimum payments on leases, and marketing and sponsorship agreements per fiscal year, at
September 30, 2013
, are as follows:
|
(in millions)
|
2014
|
2015
|
2016
|
2017
|
2018
|
Thereafter
|
Total
|
||||||||||||||||||||
|
Operating leases
|
$
|
100
|
|
$
|
77
|
|
$
|
43
|
|
$
|
35
|
|
$
|
20
|
|
$
|
82
|
|
$
|
357
|
|
||||||
|
Marketing and sponsorships
|
116
|
|
117
|
|
61
|
|
54
|
|
54
|
|
178
|
|
580
|
|
|||||||||||||
|
Total
|
$
|
216
|
|
$
|
194
|
|
$
|
104
|
|
$
|
89
|
|
$
|
74
|
|
$
|
260
|
|
$
|
937
|
|
||||||
Select sponsorship agreements require the Company to spend certain minimum amounts for advertising and marketing promotion over the life of the contract. For commitments where the individual years of spend are not specified in the contract, the Company has estimated the timing of when these amounts will be spent. In addition to the fixed payments stated above, select sponsorship agreements require the Company to undertake marketing, promotional or other activities up to stated monetary values to support events which the Company is sponsoring.
91
VISA INC.
NOTES TO CONSOLIDATED FINANCIAL STATEMENTS—(Continued)
September 30, 2013
The stated monetary value of these activities typically represents the value in the marketplace, which may be significantly in excess of the actual costs incurred by the Company.
Client incentives.
The Company has agreements with financial institution clients and other business partners for various programs designed to build payments volume, increase Visa-branded card and product acceptance and win merchant routing transactions. These agreements, with original terms ranging from one to thirteen years, can provide card issuance and/or conversion support, volume/growth targets and marketing and program support based on specific performance requirements. These agreements are designed to encourage client business and to increase overall Visa-branded payment and transaction volume, thereby reducing per-unit transaction processing costs and increasing brand awareness for all Visa clients.
Payments made that qualify for capitalization, and obligations incurred under these programs are reflected on the consolidated balance sheet. Client incentives are recognized primarily as a reduction to operating revenue in the period the related volumes and transactions occur, based on management's estimate of the client's performance in accordance with the terms of the incentive agreement. The agreements may or may not limit the amount of client incentive payments.
The table below sets forth the expected future reduction of revenue per fiscal year for client incentive agreements in effect at
September 30, 2013
:
|
(in millions)
|
2014
|
2015
|
2016
|
2017
|
2018
|
Thereafter
|
Total
|
||||||||||||||||||||
|
Client incentives
|
$
|
2,450
|
|
$
|
2,206
|
|
$
|
1,802
|
|
$
|
1,429
|
|
$
|
987
|
|
$
|
1,447
|
|
$
|
10,321
|
|
||||||
The amount of client incentives recorded as a reduction of revenue in future periods under the Company's incentive arrangements, will be greater or less than the estimates above due to changes in performance expectations, actual client performance, amendments to existing contracts or the execution of new contracts. Based on these agreements, increases in incentive payments are generally driven by increased payment and transaction volume, and as a result, in the event incentive payments exceed the above estimates, such payments are not expected to have a material effect on the Company's financial condition, results of operations or cash flows.
Visa considers an entity to be a related party for purposes of this disclosure if that entity owns more than 10% of Visa’s total voting common stock at the end of the fiscal year, or if an officer or employee of that entity also serves on the Company's board of directors. The Company considers an investee to be a related party if the Company’s: (i) ownership interest in the investee is greater than or equal to
10%
or (ii) if the investment is accounted for under the equity method of accounting. At
September 30, 2013
and
2012
,
no
entity owned more than
10%
of the Company’s total voting common stock. Except as described below, there were
no
significant transactions with related parties during fiscal
2013
,
2012
and
2011
.
In fiscal
2011
, the Company recognized
$172 million
in operating revenues from clients that were represented on the Company's board of directors. Due to changes in the board of directors made in January 2011, the Company's non-executive board members are now comprised exclusively of independent directors, and these clients are no longer considered related parties.
The Company’s income before taxes by fiscal year consisted of the following:
|
2013
|
2012
|
2011
|
|||||||||
|
|
(in millions)
|
||||||||||
|
U.S.
|
$
|
5,992
|
|
$
|
1,030
|
|
$
|
4,650
|
|
||
|
Non-U.S.
|
1,265
|
|
1,177
|
|
1,006
|
|
|||||
|
Total income before taxes and non-controlling interest
|
$
|
7,257
|
|
$
|
2,207
|
|
$
|
5,656
|
|
||
92
VISA INC.
NOTES TO CONSOLIDATED FINANCIAL STATEMENTS—(Continued)
September 30, 2013
U.S. income before taxes included
$2.0 billion
,
$1.6 billion
and
$1.3 billion
from non-U.S. clients for fiscal
2013
,
2012
and
2011
, respectively.
Income tax provision by fiscal year consisted of the following:
|
2013
|
2012
|
2011
|
|||||||||
|
|
(in millions)
|
||||||||||
|
Current:
|
|||||||||||
|
U.S. federal
|
$
|
568
|
|
$
|
1,376
|
|
$
|
1,365
|
|
||
|
State and local
|
(58
|
)
|
165
|
|
311
|
|
|||||
|
Non-U.S.
|
239
|
|
214
|
|
168
|
|
|||||
|
Total current taxes
|
749
|
|
1,755
|
|
1,844
|
|
|||||
|
Deferred:
|
|||||||||||
|
U.S. federal
|
1,401
|
|
(1,276
|
)
|
160
|
|
|||||
|
State and local
|
114
|
|
(415
|
)
|
(2
|
)
|
|||||
|
Non-U.S.
|
13
|
|
1
|
|
8
|
|
|||||
|
Total deferred taxes
|
1,528
|
|
(1,690
|
)
|
166
|
|
|||||
|
Total income tax provision
|
$
|
2,277
|
|
$
|
65
|
|
$
|
2,010
|
|
||
The tax effect of temporary differences that give rise to significant portions of deferred tax assets and liabilities at
September 30, 2013
and
2012
, are presented below:
|
2013
|
2012
|
||||||
|
|
(in millions)
|
||||||
|
Deferred Tax Assets:
|
|||||||
|
Accrued compensation and benefits
|
$
|
154
|
|
$
|
103
|
|
|
|
Comprehensive (income) loss
|
(8
|
)
|
102
|
|
|||
|
Investments in joint ventures
|
14
|
|
11
|
|
|||
|
Accrued litigation obligation
|
1
|
|
1,654
|
|
|||
|
Client incentives
|
226
|
|
227
|
|
|||
|
Net operating loss carryforward
|
31
|
|
33
|
|
|||
|
Tax credits
|
22
|
|
23
|
|
|||
|
Federal benefit of state taxes
|
176
|
|
90
|
|
|||
|
Federal benefit of foreign taxes
|
13
|
|
16
|
|
|||
|
Other
|
108
|
|
92
|
|
|||
|
Valuation allowance
|
(25
|
)
|
(13
|
)
|
|||
|
Deferred tax assets
|
712
|
|
2,338
|
|
|||
|
Deferred Tax Liabilities:
|
|||||||
|
Property, equipment and technology, net
|
(310
|
)
|
(288
|
)
|
|||
|
Intangible assets
|
(4,003
|
)
|
(4,027
|
)
|
|||
|
Foreign taxes
|
(55
|
)
|
(44
|
)
|
|||
|
Other
|
(12
|
)
|
(10
|
)
|
|||
|
Deferred tax liabilities
|
(4,380
|
)
|
(4,369
|
)
|
|||
|
Net deferred tax liabilities
|
$
|
(3,668
|
)
|
$
|
(2,031
|
)
|
|
93
VISA INC.
NOTES TO CONSOLIDATED FINANCIAL STATEMENTS—(Continued)
September 30, 2013
Total net deferred tax assets and liabilities are included in the Company’s consolidated balance sheets as follows:
|
September 30,
2013 |
September 30,
2012 |
||||||
|
|
(in millions)
|
||||||
|
Current deferred tax assets
|
$
|
481
|
|
$
|
2,027
|
|
|
|
Non-current deferred tax liabilities
|
(4,149
|
)
|
(4,058
|
)
|
|||
|
Net deferred tax liabilities
|
$
|
(3,668
|
)
|
$
|
(2,031
|
)
|
|
The decrease in the deferred tax asset for accrued litigation obligation reflects the
$1.6 billion
reduction in tax payable due to the fiscal 2013 tax deductions of the
$4.4 billion
covered litigation payments. See
Note 3—Retrospective Responsibility Plan
and
Note 20—Legal Matters
.
In assessing the realizability of deferred tax assets, management considers whether it is more likely than not that all or some portion of the deferred tax assets will not be realized. The ultimate realization of the deferred tax assets is dependent upon the generation of future taxable income during the periods in which those temporary differences are deductible. The fiscal
2013
and
2012
valuation allowances relate primarily to foreign net operating losses from subsidiaries acquired in recent years.
As of
September 30, 2013
, the Company had
$56 million
state and
$115 million
foreign net operating loss carryforwards. The state net operating loss carryforwards will expire in
fiscal 2025 through 2031
. The foreign net operating loss may be carried forward indefinitely. The Company expects to fully utilize the state net operating loss carryforwards in future years.
As of
September 30, 2013
, the Company also had federal and state research and development tax credit carryforwards of
$2 million
and
$21 million
, respectively. The federal carryforwards will expire in
fiscal 2029
. The state carryforwards may be carried forward
indefinitely
. The Company also has federal alternative minimum tax credits of approximately
$1 million
, which
do not expire
. The Company expects to realize the benefit of the credit carryforwards in future years.
The income tax provision differs from the amount of income tax determined by applying the applicable U.S. federal statutory rate of
35%
to pretax income, as a result of the following:
|
|
For the Years Ended September 30,
|
|||||||||||||||||||
|
|
2013
|
2012
|
2011
|
|||||||||||||||||
|
|
Dollars
|
Percent
|
Dollars
|
Percent
|
Dollars
|
Percent
|
||||||||||||||
|
|
(in millions, except percentages)
|
|||||||||||||||||||
|
U.S. federal income tax at statutory rate
|
$
|
2,540
|
|
35
|
%
|
$
|
772
|
|
35
|
%
|
$
|
1,980
|
|
35
|
%
|
|||||
|
State income taxes, net of federal benefit
|
42
|
|
1
|
%
|
36
|
|
2
|
%
|
203
|
|
4
|
%
|
||||||||
|
Non-U.S. tax effect, net of federal benefit
|
(328
|
)
|
(5
|
)%
|
(257
|
)
|
(12
|
)%
|
(150
|
)
|
(2
|
)%
|
||||||||
|
Reversal of tax reserves related to the deductibility of covered litigation expense
|
—
|
|
—
|
%
|
(299
|
)
|
(14
|
)%
|
—
|
|
—
|
%
|
||||||||
|
Remeasurement of deferred taxes due to:
|
||||||||||||||||||||
|
California state apportionment rule changes
|
—
|
|
—
|
%
|
(208
|
)
|
(9
|
)%
|
—
|
|
—
|
%
|
||||||||
|
Other state apportionment changes
|
(6
|
)
|
—
|
%
|
11
|
|
1
|
%
|
(3
|
)
|
—
|
%
|
||||||||
|
Revaluation of Visa Europe put option
|
—
|
|
—
|
%
|
—
|
|
—
|
%
|
(43
|
)
|
(1
|
)%
|
||||||||
|
Other, net
|
29
|
|
—
|
%
|
10
|
|
—
|
%
|
23
|
|
—
|
%
|
||||||||
|
Income tax provision
|
$
|
2,277
|
|
31
|
%
|
$
|
65
|
|
3
|
%
|
$
|
2,010
|
|
36
|
%
|
|||||
94
VISA INC.
NOTES TO CONSOLIDATED FINANCIAL STATEMENTS—(Continued)
September 30, 2013
The effective income tax rate in fiscal 2013 differs from the rates in fiscal
2012
and
2011
mainly due to:
|
•
|
the decrease in overall ongoing state tax rate beginning in fiscal 2012 as a result of changes in California apportionment rules adopted in that year;
|
|
•
|
a tax benefit recognized in fiscal
2013
as a result of new guidance issued by the state of California regarding apportionment rules for years prior to fiscal 2012;
|
|
•
|
certain foreign tax credit benefits related to prior years recognized in fiscal 2013; and
|
|
•
|
the absence of the following in fiscal
2013
:
|
|
•
|
the fiscal
2012
reversal of previously recorded tax reserves associated with uncertainties related to the deductibility of covered litigation expense;
|
|
•
|
a fiscal
2012
one-time, non-cash benefit from the remeasurement of existing net deferred tax liabilities due to the changes in California apportionment rules adopted in that year;
|
|
•
|
the effect of applying the aforementioned fiscal
2012
tax benefits to a fiscal
2012
pre-tax income that was reduced by the
$4.1 billion
covered litigation provision; and
|
|
•
|
the nontaxable revaluation of the Visa Europe put option recorded in fiscal
2011
.
|
Current income taxes receivable were
$142 million
and
$179 million
at
September 30, 2013
and
2012
, respectively. Non-current income taxes receivable of
$253 million
were included in other assets at
September 30, 2013
. See
Note 5—Prepaid Expenses and Other Assets
. At
September 30, 2013
and
2012
, income taxes payable of
$64 million
and
$58 million
, respectively, were included in accrued income taxes as part of accrued liabilities, and accrued income taxes of
$453 million
and
$171 million
, respectively, were included in other long-term liabilities. See
Note 8—Accrued and Other Liabilities
.
Cumulative undistributed earnings of the Company’s international subsidiaries that are intended to be reinvested indefinitely outside the United States amounted to
$3.8 billion
at
September 30, 2013
. The amount of income taxes that would have resulted had such earnings been repatriated is not practicably determinable.
The Company’s largest operating hub outside the United States is located in Singapore. It operates under a tax incentive agreement which is effective through September 30, 2014, and may be extended through September 30, 2023, if certain additional requirements are satisfied. The tax incentive agreement is conditional upon certain employment and investment thresholds being met by the Company. The tax incentive agreement decreased Singapore tax by
$158 million
,
$130 million
and
$111 million
, and the benefit of the tax incentive agreement on diluted earnings per share was
$0.24
,
$0.19
and
$0.16
in fiscal
2013
,
2012
and
2011
, respectively.
In accordance with Accounting Standards Codification 740, the Company is required to inventory, evaluate and measure all uncertain tax positions taken or to be taken on tax returns, and to record liabilities for the amount of such positions that may not be sustained, or may only partially be sustained, upon examination by the relevant taxing authorities.
At
September 30, 2013
and
2012
, the Company’s total gross unrecognized tax benefits were
$1.0 billion
and
$679 million
, respectively, exclusive of interest and penalties described below. Included in the
$1.0 billion
and
$679 million
are
$801 million
and
$537 million
of unrecognized tax benefits, respectively, that if recognized, would reduce the effective tax rate in a future period.
A reconciliation of beginning and ending unrecognized tax benefits by fiscal year is as follows:
|
2013
|
2012
|
||||||
|
|
(in millions)
|
||||||
|
Beginning balance at October 1
|
$
|
679
|
|
$
|
850
|
|
|
|
Increases of unrecognized tax benefits related to prior years
|
335
|
|
186
|
|
|||
|
Decreases of unrecognized tax benefits related to prior years
|
(133
|
)
|
(445
|
)
|
|||
|
Increases of unrecognized tax benefits related to current year
|
144
|
|
89
|
|
|||
|
Reductions related to lapsing statute of limitations
|
(2
|
)
|
(1
|
)
|
|||
|
Ending balance at September 30
|
$
|
1,023
|
|
$
|
679
|
|
|
95
VISA INC.
NOTES TO CONSOLIDATED FINANCIAL STATEMENTS—(Continued)
September 30, 2013
It is the Company’s policy to account for interest expense and penalties related to uncertain tax positions in non-operating income, and general and administrative expense, respectively, in its consolidated statements of operations. In fiscal
2013
, the Company recognized
$9 million
of interest expense, related to uncertain tax positions. In fiscal
2012
and
2011
, the Company reversed
$45 million
, and recognized
$7 million
, of interest expense, respectively, related to uncertain tax positions. In fiscal
2013
,
2012
and
2011
, the Company reversed
$4 million
,
$1 million
and
$2 million
of penalties, respectively. At
September 30, 2013
and
2012
, the Company had accrued interest of
$29 million
and
$20 million
, respectively, and accrued penalties of
$3 million
and
$7 million
, respectively, related to uncertain tax positions in its other long-term liabilities.
In September 2012, the IRS completed the examination of the Company's fiscal 2006, 2007 and 2008 U.S. federal income tax returns with no significant adjustments. The statute of limitations for these years is expected to expire in December of 2013.
The IRS began the examination of the Company's fiscal 2009, 2010 and 2011 tax returns in fiscal 2013. The Company's California fiscal 2006, 2007 and 2008 tax returns are currently under examination. Except for certain outstanding refund claims, the federal and California statutes of limitations have expired for fiscal years prior to fiscal 2006. During fiscal 2013, the Canada Revenue Agency (CRA) completed its examination of the Company's fiscal 2003 to 2011 Canadian tax returns and proposed certain assessments. The Company has filed or will file notices of objection against these assessments and believes that its income tax provision adequately reflects its obligations to the CRA. The Company is also subject to examinations by various state and foreign tax authorities. All material state and foreign tax matters have been concluded for years through fiscal 2002. The timing and outcome of the final resolutions of the federal, state and foreign tax examinations and refund claims are uncertain. As such, it is not reasonably possible to estimate the impact that the final outcomes could have on the Company's unrecognized tax benefits in the next 12 months.
Note 20—Legal Matters
The Company is party to various legal and regulatory proceedings. Some of these proceedings involve complex claims that are subject to substantial uncertainties and unascertainable damages. Accordingly, except as disclosed, the Company has not established reserves or ranges of possible loss related to these proceedings, as at this time in the proceedings, the matters do not relate to a probable loss and/or the amount or range of losses are not reasonably estimable. Although the Company believes that it has strong defenses for the litigation and regulatory proceedings described below, it could, in the future, incur judgments or fines or enter into settlements of claims that could have a material adverse effect on the Company's financial position, results of operations or cash flows. From time to time, the Company may engage in settlement discussions or mediations with respect to one or more of its outstanding litigation matters, either on its own behalf or collectively with other parties.
The litigation accrual is an estimate and is based on management's understanding of its litigation profile, the specifics of each case, advice of counsel to the extent appropriate and management's best estimate of incurred loss as of the balance sheet date.
The following table summarizes the activity related to accrued litigation.
|
Fiscal 2013
|
Fiscal 2012
|
||||||
|
|
(in millions)
|
||||||
|
Balance at October 1
|
$
|
4,386
|
|
$
|
425
|
|
|
|
Provision for unsettled legal matters
|
3
|
|
4,100
|
|
|||
|
Interest accretion on settled matters
|
—
|
|
1
|
|
|||
|
Payments on unsettled matters
(1)
|
(4,033
|
)
|
—
|
|
|||
|
Payments on settled matters
|
(351
|
)
|
(140
|
)
|
|||
|
Balance at September 30
|
$
|
5
|
|
$
|
4,386
|
|
|
|
(1)
|
On December 10, 2012, the Company paid approximately
$4.0 billion
from the litigation escrow account into a settlement fund established pursuant to the definitive class settlement agreement in the interchange multidistrict
|
96
VISA INC.
NOTES TO CONSOLIDATED FINANCIAL STATEMENTS—(Continued)
September 30, 2013
litigation. The settlement with the class plaintiffs is subject to final court approval, which the Company cannot assure will be received, and to the adjudication of any appeals. See further discussion below.
Covered Litigation
Visa Inc., Visa U.S.A. and Visa International are parties to certain legal proceedings that are covered by the retrospective responsibility plan, which the Company refers to as the covered litigation. See
Note 3—Retrospective Responsibility Plan
.
An accrual for the covered litigation and a charge to the litigation provision are recorded when loss is deemed to be probable and reasonably estimable. In making this determination, the Company evaluates available information, including but not limited to actions taken by the litigation committee. The total accrual related to the covered litigation could be either higher or lower than the escrow account balance. The Company recorded an additional accrual of
$4.1 billion
for the covered litigation during fiscal 2012, which increased its total reserve for the covered litigation from
$285 million
to
$4.4 billion
. During fiscal 2013, the Company paid approximately
$4.4 billion
from the litigation escrow account into settlement funds pursuant to settlement agreements with individual and class plaintiffs in the interchange multidistrict litigation.
The Attridge Litigation
On December 8, 2004, a complaint was filed in California state court on behalf of an alleged class of consumers asserting claims against Visa U.S.A., Visa International and MasterCard. The claims in this action,
Attridge v. Visa U.S.A. Inc., et al.
, allege that Visa
'
s bylaw 2.10(e) and MasterCard
'
s Competitive Programs Policy, which prohibited their respective members from issuing American Express or Discover cards, constitute unlawful restraints of trade under California
'
s Unfair Competition Law and the Cartwright Act. On May 19, 2006, the court entered an order dismissing plaintiff
'
s Cartwright Act claims with prejudice but allowing the plaintiff to proceed with his Unfair Competition Law claims, which seek restitution, injunctive relief, and attorneys
'
fees and costs. On December 14, 2007, the plaintiff amended his complaint to add Visa Inc. as a defendant.
In the separate
"
Indirect Purchaser"
Credit/Debit Card Tying Cases
, also pending in California state court (see below), Visa entered into a settlement agreement on September 14, 2009 which potentially could have had the effect of releasing the claims asserted in the
Attridge
case, subject to the ruling of the
Attridge
court. On August 23, 2010, final approval of the
Credit/Debit Card Tying Cases
settlement was granted. The plaintiff in
Attridge
and others appealed the final approval order. On February 15, 2011, the court ordered that the
Attridge
case be stayed until 30 days following the final resolution of the appeals in the
Credit/Debit Card Tying Cases.
On January 9, 2012, the appeals court reversed the approval of the
Credit/Debit Card Tying Cases
settlement, and the case was remanded to the trial court for consideration of the fairness and adequacy of the settlement in light of the inclusion of the
Attridge
claims in the release.
The parties in the
Credit/Debit Card Tying Cases
subsequently agreed upon a revised written settlement agreement, which was finally approved by the court on April 11, 2013. Objectors have filed notices of appeal in those cases and the
Attridge
case. On September 18, 2013, in light of the proceedings in the
Credit/Debit Card Tying Cases
, the
Attridge
case was stayed until April 11, 2014.
Interchange Multidistrict Litigation (MDL)
Beginning in May 2005, approximately fifty-five complaints (all but thirteen of which were styled as class actions) were filed in U.S. federal district courts by merchants against Visa U.S.A., Visa International, and/or MasterCard, and in some cases, certain Visa member financial institutions. The complaints challenged, among other things, Visa
'
s and MasterCard
'
s purported setting of interchange reimbursement fees, their
"
no surcharge" rules, and alleged tying and bundling of transaction fees under the federal antitrust laws, and, in some cases, certain state unfair competition laws. On October 19, 2005, the Judicial Panel on Multidistrict Litigation issued an order transferring the cases to the U.S. District Court for the Eastern District of New York for coordination of pre-trial proceedings in MDL 1720. A group of purported class plaintiffs filed a Second Consolidated Amended Class Action Complaint on January 29, 2009 which, together with the thirteen complaints brought by individual merchants, sought money damages alleged to range in the tens of billions of dollars (subject to trebling), as well as attorneys' fees and injunctive relief. The class plaintiffs also filed a Second Supplemental Class Action Complaint against Visa Inc. and certain member financial institutions challenging Visa
'
s reorganization and IPO under the antitrust laws and
97
VISA INC.
NOTES TO CONSOLIDATED FINANCIAL STATEMENTS—(Continued)
September 30, 2013
seeking unspecified money damages and declaratory and injunctive relief, including an order that the IPO be unwound.
On July 1, 2007, as part of the retrospective responsibility plan, Visa U.S.A. and Visa International entered into an interchange judgment sharing agreement with certain member financial institutions of Visa U.S.A.
On February 7, 2011, Visa entered into an omnibus agreement that confirmed and memorialized the signatories
'
intentions with respect to the loss sharing agreement, the judgment sharing agreement and other agreements relating to the interchange multidistrict litigation. Under the omnibus agreement, the monetary portion of any settlement of the interchange multidistrict litigation covered by the omnibus agreement would be divided into a MasterCard portion at 33.3333% and a Visa portion at 66.6667%. In addition, the monetary portion of any judgment assigned to Visa-related claims in accordance with the omnibus agreement would be treated as a Visa portion. Visa would have no liability for the monetary portion of any judgment assigned to MasterCard-related claims in accordance with the omnibus agreement, and if a judgment is not assigned to Visa-related claims or MasterCard-related claims in accordance with the omnibus agreement, then any monetary liability would be divided into a MasterCard portion at 33.3333% and a Visa portion at 66.6667%. The Visa portion of a settlement or judgment covered by the omnibus agreement would be allocated in accordance with specified provisions of the Company
'
s retrospective responsibility plan. The litigation provision on the consolidated statements of operations is not impacted by the execution of the omnibus agreement.
On October 19, 2012, the Company and the individual plaintiffs whose claims were consolidated with the MDL (the
"
Individual Plaintiffs
"
) signed a settlement agreement to resolve the Individual Plaintiffs
'
claims against the Company for approximately
$350 million
. This payment was made from the litigation escrow account under the retrospective responsibility plan on October 29, 2012. On November 6, 2012, the court entered an order dismissing the Individual Plaintiffs
'
claims with prejudice.
In addition, on October 19, 2012, Visa Inc., its wholly-owned subsidiaries Visa U.S.A. and Visa International, MasterCard Incorporated, MasterCard International Incorporated, various U.S. financial institution defendants, and the class plaintiffs signed a settlement agreement (the "Settlement Agreement") to resolve the class plaintiffs
'
claims.
The terms of the Settlement Agreement include, among other terms:
|
•
|
A comprehensive release from participating class members for liability arising out of claims asserted in the litigation, and a further release to protect against future litigation regarding default interchange and the other U.S. rules at issue in the MDL;
|
|
•
|
Settlement payments from the Company of approximately
$4.0 billion
, to be paid from the Company's previously funded litigation escrow account established under the retrospective responsibility plan, see
Note 3—Retrospective Responsibility Plan
;
|
|
•
|
Distribution to class merchants of an amount equal to 10 basis points of default interchange across all credit rate categories for a period of eight consecutive months, which otherwise would have been paid to issuers and which effectively reduces credit interchange for that period of time. The eight month period for the reduction would begin within 60 days after completion of the court-ordered period during which individual class members may opt out of this settlement;
|
|
•
|
Certain modifications to the Company's rules, including modifications to permit surcharging on credit transactions under certain circumstances, subject to a cap and a level playing field with other general purpose card competitors; and
|
|
•
|
Agreement that the Company will meet with merchant buying groups that seek to negotiate interchange rates collectively.
|
The district court entered the preliminary approval order of the Settlement Agreement on November 27, 2012. On November 27, 2012, certain objectors filed a notice of appeal from the preliminary approval order in the U.S. Court of Appeals for the Second Circuit. On December 10, 2012, the court of appeals entered an order deferring briefing for the appeal until after the district court enters an order of final approval and final judgment with respect to the settlement, or otherwise concludes the matters by entry of a final judgment.
On December 10, 2012, Visa paid approximately
$4.0 billion
from the litigation escrow account into a settlement fund established pursuant to the Settlement Agreement.
98
VISA INC.
NOTES TO CONSOLIDATED FINANCIAL STATEMENTS—(Continued)
September 30, 2013
Certain merchants in the proposed settlement classes thereafter objected to the settlement, opted out of the damages portion of the class settlement, and/or are seeking to opt out of the rules portion of the class settlement. Details of merchants who have filed an opt-out claim may be found below (see
"
Interchange Opt-out Litigation"
below).
Certain competitors and other interested parties have also objected to the class settlement, including Discover, which filed a motion to intervene on May 28, 2013. Discover sought, among other things, to object to the Settlement Agreement and to file a proposed complaint challenging certain aspects of the Settlement Agreement as a restraint of trade in violation of Section 1 of the Sherman Act. On August 16, 2013, defendants responded to Discover's objections. On September 12, 2013, the district court held a hearing on the motion for final approval of the class settlement. Until the Settlement Agreement is finally approved by the court and any appeals are finally adjudicated, no assurance can be provided that the Company will be able to resolve the class plaintiffs
'
claims as contemplated by the Settlement Agreement.
Under the Settlement Agreement, if class members opt out of the damages portion of the class settlement, the defendants are entitled to receive payments of no more than 25% of the original cash payments made into the settlement fund, based on the percentage of payment card sales volume for a defined period attributable to merchants who opted out (the
"
takedown payments"). The class administrator has filed an amended report stating that the administrator had received 7,953 requests to opt out of the settlement, some of which may include multiple merchants. Based on the payment card sales volume of merchants requesting to opt out, in the event of final approval, the defendants will receive takedown payments equal to an amount calculated as 25% of the original cash payments made into the settlement fund. Visa
'
s portion of the takedown payments is calculated to be approximately
$1.1 billion
, and would be deposited into the litigation escrow account.
Interchange Opt-out Litigation
Beginning in May 2013, approximately twenty opt-out cases have been filed by hundreds of merchants in various federal district courts, generally pursuing damages claims on allegations similar to those raised in MDL 1720. A similar case has been filed by a merchant in Texas state court. A number of the cases also include allegations that Visa has monopolized, attempted to monopolize, and/or conspired to monopolize debit card-related market segments, and one of the cases seeks an injunction against the fixed acquirer network fee. The cases name as defendants Visa Inc., Visa U.S.A., Visa International, MasterCard Incorporated, and MasterCard International Incorporated, although some also include certain U.S. financial institutions as defendants. All but one of the cases originally filed in federal court either were filed in the U.S. District Court for the Eastern District of New York and have been assigned to the judge presiding over MDL 1720, or have been transferred by the Judicial Panel on Multidistrict Litigation for inclusion in MDL 1720. Visa is seeking to transfer that one case to MDL 1720, and the plaintiff in that case has filed a motion opposing such transfer. Visa has also removed the Texas state court case to federal court and is seeking to transfer it to MDL 1720; the plaintiff in that case has opposed such transfer. Cases that are transferred to or otherwise included in MDL 1720 will be covered litigation for purposes of the retrospective responsibility plan. See
Note 3—Retrospective Responsibility Plan
.
On May 24, 2013, Visa, MasterCard, and certain U.S. financial institution defendants in MDL 1720 filed a complaint in the Eastern District of New York against certain named class representative plaintiffs who had opted out or stated their intention to opt out of the damages portion of the MDL class settlement. On June 10, 2013, Visa filed a similar complaint in the Eastern District of New York against Wal-Mart Stores Inc. Both complaints seek a declaration that, from January 1, 2004 to November 27, 2012, the time period for which opt-outs may seek damages under the MDL class settlement, Visa's conduct in, among other things, continuing to set default interchange rates, maintaining its
"
honor all cards" rule, enforcing certain rules relating to merchants, and restructuring itself, did not violate federal or state antitrust laws. Both cases have been assigned to the same district court judge presiding over MDL 1720.
Other Litigation
"
Indirect Purchaser" Actions
99
VISA INC.
NOTES TO CONSOLIDATED FINANCIAL STATEMENTS—(Continued)
September 30, 2013
Complaints were filed on behalf of consumers in nineteen different states and the District of Columbia against Visa U.S.A. and MasterCard (and, in California, Visa International). The complaints allege, among other things, that Visa U.S.A.'s
"
honor all cards" rule and a similar MasterCard rule violated state antitrust and consumer protection laws, and common law. The claims in these class actions asserted that merchants, faced with excessive merchant discount fees, passed on some portion of those fees to consumers in the form of higher prices on goods and services sold. Plaintiffs seek money damages and injunctive relief. Visa U.S.A. has been successful in the majority of these cases, as courts in eighteen jurisdictions have granted Visa U.S.A.
'
s motion to dismiss for failure to state a claim or plaintiffs have voluntarily dismissed their complaints. In California, in the consolidated
Credit/Debit Card Tying Cases
, the court dismissed claims brought under the Cartwright Act, but denied a similar motion with respect to Unfair Competition Law claims for unlawful, unfair and/or fraudulent business practices. On October 3, 2008, the parties agreed to confidential settlement terms to resolve the dispute. A written settlement agreement executed on September 14, 2009, was submitted to the court for approval. After the parties amended the settlement agreement in certain respects, the court entered an order granting final approval on August 23, 2010. The plaintiff in
Attridge
, who had filed objections to the settlement, filed a notice of appeal from the final approval order, as did other objectors to the settlement. The amount of the settlement is not considered material to the consolidated financial statements.
On January 9, 2012, the Court of Appeal of the State of California reversed the judgment approving the settlement agreement, and the case was remanded to the trial court for consideration of the fairness and adequacy of the settlement in light of the inclusion of the
Attridge
claims in the release. The parties subsequently agreed upon a revised written settlement agreement. On April 11, 2013, the court entered an order finally approving the settlement and entered judgment. Objectors to the settlement have filed notices of appeal.
Vale Canjeable
In November and December of 2006, Vale Canjeable Ticketven, C.A. filed two separate actions against Todoticket 2004, C.A., and Visa International. In the first action, the plaintiff was granted an injunction on November 29, 2006 prohibiting the defendants' use of the “Vale” mark in Venezuela’s food voucher market (the “Injunction”). In the second action, plaintiffs sought damages for trademark infringement (the “Trademark Action”). The Injunction and Trademark Action have been litigated extensively through the Venezuelan court system. On June 5, 2013, the Supreme Tribunal's Commercial Chamber dismissed the Trademark Action in its entirety and invalidated the Injunction effective immediately. On August 7, 2013, the plaintiff filed a motion requesting that the Supreme Tribunal's Constitutional Chamber enjoin or annul the Commercial Chamber's judgment, and either rule directly on the merits of the Trademark Action or resubmit the cases to the Commercial Chamber for a new decision on the merits. Visa filed an opposition to the plaintiff's motion on October 29, 2013.
European Competition Proceedings
European Commission.
On April 3, 2009, the European Commission (
"
EC") issued a Statement of Objections (
"
SO") to Visa Europe, Visa International and Visa Inc. alleging a breach of European competition law. Visa Inc. and Visa International were served with the Statement of Objections on June 1, 2009. The SO alleged a breach of Article 81 of the European Community Treaty and Article 53 of the European Economic Area Agreement (the "EEA Agreement"). The SO was directed to Visa Inc. and Visa International with respect to the
"
honor all cards
"
rule, the
"
no-surcharge" rule, and certain consumer card interchange fee practices.
On April 26, 2010, Visa Europe announced an agreement with the EC, subject to public consultation, to end the proceedings with respect to Visa Europe
'
s debit interchange fees. After public consultation, on December 8, 2010, the EC concluded that the proposed agreement with Visa Europe addressed its competition concerns, made the agreement legally binding upon Visa Europe, and closed its investigation with regard to interchange fees for consumer debit card transactions.
On July 31, 2012, the EC announced a supplementary Statement of Objections (
"
SSO") that was sent to Visa Europe concerning interchange for consumer credit card transactions. On March 8, 2013, Visa Inc. and Visa International received a redacted version of the SSO. The SSO alleges a breach of Article 101 of the Treaty on the Functioning of the European Union and Article 53 of the EEA Agreement. Among other things, the SSO asserts claims jointly against Visa Europe, Visa Inc., and Visa International, objecting to domestic, cross-border, and inter-regional interchange, Visa Europe
'
s rules relating to cross-border acquiring, and Visa Europe
’
s point of sale rules.
100
VISA INC.
NOTES TO CONSOLIDATED FINANCIAL STATEMENTS—(Continued)
September 30, 2013
The SSO also announces the EC
'
s intention to impose fines. The potential amount of any fine cannot be estimated at this time.
Visa Europe has offered commitments addressing domestic interchange, cross-border interchange within Europe, cross-border acquiring within Europe, and other Visa Europe rules. The EC will consider whether to accept those commitments after a period of public comment.
U.K. Merchant Litigation
. On August 2, 2013, Visa Inc. and Visa International were served with claims filed in the High Court of Justice Queen's Bench Division Commercial Court in London on behalf of eleven merchants in the supermarket, clothing, and other retail business. Visa Europe is also named in the case. The claimants seek damages for alleged anti-competitive conduct relating to U.K. domestic, Irish domestic, and intra-EEA interchange fees for credit and debit cards. The claimants also assert that the alleged anticompetitive effects of interchange fees are reinforced by Visa Europe's
"
honor all cards" and
"
no discrimination" rules and rules limiting cross-border issuing and acquiring. On October 16, 2013, Visa Inc. and Visa International were served with a similar claim by a twelfth merchant that is represented by the same counsel as the other eleven merchants. The twelve merchants seek damages exceeding
$825 million
. Previously, on March 22, 2013, Visa Inc. learned that counsel for a separate group of merchant plaintiffs threatened to file litigation against Visa Europe, Visa Inc., and Visa International with respect to interchange rates in Europe. On March 28, 2013, Visa Europe, Visa Inc., and Visa International entered into (1) a standstill agreement with respect to those merchants' claims, and (2) a costs agreement, which preserved the then-current recoverability rules in the United Kingdom. While the amount of interchange being challenged could be substantial, no claims have yet been filed and the full scope of the claims is not yet known.
Visa Europe is obligated to indemnify Visa Inc. and Visa International in connection with the European Competition Proceedings, in our opinion, including payment of any fines that may be imposed. However, Visa Europe has expressed an "initial" view that it is not obligated to indemnify Visa Inc. or Visa International for any claim in the European Competition Proceedings, including claims asserted in both the European Commission matter and the U.K. Merchant Litigation. Visa Inc. continues to firmly believe that Visa Europe is obligated to indemnify for all such claims, and has been in discussions with Visa Europe to resolve this issue. While the parties are not currently in non-binding arbitration, both parties have initiated the executive engagement aspect of the dispute resolution procedure contemplated by the Framework Agreement to resolve their dispute regarding this indemnification issue.
Canadian Competition Proceedings
Competition Bureau
. On December 15, 2010, following a civil inquiry regarding interchange and certain Visa policies related to merchant acceptance practices, the Commissioner of Competition filed a Notice of Application against Visa Canada Corporation (
"
Visa Canada") and MasterCard. The proceeding challenged certain Visa policies regarding merchant acceptance practices, including Visa
’
s
"
no-surcharge" and
"
honor all cards" policies under the Competition Act.
The hearing before the Competition Tribunal on the merits of the case was held from May 8, 2012 through June 21, 2012. On July 23, 2013, the Competition Tribunal ruled in favor of Visa Canada and MasterCard, dismissing the Commissioner of Competition's challenges to Visa's "no-surcharge" and "honor all cards" policies. The Competition Tribunal found that the Commissioner failed to establish that either policy constituted resale price maintenance under Section 76 of the Competition Act. The Commissioner did not file an appeal prior to the deadline of September 30, 2013.
Merchant Litigation
. Beginning in December 2010, a number of purported civil follow-on cases to the Competition Bureau
'
s proceeding were filed in Quebec, British Columbia, Ontario, Saskatchewan, and Alberta against Visa Canada, MasterCard, and ten financial institutions on behalf of purported classes of merchants and others that accept payment by Visa and MasterCard. The purported class action lawsuits allege conduct contrary to Section 45 of the Competition Act and also assert claims of civil conspiracy, interference with economic interests, and unjust enrichment, among others. Plaintiffs allege that Visa and MasterCard each conspired with their member financial institutions to set supra-competitive default interchange rates and merchant discount fees, and that Visa and MasterCard's respective
"
no-surcharge
"
and
"
honor all cards
"
policies had the anticompetitive effect of increasing merchant discount fees. The lawsuits seek unspecified monetary damages and injunctive relief.
101
VISA INC.
NOTES TO CONSOLIDATED FINANCIAL STATEMENTS—(Continued)
September 30, 2013
In the British Columbia lawsuit, a hearing on class certification commenced on April 22, 2013 and concluded on May 1, 2013. The lawsuits in Quebec, Ontario, and Alberta are being held in abeyance pending further proceedings in the British Columbia lawsuit. In Saskatchewan, applications for a stay of proceedings and carriage of the lawsuits have been filed.
Dynamic Currency Conversion
On February 4, 2013, following an investigation into Visa
'
s policies relating to the provision of Dynamic Currency Conversion (DCC), the Australian Competition and Consumer Commission ("ACCC
"
) commenced proceedings in the Federal Court of Australia against Visa Inc., Visa U.S.A., V.W.P.L., and Visa AP (Australia) Pty Limited alleging that certain Visa policies related to the provision of DCC services contravened Australian competition law. DCC refers to conversion from one currency to another, either of the price of goods or services by the merchant, or of cash withdrawals by an ATM. Among other things, the ACCC alleges that: (1) from May 2010 to October 2010, Visa prohibited DCC services with respect to transactions on Visa international payment cards conducted at Australian merchant outlets that had not previously been conducting DCC transactions; and (2) from at least May 2007, Visa prohibited DCC services with respect to cash withdrawals at Australian ATMs on Visa international payment cards. The ACCC seeks declaratory relief and a monetary penalty. On June 6, 2013, Visa filed its response to the ACCC's allegations. On August 8, 2013, the ACCC filed an amended claim which, among other things, added Visa International as a respondent. On October 4, 2013, Visa filed its response to the amended claim. The potential amount of any penalty cannot be estimated at this time.
Data Pass Litigation
On November 19, 2010, a consumer filed an amended class action complaint against Webloyalty.com, Inc., Gamestop Corporation, and Visa Inc. in federal district court in Connecticut. The plaintiff claims, among other things, that consumers who made online purchases at merchants were deceived into also incurring charges for services from Webloyalty.com through the alleged unauthorized passing of cardholder account information during the sales transaction (
"
data pass
"
), in violation of federal and state consumer protection statutes and common law. Visa allegedly aided and abetted the conduct of the other defendants. Plaintiff seeks certification of a class of persons and entities whose credit card or debit card data was improperly accessed by Webloyalty.com since October 1, 2008, and seeks damages, restitution, and injunctive relief. On December 23, 2010, Webloyalty.com, GameStop, and Visa each filed motions to dismiss the amended complaint.
Korean Fair Trade Commission
Following a complaint lodged by a Visa client, in July 2011 the Korean Fair Trade Commission ("KFTC") initiated an investigation into Visa
’
s requirements for the processing of international transactions over VisaNet. The KFTC has the authority to issue an injunction or a fine. The potential amount of any fine cannot be estimated at this time.
U.S. ATM Access Fee Litigation
National ATM Council Class Action
. On October 12, 2011, the National ATM Council and thirteen non-bank ATM operators filed a class action lawsuit against Visa (Visa Inc., Visa International, Visa U.S.A., and Plus System, Inc.) and MasterCard in the U.S. District Court for the District of Columbia. The complaint challenges Visa
'
s rule (and a similar MasterCard rule) that if an ATM operator chooses to charge consumers an access fee for a Visa or Plus transaction, that fee cannot be greater than the access fee charged for transactions on other networks. Plaintiffs claim that the rule violates Section 1 of the Sherman Act, and seek damages
"
in an amount not presently known, but which is tens of millions of dollars, prior to trebling,
"
injunctive relief, and attorneys
’
fees. On January 10, 2012, plaintiffs filed an amended class action complaint against the same defendants, also asserting that the ATM access fee rule violates Section 1 of the Sherman Act. Plaintiffs request treble damages, injunctive relief and attorneys
'
fees.
Consumer Class Actions
. In October 2011, a purported consumer class action (
Stoumbos
) was filed against Visa and MasterCard in the same federal court challenging the same ATM access fee rules. Two other purported consumer class actions were also filed in October 2011 in the same federal court, and were later combined into a
102
VISA INC.
NOTES TO CONSOLIDATED FINANCIAL STATEMENTS—(Continued)
September 30, 2013
single amended complaint (
Mackmin
). The amended complaint challenges the same ATM access fee rules and names Visa, MasterCard and three financial institutions as defendants. Both
Stoumbos
and
Mackmin
purport to represent classes and sub-classes of consumers in claims brought under Section 1 of the Sherman Act, and also allege claims under antitrust and/or consumer protection statutes in certain states and the District of Columbia. The lawsuits seek injunctive relief, attorneys
'
fees, treble damages, and restitution where available under state law.
On January 30, 2012, Visa, MasterCard, and the defendant financial institutions filed motions to dismiss the complaints in the
National ATM Council
class action and the consumer class actions. On February 13, 2013, the court granted the motion to dismiss and dismissed the cases without prejudice. On March 12, 2013, plaintiffs in the
National ATM Council
class action and the consumer class actions moved for an order altering or amending the court's February 13, 2013 order to provide that (1) the complaints (as opposed to the cases) are dismissed without prejudice, and (2) plaintiffs may move to amend their complaints. On April 15, 2013, plaintiffs in the
National ATM Council
class action and the
Stoumbos
case moved for leave to file amended complaints. On April 18, 2013, plaintiffs in the
Mackmin
case moved for leave to file an amended complaint. Defendants filed responses opposing the motions on the grounds that they are not procedurally proper and would be futile in any event. On April 24, 2013, the court ordered the defendants to file further detailed responses, addressing futility in particular. Briefing on the motions is complete.
U.S. Department of Justice Civil Investigative Demand
On March 13, 2012, the Antitrust Division of the United States Department of Justice (the
"
Division
"
) issued a Civil Investigative Demand, or
"
CID,
"
to Visa Inc. seeking documents and information regarding a potential violation of Section 1 or 2 of the Sherman Act, 15 U.S.C. §§ 1, 2. The CID focuses on PIN-Authenticated Visa Debit and Visa's competitive responses to the Dodd-Frank Act, including Visa's fixed acquirer network fee. Visa is cooperating with the Division in connection with the CID.
Federal Trade Commission Voluntary Access Letter
On September 21, 2012, the Bureau of Competition of the United States Federal Trade Commission (the
"
Bureau
"
) requested that Visa provide on a voluntary basis documents and information regarding potential violations of certain regulations associated with the Dodd-Frank Act, particularly Section 920(b)(1)(B) of the Electronic Funds Transfer Act, 15 U.S.C. 1693o-2, and Regulation II, 12 C.F.R. § 235.7(b) (commonly known as the “Durbin Amendment” and regulations). The request focuses on information related to the purposes, implementation, and impact of the optional PIN Debit Gateway Service. The revenue generated by the PIN Debit Gateway Service is not material to the Company’s financial statements. Visa is cooperating with the Bureau and responding to its information requests.
Consumer Financial Protection Bureau
On February 7, 2013, Visa received a letter from the Consumer Financial Protection Bureau (
"
CFPB
"
) seeking documents and information, on a voluntary basis, regarding Visa's practices with respect to the conversion of U.S. cardholder foreign transactions from foreign currency into U.S. dollars. On March 20, 2013, Visa met with the CFPB and provided information and materials in response to the requests. Visa is continuing to cooperate with the CFPB
'
s inquiry.
In
October 2013
, the Company’s board of directors authorized an additional
$5.0 billion
share repurchase program. See
Note 14—Stockholders' Equity
.
In
October 2013
, the Company’s board of directors declared a dividend in the aggregate amount of
$0.40
per share of class A common stock (determined in the case of class B and class C common stock on an as-converted basis). See
Note 14—Stockholders' Equity
.
103
Selected Quarterly Financial Data (Unaudited)
The following tables show selected quarterly operating results for each quarter and full year of fiscal
2013
and
2012
for the Company:
|
|
Quarter Ended (unaudited)
|
Fiscal Year
|
|||||||||||||||||
|
Visa Inc.
|
Sept. 30,
2013
|
June 30,
2013
|
Mar. 31,
2013
|
Dec.31,
2012
|
2013 Total
|
||||||||||||||
|
|
(in millions, except per share data)
|
||||||||||||||||||
|
Operating revenues
|
$
|
2,973
|
|
$
|
3,001
|
|
$
|
2,958
|
|
$
|
2,846
|
|
$
|
11,778
|
|
||||
|
Operating income
|
$
|
1,751
|
|
$
|
1,828
|
|
$
|
1,860
|
|
$
|
1,800
|
|
$
|
7,239
|
|
||||
|
Net income attributable to Visa Inc.
|
$
|
1,192
|
|
$
|
1,225
|
|
$
|
1,270
|
|
$
|
1,293
|
|
$
|
4,980
|
|
||||
|
Basic earnings per share
|
|||||||||||||||||||
|
Class A common stock
|
$
|
1.86
|
|
$
|
1.89
|
|
$
|
1.93
|
|
$
|
1.94
|
|
$
|
7.61
|
|
||||
|
Class B common stock
|
$
|
0.78
|
|
$
|
0.79
|
|
$
|
0.81
|
|
$
|
0.82
|
|
$
|
3.20
|
|
||||
|
Class C common stock
|
$
|
1.86
|
|
$
|
1.89
|
|
$
|
1.93
|
|
$
|
1.94
|
|
$
|
7.61
|
|
||||
|
Diluted earnings per share
|
|||||||||||||||||||
|
Class A common stock
|
$
|
1.85
|
|
$
|
1.88
|
|
$
|
1.92
|
|
$
|
1.93
|
|
$
|
7.59
|
|
||||
|
Class B common stock
|
$
|
0.78
|
|
$
|
0.79
|
|
$
|
0.81
|
|
$
|
0.81
|
|
$
|
3.19
|
|
||||
|
Class C common stock
|
$
|
1.85
|
|
$
|
1.88
|
|
$
|
1.92
|
|
$
|
1.93
|
|
$
|
7.59
|
|
||||
|
|
Quarter Ended (unaudited)
|
Fiscal Year
|
|||||||||||||||||
|
Visa Inc.
|
Sept. 30,
2012
(1)
|
June 30,
2012
(2)
|
Mar. 31,
2012
|
Dec.31,
2011
|
2012 Total
|
||||||||||||||
|
|
(in millions, except per share data)
|
||||||||||||||||||
|
Operating revenues
|
$
|
2,731
|
|
$
|
2,565
|
|
$
|
2,578
|
|
$
|
2,547
|
|
$
|
10,421
|
|
||||
|
Operating income (loss)
|
$
|
1,522
|
|
$
|
(2,607
|
)
|
$
|
1,606
|
|
$
|
1,618
|
|
$
|
2,139
|
|
||||
|
Net income (loss) attributable to Visa Inc.
|
$
|
1,662
|
|
$
|
(1,839
|
)
|
$
|
1,292
|
|
$
|
1,029
|
|
$
|
2,144
|
|
||||
|
Basic earnings (loss) per share
|
|||||||||||||||||||
|
Class A common stock
|
$
|
2.48
|
|
$
|
(2.74
|
)
|
$
|
1.92
|
|
$
|
1.50
|
|
$
|
3.17
|
|
||||
|
Class B common stock
|
$
|
1.05
|
|
$
|
(1.16
|
)
|
$
|
0.82
|
|
$
|
0.73
|
|
$
|
1.40
|
|
||||
|
Class C common stock
|
$
|
2.48
|
|
$
|
(2.74
|
)
|
$
|
1.92
|
|
$
|
1.50
|
|
$
|
3.17
|
|
||||
|
Diluted earnings (loss) per share
|
|||||||||||||||||||
|
Class A common stock
|
$
|
2.47
|
|
$
|
(2.74
|
)
|
$
|
1.91
|
|
$
|
1.49
|
|
$
|
3.16
|
|
||||
|
Class B common stock
|
$
|
1.04
|
|
$
|
(1.16
|
)
|
$
|
0.81
|
|
$
|
0.73
|
|
$
|
1.39
|
|
||||
|
Class C common stock
|
$
|
2.47
|
|
$
|
(2.74
|
)
|
$
|
1.91
|
|
$
|
1.49
|
|
$
|
3.16
|
|
||||
|
(1)
|
During the fourth quarter of fiscal 2012, we reversed all previously recorded tax reserves and accrued interest associated with uncertainties related to the deductibility of covered litigation expense recorded in fiscal 2007 through the third quarter of fiscal 2012, which increased our quarterly net income by $627 million. The reversal of tax reserves and related interest included $301 million related to reserves taken in the current year, and $326 million related to reserves taken in previous years. See
Overview
in
|
|
(2)
|
During the third quarter of fiscal 2012, we recorded a litigation provision of $4.1 billion and related tax benefits associated with the interchange multidistrict litigation, which is covered by the retrospective responsibility plan. Settlements of, or judgments in, covered litigation will be paid from the litigation escrow account. See
|
104
|
ITEM 9.
|
Changes in and Disagreements with Accountants on Accounting and Financial Disclosures
|
Not applicable.
|
ITEM 9A.
|
Controls and Procedures
|
Evaluation of Disclosure Controls and Procedures
We maintain a system of disclosure controls and procedures (as defined in the Rules 13a-15(e) and 15(d)-15(e) under the Securities Exchange Act of 1934, as amended (the “Exchange Act”)) that is designed to ensure that information required to be disclosed in our Exchange Act reports is recorded, processed, summarized and reported within the time periods specified in the SEC’s rules and forms, and that such information is accumulated and communicated to our management, including our Chief Executive Officer and Chief Financial Officer, as appropriate, to allow timely decisions regarding required disclosures.
Under the supervision and with the participation of our management, including our Chief Executive Officer and Chief Financial Officer, we conducted an evaluation of our disclosure controls and procedures. Based on this evaluation, our Chief Executive Officer and our Chief Financial Officer concluded that, as of
September 30, 2013
, our disclosure controls and procedures were effective, at the reasonable assurance level.
There are inherent limitations to the effectiveness of any system of disclosure controls and procedures. These limitations include the possibility of human error, the circumvention or overriding of the controls and procedures and reasonable resource constraints. In addition, because we have designed our system of controls based on certain assumptions, which we believe are reasonable, about the likelihood of future events, our system of controls may not achieve its desired purpose under all possible future conditions. Accordingly, our disclosure controls and procedures provide reasonable assurance, but not absolute assurance, of achieving their objectives.
Management’s Report on Internal Control over Financial Reporting
The Company’s management is responsible for establishing and maintaining adequate internal control over financial reporting for the Company. Management assessed the effectiveness of the Company’s internal control over financial reporting as of
September 30, 2013
. Based on management’s assessment, management has concluded that the Company’s internal control over financial reporting was effective as of
September 30, 2013
using the criteria set forth by the Committee of Sponsoring Organizations of the Treadway Commission (COSO) in
Internal Control—Integrated Framework (1992).
Our internal control over financial reporting is designed to provide reasonable, but not absolute, assurance regarding the reliability of financial reporting and the preparation of financial statements in accordance with U.S. generally accepted accounting principles. There are inherent limitations to the effectiveness of any system of internal control over financial reporting. These limitations include the possibility of human error, the circumvention or overriding of the system and reasonable resource constraints. Because of its inherent limitations, our internal control over financial reporting may not prevent or detect misstatements. Projections of any evaluation of effectiveness to future periods are subject to the risks discussed in
Item 1A—Risk Factors
of this report.
The effectiveness of our internal control over financial reporting as of
September 30, 2013
, has been audited by KPMG LLP, an independent registered public accounting firm and is included in
Item 8
of this report.
Changes in Internal Control over Financial Reporting
In preparation for management’s report on internal control over financial reporting, we documented and tested the design and operating effectiveness of our internal control over financial reporting. During fiscal
2013
, there were no significant changes in our internal controls over financial reporting that occurred during the year ended
September 30, 2013
, that have materially affected, or are reasonably likely to materially affect, the Company’s internal control over financial reporting.
|
ITEM 9B.
|
Other Information
|
Not applicable.
105
Certain information required by Part III is omitted from this Report and the Company will file a definitive proxy statement pursuant to Regulation 14A under the Exchange Act (the “Proxy Statement”) not later than 120 days after the end of the fiscal year ended
September 30, 2013
, and certain information included therein is incorporated herein by reference. Only those sections of the Proxy Statement that specifically address the items set forth herein are incorporated by reference. Such incorporation does not include the report of the Audit and Risk Committee included in the Proxy Statement.
|
ITEM 10.
|
Directors, Executive Officers and Corporate Governance
|
The information required by this item concerning the Company's directors, executive officers, the Code of Business Conduct and Ethics and corporate governance matters is incorporated herein by reference to the sections entitled
“Director Biographies,” “Executive Officers,” “Corporate Governance—Code of Business Conduct and Ethics,”
and
“Board Meetings and Committees of the Board—Committees of the Board of Directors”
in our Proxy Statement.
The information required by this item regarding compliance with Section 16(a) of the Exchange Act pursuant to Item 405 of Regulation S-K is incorporated herein by reference to the section entitled
“Section 16(a) Beneficial Ownership Reporting Compliance”
in our Proxy Statement.
Our Code of Business Conduct and Ethics, Code of Ethics for Senior Financial Officers and our Corporate Governance Guidelines are available on the Investor Relations page of our website at www.investor.visa.com, under “Corporate Governance.” Printed copies of these documents are also available to stockholders without charge upon written request directed to Corporate Secretary, Visa Inc., P.O. Box 8999, San Francisco, California 94128-8999.
|
ITEM 11.
|
Executive Compensation
|
The information required by this item concerning director and executive compensation is incorporated herein by reference to the sections entitled
“Compensation of Non-Employee Directors” and “Executive Compensation”
in our Proxy Statement.
The information required by this item pursuant to Item 407(e)(4) of Regulation S-K is incorporated herein by reference to the section entitled
“Compensation Committee Interlocks and Insider Participation”
in our Proxy Statement.
The information required by this item pursuant to Item 407(e)(5) of Regulation S-K is incorporated herein by reference to the section entitled
“Compensation Committee Report”
in our Proxy Statement.
|
ITEM 12.
|
Security Ownership of Certain Beneficial Owners and Management and Related Stockholder Matters
|
The information required by this item pursuant to Item 403 of Regulation S-K is incorporated herein by reference to the section entitled
“Beneficial Ownership of Equity Securities”
in our Proxy Statement.
For the information required by item 201(d) of Regulation S-K, refer to
Item 5
in this report.
|
ITEM 13.
|
Certain Relationships and Related Transactions, and Director Independence
|
The information required by this item concerning related party transactions pursuant to Item 404 of Regulation S-K is incorporated herein by reference to the section entitled
“Corporate Governance—Certain Relationships and Related Person Transactions”
in our Proxy Statement.
The information required by this item concerning director independence pursuant to Item 407(a) of Regulation S-K is incorporated herein by reference to the section entitled
“Corporate Governance— Independence of Directors”
in our Proxy Statement.
|
ITEM 14.
|
Principal Accountant Fees and Services
|
The information required by this Item is incorporated herein by reference to the section entitled
“Independent Registered Public Accounting Firm Fees”
in our Proxy Statement.
106
|
ITEM 15.
|
Exhibits and Financial Statement Schedules
|
|
(a)
|
The following documents are filed as part of this report:
|
|
1.
|
Consolidated Financial Statements
|
See Index to Consolidated Financial Statements in
Item 8
of this report.
|
2.
|
Consolidated Financial Statement Schedules
|
None.
|
3.
|
The following exhibits are filed as part of this report or, where indicated, were previously filed and are hereby incorporated by reference:
|
Refer to the Exhibit Index herein.
107
SIGNATURES
Pursuant to the requirements of Section 13 or 15(d) of the Securities Exchange Act of 1934, as amended, the registrant has duly caused this Annual Report on Form 10-K to be signed on its behalf by the undersigned, thereunto duly authorized.
|
VISA INC.
|
||
|
By:
|
/s/ Charles W. Scharf
|
|
|
Name:
|
|
Charles W. Scharf
|
|
Title:
|
|
Chief Executive Officer
|
|
Date:
|
|
November 21, 2013
|
Pursuant to the requirements of the Securities Exchange Act of 1934, as amended, this report has been signed below by the following persons on behalf of the registrant in the capacities and on the dates indicated:
|
Signature
|
Title
|
Date
|
||
|
/s/ Charles W. Scharf
|
Chief Executive Officer
|
November 21, 2013
|
||
|
Charles W. Scharf
|
(principal executive officer)
|
|||
|
/s/ Byron H. Pollitt
|
Chief Financial Officer
|
November 21, 2013
|
||
|
Byron H. Pollitt
|
(principal financial officer and principal accounting officer)
|
|||
|
/s/ Robert W. Matschullat
|
Chairman of the Board
|
November 21, 2013
|
||
|
Robert W. Matschullat
|
||||
|
/s/ Gary P. Coughlan
|
Director
|
November 21, 2013
|
||
|
Gary P. Coughlan
|
||||
|
/s/ Mary B. Cranston
|
Director
|
November 21, 2013
|
||
|
Mary B. Cranston
|
||||
|
/s/ Francisco Javier Fernández-Carbajal
|
Director
|
November 21, 2013
|
||
|
Francisco Javier Fernández-Carbajal
|
||||
|
/s/ Cathy E. Minehan
|
Director
|
November 21, 2013
|
||
|
Cathy E. Minehan
|
||||
|
/s/ Suzanne Nora Johnson
|
Director
|
November 21, 2013
|
||
|
Suzanne Nora Johnson
|
||||
|
/s/ David J. Pang
|
Director
|
November 21, 2013
|
||
|
David J. Pang
|
||||
|
/s/ William S. Shanahan
|
Director
|
November 21, 2013
|
||
|
William S. Shanahan
|
||||
|
/s/ John A. C. Swainson
|
Director
|
November 21, 2013
|
||
|
John A. C. Swainson
|
||||
108
EXHIBIT INDEX
|
Incorporated by Reference
|
||||||||||
|
Exhibit
|
Exhibit
|
File
|
Exhibit
|
Filing
|
||||||
|
Number
|
Description
|
Form
|
Number
|
Number
|
Date
|
|||||
|
3.1
|
Fifth Amended and Restated Certificate of Incorporation of Visa Inc.
|
8-K
|
001-33977
|
3.1
|
12/17/2008
|
|||||
|
3.2
|
Certificate of Correction of the Fifth Amended and Restated Certificate of Incorporation of Visa Inc.
|
10-Q
|
001-33977
|
3.1
|
7/30/2009
|
|||||
|
3.3
|
Certificate of Amendment to the Fifth Amended and Restated Certificate of Incorporation of Visa Inc. to Declassify the Board of Directors
|
8-K
|
001-33977
|
3.1
|
1/31/2011
|
|||||
|
3.4
|
Certificate of Amendment to the Fifth Amended and Restated Certificate of Incorporation of Visa Inc. to Implement a Majority Vote Standard in Uncontested Elections of Directors
|
8-K
|
001-33977
|
3.2
|
1/31/2011
|
|||||
|
3.5
|
Amended and Restated Bylaws
|
8-K
|
001-33977
|
3.1
|
10/25/2012
|
|||||
|
4.1
|
Form of stock certificate of Visa Inc.
|
S-4/A
|
333-143966
|
4.1
|
9/13/2007
|
|||||
|
4.2
|
Form of specimen certificate for class B common stock of Visa Inc.
|
8-A
|
000-53572
|
4.1
|
1/28/2009
|
|||||
|
4.3
|
Form of specimen certificate for class C common stock of Visa Inc.
|
8-A
|
000-53572
|
4.2
|
1/28/2009
|
|||||
|
4.4
|
The instruments defining the rights of holders of long-term debt securities of Visa Inc. and its subsidiaries have been omitted
(1)
|
N/A
|
N/A
|
N/A
|
N/A
|
|||||
|
10.1
|
Form of Indemnification Agreement between Visa Inc. and each of its directors and officers
|
8-K
|
001-33977
|
10.1
|
10/25/2012
|
|||||
|
10.2
|
Amended and Restated Global Restructuring Agreement, dated August 24, 2007, by and among Visa Inc., Visa International Service Association, Visa U.S.A. Inc., Visa Europe Limited, Visa Canada Association, Inovant LLC, Inovant, Inc., Visa Europe Services, Inc., Visa International Transition LLC, VI Merger Sub, Inc., Visa USA Merger Sub Inc. and 1734313 Ontario Inc.
|
S-4/A
|
333-143966
|
Annex A
|
9/13/2007
|
|||||
|
10.3
|
Form of Visa Europe Put-Call Option Agreement between Visa Inc. and Visa Europe Limited
|
S-4/A
|
333-143966
|
Annex B
|
9/13/2007
|
|||||
|
10.4
|
Form of Escrow Agreement by and among Visa Inc., Visa U.S.A. Inc. and the escrow agent
|
S-4
|
333-143966
|
10.15
|
6/22/2007
|
|||||
|
10.5
|
Form of Framework Agreement by and among Visa Inc., Visa Europe Limited, Inovant LLC, Visa International Services Association and Visa U.S.A. Inc. †
|
S-4/A
|
333-143966
|
10.17
|
7/24/2007
|
|||||
|
10.6
|
364-Day Revolving Credit Agreement, dated January 31, 2013, by and among Visa Inc., Visa International Service Association, Visa U.S.A. Inc., Bank of America, N.A., as administrative agent, JP Morgan Chase Bank N.A., as syndication agent, and the lenders referred to therein
|
8-K
|
001-33977
|
10.1
|
1/31/2013
|
|||||
1
|
10.7
|
Form of Interchange Judgment Sharing Agreement by and among Visa International Service Association and Visa U.S.A. Inc., and the other parties thereto †
|
S-4/A
|
333-143966
|
10.13
|
7/24/2007
|
|||||
|
10.8
|
Interchange Judgment Sharing Agreement Schedule
|
8-K
|
001-33977
|
10.2
|
2/8/2011
|
|||||
|
10.9
|
Form of Loss Sharing Agreement by and among Visa U.S.A. Inc., Visa International Service Association, Visa Inc. and various financial institutions
|
S-4/A
|
333-143966
|
10.14
|
7/24/2007
|
|||||
|
10.10
|
Loss Sharing Agreement Schedule
|
8-K
|
001-33977
|
10.1
|
2/8/2011
|
|||||
|
10.11
|
Form of Litigation Management Agreement by and among Visa Inc., Visa International Service Association, Visa U.S.A. Inc. and the other parties thereto
|
S-4/A
|
333-143966
|
10.18
|
8/22/2007
|
|||||
|
10.12
|
Agreement to Prepay Future Payments at a Discount, dated August 31, 2009, between Visa U.S.A. Inc. and co-lead counsels, acting collectively as binding representatives and agents of the plaintiffs
|
8-K
|
001-33977
|
10.1
|
8/31/2009
|
|||||
|
10.13
|
Omnibus Agreement, dated February 7, 2011, regarding Interchange Litigation Judgment Sharing and Settlement Sharing by and among Visa Inc., Visa U.S.A. Inc., Visa International Service Association, MasterCard Incorporated, MasterCard International Incorporated and the parties thereto
|
8-K
|
001-33977
|
10.2
|
7/16/2012
|
|||||
|
10.14
|
Settlement Agreement, dated October 19, 2012, by and among Visa Inc., Visa U.S.A. Inc., Visa International Service Association, MasterCard Incorporated, MasterCard International Incorporated, various U.S. financial institution defendants, and the class plaintiffs to resolve the class plaintiffs' claims in the matter styled In re Payment Card Interchange Fee and Merchant Discount Antitrust Litigation, No. 05-MD-1720
|
10-Q
|
001-33977
|
10.3
|
2/6/2013
|
|||||
|
10.15*
|
Visa 2005 Deferred Compensation Plan, effective as of January 1, 2005
|
S-4/A
|
333-143966
|
10.1
|
7/24/2007
|
|||||
|
10.16*
|
Visa Inc. 2007 Equity Incentive Compensation Plan, as amended and restated as of January 31, 2012
|
8-K
|
001-33977
|
10.1
|
1/31/2012
|
|||||
|
10.17*
|
Visa Inc. Incentive Plan, as amended and restated as of January 27, 2011
|
8-K
|
001-33977
|
10.1
|
1/31/2011
|
|||||
|
10.18*
|
Visa Excess Thrift Plan, as amended and restated as of January 1, 2008
|
10-K
|
001-33977
|
10.31
|
11/21/2008
|
|||||
|
10.19*
|
Visa Excess Retirement Benefit Plan, as amended and restated as of January 1, 2008
|
10-K
|
001-33977
|
10.32
|
11/21/2008
|
|||||
|
10.20*
|
First Amendment, effective January 1, 2011, of the Visa Excess Retirement Benefit Plan, as amended and restated as of January 1, 2008
|
10-K
|
001-33977
|
10.34
|
11/18/2011
|
|||||
|
10.21*
|
Form of Visa Inc. 2007 Equity Incentive Compensation Plan Restricted Stock Award Agreement for awards granted after March 18, 2008
|
10-K
|
001-33977
|
10.34
|
11/21/2008
|
|||||
2
|
10.22*
|
Form of Visa Inc. 2007 Equity Incentive Compensation Plan Stock Option Award Agreement for awards granted after March 18, 2008
|
10-K
|
001-33977
|
10.39
|
11/21/2008
|
|||||
|
10.23*
|
Form of Visa Inc. 2007 Equity Incentive Compensation Plan Stock Option Award Agreement for executive officers, other than the CEO, for awards granted after November 1, 2011
|
10-K
|
001-33977
|
10.35
|
11/18/2011
|
|||||
|
10.24*
|
Form of Visa Inc. 2007 Equity Incentive Compensation Plan Performance Share Award Agreement for executive officers, other than the CEO, for awards granted after November 1, 2011
|
10-K
|
001-33977
|
10.39
|
11/18/2011
|
|||||
|
10.25*
|
Form of Visa Inc. 2007 Equity Incentive Compensation Plan Stock Option Award Agreement including clawback provision, for awards granted after November 1, 2011
|
10-K
|
001-33977
|
10.40
|
11/18/2011
|
|||||
|
10.26*
|
Form of Visa Inc. 2007 Equity Incentive Compensation Plan Restricted Stock Unit Agreement including clawback provision, for awards granted after November 1, 2011
|
10-K
|
001-33977
|
10.41
|
11/18/2011
|
|||||
|
10.27*
|
Form of Visa Inc. 2007 Equity Incentive Compensation Plan Stock Option Award Agreement for the CEO, for awards granted after November 1, 2012
|
10-Q
|
001-33977
|
10.4
|
2/6/2013
|
|||||
|
10.28*
|
Form of Visa Inc. 2007 Equity Incentive Compensation Plan Restricted Stock Unit Award Agreement for the CEO, for awards granted after November 1, 2012
|
10-Q
|
001-33977
|
10.5
|
2/6/2013
|
|||||
|
10.29*
|
Form of Visa Inc. 2007 Equity Incentive Compensation Plan Restricted Stock Award Agreement for executive officers, other than the CEO, with limited vesting upon termination for awards granted after November 1, 2012
|
10-Q
|
001-33977
|
10.6
|
2/6/2013
|
|||||
|
10.30*
|
Form of Visa Inc. 2007 Equity Incentive Compensation Plan Restricted Stock Unit Agreement for executive officers, other than the CEO, with limited vesting upon termination for awards granted after November 1, 2012
|
10-Q
|
001-33977
|
10.7
|
2/6/2013
|
|||||
|
10.31*
|
Offer Letter, dated October 23, 2012, between Visa Inc. and Charles W. Scharf
|
8-K
|
001-33977
|
99.2
|
10/24/2012
|
|||||
|
10.32*
|
Aircraft Time Sharing Agreement, dated November 7, 2012, between Visa Inc. and Charles W. Scharf
|
8-K
|
001-33977
|
10.1
|
11/9/2012
|
|||||
|
10.33*
|
Amended and Restated Employment Agreement, dated December 1, 2010, between Visa Inc. and Joseph W. Saunders
|
8-K
|
001-33977
|
10.1
|
2/3/2010
|
|||||
|
10.34*
|
Offer Letter, dated May 20, 2013, between Visa Inc. and Ryan McInerney
|
8-K
|
001-33977
|
99.2
|
5/23/2013
|
|||||
|
12.1**
|
Statement of Computation of Ratio of Earnings to Fixed Charges
|
|||||||||
|
21.1**
|
List of Significant Subsidiaries of Visa Inc.
|
|||||||||
|
23.1**
|
Consent of KPMG LLP, Independent Registered Public Accounting Firm
|
|||||||||
3
|
31.1**
|
Certification of the Chief Executive Officer pursuant to Exchange Act Rules 13a-14(a) and 15d-14(a), as adopted pursuant to Section 302 of the Sarbanes-Oxley Act of 2002
|
|||||||||
|
31.2**
|
Certification of the Chief Financial Officer pursuant to Exchange Act Rules 13a-14(a) and 15d-14(a), as adopted pursuant to Section 302 of the Sarbanes-Oxley Act of 2002
|
|||||||||
|
32.1**
|
Certification of the Chief Executive Officer pursuant to 18 U.S.C. Section 1350, as adopted pursuant to Section 906 of the Sarbanes-Oxley Act of 2002
|
|||||||||
|
32.2**
|
Certification of the Chief Financial Officer pursuant to 18 U.S.C. Section 1350, as adopted pursuant to Section 906 of the Sarbanes-Oxley Act of 2002
|
|||||||||
|
101.INS
|
XBRL Instance Document
|
|||||||||
|
101.SCH
|
XBRL Taxonomy Extension Schema Document
|
|||||||||
|
101.CAL
|
XBRL Taxonomy Extension Calculation Linkbase Document
|
|||||||||
|
101.DEF
|
XBRL Taxonomy Extension Definition Linkbase Document
|
|||||||||
|
101.LAB
|
XBRL Taxonomy Extension Label Linkbase Document
|
|||||||||
|
101.PRE
|
XBRL Taxonomy Extension Presentation Linkbase Document
|
|||||||||
_______________
|
(1)
|
We have agreed to furnish to the SEC, upon request, a copy of each instrument.
|
|
†
|
Confidential treatment has been requested for portions of this agreement. A completed copy of the agreement, including the redacted portions, has been filed separately with the SEC.
|
|
*
|
Management contract, compensatory plan or arrangement.
|
|
**
|
Filed or furnished herewith.
|
4
TABLE OF CONTENTS
Part IItem 1. BusinessItem 8 Financial Statements and Supplementary DataNote 20 Legal MattersNote 13 Enterprise-wide Disclosures and Concentration Of BusinessItem 1A. Risk FactorsNote 3 Retrospective Responsibility PlanNote 19 Income TaxesNote 2 Visa EuropeNote 11 Settlement Guarantee ManagementItem 1B. Unresolved Staff CommentsItem 2. PropertiesItem 3. Legal ProceedingsItem 4. Mine Safety DisclosuresPart IIItem 5. Market For Registrant's Common Equity, Related Stockholder Matters and Issuer Purchases Of Equity SecuritiesNote 16 Share-based CompensationItem 6. Selected Financial DataItem 7 Management's Discussion and Analysis Of Financial Condition and Results Of OperationsItem 7. Management S Discussion and Analysis Of Financial Condition and Results Of OperationsNote 12 Derivative Financial InstrumentsNote 4 Fair Value Measurements and InvestmentsNote 14 Stockholders' EquityItem 1A Risk FactorsNote 9 DebtNote 10 Pension, Postretirement and Other BenefitsNote 1 Summary Of Significant Accounting PoliciesNote 17 Commitments and ContingenciesItem 7A. Quantitative and Qualitative Disclosures About Market RiskItem 8. Financial Statements and Supplementary DataNote 6 Property, Equipment and Technology, NetNote 7 Intangible Assets, NetNote 15 Earnings Per ShareNote 5 Prepaid Expenses and Other AssetsNote 12 Derivative Financial Instruments)Note 19 Income Taxes)Note 10 Pension, Postretirement and Other Benefits)Note 4 Fair Value Measurements and Investments)Note 8 Accrued and Other LiabilitiesNote 18 Related PartiesNote 21 Subsequent EventsItem 9. Changes in and Disagreements with Accountants on Accounting and Financial DisclosuresItem 9A. Controls and ProceduresItem 9B. Other InformationPart IIIItem 10. Directors, Executive Officers and Corporate GovernanceItem 11. Executive CompensationItem 12. Security Ownership Of Certain Beneficial Owners and Management and Related Stockholder MattersItem 13. Certain Relationships and Related Transactions, and Director IndependenceItem 14. Principal Accountant Fees and ServicesPart IVItem 15. Exhibits and Financial Statement Schedules