VALARIS PLC
10-Ks and 10-Qs
|
|
|
|
|
|
|
|
|
|
|
|
|
|
|
|
|
|
|
|
|
|
|
|
|
|
|
|
|
|
|
|
|
|
|
|
|
|
|
|
|
|
|
|
|
|
|
|
|
|
|
|
|
|
|
|
|
UNITED STATES
SECURITIES AND EXCHANGE COMMISSION
Washington, D.C. 20549
FORM 10-K
|
|
(Mark One)
|
ý
|
ANNUAL REPORT PURSUANT TO SECTION 13 OR 15(d) OF THE
SECURITIES EXCHANGE ACT OF 1934
For the fiscal year ended December 31, 2018
|
|
OR
|
|
|
o
|
TRANSITION REPORT PURSUANT TO SECTION 13 OR 15(d) OF THE
SECURITIES EXCHANGE ACT OF 1934
For the transition period from
to
|
|
Commission File Number 1-8097
|
|
|
Ensco plc
(Exact name of registrant as specified in its charter)
|
|
|
England and Wales
(State or other jurisdiction of
incorporation or organization)
6 Chesterfield Gardens
London, England
(Address of principal executive offices)
|
|
98-0635229
(I.R.S. Employer
Identification No.)
W1J5BQ
(Zip Code)
|
|
Registrant's telephone number, including area code:
+44 (0) 20 7659 4660
|
|
|
Securities registered pursuant to Section 12(b) of the Act:
|
|
|
Title of each class
Class A Ordinary Shares, U.S. $0.10 par value
4.50% Senior Notes due 2024
8.00% Senior Notes due 2024
7.75% Senior Notes due 2026
5.75% Senior Notes due 2044
5.20% Senior Notes due 2025
4.70% Senior Notes due 2021
|
|
Name of each exchange on which registered
New York Stock Exchange
|
Securities registered pursuant to Section 12(g) of the Act: None
Indicate by check mark if the registrant is a well-known seasoned issuer as defined in Rule 405 of the Securities Act. Yes
ý
No
o
Indicate by check mark if the registrant is not required to file reports pursuant to Section 13 or Section 15(d) of the Act. Yes
o
No
ý
Indicate by check mark whether the registrant (1) has filed all reports required to be filed by Section 13 or 15 (d) of the Securities Exchange Act of 1934 during the preceding 12 months (or for such shorter period that the registrant was required to file such reports), and (2) has been subject to such filing requirements for the past 90 days. Yes
ý
No
o
Indicate by check mark whether the registrant has submitted electronically every Interactive Data File required to be submitted pursuant to Rule 405 of Regulation S-T (S232.405 of this chapter) during the preceding 12 months (or for such shorter period that the registrant was required to submit such files). Yes
ý
No
o
Indicate by check mark if disclosure of delinquent filers pursuant to Item 405 of Regulation S-K (S229.405) is not contained herein, and will not be contained, to the best of registrant's knowledge, in definitive proxy or information statements incorporated by reference in Part III of this Form 10-K or any amendment to this Form 10-K.
ý
Indicate by check mark whether the registrant is a large accelerated filer, an accelerated filer, a non-accelerated filer, a smaller reporting company, or emerging growth company. See the definitions of "large accelerated filer," "accelerated filer," "smaller reporting company," and "emerging growth company" in Rule 12b-2 of the Exchange Act (Check one):
|
Large accelerated filer
|
|
x
|
|
Accelerated filer
|
|
o
|
|
|
Non-Accelerated filer
|
|
o
|
|
Smaller reporting company
|
|
o
|
|
|
Emerging growth company
|
o
|
||||||
o
If an emerging growth company, indicate by check mark if the registrant has elected not to use the extended transition period for complying with any new or revised financial accounting standards provided pursuant to Section 13(a) of the Exchange Act.
Indicate by check mark whether the registrant is a shell company (as defined in Rule 12b-2 of the Act).
Yes
o
No
ý
The aggregate market value of the Class A ordinary shares (based upon the closing price on the New York Stock Exchange on June 30,
2018
of $7.26) of Ensco plc held by non-affiliates of Ensco plc at that date was approximately
$3,149,586,000
.
As of
February 22, 2019
, there were
437,071,204
Class A ordinary shares of Ensco plc issued and outstanding.
DOCUMENTS INCORPORATED BY REFERENCE
Portions of the Company's Proxy Statement for the
2019
General Meeting of Shareholders are incorporated by reference into Part III of this report.
|
TABLE OF CONTENTS
|
|||
|
|
|
|
|
|
PART I
|
ITEM 1.
|
||
|
|
ITEM 1A.
|
||
|
|
ITEM 1B.
|
||
|
|
ITEM 2.
|
||
|
|
ITEM 3.
|
||
|
|
ITEM 4.
|
||
|
|
|
|
|
|
PART II
|
ITEM 5.
|
||
|
|
ITEM 6.
|
||
|
|
ITEM 7.
|
||
|
|
ITEM 7A.
|
||
|
|
ITEM 8.
|
||
|
|
ITEM 9.
|
||
|
|
ITEM 9A.
|
||
|
|
ITEM 9B.
|
||
|
|
|||
|
PART III
|
ITEM 10.
|
||
|
|
ITEM 11.
|
|
|
|
|
ITEM 12.
|
||
|
|
ITEM 13.
|
|
|
|
|
ITEM 14.
|
|
|
|
PART IV
|
ITEM 15.
|
||
|
ITEM 16.
|
|||
|
SIGNATURES
|
|||
FORWARD-LOOKING STATEMENTS
Statements contained in this report that are not historical facts are forward-looking statements within the meaning of Section 27A of the Securities Act of 1933, as amended (the "Securities Act"), and Section 21E of the Securities Exchange Act of 1934, as amended (the "Exchange Act"). Forward-looking statements include words or phrases such as "anticipate," "believe," "estimate," "expect," "intend," "likely," "plan," "project," "could," "may," "might," "should," "will" and similar words and specifically include statements regarding expected financial performance; the proposed transaction with Rowan Companies plc ("Rowan") dividends; expected utilization, day rates, revenues, operating expenses, contract terms, contract backlog, capital expenditures, insurance, financing and funding; expected work commitments, awards and contracts; the timing of availability, delivery, mobilization, contract commencement or relocation or other movement of rigs and the timing thereof; future rig construction (including work-in-progress and completion thereof), enhancement, upgrade or repair and timing and cost thereof; the suitability of rigs for future contracts; the offshore drilling market, including supply and demand, customer drilling programs, stacking of rigs, effects of new rigs on the market and effects of declines in commodity prices; expected divestitures of assets; general market, business and industry conditions, trends and outlook; future operations; the impact of increasing regulatory complexity; our program to high-grade the rig fleet by investing in new equipment and divesting selected assets and underutilized rigs; expense management; and the likely outcome of litigation, legal proceedings, investigations or insurance or other claims or contract disputes and the timing thereof.
Such statements are subject to numerous risks, uncertainties and assumptions that may cause actual results to vary materially from those indicated, including:
|
•
|
our ability to complete the combination with Rowan;
|
|
•
|
failure, difficulties and delays in meeting conditions required for closing set forth in the Transaction Agreement (as defined herein);
|
|
•
|
our ability to obtain requisite regulatory approval and satisfy the other conditions to consummate the transaction with Rowan;
|
|
•
|
the potential impact of the pendency or implementation of the transaction with Rowan on relationships, including with employees, suppliers, customers, competitors, lenders and credit rating agencies;
|
|
•
|
our ability to successfully integrate Rowan's operations and employees and to realize synergies and cost savings in connection with the Rowan Transaction (as defined herein);
|
|
•
|
changes in future levels of drilling activity and capital expenditures by our customers, whether as a result of global capital markets and liquidity, prices of oil and natural gas or otherwise, which may cause us to idle or stack additional rigs;
|
|
•
|
changes in worldwide rig supply and demand, competition or technology, including as a result of delivery of newbuild drilling rigs;
|
|
•
|
downtime and other risks associated with offshore rig operations, including rig or equipment failure, damage and other unplanned repairs, the limited availability of transport vessels, hazards, self-imposed drilling limitations and other delays due to severe storms and hurricanes and the limited availability or high cost of insurance coverage for certain offshore perils, such as hurricanes in the Gulf of Mexico or associated removal of wreckage or debris;
|
|
•
|
governmental action, terrorism, piracy, military action and political and economic uncertainties, including uncertainty or instability resulting from the U.K.'s planned withdrawal from the European Union, civil unrest, political demonstrations, mass strikes, or an escalation or additional outbreak of armed hostilities or other
|
2
crises in oil or natural gas producing areas of the Middle East, North Africa, West Africa or other geographic areas, which may result in expropriation, nationalization, confiscation or deprivation of our assets or suspension and/or termination of contracts based on force majeure events;
|
•
|
risks inherent to shipyard rig construction, repair, modification or upgrades, unexpected delays in equipment delivery, engineering, design or commissioning issues following delivery, or changes in the commencement, completion or service dates;
|
|
•
|
possible cancellation, suspension, renegotiation or termination (with or without cause) of drilling contracts as a result of general and industry-specific economic conditions, mechanical difficulties, performance or other reasons;
|
|
•
|
our ability to enter into, and the terms of, future drilling contracts, including contracts for our newbuild units and acquired rigs, for rigs currently idled and for rigs whose contracts are expiring;
|
|
•
|
any failure to execute definitive contracts following announcements of letters of intent, letters of award or other expected work commitments;
|
|
•
|
the outcome of litigation, legal proceedings, investigations or other claims or contract disputes, including any inability to collect receivables or resolve significant contractual or day rate disputes, any renegotiation, nullification, cancellation or breach of contracts with customers or other parties and any failure to execute definitive contracts following announcements of letters of intent;
|
|
•
|
governmental regulatory, legislative and permitting requirements affecting drilling operations, including limitations on drilling locations (such as the Gulf of Mexico during hurricane season);
|
|
•
|
new and future regulatory, legislative or permitting requirements, future lease sales, changes in laws, rules and regulations that have or may impose increased financial responsibility, additional oil spill abatement contingency plan capability requirements and other governmental actions that may result in claims of force majeure or otherwise adversely affect our existing drilling contracts, operations or financial results;
|
|
•
|
our ability to attract and retain skilled personnel on commercially reasonable terms, whether due to labor regulations, unionization or otherwise;
|
|
•
|
environmental or other liabilities, risks, damages or losses, whether related to storms or hurricanes (including wreckage or debris removal), collisions, groundings, blowouts, fires, explosions, other accidents, terrorism or otherwise, for which insurance coverage and contractual indemnities may be insufficient, unenforceable or otherwise unavailable;
|
|
•
|
our ability to obtain financing, service our indebtedness and pursue other business opportunities may be limited by our debt levels, debt agreement restrictions and the credit ratings assigned to our debt by independent credit rating agencies;
|
|
•
|
the adequacy of sources of liquidity for us and our customers;
|
|
•
|
tax matters, including our effective tax rates, tax positions, results of audits, changes in tax laws, treaties and regulations, tax assessments and liabilities for taxes;
|
|
•
|
delays in contract commencement dates or the cancellation of drilling programs by operators;
|
|
•
|
the occurrence of cybersecurity incidents, attacks or other breaches to our information technology systems;
|
3
|
•
|
adverse changes in foreign currency exchange rates, including their effect on the fair value measurement of our derivative instruments; and
|
|
•
|
potential long-lived asset impairments.
|
In addition to the numerous risks, uncertainties and assumptions described above, you should also carefully read and consider "Item 1A. Risk Factors" in Part I and "Item 7. Management’s Discussion and Analysis of Financial Condition and Results of Operations" in Part II of this Form 10-K. Each forward-looking statement speaks only as of the date of the particular statement, and we undertake no obligation to publicly update or revise any forward-looking statements, except as required by law.
4
PART I
Item 1.
Business
General
Ensco plc is a global offshore contract drilling company. Unless the context requires otherwise, the terms "Ensco," "Company," "we," "us" and "our" refer to Ensco plc together with all its subsidiaries and predecessors.
We are one of the leading providers of offshore contract drilling services to the international oil and gas industry. We currently own and operate an offshore drilling rig fleet of
56
rigs, with drilling operations in most of the strategic markets around the globe. We also have
three
rigs under construction. Inclusive of rigs under construction, our fleet includes
12
drillships,
9
dynamically positioned semisubmersible rigs,
three
moored semisubmersible rigs and
35
jackup rigs. We operate the world's largest fleet amongst competitive rigs, including one of the newest ultra-deepwater fleets in the industry and a leading premium jackup fleet.
Our customers include many of the leading national and international oil companies, in addition to many independent operators. We are among the most geographically diverse offshore drilling companies, with current operations spanning
14
countries on
six
continents. The markets in which we operate include the Gulf of Mexico, Brazil, the Mediterranean, the North Sea, the Middle East, West Africa, Australia and Southeast Asia.
We provide drilling services on a day rate contract basis. Under day rate contracts, we provide an integrated service that includes the provision of a drilling rig and rig crews for which we receive a daily rate that may vary between the full rate and zero rate throughout the duration of the contractual term, depending on the operations of the rig. We also may receive lump-sum fees or similar compensation for the mobilization, demobilization and capital upgrades of our rigs. Our customers bear substantially all of the costs of constructing the well and supporting drilling operations, as well as the economic risk relative to the success of the well.
Ensco plc is a public limited company incorporated under the laws of England and Wales in 2009. Our principal executive office is located at 6 Chesterfield Gardens, London W1J5BQ, England, United Kingdom, and our telephone number is +44 (0) 20 7659 4660. Our website is www.enscoplc.com. Information contained on our website is not included as part of, or incorporated by reference into, this report.
Proposed Rowan Transaction
On October 7, 2018, Ensco plc and Rowan Companies plc ("Rowan") entered into an agreement that provides for the combination of the two companies (as amended the "Transaction Agreement"). Ensco has agreed to acquire the entire issued and to be issued share capital of Rowan in an all-stock transaction (the "Rowan Transaction") by way of a scheme of arrangement to be undertaken by Rowan under Part 26 of the UK Companies Act 2006. On January 29, 2019, the Transaction Agreement was amended to increase the exchange ratio in connection with the Rowan Transaction from
2.215
to
2.750
.
Subject to the terms and conditions of the Transaction Agreement, each Class A ordinary share of Rowan will be converted into the right to receive
2.750
Class A ordinary shares of Ensco plc. We estimate the total consideration to be delivered in the Rowan Transaction to be approximately
$1.5 billion
, consisting of approximately
351.3 million
of our shares based on the closing price of
$4.41
on
February 22, 2019
. The value of the Rowan Transaction consideration will fluctuate until the closing date based on changes in the price of our shares and the number of shares of Rowan ordinary shares outstanding.
The completion of the Rowan Transaction is subject to various closing conditions, including, among others, (i) the sanction of the Rowan Transaction by the High Court of Justice of England and Wales, (ii) the receipt of certain required regulatory approvals or lapse of certain review periods with respect thereto, including in the Kingdom of Saudi Arabia, (iii) the absence of legal restraints prohibiting or restraining the Rowan Transaction and (iv) the absence of any law or order reasonably expected to result in the dissolution of the Saudi Aramco Offshore Drilling Company,
5
Rowan’s joint venture with Saudi Aramco (the “ARO JV”), or the sale, disposition, forfeiture or nationalization of Rowan’s interest in the ARO JV. Shareholders of Rowan and Ensco approved the Rowan Transaction on February 21, 2019. The Rowan Transaction is expected to close during the first half of 2019, subject to satisfaction of all conditions to closing. Upon closing of the Rowan Transaction, we intend to complete a reverse split of our ordinary shares under which every four existing Ensco ordinary shares will be consolidated into one Ensco ordinary share.
Atwood Merger
On October 6, 2017 (the "Merger Date"), we completed a merger transaction (the "Atwood Merger") with Atwood Oceanics, Inc. ("Atwood") and Echo Merger Sub, LLC, a wholly-owned subsidiary of Ensco plc. Pursuant to the merger agreement, Echo Merger Sub, LLC, merged with and into Atwood, with Atwood as the surviving entity and an indirect, wholly-owned subsidiary of Ensco plc. Total consideration delivered in the Atwood Merger consisted of
132.2 million
of our Class A ordinary shares and
$11.1 million
of cash in settlement of certain share-based payment awards. The total aggregate value of consideration transferred was
$781.8 million
. Additionally, upon closing of the Atwood Merger, we utilized cash acquired of
$445.4 million
and cash on hand to extinguish Atwood's revolving credit facility, outstanding senior notes and accrued interest totaling
$1.3 billion
. The estimated fair values assigned to assets acquired net of liabilities assumed exceeded the consideration transferred, resulting in a bargain purchase gain of
$140.2 million
that was recognized during the fourth quarter of 2017. During 2018, we recognized measurement period adjustments as we completed our fair value assessments resulting in additional bargain purchase gain of
$1.8 million
.
Drilling Rig Construction and Delivery
We remain focused on our long-established strategy of high-grading our fleet and expanding the scale of our operations, as evidenced by the recently completed Atwood Merger and proposed Rowan Transaction. During the three-year period ended
December 31, 2018
, we invested approximately
$1.0 billion
in the construction of new drilling rigs. We will continue to invest in the expansion and high-grading of our fleet or execute other strategic transactions to optimize our asset portfolio when we believe attractive opportunities exist.
We believe our remaining capital commitments will primarily be funded from cash and short-term investments, and, if necessary, funds borrowed under our Credit Facility or other future financing arrangements, including available shipyard financing options for our two drillships under construction. We may decide to access debt and/or equity markets to raise additional capital or increase liquidity as necessary.
Floaters
We previously entered into an agreement with Samsung Heavy Industries to construct ENSCO DS-10, an ultra deepwater drillship. During 2017, we took delivery of ENSCO DS-10 and made the final milestone payment of
$75.0 million
. ENSCO DS-10 commenced drilling operations offshore Nigeria in March 2018.
In connection with the Atwood Merger, we acquired two ultra-deepwater drillships, ENSCO DS-13 and ENSCO DS-14, which are currently under construction in the Daewoo Shipbuilding & Marine Engineering Co. Ltd. yard in South Korea. ENSCO DS-13 and ENSCO DS-14 are scheduled for delivery during the third quarter of 2019 and second quarter of 2020, respectively. Upon delivery, the remaining milestone payments and accrued interest thereon may be financed through a promissory note with the shipyard for each rig. The promissory notes will bear interest at a rate of 5.0% per annum with a maturity date of December 30, 2022 and will be secured by a mortgage on each respective rig.
Jackups
During 2014, we entered into an agreement with Lamprell Energy Limited to construct two premium jackup rigs, ENSCO 140 and ENSCO 141, which are significantly enhanced versions of the LeTourneau Super 116E jackup design and incorporate Ensco's patented Canti-Leverage Advantage
TM
technology. ENSCO 140 and ENSCO 141 were
6
delivered during 2016 and commenced drilling operations offshore Saudi Arabia during July and August 2018, respectively.
We previously entered into an agreement with Keppel FELS to construct an ultra-premium harsh environment jackup, ENSCO 123. In December 2017, we agreed to delay delivery of ENSCO 123 until 2019, and in January 2018, we made a
$207.4 million
milestone payment. The remaining unpaid balance of
$9.0 million
is due upon delivery. ENSCO 123 was designed to incorporate Ensco's patented Continuous Tripping Technology™, a new proprietary solution that provides safer and more efficient pipe tripping and helps to lower customers’ offshore project costs. We expect ENSCO 123 to commence drilling operations in the North Sea in July 2019.
Divestitures
Our business strategy has been to focus on ultra-deepwater floater and premium jackup operations and de-emphasize other assets and operations that are not part of our long-term strategic plan or that no longer meet our standards for economic returns. Consistent with this strategy, we sold
12
jackup rigs,
five
dynamically positioned semisubmersible rigs,
one
moored semisubmersible rig and
two
drillships during the three-year period ended
December 31, 2018
.
We continue to focus on our fleet management strategy in light of the composition of our rig fleet. As part of this strategy, we may act opportunistically from time to time to monetize assets to enhance shareholder value and improve our liquidity profile, in addition to selling or disposing of older, lower-specification or non-core assets.
Contract Drilling Operations
Our business consists of three operating segments: (1) Floaters, which includes our drillships and semisubmersible rigs, (2) Jackups and (3) Other, which consists of management services on rigs owned by third-parties. Our two reportable segments, Floaters and Jackups, provide one service, contract drilling.
Of our
59
rigs,
29
are located in the Middle East, Africa and Asia Pacific (including
three
rigs under construction),
12
are located in North and South America (including Brazil) and
18
are located in Europe and the Mediterranean.
Our drilling rigs drill and complete oil and natural gas wells. From time to time, our drilling rigs may be utilized as accommodation units or for non-drilling services, such as workovers and interventions, plug and abandonment and decommissioning work. Demand for our drilling services is based upon many factors beyond our control. See “Item 1A. Risk Factors - The success of our business largely depends on the level of activities in the oil and gas industry, which can be significantly affected by volatile oil and natural gas prices.”
Our drilling contracts are the result of negotiations with our customers, and most contracts are awarded upon competitive bidding. The terms of our drilling contracts can vary significantly, but generally contain the following commercial terms:
|
•
|
contract duration or term for a specific period of time or a period necessary to drill one or more wells,
|
|
•
|
term extension options in favor of our customer, exercisable upon advance notice to us, at mutually agreed, indexed, fixed rates or current rate at the date of extension,
|
|
•
|
provisions permitting early termination of the contract (i) if the rig is lost or destroyed, (ii) if operations are suspended for a specified period of time due to various events, including damage or breakdown of major rig equipment, unsatisfactory performance, or "force majeure" events or (iii) at the convenience (without cause) of the customer (in certain cases obligating the customer to pay us an early termination fee providing some level of compensation to us for the remaining term),
|
7
|
•
|
payment of compensation to us (generally in U.S. dollars although some contracts require a portion of the compensation to be paid in local currency) on a day rate basis such that we receive a fixed amount for each day that the drilling unit is under contract (lower day rates generally apply for limited periods when operations are suspended due to various events, including during delays that are beyond our reasonable control, during repair of equipment damage or breakdown and during periods of re-drilling damaged portions of the well, and no day rate, or zero rate, generally applies when these limited periods are exceeded until the event is remediated, and during periods to remediate unsatisfactory performance or other specified conditions),
|
|
•
|
payment by us of the operating expenses of the drilling unit, including crew labor and incidental rig supply and maintenance costs,
|
|
•
|
mobilization and demobilization requirements of us to move the drilling unit to and from the planned drilling site, and may include reimbursement of a portion of these moving costs by the customer in the form of an up-front payment, additional day rate over the contract term or direct reimbursement, and
|
|
•
|
provisions allowing us to recover certain labor and other operating cost increases, including certain cost increases due to changes in applicable law, from our customers through day rate adjustment or direct reimbursement for contracts with terms in excess of one year.
|
In general, recent contract awards have been subject to an extremely competitive bidding process. The intense pressure on operating day rates has resulted in lower margin contracts that also contain less favorable contractual and commercial terms, including reduced or no mobilization and/or demobilization fees; reduced day rates or zero day rates during downtime due to damage or failure of our equipment; reduced standby, redrill and moving rates and reduced periods in which such rates are payable; reduced caps on reimbursements for lost or damaged downhole tools; reduced periods to remediate downtime due to equipment breakdowns or failure to perform in accordance with the contractual standards of performance before the operator may terminate the contract; certain limitations on our ability to be indemnified from operator and third party damages caused by our fault, resulting in increases in the nature and amounts of liability allocated to us; and reduced or no early termination fees and/or termination notice periods.
Backlog Information
Our contract drilling backlog reflects commitments, represented by signed drilling contracts, and is calculated by multiplying the contracted day rate by the contract period. The contracted day rate excludes certain types of lump sum fees for rig mobilization, demobilization, contract preparation, as well as customer reimbursables and bonus opportunities. Contract backlog is adjusted for drilling contracts signed or terminated after each respective balance sheet date but prior to filing each of our annual reports on Form 10-K on
February 28, 2019
and
February 27, 2018
, respectively.
The following table summarizes our contract backlog of business as of
December 31, 2018
and
2017
(in millions):
|
2018
|
2017
|
||||||
|
Floaters
|
$
|
941.5
|
|
$
|
1,578.3
|
|
|
|
Jackups
|
1,071.0
|
|
1,013.0
|
|
|||
|
Other
|
169.9
|
|
229.7
|
|
|||
|
Total
|
$
|
2,182.4
|
|
$
|
2,821.0
|
|
|
8
As of
December 31, 2018
, our backlog was
$2.2 billion
as compared to
$2.8 billion
as of
December 31, 2017
. Our floater backlog
declined
$636.8 million
primarily due to revenues realized during
2018
, partially offset by new contract awards and contract extensions. While our floater utilization increased marginally in 2018 to
46%
from
45%
in 2017, our floater backlog declined as revenues were realized on above-market, longer-term contracts and new contracts were executed a lower rates for shorter terms. Our jackup backlog
increased
$58.0 million
primarily due to new contract awards as utilization increased to
63%
in 2018 from
60%
in 2017, partially offset by revenues realized during 2018. Our other segment backlog
declined
$59.8 million
due to revenues realized during
2018
.
The following table summarizes our contract backlog of business as of
December 31, 2018
and the periods in which such revenues are expected to be realized (in millions):
|
2019
|
2020
|
2021
|
2022
and Beyond |
Total
|
|||||||||||||||
|
Floaters
|
$
|
716.5
|
|
$
|
225.0
|
|
$
|
—
|
|
$
|
—
|
|
$
|
941.5
|
|
||||
|
Jackups
|
503.4
|
|
272.0
|
|
191.8
|
|
103.8
|
|
1,071.0
|
|
|||||||||
|
Other
|
55.8
|
|
55.9
|
|
55.7
|
|
2.5
|
|
169.9
|
|
|||||||||
|
Total
|
$
|
1,275.7
|
|
$
|
552.9
|
|
$
|
247.5
|
|
$
|
106.3
|
|
$
|
2,182.4
|
|
||||
Our drilling contracts generally contain provisions permitting early termination of the contract (i) if the rig is lost or destroyed or (ii) by the customer if operations are suspended for a specified period of time due to breakdown of major rig equipment, unsatisfactory performance, "force majeure" events beyond the control of either party or other specified conditions. In addition, our drilling contracts generally permit early termination of the contract by the customer for convenience (without cause), exercisable upon advance notice to us, and in some cases without making an early termination payment to us. There can be no assurances that our customers will be able to or willing to fulfill their contractual commitments to us.
The amount of actual revenues earned and the actual periods during which revenues are earned will be different from amounts disclosed in our backlog calculations due to a lack of predictability of various factors, including unscheduled repairs, maintenance requirements, newbuild rig delivery dates, weather delays, contract terminations or renegotiations and other factors.
See "Item 1A. Risk Factors - Our current backlog of contract drilling revenue may not be fully realized and may decline significantly in the future, which may have a material adverse effect on our financial position, results of operations and cash flows” and “Item 1A. Risk Factors - We may suffer losses if our customers terminate or seek to renegotiate our contracts, if operations are suspended or interrupted or if a rig becomes a total loss.”
Drilling Contracts and Insurance Program
Our drilling contracts provide for varying levels of allocation of responsibility for liability between our customer and us for loss or damage to each party's property and third-party property, personal injuries and other claims arising out of our drilling operations. We also maintain insurance for personal injuries, damage to or loss of property and certain business risks.
Our insurance policies typically consist of 12-month policy periods, and the next renewal date for a substantial portion of our insurance program is scheduled for May 31,
2019
. Our insurance program provides coverage, subject to the policies' terms and conditions and to the extent not otherwise assumed by the customer under the indemnification provisions of the drilling contract, for third-party claims arising from our operations, including third-party claims arising from well-control events, named windstorms, sudden and accidental pollution originating from our rigs, wrongful death and personal injury. Third-party pollution claims could also arise from damage to adjacent pipelines and from spills of fluids maintained on the drilling unit. Generally, our program provides liability coverage up to
$750.0 million
, with a per occurrence deductible of
$10.0 million
or less. We retain the risk for liability not indemnified by the customer in excess of our insurance coverage.
9
Well-control events generally include an unintended flow from the well that cannot be contained by using equipment on site (e.g., a blowout preventer), by increasing the weight of drilling fluid or by diverting the fluids safely into production facilities. In addition to the third-party coverage described above, for claims relating to a well-control event, we also have
$150.0 million
of coverage available to pay costs of controlling and re-drilling of the well and third-party pollution claims.
Our insurance program also provides first party coverage to us for physical damage to, including total loss or constructive total loss of, our rigs, generally excluding damage arising from a named windstorm in the U.S. Gulf of Mexico. This coverage is based on an agreed amount for each rig and has a per occurrence deductible for losses ranging from
$15.0 million
to
$25.0 million
. Due to the significant premium, high deductible and limited coverage, we decided not to purchase first party windstorm insurance for our rigs in the U.S. Gulf of Mexico. Accordingly, we have retained the risk for windstorm damage to our
four
jackups and
five
floaters in the U.S. Gulf of Mexico.
Our drilling contracts customarily provide that each party is responsible for injuries or death to their respective personnel and loss or damage to their respective property (including the personnel and property of each parties’ contractors and subcontractors) regardless of the cause of the loss or damage. However, in certain drilling contracts our customer’s responsibility for damage to its property and the property of its other contractors contains an exception to the extent the loss or damage is due to our negligence, which exception is usually subject to negotiated caps on a per occurrence basis, although in some cases we assume responsibility for all damages due to our negligence. In addition, our drilling contracts typically provide for our customers to indemnify us, generally based on replacement cost minus some level of depreciation, for loss or damage to our down-hole equipment, and in some cases for a limited amount of the replacement cost of our subsea equipment, unless the damage is caused by our negligence, normal wear and tear or defects in our equipment.
Subject to the exceptions noted below, our customers typically assume most of the responsibility for and indemnify us from any loss, damage or other liability resulting from pollution or contamination arising from operations, including as a result of blowouts, cratering and seepage, when the source of the pollution originates from the well or reservoir, including costs for clean-up and removal of pollution and third-party damages. In most drilling contracts, we assume liability for third-party damages resulting from such pollution and contamination caused by our negligence, usually subject to negotiated caps on a per occurrence or per event basis. In addition, in substantially all of our contracts, the customer assumes responsibility and indemnifies us for loss or damage to the reservoir, for loss of hydrocarbons escaping from the reservoir and for the costs of bringing the well under control. Further, subject to the exceptions noted below, most of our contracts provide that the customer assumes responsibility and indemnifies us for loss or damage to the well, except when the loss or damage to the well is due to our negligence, in which case most of our contracts provide that the customer's sole remedy is to require us to redrill the lost or damaged portion of the well at a substantially reduced rate and, in some cases, pay for some of the costs to repair the well.
Most of our drilling contracts incorporate a broad exclusion that limits the operator's indemnity for damages and losses resulting from our gross negligence and willful misconduct and for fines and penalties and punitive damages levied or assessed directly against us. This exclusion overrides other provisions in the contract that would otherwise limit our liability for ordinary negligence. In most of these cases, we are still able to negotiate a liability cap (although these caps are significantly higher than the caps we are able to negotiate for ordinary negligence) on our exposure for losses or damages resulting from our gross negligence. In certain cases, the broad exclusion only applies to losses or damages resulting from the gross negligence of our senior supervisory personnel. However, in some cases we have contractually assumed significantly increased exposure or unlimited exposure for losses and damages due to the gross negligence of some or all our personnel, and in most cases, we are not able to contractually limit our exposure for our willful misconduct.
Notwithstanding our negotiation of express limitations in our drilling contracts for losses or damages resulting from our ordinary negligence and any express limitations (albeit usually much higher) for losses or damages in the event of our gross negligence, under the applicable laws that govern certain of our drilling contracts, the courts will not enforce any indemnity for losses and damages that result from our gross negligence or willful misconduct. As a result, under the laws of such jurisdictions, the indemnification provisions of our drilling contracts that would otherwise
10
limit our liability in the event of our gross negligence or willful misconduct are deemed to be unenforceable as being contrary to public policy, and we are exposed to unlimited liability for losses and damages that result from our gross negligence or willful misconduct, regardless of any express limitation of our liability in the relevant drilling contracts. Under the laws of certain jurisdictions, an indemnity from an operator for losses or damages of third parties resulting from our gross negligence is enforceable but an indemnity for losses or damages of the operator is not enforceable. In such cases, the contractual indemnity obligation of the operator to us would be enforceable with respect to third-party claims for losses of damages, such as may arise in pollution claims, but the contractual indemnity obligation of the operator to us with respect to injury or death to the operator's personnel, the operator’s damages to the well, to the reservoir and for the costs of well control would not be enforceable. Furthermore, although there is a lack of precedential authority for these types of claims in countries where the civil law is applied, in those situations where a fault based codified civil law system is applicable to our drilling contracts, as opposed to the common law system, the courts generally will not enforce a contractual indemnity clause that totally indemnifies us from losses or damages due to our gross negligence, but may enforce the contractual indemnity over and above a cap on our liability for gross negligence, assuming the cap requires us to accept a significant amount of liability.
Similar to gross negligence, regardless of any express limitations in a drilling contract regarding our liability for fines and penalties and punitive damages, the laws of most jurisdictions will not enforce an indemnity that indemnifies a party for a fine or penalty that is levied or punitive damages that are assessed directly against such party on the ground that it is against public policy to indemnify a party from a fine and penalty or punitive damages, especially where the purpose of such levy or assessment is to deter the behavior that resulted in the fine or penalty or punish such party for the behavior that warranted the assessment of punitive damages.
The above description of our insurance program and the indemnification provisions of our drilling contracts is only a summary as of the date hereof and is general in nature. In addition, our drilling contracts are individually negotiated, and the degree of indemnification we receive from operators against the liabilities discussed above can vary from contract to contract, based on market conditions and customer requirements existing when the contract was negotiated and the interpretation and enforcement of applicable law when the claim is adjudicated. Notwithstanding a contractual indemnity from a customer, there can be no assurance that our customers will be financially able to indemnify us or will otherwise honor a contractual indemnity obligation that is enforceable under applicable law. Our insurance program and the terms of our drilling contracts may change in the future.
In certain cases, vendors who provide equipment or services to us limit their pollution liability to a specific monetary cap, and we assume the liability above that cap. Typically, in the case of original equipment manufacturers, the cap is a negotiated amount based on mutual agreement of the parties considering the risk profiles and thresholds of each party. However, for smaller vendors, the liability is usually limited to the value, or double the value, of the contract.
We generally indemnify the customer for legal and financial consequences of spills of waste oil, fuels, lubricants, motor oils, pipe dope, paint, solvents, ballast, bilge, garbage, debris, sewage, hazardous waste and other liquids, the discharge of which originates from our rigs or equipment above the surface of the water and in some cases from our subsea equipment. Our contracts generally provide that, in the event of any such spill from our rigs, we are responsible for fines and penalties.
Major Customers
We provide our contract drilling services to major international, government-owned and independent oil and gas companies. During
2018
, our five largest customers accounted for
48%
of consolidated revenues. Total and Saudi Aramco, our customers who account for 10% or more of consolidated revenues, accounted for
15%
and
11%
of consolidated revenues, respectively.
11
Competition
The offshore contract drilling industry is highly competitive. Drilling contracts are, for the most part, awarded on a competitive bid basis. Price competition is often the primary factor in determining which contractor is awarded a contract, although quality of service, operational and safety performance, equipment suitability and availability, location of equipment, reputation and technical expertise also are factors. There are numerous competitors with significant resources in the offshore contract drilling industry.
Governmental Regulation and Environmental Matters
Our operations are affected by political initiatives and by laws and regulations that relate to the oil and gas industry, including laws and regulations that have or may impose increased financial responsibility and oil spill abatement contingency plan capability requirements. Accordingly, we will be directly affected by the approval and adoption of laws and regulations curtailing exploration and development drilling for oil and natural gas for economic, environmental, safety or other policy reasons. It is also possible that these laws and regulations and political initiatives could adversely affect our operations in the future by significantly increasing our operating costs or restricting areas open for drilling activity. See "Item 1A. Risk Factors- Increasing regulatory complexity could adversely impact the costs associated with our offshore drilling operations."
Our operations are subject to laws and regulations controlling the discharge of materials into the environment, pollution, contamination and hazardous waste disposal or otherwise relating to the protection of the environment. These laws and regulations may, among other things:
|
•
|
require the acquisition of various permits before drilling commences;
|
|
•
|
require notice to stakeholders of proposed and ongoing operations;
|
|
•
|
require the installation of expensive pollution control equipment;
|
|
•
|
restrict the types, quantities and concentration of various substances that can be released into the environment in connection with drilling; and
|
|
•
|
restrict the production rate of natural resources below the rate that would otherwise be possible.
|
Environmental laws and regulations specifically applicable to our business activities could impose significant liability on us for damages, clean-up costs, fines and penalties in the event of oil spills or similar discharges of pollutants or contaminants into the environment or improper disposal of hazardous waste generated in the course of our operations, which may not be covered by contractual indemnification or insurance, or for which indemnity is prohibited by applicable law and could have a material adverse effect on our financial position, operating results and cash flows. To date, such laws and regulations have not had a material adverse effect on our operating results, and we have not experienced an accident that has exposed us to material liability arising out of or relating to discharges of pollutants into the environment. However, the legislative, judicial and regulatory response to any well-control incidents could substantially increase our customers' liabilities in respect of oil spills and also could increase our liabilities. In addition to potential increased liabilities, such legislative, judicial or regulatory action could impose increased financial, insurance or other requirements that may adversely impact the entire offshore drilling industry.
Additionally, environmental laws and regulations are revised frequently, and any changes, including changes in implementation or interpretation, that result in more stringent and costly waste handling, disposal and cleanup requirements for our industry could have a significant impact on our operating costs.
The International Convention on Oil Pollution Preparedness, Response and Cooperation, the International Convention on Civil Liability for Oil Pollution Damage 1992, the U.K. Merchant Shipping Act 1995, Marpol 73/78 (the International Convention for the Prevention of Pollution from Ships), the U.K. Merchant Shipping (Oil Pollution Preparedness, Response and Co-operation Convention) Regulations 1998, as amended, and other related legislation and regulations and the Oil Pollution Act of 1990 ("OPA 90"), as amended, the Clean Water Act and other U.S. federal
12
statutes applicable to us and our operations, as well as similar statutes in Texas, Louisiana, other coastal states and other non-U.S. jurisdictions, address oil spill prevention, reporting and control and have significantly expanded potential liability, fine and penalty exposure across many segments of the oil and gas industry. Such statutes and related regulations impose a variety of obligations on us related to the prevention of oil spills, disposal of waste and liability for resulting damages. For instance, OPA 90 imposes strict and, with limited exceptions, joint and several liability upon each responsible party for oil removal costs as well as a variety of fines, penalties and damages. Similar environmental laws apply in our other areas of operation. Failure to comply with these statutes and regulations may subject us to civil or criminal enforcement action, which may not be covered by contractual indemnification or insurance, or for which indemnity is prohibited under applicable law, and could have a material adverse effect on our financial position, operating results and cash flows.
High-profile and catastrophic events such as the 2010 Macondo well incident have heightened governmental and environmental concerns about the oil and gas industry. From time to time, legislative proposals have been introduced that would materially limit or prohibit offshore drilling in certain areas. We are adversely affected by restrictions on drilling in certain areas of the U.S. Gulf of Mexico and elsewhere, including the adoption of additional safety requirements and policies regarding the approval of drilling permits and restrictions on development and production activities in the U.S. Gulf of Mexico that have and may further impact our operations.
As a result of Macondo, the Bureau of Safety and Environmental Enforcement ("BSEE") issued a drilling safety rule in 2012 that included requirements for the cementing of wells, well-control barriers, blowout preventers, well-control fluids, well completions, workovers and decommissioning operations. BSEE also issued regulations requiring operators to have safety and environmental management systems ("SEMS") prior to conducting operations and requiring operators and contractors to agree on how the contractors will assist the operators in complying with the SEMS. In addition, in August 2012, BSEE issued an Interim Policy Document ("IPD") stating that it would begin issuing Incidents of Non-Compliance ("INC's") to contractors as well as operators for serious violations of BSEE regulations. Following federal court decisions successfully challenging the scope of BSEE’s jurisdiction over offshore contractors, this IPD has been removed from the list of IPDs on the BSEE website. If this judicial precedent stands, it may reduce regulatory and civil litigation liability exposures.
In late 2014, the United States Coast Guard ("USCG") proposed new regulations that would impose GPS equipment and positioning requirements for mobile offshore drilling units ("MODUs") and jackup rigs operating in the U.S. Gulf of Mexico and issued notices regarding the development of guidelines for cybersecurity measures used in the marine and offshore energy sectors for all vessels and facilities that are subject to the Maritime Transportation Security Act of 2002 ("MTSA"), including our rigs. The regulations imposing GPS equipment and positioning requirements have not yet been issued. On July 12, 2017, the USCG announced the availability of and requested comments on draft guidelines for addressing cyber risks at MTSA-regulated facilities.
On July 28, 2016, BSEE adopted a new well-control rule that will be implemented in phases over the next several years (the "2016 Well Control Rule"). This new rule includes more stringent design requirements for well-control equipment used in offshore drilling operations. In May 2018, BSEE proposed revisions to the 2016 Well Control Rule. This proposed rule would revise requirements for well design, well control, casing, cementing, real-time monitoring and subsea containment. The revisions are targeted to ensure safety and environmental protection while correcting errors in the 2016 rule and reducing certain unnecessary regulatory burdens imposed under the existing regulations. The proposed revisions have not yet been finalized. We are continuing to evaluate the cost and effect that these new rules will have on our operations. Based on our current assessment of the rules, we do not expect to incur significant costs to comply with the 2016 Well Control Rule.
The continuing and evolving threat of cyber attacks will likely require increased expenditures to strengthen cyber risk management systems for MODUs and onshore facilities. For example, on May 11, 2017, President Trump issued EO 13800, entitled Strengthening the Cybersecurity of Federal Networks and Critical Infrastructure, which is intended to improve the nation's ability to defend against increasing and evolving cyber attacks, and in July 2017 the USCG issued proposed cybersecurity guidelines for port facilities and offshore facilities, including MODUs, that could be impacted by cyber attacks. We cannot currently estimate the future expenditures associated with increased regulatory requirements, which may be material, and we continue to monitor regulatory changes as they occur.
13
Additionally, climate change is receiving increasing attention from scientists and legislators, and significant focus is being put on companies that are active producers of depleting natural resources. Globally, there are a number of legislative and regulatory proposals at various levels of government to address the greenhouse gas emissions that contribute to climate change. Although it is not possible at this time to predict how legislation or new regulations that may be adopted to address greenhouse gas emissions would impact our business, any such future laws and regulations could require us or our customers to incur increased operating costs. Any such legislation or regulatory programs could also increase the cost of consuming oil, and thereby reduce demand for oil, which could reduce our customers’ demand for our services. Consequently, legislation and regulatory programs to reduce greenhouse gas emissions could have an adverse effect on our financial position, operating results and cash flows.
If new laws are enacted or other government actions are taken that restrict or prohibit offshore drilling in our principal areas of operation or impose additional regulatory (including environmental protection) requirements that materially increase the liabilities, financial requirements or operating or equipment costs associated with offshore drilling, exploration, development or production of oil and natural gas, our financial position, operating results and cash flows could be materially adversely affected. See "Item 1A. Risk Factors - Compliance with or breach of environmental laws can be costly and could limit our operations."
Non-U.S. Operations
Revenues from non-U.S. operations were
87%
,
92%
and
81%
of our total consolidated revenues during
2018, 2017 and 2016
, respectively. Our non-U.S. operations and shipyard rig construction and enhancement projects are subject to political, economic and other uncertainties, including:
|
•
|
terrorist acts, war and civil disturbances,
|
|
•
|
expropriation, nationalization, deprivation or confiscation of our equipment or our customer's property,
|
|
•
|
repudiation or nationalization of contracts,
|
|
•
|
assaults on property or personnel,
|
|
•
|
piracy, kidnapping and extortion demands,
|
|
•
|
significant governmental influence over many aspects of local economies and customers,
|
|
•
|
unexpected changes in law and regulatory requirements, including changes in interpretation or enforcement of existing laws,
|
|
•
|
work stoppages, often due to strikes over which we have little or no control,
|
|
•
|
complications associated with repairing and replacing equipment in remote locations,
|
|
•
|
limitations on insurance coverage, such as war risk coverage, in certain areas,
|
|
•
|
imposition of trade barriers,
|
|
•
|
wage and price controls,
|
|
•
|
import-export quotas,
|
|
•
|
exchange restrictions,
|
|
•
|
currency fluctuations,
|
|
•
|
changes in monetary policies,
|
|
•
|
uncertainty or instability resulting from hostilities or other crises in the Middle East, West Africa, Latin America or other geographic areas in which we operate,
|
|
•
|
changes in the manner or rate of taxation,
|
14
|
•
|
limitations on our ability to recover amounts due,
|
|
•
|
increased risk of government and vendor/supplier corruption,
|
|
•
|
increased local content requirements,
|
|
•
|
the occurrence or threat of epidemic or pandemic diseases or any government response to such occurrence or threat;
|
|
•
|
changes in political conditions, and
|
|
•
|
other forms of government regulation and economic conditions that are beyond our control.
|
See "Item 1A. Risk Factors - Our non-U.S. operations involve additional risks not associated with U.S. operations."
Executive Officers
Officers generally serve for a one-year term or until successors are elected and qualified to serve. The table below sets forth certain information regarding our executive officers:
|
Name
|
Age
|
Position
|
||
|
Carl G. Trowell
|
50
|
President and Chief Executive Officer
|
||
|
P. Carey Lowe
|
60
|
Executive Vice President - Chief Operating Officer
|
||
|
Jonathan Baksht
|
44
|
Senior Vice President and Chief Financial Officer
|
||
|
Steven J. Brady
|
59
|
Senior Vice President - Eastern Hemisphere
|
||
|
John S. Knowlton
|
59
|
Senior Vice President - Technical
|
||
|
Gilles Luca
|
47
|
Senior Vice President - Western Hemisphere
|
||
|
Michael T. McGuinty
|
56
|
Senior Vice President - General Counsel and Secretary
|
||
Set forth below is certain additional information on our executive officers, including the business experience of each executive officer for at least the last five years:
Carl G. Trowell joined Ensco in June 2014 as President and Chief Executive Officer. He is also a member of the Board of Directors. Prior to joining Ensco, Mr. Trowell was President of Schlumberger Integrated Project Management (IPM) and Schlumberger Production Management (SPM) businesses that provide complex oil and gas project solutions ranging from field management, well construction, production and intervention services to well abandonment and rig management. He was promoted to this role after serving as President - Schlumberger WesternGeco Ltd. where he managed more than 6,500 employees with operations in 55 countries. Mr. Trowell began his professional career as a petroleum engineer with Shell before joining Schlumberger where he held a variety of international management positions including Geomarket Manager for North Sea operations and Global Vice President of Marketing and Sales. He has a strong background in the development and deployment of new technologies and has been a member of several industry advisory boards in this capacity. Mr. Trowell is on the advisory board of Energy Ventures, a venture capital company investing in oil and gas technology. In August 2016, Mr. Trowell became a non-executive director on the board of Ophir Energy plc. Mr. Trowell has a PhD in Earth Sciences from the University of Cambridge, a Master of Business Administration from The Open University and a Bachelor of Science degree in Geology from Imperial College London.
P. Carey Lowe joined Ensco in 2008 and serves as Executive Vice President and Chief Operating Officer. Prior to being appointed Chief Operating Officer in December 2015, Mr. Lowe served Ensco as Executive Vice President overseeing investor relations and communications, strategy and human resources. Prior to serving as Executive Vice President, he served Ensco as Senior Vice President - Eastern Hemisphere and Senior Vice President with responsibilities including the Deepwater Business Unit, safety, health and environmental matters, capital projects, engineering and strategic planning. Prior to joining Ensco, Mr. Lowe served as Vice President - Latin America for Occidental Oil & Gas. He also served as President & General Manager, Occidental Petroleum of Qatar Ltd. from 2001
15
to 2007. Mr. Lowe held various drilling-related management positions with Sedco Forex and Schlumberger Oilfield Services from 1980 to 2000, including Business Manager - Drilling, North and South America and General Manager - Oilfield Services, Saudi Arabia, Bahrain and Kuwait. Following Schlumberger, he was associated with a business-to-business e-procurement company until he joined Occidental during 2001. Mr. Lowe holds a Bachelor of Science Degree in Civil Engineering from Tulane University.
Jonathan Baksht joined Ensco in 2013 and was appointed to his current position of Senior Vice President - Chief Financial Officer in 2015. Prior to his current position, Mr. Baksht served as Vice President - Finance and Vice President - Treasurer. Prior to joining Ensco, Mr. Baksht served as a Senior Vice President at Goldman Sachs & Co. within the Investment Banking Division where he served as a financial advisor to energy clients, oilfield services lead and a member of the Merger & Acquisitions Group. Prior to joining Goldman Sachs in 2006, he consulted on strategic initiatives for energy clients at Andersen Consulting. Mr. Baksht holds a Master of Business Administration from the Kellogg School of Management at Northwestern University and a Bachelor of Science with High Honors in Electrical Engineering from the University of Texas at Austin.
Steven J. Brady joined Ensco in 2002 and was appointed to his current position of Senior Vice President – Eastern Hemisphere in December 2014. Prior to his current position, Mr. Brady served as Senior Vice President - Western Hemisphere, Vice President – Europe and Mediterranean, General Manager – Middle East and Asia Pacific, and in other leadership positions in the Eastern Hemisphere. In 2018, Mr. Brady was elected the Chairman of the Executive Committee for the International Association of Drilling Contractors. Prior to joining Ensco, Mr. Brady spent 18 years in various technical and managerial roles for ConocoPhillips in locations around the world. Mr. Brady holds a Bachelor of Science Degree in Petroleum Engineering from Mississippi State University.
John S. Knowlton joined Ensco in 1998 and was appointed to his current position of Senior Vice President – Technical in May 2011. Prior to his current position, Mr. Knowlton served Ensco as Vice President – Engineering & Capital Projects, General Manager – North & South America, Operations Manager – Asia Pacific Rim, and Operations Manager overseeing the construction and operation of our first ultra-deepwater semisubmersible rig, ENSCO 7500. Before joining Ensco, Mr. Knowlton served in various domestic and international capacities with Ocean Drilling & Exploration Company and Diamond Offshore Drilling, Inc. Mr. Knowlton holds a Bachelor of Science Degree in Civil Engineering from Tulane University.
Gilles Luca joined Ensco in 1997 and was appointed to his current position of Senior Vice President - Western Hemisphere in December 2014. Prior to his current position, Mr. Luca was Vice President - Business Development and Strategic Planning, Vice President - Brazil Business Unit and General Manager - Europe and Africa. He holds a Master Degree in Petroleum Engineering from the French Petroleum Institute and a Bachelor in Civil Engineering.
Michael T. McGuinty joined Ensco in February 2016 as Senior Vice President - General Counsel and Secretary. Prior to joining Ensco, Mr. McGuinty served as General Counsel and Company Secretary of Abu Dhabi National Energy Company. Previously, Mr. McGuinty spent 18 years with Schlumberger where he held various senior legal management positions in the United States, Europe and the Middle East including Director of Compliance, Deputy General Counsel - Corporate and M&A and Director of Legal Operations. Prior to Schlumberger, Mr. McGuinty practiced corporate and commercial law in Canada and France. Mr. McGuinty holds a Bachelor of Laws and Bachelor of Civil Law from McGill University and a Bachelor of Social Sciences from the University of Ottawa.
Employees
Excluding contract employees, we employed approximately
4,400
personnel worldwide as of
December 31, 2018
. The majority of our personnel work on rig crews and are compensated on an hourly basis.
16
Available Information
Our Annual Reports on Form 10-K, Quarterly Reports on Form 10-Q, Current Reports on Form 8-K and amendments to these reports that we file or furnish to the SEC in accordance with the Exchange Act, as amended, are available on our website at www.enscoplc.com/investors. In addition, the SEC maintains an Internet site at www.sec.gov that contains reports, proxy and information statements, and other information regarding issuers that file electronically with the SEC. These reports also are available in print without charge by contacting our Investor Relations Department at 713-430-4607 as soon as reasonably practicable after we electronically file the information with, or furnish it to, the SEC. The information contained on our website is not included as part of, or incorporated by reference into, this report.
Item 1A.
Risk Factors
Risks Related to the Rowan Transaction
The following risk factors relate to the Rowan Transaction. For more information on the Rowan Transaction, please read the joint proxy statement we filed with the SEC on December 11, 2018, the supplement to the joint proxy statement we filed with the SEC on January 31, 2019, as well as any other related information on the Rowan Transaction that we have filed with the SEC.
We and Rowan will be subject to various uncertainties and contractual restrictions while the Rowan Transaction is pending that could adversely affect each party’s business and operations.
In connection with the Rowan Transaction, it is possible that some customers, suppliers and other persons with whom we or Rowan have business relationships may delay or defer certain business decisions, or might decide to seek to terminate, change or renegotiate their relationship with us or Rowan as a result of the Rowan Transaction, which could negatively affect our or Rowan’s respective financial positions, operating results or cash flows, as well as the market price of our shares and Rowan shares, regardless of whether the Rowan Transaction is completed.
Under the terms of the Rowan Transaction Agreement, we and Rowan are subject to certain restrictions on the conduct of our businesses prior to completing the Rowan Transaction, which may adversely affect our and Rowan's ability to execute certain business strategies. Such limitations could negatively affect each party’s businesses and operations prior to the completion of the Rowan Transaction. Furthermore, the process of planning to integrate two businesses and organizations for the post-transaction period may divert management’s attention and resources and could ultimately have an adverse effect on each party. These uncertainties could cause customers, suppliers and others that deal with us or Rowan to seek to change existing business relationships with such party, which in turn could have an adverse effect on the combined company’s ability to realize the anticipated benefits of the Rowan Transaction.
We or Rowan may have difficulty attracting, motivating and retaining executives and other employees in light of the Rowan Transaction.
Uncertainty about the effect of the Rowan Transaction on our employees or Rowan’s employees may impair the companies' ability to attract, retain and motivate personnel until the Rowan Transaction is completed. Employee retention may be particularly challenging during the pendency of the Rowan Transaction, as employees may feel uncertain about their future roles with the combined organization. In addition, we or Rowan may have to provide additional compensation in order to retain employees. If our employees or Rowan's employees depart because of issues relating to the uncertainty and difficulty of integration or a desire not to become employees of the combined company, the combined company’s ability to realize the anticipated benefits of the Rowan Transaction could be adversely affected.
The Rowan Transaction is subject to conditions, including certain conditions that may not be satisfied, and may not be completed on a timely basis, if at all. Failure to complete the Rowan Transaction, or significant delays in completing the Rowan Transaction, could negatively affect the trading price of our shares and our future business and financial results.
17
The completion of the Rowan Transaction remains subject to a number of conditions beyond our and Rowan’s control that may prevent, delay or otherwise materially adversely affect its completion, including among others the receipt of antitrust clearance in Saudi Arabia. Neither we nor Rowan can predict whether and when these conditions will be satisfied. Any delay in completing the Rowan Transaction could cause the combined company not to realize some or all of the synergies expected to be achieved if the Rowan Transaction is successfully completed within its expected time frame.
If the Rowan Transaction is not completed, we will be subject to several risks and consequences, including the following:
|
•
|
certain damages for which we may be liable to Rowan under the terms and conditions of the Rowan Transaction Agreement;
|
|
•
|
negative reactions from the financial markets, including declines in the price of our shares due to the fact that current prices may reflect a market assumption that the Rowan Transaction will be completed;
|
|
•
|
certain significant costs relating to the Rowan Transaction, including, in certain circumstances, the payment by us of $15 million for Rowan’s expenses and a termination fee payable by us of $24 million less any previous expense reimbursements; and
|
|
•
|
diverted attention of our management to the Rowan Transaction rather than our own operations and pursuit of other opportunities that could have been beneficial to us.
|
In addition, completion of the Rowan Transaction remains subject to antitrust clearance in Saudi Arabia. Under the terms of the Rowan Transaction Agreement, either we and/or Rowan could be required to effect or commit to effecting the divestiture or disposition of certain of our or their respective businesses, assets, equity interests, product lines or properties in order to obtain approvals and consents needed from the antitrust authorities in the relevant jurisdictions in order to complete the Rowan Transaction. If we or Rowan takes such actions, it could be detrimental to us or to the combined company following the consummation of the Rowan Transaction.
We and Rowan will incur substantial transaction fees and costs in connection with the Rowan Transaction.
We and Rowan expect to incur a number of non-recurring transaction-related costs associated with completing the Rowan Transaction, combining the operations of the two organizations and achieving desired synergies. These fees and costs will be substantial. Non-recurring transaction costs include, but are not limited to, fees paid to legal, financial and accounting advisors, retention, severance, change in control and other integration-related costs, filing fees and printing costs. Additional unanticipated costs may be incurred in the integration of our business and Rowan's business. There can be no assurance that the elimination of certain duplicative costs, as well as the realization of other efficiencies related to the integration of the two businesses, will offset the incremental transaction-related costs over time. Thus, any net benefit may not be achieved in the near term, the long term or at all.
Completion of the Rowan Transaction will trigger change of control or other provisions in certain agreements to which Rowan is a party.
The completion of the Rowan Transaction will trigger change of control or other provisions in certain agreements to which Rowan is a party. In particular, pursuant to the indenture governing Rowan’s 7.375% senior notes due 2025, Rowan will be required to make an offer to purchase all or any part of each holder’s notes at an amount equal to 101% of the aggregate principal amount of such holder’s notes, plus accrued and unpaid interest, if any, if there is a ratings downgrade by both Moody’s Investors Service, Inc. (“Moody’s”) and S&P Global Ratings (“S&P”) between the public notice of the Rowan Transaction and 60 days after the consummation of the Rowan Transaction (or any extended period if either Moody’s or S&P publicly announces a possible downgrade). As a result, we could be required to repay up to an aggregate $500.0 million principal amount of senior notes plus $5.0 million in associated premiums.
18
In addition, the completion of the Rowan Transaction will constitute a change of control under Rowan’s 2018 and 2014 revolving credit facilities. As a result, at the direction of the lenders holding a majority of the unfunded commitments and outstanding loans under a revolving credit facility, the commitments under such revolving credit facility may be terminated and the outstanding balance under such revolving credit facilities may be accelerated and become due and payable by Rowan in connection with the completion of the Rowan Transaction. As of December 31, 2018, Rowan had no outstanding borrowings under its revolving credit facilities.
If a governmental authority asserts objections to the Rowan Transaction, we and Rowan may be unable to complete the Rowan Transaction or, in order to do so, we and Rowan may be required to comply with material restrictions or satisfy material conditions.
The completion of the Rowan Transaction is subject to the condition that there is no order, injunction, decree or other legal restraint by a governmental authority in effect restraining, preventing or prohibiting the Rowan Transaction contemplated by the Transaction Agreement. If a governmental authority asserts objections to the Rowan Transaction, we or Rowan may be required to divest assets or accept other remedies in order to complete the Rowan Transaction. There can be no assurance as to the cost, scope or impact of the actions that may be required to address any governmental authority objections to the Rowan Transaction. If we or Rowan takes such actions, it could be detrimental to us or to the combined company following the consummation of the Rowan Transaction. Furthermore, these actions could have the effect of delaying or preventing completion of the Rowan Transaction or imposing additional costs on or limiting the operating results or cash flows of the combined company following the consummation of the Rowan Transaction.
In addition, in some circumstances, a third party could initiate a private action under antitrust laws challenging or seeking to enjoin the Rowan Transaction, before or after it is completed. We or Rowan may not prevail and may incur significant costs in defending or settling any action under the antitrust laws.
If completed, the Rowan Transaction may not achieve its intended results, and we and Rowan may be unable to successfully integrate our operations. Failure to successfully combine our business and Rowan's business in the expected time frame may adversely affect the future results of the combined organization, and, consequently, the value of our shares that Rowan shareholders receive as the Rowan Transaction consideration.
We and Rowan entered into the Transaction Agreement with the expectation that the Rowan Transaction will result in various benefits, including, among other things, expanding our geographic presence and customer base and creating synergies. Achieving the anticipated benefits of the Rowan Transaction is subject to a number of uncertainties, including whether the businesses of us and Rowan can be integrated in an efficient and effective manner.
It is possible that the integration process could take longer than anticipated and could result in the loss of valuable employees, the disruption of each company’s ongoing businesses, processes and systems or inconsistencies in standards, controls, procedures, practices, policies and compensation arrangements, any of which could adversely affect the combined company’s ability to achieve the anticipated benefits of the Rowan Transaction. The combined company’s results of operations could also be adversely affected by any issues attributable to either company’s operations that arise or are based on events or actions that occur prior to the completion of the Rowan Transaction. The companies may have difficulty addressing possible differences in corporate cultures and management philosophies. The integration process is subject to a number of uncertainties, and no assurance can be given that the anticipated benefits will be realized or, if realized, the timing of their realization. Failure to achieve these anticipated benefits could result in increased costs or decreases in the amount of expected revenues and could adversely affect the combined company’s future business, financial condition, operating results and cash flows.
A downgrade in our or our subsidiaries’ credit ratings following the Rowan Transaction could impact the combined company’s access to capital and cost of doing business.
Following the Rowan Transaction, rating agencies may re-evaluate our and our subsidiaries’ ratings, and any additional actual or anticipated downgrades in such credit ratings could limit our ability to access credit and capital markets, or to restructure or refinance our indebtedness. As a result of any such downgrades, future financings or
19
refinancings may result in higher borrowing costs and require more restrictive terms and covenants, including obligations to post collateral with third parties, which may further restrict operations and negatively impact liquidity.
Credit rating agencies perform independent analysis when assigning credit ratings. The analysis includes a number of criteria including, but not limited to, business composition, market and operational risks, as well as various financial tests. Credit rating agencies continue to review the criteria for industry sectors and various debt ratings and may make changes to those criteria from time to time. Credit ratings are not recommendations to buy, sell or hold investments in the rated entity. Ratings are subject to revision or withdrawal at any time by the rating agencies, and we cannot assure you that we will maintain our current credit ratings.
The Rowan Transaction may be completed even though material adverse changes subsequent to the announcement of the Rowan Transaction, such as industry-wide changes or other events, may occur.
In general, either party can refuse to complete the Rowan Transaction if there is a material adverse change affecting the other party. However, some types of changes do not permit either party to refuse to complete the Rowan Transaction, even if such changes would have a material adverse effect on either of the parties. For example, a worsening of our or Rowan's financial condition or results of operations due to a decrease in commodity prices or general economic conditions would not give the other party the right to refuse to complete the Rowan Transaction. If adverse changes occur that affect either party but the parties are still required to complete the Rowan Transaction, our share price, business and financial results after the Rowan Transaction may suffer.
Risks Related to Our Business
There are numerous factors that affect our business and operating results, many of which are beyond our control. The following is a description of significant factors that might cause our future operating results to differ materially from those currently expected. The risks described below are not the only risks facing our Company. Additional risks and uncertainties not specified herein, not currently known to us or currently deemed to be immaterial also may materially adversely affect our business, financial position, operating results or cash flows.
The success of our business largely depends on the level of activity in the oil and gas industry, which can be significantly affected by volatile oil and natural gas prices.
The success of our business largely depends on the level of activity in offshore oil and natural gas exploration, development and production. Oil and natural gas prices, and market expectations of potential changes in these prices, significantly affect the level of drilling activity. Historically, when drilling activity and operator capital spending decline, utilization and day rates also decline and drilling may be reduced or discontinued, resulting in an oversupply of drilling rigs. The oversupply of drilling rigs will be exacerbated by the entry of newbuild rigs into the market. Oil and natural gas prices have historically been volatile, and have declined significantly from prices in excess of $100 since mid-2014 causing operators to reduce capital spending and cancel or defer existing programs, substantially reducing the opportunities for new drilling contracts. More recently, oil prices have increased meaningfully from the decade lows reached during 2016, with Brent crude averaging nearly
$55
per barrel in 2017 and more than $70 per barrel through the first nine months of 2018, leading to signs of a gradual recovery in demand for offshore drilling services. However, macroeconomic and geopolitical headwinds triggered a market correction during the fourth quarter of 2018, resulting in a decline in Brent crude prices from more than
$85
per barrel at the beginning of the quarter to approximately
$50
per barrel at year-end. Commodity prices have not improved to a level that supports increased rig demand sufficient to absorb existing rig supply and generate meaningful increases in day rates. We expect these trends to continue as long as commodity prices and rig supply remain at current levels. The lack of a meaningful recovery of oil and natural gas prices or further price reductions or volatility in prices may cause our customers to maintain historically low levels or further reduce their overall level of activity, in which case demand for our services may further decline and revenues may continue to be adversely affected through lower rig utilization and/or lower day rates. Numerous factors may affect oil and natural gas prices and the level of demand for our services, including:
|
•
|
regional and global economic conditions and changes therein,
|
20
|
•
|
oil and natural gas supply and demand,
|
|
•
|
expectations regarding future energy prices,
|
|
•
|
the ability of the Organization of Petroleum Exporting Countries ("OPEC") to reach further agreements to set and maintain production levels and pricing and to implement existing and future agreements,
|
|
•
|
capital allocation decisions by our customers, including the relative economics of offshore development versus onshore prospects,
|
|
•
|
the level of production by non-OPEC countries,
|
|
•
|
U.S. and non-U.S. tax policy,
|
|
•
|
advances in exploration and development technology,
|
|
•
|
costs associated with exploring for, developing, producing and delivering oil and natural gas,
|
|
•
|
the rate of discovery of new oil and gas reserves and the rate of decline of existing oil and gas reserves,
|
|
•
|
laws and government regulations that limit, restrict or prohibit exploration and development of oil and natural gas in various jurisdictions, or materially increase the cost of such exploration and development,
|
|
•
|
the development and exploitation of alternative fuels or energy sources,
|
|
•
|
disruption to exploration and development activities due to hurricanes and other severe weather conditions and the risk thereof,
|
|
•
|
natural disasters or incidents resulting from operating hazards inherent in offshore drilling, such as oil spills, and
|
|
•
|
the worldwide military or political environment, including uncertainty or instability resulting from an escalation or additional outbreak of armed hostilities or other crises in oil or natural gas producing areas of the Middle East or geographic areas in which we operate, or acts of terrorism.
|
Despite significant declines in capital spending and cancelled or deferred drilling programs by many operators since 2014, oil and gas production has not yet been reduced by amounts sufficient to result in a rebound in pricing to levels seen prior to the current downturn, and we may not see sufficient supply reductions or a resulting rebound in pricing for an extended period of time. Further, the agreements of OPEC and certain non-OPEC countries to freeze and/or cut production may not be fully realized. The lack of actual production cuts or freezes, or the perceived risk that OPEC countries may not comply with such agreements, may result in depressed commodity prices for an extended period of time.
In addition, continued hostility in foreign countries and the occurrence or threat of terrorist attacks against the United States or other countries could create downward pressure on the economies of the United States and other countries. Moreover, higher commodity prices may not necessarily translate into increased activity, and even during periods of high commodity prices, customers may cancel or curtail their drilling programs, or reduce their levels of capital expenditures for exploration and production for a variety of reasons, including their lack of success in exploration efforts. Advances in onshore exploration and development technologies, particularly with respect to onshore shale, could also result in our customers allocating more of their capital expenditure budgets to onshore exploration and production activities and less to offshore activities. These factors could cause our revenues and profits to decline further, as a result of declines in utilization and day rates, and limit our future growth prospects. Any significant decline in day rates or utilization of our rigs, particularly our high-specification floaters, could materially reduce our revenues and profitability. In addition, these risks could increase instability in the financial and insurance markets and make it more difficult for us to access capital and obtain insurance coverage that we consider adequate or are otherwise required by our contracts.
21
The offshore contract drilling industry historically has been highly competitive and cyclical, with periods of low demand and excess rig availability that could result in adverse effects on our business.
Our industry is highly competitive, and our contracts are traditionally awarded on a competitive bid basis. Pricing, safety records and competency are key factors in determining which qualified contractor is awarded a job. Rig availability, location and technical capabilities also can be significant factors in the determination. If we are not able to compete successfully, our revenues and profitability may be reduced.
The offshore contract drilling industry historically has been very cyclical and is primarily related to the demand for drilling rigs and the available supply of drilling rigs. Demand for rigs is directly related to the regional and worldwide levels of offshore exploration and development spending by oil and gas companies, which is beyond our control. Offshore exploration and development spending may fluctuate substantially from year-to-year and from region-to-region.
The supply of offshore drilling rigs has increased significantly in recent years. Delivery of newbuild drilling rigs has increased and will continue to increase rig supply and could curtail a strengthening, or trigger a further reduction, in utilization and day rates. Currently, there are approximately 105 competitive newbuild drillships, semisubmersibles and jackup rigs reported to be on order or under construction with delivery expected by the end of 2020. Approximately 71 of these rigs are scheduled for delivery during 2019, representing an approximate 9% increase in the total worldwide fleet of competitive offshore drilling rigs since year-end 2018. Many of these offshore drilling rigs do not have drilling contracts in place. In addition, the supply of marketed offshore drilling rigs could further increase due to depressed market conditions resulting in an increase in uncontracted rigs as existing contracts expire. There are no assurances that the market in general or a geographic region in particular will be able to fully absorb the supply of new rigs in future periods.
The significant decline in oil and gas prices and resulting reduction in spending by our customers, together with the increase in supply of offshore drilling rigs in recent years, has resulted in an oversupply of offshore drilling rigs and a decline in utilization and day rates, a situation which may persist for many years.
Such a prolonged period of reduced demand and/or excess rig supply has required us, and may in the future require us, to idle or scrap rigs and enter into low day rate contracts or contracts with unfavorable terms. There can be no assurance that the current demand for drilling rigs will increase in the future. Any further decline in demand for drilling rigs or a continued oversupply of drilling rigs could adversely affect our financial position, operating results or cash flows.
Our business will be adversely affected if we are unable to secure contracts on economically favorable terms.
Our ability to renew expiring contracts or obtain new contracts and the terms of any such contracts will depend on market conditions. We may be unable to renew our expiring contracts or obtain new contracts for the rigs under contracts that have expired or have been terminated, and the day rates under any new contracts or any renegotiated contracts may be substantially below the existing day rates, which could adversely affect our revenues and profitability.
Two of our
three
rigs under construction, which are scheduled for delivery between 2019 and 2020, are currently uncontracted. There is no assurance that we will secure drilling contracts for these rigs, or future rigs we construct or acquire, or that the drilling contracts we may be able to secure will be based upon rates and terms that will provide a reasonable rate of return on these investments. Our failure to secure contracts for these rigs at day rates and terms that result in a reasonable return upon completion of construction may result in a material adverse effect on our financial position, operating results or cash flows.
22
Our customers may be unable or unwilling to fulfill their contractual commitments to us, including their obligations to pay for losses, damages or other liabilities resulting from operations under the contract.
Certain of our customers are subject to liquidity risk and such risk could lead them to seek to repudiate, cancel or renegotiate our drilling contracts or fail to fulfill their commitments to us under those contracts. These risks are heightened in periods of depressed market conditions. Our drilling contracts provide for varying levels of indemnification from our customers, including with respect to well-control, reservoir liability and pollution. Our drilling contracts also provide for varying levels of indemnification and allocation of liabilities between our customers and us with respect to loss or damage to property and injury or death to persons arising from the drilling operations we perform. Under our drilling contracts, liability with respect to personnel and property customarily is allocated so that we and our customers each assume liability for our respective personnel and property. Our customers have historically assumed most of the responsibility for and indemnified us from any loss, damage or other liability resulting from pollution or contamination, including clean-up and removal and third-party damages arising from operations under the contract when the source of the pollution originates from the well or reservoir, including those resulting from blow-outs or cratering of the well. However, we regularly are required to assume a limited amount of liability for pollution damage caused by our negligence, which liability generally has caps for ordinary negligence, with much higher caps or unlimited liability where the damage is caused by our gross negligence. Notwithstanding a contractual indemnity from a customer, there can be no assurance that our customers will be financially able to assume their responsibility and honor their indemnity to us for such losses. In addition, under the laws of certain jurisdictions, such indemnities under certain circumstances are not enforceable if the cause of the damage was our gross negligence or willful misconduct. This could result in us having to assume liabilities in excess of those agreed in our contracts due to customer balance sheet or liquidity issues or applicable law.
We may suffer losses if our customers terminate or seek to renegotiate our contracts, if operations are suspended or interrupted or if a rig becomes a total loss.
In market downturns similar to the current environment, our customers may not be able to honor the terms of existing contracts, may terminate contracts even where there may be onerous termination fees, may seek to void or otherwise repudiate our contracts including by claiming we have breached the contract, or may seek to renegotiate contract day rates and terms in light of depressed market conditions. Since early 2015, we have renegotiated a number of contracts and received termination notices with respect to several of our rigs. Often, our drilling contracts are subject to termination without cause or termination for convenience upon notice by the customer. In certain cases, our contracts require the customer to pay an early termination fee in the event of a termination for convenience (without cause). Such payment would provide some level of compensation to us for the lost revenue from the contract and in many cases would not fully compensate us for all of the lost revenue. Certain of our contracts permit termination by the customer without an early termination fee. Furthermore, financially distressed customers may seek to negotiate reduced termination fees as part of a restructuring package.
Drilling contracts customarily specify automatic termination or termination at the option of the customer in the event of a total loss of the drilling rig and often include provisions addressing termination rights or reduction or cessation of day rates if operations are suspended or interrupted for extended periods due to breakdown of major rig equipment, unsatisfactory performance, "force majeure" events beyond the control of either party or other specified conditions.
If a customer cancels a contract or if we terminate a contract due to the customer’s breach and, in either case, we are unable to secure a new contract on a timely basis and on substantially similar terms, or if a contract is disputed or suspended for an extended period of time or renegotiated, it could materially and adversely affect our financial position, operating results or cash flows.
We may incur impairments as a result of future declines in demand for offshore drilling rigs.
We evaluate the carrying value of our property and equipment, primarily our drilling rigs, when events or changes in circumstances indicate that the carrying value of such rigs may not be recoverable. The offshore drilling
23
industry historically has been highly cyclical, and it is not unusual for rigs to be idle or underutilized for significant periods of time and subsequently resume full or near full utilization when business cycles change. Likewise, during periods in which rig supply exceeds rig demand, competition may force us to contract our rigs at or near cash break-even rates for extended periods of time.
During 2017, we recognized a pre-tax, non-cash loss on impairment of
$182.9 million
related to two floaters and one jackup rig, all of which were older, less capable, non-core assets in our fleet. During 2018, we recognized a pre-tax, non-cash loss on impairment of
$40.3 million
related to an older, non-core jackup rig. During the three years ended
December 31, 2018
, we have recorded pre-tax, non-cash losses on impairment of long-lived assets totaling
$223.2 million
. Further asset impairments may be necessary if market conditions remain depressed for longer than we expect. See Note 5 to our consolidated financial statements included in "Item 8. Financial Statements and Supplementary Data" for additional information.
The loss of a significant customer or customer contract could adversely affect us.
We provide our services to major international, government-owned and independent oil and gas companies. During
2018
, our five largest customers accounted for
48%
of our consolidated revenues in the aggregate, with our largest customer representing
15%
of our consolidated revenues. In addition, our largest customer contract represents a significant percentage of our operating cash flows. Our financial position, operating results or cash flows may be materially adversely affected if any of our higher day rate contracts were terminated or renegotiated on less favorable terms or if a major customer terminates its contracts with us, fails to renew its existing contracts with us, requires renegotiation of our contracts or declines to award new contracts to us.
Our current backlog of contract drilling revenue may not be fully realized and may decline significantly in the future, which may have a material adverse effect on our financial position, operating results or cash flows.
As of
December 31, 2018
, our contract backlog was approximately
$2.2 billion
, which represents a decline of
$638.6 million
since
December 31, 2017
. This amount reflects the remaining contractual terms multiplied by the applicable contractual day rate. The contractual revenue may be higher than the actual revenue we ultimately receive because of a number of factors, including rig downtime or suspension of operations. Several factors could cause rig downtime or a suspension of operations, many of which are beyond our control, including:
|
•
|
the early termination, repudiation or renegotiation of contracts,
|
|
•
|
breakdowns of equipment,
|
|
•
|
work stoppages, including labor strikes,
|
|
•
|
shortages of material or skilled labor,
|
|
•
|
surveys by government and maritime authorities,
|
|
•
|
periodic classification surveys,
|
|
•
|
severe weather, strong ocean currents or harsh operating conditions,
|
|
•
|
the occurrence or threat of epidemic or pandemic diseases or any government response to such occurrence or threat, and
|
|
•
|
force majeure events.
|
Our customers may seek to terminate, repudiate or renegotiate our drilling contracts for various reasons. Generally, our drilling contracts permit early termination of the contract by the customer for convenience (without cause), exercisable upon advance notice to us, and in certain cases without making an early termination payment to us. There can be no assurances that our customers will be able to or willing to fulfill their contractual commitments to us.
24
The decline in oil prices and the resulting downward pressure on utilization has caused and may continue to cause some customers to consider early termination of select contracts despite having to pay onerous early termination fees in certain cases. Customers may continue to request to renegotiate the terms of existing contracts, or they may request early termination or seek to repudiate contracts in some circumstances. Furthermore, as our existing contracts expire, we may be unable to secure new contracts for our rigs. Therefore, revenues recorded in future periods could differ materially from our current backlog. Our inability to realize the full amount of our contract backlog may have a material adverse effect on our financial position, operating results or cash flows.
We may have difficulty obtaining or maintaining insurance in the future on terms we find acceptable and our insurance coverage may not protect us against all of the risks and hazards we face, including those specific to offshore operations.
Our operations are subject to hazards inherent in the offshore drilling industry, such as blow-outs, reservoir damage, loss of production, loss of well-control, uncontrolled formation pressures, lost or stuck drill strings, equipment failures and mechanical breakdowns, punchthroughs, craterings, industrial accidents, fires, explosions, oil spills and pollution. These hazards can cause personal injury or loss of life, severe damage to or destruction of property and equipment, pollution or environmental damage, which could lead to claims by third parties or customers, suspension of operations and contract terminations. Our fleet is also subject to hazards inherent in marine operations, either while on-site or during mobilization, such as punch-throughs, capsizing, sinking, grounding, collision, damage from severe weather and marine life infestations. Additionally, a cyber attack or other security breach of our information systems or other technological failure could lead to a material disruption of our operations, information systems and/or loss of business information, which could result in an adverse impact to our business. Our drilling contracts provide for varying levels of indemnification from our customers, including with respect to well-control and subsurface risks. For example, most of our drilling contracts incorporate a broad exclusion that limits the customer's indemnity rights for damages and losses resulting from our gross negligence and willful misconduct and for fines and penalties and punitive damages levied or assessed directly against us. We also maintain insurance for personal injuries, damage to or loss of equipment and other insurance coverage for various business risks.
We generally identify the operational hazards for which we will procure insurance coverage based on the likelihood of loss, the potential magnitude of loss, the cost of coverage, the requirements of our customer contracts and applicable legal requirements. Although we maintain what we believe to be an appropriate level of insurance covering hazards and risks we currently encounter during our operations, no assurance can be given that we will be able to obtain insurance against all potential risks and hazards, or that we will be able to maintain the same levels and types of coverage that we have maintained in the past.
Furthermore, our insurance carriers may interpret our insurance policies such that they do not cover losses for all of our claims. Our insurance policies may also have exclusions of coverage for some losses. Uninsured exposures may include radiation hazards, certain loss or damage to property onboard our rigs and losses relating to shore-based terrorist acts or strikes.
If we are unable to obtain or maintain adequate insurance at rates and with deductibles or retention amounts that we consider commercially reasonable, we may choose to forgo insurance coverage and retain the associated risk of loss or damage.
If a significant accident or other event occurs and is not fully covered by insurance or contractual indemnity (or if our contractual indemnity is not enforceable under applicable law or our clients are unable to meet their indemnification obligation), it could adversely affect our financial position, operating results or cash flows.
25
The potential for U.S. Gulf of Mexico hurricane related windstorm damage or liabilities could result in uninsured losses and may cause us to alter our operating procedures during hurricane season, which could adversely affect our business.
Certain areas in and near the U.S. Gulf of Mexico experience hurricanes and other extreme weather conditions on a relatively frequent basis. Some of our drilling rigs in the U.S. Gulf of Mexico are located in areas that could cause them to be susceptible to damage and/or total loss by these storms, and we have a larger concentration of jackup rigs in the U.S. Gulf of Mexico than most of our competitors. We currently have
four
jackup rigs and
five
floaters in the U.S. Gulf of Mexico. Damage caused by high winds and turbulent seas could result in rig loss or damage, termination of drilling contracts for lost or severely damaged rigs or curtailment of operations on damaged drilling rigs with reduced or suspended day rates for significant periods of time until the damage can be repaired. Moreover, even if our drilling rigs are not directly damaged by such storms, we may experience disruptions in our operations due to damage to our customers' platforms and other related facilities in the area. Our drilling operations in the U.S. Gulf of Mexico have been impacted by hurricanes in the past, including the total loss of drilling rigs, with associated losses of contract revenues and potential liabilities.
Insurance companies incurred substantial losses in the offshore drilling, exploration and production industries as a consequence of hurricanes that occurred in the U.S. Gulf of Mexico during 2004, 2005 and 2008. Accordingly, insurance companies have substantially reduced the nature and amount of insurance coverage available for losses arising from named tropical storm or hurricane damage in the U.S. Gulf of Mexico and have dramatically increased the cost of available windstorm coverage. The tight insurance market not only applies to coverage related to U.S. Gulf of Mexico windstorm damage or loss of our drilling rigs, but also impacts coverage for any potential liabilities to third parties associated with property damage, personal injury or death and environmental liabilities, as well as coverage for removal of wreckage and debris associated with hurricane losses. It is likely that the tight insurance market for windstorm damage, liabilities and removal of wreckage and debris will continue into the foreseeable future.
We do not purchase windstorm insurance for hull and machinery losses to our floaters arising from windstorm damage in the U.S. Gulf of Mexico due to the significant premium, high deductible and limited coverage for windstorm damage. We opted out of windstorm insurance for our jackups in the U.S. Gulf of Mexico during 2009 and have not since renewed that insurance. We believe it is no longer customary for drilling contractors with similar size and fleet composition to purchase windstorm insurance for rigs in the U.S. Gulf of Mexico for the aforementioned reasons. Accordingly, we have retained the risk of loss or damage for our
four
jackups and
five
floaters arising from windstorm damage in the U.S. Gulf of Mexico.
We have established operational procedures designed to mitigate risk to our jackup rigs in the U.S. Gulf of Mexico during hurricane season, and these procedures may, on occasion, result in a decision to decline to operate on a customer-designated location during hurricane season notwithstanding that the location, water depth and other standard operating conditions are within a rig's normal operating range. Our procedures and the associated regulatory requirements addressing MODU operations in the U.S. Gulf of Mexico during hurricane season, coupled with our decision to retain (self-insure) certain windstorm-related risks, may result in a significant reduction in the utilization of our jackup rigs in the U.S. Gulf of Mexico.
Our annual insurance policies are up for renewal effective May 31,
2019
, and any retained exposures for property loss or damage and wreckage and debris removal or other liabilities associated with U.S. Gulf of Mexico tropical storms or hurricanes may have a material adverse effect on our financial position, operating results or cash flows if we sustain significant uninsured or underinsured losses or liabilities as a result of these storms or hurricanes.
26
Our non-U.S. operations involve additional risks not typically associated with U.S. operations.
Revenues from non-U.S. operations were
87%
,
92%
and
81%
of our total revenues during
2018, 2017 and 2016
, respectively. Our non-U.S. operations and shipyard rig construction and enhancement projects are subject to political, economic and other uncertainties, including:
|
•
|
terrorist acts, war and civil disturbances,
|
|
•
|
expropriation, nationalization, deprivation or confiscation of our equipment or our customer's property,
|
|
•
|
repudiation or nationalization of contracts,
|
|
•
|
assaults on property or personnel,
|
|
•
|
piracy, kidnapping and extortion demands,
|
|
•
|
significant governmental influence over many aspects of local economies and customers,
|
|
•
|
unexpected changes in law and regulatory requirements, including changes in interpretation or enforcement of existing laws,
|
|
•
|
work stoppages, often due to strikes over which we have little or no control,
|
|
•
|
complications associated with repairing and replacing equipment in remote locations,
|
|
•
|
limitations on insurance coverage, such as war risk coverage, in certain areas,
|
|
•
|
imposition of trade barriers,
|
|
•
|
wage and price controls,
|
|
•
|
import-export quotas,
|
|
•
|
exchange restrictions,
|
|
•
|
currency fluctuations,
|
|
•
|
changes in monetary policies,
|
|
•
|
uncertainty or instability resulting from hostilities or other crises in the Middle East, West Africa, Latin America or other geographic areas in which we operate,
|
|
•
|
changes in the manner or rate of taxation,
|
|
•
|
limitations on our ability to recover amounts due,
|
|
•
|
increased risk of government and vendor/supplier corruption,
|
|
•
|
increased local content requirements,
|
|
•
|
the occurrence or threat of epidemic or pandemic diseases or any government response to such occurrence or threat,
|
|
•
|
changes in political conditions, and
|
27
|
•
|
other forms of government regulation and economic conditions that are beyond our control.
|
We historically have maintained insurance coverage and obtained contractual indemnities that protect us from some, but not all, of the risks associated with our non-U.S. operations such as nationalization, deprivation, expropriation, confiscation, political and war risks. However, there can be no assurance that any particular type of contractual or insurance protection will be available in the future or that we will be able to purchase our desired level of insurance coverage at commercially feasible rates. Moreover, we may initiate a self-insurance program through one or more captive insurance subsidiaries. In circumstances where we have insurance protection for some or all of the risks sometimes associated with non-U.S. operations, such insurance may be subject to cancellation on short notice, and it is unlikely that we would be able to remove our rig or rigs from the affected area within the notice period. Accordingly, a significant event for which we are uninsured, underinsured or self-insured, or for which we have not received an enforceable contractual indemnity from a customer, could cause a material adverse effect on our financial position, operating results or cash flows.
We are subject to various tax laws and regulations in substantially all countries in which we operate or have a legal presence. We evaluate applicable tax laws and employ various business structures and operating strategies to obtain the optimal level of taxation on our revenues, income, assets and personnel. Actions by tax authorities that impact our business structures and operating strategies, such as changes to tax treaties, laws and regulations, or the interpretation or repeal of any of the foregoing or changes in the administrative practices and precedents of tax authorities, adverse rulings in connection with audits or otherwise, or other challenges may substantially increase our tax expense.
As required by law, we file periodic tax returns that are subject to review and examination by various revenue agencies within the jurisdictions in which we operate. We cannot predict or provide assurance as to the ultimate outcome of existing or future tax assessments.
Our non-U.S. operations also face the risk of fluctuating currency values, which may impact our revenues, operating costs and capital expenditures. We currently conduct contract drilling operations in certain countries that have experienced substantial fluctuations in the value of their currency compared to the U.S. dollar. In addition, some of the countries in which we operate have occasionally enacted exchange controls. Generally, we have contractually mitigated these risks by invoicing and receiving payment in U.S. dollars (our functional currency) or freely convertible currency and, to the extent possible, by limiting our acceptance of foreign currency to amounts which approximate our expenditure requirements in such currencies. However, not all of our contracts contain these terms and there is no assurance that our contracts will contain such terms in the future.
A portion of the costs and expenditures incurred by our non-U.S. operations, including certain capital expenditures, are settled in local currencies, exposing us to risks associated with fluctuation in the value of these currencies relative to the U.S. dollar. We use foreign currency forward contracts to reduce this exposure in certain cases. However, a relative weakening in the value of the U.S. dollar in relation to the local currencies in these countries may increase our costs and expenditures.
Our non-U.S. operations are also subject to various laws and regulations in countries in which we operate, including laws and regulations relating to the operation of drilling rigs and the requirements for equipment. We may be required to make significant capital expenditures to operate in such countries, which may not be reimbursed by our customers. Governments in some countries have become increasingly active in regulating and controlling the ownership of oil, natural gas and mineral concessions and companies holding concessions, the exploration of oil and natural gas and other aspects of the oil and gas industry in their countries. In some areas of the world, government activity has adversely affected the amount of exploration and development work performed by major international oil companies and may continue to do so. Moreover, certain countries accord preferential treatment to local contractors or joint ventures or impose specific quotas for local goods and services, which can increase our operational costs and place us at a competitive disadvantage. There can be no assurance that such laws and regulations or activities will not have a material adverse effect on our future operations.
28
The shipment of goods, services and technology across international borders subjects us to extensive trade laws and regulations. Our import activities are governed by specific customs laws and regulations in each of the countries where we operate. Moreover, many countries, including the United States, control the export and re-export of certain goods, services and technology and impose related export recordkeeping and reporting obligations. Governments also may impose express or de facto economic sanctions against certain countries, persons and other entities that may restrict or prohibit transactions involving such countries, persons and entities.
The laws and regulations concerning import activity, export recordkeeping and reporting, export control and economic sanctions are complex and constantly changing. These laws and regulations may be enacted, amended, enforced or interpreted in a manner materially impacting our operations. Shipments can be delayed and denied export or entry for a variety of reasons, some of which are outside our control and some of which may result from failure to comply with existing legal and regulatory regimes. Shipping delays or denials could cause unscheduled operational downtime, reduced day rates during such downtime and contract cancellations. Any failure to comply with applicable legal and regulatory trading obligations also could result in criminal and civil penalties and sanctions, such as fines, imprisonment, exclusion from government contracts, seizure of shipments and loss of import and export privileges.
Our employees, contractors and agents may take actions in violation of our policies and procedures designed to promote compliance with the laws of the jurisdictions in which we operate. Any such violation could have a material adverse effect on our financial position, operating results or cash flows.
The results of the U.K.'s referendum on withdrawal from the E.U. may have a negative effect on global economic conditions, financial markets and our business.
In June 2016, a referendum was held in the U.K. which resulted in a majority voting in favor of the U.K. withdrawing from the E.U. (commonly referred to as “Brexit”). The U.K. will continue to be a member of the E.U. until the expiration of a two-year notice period, following the U.K.’s formal notification to the European Council under Article 50 of the Treaty on European Union (which occurred on March 29, 2017), or until such other date as is agreed by all 28 member states of the E.U., unless prior to any such date the U.K. elects to revoke its formal Article 50 notification to the European Council. While the U.K. government and the European Commission have agreed to the terms of a withdrawal agreement, on January 16, 2019, the U.K. Parliament voted against the withdrawal agreement in its current form. There is currently no certainty that the withdrawal agreement will be ratified by, in particular, the U.K. Parliament or the European Parliament or the European Council. Consequently, the terms on which, and the date on which, the U.K. will withdraw from the E.U. (if at all) remain difficult to predict. In addition, it is expected that, if and when the U.K. withdraws from the E.U., the U.K. and the E.U. will hold further negotiations seeking to establish the terms of the long-term trading relationship between the U.K. and the E.U.
The referendum and the political negotiation surrounding the terms of the U.K.’s withdrawal from the E.U. have created significant uncertainty about the future relationship between the U.K. and the E.U., including with respect to the laws and regulations that will apply. This is because if the U.K. withdraws from the E.U. (and subject to the terms of any withdrawal agreement), the U.K. will determine which E.U.-derived laws to replace or replicate in the event of a withdrawal. The referendum has also given rise to calls for the governments of other E.U. member states to consider withdrawal, while the U.K.’s withdrawal negotiation process has increased the risk of governmental change in the U.K. as well as the possibility of a further referendum concerning Scotland’s independence from the rest of the U.K.
If no withdrawal agreement is reached by March 29, 2019, the U.K.’s membership of the E.U. could terminate under a so-called “hard Brexit.” Under this scenario, there could be increased costs from the imposition of tariffs on trade or non-tariff barriers between the U.K. and E.U., shipping delays because of the need for customs inspections and temporary shortages of certain goods. Any of the foregoing might cause our U.K. suppliers to pass along these increased costs, if realized, to us in the U.K. In addition, trade and investment between the U.K., the E.U. and other countries would be impacted by the fact that the U.K. currently operates under tax and trade treaties concluded between the E.U. and other countries. Following a “hard Brexit”, the U.K. would need to negotiate its own tax and trade treaties with other countries, as well as with the E.U. Any new, or changes to existing, U.K. tax laws could make the U.K. a
29
less desirable jurisdiction of incorporation for our parent company, Ensco plc. In addition, one of our U.K. subsidiaries owns two jackup rigs, and following a “hard Brexit,” the E.U. might require some form of importation fee or guarantee on certain U.K. owned rigs that operate outside U.K. waters.
These developments, or the perception that any of them could occur, have had and may continue to have a material adverse effect on global, regional and/or national economic conditions and the stability of global financial markets, and may significantly reduce global market liquidity and restrict the ability of key market participants to operate in certain financial markets. Any of these factors could depress economic activity, result in changes to currency exchange rates, tariffs, treaties, taxes, import/export regulations, laws and other regulatory matters, and/or restrict our access to capital and the free movement of our employees, which could have a material adverse effect on our financial position, operating results or cash flows. Approximately
11%
of our total revenues were generated in the U.K. for the year ended December 31, 2018.
Our drilling contracts with national oil companies may expose us to greater risks than we normally assume in drilling contracts with non-governmental customers.
We currently own and operate
15
rigs that are contracted with national oil companies. The terms of these contracts are often non-negotiable and may expose us to greater commercial, political and operational risks than we assume in other contracts, such as exposure to materially greater environmental liability, personal injury and other claims for damages (including consequential damages), or the risk that the contract may be terminated by our customer without cause on short-term notice, contractually or by governmental action, under certain conditions that may not provide us with an early termination payment. We can provide no assurance that the increased risk exposure will not have an adverse impact on our future operations or that we will not increase the number of rigs contracted to national oil companies with commensurate additional contractual risks.
We may reduce or suspend our dividend in the future.
Our Board of Directors declared a
$0.01
quarterly cash dividend per Class A ordinary share for each quarter during
2016
,
2017
and
2018
. In the future, our Board of Directors may, without advance notice, reduce or suspend our dividend in order to improve our financial flexibility and best position us for long-term success. The declaration and amount of future dividends is at the discretion of our Board of Directors and will depend on our profitability, liquidity, financial condition, market outlook, reinvestment opportunities, capital requirements, restrictions and limitations in our credit facility and other debt documents and other factors and restrictions our Board of Directors deems relevant. There can be no assurance that we will pay a dividend in the future.
Legal and regulatory proceedings could adversely affect us.
We are involved in litigation, including various claims, disputes and regulatory proceedings that arise in the ordinary course of business, many of which are uninsured and relate to intellectual property, commercial, operational, employment, regulatory or other activities.
We operate in a number of countries throughout the world, including countries known to have a reputation for corruption and are subject to the U.S. Foreign Corrupt Practices Act of 1977 (“FCPA”), the U.S. Treasury Department's Office of Foreign Assets Control ("OFAC") regulations, the U.K. Bribery Act ("UKBA"), other U.S. laws and regulations governing our international operations and similar laws in other countries.
During 2010, Pride International LLC ("Pride") and its subsidiaries resolved with the U.S. Department of Justice (“DOJ”) and the SEC their previously disclosed investigations into potential violations of the FCPA. However, Pride received preliminary inquiries from governmental authorities of certain of the countries referenced in its settlements with the DOJ and SEC. We could face additional fines, sanctions and other penalties from authorities in these and other relevant jurisdictions, including prohibition of our participating in or curtailment of business operations in those jurisdictions and the seizure of our rigs or other assets. At this stage of such inquiries, we are unable to determine what, if any, legal liability may result. Our customers in those jurisdictions could seek to impose penalties or take other
30
actions adverse to our interests. We could also face other third-party claims by directors, officers, employees, affiliates, advisors, attorneys, agents, stockholders, debt holders or other stakeholders. In addition, disclosure of the subject matter of the investigations and settlements could adversely affect our reputation and our ability to obtain new business or retain existing business from our current clients and potential clients, to attract and retain employees and to access the capital markets.
On August 29, 2018, we received a letter from the Division of Enforcement of the SEC informing us that the Division had concluded its investigation into alleged irregularities related to the drilling services agreement with Petrobras for ENSCO DS-5 (the “DSA”) and does not intend to recommend any enforcement action against us. On August 31, 2018, we received a letter from the DOJ stating that it had closed the inquiry into this matter and acknowledging our full cooperation with the investigation. See Item 1 “Legal Proceedings” in our quarterly report on Form 10-Q for the quarter ended June 30, 2018, for further information on the investigation.
In August 2017, one of our Brazilian subsidiaries was contacted by the Office of the Attorney General for the Brazilian state of Paraná in connection with a criminal investigation procedure initiated against agents of both Samsung Heavy Industries, a shipyard in South Korea (“SHI”), and Pride in relation to the DSA. The Brazilian authorities requested information regarding our compliance program and the findings of our internal investigations. We cooperated with the Office of the Attorney General and provided documents in response to its request. We cannot predict the scope or ultimate outcome of this procedure or whether any Brazilian governmental authority will open an investigation into Pride’s involvement in this matter, or if a proceeding were opened, the scope or ultimate outcome of any such investigation.
Any violation of the FCPA, OFAC regulations, the UKBA or other applicable anti-corruption laws by us, our affiliated entities or their respective officers, directors, employees and agents could in some cases provide a customer with termination rights under a contract and result in substantial fines, sanctions, civil and/or criminal penalties and curtailment of operations in certain jurisdictions and could adversely affect our financial condition, operating results, cash flows or the availability of funds under our revolving credit facility. Further, we may incur significant costs and consume significant internal resources in our efforts to detect, investigate and resolve actual or alleged violations.
Increasing regulatory complexity could adversely impact the costs associated with our offshore drilling operations.
Increases in regulatory requirements, particularly in the U.S. Gulf of Mexico, could significantly increase our costs. In recent years, we have seen several significant regulatory changes that have affected the way we operate in the U.S. Gulf of Mexico.
Hurricanes Katrina and Rita in 2005 and Hurricanes Gustav and Ike in 2008 caused damage to a number of rigs in the Gulf of Mexico. Rigs that were moved off location by the storms damaged platforms, pipelines, wellheads and other drilling rigs. As a result of jackup rig fitness requirements during hurricane seasons issued by BSEE and its predecessor agency, jackup rigs in the U.S. Gulf of Mexico are required to operate with a higher air gap (the space between the water level and the bottom of the rig's hull) during hurricane season, effectively reducing the water depth in which they can operate. The guidelines also provide for enhanced information and data requirements from oil and gas companies operating in the U.S. Gulf of Mexico.
Following the 2010 Macondo well incident in the U.S. Gulf of Mexico, the U.S. Department of the Interior issued Notices to Lessees, implementing new requirements and/or guidelines that are applicable to drilling operations in the U.S. Gulf of Mexico. Current or future Notice to Lessees or other rules, directives and regulations may further impact our customers' ability to obtain permits and commence or continue deep or shallow water operations in the U.S. Gulf of Mexico. In 2016, BSEE promulgated the 2016 Well Control Rule imposing new requirements for well-control and blowout prevention equipment that could increase our costs and cause delays in our operations due to unavailability of associated equipment. In May 2018, BSEE proposed revisions to the 2016 Well Control Rule. This proposed rule would revise requirements for well design, well control, casing, cementing, real-time monitoring and subsea containment. The revisions are targeted to ensure safety and environmental protection while correcting errors in the 2016 rule and reducing certain unnecessary regulatory burdens imposed under the existing regulations. The proposed revisions have not yet been finalized.
31
Also, as a result of the Macondo well incident, BSEE and its predecessor agency promulgated regulations regarding SEMS. Although only operators are currently required to have a SEMS, the SEMS regulations require written agreements between operators and contractors regarding the contractors’ support of the operators' safety and environmental policies at the worksite, including requirements for personnel training and written safe work practices. In addition, BSEE has in the past stated that future rulemaking may require offshore drilling contractors to implement their own SEMS programs. The current SEMS regulations and the possibility of additional SEMS rules for contractors could expose us to increased costs.
In 2012, BSEE issued an IPD for use by BSEE inspectors in INCs to contractors operating under BSEE jurisdiction on the Outer Continental Shelf of the U.S. Gulf of Mexico. The stated purpose of the policy was to provide for consistency in application of BSEE enforcement authority by establishing guidelines for issuance of INCs to contractors in addition to operators. The policy indicated that BSEE’s enforcement actions would continue to focus primarily on lessees and operators, but that “in appropriate circumstances” BSEE also would issue INCs to contractors for “serious violations” of BSEE regulations. Following federal court decisions successfully challenging the scope of BSEE’s jurisdiction over offshore contractors, this IPD has been removed from the list of IPDs on the BSEE website. If this judicial precedent stands, it may reduce regulatory and civil litigation liability exposures.
Since 2014, the United States Coast Guard has proposed new regulations that would impose GPS equipment and positioning requirements for MODUs and jackup rigs operating in the U.S. Gulf of Mexico and issued notices regarding the development of guidelines for cybersecurity measures used in the marine and offshore energy sectors for all vessels and facilities that are subject to the MTSA, including our rigs. In 2016, BSEE adopted the 2016 Well Control Rule, which will be implemented in phases over the next several years. This new rule includes more stringent design requirements for well-control equipment used in offshore drilling operations. As described above, revisions to this rule have been proposed by BSEE, which could reduce the regulatory burden of the rule. We are continuing to evaluate the cost and effect that these new rules will have on our operations. However, based on our current assessment of the rules, we do not expect to incur significant costs to comply with the rule. Implementation of further guidelines and regulations may subject us to increased costs and limit the operational capabilities of our rigs.
Any new or additional regulatory, legislative, permitting or certification requirements in the U.S., including laws and regulations that have or may impose increased financial responsibility, oil spill abatement contingency plan capability requirements, or additional operational requirements and certifications, could materially adversely affect our financial position, operating results or cash flows.
We anticipate that government regulation in other countries where we operate may follow the U.S. in regard to enhanced safety and environmental regulation, which could also result in governments imposing sanctions on contractors when operators fail to comply with regulations that impact drilling operations. Even if not a requirement in these countries, most international operating companies, and many others, are voluntarily complying with some or all of the U.S. inspections and safety and environmental guidelines when operating outside the U.S. Such additional governmental regulation and voluntary compliance by operators could increase the cost of our operations and expose us to greater liability.
Compliance with or breach of environmental laws can be costly and could limit our operations.
Our operations are subject to laws and regulations controlling the discharge of materials into the environment, pollution, contamination and hazardous waste disposal or otherwise relating to the protection of the environment. Environmental laws and regulations specifically applicable to our business activities could impose significant liability on us for damages, clean-up costs, fines and penalties in the event of oil spills or similar discharges of pollutants or contaminants into the environment or improper disposal of hazardous waste generated in the course of our operations. To date, such laws and regulations have not had a material adverse effect on our operating results, and we have not experienced an accident that has exposed us to material liability arising out of or relating to discharges of pollutants into the environment. However, the legislative, judicial and regulatory response to a well incident could substantially increase our and our customers' liabilities. In addition to potential increased liabilities, such legislative, judicial or
32
regulatory action could impose increased financial, insurance or other requirements that may adversely impact the entire offshore drilling industry.
The International Convention on Oil Pollution Preparedness, Response and Cooperation, the International Convention on Civil Liability for Oil Pollution Damage 1992, the U.K. Merchant Shipping Act 1995, Marpol 73/78 (the International Convention for the Prevention of Pollution from Ships), the U.K. Merchant Shipping (Oil Pollution Preparedness, Response and Co-operation Convention) Regulations 1998, as amended, and other related legislation and regulations and the OPA 90, as amended, the Clean Water Act, and other U.S. federal statutes applicable to us and our operations, as well as similar statutes in Texas, Louisiana, other coastal states and other non-U.S. jurisdictions, address oil spill prevention, reporting and control and have significantly expanded potential liability, fine and penalty exposure across many segments of the oil and gas industry.
Such statutes and related regulations impose a variety of obligations on us related to the prevention of oil spills, disposal of waste and liability for resulting damages. For instance, OPA 90 imposes strict and, with limited exceptions, joint and several liability upon each responsible party for oil removal costs as well as a variety of fines, penalties and damages. Although OPA 90 provides for certain limits of liability, such limits are not applicable where there is any safety violation or where gross negligence is involved. Failure to comply with these statutes and regulations, including OPA 90, may subject us to civil or criminal enforcement action, which may not be covered by contractual indemnification or insurance and could have a material adverse effect on our financial position, operating results or cash flows. Further, remedies under the Clean Water Act and related legislation and OPA 90 do not preclude claims under state regulations or civil claims for damages to third parties under state laws.
High profile and catastrophic events, including the 2010 Macondo well incident, have heightened governmental and environmental concerns about the risks associated with offshore oil and gas drilling. We are adversely affected by restrictions on drilling in certain areas in which we operate, including policies and guidelines regarding the approval of drilling permits, restrictions on development and production activities, and directives and regulations that have and may further impact our operations. From time to time, legislative and regulatory proposals have been introduced that would materially limit or prohibit offshore drilling in certain areas, or that would increase the liabilities or costs associated with offshore drilling. If new laws are enacted, or if government actions are taken that restrict or prohibit offshore drilling in our principal areas of operation or that impose environmental or other requirements that materially increase the liabilities, financial requirements or operating or equipment costs associated with offshore drilling, exploration, development, or production of oil and natural gas, our financial position, operating results or cash flows could be materially adversely affected.
Laws and governmental regulations may add to costs, limit our drilling activity or reduce demand for our drilling services.
Our operations are affected by political developments and by laws and regulations that relate directly to the oil and gas industry. The offshore contract drilling industry is dependent on demand for services from the oil and gas industry. Accordingly, we will be directly affected by the approval and adoption of laws and regulations limiting or curtailing exploration and development drilling for oil and natural gas for economic, environmental, safety and other policy reasons. Furthermore, we may be required to make significant capital expenditures or incur substantial additional costs to comply with new governmental laws and regulations. It is also possible that legislative and regulatory activity could adversely affect our operations by limiting drilling opportunities or significantly increasing our operating costs.
Regulation of greenhouse gases and climate change could have a negative impact on our business.
Governments around the world are increasingly focused on enacting laws and regulations regarding climate change and regulation of greenhouse gases. Lawmakers and regulators in the jurisdictions where we operate have proposed or enacted regulations requiring reporting of greenhouse gas emissions and the restriction thereof, including increased fuel efficiency standards, carbon taxes or cap and trade systems, restrictive permitting, and incentives for renewable energy. In addition, efforts have been made and continue to be made in the international community toward the adoption of international treaties or protocols that would address global climate change issues and impose reductions
33
of hydrocarbon-based fuels, including plans developed in connection with the Paris climate conference in December 2015 and the Katowice climate conference in December 2018. Laws or regulations incentivizing or mandating the use of alternative energy sources such as wind power and solar energy have also been enacted in certain jurisdictions. Additionally, numerous large cities globally and several countries have adopted programs to mandate or incentivize the conversion from internal combustion engine powered vehicles to electric-powered vehicles and placed restrictions on non-public transportation. Such policies or other laws, regulations, treaties and international agreements related to greenhouse gases and climate change may negatively impact the price of oil relative to other energy sources, reduce demand for hydrocarbons, limit drilling in the offshore oil and gas industry, or otherwise unfavorably impact our business, our suppliers and our customers, and result in increased compliance costs and additional operating restrictions, all of which would have a material adverse impact on our business. In addition, there have also been efforts in recent years to influence the investment community, including investment advisors and certain sovereign wealth, pension and endowment funds promoting divestment of fossil fuel equities and pressuring lenders to limit funding to companies engaged in the extraction of fossil fuel reserves. Such environmental activism and initiatives aimed at limiting climate change and reducing air pollution could ultimately interfere with our business activities and operations.
Geopolitical events, terrorist attacks, piracy and military action could affect the markets for our services and have a material adverse effect on our business and cost and availability of insurance.
Geopolitical events have resulted in military actions, terrorist, pirate and other armed attacks, civil unrest, political demonstrations, mass strikes and government responses. Military action by the United States or other nations could escalate, and acts of terrorism, piracy, kidnapping, extortion, acts of war, violence, civil war or general disorder may initiate or continue. Such acts could be directed against companies such as ours. Such developments have caused instability in the world’s financial and insurance markets in the past. In addition, these developments could lead to increased volatility in prices for oil and natural gas and could affect the markets for our services. Insurance premiums could increase and coverage for these kinds of events may be unavailable in the future. Any or all of these effects could have a material adverse effect on our financial position, operating results or cash flows.
Rig construction, upgrade and enhancement projects are subject to risks, including delays and cost overruns, which could have a material adverse effect on our financial position, operating results or cash flows.
We currently have two ultra-deepwater drillships and one jackup rig under construction. In the future, we may construct additional rigs and continue to upgrade the capability and extend the service lives of our existing rigs. As a result of current market conditions, we may seek to delay delivery of our rigs under construction. We agreed with the shipyard constructing ENSCO 123 to delay the delivery of the rig until 2019 and, prior to the closing of the Atwood Merger, Atwood agreed to delay the delivery of two ultra deepwater drillships, ENSCO DS-13 and ENSCO DS-14, into 2019 and 2020, respectively. During periods of heightened rig construction projects, shipyards and third-party equipment vendors may be under significant resource constraints to meet delivery obligations. Such constraints may lead to substantial delivery and commissioning delays, equipment failures and/or quality deficiencies. Furthermore, new drilling rigs may face start-up or other operational complications following completion of construction, upgrades or maintenance. Other unexpected difficulties, including equipment failures, design or engineering problems, could result in significant downtime at reduced or zero day rates or the cancellation or termination of drilling contracts.
Rig construction, upgrade, life extension and repair projects are subject to the risks of delay or cost overruns inherent in any large construction project, including the following:
|
•
|
failure of third-party equipment to meet quality and/or performance standards,
|
|
•
|
delays in equipment deliveries or shipyard construction,
|
|
•
|
shortages of materials or skilled labor,
|
|
•
|
damage to shipyard facilities or construction work-in-progress, including damage resulting from fire, explosion, flooding, severe weather, terrorism, war or other armed hostilities,
|
34
|
•
|
unforeseen design or engineering problems, including those relating to the commissioning of newly designed equipment,
|
|
•
|
unanticipated actual or purported change orders,
|
|
•
|
strikes, labor disputes or work stoppages,
|
|
•
|
financial or operating difficulties of equipment vendors or the shipyard while constructing, enhancing, upgrading, improving or repairing a rig or rigs,
|
|
•
|
unanticipated cost increases,
|
|
•
|
foreign currency exchange rate fluctuations impacting overall cost,
|
|
•
|
inability to obtain the requisite permits or approvals,
|
|
•
|
client acceptance delays,
|
|
•
|
disputes with shipyards and suppliers,
|
|
•
|
latent damages or deterioration to hull, equipment and machinery in excess of engineering estimates and assumptions,
|
|
•
|
claims of force majeure events, and
|
|
•
|
additional risks inherent to shipyard projects in a non-U.S. location.
|
With respect to ENSCO DS-13 and ENSCO DS-14, if we were to secure contracts for such rigs, we would be subject to the risk of delays and other hazards impacting the viability of such contracts, which could have a material adverse effect on our financial position, operating results or cash flows. The same risks apply to ENSCO 123 which was recently contracted and is expected to commence operations in July 2019 in the North Sea.
Failure to recruit and retain skilled personnel could adversely affect our operations and financial results.
We require skilled personnel to operate our drilling rigs and to provide technical services and support for our business. Historically, competition for the labor required for drilling operations and construction projects was intense as the number of rigs activated, added to worldwide fleets or under construction increased, leading to shortages of qualified personnel in the industry. During such periods of intensified competition, it is more difficult and costly to recruit and retain qualified employees, especially in foreign countries that require a certain percentage of national employees. The recent prolonged industry downturn may further reduce the number of qualified personnel available. If competition for labor were to intensify in the future, we could experience an increase in operating expenses, with a resulting reduction in net income, and our ability to fully staff and operate our rigs could be negatively affected.
We may be required to maintain or increase existing levels of compensation to retain our skilled workforce, especially if our competitors raise their wage rates. We also are subject to potential legislative or regulatory action that may impact working conditions, paid time off or other conditions of employment. If such labor trends continue, they could further increase our costs or limit our ability to fully staff and operate our rigs.
Unionization efforts and labor regulations in certain countries in which we operate could materially increase our costs or limit our flexibility.
Outside of the U.S., we are often subject to collective bargaining agreements that require periodic salary negotiations, which usually result in higher personnel expenses and other benefits. Efforts have been made from time to time to unionize other portions of our workforce. In addition, we have been subjected to strikes or work stoppages and other labor disruptions in certain countries. Additional unionization efforts, new collective bargaining agreements or work stoppages could materially increase our costs, reduce our revenues or limit our flexibility.
35
Certain legal obligations require us to contribute certain amounts to retirement funds or other benefit plans and restrict our ability to dismiss employees. Future regulations or court interpretations established in the countries in which we conduct our operations could increase our costs and materially adversely affect our business, financial position, operating results or cash flows.
Our debt levels and debt agreement restrictions may limit our liquidity and flexibility in obtaining additional financing and in pursuing other business opportunities.
As of
December 31, 2018
, we had
$5.0 billion
in total debt outstanding, representing approximately
38.2%
of our total capitalization. Our current indebtedness may have several important effects on our future operations, including:
|
•
|
a substantial portion of our cash flows from operations will be dedicated to the payment of principal and interest,
|
|
•
|
covenants contained in our debt arrangements require us to meet certain financial tests, which may affect our flexibility in planning for, and reacting to, changes in our business and may limit our ability to dispose of assets or place restrictions on the use of proceeds from such dispositions, withstand current or future economic or industry downturns and compete with others in our industry for strategic opportunities, and
|
|
•
|
our ability to obtain additional financing to fund working capital requirements, capital expenditures, acquisitions, dividend payments and general corporate or other cash requirements may be limited.
|
Our ability to maintain a sufficient level of liquidity to meet our financial obligations will be dependent upon our future performance, which will be subject to general economic conditions, industry cycles and financial, business and other factors affecting our operations, many of which are beyond our control. Our future cash flows may be insufficient to meet all of our working capital requirements, debt obligations and contractual commitments, and any insufficiency could negatively impact our business.
To the extent we are unable to repay our debt as it becomes due with cash on hand or from other sources, we will need to refinance our debt, sell assets or repay the debt with the proceeds from equity offerings. Additional indebtedness or equity financing may not be available to us in the future for the refinancing or repayment of existing debt, or if available, such additional debt or equity financing may not be available on a timely basis, or on terms acceptable to us and within the limitations specified in our then existing debt instruments. In addition, in the event we decide to sell additional assets, we can provide no assurance as to the timing of any asset sales or the proceeds that could be realized by us from any such asset sale.
Our revolving credit facility places restrictions on us and certain of our subsidiaries with respect to incurring additional indebtedness and liens, paying dividends and other payments to shareholders, repurchasing our ordinary shares, repurchasing or redeeming certain other indebtedness which matures after the revolving credit facility, entering into mergers and other matters. Our revolving credit facility also requires compliance with covenants to maintain specified financial and guarantee coverage ratios. These restrictions may limit our flexibility in obtaining additional financing and in pursuing various business opportunities.
In addition, our access to credit and capital markets depends on the credit ratings assigned to our credit facility and our notes by independent credit rating agencies. In recent years, we have experienced downgrades in our corporate credit rating and the credit rating of our senior notes. Our access to credit and capital markets may be more limited because we no longer have an investment grade credit rating. Any additional actual or anticipated downgrades in our corporate credit rating or the credit rating of our notes could further limit our ability to access credit and capital markets, or to restructure or refinance our indebtedness. Furthermore, future financings or refinancings may result in higher borrowing costs and require more restrictive terms and covenants, which may further restrict our operations. With our current credit ratings below investment grade, we have no access to the commercial paper market. Limitations on our ability to access credit and capital markets could have a material adverse impact on our financial position, operating results or cash flows.
36
We have historically made substantial capital expenditures to maintain our fleet to comply with laws and the applicable regulations and standards of governmental authorities and organizations, or to expand our fleet, and we may be required to make significant capital expenditures to maintain our competitiveness, which could adversely affect our financial condition, operating results or cash flows.
We have historically made substantial capital expenditures to maintain our fleet. These expenditures could increase as a result of changes in:
|
•
|
offshore drilling technology,
|
|
•
|
the cost of labor and materials,
|
|
•
|
customer requirements,
|
|
•
|
fleet size,
|
|
•
|
the cost of replacement parts for existing drilling rigs,
|
|
•
|
the geographic location of the drilling rigs,
|
|
•
|
length of drilling contracts,
|
|
•
|
governmental regulations and maritime self-regulatory organization and technical standards relating to safety, security or the environment, and
|
|
•
|
industry standards.
|
Changes in offshore drilling technology, customer requirements for new or upgraded equipment and competition within our industry may require us to make significant capital expenditures in order to maintain our competitiveness. In addition, changes in governmental regulations relating to safety or equipment standards, as well as compliance with standards imposed by maritime self-regulatory organizations, may require us to make additional unforeseen capital expenditures. As a result, we may be required to take our rigs out of service for extended periods of time, with corresponding losses of revenues, in order to make such alterations or to add such equipment. In the future, market conditions may not justify these expenditures or enable us to operate our older rigs profitably during the remainder of their economic useful lives.
Additionally, in order to expand our fleet, we may require additional capital in the future. If we are unable to fund capital with cash flows from operations or proceeds from sales of non-core assets, we may be required to either incur additional borrowings or raise capital through the sale of debt or equity securities. Our ability to access the capital markets may be limited by our financial condition at the time, by changes in laws and regulations (or interpretation thereof) and by adverse market conditions resulting from, among others, general economic conditions, contingencies and uncertainties that are beyond our control. Similarly, when lenders and institutional investors reduce, and in some cases cease to provide, funding to corporate and other industrial borrowers, the liquidity and financial condition of us and our customers can be adversely impacted. If we raise funds by issuing equity securities, existing shareholders may experience dilution. Our failure to obtain the funds for necessary future capital expenditures could have a material adverse effect on our business and on our financial position, operating results or cash flows.
37
Significant part or equipment shortages, supplier capacity constraints, supplier production disruptions, supplier quality and sourcing issues or price increases could increase our operating costs, decrease our revenues and adversely impact our operations.
Our reliance on third-party suppliers, manufacturers and service providers to secure equipment, parts, components and sub-systems used in our operations exposes us to potential volatility in the quality, prices and availability of such items. Certain high-specification parts and equipment that we use in our operations may be available only from a small number of suppliers, manufacturers or service providers, or in some cases must be sourced through a single supplier, manufacturer or service provider. Recent industry consolidation has reduced the number of available suppliers. A disruption in the deliveries from such third-party suppliers, manufacturers or service providers, capacity constraints, production disruptions, price increases, quality control issues, recalls or other decreased availability of parts and equipment could adversely affect our ability to meet our commitments to customers, thus adversely impacting our operations and revenues and/or our operating costs.
Our long-term contracts are subject to the risk of cost increases, which could adversely impact our profitability.
In general, our costs increase as the demand for contract drilling services and skilled labor increases. While many of our contracts include cost escalation provisions that allow changes to our day rate based on stipulated cost increases or decreases, the timing and amount earned from these day rate adjustments may differ from our actual increase in costs and certain contracts do not allow for such day rate adjustments. During times of reduced demand, reductions in costs may not be immediate as portions of the crew may be required to prepare our rigs for stacking, after which time the crew members are assigned to active rigs or dismissed. Moreover, as our rigs are mobilized from one geographic location to another, the labor and other operating and maintenance costs can vary significantly. In general, labor costs increase primarily due to higher salary levels and inflation. Equipment maintenance expenses fluctuate depending upon the type of activity a drilling rig is performing and the age and condition of the equipment. Contract preparation expenses vary based on the scope and length of contract preparation required.
Our information technology systems are subject to cybersecurity risks and threats.
We depend on technologies, systems and networks to conduct our offshore and onshore operations, to collect payments from customers and to pay vendors and employees. The risks associated with cyber incidents and attacks on our information technology systems could include disruptions of certain systems on our rigs; other impairments of our ability to conduct our operations; loss of intellectual property, proprietary information or customer and vendor data; disruption of our or our customers' operations; and increased costs to prevent, respond to or mitigate cybersecurity events. Despite our security measures, our information technology and infrastructure may be vulnerable to attacks by hackers or breached due to employee error, malfeasance or other disruptions. Any such breach could compromise our networks or our customers' and vendors' networks and the information stored there could be accessed, publicly disclosed, lost or stolen. Any such access, disclosure or other loss of information could result in legal claims or proceedings, including under data privacy laws and regulations such as the European Union General Data Protection Regulation, disrupt our operations and damage our reputation, which could adversely affect our financial position, operating results or cash flows. In the past, we have experienced data security breaches resulting from unauthorized access to our systems, which to date have not had a material impact on our operations; however, there is no assurance that such impacts will not be material in the future.
The accounting method for our 2024 Convertible Notes could have a material effect on our reported financial results.
Under U.S. GAAP, we must separately account for the liability and equity components of convertible debt instruments, such as our 3.00% exchangeable senior notes due 2024 (the “2024 Convertible Notes”) in a manner that reflects the issuer’s economic interest cost. The equity component representing the conversion feature is recorded in additional paid-in capital within the shareholders’ equity section of our consolidated balance sheet. The carrying value of the debt component is recorded with a corresponding discount that will result in a significant amount of non-cash interest expense from the accretion of the discounted carrying value up to the principal amount over the term of the 2024 Convertible Notes. The equity component is not remeasured if we continue to meet certain conditions for equity
38
classification under U.S. GAAP, including maintaining the ability to settle the 2024 Convertible Notes entirely in shares. During periods in which we are unable to meet the conditions for equity classification, the equity component or a portion thereof would be remeasured through earnings, which could adversely affect our operating results.
Upon conversion of the 2024 Convertible Notes, holders will receive cash, our Class A ordinary shares or a combination thereof, at our election. Our intent is to settle the principal amount of the 2024 Convertible Notes in cash upon conversion. If the conversion value exceeds the principal amount (i.e., our share price exceeds the exchange price on the date of conversion), we expect to deliver shares equal to our conversion obligation in excess of the principal amount. During each respective reporting period that our average share price exceeds the exchange price, an assumed number of shares required to settle the conversion obligation in excess of the principal amount will be included in the denominator for our computation of diluted earnings per share using the treasury stock method. If we are unable to demonstrate our intent to settle the principal amount in cash, or are otherwise unable to utilize the treasury stock method, our diluted earnings per share would be adversely affected. See Note 6 to our consolidated financial statements included in "Item 8. Financial Statements and Supplementary Data" for additional information on our 2024 Convertible Notes.
The IRS may not agree with the conclusion that we should be treated as a foreign corporation for U.S. federal tax purposes following the Atwood Merger.
Although Ensco plc is incorporated in the United Kingdom, the U.S. Internal Revenue Service (“IRS”) may assert that we should be treated as a U.S. corporation (and, therefore, a U.S. tax resident) for U.S. federal income tax purposes following the Atwood Merger pursuant to Section 7874 of the Internal Revenue Code. For U.S. federal income tax purposes, a corporation is generally considered a U.S. “domestic” corporation (or U.S. tax resident) if it is organized in the United States, and a corporation is generally considered a “foreign” corporation (or non-U.S. tax resident) if it is not a U.S. domestic corporation. Because Ensco plc is an entity incorporated in England and Wales, it would generally be classified as a foreign corporation (or non-U.S. tax resident) under these rules. Section 7874 of the Internal Revenue Code provides an exception under which a foreign incorporated entity may, in certain circumstances, be treated as a U.S. domestic corporation for U.S. federal income tax purposes.
We would be treated as a U.S. domestic corporation (that is, as a U.S. tax resident) for U.S. federal income tax purposes following the Atwood Merger pursuant to Section 7874 of the Internal Revenue Code if the percentage (by vote or value) of our shares considered to be held by former holders of shares of Atwood common stock after the acquisition by reason of holding shares of Atwood common stock for purposes of Section 7874 of the Internal Revenue Code (the “Section 7874 Percentage”) was 80% or more.
The Section 7874 Percentage at the time of the acquisition was less than 60%. The calculation of the Section 7874 Percentage, however, is complex, is subject to detailed regulations and is subject to factual uncertainties. As a result, the IRS could assert that the Section 7874 Percentage was greater than 80% and that we therefore are treated for U.S. federal income tax purposes as a U.S. domestic corporation (that is, as a U.S. tax resident) following the acquisition. If the IRS successfully challenged our status as a foreign corporation, significant adverse tax consequences would result for us and for certain of our shareholders.
U.S. tax laws and IRS guidance could affect our ability to engage in certain acquisition strategies and certain internal restructurings.
Even if we are treated as a foreign corporation for U.S. federal income tax purposes, Section 7874 of the Internal Revenue Code and U.S. Treasury Regulations promulgated thereunder, including temporary Treasury Regulations, may adversely affect our ability to engage in certain future acquisitions of U.S. businesses in exchange for our equity, which may affect the tax efficiencies that otherwise might be achieved in such potential future transactions.
39
Governments may pass laws that subject us to additional taxation or may challenge our tax positions, which could adversely affect our financial position, operating results or cash flows.
There is increasing uncertainty with respect to tax laws, regulations and treaties, and the interpretation and enforcement thereof that may affect our business. The Organization for Economic Cooperation and Development (“OECD”) has issued its final reports on base erosion and profit shifting, which generally focus on situations where profits are earned in low-tax jurisdictions, or payments are made between affiliates from jurisdictions with high tax rates to jurisdictions with lower tax rates. Certain countries within which we operate have recently enacted changes to their tax laws in response to the OECD recommendations or otherwise and these and other countries may enact changes to their tax laws or practices in the future (prospectively or retroactively), which may have a material adverse effect on our financial position, operating results or cash flows. U.S. federal income tax reform legislation enacted in late 2017, formally known as the Tax Cuts and Jobs Act of 2017, introduced significant changes to U.S. income tax law, including a reduction in the statutory income tax rate from
35%
to
21%
effective January 1, 2018, a one-time transition tax on deemed repatriation of deferred foreign income, a base erosion anti-abuse tax that effectively imposes a minimum tax on certain payments to non-U.S. affiliates, new and revised rules relating to the current taxation of certain income of foreign subsidiaries and revised rules associated with limitations on the deduction of interest.
In addition, our tax positions are subject to audit by U.K., U.S. and other foreign tax authorities. Such tax authorities may disagree with our interpretations or assessments of the effects of tax laws, treaties or regulations or their applicability to our corporate structure or certain transactions we have undertaken. Even if we are successful in maintaining our tax positions, we may incur significant expenses in defending our positions and contesting claims asserted by tax authorities. If we are unsuccessful in defending our tax positions, the resulting assessments or rulings could significantly impact our consolidated income taxes in past or future periods.
As a result of these uncertainties, as well as changes in the administrative practices and precedents of tax authorities or other matters (such as changes in applicable accounting rules) that increase the amounts we have provided for income taxes or deferred tax assets and liabilities in our consolidated financial statements, we cannot provide any assurances as to what our consolidated effective income tax rate will be in future periods. If we are unable to mitigate the negative consequences of any change in law, audit or other matters, this could cause our consolidated income taxes to increase and cause a material adverse effect on our financial position, operating results or cash flows.
Our consolidated effective income tax rate may vary substantially from one reporting period to another.
We cannot provide any assurances as to what our future consolidated effective income tax rate will be because of, among other matters, uncertainty regarding the nature and extent of our business activities in any particular jurisdiction in the future and the tax laws of such jurisdictions, as well as potential changes in U.K., U.S. and other foreign tax laws, regulations or treaties or the interpretation or enforcement thereof, changes in the administrative practices and precedents of tax authorities or other matters (such as changes in applicable accounting rules) that increase the amounts we have provided for income taxes or deferred tax assets and liabilities in our consolidated financial statements. In addition, as a result of frequent changes in the taxing jurisdictions in which our drilling rigs are operated and/or owned, changes in the overall level of our income and changes in tax laws, our consolidated effective income tax rate may vary substantially from one reporting period to another. In periods of declining profitability, our income tax expense may not decline proportionately with income. Further, we may continue to incur income tax expense in periods in which we operate at a loss. Income tax rates imposed in the tax jurisdictions in which our subsidiaries conduct operations vary, as does the tax base to which the rates are applied. In some cases, tax rates may be applicable to gross revenues, statutory or negotiated deemed profits or other bases utilized under local tax laws, rather than to net income. In some instances, the movement of drilling rigs among taxing jurisdictions will involve the transfer of ownership of the drilling rigs among our subsidiaries. If we are unable to mitigate the negative consequences of any change in law, audit, business activity or other matters, this could cause our consolidated effective income tax rate to increase and cause a material adverse effect on our financial position, operating results or cash flows.
40
Transfers of our Class A ordinary shares may be subject to stamp duty or stamp duty reserve tax (“SDRT”) in the U.K., which would increase the cost of dealing in our Class A ordinary shares.
Stamp duty and/or SDRT are imposed in the U.K. on certain transfers of chargeable securities (which include shares in companies incorporated in the U.K.) at a rate of 0.5% of the consideration paid for the transfer. Certain transfers of shares to depositary receipt facilities or clearance systems providers are charged at a higher rate of 1.5%.
Pursuant to arrangements that we entered into with the Depository Trust Company (“DTC”), our Class A ordinary shares are eligible to be held in book entry form through the facilities of DTC. Transfers of shares held in book entry form through DTC will not attract a charge to stamp duty or SDRT in the U.K. A transfer of the shares from within the DTC system out of DTC and any subsequent transfers that occur entirely outside the DTC system will attract a charge to stamp duty at a rate of 0.5% of any consideration, which is payable by the transferee of the shares. Any such duty must be paid (and the relevant transfer document stamped by Her Majesty's Revenue & Customs (“HMRC”)) before the transfer can be registered in the share register of Ensco plc. If a shareholder decides to redeposit shares into DTC, the redeposit will attract SDRT at a rate of 1.5% of the value of the shares.
We have put in place arrangements with our transfer agent to require that shares held in certificated form cannot be transferred into the DTC system until the transferor of the shares has first delivered the shares to a depository specified by us so that SDRT may be collected in connection with the initial delivery to the depository. Any such shares will be evidenced by a receipt issued by the depository. Before the transfer can be registered in our share register, the transferor will also be required to provide the transfer agent sufficient funds to settle the resultant liability for SDRT, which will be charged at a rate of 1.5% of the value of the shares.
Following decisions of the European Court of Justice and the U.K. First-tier Tax Tribunal, HMRC has announced that it will not seek to apply a charge to stamp duty or SDRT on the issuance of shares (or, where it is integral to the raising of new capital, the transfer of new shares) into a depositary receipt facility or clearance system provider, such as DTC. However, it is possible that the U.K. government may change or enact laws applicable to stamp duty or SDRT in response to this decision, which could have a material effect on the cost of trading in our shares.
If our Class A ordinary shares are not eligible for continued deposit and clearing within the facilities of DTC, then transactions in our securities may be disrupted.
The facilities of DTC are widely-used for rapid electronic transfers of securities between participants within the DTC system, which include numerous major international financial institutions and brokerage firms. Currently, all trades of our Class A ordinary shares on the NYSE are cleared and settled on the facilities of DTC. Our Class A ordinary shares are, at present, eligible for deposit and clearing within the DTC system, pursuant to arrangements with DTC whereby DTC accepted our Class A ordinary shares for deposit, clearing and settlement services, and we agreed to indemnify DTC for any stamp duty and/or SDRT that may be assessed upon it as a result of its service as a clearance system provider for our Class A ordinary shares. However, DTC retains sole discretion to cease to act as a clearance system provider for our Class A ordinary shares at any time.
If DTC determines at any time that our shares are no longer eligible for deposit, clearing and settlement services within its facilities, our shares may become ineligible for continued listing on a U.S. securities exchange, and trading in such shares would be disrupted. In this event, DTC has agreed it will provide us advance notice and assist us, to the extent possible, with efforts to mitigate adverse consequences. While we would pursue alternative arrangements to preserve our listing and maintain trading, any such disruption could have a material adverse effect on the trading price of our Class A ordinary shares.
Investor enforcement of civil judgments against us may be more difficult.
Because we are a public limited company incorporated under the Laws of England and Wales, investors could experience difficulty enforcing judgments obtained against us in U.S. courts. In addition, it may be more difficult (or
41
impossible) to bring some types of claims against us in courts in England than it would be to bring similar claims against a U.S. company in a U.S. court.
We have less flexibility as a U.K. public limited company with respect to certain aspects of capital management than U.S. corporations due to increased shareholder approval requirements.
Directors of Delaware and other U.S. corporations may issue, without further shareholder approval, shares of common stock authorized in their certificates of incorporation that were not already issued or reserved. The business corporation laws of Delaware and other U.S. states also provide substantial flexibility in establishing the terms of preferred stock. However, English law provides that a board of directors may only allot shares with the prior authorization of an ordinary resolution of the shareholders, which authorization must state the maximum amount of shares that may be allotted under it and specify the date on which it will expire, which must not be more than five years from the date on which the shareholder resolution is passed. An ordinary resolution was passed by shareholders at our last annual general meeting in 2018 to authorize the allotment of up to a prescribed amount of additional shares until the conclusion of the next annual general meeting or the close of business on August 21, 2019 (whichever is earlier). This authority was further increased by shareholders at an additional general meeting on February 21, 2019, expiring at the next annual shareholder meeting or at the close of business on April 22, 2020 (whichever is earlier). An ordinary resolution will be put to shareholders at our next annual shareholder meeting seeking their approval to renew the board's authority to allot up to a prescribed amount of shares for an additional term.
English law also generally provides shareholders pre-emption rights over new shares that are issued for cash. However, it is possible, where the board of directors is generally authorized to allot shares, to exclude pre-emption rights by a special resolution of the shareholders or by a provision in the articles of association. Such exclusion of pre-emption rights will commonly cease to have effect at the same time as the general allotment authority to which it relates is revoked or expires. If the general allotment authority is renewed, the authority excluding pre-emption rights may also be renewed by a special resolution of the shareholders. A special resolution was passed, in conjunction with an allotment authority at our last annual general meeting in 2018, to disapply pre-emption rights in respect of new shares up to a prescribed amount until the conclusion of the next annual general meeting or the close of business on August 21, 2019 (whichever is earlier). This authority was further increased by shareholders at an additional general meeting on February 21, 2019, expiring at the next annual shareholder meeting or at the close of business on April 22, 2020 (whichever is earlier). Special resolutions will be put to shareholders at our next annual shareholder meeting seeking their approval to renew the board's authority to disapply pre-emption rights in respect of new shares up to a prescribed amount for an additional term.
English law prohibits us from conducting "on-market purchases" as our shares will not be traded on a recognized investment exchange in the U.K. English law also generally prohibits a company from repurchasing its own shares by way of "off-market purchases" without the approval by a special resolution of the shareholders of the terms of the contract by which the purchase(s) is affected. Such approval may only last for a maximum period of five years after the date on which the resolution is passed. A special resolution was passed at our annual shareholder meeting in May 2018 to permit us to make "off-market" purchases of our own shares pursuant to certain purchase agreements for a five-year term.
We can provide no assurances that situations will not arise where such shareholder approval requirements for any of these actions would deprive our shareholders of substantial benefits.
Our articles of association contain anti-takeover provisions.
Certain provisions of our articles of association have anti-takeover effects, such as the ability to issue shares under the Rights Plan (as defined therein). These provisions are intended to ensure that any takeover or change of control of the Company is conducted in an orderly manner, all shareholders of the Company are treated equally and fairly and receive an optimum price for their shares and the long-term success of the Company is safeguarded. Under English law, it may not be possible to implement these provisions in all circumstances.
42
The Company is not subject to the U.K.'s Code on Takeovers and Mergers (the “Code”).
The Code only applies to an offer for a public company that is registered in the U.K. (or the Channel Islands or the Isle of Man) and the securities of which are not admitted to trading on a regulated market in the U.K. (or the Channel Islands or the Isle of Man) if the company is considered by the takeover panel (the "Takeover Panel") to have its place of central management and control in the U.K. (or the Channel Islands or the Isle of Man). This is known as the "residency test." The test for central management and control under the Code is different from that used by the U.K. tax authorities. Under the Code, the Takeover Panel will look to where the majority of the directors of the company are residents for the purposes of determining where the company has its place of central management and control. Accordingly, the Takeover Panel has previously indicated that the Code does not apply to the Company and the Company's shareholders therefore do not have the benefit of the protections the Code affords, including, but not limited to, the requirement that a person who acquires an interest in shares carrying 30% or more of the voting rights in the Company must make a cash offer to all other shareholders at the highest price paid in the 12 months before the offer was announced.
English law requires that we meet certain additional financial requirements before declaring dividends and returning funds to shareholders.
Under English law, we are only able to declare dividends and return funds to our shareholders out of the accumulated distributable reserves on our statutory balance sheet. Distributable reserves are a company’s accumulated, realized profits, so far as not previously utilized by distribution or capitalization, less its accumulated, realized losses, so far as not previously written off in a reduction or reorganization of capital duly made. Realized profits are created through the remittance of profits of certain subsidiaries to our parent company in the form of dividends.
English law also provides that a public company can only make a distribution if, among other things (a) the amount of its net assets (that is, the total excess of assets over liabilities) is not less than the total of its called up share capital and non-distributable reserves and (b) if, and to the extent that, the distribution does not reduce the amount of its net assets to less than that total.
We may be unable to remit the profits of our subsidiaries in a timely or tax efficient manner. If at any time we do not have sufficient distributable reserves to declare and pay quarterly dividends, we may undertake a reduction in the capital of the Company, in addition to the reduction in capital taken in 2014, to reduce the amount of our share capital and non-distributable reserves and to create a corresponding increase in our distributable reserves out of which future distributions to shareholders can be made. To comply with English law, a reduction of capital would be subject to (a) approval of shareholders at a general meeting by special resolution; (b) confirmation by an order of the English Courts and (c) the Court order being delivered to and registered by the Registrar of Companies in England. If we were to pursue a reduction of capital of the Company as a course of action, and failed to obtain the necessary approvals from shareholders and the English Courts, we may undertake other efforts to allow the Company to declare dividends and return funds to shareholders.
Item 1B.
Unresolved Staff Comments
None.
43
Item 2.
Properties
Contract Drilling Fleet
The following table provides certain information about the rigs in our drilling fleet by reportable segment as of
February 20, 2019
:
|
Rig Name
|
Rig Type
|
Year Built/
Rebuilt
|
Design
|
Maximum
Water Depth/
Drilling Depth
|
Location
|
Status
|
||||
|
Floaters
|
|
|
|
|||||||
|
ENSCO DS-3
|
Drillship
|
2010
|
Dynamically Positioned
|
10,000'/40,000'
|
Spain
|
Preservation stacked
(1)
|
||||
|
ENSCO DS-4
|
Drillship
|
2010
|
Dynamically Positioned
|
10,000'/40,000'
|
Nigeria
|
Under contract
|
||||
|
ENSCO DS-5
|
Drillship
|
2011
|
Dynamically Positioned
|
10,000'/40,000'
|
Spain
|
Preservation stacked
(1)
|
||||
|
ENSCO DS-6
|
Drillship
|
2012
|
Dynamically Positioned
|
10,000'/40,000'
|
Spain
|
Available
|
||||
|
ENSCO DS-7
|
Drillship
|
2013
|
Dynamically Positioned
|
10,000'/40,000'
|
Cyprus
|
Available
|
||||
|
ENSCO DS-8
|
Drillship
|
2015
|
Dynamically Positioned
|
10,000'/40,000'
|
Angola
|
Under contract
|
||||
|
ENSCO DS-9
|
Drillship
|
2015
|
Dynamically Positioned
|
10,000'/40,000'
|
French Guiana
|
Under contract
|
||||
|
ENSCO DS-10
|
Drillship
|
2018
|
Dynamically Positioned
|
10,000'/40,000'
|
Nigeria
|
Under contract
|
||||
|
ENSCO DS-11
|
Drillship
|
2013
|
Dynamically Positioned
|
12,000'/40,000'
|
Spain
|
Available
|
||||
|
ENSCO DS-12
|
Drillship
|
2013
|
Dynamically Positioned
|
12,000'/40,000'
|
Spain
|
Under contract
|
||||
|
ENSCO DS-13
|
Drillship
|
2019
|
Dynamically Positioned
|
12,000'/40,000'
|
South Korea
|
Under construction
(2)
|
||||
|
ENSCO DS-14
|
Drillship
|
2020
|
Dynamically Positioned
|
12,000'/40,000'
|
South Korea
|
Under construction
(2)
|
||||
|
ENSCO 5004
|
Semisubmersible
|
1982/2001/2014
|
F&G Enhanced Pacesetter
|
1,500'/25,000'
|
Mediterranean
|
Under contract
|
||||
|
ENSCO 5006
|
Semisubmersible
|
1999/2014
|
Bingo 8000
|
7,000'/25,000'
|
Australia
|
Under contract
|
||||
|
ENSCO 6002
|
Semisubmersible
|
2001/2009/2015
|
Megathyst
|
5,600'/25,000'
|
Brazil
|
Under contract
|
||||
|
ENSCO 8500
|
Semisubmersible
|
2008
|
Dynamically Positioned
|
8,500'/35,000'
|
Gulf of Mexico
|
Preservation stacked
(1)
|
||||
|
ENSCO 8501
|
Semisubmersible
|
2009
|
Dynamically Positioned
|
8,500'/35,000'
|
Gulf of Mexico
|
Preservation stacked
(1)
|
||||
|
ENSCO 8502
|
Semisubmersible
|
2010/2012
|
Dynamically Positioned
|
8,500'/35,000'
|
Gulf of Mexico
|
Preservation stacked
(1)
|
||||
|
ENSCO 8503
|
Semisubmersible
|
2010
|
Dynamically Positioned
|
8,500'/35,000'
|
Mexico
|
Under contract
|
||||
|
ENSCO 8504
|
Semisubmersible
|
2011
|
Dynamically Positioned
|
8,500'/35,000'
|
Japan
|
Under contract
|
||||
|
ENSCO 8505
|
Semisubmersible
|
2012
|
Dynamically Positioned
|
8,500'/35,000'
|
Gulf of Mexico
|
Under contract
|
||||
|
ENSCO 8506
|
Semisubmersible
|
2012
|
Dynamically Positioned
|
8,500'/35,000'
|
Gulf of Mexico
|
Preservation stacked
(1)
|
||||
|
ENSCO DPS-1
|
Semisubmersible
|
2012
|
Dynamically Positioned
|
10,000'/35,000'
|
Australia
|
Under contract
|
||||
|
ENSCO MS-1
|
Semisubmersible
|
2011
|
F&G ExD Millennium
|
8200'/32,000'
|
Malaysia
|
Available
|
||||
|
Jackups
|
|
|
|
|
|
|
||||
|
ENSCO 54
|
Jackup
|
1982/1997/2014
|
F&G L-780 MOD II-C
|
300'/25,000'
|
Saudi Arabia
|
Under contract
|
||||
|
ENSCO 67
|
Jackup
|
1976/2005
|
MLT 84-CE
|
400'/30,000'
|
Indonesia
|
Under contract
|
||||
|
ENSCO 68
|
Jackup
|
1976/2004
|
MLT 84-CE
|
400'/30,000'
|
Gulf of Mexico
|
Under contract
|
||||
|
ENSCO 70
|
Jackup
|
1981/1996/2014
|
Hitachi K1032N
|
250'/30,000
|
United Kingdom
|
Preservation stacked
(1)
|
||||
|
ENSCO 71
|
Jackup
|
1982/1995/2012
|
Hitachi K1032N
|
225'/25,000'
|
United Kingdom
|
Preservation stacked
(1)
|
||||
|
ENSCO 72
|
Jackup
|
1981/1996
|
Hitachi K1025N
|
225'/25,000'
|
United Kingdom
|
Under contract
|
||||
|
ENSCO 75
|
Jackup
|
1999
|
MLT Super 116-C
|
400'/30,000'
|
Gulf of Mexico
|
Under contract
|
||||
|
ENSCO 76
|
Jackup
|
2000
|
MLT Super 116-C
|
350'/30,000'
|
Saudi Arabia
|
Under contract
|
||||
|
ENSCO 84
|
Jackup
|
1981/2005/2012
|
MLT 82-SD-C
|
250'/25,000'
|
Saudi Arabia
|
Under contract
|
||||
|
ENSCO 87
|
Jackup
|
1982/2006
|
MLT 116-C
|
350'/25,000'
|
Gulf of Mexico
|
Under contract
|
||||
|
ENSCO 88
|
Jackup
|
1982/2004/2014
|
MLT 82-SD-C
|
250'/25,000'
|
Saudi Arabia
|
Under contract
|
||||
|
ENSCO 92
|
Jackup
|
1982/1996
|
MLT 116-C
|
225'/25,000'
|
United Kingdom
|
Under contract
|
||||
|
ENSCO 96
|
Jackup
|
1982/1997/2012
|
Hitachi 250-C
|
250'/25,000'
|
Saudi Arabia
|
Under contract
|
||||
|
ENSCO 97
|
Jackup
|
1980/1997/2012
|
MLT 82 SD-C
|
250'/25,000'
|
Saudi Arabia
|
Under contract
|
||||
|
ENSCO 100
|
Jackup
|
1987/2009
|
MLT 150-88-C
|
350'/30,000
|
United Kingdom
|
Available
|
||||
44
|
Rig Name |
Rig Type
|
Year Built/ Rebuilt |
Design
|
Maximum
Water Depth/ Drilling Depth |
Location |
Status
|
||||
|
Jackups
|
|
|
|
|
|
|
||||
|
ENSCO 101
|
Jackup
|
2000
|
KFELS MOD V-A
|
400'/30,000'
|
United Kingdom
|
Under contract
|
||||
|
ENSCO 102
|
Jackup
|
2002
|
KFELS MOD V-A
|
400'/30,000'
|
Gulf of Mexico
|
Under contract
|
||||
|
ENSCO 104
|
Jackup
|
2002
|
KFELS MOD V-B
|
400'/30,000'
|
UAE
|
Under contract
|
||||
|
ENSCO 105
|
Jackup
|
2002
|
KFELS MOD V-B
|
400'/30,000'
|
Singapore
|
Preservation stacked
(1)
|
||||
|
ENSCO 106
|
Jackup
|
2005
|
KFELS MOD V-B
|
400'/30,000'
|
Indonesia
|
Under contract
|
||||
|
ENSCO 107
|
Jackup
|
2006
|
KFELS MOD V-B
|
400'/30,000'
|
Australia
|
Under contract
|
||||
|
ENSCO 108
|
Jackup
|
2007
|
KFELS MOD V-B
|
400'/30,000'
|
Saudi Arabia
|
Under contract
|
||||
|
ENSCO 109
|
Jackup
|
2008
|
KFELS MOD V-Super B
|
350'/35,000'
|
Angola
|
Under contract
|
||||
|
ENSCO 110
|
Jackup
|
2015
|
KFELS MOD V-B
|
400'/30,000'
|
Qatar
|
Under contract
|
||||
|
ENSCO 111
|
Jackup
|
2003
|
KFELS MOD V-B
|
400'/36,000'
|
Malta
|
Cold stacked
|
||||
|
ENSCO 112
|
Jackup
|
2008
|
MLT Super 116-E
|
350'/30,000'
|
Malta
|
Cold stacked
|
||||
|
ENSCO 113
|
Jackup
|
2012
|
Pacific Class 400
|
400'/30,000'
|
Philippines
|
Cold stacked
|
||||
|
ENSCO 114
|
Jackup
|
2012
|
Pacific Class 400
|
400'/30,000'
|
Philippines
|
Cold stacked
|
||||
|
ENSCO 115
|
Jackup
|
2013
|
Pacific Class 400
|
400'/30,000'
|
Malaysia
|
Under contract
|
||||
|
ENSCO 120
|
Jackup
|
2013
|
KFELS Super A
|
400'/40,000'
|
United Kingdom
|
Under contract
|
||||
|
ENSCO 121
|
Jackup
|
2013
|
KFELS Super A
|
400'/40,000'
|
United Kingdom
|
Under contract
|
||||
|
ENSCO 122
|
Jackup
|
2014
|
KFELS Super A
|
400'/40,000'
|
United Kingdom
|
Under contract
|
||||
|
ENSCO 123
|
Jackup
|
2019
|
KFELS Super A
|
400'/40,000'
|
Singapore
|
Under construction
(3)
|
||||
|
ENSCO 140
|
Jackup
|
2016
|
Cameron Letourneau Super 116E
|
400'/30,000'
|
Saudi Arabia
|
Under contract
|
||||
|
ENSCO 141
|
Jackup
|
2016
|
Cameron Letourneau Super 116E
|
400'/30,000'
|
Saudi Arabia
|
Under contract
|
||||
|
(1)
|
Prior to stacking, upfront steps are taken to preserve the rig. This may include a quayside power source to dehumidify key equipment and/or provide electric current to the hull to prevent corrosion. Also, certain equipment may be removed from the rig for storage in a temperature-controlled environment. While stacked, large equipment that remains on the rig is periodically inspected and maintained by Ensco personnel. These steps are designed to reduce time and lower cost to reactivate the rig when market conditions improve.
|
|
(2)
|
Rig is currently under construction and is not contracted. The "year built" provided is based on the current construction schedule.
|
|
(3)
|
Rig is currently under construction but is contracted to commence operations in July 2019 in the North Sea. The "year built" provided is based on the current construction schedule.
|
The equipment on our drilling rigs includes engines, drawworks, derricks, pumps to circulate drilling fluid, well control systems, drill string and related equipment. The engines power a top-drive mechanism that turns the drill string and drill bit so that the hole is drilled by grinding subsurface materials, which are then returned to the rig by the drilling fluid. The intended water depth, well depth and geological conditions are the principal factors that determine the size and type of rig most suitable for a particular drilling project.
Floater rigs consist of drillships and semisubmersibles. Drillships are purpose-built maritime vessels outfitted with drilling apparatus. Drillships are self-propelled and can be positioned over a drill site through the use of a computer-controlled propeller or "thruster" dynamic positioning systems. Our drillships are capable of drilling in water depths of up to 12,000 feet and are suitable for deepwater drilling in remote locations because of their superior mobility and large load-carrying capacity. Although drillships are most often used for deepwater drilling and exploratory well drilling, drillships can also be used as a platform to carry out well maintenance or completion work such as casing and tubing installation or subsea tree installations.
Semisubmersibles are MODUs with pontoons and columns that are partially submerged at the drilling location to provide added stability during drilling operations. Semisubmersibles are held in a fixed location over the ocean floor either by being anchored to the sea bottom with mooring chains or dynamically positioned by computer-controlled
45
propellers or "thrusters" similar to that used by our drillships. Moored semisubmersibles are most commonly used for drilling in water depths of 4,499 feet or less. However, ENSCO 5006 and ENSCO MS-1, which are moored semisubmersibles, are capable of deepwater drilling in water depths greater than 5,000 feet. Dynamically positioned semisubmersibles generally are outfitted for drilling in deeper water depths and are well-suited for deepwater development and exploratory well drilling. Further, we have three hybrid semisubmersibles, ENSCO 8503, ENSCO 8504 and ENSCO 8505, which leverage both moored and dynamically positioned configurations. This hybrid design provides multi-faceted drilling solutions to customers with both shallow water and deepwater requirements.
Jackup rigs stand on the ocean floor with their hull and drilling equipment elevated above the water on connected leg supports. Jackups are generally preferred over other rig types in shallow water depths of 400 feet or less, primarily because jackups provide a more stable drilling platform with above water well-control equipment. Our jackups are of the independent leg design where each leg can be fixed into the ocean floor at varying depths and equipped with a cantilever that allows the drilling equipment to extend outward from the hull over fixed platforms enabling safer drilling of both exploratory and development wells. The jackup hull supports the drilling equipment, jacking system, crew quarters, storage and loading facilities, helicopter landing pad and related equipment and supplies.
Over the life of a typical rig, many of the major systems are replaced due to normal wear and tear or technological advancements in drilling equipment. We believe all our rigs are in good condition. As of
February 28, 2019
, we owned all rigs in our fleet. We also manage the drilling operations for
two
rigs owned by third-parties.
We lease our executive offices in London, England in addition to office space in Houston, Aberdeen, Abu Dhabi, Australia, Dubai, Indonesia, Malaysia, Malta, Mexico, Nigeria, The Netherlands, Saudi Arabia, Singapore, Thailand, Vietnam and Qatar. We own offices and other facilities in Louisiana, Angola, Australia and Brazil.
Item 3.
Legal Proceedings
DSA Dispute
On January 4, 2016, Petrobras sent a notice to us declaring the drilling services agreement with Petrobras (the "DSA") for ENSCO DS-5, a drillship ordered from Samsung Heavy Industries, a shipyard in South Korea ("SHI"), void effective immediately, reserving its rights and stating its intention to seek any restitution to which it may be entitled. The previously disclosed arbitral hearing on liability related to the matter was held in March 2018. Prior to the arbitration tribunal issuing its decision, we and Petrobras agreed in August 2018 to a settlement of all claims relating to the DSA. No payments were made by either party in connection with the settlement agreement. The parties agreed to normalize business relations and the settlement agreement provides for our participation in current and future Petrobras tenders on the same basis as all other companies invited to these tenders. No losses were recognized during 2018 with respect to this settlement as all disputed receivables with Petrobras related to the DSA were fully reserved in 2015. See Item 1 “Legal Proceedings” in our quarterly report on Form 10-Q for the quarter ended June 30, 2018 for further information about the DSA dispute.
In November 2016, we initiated separate arbitration proceedings in the U.K. against SHI for the losses incurred in connection with the foregoing Petrobras arbitration and certain other losses relating to the DSA. SHI subsequently filed a statement of defense disputing our claim. In January 2018, the arbitration tribunal for the SHI matter issued an award on liability fully in our favor. In August 2018, the tribunal awarded us approximately
$2.8 million
in costs and legal fees incurred to date, plus interest, which was collected during the fourth quarter.
The January 2018 arbitration award provides that SHI is liable to us for
$10 million
or damages that we can prove. We have submitted to the tribunal our claim for damages. The arbitral hearing on damages owed to us by SHI is scheduled to take place in the first quarter of 2019. We are unable to estimate the ultimate outcome of recovery for damages at this time.
46
Pride FCPA Investigation
During 2010, Pride and its subsidiaries resolved their previously disclosed investigations into potential violations of the U.S. Foreign Corrupt Practices Act of 1977 (the "FCPA") with the DOJ and SEC. The settlement with the DOJ included a deferred prosecution agreement (the "DPA") between Pride and the DOJ and a guilty plea by Pride Forasol S.A.S., one of Pride’s subsidiaries, to FCPA-related charges. During 2012, the DOJ moved to (i) dismiss the charges against Pride and end the DPA one year prior to its scheduled expiration; and (ii) terminate the unsupervised probation of Pride Forasol S.A.S. The Court granted the motions.
Pride has received preliminary inquiries from governmental authorities of certain countries referenced in its settlements with the DOJ and SEC. We could face additional fines, sanctions and other penalties from authorities in these and other relevant jurisdictions, including prohibition of our participating in or curtailment of business operations in certain jurisdictions and the seizure of rigs or other assets. At this stage of such inquiries, we are unable to determine what, if any, legal liability may result. Our customers in certain jurisdictions could seek to impose penalties or take other actions adverse to our business. We could also face other third-party claims by directors, officers, employees, affiliates, advisors, attorneys, agents, stockholders, debt holders or other stakeholders. In addition, disclosure of the subject matter of the investigations and settlements could adversely affect our reputation and our ability to obtain new business or retain existing business, to attract and retain employees and to access the capital markets.
We cannot currently predict what, if any, actions may be taken by any other applicable government or other authorities or our customers or other third parties or the effect any such actions may have on our financial position, operating results and cash flows.
Environmental Matters
We are currently subject to pending notices of assessment relating to spills of drilling fluids, oil, brine, chemicals, grease or fuel from drilling rigs operating offshore Brazil from 2008 to 2017, pursuant to which the governmental authorities have assessed, or are anticipated to assess, fines. We have contested these notices and appealed certain adverse decisions and are awaiting decisions in these cases. Although we do not expect final disposition of these assessments to have a material adverse effect on our financial position, operating results and cash flows, there can be no assurance as to the ultimate outcome of these assessments. A
$180,000
liability related to these matters was included in accrued liabilities and other on our consolidated balance sheet as of
December 31, 2018
.
We currently are subject to a pending administrative proceeding initiated during 2009 by a Spanish government authority seeking payment in an aggregate amount of approximately $3.0 million for an alleged environmental spill originating from ENSCO 5006 while it was operating offshore Spain. Our customer has posted guarantees with the Spanish government to cover potential penalties. Additionally, we expect to be indemnified for any payments resulting from this incident by our customer under the terms of the drilling contract. A criminal investigation of the incident was initiated during 2010 by a prosecutor in Tarragona, Spain, and the administrative proceeding has been suspended pending the outcome of this investigation. We do not know at this time what, if any, involvement we may have in this investigation.
We intend to vigorously defend ourselves in the administrative proceeding and any criminal investigation. At this time, we are unable to predict the outcome of these matters or estimate the extent to which we may be exposed to any resulting liability. Although we do not expect final disposition of this matter to have a material adverse effect on our financial position, operating results and cash flows, there can be no assurance as to the ultimate outcome of the proceedings.
47
Other Matters
In addition to the foregoing, we are named defendants or parties in certain other lawsuits, claims or proceedings incidental to our business and are involved from time to time as parties to governmental investigations or proceedings, including matters related to taxation, arising in the ordinary course of business. Although the outcome of such lawsuits or other proceedings cannot be predicted with certainty and the amount of any liability that could arise with respect to such lawsuits or other proceedings cannot be predicted accurately, we do not expect these matters to have a material adverse effect on our financial position, operating results and cash flows.
Item 4.
Mine Safety Disclosures
Not applicable.
48
PART II
|
Item 5.
|
Market for Registrant's Common Equity, Related Shareholder Matters and Issuer Purchases of Equity Securities
|
Market Information
Our Class A ordinary shares are traded on the NYSE under the ticker symbol "ESV." Many of our shareholders hold shares electronically, all of which are owned by a nominee of DTC. We had
77
shareholders of record on February 1,
2019
.
Dividends
Our Board of Directors declared a
$0.01
quarterly cash dividend for the first quarter of
2019
. In October 2017, we amended our revolving credit facility, which prohibits us from paying dividends in excess of
$0.01
per share per fiscal quarter. Dividends in excess of this amount would require the amendment or waiver of such provision.
The declaration and amount of future dividends is at the discretion of our Board of Directors and could change in future periods. In the future, our Board of Directors may, without advance notice, determine to reduce or suspend our dividend in order to improve our financial flexibility and best position us for long-term success. When evaluating dividend payment timing and amounts, our Board of Directors considers several factors, including our profitability, liquidity, financial condition, market outlook, reinvestment opportunities and capital requirements.
Exchange Controls
There are no U.K. government laws, decrees or regulations that restrict or affect the export or import of capital, including but not limited to, foreign exchange controls on remittance of dividends on our ordinary shares or on the conduct of our operations.
U.K. Taxation
The following paragraphs are intended to be a general guide to current U.K. tax law and what is understood to be HMRC practice applying as of the date of this report (both of which are subject to change at any time, possibly with retrospective effect) in respect of the taxation of capital gains, the taxation of dividends paid by us and stamp duty and SDRT on the transfer of our shares. In addition, the following paragraphs relate only to persons who for U.K. tax purposes are beneficial owners of the shares.
These paragraphs may not relate to certain classes of holders or beneficial owners of shares, such as our employees or directors, persons who are connected with us, persons who could be treated for U.K. tax purposes as holding their shares as carried interest, insurance companies, charities, collective investment schemes, pension schemes, trustees or persons who hold shares other than as an investment, or U.K. resident individuals who are not domiciled in the U.K. or who are subject to split-year treatment.
These paragraphs do not describe all of the circumstances in which shareholders may benefit from an exemption or relief from taxation. It is recommended that all shareholders obtain their own taxation advice. In particular, any shareholders who are non-U.K. resident or domiciled are advised to consider the potential impact of any relevant double tax treaties, including the Convention between the United States of America and the United Kingdom for the Avoidance of Double Taxation with respect to Taxes on Income, to the extent applicable.
49
U.K. Taxation of Dividends
U.K. Withholding Tax
- Dividends paid by us will not be subject to any withholding or deduction for, or on account of, U.K. tax, irrespective of the residence or the individual circumstances of the shareholders.
U.K. Income Tax
- An individual shareholder who is resident in the U.K. may, depending on his or her individual circumstances, be subject to U.K. income tax on dividends received from us. An individual shareholder who is not resident in the U.K. will not be subject to U.K. income tax on dividends received from us, unless that shareholder carries on (whether alone or in partnership) any trade, profession or vocation through a branch or agency in the U.K. and shares are used by, or held by or for, that branch or agency. In these circumstances, the non-U.K. resident shareholder may, depending on his or her individual circumstances, be subject to U.K. income tax on dividends received from us.
The tax treatment of dividends paid by the Company to individual shareholders is as follows:
|
•
|
dividends paid by the Company will not carry a tax credit,
|
|
•
|
all dividends received by an individual shareholder from the Company (or from other sources) will, except to the extent that they are earned through an Individual Savings Account, self-invested personal pension plan or other regime which exempts the dividends from income tax, form part of the shareholder's total income for income tax purposes,
|
|
•
|
a nil rate of income tax will apply to the first
£2,000
of taxable dividend income received by an individual shareholder in the tax year
2018
/
2019
(the "Nil Rate Amount"), regardless of what tax rate would otherwise apply to that dividend income,
|
|
•
|
any taxable dividend income received by an individual shareholder in a tax year in excess of the Nil Rate Amount will be taxed at a special rate, as set out below, and
|
|
•
|
that tax will be applied to the amount of the dividend income actually received by the individual shareholder (rather than to a grossed-up amount).
|
Where a shareholder’s taxable dividend income for a tax year exceeds the Nil Rate Amount, the excess amount will, subject to the availability of any income tax personal allowance, be subject to income tax at the following rates for the tax year 2018/2019:
|
•
|
at the rate of
7.5%
, to the extent that the excess amount falls below the threshold for the higher rate of income tax,
|
|
•
|
at the rate of
32.5%
, to the extent that the excess amount falls above the threshold for the higher rate of income tax but below the threshold for the additional rate of income tax, or
|
|
•
|
at the rate of
38.1
%, to the extent that the excess amount falls above the threshold for the additional rate of income tax.
|
In determining whether and, if so, to what extent the Relevant Dividend Income falls above or below the threshold for the higher rate of income tax or, as the case may be, the additional rate of income tax, the shareholder’s total dividend income for the tax year in question (including the part within the Nil Rate Amount) will be treated as the highest part of the shareholder’s total income for income tax purposes.
U.K. Corporation Tax
- Unless an exemption is available, as discussed below, a corporate shareholder that is resident in the U.K. will be subject to U.K. corporation tax on dividends received from us. A corporate shareholder that is not resident in the U.K. will not be subject to U.K. corporation tax on dividends received from us, unless that shareholder carries on a trade in the U.K. through a permanent establishment in the U.K. and the shares are used by,
50
for or held by or for, the permanent establishment. In these circumstances, the non-U.K. resident corporate shareholder may, depending on its individual circumstances (and if no exemption is available), be subject to U.K. corporation tax on dividends received from us.
The main rate of corporation tax payable with respect to dividends received from us in the financial year
2018
is
19%
, and will be
19%
for the financial year
2019
. If dividends paid by us fall within any of the exemptions from U.K. corporation tax set out in Part 9A of the U.K. Corporation Tax Act 2009, the receipt of the dividend by a corporate shareholder generally will be exempt from U.K. corporation tax. Generally, the conditions for one or more of those exemptions from U.K. corporation tax on dividends paid by us should be satisfied, although the conditions that must be satisfied in any particular case will depend on the individual circumstances of the relevant corporate shareholder.
Shareholders that are regarded as small companies should generally be exempt from U.K. corporation tax on dividends received from us, unless the dividends are received as part of a tax advantage scheme. Shareholders that are not regarded as small companies should generally be exempt from U.K. corporation tax on dividends received from us on the basis that the shares should be regarded as non-redeemable ordinary shares. Alternatively, shareholders that are not small companies should also generally be exempt from U.K. corporation tax on dividends received from us if they hold shares representing less than 10% of our issued share capital, would be entitled to less than 10% of the profits available for distribution to our equity-holders and would be entitled on a winding up to less than 10% of our assets available for distribution to such equity-holders. In certain limited circumstances, the exemption from U.K. corporation tax will not apply to such shareholders if a dividend is made as part of a scheme that has a main purpose of falling within the exemption from U.K. corporation tax.
U.K. Taxation of Capital Gains
U.K. Withholding Tax
- Capital gains accruing to non-U.K. resident shareholders on the disposal of shares will not be subject to any withholding or deduction for or on account of U.K. tax, irrespective of the residence or the individual circumstances of the relevant shareholder.
U.K. Capital Gains Tax
- A disposal of shares by an individual shareholder who is resident in the U.K. may, depending on his or her individual circumstances, give rise to a taxable capital gain or an allowable loss for the purposes of U.K. capital gains tax (“CGT”). An individual shareholder who temporarily ceases to be resident in the U.K. for a period of five years or less and who disposes of his or her shares during that period of temporary non-residence may be liable for CGT on a taxable capital gain accruing on the disposal on his or her return to the U.K. under certain anti-avoidance rules.
An individual shareholder who is not resident in the U.K. will not be subject to CGT on capital gains arising on the disposal of their shares, unless that shareholder carries on a trade, profession or vocation in the U.K. through a branch or agency in the U.K. and the shares were acquired, used in or for the purposes of the branch or agency or used in or for the purposes of the trade, profession or vocation carried on by the shareholder through the branch or agency. In these circumstances, the relevant non-U.K. resident shareholder may, depending on his or her individual circumstances, be subject to CGT on chargeable gains arising from a disposal of his or her shares. The rate of CGT in the tax year
2018
/
2019
is:
|
•
|
10%
, to the extent that the shareholder's total taxable gains and taxable income in a given year, including any chargeable gains arising from a disposal of his or her shares ("Total Taxable Gains and Income"), are less than or equal to the upper limit of the income tax basic rate band applicable to that shareholder in respect of that tax year (the "Band Limit"), and
|
|
•
|
20%
, to the extent that the shareholder's Total Taxable Gains and Income are more than the Band Limit.
|
U.K. Corporation Tax
- A disposal of shares by a corporate shareholder resident in the U.K. may give rise to a chargeable gain or an allowable capital loss for the purposes of U.K. corporation tax. A corporate shareholder not resident in the U.K. will not be liable for U.K. corporation tax on chargeable gains accruing on the disposal of its shares, unless that shareholder carries on a trade in the U.K. through a permanent establishment in the U.K. and the
51
shares were acquired, used in or for the purposes of the permanent establishment or used in or for the purposes of the trade carried on by the shareholder through the permanent establishment. In these circumstances, the relevant non-U.K. resident shareholder may, depending on its individual circumstances, be subject to U.K. corporation tax on chargeable gains arising from a disposal of its shares.
The financial year for U.K. corporation tax purposes runs from April 1 to March 31. The main rate of U.K. corporation tax on chargeable gains is
19%
in the financial year
2018
and
19%
in the financial year
2019
. Corporate shareholders may be entitled to an indexation allowance in computing the amount of a chargeable gain accruing on a disposal of the shares, which provides relief for the effects of inflation by reference to movements in the U.K. retail price index. Such indexation allowance is calculated only up to and including December 2017.
If the conditions of the substantial shareholding exemption are satisfied in relation to a chargeable gain accruing to a corporate shareholder on a disposal of its shares, the chargeable gain will be exempt from U.K. corporation tax. The conditions of the substantial shareholding exemption that must be satisfied will depend on the individual circumstances of the relevant corporate shareholder. One of the conditions of the substantial shareholding exemption that must be satisfied is that the corporate shareholder must have held a substantial shareholding in the Company throughout a 12-month period beginning not more than six years before the day on which the disposal takes place. Ordinarily, a corporate shareholder will not be regarded as holding a substantial shareholding in us, unless it (whether alone, or together with other group companies) holds not less than 10% of our ordinary share capital.
U.K. Stamp Duty and SDRT
The discussion below relates to shareholders wherever resident but not to holders such as market makers, brokers, dealers and intermediaries, to whom special rules apply. Special rules also apply in relation to certain stock lending and repurchase transactions.
Transfer of Shares held in book entry form via DTC -
A transfer of shares held in book entry (i.e., electronic) form within the facilities of the DTC system will not be subject to U.K. stamp duty or SDRT.
Transfers of Shares out of, or outside of, DTC
- Subject to an exemption for certain low value transactions, a transfer of shares from within the DTC system out of that system or any transfer of shares that occurs entirely outside the DTC system generally will be subject to a charge to
ad valorem
U.K. stamp duty (normally payable by the transferee) at 0.5% of the purchase price of the shares (rounded up to the nearest multiple of £5). SDRT generally will be payable on an unconditional agreement to transfer such shares at 0.5% of the amount or value of the consideration for the transfer. However, such liability for SDRT generally will be cancelled and any SDRT paid will be refunded if the agreement is completed by a duly-stamped transfer within six years of either the date of the agreement or, if the agreement was conditional, the date when the agreement became unconditional.
We have put in place arrangements to require that shares held outside the facilities of DTC cannot be transferred into such facilities (including where shares are re-deposited into DTC by an existing shareholder) until the transferor of the shares has first delivered the shares to a depository we specify, so that stamp duty and/or SDRT may be collected in connection with the initial delivery to the depository. Before such transfer can be registered in our books, the transferor will be required to put the depository in funds to settle the resultant liability for stamp duty and/or SDRT, which will be
1.5%
of the value of the shares, and to pay the transfer agent such processing fees as may be established from time to time.
Following a decision of the European Court of Justice in 2009 and a decision of the U.K. First-Tier Tax Tribunal in 2012, HMRC has announced that it will not seek to apply the
1.5%
charge to stamp duty or SDRT on the issuance of shares (or, where it is integral to the raising of new capital, the transfer of new shares) into depository receipt or clearance systems, such as DTC. Thus, the
1.5%
U.K. stamp duty or SDRT charge will apply only to the transfer of existing shares to clearance services or depositary receipt systems in circumstances where the transfer is not integral to the raising of new capital (for example, where shares are re-deposited into DTC by an existing shareholder). Investors should, however, be aware that this area may be subject to further developments in the future.
52
The above statements are intended only as a general guide to the current U.K. stamp duty and SDRT position. Transfers to certain categories of persons are not liable to U.K. stamp duty or SDRT and transfers to others may be liable at a higher rate than discussed above.
Equity Compensation Plans
For information on shares issued or to be issued in connection with our equity compensation plans, see "Part III, Item 12. Security Ownership of Certain Beneficial Owners and Management and Related Shareholder Matters."
Issuer Repurchases of Equity Securities
The following table provides a summary of our repurchases of our equity securities during the
quarter ended December 31, 2018
.
|
|
||||||||||||||
|
Issuer Repurchases of Equity Securities
|
||||||||||||||
|
Period
|
Total Number of Securities Repurchased
(1)
|
Average Price Paid per Security
|
Total Number of Securities Repurchased as Part of Publicly Announced Plans or Programs
(2)
|
Approximate Dollar Value of Securities that May Yet Be Repurchased Under Plans or Programs
|
||||||||||
|
October 1 - October 31
|
2,602
|
|
$
|
8.50
|
|
—
|
|
$
|
500,000,000
|
|
||||
|
November 1 - November 30
|
4,858
|
|
$
|
6.53
|
|
—
|
|
$
|
500,000,000
|
|
||||
|
December 1 - December 31
|
1,914
|
|
$
|
5.11
|
|
—
|
|
$
|
500,000,000
|
|
||||
|
Total
|
9,374
|
|
$
|
6.79
|
|
—
|
|
|
|
|||||
|
(1)
|
During the
quarter ended December 31, 2018
, equity securities were repurchased from employees and non-employee directors by an affiliated employee benefit trust in connection with the settlement of income tax withholding obligations arising from the vesting of share awards. Such securities remain available for re-issuance in connection with employee share awards.
|
|
(2)
|
Our shareholders approved a new repurchase program at our annual shareholder meeting held in May 2018. Subject to certain provisions under English law, including the requirement of Ensco plc to have sufficient distributable reserves, we may repurchase up to a maximum of
$500.0 million
in the aggregate from one or more financial intermediaries under the program, but in no case more than
65.0 million
shares. The program terminates in May 2023. Our prior share repurchase program approved by our shareholders in 2013, under which we could purchase up to a maximum of
$2.0 billion
in the aggregate, but in no case more than
35.0 million
shares, expired in May 2018. As of
December 31, 2018
, there had been
no
share repurchases under this program.
|
53
Performance Chart
The chart below presents a comparison of the five-year cumulative total return, assuming $100 invested on December 31,
2013
for Ensco plc, the Standard & Poor's MidCap 400 Index, and a self-determined peer group.
Total return assumes the reinvestment of dividends, if any, in the security on the ex-dividend date. The Standard & Poor's MidCap 400 Index includes Ensco and has been included as a comparison. Since Ensco operates exclusively as an offshore drilling company, a self-determined peer group composed exclusively of major offshore drilling companies has been included as a comparison.
*
COMPARISON OF 5 YEAR CUMULATIVE TOTAL RETURN
(1)
Among Ensco plc, the S&P MidCap 400 Index and Peer Group
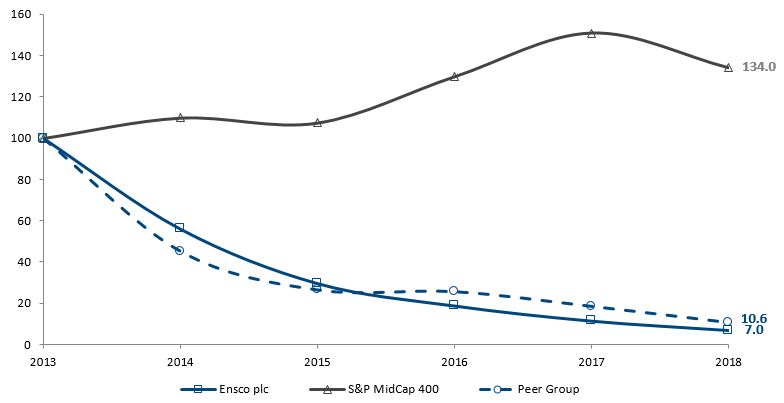
(1)
100 invested on 12/31/
2013
in stock or index, including reinvestment of dividends.
Fiscal year ending December 31.
Copyright©
2019
S&P, a division of The McGraw-Hill Companies Inc. All rights reserved.
|
Fiscal Year Ended December 31,
|
|||||||||||||||||
|
|
2013
|
2014
|
2015
|
2016
|
2017
|
2018
|
|||||||||||
|
Ensco plc
|
100.0
|
|
56.1
|
|
29.7
|
|
18.8
|
|
11.5
|
|
7.0
|
|
|||||
|
S&P MidCap 400
|
100.0
|
|
109.8
|
|
107.4
|
|
129.7
|
|
150.7
|
|
134.0
|
|
|||||
|
Peer Group
|
100.0
|
|
45.2
|
|
26.5
|
|
25.6
|
|
18.5
|
|
10.6
|
|
|||||
____________________________________
*
Our self-determined peer group is weighted according to market capitalization and consists of the following companies: Transocean Ltd., Diamond Offshore Drilling Inc., Noble Corporation plc, SeaDrill Limited and Rowan Companies plc.
54
Item 6.
Selected Financial Data
The financial data below should be read in conjunction with "Item 7. Management's Discussion and Analysis of Financial Condition and Results of Operations" and our consolidated financial statements and notes thereto included in "Item 8. Financial Statements and Supplementary Data."
|
|
Year Ended December 31,
|
||||||||||||||||||
|
2018
|
2017
|
2016
|
2015
|
2014
|
|||||||||||||||
|
|
(in millions, except per share amounts)
|
||||||||||||||||||
|
Consolidated Statement of Operations Data
|
|
|
|
|
|
|
|
|
|||||||||||
|
Revenues
|
$
|
1,705.4
|
|
$
|
1,843.0
|
|
$
|
2,776.4
|
|
$
|
4,063.4
|
|
$
|
4,564.5
|
|
||||
|
Operating expenses
|
|
|
|
|
|
|
|
|
|
|
|||||||||
|
Contract drilling (exclusive of depreciation)
|
1,319.4
|
|
1,189.5
|
|
1,301.0
|
|
1,869.6
|
|
2,076.9
|
|
|||||||||
|
Loss on impairment
|
40.3
|
|
182.9
|
|
—
|
|
2,746.4
|
|
4,218.7
|
|
|||||||||
|
Depreciation
|
478.9
|
|
444.8
|
|
445.3
|
|
572.5
|
|
537.9
|
|
|||||||||
|
General and administrative
|
102.7
|
|
157.8
|
|
100.8
|
|
118.4
|
|
131.9
|
|
|||||||||
|
Operating income (loss)
|
(235.9
|
)
|
|
(132.0
|
)
|
|
929.3
|
|
|
(1,243.5
|
)
|
|
(2,400.9
|
)
|
|||||
|
Other income (expense), net
|
(303.0
|
)
|
(64.0
|
)
|
68.2
|
|
(227.7
|
)
|
(147.9
|
)
|
|||||||||
|
Income tax expense (benefit)
|
89.6
|
|
109.2
|
|
108.5
|
|
(13.9
|
)
|
140.5
|
|
|||||||||
|
Income (loss) from continuing operations
|
(628.5
|
)
|
(305.2
|
)
|
|
889.0
|
|
|
(1,457.3
|
)
|
|
(2,689.3
|
)
|
||||||
|
Income (loss) from discontinued operations, net
(1)
|
(8.1
|
)
|
1.0
|
|
8.1
|
|
(128.6
|
)
|
(1,199.2
|
)
|
|||||||||
|
Net income (loss)
|
(636.6
|
)
|
(304.2
|
)
|
|
897.1
|
|
|
(1,585.9
|
)
|
|
(3,888.5
|
)
|
||||||
|
Net (income) loss attributable to noncontrolling interests
|
(3.1
|
)
|
.5
|
|
(6.9
|
)
|
(8.9
|
)
|
(14.1
|
)
|
|||||||||
|
Net income (loss) attributable to Ensco
|
$
|
(639.7
|
)
|
$
|
(303.7
|
)
|
|
$
|
890.2
|
|
|
$
|
(1,594.8
|
)
|
|
$
|
(3,902.6
|
)
|
|
|
Earnings (loss) per share – basic and diluted
|
|
|
|
|
|
|
|
|
|
|
|||||||||
|
Continuing operations
|
$
|
(1.45
|
)
|
$
|
(0.91
|
)
|
$
|
3.10
|
|
$
|
(6.33
|
)
|
$
|
(11.70
|
)
|
||||
|
Discontinued operations
|
(0.02
|
)
|
—
|
|
0.03
|
|
(0.55
|
)
|
(5.18
|
)
|
|||||||||
|
|
$
|
(1.47
|
)
|
$
|
(0.91
|
)
|
|
$
|
3.13
|
|
|
$
|
(6.88
|
)
|
|
$
|
(16.88
|
)
|
|
|
Weighted-average shares outstanding
|
|
|
|
|
|
|
|
|
|
|
|||||||||
|
Basic and diluted
|
434.1
|
|
332.5
|
|
279.1
|
|
232.2
|
|
231.6
|
|
|||||||||
|
(1)
|
See Note 11 to our consolidated financial statements included in "Item 8. Financial Statements and Supplementary Data" for information on discontinued operations.
|
|
|
Year Ended December 31,
|
||||||||||||||||||
|
|
2018
|
2017
|
2016
|
2015
|
2014
|
||||||||||||||
|
|
(in millions)
|
||||||||||||||||||
|
Consolidated Balance Sheet and Cash Flow Statement Data
|
|||||||||||||||||||
|
Working capital
|
$
|
781.2
|
|
$
|
853.5
|
|
$
|
2,424.9
|
|
$
|
1,509.6
|
|
$
|
1,788.9
|
|
||||
|
Total assets
|
$
|
14,023.7
|
|
$
|
14,625.9
|
|
$
|
14,374.5
|
|
$
|
13,610.5
|
|
$
|
16,023.3
|
|
||||
|
Long-term debt
|
$
|
5,010.4
|
|
$
|
4,750.7
|
|
$
|
4,942.6
|
|
$
|
5,868.6
|
|
$
|
5,868.1
|
|
||||
|
Ensco shareholders' equity
|
$
|
8,091.4
|
|
$
|
8,732.1
|
|
$
|
8,250.6
|
|
$
|
6,512.9
|
|
$
|
8,215.0
|
|
||||
|
Cash flows from operating activities of continuing operations
|
$
|
(55.7
|
)
|
$
|
259.4
|
|
$
|
1,077.4
|
|
$
|
1,697.9
|
|
$
|
2,057.9
|
|
||||
55
Item 7.
Management's Discussion and Analysis of Financial Condition and Results of Operations
INTRODUCTION
Our Business
We are one of the leading providers of offshore contract drilling services to the international oil and gas industry. We currently own and operate an offshore drilling rig fleet of
56
rigs, with drilling operations in most of the strategic markets around the globe. We also have
three
rigs under construction. Inclusive of our rigs under construction, our fleet includes
12
drillships,
nine
dynamically positioned semisubmersible rigs,
three
moored semisubmersible rigs and
35
jackup rigs. We operate the world's largest fleet amongst competitive rigs, including one of the newest ultra-deepwater fleets in the industry and a leading premium jackup fleet.
Our customers include many of the leading national and international oil companies, in addition to many independent operators. We are among the most geographically diverse offshore drilling companies, with current operations spanning
14
countries on
six
continents. The markets in which we operate include the Gulf of Mexico, Brazil, the Mediterranean, the North Sea, the Middle East, West Africa, Australia and Southeast Asia.
We provide drilling services on a day rate contract basis. Under day rate contracts, we provide an integrated service that includes the provision of a drilling rig and rig crews for which we receive a daily rate that may vary between the full rate and zero rate throughout the duration of the contractual term, depending on the operations of the rig. We also may receive lump-sum fees or similar compensation for the mobilization, demobilization and capital upgrades of our rigs. Our customers bear substantially all of the costs of constructing the well and supporting drilling operations, as well as the economic risk relative to the success of the well.
Proposed Rowan Transaction
On October 7, 2018, Ensco plc and Rowan Companies plc ("Rowan") entered into an agreement that provides for the combination of the two companies (as amended the "Transaction Agreement"). Ensco has agreed to acquire the entire issued and to be issued share capital of Rowan in an all-stock transaction (the "Rowan Transaction") by way of a scheme of arrangement to be undertaken by Rowan under Part 26 of the UK Companies Act 2006. On January 29, 2019, the Transaction Agreement was amended to increase the exchange ratio in connection with the Rowan Transaction from
2.215
to
2.750
.
Subject to the terms and conditions of the Transaction Agreement, each Class A ordinary share of Rowan will be converted into the right to receive
2.750
Class A ordinary shares of Ensco plc. We estimate the total consideration to be delivered in the Rowan Transaction to be approximately
$1.5 billion
, consisting of approximately
351.3 million
of our shares based on the closing price of
$4.41
on
February 22, 2019
. The value of the Rowan Transaction consideration will fluctuate until the closing date based on changes in the price of our shares and the number of Rowan ordinary shares outstanding.
The completion of the Rowan Transaction is subject to various closing conditions, including, among others, (i) the sanction of the Rowan Transaction by the High Court of Justice of England and Wales, (ii) the receipt of certain required regulatory approvals or lapse of certain review periods with respect thereto, including in the Kingdom of Saudi Arabia, (iii) the absence of legal restraints prohibiting or restraining the Rowan Transaction and (iv) the absence of any law or order reasonably expected to result in the dissolution of the Saudi Aramco Offshore Drilling Company, Rowan’s joint venture with Saudi Aramco (the “ARO JV”), or the sale, disposition, forfeiture or nationalization of Rowan’s interest in the ARO JV. Shareholders of Rowan and Ensco approved the Rowan Transaction and related proposals on February 21, 2019. The Rowan Transaction is expected to close during the first half of 2019, subject to satisfaction of all conditions to closing. Upon closing of the Rowan Transaction, we intend to complete a reverse split of our ordinary shares under which every four existing Ensco ordinary shares will be consolidated into one Ensco ordinary share.
56
Atwood Merger
On October 6, 2017 (the "Merger Date"), we completed a merger transaction (the "Atwood Merger") with Atwood Oceanics, Inc. ("Atwood") and Echo Merger Sub, LLC, a wholly-owned subsidiary of Ensco plc. Pursuant to the merger agreement, Echo Merger Sub, LLC, merged with and into Atwood, with Atwood as the surviving entity and an indirect, wholly-owned subsidiary of Ensco plc. Total consideration delivered in the Atwood Merger consisted of
132.2 million
of our Class A ordinary shares and
$11.1 million
of cash in settlement of certain share-based payment awards. The total aggregate value of consideration transferred was
$781.8 million
. Additionally, upon closing of the Atwood Merger, we utilized cash acquired of
$445.4 million
and cash on hand to extinguish Atwood's revolving credit facility, outstanding senior notes and accrued interest totaling
$1.3 billion
. The estimated fair values assigned to assets acquired net of liabilities assumed exceeded the consideration transferred, resulting in a bargain purchase gain of
$140.2 million
that was recognized during the fourth quarter of 2017. During 2018, we recognized measurement period adjustments as we completed our fair value assessments resulting in additional bargain purchase gain of
$1.8 million
.
Our Industry
Operating results in the offshore contract drilling industry are highly cyclical and are directly related to the demand for drilling rigs and the available supply of drilling rigs. Low demand and excess supply can independently affect day rates and utilization of drilling rigs. Therefore, adverse changes in either of these factors can result in adverse changes in our industry. While the cost of moving a rig may cause the balance of supply and demand to vary somewhat between regions, significant variations between regions are generally of a short-term nature due to rig mobility.
Drilling Rig Demand
The decline in oil prices from 2014 highs led to a significant reduction in demand for offshore drilling services in recent years as many projects became uneconomic for customers at lower commodity prices. Customers significantly reduced their capital spending budgets, including the cancellation or deferral of existing programs, resulting in fewer contracting opportunities for offshore drilling rigs. Declines in capital spending levels, together with the oversupply of rigs, resulted in significantly reduced day rates and utilization.
More recently, oil prices have increased meaningfully from the decade lows reached during 2016, with Brent crude averaging nearly
$55
per barrel in 2017 and more than $70 per barrel through the first nine months of 2018, leading to signs of a gradual recovery in demand for offshore drilling services. However, macroeconomic and geopolitical headwinds triggered a market correction during the fourth quarter of 2018, resulting in a decline in Brent crude prices from more than
$85
per barrel at the beginning of the quarter to approximately
$50
per barrel at year-end.
While market volatility may continue over the near-term, we expect long-term oil prices to remain at levels sufficient to result in more offshore projects that are economic for our customers. Therefore, we expect that near-term market conditions will remain challenging while demand for contract drilling services continues its gradual recovery with different segments of the market recovering more quickly than others.
Although oil prices have declined from the recent highs reached in 2018, we continue to observe improvements in the shallow-water market as higher levels of customer demand and rig retirements have led to gradually increasing jackup utilization over the past year. Moreover, new floater contracts and open tenders have increased as compared to a year ago due to improving economics for deepwater projects.
Despite the increase in customer activity, contract awards remain subject to an extremely competitive bidding process, and the corresponding pressure on operating day rates in recent periods has resulted in low margin contracts, particularly for floaters. Therefore, we expect our results from operations to continue to decline over the near-term as current contracts with above market rates expire and new contracts are executed at lower rates. We believe further improvements in demand coupled with a reduction in rig supply are necessary to improve the commercial landscape for day rates.
57
Drilling Rig Supply
Drilling rig supply continues to exceed drilling rig demand for both floaters and jackups. However, the decline in customer capital expenditure budgets over the past several years has led to a lack of contracting opportunities resulting in meaningful global fleet attrition. Since the beginning of the downturn, drilling contractors have retired approximately
120
floaters and
90
jackups. As demand for offshore drilling ultimately improves, we expect that newer, more capable rigs will be the first to obtain contract awards, increasing the likelihood that older, less capable rigs do not return to the global active fleet.
Approximately
20
floaters older than 30 years are idle,
10
additional floaters older than 30 years have contracts expiring by the end of
2019
without follow-on work and a further
10
floaters aged between 15 and 30 years have been idle for more than two years. Operating costs associated with keeping these rigs idle as well as expenditures required to recertify these aging rigs may prove cost prohibitive. Drilling contractors will likely elect to scrap or cold-stack some or all of these rigs.
Approximately
100
jackups older than 30 years are idle, and
60
jackups that are 30 years or older have contracts expiring by the end of
2019
without follow-on work. Expenditures required to recertify these aging rigs may prove cost prohibitive and drilling contractors may instead elect to scrap or cold-stack these rigs. We expect jackup scrapping and cold-stacking to continue during
2019
.
There are
41
newbuild drillships and semisubmersibles reported to be under construction, of which
20
are scheduled to be delivered before the end of
2019
. Most newbuild floaters are uncontracted. Several newbuild deliveries have been delayed into future years, and we expect that more uncontracted newbuilds will be delayed or cancelled.
There are
77
newbuild jackups reported to be under construction, of which
51
are scheduled to be delivered before the end of
2019
. Most newbuild jackups are uncontracted. Over the past year, some jackup orders have been cancelled, and many newbuild jackups have been delayed. We expect that additional rigs may be delayed or cancelled given limited contracting opportunities.
Liquidity, Backlog and Debt Maturities
We remain focused on our liquidity and over the past several years have executed a number of financing transactions to improve our financial position and manage our debt maturities. Based on our balance sheet, our contractual backlog and
$2.0 billion
available under our Credit Facility, we expect to fund our liquidity needs, including contractual obligations and anticipated capital expenditures, as well as working capital requirements, from cash and short-term investments and, if necessary, funds borrowed under our Credit Facility or other future financing arrangements, including available shipyard financing options for our two drillships under construction. We may rely on the issuance of debt and/or equity securities in the future to supplement our liquidity needs.
Cash and Debt
As of
December 31, 2018
, we had
$5.0 billion
in total debt outstanding, representing
38.2%
of our total capitalization. We also had
$604.1 million
in cash and short-term investments and
$2.0 billion
undrawn capacity under our Credit Facility.
In January 2018, we issued
$1.0 billion
aggregate principal amount of unsecured
7.75%
senior notes due 2026 (the "2026 Notes"), net of debt issuance costs of
$16.5 million
. Net proceeds of $
983.5 million
from the 2026 Notes were partially used to fund the repurchase and redemption of
$237.6 million
principal amount of our
8.50%
senior notes due 2019,
$328.0 million
principal amount of our
6.875%
senior notes due 2020 and
$156.2 million
principal amount of our
4.70%
senior notes due 2021. We recognized a pre-tax loss on debt extinguishment of
$19.0 million
during the first quarter of 2018.
Following the January 2018 debt offering, repurchases and redemption, our only debt maturities until 2024 are
$122.9 million
during 2020 and
$113.5 million
during 2021.
58
Backlog
As of
December 31, 2018
, our backlog was
$2.2 billion
as compared to
$2.8 billion
as of
December 31, 2017
. Our floater backlog
declined
$636.8 million
primarily due to revenues realized during
2018
, partially offset by new contract awards and contract extensions. While our floater utilization increased marginally in 2018 to
46%
from
45%
in 2017, our floater backlog declined as revenues were realized on above-market, longer-term contracts and new contracts were executed a lower rates for shorter terms. Our jackup backlog
increased
$58.0 million
primarily due to new contract awards as utilization increased to
63%
in 2018 from
60%
in 2017, partially offset by revenues realized during 2018. Our other segment backlog
declined
$59.8 million
due to revenues realized during
2018
.
As current contracts expire, we may experience further declines in backlog, which could result in a decline in revenues and operating cash flows during
2019
. Contract backlog includes the impact of drilling contracts signed or terminated after each respective balance sheet date but prior to filing our annual reports on
February 28, 2019
and
February 27, 2018
, respectively.
Drilling Rig Construction and Delivery
We remain focused on our long-established strategy of high-grading our fleet, as evidenced by the recently completed Atwood Merger and proposed Rowan Transaction. During the three-year period ended
December 31, 2018
, we invested approximately
$1.0 billion
in the construction of new drilling rigs. We will continue to invest in the expansion and high-grading of our fleet or execute other strategic transactions to optimize our asset portfolio when we believe attractive opportunities exist.
We believe our remaining capital commitments will primarily be funded from cash and short-term investments, and, if necessary, funds borrowed under our Credit Facility or other future financing arrangements, including available shipyard financing options for our two drillships under construction. We may decide to access debt and/or equity markets to raise additional capital or increase liquidity as necessary.
Floaters
We previously entered into an agreement with Samsung Heavy Industries to construct ENSCO DS-10, an ultra deepwater drillship. During 2017, we took delivery of ENSCO DS-10 and made the final milestone payment of
$75.0 million
. ENSCO DS-10 commenced drilling operations offshore Nigeria in March 2018.
In connection with the Atwood Merger, we acquired two ultra-deepwater drillships, ENSCO DS-13 and ENSCO DS-14, which are currently under construction in the Daewoo Shipbuilding & Marine Engineering Co. Ltd. yard in South Korea. ENSCO DS-13 and ENSCO DS-14 are scheduled for delivery during the third quarter of 2019 and second quarter of 2020, respectively. Upon delivery, the remaining milestone payments and accrued interest thereon may be financed through a promissory note with the shipyard for each rig. The promissory notes will bear interest at a rate of 5.0% per annum with a maturity date of December 30, 2022 and will be secured by a mortgage on each respective rig.
Jackups
During 2014, we entered into an agreement with Lamprell Energy Limited to construct two premium jackup rigs, ENSCO 140 and ENSCO 141, which are significantly enhanced versions of the LeTourneau Super 116E jackup design and incorporate Ensco's patented Canti-Leverage Advantage
TM
technology. ENSCO 140 and ENSCO 141 were delivered during 2016 and commenced drilling operations offshore Saudi Arabia in July and August 2018, respectively.
We previously entered into an agreement with Keppel FELS to construct an ultra-premium harsh environment jackup, ENSCO 123. In December 2017, we agreed to delay delivery of ENSCO 123 until 2019, and in January 2018, we made a
$207.4 million
milestone payment. The remaining unpaid balance of
$9.0 million
is due upon delivery.
59
ENSCO 123 was designed to incorporate Ensco's patented Continuous Tripping Technology™, a new proprietary solution that provides safer and more efficient pipe tripping and helps to lower customers’ offshore project costs. We expect ENSCO 123 to commence drilling operations in the North Sea in July 2019.
Divestitures
Our business strategy has been to focus on ultra-deepwater floater and premium jackup operations and de-emphasize other assets and operations that are not part of our long-term strategic plan or that no longer meet our standards for economic returns. Consistent with this strategy, we sold
12
jackup rigs,
five
dynamically positioned semisubmersible rigs,
one
moored semisubmersible rig and
two
drillships during the three-year period ended
December 31, 2018
.
We continue to focus on our fleet management strategy in light of the composition of our rig fleet. As part of this strategy, we may act opportunistically from time to time to monetize assets to enhance shareholder value and improve our liquidity profile, in addition to selling or disposing of older, lower-specification or non-core rigs.
BUSINESS ENVIRONMENT
Floaters
The floater contracting environment continues to be challenged due to limited demand and excess newbuild supply. Floater demand declined significantly since the beginning of the current market downturn due to lower commodity prices that have caused our customers to reduce capital expenditures. More recently, we have observed increased activity that has translated into marginal improvements in near-term utilization of our floater fleet; however, further improvements in demand and/or reductions in supply will be necessary before meaningful increases in utilization and day rates are realized.
During first quarter 2018, we executed two short-term contracts and a contract extension for ENSCO 8503, as well as a short-term contract for ENSCO 8505, in the U.S Gulf of Mexico.
During second quarter 2018, we executed a short-term contract extension for ENSCO DS-12 offshore Suriname as well as a short-term contract and contract extension for ENSCO 8505 and ENSCO 8503, respectively, in the U.S. Gulf of Mexico. Additionally, our customer terminated the contract for ENSCO 8504 offshore Vietnam due to force majeure.
During third quarter 2018, we executed a one-well contract for ENSCO DS-9 that commenced in December 2018 offshore French Guiana, a two-well contract for ENSCO DS-12 that is expected to commence in April 2019 offshore Senegal, an eight-well contract for ENSCO 8505 that commenced in January 2019, a100-day contract for ENSCO 8503 that commenced in November 2018 offshore Mexico and a one-well contract for ENSCO 8504 that is expected to commence in April 2019 offshore Japan.
During fourth quarter 2018, we executed a one-year contract extension for ENSCO DS-10 offshore Nigeria and a two-well contract extension for ENSCO 5004 in the Mediterranean.
During first quarter 2019, we executed a four-well contract in the U.S. Gulf of Mexico for ENSCO 8503 that is expected to commence in June 2019 and a two-well contract offshore Australia for ENSCO DPS-1 that is expected to commence in February 2020.
During 2018, we sold
three
floaters for scrap value resulting in insignificant pre-tax gains.
60
Jackups
Demand for jackups has improved with increased tendering activity observed in recent periods; however, day rates remain depressed due to the oversupply of rigs.
During first quarter 2018, we executed a 16-month contract for ENSCO 104 offshore UAE. We also executed short-term contracts or extensions for ENSCO 72, ENSCO 101 and ENSCO 122 in the North Sea as well as for ENSCO 68, ENSCO 75 and ENSCO 87 in the U.S. Gulf of Mexico.
During second quarter 2018, we executed three-year contracts for ENSCO 140, ENSCO 141 and ENSCO 108 offshore Saudi Arabia. ENSCO 140 and ENSCO 141 commenced operations during July 2018 and August 2018, respectively, and ENSCO 108 commenced operations during the fourth quarter. We also executed a 10-month contract for ENSCO 115 offshore Thailand that is expected to commence during first quarter 2019 and short-term contracts or extensions for ENSCO 101 and ENSCO 122 in the North Sea as well as for ENSCO 68 and ENSCO 75 in the U.S. Gulf of Mexico.
During third quarter 2018, we executed a nine-month contract extension for ENSCO 75 and short-term contracts or extensions for ENSCO 72, ENSCO 121 and ENSCO 122 in the North Sea as well as for ENSCO 68, ENSCO 87 and ENSCO 102 in the U.S. Gulf of Mexico.
During fourth quarter 2018, we executed a four-year contract extension for ENSCO 76 offshore Saudi Arabia and a 500-day contract extension for ENSCO 67 offshore Indonesia. We also executed a contract with a customer in the North Sea comprising three campaigns scheduled to commence in July 2019, March 2020 and June 2020. ENSCO 123 is contracted to perform the first and third campaigns and ENSCO 100 is contracted to perform the second campaign. However, the contract allows for us to provide any ENSCO 120 Series rig to perform the second and third campaigns. Additionally, we executed short-term contracts for ENSCO 87 and ENSCO 102 in the U.S. Gulf of Mexico.
During first quarter 2019, we executed short-term contracts or extensions for ENSCO 72, ENSCO 100 and ENSCO 121 in the North Sea, ENSCO 96 offshore Saudi Arabia and ENSCO 107 offshore Australia.
During 2018, we sold
three
jackups for scrap value resulting in insignificant pre-tax gains.
61
RESULTS OF OPERATIONS
The following table summarizes our consolidated results of operations for each of the years in the three-year period ended
December 31, 2018
(in millions):
|
2018
|
2017
|
2016
|
||||||||||
|
Revenues
|
$
|
1,705.4
|
|
$
|
1,843.0
|
|
$
|
2,776.4
|
|
|||
|
Operating expenses
|
|
|
|
|
|
|
||||||
|
Contract drilling (exclusive of depreciation)
|
1,319.4
|
|
1,189.5
|
|
1,301.0
|
|
||||||
|
Loss on impairment
|
40.3
|
|
182.9
|
|
—
|
|
||||||
|
Depreciation
|
478.9
|
|
444.8
|
|
445.3
|
|
||||||
|
General and administrative
|
102.7
|
|
157.8
|
|
100.8
|
|
||||||
|
Operating income (loss)
|
(235.9
|
)
|
(132.0
|
)
|
929.3
|
|
||||||
|
Other income (expense), net
|
(303.0
|
)
|
(64.0
|
)
|
68.2
|
|
||||||
|
Provision for income taxes
|
89.6
|
|
109.2
|
|
108.5
|
|
||||||
|
Income (loss) from continuing operations
|
(628.5
|
)
|
(305.2
|
)
|
889.0
|
|
||||||
|
Income (loss) from discontinued operations, net
|
(8.1
|
)
|
1.0
|
|
8.1
|
|
||||||
|
Net income (loss)
|
(636.6
|
)
|
(304.2
|
)
|
897.1
|
|
||||||
|
Net (income) loss attributable to noncontrolling interests
|
(3.1
|
)
|
.5
|
|
(6.9
|
)
|
||||||
|
Net income (loss) attributable to Ensco
|
$
|
(639.7
|
)
|
$
|
(303.7
|
)
|
$
|
890.2
|
|
|||
Overview
Year Ended December 31, 2018
Revenues
declined
by
$137.6 million
, or
7%
, as compared to the prior year. The decline was primarily due to a decline in average day rates in both our floater and jackup fleets and the sale of several rigs during the year that operated in the year-ago period, partially offset by increased utilization and the addition of Atwood rigs to the fleet.
Contract drilling expense
increased
by
$129.9 million
, or
11%
, as compared to the prior year. The increase was primarily due to addition of Atwood rigs to the fleet and the commencement of drilling operations for several of our newbuild rigs. This increase was partially offset by the sale of several rigs during the year that operated in the year-ago period and cost incurred during the prior year to settle a previously disclosed legal contingency.
Excluding the impact of
$7.5 million
and
$51.6 million
of transaction costs recognized during 2018 and 2017 respectively, general and administrative expenses
declined
by
$11.0 million
, or
10%
, as compared to the prior year. The decline was primarily due to lower compensation costs and the recovery of certain legal costs awarded to us in connection with the SHI litigation.
Year Ended December 31, 2017
Excluding the impact of ENSCO DS-9 and ENSCO 8503 lump-sum termination payments totaling
$205.0 million
received during 2016, revenues
declined
by
$728.4 million
, or
28%
, as compared to the prior year. The decline was primarily due to a decline in average day rates in both our floater and jackup segments and the sale of several rigs during the year that operated in the year-ago period. The decline was partially offset by the addition of Atwood rigs to the fleet during the fourth quarter of 2017.
Contract drilling expense
declined
by
$111.5 million
, or
9%
, as compared to the prior year. The decline was primarily due to lower fleet-wide utilization and the sale of several rigs that operated in the year-ago period. This decline was partially offset by the addition of Atwood rigs to the fleet during the fourth quarter of 2017.
62
Excluding the impact of
$51.6 million
of transaction costs associated with the Atwood Merger, general and administrative expenses
increased
by
$5.4 million
, or
5%
, as compared to the prior year primarily due to increased compensation costs for certain performance-based awards.
Rig Counts, Utilization and Average Day Rates
The following table summarizes our offshore drilling rigs by reportable segment, rigs under construction and rigs held-for-sale as of December 31,
2018, 2017 and 2016
:
|
2018
|
2017
|
2016
|
||||
|
Floaters
(1)(2)
|
22
|
24
|
19
|
|||
|
Jackups
(3)
|
34
|
37
|
36
|
|||
|
Under construction
(2)(4)
|
3
|
3
|
2
|
|||
|
Held-for-sale
(5)
|
—
|
1
|
2
|
|||
|
Total
|
59
|
65
|
59
|
|||
|
(1)
|
During 2018, we sold ENSCO 5005 and ENSCO 6001. During 2017, we added ENSCO DS-11, ENSCO DS-12, ENSCO DPS-1 and ENSCO MS-1 from the Atwood Merger.
|
|
(2)
|
During 2017, we accepted delivery of ENSCO DS-10.
|
|
(3)
|
During 2018, we sold ENSCO 80, ENSCO 81 and ENSCO 82. During 2017, we added ENSCO 111, ENSCO 112, ENSCO 113, ENSCO 114 and ENSCO 115 from the Atwood Merger and sold ENSCO 86, ENSCO 99, ENSCO 52 and ENSCO 56.
|
|
(4)
|
During 2017, we added ENSCO DS-13 and ENSCO DS-14 from the Atwood Merger, both of which are under construction.
|
(5)
During 2018, we sold ENSCO 7500. During 2017, we sold ENSCO 90.
The following table summarizes our rig utilization and average day rates from continuing operations by reportable segment for each of the years in the three-year period ended
December 31, 2018
:
|
|
2018
|
2017
|
2016
|
|||||||||
|
Rig Utilization
(1)
|
|
|
|
|
|
|
||||||
|
Floaters
|
46%
|
45%
|
54%
|
|||||||||
|
Jackups
|
63%
|
60%
|
60%
|
|||||||||
|
Total
|
56%
|
55%
|
58%
|
|||||||||
|
Average Day Rates
(2)
|
|
|
|
|||||||||
|
Floaters
|
$
|
248,395
|
|
$
|
327,736
|
|
$
|
359,758
|
|
|||
|
Jackups
|
77,086
|
|
84,913
|
|
110,682
|
|
||||||
|
Total
|
$
|
131,313
|
|
$
|
158,484
|
|
$
|
192,427
|
|
|||
|
(1)
|
Rig utilization is derived by dividing the number of days under contract by the number of days in the period. Days under contract equals the total number of days that rigs have earned and recognized day rate revenue, including days associated with early contract terminations, compensated downtime and mobilizations. When revenue is deferred and amortized over a future period, for example when we receive fees while mobilizing to commence a new contract or while being upgraded in a shipyard, the related days are excluded from days under contract.
|
63
For newly-constructed or acquired rigs, the number of days in the period begins upon commencement of drilling operations for rigs with a contract or when the rig becomes available for drilling operations for rigs without a contract.
|
(2)
|
Average day rates are derived by dividing contract drilling revenues, adjusted to exclude certain types of non-recurring reimbursable revenues, lump-sum revenues and revenues attributable to amortization of drilling contract intangibles, by the aggregate number of contract days, adjusted to exclude contract days associated with certain mobilizations, demobilizations, shipyard contracts and standby contracts.
|
Detailed explanations of our operating results, including discussions of revenues, contract drilling expense and depreciation expense by segment, are provided below.
Operating Income by Segment
Our business consists of three operating segments: (1) Floaters, which includes our drillships and semisubmersible rigs, (2) Jackups and (3) Other, which consists of management services on rigs owned by third parties. Our two reportable segments, Floaters and Jackups, provide one service, contract drilling.
Segment information for each of the years in the three-year period ended
December 31, 2018
is presented below (in millions). General and administrative expense and depreciation expense incurred by our corporate office are not allocated to our operating segments for purposes of measuring segment operating income (loss) and were included in "Reconciling Items."
Year Ended December 31, 2018
|
Floaters
|
Jackups
|
Other
|
Operating Segments Total
|
Reconciling Items
|
Consolidated Total
|
||||||||||||||||||
|
Revenues
|
$
|
1,013.5
|
|
$
|
630.9
|
|
$
|
61.0
|
|
$
|
1,705.4
|
|
$
|
—
|
|
$
|
1,705.4
|
|
|||||
|
Operating expenses
|
|||||||||||||||||||||||
|
Contract drilling
(exclusive of depreciation)
|
737.4
|
|
526.5
|
|
55.5
|
|
1,319.4
|
|
—
|
|
1,319.4
|
|
|||||||||||
|
Loss on impairment
|
—
|
|
40.3
|
|
—
|
|
40.3
|
|
—
|
|
40.3
|
|
|||||||||||
|
Depreciation
|
311.8
|
|
153.3
|
|
—
|
|
465.1
|
|
13.8
|
|
478.9
|
|
|||||||||||
|
General and administrative
|
—
|
|
—
|
|
—
|
|
—
|
|
102.7
|
|
102.7
|
|
|||||||||||
|
Operating income (loss)
|
$
|
(35.7
|
)
|
$
|
(89.2
|
)
|
$
|
5.5
|
|
$
|
(119.4
|
)
|
$
|
(116.5
|
)
|
$
|
(235.9
|
)
|
|||||
Year Ended December 31, 2017
|
Floaters
|
Jackups
|
Other
|
Operating Segments Total
|
Reconciling Items
|
Consolidated Total
|
||||||||||||||||||
|
Revenues
|
$
|
1,143.5
|
|
$
|
640.3
|
|
$
|
59.2
|
|
$
|
1,843.0
|
|
$
|
—
|
|
$
|
1,843.0
|
|
|||||
|
Operating expenses
|
|||||||||||||||||||||||
|
Contract drilling
(exclusive of depreciation)
|
624.2
|
|
512.1
|
|
53.2
|
|
1,189.5
|
|
—
|
|
1,189.5
|
|
|||||||||||
|
Loss on impairment
|
174.7
|
|
8.2
|
|
—
|
|
—
|
|
—
|
|
182.9
|
|
|||||||||||
|
Depreciation
|
297.4
|
|
131.5
|
|
—
|
|
428.9
|
|
15.9
|
|
444.8
|
|
|||||||||||
|
General and administrative
|
—
|
|
—
|
|
—
|
|
—
|
|
157.8
|
|
157.8
|
|
|||||||||||
|
Operating income (loss)
|
$
|
47.2
|
|
$
|
(11.5
|
)
|
$
|
6.0
|
|
$
|
41.7
|
|
$
|
(173.7
|
)
|
$
|
(132.0
|
)
|
|||||
64
Year Ended December 31, 2016
|
Floaters
|
Jackups
|
Other
|
Operating Segments Total
|
Reconciling Items
|
Consolidated Total
|
||||||||||||||||||
|
Revenues
|
$
|
1,771.1
|
|
$
|
929.5
|
|
$
|
75.8
|
|
$
|
2,776.4
|
|
$
|
—
|
|
$
|
2,776.4
|
|
|||||
|
Operating expenses
|
|||||||||||||||||||||||
|
Contract drilling
(exclusive of depreciation)
|
725.0
|
|
516.8
|
|
59.2
|
|
1,301.0
|
|
—
|
|
1,301.0
|
|
|||||||||||
|
Depreciation
|
304.1
|
|
123.7
|
|
—
|
|
427.8
|
|
17.5
|
|
445.3
|
|
|||||||||||
|
General and administrative
|
—
|
|
—
|
|
—
|
|
—
|
|
100.8
|
|
100.8
|
|
|||||||||||
|
Operating income
|
$
|
742.0
|
|
$
|
289.0
|
|
$
|
16.6
|
|
$
|
1,047.6
|
|
$
|
(118.3
|
)
|
$
|
929.3
|
|
|||||
Floaters
During 2018, revenues
declined
by
$130.0 million
, or
11%
, as compared to the prior year primarily due to lower average day rates resulting from the expiration of above-market, older contracts that were replaced with new market-rate contracts and sale of ENSCO 6001. The decline was partially offset by the addition of Atwood rigs to the fleet and the commencement of ENSCO DS-10 drilling operations.
Contract drilling expense
increased
by
$113.2 million
, or
18%
, as compared to the prior year primarily due to the addition of Atwood rigs to the fleet and commencement of ENSCO DS-10 drilling operations. This increase was partially offset by the sale of ENSCO 6001, lower rig reactivation costs and costs incurred in the prior year to settle a previously disclosed legal contingency.
Depreciation expense
increased
by
$14.4 million
, or
5%
, compared to the prior year primarily due to the addition of Atwood rigs and commencement of ENSCO DS-10 drilling operations. The increase was partially offset by lower depreciation expense on non-core assets that were impaired to scrap value during the fourth quarter of 2017.
During 2017, excluding the impact of ENSCO DS-9 and ENSCO 8503 lump-sum termination payments totaling
$205.0 million
received during 2016, revenues
declined
by
$422.6 million
, or
27%
. The decline was primarily due to fewer days under contract across our fleet, sale of ENSCO 6003 and ENSCO 6004 and lower average day rates. The decline in revenues was partially offset by the reactivation of ENSCO DS-4 and the addition of Atwood rigs to the fleet.
Contract drilling expense
declined
by
$100.8 million
, or
14%
, as compared to the prior year primarily due to rig stackings, sale of ENSCO 6004 and ENSCO 6003 and other cost control initiatives that reduced personnel costs and other daily rig operating expenses. This decline was partially offset by the addition of Atwood rigs to the fleet, rig reactivation costs and ENSCO DS-4 contract drilling expense.
Depreciation expense
declined
by
$6.7 million
, or
2%
, as compared to the prior year primarily due to the extension of useful lives for certain contracted rigs, partially offset by the addition of Atwood rigs.
Jackups
During 2018, revenues
declined
by
$9.4 million
, or
1%
, as compared to the prior year primarily due to the sale of ENSCO 52 and ENSCO 80 and lower average day rates across the fleet. These declines were partially offset by more days under contract across the fleet, the commencement of ENSCO 140 and ENSCO 141 and addition of Atwood rigs to the fleet.
Contract drilling expense
increased
by
$14.4 million
, or
3%
, as compared to the prior year primarily due to more days under contract across the fleet, the addition of Atwood rigs and contract commencements for ENSCO 140
65
and ENSCO 141. These increases were partially offset by lower rig reactivation costs and the sale of ENSCO 52 and ENSCO 80.
Depreciation expense
increased
by
$21.8 million
, or
17%
, as compared to the prior year primarily due to the addition of Atwood rigs and ENSCO 140 and ENSCO 141 to the fleet. The increase was partially offset by lower depreciation expense on a non-core rig that was impaired to scrap value during the fourth quarter of 2017.
During 2017, revenues
declined
by
$289.2 million
, or
31%
, as compared to the prior year. The decline was primarily due to lower average day rates, fewer days under contract across our fleet, additional shipyard days and sale of ENSCO 53 and ENSCO 52.
Contract drilling expense
declined
by
$4.7 million
, or
1%
, as compared to the prior year due to the sale of ENSCO 94, ENSCO 53, ENSCO 52 and ENSCO 56 and other cost control initiatives that reduced personnel costs and other daily rig operating expenses. This decline was partially offset by rigs that were stacked in 2016 which operated in 2017 and related rig reactivation costs.
Depreciation expense
increased
by
$7.8 million
, or
6%
, as compared to the prior year primarily due to the addition of Atwood rigs, partially offset by the extension of useful lives for certain contracted rigs.
Impairment of Long-Lived Assets
See Note 5 to our consolidated financial statements included in "Item 8. Financial Statements and Supplementary Data" for information on impairment of long-lived assets.
Other Income (Expense), Net
The following table summarizes other income (expense), net, for each of the years in the three-year period ended
December 31, 2018
(in millions):
|
2018
|
2017
|
2016
|
|||||||||
|
Interest income
|
$
|
14.5
|
|
$
|
25.8
|
|
$
|
13.8
|
|
||
|
Interest expense, net:
|
|||||||||||
|
Interest expense
|
(345.3
|
)
|
(296.7
|
)
|
(274.5
|
)
|
|||||
|
Capitalized interest
|
62.6
|
|
72.5
|
|
45.7
|
|
|||||
|
|
(282.7
|
)
|
(224.2
|
)
|
(228.8
|
)
|
|||||
|
Other, net
|
(34.8
|
)
|
134.4
|
|
283.2
|
|
|||||
|
|
$
|
(303.0
|
)
|
$
|
(64.0
|
)
|
$
|
68.2
|
|
||
Interest income declined during 2018 and increased during 2017 as compared to the respective prior year periods as a result of corresponding changes in our average short-term investment balances.
Interest expense
increased
during 2018 by
$48.6 million
, or
16%
, as compared to the prior year due to the debt transactions we undertook during the first quarter of 2018. Interest expense increased during 2017 by
$22.2 million
, or
8%
, as compared to the prior year due to the issuance of convertible debt and exchange notes, partially offset by lower interest expense due to debt repurchases.
Interest expense capitalized
declined
during
2018
by
$9.9 million
, or
14%
, as compared to the prior year due to a decline in the amount of capital invested in newbuild construction, resulting from newbuild rigs placed into service. Interest expense capitalized during
2017
increased
$26.8 million
, or
59%
, as compared to the prior year due to an increase in the amount of capital invested in newbuild construction.
66
Other income (expense), net, during 2018 included a pre-tax loss of
$19.0 million
related to the repurchase and redemption of senior notes and foreign currency losses as discussed below. Other income (expense), net, included a gain on bargain purchase recognized in connection with the Atwood Merger of
$140.2 million
and pre-tax gains on debt extinguishment totaling
$287.8 million
during 2017 and 2016, respectively.
Our functional currency is the U.S. dollar, and a portion of the revenues earned and expenses incurred by certain of our subsidiaries are denominated in currencies other than the U.S. dollar. These transactions are remeasured in U.S. dollars based on a combination of both current and historical exchange rates. Net foreign currency exchange losses, inclusive of offsetting fair value derivatives, were
$17.2 million
,
$5.1 million
and
$6.0 million
, and were included in other, net, in our consolidated statements of operations for the years ended December 31,
2018, 2017 and 2016
, respectively. Net foreign currency exchange losses incurred during 2018 included
$5.8 million
,
$3.6 million
and
$2.0 million
related to Angolan kwanza, Brazilian reals and euros, respectively.
Net unrealized
losses
of
$700,000
and
gains
of
$4.5 million
and
$1.8 million
from marketable securities held in our supplemental executive retirement plans ("the SERP") were included in other, net, in our consolidated statements of operations for the years ended December 31,
2018, 2017 and 2016
, respectively. Information on the fair value measurement of our marketable securities held in the SERP is presented in Note 4 to our consolidated financial statements included in "Item 8. Financial Statements and Supplementary Data."
Provision for Income Taxes
Ensco plc, our parent company, is domiciled and resident in the U.K. Our subsidiaries conduct operations and earn income in numerous countries and are subject to the laws of taxing jurisdictions within those countries. The income of our non-U.K. subsidiaries is generally not subject to U.K. taxation. Income tax rates imposed in the tax jurisdictions in which our subsidiaries conduct operations vary, as does the tax base to which the rates are applied. In some cases, tax rates may be applicable to gross revenues, statutory or negotiated deemed profits or other bases utilized under local tax laws, rather than to net income.
Our drilling rigs frequently move from one taxing jurisdiction to another to perform contract drilling services. In some instances, the movement of drilling rigs among taxing jurisdictions will involve the transfer of ownership of the drilling rigs among our subsidiaries. As a result of frequent changes in the taxing jurisdictions in which our drilling rigs are operated and/or owned, changes in profitability levels and changes in tax laws, our annual effective income tax rate may vary substantially from one reporting period to another. In periods of declining profitability, our income tax expense may not decline proportionally with income, which could result in higher effective income tax rates. Further, we may continue to incur income tax expense in periods in which we operate at a loss.
U.S. Tax Reform
The U.S. Tax Cuts and Jobs Act (“U.S. tax reform”) was enacted on December 22, 2017 and introduced significant changes to U.S. income tax law, including a reduction in the statutory income tax rate from
35%
to
21%
effective January 1, 2018, a one-time transition tax on deemed repatriation of deferred foreign income, a base erosion anti-abuse tax that effectively imposes a minimum tax on certain payments to non-U.S. affiliates, new and revised rules relating to the current taxation of certain income of foreign subsidiaries and revised rules associated with limitations on the deduction of interest.
Due to the timing of the enactment of U.S. tax reform and the complexity involved in applying its provisions, we made reasonable estimates of its effects and recorded such amounts in our consolidated financial statements as of December 31, 2017 on a provisional basis. Throughout 2018, we continued to analyze applicable information and data, interpret rules and guidance issued by the U.S. Treasury Department and Internal Revenue Service, and make adjustments to the provisional amounts, as provided for in Staff Accounting Bulletin No. 118. The U.S. Treasury Department is expected to continue finalizing rules associated with U.S. tax reform during 2019 and, when issued, these rules may have a material impact on our consolidated financial statements.
67
During 2018, we recognized a tax benefit of
$11.7 million
associated with the one-time transition tax on deemed repatriation of the deferred foreign income of our U.S. subsidiaries. We recognized a net tax expense of
$16.5 million
during the fourth quarter of 2017 in connection with enactment of U.S. tax reform, consisting of a
$38.5 million
tax expense associated with the one-time transition tax on deemed repatriation of the deferred foreign income of our U.S. subsidiaries, a
$17.3 million
tax expense associated with revisions to rules over the taxation of income of foreign subsidiaries, a
$20.0 million
tax benefit resulting from the re-measurement of our deferred tax assets and liabilities as of December 31, 2017 to reflect the reduced tax rate and a
$19.3 million
tax benefit resulting from adjustments to the valuation allowance on deferred tax assets.
See Note 10 to our consolidated financial statements included in "Item 8. Financial Statements and Supplementary Data" for additional information.
Effective Tax Rate
During the years ended December 31,
2018, 2017 and 2016
, we recorded income tax expense of
$89.6 million
,
$109.2 million
and
$108.5 million
, respectively. Our consolidated effective income tax rates were
(16.6)%
,
(55.7)%
and
10.9%
during the same periods, respectively.
Our
2018
consolidated effective income tax rate includes the impact of various discrete tax items, including
$46.0 million
of tax benefit associated with the utilization of foreign tax credits subject to a valuation allowance, the transition tax on deemed repatriation of the deferred foreign income of our U.S. subsidiaries, and a restructuring transaction, partially offset by
$21.0 million
of tax expense related to recovery of certain costs associated with an ongoing legal matter, repurchase and redemption of senior notes and rig sales.
Our
2017
consolidated effective income tax rate includes
$32.2 million
associated with the impact of various discrete tax items, including
$16.5 million
of tax expense associated with U.S. tax reform and
$15.7 million
of tax expense associated with the exchange offers and debt repurchases, rig sales, a restructuring transaction, settlement of a previously disclosed legal contingency, the effective settlement of a liability for unrecognized tax benefits associated with a tax position taken in prior years and other resolutions of prior year tax matters.
Our
2016
consolidated effective income tax rate includes the impact of various discrete tax items, including a
$16.9 million
tax expense resulting from net gains on the repurchase of various debt during the year, the recognition of an
$8.4 million
net tax benefit relating to the sale of various rigs, a
$5.5 million
tax benefit resulting from a net reduction in the valuation allowance on U.S. foreign tax credits and a net
$5.3 million
tax benefit associated with liabilities for unrecognized tax benefits and other adjustments relating to prior years.
Excluding the impact of the aforementioned discrete tax items, our consolidated effective income tax rates for the years ended December 31,
2018
,
2017
and
2016
were
(24.8)%
,
(96.0)%
and
20.3%
, respectively. The changes in our consolidated effective income tax rate excluding discrete tax items during the three-year period result primarily from U.S. tax reform and changes in the relative components of our earnings from the various taxing jurisdictions in which our drilling rigs are operated and/or owned and differences in tax rates in such taxing jurisdictions.
Divestitures
Our business strategy has been to focus on ultra-deepwater floater and premium jackup operations and de-emphasize other assets and operations that are not part of our long-term strategic plan or that no longer meet our standards for economic returns. Consistent with this strategy, we sold
12
jackup rigs,
five
dynamically positioned semisubmersible rigs,
one
moored semisubmersible rig and
two
drillships during the three-year period ended
December 31, 2018
.
We continue to focus on our fleet management strategy in light of the composition of our rig fleet. As part of this strategy, we may act opportunistically from time to time to monetize assets to enhance shareholder value and improve our liquidity profile, in addition to selling or disposing of older, lower-specification or non-core rigs.
68
We sold the following rigs during the three-year period ended
December 31, 2018
(in millions):
|
Rig
|
Date of Sale
|
Classification
(1)
|
Segment
(1)
|
Net Proceeds
|
Net Book Value
(2)
|
Pre-tax Gain/(Loss)
|
||||||||||||
|
ENSCO 80
|
August 2018
|
Continuing
|
Jackups
|
$
|
1.0
|
|
$
|
.5
|
|
$
|
.5
|
|
||||||
|
ENSCO 5005
|
August 2018
|
Continuing
|
Floaters
|
4.0
|
|
2.0
|
|
2.0
|
|
|||||||||
|
ENSCO 6001
|
July 2018
|
Continuing
|
Floaters
|
2.0
|
|
.9
|
|
1.1
|
|
|||||||||
|
ENSCO 7500
|
April 2018
|
Discontinued
|
Floaters
|
2.6
|
|
1.5
|
|
1.1
|
|
|||||||||
|
ENSCO 81
|
April 2018
|
Continuing
|
Jackups
|
1.0
|
|
.3
|
|
.7
|
|
|||||||||
|
ENSCO 82
|
April 2018
|
Continuing
|
Jackups
|
1.0
|
|
.3
|
|
.7
|
|
|||||||||
|
ENSCO 52
|
August 2017
|
Continuing
|
Jackups
|
.8
|
|
.4
|
|
.4
|
|
|||||||||
|
ENSCO 86
|
June 2017
|
Continuing
|
Jackups
|
.3
|
|
.3
|
|
—
|
|
|||||||||
|
ENSCO 90
|
June 2017
|
Discontinued
|
Jackups
|
.3
|
|
.3
|
|
—
|
|
|||||||||
|
ENSCO 99
|
June 2017
|
Continuing
|
Jackups
|
.3
|
|
.3
|
|
—
|
|
|||||||||
|
ENSCO 56
|
April 2017
|
Continuing
|
Jackups
|
1.0
|
|
.3
|
|
.7
|
|
|||||||||
|
ENSCO 94
|
November 2016
|
Continuing
|
Jackups
|
.9
|
|
.3
|
|
.6
|
|
|||||||||
|
ENSCO 53
|
October 2016
|
Continuing
|
Jackups
|
.9
|
|
.3
|
|
.6
|
|
|||||||||
|
ENSCO DS-1
|
June 2016
|
Continuing
|
Floaters
|
5.0
|
|
2.3
|
|
2.7
|
|
|||||||||
|
ENSCO 6004
|
May 2016
|
Continuing
|
Floaters
|
.9
|
|
.9
|
|
—
|
|
|||||||||
|
ENSCO 6003
|
May 2016
|
Continuing
|
Floaters
|
.9
|
|
.9
|
|
—
|
|
|||||||||
|
ENSCO DS-2
|
May 2016
|
Discontinued
|
Floaters
|
5.0
|
|
4.0
|
|
1.0
|
|
|||||||||
|
ENSCO 91
|
May 2016
|
Continuing
|
Jackups
|
.8
|
|
.3
|
|
.5
|
|
|||||||||
|
ENSCO 58
|
April 2016
|
Discontinued
|
Jackups
|
.7
|
|
.3
|
|
.4
|
|
|||||||||
|
ENSCO 6000
|
April 2016
|
Discontinued
|
Floaters
|
.6
|
|
.8
|
|
(.2
|
)
|
|||||||||
|
|
$
|
30.0
|
|
$
|
17.2
|
|
$
|
12.8
|
|
|||||||||
|
(1)
|
Classification denotes the location of the operating results and gain (loss) on sale for each rig in our consolidated statements of operations. For rigs' operating results that were reclassified to discontinued operations in our consolidated statements of operations, these results were previously included within the specified operating segment.
|
|
(2)
|
Includes the rig's net book value as well as inventory and other assets on the date of the sale.
|
Discontinued Operations
Prior to 2015, individual rig disposals were classified as discontinued operations once the rigs met the criteria to be classified as held-for-sale. The operating results of the rigs through the date the rig was sold as well as the gain or loss on sale were included in results from discontinued operations, net, in our consolidated statement of operations. Net proceeds from the sales of the rigs were included in investing activities of discontinued operations in our consolidated statement of cash flows in the period in which the proceeds were received.
During 2015, we adopted the Financial Accounting Standards Board’s Accounting Standards Update 2014-08,
Presentation of Financial Statements
(
Topic 205
)
and Property, Plant, and Equipment
(
Topic 360
):
Reporting Discontinued Operations and Disclosures of Disposals of Components of an Entity
("
Update 2014-08
"). Under the revised guidance, only disposals representing a strategic shift in operations should be presented as discontinued operations. As a result, individual assets that are classified as held-for-sale beginning in 2015 are not reported as discontinued operations and their operating results and gain or loss on sale are included in continuing operations in our consolidated statements of operations.
69
The following table summarizes income (loss) from discontinued operations for each of the years in the three-year period ended
December 31, 2018
(in millions):
|
2018
|
2017
|
2016
|
||||||||||
|
Revenues
|
$
|
—
|
|
$
|
—
|
|
$
|
—
|
|
|||
|
Operating expenses
|
2.0
|
|
1.5
|
|
3.1
|
|
||||||
|
Operating loss
|
(2.0
|
)
|
(1.5
|
)
|
(3.1
|
)
|
||||||
|
Income tax expense (benefit)
|
7.1
|
|
(2.1
|
)
|
(10.1
|
)
|
||||||
|
Gain on disposal of discontinued operations, net
|
1.0
|
|
.4
|
|
1.1
|
|
||||||
|
Income (loss) from discontinued operations
|
$
|
(8.1
|
)
|
$
|
1.0
|
|
$
|
8.1
|
|
|||
Income tax expense (benefit) from discontinued operations for the years ended
December 31, 2018
,
2017
and
2016
included
$6.9 million
of discrete tax expense and
$2.1 million
and
$10.2 million
of discrete tax benefits, respectively.
Debt and interest expense are not allocated to our discontinued operations.
LIQUIDITY AND CAPITAL RESOURCES
We remain focused on our liquidity and over the past several years have executed a number of financing transactions to improve our financial position and manage our debt maturities. In recent periods, a substantial portion of our cash has been utilized to repurchase debt and invest in the expansion and enhancement of our fleet of drilling rigs through newbuild construction, acquisition and upgrade projects. We expect that our cash and short-term investments will primarily be used to fund capital expenditures and service our debt during 2019.
Based on our balance sheet, our contractual backlog and
$2.0 billion
available under our Credit Facility, we expect to fund our liquidity needs, including contractual obligations and anticipated capital expenditures, as well as working capital requirements, from cash and short-term investments and, if necessary, funds borrowed under our Credit Facility or other future financing arrangements, including available shipyard financing options for our two drillships under construction. We may rely on the issuance of debt and/or equity securities in the future to supplement our liquidity needs.
In January 2018, we issued
$1.0 billion
aggregate principal amount of unsecured
7.75%
senior notes due 2026 at par, net of debt issuance costs of
$16.5 million
. Net proceeds of
$983.5 million
from the 2026 Notes were partially used to fund the repurchase and redemption of
$237.6 million
principal amount of our 8.50% notes due 2019,
$328.0 million
principal amount of our 6.875% notes due 2020 and
$156.2 million
principal amount of our 4.70% notes due 2021. We recognized a pre-tax loss on debt extinguishment of
$19.0 million
during the first quarter of 2018.
During 2017, upon closing of the Atwood Merger, we utilized acquired cash of
$445.4 million
and cash on hand from the liquidation of short-term investments to repay Atwood's debt and accrued interest of
$1.3 billion
. We amended our credit facility upon closing to extend the final maturity date by two years. Previously, our Credit Facility had a borrowing capacity of $2.25 billion through September 2019 that declined to $1.13 billion through September 2020. Subsequent to the amendment, our borrowing capacity is
$2.0 billion
through September 2019 and declines to
$1.3 billion
through September 2020 and to
$1.2 billion
through September 2022. The Credit Facility, as amended, requires us to maintain a total debt to total capitalization ratio that is less than or equal to 60%.
During the three-year period ended
December 31, 2018
, our primary sources of cash were
$1.8 billion
in proceeds from the issuance of senior notes, an aggregate
$1.3 billion
generated from operating activities of continuing operations,
$850.9 million
from net maturities of short-term investments and
$585.5 million
in proceeds from an equity offering. Our primary uses of cash during the same period included
$2.2 billion
for the repurchase and redemption of outstanding debt,
$871.6 million
for the repayment of Atwood debt,
$1.3 billion
for the construction, enhancement
70
and other improvement of our drilling rigs, including
$980.7 million
invested in newbuild construction, and
$43.3 million
for dividend payments.
Explanations of our liquidity and capital resources for each of the years in the three-year period ended
December 31, 2018
are set forth below.
Cash Flows and Capital Expenditures
Our cash flows from operating activities of continuing operations and capital expenditures on continuing operations for each of the years in the three-year period ended
December 31, 2018
were as follows (in millions):
|
2018
|
2017
|
2016
|
||||||||||
|
Net cash provided by (used in) operating activities of continuing operations
|
$
|
(55.7
|
)
|
$
|
259.4
|
|
$
|
1,077.4
|
|
|||
|
Capital expenditures on continuing operations:
|
|
|
|
|
|
|
||||||
|
New rig construction
|
$
|
341.1
|
|
$
|
429.8
|
|
$
|
209.8
|
|
|||
|
Rig enhancements
|
45.2
|
|
45.1
|
|
15.9
|
|
||||||
|
Minor upgrades and improvements
|
40.4
|
|
61.8
|
|
96.5
|
|
||||||
|
|
$
|
426.7
|
|
$
|
536.7
|
|
$
|
322.2
|
|
|||
During
2018
, cash flows from continuing operations
declined
by
$315.1 million
, or
121%
, as compared to the prior year due primarily to declining margins and higher cash interest expense due to the debt financing transactions we undertook during the first quarter of 2018. As challenging industry conditions persist, and our remaining above-market contracts expire and utilization increases with the execution of new market-rate contracts, coupled with the potential impact of rig reactivation costs, our operating cash flows are expected to decline further and remain negative over the near-term.
During
2017
, excluding the impact of ENSCO DS-9 and ENSCO 8503 lump-sum termination payments totaling
$205.0 million
received during 2016, cash flows from continuing operations
declined
by
$613.0 million
, or
70%
, as compared to the prior year. The decline primarily resulted from a
$823.0 million
decline in cash receipts from contract drilling services, partially offset by a
$190.4 million
decline in cash payments related to contract drilling expenses and a
$65.0 million
decline in cash paid for interest, net of amounts capitalized.
We remain focused on our long-established strategy of high-grading and expanding the size of our fleet. During the three-year period ended
December 31, 2018
, we invested
$980.7 million
in the construction of new drilling rigs and an additional
$106.2 million
enhancing the capability and extending the useful lives of our existing fleet.
Based on our current projections, we expect capital expenditures during
2019
to include approximately
$160 million
for newbuild construction, approximately
$20 million
for rig enhancement projects and approximately
$50 million
for minor upgrades and improvements. Depending on market conditions and opportunities, we may make additional capital expenditures to upgrade rigs for customer requirements and construct or acquire additional rigs. Of the
$160 million
for newbuild construction, approximately
$100 million
relates to the final milestone payment and accrued interest thereon for ENSCO DS-13 which may, at our election, be converted to a promissory note bearing interest of 5.0% per annum due December 30, 2022.
Dividends
Our Board of Directors declared a
$0.01
quarterly cash dividend per Class A ordinary share for each quarter during
2018
. In October 2017, we amended our Credit Facility, which prohibits us from paying dividends in excess of
$0.01
per share per fiscal quarter. Dividends in excess of this amount would require the amendment or waiver of such provision. The declaration and amount of future dividends is at the discretion of our Board of Directors. In the future, our Board of Directors may, without advance notice, determine to reduce or suspend our dividend in order to
71
improve our financial flexibility and best position us for long-term success. When evaluating dividend payment timing and amounts, our Board of Directors considers several factors, including our profitability, liquidity, financial condition, market outlook, reinvestment opportunities, capital requirements and limitations under our Credit Facility.
Financing and Capital Resources
Our total debt, total capital and total debt to total capital ratios as of December 31,
2018, 2017 and 2016
are summarized below (in millions, except percentages):
|
2018
|
2017
|
2016
|
|||||||||
|
Total debt
|
$
|
5,010.4
|
|
$
|
4,750.7
|
|
$
|
5,274.5
|
|
||
|
Total capital
(1)
|
13,101.8
|
|
13,482.8
|
|
13,525.1
|
|
|||||
|
Total debt to total capital
|
38.2
|
%
|
35.2
|
%
|
39.0
|
%
|
|||||
|
(1)
|
Total capital consists of total debt and Ensco shareholders' equity.
|
During
2018
, our total debt increased by
$259.7 million
and total capital declined by
$381.0 million
, respectively. Our total debt increased as a result of the debt transactions we undertook during the first quarter of 2018 and our total capital declined as a result of our current period net loss, partially offset by the aforementioned increase in our total debt. This resulted in an increase of our total debt to total capital ratio from
35.2%
to
38.2%
.
During
2017
, our total debt and total capital declined by
$523.8 million
and
$42.3 million
, respectively. Our total debt declined as a result of debt repurchased during the year and our total capital declined as a result of the net loss incurred during the period and the aforementioned reduction in total debt, partially offset by the equity issued in connection with the Atwood Merger. This resulted in a decline of our total debt to total capital ratio from
39.0%
to
35.2%
.
Convertible Senior Notes
In December 2016, Ensco Jersey Finance Limited, a wholly-owned subsidiary of Ensco plc, issued
$849.5 million
aggregate principal amount of unsecured
2024
Convertible Notes in a private offering. The 2024 Convertible Notes are fully and unconditionally guaranteed, on a senior, unsecured basis, by Ensco plc and are exchangeable into cash, our Class A ordinary shares or a combination thereof, at our election. Interest on the 2024 Convertible Notes is payable semiannually on January 31 and July 31 of each year. The 2024 Convertible Notes will mature on January 31, 2024, unless exchanged, redeemed or repurchased in accordance with their terms prior to such date. Holders may exchange their 2024 Convertible Notes at their option any time prior to July 31, 2023 only under certain circumstances set forth in the indenture governing the 2024 Convertible Notes. On or after July 31, 2023, holders may exchange their 2024 Convertible Notes at any time. The exchange rate is
71.3343
shares per
$1,000
principal amount of notes, representing an exchange price of
$14.02
per share, and is subject to adjustment upon certain events. The 2024 Convertible Notes may not be redeemed by us except in the event of certain tax law changes.
The indenture governing the 2024 Convertible Notes contains customary events of default, including failure to pay principal or interest on such notes when due, among others. The indenture also contains certain restrictions, including, among others, restrictions on our ability and the ability of our subsidiaries to create or incur secured indebtedness, enter into certain sale/leaseback transactions and enter into certain merger or consolidation transactions. See Note 6 to our consolidated financial statements included in "Item 8. Financial Statements and Supplementary Data" for additional information on our 2024 Convertible Notes.
72
Senior Notes
On January 26, 2018, we issued
$1.0 billion
aggregate principal amount of unsecured
7.75%
senior notes due 2026 at par, net of
$16.5 million
in debt issuance costs. Interest on the 2026 Notes is payable semiannually on February 1 and August 1 of each year.
During 2017, we exchanged
$332.0 million
aggregate principal amount of unsecured
8.00%
senior notes due
2024
(the “8% 2024 Notes”) for certain amounts of our outstanding senior notes due 2019, 2020 and 2021. Interest on the 8% 2024 Notes is payable semiannually on January 31 and July 31 of each year.
During 2015, we issued
$700.0 million
aggregate principal amount of unsecured
5.20%
senior notes due
2025
(the “2025 Notes”) at a discount of
$2.6 million
and
$400.0 million
aggregate principal amount of unsecured
5.75%
senior notes due
2044
(the “New 2044 Notes”) at a discount of
$18.7 million
in a public offering. Interest on the 2025 Notes is payable semiannually on March 15 and September 15 of each year. Interest on the New 2044 Notes is payable semiannually on April 1 and October 1 of each year.
During 2014, we issued
$625.0 million
aggregate principal amount of unsecured
4.50%
senior notes due
2024
(the "2024 Notes") at a discount of
$850,000
and
$625.0 million
aggregate principal amount of unsecured
5.75%
senior notes due
2044
(the "Existing 2044 Notes" and together with the New 2044 Notes, the "2044 Notes") at a discount of
$2.8 million
. Interest on the 2024 Notes and the Existing 2044 Notes is payable semiannually on April 1 and October 1 of each year. The Existing 2044 Notes and the New 2044 Notes are treated as a single series of debt securities under the indenture governing the notes.
During 2011, we issued
$1.5 billion
aggregate principal amount of unsecured
4.70%
senior notes due
2021
(the “2021 Notes”) at a discount of
$29.6 million
in a public offering. Interest on the 2021 Notes is payable semiannually on March 15 and September 15 of each year.
Upon consummation of our acquisition of Pride International LLC ("Pride") during 2011, we assumed outstanding debt comprised of
$900.0 million
aggregate principal amount of unsecured
6.875%
senior notes due
2020
,
$500.0 million
aggregate principal amount of unsecured
8.5%
senior notes due
2019
and
$300.0 million
aggregate principal amount of unsecured
7.875%
senior notes due
2040
(collectively, the "Acquired Notes" and together with the 2021 Notes, 8% 2024 Notes, 2024 Notes, 2025 Notes, 2026 Notes and 2044 Notes, the "Senior Notes"). Ensco plc has fully and unconditionally guaranteed the performance of all Pride obligations with respect to the Acquired Notes. See "
Note 15 - Guarantee of Registered Securities
" for additional information on the guarantee of the Acquired Notes.
We may redeem the 8% 2024 Notes, 2024 Notes, 2025 Notes, 2026 Notes and 2044 Notes in whole at any time, or in part from time to time, prior to maturity. If we elect to redeem the 8% 2024 Notes, 2024 Notes, 2025 Notes and 2026 Notes before the date that is three months prior to the maturity date or the 2044 Notes before the date that is six months prior to the maturity date, we will pay an amount equal to
100%
of the principal amount of the notes redeemed plus accrued and unpaid interest and a "make-whole" premium. If we elect to redeem the 8% 2024 Notes, 2024 Notes, 2025 Notes, 2026 Notes or 2044 Notes on or after the aforementioned dates, we will pay an amount equal to
100%
of the principal amount of the notes redeemed plus accrued and unpaid interest, but we are not required to pay a "make-whole" premium.
We may redeem each series of the 2021 Notes and the Acquired Notes, in whole or in part, at any time at a price equal to
100%
of their principal amount, plus accrued and unpaid interest and a "make-whole" premium.
The indentures governing the Senior Notes contain customary events of default, including failure to pay principal or interest on such notes when due, among others. The indentures governing the Senior Notes also contain certain restrictions, including, among others, restrictions on our ability and the ability of our subsidiaries to create or incur secured indebtedness, enter into certain sale/leaseback transactions and enter into certain merger or consolidation transactions.
73
Debentures Due 2027
During 1997, Ensco International Incorporated issued
$150.0 million
of unsecured
7.20%
Debentures due
2027
(the "Debentures"). Interest on the Debentures is payable semiannually on May 15 and November 15 of each year. We may redeem the Debentures, in whole or in part, at any time prior to maturity, at a price equal to
100%
of their principal amount, plus accrued and unpaid interest and a "make-whole" premium. During 2009, Ensco plc entered into a supplemental indenture to unconditionally guarantee the principal and interest payments on the Debentures. See "
Note 15 - Guarantee of Registered Securities
" for additional information on the guarantee of the Debentures.
The Debentures and the indenture pursuant to which the Debentures were issued also contain customary events of default, including failure to pay principal or interest on the Debentures when due, among others. The indenture also contains certain restrictions, including, among others, restrictions on our ability and the ability of our subsidiaries to create or incur secured indebtedness, enter into certain sale/leaseback transactions and enter into certain merger or consolidation transactions.
Tender Offers, Redemptions and Open Market Repurchases
Concurrent with the issuance of the 2026 Notes in January 2018, we launched cash tender offers for up to
$985.0 million
aggregate principal amount of certain series of our senior notes issued by us and Pride, our wholly-owned subsidiary. The tender offers expired February 7, 2018, and we repurchased
$182.6 million
of our 8.50% senior notes due 2019,
$256.6 million
of our 6.875% senior notes due 2020 and
$156.2 million
of our 4.70% senior notes due 2021. Subsequently, we issued a redemption notice for the remaining outstanding
$55.0 million
principal amount of the 8.50% senior notes due 2019 and repurchased
$71.4 million
principal amount of our senior notes due 2020. As a result of these transactions, we recognized a pre-tax loss from debt extinguishment of
$19.0 million
, net of discounts, premiums, debt issuance costs and commissions during the first quarter of 2018.
During 2017, we repurchased
$194.1 million
of our outstanding senior notes on the open market for an aggregate purchase price of
$204.5 million
with cash on hand and recognized an insignificant pre-tax gain, net of discounts, premiums and debt issuance costs.
Our tender offers and open market repurchases during the two-year period ended
December 31, 2018
are summarized in the following tables (in millions):
Year Ended December 31, 2018
|
Aggregate Principal Amount Repurchased
|
Aggregate Repurchase Price
(1)
|
||||||
|
8.50% Senior notes due 2019
|
$
|
237.6
|
|
$
|
256.8
|
|
|
|
6.875% Senior notes due 2020
|
328.0
|
|
354.7
|
|
|||
|
4.70% Senior notes due 2021
|
156.2
|
|
159.7
|
|
|||
|
Total
|
$
|
721.8
|
|
$
|
771.2
|
|
|
74
Year Ended December 31, 2017
|
Aggregate Principal Amount Repurchased
|
Aggregate Repurchase Price
(1)
|
||||||
|
8.50% Senior notes due 2019
|
$
|
54.6
|
|
$
|
60.1
|
|
|
|
6.875% Senior notes due 2020
|
100.1
|
|
105.1
|
|
|||
|
4.70% Senior notes due 2021
|
39.4
|
|
39.3
|
|
|||
|
Total
|
$
|
194.1
|
|
$
|
204.5
|
|
|
|
(1)
|
Excludes accrued interest paid to holders of the repurchased senior notes.
|
Exchange Offers
During 2017, we completed exchange offers to exchange our outstanding
2019
Notes,
2020
Notes and
2021
Notes for the
8%
2024
Notes and cash. The exchange offers resulted in the tender of
$649.5 million
aggregate principal amount of our outstanding notes that were settled and exchanged as follows (in millions):
|
Aggregate Principal Amount Repurchased
|
8% Senior Notes Due 2024 Consideration
|
Cash
Consideration |
Total Consideration
|
||||||||||||
|
8.50% Senior notes due 2019
|
$
|
145.8
|
|
$
|
81.6
|
|
$
|
81.7
|
|
$
|
163.3
|
|
|||
|
6.875% Senior notes due 2020
|
129.8
|
|
69.3
|
|
69.4
|
|
138.7
|
|
|||||||
|
4.70% Senior notes due 2021
|
373.9
|
|
181.1
|
|
181.4
|
|
362.5
|
|
|||||||
|
Total
|
$
|
649.5
|
|
$
|
332.0
|
|
$
|
332.5
|
|
$
|
664.5
|
|
|||
During the year ended December 31, 2017, we recognized a pre-tax loss on the exchange offers of approximately
$6.2 million
, consisting of a loss of
$3.5 million
that includes the write-off of premiums on tendered debt and
$2.7 million
of transaction costs.
Debt to Equity Exchange
During 2016, we entered into a privately-negotiated exchange agreement whereby we issued
1,822,432
Class A ordinary shares, representing less than one percent of our outstanding shares, in exchange for
$24.5 million
principal amount of our 2044 Notes, resulting in a pre-tax gain from debt extinguishment of
$8.8 million
.
Revolving Credit
In October 2017, we amended our revolving credit facility ("Credit Facility") to extend the final maturity date by two years. Previously, our Credit Facility had a borrowing capacity of
$2.25 billion
through September 2019 that declined to
$1.13 billion
through September 2020. Subsequent to the amendment, our borrowing capacity is
$2.0 billion
through September 2019 and declines to
$1.3 billion
through September 2020 and to
$1.2 billion
through September 2022. The credit agreement governing our Credit Facility includes an accordion feature allowing us to increase the commitments expiring in September 2022 up to an aggregate amount not to exceed
$1.5 billion
.
Advances under the Credit Facility bear interest at Base Rate or LIBOR plus an applicable margin rate, depending on our credit ratings. We are required to pay a quarterly commitment fee on the undrawn portion of the
$2.0 billion
commitment, which is also based on our credit ratings.
75
In January 2018, Moody's downgraded our senior unsecured bond credit rating from B2 to B3. The rating actions resulted in an increase to the interest rates applicable to our borrowings and the quarterly commitment fee on the undrawn portion of the
$2.0 billion
commitment. The applicable margin rates are
3.00%
per annum for Base Rate advances and
4.00%
per annum for LIBOR advances. The quarterly commitment fee is
0.75%
per annum on the undrawn portion of the
$2.0 billion
commitment.
The Credit Facility requires us to maintain a total debt to total capitalization ratio that is less than or equal to
60%
and to provide guarantees from certain of our rig-owning subsidiaries sufficient to meet certain guarantee coverage ratios. The Credit Facility also contains customary restrictive covenants, including, among others, prohibitions on creating, incurring or assuming certain debt and liens (subject to customary exceptions, including a permitted lien basket that permits us to raise secured debt up to the lesser of
$750 million
or
10%
of consolidated tangible net worth (as defined in the Credit Facility)); entering into certain merger arrangements; selling, leasing, transferring or otherwise disposing of all or substantially all of our assets; making a material change in the nature of the business; paying or distributing dividends on our ordinary shares (subject to certain exceptions, including the ability to continue paying a quarterly dividend of
$0.01
per share); borrowings, if after giving effect to any such borrowings and the application of the proceeds thereof, the aggregate amount of available cash (as defined in the Credit Facility) would exceed
$150 million
; and entering into certain transactions with affiliates.
The Credit Facility also includes a covenant restricting our ability to repay indebtedness maturing after September 2022, which is the final maturity date of our Credit Facility. This covenant is subject to certain exceptions that permit us to manage our balance sheet, including the ability to make repayments of indebtedness (i) of acquired companies within
90 days
of the completion of the acquisition or (ii) if, after giving effect to such repayments, available cash is greater than
$250 million
and there are no amounts outstanding under the Credit Facility.
As of
December 31, 2018
, we were in compliance in all material respects with our covenants under the Credit Facility. We expect to remain in compliance with our Credit Facility covenants during
2019
. We had
no
amounts outstanding under the Credit Facility as of
December 31, 2018
and
2017
.
Our access to credit and capital markets depends on the credit ratings assigned to our debt. As a result of recent rating actions by credit rating agencies, we no longer maintain an investment-grade status. Our current credit ratings, and any additional actual or anticipated downgrades in our credit ratings, could limit our available options when accessing credit and capital markets, or when restructuring or refinancing our debt. In addition, future financings or refinancings may result in higher borrowing costs and require more restrictive terms and covenants, which may further restrict our operations.
76
Maturities
The descriptions of our senior notes above reflect the original principal amounts issued, which have subsequently changed as a result of our tenders, repurchases, exchanges, redemptions and new debt issuances such that the maturities of our debt were as follows (in millions):
|
Senior Notes
|
Original Principal
|
2016 Tenders, Repurchases and Equity Exchange
|
2017 Exchange Offers Repurchases
|
2018 Tender Offers, Redemption and Debt Issuance
|
Remaining Principal
|
||||||||||||||
|
8.50% due 2019
|
$
|
500.0
|
|
$
|
(62.0
|
)
|
$
|
(200.4
|
)
|
$
|
(237.6
|
)
|
$
|
—
|
|
||||
|
6.875% due 2020
|
900.0
|
|
(219.2
|
)
|
(229.9
|
)
|
(328.0
|
)
|
122.9
|
|
|||||||||
|
4.70% due 2021
|
1,500.0
|
|
(817.0
|
)
|
(413.3
|
)
|
(156.2
|
)
|
113.5
|
|
|||||||||
|
3.00% Exchangeable senior notes due 2024
|
849.5
|
|
—
|
|
—
|
|
—
|
|
849.5
|
|
|||||||||
|
4.50% due 2024
|
625.0
|
|
(1.7
|
)
|
—
|
|
—
|
|
623.3
|
|
|||||||||
|
8.00% due 2024
|
—
|
|
—
|
|
332.0
|
|
—
|
|
332.0
|
|
|||||||||
|
5.20% due 2025
|
700.0
|
|
(30.7
|
)
|
—
|
|
—
|
|
669.3
|
|
|||||||||
|
7.75% due 2026
|
—
|
|
—
|
|
—
|
|
1,000.0
|
|
1,000.0
|
|
|||||||||
|
7.20% due 2027
|
150.0
|
|
—
|
|
—
|
|
—
|
|
150.0
|
|
|||||||||
|
7.875% due 2040
|
300.0
|
|
—
|
|
—
|
|
—
|
|
300.0
|
|
|||||||||
|
5.75% due 2044
|
1,025.0
|
|
(24.5
|
)
|
—
|
|
—
|
|
1,000.5
|
|
|||||||||
|
Total
|
$
|
6,549.5
|
|
$
|
(1,155.1
|
)
|
$
|
(511.6
|
)
|
$
|
278.2
|
|
$
|
5,161.0
|
|
||||
Other Financing
We filed an automatically effective shelf registration statement on Form S-3 with the U.S. Securities and Exchange Commission on November 21, 2017, which provides us the ability to issue debt securities, equity securities, guarantees and/or units of securities in one or more offerings. The registration statement expires in November 2020.
Our shareholders approved a new share repurchase program at our annual shareholder meeting held in May 2018. Subject to certain provisions under English law, including the requirement of Ensco plc to have sufficient distributable reserves, we may repurchase shares up to a maximum of
$500.0 million
in the aggregate from one or more financial intermediaries under the program, but in no case more than
65.0 million
shares. The program terminates in May 2023. Our prior share repurchase program approved by our shareholders in 2013, under which we could repurchase up to a maximum of
$2.0 billion
in the aggregate, not to exceed
35.0 million
shares, expired in May 2018. As of
December 31, 2018
, there had been
no
share repurchases under this program. In October 2017, we amended our Credit Facility, which prohibits us from repurchasing our shares, except in certain limited circumstances. Any share repurchases, outside of such limited circumstances, would require the amendment or waiver of such provision.
From time to time, we and our affiliates may repurchase our outstanding senior notes in the open market, in privately negotiated transactions, through tender offers, exchange offers or otherwise, or we may redeem senior notes, pursuant to their terms. In connection with any exchange, we may issue equity, issue new debt and/or pay cash consideration. Any future repurchases, exchanges or redemptions will depend on various factors existing at that time. There can be no assurance as to which, if any, of these alternatives (or combinations thereof) we may choose to pursue in the future. There can be no assurance that an active trading market will exist for our outstanding senior notes following any such transaction.
77
Contractual Obligations
We have various contractual commitments related to our new rig construction and rig enhancement agreements, long-term debt and operating leases. We expect to fund these commitments from existing cash and short-term investments and, if necessary, funds borrowed under our Credit Facility or other future financing arrangements, including available shipyard financing options for our two drillships under construction. The actual timing of our new rig construction and rig enhancement payments may vary based on the completion of various milestones, which are beyond our control. The following table summarizes our significant contractual obligations as of
December 31, 2018
and the periods in which such obligations are due (in millions):
|
|
Payments due by period
|
||||||||||||||||||
|
2019
|
2020 and 2021
|
2022 and 2023
|
Thereafter
|
Total
|
|||||||||||||||
|
Principal payments on long-term debt
|
$
|
—
|
|
$
|
236.4
|
|
$
|
—
|
|
$
|
4,924.6
|
|
$
|
5,161.0
|
|
||||
|
Interest payments on long-term debt
|
298.1
|
|
585.2
|
|
568.7
|
|
1,953.0
|
|
3,405.0
|
|
|||||||||
|
New rig construction agreements
(1) (2)
|
92.9
|
|
165.0
|
|
—
|
|
—
|
|
257.9
|
|
|||||||||
|
Operating leases
|
32.3
|
|
30.6
|
|
18.1
|
|
15.2
|
|
96.2
|
|
|||||||||
|
Total contractual obligations
(3)
|
$
|
423.3
|
|
$
|
1,017.2
|
|
$
|
586.8
|
|
$
|
6,892.8
|
|
$
|
8,920.1
|
|
||||
|
(1)
|
The remaining milestone payments for ENSCO DS-13 and ENSCO DS-14 bear interest at a rate of 4.5% per annum, which accrues during the holding period until delivery. Delivery is scheduled for September 2019 and June 2020 for ENSCO DS-13 and ENSCO DS-14, respectively. Upon delivery, the remaining milestone payments and accrued interest thereon may be financed through a promissory note with the shipyard for each rig. The promissory notes will bear interest at a rate of 5.0% per annum with a maturity date of December 30, 2022 and will be secured by a mortgage on each respective rig. The remaining milestone payments for ENSCO DS-13 and ENSCO DS-14 are included in the table above in the period in which we expect to take delivery of the rig. However, we may elect to execute the promissory notes and defer payment until December 2022.
|
|
(2)
|
Total commitments are based on fixed-price shipyard construction contracts, exclusive of our internal costs associated with project management, commissioning and systems integration testing. Total commitments also exclude holding costs and interest.
|
a
|
(3)
|
Contractual obligations do not include
$177.0 million
of unrecognized tax benefits, inclusive of interest and penalties, included on our consolidated balance sheet as of
December 31, 2018
. We are unable to specify with certainty the future periods in which we may be obligated to settle such amounts.
|
Other Commitments
We have other commitments that we are contractually obligated to fulfill with cash under certain circumstances. These commitments include letters of credit to guarantee our performance as it relates to our drilling contracts, contract bidding, customs duties, tax appeals and other obligations in various jurisdictions. Obligations under these letters of credit are not normally called, as we typically comply with the underlying performance requirement. As of
December 31, 2018
, we had not been required to make collateral deposits with respect to these agreements. The following table summarizes our other commitments as of
December 31, 2018
(in millions):
|
Commitment expiration by period
|
|||||||||||||||||||
|
2019
|
2020 and 2021
|
|
2022 and 2023
|
Thereafter
|
Total
|
||||||||||||||
|
Letters of credit
|
$
|
105.4
|
|
$
|
14.7
|
|
$
|
—
|
|
$
|
6.2
|
|
$
|
126.3
|
|
||||
78
Liquidity
Our liquidity position as of December 31,
2018, 2017 and 2016
is summarized below (in millions, except ratios):
|
2018
|
2017
|
2016
|
|||||||||
|
Cash and cash equivalents
|
$
|
275.1
|
|
$
|
445.4
|
|
$
|
1,159.7
|
|
||
|
Short-term investments
|
329.0
|
|
440.0
|
|
50.0
|
|
|||||
|
Working capital
|
781.2
|
|
853.5
|
|
2,424.9
|
|
|||||
|
Current ratio
|
2.5
|
|
2.1
|
|
3.8
|
|
|||||
We expect to fund our liquidity needs, including contractual obligations and anticipated capital expenditures, as well as working capital requirements, from our cash and short-term investments, and, if necessary, funds borrowed under the Credit Facility or future financing arrangements, including available shipyard financing options for our two drillships under construction. We may rely on the issuance of debt or equity securities in the future to supplement our liquidity needs.
Notwithstanding our current liquidity position, if we experience significant further deterioration in demand for offshore drilling, our ability to maintain a sufficient level of liquidity to meet our financial obligations could be materially and adversely impacted. Further, our access to credit and capital markets depends on the credit ratings assigned to our debt by independent credit rating agencies. Our credit rating is no longer investment-grade. Our current credit ratings, and any additional actual or anticipated downgrades in our credit ratings, could limit our ability to access credit and capital markets, or to restructure or refinance our indebtedness. In addition, future financings or refinancings may result in higher borrowing costs and require more restrictive terms and covenants, which may further restrict our operations.
Effects of Climate Change and Climate Change Regulation
Greenhouse gas (“GHG”) emissions have increasingly become the subject of international, national, regional, state and local attention. At the December 2015 Conference of the Parties to the United Nations Framework Convention on Climate Change held in Paris, an agreement was reached that requires countries to review and “represent a progression” in their intended nationally determined contributions to the reduction of GHG emissions, setting GHG emission reduction goals every five years beginning in 2020. This agreement, known as the Paris Agreement, entered into force on November 4, 2016 and, as of February 2019, had been ratified by 187 of the 197 parties to the United Nations Framework Convention on Climate Change, including the United Kingdom, the United States and the majority of the other countries in which we operate. However, on August 4, 2017, the United States formally communicated to the United Nations its intent to withdraw from participation in the Paris Agreement. Nevertheless, pursuant to the agreement, withdrawal cannot officially occur earlier than November 4, 2020, four years after the agreement entered into force. In response to the announced withdrawal plan, a number of state and local governments in the United States have expressed intentions to take GHG-related actions by implementing their own programs to reduce GHG emissions. The United Nations Climate Change Conference held in Katowice, Poland in December 2018 adopted further rules regarding the implementation of the Paris Agreement and in connection with this conference numerous countries issued commitments to increase their GHG emission reduction targets.
In an effort to reduce GHG emissions, governments have implemented or considered legislative and regulatory mechanisms to institute carbon pricing mechanisms, such as the European Union’s Emission Trading System, and to impose technical requirements to reduce carbon emissions. The Companies Act 2006 (Strategic and Directors' Reports) Regulations 2013 now requires all quoted U.K. companies, including Ensco plc, to report their annual GHG emissions in the Company's directors' report.
79
During 2009, the United States Environmental Protection Agency (the “EPA”) officially published its findings that emissions of carbon dioxide, methane and other GHGs present an endangerment to human health and the environment because emissions of such gases are, according to the EPA, contributing to warming of the earth’s atmosphere and other climatic changes. These findings allowed the agency to proceed with the adoption and implementation of regulations to restrict GHG emissions under existing provisions of the Clean Air Act that establish permitting requirements, including emissions control technology requirements, for certain large stationary sources that are potential major sources of GHG emissions. These requirements for stationary sources took effect on January 2, 2011; however, in June 2014 the U.S. Supreme Court reversed a D.C. Circuit Court of Appeals decision upholding these rules and struck down the EPA’s greenhouse gas permitting rules to the extent they impose a requirement to obtain a federal air permit based solely on emissions of greenhouse gases. Large sources of other air pollutants, such as VOC or nitrogen oxides, could still be required to implement process or technology controls and obtain permits regarding emissions of greenhouse gases. The EPA has also adopted rules requiring annual monitoring and reporting of GHG emissions from specified sources in the U.S., including, among others, certain onshore and offshore oil and natural gas production facilities. Although a number of bills related to climate change have been introduced in the U.S. Congress in the past, comprehensive federal climate legislation has not yet been passed by Congress. If such legislation were to be adopted in the U.S., such legislation could adversely impact many industries. In the absence of federal legislation, almost half of the states have begun to address GHG emissions, primarily through the development or planned development of emission inventories or regional GHG cap and trade programs.
Future regulation of GHG emissions could occur pursuant to future treaty obligations, statutory or regulatory changes or new climate change legislation in the jurisdictions in which we operate. Depending on the particular program, we, or our customers, could be required to control GHG emissions or to purchase and surrender allowances for GHG emissions resulting from our operations. It is uncertain whether any of these initiatives will be implemented. If such initiatives are implemented, we do not believe that such initiatives would have a direct, material adverse effect on our financial condition, operating results and cash flows in a manner different than our competitors.
Restrictions on GHG emissions or other related legislative or regulatory enactments could have an indirect effect in those industries that use significant amounts of petroleum products, which could potentially result in a reduction in demand for petroleum products and, consequently, our offshore contract drilling services. We are currently unable to predict the manner or extent of any such effect. Furthermore, one of the long-term physical effects of climate change may be an increase in the severity and frequency of adverse weather conditions, such as hurricanes, which may increase our insurance costs or risk retention, limit insurance availability or reduce the areas in which, or the number of days during which, our customers would contract for our drilling rigs in general and in the Gulf of Mexico in particular. We are currently unable to predict the manner or extent of any such effect.
In addition, there have also been efforts in recent years to influence the investment community, including investment advisors and certain sovereign wealth, pension and endowment funds promoting divestment of fossil fuel equities and pressuring lenders to limit funding to companies engaged in the extraction of fossil fuel reserves. Such environmental activism and initiatives aimed at limiting climate change and reducing air pollution could ultimately interfere with our business activities and operations. Finally, increasing attention to the risks of climate change has resulted in an increased possibility of lawsuits brought by public and private entities against oil and gas companies in connection with their greenhouse gas emissions. Should we be targeted by any such litigation, we may incur liability, which, to the extent that societal pressures or political or other factors are involved, could be imposed without regard to the company’s causation of or contribution to the asserted damage, or to other mitigating factors.
80
MARKET RISK
We use derivatives to reduce our exposure to foreign currency exchange rate risk. Our functional currency is the U.S. dollar. As is customary in the oil and gas industry, a majority of our revenues and expenses are denominated in U.S. dollars; however, a portion of the revenues earned and expenses incurred by certain of our subsidiaries are denominated in currencies other than the U.S. dollar. We maintain a foreign currency exchange rate risk management strategy that utilizes derivatives to reduce our exposure to unanticipated fluctuations in earnings and cash flows caused by changes in foreign currency exchange rates.
We utilize cash flow hedges to hedge forecasted foreign currency denominated transactions, primarily to reduce our exposure to foreign currency exchange rate risk on future expected contract drilling expenses and capital expenditures denominated in various foreign currencies. We predominantly structure our drilling contracts in U.S. dollars, which significantly reduces the portion of our cash flows and assets denominated in foreign currencies. As of
December 31, 2018
, we had cash flow hedges outstanding to exchange an aggregate
$187.8 million
for various foreign currencies.
We have net assets and liabilities denominated in numerous foreign currencies and use various strategies to manage our exposure to changes in foreign currency exchange rates. We occasionally enter into derivatives that hedge the fair value of recognized foreign currency denominated assets or liabilities, thereby reducing exposure to earnings fluctuations caused by changes in foreign currency exchange rates. We do not designate such derivatives as hedging instruments. In these situations, a natural hedging relationship generally exists whereby changes in the fair value of the derivatives offset changes in the carrying value of the underlying hedged items. As of
December 31, 2018
, we held derivatives not designated as hedging instruments to exchange an aggregate
$175.7 million
for various foreign currencies.
If we were to incur a hypothetical 10% adverse change in foreign currency exchange rates, net unrealized losses associated with our foreign currency denominated assets and liabilities as of
December 31, 2018
would approximate
$17.3 million
. Approximately
$12.5 million
of these unrealized losses would be offset by corresponding gains on the derivatives utilized to offset changes in the fair value of net assets and liabilities denominated in foreign currencies.
We utilize derivatives and undertake foreign currency exchange rate hedging activities in accordance with our established policies for the management of market risk. We mitigate our credit risk relating to counterparties of our derivatives through a variety of techniques, including transacting with multiple, high-quality financial institutions, thereby limiting our exposure to individual counterparties and by entering into International Swaps and Derivatives Association, Inc. (“ISDA”) Master Agreements, which include provisions for a legally enforceable master netting agreement, with our derivative counterparties. The terms of the ISDA agreements may also include credit support requirements, cross default provisions, termination events or set-off provisions. Legally enforceable master netting agreements reduce credit risk by providing protection in bankruptcy in certain circumstances and generally permitting the closeout and netting of transactions with the same counterparty upon the occurrence of certain events.
We do not enter into derivatives for trading or other speculative purposes. We believe that our use of derivatives and related hedging activities reduces our exposure to foreign currency exchange rate risk and does not expose us to material credit risk or any other material market risk. All our derivatives mature during the next
18
months. See Note 7 to our consolidated financial statements included in "Item 8. Financial Statements and Supplementary Data" for additional information on our derivative instruments.
81
CRITICAL ACCOUNTING POLICIES AND ESTIMATES
The preparation of financial statements and related disclosures in conformity with accounting principles generally accepted in the United States of America requires us to make estimates, judgments and assumptions that affect the amounts reported in our consolidated financial statements and accompanying notes. Our significant accounting policies are included in Note 1 to our consolidated financial statements. These policies, along with our underlying judgments and assumptions made in their application, have a significant impact on our consolidated financial statements. We identify our critical accounting policies as those that are the most pervasive and important to the portrayal of our financial position and operating results and that require the most difficult, subjective and/or complex judgments regarding estimates in matters that are inherently uncertain. Our critical accounting policies are those related to property and equipment, impairment of long-lived assets and income taxes.
Property and Equipment
As of
December 31, 2018
, the carrying value of our property and equipment totaled
$12.6 billion
, which represented
90%
of total assets. This carrying value reflects the application of our property and equipment accounting policies, which incorporate our estimates, judgments and assumptions relative to the capitalized costs, useful lives and salvage values of our rigs.
We develop and apply property and equipment accounting policies that are designed to appropriately and consistently capitalize those costs incurred to enhance, improve and extend the useful lives of our assets and expense those costs incurred to repair or maintain the existing condition or useful lives of our assets. The development and application of such policies requires estimates, judgments and assumptions relative to the nature of, and benefits from, expenditures on our assets. We establish property and equipment accounting policies that are designed to depreciate our assets over their estimated useful lives. The judgments and assumptions used in determining the useful lives of our property and equipment reflect both historical experience and expectations regarding future operations, utilization and performance of our assets. The use of different estimates, judgments and assumptions in the establishment of our property and equipment accounting policies, especially those involving the useful lives of our rigs, would likely result in materially different asset carrying values and operating results.
The useful lives of our drilling rigs are difficult to estimate due to a variety of factors, including technological advances that impact the methods or cost of oil and natural gas exploration and development, changes in market or economic conditions and changes in laws or regulations affecting the drilling industry. We evaluate the remaining useful lives of our rigs on a periodic basis, considering operating condition, functional capability and market and economic factors.
Property and equipment held-for-sale is recorded at the lower of net book value or fair value less cost to sell.
During 2018, we recorded a pre-tax, non-cash loss on impairment of
$40.3 million
related to one older non-core jackup rig. We estimate the aforementioned impairment will cause a decline in depreciation expense of approximately
$13.1 million
for the year ended December 31, 2019.
Our fleet of
22
floater rigs, excluding
two
rigs under construction, represented
69%
of the gross cost and
70%
net carrying amount of our depreciable property and equipment as of
December 31, 2018
. Our floater rigs are depreciated over useful lives ranging from 10 to 35 years. Our fleet of
34
jackup rigs, excluding
one
rig under construction, represented
23%
of the gross cost and
21%
of the net carrying amount of our depreciable property and equipment as of
December 31, 2018
. Our jackup rigs are depreciated over useful lives ranging from 10 to 30 years.
82
The following table provides an analysis of estimated increases and decreases in depreciation expense from continuing operations that would have been recognized for the year ended
December 31, 2018
for various assumed changes in the useful lives of our drilling rigs effective January 1,
2018
:
|
Increase (decrease) in
useful lives of our
drilling rigs
|
Estimated (decrease) increase in
depreciation expense that would
have been recognized (in millions)
|
|
|
10%
|
$(38.6)
|
|
|
20%
|
(70.7)
|
|
|
(10%)
|
45.1
|
|
|
(20%)
|
101.7
|
|
Impairment of Long-Lived Assets
We recorded pre-tax, non-cash losses on impairment of long-lived assets of
$40.3 million
and
$182.9 million
during 2018 and 2017, respectively. See Note 5 to our consolidated financial statements included in "Item 8. Financial Statements and Supplementary Data" for additional information on our property and equipment.
We evaluate the carrying value of our property and equipment, primarily our drilling rigs, when events or changes in circumstances indicate that the carrying value of such rigs may not be recoverable. Generally, extended periods of idle time and/or inability to contract rigs at economical rates are an indication that a rig may be impaired. Impairment situations may arise with respect to specific individual rigs, groups of rigs, such as a specific type of drilling rig, or rigs in a certain geographic location.
For property and equipment used in our operations, recoverability generally is determined by comparing the carrying value of an asset to the expected undiscounted future cash flows of the asset. If the carrying value of an asset is not recoverable, the amount of impairment loss is measured as the difference between the carrying value of the asset and its estimated fair value. The determination of expected undiscounted cash flow amounts requires significant estimates, judgments and assumptions, including utilization levels, day rates, expense levels and capital requirements, as well as cash flows generated upon disposition, for each of our drilling rigs. Due to the inherent uncertainties associated with these estimates, we perform sensitivity analysis on key assumptions as part of our recoverability test.
Our judgments and assumptions about future cash flows to be generated by our drilling rigs are highly subjective and based on consideration of the following:
|
•
|
global macroeconomic and political environment,
|
|
•
|
historical utilization, day rate and operating expense trends by asset class,
|
|
•
|
regulatory requirements such as surveys, inspections and recertification of our rigs,
|
|
•
|
remaining useful lives of our rigs,
|
|
•
|
expectations on the use and eventual disposition of our rigs,
|
|
•
|
weighted-average cost of capital,
|
|
•
|
oil price projections,
|
|
•
|
sanctioned and unsanctioned offshore project data,
|
|
•
|
offshore economic project break-even data,
|
|
•
|
global rig supply and construction orders,
|
|
•
|
global rig fleet capabilities and relative rankings, and
|
|
•
|
expectations of global rig fleet attrition.
|
We collect and analyze the above information to develop a range of estimated utilization levels, day rates, expense levels and capital requirements, as well as estimated cash flows generated upon disposition. The most subjective assumptions that impact our impairment analyses include projections of future oil prices and timing of global rig fleet attrition, which, in large part, impact our estimates on timing and magnitude of recovery from the
83
current industry downturn. However, there are numerous judgments and assumptions unique to the projected future cash flows of each rig that individually, and in the aggregate, can significantly impact the recoverability of its carrying value.
The highly cyclical nature of our industry cannot be reasonably predicted with a high level of accuracy and therefore differences between our historical judgments and assumptions and actual results will occur. We reassess our judgments and assumptions in the period in which significant differences are observed and may conclude that a triggering event has occurred and perform a recoverability test. We recognized impairment charges during 2014, 2015, 2017 and 2018 upon observation of significant unexpected changes in our business climate and estimated useful lives of certain assets.
There are numerous factors underlying the highly cyclical nature of our industry that are reasonably likely to impact our judgments and assumptions including, but not limited to, the following:
|
•
|
changes in global economic conditions,
|
|
•
|
production levels of the Organization of Petroleum Exporting Countries (“OPEC”),
|
|
•
|
production levels of non-OPEC countries,
|
|
•
|
advances in exploration and development technology,
|
|
•
|
offshore and onshore project break-even economics,
|
|
•
|
development and exploitation of alternative fuels,
|
|
•
|
natural disasters or other operational hazards,
|
|
•
|
changes in relevant law and governmental regulations,
|
|
•
|
political instability and/or escalation of military actions in the areas we operate,
|
|
•
|
changes in the timing and rate of global newbuild rig construction, and
|
|
•
|
changes in the timing and rate of global rig fleet attrition.
|
There is a wide range of interrelated changes in our judgments and assumptions that could reasonably occur as a result of unexpected developments in the aforementioned factors, which could result in materially different carrying values for an individual rig, group of rigs or our entire rig fleet, materially impacting our operating results.
Income Taxes
We conduct operations and earn income in numerous countries and are subject to the laws of numerous tax jurisdictions. As of
December 31, 2018
, our consolidated balance sheet included a
$41.3 million
net deferred income tax
liability
, a
$24.8 million
liability for income taxes currently payable and a
$177.0 million
liability for unrecognized tax benefits, inclusive of interest and penalties.
The carrying values of deferred income tax assets and liabilities reflect the application of our income tax accounting policies and are based on estimates, judgments and assumptions regarding future operating results and levels of taxable income. Carryforwards and tax credits are assessed for realization as a reduction of future taxable income by using a more-likely-than-not determination. We do not offset deferred tax assets and deferred tax liabilities attributable to different tax paying jurisdictions.
We do not provide deferred taxes on the undistributed earnings of certain subsidiaries because our policy and intention is to reinvest such earnings indefinitely. Should we make a distribution from these subsidiaries in the form of dividends or otherwise, we may be subject to additional income taxes.
The carrying values of liabilities for income taxes currently payable and unrecognized tax benefits are based on our interpretation of applicable tax laws and incorporate estimates, judgments and assumptions regarding the use of tax planning strategies in various taxing jurisdictions. The use of different estimates, judgments and assumptions in connection with accounting for income taxes, especially those involving the deployment of tax planning strategies, may result in materially different carrying values of income tax assets and liabilities and operating results.
84
We operate in several jurisdictions where tax laws relating to the offshore drilling industry are not well developed. In jurisdictions where available statutory law and regulations are incomplete or underdeveloped, we obtain professional guidance and consider existing industry practices before utilizing tax planning strategies and meeting our tax obligations.
Tax returns are routinely subject to audit in most jurisdictions and tax liabilities occasionally are finalized through a negotiation process. In some jurisdictions, income tax payments may be required before a final income tax obligation is determined in order to avoid significant penalties and/or interest. While we historically have not experienced significant adjustments to previously recognized tax assets and liabilities as a result of finalizing tax returns, there can be no assurance that significant adjustments will not arise in the future. In addition, there are several factors that could cause the future level of uncertainty relating to our tax liabilities to increase, including the following:
|
•
|
During recent years, the number of tax jurisdictions in which we conduct operations has increased, and we currently anticipate that this trend will continue.
|
|
•
|
In order to utilize tax planning strategies and conduct operations efficiently, our subsidiaries frequently enter into transactions with affiliates that are generally subject to complex tax regulations and are frequently reviewed and challenged by tax authorities.
|
|
•
|
We may conduct future operations in certain tax jurisdictions where tax laws are not well developed, and it may be difficult to secure adequate professional guidance.
|
|
•
|
Tax laws, regulations, agreements, treaties and the administrative practices and precedents of tax authorities change frequently, requiring us to modify existing tax strategies to conform to such changes.
|
|
•
|
We recognized the impact of the enactment of U.S. tax reform during the fourth quarter of 2017 on a provisional basis. Throughout 2018, we continued to analyze applicable information and data, interpret rules and guidance issued by the U.S. Treasury Department and Internal Revenue Service, and make adjustments to the provisional amounts as provided for in Staff Accounting Bulletin No. 118. The U.S. Treasury Department is expected to continue finalizing rules associated with U.S. tax reform during 2019 and, when issued, these rules may have a material impact on our consolidated financial statements.
|
NEW ACCOUNTING PRONOUNCEMENTS
See Note 1 to our consolidated financial statements included in "Item 8. Financial Statements and Supplementary Data" for information on new accounting pronouncements.
Item 7A.
Quantitative and Qualitative Disclosures About Market Risk
Information required under Item 7A. has been incorporated into "Item 7. Management's Discussion and Analysis of Financial Condition and Results of Operations - Market Risk."
85
Item 8.
Financial Statements and Supplementary Data
MANAGEMENT'S REPORT ON INTERNAL CONTROL OVER FINANCIAL REPORTING
Our management is responsible for establishing and maintaining adequate internal control over financial reporting, as such term is defined in Exchange Act Rules 13a-15(f) or 15d-15(f). Our internal control over financial reporting system is designed to provide reasonable assurance as to the reliability of our financial reporting and the preparation and presentation of consolidated financial statements in accordance with accounting principles generally accepted in the United States, as well as to safeguard assets from unauthorized use or disposition. Because of its inherent limitations, internal control over financial reporting may not prevent or detect misstatements. Therefore, even those systems determined to be effective can provide only reasonable assurance with respect to financial statement preparation and presentation. Projections of any evaluation of effectiveness to future periods are subject to the risk that controls may become inadequate because of changes in conditions, or that the degree of compliance with the policies or procedures may deteriorate.
Under the supervision and with the participation of management, including the Chief Executive Officer and Chief Financial Officer, we have conducted an evaluation of the effectiveness of our internal control over financial reporting based on the criteria established in
Internal Control - Integrated Framework (2013)
issued by the Committee of Sponsoring Organizations of the Treadway Commission (COSO). Based on this evaluation, we have concluded that our internal control over financial reporting is effective as of
December 31, 2018
to provide reasonable assurance regarding the reliability of financial reporting and the preparation of financial statements for external purposes in accordance with generally accepted accounting principles.
KPMG LLP, the independent registered public accounting firm who audited our consolidated financial statements, has issued an audit report on our internal control over financial reporting. KPMG LLP's audit report on our internal control over financial reporting is included herein.
February 28, 2019
86
REPORT OF INDEPENDENT REGISTERED PUBLIC ACCOUNTING FIRM
To the Board of Directors and Shareholders
Ensco plc:
Opinion on the Consolidated Financial Statements
We have audited the accompanying consolidated balance sheets of Ensco plc and subsidiaries (the Company) as of
December 31, 2018
and
2017
, the related consolidated statements of operations, comprehensive income (loss), and cash flows for each of the years in the three‑year period ended
December 31, 2018
and the related notes (collectively, the “consolidated financial statements”). In our opinion, the consolidated financial statements present fairly, in all material respects, the financial position of the Company as of
December 31, 2018
and
2017
, and the results of its operations and its cash flows for each of the years in the three‑year period ended
December 31, 2018
, in conformity with U.S. generally accepted accounting principles.
We also have audited, in accordance with the standards of the Public Company Accounting Oversight Board (United States) (“PCAOB”), the Company’s internal control over financial reporting as of
December 31, 2018
, based on criteria established in Internal Control - Integrated Framework (2013) issued by the Committee of Sponsoring Organizations of the Treadway Commission, and our report dated
February 28, 2019
expressed an unqualified opinion on the effectiveness of the Company’s internal control over financial reporting.
Basis for Opinion
These consolidated financial statements are the responsibility of the Company’s management. Our responsibility is to express an opinion on these consolidated financial statements based on our audits. We are a public accounting firm registered with the PCAOB and are required to be independent with respect to the Company in accordance with the U.S. federal securities laws and the applicable rules and regulations of the Securities and Exchange Commission and the PCAOB.
We conducted our audits in accordance with the standards of the PCAOB. Those standards require that we plan and perform the audit to obtain reasonable assurance about whether the consolidated financial statements are free of material misstatement, whether due to error or fraud. Our audits included performing procedures to assess the risks of material misstatement of the consolidated financial statements, whether due to error or fraud, and performing procedures that respond to those risks. Such procedures included examining, on a test basis, evidence regarding the amounts and disclosures in the consolidated financial statements. Our audits also included evaluating the accounting principles used and significant estimates made by management, as well as evaluating the overall presentation of the consolidated financial statements. We believe that our audits provide a reasonable basis for our opinion.
/s/ KPMG LLP
We have served as the Company’s auditor since 2002.
Houston, Texas
February 28, 2019
87
REPORT OF INDEPENDENT REGISTERED PUBLIC ACCOUNTING FIRM
To the Board of Directors and Shareholders
Ensco plc:
Opinion on Internal Control Over Financial Reporting
We have audited Ensco plc and subsidiaries’ (the Company) internal control over financial reporting as of
December 31, 2018
, based on criteria established in
Internal Control - Integrated Framework (2013)
issued by the Committee of Sponsoring Organizations of the Treadway Commission. In our opinion, the Company maintained, in all material respects, effective internal control over financial reporting as of December 31, 2018, based on criteria established in
Internal Control - Integrated Framework (2013)
issued by the Committee of Sponsoring Organizations of the Treadway Commission.
We also have audited, in accordance with the standards of the Public Company Accounting Oversight Board (United States) (PCAOB), the consolidated balance sheets of the Company as of
December 31, 2018
and
2017
, the related consolidated statements of operations, comprehensive income (loss), and cash flows for each of the years in the three-year period ended December 31, 2018, and the related notes (collectively, the consolidated financial statements), and our report dated
February 28, 2019
expressed an unqualified opinion on those consolidated financial statements.
Basis for Opinion
The Company’s management is responsible for maintaining effective internal control over financial reporting and for its assessment of the effectiveness of internal control over financial reporting, included in the accompanying Management’s Report On Internal Control Over Financial Reporting. Our responsibility is to express an opinion on the Company’s internal control over financial reporting based on our audit. We are a public accounting firm registered with the PCAOB and are required to be independent with respect to the Company in accordance with the U.S. federal securities laws and the applicable rules and regulations of the Securities and Exchange Commission and the PCAOB.
We conducted our audit in accordance with the standards of the PCAOB. Those standards require that we plan and perform the audit to obtain reasonable assurance about whether effective internal control over financial reporting was maintained in all material respects. Our audit of internal control over financial reporting included obtaining an understanding of internal control over financial reporting, assessing the risk that a material weakness exists, and testing and evaluating the design and operating effectiveness of internal control based on the assessed risk. Our audit also included performing such other procedures as we considered necessary in the circumstances. We believe that our audit provides a reasonable basis for our opinion.
Definition and Limitations of Internal Control Over Financial Reporting
A company’s internal control over financial reporting is a process designed to provide reasonable assurance regarding the reliability of financial reporting and the preparation of financial statements for external purposes in accordance with generally accepted accounting principles. A company’s internal control over financial reporting includes those policies and procedures that (1) pertain to the maintenance of records that, in reasonable detail, accurately and fairly reflect the transactions and dispositions of the assets of the company; (2) provide reasonable assurance that transactions are recorded as necessary to permit preparation of financial statements in accordance with generally accepted accounting principles, and that receipts and expenditures of the company are being made only in accordance with authorizations of management and directors of the company; and (3) provide reasonable assurance regarding prevention or timely detection of unauthorized acquisition, use, or disposition of the company’s assets that could have a material effect on the financial statements.
Because of its inherent limitations, internal control over financial reporting may not prevent or detect misstatements. Also, projections of any evaluation of effectiveness to future periods are subject to the risk that controls may become inadequate because of changes in conditions, or that the degree of compliance with the policies or procedures may deteriorate.
/s/ KPMG LLP
Houston, Texas
February 28, 2019
88
ENSCO PLC AND SUBSIDIARIES
CONSOLIDATED STATEMENTS OF OPERATIONS
(in millions, except per share amounts)
|
|
Year Ended December 31,
|
||||||||||
|
2018
|
2017
|
2016
|
|||||||||
|
OPERATING REVENUES
|
$
|
1,705.4
|
|
$
|
1,843.0
|
|
$
|
2,776.4
|
|
||
|
OPERATING EXPENSES
|
|
|
|
|
|
|
|||||
|
Contract drilling (exclusive of depreciation)
|
1,319.4
|
|
1,189.5
|
|
1,301.0
|
|
|||||
|
Loss on impairment
|
40.3
|
|
182.9
|
|
—
|
|
|||||
|
Depreciation
|
478.9
|
|
444.8
|
|
445.3
|
|
|||||
|
General and administrative
|
102.7
|
|
157.8
|
|
100.8
|
|
|||||
|
|
1,941.3
|
|
1,975.0
|
|
1,847.1
|
|
|||||
|
OPERATING INCOME (LOSS)
|
(235.9
|
)
|
(132.0
|
)
|
929.3
|
|
|||||
|
OTHER INCOME (EXPENSE)
|
|
|
|
|
|
|
|||||
|
Interest income
|
14.5
|
|
25.8
|
|
13.8
|
|
|||||
|
Interest expense, net
|
(282.7
|
)
|
(224.2
|
)
|
(228.8
|
)
|
|||||
|
Other, net
|
(34.8
|
)
|
134.4
|
|
283.2
|
|
|||||
|
|
(303.0
|
)
|
(64.0
|
)
|
68.2
|
|
|||||
|
INCOME (LOSS) FROM CONTINUING OPERATIONS BEFORE INCOME TAXES
|
(538.9
|
)
|
(196.0
|
)
|
997.5
|
|
|||||
|
PROVISION FOR INCOME TAXES
|
|
|
|
|
|
|
|||||
|
Current income tax expense
|
33.0
|
|
54.2
|
|
79.8
|
|
|||||
|
Deferred income tax expense
|
56.6
|
|
55.0
|
|
28.7
|
|
|||||
|
|
89.6
|
|
109.2
|
|
108.5
|
|
|||||
|
INCOME (LOSS) FROM CONTINUING OPERATIONS
|
(628.5
|
)
|
|
(305.2
|
)
|
|
889.0
|
|
|||
|
INCOME (LOSS) FROM DISCONTINUED OPERATIONS, NET
|
(8.1
|
)
|
1.0
|
|
8.1
|
|
|||||
|
NET INCOME (LOSS)
|
(636.6
|
)
|
(304.2
|
)
|
897.1
|
|
|||||
|
NET (INCOME) LOSS ATTRIBUTABLE TO NONCONTROLLING INTERESTS
|
(3.1
|
)
|
.5
|
|
(6.9
|
)
|
|||||
|
NET INCOME (LOSS) ATTRIBUTABLE TO ENSCO
|
$
|
(639.7
|
)
|
$
|
(303.7
|
)
|
$
|
890.2
|
|
||
|
EARNINGS (LOSS) PER SHARE - BASIC AND DILUTED
|
|
|
|
|
|
|
|||||
|
Continuing operations
|
$
|
(1.45
|
)
|
$
|
(0.91
|
)
|
$
|
3.10
|
|
||
|
Discontinued operations
|
(0.02
|
)
|
—
|
|
0.03
|
|
|||||
|
|
$
|
(1.47
|
)
|
$
|
(0.91
|
)
|
$
|
3.13
|
|
||
|
WEIGHTED-AVERAGE SHARES OUTSTANDING
|
|
|
|
||||||||
|
Basic and Diluted
|
434.1
|
|
332.5
|
|
279.1
|
|
|||||
The accompanying notes are an integral part of these consolidated financial statements.
89
ENSCO PLC AND SUBSIDIARIES
CONSOLIDATED STATEMENTS OF COMPREHENSIVE INCOME (LOSS)
(in millions)
|
Year Ended December 31,
|
|||||||||||
|
2018
|
2017
|
2016
|
|||||||||
|
NET INCOME (LOSS)
|
$
|
(636.6
|
)
|
$
|
(304.2
|
)
|
$
|
897.1
|
|
||
|
OTHER COMPREHENSIVE INCOME (LOSS), NET
|
|
|
|
||||||||
|
Net change in fair value of derivatives
|
(9.7
|
)
|
8.5
|
|
(5.4
|
)
|
|||||
|
Reclassification of net (gains) losses on derivative instruments from other comprehensive income (loss) into net income (loss)
|
(1.0
|
)
|
.4
|
|
12.4
|
|
|||||
|
Other
|
(.5
|
)
|
.7
|
|
(.5
|
)
|
|||||
|
NET OTHER COMPREHENSIVE INCOME (LOSS)
|
(11.2
|
)
|
9.6
|
|
6.5
|
|
|||||
|
COMPREHENSIVE INCOME (LOSS)
|
(647.8
|
)
|
(294.6
|
)
|
903.6
|
|
|||||
|
COMPREHENSIVE (INCOME) LOSS ATTRIBUTABLE TO NONCONTROLLING INTERESTS
|
(3.1
|
)
|
.5
|
|
(6.9
|
)
|
|||||
|
COMPREHENSIVE INCOME (LOSS) ATTRIBUTABLE TO ENSCO
|
$
|
(650.9
|
)
|
$
|
(294.1
|
)
|
$
|
896.7
|
|
||
The accompanying notes are an integral part of these consolidated financial statements.
90
ENSCO PLC AND SUBSIDIARIES
CONSOLIDATED BALANCE SHEETS
(in millions, except share and par value amounts)
|
|
December 31,
|
||||||
|
ASSETS
|
2018
|
2017
|
|||||
|
CURRENT ASSETS
|
|
|
|
||||
|
Cash and cash equivalents
|
$
|
275.1
|
|
$
|
445.4
|
|
|
|
Short-term investments
|
329.0
|
|
440.0
|
|
|||
|
Accounts receivable, net
|
344.7
|
|
345.4
|
|
|||
|
Other
|
360.9
|
|
381.2
|
|
|||
|
Total current assets
|
1,309.7
|
|
1,612.0
|
|
|||
|
PROPERTY AND EQUIPMENT, AT COST
|
15,517.0
|
|
15,332.1
|
|
|||
|
Less accumulated depreciation
|
2,900.8
|
|
2,458.4
|
|
|||
|
Property and equipment, net
|
12,616.2
|
|
12,873.7
|
|
|||
|
OTHER ASSETS
|
97.8
|
|
140.2
|
|
|||
|
|
$
|
14,023.7
|
|
$
|
14,625.9
|
|
|
|
LIABILITIES AND SHAREHOLDERS' EQUITY
|
|
|
|
|
|||
|
CURRENT LIABILITIES
|
|
|
|
|
|||
|
Accounts payable - trade
|
$
|
210.5
|
|
$
|
432.6
|
|
|
|
Accrued liabilities and other
|
318.0
|
|
325.9
|
|
|||
|
Total current liabilities
|
528.5
|
|
758.5
|
|
|||
|
LONG-TERM DEBT
|
5,010.4
|
|
4,750.7
|
|
|||
|
OTHER LIABILITIES
|
396.0
|
|
386.7
|
|
|||
|
COMMITMENTS AND CONTINGENCIES
|
|
|
|
|
|||
|
ENSCO SHAREHOLDERS' EQUITY
|
|
|
|
|
|||
|
Class A ordinary shares, U.S. $.10 par value, 460.7 million and 447.0 million
shares issued as of December 31, 2018 and 2017
|
46.1
|
|
44.7
|
|
|||
|
Class B ordinary shares, £1 par value, 50,000 shares issued
as of December 31, 2018 and 2017
|
.1
|
|
.1
|
|
|||
|
Additional paid-in capital
|
7,225.0
|
|
7,195.0
|
|
|||
|
Retained earnings
|
874.2
|
|
1,532.7
|
|
|||
|
Accumulated other comprehensive income
|
18.2
|
|
28.6
|
|
|||
|
Treasury shares, at cost, 23.6 million and 11.1 million shares as of
December 31, 2018 and 2017
|
(72.2
|
)
|
(69.0
|
)
|
|||
|
Total Ensco shareholders' equity
|
8,091.4
|
|
8,732.1
|
|
|||
|
NONCONTROLLING INTERESTS
|
(2.6
|
)
|
(2.1
|
)
|
|||
|
Total equity
|
8,088.8
|
|
8,730.0
|
|
|||
|
|
$
|
14,023.7
|
|
$
|
14,625.9
|
|
|
The accompanying notes are an integral part of these consolidated financial statements.
91
|
ENSCO PLC AND SUBSIDIARIES
CONSOLIDATED STATEMENTS OF CASH FLOWS
(in millions)
|
|||||||||||
|
|
Year Ended December 31,
|
||||||||||
|
2018
|
2017
|
2016
|
|||||||||
|
OPERATING ACTIVITIES
|
|
|
|
|
|
|
|||||
|
Net income (loss)
|
$
|
(636.6
|
)
|
$
|
(304.2
|
)
|
$
|
897.1
|
|
||
|
Adjustments to reconcile net income (loss) to net cash provided by (used in) operating activities of continuing operations:
|
|
|
|
|
|
|
|||||
|
Depreciation expense
|
478.9
|
|
444.8
|
|
445.3
|
|
|||||
|
Deferred income tax expense
|
56.6
|
|
55.0
|
|
28.7
|
|
|||||
|
Share-based compensation expense
|
41.6
|
|
41.2
|
|
39.6
|
|
|||||
|
Loss on impairment
|
40.3
|
|
182.9
|
|
—
|
|
|||||
|
Amortization, net
|
(40.2
|
)
|
(61.6
|
)
|
(139.7
|
)
|
|||||
|
(Gain) loss on debt extinguishment
|
19.0
|
|
2.6
|
|
(287.8
|
)
|
|||||
|
Discontinued operations, net
|
8.1
|
|
(1.0
|
)
|
(8.1
|
)
|
|||||
|
Bargain purchase gain
|
(1.8
|
)
|
(140.2
|
)
|
—
|
|
|||||
|
Other
|
(3.6
|
)
|
(25.5
|
)
|
(38.3
|
)
|
|||||
|
Changes in operating assets and liabilities, net of acquisition
|
(18.0
|
)
|
65.4
|
|
140.6
|
|
|||||
|
Net cash provided by (used in) operating activities of continuing operations
|
(55.7
|
)
|
259.4
|
|
1,077.4
|
|
|||||
|
INVESTING ACTIVITIES
|
|
|
|
|
|
|
|||||
|
Maturities of short-term investments
|
1,030.0
|
|
2,042.5
|
|
2,212.0
|
|
|||||
|
Purchases of short-term investments
|
(919.0
|
)
|
(1,040.0
|
)
|
(2,474.6
|
)
|
|||||
|
Additions to property and equipment
|
(426.7
|
)
|
(536.7
|
)
|
(322.2
|
)
|
|||||
|
Net proceeds from disposition of assets
|
11.0
|
|
2.8
|
|
9.8
|
|
|||||
|
Acquisition of Atwood, net of cash acquired
|
—
|
|
(871.6
|
)
|
—
|
|
|||||
|
Net cash used in investing activities of continuing operations
|
(304.7
|
)
|
(403.0
|
)
|
(575.0
|
)
|
|||||
|
FINANCING ACTIVITIES
|
|
|
|
|
|
|
|||||
|
Proceeds from issuance of senior notes
|
1,000.0
|
|
—
|
|
849.5
|
|
|||||
|
Reduction of long-term borrowings
|
(771.2
|
)
|
(537.0
|
)
|
(863.9
|
)
|
|||||
|
Cash dividends paid
|
(17.9
|
)
|
(13.8
|
)
|
(11.6
|
)
|
|||||
|
Debt issuance costs
|
(17.0
|
)
|
(12.0
|
)
|
(23.4
|
)
|
|||||
|
Proceeds from equity issuance
|
—
|
|
—
|
|
585.5
|
|
|||||
|
Other
|
(5.7
|
)
|
(7.7
|
)
|
(7.1
|
)
|
|||||
|
Net cash provided by (used in) financing activities
|
188.2
|
|
(570.5
|
)
|
529.0
|
|
|||||
|
Net cash provided by (used in) discontinued operations
|
2.5
|
|
(.8
|
)
|
8.4
|
|
|||||
|
Effect of exchange rate changes on cash and cash equivalents
|
(.6
|
)
|
.6
|
|
(1.4
|
)
|
|||||
|
INCREASE (DECREASE) IN CASH AND CASH EQUIVALENTS
|
(170.3
|
)
|
(714.3
|
)
|
1,038.4
|
|
|||||
|
CASH AND CASH EQUIVALENTS, BEGINNING OF YEAR
|
445.4
|
|
1,159.7
|
|
121.3
|
|
|||||
|
CASH AND CASH EQUIVALENTS, END OF YEAR
|
$
|
275.1
|
|
$
|
445.4
|
|
$
|
1,159.7
|
|
||
The accompanying notes are an integral part of these consolidated financial statements.
92
ENSCO PLC AND SUBSIDIARIES
NOTES TO CONSOLIDATED FINANCIAL STATEMENTS
1. DESCRIPTION OF THE BUSINESS AND SUMMARY OF SIGNIFICANT ACCOUNTING POLICIES
Business
We are one of the leading providers of offshore contract drilling services to the international oil and gas industry. We own and operate an offshore drilling rig fleet of
56
rigs spanning most of the strategic markets around the globe. We also have
three
rigs under construction. Inclusive of our rigs under construction, our fleet includes
12
drillships,
9
dynamically positioned semisubmersible rigs,
three
moored semisubmersible rigs and
35
jackup rigs. We operate the world's largest fleet amongst competitive rigs, including one of the newest ultra-deepwater fleets in the industry and a leading premium jackup fleet.
Our customers include many of the leading national and international oil companies, in addition to many independent operators. We are among the most geographically diverse offshore drilling companies, with current operations spanning
14
countries on
six
continents. The markets in which we operate include the Gulf of Mexico, Brazil, the Mediterranean, the North Sea, the Middle East, West Africa, Australia and Southeast Asia.
We provide drilling services on a day rate contract basis. Under day rate contracts, we provide an integrated service that includes the provision of a drilling rig and rig crews for which we receive a daily rate that may vary between the full rate and zero rate throughout the duration of the contractual term, depending on the operations of the rig. We also may receive lump-sum fees or similar compensation for the mobilization, demobilization and capital upgrades of our rigs. Our customers bear substantially all of the costs of constructing the well and supporting drilling operations, as well as the economic risk relative to the success of the well.
Proposed Rowan Transaction
On October 7, 2018, Ensco plc and Rowan Companies plc ("Rowan") entered into an agreement that provides for the combination of the two companies (as amended the "Transaction Agreement"). Ensco has agreed to acquire the entire issued and to be issued share capital of Rowan in an all-stock transaction (the " Rowan Transaction") by way of a scheme of arrangement to be undertaken by Rowan under Part 26 of the UK Companies Act 2006. On January 29, 2019, the Transaction Agreement was amended to increase the exchange ratio in connection with the Rowan Transaction from
2.215
to
2.750
.
Subject to the terms and conditions of the Transaction Agreement, each Class A ordinary share of Rowan will be converted into the right to receive
2.750
Class A ordinary shares of Ensco plc. We estimate the total consideration to be delivered in the Rowan Transaction to be approximately
$1.5 billion
, consisting of approximately
351.3 million
of our shares based on the closing price of
$4.41
on
February 22, 2019
. The value of the Rowan Transaction consideration will fluctuate until the closing date based on changes in the price of our shares and the number of Rowan ordinary shares outstanding.
The completion of the Rowan Transaction is subject to various closing conditions, including, among others, (i) the sanction of the Rowan Transaction by the High Court of Justice of England and Wales, (ii) the receipt of certain required regulatory approvals or lapse of certain review periods with respect thereto, including in the Kingdom of Saudi Arabia, (iii) the absence of legal restraints prohibiting or restraining the Rowan Transaction and (iv) the absence of any law or order reasonably expected to result in the dissolution of the Saudi Aramco Offshore Drilling Company, Rowan’s joint venture with Saudi Aramco (the “ARO JV”), or the sale, disposition, forfeiture or nationalization of Rowan’s interest in the ARO JV. Shareholders of Rowan and Ensco approved the Rowan Transaction on February 21, 2019. The Rowan Transaction is expected to close during the first half of 2019, subject to satisfaction of all conditions to closing. Upon closing of the Rowan Transaction, we intend to complete a reverse split of our ordinary shares under which every four existing Ensco ordinary shares will be consolidated into one Ensco ordinary share.
93
Atwood Merger
On October 6, 2017 (the "Merger Date"), we completed a merger transaction (the "Atwood Merger") with Atwood Oceanics, Inc. ("Atwood") and Echo Merger Sub, LLC, a wholly-owned subsidiary of Ensco plc. Pursuant to the merger agreement, Echo Merger Sub, LLC, merged with and into Atwood, with Atwood as the surviving entity and an indirect, wholly-owned subsidiary of Ensco plc. Total consideration delivered in the Atwood Merger consisted of
132.2 million
of our Class A ordinary shares and
$11.1 million
of cash in settlement of certain share-based payment awards. The total aggregate value of consideration transferred was
$781.8 million
. Additionally, upon closing of the Atwood Merger, we utilized cash acquired of
$445.4 million
and cash on hand to extinguish Atwood's revolving credit facility, outstanding senior notes and accrued interest totaling
$1.3 billion
. The estimated fair values assigned to assets acquired net of liabilities assumed exceeded the consideration transferred, resulting in a bargain purchase gain of
$140.2 million
that was recognized during the fourth quarter of 2017. During 2018, we recognized measurement period adjustments as we completed our fair value assessments resulting in additional bargain purchase gain of
$1.8 million
.
Basis of Presentation—U.K. Companies Act 2006 Section 435 Statement
The accompanying consolidated financial statements have been prepared in accordance with U.S. GAAP, which the Board of Directors consider to be the most meaningful presentation of our results of operations and financial position. The accompanying consolidated financial statements do not constitute U.K. statutory accounts for the year ended December 31, 2018 and 2017 as required to be prepared under the U.K. Companies Act 2006. The U.K. statutory accounts are prepared in accordance with Financial Reporting Standard 102, the financial reporting standard applicable in the U.K. and Republic of Ireland (“FRS 102”). The auditor has reported on the U.K. statutory accounts for the year ended December 31, 2017; their report was (i) unqualified, (ii) did not include a reference to any matters to which the auditor drew attention by way of emphasis without qualifying their report and (iii) did not contain a statement under section 498 (2) or (3) of the U.K. Companies Act 2006. The U.K. statutory accounts for the year ended December 31, 2018 have yet to be finalized and will be delivered to the U.K. registrar of companies during 2019.
Principles of Consolidation
The accompanying consolidated financial statements include the accounts of Ensco plc, those of our wholly-owned subsidiaries and entities in which we hold a controlling financial interest. All intercompany accounts and transactions have been eliminated. Certain previously reported amounts have been reclassified to conform to the current year presentation.
Pervasiveness of Estimates
The preparation of financial statements in conformity with U.S. GAAP requires us to make certain estimates, judgments and assumptions that affect the reported amounts of assets and liabilities, the related revenues and expenses and disclosures of gain and loss contingencies as of the date of the financial statements. Actual results could differ from those estimates.
Foreign Currency Remeasurement and Translation
Our functional currency is the U.S. dollar. As is customary in the oil and gas industry, a majority of our revenues and expenses are denominated in U.S. dollars; however, a portion of the revenues earned and expenses incurred by certain of our subsidiaries are denominated in currencies other than the U.S. dollar. These transactions are remeasured in U.S. dollars based on a combination of both current and historical exchange rates. Most transaction gains and losses, including certain gains and losses on our derivative instruments, are included in other, net, in our consolidated statement of operations. Certain gains and losses from the translation of foreign currency balances of our non-U.S. dollar functional currency subsidiaries are included in accumulated other comprehensive income on our consolidated balance sheet. Net foreign currency exchange losses, inclusive of offsetting fair value derivatives, were
94
$17.2 million
,
$5.1 million
and
$6.0 million
, and were included in other, net, in our consolidated statements of operations for the years ended December 31,
2018, 2017 and 2016
, respectively.
Cash Equivalents and Short-Term Investments
Highly liquid investments with maturities of three months or less at the date of purchase are considered cash equivalents. Highly liquid investments with maturities of greater than three months but less than one year at the date of purchase are classified as short-term investments.
Short-term investments consisted of time deposits with initial maturities in excess of three months but less than one year and totaled
$329.0 million
and
$440.0 million
as of
December 31, 2018
and
2017
, respectively. Cash flows from purchases and maturities of short-term investments were classified as investing activities in our consolidated statements of cash flows for the years ended December 31,
2018, 2017 and 2016
. To mitigate our credit risk, our investments in time deposits are diversified across multiple, high-quality financial institutions.
Property and Equipment
All costs incurred in connection with the acquisition, construction, major enhancement and improvement of assets are capitalized, including allocations of interest incurred during periods that our drilling rigs are under construction or undergoing major enhancements and improvements. Costs incurred to place an asset into service are capitalized, including costs related to the initial mobilization of a newbuild drilling rig. Repair and maintenance costs are charged to contract drilling expense in the period in which they are incurred. Upon the sale or retirement of assets, the related cost and accumulated depreciation are removed from the balance sheet, and the resulting gain or loss is included in contract drilling expense, unless reclassified to discontinued operations.
Our property and equipment is depreciated on a straight-line basis, after allowing for salvage values, over the estimated useful lives of our assets. Drilling rigs and related equipment are depreciated over estimated useful lives ranging from
four
to
35
years. Buildings and improvements are depreciated over estimated useful lives ranging from
seven
to
30
years. Other equipment, including computer and communications hardware and software costs, is depreciated over estimated useful lives ranging from
three
to
six
years.
We evaluate the carrying value of our property and equipment for impairment when events or changes in circumstances indicate that the carrying value of such assets may not be recoverable. For property and equipment used in our operations, recoverability generally is determined by comparing the carrying value of an asset to the expected undiscounted future cash flows of the asset. If the carrying value of an asset is not recoverable, the amount of impairment loss is measured as the difference between the carrying value of the asset and its estimated fair value. Property and equipment held-for-sale is recorded at the lower of net book value or fair value less cost to sell.
We recorded pre-tax, non-cash impairment losses related to long-lived assets of
$40.3 million
and
$182.9 million
during 2018 and 2017, respectively. See "Note 5 - Property and Equipment" for additional information on our impairment charges.
If the global economy deteriorates and/or our expectations relative to future offshore drilling industry conditions decline, it is reasonably possible that additional impairment charges may occur with respect to specific individual rigs, groups of rigs, such as a specific type of drilling rig, or rigs in a certain geographic location.
95
Operating Revenues and Expenses
See "Note 2 - Revenue from Contracts with Customers" for information on our accounting policies for revenue recognition and certain operating costs that are deferred and amortized over future periods, which reflects our revenue recognition policies subsequent to our adoption of ASC Topic 606,
Revenue from Contracts with Customers
, effective January 1, 2018. Prior to our adoption of ASC Topic 606, we recognized revenue in accordance with prior guidance under ASC Topic 605. With the exception of a change in our policy to recognize demobilization revenue over the related contract term, if certain conditions are met, our revenue recognition policies are substantively unchanged as a result of our adoption of ASC Topic 606.
Derivative Instruments
We use derivatives to reduce our exposure to various market risks, primarily foreign currency exchange rate risk. See "Note 7 - Derivative Instruments" for additional information on how and why we use derivatives.
All derivatives are recorded on our consolidated balance sheet at fair value. Derivatives subject to legally enforceable master netting agreements are not offset on our consolidated balance sheet. Accounting for the gains and losses resulting from changes in the fair value of derivatives depends on the use of the derivative and whether it qualifies for hedge accounting. Derivatives qualify for hedge accounting when they are formally designated as hedges and are effective in reducing the risk exposure that they are designated to hedge.
Changes in the fair value of derivatives that are designated as hedges of the variability in expected future cash flows associated with existing recognized assets or liabilities or forecasted transactions ("cash flow hedges") are recorded in accumulated other comprehensive income ("AOCI"). Amounts recorded in AOCI associated with cash flow hedges are subsequently reclassified into contract drilling, depreciation or interest expense as earnings are affected by the underlying hedged forecasted transactions.
Gains and losses on a cash flow hedge, or a portion of a cash flow hedge, that no longer qualifies as effective due to an unanticipated change in the forecasted transaction are recognized currently in earnings and included in other, net, in our consolidated statement of operations based on the change in the fair value of the derivative. When a forecasted transaction becomes probable of not occurring, gains and losses on the derivative previously recorded in AOCI are reclassified currently into earnings and included in other, net, in our consolidated statement of operations.
We occasionally enter into derivatives that hedge the fair value of recognized assets or liabilities, but do not designate such derivatives as hedges or the derivatives otherwise do not qualify for hedge accounting. In these situations, a natural hedging relationship generally exists where changes in the fair value of the derivatives offset changes in the fair value of the underlying hedged items. Changes in the fair value of these derivatives are recognized currently in earnings in other, net, in our consolidated statement of operations.
Derivatives with asset fair values are reported in other current assets or other assets, net, on our consolidated balance sheet depending on maturity date. Derivatives with liability fair values are reported in accrued liabilities and other, or other liabilities on our consolidated balance sheet depending on maturity date.
Income Taxes
We conduct operations and earn income in numerous countries. Current income taxes are recognized for the amount of taxes payable or refundable based on the laws and income tax rates in the taxing jurisdictions in which operations are conducted and income is earned.
Deferred tax assets and liabilities are recognized for the anticipated future tax effects of temporary differences between the financial statement basis and the tax basis of our assets and liabilities using the enacted tax rates in effect at year-end. A valuation allowance for deferred tax assets is recorded when it is more-likely-than-not that the benefit from the deferred tax asset will not be realized. We do not offset deferred tax assets and deferred tax liabilities attributable to different tax paying jurisdictions.
96
We operate in certain jurisdictions where tax laws relating to the offshore drilling industry are not well developed and change frequently. Furthermore, we may enter into transactions with affiliates or employ other tax planning strategies that generally are subject to complex tax regulations. As a result of the foregoing, the tax liabilities and assets we recognize in our financial statements may differ from the tax positions taken, or expected to be taken, in our tax returns. Our tax positions are evaluated for recognition using a more-likely-than-not threshold, and those tax positions requiring recognition are measured as the largest amount of tax benefit that is greater than 50% likely of being realized upon effective settlement with a taxing authority that has full knowledge of all relevant information. Interest and penalties relating to income taxes are included in current income tax expense in our consolidated statement of operations.
Our drilling rigs frequently move from one taxing jurisdiction to another based on where they are contracted to perform drilling services. The movement of drilling rigs among taxing jurisdictions may involve a transfer of drilling rig ownership among our subsidiaries through an intercompany rig sale. The pre-tax profit resulting from an intercompany rig sale is eliminated from our consolidated financial statements, and the carrying value of a rig sold in an intercompany transaction remains at historical net depreciated cost prior to the transaction. Our consolidated financial statements do not reflect the asset disposition transaction of the selling subsidiary or the asset acquisition transaction of the acquiring subsidiary. Prior to our adoption of Accounting Standards Update 2016-16, Income Taxes (Topic 740): Intra-Entity Transfers of Assets Other Than Inventory (“Update 2016-16”) on January 1, 2017, income taxes resulting from an intercompany rig sale, as well as the tax effect of any reversing temporary differences resulting from the sale, were deferred and amortized on a straight-line basis over the remaining useful life of the rig. Subsequent to our adoption of Update 2016-16, the income tax effects resulting from intercompany rig sales are recognized in earnings in the period in which the sale occurs.
In some instances, we may determine that certain temporary differences will not result in a taxable or deductible amount in future years, as it is more-likely-than-not we will commence operations and depart from a given taxing jurisdiction without such temporary differences being recovered or settled. Under these circumstances, no future tax consequences are expected and no deferred taxes are recognized in connection with such operations. We evaluate these determinations on a periodic basis and, in the event our expectations relative to future tax consequences change, the applicable deferred taxes are recognized or derecognized.
We do not provide deferred taxes on the undistributed earnings of certain subsidiaries because our policy and intention is to reinvest such earnings indefinitely. Should we make a distribution from these subsidiaries in the form of dividends or otherwise, we may be subject to additional income taxes.
The U.S. Tax Cuts and Jobs Act (“U.S. tax reform”) was enacted on December 22, 2017 and introduced significant changes to U.S. income tax law, including a reduction in the statutory income tax rate from
35%
to
21%
effective January 1, 2018, a one-time transition tax on deemed repatriation of deferred foreign income, a base erosion anti-abuse tax that effectively imposes a minimum tax on certain payments to non-U.S. affiliates, new and revised rules relating to the current taxation of certain income of foreign subsidiaries and revised rules associated with limitations on the deduction of interest. See "Note 10 - Income Taxes" for additional information.
Share-Based Compensation
We sponsor share-based compensation plans that provide equity compensation to our key employees, officers and non-employee directors. Our Long-Term Incentive Plan (the “2018 LTIP”) allows our Board of Directors to authorize share grants to be settled in cash or shares. Compensation expense for share awards to be settled in shares is measured at fair value on the date of grant and recognized on a straight-line basis over the requisite service period (usually the vesting period). Compensation expense for share awards to be settled in cash is remeasured each quarter with a cumulative adjustment to compensation cost during the period based on changes in our share price. Any adjustments to the compensation cost recognized in our consolidated statement of operations for awards that are forfeited are recognized in the period in which the forfeitures occur. See "Note 9 - Benefit Plans" for additional information on our share-based compensation.
97
Fair Value Measurements
We measure certain of our assets and liabilities based on a fair value hierarchy that prioritizes the inputs to valuation techniques used to measure fair value. The hierarchy assigns the highest priority to unadjusted quoted prices in active markets for identical assets or liabilities ("Level 1") and the lowest priority to unobservable inputs ("Level 3"). Level 2 measurements represent inputs that are observable for similar assets or liabilities, either directly or indirectly, other than quoted prices included within Level 1. See "Note 4 - Fair Value Measurements" for additional information on the fair value measurement of certain of our assets and liabilities.
Noncontrolling Interests
Third parties hold a noncontrolling ownership interest in certain of our non-U.S. subsidiaries. Noncontrolling interests are classified as equity on our consolidated balance sheet and net income attributable to noncontrolling interests is presented separately in our consolidated statement of operations. For each of the years in the three-year period ended
December 31, 2018
, all income attributable to noncontrolling interest was from continuing operations.
Earnings Per Share
We compute basic and diluted earnings per share ("EPS") in accordance with the two-class method. Net income (loss) attributable to Ensco used in our computations of basic and diluted EPS is adjusted to exclude net income allocated to non-vested shares granted to our employees and non-employee directors. Weighted-average shares outstanding used in our computation of diluted EPS is calculated using the treasury stock method and includes the effect of all potentially dilutive performance awards and excludes non-vested shares. In each of the years in the three-year period ended
December 31, 2018
, our potentially dilutive instruments were not included in the computation of diluted EPS as the effect of including these shares in the calculation would have been anti-dilutive.
The following table is a reconciliation of income (loss) from continuing operations attributable to Ensco shares used in our basic and diluted EPS computations for each of the years in the three-year period ended
December 31, 2018
(in millions):
|
2018
|
2017
|
2016
|
|||||||||
|
Income (loss) from continuing operations attributable to Ensco
|
$
|
(631.6
|
)
|
$
|
(304.7
|
)
|
$
|
882.1
|
|
||
|
Income from continuing operations allocated to non-vested share awards
|
(.5
|
)
|
(.4
|
)
|
(16.6
|
)
|
|||||
|
Income (loss) from continuing operations attributable to Ensco shares
|
$
|
(632.1
|
)
|
$
|
(305.1
|
)
|
$
|
865.5
|
|
||
Anti-dilutive share awards totaling
1.5 million
,
2.0 million
and
500,000
for the years ended December 31,
2018, 2017 and 2016
, respectively, were excluded from the computation of diluted EPS.
During 2016, we issued our
3.00%
exchangeable senior notes due 2024 (the "2024 Convertible Notes"). See "Note 6 - Debt" for additional information on this issuance. We have the option to settle the notes in cash, shares or a combination thereof for the aggregate amount due upon conversion. Our intent is to settle the principal amount of the 2024 Convertible Notes in cash upon conversion. If the conversion value exceeds the principal amount (i.e., our share price exceeds the exchange price on the date of conversion), we expect to deliver shares equal to the remainder of our conversion obligation in excess of the principal amount.
During each respective reporting period that our average share price exceeds the exchange price, an assumed number of shares required to settle the conversion obligation in excess of the principal amount will be included in our denominator for the computation of diluted EPS using the treasury stock method. Our average share price did not exceed the exchange price during the years ended
December 31, 2018
and
December 31, 2017
.
98
New Accounting Pronouncements
Recently adopted accounting standards
In August 2018, the Financial Accounting Standards Board (the "FASB") issued Update 2018-15, Intangibles—Goodwill and Other—Internal-Use Software (Subtopic 350-40): Customer’s Accounting for Implementation Costs Incurred in a Cloud Computing Arrangement That is a Service Contract ("Update 2018-15"), which aligns the requirements for capitalizing implementation costs incurred in a hosting arrangement that is a service contract with the requirements for capitalizing implementation costs incurred to develop or obtain internal-use software (and hosting arrangements that included an internal-use software license). This update is effective for fiscal years beginning after December 15, 2020 and interim periods within those fiscal years, with early adoption permitted. We elected to early-adopt Update 2018-15 effective October 1, 2018. As a result of adopting Update 2018-15, we began deferring and amortizing certain costs incurred to implement cloud computing arrangements that would have been recognized as incurred under previous guidance. We do not expect our adoption of Update 2018-15 to have a material impact on our financial position or results of operations in future periods.
In February 2018, the FASB issued Update 2018-02, Income Statement - Reporting Comprehensive Income (Topic 220): Reclassification of Certain Tax Effects From Accumulated Other Comprehensive Income ("Update 2018-02"), which allows for a reclassification from accumulated other comprehensive income (AOCI) to retained earnings for stranded tax effects resulting from U.S. tax reform. This update is effective for fiscal years beginning after December 15, 2018 and interim periods within those fiscal years, with early adoption permitted. We adopted Update 2018-02 effective January 1, 2018. As a result, we reclassified a total of
$800,000
in tax effects from AOCI to opening retained earnings.
In October 2016, the FASB issued Accounting Standards Update 2016-16,
Income Taxes (Topic 740): Intra-Entity Transfers of Assets Other Than Inventory
(“Update 2016-16”), which requires entities to recognize the income tax consequences of an intra-entity transfer of an asset other than inventory when the transaction occurs as opposed to deferring tax consequences and amortizing them into future periods. We adopted Update 2016-16 on a modified retrospective basis effective January 1, 2017. As a result of modified retrospective application, we reduced prepaid taxes on intercompany transfers of property and related deferred tax liabilities resulting in the recognition of a cumulative-effect reduction in retained earnings of
$14.1 million
on our consolidated balance sheet as of January 1, 2017.
During 2014, the FASB issued Update 2014-09, Revenue from Contracts with Customers (Topic 606) ("Update 2014-09"), which requires entities to recognize the amount of revenue to which it expects to be entitled for the transfer of promised goods or services to customers. Update 2014-09 is effective for annual and interim periods for fiscal years beginning after December 15, 2017. We adopted Update 2014-09 effective January 1, 2018, using the modified retrospective approach. Only customer contracts that were not completed as of the effective adoption date were evaluated under the transition guidance to determine if a cumulative catch-up adjustment to retained earnings was warranted. Revenues recognized in prior years for customer contracts that expired prior to the effective adoption date continue to be reported under the previous revenue recognition guidance. Our adoption of Update 2014-09 did not result in a cumulative effect on retained earnings and no adjustments were made to prior periods. While Update 2014-09 requires additional disclosure regarding revenues recognized from customer contracts, our adoption did not have a material impact on the recognition of current or prior period revenues as compared to previous guidance nor do we expect a material impact to our pattern of revenue recognition in future periods. See "Note 2 - Revenue from Contracts with Customers" for additional information.
Recently issued accounting standards
In August 2017, the FASB issued Update 2017-12, Derivatives and Hedging (Topic 815): Targeted Improvements to Accounting for Hedging Activities ("Update 2017-12"), which will make more hedging strategies eligible for hedge accounting. It also amends presentation and disclosure requirements and changes how companies assess effectiveness. This update is effective for annual and interim periods beginning after December 15, 2018, with
99
early adoption permitted. We are currently evaluating the effect that Update 2017-12 will have on our consolidated financial statements and related disclosures. However, we do not expect our adoption of Update 2017-12 to have a material impact on our financial position or results of operations.
During 2016, the FASB issued Update 2016-02, Leases (Topic 842) ("Update 2016-02"), which requires an entity to recognize lease assets and lease liabilities on the balance sheet and to disclose key qualitative and quantitative information about the entity's leasing arrangements. This update is effective for annual and interim periods beginning after December 15, 2018, with early adoption permitted. During our evaluation of Update 2016-02, we concluded that our drilling contracts contain a lease component. In July 2018, the FASB issued Accounting Standard Update 2018-11, Leases (Topic 842), Targeted Improvements, which (1) provides for a new transition method whereby entities may elect to adopt the Update using a prospective with cumulative catch-up approach and (2) provides lessors with a practical expedient, by class of underlying asset, to not separate lease and non-lease components and account for the combined component under Topic 606 when the non-lease component is the predominant element of the combined component. The lessor practical expedient is limited to circumstances in which the lease, if accounted for separately, would be classified as an operating lease under Topic 842. While we are still finalizing our analysis, we believe the non-lease component of our contracts is the predominant element and that the lease component, if accounted for separately, would be classified as an operating lease. Accordingly, we expect that substantially all of our contracts will qualify for the practical expedient provided for in Update 2018-11. Therefore, we expect to elect the practical expedient prescribed in Update 2018-11 and account for the combined component as a single component under Topic 606. We do not expect our adoption to have a material impact on the recognition of current or prior period revenues as compared to previous guidance nor do we expect a material impact to our pattern of revenue recognition in future periods. With respect to leases whereby we are the lessee, we expect to recognize upon adoption on January 1, 2019 lease liabilities ranging from approximately
$75 million
to
$80 million
and offsetting "right of use" assets ranging from approximately
$65 million
to
$70 million
. Our adoption of Update 2016-02 is not expected to have a material impact on our ability to comply with current debt covenants.
With the exception of the updated standards discussed above, there have been no accounting pronouncements issued and not yet effective that have significance, or potential significance, to our consolidated financial statements.
2. REVENUE FROM CONTRACTS WITH CUSTOMERS
We provide drilling services on a day rate contract basis. Under day rate contracts, we provide an integrated service that includes the provision of a drilling rig and rig crews for which we receive a daily rate that may vary between the full rate and zero rate throughout the duration of the contractual term, depending on the operations of the rig. We also may receive lump-sum fees or similar compensation for the mobilization, demobilization and capital upgrades of our rigs. Our customers bear substantially all of the costs of constructing the well and supporting drilling operations, as well as the economic risk relative to the success of the well.
Our integrated drilling service provided under each drilling contract is a single performance obligation satisfied over time and comprised of a series of distinct time increments, or service periods. Total revenue is determined for each individual drilling contract by estimating both fixed and variable consideration expected to be earned over the contract term. Fixed consideration generally relates to activities such as mobilization, demobilization and capital upgrades of our rigs that are not distinct within the context of our contracts and is recognized on a straight-line basis over the contract term. Variable consideration generally relates to distinct service periods during the contract term and is recognized in the period when the services are performed.
The amount estimated for variable consideration is only recognized as revenue to the extent that it is probable that a significant reversal will not occur during the contract term. We have applied the optional exemption afforded in Update 2014-09 and have not disclosed the variable consideration related to our estimated future day rate revenues.
The remaining duration of our drilling contracts based on those in place as of December 31, 2018 was between approximately one month and four years.
100
Day Rate Drilling Revenue
Our drilling contracts provide for payment on a day rate basis and include a rate schedule with higher rates for periods when the drilling unit is operating and lower rates or zero rates for periods when drilling operations are interrupted or restricted. The day rate invoiced to the customer is determined based on the varying rates applicable to specific activities performed on an hourly basis. Day rate consideration is allocated to the distinct hourly increment to which it relates within the contract term and is generally recognized consistent with the contractual rate invoiced for the services provided during the respective period. Invoices are typically issued to our customers on a monthly basis and payment terms on customer invoices typically range from 30 to 45 days.
Certain of our contracts contain performance incentives whereby we may earn a bonus based on pre-established performance criteria. Such incentives are generally based on our performance over individual monthly time periods or individual wells. Consideration related to performance bonus is generally recognized in the specific time period to which the performance criteria was attributed.
We may receive termination fees if certain drilling contracts are terminated by the customer prior to the end of the contractual term. Such compensation is recognized as revenue when our performance obligation is satisfied, the termination fee can be reasonably measured and collection is probable. For the year ended
December 31, 2017
, operating revenues included
$185.0 million
for the lump-sum consideration received in settlement and release of the ENSCO DS-9 customer's ongoing early termination obligations. For the year ended December 31, 2016, operating revenues included
$20.0 million
for the lump-sum consideration received in settlement of the ENSCO 8503 customer's remaining obligations under the contract.
Mobilization / Demobilization Revenue
In connection with certain contracts, we receive lump-sum fees or similar compensation for the mobilization of equipment and personnel prior to the commencement of drilling services or the demobilization of equipment and personnel upon contract completion. Fees received for the mobilization or demobilization of equipment and personnel are included in operating revenues. The costs incurred in connection with the mobilization and demobilization of equipment and personnel are included in contract drilling expense.
Mobilization fees received prior to commencement of drilling operations are recorded as a contract liability and amortized on a straight-line basis over the contract term. Demobilization fees expected to be received upon contract completion are estimated at contract inception and recognized on a straight-line basis over the contract term. In some cases, demobilization fees may be contingent upon the occurrence or non-occurrence of a future event. In such cases, this may result in cumulative-effect adjustments to demobilization revenues upon changes in our estimates of future events during the contract term.
Capital Upgrade / Contract Preparation Revenue
In connection with certain contracts, we receive lump-sum fees or similar compensation for requested capital upgrades to our drilling rigs or for other contract preparation work. Fees received for requested capital upgrades and other contract preparation work are recorded as a contract liability and amortized on a straight-line basis over the contract term to operating revenues. Costs incurred for capital upgrades are capitalized and depreciated over the useful life of the asset.
Contract Assets and Liabilities
Contract assets represent amounts recognized as revenue but for which the right to invoice the customer is dependent upon our future performance. Once the previously recognized revenue is invoiced, the corresponding contract asset, or a portion thereof, is transferred to accounts receivable. Contract liabilities generally represent fees received for mobilization or capital upgrades.
101
Contract assets and liabilities are presented net on our consolidated balance sheet on a contract-by-contract basis. Current contract assets and liabilities are included in other current assets and accrued liabilities and other, respectively, and noncurrent contract assets and liabilities are included in other assets and other liabilities, respectively, on our consolidated balance sheets.
The following table summarizes our contract assets and contract liabilities (in millions):
|
|
December 31, 2018
|
|
December 31, 2017
|
||||
|
Current contract assets
|
$
|
4.0
|
|
$
|
3.0
|
|
|
|
Noncurrent contract assets
|
$
|
—
|
|
$
|
2.8
|
|
|
|
Current contract liabilities (deferred revenue)
|
$
|
56.9
|
|
$
|
71.9
|
|
|
|
Noncurrent contract liabilities (deferred revenue)
|
$
|
20.5
|
|
$
|
51.2
|
|
|
Changes in contract assets and liabilities during the period are as follows (in millions):
|
|
Contract Assets
|
Contract Liabilities
|
|||||
|
Balance as of December 31, 2017
|
$
|
5.8
|
|
$
|
123.1
|
|
|
|
Revenue recognized in advance of right to bill customer
|
2.2
|
|
—
|
|
|||
|
Increase due to cash received
|
—
|
|
49.4
|
|
|||
|
Decrease due to amortization of deferred revenue that was included in the beginning contract liability balance
|
—
|
|
(72.0
|
)
|
|||
|
Decrease due to amortization of deferred revenue that was added during the period
|
—
|
|
(23.1
|
)
|
|||
|
Decrease due to transfer to receivables during the period
|
(4.0
|
)
|
—
|
|
|||
|
Balance as of December 31, 2018
|
$
|
4.0
|
|
$
|
77.4
|
|
|
Deferred Contract Costs
Costs incurred for upfront rig mobilizations and certain contract preparations are attributable to our future performance obligation under each respective drilling contract. Such costs are deferred and amortized on a straight-line basis over the contract term. Demobilization costs are recognized as incurred upon contract completion. Costs associated with the mobilization of equipment and personnel to more promising market areas without contracts are expensed as incurred. Deferred contract costs were included in other current assets and other assets on our consolidated balance sheets and totaled
$23.5 million
and
$40.6 million
as of
December 31, 2018
and
2017
, respectively. Amortization of such costs totaled
$34.0 million
,
$28.1 million
and
$42.5 million
for the years ended
December 31, 2018
,
2017
and
2016
, respectively.
Deferred Certification Costs
We must obtain certifications from various regulatory bodies in order to operate our drilling rigs and must maintain such certifications through periodic inspections and surveys. The costs incurred in connection with maintaining such certifications, including inspections, tests, surveys and drydock, as well as remedial structural work and other compliance costs, are deferred and amortized on a straight-line basis over the corresponding certification periods. Deferred regulatory certification and compliance costs were included in other current assets and other assets on our consolidated balance sheets and totaled
$13.6 million
and
$15.3 million
as of
December 31, 2018
and
2017
, respectively. Amortization of such costs totaled
$12.4 million
,
$12.1 million
and
$16.8 million
for the years ended
December 31, 2018
,
2017
and
2016
, respectively.
102
Future Amortization of Contract Liabilities and Deferred Costs
Our contract liabilities and deferred costs are amortized on a straight-line basis over the contract term or corresponding certification period to operating revenues and contract drilling expense, respectively. Expected future amortization of our contract liabilities and deferred costs recorded as of
December 31, 2018
is set forth in the table below (in millions):
|
|
2019
|
|
2020
|
|
2021
|
|
2022 and Thereafter
|
Total
|
|||||||||||
|
Amortization of contract liabilities
|
$
|
57.0
|
|
$
|
11.7
|
|
$
|
7.2
|
|
$
|
1.5
|
|
$
|
77.4
|
|
||||
|
Amortization of deferred costs
|
$
|
23.8
|
|
$
|
9.4
|
|
$
|
2.4
|
|
$
|
1.5
|
|
$
|
37.1
|
|
||||
3. ACQUISITION OF ATWOOD
On the Merger Date, we completed the Atwood Merger with Atwood and Echo Merger Sub, LLC, our wholly-owned subsidiary. Assets acquired and liabilities assumed in the Atwood Merger were recorded at their estimated fair values as of the Merger Date under the acquisition method of accounting. As of September 30, 2018, we completed our fair value assessments.
Consideration
As a result of the Atwood Merger, Atwood shareholders received
1.60
Ensco Class A Ordinary shares for each share of Atwood common stock, representing a value of
$9.33
per share of Atwood common stock based on a closing price of
$5.83
per Class A ordinary share on October 5, 2017, the last trading day before the Merger Date. Total consideration delivered in the Atwood Merger consisted of
132.2 million
of our Class A ordinary shares and
$11.1 million
of cash in settlement of certain share-based payment awards. The total aggregate value of consideration transferred was
$781.8 million
. Additionally, upon closing of the Atwood Merger, we utilized cash acquired of
$445.4 million
and cash on hand to extinguish Atwood's revolving credit facility, outstanding senior notes and accrued interest totaling
$1.3 billion
. The estimated fair values assigned to assets acquired net of liabilities assumed exceeded the consideration transferred, resulting in a bargain purchase gain of
$140.2 million
that was recognized during the fourth quarter of 2017. During 2018, we recognized measurement period adjustments as we completed our fair value assessments resulting in additional bargain purchase gain of
$1.8 million
. Bargain purchase gain was included in other, net, in our consolidated statements of operations.
103
Assets Acquired and Liabilities Assumed
The provisional amounts recorded for assets acquired and liabilities assumed as of the Merger Date and respective measurement period adjustments were as follows (in millions):
|
Amounts Recognized as of Merger Date
|
Measurement Period Adjustments
(1)
|
Estimated Fair Value
|
|||||||||
|
Assets:
|
|||||||||||
|
Cash and cash equivalents
(2)
|
$
|
445.4
|
|
$
|
—
|
|
$
|
445.4
|
|
||
|
Accounts receivable
(3)
|
62.3
|
|
(1.6
|
)
|
60.7
|
|
|||||
|
Other current assets
|
118.1
|
|
4.6
|
|
122.7
|
|
|||||
|
Property and equipment
|
1,762.0
|
|
9.2
|
|
1,771.2
|
|
|||||
|
Other assets
|
23.7
|
|
(5.1
|
)
|
18.6
|
|
|||||
|
Liabilities:
|
|||||||||||
|
Accounts payable and accrued liabilities
|
64.9
|
|
(1.1
|
)
|
63.8
|
|
|||||
|
Other liabilities
|
118.7
|
|
6.4
|
|
125.1
|
|
|||||
|
Net assets acquired
|
2,227.9
|
|
1.8
|
|
2,229.7
|
|
|||||
|
Less:
|
|||||||||||
|
Merger consideration
|
(781.8
|
)
|
(781.8
|
)
|
|||||||
|
Repayment of Atwood debt
(2)
|
(1,305.9
|
)
|
(1,305.9
|
)
|
|||||||
|
Bargain purchase gain
|
$
|
140.2
|
|
$
|
142.0
|
|
|||||
(1)
The measurement period adjustments reflect changes in the estimated fair values of certain assets and liabilities, primarily related to inventory, capital equipment and other liabilities. The measurement period adjustments were recorded to reflect new information obtained about facts and circumstances existing as of the Merger Date and did not result from subsequent intervening events.
(2)
Upon closing of the Atwood Merger, we utilized acquired cash of
$445.4 million
and cash on hand from the liquidation of short-term investments to repay Atwood's debt and accrued interest of
$1.3 billion
.
(3)
Gross contractual amounts receivable totaled
$64.7 million
as of the Merger Date.
Bargain Purchase Gain
The fair values assigned to assets acquired net of liabilities assumed exceeded the consideration transferred, resulting in a bargain purchase gain primarily due to depressed offshore drilling company valuations. Market capitalizations across the offshore drilling industry declined significantly since mid-2014 due to the decline in commodity prices and the related imbalance of supply and demand for drilling rigs. The resulting bargain purchase gain was further driven by the decline in our share price from
$6.70
to
$5.83
between the last trading day prior to the announcement of the Atwood Merger and the Merger Date.
Merger-Related Costs
Merger-related costs were expensed as incurred and consisted of various advisory, legal, accounting, valuation and other professional or consulting fees totaling
$19.4 million
for the year ended December 31, 2017. These costs are included in general and administrative expense in our consolidated statements of operations.
Property and Equipment
Property and equipment acquired in connection with the Atwood Merger consisted primarily of drilling rigs and related equipment, including
four
drillships (
two
of which are under construction),
two
semisubmersible rigs and
five
jackup rigs. We recorded property and equipment acquired at its estimated fair value of
$1.8 billion
. We estimated
104
the fair value of the rigs and equipment by applying an income approach, using projected discounted cash flows, or a market approach. We estimated remaining useful lives for Atwood's drilling rigs, which ranged from
16
to
35
years based on original estimated useful lives of
30
to
35
years.
Deferred Taxes
The Atwood Merger was executed through the acquisition of Atwood's outstanding common stock and, therefore, the historical tax bases of the acquired assets and assumed liabilities, net operating losses and other tax attributes of Atwood were assumed as of the Merger Date. However, adjustments were recorded to recognize deferred tax assets and liabilities for the tax effects of differences between acquisition date fair values and tax bases of assets acquired and liabilities assumed. Additionally, the interaction of our and Atwood's tax attributes that impacted the deferred taxes of the combined entity were also recognized as part of acquisition accounting. As of the Merger Date, an increase of
$2.5 million
to Atwood’s net deferred tax liability was recognized.
Deferred tax assets and liabilities recognized in connection with the Atwood Merger were measured at rates enacted as of the Merger Date. Tax rate changes, or any deferred tax adjustments for new tax legislation, following the Merger Date, including the recently enacted U.S. tax reform, are reflected in our operating results in the period in which the change in tax laws or rate is enacted.
Intangible Assets and Liabilities
We recorded intangible assets totaling
$30.1 million
, inclusive of certain measurement period adjustments, as of the Merger Date representing the estimated fair value of Atwood's firm drilling contracts with favorable contract terms compared to then-market day rates for comparable drilling rigs.
Operating revenues were net of
$11.4 million
and
$16.1 million
of asset amortization during the years ended
December 31, 2018
and
2017
, respectively. The remaining balance of
$2.6 million
was included in other assets on our consolidated balance sheet as of
December 31, 2018
and will be amortized to operating revenue during
2019
.
We recorded intangible liabilities of
$60.0 million
for the estimated fair value of unfavorable drillship construction contracts, which were determined by comparing the firm obligations for the remaining construction of ENSCO DS-13 and ENSCO DS-14 to the estimated current market rates for the construction of a comparable drilling rig. The liabilities will be amortized over the estimated life of ENSCO DS-13 and ENSCO DS-14 as a reduction of depreciation expense beginning on the date the rig is placed into service.
Pro Forma Impact of the Atwood Merger
The following unaudited supplemental pro forma results present consolidated information as if the Atwood Merger was completed on January 1, 2016. The pro forma results include, among others, (i) the amortization associated with acquired intangible assets and liabilities, (ii) a reduction in depreciation expense for adjustments to property and equipment and (iii) a reduction to interest expense resulting from the retirement of Atwood's revolving credit facility and 6.50% senior notes due 2020. The pro forma results do not include any potential synergies or non-recurring charges resulting directly from the Atwood Merger.
|
(in millions, except per share amounts)
|
Twelve Months Ended (Unaudited)
|
||||||
|
2017
(1)
|
2016
|
||||||
|
Revenues
|
$
|
2,226.0
|
|
$
|
3,622.1
|
|
|
|
Net income (loss)
|
(347.0
|
)
|
1,284.9
|
|
|||
|
Earnings (loss) per share - basic and diluted
|
(.80
|
)
|
3.18
|
|
|||
105
(1)
Pro forma net income and earnings per share were adjusted to exclude an aggregate
$80.7 million
of merger-related and integration costs incurred by Ensco and Atwood during 2017 and the
$140.2 million
estimated bargain purchase gain.
4. FAIR VALUE MEASUREMENTS
The following fair value hierarchy table categorizes information regarding our net financial assets measured at fair value on a recurring basis as of
December 31, 2018
and
2017
(in millions):
|
Quoted Prices in
Active Markets
for
Identical Assets
(Level 1)
|
Significant
Other
Observable
Inputs
(Level 2)
|
Significant
Unobservable
Inputs
(Level 3)
|
Total
|
||||||||||||
|
As of December 31, 2018
|
|
|
|
|
|
|
|
|
|||||||
|
Supplemental executive retirement plan assets
|
$
|
27.2
|
|
$
|
—
|
|
$
|
—
|
|
$
|
27.2
|
|
|||
|
Total financial assets
|
27.2
|
|
—
|
|
—
|
|
27.2
|
|
|||||||
|
Derivatives, net
|
—
|
|
(10.7
|
)
|
—
|
|
(10.7
|
)
|
|||||||
|
Total financial liabilities
|
$
|
—
|
|
$
|
(10.7
|
)
|
$
|
—
|
|
$
|
(10.7
|
)
|
|||
|
As of December 31, 2017
|
|
|
|
|
|
|
|
|
|||||||
|
Supplemental executive retirement plan assets
|
$
|
30.9
|
|
$
|
—
|
|
$
|
—
|
|
$
|
30.9
|
|
|||
|
Derivatives, net
|
—
|
|
6.8
|
|
—
|
|
6.8
|
|
|||||||
|
Total financial assets
|
$
|
30.9
|
|
$
|
6.8
|
|
$
|
—
|
|
$
|
37.7
|
|
|||
Supplemental Executive Retirement Plans
Our Ensco supplemental executive retirement plans (the "SERPs") are non-qualified plans that provide for eligible employees to defer a portion of their compensation for use after retirement. Assets held in the SERP were marketable securities measured at fair value on a recurring basis using Level 1 inputs and were included in other assets, net, on our consolidated balance sheets as of
December 31, 2018
and
2017
. The fair value measurements of assets held in the SERP were based on quoted market prices. Net unrealized
losses
of
$700,000
and
gains
of
$4.5 million
and
$1.8 million
from marketable securities held in our SERP were included in other, net, in our consolidated statements of operations for the years ended December 31,
2018, 2017 and 2016
, respectively.
Derivatives
Our derivatives were measured at fair value on a recurring basis using Level 2 inputs as of
December 31, 2018
and
2017
. See "Note 7 - Derivative Instruments" for additional information on our derivatives, including a description of our foreign currency hedging activities and related methodologies used to manage foreign currency exchange rate risk. The fair value measurements of our derivatives were based on market prices that are generally observable for similar assets or liabilities at commonly quoted intervals.
106
Other Financial Instruments
The carrying values and estimated fair values of our debt instruments as of
December 31, 2018
and
2017
were as follows (in millions):
|
December 31, 2018
|
December 31, 2017
|
|||||||||||||||
|
Carrying
Value
|
Estimated
Fair
Value
|
Carrying
Value
|
Estimated
Fair
Value
|
|||||||||||||
|
8.50% Senior notes due 2019
(1)
|
$
|
—
|
|
$
|
—
|
|
$
|
251.4
|
|
$
|
252.9
|
|
||||
|
6.875% Senior notes due 2020
(1)
|
127.5
|
|
121.6
|
|
477.9
|
|
473.1
|
|
||||||||
|
4.70% Senior notes due 2021
(1)
|
112.7
|
|
101.8
|
|
267.1
|
|
265.3
|
|
||||||||
|
3.00% Exchangeable senior notes due 2024
(2)
|
666.8
|
|
575.5
|
|
635.7
|
|
757.1
|
|
||||||||
|
4.50% Senior notes due 2024
|
619.8
|
|
405.2
|
|
619.3
|
|
527.1
|
|
||||||||
|
8.00% Senior notes due 2024
|
337.0
|
|
273.7
|
|
337.9
|
|
333.8
|
|
||||||||
|
5.20% Senior notes due 2025
|
664.4
|
|
443.9
|
|
663.6
|
|
571.4
|
|
||||||||
|
7.75% Senior notes due 2026
|
985.0
|
|
725.5
|
|
—
|
|
—
|
|
||||||||
|
7.20% Debentures due 2027
|
149.3
|
|
109.1
|
|
149.3
|
|
141.9
|
|
||||||||
|
7.875% Senior notes due 2040
|
375.0
|
|
223.2
|
|
376.7
|
|
258.8
|
|
||||||||
|
5.75% Senior notes due 2044
|
972.9
|
|
566.3
|
|
971.8
|
|
690.4
|
|
||||||||
|
Total
|
$
|
5,010.4
|
|
$
|
3,545.8
|
|
$
|
4,750.7
|
|
$
|
4,271.8
|
|
||||
|
(1)
|
The decline in the carrying value of our 8.50% senior notes due 2019, 6.875% senior notes due 2020 and our 4.70% senior notes due 2021 from
December 31, 2017
to
December 31, 2018
is primarily due to debt repurchases and redemptions as discussed in "Note 6 - Debt".
|
|
(2)
|
Our 3.00% exchangeable senior notes due 2024 (the "2024 Convertible Notes") were issued with a conversion feature. The 2024 Convertible Notes were separated into their liability and equity components on our consolidated balance sheet. The equity component was initially recorded to additional paid-in capital and as a debt discount, which will be amortized to interest expense. Excluding the unamortized discount, the carrying value of the 2024 Convertible Notes was
$836.3 million
and
$834.0 million
as of
December 31, 2018
and
2017
. See "Note 6 - Debt" for additional information on this issuance.
|
The estimated fair values of our senior notes and debentures were determined using quoted market prices. The estimated fair values of our cash and cash equivalents, short-term investments, receivables, trade payables and other liabilities approximated their carrying values as of
December 31, 2018
and
2017
.
5. PROPERTY AND EQUIPMENT
Property and equipment as of
December 31, 2018
and
2017
consisted of the following (in millions):
|
2018
|
2017
|
|||||||
|
Drilling rigs and equipment
|
$
|
14,542.5
|
|
$
|
12,272.4
|
|
||
|
Work-in-progress
|
779.2
|
|
2,876.3
|
|
||||
|
Other
|
195.3
|
|
183.4
|
|
||||
|
|
$
|
15,517.0
|
|
$
|
15,332.1
|
|
||
Work-in-progress as of
December 31, 2018
primarily consisted of
$416.8 million
related to the construction of ultra-deepwater drillships ENSCO DS-13 and ENSCO DS-14 and
$352.4 million
related to the construction of ENSCO 123, an ultra-premium harsh environment jackup rig.
107
Work-in-progress as of
December 31, 2017
primarily consisted of
$2.0 billion
related to the construction of ultra-deepwater drillships ENSCO DS-9, ENSCO DS-10, ENSCO DS-13 and ENSCO DS-14,
$423.6 million
related to the construction of premium jackup rigs ENSCO 140 and ENSCO 141 and
$321.6 million
related to the construction of ENSCO 123, an ultra-premium harsh environment jackup rig.
ENSCO DS-9, ENSCO DS-10, ENSCO 140 and ENSCO 141 were placed into service and reclassified from work-in-progress to drilling rigs and equipment during the year ended
December 31, 2018
.
Impairment of Long-Lived Assets
On a quarterly basis, we evaluate the carrying value of our property and equipment to identify events or changes in circumstances ("triggering events") that indicate the carrying value may not be recoverable.
During 2018, we recorded a pre-tax, non-cash loss on impairment of
$40.3 million
related to one older non-core jackup rig. During the fourth quarter, we concluded that a triggering event occurred due to the expiration of a legacy higher day rate contract resulting in the performance of a recoverability test. We determined that the estimated undiscounted cash flows over the remaining useful life of the rig were not sufficient to recover the rig’s carrying value and concluded the rig was impaired as of December 31, 2018.
During 2017, we recognized a pre-tax, non-cash loss on impairment of
$182.9 million
related to older, less capable, non-core assets in our fleet. During the fourth quarter, we determined that the remaining useful life of certain non-core rigs would not extend substantially beyond their current contracts, resulting in triggering events and the performance of recoverability tests. Our estimates of undiscounted cash flows over the revised estimated remaining useful lives were not sufficient to recover each asset’s carrying value. Accordingly, we concluded that
two
semisubmersibles and
one
jackup were impaired as of December 31, 2017.
For rigs whose carrying values were determined not to be recoverable during 2018 and 2017, we recorded an impairment for the difference between their fair values and carrying values. We estimated the fair values of these rigs by applying an income approach, using projected discounted cash flows. These valuations were based on unobservable inputs that require significant judgments for which there is limited information, including assumptions regarding future day rates, utilization, operating costs and capital requirements. Forecasted day rates and utilization took into account market conditions and our anticipated business outlook.
If the global economy, our overall business outlook and/or our expectations regarding the marketability of one or more of our drilling rigs deteriorate further, we may conclude that a triggering event has occurred and perform a recoverability test that could lead to a material impairment charge in future periods.
108
6. DEBT
The carrying value of our long-term debt as of
December 31, 2018
and
2017
consisted of the following (in millions):
|
2018
|
2017
|
|||||||
|
8.50% Senior notes due 2019
(1)
|
$
|
—
|
|
$
|
251.4
|
|
||
|
6.875% Senior notes due 2020
(1)
|
127.5
|
|
477.9
|
|
||||
|
4.70% Senior notes due 2021
(1)
|
112.7
|
|
267.1
|
|
||||
|
3.00% Exchangeable senior notes due 2024
(2)
|
666.8
|
|
635.7
|
|
||||
|
4.50% Senior notes due 2024
|
619.8
|
|
619.3
|
|
||||
|
8.00% Senior notes due 2024
|
337.0
|
|
337.9
|
|
||||
|
5.20% Senior notes due 2025
|
664.4
|
|
663.6
|
|
||||
|
7.75% Senior notes due 2026
|
985.0
|
|
—
|
|
||||
|
7.20% Debentures due 2027
|
149.3
|
|
149.3
|
|
||||
|
7.875% Senior notes due 2040
|
375.0
|
|
376.7
|
|
||||
|
5.75% Senior notes due 2044
|
972.9
|
|
971.8
|
|
||||
|
Total long-term debt
|
$
|
5,010.4
|
|
$
|
4,750.7
|
|
||
|
(1)
|
The decline in the carrying value of our
8.50%
senior notes due 2019,
6.875%
senior notes due 2020 and our
4.70%
senior notes due 2021 resulted from repurchases and redemptions during the first quarter of 2018 discussed below.
|
|
(2)
|
Our 2024 Convertible Notes were issued with a conversion feature. The 2024 Convertible Notes were separated into their liability and equity components on our consolidated balance sheet. The equity component was initially recorded to additional paid-in capital and as a debt discount that will be amortized to interest expense over the life of the instrument. Excluding the unamortized discount, the carrying value of the 2024 Convertible Notes was
$836.3 million
and
$834.0 million
as of December 31,
2018
and
2017
, respectively.
|
2024 Convertible Notes
In December 2016, Ensco Jersey Finance Limited, a wholly-owned subsidiary of Ensco plc, issued
$849.5 million
aggregate principal amount of unsecured
2024
Convertible Notes in a private offering. The 2024 Convertible Notes are fully and unconditionally guaranteed, on a senior, unsecured basis, by Ensco plc and are exchangeable into cash, our Class A ordinary shares or a combination thereof, at our election. Interest on the 2024 Convertible Notes is payable semiannually on January 31 and July 31 of each year. The 2024 Convertible Notes will mature on January 31, 2024, unless exchanged, redeemed or repurchased in accordance with their terms prior to such date. Holders may exchange their 2024 Convertible Notes at their option any time prior to July 31, 2023 only under certain circumstances set forth in the indenture governing the 2024 Convertible Notes. On or after July 31, 2023, holders may exchange their 2024 Convertible Notes at any time. The exchange rate is
71.3343
shares per
$1,000
principal amount of notes, representing an exchange price of
$14.02
per share, and is subject to adjustment upon certain events. The 2024 Convertible Notes may not be redeemed by us except in the event of certain tax law changes.
109
Upon conversion of the 2024 Convertible Notes, holders will receive cash, our Class A ordinary shares or a combination thereof, at our election. Our intent is to settle the principal amount of the 2024 Convertible Notes in cash upon conversion. If the conversion value exceeds the principal amount (i.e., our share price exceeds the exchange price on the date of conversion), we expect to deliver shares equal to our conversion obligation in excess of the principal amount. During each respective reporting period that our average share price exceeds the exchange price, an assumed number of shares required to settle the conversion obligation in excess of the principal amount will be included in the denominator for our computation of diluted EPS using the treasury stock method. See "Note 1 - Description of the Business and Summary of Significant Accounting Policies" for additional information regarding the impact to our EPS.
The 2024 Convertible Notes were separated into their liability and equity components and included in long-term debt and additional paid-in capital on our consolidated balance sheet, respectively. The carrying amount of the liability component was calculated by measuring the estimated fair value of a similar liability that does not include an associated conversion feature. The carrying amount of the equity component representing the conversion feature was determined by deducting the fair value of the liability component from the principal amount of the 2024 Convertible Notes. The difference between the carrying amount of the liability and the principal amount is amortized to interest expense over the term of the 2024 Convertible Notes, together with the coupon interest, resulting in an effective interest rate of approximately
8%
per annum. The equity component is not remeasured if we continue to meet certain conditions for equity classification.
The costs related to the issuance of the 2024 Convertible Notes were allocated to the liability and equity components based on their relative fair values. Issuance costs attributable to the liability component are amortized to interest expense over the term of the notes and the issuance costs attributable to the equity component were recorded to additional paid-in capital on our consolidated balance sheet.
As of
December 31, 2018
and
2017
, the 2024 Convertible Notes consist of the following (in millions):
|
Liability component:
|
2018
|
2017
|
||||||
|
Principal
|
$
|
849.5
|
|
$
|
849.5
|
|
||
|
Less: Unamortized debt discount and issuance costs
|
(182.7
|
)
|
(213.8
|
)
|
||||
|
Net carrying amount
|
666.8
|
|
635.7
|
|
||||
|
Equity component, net
|
$
|
220.0
|
|
$
|
220.0
|
|
||
During the year ended
December 31, 2018
, we recognized
$25.5 million
associated with coupon interest and
$31.0 million
associated with the amortization of debt discount and issuance costs. During the year ended
December 31, 2017
, we recognized
$25.5 million
associated with coupon interest and
$31.4 million
associated the amortization of debt discount and issuance costs.
The indenture governing the 2024 Convertible Notes contains customary events of default, including failure to pay principal or interest on such notes when due, among others. The indenture also contains certain restrictions, including, among others, restrictions on our ability and the ability of our subsidiaries to create or incur secured indebtedness, enter into certain sale/leaseback transactions and enter into certain merger or consolidation transactions.
Senior Notes
On January 26, 2018, we issued
$1.0 billion
aggregate principal amount of unsecured
7.75%
senior notes due 2026 (the "2026 Notes") at par, net of
$16.5 million
of debt issuance costs. Interest on the 2026 Notes is payable semiannually on February 1 and August 1 of each year.
During 2017, we exchanged
$332.0 million
aggregate principal amount of unsecured
8.00%
senior notes due
2024
(the “8 % 2024 Notes”) for certain amounts of our outstanding senior notes due 2019, 2020 and 2021. Interest on the 8% 2024 Notes is payable semiannually on January 31 and July 31 of each year.
110
During 2015, we issued
$700.0 million
aggregate principal amount of unsecured
5.20%
senior notes due
2025
(the “2025 Notes”) at a discount of
$2.6 million
and
$400.0 million
aggregate principal amount of unsecured
5.75%
senior notes due
2044
(the “New 2044 Notes”) at a discount of
$18.7 million
in a public offering. Interest on the 2025 Notes is payable semiannually on March 15 and September 15 of each year. Interest on the New 2044 Notes is payable semiannually on April 1 and October 1 of each year.
During 2014, we issued
$625.0 million
aggregate principal amount of unsecured
4.50%
senior notes due
2024
(the "2024 Notes") at a discount of
$850,000
and
$625.0 million
aggregate principal amount of unsecured
5.75%
senior notes due
2044
(the "Existing 2044 Notes" and together with the New 2044 Notes, the "2044 Notes") at a discount of
$2.8 million
. Interest on the 2024 Notes and the Existing 2044 Notes is payable semiannually on April 1 and October 1 of each year. The Existing 2044 Notes and the New 2044 Notes are treated as a single series of debt securities under the indenture governing the notes.
During 2011, we issued
$1.5 billion
aggregate principal amount of unsecured
4.70%
senior notes due
2021
(the “2021 Notes”) at a discount of
$29.6 million
in a public offering. Interest on the 2021 Notes is payable semiannually on March 15 and September 15 of each year.
Upon consummation of the Pride acquisition during 2011, we assumed outstanding debt comprised of
$900.0 million
aggregate principal amount of unsecured
6.875%
senior notes due
2020
,
$500.0 million
aggregate principal amount of unsecured
8.5%
senior notes due
2019
and
$300.0 million
aggregate principal amount of unsecured
7.875%
senior notes due
2040
(collectively, the "Acquired Notes" and together with the 2021 Notes, 8% 2024 Notes, 2024 Notes, 2025 Notes, 2026 Notes and 2044 Notes, the "Senior Notes"). Ensco plc has fully and unconditionally guaranteed the performance of all Pride obligations with respect to the Acquired Notes. See "
Note 15 - Guarantee of Registered Securities
" for additional information on the guarantee of the Acquired Notes.
We may redeem the 8% 2024 Notes, 2024 Notes, 2025 Notes, 2026 Notes and 2044 Notes in whole at any time, or in part from time to time, prior to maturity. If we elect to redeem the 8% 2024 Notes, 2024 Notes, 2025 Notes and 2026 Notes before the date that is three months prior to the maturity date or the 2044 Notes before the date that is six months prior to the maturity date, we will pay an amount equal to
100%
of the principal amount of the notes redeemed plus accrued and unpaid interest and a "make-whole" premium. If we elect to redeem the 8% 2024 Notes, 2024 Notes, 2025 Notes, 2026 Notes or 2044 Notes on or after the aforementioned dates, we will pay an amount equal to
100%
of the principal amount of the notes redeemed plus accrued and unpaid interest but we are not required to pay a "make-whole" premium.
We may redeem each series of the 2021 Notes and the Acquired Notes, in whole or in part, at any time at a price equal to
100%
of their principal amount, plus accrued and unpaid interest and a "make-whole" premium.
The indentures governing the Senior Notes contain customary events of default, including failure to pay principal or interest on such notes when due, among others. The indentures governing the Senior Notes also contain certain restrictions, including, among others, restrictions on our ability and the ability of our subsidiaries to create or incur secured indebtedness, enter into certain sale/leaseback transactions and enter into certain merger or consolidation transactions.
Debentures Due 2027
During 1997, Ensco International Incorporated issued
$150.0 million
of unsecured
7.20%
Debentures due
2027
(the "Debentures"). Interest on the Debentures is payable semiannually on May 15 and November 15 of each year. We may redeem the Debentures, in whole or in part, at any time prior to maturity, at a price equal to
100%
of their principal amount, plus accrued and unpaid interest and a "make-whole" premium. During 2009, Ensco plc entered into a supplemental indenture to unconditionally guarantee the principal and interest payments on the Debentures. See "
Note 15 - Guarantee of Registered Securities
" for additional information on the guarantee of the Debentures.
The Debentures and the indenture pursuant to which the Debentures were issued also contain customary events of default, including failure to pay principal or interest on the Debentures when due, among others. The indenture also
111
contains certain restrictions, including, among others, restrictions on our ability and the ability of our subsidiaries to create or incur secured indebtedness, enter into certain sale/leaseback transactions and enter into certain merger or consolidation transactions.
Tender Offers, Redemptions and Open Market Repurchases
Concurrent with the issuance of the 2026 Notes in January 2018, we launched cash tender offers for up to
$985.0 million
aggregate principal amount of certain series of our senior notes issued by us and Pride. The tender offers expired February 7, 2018, and we repurchased
$182.6 million
of our 8.50% senior notes due 2019,
$256.6 million
of our 6.875% senior notes due 2020 and
$156.2 million
of the 2021 Notes. Subsequently, we issued a redemption notice for the remaining outstanding
$55.0 million
principal amount of the 8.50% senior notes due 2019 and repurchased
$71.4 million
principal amount of our senior notes due 2020. As a result of these transactions, we recognized a pre-tax loss from debt extinguishment of
$19.0 million
, net of discounts, premiums, debt issuance costs and commissions during the first quarter of 2018.
During 2017, we repurchased
$194.1 million
of our outstanding senior notes on the open market for an aggregate purchase price of
$204.5 million
with cash on hand and recognized an insignificant pre-tax gain, net of discounts, premiums and debt issuance costs.
Our tender offers and open market repurchases during the two-year period ended
December 31, 2018
were as follows (in millions):
Year Ended December 31, 2018
|
Aggregate Principal Amount Repurchased
|
Aggregate Repurchase Price
(1)
|
||||||
|
8.50% Senior notes due 2019
|
$
|
237.6
|
|
$
|
256.8
|
|
|
|
6.875% Senior notes due 2020
|
328.0
|
|
354.7
|
|
|||
|
4.70% Senior notes due 2021
|
156.2
|
|
159.7
|
|
|||
|
Total
|
$
|
721.8
|
|
$
|
771.2
|
|
|
Year Ended December 31, 2017
|
Aggregate Principal Amount Repurchased
|
Aggregate Repurchase Price
(1)
|
||||||
|
8.50% Senior notes due 2019
|
$
|
54.6
|
|
$
|
60.1
|
|
|
|
6.875% Senior notes due 2020
|
100.1
|
|
105.1
|
|
|||
|
4.70% Senior notes due 2021
|
39.4
|
|
39.3
|
|
|||
|
Total
|
$
|
194.1
|
|
$
|
204.5
|
|
|
|
(1)
|
Excludes accrued interest paid to holders of the repurchased senior notes.
|
112
Exchange Offers
During 2017, we completed exchange offers to exchange our outstanding
2019
Notes,
2020
Notes and
2021
Notes for our
8%
2024
Notes and cash. The exchange offers resulted in the tender of
$649.5 million
aggregate principal amount of our outstanding notes that were settled and exchanged as follows (in millions):
|
Aggregate Principal Amount Repurchased
|
8% Senior Notes Due 2024 Consideration
|
Cash
Consideration |
Total Consideration
|
||||||||||||
|
8.50% Senior notes due 2019
|
$
|
145.8
|
|
$
|
81.6
|
|
$
|
81.7
|
|
$
|
163.3
|
|
|||
|
6.875% Senior notes due 2020
|
129.8
|
|
69.3
|
|
69.4
|
|
138.7
|
|
|||||||
|
4.70% Senior notes due 2021
|
373.9
|
|
181.1
|
|
181.4
|
|
362.5
|
|
|||||||
|
Total
|
$
|
649.5
|
|
$
|
332.0
|
|
$
|
332.5
|
|
$
|
664.5
|
|
|||
During the year ended December 31, 2017, we recognized a pre-tax loss on the exchange offers of approximately
$6.2 million
, consisting of a loss of
$3.5 million
that includes the write-off of premiums on tendered debt and
$2.7 million
of transaction costs.
Debt to Equity Exchange
During 2016, we entered into a privately-negotiated exchange agreement whereby we issued
1,822,432
Class A ordinary shares, representing less than one percent of our outstanding shares, in exchange for
$24.5 million
principal amount of our 2044 Notes, resulting in a pre-tax gain from debt extinguishment of
$8.8 million
.
Revolving Credit
In October 2017, we amended our revolving credit facility ("Credit Facility") to extend the final maturity date by two years. Previously, our Credit Facility had a borrowing capacity of
$2.25 billion
through September 2019 that declined to
$1.13 billion
through September 2020. Subsequent to the amendment, our borrowing capacity is
$2.0 billion
through September 2019 and declines to
$1.3 billion
through September 2020 and to
$1.2 billion
through September 2022. The credit agreement governing our Credit Facility includes an accordion feature allowing us to increase the commitments expiring in September 2022 up to an aggregate amount not to exceed
$1.5 billion
.
Advances under the Credit Facility bear interest at Base Rate or LIBOR plus an applicable margin rate, depending on our credit ratings. We are required to pay a quarterly commitment fee on the undrawn portion of the
$2.0 billion
commitment, which is also based on our credit ratings.
In January 2018, Moody's downgraded our senior unsecured bond credit rating from B2 to B3. The rating actions resulted in an increase to the interest rates applicable to our borrowings and the quarterly commitment fee on the undrawn portion of the
$2.0 billion
commitment. The applicable margin rates are
3.00%
per annum for Base Rate advances and
4.00%
per annum for LIBOR advances. The quarterly commitment fee is
0.75%
per annum on the undrawn portion of the
$2.0 billion
commitment.
The Credit Facility requires us to maintain a total debt to total capitalization ratio that is less than or equal to
60%
and to provide guarantees from certain of our rig-owning subsidiaries sufficient to meet certain guarantee coverage ratios. The Credit Facility also contains customary restrictive covenants, including, among others, prohibitions on creating, incurring or assuming certain debt and liens (subject to customary exceptions, including a permitted lien basket that permits us to raise secured debt up to the lesser of
$750 million
or
10%
of consolidated tangible net worth (as defined in the Credit Facility)); entering into certain merger arrangements; selling, leasing, transferring or otherwise disposing of all or substantially all of our assets; making a material change in the nature of the business; paying or distributing dividends on our ordinary shares (subject to certain exceptions, including the ability to continue paying a
113
quarterly dividend of
$0.01
per share); borrowings, if after giving effect to any such borrowings and the application of the proceeds thereof, the aggregate amount of available cash (as defined in the Credit Facility) would exceed
$150 million
; and entering into certain transactions with affiliates.
The Credit Facility also includes a covenant restricting our ability to repay indebtedness maturing after September 2022, which is the final maturity date of our Credit Facility. This covenant is subject to certain exceptions that permit us to manage our balance sheet, including the ability to make repayments of indebtedness (i) of acquired companies within
90 days
of the completion of the acquisition or (ii) if, after giving effect to such repayments, available cash is greater than
$250 million
and there are no amounts outstanding under the Credit Facility.
As of
December 31, 2018
, we were in compliance in all material respects with our covenants under the Credit Facility. We expect to remain in compliance with our Credit Facility covenants during
2019
. We had
no
amounts outstanding under the Credit Facility as of
December 31, 2018
and
2017
.
Our access to credit and capital markets depends on the credit ratings assigned to our debt. As a result of recent rating actions by credit rating agencies, we no longer maintain an investment-grade status. Our current credit ratings, and any additional actual or anticipated downgrades in our credit ratings, could limit our available options when accessing credit and capital markets, or when restructuring or refinancing our debt. In addition, future financings or refinancings may result in higher borrowing costs and require more restrictive terms and covenants, which may further restrict our operations.
Maturities
The descriptions of our senior notes above reflect the original principal amounts issued, which have subsequently changed as a result of our tenders, repurchases, exchanges, redemptions and new debt issuances such that the maturities of our debt were as follows (in millions):
|
Senior Notes
|
Original Principal
|
2016 Tenders, Repurchases and Equity Exchange
|
2017 Exchange Offers and Repurchases
|
2018 Tender Offers, Redemption and Debt Issuance
|
Remaining Principal
|
||||||||||||||
|
8.50% due 2019
|
$
|
500.0
|
|
$
|
(62.0
|
)
|
$
|
(200.4
|
)
|
$
|
(237.6
|
)
|
$
|
—
|
|
||||
|
6.875% due 2020
|
900.0
|
|
(219.2
|
)
|
(229.9
|
)
|
(328.0
|
)
|
122.9
|
|
|||||||||
|
4.70% due 2021
|
1,500.0
|
|
(817.0
|
)
|
(413.3
|
)
|
(156.2
|
)
|
113.5
|
|
|||||||||
|
3.00% Exchangeable senior notes due 2024
|
849.5
|
|
—
|
|
—
|
|
—
|
|
849.5
|
|
|||||||||
|
4.50% due 2024
|
625.0
|
|
(1.7
|
)
|
—
|
|
—
|
|
623.3
|
|
|||||||||
|
8.00% due 2024
|
—
|
|
—
|
|
332.0
|
|
—
|
|
332.0
|
|
|||||||||
|
5.20% due 2025
|
700.0
|
|
(30.7
|
)
|
—
|
|
—
|
|
669.3
|
|
|||||||||
|
7.75% due 2026
|
—
|
|
—
|
|
—
|
|
1,000.0
|
|
1,000.0
|
|
|||||||||
|
7.20% due 2027
|
150.0
|
|
—
|
|
—
|
|
—
|
|
150.0
|
|
|||||||||
|
7.875% due 2040
|
300.0
|
|
—
|
|
—
|
|
—
|
|
300.0
|
|
|||||||||
|
5.75% due 2044
|
1,025.0
|
|
(24.5
|
)
|
—
|
|
—
|
|
1,000.5
|
|
|||||||||
|
Total
|
$
|
6,549.5
|
|
$
|
(1,155.1
|
)
|
$
|
(511.6
|
)
|
$
|
278.2
|
|
$
|
5,161.0
|
|
||||
Interest Expense
Interest expense totaled
$282.7 million
,
$224.2 million
and
$228.8 million
for the years ended December 31,
2018, 2017 and 2016
, respectively, which was net of capitalized interest of
$62.6 million
,
$72.5 million
and
$45.7 million
associated with newbuild rig construction and other capital projects.
114
7. DERIVATIVE INSTRUMENTS
We use derivatives to reduce our exposure to various market risks, primarily foreign currency exchange rate risk. We maintain a foreign currency exchange rate risk management strategy that utilizes derivatives to reduce our exposure to unanticipated fluctuations in earnings and cash flows caused by changes in foreign currency exchange rates. We mitigate our credit risk relating to the counterparties of our derivatives by transacting with multiple, high-quality financial institutions, thereby limiting exposure to individual counterparties, and by entering into International Swaps and Derivatives Association, Inc. (“ISDA”) Master Agreements, which include provisions for a legally enforceable master netting agreement, with our derivative counterparties. See "Note 14 - Supplemental Financial Information" for additional information on the mitigation of credit risk relating to counterparties of our derivatives. We do not enter into derivatives for trading or other speculative purposes.
All derivatives were recorded on our consolidated balance sheets at fair value. Derivatives subject to legally enforceable master netting agreements were not offset on our consolidated balance sheets. Accounting for the gains and losses resulting from changes in the fair value of derivatives depends on the use of the derivative and whether it qualifies for hedge accounting. See "Note 1 - Description of the Business and Summary of Significant Accounting Policies" for additional information on our accounting policy for derivatives and "Note 4 - Fair Value Measurements" for additional information on the fair value measurement of our derivatives.
As of
December 31, 2018
and
2017
, our consolidated balance sheets included net foreign currency derivative
liabilities
of
$10.7 million
and
assets
of
$6.8 million
, respectively. All of our derivatives mature within the next
18
months.
Derivatives recorded at fair value on our consolidated balance sheets as of
December 31, 2018
and
2017
consisted of the following (in millions):
|
|
Derivative Assets
|
Derivative Liabilities
|
|||||||||||||
|
|
2018
|
2017
|
2018
|
2017
|
|||||||||||
|
Derivatives Designated as Hedging Instruments
|
|
|
|
|
|
|
|
|
|||||||
|
Foreign currency forward contracts - current
(1)
|
$
|
.2
|
|
$
|
5.9
|
|
$
|
8.3
|
|
$
|
.2
|
|
|||
|
Foreign currency forward contracts - non-current
(2)
|
—
|
|
.5
|
|
.4
|
|
.1
|
|
|||||||
|
|
.2
|
|
6.4
|
|
8.7
|
|
.3
|
|
|||||||
|
Derivatives not Designated as Hedging Instruments
|
|
|
|
|
|
|
|
|
|||||||
|
Foreign currency forward contracts - current
(1)
|
.4
|
|
.9
|
|
2.6
|
|
.2
|
|
|||||||
|
Total
|
$
|
.6
|
|
$
|
7.3
|
|
$
|
11.3
|
|
$
|
.5
|
|
|||
|
(1)
|
Derivative assets and liabilities that have maturity dates equal to or less than 12 months from the respective balance sheet dates were included in other current assets and accrued liabilities and other, respectively, on our consolidated balance sheets.
|
|
(2)
|
Derivative assets and liabilities that have maturity dates greater than 12 months from the respective balance sheet dates were included in other assets and other liabilities, respectively, on our consolidated balance sheets.
|
We utilize cash flow hedges to hedge forecasted foreign currency denominated transactions, primarily to reduce our exposure to foreign currency exchange rate risk associated with contract drilling expenses and capital expenditures denominated in various currencies. As of
December 31, 2018
, we had cash flow hedges outstanding to exchange an aggregate
$187.8 million
for various foreign currencies, including
$88.0 million
for British pounds,
$50.3 million
for Australian dollars,
$19.7 million
for euros,
$16.2 million
for Brazilian reals,
$11.0 million
for Singapore dollars and
$2.6 million
for other currencies.
115
Gains and losses, net of tax, on derivatives designated as cash flow hedges included in our consolidated statements of operations and comprehensive income for each of the years in the three-year period ended
December 31, 2018
were as follows (in millions):
|
Gain (Loss) Recognized in Other Comprehensive
Income ("OCI")
on Derivatives
(Effective Portion)
|
(Gain) Loss Reclassified from
AOCI into Income
(Effective Portion)
(1)
|
Gain (Loss) Recognized
in Income on
Derivatives (Ineffective
Portion and Amount
Excluded from
Effectiveness Testing)
(2)
|
|||||||||||||||||||||||||||||||||
|
2018
|
2017
|
2016
|
2018
|
2017
|
2016
|
2018
|
2017
|
2016
|
|||||||||||||||||||||||||||
|
Interest rate lock contracts
(3)
|
$
|
—
|
|
$
|
—
|
|
$
|
—
|
|
$
|
.2
|
|
$
|
.2
|
|
$
|
.2
|
|
$
|
—
|
|
$
|
—
|
|
$
|
—
|
|
||||||||
|
Foreign currency forward contracts
(4)
|
(9.7
|
)
|
8.5
|
|
(5.4
|
)
|
(1.2
|
)
|
.2
|
|
12.2
|
|
(1.9
|
)
|
(.7
|
)
|
1.9
|
|
|||||||||||||||||
|
Total
|
$
|
(9.7
|
)
|
$
|
8.5
|
|
$
|
(5.4
|
)
|
$
|
(1.0
|
)
|
$
|
.4
|
|
$
|
12.4
|
|
$
|
(1.9
|
)
|
$
|
(.7
|
)
|
$
|
1.9
|
|
||||||||
|
(1)
|
Changes in the fair value of cash flow hedges are recorded in AOCI. Amounts recorded in AOCI associated with cash flow hedges are subsequently reclassified into contract drilling, depreciation or interest expense as earnings are affected by the underlying hedged forecasted transaction.
|
|
(2)
|
Gains and losses recognized in income for amounts excluded from effectiveness testing were included in other, net, in our consolidated statements of operations.
|
|
(3)
|
Losses on interest rate lock derivatives reclassified from AOCI into income were included in interest expense, net, in our consolidated statements of operations.
|
|
(4)
|
During the year ended
December 31, 2018
,
$400,000
of
gains
were reclassified from AOCI into contract drilling expense and
$800,000
of
gains
were reclassified from AOCI into depreciation expense in our consolidated statement of operations. During the year ended
December 31, 2017
,
$1.1 million
of
losses
were reclassified from AOCI into contract drilling expense and
$900,000
of
gains
were reclassified from AOCI into depreciation expense in our consolidated statement of operations. During the year ended
December 31, 2016
,
$13.1 million
of
losses
were reclassified from AOCI into contract drilling and
$900,000
of
gains
were reclassified from AOCI into depreciation expense in our consolidated statement of operations.
|
We have net assets and liabilities denominated in numerous foreign currencies and use various methods to manage our exposure to foreign currency exchange rate risk. We predominantly structure our drilling contracts in U.S. dollars, which significantly reduces the portion of our cash flows and assets denominated in foreign currencies. We occasionally enter into derivatives that hedge the fair value of recognized foreign currency denominated assets or liabilities but do not designate such derivatives as hedging instruments. In these situations, a natural hedging relationship generally exists whereby changes in the fair value of the derivatives offset changes in the fair value of the underlying hedged items. As of
December 31, 2018
, we held derivatives not designated as hedging instruments to exchange an aggregate
$175.7 million
for various foreign currencies, including
$89.3 million
for euros,
$19.8 million
for Australian dollars,
$19.6 million
for Qatari riyals,
$10.3 million
for Indonesian rupiahs,
$10.2 million
for British pounds and
$26.5 million
for other currencies.
Net
losses
of
$11.8 million
, gains of
$10.0 million
and
losses
of
$7.0 million
associated with our derivatives not designated as hedging instruments were included in other, net, in our consolidated statements of operations for the years ended December 31,
2018, 2017 and 2016
, respectively.
116
As of
December 31, 2018
, the estimated amount of net
losses
associated with derivatives, net of tax, that will be reclassified to earnings during the next 12 months was as follows (in millions):
|
Net unrealized losses to be reclassified to contract drilling expense
|
$
|
(5.2
|
)
|
|
|
Net realized gains to be reclassified to depreciation expense
|
.8
|
|
||
|
Net realized losses to be reclassified to interest expense
|
(.2
|
)
|
||
|
Net losses to be reclassified to earnings
|
$
|
(4.6
|
)
|
|
117
8. SHAREHOLDERS' EQUITY
Activity in our various shareholders' equity accounts for each of the years in the three-year period ended
December 31, 2018
was as follows (in millions):
|
Shares
|
Par Value
|
Additional
Paid-in
Capital
|
Retained
Earnings
|
AOCI
|
Treasury
Shares
|
Non-controlling
Interest
|
||||||||||||||||||||
|
BALANCE, December 31, 2015
|
242.9
|
|
$
|
24.4
|
|
$
|
5,554.5
|
|
$
|
985.3
|
|
$
|
12.5
|
|
$
|
(63.8
|
)
|
$
|
4.3
|
|
||||||
|
Net income
|
—
|
|
—
|
|
—
|
|
890.2
|
|
—
|
|
—
|
|
6.9
|
|
||||||||||||
|
Dividends paid ($0.04 per share)
|
—
|
|
—
|
|
—
|
|
(11.4
|
)
|
—
|
|
—
|
|
—
|
|
||||||||||||
|
Distributions to noncontrolling interests
|
—
|
|
—
|
|
—
|
|
—
|
|
—
|
|
—
|
|
(7.8
|
)
|
||||||||||||
|
Equity issuance
|
65.6
|
|
6.5
|
|
579.0
|
|
—
|
|
—
|
|
—
|
|
—
|
|
||||||||||||
|
Equity for debt exchange
|
1.8
|
|
.2
|
|
14.8
|
|
—
|
|
—
|
|
—
|
|
—
|
|
||||||||||||
|
Equity component of convertible debt
|
—
|
|
—
|
|
220.0
|
|
—
|
|
—
|
|
—
|
|
—
|
|
||||||||||||
|
Contributions from noncontrolling interests
|
—
|
|
—
|
|
—
|
|
—
|
|
—
|
|
—
|
|
1.0
|
|
||||||||||||
|
Tax expense on share-based compensation
|
—
|
|
—
|
|
(3.4
|
)
|
—
|
|
—
|
|
—
|
|
—
|
|
||||||||||||
|
Repurchase of shares
|
—
|
|
—
|
|
—
|
|
—
|
|
—
|
|
(2.0
|
)
|
—
|
|
||||||||||||
|
Share-based compensation cost
|
—
|
|
—
|
|
37.3
|
|
—
|
|
—
|
|
—
|
|
—
|
|
||||||||||||
|
Net other comprehensive loss
|
—
|
|
—
|
|
—
|
|
—
|
|
6.5
|
|
—
|
|
—
|
|
||||||||||||
|
BALANCE, December 31, 2016
|
310.3
|
|
31.1
|
|
6,402.2
|
|
1,864.1
|
|
19.0
|
|
(65.8
|
)
|
4.4
|
|
||||||||||||
|
Net loss
|
—
|
|
—
|
|
—
|
|
(303.7
|
)
|
—
|
|
—
|
|
(.5
|
)
|
||||||||||||
|
Dividends paid ($0.04 per share)
|
—
|
|
—
|
|
—
|
|
(13.6
|
)
|
—
|
|
—
|
|
—
|
|
||||||||||||
|
Cumulative-effect reduction from adoption of ASU 2016-16
|
—
|
|
—
|
|
—
|
|
(14.1
|
)
|
—
|
|
—
|
|
—
|
|
||||||||||||
|
Distributions to noncontrolling interests
|
—
|
|
—
|
|
—
|
|
—
|
|
—
|
|
—
|
|
(6.0
|
)
|
||||||||||||
|
Equity issuance in connection with Atwood Merger
|
132.2
|
|
13.2
|
|
757.5
|
|
—
|
|
—
|
|
—
|
|
—
|
|
||||||||||||
|
Shares issued under share-based compensation plans, net
|
4.5
|
|
.5
|
|
(.4
|
)
|
—
|
|
—
|
|
(1.3
|
)
|
—
|
|
||||||||||||
|
Repurchase of shares
|
—
|
|
—
|
|
—
|
|
—
|
|
—
|
|
(1.9
|
)
|
—
|
|
||||||||||||
|
Share-based compensation cost
|
—
|
|
—
|
|
35.7
|
|
—
|
|
—
|
|
—
|
|
—
|
|
||||||||||||
|
Net other comprehensive income
|
—
|
|
—
|
|
—
|
|
—
|
|
9.6
|
|
—
|
|
—
|
|
||||||||||||
|
BALANCE, December 31, 2017
|
447.0
|
|
44.8
|
|
7,195.0
|
|
1,532.7
|
|
28.6
|
|
(69.0
|
)
|
(2.1
|
)
|
||||||||||||
|
Net loss
|
—
|
|
—
|
|
—
|
|
(639.7
|
)
|
—
|
|
—
|
|
3.1
|
|
||||||||||||
|
Dividends paid ($0.04 per share)
|
—
|
|
—
|
|
—
|
|
(18.0
|
)
|
—
|
|
—
|
|
—
|
|
||||||||||||
|
Cumulative-effect reduction from adoption of ASU 2018-02
|
—
|
|
—
|
|
—
|
|
(.8
|
)
|
.8
|
|
—
|
|
—
|
|
||||||||||||
|
Shares issued under share-based compensation plans, net
|
13.7
|
|
1.4
|
|
(.6
|
)
|
—
|
|
—
|
|
(1.3
|
)
|
—
|
|
||||||||||||
|
Distributions to noncontrolling interests
|
—
|
|
—
|
|
—
|
|
—
|
|
—
|
|
—
|
|
(3.6
|
)
|
||||||||||||
|
Repurchase of shares
|
—
|
|
—
|
|
—
|
|
—
|
|
—
|
|
(1.9
|
)
|
—
|
|
||||||||||||
|
Share-based compensation cost
|
—
|
|
—
|
|
30.6
|
|
—
|
|
—
|
|
—
|
|
—
|
|
||||||||||||
|
Net other comprehensive income
|
—
|
|
—
|
|
—
|
|
—
|
|
(11.2
|
)
|
—
|
|
—
|
|
||||||||||||
|
BALANCE, December 31, 2018
|
460.7
|
|
$
|
46.2
|
|
$
|
7,225.0
|
|
$
|
874.2
|
|
$
|
18.2
|
|
$
|
(72.2
|
)
|
$
|
(2.6
|
)
|
||||||
In October 2017, as a result of the Atwood Merger, we issued
132.2 million
of our Class A Ordinary shares, representing total equity consideration of
$770.7 million
based on a closing price of
$5.83
per Class A ordinary share on October 5, 2017, the last trading day before the Merger Date.
118
In April, 2016, we closed an underwritten public offering of
65,550,000
Class A ordinary shares at
$9.25
per share. We received net proceeds from the offering of
$585.5 million
.
In October 2016, we entered into a privately-negotiated exchange agreement whereby we issued
1,822,432
Class A ordinary shares, representing less than one percent of our outstanding Class A ordinary shares, in exchange for
$24.5 million
principal amount of our 2044 Notes, resulting in a pre-tax gain from debt extinguishment of
$8.8 million
.
As a U.K. company governed in part by the Companies Act, we cannot issue new shares (other than in limited circumstances) without being authorized by our shareholders. At our 2018 annual general meeting, our shareholders authorized the allotment of
145.6 million
Class A ordinary shares (or
291.2 million
Class A ordinary shares in connection with an offer by way of a rights issue or other similar issue). This authority was further increased by shareholders at an additional general meeting on February 21, 2019, expiring at the next annual shareholder meeting or at the close of business on April 22, 2020 (whichever is earlier).
Under English law, we are only able to declare dividends and return funds to our shareholders out of the accumulated distributable reserves on our statutory balance sheet. The declaration and amount of future dividends is at the discretion of our Board of Directors and will depend on our profitability, liquidity, financial condition, market outlook, reinvestment opportunities, capital requirements and other factors and restrictions our Board of Directors deems relevant. There can be no assurance that we will pay a dividend in the future.
Our shareholders approved a new share repurchase program at our annual shareholder meeting held in May 2018. Subject to certain provisions under English law, including the requirement of Ensco plc to have sufficient distributable reserves, we may repurchase shares up to a maximum of
$500.0 million
in the aggregate from one or more financial intermediaries under the program, but in no case more than
65.0 million
shares. The program terminates in May 2023. Our prior share repurchase program approved by our shareholders in 2013, under which we could repurchase up to a maximum of
$2.0 billion
in the aggregate, not to exceed
35.0 million
shares, expired in May 2018. As of
December 31, 2018
, there had been
no
share repurchases under this program.
9. BENEFIT PLANS
In May 2018, our shareholders approved the 2018 Long-Term Incentive Plan (the "2018 LTIP") effective January 1, 2018, to provide for the issuance of non-vested share awards, share option awards and performance awards (collectively "awards"). The 2018 LTIP is similar to and replaces the Company's previously adopted 2012 Long-Term Incentive Plan (the “2012 LTIP”). No further awards will be granted under the 2012 LTIP. Under the 2018 LTIP,
59.0 million
shares were reserved for issuance as awards to officers, non-employee directors and key employees who are in a position to contribute materially to our growth, development and long-term success. As of
December 31, 2018
, there were
34.0 million
shares available for issuance as awards under the 2018 LTIP. Awards may be satisfied by newly issued shares, including shares held by a subsidiary or affiliated entity, or by delivery of shares held in an affiliated employee benefit trust at the Company's discretion.
In connection with the Atwood Merger, we assumed Atwood’s Amended and Restated 2007 Long-Term Incentive Plan (the “Atwood LTIP”) and the options outstanding thereunder. As of
December 31, 2018
, there were
1.4 million
shares remaining available for future issuance as awards under the Atwood LTIP, which may be granted to employees and other service providers who were not employed or engaged with Ensco prior to the Atwood Merger.
119
Non-Vested Share Awards and Cash-Settled Awards
Grants of share awards and share units (collectively "share awards") and share units to be settled in cash ("cash-settled awards"), generally vest at rates of
20%
or
33%
per year, as determined by a committee or subcommittee of the Board of Directors at the time of grant. During
2018
, we granted
114,000
cash-settled awards and
6.3 million
share awards to our employees and non-employee directors pursuant to the 2018 LTIP. Our non-vested share awards have voting and dividend rights effective on the date of grant, and our non-vested share units have dividend rights effective on the date of grant. Compensation expense for share awards is measured at fair value on the date of grant and recognized on a straight-line basis over the requisite service period (usually the vesting period). Compensation expense for cash-settled awards is remeasured each quarter with a cumulative adjustment to compensation cost during the period based on changes in our share price. Our compensation cost is reduced for forfeited awards in the period in which the forfeitures occur.
The following table summarizes share award and cash-settled award compensation expense recognized during each of the years in the three-year period ended
December 31, 2018
(in millions):
|
2018
|
2017
|
2016
|
|||||||||
|
Contract drilling
|
$
|
18.9
|
|
$
|
18.3
|
|
$
|
19.9
|
|
||
|
General and administrative
|
14.5
|
|
14.5
|
|
16.6
|
|
|||||
|
33.4
|
|
32.8
|
|
36.5
|
|
||||||
|
Tax benefit
|
(2.8
|
)
|
(4.8
|
)
|
(5.9
|
)
|
|||||
|
Total
|
$
|
30.6
|
|
$
|
28.0
|
|
$
|
30.6
|
|
||
The following table summarizes the value of share awards and cash-settled awards granted and vested during each of the years in the three-year period ended
December 31, 2018
:
|
Share Awards
|
Cash-Settled Awards
|
||||||||||||||||||||||
|
2018
|
2017
|
2016
|
2018
|
2017
|
2016
|
||||||||||||||||||
|
Weighted-average grant-date fair value of share awards granted (per share)
|
$
|
6.16
|
|
$
|
7.90
|
|
|
$
|
10.42
|
|
$
|
5.31
|
|
$
|
6.27
|
|
$
|
9.64
|
|
||||
|
Total fair value of share awards vested during the period (in millions)
|
$
|
7.5
|
|
$
|
8.6
|
|
|
$
|
8.8
|
|
$
|
9.9
|
|
$
|
3.9
|
|
$
|
—
|
|
||||
The following table summarizes share awards and cash-settled awards activity for the year ended
December 31, 2018
(shares in thousands):
|
Share Awards
|
Cash-settled Awards
|
||||||||||||
|
Awards
|
Weighted-Average
Grant-Date
Fair Value
|
Awards
|
Weighted-Average
Grant-Date
Fair Value
|
||||||||||
|
Share awards and cash-settled awards as of December 31, 2017
|
3,305
|
|
$
|
16.06
|
|
7,089
|
|
$
|
7.37
|
|
|||
|
Granted
|
6,298
|
|
6.16
|
|
114
|
|
5.31
|
|
|||||
|
Vested
|
(1,312
|
)
|
19.85
|
|
(1,512
|
)
|
7.53
|
|
|||||
|
Forfeited
|
(225
|
)
|
11.62
|
|
(574
|
)
|
7.18
|
|
|||||
|
Share awards and cash-settled awards as of December 31, 2018
|
8,066
|
|
$
|
7.84
|
|
5,117
|
|
$
|
7.30
|
|
|||
As of
December 31, 2018
, there was
$63.5 million
of total unrecognized compensation cost related to share awards, which is expected to be recognized over a weighted-average period of
3.5
years.
120
Share Option Awards
Share option awards ("options") granted to employees generally become exercisable in
25%
increments over a four-year period or
33%
increments over a three-year period and, to the extent not exercised, expire on either the seventh or tenth anniversary of the date of grant. The exercise price of options granted under the 2018 LTIP equals the market value of the underlying shares on the date of grant. As of
December 31, 2018
, options granted to purchase
691,852
shares with a weighted-average exercise price of
$25.46
were outstanding under the 2018 LTIP and predecessor or acquired plans. Excluding options assumed under the Atwood LTIP, no options have been granted since 2011, and there was
no
unrecognized compensation cost related to options as of
December 31, 2018
.
Performance Awards
Under the 2018 LTIP, performance awards may be issued to our senior executive officers. Performance awards are subject to achievement of specified performance goals based on relative total shareholder return ("TSR") and relative return on capital employed ("ROCE") as compared to a specified peer group. The performance goals are determined by a committee or subcommittee of the Board of Directors. Awards are payable in either Ensco shares or cash upon attainment of relative TSR and ROCE performance goals. Performance awards granted during 2017 and 2018 are payable in cash while performance awards granted in 2016 are payable in Ensco shares.
Performance awards generally vest at the end of a
three
-year measurement period based on attainment of performance goals. Our performance awards granted during 2016 are classified as equity awards and awards granted during 2017 and 2018 are classified as liability awards, all with compensation expense recognized over the requisite service period. The estimated probable outcome of attainment of the specified performance goals is based primarily on relative performance over the requisite performance period. Any subsequent changes in this estimate for the relative ROCE performance goal for the 2016 awards and both the ROCE and TSR performance goals for the 2017 and 2018 awards are recognized as a cumulative adjustment to compensation cost in the period in which the change in estimate occurs.
The aggregate grant-date fair value of performance awards granted during
2018, 2017 and 2016
totaled
$6.7 million
,
$6.7 million
and
$6.1 million
, respectively. The aggregate fair value of performance awards vested during
2018, 2017 and 2016
totaled
$0.7 million
,
$2.9 million
and
$2.8 million
, respectively.
During the years ended December 31,
2018, 2017 and 2016
, we recognized
$8.2 million
,
$8.4 million
and
$3.1 million
of compensation expense for performance awards, respectively, which was included in general and administrative expense in our consolidated statements of operations. As of
December 31, 2018
, there was
$10.3 million
of total unrecognized compensation cost related to unvested performance awards, which is expected to be recognized over a weighted-average period of
1.9
years.
Savings Plans
We have savings plans, (the Ensco Savings Plan, the Ensco Multinational Savings Plan and the Ensco Limited Retirement Plan), which cover eligible employees as defined within each plan. The Ensco Savings Plan includes a 401(k) savings plan feature, which allows eligible employees to make tax-deferred contributions to the plan. The Ensco Limited Retirement Plan also allows eligible employees to make tax-deferred contributions to the plan. Contributions made to the Ensco Multinational Savings Plan may or may not qualify for tax deferral based on each plan participant's local tax requirements.
We generally make matching cash contributions to the plans. We match
100%
of the amount contributed by the employee up to a maximum of
5%
of eligible salary. Matching contributions totaled
$14.4 million
,
$12.2 million
and
$16.7 million
for the years ended December 31,
2018, 2017 and 2016
, respectively. Any additional discretionary contributions made into the plans require approval of the Board of Directors and are generally paid in cash. We recorded an additional discretionary contribution provision of
$19.2 million
for the year ended December 31, 2016, which was paid during 2017. Matching contributions and additional discretionary contributions become vested in
33%
increments upon completion of each initial year of service with all contributions becoming fully vested subsequent to achievement
121
of
three
or more years of service. As of January 1, 2019, the plans were modified such that all previously paid employer contributions became 100% vested and any future employer contributions will vest immediately. We have
1.0 million
shares reserved for issuance as matching contributions under the Ensco Savings Plan.
10. INCOME TAXES
We generated losses of
$115.1 million
, profits of
$6.3 million
and losses of
$151.6 million
from continuing operations before income taxes in the U.S. and losses of
$423.8 million
and
$202.3 million
and profits of
$1.1 billion
from continuing operations before income taxes in non-U.S. jurisdictions for the years ended December 31, 2018,
2017
and
2016
, respectively.
The following table summarizes components of our provision for income taxes from continuing operations for each of the years in the three-year period ended
December 31, 2018
(in millions):
|
2018
|
2017
|
2016
|
|||||||||
|
Current income tax (benefit) expense:
|
|
|
|
|
|
|
|||||
|
U.S.
|
$
|
(19.9
|
)
|
$
|
(2.2
|
)
|
$
|
(6.6
|
)
|
||
|
Non-U.S.
|
52.9
|
|
56.4
|
|
86.4
|
|
|||||
|
|
33.0
|
|
54.2
|
|
79.8
|
|
|||||
|
Deferred income tax expense:
|
|
|
|
|
|
|
|||||
|
U.S.
|
52.9
|
|
36.0
|
|
15.9
|
|
|||||
|
Non-U.S.
|
3.7
|
|
19.0
|
|
12.8
|
|
|||||
|
|
56.6
|
|
55.0
|
|
28.7
|
|
|||||
|
Total income tax expense
|
$
|
89.6
|
|
$
|
109.2
|
|
$
|
108.5
|
|
||
U.S. Tax Reform
U.S. tax reform was enacted on December 22, 2017 and introduced significant changes to U.S. income tax law, including a reduction in the statutory income tax rate from
35%
to
21%
effective January 1, 2018, a one-time transition tax on deemed repatriation of deferred foreign income, a base erosion anti-abuse tax that effectively imposes a minimum tax on certain payments to non-U.S. affiliates, new and revised rules relating to the current taxation of certain income of foreign subsidiaries and revised rules associated with limitations on the deduction of interest.
Due to the timing of the enactment of U.S. tax reform and the complexity involved in applying its provisions, we made reasonable estimates of its effects and recorded such amounts in our consolidated financial statements as of December 31, 2017 on a provisional basis. Throughout 2018, we continued to analyze applicable information and data, interpret rules and guidance issued by the U.S. Treasury Department and Internal Revenue Service, and make adjustments to the provisional amounts as provided for in Staff Accounting Bulletin No. 118. The U.S. Treasury Department is expected to continue finalizing rules associated with U.S. tax reform during 2019 and, when issued, these rules may have a material impact on our consolidated financial statements.
During 2018, we recognized a tax benefit of
$11.7 million
associated with the one-time transition tax on deemed repatriation of the deferred foreign income of our U.S. subsidiaries. We recognized a net tax expense of
$16.5 million
during the fourth quarter of 2017 in connection with enactment of U.S. tax reform, consisting of a
$38.5 million
tax expense associated with the one-time transition tax on deemed repatriation of the deferred foreign income of our U.S. subsidiaries, a
$17.3 million
tax expense associated with revisions to rules over the taxation of income of foreign subsidiaries, a
$20.0 million
tax benefit resulting from the re-measurement of our deferred tax assets and liabilities as of December 31, 2017 to reflect the reduced tax rate and a
$19.3 million
tax benefit resulting from adjustments to the valuation allowance on deferred tax assets.
122
Deferred Taxes
The following table summarizes significant components of deferred income tax assets and liabilities as of
December 31, 2018
and
2017
(in millions):
|
2018
|
2017
|
|||||||
|
Deferred tax assets
:
|
|
|
||||||
|
Net operating loss carryforwards
|
$
|
148.4
|
|
$
|
187.1
|
|
||
|
Foreign tax credits
|
123.6
|
|
132.3
|
|
||||
|
Interest limitation carryforwards
|
40.2
|
|
—
|
|
||||
|
Premiums on long-term debt
|
23.8
|
|
36.1
|
|
||||
|
Employee benefits, including share-based compensation
|
15.4
|
|
20.7
|
|
||||
|
Deferred revenue
|
10.3
|
|
26.0
|
|
||||
|
Other
|
14.5
|
|
12.8
|
|
||||
|
Total deferred tax assets
|
376.2
|
|
415.0
|
|
||||
|
Valuation allowance
|
(316.0
|
)
|
(278.8
|
)
|
||||
|
Net deferred tax assets
|
60.2
|
|
136.2
|
|
||||
|
Deferred tax liabilities
:
|
|
|
|
|
||||
|
Property and equipment
|
(54.5
|
)
|
(51.5
|
)
|
||||
|
Deferred U.S. tax on foreign income
|
(31.5
|
)
|
(24.8
|
)
|
||||
|
Deferred costs
|
(5.3
|
)
|
(9.1
|
)
|
||||
|
Deferred transition tax
|
—
|
|
(13.7
|
)
|
||||
|
Other
|
(3.7
|
)
|
(8.7
|
)
|
||||
|
Total deferred tax liabilities
|
(95.0
|
)
|
(107.8
|
)
|
||||
|
Net deferred tax asset (liability)
|
$
|
(34.8
|
)
|
$
|
28.4
|
|
||
The realization of substantially all of our deferred tax assets is dependent upon generating sufficient taxable income during future periods in various jurisdictions in which we operate. Realization of certain of our deferred tax assets is not assured. We recognize a valuation allowance for deferred tax assets when it is more-likely-than-not that the benefit from the deferred tax asset will not be realized. The amount of deferred tax assets considered realizable could increase or decrease in the near-term if our estimates of future taxable income change.
As of
December 31, 2018
, we had deferred tax assets of
$123.6 million
for U.S. foreign tax credits (“FTCs”),
$148.4 million
related to
$784.2 million
of net operating loss (“NOL”) carryforwards and
$40.2 million
for U.S. interest limitation carryforwards, which can be used to reduce our income taxes payable in future years. The FTCs expire between
2022
and
2028
. NOL carryforwards, which were generated in various jurisdictions worldwide, include
$449.8 million
that do not expire and
$334.4 million
that will expire, if not utilized, between
2019
and
2037
. U.S. interest limitation carryforwards do not expire. Due to the uncertainty of realization, we have a
$271.8 million
valuation allowance on FTC, NOL carryforwards and U.S. interest limitation carryforwards.
123
Effective Tax Rate
Ensco plc, our parent company, is domiciled and resident in the U.K. Our subsidiaries conduct operations and earn income in numerous countries and are subject to the laws of taxing jurisdictions within those countries. The income of our non-U.K. subsidiaries is generally not subject to U.K. taxation. Income tax rates imposed in the tax jurisdictions in which our subsidiaries conduct operations vary, as does the tax base to which the rates are applied. In some cases, tax rates may be applicable to gross revenues, statutory or negotiated deemed profits or other bases utilized under local tax laws, rather than to net income.
Our drilling rigs frequently move from one taxing jurisdiction to another to perform contract drilling services. In some instances, the movement of drilling rigs among taxing jurisdictions will involve the transfer of ownership of the drilling rigs among our subsidiaries. As a result of frequent changes in the taxing jurisdictions in which our drilling rigs are operated and/or owned, changes in profitability levels and changes in tax laws, our annual effective income tax rate may vary substantially from one reporting period to another. In periods of declining profitability, our income tax expense may not decline proportionally with income, which could result in higher effective income tax rates. Further, we may continue to incur income tax expense in periods in which we operate at a loss.
Our consolidated effective income tax rate on continuing operations for each of the years in the three-year period ended
December 31, 2018
, differs from the U.K. statutory income tax rate as follows:
|
2018
|
2017
|
2016
|
||||||
|
U.K. statutory income tax rate
|
19.0
|
%
|
19.2
|
%
|
20.0
|
%
|
||
|
Non-U.K. taxes
|
(18.0
|
)
|
(40.4
|
)
|
(7.9
|
)
|
||
|
Valuation allowance
|
(16.9
|
)
|
(18.0
|
)
|
2.6
|
|
||
|
Debt repurchases
|
(1.6
|
)
|
(2.8
|
)
|
(4.1
|
)
|
||
|
Asset impairments
|
(1.4
|
)
|
(17.1
|
)
|
—
|
|
||
|
Bargain purchase gain
|
(.2
|
)
|
13.8
|
|
—
|
|
||
|
U.S. tax reform
|
2.2
|
|
(8.4
|
)
|
—
|
|
||
|
Tax restructuring transaction
|
1.7
|
|
—
|
|
—
|
|
||
|
Other
|
(1.4
|
)
|
(2.0
|
)
|
.3
|
|
||
|
Effective income tax rate
|
(16.6
|
)%
|
(55.7
|
)%
|
10.9
|
%
|
||
Our 2018 consolidated effective income tax rate includes the impact of various discrete tax items, including
$46.0 million
of tax benefit associated with the utilization of foreign tax credits subject to a valuation allowance, the transition tax on deemed repatriation of the deferred foreign income of our U.S. subsidiaries and a restructuring transaction, partially offset by
$21.0 million
of tax expense related to recovery of certain costs associated with an ongoing legal matter, repurchase and redemption of senior notes, unrecognized tax benefits associated with tax positions taken in prior years and rig sales.
Our 2017 consolidated effective income tax rate includes
$32.2 million
associated with the impact of various discrete tax items, including
$16.5 million
of tax expense associated with U.S. tax reform and
$15.7 million
of tax expense associated with the exchange offers and debt repurchases, rig sales, a restructuring transaction, settlement of a previously disclosed legal contingency, the effective settlement of a liability for unrecognized tax benefits associated with a tax position taken in prior years and other resolutions of prior year tax matters.
Our 2016 consolidated effective income tax rate includes the impact of various discrete tax items, including a
$16.9 million
tax expense resulting from net gains on the repurchase of various debt during the year, the recognition of an
$8.4 million
net tax benefit relating to the sale of various rigs, a
$5.5 million
tax benefit resulting from a net reduction in the valuation allowance on U.S. foreign tax credits and a net
$5.3 million
tax benefit associated with liabilities for unrecognized tax benefits and other adjustments relating to prior years.
124
Excluding the impact of the aforementioned discrete tax items, our consolidated effective income tax rates for the years ended December 31,
2018
,
2017
and
2016
were
(24.8)%
,
(96.0)%
and
20.3%
, The changes in our consolidated effective income tax rate, excluding discrete tax items, during the three-year period result primarily from U.S. tax reform and changes in the relative components of our earnings from the various taxing jurisdictions in which our drilling rigs are operated and/or owned and differences in tax rates in such taxing jurisdictions.
Unrecognized Tax Benefits
Our tax positions are evaluated for recognition using a more-likely-than-not threshold, and those tax positions requiring recognition are measured as the largest amount of tax benefit that is greater than
50%
likely of being realized upon effective settlement with a taxing authority that has full knowledge of all relevant information. As of
December 31, 2018
, we had
$143.0 million
of unrecognized tax benefits, of which
$136.5 million
was included in other liabilities on our consolidated balance sheet and the remaining
$6.5 million
, which is associated with a tax position taken in tax years with NOL carryforwards, was presented as a reduction of deferred tax assets. As of
December 31, 2017
, we had
$147.6 million
of unrecognized tax benefits, of which
$139.4 million
was included in other liabilities on our consolidated balance sheet and the remaining
$8.2 million
, which is associated with a tax position taken in tax years with NOL carryforwards, was presented as a reduction of deferred tax assets. If recognized,
$127.4 million
of the
$143.0 million
unrecognized tax benefits as of
December 31, 2018
would impact our consolidated effective income tax rate. A reconciliation of the beginning and ending amount of unrecognized tax benefits for the years ended
December 31, 2018
and
2017
is as follows (in millions):
|
2018
|
2017
|
|||||||
|
Balance, beginning of year
|
$
|
147.6
|
|
$
|
122.0
|
|
||
|
Increases in unrecognized tax benefits as a result
of tax positions taken during the current year
|
6.5
|
|
5.4
|
|
||||
|
Impact of foreign currency exchange rates
|
(5.0
|
)
|
8.1
|
|
||||
|
Lapse of applicable statutes of limitations
|
(4.5
|
)
|
(.4
|
)
|
||||
|
Increase in unrecognized tax benefits as a result
of tax positions taken during prior years
|
2.5
|
|
.7
|
|
||||
|
Decreases in unrecognized tax benefits as a result
of tax positions taken during prior years |
(3.8
|
)
|
(.2
|
)
|
||||
|
Settlements with taxing authorities
|
(.3
|
)
|
(10.2
|
)
|
||||
|
Increases in unrecognized tax benefits as a result of the Atwood Merger
|
—
|
|
22.2
|
|
||||
|
Balance, end of year
|
$
|
143.0
|
|
$
|
147.6
|
|
||
Accrued interest and penalties totaled
$40.5 million
and
$38.6 million
as of
December 31, 2018
and
2017
, respectively, and were included in other liabilities on our consolidated balance sheets. We recognized a net expense of
$1.9 million
and
$4.4 million
and a net benefit of
$3.8 million
associated with interest and penalties during the years ended December 31,
2018, 2017 and 2016
, respectively. Interest and penalties are included in current income tax expense in our consolidated statements of operations.
Our 2014 and subsequent years remain subject to examination for U.S. federal tax returns. Tax years as early as 2005 remain subject to examination in the other major tax jurisdictions in which we operated.
Statutes of limitations applicable to certain of our tax positions lapsed during
2018, 2017 and 2016
, resulting in net income tax benefits, inclusive of interest and penalties, of
$5.3 million
,
$1.1 million
and
$600,000
, respectively.
Absent the commencement of examinations by tax authorities, statutes of limitations applicable to certain of our tax positions will lapse during
2019
. Therefore, it is reasonably possible that our unrecognized tax benefits will decline during the next 12 months by
$500,000
, inclusive of
$300,000
of accrued interest and penalties, all of which would impact our consolidated effective income tax rate if recognized.
125
Intercompany Transfer of Drilling Rigs
In October 2016, the FASB issued Accounting Standards Update 2016-16, Income Taxes (Topic 740): Intra-Entity Transfers of Assets Other Than Inventory (“Update 2016-16”), which requires entities to recognize the income tax consequences of an intra-entity transfer of an asset other than inventory when the transaction occurs as opposed to deferring tax consequences and amortizing them into future periods. We adopted Update 2016-16 on a modified retrospective basis effective January 1, 2017. As a result of modified retrospective application, we reduced prepaid taxes on intercompany transfers of property and related deferred tax liabilities resulting in the recognition of a cumulative-effect reduction in retained earnings of
$14.1 million
on our consolidated balance sheet as of January 1, 2017. We did not recognize any income tax benefit or expense from the intercompany transfer of drilling rigs during the years ended December 31, 2018 and 2017, respectively.
Undistributed Earnings
Dividend income received by Ensco plc from its subsidiaries is exempt from U.K. taxation. We do not provide deferred taxes on undistributed earnings of certain subsidiaries because our policy and intention is to reinvest such earnings indefinitely. Each of the subsidiaries for which we maintain such policy has sufficient net assets, liquidity, contract backlog and/or other financial resources available to meet operational and capital investment requirements, which allows us to continue to maintain our policy of reinvesting the undistributed earnings indefinitely.
As of December 31, 2018, the aggregate undistributed earnings of the subsidiaries for which we maintain a policy and intention to reinvest earnings indefinitely totaled
$386.7 million
. Should we make a distribution from these subsidiaries in the form of dividends or otherwise, we would be subject to additional income taxes. The unrecognized deferred tax liability related to these undistributed earnings was not practicable to estimate as of December 31, 2018.
11. DISCONTINUED OPERATIONS
Our business strategy has been to focus on ultra-deepwater floater and premium jackup operations and de-emphasize other assets and operations that are not part of our long-term strategic plan or that no longer meet our standards for economic returns. Consistent with this strategy, we sold
12
jackup rigs,
five
dynamically positioned semisubmersible rigs,
one
moored semisubmersible rig and
two
drillships during the three-year period ended
December 31, 2018
.
We continue to focus on our fleet management strategy in light of the new composition of our rig fleet and will continue to review our fleet composition as we position Ensco for the future. As part of this strategy, we may act opportunistically from time to time to monetize assets to enhance shareholder value and improve our liquidity profile, in addition to selling or disposing of older, lower-specification or non-core rigs.
Prior to 2015, individual rig disposals were classified as discontinued operations once the rigs met the criteria to be classified as held-for-sale. The operating results of the rigs through the date the rig was sold as well as the gain or loss on sale were included in results from discontinued operations, net, in our consolidated statement of operations. Net proceeds from the sales of the rigs were included in investing activities of discontinued operations in our consolidated statement of cash flows in the period in which the proceeds were received.
During 2015, we adopted the Financial Accounting Standards Board’s Accounting Standards Update 2014-08,
Presentation of Financial Statements
(
Topic 205
)
and Property, Plant, and Equipment
(
Topic 360
):
Reporting Discontinued Operations and Disclosures of Disposals of Components of an Entity
("
Update 2014-08
"). Under the new guidance, only disposals representing a strategic shift in operations should be presented as discontinued operations. As a result, individual assets that are classified as held-for-sale beginning in 2015 are not reported as discontinued operations and their operating results and gain or loss on sale of these rigs are included in continuing operations in our consolidated statements of operations. Rigs that were classified as held-for-sale prior to 2015 continue to be reported as discontinued operations.
126
The following rig sales were included in discontinued operations during the three-year period ended
December 31, 2018
(in millions):
|
Rig
|
Date of Sale
|
Segment
(1)
|
Net Proceeds
|
Net Book Value
(2)
|
Pre-tax Gain (Loss)
|
|||||||||||
|
ENSCO 7500
|
April 2018
|
Floaters
|
$
|
2.6
|
|
$
|
1.5
|
|
$
|
1.1
|
|
|||||
|
ENSCO 90
|
June 2017
|
Jackups
|
.3
|
|
.3
|
|
—
|
|
||||||||
|
ENSCO DS-2
|
May 2016
|
Floaters
|
5.0
|
|
4.0
|
|
1.0
|
|
||||||||
|
ENSCO 58
|
April 2016
|
Jackups
|
.7
|
|
.3
|
|
.4
|
|
||||||||
|
ENSCO 6000
|
April 2016
|
Floaters
|
.6
|
|
|
.8
|
|
(.2
|
)
|
|||||||
|
|
$
|
9.2
|
|
$
|
6.9
|
|
$
|
2.3
|
|
|||||||
(1)
The rigs' operating results were reclassified to discontinued operations in our consolidated statements of operations for each of the years in the three-year period ended
December 31, 2018
and were previously included within the specified operating segment.
(2)
Includes the rig's net book value as well as inventory and other assets on the date of the sale.
The following table summarizes income (loss) from discontinued operations for each of the years in the three-year period ended
December 31, 2018
(in millions):
|
2018
|
2017
|
2016
|
|||||||||
|
Revenues
|
$
|
—
|
|
$
|
—
|
|
$
|
—
|
|
||
|
Operating expenses
|
2.0
|
|
1.5
|
|
3.1
|
|
|||||
|
Operating loss
|
(2.0
|
)
|
(1.5
|
)
|
(3.1
|
)
|
|||||
|
Income tax expense (benefit)
|
7.1
|
|
(2.1
|
)
|
(10.1
|
)
|
|||||
|
Gain on disposal of discontinued operations, net
|
1.0
|
|
.4
|
|
1.1
|
|
|||||
|
Income (loss) from discontinued operations
|
$
|
(8.1
|
)
|
$
|
1.0
|
|
$
|
8.1
|
|
||
Income tax benefit from discontinued operations for the years ended
December 31, 2018
,
2017
and
2016
included
$6.9 million
of discrete tax expense and
$2.1 million
and
$10.2 million
of discrete tax benefits, respectively.
Debt and interest expense are not allocated to our discontinued operations.
12. COMMITMENTS AND CONTINGENCIES
Leases
We are obligated under leases for certain of our offices and equipment. Rental expense relating to operating leases was
$40.1 million
,
$37.0 million
and
$39.7 million
during the years ended December 31,
2018, 2017 and 2016
, respectively. Future minimum rental payments under our noncancellable operating lease obligations are as follows:
$32.3 million
during
2019
;
$18.7 million
during
2020
;
$11.9 million
during
2021
;
$9.2 million
during
2022
;
$8.9 million
during
2023
and
$15.2 million
thereafter.
127
Capital Commitments
The following table summarizes the cumulative amount of contractual payments made as of
December 31, 2018
for our rigs under construction and estimated timing of our remaining contractual payments (in millions):
|
Cumulative Paid
(1)
|
2019
|
2020
|
Thereafter
|
Total
(2)
|
||||||||||||||||
|
ENSCO 123
(3)
|
$
|
276.4
|
|
$
|
9.0
|
|
$
|
—
|
|
$
|
—
|
|
$
|
285.4
|
|
|||||
|
ENSCO DS-14
(4)
|
15.0
|
|
—
|
|
165.0
|
|
—
|
|
180.0
|
|
||||||||||
|
ENSCO DS-13
(4)
|
—
|
|
83.9
|
|
—
|
|
—
|
|
83.9
|
|
||||||||||
|
$
|
291.4
|
|
$
|
92.9
|
|
$
|
165.0
|
|
$
|
—
|
|
$
|
549.3
|
|
||||||
|
(1)
|
Cumulative paid represents the aggregate amount of contractual payments made from commencement of the construction agreement through
December 31, 2018
. Contractual payments made by Atwood prior to the Atwood Merger for ENSCO DS-13 and ENSCO DS-14 are excluded.
|
|
(2)
|
Total commitments are based on fixed-price shipyard construction contracts, exclusive of our internal costs associated with project management, commissioning and systems integration testing. Total commitments also exclude holding costs and interest.
|
|
(3)
|
In January 2018, we made a milestone payment of
$207.4 million
. The remaining unpaid balance of
$9.0 million
is due upon delivery. The
$207.4 million
milestone payment was invoiced and included in accounts payable - trade as of December 31, 2017 on our consolidated balance sheet.
|
|
(4)
|
The remaining milestone payments for ENSCO DS-13 and ENSCO DS-14 bear interest at a rate of 4.5% per annum, which accrues during the holding period until delivery. Delivery is scheduled for September 2019 and June 2020 for ENSCO DS-13 and ENSCO DS-14, respectively. Upon delivery, the remaining milestone payments and accrued interest thereon may be financed through a promissory note with the shipyard for each rig. The promissory notes will bear interest at a rate of 5.0% per annum with a maturity date of December 30, 2022 and will be secured by a mortgage on each respective rig. The remaining milestone payments for ENSCO DS-13 and ENSCO DS-14 are included in the table above in the period in which we expect to take delivery of the rig. However, we may elect to execute the promissory notes and defer payment until December 2022.
|
The actual timing of these expenditures may vary based on the completion of various construction milestones, which are, to a large extent, beyond our control.
DSA Dispute
On January 4, 2016, Petrobras sent a notice to us declaring the drilling services agreement with Petrobras (the "DSA") for ENSCO DS-5, a drillship ordered from Samsung Heavy Industries, a shipyard in South Korea ("SHI"), void effective immediately, reserving its rights and stating its intention to seek any restitution to which it may be entitled. The previously disclosed arbitral hearing on liability related to the matter was held in March 2018. Prior to the arbitration tribunal issuing its decision, we and Petrobras agreed in August 2018 to a settlement of all claims relating to the DSA. No payments were made by either party in connection with the settlement agreement. The parties agreed to normalize business relations and the settlement agreement provides for our participation in current and future Petrobras tenders on the same basis as all other companies invited to these tenders. No losses were recognized during 2018 with respect to this settlement as all disputed receivables with Petrobras related to the DSA were fully reserved in 2015. See Item 3 “Legal Proceedings” in our quarterly report on Form 10-Q for the quarter ended June 30, 2018 for further information about the DSA dispute.
In November 2016, we initiated separate arbitration proceedings in the U.K. against SHI for the losses incurred in connection with the foregoing Petrobras arbitration and certain other losses relating to the DSA. SHI subsequently filed a statement of defense disputing our claim. In January 2018, the arbitration tribunal for the SHI matter issued an
128
award on liability fully in our favor. In August 2018, the tribunal awarded us approximately
$2.8 million
in costs and legal fees incurred to date, plus interest, which was collected during the fourth quarter.
The January 2018 arbitration award provides that SHI is liable to us for
$10 million
or damages that we can prove. We have submitted to the tribunal our claim for damages. The arbitral hearing on damages owed to us by SHI is scheduled to take place in the first quarter of 2019. We are unable to estimate the ultimate outcome of recovery for damages at this time.
Other Matters
In addition to the foregoing, we are named defendants or parties in certain other lawsuits, claims or proceedings incidental to our business and are involved from time to time as parties to governmental investigations or proceedings, including matters related to taxation, arising in the ordinary course of business. Although the outcome of such lawsuits or other proceedings cannot be predicted with certainty and the amount of any liability that could arise with respect to such lawsuits or other proceedings cannot be predicted accurately, we do not expect these matters to have a material adverse effect on our financial position, operating results and cash flows.
In the ordinary course of business with customers and others, we have entered into letters of credit to guarantee our performance as it relates to our drilling contracts, contract bidding, customs duties, tax appeals and other obligations in various jurisdictions. Letters of credit outstanding as of
December 31, 2018
totaled
$126.3 million
and are issued under facilities provided by various banks and other financial institutions. Obligations under these letters of credit and surety bonds are not normally called, as we typically comply with the underlying performance requirement. As of
December 31, 2018
, we had not been required to make collateral deposits with respect to these agreements.
13. SEGMENT INFORMATION
Our business consists of
three
operating segments: (1) Floaters, which includes our drillships and semisubmersible rigs, (2) Jackups and (3) Other, which consists of management services on rigs owned by third-parties. Our
two
reportable segments, Floaters and Jackups, provide
one
service, contract drilling.
Segment information for each of the years in the three-year period ended
December 31, 2018
is presented below (in millions). General and administrative expense and depreciation expense incurred by our corporate office are not allocated to our operating segments for purposes of measuring segment operating income and were included in "Reconciling Items." We measure segment assets as property and equipment.
Year Ended December 31, 2018
|
Floaters
|
Jackups
|
Other
|
Operating Segments Total
|
Reconciling Items
|
Consolidated Total
|
||||||||||||||||||
|
Revenues
|
$
|
1,013.5
|
|
$
|
630.9
|
|
$
|
61.0
|
|
$
|
1,705.4
|
|
$
|
—
|
|
$
|
1,705.4
|
|
|||||
|
Operating expenses
|
|||||||||||||||||||||||
|
Contract drilling
(exclusive of depreciation)
|
737.4
|
|
526.5
|
|
55.5
|
|
1,319.4
|
|
—
|
|
1,319.4
|
|
|||||||||||
|
Loss on impairment
|
—
|
|
40.3
|
|
—
|
|
40.3
|
|
—
|
|
40.3
|
|
|||||||||||
|
Depreciation
|
311.8
|
|
153.3
|
|
—
|
|
465.1
|
|
13.8
|
|
478.9
|
|
|||||||||||
|
General and administrative
|
—
|
|
—
|
|
—
|
|
—
|
|
102.7
|
|
102.7
|
|
|||||||||||
|
Operating income (loss)
|
$
|
(35.7
|
)
|
$
|
(89.2
|
)
|
$
|
5.5
|
|
$
|
(119.4
|
)
|
$
|
(116.5
|
)
|
$
|
(235.9
|
)
|
|||||
|
Property and equipment, net
|
$
|
9,465.6
|
|
$
|
3,114.1
|
|
$
|
—
|
|
$
|
12,579.7
|
|
$
|
36.5
|
|
$
|
12,616.2
|
|
|||||
|
Capital expenditures
|
$
|
105.5
|
|
$
|
317.7
|
|
$
|
—
|
|
$
|
423.2
|
|
$
|
3.5
|
|
$
|
426.7
|
|
|||||
129
Year Ended December 31, 2017
|
Floaters
|
Jackups
|
Other
|
Operating Segments Total
|
Reconciling Items
|
Consolidated Total
|
||||||||||||||||||
|
Revenues
|
$
|
1,143.5
|
|
$
|
640.3
|
|
$
|
59.2
|
|
$
|
1,843.0
|
|
$
|
—
|
|
$
|
1,843.0
|
|
|||||
|
Operating expenses
|
|||||||||||||||||||||||
|
Contract drilling
(exclusive of depreciation)
|
624.2
|
|
512.1
|
|
53.2
|
|
1,189.5
|
|
—
|
|
1,189.5
|
|
|||||||||||
|
Loss on impairment
|
174.7
|
|
8.2
|
|
—
|
|
182.9
|
|
—
|
|
182.9
|
|
|||||||||||
|
Depreciation
|
297.4
|
|
131.5
|
|
—
|
|
428.9
|
|
15.9
|
|
444.8
|
|
|||||||||||
|
General and administrative
|
—
|
|
—
|
|
—
|
|
—
|
|
157.8
|
|
157.8
|
|
|||||||||||
|
Operating income (loss)
|
$
|
47.2
|
|
$
|
(11.5
|
)
|
$
|
6.0
|
|
$
|
41.7
|
|
$
|
(173.7
|
)
|
$
|
(132.0
|
)
|
|||||
|
Property and equipment, net
|
$
|
9,650.9
|
|
$
|
3,177.6
|
|
$
|
—
|
|
$
|
12,828.5
|
|
$
|
45.2
|
|
$
|
12,873.7
|
|
|||||
|
Capital expenditures
|
$
|
470.3
|
|
$
|
62.1
|
|
$
|
—
|
|
$
|
532.4
|
|
$
|
4.3
|
|
$
|
536.7
|
|
|||||
Year Ended December 31, 2016
|
Floaters
|
Jackups
|
Other
|
Operating Segments Total
|
Reconciling Items
|
Consolidated Total
|
||||||||||||||||||
|
Revenues
|
$
|
1,771.1
|
|
$
|
929.5
|
|
$
|
75.8
|
|
$
|
2,776.4
|
|
$
|
—
|
|
$
|
2,776.4
|
|
|||||
|
Operating expenses
|
|||||||||||||||||||||||
|
Contract drilling
(exclusive of depreciation)
|
725.0
|
|
516.8
|
|
59.2
|
|
1,301.0
|
|
—
|
|
1,301.0
|
|
|||||||||||
|
Depreciation
|
304.1
|
|
123.7
|
|
—
|
|
427.8
|
|
17.5
|
|
445.3
|
|
|||||||||||
|
General and administrative
|
—
|
|
—
|
|
—
|
|
—
|
|
100.8
|
|
100.8
|
|
|||||||||||
|
Operating income
|
$
|
742.0
|
|
$
|
289.0
|
|
$
|
16.6
|
|
$
|
1,047.6
|
|
$
|
(118.3
|
)
|
$
|
929.3
|
|
|||||
|
Property and equipment, net
|
$
|
8,300.4
|
|
$
|
2,561.0
|
|
$
|
—
|
|
$
|
10,861.4
|
|
$
|
57.9
|
|
$
|
10,919.3
|
|
|||||
|
Capital expenditures
|
$
|
110.3
|
|
$
|
206.2
|
|
$
|
—
|
|
$
|
316.5
|
|
$
|
5.7
|
|
$
|
322.2
|
|
|||||
Information about Geographic Areas
As of
December 31, 2018
, our Floaters segment consisted of
10
drillships,
nine
dynamically positioned semisubmersible rigs and
three
moored semisubmersible rigs deployed in various locations. Additionally, our Floaters segment included
two
ultra-deepwater drillships under construction in South Korea. Our Jackups segment consisted of
35
jackup rigs, of which
34
were deployed in various locations and
one
was under construction in Singapore.
As of
December 31, 2018
, the geographic distribution of our drilling rigs by operating segment was as follows:
|
Floaters
|
Jackups
|
Total
|
|||
|
North & South America
|
8
|
4
|
12
|
||
|
Europe & the Mediterranean
|
7
|
11
|
18
|
||
|
Middle East & Africa
|
3
|
12
|
15
|
||
|
Asia & Pacific Rim
|
4
|
7
|
11
|
||
|
Asia & Pacific Rim (under construction)
|
2
|
1
|
3
|
||
|
Total
|
24
|
35
|
59
|
||
We provide management services on
two
rigs owned by third-parties not included in the table above.
For purposes of our long-lived asset geographic disclosure, we attribute assets to the geographic location of the drilling rig as of the end of the applicable year. For new construction projects, assets are attributed to the location
130
of future operation if known or to the location of construction if the ultimate location of operation is undetermined.
Information by country for those countries that account for more than
10%
of our long-lived assets as well as the United Kingdom, our country of domicile, was as follows (in millions):
|
|
Long-lived Assets
|
||||||||||
|
2018
|
2017
|
2016
|
|||||||||
|
Spain
|
$
|
2,306.6
|
|
$
|
2,004.2
|
|
$
|
2,334.5
|
|
||
|
United States
|
2,270.0
|
|
2,764.9
|
|
2,898.3
|
|
|||||
|
Nigeria
|
1,368.2
|
|
583.3
|
|
—
|
|
|||||
|
United Kingdom
|
1,185.2
|
|
609.4
|
|
409.0
|
|
|||||
|
Singapore
|
23.9
|
|
2,859.3
|
|
1,388.4
|
|
|||||
|
Other countries
|
5,462.3
|
|
4,052.6
|
|
3,889.1
|
|
|||||
|
Total
|
$
|
12,616.2
|
|
$
|
12,873.7
|
|
$
|
10,919.3
|
|
||
14. SUPPLEMENTAL FINANCIAL INFORMATION
Consolidated Balance Sheet Information
Accounts receivable, net, as of
December 31, 2018
and
2017
consisted of the following (in millions):
|
2018
|
2017
|
|||||||
|
Trade
(1)
|
$
|
301.7
|
|
$
|
335.4
|
|
||
|
Other
|
46.4
|
|
33.6
|
|
||||
|
|
348.1
|
|
369.0
|
|
||||
|
Allowance for doubtful accounts
(1)
|
(3.4
|
)
|
(23.6
|
)
|
||||
|
|
$
|
344.7
|
|
$
|
345.4
|
|
||
(1)
The decline in trade receivables and allowance for doubtful accounts is primarily due to the settlement with Petrobras described in "Note 12 - Commitments and Contingencies".
Other current assets as of
December 31, 2018
and
2017
consisted of the following (in millions):
|
2018
|
2017
|
|||||||
|
Inventory
|
$
|
268.1
|
|
$
|
278.8
|
|
||
|
Prepaid taxes
|
35.0
|
|
43.5
|
|
||||
|
Deferred costs
|
23.5
|
|
29.7
|
|
||||
|
Prepaid expenses
|
15.2
|
|
14.2
|
|
||||
|
Other
|
19.1
|
|
15.0
|
|
||||
|
$
|
360.9
|
|
$
|
381.2
|
|
|||
131
Other assets as of
December 31, 2018
and
2017
consisted of the following (in millions):
|
2018
|
2017
|
|||||||
|
Deferred tax assets
|
$
|
29.4
|
|
$
|
38.8
|
|
||
|
Supplemental executive retirement plan assets
|
27.2
|
|
30.9
|
|
||||
|
Deferred costs
|
21.5
|
|
37.4
|
|
||||
|
Intangible assets
|
2.5
|
|
15.7
|
|
||||
|
Other
|
17.2
|
|
17.4
|
|
||||
|
$
|
97.8
|
|
$
|
140.2
|
|
|||
Accrued liabilities and other as of
December 31, 2018
and
2017
consisted of the following (in millions):
|
2018
|
2017
|
|||||||
|
Accrued interest
|
$
|
100.6
|
|
$
|
83.1
|
|
||
|
Personnel costs
|
82.5
|
|
112.0
|
|
||||
|
Deferred revenue
|
56.9
|
|
71.9
|
|
||||
|
Income and other taxes payable
|
36.9
|
|
46.4
|
|
||||
|
Derivative liabilities
|
10.9
|
|
.4
|
|
||||
|
Other
|
30.2
|
|
12.1
|
|
||||
|
|
$
|
318.0
|
|
$
|
325.9
|
|
||
Other liabilities as of
December 31, 2018
and
2017
consisted of the following (in millions):
|
2018
|
2017
|
|||||||
|
Unrecognized tax benefits (inclusive of interest and penalties)
|
$
|
177.0
|
|
$
|
178.0
|
|
||
|
Deferred tax liabilities
|
70.7
|
|
18.5
|
|
||||
|
Intangible liabilities
|
53.5
|
|
59.6
|
|
||||
|
Supplemental executive retirement plan liabilities
|
28.1
|
|
32.0
|
|
||||
|
Personnel costs
|
25.1
|
|
18.1
|
|
||||
|
Deferred revenue
|
20.5
|
|
51.2
|
|
||||
|
Deferred rent
|
11.7
|
|
17.1
|
|
||||
|
Other
|
9.4
|
|
12.2
|
|
||||
|
|
$
|
396.0
|
|
$
|
386.7
|
|
||
Accumulated other comprehensive income as of
December 31, 2018
and
2017
consisted of the following (in millions):
|
2018
|
2017
|
|||||||
|
Derivative instruments
|
$
|
12.6
|
|
$
|
22.5
|
|
||
|
Currency translation adjustment
|
7.3
|
|
7.8
|
|
||||
|
Other
|
(1.7
|
)
|
(1.7
|
)
|
||||
|
$
|
18.2
|
|
$
|
28.6
|
|
|||
Consolidated Statement of Operations Information
Repair and maintenance expense related to continuing operations for each of the years in the three-year period ended
December 31, 2018
was as follows (in millions):
|
2018
|
2017
|
2016
|
||||||||||
|
Repair and maintenance expense
|
$
|
198.4
|
|
$
|
188.7
|
|
$
|
151.1
|
|
|||
132
Consolidated Statement of Cash Flows Information
Net cash provided by (used in) operating activities of continuing operations attributable to the net change in operating assets and liabilities for each of the years in the three-year period ended
December 31, 2018
was as follows (in millions):
|
2018
|
2017
|
2016
|
||||||||||
|
(Increase) decrease in accounts receivable
|
$
|
(6.2
|
)
|
$
|
83.2
|
|
$
|
222.4
|
|
|||
|
(Increase) decrease in other assets
|
(2.8
|
)
|
(14.0
|
)
|
44.0
|
|
||||||
|
Decrease in liabilities
|
(9.0
|
)
|
(3.8
|
)
|
(125.8
|
)
|
||||||
|
$
|
(18.0
|
)
|
$
|
65.4
|
|
$
|
140.6
|
|
||||
During periods in which our business contracts, resulting in significantly lower revenues and expenses as compared to the prior year, we typically generate positive cash flows from the net change in operating assets and liabilities as the impact from the collection of receivables that were accrued during the prior period is generally larger than the impact from the payment of expenses incurred in the prior period. For the years ended December 31, 2017 and 2016, our business contracted significantly as compared to the respective prior year periods resulting in positive cash generated from the net change in operating assets and liabilities. During the year ended December 31, 2018, our business contracted at a more moderate pace, resulting in modest negative cash flows from the net change in operating assets and liabilities.
Cash paid for interest and income taxes for each of the years in the three-year period ended
December 31, 2018
was as follows (in millions):
|
2018
|
2017
|
2016
|
||||||||||
|
Interest, net of amounts capitalized
|
$
|
232.6
|
|
$
|
199.8
|
|
$
|
264.8
|
|
|||
|
Income taxes
|
58.4
|
|
62.8
|
|
56.4
|
|
||||||
Capitalized interest totaled
$62.6 million
,
$72.5 million
and
$45.7 million
during the years ended December 31,
2018, 2017 and 2016
, respectively. Capital expenditure accruals totaling
$27.8 million
,
$234.3 million
and
$11.5 million
for the years ended December 31,
2018, 2017 and 2016
, respectively, were excluded from investing activities in our consolidated statements of cash flows. In January 2018, we made a
$207.4 million
milestone payment for ENSCO 123 and the remaining unpaid balance of
$9.0 million
is due upon delivery. The
$207.4 million
milestone payment was invoiced and included in accounts payable - trade as of December 31, 2017 on our consolidated balance sheet.
Amortization, net, includes amortization of deferred mobilization revenues and costs, deferred capital upgrade revenues, intangible amortization and other amortization.
Other includes amortization of debt discounts and premiums, deferred financing costs, deferred charges for income taxes incurred on intercompany transfers of drilling rigs and other items.
Concentration of Risk
We are exposed to credit risk relating to our receivables from customers, our cash and cash equivalents, investments and our use of derivatives in connection with the management of foreign currency exchange rate risk. We mitigate our credit risk relating to receivables from customers, which consist primarily of major international, government-owned and independent oil and gas companies, by performing ongoing credit evaluations. We also maintain reserves for potential credit losses, which generally have been within our expectations. We mitigate our credit risk relating to cash and investments by focusing on diversification and quality of instruments. Short-term investments consist of a portfolio of time deposits held with several well-capitalized financial institutions, and we monitor the financial condition of those financial institutions.
133
We mitigate our credit risk relating to counterparties of our derivatives through a variety of techniques, including transacting with multiple, high-quality financial institutions, thereby limiting our exposure to individual counterparties and by entering into ISDA Master Agreements, which include provisions for a legally enforceable master netting agreement, with our derivative counterparties. See "Note 7 - Derivative Instruments" for additional information on our derivative activity.
The terms of the ISDA agreements may also include credit support requirements, cross default provisions, termination events or set-off provisions. Legally enforceable master netting agreements reduce credit risk by providing protection in bankruptcy in certain circumstances and generally permitting the closeout and netting of transactions with the same counterparty upon the occurrence of certain events.
Consolidated revenues by customer for the years ended
December 31, 2018
,
2017
and
2016
were as follows:
|
2018
|
2017
|
2016
|
|||||||
|
Total
(1)
|
15
|
%
|
22
|
%
|
13
|
%
|
|||
|
Saudi Aramco
(2)
|
11
|
%
|
9
|
%
|
6
|
%
|
|||
|
Petrobras
(1)
|
8
|
%
|
11
|
%
|
9
|
%
|
|||
|
BP
(3)
|
7
|
%
|
15
|
%
|
12
|
%
|
|||
|
Other
|
59
|
%
|
43
|
%
|
60
|
%
|
|||
|
|
100
|
%
|
|
100
|
%
|
100
|
%
|
||
|
(1)
|
For the years ended December 31,
2018, 2017 and 2016
, all Total and Petrobras revenues were attributable to the Floater segment.
|
|
(2)
|
For the years ended December 31,
2018, 2017 and 2016
, all Saudi Aramco revenues were attributable to the Jackup segment.
|
|
(3)
|
For the year ended December 31, 2018,
27%
,
53%
and
20%
of BP revenues were attributable to our Floater, Other and Jackup segments, respectively. For the year ended December 31, 2017,
78%
of BP revenues were attributable to our Floater segment and the remaining revenues were attributable to our Other segment. For the year ended December 31, 2016,
76%
,
17%
and
7%
of BP revenues were attributable to our Floater, Other and Jackup segments, respectively.
|
For purposes of our geographic disclosure, we attribute revenues to the geographic location where such revenues are earned. Consolidated revenues by region, including the United Kingdom, our country of domicile, for the years ended December 31,
2018, 2017 and 2016
were as follows (in millions):
|
2018
|
2017
|
2016
|
||||||||||
|
Angola
(1)
|
$
|
285.7
|
|
$
|
445.7
|
|
$
|
552.1
|
|
|||
|
Australia
(2)
|
283.9
|
|
206.7
|
|
222.8
|
|
||||||
|
U.S. Gulf of Mexico
(3)
|
214.7
|
|
149.8
|
|
531.7
|
|
||||||
|
United Kingdom
(4)
|
192.6
|
|
164.6
|
|
246.2
|
|
||||||
|
Saudi Arabia
(4)
|
182.2
|
|
171.8
|
|
210.6
|
|
||||||
|
Brazil
(5)
|
139.6
|
|
196.2
|
|
298.0
|
|
||||||
|
Egypt
(5)
|
31.2
|
|
214.8
|
|
141.2
|
|
||||||
|
Other
|
375.5
|
|
293.4
|
|
573.8
|
|
||||||
|
$
|
1,705.4
|
|
$
|
1,843.0
|
|
$
|
2,776.4
|
|
||||
|
(1)
|
For the years ended December 31,
2018, 2017 and 2016
,
86%
,
88%
and
87%
of revenues earned in Angola, respectively, were attributable to our Floaters segment with the remaining revenues attributable to our Jackup segment.
|
134
|
(2)
|
For the years ended December 31,
2018, 2017 and 2016
,
92%
,
87%
and
95%
of revenues earned in Australia, respectively, were attributable to our Floaters segment with the remaining revenues attributable to our Jackup segment.
|
|
(3)
|
For the years ended December 31,
2018, 2017 and 2016
,
30%
,
29%
and
82%
of revenues earned in the U.S. Gulf of Mexico, respectively, were attributable to our Floaters segment,
42%
,
31%
and
7%
of revenues were attributable to our Jackup segment, respectively, and the remaining revenues were attributable to our Other segment, respectively.
|
|
(4)
|
For the years ended December 31,
2018, 2017 and 2016
, all revenues were attributable to our Jackup segment.
|
|
(5)
|
For the years ended December 31,
2018, 2017 and 2016
, all revenues were attributable to our Floater segment.
|
135
15. GUARANTEE OF REGISTERED SECURITIES
In connection with the Pride acquisition, Ensco plc and Pride entered into a supplemental indenture to the indenture dated as of July 1, 2004 between Pride and the Bank of New York Mellon, as indenture trustee, providing for, among other matters, the full and unconditional guarantee by Ensco plc of Pride’s
6.875%
senior notes due
2020
and
7.875%
senior notes due
2040
, which had an aggregate outstanding principal balance of $
422.9 million
as of
December 31, 2018
. The Ensco plc guarantee provides for the unconditional and irrevocable guarantee of the prompt payment, when due, of any amount owed to the holders of the notes.
Ensco plc is also a full and unconditional guarantor of the
7.2%
Debentures due
2027
issued by Ensco International Incorporated in November 1997, which had an aggregate outstanding principal balance of
$150.0 million
as of
December 31, 2018
.
Pride (formerly Pride International, Inc.) and Ensco International Incorporated are 100% owned subsidiaries of Ensco plc. All guarantees are unsecured obligations of Ensco plc ranking equal in right of payment with all of its existing and future unsecured and unsubordinated indebtedness.
The following tables present our condensed consolidating statements of operations for each of the years in the three-year period ended
December 31, 2018
; our condensed consolidating statements of comprehensive income (loss) for each of the years in the three-year period ended
December 31, 2018
; our condensed consolidating balance sheets as of
December 31, 2018
and
2017
; and our condensed consolidating statements of cash flows for each of the years in the three-year period ended
December 31, 2018
, in accordance with Rule 3-10 of Regulation S-X.
136
|
ENSCO PLC AND SUBSIDIARIES
CONDENSED CONSOLIDATING STATEMENTS OF OPERATIONS
Year Ended December 31, 2018
(in millions)
|
|||||||||||||||||||||||
|
|
Ensco plc
|
ENSCO International Incorporated
|
Pride International LLC
|
Other Non-guarantor Subsidiaries of Ensco
|
Consolidating Adjustments
|
Total
|
|||||||||||||||||
|
OPERATING REVENUES
|
$
|
49.5
|
|
$
|
155.2
|
|
$
|
—
|
|
$
|
1,802.8
|
|
$
|
(302.1
|
)
|
$
|
1,705.4
|
|
|||||
|
OPERATING EXPENSES
|
|||||||||||||||||||||||
|
Contract drilling (exclusive of depreciation)
|
51.0
|
|
139.5
|
|
—
|
|
1,431.0
|
|
(302.1
|
)
|
1,319.4
|
|
|||||||||||
|
Loss on impairment
|
—
|
|
—
|
|
—
|
|
40.3
|
|
—
|
|
40.3
|
|
|||||||||||
|
Depreciation
|
—
|
|
14.2
|
|
—
|
|
464.7
|
|
—
|
|
478.9
|
|
|||||||||||
|
General and administrative
|
46.3
|
|
.4
|
|
—
|
|
56.0
|
|
—
|
|
102.7
|
|
|||||||||||
|
OPERATING INCOME (LOSS)
|
(47.8
|
)
|
1.1
|
|
—
|
|
(189.2
|
)
|
—
|
|
(235.9
|
)
|
|||||||||||
|
OTHER INCOME (EXPENSE), NET
|
2.7
|
|
(135.2
|
)
|
(89.0
|
)
|
(109.0
|
)
|
27.5
|
|
(303.0
|
)
|
|||||||||||
|
LOSS FROM CONTINUING OPERATIONS BEFORE INCOME TAXES
|
(45.1
|
)
|
(134.1
|
)
|
|
(89.0
|
)
|
|
(298.2
|
)
|
|
27.5
|
|
|
(538.9
|
)
|
|||||||
|
INCOME TAX EXPENSE
|
—
|
|
43.3
|
|
—
|
|
46.3
|
|
—
|
|
89.6
|
|
|||||||||||
|
DISCONTINUED OPERATIONS, NET
|
—
|
|
—
|
|
—
|
|
(8.1
|
)
|
—
|
|
(8.1
|
)
|
|||||||||||
|
EQUITY EARNINGS (LOSSES) IN AFFILIATES, NET OF TAX
|
(594.6
|
)
|
121.8
|
|
93.3
|
|
—
|
|
379.5
|
|
—
|
|
|||||||||||
|
NET INCOME (LOSS)
|
(639.7
|
)
|
(55.6
|
)
|
|
4.3
|
|
|
(352.6
|
)
|
|
407.0
|
|
|
(636.6
|
)
|
|||||||
|
NET INCOME ATTRIBUTABLE TO NONCONTROLLING INTERESTS
|
—
|
|
—
|
|
—
|
|
(3.1
|
)
|
—
|
|
(3.1
|
)
|
|||||||||||
|
NET INCOME (LOSS) ATTRIBUTABLE TO ENSCO
|
$
|
(639.7
|
)
|
$
|
(55.6
|
)
|
|
$
|
4.3
|
|
|
$
|
(355.7
|
)
|
|
$
|
407.0
|
|
|
$
|
(639.7
|
)
|
|
137
|
ENSCO PLC AND SUBSIDIARIES
CONDENSED CONSOLIDATING STATEMENTS OF OPERATIONS
Year Ended December 31, 2017
(in millions)
|
|||||||||||||||||||||||
|
|
Ensco plc
|
ENSCO International Incorporated
|
Pride International LLC
|
Other Non-guarantor Subsidiaries of Ensco
|
Consolidating Adjustments
|
Total
|
|||||||||||||||||
|
OPERATING REVENUES
|
$
|
52.9
|
|
$
|
163.3
|
|
$
|
—
|
|
$
|
1,941.2
|
|
$
|
(314.4
|
)
|
$
|
1,843.0
|
|
|||||
|
OPERATING EXPENSES
|
|
|
|||||||||||||||||||||
|
Contract drilling (exclusive of depreciation)
|
50.0
|
|
149.9
|
|
—
|
|
1,304.0
|
|
(314.4
|
)
|
1,189.5
|
|
|||||||||||
|
Loss on impairment
|
—
|
|
—
|
|
—
|
|
182.9
|
|
—
|
|
182.9
|
|
|||||||||||
|
Depreciation
|
—
|
|
15.9
|
|
—
|
|
428.9
|
|
—
|
|
444.8
|
|
|||||||||||
|
General and administrative
|
45.4
|
|
50.8
|
|
—
|
|
61.6
|
|
—
|
|
157.8
|
|
|||||||||||
|
OPERATING LOSS
|
(42.5
|
)
|
|
(53.3
|
)
|
|
—
|
|
|
(36.2
|
)
|
|
—
|
|
|
(132.0
|
)
|
||||||
|
OTHER INCOME (EXPENSE), NET
|
(6.8
|
)
|
(110.5
|
)
|
(71.7
|
)
|
110.5
|
|
14.5
|
|
(64.0
|
)
|
|||||||||||
|
INCOME (LOSS) FROM CONTINUING OPERATIONS BEFORE INCOME TAXES
|
(49.3
|
)
|
|
(163.8
|
)
|
|
(71.7
|
)
|
|
74.3
|
|
|
14.5
|
|
|
(196.0
|
)
|
||||||
|
INCOME TAX EXPENSE
|
—
|
|
45.0
|
|
—
|
|
64.2
|
|
—
|
|
109.2
|
|
|||||||||||
|
DISCONTINUED OPERATIONS, NET
|
—
|
|
—
|
|
—
|
|
1.0
|
|
—
|
|
1.0
|
|
|||||||||||
|
EQUITY EARNINGS (LOSSES) IN AFFILIATES, NET OF TAX
|
(254.4
|
)
|
129.6
|
|
84.2
|
|
—
|
|
40.6
|
|
—
|
|
|||||||||||
|
NET INCOME (LOSS)
|
(303.7
|
)
|
|
(79.2
|
)
|
|
12.5
|
|
|
11.1
|
|
|
55.1
|
|
|
(304.2
|
)
|
||||||
|
NET LOSS ATTRIBUTABLE TO NONCONTROLLING INTERESTS
|
—
|
|
—
|
|
—
|
|
.5
|
|
—
|
|
.5
|
|
|||||||||||
|
NET INCOME (LOSS) ATTRIBUTABLE TO ENSCO
|
$
|
(303.7
|
)
|
|
$
|
(79.2
|
)
|
|
$
|
12.5
|
|
|
$
|
11.6
|
|
|
$
|
55.1
|
|
|
$
|
(303.7
|
)
|
138
|
ENSCO PLC AND SUBSIDIARIES
CONDENSED CONSOLIDATING STATEMENTS OF OPERATIONS
Year Ended December 31, 2016
(in millions)
|
|||||||||||||||||||||||
|
|
Ensco plc
|
ENSCO International Incorporated
|
Pride International LLC
|
Other Non-guarantor Subsidiaries of Ensco
|
Consolidating Adjustments
|
Total
|
|||||||||||||||||
|
OPERATING REVENUES
|
$
|
27.9
|
|
$
|
144.4
|
|
$
|
—
|
|
$
|
2,897.4
|
|
$
|
(293.3
|
)
|
$
|
2,776.4
|
|
|||||
|
OPERATING EXPENSES
|
|
|
|
|
|
|
|
|
|
|
|
|
|||||||||||
|
Contract drilling (exclusive of depreciation)
|
27.3
|
|
144.8
|
|
.1
|
|
1,422.1
|
|
(293.3
|
)
|
1,301.0
|
|
|||||||||||
|
Depreciation
|
—
|
|
17.2
|
|
.4
|
|
427.7
|
|
—
|
|
445.3
|
|
|||||||||||
|
General and administrative
|
36.2
|
|
.2
|
|
—
|
|
64.4
|
|
—
|
|
100.8
|
|
|||||||||||
|
OPERATING INCOME (LOSS)
|
(35.6
|
)
|
|
(17.8
|
)
|
(0.5
|
)
|
|
983.2
|
|
|
—
|
|
|
929.3
|
|
|||||||
|
OTHER INCOME (EXPENSE), NET
|
152.9
|
|
(79.0
|
)
|
(76.6
|
)
|
7.8
|
|
63.1
|
|
68.2
|
|
|||||||||||
|
INCOME (LOSS) FROM CONTINUING OPERATIONS BEFORE INCOME TAXES
|
117.3
|
|
|
(96.8
|
)
|
(77.1
|
)
|
|
991.0
|
|
|
63.1
|
|
|
997.5
|
|
|||||||
|
INCOME TAX EXPENSE (BENEFIT)
|
—
|
|
.7
|
|
(.6
|
)
|
108.4
|
|
—
|
|
108.5
|
|
|||||||||||
|
DISCONTINUED OPERATIONS, NET
|
—
|
|
—
|
|
—
|
|
8.1
|
|
—
|
|
8.1
|
|
|||||||||||
|
EQUITY EARNINGS IN AFFILIATES, NET OF TAX
|
772.9
|
|
205.7
|
|
125.7
|
|
—
|
|
(1,104.3
|
)
|
—
|
|
|||||||||||
|
NET INCOME
|
890.2
|
|
|
108.2
|
|
49.2
|
|
|
890.7
|
|
|
(1,041.2
|
)
|
|
897.1
|
|
|||||||
|
NET INCOME ATTRIBUTABLE TO NONCONTROLLING INTERESTS
|
—
|
|
—
|
|
—
|
|
(6.9
|
)
|
—
|
|
(6.9
|
)
|
|||||||||||
|
NET INCOME ATTRIBUTABLE TO ENSCO
|
$
|
890.2
|
|
|
$
|
108.2
|
|
$
|
49.2
|
|
|
$
|
883.8
|
|
|
$
|
(1,041.2
|
)
|
|
$
|
890.2
|
|
|
139
ENSCO PLC AND SUBSIDIARIES
CONDENSED CONSOLIDATING STATEMENTS OF COMPREHENSIVE INCOME
Year Ended December 31, 2018
(in millions)
|
Ensco plc
|
ENSCO International Incorporated
|
Pride International LLC
|
Other Non-Guarantor Subsidiaries of Ensco
|
Consolidating Adjustments
|
Total
|
||||||||||||||||||
|
NET INCOME (LOSS)
|
$
|
(639.7
|
)
|
$
|
(55.6
|
)
|
$
|
4.3
|
|
$
|
(352.6
|
)
|
$
|
407.0
|
|
$
|
(636.6
|
)
|
|||||
|
OTHER COMPREHENSIVE LOSS, NET
|
|||||||||||||||||||||||
|
Net change in fair value of derivatives
|
—
|
|
(9.7
|
)
|
—
|
|
—
|
|
—
|
|
(9.7
|
)
|
|||||||||||
|
Reclassification of net gains on derivative instruments from other comprehensive loss into net loss
|
—
|
|
(1.0
|
)
|
—
|
|
—
|
|
—
|
|
(1.0
|
)
|
|||||||||||
|
Other
|
—
|
|
—
|
|
—
|
|
(.5
|
)
|
—
|
|
(.5
|
)
|
|||||||||||
|
NET OTHER COMPREHENSIVE LOSS
|
—
|
|
(10.7
|
)
|
—
|
|
(.5
|
)
|
—
|
|
(11.2
|
)
|
|||||||||||
|
COMPREHENSIVE INCOME (LOSS)
|
(639.7
|
)
|
(66.3
|
)
|
4.3
|
|
(353.1
|
)
|
407.0
|
|
(647.8
|
)
|
|||||||||||
|
COMPREHENSIVE INCOME ATTRIBUTABLE TO NONCONTROLLING INTERESTS
|
—
|
|
—
|
|
—
|
|
(3.1
|
)
|
—
|
|
(3.1
|
)
|
|||||||||||
|
COMPREHENSIVE INCOME (LOSS) ATTRIBUTABLE TO ENSCO
|
$
|
(639.7
|
)
|
$
|
(66.3
|
)
|
$
|
4.3
|
|
$
|
(356.2
|
)
|
$
|
407.0
|
|
$
|
(650.9
|
)
|
|||||
140
ENSCO PLC AND SUBSIDIARIES
CONDENSED CONSOLIDATING STATEMENTS OF COMPREHENSIVE INCOME
Year Ended December 31, 2017
(in millions)
|
Ensco plc
|
ENSCO International Incorporated
|
Pride International LLC
|
Other Non-Guarantor Subsidiaries of Ensco
|
Consolidating Adjustments
|
Total
|
||||||||||||||||||
|
NET INCOME (LOSS)
|
$
|
(303.7
|
)
|
$
|
(79.2
|
)
|
$
|
12.5
|
|
$
|
11.1
|
|
$
|
55.1
|
|
$
|
(304.2
|
)
|
|||||
|
OTHER COMPREHENSIVE INCOME, NET
|
|||||||||||||||||||||||
|
Net change in fair value of derivatives
|
—
|
|
8.5
|
|
—
|
|
—
|
|
—
|
|
8.5
|
|
|||||||||||
|
Reclassification of net losses on derivative instruments from other comprehensive income into net income
|
—
|
|
.4
|
|
—
|
|
—
|
|
—
|
|
.4
|
|
|||||||||||
|
Other
|
—
|
|
—
|
|
—
|
|
.7
|
|
—
|
|
.7
|
|
|||||||||||
|
NET OTHER COMPREHENSIVE INCOME
|
—
|
|
8.9
|
|
—
|
|
.7
|
|
—
|
|
9.6
|
|
|||||||||||
|
COMPREHENSIVE INCOME (LOSS)
|
(303.7
|
)
|
(70.3
|
)
|
12.5
|
|
11.8
|
|
55.1
|
|
(294.6
|
)
|
|||||||||||
|
COMPREHENSIVE LOSS ATTRIBUTABLE TO NONCONTROLLING INTERESTS
|
—
|
|
—
|
|
—
|
|
.5
|
|
—
|
|
.5
|
|
|||||||||||
|
COMPREHENSIVE INCOME (LOSS) ATTRIBUTABLE TO ENSCO
|
$
|
(303.7
|
)
|
$
|
(70.3
|
)
|
$
|
12.5
|
|
$
|
12.3
|
|
$
|
55.1
|
|
$
|
(294.1
|
)
|
|||||
141
ENSCO PLC AND SUBSIDIARIES
CONDENSED CONSOLIDATING STATEMENTS OF COMPREHENSIVE INCOME
Year Ended December 31, 2016
(in millions)
|
Ensco plc
|
ENSCO International Incorporated
|
Pride International LLC
|
Other Non-Guarantor Subsidiaries of Ensco
|
Consolidating Adjustments
|
Total
|
||||||||||||||||||
|
NET INCOME
|
$
|
890.2
|
|
$
|
108.2
|
|
$
|
49.2
|
|
$
|
890.7
|
|
$
|
(1,041.2
|
)
|
$
|
897.1
|
|
|||||
|
OTHER COMPREHENSIVE INCOME (LOSS), NET
|
|||||||||||||||||||||||
|
Net change in fair value of derivatives
|
—
|
|
(5.4
|
)
|
—
|
|
—
|
|
—
|
|
(5.4
|
)
|
|||||||||||
|
Reclassification of net gains on derivative instruments from other comprehensive income into net loss
|
—
|
|
12.4
|
|
—
|
|
—
|
|
—
|
|
12.4
|
|
|||||||||||
|
Other
|
—
|
|
—
|
|
—
|
|
(.5
|
)
|
—
|
|
(.5
|
)
|
|||||||||||
|
NET OTHER COMPREHENSIVE INCOME (LOSS)
|
—
|
|
7.0
|
|
—
|
|
(.5
|
)
|
—
|
|
6.5
|
|
|||||||||||
|
COMPREHENSIVE INCOME
|
890.2
|
|
115.2
|
|
49.2
|
|
890.2
|
|
(1,041.2
|
)
|
903.6
|
|
|||||||||||
|
COMPREHENSIVE INCOME ATTRIBUTABLE TO NONCONTROLLING INTERESTS
|
—
|
|
—
|
|
—
|
|
(6.9
|
)
|
—
|
|
(6.9
|
)
|
|||||||||||
|
COMPREHENSIVE INCOME ATTRIBUTABLE TO ENSCO
|
$
|
890.2
|
|
$
|
115.2
|
|
$
|
49.2
|
|
$
|
883.3
|
|
$
|
(1,041.2
|
)
|
$
|
896.7
|
|
|||||
142
|
ENSCO PLC AND SUBSIDIARIES
CONDENSED CONSOLIDATING BALANCE SHEETS
December 31, 2018
(in millions)
|
|||||||||||||||||||||||
|
|
Ensco plc
|
ENSCO
International Incorporated
|
Pride International LLC
|
Other
Non-guarantor
Subsidiaries of Ensco
|
Consolidating
Adjustments
|
Total
|
|||||||||||||||||
|
ASSETS
|
|
|
|
|
|
|
|||||||||||||||||
|
CURRENT ASSETS
|
|
|
|
|
|
|
|||||||||||||||||
|
Cash and cash equivalents
|
$
|
199.8
|
|
$
|
—
|
|
$
|
2.7
|
|
$
|
72.6
|
|
$
|
—
|
|
$
|
275.1
|
|
|||||
|
Short-term investments
|
329.0
|
|
—
|
|
—
|
|
—
|
|
—
|
|
329.0
|
|
|||||||||||
|
Accounts receivable, net
|
7.3
|
|
25.4
|
|
—
|
|
312.0
|
|
—
|
|
344.7
|
|
|||||||||||
|
Accounts receivable from
affiliates
|
1,861.2
|
|
171.4
|
|
—
|
|
131.7
|
|
(2,164.3
|
)
|
—
|
|
|||||||||||
|
Other
|
.6
|
|
6.0
|
|
—
|
|
354.3
|
|
—
|
|
360.9
|
|
|||||||||||
|
Total current assets
|
2,397.9
|
|
202.8
|
|
2.7
|
|
870.6
|
|
(2,164.3
|
)
|
1,309.7
|
|
|||||||||||
|
PROPERTY AND EQUIPMENT, AT COST
|
1.8
|
|
125.2
|
|
—
|
|
15,390.0
|
|
—
|
|
15,517.0
|
|
|||||||||||
|
Less accumulated depreciation
|
1.8
|
|
91.3
|
|
—
|
|
2,807.7
|
|
—
|
|
2,900.8
|
|
|||||||||||
|
Property and equipment, net
|
—
|
|
33.9
|
|
—
|
|
12,582.3
|
|
—
|
|
12,616.2
|
|
|||||||||||
|
DUE FROM AFFILIATES
|
2,413.8
|
|
234.5
|
|
125.0
|
|
2,715.1
|
|
(5,488.4
|
)
|
—
|
|
|||||||||||
|
INVESTMENTS IN AFFILIATES
|
8,522.6
|
|
3,713.7
|
|
1,199.9
|
|
—
|
|
(13,436.2
|
)
|
—
|
|
|||||||||||
|
OTHER ASSETS
|
8.1
|
|
—
|
|
—
|
|
89.7
|
|
—
|
|
97.8
|
|
|||||||||||
|
|
$
|
13,342.4
|
|
$
|
4,184.9
|
|
$
|
1,327.6
|
|
$
|
16,257.7
|
|
$
|
(21,088.9
|
)
|
$
|
14,023.7
|
|
|||||
|
LIABILITIES AND SHAREHOLDERS' EQUITY
|
|
|
|
|
|||||||||||||||||||
|
CURRENT LIABILITIES
|
|
|
|
|
|
|
|||||||||||||||||
|
Accounts payable and accrued
liabilities
|
$
|
85.3
|
|
$
|
32.0
|
|
$
|
12.7
|
|
$
|
398.5
|
|
$
|
—
|
|
$
|
528.5
|
|
|||||
|
Accounts payable to affiliates
|
59.7
|
|
139.5
|
|
38.2
|
|
1,926.9
|
|
(2,164.3
|
)
|
—
|
|
|||||||||||
|
Total current liabilities
|
145.0
|
|
171.5
|
|
50.9
|
|
2,325.4
|
|
(2,164.3
|
)
|
528.5
|
|
|||||||||||
|
DUE TO AFFILIATES
|
1,432.0
|
|
1,226.9
|
|
1,366.5
|
|
1,463.0
|
|
(5,488.4
|
)
|
—
|
|
|||||||||||
|
LONG-TERM DEBT
|
3,676.5
|
|
149.3
|
|
502.6
|
|
682.0
|
|
—
|
|
5,010.4
|
|
|||||||||||
|
OTHER LIABILITIES
|
.1
|
|
64.3
|
|
—
|
|
331.6
|
|
—
|
|
396.0
|
|
|||||||||||
|
ENSCO SHAREHOLDERS' EQUITY (DEFICIT)
|
8,088.8
|
|
2,572.9
|
|
(592.4
|
)
|
11,458.3
|
|
(13,436.2
|
)
|
8,091.4
|
|
|||||||||||
|
NONCONTROLLING INTERESTS
|
—
|
|
—
|
|
—
|
|
(2.6
|
)
|
—
|
|
(2.6
|
)
|
|||||||||||
|
Total equity (deficit)
|
8,088.8
|
|
2,572.9
|
|
(592.4
|
)
|
11,455.7
|
|
(13,436.2
|
)
|
8,088.8
|
|
|||||||||||
|
|
$
|
13,342.4
|
|
$
|
4,184.9
|
|
$
|
1,327.6
|
|
$
|
16,257.7
|
|
$
|
(21,088.9
|
)
|
$
|
14,023.7
|
|
|||||
143
|
ENSCO PLC AND SUBSIDIARIES
CONDENSED CONSOLIDATING BALANCE SHEETS
December 31, 2017
(in millions)
|
|||||||||||||||||||||||
|
|
Ensco plc
|
ENSCO
International Incorporated
|
Pride International LLC
|
Other
Non-guarantor
Subsidiaries of Ensco
|
Consolidating
Adjustments
|
Total
|
|||||||||||||||||
|
ASSETS
|
|
|
|
|
|
|
|||||||||||||||||
|
CURRENT ASSETS
|
|
|
|
|
|
|
|||||||||||||||||
|
Cash and cash equivalents
|
$
|
185.2
|
|
$
|
—
|
|
$
|
25.6
|
|
$
|
234.6
|
|
$
|
—
|
|
$
|
445.4
|
|
|||||
|
Short-term investments
|
440.0
|
|
—
|
|
—
|
|
—
|
|
—
|
|
440.0
|
|
|||||||||||
|
Accounts receivable, net
|
6.9
|
|
.4
|
|
—
|
|
338.1
|
|
—
|
|
345.4
|
|
|||||||||||
|
Accounts receivable from
affiliates
|
351.8
|
|
492.7
|
|
—
|
|
424.3
|
|
(1,268.8
|
)
|
—
|
|
|||||||||||
|
Other
|
—
|
|
8.8
|
|
—
|
|
372.4
|
|
—
|
|
381.2
|
|
|||||||||||
|
Total current assets
|
983.9
|
|
501.9
|
|
25.6
|
|
1,369.4
|
|
(1,268.8
|
)
|
1,612.0
|
|
|||||||||||
|
PROPERTY AND EQUIPMENT, AT COST
|
1.8
|
|
120.8
|
|
—
|
|
15,209.5
|
|
—
|
|
15,332.1
|
|
|||||||||||
|
Less accumulated depreciation
|
1.8
|
|
77.1
|
|
—
|
|
2,379.5
|
|
—
|
|
2,458.4
|
|
|||||||||||
|
Property and equipment, net
|
—
|
|
43.7
|
|
—
|
|
12,830.0
|
|
—
|
|
12,873.7
|
|
|||||||||||
|
DUE FROM AFFILIATES
|
3,002.1
|
|
2,618.0
|
|
165.1
|
|
3,736.1
|
|
(9,521.3
|
)
|
—
|
|
|||||||||||
|
INVESTMENTS IN AFFILIATES
|
9,098.5
|
|
3,591.9
|
|
1,106.6
|
|
—
|
|
(13,797.0
|
)
|
—
|
|
|||||||||||
|
OTHER ASSETS
|
12.9
|
|
5.0
|
|
—
|
|
226.5
|
|
(104.2
|
)
|
140.2
|
|
|||||||||||
|
|
$
|
13,097.4
|
|
$
|
6,760.5
|
|
$
|
1,297.3
|
|
$
|
18,162.0
|
|
$
|
(24,691.3
|
)
|
$
|
14,625.9
|
|
|||||
|
LIABILITIES AND SHAREHOLDERS' EQUITY
|
|
|
|
|
|||||||||||||||||||
|
CURRENT LIABILITIES
|
|
|
|
|
|
|
|||||||||||||||||
|
Accounts payable and accrued
liabilities
|
$
|
55.4
|
|
$
|
39.0
|
|
$
|
21.7
|
|
$
|
642.4
|
|
$
|
—
|
|
$
|
758.5
|
|
|||||
|
Accounts payable to affiliates
|
67.3
|
|
458.3
|
|
12.4
|
|
730.8
|
|
(1,268.8
|
)
|
—
|
|
|||||||||||
|
Total current liabilities
|
122.7
|
|
497.3
|
|
34.1
|
|
1,373.2
|
|
(1,268.8
|
)
|
758.5
|
|
|||||||||||
|
DUE TO AFFILIATES
|
1,402.9
|
|
3,559.2
|
|
753.9
|
|
3,805.3
|
|
(9,521.3
|
)
|
—
|
|
|||||||||||
|
LONG-TERM DEBT
|
2,841.8
|
|
149.2
|
|
1,106.0
|
|
653.7
|
|
—
|
|
4,750.7
|
|
|||||||||||
|
OTHER LIABILITIES
|
—
|
|
3.1
|
|
—
|
|
487.8
|
|
(104.2
|
)
|
386.7
|
|
|||||||||||
|
ENSCO SHAREHOLDERS' EQUITY (DEFICIT)
|
8,730.0
|
|
2,551.7
|
|
(596.7
|
)
|
11,844.1
|
|
(13,797.0
|
)
|
8,732.1
|
|
|||||||||||
|
NONCONTROLLING INTERESTS
|
—
|
|
—
|
|
—
|
|
(2.1
|
)
|
—
|
|
(2.1
|
)
|
|||||||||||
|
Total equity (deficit)
|
8,730.0
|
|
2,551.7
|
|
(596.7
|
)
|
11,842.0
|
|
(13,797.0
|
)
|
8,730.0
|
|
|||||||||||
|
|
$
|
13,097.4
|
|
$
|
6,760.5
|
|
$
|
1,297.3
|
|
$
|
18,162.0
|
|
$
|
(24,691.3
|
)
|
$
|
14,625.9
|
|
|||||
144
|
ENSCO PLC AND SUBSIDIARIES
CONDENSED CONSOLIDATING STATEMENTS OF CASH FLOWS
Year Ended December 31, 2018
(in millions)
|
|||||||||||||||||||||||
|
|
Ensco plc
|
ENSCO International Incorporated
|
Pride International LLC
|
Other Non-guarantor Subsidiaries of Ensco
|
Consolidating Adjustments
|
Total
|
|||||||||||||||||
|
OPERATING ACTIVITIES
|
|
|
|
|
|
|
|
|
|
|
|
|
|||||||||||
|
Net cash provided by (used in) operating activities of continuing operations
|
$
|
18.1
|
|
$
|
(135.1
|
)
|
$
|
(97.6
|
)
|
$
|
158.9
|
|
$
|
—
|
|
$
|
(55.7
|
)
|
|||||
|
INVESTING ACTIVITIES
|
|||||||||||||||||||||||
|
Maturities of short-term investments
|
1,030.0
|
|
—
|
|
—
|
|
—
|
|
—
|
|
1,030.0
|
|
|||||||||||
|
Purchases of short-term investments
|
(919.0
|
)
|
—
|
|
—
|
|
—
|
|
—
|
|
(919.0
|
)
|
|||||||||||
|
Purchase of affiliate debt
|
(551.7
|
)
|
—
|
|
—
|
|
—
|
|
551.7
|
|
—
|
|
|||||||||||
|
Sale of affiliate debt
|
479.0
|
|
—
|
|
—
|
|
—
|
|
(479.0
|
)
|
—
|
|
|||||||||||
|
Additions to property and equipment
|
—
|
|
—
|
|
—
|
|
(426.7
|
)
|
—
|
|
(426.7
|
)
|
|||||||||||
|
Net proceeds from disposition of assets
|
|
|
—
|
|
—
|
|
11.0
|
|
—
|
|
11.0
|
|
|||||||||||
|
Net cash provided by (used in) investing activities of continuing operations
|
38.3
|
|
—
|
|
—
|
|
(415.7
|
)
|
72.7
|
|
(304.7
|
)
|
|||||||||||
|
FINANCING ACTIVITIES
|
|
|
|
|
|
|
|||||||||||||||||
|
Proceeds from issuance of senior notes
|
1,000.0
|
|
—
|
|
—
|
|
—
|
|
—
|
|
1,000.0
|
|
|||||||||||
|
Advances from (to) affiliates
|
(845.0
|
)
|
135.1
|
|
612.5
|
|
97.4
|
|
—
|
|
—
|
|
|||||||||||
|
Reduction of long-term
borrowings
|
(159.9
|
)
|
—
|
|
(537.8
|
)
|
(0.8
|
)
|
(72.7
|
)
|
(771.2
|
)
|
|||||||||||
|
Cash dividends paid
|
(17.9
|
)
|
—
|
|
—
|
|
—
|
|
—
|
|
(17.9
|
)
|
|||||||||||
|
Debt issuance costs
|
(17.0
|
)
|
—
|
|
—
|
|
—
|
|
—
|
|
(17.0
|
)
|
|||||||||||
|
Other
|
(2.0
|
)
|
—
|
|
—
|
|
(3.7
|
)
|
—
|
|
(5.7
|
)
|
|||||||||||
|
Net cash provided by (used in) financing activities
|
(41.8
|
)
|
135.1
|
|
74.7
|
|
92.9
|
|
(72.7
|
)
|
188.2
|
|
|||||||||||
|
Net cash provided by discontinued operations
|
—
|
|
—
|
|
—
|
|
2.5
|
|
—
|
|
2.5
|
|
|||||||||||
|
Effect of exchange rate changes on cash and cash equivalents
|
—
|
|
—
|
|
—
|
|
(.6
|
)
|
—
|
|
(.6
|
)
|
|||||||||||
|
NET INCREASE (DECREASE) IN CASH AND CASH EQUIVALENTS
|
14.6
|
|
—
|
|
|
(22.9
|
)
|
|
(162.0
|
)
|
|
—
|
|
|
(170.3
|
)
|
|||||||
|
CASH AND CASH EQUIVALENTS, BEGINNING OF YEAR
|
185.2
|
|
—
|
|
25.6
|
|
234.6
|
|
—
|
|
445.4
|
|
|||||||||||
|
CASH AND CASH EQUIVALENTS, END OF YEAR
|
$
|
199.8
|
|
$
|
—
|
|
|
$
|
2.7
|
|
|
$
|
72.6
|
|
|
$
|
—
|
|
|
$
|
275.1
|
|
|
145
|
ENSCO PLC AND SUBSIDIARIES
CONDENSED CONSOLIDATING STATEMENTS OF CASH FLOWS
Year Ended December 31, 2017
(in millions)
|
|||||||||||||||||||||||
|
|
Ensco plc
|
ENSCO International Incorporated
|
Pride International LLC
|
Other Non-guarantor Subsidiaries of Ensco
|
Consolidating Adjustments
|
Total
|
|||||||||||||||||
|
OPERATING ACTIVITIES
|
|
|
|
|
|
|
|
|
|
|
|
|
|||||||||||
|
Net cash provided by (used in) operating activities of continuing operations
|
$
|
(18.2
|
)
|
$
|
(117.6
|
)
|
$
|
(100.1
|
)
|
$
|
495.3
|
|
$
|
—
|
|
$
|
259.4
|
|
|||||
|
INVESTING ACTIVITIES
|
|
|
|||||||||||||||||||||
|
Purchases of short-term investments
|
(1,022.9
|
)
|
—
|
|
—
|
|
(17.1
|
)
|
—
|
|
(1,040.0
|
)
|
|||||||||||
|
Maturities of short-term investments
|
1,748.0
|
|
5.5
|
|
—
|
|
289.0
|
|
—
|
|
2,042.5
|
|
|||||||||||
|
Additions to property and
equipment
|
—
|
|
—
|
|
—
|
|
(536.7
|
)
|
—
|
|
(536.7
|
)
|
|||||||||||
|
Net proceeds from disposition of assets
|
—
|
|
—
|
|
—
|
|
2.8
|
|
—
|
|
2.8
|
|
|||||||||||
|
Purchase of affiliate debt
|
(316.3
|
)
|
—
|
|
—
|
|
—
|
|
316.3
|
|
—
|
|
|||||||||||
|
Acquisition of Atwood, net of cash acquired
|
—
|
|
—
|
|
—
|
|
(871.6
|
)
|
—
|
|
(871.6
|
)
|
|||||||||||
|
Net cash provided by (used in) investing activities of continuing operations
|
408.8
|
|
5.5
|
|
—
|
|
(1,133.6
|
)
|
316.3
|
|
(403.0
|
)
|
|||||||||||
|
FINANCING ACTIVITIES
|
|
|
|||||||||||||||||||||
|
Reduction of long-term
borrowings
|
(220.7
|
)
|
—
|
|
—
|
|
—
|
|
(316.3
|
)
|
(537.0
|
)
|
|||||||||||
|
Debt issuance costs
|
(12.0
|
)
|
—
|
|
—
|
|
—
|
|
—
|
|
(12.0
|
)
|
|||||||||||
|
Cash dividends paid
|
(13.8
|
)
|
—
|
|
—
|
|
—
|
|
—
|
|
(13.8
|
)
|
|||||||||||
|
Advances from (to) affiliates
|
(848.9
|
)
|
112.1
|
|
105.9
|
|
630.9
|
|
—
|
|
—
|
|
|||||||||||
|
Other
|
(2.6
|
)
|
—
|
|
—
|
|
(5.1
|
)
|
—
|
|
(7.7
|
)
|
|||||||||||
|
Net cash provided by (used in) financing activities
|
(1,098.0
|
)
|
112.1
|
|
|
105.9
|
|
|
625.8
|
|
|
(316.3
|
)
|
(570.5
|
)
|
||||||||
|
Net cash used in discontinued operations
|
—
|
|
—
|
|
—
|
|
(.8
|
)
|
—
|
|
|
(.8
|
)
|
||||||||||
|
Effect of exchange rate changes on cash and cash equivalents
|
—
|
|
—
|
|
—
|
|
.6
|
|
—
|
|
.6
|
|
|||||||||||
|
NET INCREASE (DECREASE) IN CASH AND CASH EQUIVALENTS
|
(707.4
|
)
|
—
|
|
|
5.8
|
|
|
(12.7
|
)
|
|
—
|
|
|
(714.3
|
)
|
|||||||
|
CASH AND CASH EQUIVALENTS, BEGINNING OF YEAR
|
892.6
|
|
—
|
|
19.8
|
|
247.3
|
|
—
|
|
1,159.7
|
|
|||||||||||
|
CASH AND CASH EQUIVALENTS, END OF YEAR
|
$
|
185.2
|
|
$
|
—
|
|
|
$
|
25.6
|
|
|
$
|
234.6
|
|
|
$
|
—
|
|
$
|
445.4
|
|
||
146
|
ENSCO PLC AND SUBSIDIARIES
CONDENSED CONSOLIDATING STATEMENTS OF CASH FLOWS
Year Ended December 31, 2016
(in millions)
|
|||||||||||||||||||||||
|
|
Ensco plc
|
ENSCO International Incorporated
|
Pride International LLC
|
Other Non-guarantor Subsidiaries of Ensco
|
Consolidating Adjustments
|
Total
|
|||||||||||||||||
|
OPERATING ACTIVITIES
|
|
|
|
|
|
|
|
|
|
|
|||||||||||||
|
Net cash provided by (used in) operating activities of continuing operations
|
$
|
(101.3
|
)
|
$
|
(46.5
|
)
|
$
|
(116.9
|
)
|
$
|
1,342.1
|
|
$
|
—
|
|
$
|
1,077.4
|
|
|||||
|
INVESTING ACTIVITIES
|
|
|
|
|
|
|
|
|
|
|
|
|
|||||||||||
|
Purchases of short-term investments
|
(2,047.1
|
)
|
(5.5
|
)
|
—
|
|
(422.0
|
)
|
—
|
|
(2,474.6
|
)
|
|||||||||||
|
Additions to property and equipment
|
—
|
|
—
|
|
—
|
|
(322.2
|
)
|
—
|
|
(322.2
|
)
|
|||||||||||
|
Maturities of short-term investments
|
2,062.0
|
|
—
|
|
—
|
|
150.0
|
|
—
|
|
2,212.0
|
|
|||||||||||
|
Net proceeds from disposition of assets
|
—
|
|
—
|
|
—
|
|
9.8
|
|
—
|
|
9.8
|
|
|||||||||||
|
Purchase of affiliate debt
|
(237.9
|
)
|
—
|
|
—
|
|
—
|
|
237.9
|
|
—
|
|
|||||||||||
|
Net cash used in investing activities of continuing operations
|
(223.0
|
)
|
(5.5
|
)
|
|
—
|
|
|
(584.4
|
)
|
|
237.9
|
|
(575.0
|
)
|
||||||||
|
FINANCING ACTIVITIES
|
|
|
|
|
|
|
|
|
|
|
|
|
|||||||||||
|
Proceeds from debt issuance
|
—
|
|
—
|
|
—
|
|
849.5
|
|
—
|
|
849.5
|
|
|||||||||||
|
Reduction of long-term borrowing
|
(626.0
|
)
|
—
|
|
—
|
|
—
|
|
(237.9
|
)
|
(863.9
|
)
|
|||||||||||
|
Proceeds from equity issuance
|
585.5
|
|
—
|
|
—
|
|
—
|
|
—
|
|
585.5
|
|
|||||||||||
|
Cash dividends paid
|
(11.6
|
)
|
—
|
|
—
|
|
—
|
|
—
|
|
(11.6
|
)
|
|||||||||||
|
Debt issuance costs
|
(23.4
|
)
|
—
|
|
—
|
|
—
|
|
—
|
|
(23.4
|
)
|
|||||||||||
|
Advances from (to) affiliates
|
1,200.6
|
|
52.0
|
|
134.7
|
|
(1,387.3
|
)
|
—
|
|
—
|
|
|||||||||||
|
Other
|
(2.2
|
)
|
—
|
|
—
|
|
(4.9
|
)
|
—
|
|
(7.1
|
)
|
|||||||||||
|
Net cash provided by (used in) financing activities
|
1,122.9
|
|
52.0
|
|
|
134.7
|
|
|
(542.7
|
)
|
|
(237.9
|
)
|
529.0
|
|
||||||||
|
Net cash provided by discontinued operations
|
—
|
|
—
|
|
—
|
|
8.4
|
|
—
|
|
8.4
|
|
|||||||||||
|
Effect of exchange rate changes on cash and cash equivalents
|
—
|
|
—
|
|
—
|
|
(1.4
|
)
|
—
|
|
(1.4
|
)
|
|||||||||||
|
NET INCREASE IN CASH AND CASH EQUIVALENTS
|
798.6
|
|
—
|
|
|
17.8
|
|
|
222.0
|
|
|
—
|
|
1,038.4
|
|
||||||||
|
CASH AND CASH EQUIVALENTS, BEGINNING OF YEAR
|
94.0
|
|
—
|
|
2.0
|
|
25.3
|
|
—
|
|
121.3
|
|
|||||||||||
|
CASH AND CASH EQUIVALENTS, END
OF YEAR
|
$
|
892.6
|
|
$
|
—
|
|
|
$
|
19.8
|
|
|
$
|
247.3
|
|
|
$
|
—
|
|
$
|
1,159.7
|
|
||
147
16. UNAUDITED QUARTERLY FINANCIAL DATA
The following tables summarize our unaudited quarterly condensed consolidated income statement data for the years ended
December 31, 2018
and
2017
(in millions, except per share amounts):
|
2018
|
||||||||||||||||||||
|
First
Quarter
|
Second
Quarter
|
Third
Quarter
|
Fourth
Quarter
|
Year
|
||||||||||||||||
|
Operating revenues
|
$
|
417.0
|
|
$
|
458.5
|
|
$
|
430.9
|
|
$
|
399.0
|
|
$
|
1,705.4
|
|
|||||
|
Operating expenses
|
|
|
|
|
|
|
|
|
||||||||||||
|
Contract drilling (exclusive of depreciation)
|
325.2
|
|
344.3
|
|
327.1
|
|
322.8
|
|
1,319.4
|
|
||||||||||
|
Loss on impairment
(1)
|
—
|
|
—
|
|
—
|
|
40.3
|
|
40.3
|
|
||||||||||
|
Depreciation
|
115.2
|
|
120.7
|
|
120.6
|
|
122.4
|
|
478.9
|
|
||||||||||
|
General and administrative
|
27.9
|
|
26.1
|
|
25.1
|
|
23.6
|
|
102.7
|
|
||||||||||
|
Operating loss
|
(51.3
|
)
|
(32.6
|
)
|
(41.9
|
)
|
(110.1
|
)
|
(235.9
|
)
|
||||||||||
|
Other expense, net
|
(70.7
|
)
|
(84.8
|
)
|
(77.7
|
)
|
(69.8
|
)
|
(303.0
|
)
|
||||||||||
|
Loss from continuing operations before income taxes
|
(122.0
|
)
|
(117.4
|
)
|
(119.6
|
)
|
(179.9
|
)
|
(538.9
|
)
|
||||||||||
|
Income tax expense
|
18.4
|
|
24.7
|
|
23.3
|
|
23.2
|
|
89.6
|
|
||||||||||
|
Loss from continuing operations
|
(140.4
|
)
|
(142.1
|
)
|
(142.9
|
)
|
(203.1
|
)
|
(628.5
|
)
|
||||||||||
|
Loss from discontinued operations, net
|
(.1
|
)
|
(8.0
|
)
|
—
|
|
—
|
|
(8.1
|
)
|
||||||||||
|
Net loss
|
(140.5
|
)
|
(150.1
|
)
|
(142.9
|
)
|
(203.1
|
)
|
(636.6
|
)
|
||||||||||
|
Net (income) loss attributable to noncontrolling interests
|
.4
|
|
(.9
|
)
|
(2.1
|
)
|
(.5
|
)
|
(3.1
|
)
|
||||||||||
|
Net loss attributable to Ensco
|
$
|
(140.1
|
)
|
$
|
(151.0
|
)
|
$
|
(145.0
|
)
|
$
|
(203.6
|
)
|
$
|
(639.7
|
)
|
|||||
|
Loss per share – basic and diluted
|
|
|
|
|
|
|
|
|
|
|
||||||||||
|
Continuing operations
|
$
|
(.32
|
)
|
$
|
(.33
|
)
|
$
|
(.33
|
)
|
$
|
(.47
|
)
|
$
|
(1.45
|
)
|
|||||
|
Discontinued operations
|
—
|
|
(.02
|
)
|
—
|
|
—
|
|
(.02
|
)
|
||||||||||
|
|
$
|
(.32
|
)
|
$
|
(.35
|
)
|
$
|
(.33
|
)
|
$
|
(.47
|
)
|
$
|
(1.47
|
)
|
|||||
|
(1)
|
Fourth quarter included an aggregate loss of
$40.3 million
associated with the impairment of an older, non-core jackup rig. See "Note 5 - Property and Equipment" for additional information.
|
148
|
2017
|
||||||||||||||||||||
|
First
Quarter
|
Second
Quarter
|
Third
Quarter
|
Fourth
Quarter
|
Year
|
||||||||||||||||
|
Operating revenues
|
$
|
471.1
|
|
$
|
457.5
|
|
$
|
460.2
|
|
$
|
454.2
|
|
$
|
1,843.0
|
|
|||||
|
Operating expenses
|
|
|
|
|
|
|
|
|
||||||||||||
|
Contract drilling (exclusive of depreciation)
(1)
|
278.1
|
|
291.3
|
|
285.8
|
|
334.3
|
|
1,189.5
|
|
||||||||||
|
Loss on impairment
(2)
|
—
|
|
—
|
|
—
|
|
182.9
|
|
182.9
|
|
||||||||||
|
Depreciation
|
109.2
|
|
107.9
|
|
108.2
|
|
119.5
|
|
444.8
|
|
||||||||||
|
General and administrative
(3)
|
26.0
|
|
30.5
|
|
30.4
|
|
70.9
|
|
157.8
|
|
||||||||||
|
Operating income (loss)
|
57.8
|
|
27.8
|
|
35.8
|
|
(253.4
|
)
|
(132.0
|
)
|
||||||||||
|
Other income (expense), net
(4)
|
(57.7
|
)
|
(53.2
|
)
|
(40.4
|
)
|
87.3
|
|
(64.0
|
)
|
||||||||||
|
Income (loss) from continuing operations before income taxes
|
.1
|
|
(25.4
|
)
|
(4.6
|
)
|
(166.1
|
)
|
(196.0
|
)
|
||||||||||
|
Income tax expense
(5)
|
24.1
|
|
19.3
|
|
23.4
|
|
42.4
|
|
109.2
|
|
||||||||||
|
Loss from continuing operations
|
(24.0
|
)
|
(44.7
|
)
|
(28.0
|
)
|
(208.5
|
)
|
(305.2
|
)
|
||||||||||
|
Income (loss) from discontinued operations, net
|
(.6
|
)
|
.4
|
|
(.2
|
)
|
1.4
|
|
1.0
|
|
||||||||||
|
Net loss
|
(24.6
|
)
|
(44.3
|
)
|
(28.2
|
)
|
(207.1
|
)
|
(304.2
|
)
|
||||||||||
|
Net (income) loss attributable to noncontrolling interests
|
(1.1
|
)
|
(1.2
|
)
|
2.8
|
|
—
|
|
.5
|
|
||||||||||
|
Net loss attributable to Ensco
|
$
|
(25.7
|
)
|
$
|
(45.5
|
)
|
$
|
(25.4
|
)
|
$
|
(207.1
|
)
|
$
|
(303.7
|
)
|
|||||
|
Loss per share – basic and diluted
|
|
|
|
|
|
|
|
|
|
|
||||||||||
|
Continuing operations
|
$
|
(.09
|
)
|
$
|
(.15
|
)
|
$
|
(.08
|
)
|
$
|
(.49
|
)
|
$
|
(.91
|
)
|
|||||
|
Discontinued operations
|
—
|
|
—
|
|
—
|
|
—
|
|
—
|
|
||||||||||
|
|
$
|
(.09
|
)
|
$
|
(.15
|
)
|
$
|
(.08
|
)
|
$
|
(.49
|
)
|
$
|
(.91
|
)
|
|||||
|
(1)
|
Fourth quarter included
$7.0 million
of integration costs associated with the Atwood Merger. See "Item 7. Management's Discussion and Analysis of Financial Condition and Results of Operations" in Part II for additional information.
|
|
(2)
|
Fourth quarter included an aggregate loss of
$182.9 million
associated with the impairment of certain rigs. See "Note 5 - Property and Equipment" for additional information.
|
|
(3)
|
Fourth quarter included integration costs of
$30.9 million
and merger-related costs consisting of various advisory, legal, accounting, valuation and other professional or consulting fees totaling
$11.5 million
. See "Note 3 - Acquisition of Atwood" for additional information.
|
|
(4)
|
Fourth quarter included a bargain purchase gain of
$140.2 million
related to the Atwood Merger. See "Note 3 - Acquisition of Atwood" for additional information.
|
|
(5)
|
Fourth quarter included net discrete tax expense of
$16.5 million
in connection with enactment of U.S. tax reform. See "Note 10 - Income taxes" for additional information.
|
149
Item 9.
Changes in and Disagreements with Accountants on Accounting and Financial Disclosure
Not applicable.
Item 9A.
Controls and Procedures
CONCLUSION REGARDING THE EFFECTIVENESS OF DISCLOSURE CONTROLS AND PROCEDURES
Based on their evaluation as of the end of the period covered by this Annual Report on Form 10-K, our management, with the participation of our Chief Executive Officer and Chief Financial Officer, has concluded that our disclosure controls and procedures, as defined in Rule 13a-15 under the Exchange Act, are effective.
During the fiscal quarter ended
December 31, 2018
, there were no changes in our internal control over financial reporting that have materially affected, or are reasonably likely to materially affect, our internal control over financial reporting.
See "Item 8. Financial Statements and Supplementary Data" for Management's Report on Internal Control Over Financial Reporting.
Item 9B.
Other Information
Not applicable.
150
PART III
Item 10.
Directors, Executive Officers and Corporate Governance
The information required by this item with respect to our directors, corporate governance matters, committees of the Board of Directors and Section 16(a) of the Exchange Act is contained in our Proxy Statement for the Annual General Meeting of Shareholders ("Proxy Statement") to be filed with the SEC not later than 120 days after the end of our fiscal year ended
December 31, 2018
and incorporated herein by reference.
The information required by this item with respect to our executive officers is set forth in "Executive Officers" in Part I of this Annual Report on Form 10-K.
The guidelines and procedures of the Board of Directors are outlined in our Corporate Governance Policy. The committees of the Board of Directors operate under written charters adopted by the Board of Directors. The Corporate Governance Policy and committee charters are available on our website at www.enscoplc.com in the Corporate Governance section and are available in print without charge by contacting our Investor Relations Department at 713-430-4607.
We have a Code of Business Conduct Policy that applies to all employees, including our principal executive officer, principal financial officer and principal accounting officer. The Code of Business Conduct Policy is available on our website at www.enscoplc.com in the Corporate Governance section and is available in print without charge by contacting our Investor Relations Department. We intend to disclose any amendments to or waivers from our Code of Business Conduct Policy by posting such information on our website. Our Proxy Statement contains governance disclosures, including information on our Code of Business Conduct Policy, the Ensco Corporate Governance Policy, the director nomination process, shareholder director nominations, shareholder communications to the Board of Directors and director attendance at the Annual General Meeting of Shareholders.
Item 11.
Executive Compensation
The information required by this item is contained in our Proxy Statement and incorporated herein by reference.
151
Item 12.
Security Ownership of Certain Beneficial Owners and Management and Related Shareholder Matters
The following table summarizes certain information related to our compensation plans under which our shares are authorized for issuance as of
December 31, 2018
:
|
Plan category
|
Number of securities
to be issued upon
exercise of
outstanding options,
warrants and rights
|
Weighted-average
exercise price of
outstanding options,
warrants and rights
|
Number of securities
remaining available for
future issuance under
equity compensation
plans (excluding
securities reflected
in column (a))
(1)
|
|||||||
|
(a)
|
(b)
|
(c)
|
||||||||
|
Equity compensation
plans approved by
security holders
|
—
|
|
$
|
—
|
|
33,981,655
|
|
|||
|
Equity compensation
plans not approved by
security holders
(2)
|
691,852
|
|
25.46
|
|
1,373,655
|
|
||||
|
Total
|
691,852
|
|
$
|
25.46
|
|
35,355,310
|
|
|||
|
(1)
|
Under the 2018 LTIP, 34.0 million shares remained available for future issuances of non-vested share awards, share option awards and performance awards as of December 31, 2018.
|
|
(2)
|
In connection with the Pride acquisition, we assumed Pride's option plan and the outstanding options thereunder. As of December 31, 2018, options to purchase 48,074 shares at a weighted-average exercise price of $41.46 per share were outstanding under this plan. No shares are available for future issuance under this plan, no further options will be granted under this plan and the plan will be terminated upon the earlier of the exercise or expiration date of the last outstanding option. Additional information required by this item is included in our Proxy Statement and incorporated herein by reference.
In connection with the Atwood acquisition, we assumed Atwood’s Amended and Restated 2007 Long-Term Incentive Plan (the “Atwood LTIP”) and the options outstanding thereunder. As of December 31, 2018, options to purchase 643,778 shares at a weighted-average exercise price of $24.27 per share were outstanding under this plan. There were also 1.4 million shares remaining available for future issuance, which we may grant to employees and other service providers who were not employed or engaged with us prior to the Atwood acquisition.
The Atwood LTIP, which we adopted in connection with the Atwood acquisition, provides for discretionary equity compensation awards. Awards may be granted in the form of share options, restricted share awards, share appreciation rights and performance share or unit awards. All future awards granted under the Atwood LTIP will be subject to such terms and conditions, including vesting terms, as may be determined by the plan administrator at the time of grant. Following the Atwood acquisition, the Atwood LTIP is administered by and all award decisions will be made on a discretionary basis by our Compensation Committee or Board of Directors.
|
Additional information required by this item is included in our Proxy Statement and incorporated herein by reference.
Item 13.
Certain Relationships and Related Transactions, and Director Independence
The information required by this item is contained in our Proxy Statement and incorporated herein by reference.
152
Item 14.
Principal Accounting Fees and Services
The information required by this item is contained in our Proxy Statement and incorporated herein by reference.
PART IV
Item 15.
Exhibits, Financial Statement Schedules
|
(a)
|
The following documents are filed as part of this report:
|
|
|
|
1. Financial Statements
|
|
|
Reports of Independent Registered Public Accounting Firm
|
||
|
Consolidated Statements of Operations
|
||
|
Consolidated Statements of Comprehensive Income
|
||
|
Consolidated Balance Sheets
|
||
|
Consolidated Statements of Cash Flows
|
||
|
Notes to Consolidated Financial Statements
|
||
|
2. Financial Statement Schedules:
|
||
|
The schedules for which provision is made in the applicable accounting regulations of the SEC are not required under the related instructions or are inapplicable or provided elsewhere in the financial statements and, therefore, have been omitted.
|
||
|
|
3. Exhibits
|
|
Exhibit
Number
|
|
Exhibit
|
|
2.1
|
||
|
2.2
|
||
|
2.3
|
||
|
3.1
|
||
|
3.2
|
||
|
3.3
|
|
|
|
4.1
|
||
153
|
4.2
|
||
|
4.3
|
||
|
4.4
|
||
|
4.5
|
||
|
4.6
|
||
|
4.7
|
||
|
4.8
|
||
|
4.9
|
||
|
4.10
|
||
|
4.11
|
||
|
4.12
|
||
|
4.13
|
||
|
4.14
|
||
|
4.15
|
||
|
4.16
|
||
|
4.17
|
||
|
4.18
|
||
154
|
4.19
|
||
|
4.20
|
||
|
4.21
|
||
|
4.22
|
||
|
4.23
|
||
|
4.24
|
||
|
4.25
|
||
|
10.1
|
||
|
10.2
|
||
|
10.3
|
||
|
10.4
|
||
|
10.5
|
||
|
10.6
|
||
|
10.7
|
||
|
+10.8
|
||
|
+10.9
|
||
155
|
+10.10
|
||
|
+10.11
|
||
|
+10.12
|
||
|
+10.13
|
||
|
+10.14
|
||
|
+10.15
|
||
|
+10.16
|
||
|
+10.17
|
||
|
+10.18
|
||
|
+10.19
|
||
|
+10.20
|
||
|
+10.21
|
||
|
+10.22
|
||
|
+10.23
|
||
|
+10.24
|
||
|
+10.25
|
||
156
|
+10.26
|
||
|
+10.27
|
||
|
+10.28
|
||
|
+10.29
|
||
|
+10.30
|
||
|
+10.31
|
||
|
+10.32
|
||
|
+10.33
|
||
|
+10.34
|
||
|
+10.35
|
||
|
+10.36
|
||
|
+10.37
|
||
|
+10.38
|
||
|
+10.39
|
||
|
+10.40
|
||
|
+10.41
|
||
|
+10.42
|
||
|
+10.43
|
||
157
|
+10.44
|
||
|
+10.45
|
||
|
+10.46
|
||
|
+10.47
|
||
|
+10.48
|
||
|
+10.49
|
||
|
+10.50
|
||
|
+10.51
|
||
|
+10.52
|
||
|
*21.1
|
||
|
*23.1
|
||
|
*31.1
|
||
|
*31.2
|
||
|
**32.1
|
||
|
**32.2
|
||
|
*101.INS
|
XBRL Instance Document
|
|
|
*101.SCH
|
XBRL Taxonomy Extension Schema
|
|
|
*101.CAL
|
XBRL Taxonomy Extension Calculation Linkbase
|
|
|
*101.DEF
|
XBRL Taxonomy Extension Definition Linkbase
|
|
|
*101.LAB
|
XBRL Taxonomy Extension Label Linkbase
|
|
|
*101.PRE
|
XBRL Taxonomy Extension Presentation Linkbase
|
|
|
*
**
+
|
Filed herewith.
Furnished herewith.
Management contracts or compensatory plans and arrangements required to be filed as exhibits pursuant to Item 15(b) of this report.
|
|
158
Certain agreements relating to our long-term debt have not been filed as exhibits as permitted by paragraph (b)(4)(iii)(A) of Item 601 of Regulation S-K since the total amount of securities authorized under any such agreements do not exceed 10% of our total assets on a consolidated basis. Upon request, we will furnish to the SEC all constituent agreements defining the rights of holders of our long-term debt not filed herewith.
Item 16.
Form 10-K Summary
None.
159
SIGNATURES
Pursuant to the requirements of Section 13 or 15(d) of the Securities Exchange Act of 1934, the Registrant has duly caused this report to be signed on its behalf by the undersigned thereunto duly authorized, on
February 28, 2019
.
|
Ensco plc
(Registrant)
|
|
|
|
By
/s/ CARL G. TROWELL
Carl G. Trowell
President and Chief Executive Officer
|
Pursuant to the requirements of the Securities Exchange Act of 1934, this report has been signed by the following persons on behalf of the Registrant and in the capacities and on the date indicated.
|
Signatures
|
|
Title
|
|
Date
|
|
/s/ CARL G. TROWELL
Carl G. Trowell
|
|
President and Chief Executive Officer and Director
|
|
February 28, 2019
|
|
|
|
|
|
|
|
/s/ PAUL E. ROWSEY III
Paul E. Rowsey III
|
|
Chairman
|
|
February 28, 2019
|
|
|
|
|
|
|
|
/s/ J. RODERICK CLARK
J. Roderick Clark
|
|
Director
|
|
February 28, 2019
|
|
/s/ ROXANNE J. DECYK
Roxanne J. Decyk
|
|
Director
|
|
February 28, 2019
|
|
|
|
|
|
|
|
/s/ MARY E. FRANCIS CBE
Mary E. Francis CBE
|
Director
|
|
February 28, 2019
|
|
|
/s/ C. CHRISTOPHER GAUT
C. Christopher Gaut
|
|
Director
|
|
February 28, 2019
|
|
|
|
|
|
|
|
/s/ JACK E. GOLDEN
Jack E. Golden
|
|
Director
|
|
February 28, 2019
|
|
/s/ GERALD W. HADDOCK
Gerald W. Haddock
|
|
Director
|
|
February 28, 2019
|
|
|
|
|
|
|
|
/s/ FRANCIS S. KALMAN
Francis S. Kalman
|
|
Director
|
|
February 28, 2019
|
|
|
|
|
|
|
|
/s/ KEITH O. RATTIE
Keith O. Rattie
|
|
Director
|
|
February 28, 2019
|
|
/s/ PHIL D. WEDEMEYER
Phil D. Wedemeyer
|
|
Director
|
|
February 28, 2019
|
|
|
|
|
|
|
|
/s/ JONATHAN H. BAKSHT
Jonathan H. Baksht
|
Senior Vice President and
Chief Financial Officer
(principal financial officer)
|
February 28, 2019
|
||
|
|
|
|
|
|
|
/s/ TOMMY E. DARBY
Tommy E. Darby
|
|
Controller (principal accounting officer)
|
|
February 28, 2019
|
160
TABLE OF CONTENTS
Part IItem 1. BusinessItem 1A. Risk FactorsItem 1B. Unresolved Staff CommentsItem 2. PropertiesItem 3. Legal ProceedingsItem 4. Mine Safety DisclosuresPart IIItem 5. Market For Registrant's Common Equity, Related Shareholder Matters and Issuer Purchases Of Equity SecuritiesItem 6. Selected Financial DataItem 7. Management's Discussion and Analysis Of Financial Condition and Results Of OperationsNote 15 - Guarantee Of Registered SecuritiesItem 7A. Quantitative and Qualitative Disclosures About Market RiskItem 8. Financial Statements and Supplementary DataItem 9. Changes in and Disagreements with Accountants on Accounting and Financial DisclosureItem 9A. Controls and ProceduresItem 9B. Other InformationPart IIIItem 10. Directors, Executive Officers and Corporate GovernanceItem 11. Executive CompensationItem 12. Security Ownership Of Certain Beneficial Owners and Management and Related Shareholder MattersItem 13. Certain Relationships and Related Transactions, and Director IndependenceItem 14. Principal Accounting Fees and ServicesPart IVItem 15. Exhibits, Financial Statement SchedulesItem 16. Form 10-k Summary