VISTEON CORP
10-Ks and 10-Qs
|
|
|
|
|
|
|
|
|
|
|
|
|
|
|
|
|
|
|
|
|
|
|
|
|
|
|
|
|
|
|
|
|
|
|
|
|
|
|
|
|
|
|
|
|
|
|
|
|
|
|
|
|
UNITED STATES
SECURITIES AND EXCHANGE COMMISSION
Washington, D.C. 20549
FORM 10-K
(Mark One)
|
þ
|
ANNUAL REPORT PURSUANT TO SECTION 13 OR 15(d) OF THE SECURITIES EXCHANGE ACT OF 1934
|
For the fiscal year ended December 31, 2013
OR
|
¨
|
TRANSITION REPORT PURSUANT TO SECTION 13 OR 15(d) OF THE SECURITIES EXCHANGE ACT OF 1934
|
For the transition period from ____________ to ____________
Commission file number 001-15827
VISTEON CORPORATION
(Exact name of registrant as specified in its charter)
|
State of Delaware
|
38-3519512
|
|
(State or other jurisdiction of incorporation or organization)
|
(I.R.S. Employer Identification No.)
|
|
One Village Center Drive, Van Buren Township, Michigan
|
48111
|
|
(Address of principal executive offices)
|
(Zip code)
|
Registrant’s telephone number, including area code: (800)-VISTEON
Securities registered pursuant to Section 12(b) of the Act:
|
Title of Each Class
|
Name of Each Exchange on which Registered
|
|
Common Stock, par value $0.01 per share
|
New York Stock Exchange
|
Securities registered pursuant to Section 12(g) of the Act:
|
Warrants, each exercisable for one share of Common Stock at an exercise price of $58.80 (expiring October 15, 2015)
(Title of class)
Warrants, each exercisable for one share of Common Stock at an exercise price of $9.66 (expiring October 15, 2020)
(Title of class)
|
Indicate by check mark if the registrant is a well-known seasoned issuer, as defined in Rule 405 of the Securities Act. Yes
ü
No __
Indicate by check mark if the registrant is not required to file reports pursuant to Section 13 or Section 15(d) of the Exchange Act.
Yes __ No
ü
Indicate by check mark whether the registrant (1) has filed all reports required to be filed by Section 13 or 15(d) of the Securities Exchange Act of 1934 during the preceding 12 months (or for such shorter period that the registrant was required to file such reports), and (2) has been subject to such filing requirements for the past 90 days. Yes
ü
No__
Indicate by check mark whether the registrant has submitted electronically and posted on its corporate Web site, if any, every Interactive Data File required to be submitted and posted pursuant to Rule 405 of Regulation S-T (Section 232.405 of this chapter) during the preceding 12 months (or for such shorter period that the registrant was required to submit and post such files). Yes
ü
No __
Indicate by check mark if disclosure of delinquent filers pursuant to Item 405 of Regulation S-K is not contained herein, and will not be contained, to the best of registrant’s knowledge, in definitive proxy or information statements incorporated by reference in Part III of this Form 10-K or any amendment to this Form 10-K.
ü
Indicate by check mark whether the registrant is a large accelerated filer, an accelerated filer, a non-accelerated filer, or a smaller reporting company. See the definitions of “large accelerated filer," "accelerated filer” and "smaller reporting company" in Rule 12b-2 of the Exchange Act.
Large accelerated filer
ü
Accelerated filer __ Non-accelerated filer __ Smaller reporting company __
Indicate by check mark whether the registrant is a shell company (as defined in Rule 12b-2 of the Exchange Act). Yes __ No
ü
The aggregate market value of the registrant’s voting and non-voting common equity held by non-affiliates of the registrant on June 28, 2013 (the last business day of the most recently completed second fiscal quarter) was approximately $3.2 billion.
Indicate by check mark whether the registrant has filed all documents and reports required to be filed by Sections 12, 13 or 15(d) of the Securities Exchange Act of 1934 subsequent to the distribution of securities under a plan confirmed by a court. Yes
ü
No__
As o
f February 17, 2014, the registrant had outstanding 48,395,695
shares of common stock.
Document Incorporated by Reference
|
Document
|
Where Incorporated
|
|
2014 Proxy Statement
|
Part III (Items 10, 11, 12, 13 and 14)
|
1
Visteon Corporation and Subsidiaries
Index
|
Page
|
||
2
|
Item 1.
|
Business
|
Description of Business
Visteon Corporation ("Visteon" or the "Company") is a global supplier of climate, electronics and interiors systems, modules and components to automotive original equipment manufacturers (“OEMs”) including Bayerishe Motoren Werke AG (“BMW”), Chrysler Group LLC (“Chrysler”), Daimler AG (“Daimler”), Ford Motor Company ("Ford"), General Motors Company (“General Motors”), Honda Motor Co., Ltd. (“Honda”), Hyundai Motor Company (“Hyundai”), Kia Motors (“Kia”), Mazda Motor Corporation (“Mazda”), Mitsubishi Motors (“Mitsubishi”), Nissan Motor Company, Ltd. (“Nissan”), PSA Peugeot Citroën,
Renault S.A. (“Renault”), Toyota Motor Corporation (“Toyota”) and Volkswagen, as well as emerging new vehicle manufacturers in Asia. Visteon delivers value to its customer and shareholders through a family of businesses including:
|
•
|
Halla Visteon Climate Control Corporation, majority-owned by Visteon and the world's second largest global supplier of automotive climate components and systems.
|
|
•
|
Visteon Electronics, a global provider of cockpit electronics, including audio/infotainment, driver information, center stack electronics and feature control modules.
|
|
•
|
Visteon Interiors, a global provider of vehicle cockpit modules, instrument panels, consoles and door trim modules.
|
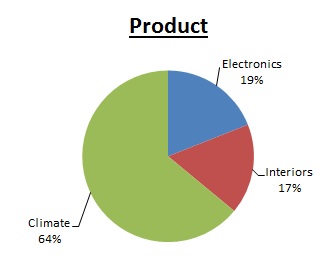
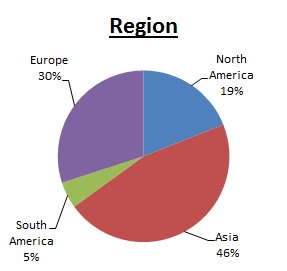
The Company, headquartered in Van Buren Township, Michigan, has an international network of manufacturing operations, technical centers and joint venture operations, supported by approximately 24,000 employees dedicated to the design, development, manufacture and support of its product offering and its global customers. The Company's manufacturing and engineering footprint is principally located outside of the U.S., with a heavy concentration in low-cost geographic regions. Management believes that the Company is strategically well-positioned to capitalize on growth in emerging markets, particularly those in Asia, where the Company generated 46% of its consolidated sales for the year ended December 31, 2013. The Company's sales for the year ended December 31, 2013 totaled $7.4 billion and were distributed by product group, geographic region, and customer as follows.
The Company’s History
The Company was incorporated in Delaware in January 2000 as a wholly-owned subsidiary of Ford Motor Company (“Ford” or “Ford Motor Company”). Subsequently, Ford transferred the assets and liabilities comprising its automotive components and systems business to Visteon. The Company separated from Ford on June 28, 2000 when all of the Company’s common stock was distributed by Ford to its shareholders.
During the latter part of 2008 and through 2009, weakened economic conditions, largely attributable to the global credit crisis, and erosion of consumer confidence, triggered a global economic recession that negatively impacted the automotive sector. On May 28, 2009, the Company and many of its domestic subsidiaries filed voluntary petitions for reorganization relief under the Bankruptcy Code in the United States Bankruptcy Court for the District of Delaware in response to the resulting sudden and severe declines in global automotive production and the related adverse impact on the Company’s cash flows and liquidity. On August 31, 2010, the bankruptcy court entered an order confirming the plan of reorganization and the Company emerged from bankruptcy on October 1, 2010.
3
The Company’s Value Creation Strategy
In September 2012, the Company announced a comprehensive shareholder value creation plan founded on the pillars of industrial logic, customer focus and financial discipline. The comprehensive shareholder value creation plan includes the following primary elements.
|
•
|
Climate consolidation - Prior to 2013, the Company's Climate operations were comprised of Halla Climate Control Corporation ("Halla"), a 70% owned and consolidated Korean subsidiary, and a series of wholly-owned Visteon Climate operations and other Visteon Climate joint ventures. During the first quarter of 2013, Halla purchased certain subsidiaries and intellectual property relating to Visteon's global climate business for a total purchase price of $410 million.
This combination formed t
he world's second largest global supplier of automotive climate components and systems under the name of Halla Visteon Climate Control Corporation ("HVCC"). HVCC is majority-owned by Visteon and headquartered in South Korea. The Company expects to achieve synergies through improved global scale and common business practices over time in connection with this business combination.
|
|
•
|
Electronics optimization - The Company's Electronics business has undergone a transition away from powertrain, body and security electronics over the past several years and today is focused solely on electronics in the cockpit of the vehicle delivering innovative audio, infotainment, clusters and displays to OEM customers. The market for cockpit electronics is projected to grow to $45 billion by 2018. The Company believes that its Electronics business is well-positioned to capitalize on a rapidly changing consumer-driven technology landscape and has taken steps to optimize the size and scale of this business associated with its cockpit electronics products.
|
|
◦
|
In the fourth quarter of 2013, the Company paid $58 million for an additional 11% ownership interest in Yanfeng Visteon Automotive Electronics Co., Ltd. (“YFVE”), resulting in a 51% controlling ownership interest in YFVE. YFVE provides an important source of global electronics development and engineering capability. Additionally, the Company invested $48 million during the fourth quarter of 2013 in a non-consolidated electronics holding company owned 50% by Visteon and 50% by Yanfeng.
|
|
◦
|
On January 13, 2014, Visteon reached an agreement to acquire the automotive electronics business of Johnson Controls for cash of $265 million.The acquisition is subject to certain regulatory and other consents and approvals and is expected to be completed in the second quarter of 2014. In the fiscal year ended September 30, 2013, the business to be acquired by Visteon generated approximately $1.3 billion in revenue and about $58 million in EBITDA (earnings before interest, taxes, depreciation and amortization).
|
These actions are expected to strengthen Visteon's competitive position in the fast-growing vehicle cockpit electronics segment by expanding its global scale, manufacturing and engineering footprint, product portfolio and customer penetration. On a combined basis following completion of the acquisition of the automotive electronics business of Johnson Controls, Visteon expects that its electronics business will have sales of about $3 billion, a No. 2 global position in driver information, an above-average growth rate for the segment, and penetration of nine of the world's ten largest vehicle manufacturers.
|
•
|
Interiors strategy - The Company determined that its Interiors business is not aligned with its long-term strategic goals and continues to explore alternatives for this non-core business including, but not limited to, divestiture, partnership or alliance. While the Company views Interiors as a non-core business, it continues to make commitments to this business and intends to divest in the future only under acceptable terms and conditions. On December 17, 2013, Visteon completed the sale of its 50% ownership interest in Yanfeng Visteon Automotive Trim Systems Co., Ltd., ("Yanfeng") a significant Interiors equity investee, for cash proceeds of $928 million. The Company's goal is to dispose of the remainder of its Interiors businesses in three separate transactions targeted for 2014. Due to certain liabilities and capital requirements of many of the these remaining businesses, the Company may be required to contribute cash to such businesses in connection with any disposition, which amounts could be material.
|
|
•
|
Cost reduction program - In November 2012 the Company announced a $100 million restructuring program designed to reduce fixed costs and to improve operational efficiency by addressing certain under-performing operations. Through December 31, 2013, the Company recorded approximately
$76 million
of restructuring expenses under this program. The Company anticipates recording additional restructuring charges related to this program in future periods as underlying plans are finalized.
|
|
•
|
Balance sheet enhancement - In December 2013 the Company exercised its right to repurchase $50 million or 10% of its outstanding 6.75% senior notes due April 2019 for a redemption price of 103% of the principal amount, plus accrued and unpaid interest to the redemption date. This repurchase was in addition to a similar $50 million repurchase of outstanding 6.75% senior notes due April 2019 that was completed in December 2012. Also during 2012, the Company offered an accelerated pension payment program to most of its U.S. defined benefit plan participants who are former employees with vested benefits not yet in pay status, whereby such participants could elect to receive a single lump sum
|
4
payout. Approximately 70% of eligible participants elected to receive a single lump sum payout resulting in a reduction of the Company's U.S. retirement plan obligations of
$408 million
and a reduction in plan assets of
$301 million
, respectively.
|
•
|
Share repurchases - Since July 2012, the Company's board of directors has authorized a total of $1.175 billion in share repurchases. In connection with these authorizations the Company completed two $125 million accelerated share buy-back programs during 2013. Also in connection with these authorizations, the Company repurchased $50 million during 2012 through open market purchases. As of December 31, 2013,
$875 million
remains authorized and available for repurchase through December 31, 2015.
|
The Company’s Industry
The Company operates in the automotive industry, which is cyclical and highly sensitive to general economic conditions. The Company believes that future success in the automotive industry is, in part, dependent on alignment with customers to support their efforts to effectively meet the challenges associated with the following significant trends and developments in the global automotive industry.
|
•
|
Emissions and safety - Governments continue to focus regulatory efforts on cleaner and safer transportation with the objective of securing individual mobility. Accordingly, OEMs are working to lower average vehicle emissions by developing a more diverse range of vehicles including those powered by hybrid technologies, alternative fuels, and electricity. OEMs are also working to improve occupant and pedestrian safety by incorporating more safety oriented content in their vehicles. Suppliers must enable the emissions and safety initiatives of their customers including the development of new technologies.
|
|
•
|
Electronic content and connectivity - The electronic content of vehicles continues to increase due to various regulatory requirements and consumer demand for increased vehicle performance and functionality. The use of electronic components can reduce weight, expedite assembly, enhance fuel economy, improve emissions, increase safety and enhance vehicle performance. Additionally, digital and portable technologies have dramatically influenced the lifestyle of today’s consumers who expect products that enable such a lifestyle. This requires increased electronic and technical content such as in-vehicle communication, navigation and entertainment capabilities. While OEMs are taking different paths to connect their vehicles to high-speed broadband internet connections in the short-term, future vehicles are expected to be built with vehicle-to-vehicle connectivity systems.
|
|
•
|
Vehicle standardization - OEMs continue to standardize vehicle platforms on a global basis, resulting in a lower number of individual vehicle platforms, design cost savings and further scale of economies through the production of a greater number of models from each platform. Having operations in the geographic markets in which OEMs produce global platforms enables suppliers to meet OEMs’ needs more economically and efficiently, thus making global coverage a source of significant competitive advantage for suppliers with a diverse global footprint. Additionally, OEMs are looking to suppliers for increased collaboration to lower costs, reduce risks, and decrease overall time to market. Suppliers that can provide fully-engineered solutions, systems and pre-assembled combinations of component parts are positioned to leverage the trend toward system sourcing.
|
Financial Information about Segments
The Company's operating structure is organized by global product lines, including Climate, Electronics and Interiors. These global product lines have financial and operating responsibility over the design, development and manufacture of the Company's product portfolio. Global customer groups are responsible for the business development of the Company's product portfolio and overall customer relationships. Certain functions such as procurement, information technology and other administrative activities are managed on a global basis with regional deployment. The Company's reportable segments are as follows:
|
•
|
Climate - The Company's Climate product line includes climate air handling modules, powertrain cooling modules, heat exchangers, compressors, fluid transport and engine induction systems.
|
|
•
|
Electronics - The Company's Electronics product line includes audio systems, infotainment systems, driver information systems, powertrain and feature control modules, climate controls, and electronic control modules.
|
|
•
|
Interiors - The Company's Interiors product line includes instrument panels, cockpit modules, door trim and floor consoles.
|
Further information relating to the Company’s reportable segments can be found in Item 8, “Financial Statements and Supplementary Data” of this Annual Report on Form 10-K (Note 19, “Segment Information,” to the Company’s consolidated financial statements).
5
The Company’s Products
The following discussion provides an overview description of the products associated with major design systems within each of the Company’s global product lines.
Climate
The Company designs and manufactures components, modules and systems that provide automotive heating, ventilation, air conditioning and powertrain cooling.
|
Climate Products
|
Description
|
|
|
Climate Systems
|
The Company designs and manufactures fully integrated heating, ventilation and air conditioning (“HVAC”) systems. The Company’s proprietary analytical tools and systems integration expertise enables the development of climate-oriented components, sub-systems and vehicle-level systems. Products contained in this area include: evaporators, condensers, heater cores, climate controls, compressors, air handling cases and fluid transport systems.
|
|
|
Powertrain Cooling Systems
|
The Company designs and manufactures components and modules that provide cooling and thermal management for the vehicle’s engine and transmission, as well as for batteries and power electronics on hybrid and electric vehicles. The Company’s systems expertise and proprietary analytical tools enable development of components and modules to meet a wide array of thermal management needs. Products include: radiators, oil coolers, charge air coolers, exhaust gas coolers, battery and power electronics coolers and systems and fluid transport systems.
|
|
Electronics
The Company designs and manufactures advanced in-vehicle entertainment, driver information, wireless communication, climate control and body and security electronics products.
|
Electronics Products
|
Description
|
|
|
Audio / Infotainment Systems
|
The Company offers a range of audio/infotainment products, including audio head units, infotainment head units, connectivity solutions and various amplifiers and rear seat family entertainment systems. Premium audio and infotainment products are marketed under the brand OpenAir™.
|
|
|
Driver Information Systems
|
The Company offers a complete line of instrument clusters and displays ranging from standard analog-electronic clusters to high resolution, fully-configurable TFT devices across multiple vehicle segments. Displays can integrate a range of user interface technologies and graphics management capabilities. Premium instrumentation products are marketed under the brand LightScape™.
|
|
|
Electronic Climate Controls and Decorative Control Panels
|
The Company offers a complete line of electronic climate control modules and decorative control panel technologies. Available climate controls vary from single zone manual electronic modules to fully automatic multiple zone modules. Decorative control panels can include multiple modes for user interface technologies, various display and styling-related technologies, and a wide range of cockpit electronic features including audio, climate and driver information.
|
|
|
Body and Security
|
The Company designs and manufactures body electronics and security modules. Body electronics modules cover a wide range of comfort and convenience applications. Security modules typically manage a variety of access control and immobilization functions.
|
|
Interiors
The Company designs and manufactures cockpit modules, instrument panels, door and console modules and interior trim.
|
Interiors Products
|
Description
|
|
|
Cockpit Modules
|
Cockpit modules incorporate structural, electronic, climate control, mechanical and safety components and customers receive services including advanced engineering, design, styling and in-sequence delivery of parts. Cockpit modules are built around instrument panels which consist of a substrate and the optional assembly of structure, ducts, registers, passenger airbag system (integrated or conventional), finished panels and the glove box assembly.
|
|
|
Door Panels and Trims
|
The Company provides a range of door panels/modules as well as a variety of interior trim products.
|
|
|
Console Modules
|
Consoles deliver flexible and versatile storage options and are interchangeable units offering consumers a wide range of options that can be tailored to their individual needs.
|
|
6
The Company’s Customers
The Company sells its products primarily to global vehicle manufacturers including BMW, Chrysler, Daimler, Ford, General Motors, Honda, Hyundai, Kia, Mazda, Mitsubishi, Nissan, PSA Peugeot Citroën,
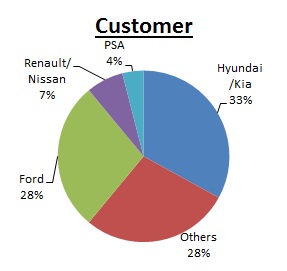
Renault, Toyota and Volkswagen, as well as emerging new vehicle manufacturers in Asia. To a lesser degree, the Company also sells products for use as aftermarket and service parts to automotive original equipment manufacturers and others for resale through independent distribution networks. Hyundai Kia Automotive Group is one of the Company's largest customers, accounting for 33% of total sales in both 2013 and 2012 and 31% of total sales in 2011. Additionally, Ford is one of the Company's largest customers and accounted for approximately 28% of total sales in 2013, 27% of total sales in both 2012 and 2011.
The Company records revenue when persuasive evidence of an arrangement exists, delivery occurs or services are rendered, the sales price or fee is fixed or determinable and collectibility is reasonably assured. Price reductions are typically negotiated on an annual basis between suppliers and OEMs. Such reductions are intended to take into account expected annual reductions in the overall cost to the supplier of providing products and services to the customer, through such factors as manufacturing productivity enhancements, material cost reductions and design-related cost improvements. The Company has an aggressive cost reduction program that focuses on reducing its total costs, which are intended to offset customer price reductions. However, there can be no assurance that the Company’s cost reduction efforts will be sufficient to fully offset such price reductions. The Company records price reductions when probable and reasonably estimable.
The Company’s Competition
The automotive sector is concentrated, but operates under highly competitive conditions resulting from the globalized nature of the industry, high fixed costs and the resulting need for scale economies, market dynamics including share in mature economies and positioning in emerging economies, and the low cost of switching for the end consumer. Accordingly, OEMs rigorously evaluate suppliers on the basis of financial viability, product quality, price competitiveness, technical expertise and development capability, new product innovation, reliability and timeliness of delivery, product design and manufacturing capability and flexibility, customer service and overall management. The Company's primary independent competitors include Behr GmbH & Co. KG, Calsonic Kansei, Continental AG, Delphi Corporation, Denso Corporation, Faurecia Group, Hyundai Mobis Co., Ltd., International Automotive Components Group, Johnson Controls, Inc., Magna International Inc., Panasonic Corporation, Pioneer Corporation, Robert Bosch GmbH, Sanden Corporation and Valéo S.A.
The Company’s Product Sales Backlog
Expected net product sales in Climate and Electronics for 2014 through 2016 from new programs, less net sales from phased-out, lost and canceled programs are approximately $900 million. The Company’s estimate of expected net sales may be impacted by various assumptions, including vehicle production levels on new programs, customer price reductions, currency exchange rates and the timing of program launches. In addition, the Company typically enters into agreements with its customers at the beginning of a vehicle’s life for the fulfillment of customers’ purchasing requirements for the entire production life of the vehicle. These agreements generally may be terminated by customers at any time and, accordingly, expected net sales information does not represent firm orders or firm commitments.
Seasonality and Cyclicality of the Company’s Business
Historically, the Company’s business has been moderately seasonal because its largest North American customers typically cease production for approximately two weeks in July for model year changeovers and approximately one week in December during the winter holidays. Customers in Europe historically shut down vehicle production during a portion of August and one week in December. Additionally, third quarter automotive production traditionally is lower as new vehicle models enter production.
However, the market for vehicles is cyclical and is heavily dependent upon general economic conditions, consumer sentiment and spending and credit availability. During 2009, the automotive sector was negatively impacted by global economic instability and the lack of available credit. The severity of the decline in 2009 was masked by numerous government stimulus programs and significant growth in certain emerging automotive markets, which caused vehicle production volumes to vary from historical patterns.
The Company’s Workforce and Employee Relations
The Company’s workforce as of December 31, 2013 included approximately 24,000 persons, of which approximately 8,000 were salaried employees and 16,000 were hourly workers. Many of the Company’s employees are members of industrial trade unions and confederations within their respective countries, including Europe, Asia and South America. Many of these organizations
7
operate under collectively bargained contracts that are not specific to any one employer. The Company constantly works to establish and maintain positive, cooperative relations with its unions around the world and believes that its relationships with unionized employees are satisfactory. The Company experienced work stoppages of varying lengths in Europe, South America and Asia during the past three years. These stoppages primarily were either national in nature, aimed at customers or were in anticipation of Company restructuring activities at particular facilities.
The Company’s Product Research and Development
The Company’s research and development efforts are intended to maintain leadership positions in core product lines and provide the Company with a competitive edge as it seeks additional business with new and existing customers. The Company also works with technology development partners, including customers, to develop technological capabilities and new products and applications. Total research and development expenditures were approximately $325 million in 2013, $299 million in 2012, and $326 million in 2011.
The Company’s Intellectual Property
The Company owns significant intellectual property, including a number of patents, copyrights, proprietary tools and technologies and trade secrets and is involved in numerous licensing arrangements. Although the Company’s intellectual property plays an important role in maintaining its competitive position, no single patent, copyright, proprietary tool or technology, trade secret or license, or group of related patents, copyrights, proprietary tools or technologies, trade secrets or licenses is, in the opinion of management, of such value to the Company that its business would be materially affected by the expiration or termination thereof. The Company’s general policy is to apply for patents on an ongoing basis, in appropriate countries, on its patentable developments which are considered to have commercial significance.
The Company also views its name and mark as significant to its business as a whole. In addition, the Company holds rights in a number of other trade names and marks applicable to certain of its businesses and products that it views as important to such businesses and products.
The Company’s Raw Materials and Suppliers
Raw materials used by the Company in the manufacture of its products include aluminum, resins, precious metals, steel, urethane chemicals and electronics components. All of the materials used are generally available from numerous sources. In general, the Company does not carry inventories of raw materials in excess of those reasonably required to meet production and shipping schedules.
Although not material to the Company's financial position, results of operations or cash flows, supply disruptions occurred during the year ended December 31, 2011 attributable to natural disasters that occurred in Thailand and Japan. Severe flooding from heavy monsoon rains in Thailand occurred in the third quarter of 2011, causing significant supplier and OEM production disruption in the fourth quarter of 2011. The Thailand disruptions primarily affected the Company's Climate and Interiors businesses. During March 2011, a large earthquake triggered a tsunami off the coast of northeastern Japan and resulted in significant casualties, dislocation and extensive infrastructure destruction. The Japan disruptions primarily affected the Company's Electronics business.
As of December 31, 2013 the Company had not experienced any other significant shortages of raw materials. The Company monitors its supply base and endeavors to work with suppliers and customers to attempt to mitigate the impact of potential material shortages and supply disruptions. While the Company does not anticipate any significant interruption in the supply of raw materials, there can be no assurance that sufficient sources or amounts of all necessary raw materials will be available in the future.
The automotive supply industry is subject to inflationary pressures with respect to raw materials which have historically placed operational and financial burdens on the entire supply chain. Accordingly, the Company continues to take actions with its customers and suppliers to mitigate the impact of these inflationary pressures in the future. Actions to mitigate inflationary pressures with customers include collaboration on alternative product designs and material specifications, contractual price escalation clauses and negotiated customer recoveries. Actions to mitigate inflationary pressures with suppliers include aggregation of purchase requirements to achieve optimal volume benefits, negotiation of cost reductions and identification of more cost competitive suppliers. While these actions are designed to offset the impact of inflationary pressures, the Company cannot provide assurance that it will be successful in fully offsetting increased costs resulting from inflationary pressures.
8
Impact of Environmental Regulations on the Company
The Company is subject to the requirements of federal, state, local and foreign environmental and occupational safety and health laws and regulations. These include laws regulating air emissions, water discharge and waste management. The Company is also subject to environmental laws requiring the investigation and cleanup of environmental contamination at properties it presently owns or operates and at third-party disposal or treatment facilities to which these sites send or arranged to send hazardous waste. The Company makes capital expenditures in the normal course of business as necessary to ensure that its facilities are in compliance with applicable environmental laws and regulations. For 2013, capital expenditures associated with environmental compliance were not material nor did such expenditures have a materially adverse effect on the Company’s earnings or competitive position. The Company does not anticipate that its environmental compliance costs will be material in 2014.
The Company is aware of contamination at some of its properties. The Company is in various stages of investigation and cleanup at these sites and at December 31, 2013, had recorded a reserve of approximately $1 million for this environmental investigation and cleanup. However, estimating liabilities for environmental investigation and cleanup is complex and dependent upon a number of factors beyond the Company’s control and which may change dramatically. Accordingly, although the Company believes its reserve is adequate based on current information, the Company cannot provide any assurance that its ultimate environmental investigation and cleanup costs and liabilities will not exceed the amount of its current reserve.
The Company’s International Operations
Financial information about sales and net property by major geographic region can be found in Note 19, “Segment Information,” included in Item 8 “Financial Statements and Supplementary Data” of this Annual Report on Form 10-K. The attendant risks of the Company’s international operations are primarily related to currency fluctuations, changes in local economic and political conditions, and changes in laws and regulations. The following table sets forth the Company’s sales and net property and equipment by geographic region as a percentage of such consolidated total amounts.
|
Sales
|
Property and Equipment, Net
|
|||||||||||||
|
Year Ended December 31
|
December 31
|
|||||||||||||
|
2013
|
2012
|
2011
|
2013
|
2012
|
||||||||||
|
United States
|
19
|
%
|
18
|
%
|
16
|
%
|
5
|
%
|
8
|
%
|
||||
|
Mexico
|
1
|
%
|
1
|
%
|
1
|
%
|
2
|
%
|
2
|
%
|
||||
|
Canada
|
1
|
%
|
1
|
%
|
1
|
%
|
1
|
%
|
2
|
%
|
||||
|
Intra-region eliminations
|
—
|
%
|
—
|
%
|
(1
|
)%
|
—
|
%
|
—
|
%
|
||||
|
Total North America
|
21
|
%
|
20
|
%
|
17
|
%
|
8
|
%
|
12
|
%
|
||||
|
Germany
|
2
|
%
|
2
|
%
|
2
|
%
|
2
|
%
|
2
|
%
|
||||
|
France
|
7
|
%
|
8
|
%
|
9
|
%
|
5
|
%
|
6
|
%
|
||||
|
Portugal
|
8
|
%
|
8
|
%
|
6
|
%
|
7
|
%
|
6
|
%
|
||||
|
Spain
|
3
|
%
|
4
|
%
|
5
|
%
|
2
|
%
|
3
|
%
|
||||
|
Slovakia
|
5
|
%
|
5
|
%
|
5
|
%
|
4
|
%
|
4
|
%
|
||||
|
Czech Republic
|
6
|
%
|
5
|
%
|
7
|
%
|
3
|
%
|
3
|
%
|
||||
|
Hungary
|
4
|
%
|
4
|
%
|
4
|
%
|
5
|
%
|
5
|
%
|
||||
|
Other Europe
|
3
|
%
|
3
|
%
|
1
|
%
|
5
|
%
|
2
|
%
|
||||
|
Intra-region eliminations
|
(5
|
)%
|
(4
|
)%
|
—
|
%
|
—
|
%
|
—
|
%
|
||||
|
Total Europe
|
33
|
%
|
35
|
%
|
39
|
%
|
33
|
%
|
31
|
%
|
||||
|
Korea
|
30
|
%
|
30
|
%
|
31
|
%
|
33
|
%
|
34
|
%
|
||||
|
China
|
15
|
%
|
11
|
%
|
7
|
%
|
13
|
%
|
10
|
%
|
||||
|
India
|
4
|
%
|
5
|
%
|
4
|
%
|
6
|
%
|
6
|
%
|
||||
|
Japan
|
3
|
%
|
3
|
%
|
3
|
%
|
1
|
%
|
1
|
%
|
||||
|
Thailand
|
5
|
%
|
5
|
%
|
3
|
%
|
2
|
%
|
2
|
%
|
||||
|
Intra-region eliminations
|
(7
|
)%
|
(6
|
)%
|
(4
|
)%
|
—
|
%
|
—
|
%
|
||||
|
Total Asia
|
50
|
%
|
48
|
%
|
44
|
%
|
55
|
%
|
53
|
%
|
||||
|
South America
|
6
|
%
|
6
|
%
|
6
|
%
|
4
|
%
|
4
|
%
|
||||
|
Inter-region eliminations
|
(10
|
)%
|
(9
|
)%
|
(6
|
)%
|
—
|
%
|
—
|
%
|
||||
|
100
|
%
|
100
|
%
|
100
|
%
|
100
|
%
|
100
|
%
|
|||||
9
The Company’s Website and Access to Available Information
The Company’s current and periodic reports filed with the United States Securities and Exchange Commission (“SEC”), including amendments to those reports, may be obtained through its internet website at www.visteon.com free of charge as soon as reasonably practicable after the Company files these reports with the SEC. A copy of the Company’s code of business conduct and ethics for directors, officers and employees of Visteon and its subsidiaries, entitled “Ethics and Integrity Policy,” the Corporate Governance Guidelines adopted by the Company’s Board of Directors and the charters of each committee of the Board of Directors are also available on the Company’s website. A printed copy of the foregoing documents may be requested by contacting the Company’s Investor Relations department in writing at One Village Center Drive, Van Buren Township, MI 48111; by phone (734) 710-5800; or via email at investor@visteon.com.
|
Item 1A.
|
Risk Factors
|
The risks and uncertainties described below are not the only ones facing the Company. Additional risks and uncertainties, including those not presently known or that the Company believes to be immaterial, also may adversely affect the Company’s results of operations and financial condition. Should any such risks and uncertainties develop into actual events, these developments could have material adverse effects on the Company’s business and financial results.
The Company is highly dependent on Hyundai Kia Automotive Group and Ford Motor Company and decreases in such customers’ vehicle production volumes would adversely affect the Company.
Hyundai Kia Automotive Group (“Hyundai Kia”) has rapidly become one of the Company’s largest customers, accounting for 33% of total product sales in 2013, 33% of total product sales in 2012 and 31% of total product sales in 2011. Additionally, Ford is one of the Company’s largest customers and accounted for approximately 28% of total product sales in 2013, 27% of total product sales in 2012, and 27% of total product sales in 2011. Accordingly, any change in Hyundai Kia's and/or Ford's vehicle production volumes will have a significant impact on the Company’s sales volume and profitability.
Escalating price pressures from customers may adversely affect the Company’s business.
Downward pricing pressures by automotive manufacturers is a characteristic of the automotive industry. Virtually all automakers have implemented aggressive price reduction initiatives and objectives each year with their suppliers, and such actions are expected to continue in the future. In addition, estimating such amounts is subject to risk and uncertainties because any price reductions are a result of negotiations and other factors. Accordingly, suppliers must be able to reduce their operating costs in order to maintain profitability. The Company has taken steps to reduce its operating costs and other actions to offset customer price reductions; however, price reductions have impacted the Company’s sales and profit margins and are expected to continue to do so in the future. If the Company is unable to offset customer price reductions in the future through improved operating efficiencies, new manufacturing processes, sourcing alternatives and other cost reduction initiatives, the Company’s results of operations and financial condition will likely be adversely affected.
Significant declines in the production levels of the Company’s major customers could reduce the Company’s sales and harm its profitability.
Demand for the Company’s products is directly related to the automotive vehicle production of the Company’s major customers. Automotive sales and production can be affected by general economic or industry conditions, labor relations issues, fuel prices, regulatory requirements, government initiatives, trade agreements and other factors. Automotive industry conditions in North America and Europe have been and continue to be extremely challenging. In North America, the industry is characterized by significant overcapacity and fierce competition. In Europe, the market structure is more fragmented with significant overcapacity and declining sales. While Asia continues to grow, the rate of growth is expected to decline.
The financial distress of the Company’s major customers and within the supply base could significantly affect its operating performance.
Domestic and European automotive manufacturers are burdened with substantial structural costs, such as pension and healthcare costs that have impacted their profitability and labor relations. In this environment, it is difficult to forecast future customer production schedules, the potential for labor disputes or the success or sustainability of any strategies undertaken by any of the Company’s major customers in response to the current industry environment. This environment may also put additional pricing pressure on suppliers to OEMs, such as the Company, which would reduce such suppliers’ (including the Company’s) margins. In addition, cuts in production schedules are also sometimes announced by customers with little advance notice, making it difficult for suppliers to respond with corresponding cost reductions.
10
The Company’s supply base has also been adversely affected by industry conditions. Lower production levels for the global automotive OEMs and increases in certain raw material, commodity and energy costs have resulted in financial distress among many companies within the automotive supply base. In recent years, several large suppliers have filed for bankruptcy protection or ceased operations. Unfavorable industry conditions have also resulted in financial distress within the Company’s supply base, an increase in commercial disputes and other risks of supply disruption. In addition, the current adverse industry environment has required the Company to provide financial support to distressed suppliers or take other measures to ensure uninterrupted production. While the Company has taken certain actions to mitigate these factors, those actions have offset only a portion of the overall impact on the Company’s operating results. The continuation or worsening of these industry conditions would adversely affect the Company’s profitability, operating results and cash flow.
The discontinuation of, loss of business or lack of commercial success, with respect to a particular vehicle model for which the Company is a significant supplier could reduce the Company’s sales and harm its profitability.
Although the Company has purchase orders from many of its customers, these purchase orders generally provide for the supply of a customer’s annual requirements for a particular vehicle model and assembly plant, or in some cases, for the supply of a customer’s requirements for the life of a particular vehicle model, rather than for the purchase of a specific quantity of products. In addition, it is possible that customers could elect to manufacture components internally that are currently produced by outside suppliers, such as the Company. The discontinuation of, the loss of business with respect to or a lack of commercial success of a particular vehicle model for which the Company is a significant supplier, could reduce the Company’s sales and harm the Company’s profitability.
The Company’s substantial international operations make it vulnerable to risks associated with doing business in foreign countries.
As a result of the Company’s global presence, a significant portion of the Company’s revenues and expenses are denominated in currencies other than the U.S. dollar. In addition, the Company has manufacturing and distribution facilities in many foreign countries, including countries in Europe, Central and South America and Asia. International operations are subject to certain risks inherent in doing business abroad, including:
|
•
|
local economic conditions, expropriation and nationalization, foreign exchange rate fluctuations and currency controls;
|
|
•
|
withholding and other taxes on remittances and other payments by subsidiaries;
|
|
•
|
investment restrictions or requirements;
|
|
•
|
export and import restrictions; and
|
|
•
|
increases in working capital requirements related to long supply chains.
|
Expanding the Company’s business in Asia and Europe and enhancing the Company’s business relationships with Asian and European automotive manufacturers worldwide are important elements of the Company’s long-term business strategy. In addition, the Company has invested significantly in joint ventures with other parties to conduct business in South Korea, China and elsewhere in Asia. The Company’s ability to repatriate funds from these joint ventures depends not only upon their uncertain cash flows and profits, but also upon the terms of particular agreements with the Company’s joint venture partners and maintenance of the legal and political status quo. As a result, the Company’s exposure to the risks described above is substantial. The likelihood of such occurrences and its potential effect on the Company vary from country to country and are unpredictable. However, any such occurrences could be harmful to the Company’s business and the Company’s profitability and financial condition.
The Company is subject to significant foreign currency risks and foreign exchange exposure.
In addition, as a result of our global presence, a significant portion of the Company's revenues and expenses is denominated in currencies other than the U.S. dollar. The Company is therefore subject to foreign currency risks and foreign exchange exposure. The Company's primary exposures are to the Euro, Korean Won, Czech Koruna, Mexican Peso, Hungarian Forint, Indian Rupee, Thai Baht and Chinese Renminbi. While the Company employs financial instruments to hedge transactional foreign exchange exposure, these activities do not insulate us completely from those exposures. Exchange rates can be volatile and could adversely impact our financial results and comparability of results from period to period. Specifically, there is concern regarding the overall stability of the euro and the future of the euro as a single currency given the diverse economic and political circumstances in individual Eurozone countries. Potential negative developments and market perceptions related to the euro could adversely affect the value of the Company's euro-denominated assets, as well as those of the Company's customers and suppliers.
11
Work stoppages and similar events could significantly disrupt the Company’s business.
Because the automotive industry relies heavily on just-in-time delivery of components during the assembly and manufacture of vehicles, a work stoppage at one or more of the Company’s manufacturing and assembly facilities could have material adverse effects on the business. Similarly, if one or more of the Company’s customers were to experience a work stoppage, that customer would likely halt or limit purchases of the Company’s products, which could result in the shut down of the related manufacturing facilities. A significant disruption in the supply of a key component due to a work stoppage at one of the Company’s suppliers or any other supplier could have the same consequences, and accordingly, have a material adverse effect on the Company’s financial results.
Visteon’s operations may be restricted by the terms of the Company’s credit agreements.
The Company’s credit agreements include a number of significant restrictive covenants. These covenants could impair the Company’s financing and operational flexibility and make it difficult to react to market conditions and satisfy ongoing capital needs and unanticipated cash requirements. Specifically, such covenants may restrict the ability and, if applicable, the ability of the subsidiaries to, among other things:
|
•
|
incur additional debt;
|
|
•
|
make certain investments;
|
|
•
|
enter into certain types of transactions with affiliates;
|
|
•
|
limit dividends or other payments by restricted subsidiaries;
|
|
•
|
use assets as security in other transactions;
|
|
•
|
pay dividends on Successor common stock or repurchase equity interests;
|
|
•
|
sell certain assets or merge with or into other companies;
|
|
•
|
guarantee the debts of others;
|
|
•
|
enter into new lines of business;
|
|
•
|
prepay, redeem or exchange debt; and
|
|
•
|
form any joint ventures or subsidiary investments.
|
In addition, the credit agreements require the Company to periodically meet various financial ratios and tests, including maximum leverage, minimum excess availability and minimum interest coverage levels in order to take certain corporate actions such as additional debt incurrence or restricted payments. These financial covenants and tests could limit the ability to react to market conditions or satisfy extraordinary capital needs and could otherwise restrict the Company’s financing and operations. The Company’s ability to comply with the covenants and other terms of the credit agreements will depend on future operating performance. If Visteon fails to comply with such covenants and terms, the Company would be required to obtain waivers from the lenders to maintain compliance under such agreements. If the Company is unable to obtain any necessary waivers and the debt under the credit agreements is accelerated, it would have a material adverse effect on the financial condition and future operating performance.
Inflation may adversely affect the Company’s profitability and the profitability of the Company’s tier 2 and tier 3 supply base.
The automotive supply industry has experienced significant inflationary pressures, primarily in ferrous and non-ferrous metals and petroleum-based commodities, such as resins. These inflationary pressures have placed significant operational and financial burdens on automotive suppliers at all levels, and are expected to continue for the foreseeable future. Generally, it has been difficult to pass on, in total, the increased costs of raw materials and components used in the manufacture of the Company’s products to its customers. In addition, the Company’s need to maintain a continuing supply of raw materials and/or components has made it difficult to resist price increases and surcharges imposed by its suppliers.
Further, this inflationary pressure, combined with other factors, has adversely impacted the financial condition of several domestic automotive suppliers, resulting in several significant supplier bankruptcies. Because the Company purchases various types of equipment, raw materials and component parts from suppliers, the Company may be materially and adversely affected by the failure of those suppliers to perform as expected. This non-performance may consist of delivery delays, failures caused by production issues or delivery of non-conforming products, or supplier insolvency or bankruptcy. Consequently, the Company’s efforts to continue to mitigate the effects of these inflationary pressures may be insufficient if conditions worsen, thereby negatively impacting the Company’s financial results.
12
The Company could be negatively impacted by supplier shortages.
In an effort to manage and reduce the costs of purchased goods and services, the Company, like many suppliers and automakers, has been consolidating its supply base. In addition, certain materials and components used by the Company, primarily in its electronics products, are in high demand but of limited availability. As a result, the Company is dependent on single or limited sources of supply for certain components used in the manufacture of its products. The Company selects its suppliers based on total value (including price, delivery and quality), taking into consideration production capacities and financial condition. However, there can be no assurance that strong demand, capacity limitations or other problems experienced by the Company’s suppliers will not result in occasional shortages or delays in the supply of components. If the Company were to experience a significant or prolonged shortage of critical components from any of its suppliers, particularly those who are sole sources, and could not procure the components from other sources, the Company would be unable to meet its production schedules for some of its key products or to ship such products to its customers in a timely fashion, which would adversely affect sales, margins, and customer relations.
The Company’s pension expense and funding levels of pension plans could materially deteriorate or the Company may be unable to generate sufficient excess cash flow to meet increased pension benefit obligations.
Many of the Company’s employees participate in defined benefit pension plans or retirement/termination indemnity plans. Effective December 31, 2011, active salaried employees in the U.S. ceased to accrue benefits under the existing defined benefit pension plan. The Company’s worldwide pension obligations exposed the Company to approximately $388 million in unfunded liabilities as of December 31, 2013, of which approximately $121 million and $267 million was attributable to unfunded U.S. and non-U.S. pension obligations, respectively.
The Company has previously experienced declines in interest rates and pension asset values. Future declines in interest rates or the market values of the securities held by the plans, or certain other changes, could materially deteriorate the funded status of the Company’s plans and affect the level and timing of required contributions in 2014 and beyond. Additionally, a material deterioration in the funded status of the plans could significantly increase pension expenses and reduce the Company’s profitability.
The Company’s assumptions used to calculate pension obligations as of the annual measurement date directly impact the expense to be recognized in future periods. While the Company’s management believes that these assumptions are appropriate, significant differences in actual experience or significant changes in these assumptions may materially affect the Company’s pension obligations and future expense. For more information on sensitivities to changing assumptions, please see Item 7 “Management’s Discussion and Analysis of Financial Condition and Results of Operations” and Note 10 “Employee Retirement Benefits” to the Company’s consolidated financial statements included in Item 8 “Financial Statements and Supplementary Data” of this Annual Report on Form 10-K.
The Company’s ability to generate sufficient cash to satisfy its obligations may be impacted by the factors discussed herein
.
The Company's inability to execute its shareholder value creation strategy could adversely affect its financial performance.
The Company's long-term financial and stock performance depends, in part, on the Company's ability to successfully execute a comprehensive shareholder value creation strategy. This strategy involves, among other things, consolidating climate operations, realigning and reducing fixed costs, enhancing or disposing of certain product groups, achieving market recognition for certain businesses, balance sheet improvements, and share repurchases. Various factors, including the industry environment and the other matters described herein and in Part II - Item 7, “Management's Discussion and Analysis of Financial Condition and Results of Operations,” including “- Forward-Looking Statements,” could adversely affect our ability to execute this strategy. A failure to execute these strategic objectives could adversely affect the Company's financial condition, operating results and cash flows. Moreover, there can be no assurances that, even if implemented, that the strategy will be successful.
The Company’s ability to effectively operate could be hindered if it fails to attract and retain key personnel.
The Company’s ability to operate its business and implement its strategies effectively depends, in part, on the efforts of its executive officers and other key employees. In addition, the Company’s future success will depend on, among other factors, the ability to attract and retain qualified personnel, particularly engineers and other employees with critical expertise and skills that support key customers and products or in emerging regions. The loss of the services of any key employees or the failure to attract or retain other qualified personnel could have a material adverse effect on the Company’s business.
13
The Company may incur significant restructuring charges.
The Company has taken, and expects to take, restructuring actions to realign and resize its production capacity and cost structure to meet current and projected operational and market requirements. Charges related to these actions could have a material adverse effect on the Company's financial condition, operating results and cash flows. Moreover, there can be no assurances that any future restructurings will be completed as planned or achieve the desired results.
Impairment charges relating to the Company’s goodwill and long-lived assets and possible increases to deferred income tax asset valuation allowances could adversely affect the Company’s financial performance.
The Company regularly monitors its goodwill and long-lived assets for impairment indicators. The Company performs either a qualitative or quantitative assessment of goodwill for impairment at the reporting unit level on an annual basis. In conducting the impairment analysis of long-lived assets, the Company compares the undiscounted cash flows expected to be generated from the long-lived assets to the related net book values. Changes in economic or operating conditions impacting the estimates and assumptions could result in the impairment of goodwill or long-lived assets. In the event that the Company determines that its goodwill or long-lived assets are impaired, the Company may be required to record a significant charge to earnings that could materially affect the Company’s results of operations and financial condition in the period(s) recognized. The Company recorded asset impairment charges of $24 million and $66 million in 2012 and 2011, respectively, to adjust the carrying value of certain assets to their estimated fair value. In addition, the Company cannot provide assurance that it will be able to recover remaining net deferred tax assets, which are dependent upon achieving future taxable income in certain foreign jurisdictions. Failure to achieve its taxable income targets may change the Company’s assessment of the recoverability of its remaining net deferred tax assets and would likely result in an increase in the valuation allowance in the applicable period. Any increase in the valuation allowance would result in additional income tax expense, which could have a significant impact on the Company’s future results of operations.
The Company’s expected annual effective tax rate could be volatile and could materially change as a result of changes in mix of earnings and other factors.
Changes in the Company’s debt and capital structure, among other items, may impact its effective tax rate. The Company’s overall effective tax rate is computed as consolidated tax expense as a percentage of consolidated earnings before tax. However, tax expenses and benefits are not recognized on a global basis but rather on a jurisdictional basis. Further, the Company is in a position whereby losses incurred in certain tax jurisdictions generally provide no current financial statement benefit. In addition, certain jurisdictions have statutory rates greater than or less than the United States statutory rate. As such, changes in the mix and source of earnings between jurisdictions could have a significant impact on the Company’s overall effective tax rate in future periods. Changes in tax law and rates, changes in rules related to accounting for income taxes or adverse outcomes from tax audits that regularly are in process in any of the jurisdictions in which the Company operates could also have a significant impact on the Company’s overall effective rate in future periods.
Warranty claims, product liability claims and product recalls could harm the Company’s business, results of operations and financial condition.
The Company faces the inherent business risk of exposure to warranty and product liability claims in the event that its products fail to perform as expected or such failure results, or is alleged to result, in bodily injury or property damage (or both). In addition, if any of the Company’s designed products are defective or are alleged to be defective, the Company may be required to participate in a recall campaign. As suppliers become more integrally involved in the vehicle design process and assume more of the vehicle assembly functions, automakers are increasingly expecting them to warrant their products and are increasingly looking to suppliers for contributions when faced with product liability claims or recalls. A successful warranty or product liability claim against the Company in excess of its available insurance coverage and established reserves, or a requirement that the Company participate in a product recall campaign, could have materially adverse effects on the Company’s business, results of operations and financial condition.
The Company is involved from time to time in legal proceedings and commercial or contractual disputes, which could have an adverse effect on its business, results of operations and financial position.
The Company is involved in legal proceedings and commercial or contractual disputes that, from time to time, are significant. These are typically claims that arise in the normal course of business including, without limitation, commercial or contractual disputes (including disputes with suppliers), intellectual property matters, personal injury claims and employment matters. No assurances can be given that such proceedings and claims will not have a material adverse impact on the Company’s profitability and financial position.
14
The Company could be adversely impacted by environmental laws and regulations.
The Company’s operations are subject to U.S. and foreign environmental laws and regulations governing emissions to air; discharges to water; the generation, handling, storage, transportation, treatment and disposal of waste materials; and the cleanup of contaminated properties. Currently, environmental costs with respect to former, existing or subsequently acquired operations are not material, but there is no assurance that the Company will not be adversely impacted by such costs, liabilities or claims in the future either under present laws and regulations or those that may be adopted or imposed in the future.
Developments or assertions by or against the Company relating to intellectual property rights could materially impact its business.
The Company owns significant intellectual property, including a number of patents, trademarks, copyrights and trade secrets, and is involved in numerous licensing arrangements. The Company’s intellectual property plays an important role in maintaining its competitive position in a number of the markets served. Developments or assertions by or against the Company relating to intellectual property rights could materially impact the Company’s business. Significant technological developments by others also could materially and adversely affect the Company’s business and results of operations and financial condition.
A disruption in our information technology systems could adversely affect our business and financial performance.
We rely on the accuracy, capacity and security of our information technology systems. Despite the security and risk-prevention measures we have implemented, our systems could be breached, damaged or otherwise interrupted by computer viruses, unauthorized physical or electronic access or other natural or man-made incidents or disasters. Such a breach or interruption could result in business disruption, theft of our intellectual property or trade secrets and unauthorized access to personnel information. To the extent that our business is interrupted or data is lost, destroyed or inappropriately used or disclosed, such disruptions could adversely affect our competitive position, relationships with our customers, financial condition, operating results and cash flows.
The Company may not be able to fully utilize its U.S. net operating losses and other tax attributes.
Visteon's emergence from bankruptcy in 2010 resulted in a change of ownership within the meaning of Internal Revenue Code (“IRC”) Sections 382 and 383, causing the use of Visteon's pre-emergence U.S. federal net operating loss (“NOL”) and various other tax attributes to be limited in the post-emergence period. However, NOLs and other tax attributes generated in the post-emergence period are generally not limited by the emergence from bankruptcy, but could be limited if there is a subsequent change of ownership. If the Company were to have another change of ownership within the meaning of IRC Sections 382 and 383, its post-emergence NOL and other tax attributes could be limited to an amount equal to its market capitalization at the time of the subsequent ownership change multiplied by the federal long-term tax exempt rate. The Company cannot provide any assurance that such an ownership change will not occur, in which case the availability of the Company's NOLs and other tax attributes could be significantly limited or possibly eliminated.
Certain tax benefit preservation provisions of our corporate documents could delay or prevent a change of control, even if that change would be beneficial to stockholders.
Our second amended and restated certificate of incorporation provides, among other things, that any attempted transfer of the Company's securities during a Restricted Period shall be prohibited and void ab initio insofar as it purports to transfer ownership or rights in respect of such stock to the purported transferee to the extent that, as a result of such transfer, either any person or group of persons shall become a “Five-percent shareholder” of Visteon pursuant to Treasury Regulation § 1.382-2T(g), other than a “direct public group” as defined in such regulation (a “Five-Percent Shareholder”), or the percentage stock ownership interest in Visteon of any Five-Percent Shareholder shall be increased.
The foregoing restriction does not apply to transfers if either the transferor or transferee gives written notice to the Board of Directors and obtains their approval. A Restricted Period means any period beginning when the Company's market capitalization falls below $1.5 billion (or such other level determined by the Board of Directors not more frequently than annually) and ending when such market capitalization has been above such threshold for 30 consecutive calendar days.
The Company’s business and results of operations could be affected adversely by terrorism.
Terrorist-sponsored attacks, both foreign and domestic, could have adverse effects on the Company’s business and results of operations. These attacks could accelerate or exacerbate other automotive industry risks such as those described above and also have the potential to interfere with the Company’s business by disrupting supply chains and the delivery of products to customers.
15
A failure of the Company’s internal controls could adversely affect the Company’s ability to report its financial condition and results of operations accurately and on a timely basis. As a result, the Company’s business, operating results and liquidity could be harmed.
Because of the inherent limitations of any system of internal control, including the possibility of human error, the circumvention or overriding of controls or fraud, even an effective system of internal control may not prevent or detect all misstatements. In the event of an internal control failure, the Company’s ability to report its financial results on a timely and accurate basis could be adversely impacted, which could result in a loss of investor confidence in its financial reports or have a material adverse effect on the Company’s ability to operate its business or access sources of liquidity.
These restrictions could prohibit or delay the accomplishment of an ownership change with respect to Visteon by (i) discouraging any person or group from being a Five-Percent Shareholder and (ii) discouraging any existing Five-Percent Shareholder from acquiring more than a minimal number of additional shares of Visteon's stock.
|
Item 1B.
|
Unresolved Staff Comments
|
None
|
Item 2.
|
Properties
|
The Company's principal executive offices are located in Van Buren Township, Michigan. As of December 31, 2013, the Company and its consolidated subsidiaries owned or leased approximately:
|
•
|
29 corporate offices, technical and engineering centers and customer service centers in seventeen countries around the world, of which 26 were leased and 3 were owned;
|
|
•
|
30 Climate manufacturing and/or assembly facilities in the United States, Canada, Mexico, Czech Republic, France, Hungary, Portugal, Slovakia, Turkey, South Africa, China, India, South Korea, Thailand and Argentina, of which 13 were leased and 17 were owned;
|
|
•
|
24 Interiors manufacturing and/or assembly facilities in Belgium, France, Germany, Poland, Slovakia, Spain, Russia, Morocco, South Korea, Thailand, India, Brazil and Argentina, of which 14 were leased and 10 were owned; and
|
|
•
|
10 Electronics manufacturing and/or assembly facilities in Mexico, Portugal, Russia, India, Japan, South Korea, China, Thailand and Brazil, of which 7 were leased and 3 were owned.
|
In addition, the Company's non-consolidated affiliates operate approximately 19 manufacturing and/or assembly locations, primarily in the Asia Pacific region. The Company considers its facilities to be adequate for its current uses.
|
Item 3.
|
Legal Proceedings
|
In 2003, the Local Development Finance Authority of the Charter Township of Van Buren, Michigan (the “Township”) issued approximately $28 million in bonds finally maturing in 2032, the proceeds of which were used at least in part to assist in the development of the Company’s U.S. headquarters located in the Township. During January 2010, the Company and the Township entered into a settlement agreement (the “Settlement Agreement”) that, among other things, reduced the taxable value of the headquarters property to current market value and facilitated certain claims of the Township in the Company’s chapter 11 proceedings. The Settlement Agreement also provided that the Company would continue to negotiate in good faith with the Township in the event that property tax payments were inadequate to permit the Township to meet its payment obligations with respect to the bonds. In September 2013, the Township notified the Company in writing that it is estimating a shortfall in tax revenues of between $25 million and $36 million, which could render it unable to satisfy its payment obligations under the bonds, but made no specific monetary demand of the Company. The Company disputes the factual and legal assertions made by the Township and intends to vigorously defend the matter should the Township seek to commence a legal proceeding against the Company. The Company is not able to estimate the possible loss or range of loss in connection with this matter.
In November 2013, the Company and Halla Visteon Climate Control Corp., the Company’s South Korean subsidiary (“HVCC”), jointly filed an Initial Notice of Voluntary Self-Disclosure statement with the U.S. Treasury Department’s Office of Foreign Assets Control (“OFAC”) regarding certain sales of automotive HVAC components by a minority-owned, Chinese joint venture of HVCC into Iran, which the Company updated in December 2013. Pursuant to the notice, the Company and HVCC are reviewing these matters and will furnish OFAC with the results of their investigation. OFAC may conclude that our actions resulted in violations of U.S. economic sanctions laws and warrant the imposition of civil penalties, such as fines, limitations on our ability to export
16
products from the United States, and/or referral for further investigation by the U.S. Department of Justice. Any such fines or restrictions may be material to the Company’s financial results in the period in which they are imposed. Additionally, disclosure of this conduct and any fines or other action relating to this conduct could harm the Company’s reputation and have a material adverse effect on our business, operating results and financial condition. Although the Company plans to file its full report with OFAC by March 2014, it cannot predict when OFAC will conclude its review of that report or whether it will impose any of the potential penalties described above.
During January 2014, HVCC provided documents and information to the Korean Fair Trade Commission regarding certain subcontracting transactions and practices. HVCC's policy is to comply with all laws and regulations applicable to it and it intends to cooperate fully with the Korean Fair Trade Commission. At this time, HVCC is not able to estimate a reasonably possible range of loss that may ultimately result from this investigation.
On March 29, 2012, the Korean Supreme Court ruled that regular bonuses should be included for purposes of calculating the ordinary wage of applicable employees, which was contrary to previous legal precedent and the position of the Korean Ministry of Employment and Labor. On December 18, 2013, the Korean Supreme Court issued an en banc decision clarifying that (i) regular bonuses, should be included for purposes of calculating such ordinary wage, and (ii) certain incentive pay and family allowances may also be included for purposes of calculating such ordinary wage if they were paid to employees as consideration for the labor actually provided by them. The court also indicated that employers could be excused from liability for excluding such regular bonuses from ordinary wages where an express or implied management-labor agreement or practice to exclude such amounts existed and to require such payment would cause “serious managerial difficulty.” The Company is evaluating the potential financial impact of these new court rulings, and is not able to determine at this time whether it will have a material impact on the results of operations and cash flows of its South Korean subsidiaries. However, the Company believes it qualifies for this provision for prior periods. In addition, on May 24, 2013, Halla Visteon Climate Control Union in Korea, representing 891 hourly employees of HVCC, filed a legal petition with Seoul Southern District Court, claiming unpaid statutory benefits for the past three years based on the initial Supreme Court ruling. The Company is in the process of evaluating these claims, but at this time is not able to estimate the possible loss or range of loss in connection with this matter.
The Company's operations in Brazil are subject to highly complex labor, tax, customs and other laws. While the Company believes that it is in compliance with such laws, it is periodically engaged in litigation regarding the application of these laws. As of December 31, 2013, the Company maintained accruals of approximately $9 million for claims aggregating approximately $150 million. The amounts accrued represent claims that are deemed probable of loss and are reasonably estimable based on the Company's assessment of the claims and prior experience with similar matters.
Several current and former employees of Visteon Deutschland GmbH (“Visteon Germany”) filed civil actions against Visteon Germany in various German courts beginning in August 2007 seeking damages for the alleged violation of German pension laws that prohibit the use of pension benefit formulas that differ for salaried and hourly employees without adequate justification. Several of these actions have been joined as pilot cases. In a written decision issued in April 2010, the Federal Labor Court issued a declaratory judgment in favor of the plaintiffs in the pilot cases. To date, more than 750 current and former employees have filed similar actions or have inquired as to or been granted additional benefits, and an additional 600 current and former employees are similarly situated. The Company's remaining reserve for unsettled cases is approximately $8 million and is based on the Company’s best estimate as to the number and value of the claims that will be made in connection with the pension plan. However, the Company’s estimate is subject to many uncertainties which could result in Visteon Germany incurring amounts in excess of the reserved amount of up to approximately $9 million.
On May 28, 2009, the Company filed voluntary petitions in the Court seeking reorganization relief under the provisions of chapter 11 of the Bankruptcy Code and continued to operate as debtors-in-possession until emergence on October 1, 2010. Substantially all pre-petition liabilities and claims relating to rejected executory contracts and unexpired leases have been settled under the plan of reorganization, however, the ultimate amounts to be paid in settlement of each those claims will continue to be subject to the uncertain outcome of litigation, negotiations and Bankruptcy Court decisions for a period of time after the emergence date.
In December of 2009, the Court granted the Debtors' motion in part authorizing them to terminate or amend certain other postretirement employee benefits, including health care and life insurance. On December 29, 2009, the IUE-CWA, the Industrial Division of the Communications Workers of America, AFL-CIO, CLC, filed a notice of appeal of the Court's order with the District Court. By order dated March 31, 2010, the District Court affirmed the Court's order in all respects. On April 1, 2010, the IUE filed a notice of appeal. On July 13, 2010, the Circuit Court reversed the order of the District Court as to the IUE-CWA and directed the District Court to, among other things, direct the Court to order the Company to take whatever action is necessary to immediately restore terminated or modified benefits to their pre-termination/modification levels. On July 27, 2010, the Company filed a Petition for Rehearing or Rehearing En Banc requesting that the Circuit Court review the panel’s decision, which was denied. By orders dated August 30, 2010, the Court ruled that the Company should restore certain other postretirement employee benefits to the
17
appellant-retirees and also to salaried retirees and certain retirees of the International Union, United Automobile, Aerospace and Agricultural Implement Workers of America (“UAW”). On September 1, 2010, the Company filed a Notice of Appeal to the District Court of the Court's decision to include non-appealing retirees, and on September 15, 2010 the UAW filed a Notice of Cross-Appeal. On July 25, 2012, the District Court ruled in favor of the Company on both appeals, and the UAW has appealed this ruling to the Circuit Court. The Company reached an agreement with the original appellants in late-September 2010, which resulted in the Company not restoring other postretirement employee benefits of such retirees. On September 30, 2010, the UAW filed a complaint, which it amended on October 1, 2010, in the United States District Court for the Eastern District of Michigan seeking, among other things, a declaratory judgment to prohibit the Company from terminating certain other postretirement employee benefits for UAW retirees after October 1, 2010. The parties reached a preliminary settlement agreement in January 2013, but it was later terminated by the plaintiffs. On October 22, 2013, the U.S. District Court for the Eastern District of Michigan issued an order denying the Company's motion to dismiss the UAW's complaint and granted its motion to transfer the case to the U.S. District Court for the District of Delaware. As of December 31, 2013, the Company maintains an accrual for claims that are deemed probable of loss and are reasonably estimable.
While the Company believes its accruals for litigation and claims are adequate, the final amounts required to resolve such matters could differ materially from recorded estimates and the Company's results of operations and cash flows could be materially affected.
|
Item 4.
|
Mine Safety Disclosures
|
None
|
Item 4A.
|
Executive Officers and Key Employees
|
The following table shows information about the executive officers of the Company and other key employees. Ages are as of February 1, 2014:
|
Name
|
Age
|
Position
|
||
|
Timothy D. Leuliette
|
64
|
President and Chief Executive Officer
|
||
|
Jeffrey M. Stafeil
|
44
|
Executive Vice President and Chief Financial Officer
|
||
|
Martin T. Thall
|
52
|
Executive Vice President and President, Electronics Product Group
|
||
|
Michael K. Sharnas
|
42
|
Senior Vice President and General Counsel
|
||
|
Michael J. Widgren
|
45
|
Senior Vice President, Corporate Controller and Chief Accounting Officer
|
||
|
Yong Hwan Park
|
57
|
President and Chief Executive Officer, Halla Visteon Climate Control Corporation
|
||
Timothy D. Leuliette has been Visteon's Chief Executive Officer and President since September 30, 2012, and a director of the Company since October 1, 2010. From August 10, 2012 to September, 30, 2012 Mr. Leuliette served as Visteon's Interim Chairman of the Board, Interim Chief Executive Officer and Interim President, and prior to that Mr. Leuliette was the Senior Managing Director of FINNEA Group, LLC, an investment and financial services firm since October 14, 2010. Mr. Leuliette has also served as the President and Chief Executive Officer of Dura Automotive LLC, an automotive supplier, from July 2008, a director of Dura from June 2008, and the Chairman of the Board of Dura from December 2008. Mr. Leuliette also served as a Managing Director of Patriarch Partners LLC, the majority stockholder of Dura. Prior to that, he served as Co-Chairman and Co-Chief Executive Officer of Asahi Tec Corporation, a manufacturer of automotive parts and other products, and Chairman, Chief Executive Officer and President of Metaldyne Corporation, an automotive supplier, from January 2001 to January 2008. Over his career he has held executive and management positions at both vehicle manufacturers and suppliers and has served on both corporate and civic boards, including as Chairman of the Detroit Branch of the Federal Reserve Bank of Chicago.
Jeffrey M. Stafeil has been Visteon's Executive Vice President since joining the Company on October 31, 2012 and Chief Financial Officer since November 2, 2012. Prior to joining the Company, Mr. Stafeil was the chief executive officer of DURA Automotive Systems LLC, an automotive supplier, since October 2010, and DURA's executive vice president and chief financial officer between December 2008 and October 2012. Prior to that, Mr. Stafeil was the chief financial officer and a board member at the Klöckner Pentaplast Group, a producer of films for packaging, printing and specialty applications, from July 2007 to December 2008. From July 2003 to July 2007, he was the executive vice president and chief financial officer of Metaldyne Corporation, an automotive supplier. Prior to joining Metaldyne in 2001, Mr. Stafeil served in a variety of management positions at Booz Allen and Hamilton, Peterson Consulting and Ernst and Young. In addition, from January 2007 to July 2009, he served on the board of directors and was co-chairman of the audit committee for Meridian Automotive Systems, and served on the board of directors and was audit committee chairman of J.L. French Automotive Castings, Inc. from September 2009 to June 2012.
18
Martin T. Thall has been Visteon’s Executive Vice President and President, Electronics Product Group since November 19, 2013. Before joining Visteon, Mr. Thall was a vice president at Verizon Communications, a mobile phone service provider, from January 2012 to April 2013, and Chief Executive Officer of Vehicle ICT Corporation, a provider of management consulting services to automotive and information technology firms, from January 2010 to December 2011. Prior to that, he served in various management roles at Microsoft Corporation from 1996 to 2008, including Vice President and General Manager of the Automotive Business Unit. Mr. Thall also served as director of Blackline GPS, Inc. from July 2009 to December 2011.
Michael K. Sharnas has been Visteon's Senior Vice President and General Counsel since August 2012. Prior to that, he was Vice President and General Counsel since October 2009, Assistant General Counsel since 2005 and Associate General Counsel since joining the Company in October 2002.
Michael J. Widgren has been Visteon’s Senior Vice President, Corporate Controller and Chief Accounting Officer since November 1, 2013. Prior to that he was Vice President, Corporate Controller and Chief Accounting Officer since May 2007, served as Visteon’s interim Chief Financial Officer from October 3, 2012 to November 2, 2012, and was Assistant Corporate Controller since joining the Company in October 2005. Before joining Visteon, Mr. Widgren served as Chief Accounting Officer for Federal-Mogul Corporation.
Yong Hwan Park has been Halla Visteon Climate Control Corporation’s President and Chief Executive Officer since March 2012. From June 2011 until March 2012, Mr. Park served as President and Chief Operating Officer of Halla Visteon Climate Control Corporation. Prior to that, he was Vice President, Corporate Planning from January 2011 until May 2011, and Senior Director, Corporate Planning prior thereto. Mr. Park joined Halla Visteon Climate Control Corporation in 1986 when the company was formed and has held various roles of increasing responsibility.
19
|
Item 5.
|
Market for Registrant’s Common Equity, Related Stockholder Matters and Issuer Purchases of Equity Securities
|
As of February 17, 2014, the Company had 48,395,695 shares of its common stock $0.01 par value outstanding, which were owned by 10,890 shareholders of record. The table below shows the high and low sales prices per share for the Company’s successor common stock as reported by the NYSE for each quarterly period for the last two years.
|
2013
|
|||||||
|
First
Quarter
|
Second
Quarter
|
Third
Quarter
|
Fourth
Quarter
|
||||
|
High
|
$61.50
|
$66.49
|
$77.60
|
$82.23
|
|||
|
Low
|
$50.00
|
$52.26
|
$59.95
|
$72.50
|
|||
|
2012
|
|||||||
|
First
Quarter
|
Second
Quarter
|
Third
Quarter
|
Fourth
Quarter
|
||||
|
High
|
$57.00
|
$53.46
|
$48.40
|
$54.18
|
|||
|
Low
|
$47.16
|
$35.72
|
$27.04
|
$42.48
|
|||
No dividends were paid by the Company on its common stock during the years ended December 31, 2013, 2012 or 2011. The Company’s Board of Directors (the “Board”) evaluates the Company’s dividend policy based on all relevant factors. The Company’s credit agreements limit the amount of cash payments for dividends that may be made. Additionally, the ability of the Company’s subsidiaries to transfer assets is subject to various restrictions, including regulatory requirements and governmental restraints. Refer to Note 4, “Non-Consolidated Affiliates,” to the Company’s consolidated financial statements included in Item 8 “Financial Statements and Supplementary Data” of this Annual Report on Form 10-K.
The following table summarizes information relating to purchases made by or on behalf of the Company, or an affiliated purchaser, of shares of the Company’s common stock during the fourth quarter of 2013.
|
Period
|
Total Number of Shares (or Units) Purchased (1)
|
Average Price Paid per Share (or Unit)
|
Total Number of Shares (or units) Purchased as Part of Publicly Announced Plans or Programs (2)
|
Approximate Dollar Value of Shares (or Units) that May Yet Be Purchased Under the Plans or Programs (2) (in millions)
|
|||||
|
Oct. 1, 2013 to Oct. 31, 2013
|
57,424
|
|
$76.00
|
—
|
|
$875
|
|||
|
Nov. 1, 2013 to Nov. 30, 2013
|
1,350
|
|
$77.14
|
—
|
|
$875
|
|||
|
Dec. 1, 2013 to Dec. 31, 2013
|
308,992
|
|
$74.56
|
307,975
|
|
$875
|
|||
|
Total
|
367,766
|
|
$74.80
|
307,975
|
|
$875
|
|||
|
(1)
|
This column includes 59,791 shares surrendered to the Company by employees to satisfy tax withholding obligations in connection with the vesting of restricted share and stock unit awards made pursuant to the Visteon Corporation 2010 Incentive Plan.
|
|
(2)
|
On August 11, 2013, the board of directors increased its share repurchase program authorization by $875 million to a total authorization to repurchase up to $1 billion of the Company's common stock thereafter until December 31, 2015. In August 2013, the Company entered into an accelerated stock buyback "(ASB") program with a third-party financial institution to repurchase shares of common stock for an aggregate purchase price of $125 million. Under the ASB program, the Company paid the financial institution $125 million and received an initial delivery of 1,368,925 shares of common stock using a reference price of $73.05. On December 20, 2013, the program concluded and the Company received an additional 307,975 shares. The Company anticipates that additional repurchases of common stock, if any, would occur from time to time in open market transactions, non-discretionary programs or in privately negotiated transactions depending on market and economic conditions, share price, trading volumes, alternative uses of capital and other factors.
|
The following information in Item 5 is not deemed to be “soliciting material” or be “filed” with the SEC or subject to Regulation 14A or 14C under the Securities Exchange Act of 1934 (“Exchange Act”) or to the liabilities of Section 18 of the Exchange Act, and will not be deemed to be incorporated by reference into any filing under the Securities Act of 1933 or the Exchange Act, except to the extent the Company specifically incorporates it by reference into such a filing.
20
Performance Graph
The following graph compares the cumulative total stockholder return from October 1, 2010, the date of the Company's emergence from Chapter 11 bankruptcy proceedings, through December 31, 2013, for its existing common stock, the S&P 500 Index and the Dow Jones U.S. Auto Parts Index. Because the value of the Company's predecessor common stock bears no relation to the value of its existing common stock, the graph below reflects only the Company's existing common stock. The graph below assumes that $100 was invested on October 1, 2010 in each of the Company's existing common stock, the stocks comprising the S&P 500 Index and the stocks comprising the Dow Jones U.S. Auto Parts Index, and that all that dividends have been reinvested.
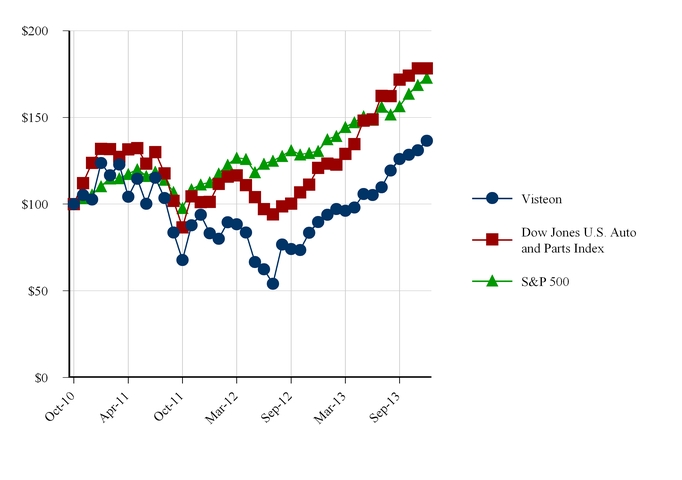
|
October 1, 2010
|
December 31, 2010
|
December 31, 2011
|
December 31, 2012
|
December 31, 2013
|
|||||||||||
|
Visteon Corporation
|
$
|
100.00
|
|
$
|
123.80
|
|
$
|
83.20
|
|
$
|
89.70
|
|
$
|
136.50
|
|
|
S&P 500
|
$
|
100.00
|
|
$
|
110.30
|
|
$
|
112.60
|
|
$
|
130.60
|
|
$
|
172.90
|
|
|
Dow Jones U.S. Auto & Parts Index
|
$
|
100.00
|
|
$
|
127.80
|
|
$
|
111.30
|
|
$
|
122.70
|
|
$
|
178.30
|
|
The above comparisons are required by the Securities and Exchange Commission and are not intended to forecast or be indicative of possible future performance of the Company's common stock or the referenced indices.
21
|
Item 6.
|
Selected Financial Data
|
The following statement of operations, statement of cash flow and balance sheet data were derived from the Company's consolidated financial statements for the years ended December 31, 2013, 2012 and 2011, and the three month period ended December 31, 2010 and nine month period ended October 1, 2010, and the years ended December 31, 2009. This information should be read in conjunction with Item 7, “Management's Discussion and Analysis of Financial Condition and Results of Operations” and Item 8, “Financial Statements and Supplementary Data” in this Annual Report on Form 10-K.
On May 28, 2009, Visteon and certain of its U.S. subsidiaries (the “Debtors”) filed voluntary petitions for reorganization relief under chapter 11 of the United States Bankruptcy Code (the “Bankruptcy Code”) in the United States Bankruptcy Court for the District of Delaware (the “Court”) (the “Chapter 11 Proceedings”) in response to sudden and severe declines in global automotive production during the latter part of 2008 and early 2009 and the resulting adverse impact on the Company’s cash flows and liquidity. On August 31, 2010 (the “Confirmation Date”), the Court entered an order (the “Confirmation Order”) confirming the Debtors’ joint plan of reorganization (as amended and supplemented, the “Plan”). On October 1, 2010 (the “Effective Date”), all conditions precedent to the effectiveness of the Plan and related documents were satisfied or waived and the Company emerged from bankruptcy and became a new entity for financial reporting purposes. Accordingly, the consolidated financial statements for the reporting entity subsequent to the Effective Date (the “Successor”) are not comparable to the consolidated financial statements for the reporting entity prior to the Effective Date (the “Predecessor”).
|
Successor
|
Predecessor
|
|||||||||||||||||||||||
|
Year Ended December 31
|
Year Ended December 31
|
Year Ended December 31
|
Three months Ended December 31
|
Nine Months Ended October 1
|
Year Ended December 31
|
|||||||||||||||||||
|
2013
|
2012
|
2011
|
2010
|
2010
|
2009
|
|||||||||||||||||||
|
(Dollars in Millions, Except Per Share Amounts)
|
||||||||||||||||||||||||
|
Statement of Operations Data
|
||||||||||||||||||||||||
|
Net sales
|
$
|
7,439
|
|
$
|
6,857
|
|
$
|
7,532
|
|
$
|
1,778
|
|
$
|
5,244
|
|
$
|
6,328
|
|
||||||
|
Net income from continuing operations
|
775
|
|
170
|
|
210
|
|
105
|
|
982
|
|
227
|
|
||||||||||||
|
(Loss) income from discontinued operations, net of tax
|
—
|
|
(3
|
)
|
(56
|
)
|
—
|
|
14
|
|
(43
|
)
|
||||||||||||
|
Net income attributable to Visteon Corporation
|
$
|
690
|
|
$
|
100
|
|
$
|
80
|
|
$
|
86
|
|
$
|
940
|
|
$
|
128
|
|
||||||
|
Basic earnings (loss) per share:
|
||||||||||||||||||||||||
|
Continuing operations
|
$
|
13.80
|
|
$
|
1.95
|
|
$
|
2.65
|
|
$
|
1.71
|
|
$
|
7.10
|
|
$
|
1.31
|
|
||||||
|
Discontinued operations
|
—
|
|
(0.06
|
)
|
(1.09
|
)
|
—
|
|
0.11
|
|
(0.33
|
)
|
||||||||||||
|
Basic earnings attributable to Visteon Corporation
|
$
|
13.80
|
|
$
|
1.89
|
|
$
|
1.56
|
|
$
|
1.71
|
|
$
|
7.21
|
|
$
|
0.98
|
|
||||||
|
Diluted earnings (loss) per share:
|
||||||||||||||||||||||||
|
Continuing operations
|
$
|
13.50
|
|
$
|
1.93
|
|
$
|
2.62
|
|
$
|
1.66
|
|
$
|
7.10
|
|
$
|
1.31
|
|
||||||
|
Discontinued operations
|
—
|
|
(0.05
|
)
|
(1.08
|
)
|
—
|
|
0.11
|
|
(0.33
|
)
|
||||||||||||
|
Diluted earnings attributable to Visteon Corporation
|
$
|
13.50
|
|
$
|
1.88
|
|
$
|
1.54
|
|
$
|
1.66
|
|
$
|
7.21
|
|
$
|
0.98
|
|
||||||
|
Balance Sheet Data
|
||||||||||||||||||||||||
|
Total assets
|
$
|
5,991
|
|
$
|
5,156
|
|
$
|
4,969
|
|
$
|
5,208
|
|
N/A
|
|
$
|
5,019
|
|
|||||||
|
Total debt
|
$
|
730
|
|
$
|
569
|
|
$
|
599
|
|
$
|
561
|
|
N/A
|
|
$
|
231
|
|
|||||||
|
Total Visteon Corporation stockholders' equity (deficit)
|
$
|
1,920
|
|
$
|
1,385
|
|
$
|
1,307
|
|
$
|
1,260
|
|
N/A
|
|
$
|
(772
|
)
|
|||||||
|
Statement of Cash Flows Data
|
||||||||||||||||||||||||
|
Cash provided from operating activities
|
$
|
312
|
|
$
|
239
|
|
$
|
175
|
|
$
|
154
|
|
$
|
20
|
|
$
|
141
|
|
||||||
|
Cash provided from (used by) investing activities
|
$
|
698
|
|
$
|
(40
|
)
|
$
|
(331
|
)
|
$
|
(76
|
)
|
$
|
(75
|
)
|
$
|
(123
|
)
|
||||||
|
Cash used by financing activities
|
$
|
(141
|
)
|
$
|
(115
|
)
|
$
|
(3
|
)
|
$
|
(40
|
)
|
$
|
(42
|
)
|
$
|
(259
|
)
|
||||||
22
On August 12, 2013, Visteon entered into a Master Agreement (the “Master Agreement”) with Huayu Automotive Systems Company Limited (“HASCO”), Yanfeng Visteon Automotive Trim Systems Co., Ltd. (“Yanfeng”) and Yanfeng Visteon Automotive Electronics Co., Ltd. (“YFVE”), pursuant to which, among other things, Visteon and HASCO agreed to modify their existing interests in automobile interiors and electronics joint ventures in the People’s Republic of China, including Yanfeng and YFVE. Pursuant to the Master Agreement, among other transactions, Visteon agreed to sell its 50% ownership interest in Yanfeng for cash of approximately $928 million and Visteon agreed to subscribe to an additional 11% ownership interest in YFVE for cash of approximately $58 million. During the fourth quarter of 2013, Visteon completed some of the transactions contemplated under the Master Agreement including, but not limited to, the subscription to an additional 11% ownership interest in YFVE and the sale of its 50% ownership interest in Yanfeng.
Income before income taxes, income (loss) from continuing operations, and net income (loss) attributable to Visteon Corporation for the quarter ended December 31, 2013 included gains of $465 million related to the completion of certain of these transactions. Visteon recorded a gain of $413 million from the sale of its 50% equity interest in Yanfeng and a gain of $52 million from the remeasurement of Visteon's previous 40% equity interest in YFVE to fair value in connection with the step acquisition of an additional 11%, which resulted in a 51% controlling ownership interest in YFVE. Additionally, during the fourth quarter of 2013, Visteon recorded equity earnings of $27 million, representing its 50% share of a $54 million non-cash gain at Yanfeng. The gain resulted from the deconsolidation of YFVE at Yanfeng pursuant to Visteon's November 2013 step acquisition. Cash received from the sale of the Company's 50% investment in Yanfeng has been included in the table above as Cash provided from investing activities for the year ended December 31, 2013.
On August 1, 2012, the Company completed the sale of its Lighting operations and the respective results of operations of the Lighting business have been reclassified to (Loss) income from discontinued operations, net of tax for all periods presented.
During the nine-month predecessor period ended October 1, 2010 the Company recorded a pre-tax gain of approximately
$1.1 billion
for reorganization related items in connection with the plan of reorganization. This gain included
$956 million
related to the cancellation of certain pre-petition obligations previously recorded as liabilities subject to compromise in accordance with terms of the plan of reorganization. Additionally, on the Effective Date, the Company became a new entity for financial reporting purposes and adopted fresh-start accounting, which requires, among other things, that all assets and liabilities be recorded at fair value resulting in a gain of
$106 million
.
23
|
Item 7.
|
MANAGEMENT’S DISCUSSION AND ANALYSIS OF FINANCIAL CONDITION AND RESULTS OF OPERATIONS
|
Management’s Discussion and Analysis (“MD&A”) is intended to help the reader understand the results of operations, financial condition and cash flows of Visteon Corporation (“Visteon” or the “Company”). MD&A is provided as a supplement to, and should be read in conjunction with, the Company’s consolidated financial statements and related notes appearing in Item 8 “Financial Statements and Supplementary Data” of this Annual Report on Form 10-K.
Executive Summary
Description of Business
Visteon Corporation (the "Company" or "Visteon") is a global supplier of climate, electronics and interiors systems, modules and components to automotive original equipment manufacturers (“OEMs”) including BMW, Chrysler, Daimler, Ford, General Motors, Honda, Hyundai, Kia, Nissan, PSA Peugeot Citroën, Renault, Toyota and Volkswagen. Visteon delivers value to its customers, and shareholders through a family of businesses including:
|
•
|
Halla Visteon Climate Control Corporation, majority-owned by Visteon and the world's second largest global supplier of automotive climate components and systems.
|
|
•
|
Visteon Electronics, a global provider of cockpit electronics, including audio/infotainment, driver information, center stack electronics and feature control modules.
|
|
•
|
Visteon Interiors, a global provider of vehicle cockpit modules, instrument panels, consoles and door trim modules.
|
Visteon, headquartered in Van Buren Township, Michigan, has an international network of manufacturing operations, technical centers and joint venture operations, supported by approximately 24,000 employees dedicated to the design, development, manufacture and support of its product offerings and its global customers. The Company's manufacturing and engineering footprint is principally located outside of the U.S., with a heavy concentration in low-cost geographic regions. The Company's sales for the year ended December 31, 2013 totaled $7.4 billion and were distributed by product group, geographic region, and customer as follows.
Strategic Transformation
In September 2012, the Company announced a comprehensive shareholder value creation plan founded on the pillars of industrial logic, customer focus and financial discipline. The comprehensive shareholder value creation plan includes the following primary elements.
|
•
|
Climate consolidation - Prior to 2013, the Company's Climate operations were comprised of Halla Climate Control Corporation ("Halla"), a 70% owned and consolidated Korean subsidiary, and a series of wholly-owned Visteon Climate operations and other Visteon Climate joint ventures. By combining these Climate operations, the Company expects to achieve synergies through improved global scale and common business practices. During the first quarter of 2013, Halla purchased certain subsidiaries and intellectual property relating to Visteon's global climate business for a total purchase price of $410 million.
This combination formed t
he world's second largest global supplier of automotive climate components and systems under the name of Halla Visteon Climate Control Corporation ("HVCC"). HVCC is majority-owned by Visteon and headquartered in South Korea.
|
24
|
•
|
Electronics optimization - The Company's Electronics business has undergone a transition away from powertrain, body and security electronics over the past several years and today is focused solely on electronics in the cockpit of the vehicle delivering innovative audio, infotainment, clusters and displays to OEM customers. The market for cockpit electronics is projected to grow to $45 billion by 2018. The Company believes that its Electronics business is well-positioned to capitalize on a rapidly changing consumer-driven technology landscape. The Company has taken steps to optimize the size and scale of its Electronics business with a specific focus on cockpit electronics products.
|
|
◦
|
In the fourth quarter of 2013, the Company paid $58 million for an additional 11% ownership interest in Yanfeng Visteon Automotive Electronics Co., Ltd. (“YFVE”), resulting in a 51% controlling ownership interest. YFVE provides an important source of global electronics development and engineering capability. Additionally, the Company invested $48 million during the fourth quarter of 2013 in a non-consolidated electronics holding company owned 50% by Visteon and 50% by Yanfeng.
|
|
◦
|
On January 13, 2014, Visteon reached an agreement to acquire the automotive electronics business of Johnson Controls for cash of $265 million. The acquisition is subject to certain regulatory and other consents and approvals and is expected to be completed in the second quarter of 2014. In the fiscal year ended September 30, 2013, the business to be acquired by Visteon generated approximately $1.3 billion in revenue and about $58 million in EBITDA (earnings before interest, taxes, depreciation and amortization).
|
These actions are expected to strengthen Visteon's competitive position in the fast-growing vehicle cockpit electronics segment by expanding its global scale, manufacturing and engineering footprint, product portfolio and customer penetration. On a combined basis following completion of the acquisition of the automotive electronics business of Johnson Controls, Visteon expects that its electronics business will have sales of about $3 billion, a No.2 global position in driver information, an above-average growth rate for the segment, and penetration of nine of the world's ten largest vehicle manufacturers.
|
•
|
Interiors strategy - The Company determined that its Interiors business is not aligned with its long-term strategic goals and continues to explore alternatives for this non-core business including, but not limited to, divestiture, partnership or alliance. While the Company views Interiors as a non-core business, it continues to make commitments to this business and intends to divest in the future only under acceptable terms and conditions. On December 17, 2013, Visteon completed the sale of its 50% ownership interest in Yanfeng Visteon Automotive Trim Systems Co., Ltd., ("Yanfeng") a significant interiors equity investee, for cash proceeds of $928 million (before applicable taxes). The Company's goal is to dispose of the remainder of its Interiors businesses in three separate transactions targeted for 2014. Due to certain liabilities and capital requirements of many of the these remaining businesses, the Company may be required to contribute cash to such businesses in connection with any disposition, which amounts could be material.
|
In connection with the preparation of the December 31, 2013 financial statements, the Company determined that an indicator of impairment existed in relation to the net assets of its Interiors business, which approximated $220 million as of December 31, 2013. Accordingly, the Company performed a recoverability test utilizing a probability weighted analysis of cash flows associated with continuing to run and operate the Interiors business and estimated cash flows associated with the potential sale of the Interiors business. As a result of the analysis, the Company concluded that the assets were not recoverable. However, no impairment was recorded as of December 31, 2013 as the fair value of the underlying assets were determined to be in excess of the respective carrying value. To the extent that a sale transaction becomes more likely to occur in future periods an impairment charge may be required and such charge could be material. As of December 31, 2013 the Company did not meet the specific criteria necessary for the Interiors assets to be considered held for sale.
|
•
|
Cost reduction program - In November 2012 the Company announced a $100 million restructuring program designed to reduce fixed costs and to improve operational efficiency by addressing certain under-performing operations. Through December 31, 2013, the Company recorded approximately
$76 million
of restructuring expenses under this program. The Company anticipates recording additional restructuring charges related to this program in future periods as underlying plans are finalized.
|
|
•
|
Balance sheet enhancement - In December 2013 the Company exercised its right to repurchase $50 million or 10% of its outstanding 6.75% senior notes due April 2019 for a redemption price of 103% of the principal amount, plus accrued and unpaid interest to the redemption date. This repurchase was in addition to a similar $50 million repurchase of outstanding 6.75% senior notes due April 2019 that was completed in December 2012. Also during 2012, the Company offered an accelerated pension payment program to most of its U.S. defined benefit plan participants who are former employees with vested benefits not yet in pay status, whereby such participants could elect to receive a single lump sum payout. Approximately 70% of eligible participants elected to receive a single lump sum payout resulting in a reduction of the Company's U.S. retirement plan obligations of
$408 million
and a reduction in plan assets of
$301 million
, respectively.
|
25
Share Repurchase Program
During 2012, the Company's board of directors authorized the repurchase of up to $100 million of the Company's common stock. During 2012, the Company repurchased 1,005,559 shares of its outstanding common stock at an average price of $49.72 per share, excluding commissions, for the aggregate purchase price of $50 million. In January 2013, the board of directors reauthorized the $100 million and increased the repurchase amount to an additional $200 million over the next two years, bringing the total share repurchase authorization to $300 million. In March 2013, the Company entered into an accelerated stock buyback ("ASB") program with a third-party financial institution to purchase shares of common stock for an aggregate purchase price of $125 million. On April 17, 2013, the ASB program concluded with the Company having repurchased a total of 2,209,078 shares.
In August 2013, the Company's board of directors raised the authorization of its remaining share repurchase program from $125 million to $1 billion over the next two years. The Company entered into another ASB program in August 2013 with a third-party financial institution to purchase shares of common stock for an aggregate purchase price of $125 million. The Company paid the financial institution $125 million and received an initial delivery of 1,368,925 shares of common stock. The value of those shares on the date of delivery was $100 million at $73.05 per share and is included in common stock held in treasury. On December 20, 2013, the program concluded and the Company received an additional 307,975 shares. As of December 31, 2013, $875 million remains authorized and available for repurchase through December 31, 2015. The Company anticipates that repurchases of common stock would occur from time to time in open market transactions, non-discretionary programs or in privately negotiated transactions depending on market and economic conditions, share price, trading volumes, alternative uses of capital and other factors.
Global Automotive Industry
The Company conducts its business in the automotive industry, which is capital intensive, highly competitive and sensitive to economic conditions. During 2013 the global automotive industry continued to experience modest global growth. Vehicle production in China outpaced the overall growth rate fueled by increasing consumer demand. Production in North America also increased based on continuing strength in demand, growing exports, and increased localization of production. Europe appears to have stabilized, although at historically low levels, supported by strong luxury exports. Production in the remaining regions was mixed due to varying economic, political and social factors. Light vehicle production levels for 2013 by geographic region are provided below (units in millions):
|
Light Vehicle Production
|
||||||||
|
2013
|
2012
|
Change
|
||||||
|
Global
|
84.5
|
|
81.5
|
|
3.6
|
%
|
||
|
North America
|
16.2
|
|
15.4
|
|
4.9
|
%
|
||
|
South America
|
4.5
|
|
4.3
|
|
5.7
|
%
|
||
|
Europe
|
19.3
|
|
19.3
|
|
0.2
|
%
|
||
|
China
|
21.2
|
|
18.6
|
|
13.9
|
%
|
||
|
Japan/Korea
|
13.5
|
|
14.0
|
|
(3.4
|
)%
|
||
|
India
|
3.6
|
|
3.8
|
|
(4.1
|
)%
|
||
|
ASEAN
|
4.3
|
|
4.1
|
|
4.1
|
%
|
||
|
Source: IHS Automotive
|
||||||||
Financial Results Summary
Highlights of the Company's financial results for the year ended December 31, 2013 include the following.
|
•
|
The Company recorded sales of $7,439 million representing an increase of approximately 8% when compared with the year ended December 31, 2012.
The increase reflects higher customer production volumes for Climate in all regions, Electronics in Asia and North America, partially offset by Interiors declines in Europe and South America.
|
|
•
|
Gross margin was $684 million or 9.2% of sales for the year ended December 31, 2013 compared to $589 million or 8.6% of sales for the same period of 2012. The increase was primarily attributable to higher volumes.
|
|
•
|
Net income attributable to Visteon was $690 million, inclusive of gains totaling $465 million comprised of a $413 million gain on the sale of the Company's 50% ownership interest in Yanfeng and a $52 million gain on the remeasurement of Visteon's previous 40% equity interest in YFVE to fair value.
|
|
•
|
The Company generated $312 million of cash from operating activities, an increase of $73 million compared with the prior year, largely due to higher cash dividends from non-consolidated affiliates.
|
26
|
•
|
Cash from investing activities of $698 million included $928 million from the sale of the Company's 50% interest in Yanfeng, partially offset by capital expenditures.
|
|
•
|
Total cash, including restricted cash, was $1,702 million, $857 million higher than December 31, 2012. The Company's total debt was $730 million, $161 million higher than December 31, 2012. As of December 31, 2013 the Company had $972 million of cash in excess of total debt.
|
Consolidated Results of Operations - 2013 Compared with 2012
The Company's consolidated results of operations for the years ended December 31, 2013 and 2012 were as follows:
|
Year Ended December 31
|
|||||||||||
|
2013
|
2012
|
Change
|
|||||||||
|
(Dollars in Millions)
|
|||||||||||
|
Sales
|
$
|
7,439
|
|
$
|
6,857
|
|
$
|
582
|
|
||
|
Cost of sales
|
6,755
|
|
6,268
|
|
487
|
|
|||||
|
Gross margin
|
684
|
|
589
|
|
95
|
|
|||||
|
Selling, general and administrative expenses
|
367
|
|
369
|
|
(2
|
)
|
|||||
|
Equity in net income of non-consolidated affiliates
|
213
|
|
226
|
|
(13
|
)
|
|||||
|
Restructuring expense
|
39
|
|
79
|
|
(40
|
)
|
|||||
|
Interest expense, net
|
39
|
|
35
|
|
4
|
|
|||||
|
Gain on Yanfeng transactions
|
465
|
|
—
|
|
465
|
|
|||||
|
Other expense, net
|
35
|
|
41
|
|
(6
|
)
|
|||||
|
Provision for income taxes
|
107
|
|
121
|
|
(14
|
)
|
|||||
|
Net income from continuing operations
|
775
|
|
170
|
|
605
|
|
|||||
|
Loss from discontinued operations
|
—
|
|
(3
|
)
|
3
|
|
|||||
|
Net income
|
$
|
775
|
|
$
|
167
|
|
$
|
608
|
|
||
|
Net income attributable to Visteon Corporation
|
$
|
690
|
|
$
|
100
|
|
$
|
590
|
|
||
|
Adjusted EBITDA*
|
$
|
704
|
|
$
|
626
|
|
$
|
78
|
|
||
|
*
Adjusted EBITDA is a Non-GAAP financial measure, as further discussed
below.
|
|||||||||||
Sales
Sales for the year ended December 31, 2013 totaled $7,439 million, which represents an increase of $582 million compared with the same period of 2012. Sales increased $562 million primarily driven by Climate and Electronics due to higher production volumes in Asia, North America and Europe. Favorable currency of $58 million also contributed to the increase, primarily attributable to the Euro, Korean Won and Chinese Yuan currencies, partially offset by the Indian Rupee, Japanese Yen and Brazilian Real currencies. The consolidation of YFVE with effect from November 1, 2013 increased sales $66 million. Other reductions of $104 million were associated with customer pricing, net of design savings.
Cost of Sales
Cost of sales increased $487 million for the year ended December 31, 2013 when compared with the same period in 2012. The increase includes $446 million attributable to increased production volumes and changes in product mix, representing the variable nature of material and labor costs. Foreign currency increased cost of sales by $73 million attributable to strengthening of the Euro, Korean Won and Chinese Yuan, partially offset by offset by weakening of the Japanese Yen, Indian Rupee, and the Brazilian Real. Engineering costs increased $23 million, supporting growth in the Climate and Electronics segments. Material commodity pricing, manufacturing performance and design changes increased cost of sales by $16 million. These increases were partially offset by $134 million of efficiencies including material, design, and usage economics.
Gross Margin
The Company's gross margin was $684 million or 9.2% of sales for the year ended December 31, 2013 compared to $589 million or 8.6% of sales for the same period of 2012. The increase in gross margin of $95 million was associated with favorable volume and mix of $116 million partially offset by unfavorable currency of $14 million. Other net cost performance decreased gross margin by $7 million, primarily driven by increased engineering costs.
27
Selling, General and Administrative Expenses
Selling, general, and administrative expenses were $367 million and $369 million during the years ended December 31, 2013 and 2012, respectively. The decrease resulted from administrative cost efficiencies and the non-recurrence of prior year costs including pension settlement losses of $4 million, note receivable impairment of $4 million and consulting fees of $5 million. Higher incentive compensation costs and the YFVE consolidation of $4 million were partial offsets.
Equity in Net Income of Non-Consolidated Affiliates
Equity in net income of non-consolidated affiliates totaled $213 million and $226 million for the years ended December 31, 2013 and 2012, respectively, representing a decrease of $13 million. Equity in net income of non-consolidated affiliates for the year ended December 31, 2013 includes $27 million representing Visteon's 50% equity interest in a non-cash gain recorded by Yanfeng. The gain resulted from the deconsolidation of YFVE pursuant to Visteon's November 2013 step acquisition to acquire a controlling 51% ownership interest in YFVE. In connection with the deconsolidation, Yanfeng recorded its retained non-controlling interest in YFVE at fair value, which exceeded the carrying value of net assets deconsolidated. Equity earnings for the year ended December 31, 2012 included $63 million representing Visteon's equity interest in a non-cash gain recorded by Yanfeng resulting from the excess of fair value over the carrying value of a former equity investee that was consolidated effective June 1, 2012. The following table presents summarized statement of operations data for the Company’s non-consolidated affiliates representing 100% of the results of operations of such non-consolidated affiliates.
|
Net Sales
|
Gross Margin
|
Net Income
|
|||||||||||||||||||||
|
December 31
|
December 31
|
December 31
|
|||||||||||||||||||||
|
2013
|
2012
|
2013
|
2012
|
2013
|
2012
|
||||||||||||||||||
|
(Dollars in Millions)
|
|||||||||||||||||||||||
|
Yanfeng
|
$
|
8,089
|
|
$
|
5,171
|
|
$
|
1,160
|
|
$
|
782
|
|
$
|
334
|
|
$
|
369
|
|
|||||
|
All other
|
1,335
|
|
1,757
|
|
111
|
|
194
|
|
94
|
|
92
|
|
|||||||||||
|
$
|
9,424
|
|
$
|
6,928
|
|
$
|
1,271
|
|
$
|
976
|
|
$
|
428
|
|
$
|
461
|
|
||||||
Yanfeng sales and gross margin for the year ended December 31, 2012 include approximately
$1,733 million
and
$278 million
, respectively, related to the results of operations for the five months ended May 31, 2013 of a former equity investee that was consolidated effective June 1, 2012. Yanfeng net income for the years ended December 31, 2013 and 2012 includes approximately $54 million and
$130 million
, respectively associated with non-cash gains.
Restructuring Expense
During 2013 the Company recorded $39 million of restructuring expenses, net of reversals, compared to $79 million, net of reversals, for 2012. The Company's restructuring reserve and activity is summarized below for the year ended December 31, 2013.
|
|
Interiors
|
Climate
|
Electronics
|
Corporate
|
Total
|
||||||||||||||
|
(Dollars in Millions)
|
|||||||||||||||||||
|
Restructuring reserve - December 31, 2012
|
$
|
34
|
|
$
|
1
|
|
$
|
1
|
|
$
|
3
|
|
$
|
39
|
|
||||
|
Expenses
|
13
|
|
19
|
|
—
|
|
9
|
|
41
|
|
|||||||||
|
Reversals
|
(1
|
)
|
—
|
|
(1
|
)
|
—
|
|
(2
|
)
|
|||||||||
|
Utilization
|
(21
|
)
|
(19
|
)
|
—
|
|
(9
|
)
|
(49
|
)
|
|||||||||
|
Restructuring reserve - December 31, 2013
|
$
|
25
|
|
$
|
1
|
|
$
|
—
|
|
$
|
3
|
|
$
|
29
|
|
||||
During the year ended December 31, 2013, the Company recorded an additional
$4 million
of employee severance and termination benefit costs associated with a previously announced plan to restructure three European Interiors facilities and made cash payments of approximately
$16 million
for related employee severance and termination benefits. As of December 31, 2013 approximately $18 million remains accrued for this program. During 2013 the Company also announced a plan to restructure the workforce and related processes at an Interiors operation in Brazil and recorded employee severance and termination benefit costs of
$8 million
associated with approximately
255
employees. The Company made cash payments of approximately
$4 million
for related employee severance and termination benefits during 2013. As of December 31, 2013 approximately $4 million remains accrued for this program. The Company recorded and paid employee severance and termination benefit costs of
$19 million
for approximately
100
employees during the year ended December 31, 2013 related to a program designed to commonize global business systems and processes across its Climate operations for the purpose of reducing costs.
28
Given the economically-sensitive and highly competitive nature of the automotive industry, the Company continues to closely monitor current market factors and industry trends taking action as necessary, including but not limited to, additional restructuring actions. However, there can be no assurance that such actions will be sufficient to fully offset the impact of adverse factors on the Company or its results of operations, financial position and cash flows.
Interest Expense, Net
Interest expense for the year ended December 31, 2013 of $47 million included $30 million associated with the Company's 6.75% Senior Notes due April 15, 2019, $11 million associated with affiliate debt, and $6 million for commitment fees and amortization of debt issuance costs. During the year ended December 31, 2012, interest expense was $49 million, including $33 million on the 6.75% Senior Notes due April 15, 2019, $7 million for commitment fees and amortization of debt issuance costs, $5 million related to the Korean Bridge Loan and $4 million associated with affiliate debt. Interest income of $8 million for the year ended December 31, 2013 decreased by $6 million when compared to $14 million for the same period of 2012 due to lower rates and a change in the regional mix of cash.
Gain on Yanfeng Transactions
On August 12, 2013, Visteon entered into a Master Agreement (the “Master Agreement”) with Huayu Automotive Systems Company Limited (“HASCO”), Yanfeng Visteon Automotive Trim Systems Co., Ltd. (“Yanfeng”) and Yanfeng Visteon Automotive Electronics Co., Ltd. (“YFVE”), pursuant to which, among other things, Visteon and HASCO agreed to modify their existing interests in automobile interiors and electronics joint ventures in the People’s Republic of China, including Yanfeng and YFVE.
During the fourth quarter of 2013, Visteon completed some of the transactions contemplated under the Master Agreement including, but not limited to, the subscription to an additional 11% ownership interest in YFVE and the sale of its 50% ownership interest in Yanfeng. The Company recorded gains on these transactions totaling
$465 million
, including a gain of
$413 million
from the sale of its 50% equity interest in Yanfeng and a gain of
$52 million
from the remeasurement of Visteon's previous
40%
equity interest in YFVE to fair value in connection with the 11% step acquisition, which resulted in a
51%
controlling ownership interest in YFVE. Other transactions contemplated under the Master Agreement not completed during the fourth quarter of 2013 remain subject to substantive closing conditions, including government and regulatory approvals. Such transactions are expected to be substantially completed in multiple stages by June 30, 2015.
Other Expense, Net
Other expense, net consists of the following:
|
Year Ended December 31
|
|||||||
|
2013
|
2012
|
||||||
|
(Dollars in Millions)
|
|||||||
|
Transformation costs
|
$
|
40
|
|
$
|
33
|
|
|
|
Gain on sale of joint venture interest
|
(5
|
)
|
(19
|
)
|
|||
|
Loss on debt extinguishment
|
2
|
|
6
|
|
|||
|
UK Administration recovery
|
(2
|
)
|
—
|
|
|||
|
Loss on asset contribution
|
—
|
|
14
|
|
|||
|
Asset impairments
|
—
|
|
5
|
|
|||
|
Reorganization-related costs, net
|
—
|
|
2
|
|
|||
|
$
|
35
|
|
$
|
41
|
|
||
The Company recorded transformation costs of $40 million and $33 million for the years ended December 31, 2013 and 2012, respectively, related to financial and advisory services associated with continued execution of its comprehensive shareholder value creation plan.
In June 2013, the Company completed the sale of its 20% equity interest in Dongfeng Visteon Automotive Trim Systems Co., Ltd. ("Dongfeng") for proceeds of approximately $20 million and recognized a gain of approximately $5 million. Dongfeng is an interiors joint venture based in China with 2012 revenue of $190 million. In August 2012, the Company sold its 50% ownership interest in R-Tek Limited, a UK-based Interiors joint venture, for cash proceeds of approximately $30 million, resulting in a gain of $19 million.
29
Loss on debt extinguishment of $2 million for the years ended December 31, 2013 and 2012 are related to the 103% redemption premium paid on the December 2013 and 2012 repurchases each for $50 million of the Company's 6.75% senior notes due April 15, 2019. In the year ended December 31, 2012, the Company recorded an additional loss on debt extinguishment of $4 million relating to unamortized amounts attributable to the Korean Bridge Loan that was repaid during the third quarter 2012.
In September 2013, the Company received a distribution of $2 million under the United Kingdom Insolvency Act of 1986 resulting from the liquidation and recovery process associated with the estate of Visteon UK Limited, a company organized under the laws of England and Wales and a former indirect, wholly-owned subsidiary of the Company. The recovery was primarily related to various trade and loan receivables due from Visteon UK Limited to the Company at the March 2009 date of entry into administration.
During the year ended December 31, 2012 and in connection with agreements reached with the labor union and the Spanish government for the closure of the Cadiz Electronics operation, the Company transfered land, building and machinery with a net book value of approximately $14 million to the Spanish government for the benefit of the former Cadiz Electronics employees and the El Puerto de Santa Maria, Spain community.
During the fourth quarter of 2012, the Company recorded an impairment of $5 million for an other than temporary decline in the value of Visteon TYC Corporation, reflecting the difference between the carrying value and estimated sale transaction proceeds.
Income Taxes
The Company's provision for income tax was $107 million for year ended December 31, 2013 and reflects income tax expense related to those countries where the Company is profitable, accrued withholding taxes, ongoing assessments related to the recognition and measurement of uncertain tax benefits, the inability to record a tax benefit for pre-tax losses in the U.S. and certain other jurisdictions, and other non-recurring tax items.
The Company's provision for income taxes decreased $14 million for the year ended December 31, 2013 compared with 2012, reflecting a $59 million reduction in year-over-year changes in unrecognized tax benefits (including interest) primarily attributable to reevaluating transfer pricing-related exposures in Europe and the United States due to audit closures occurring in 2013, $6 million associated with tax law changes (primarily in Mexico), and a $4 million increase in tax benefits resulting from the elimination of valuation allowances, comprised of a $12 million benefit in 2013 related to the elimination of valuation allowances against Korean foreign tax credits as compared to an $8 million benefit in 2012 related to the elimination of deferred tax asset valuation allowances at several foreign subsidiaries in China, India and the Czech Republic. Other changes in the Company's deferred tax asset valuation allowances did not materially impact net tax expense during the years ended December 31, 2013 or 2012. Decreases in year-over-year tax expense were partially offset by $4 million attributable to overall changes in the mix of earnings and tax rates between jurisdictions and other items and $51 million of China tax associated with the gain on the Yanfeng transactions. Additionally, the U.S. income tax consequences associated with the Yanfeng transactions were fully offset by tax attributes carrying a full valuation allowance and had no material impact on net tax expense.
Visteon's emergence from bankruptcy in 2010 resulted in a change of ownership within the meaning of Internal Revenue Code (“IRC”) Sections 382 and 383, causing the use of Visteon's pre-emergence U.S. federal net operating loss (“NOL”) and various other tax attributes to be limited in the post-emergence period. However, NOLs and other tax attributes generated in the post emergence period are generally not limited by the emergence from bankruptcy, but could be limited if there is a subsequent change of ownership. If the Company were to have another change of ownership within the meaning of IRC Sections 382 and 383, its post-emergence NOL and other tax attributes could be limited to an amount equal to its market capitalization at the time of the subsequent ownership change multiplied by the federal long-term tax exempt rate. The Company cannot provide any assurance that such an ownership change will not occur, in which case the availability of the Company's NOLs and other tax attributes could be significantly limited or possibly eliminated. In order to continue to protect the Company's pre and post-emergence period tax attributes and reduce the likelihood that the Company will experience an additional ownership change, once the Company's market capitalization falls below $1.5 billion Board of Director approval is required should a person or group become a 5-percent shareholder and/or an existing 5-percent shareholder intend to increase its ownership interest.
Discontinued Operations
On August 1, 2012, the Company completed the sale of its Lighting operations for proceeds of approximately $70 million (the "Lighting Transaction"). In connection with the Lighting Transaction, the results of operations of the Lighting business were reclassified to (Loss) income from discontinued operations, net of tax in the Consolidated Statements of Operations for the year ended December 31, 2012.
30
Discontinued operations are summarized as follows:
|
Year Ended December 31, 2012
|
|||
|
(Dollars in Millions)
|
|||
|
Sales
|
$
|
297
|
|
|
Cost of sales
|
264
|
|
|
|
Gross margin
|
33
|
|
|
|
Selling, general and administrative expenses
|
7
|
|
|
|
Asset impairments
|
19
|
|
|
|
Interest and other expense
|
6
|
|
|
|
Income from discontinued operations before income taxes
|
1
|
|
|
|
Provision for income taxes
|
4
|
|
|
|
Loss from discontinued operations, net of tax
|
$
|
(3
|
)
|
The Company recorded impairment charges principally related to property and equipment of approximately $19 million during the year ended December 31, 2012. Included in the provision for income taxes in 2012 was $3 million related to the establishment of a valuation allowance against certain deferred tax credits in Mexico, the realization of which is no longer considered more likely than not due to insufficient projected future taxable income, offset by favorable adjustments of $2 million associated with uncertain tax positions.
Net Income
Net income attributable to Visteon was $690 million for the year ended December 31, 2013 compared to $100 million for the same period of 2012. Adjusted EBITDA (a non-GAAP financial measure, as defined below) was $704 million for the year ended December 31, 2013, representing an increase of $78 million when compared with Adjusted EBITDA of $626 million for the same period of 2012. The increase in Adjusted EBITDA included $116 million of favorable volume and mix primarily attributable to growth in Asia and North America markets, $25 million of higher equity in affiliate earnings primarily related to Yanfeng and affiliates, $6 million associated with the Company's consolidation of the YFVE business, partially offset by $15 million of unfavorable currency primarily reflecting stronger Korean Won and weakening Indian Rupee currencies partially offset by the stronger Euro. Adjusted EBITDA also decreased by $18 million for non-controlling interest impacts due to improved climate business and climate consolidation actions and lower commercial agreements and engineering cost recoveries of $6 million. Higher engineering of $23 million and other costs were partially offset by material, design and other cost efficiencies.
Adjusted EBITDA is presented as a supplemental measure of the Company's financial performance that management believes is useful to investors because the excluded items may vary significantly in timing or amounts and/or may obscure trends useful in evaluating and comparing the Company's operating activities across reporting periods. The Company defines Adjusted EBITDA as net income attributable to the Company, plus net interest expense, provision for income taxes and depreciation and amortization, as further adjusted to eliminate the impact of asset impairments, gains or losses on divestitures, discontinued operations, net restructuring expenses and other reimbursable costs, non-cash stock-based compensation expense, certain employee charges and benefits, reorganization items and other non-operating gains and losses. Not all companies use identical calculations and, accordingly, the Company's presentation of Adjusted EBITDA may not be comparable to other similarly titled measures of other companies.
Adjusted EBITDA is not a recognized term under accounting principles generally accepted in the United States and does not purport to be a substitute for net income as an indicator of operating performance or cash flows from operating activities as a measure of liquidity. Adjusted EBITDA has limitations as an analytical tool and is not intended to be a measure of cash flow available for management's discretionary use, as it does not consider certain cash requirements such as interest payments, tax payments and debt service requirements. In addition, the Company uses Adjusted EBITDA (i) as a factor in incentive compensation decisions, (ii) to evaluate the effectiveness of the Company's business strategies and (iii) because the Company's credit agreements use measures similar to Adjusted EBITDA to measure compliance with certain covenants. Adjusted EBITDA, as determined and measured by the Company should not be compared to similarly titled measures reported by other companies.
31
The reconciliation of Adjusted EBITDA to net income attributable to Visteon for the years ended December 31, 2013 and 2012 is as follows:
|
Year Ended December 31
|
|||||||||||
|
2013
|
2012
|
Change
|
|||||||||
|
(Dollars in Millions)
|
|||||||||||
|
Adjusted EBITDA
|
$
|
704
|
|
$
|
626
|
|
$
|
78
|
|
||
|
Interest expense, net
|
39
|
|
35
|
|
4
|
|
|||||
|
Provision for income taxes
|
107
|
|
121
|
|
(14
|
)
|
|||||
|
Depreciation and amortization
|
262
|
|
258
|
|
4
|
|
|||||
|
Restructuring expenses
|
39
|
|
79
|
|
(40
|
)
|
|||||
|
Gain on Yanfeng transactions
|
(465
|
)
|
—
|
|
(465
|
)
|
|||||
|
Non-cash, stock-based compensation expense
|
17
|
|
25
|
|
(8
|
)
|
|||||
|
Equity in gain of non-consolidated affiliates
|
(29
|
)
|
(63
|
)
|
34
|
|
|||||
|
Other
|
44
|
|
71
|
|
(27
|
)
|
|||||
|
Net income attributable to Visteon Corporation
|
$
|
690
|
|
$
|
100
|
|
$
|
590
|
|
||
Segment Results of Operations - 2013 compared with 2012
The Company's operating structure is organized by global product lines, including Climate, Electronics and Interiors. These global product lines have financial and operating responsibility over the design, development and manufacture of the Company's product portfolio. Global customer groups are responsible for the business development of the Company's product portfolio and overall customer relationships. Certain functions such as procurement, information technology and other administrative activities are managed on a global basis with regional deployment. The Company's reportable segments are as follows:
|
•
|
Climate - The Company's Climate product line includes climate air handling modules, powertrain cooling modules, heat exchangers, compressors, fluid transport and engine induction systems.
|
|
•
|
Electronics - The Company's Electronics product line includes audio systems, infotainment systems, driver information systems, powertrain and feature control modules, climate controls, and electronic control modules.
|
|
•
|
Interiors - The Company's Interiors product line includes instrument panels, cockpit modules, door trim and floor consoles.
|
Sales
|
|
Climate
|
Electronics
|
Interiors
|
Eliminations
|
Total
|
||||||||||||||
|
(Dollars in Millions)
|
|||||||||||||||||||
|
Year ended December 31, 2012
|
$
|
4,286
|
|
$
|
1,274
|
|
$
|
1,388
|
|
$
|
(91
|
)
|
$
|
6,857
|
|
||||
|
Volume and mix
|
583
|
|
139
|
|
(103
|
)
|
(57
|
)
|
562
|
|
|||||||||
|
Currency
|
76
|
|
(12
|
)
|
(6
|
)
|
—
|
|
58
|
|
|||||||||
|
YFVE consolidation
|
—
|
|
66
|
|
—
|
|
—
|
|
66
|
|
|||||||||
|
Other
|
(74
|
)
|
(12
|
)
|
(18
|
)
|
—
|
|
(104
|
)
|
|||||||||
|
Year ended December 31, 2013
|
$
|
4,871
|
|
$
|
1,455
|
|
$
|
1,261
|
|
$
|
(148
|
)
|
$
|
7,439
|
|
||||
Climate sales increased during the year ended December 31, 2013 by $585 million. Higher production volumes in Asia, North America, and Europe, increased sales by $583 million. Favorable currency resulted in an increase of $76 million, primarily related to the Euro, Korean Won and Chinese Yuan partially offset by the Indian Rupee. Other changes, totaling $74 million, reflected price productivity, partially offset by increases in commodity pricing and design actions.
Electronics sales increased during the year ended December 31, 2013 by $181 million. Volume increases of $139 million reflected higher production volumes primarily in North America and Asia. Unfavorable currency, primarily related to the Japanese Yen and Indian Rupee partially offset by the Euro, decreased product sales by $12 million. The consolidation of YFVE during the fourth quarter of 2013 increased sales $66 million. Other changes, totaling $12 million, reflected price productivity, partially offset by increases in revenue related to commodity pricing and design actions.
Interiors sales decreased during the year ended December 31, 2013 by $127 million, including unfavorable volume and product mix of $103 million primarily reflecting production declines in Europe driven by continued weak economic conditions across the
32
region. Unfavorable currency related to the Indian Rupee and Brazilian Real partially offset by the Euro decreased sales by $6 million. Other changes, totaling $18 million, reflected price productivity, partially offset by increases in commodity pricing and design actions and lower commercial agreement recoveries.
Cost of Sales
|
|
Climate
|
Electronics
|
Interiors
|
Eliminations
|
Total
|
||||||||||||||
|
(Dollars in Millions)
|
|||||||||||||||||||
|
Year ended December 31, 2012
|
$
|
3,909
|
|
$
|
1,136
|
|
$
|
1,314
|
|
$
|
(91
|
)
|
$
|
6,268
|
|
||||
|
Material
|
378
|
|
92
|
|
(88
|
)
|
(58
|
)
|
324
|
|
|||||||||
|
Freight and duty
|
11
|
|
(5
|
)
|
(5
|
)
|
(1
|
)
|
—
|
|
|||||||||
|
Labor and overhead
|
116
|
|
6
|
|
(17
|
)
|
(2
|
)
|
103
|
|
|||||||||
|
Depreciation and amortization
|
7
|
|
(3
|
)
|
(3
|
)
|
(1
|
)
|
—
|
|
|||||||||
|
YFVE consolidation
|
—
|
|
63
|
|
—
|
|
—
|
|
63
|
|
|||||||||
|
Other
|
(15
|
)
|
6
|
|
1
|
|
5
|
|
(3
|
)
|
|||||||||
|
Year ended December 31, 2013
|
$
|
4,406
|
|
$
|
1,295
|
|
$
|
1,202
|
|
$
|
(148
|
)
|
$
|
6,755
|
|
||||
Climate material costs increased by $378 million, including $474 million related to higher production volumes and $9 million related to higher aluminum, resin and other commodity costs and design changes, partially offset by $105 million of manufacturing efficiencies and purchasing improvements. Labor and overhead increased by $116 million, including $101 million related to production volumes and currency and $15 million related to higher manufacturing costs, net of efficiencies, primarily driven by significant launch activity during 2013. Depreciation and amortization increased by $7 million, as capital expenditures increased to support growing business. Other decreases of $15 million primarily relate to the non-recurrence of 2012 pension settlement charges.
Electronics material costs increased by $92 million, including $123 million related to production volumes and currency and $4 million of design changes, partially offset by $35 million related to the impact of manufacturing efficiencies and purchasing improvements. Labor and overhead increased by $6 million, directly attributable to production volumes. The consolidation of YFVE during the fourth quarter of 2013 increased cost of sales $63 million, including $4 million for the step-up of inventory related to purchase accounting. Other increases of $6 million primarily relate to engineering costs to support infotainment technology, impacts of a temporary contract manufacturing arrangement and project launch costs.
Interiors material costs decreased by $88 million, including $82 million related to lower production volumes and currency. Material costs also decreased $6 million due to lower resin material commodity costs and design changes. Labor and overhead decreased by $17 million, including $8 million related to production volumes and $9 million primarily associated with European restructuring related cost reductions.
Adjusted EBITDA
Adjusted EBITDA by segment for the years ended December 31, 2013 and 2012 is presented in the table below.
|
Year Ended December 31
|
|||||||||||
|
2013
|
2012
|
Change
|
|||||||||
|
(Dollars in Millions)
|
|||||||||||
|
Climate
|
$
|
443
|
|
$
|
370
|
|
$
|
73
|
|
||
|
Electronics
|
137
|
|
126
|
|
11
|
|
|||||
|
Interiors
|
183
|
|
178
|
|
5
|
|
|||||
|
Total Segment Adjusted EBITDA
|
$
|
763
|
|
$
|
674
|
|
$
|
89
|
|
||
|
Reconciling Item:
|
|||||||||||
|
Corporate
|
(59
|
)
|
(48
|
)
|
(11
|
)
|
|||||
|
Total consolidated
|
$
|
704
|
|
$
|
626
|
|
$
|
78
|
|
||
33
Changes in Adjusted EBITDA by segment are presented in the table below.
|
|
Climate
|
Electronics
|
Interiors
|
Total
|
|||||||||||
|
(Dollars in Millions)
|
|||||||||||||||
|
Year ended December 31, 2012
|
$
|
370
|
|
$
|
126
|
|
$
|
178
|
|
$
|
674
|
|
|||
|
Volume and mix
|
107
|
|
26
|
|
(17
|
)
|
116
|
|
|||||||
|
Currency
|
(8
|
)
|
(4
|
)
|
(3
|
)
|
(15
|
)
|
|||||||
|
Other
|
(26
|
)
|
(11
|
)
|
25
|
|
(12
|
)
|
|||||||
|
Year ended December 31, 2013
|
$
|
443
|
|
$
|
137
|
|
$
|
183
|
|
763
|
|
||||
|
Reconciling Item:
|
|||||||||||||||
|
Corporate
|
(59
|
)
|
|||||||||||||
|
Total
|
$
|
704
|
|
||||||||||||
Adjusted EBITDA for the Climate segment for the year ended December 31, 2013 increased by $73 million compared to the same period of 2012. The increase in Climate Adjusted EBITDA primarily reflects increased volume of $107 million associated with net new business including Hyundai in Asia and Europe, Kia in North America, and Ford in Asia and Europe. Unfavorable currency decreased Climate Adjusted EBITDA by $8 million primarily reflecting stronger Korean Won and weaker Indian Rupee currencies, partially offset by a stronger Euro. Higher engineering and other costs associated with current year launch activity, customer price productivity and increased non-controlling interest related to the 2013 combination of former Visteon climate operations with Halla to form HVCC, and overall growth were partially offset by material, design and other cost efficiencies.
Electronics Adjusted EBITDA for the year ended December 31, 2013 increased by $11 million compared to the same period of 2012. Favorable volume increased Adjusted EBITDA $26 million, primarily in Asia and North America. Unfavorable currency of $4 million reflects the weakening Japanese Yen and Indian Rupee, partially offset by the Euro. Higher engineering and temporary contract manufacturing arrangement costs were partially offset by the favorable impact of consolidating YFVE during the fourth quarter of 2013 and other material, design and other cost efficiencies.
Interiors Adjusted EBITDA for the year ended December 31, 2013 increased by $5 million compared to the same period of 2012. The increase in Interiors Adjusted EBITDA includes equity in affiliate net income of $22 million primarily related to Yanfeng and its affiliates, as well as material, design and other cost efficiencies which more than offset customer price productivity. These favorable impacts were partially offset by $17 million of unfavorable volume reflecting lower production volumes in Europe and South America, $3 million of unfavorable currency reflecting the weaker Indian Rupee and Brazilian Real offset by the Euro.
34
Consolidated Results of Operations - 2012 Compared with 2011
The Company's consolidated results of operations for the years ended December 31, 2012 and 2011 were as follows:
|
Year Ended December 31
|
|||||||||||
|
2012
|
2011
|
Change
|
|||||||||
|
(Dollars in Millions)
|
|||||||||||
|
Sales
|
$
|
6,857
|
|
$
|
7,532
|
|
$
|
(675
|
)
|
||
|
Cost of sales
|
6,268
|
|
6,914
|
|
(646
|
)
|
|||||
|
Gross margin
|
589
|
|
618
|
|
(29
|
)
|
|||||
|
Selling, general and administrative expenses
|
369
|
|
387
|
|
(18
|
)
|
|||||
|
Equity in net income of non-consolidated affiliates
|
226
|
|
168
|
|
58
|
|
|||||
|
Restructuring expense
|
79
|
|
24
|
|
55
|
|
|||||
|
Interest expense, net
|
35
|
|
27
|
|
8
|
|
|||||
|
Other expense, net
|
41
|
|
11
|
|
30
|
|
|||||
|
Provision for income taxes
|
121
|
|
127
|
|
(6
|
)
|
|||||
|
Net income from continuing operations
|
170
|
|
210
|
|
(40
|
)
|
|||||
|
Loss from discontinued operations
|
(3
|
)
|
(56
|
)
|
53
|
|
|||||
|
Net income
|
$
|
167
|
|
$
|
154
|
|
$
|
13
|
|
||
|
Net income attributable to Visteon Corporation
|
$
|
100
|
|
$
|
80
|
|
$
|
20
|
|
||
|
Adjusted EBITDA*
|
$
|
626
|
|
$
|
689
|
|
$
|
(63
|
)
|
||
|
* Adjusted EBITDA is a Non-GAAP financial measure, as further discussed below.
|
|||||||||||
Sales
Sales for the year ended December 31, 2012 totaled $6,857 million, which represents a decrease of $675 million compared with the same period of 2011. Approximately $549 million of this decrease is due to the deconsolidation of Duckyang Industry Co. Ltd ("Duckyang"), an Interiors joint venture, which resulted from the October 2011 sale of a controlling ownership interest in the entity ("Duckyang Share Sale"). Unfavorable currency of $307 million, primarily attributable to the Euro, Indian Rupee, Brazilian Real and Korean Won currencies, also contributed to the decline. Other reductions of $79 million were associated with price productivity net of design actions. These declines were partially offset by sales increases of $241 million associated with higher global production volumes as increases in Asia and North America more than offset decreases in Europe and higher commercial agreements of $19 million.
Cost of Sales
Cost of sales decreased $646 million for the year ended December 31, 2012 when compared with the prior year. The decrease includes $541 million attributable to the deconsolidation of Duckyang and $257 million attributable to currency primarily driven by the Euro, Brazilian Real, Indian Rupee, and the Korean Won. Cost of sales also decreased by $136 million attributable to production efficiencies including material design and usage economics as well as lower depreciation and amortization expense of $29 million. These decreases were partially offset by costs associated with increased production volumes and changes in product mix, which increased cost of sales by $283 million. Other changes, totaling $34 million, primarily relate to commodity pricing and design actions and customer design and development recoveries.
Gross Margin
Gross margin was $589 million or 8.6% of sales for the year ended December 31, 2012 compared to $618 million or 8.2% of sales for the same period of 2011. The $29 million decrease in gross margin resulted from unfavorable currency of $50 million, unfavorable product mix of $42 million, and the Duckyang deconsolidation of $8 million. Lower depreciation and amortization expense of $29 million, net cost performance of $23 million and customer recoveries of $19 million, were partial offsets.
Selling, General and Administrative Expenses
Selling, general, and administrative expenses were $369 million and $387 million during the years ended December 31, 2012 and 2011, respectively, for a year over year decrease of $18 million. The decrease includes $23 million associated with lower employee costs including incentive compensation expense, favorable currency of $11 million, and the Duckyang deconsolidation of $5
35
million. These decreases were partially offset by higher corporate office rent expense of $3 million, pension settlement losses of $4 million, note receivable impairment of $4 million, and higher professional fees of $5 million.
Equity in Net Income of Non-Consolidated Affiliates
Equity in the net income of non-consolidated affiliates totaled $226 million and $168 million for the years ended December 31, 2012 and 2011, respectively, representing an increase of $58 million. Equity earnings for the year ended December 31, 2012 included $63 million representing Visteon's equity interest in a non-cash gain recorded by Yanfeng Visteon Automotive Trim Systems Co., Ltd (“Yanfeng”) resulting from the excess of fair value over the carrying value of a former equity investee that was consolidated effective June 1, 2012. The following table presents summarized statement of operations data for the Company’s non-consolidated affiliates representing 100% of the results of operations of such non-consolidated affiliates.
|
Net Sales
|
Gross Margin
|
Net Income
|
|||||||||||||||||||||
|
December 31
|
December 31
|
December 31
|
|||||||||||||||||||||
|
2012
|
2011
|
2012
|
2011
|
2012
|
2011
|
||||||||||||||||||
|
(Dollars in Millions)
|
|||||||||||||||||||||||
|
Yanfeng
|
$
|
5,171
|
|
$
|
3,014
|
|
$
|
782
|
|
$
|
473
|
|
$
|
369
|
|
$
|
246
|
|
|||||
|
All other
|
1,757
|
|
1,681
|
|
194
|
|
176
|
|
92
|
|
90
|
|
|||||||||||
|
$
|
6,928
|
|
$
|
4,695
|
|
$
|
976
|
|
$
|
649
|
|
$
|
461
|
|
$
|
336
|
|
||||||
Yanfeng sales and gross margin for the year ended December 31, 2012 include approximately $1,733 million and $278 million, respectively, related to activity of a former equity investee that was consolidated effective June 1, 2012. Yanfeng net income for the year ended December 31, 2012 includes approximately $130 million associated with a non-cash gain on the consolidation of a former equity investee.
Restructuring Expense
During the year ended December 31, 2012, the Company recorded $79 million of restructuring expenses compared to $24 million, net of reversals, for the year ended December 31, 2011. The following is a summary of the Company's consolidated restructuring reserve and related activity for the year ended December 31, 2012.
|
|
Electronics
|
Interiors
|
Climate
|
Corporate
|
Total
|
||||||||||||||
|
(Dollars in Millions)
|
|||||||||||||||||||
|
Restructuring reserve - December 31, 2011
|
$
|
19
|
|
$
|
6
|
|
$
|
1
|
|
$
|
—
|
|
$
|
26
|
|
||||
|
Expenses
|
36
|
|
34
|
|
5
|
|
4
|
|
79
|
|
|||||||||
|
Utilization
|
(54
|
)
|
(6
|
)
|
(5
|
)
|
(1
|
)
|
(66
|
)
|
|||||||||
|
Restructuring reserve - December 31, 2012
|
$
|
1
|
|
$
|
34
|
|
$
|
1
|
|
$
|
3
|
|
$
|
39
|
|
||||
During 2011 the Company announced
its intention to permanently cease production and to close the Cadiz Electronics facility located in Spain.
During January 2012 the Company reached agreements with the local unions and Spanish government for the closure of the Cadiz Electronics operation. During the three months ended March 31, 2012, the Company recorded one-time termination benefits, in excess of the previously recorded statutory minimum requirement, of approximately $31 million and other exit costs of $5 million. Utilization during the year ended December 31, 2012 associated with the Cadiz closure included $49 million of cash payments for employee severance and termination benefits and $5 million for other exit costs, primarily governmental registration of contributed assets. The Company recovered approximately $23 million of these costs pursuant to the Release Agreement with Ford, including $19 million during 2012 and $4 million during 2011.
In November 2012 the Company announced a $100 million restructuring program designed to reduce fixed costs and to improve operational efficiency by addressing certain under-performing operations. During the quarter ended December 31, 2012 and in connection with that program, the Company announced a plan to restructure three European Interiors facilities. The Company recorded approximately $30 million for employee severance and termination benefits associated with approximately 230 employees. These cash benefits are expected to be paid to employees during 2013 and remain accrued on the Company's consolidated balance sheet as of December 31, 2012. The Company also recorded severance and termination benefit costs of $4 million under this program associated with the realignment of its corporate and administrative functions directly to their corresponding operational beneficiary to right-sizing such functions and reduce related costs. Benefits associated with these actions are expected to be paid to employees during 2013 and remain accrued on the Company's consolidated balance sheet as of December 31, 2012.
36
Interest Expense, Net
Interest expense for the year ended December 31, 2012 of $49 million included $33 million associated with the Company's 6.75% Senior Notes due April 15, 2019, $7 million for commitment fees and amortization of debt issuance costs, $5 million related to the Korean Bridge Loan, and $4 million associated with affiliate debt. During the year ended December 31, 2011, interest expense was $48 million, including $25 million on the 6.75% Senior Notes due April 15, 2019, $11 million associated with the $500 million secured term loan due October 1, 2017 which was repaid on April 16, 2011, $6 million for commitment fees and amortization of debt issuance costs, and $6 million associated with affiliate debt. Interest income of $14 million for the year ended December 31, 2012 decreased by $7 million when compared to $21 million for the same period of 2011 due to a change in the regional mix of cash, lower rates, and lower average cash balances.
Other Expense, Net
Other expense, net consists of the following:
|
Year Ended December 31
|
|||||||
|
2012
|
2011
|
||||||
|
(Dollars in Millions)
|
|||||||
|
Transformation costs
|
$
|
33
|
|
$
|
7
|
|
|
|
Gain on sale of joint venture interest
|
(19
|
)
|
—
|
|
|||
|
Loss on asset contribution
|
14
|
|
—
|
|
|||
|
Loss on debt extinguishment
|
6
|
|
24
|
|
|||
|
Asset impairments
|
5
|
|
—
|
|
|||
|
Reorganization-related costs, net
|
2
|
|
8
|
|
|||
|
Deconsolidation gains
|
—
|
|
(8
|
)
|
|||
|
UK Administration recovery
|
—
|
|
(18
|
)
|
|||
|
Gain on sale of assets
|
—
|
|
(2
|
)
|
|||
|
$
|
41
|
|
$
|
11
|
|
||
During the year ended December 31, 2012, the Company continued to transform its business portfolio and to rationalize its cost structure including, among other things, the investigation of potential transactions for the sale, merger or other combination of certain businesses. Business transformation costs of $33 million and $7 million incurred during the years ended December 31, 2012 and December 31, 2011, respectively relate principally to financial and advisory fees.
In August 2012, Visteon sold its 50% ownership interest in R-Tek Ltd., a UK-based Interiors joint venture, for cash proceeds of approximately $30 million, resulting in a gain of $19 million.
In connection with the closure of the Cadiz Electronics operation the Company agreed to transfer land, building and machinery with a net book value of approximately $14 million for the benefit of employees.
Loss on debt extinguishment of $6 million for the year ended December 31, 2012 included $4 million of unamortized amounts attributable to the Korean Bridge Loan that was repaid during the third quarter 2012 and $2 million for the 103% redemption premium paid on the December 2012 repurchase of $50 million of the Company's 6.75% Senior Notes due April 15, 2019. In April 2011, the Company completed the sale of $500 million aggregate principal amount of 6.75% senior notes due April 15, 2019. Concurrently with the completion of the sale of the senior notes, the Company repaid its obligations under the $500 million secured term loan due October 1, 2017 and recorded a loss on early extinguishment of $24 million for unamortized original issue discount, debt fees and other debt issue costs associated with the term loan.
In connection with the expected sale of the Company's 50% equity interest in Visteon TYC Corporation ("VYTC"), the Company recorded an other-than temporary decline in value of $5 million during the three months ended December 31, 2012, reflecting the difference between carrying value and expected proceeds. In January 2013, the Company completed the sale of its interest in VTYC for proceeds of approximately $17 million.
In December 2011, the Company received a distribution of $18 million, in connection with the liquidation and recovery process under the UK Administration. This distribution represented recoveries associated with loss claims on amounts owed to Visteon for various trade and loan receivables due from the UK Debtor.
37
As of October 31, 2011 the Company deconsolidated total assets of $217 million, total liabilities of $159 million, non-controlling interests of $29 million and related amounts deferred as Accumulated other comprehensive income from its balance sheet related to Duckyang pursuant to the Duckyang Share Sale. The Company recorded a gain on the transaction of $8 million including amounts associated with the deconsolidation and remeasurement of the retained 50% non-controlling interest to fair value.
Income Taxes
The Company's provision for income tax was $121 million for year ended December 31, 2012 and reflects income tax expense related to those countries where the Company is profitable, accrued withholding taxes, ongoing assessments related to the recognition and measurement of uncertain tax benefits, the inability to record a tax benefit for pre-tax losses in the U.S. and certain other jurisdictions, and other non-recurring tax items. The Company's provision for income taxes decreased $6 million for the year ended December 31, 2012 compared with 2011. The decrease in tax expense includes $5 million associated with tax law changes and $1 million attributable to the overall changes in the mix of earnings and tax rates between jurisdictions.
During 2012, the Company recorded a tax benefit of $8 million attributable to the elimination of deferred tax asset valuation allowances at several foreign subsidiaries in China, India and the Czech Republic. The Company recorded a similar amount during 2011 attributable to the elimination of deferred tax asset valuation allowances at its UK subsidiary. Additionally, other changes in the Company's deferred tax asset valuation allowances did not materially impact net tax expense during the years ended December 31, 2012 or 2011.
Discontinued Operations
On August 1, 2012, the Company completed the sale of its Lighting operations for proceeds of approximately $70 million (the "Lighting Transaction"). In connection with the Lighting Transaction, the results of operations of the Lighting business were reclassified to (Loss) income from discontinued operations, net of tax in the Consolidated Statements of Comprehensive Income for the years ended December 31, 2012 and 2011. Discontinued operations are summarized as follows:
|
Year Ended December 31
|
|||||||
|
2012
|
2011
|
||||||
|
(Dollars in Millions)
|
|||||||
|
Sales
|
$
|
297
|
|
$
|
515
|
|
|
|
Cost of sales
|
264
|
|
490
|
|
|||
|
Gross margin
|
33
|
|
25
|
|
|||
|
Selling, general and administrative expenses
|
7
|
|
11
|
|
|||
|
Asset impairments
|
19
|
|
66
|
|
|||
|
Interest and other expense
|
6
|
|
4
|
|
|||
|
Income (loss) from discontinued operations before income taxes
|
1
|
|
(56
|
)
|
|||
|
Provision for income taxes
|
4
|
|
—
|
|
|||
|
Loss from discontinued operations, net of tax
|
$
|
(3
|
)
|
$
|
(56
|
)
|
|
The Company recorded impairment charges principally related to property and equipment of approximately $19 million and $66 million during the years ended December 31, 2012 and 2011, respectively. Included in the provision for income taxes in 2012 is $3 million related to the establishment of a valuation allowance against certain deferred tax credits in Mexico, the realization of which is no longer considered more likely than not due to insufficient projected future taxable income, offset by favorable adjustments of $2 million associated with uncertain tax positions.
Net Income
Net income attributable to Visteon was $100 million for the year ended December 31, 2012 compared to $80 million for the same period of 2011. Adjusted EBITDA (a non-GAAP financial measure, as defined below) was $626 million for the year ended December 31, 2012, representing a decrease of $63 million when compared with Adjusted EBITDA of $689 million for the same period of 2011. The decrease in Adjusted EBITDA included $42 million of unfavorable volume and mix attributable to continued economic weakness in European markets, $40 million of unfavorable currency primarily reflecting weaker Euro and Indian Rupee currencies, and $6 million associated with the non-recurrence of a 2011 Brazil land sale. Higher favorable commercial agreements and engineering cost recoveries increased Adjusted EBITDA $33 million.
Adjusted EBITDA is presented as a supplemental measure of the Company's financial performance that management believes is useful to investors because the excluded items may vary significantly in timing or amounts and/or may obscure trends useful in
38
evaluating and comparing the Company's operating activities across reporting periods. The Company defines Adjusted EBITDA as net income attributable to the Company, plus net interest expense, provision for income taxes and depreciation and amortization, as further adjusted to eliminate the impact of asset impairments, gains or losses on divestitures, discontinued operations, net restructuring expenses and other reimbursable costs, non-cash stock-based compensation expense, certain employee charges and benefits, reorganization items and other non-operating gains and losses. Not all companies use identical calculations and, accordingly, the Company's presentation of Adjusted EBITDA may not be comparable to other similarly titled measures of other companies.
Adjusted EBITDA is not a recognized term under accounting principles generally accepted in the United States and does not purport to be a substitute for net income as an indicator of operating performance or cash flows from operating activities as a measure of liquidity. Adjusted EBITDA has limitations as an analytical tool and is not intended to be a measure of cash flow available for management's discretionary use, as it does not consider certain cash requirements such as interest payments, tax payments and debt service requirements. In addition, the Company uses Adjusted EBITDA (i) as a factor in incentive compensation decisions, (ii) to evaluate the effectiveness of the Company's business strategies and (iii) because the Company's credit agreements use measures similar to Adjusted EBITDA to measure compliance with certain covenants. Adjusted EBITDA, as determined and measured by the Company should not be compared to similarly titled measures reported by other companies.
The reconciliation of Adjusted EBITDA to net income attributable to Visteon for the years ended December 31, 2012 and 2011 is as follows:
|
Year Ended December 31
|
|||||||||||
|
2012
|
2011
|
Change
|
|||||||||
|
(Dollars in Millions)
|
|||||||||||
|
Adjusted EBITDA
|
$
|
626
|
|
$
|
689
|
|
$
|
(63
|
)
|
||
|
Interest expense, net
|
35
|
|
27
|
|
8
|
|
|||||
|
Provision for income taxes
|
121
|
|
127
|
|
(6
|
)
|
|||||
|
Depreciation and amortization
|
258
|
|
295
|
|
(37
|
)
|
|||||
|
Restructuring expense
|
79
|
|
24
|
|
55
|
|
|||||
|
Non-cash, stock-based compensation expense
|
25
|
|
39
|
|
(14
|
)
|
|||||
|
Equity in gain of non-consolidated affiliate
|
(63
|
)
|
—
|
|
(63
|
)
|
|||||
|
Other
|
71
|
|
97
|
|
(26
|
)
|
|||||
|
Net income attributable to Visteon Corporation
|
$
|
100
|
|
$
|
80
|
|
$
|
20
|
|
||
Segment Results of Operations - 2012 compared with 2011
Sales
|
|
Climate
|
Electronics
|
Interiors
|
Eliminations
|
Total
|
||||||||||||||
|
(Dollars in Millions)
|
|||||||||||||||||||
|
Year ended December 31, 2011
|
$
|
4,053
|
|
$
|
1,370
|
|
$
|
2,282
|
|
$
|
(173
|
)
|
$
|
7,532
|
|
||||
|
Volume and mix
|
418
|
|
(26
|
)
|
(193
|
)
|
42
|
|
241
|
|
|||||||||
|
Currency
|
(146
|
)
|
(54
|
)
|
(107
|
)
|
—
|
|
(307
|
)
|
|||||||||
|
Duckyang deconsolidation
|
—
|
|
—
|
|
(589
|
)
|
40
|
|
(549
|
)
|
|||||||||
|
Other
|
(39
|
)
|
(16
|
)
|
(5
|
)
|
—
|
|
(60
|
)
|
|||||||||
|
Year ended December 31, 2012
|
$
|
4,286
|
|
$
|
1,274
|
|
$
|
1,388
|
|
$
|
(91
|
)
|
$
|
6,857
|
|
||||
Climate sales increased during the year ended December 31, 2012 by $233 million. Higher production volumes in Asia, North America, and Europe, increased sales by $418 million. Unfavorable currency, primarily related to the Euro, Indian Rupee and Korean Won, resulted in a decrease of $146 million. Other changes, totaling $39 million, reflected price productivity, partially offset by increases in revenue related to commercial agreements, commodity pricing and design actions.
Electronics sales decreased during the year ended December 31, 2012 by $96 million. Volume declines of $26 million reflect historical customer sourcing actions and weakened economic conditions in Europe, partially offset by higher production volumes in North America and Asia. Unfavorable currency, primarily related to the Euro and the Indian Rupee, further decreased product sales by $54 million. Other changes, totaling $16 million, reflected price productivity, partially offset by increases in revenue related to commercial agreements, commodity pricing and design actions.
39
Interiors sales decreased during the year ended December 31, 2012 by $894 million, including the Duckyang deconsolidation of $589 million (prior to eliminations), unfavorable volume and product mix of $193 million reflecting customer sourcing actions and weakened economic conditions in Europe, and unfavorable currency related to the Euro and Brazilian Real of $107 million.
Cost of Sales
|
|
Climate
|
Electronics
|
Interiors
|
Eliminations
|
Total
|
||||||||||||||
|
(Dollars in Millions)
|
|||||||||||||||||||
|
Year ended December 31, 2011
|
$
|
3,702
|
|
$
|
1,237
|
|
$
|
2,148
|
|
$
|
(173
|
)
|
$
|
6,914
|
|
||||
|
Material
|
162
|
|
(27
|
)
|
(700
|
)
|
82
|
|
(483
|
)
|
|||||||||
|
Freight and duty
|
22
|
|
(6
|
)
|
(15
|
)
|
—
|
|
1
|
|
|||||||||
|
Labor and overhead
|
30
|
|
(20
|
)
|
(103
|
)
|
(2
|
)
|
(95
|
)
|
|||||||||
|
Depreciation and amortization
|
(12
|
)
|
(12
|
)
|
(7
|
)
|
(6
|
)
|
(37
|
)
|
|||||||||
|
Other
|
5
|
|
(36
|
)
|
(9
|
)
|
8
|
|
(32
|
)
|
|||||||||
|
Year ended December 31, 2012
|
$
|
3,909
|
|
$
|
1,136
|
|
$
|
1,314
|
|
$
|
(91
|
)
|
$
|
6,268
|
|
||||
Climate material costs increased by $162 million, including $240 million related to higher production volumes and $16 million related to higher aluminum, resin and other commodity costs and design changes, partially offset by $95 million of manufacturing efficiencies and purchasing improvements. Labor and overhead increased by $30 million, including $25 million related to production volumes and currency and $5 million related to higher manufacturing costs, net of efficiencies. Depreciation and amortization decreased by $12 million, as the cessation of depreciation on assets with short useful lives established in connection with fresh-start accounting more than offset depreciation from current year capital expenditures.
Electronics material costs decreased by $27 million, including $5 million related to production volumes and currency and $30 million associated with purchasing improvement efforts and design efficiencies, partially offset by $8 million related to the impact of commodity price increases and design changes. Labor and overhead decreased by $20 million, including $14 million related to lower production volumes, the exit of the Cadiz facility and currency and $6 million related to lower manufacturing costs, net of economics. Depreciation and amortization decreased by $12 million, as the cessation of depreciation on assets with short useful lives established in connection with fresh-start accounting more than offset depreciation from current year capital expenditures. Other decreases of $36 million primarily relate to currency hedging and the non-recurrence of costs related to the closure of the Cadiz facility.
Interiors material costs decreased by $700 million, including $532 million related to the deconsolidation of Duckyang (prior to eliminations), $154 million related to production volumes and currency and $14 million related to the impact of resin commodity costs and design changes. Labor and overhead decreased by $103 million, including $40 million associated with Duckyang (prior to eliminations), $70 million related to production volumes and currency, partially offset by $4 million related to increases in net manufacturing costs. Other reductions of $9 million include design and development recoveries of $15 million, partially offset by the non-recurrence of a Brazil land sale in 2011.
Adjusted EBITDA
Adjusted EBITDA by segment for the years ended December 30, 2012 and 2011 is presented in the table below.
|
Year Ended December 31
|
|||||||||||
|
2012
|
2011
|
Change
|
|||||||||
|
(Dollars in Millions)
|
|||||||||||
|
Climate
|
$
|
370
|
|
$
|
352
|
|
$
|
18
|
|
||
|
Electronics
|
126
|
|
148
|
|
(22
|
)
|
|||||
|
Interiors
|
178
|
|
230
|
|
(52
|
)
|
|||||
|
Total segment Adjusted EBITDA
|
$
|
674
|
|
$
|
730
|
|
$
|
(56
|
)
|
||
|
Reconciling Item:
|
|||||||||||
|
Corporate
|
(48
|
)
|
(41
|
)
|
(7
|
)
|
|||||
|
Total consolidated
|
$
|
626
|
|
$
|
689
|
|
$
|
(63
|
)
|
||
40
Changes in Adjusted EBITDA by segment are presented in the table below.
|
|
Climate
|
Electronics
|
Interiors
|
Total
|
|||||||||||
|
(Dollars in Millions)
|
|||||||||||||||
|
Year ended December 31, 2011
|
$
|
352
|
|
$
|
148
|
|
$
|
230
|
|
$
|
730
|
|
|||
|
Volume and mix
|
30
|
|
(26
|
)
|
(46
|
)
|
(42
|
)
|
|||||||
|
Currency
|
(16
|
)
|
(10
|
)
|
(14
|
)
|
(40
|
)
|
|||||||
|
Other
|
4
|
|
14
|
|
8
|
|
26
|
|
|||||||
|
Year ended December 31, 2012
|
$
|
370
|
|
$
|
126
|
|
$
|
178
|
|
674
|
|
||||
|
Corporate
|
(48
|
)
|
|||||||||||||
|
Total
|
$
|
626
|
|
||||||||||||
Adjusted EBITDA for the Climate segment for the year ended December 31, 2012 increased by $18 million compared to the same period of 2011. The increase in Climate Adjusted EBITDA primarily reflects increased volume of $30 million associated with net new business including Hyundai in Asia and Europe, Kia in North America, and Ford in Asia and Europe partially offset by declines in Europe and North America. Favorable commercial agreements contributed $12 million to the increase in Climate Adjusted EBITDA. Unfavorable currency decreased Climate Adjusted EBITDA by $16 million primarily reflecting weaker Euro and Indian Rupee currencies. Material, design and other cost efficiencies more than offset higher engineering and other costs associated with current year launch activity and customer price productivity.
Electronics Adjusted EBITDA for the year ended December 31, 2012 decreased by $22 million compared to the same period of 2011. The decrease in Electronics Adjusted EBITDA includes unfavorable volume and currency of $26 million and $10 million, respectively. The decline in volumes reflected continued economic weakness in Europe and historical unfavorable customer sourcing actions associated with Vehicle Electronics products. Approximately three-quarters of the Electronics Adjusted EBITDA decline is associated with Vehicle Electronics products, primarily powertrain control modules. Adjusted EBITDA for all other Electronics products increased $14 million reflecting material, manufacturing, and design cost savings in excess of customer price productivity partially offset by the impact of unfavorable currency primarily attributable to a weaker Euro and Indian Rupee.
Interiors Adjusted EBITDA was $178 million for the year ended December 31, 2012, representing a decrease of $52 million compared to the same period of 2011. The decrease in Interiors Adjusted EBITDA includes $46 million of unfavorable volume reflecting lower production volumes in Europe and South America, $14 million of unfavorable currency reflecting weaker Euro and Brazilian Real currencies and $6 million related to the non-recurrence of a 2011 Brazil land sale. These decreases were partially offset by favorable design and development cost recoveries of $15 million and customer price productivity partially offset by material, design and other cost efficiencies.
Cash Flows
Operating Activities
The Company generated $312 million of cash from operating activities during the year ended December 31, 2013, compared to $239 million during the same period of 2012 for an increase of $73 million. Higher cash dividends from non-consolidated affiliates contributed $83 million of the increase in cash from operating activities. Changes in receivable terms for certain customers in Asia of $32 million, lower restructuring payments of $17 million, and lower employee benefit related payments of $8 million also contributed to the increase. These increases were partially offset by $86 million in tax payments associated with sale of the Company's 50% ownership interest in Yanfeng, $52 million of incremental value-added tax payments, $38 million of payments to the Korean and Brazilian tax authorities, and the non-recurrence of customer accommodation agreement payments received in 2012 of $21 million. The remaining increase was driven by higher collections as compared to payments related to increased profitability from favorable production volume and product mix as well as higher payables related to increased year-end capital spending and inventory levels.
Cash provided from operating activities during the year ended December 31, 2012 totaled $239 million, compared to $175 million during the same period of 2011 for an increase of $64 million. The increase is primarily attributable to higher cash dividends from non-consolidated affiliates of $58 million, lower bankruptcy claim settlement payments of $43 million, and lower employee benefit payments of $24 million. Lower customer accommodation agreement receipts of $38 million and higher restructuring payments of $24 million were partial offsets.
41
Investing Activities
Cash provided from investing activities during the year ended December 31, 2013 totaled $698 million, compared to net cash used by investing activities of $40 million for the same period in 2012 for an increase of $738 million. Cash provided from investing activities during the year ended December 31, 2013 included $928 million of proceeds from the sale of the Company's 50% ownership interest in Yanfeng, $49 million in proceeds from the sale of various investments including Visteon's 50% ownership interest in Visteon TYC Corporation, its 20% ownership interest in Dongfeng Visteon Automotive Trim Systems Co., Ltd, and its 29% ownership interest in Toppower Automotive Electronics Co., Ltd. Cash from investing activities also increased by $38 million related to the consolidation of YFVE. These increases in cash from investing activities were partially offset by $269 million of capital expenditures and a $48 million investment in a non-consolidated electronics holding company owned 50% by Visteon and 50% by Yanfeng.
Cash used by investing activities during the year ended December 31, 2012 included $229 million of capital expenditures, partially offset by approximately $100 million of proceeds from the Lighting and R-Tek divestitures and $91 million of proceeds from asset sales primarily related to the Company's headquarters. Cash used by investing activities during the year ended December 31, 2011 totaled $331 million, which included $258 million of capital expenditures, $52 million of cash deconsolidated from the Company's financial statements in connection with the Duckyang Share Sale, and $29 million for the acquisition of joint venture interests, partially offset by $14 million of proceeds from asset sales.
Financing Activities
Cash used by financing activities during the year ended December 31, 2013 totaled $141 million, compared to $115 million for the same period in 2012 for an increase of $26 million. Cash used by financing activities during the year ended December 31, 2013 included $250 million in stock repurchases under accelerated stock buyback programs, $52 million related to the redemption of outstanding 6.75% Senior Notes due April 2019, $22 million of dividends paid to non-controlling interests, and a net decrease in other affiliate debt of $17 million. These financing cash uses were partially offset by $195 million of proceeds related to HVCC unsecured bilateral term loans.
Cash used by financing activities of $115 million during the year ended December 31, 2012 included $52 million related to the redemption of outstanding 6.75% Senior Notes due April 2019 at 103%, $50 million in stock repurchases and $27 million of dividends paid to non-controlling interests. Cash used by financing activities during the year ended December 31, 2011 totaled $3 million primarily resulting from the termination and payoff of the Company's term loan, reorganization related professional fees and dividends paid to non-controlling interests, offset by issuance of $500 million in senior notes, a reduction in restricted cash primarily related to the disbursement of previously escrowed funds to settle reorganization related rights offering and other financing fees and increases in affiliate debt. The Company's credit agreements contain restrictions regarding the amount of cash payments for dividends the Company may make.
Liquidity
Overview
The Company’s primary liquidity needs are related to the funding of general business requirements, including working capital requirements, capital expenditures, debt service, employee retirement benefits and restructuring actions. To the extent the Company generates discretionary cash flow, it will be evaluated for and may be used for optional prepayments of existing indebtedness, strategic acquisitions, additional share repurchases, and/or general corporate purposes. The Company continues to evaluate options to enhance its existing capital structure. The Company's primary sources of liquidity are cash flows from operations, existing cash balances, asset sales, and borrowings under available credit facilities, if necessary. A substantial portion of the Company's cash flows from operations are generated outside of the U.S. Accordingly, the Company utilizes a combination of cash repatriation strategies, including dividends, royalties, intercompany loan repayments and other distributions and advances to provide the funds necessary to meet obligations globally. The Company’s ability to access funds from its subsidiaries using these repatriation strategies is subject to, among other things, customary regulatory and statutory requirements and contractual arrangements including joint venture agreements and local debt agreements. Additionally, such repatriation strategies may be adjusted or modified as the Company continues to, among other things, rationalize its business portfolio and cost structure.
As of December 31, 2013, the Company had total cash balances of $1.7 billion, including restricted cash of $25 million. Cash balances totaling $527 million were located in jurisdictions outside of the United States, of which approximately
$185 million
is considered permanently reinvested for funding ongoing operations outside of the U.S. If such permanently reinvested funds are needed for operations in the U.S., the Company would be required to accrue additional tax expense, primarily related to foreign withholding taxes.
42
The Company's ability to fund its liquidity needs is dependent on the level, variability and timing of its customers' worldwide vehicle production, which may be affected by many factors including, but not limited to, general economic conditions, specific industry conditions, financial markets, competitive factors and legislative and regulatory changes. The Company monitors the macroeconomic environment and its impact on vehicle production volumes in relation to the Company's specific cash needs. The Company's intra-year needs are impacted by seasonal effects in the industry, such as mid-year shutdowns, the subsequent ramp-up of new model production and the additional year-end shutdowns by primary customers.
Significant Cash Sources and Availability
To the extent that the Company's liquidity needs exceed cash provided by its operating activities, the Company would look to cash balances on hand; cash available through existing financing vehicles such as the Company's $130 million asset-based revolving loan credit facility (the "Revolver"), the sale of businesses or other assets as permitted under credit agreements, affiliate working capital lines of credit, other contractual arrangements, and potential additional capital through debt or equity markets.
The Revolver requires the Company and its subsidiaries to comply with customary affirmative and negative covenants, and contains customary events of default. Cash available to the Company under the Revolver is subject to a borrowing base which may be impacted by potential sale agreements. On January 28, 2013, the Company entered into an amendment to the Revolver to permit, among other things, the sale of certain Climate operations to Halla, which was completed in January 2013 for a total purchase price of $410 million. In anticipation of the associated reduction in collateral, the Company also reduced its commitment amount under the Revolver from $175 million to $130 million. As of December 31, 2013, the Company had no outstanding borrowings or letter of credit obligations under its revolving loan credit agreement with approximately $100 million available for borrowing. Future borrowing base capacity under the facility may be impacted by the sale or purchase of assets.
Available borrowings on outstanding affiliate credit facilities as of December 31, 2013 is approximately
$291 million
and certain of these facilities have pledged receivables, inventory or equipment as security. In addition to affiliate credit facilities, the Company has an arrangement, through a subsidiary in France, to sell accounts receivable on an uncommitted basis. The amount of financing available is contingent upon the amount of receivables less certain reserves. On December 31, 2013, there was $31 million of outstanding borrowings under this facility with $52 million of receivables pledged as security, which are recorded as “Other current assets” on the consolidated balance sheet.
Access to additional capital through the debt or equity markets is influenced by the Company's credit ratings. At December 31, 2013, the Company's corporate credit ratings were B1 and B+ by Moody's and S&P, respectively, both with a stable outlook. On January 31, 2014, S&P revised its rating outlook on the Company to positive from stable and reaffirmed the Company's ratings.
On December 17, 2013, the Company sold its 50% ownership interest in Yanfeng for cash proceeds of $928 million (before applicable taxes). The Company also received approximately $180 million in dividend distributions from Yanfeng and related entities based on previously undistributed earnings for 2012 and 2013. In 2013, the Company also received $49 million of proceeds from other business divestitures and asset sales which included the sale of the Company’s 50% equity interest in Visteon TYC Corporation, 20% equity interest in Dongfeng Visteon Automotive Trim Systems Co., Ltd, and the sale of its 29% direct interest in Toppower Automotive Electronics Co., Ltd.
Significant Cash Uses and Other Considerations
In March 2013, the Company commenced an accelerated stock buyback ("ASB") program to purchase shares of Visteon common stock for an aggregate purchase price of $125 million. In August 2013, the Company's board of directors authorized share repurchases of up to $1 billion over the next two years and the Company entered into another ASB program to purchase shares of Visteon common stock for an aggregate purchase price of $125 million. As of December 31, 2013, both of these ASB programs had concluded and $875 million remains authorized and available for repurchase through December 31, 2015. The Company anticipates that additional repurchases of common stock, if any, would occur from time to time in open market transactions, non-discretionary programs or in privately negotiated transactions depending on market and economic conditions, share price, trading volumes, alternative uses of capital and other factors.
In connection with the Company's shareholder value creation strategy, Visteon continues to invest in the optimization of its Electronics business. During the fourth quarter of 2013, the Company made a cash payment of $58 million to subscribe to an additional 11% ownership interest in YFVE. This step acquisition increased Visteon's direct ownership interest in YFVE from a non-controlling 40% direct ownership interest to a controlling 51% direct ownership interest. Additionally, the Company invested $48 million during the fourth quarter of 2013 in a non-consolidated electronics holding company owned 50% by Visteon and 50% by Yanfeng. On January 13, 2014, Visteon reached an agreement to acquire the automotive electronics business of Johnson Controls
43
for cash of $265 million. The acquisition is subject to certain regulatory and other consents and approvals and is expected to be completed in the second quarter of 2014.
In connection with the Company's shareholder value creation strategy Visteon continues to explore alternatives for its non-core Interiors business including, but not limited to, divestiture, partnership or alliance. On December 17, 2013, Visteon completed the sale of its 50% ownership interest in Yanfeng, a significant interiors equity investee, for cash proceeds of $928 million (before applicable taxes). The Company's goal is to dispose of the remainder of its Interiors businesses in three separate transactions targeted for 2014. Due to certain liabilities and capital requirements of many of the these remaining businesses, the Company may be required to contribute cash to such businesses in connection with any disposition, which amounts could be material.
The Company previously announced a $100 million restructuring program designed to reduce fixed costs and to improve operational efficiency by addressing certain under-performing operations. At December 31, 2013, the Company had restructuring accruals totaling $29 million, which are expected to be settled in cash during 2014 including $25 million associated with activities under the program announced on November 1, 2012. The Company anticipates that it will record additional restructuring and other charges related to this program of up to $24 million in future periods as related plans are finalized. The Company estimates cash requirements for restructuring programs during the year ending December 31, 2014, to be approximately $50 million.
Korean tax authorities commenced a review of the Company's Korean affiliates (including Halla) for tax years 2007 through 2012 and issued formal notice of assessments, including penalties, of approximately $25 million for alleged underpayment of withholding tax on dividends paid and other items, including certain management service fees charged by Visteon. During the twelve months ended December 31, 2013, the Company's Korean affiliates have paid approximately $23 million to the Korean tax authorities, as required under Korean tax regulations, to pursue the appeals process. The Company believes that it is more likely than not that it will receive a favorable ruling when all of the available appeals have been exhausted. Also during 2012, Brazilian tax authorities issued tax assessment notices to Visteon Sistemas Automotivos (“Sistemas”) of approximately $15 million related to the sale of its chassis business to a third party. During the third quarter of 2013, after attempts to reopen an appeal of the administrative decision failed, Sistemas opened a judicial proceeding against the government to address the notice which required a deposit in the amount of the assessment in order to suspend the debt and allow Sistemas to operate regularly before the tax authorities. The Company believes that the risk of a negative outcome is remote once the matter is fully litigated at the highest judicial level. These appeal payments in Korea and Brazil, as well as contingent income tax refund claims associated with other jurisdictions, total $47 million as of December 31, 2013 and are included in Other non-current assets on the consolidated balance sheet.
The Company expects to make cash contributions to its U.S. retirement plans of $14 million in 2014. Contributions to non-U.S. retirement plans are expected to be $37 million during 2014. Estimated cash contributions for 2015 through 2017 under current regulations and market assumptions are approximately $155 million.
Information related to the Company’s debt and related agreements is set forth in Note 9, “Debt” to the consolidated financial statements which are included in Item 8 “Financial Statements and Supplementary Data” of this Annual Report on Form 10-K. Information related to the Company’s stockholders’ equity is set forth in Note 14 “Stockholders’ Equity and Non-controlling Interests” to the consolidated financial statements which are included in Item 8 “Financial Statements and Supplementary Data” of this Annual Report on Form 10-K. The Company’s short and long-term debt consists of the following:
|
|
|
Weighted Average
Interest Rate
|
Carrying Value
|
||||||||||
|
Maturity
|
2013
|
2012
|
2013
|
2012
|
|||||||||
|
(Dollars in Millions)
|
|||||||||||||
|
Short-term debt
|
|||||||||||||
|
Current portion of long-term debt
|
7.7%
|
8.9%
|
$
|
2
|
|
$
|
3
|
|
|||||
|
Short-term borrowings
|
4.7%
|
3.3%
|
104
|
|
93
|
|
|||||||
|
Total short-term debt
|
$
|
106
|
|
$
|
96
|
|
|||||||
|
Long-term debt
|
|||||||||||||
|
6.75% Senior notes due April 15, 2019
|
2019
|
6.75%
|
6.75%
|
$
|
396
|
|
$
|
445
|
|
||||
|
HVCC USD term loan due May 30, 2016
|
2016
|
1.8%
|
N/A
|
100
|
|
—
|
|
||||||
|
HVCC KRW term loan due May 30, 2016
|
2016
|
3.7%
|
N/A
|
95
|
|
—
|
|
||||||
|
Other
|
2014-2018
|
5.7%
|
8.5%
|
33
|
|
28
|
|
||||||
|
Total long-term debt
|
$
|
624
|
|
$
|
473
|
|
|||||||
44
Short term borrowings
Short-term borrowings are primarily related to the Company's non-U.S. operations and are payable in various currencies. As of December 31, 2013, the Company had international affiliate short-term borrowings of $104 million, approximately $68 million of which is related to HVCC. These borrowings are payable in both U.S. dollar and non-U.S. currencies including, but not limited to, the Euro, Korean Won, Turkish Lira, Russian Ruble and Chinese Yuan. Short-term borrowings also include an arrangement, through a subsidiary in France, to sell accounts receivable with recourse on an uncommitted basis. The amount of financing available is dependent on the amount of receivables less customary reserves. At December 31, 2013 there were
$31 million
outstanding borrowings under the facility with
$52 million
of receivables pledged as security, which are recorded as "Other current assets" on the consolidated balance sheet.
6.75% Senior Notes Due April 15, 2019
On April 6, 2011, the Company completed the sale of $500 million aggregate principal amount of 6.75% senior notes due April 15, 2019 (the “Original Senior Notes”). The Original Senior Notes were sold to the initial purchasers who are party to a certain purchase agreement (the “Initial Purchasers”) for resale to qualified institutional buyers under Rule 144A and to persons outside the United States under Regulation S. In accordance with a registration rights agreement, in January 2012 the Company exchanged substantially identical senior notes (the "Senior Notes") that have been registered under the Securities Act of 1933, as amended, for all of the Original Senior Notes.
The Senior Notes were issued under an Indenture (the “Indenture”) among the Company, the subsidiary guarantors named therein, and The Bank of New York Mellon Trust Company, N.A., as trustee (the “Trustee”). The Indenture and the form of Senior Notes provide, among other things, that the Senior Notes are senior unsecured obligations. Interest is payable on the Senior Notes on April 15 and October 15 of each year until maturity on April 15, 2019. Each of the Company’s existing and future 100% owned domestic restricted subsidiaries that guarantee debt under the Company’s Revolver guarantee the Senior Notes.
The terms of the Indenture, among other things, limit the ability of the Company and certain of its subsidiaries to make restricted payments; restrict dividends or other payments of subsidiaries; incur additional debt; engage in transactions with affiliates; create liens on assets; engage in sale and leaseback transactions; and consolidate, merge or transfer all or substantially all of its assets and the assets of its subsidiaries. The Indenture provides for customary events of default which include (subject in certain cases to customary grace and cure periods), among others: nonpayment of principal or interest; breach of other agreements in the Indenture; defaults in failure to pay certain other indebtedness; the rendering of judgments to pay certain amounts of money against the Company and its subsidiaries; the failure of certain guarantees to be enforceable; and certain events of bankruptcy or insolvency. Generally, if an event of default occurs and is not cured within the time periods specified, the Trustee or the holders of at least 25% in principal amount of the then outstanding series of Senior Notes may declare all the Senior Notes of such series to be due and payable immediately.
Prior to April 15, 2014, the Company has the option to redeem up to
10%
of the Senior Notes during any 12-month period from issue date until April 15, 2014 for a
103%
redemption price, plus accrued and unpaid interest to the redemption date. The Company exercised this right in December 2013 and 2012 to repurchase an aggregate of $100 million of its Senior Notes. The Company also has the option to redeem a portion or all of the Senior Notes subject to a make-whole provision. Beginning April 15, 2014, the Indenture allows for part or all of the Senior Notes to be redeemed at the following redemption prices (plus accrued and unpaid interest to the redemption date) during the 12 month period beginning on April 15 of the indicated years: 2014 at
105.063%
, 2015 at
103.375%
, 2016 at
101.688%
, and 2017 and thereafter at
100.000%
. The Indenture also contains optional redemption rights related to the proceeds from equity offerings.
HVCC Term Loans
In January 2013, HVCC entered into two unsecured bilateral term loan credit agreements with aggregate available borrowings of approximately
$195 million
, all of which was drawn at December 31, 2013 and 2012, respectively. Both credit agreements mature in May 2016 and are subject to financial covenants requiring total debt to EBITDA of not greater than
3.2
x and a net interest coverage test of more than
3
x.
Other Long-Term Debt
Other long-term debt includes amounts associated with the Company's non-U.S. operations and are payable in various currencies. As of December 31, 2013, the Company had long-term international affiliate debt outstanding of
$33 million
. Included in other long-term debt at December 31, 2013 is approximately $17 million attributable to a sale-leaseback arrangement for land and
45
buildings located in Chihuahua, Mexico. The long-term debt balances are payable in both U.S. and non-U.S. currencies including, but not limited to, the Euro, Korean Won, and Russian Ruble.
Stock Warrants
Stock warrants to purchase up to 2,355,000 shares of common stock at an exercise price of $9.66 per share, which expire October 1, 2020 may be net share settled and are recorded as permanent equity in the Company’s consolidated balance sheets with
909
and
299,171
warrants outstanding at December 31, 2013 and 2012, respectively. These warrants were valued at
$15.00
per share on the October 1, 2010 issue date using the Black-Scholes option pricing model.
Stock warrants to purchase up to 1,552,774 shares of common stock at an exercise price of $58.80 per share, which expire October 1, 2015 may be net share settled and are recorded as permanent equity in the Company’s consolidated balance sheets with
1,548,387
and
1,549,337
warrants outstanding at December 31, 2013 and 2012, respectively. These warrants were valued at
$3.62
per share on the October 1, 2010 issue date using the Black-Scholes option pricing model.
If the Company pays or declares a dividend or makes a distribution on common stock payable in shares of its common stock, or if the Company pays an extraordinary dividend (as defined in each Warrant Agreement), the number of shares a warrant holder is entitled to receive or the warrant exercise price may be subject to adjustment in accordance with the terms of the respective Warrant Agreement.
Treasury Stock
At December 31, 2013 and 2012, the Company held approximately
5,640,000
and
1,760,000
shares of common stock in treasury. These shares may be used in satisfying obligations under employee incentive compensation arrangements. The Company values shares of common stock held in treasury at cost.
Since July 2012, the Company's board of directors has authorized a total of $1.175 billion in share repurchases. In connection with these authorizations, the Company completed two accelerated share buy-back programs during 2013 that contributed 3,885,978 shares to treasury stock in 2013. Also in connection with these authorizations, the Company added a total of
1,005,559
shares to treasury stock in 2012 through open market purchases. As of December 31, 2013,
$875 million
remains authorized and available for repurchase through December 31, 2015.
Off-Balance Sheet Arrangements
The Company has guaranteed approximately $43 million of subsidiary lease payments under various arrangements generally spanning from one to ten years in duration, and approximately $6 million of affiliate credit lines and other credit support agreements. The Company has a $15 million Letter of Credit ("LOC") Facility with US Bank National Association, which expires on September 30, 2015. This agreement was amended in September 2013 to extend the agreement for an additional two years, having an expiration date of September 30, 2015. Under the terms of the LOC facility, the Company must maintain a collateral account with U.S. Bank equal to 103% of the aggregated stated amount of the issued LOCs (or 110% for non-U.S. currencies) with reimbursement for any draws. As of December 31, 2013, the Company had $10 million of outstanding letters of credit issued under this facility and secured by restricted cash. In addition, the Company had $21 million of locally issued letters of credit to support various customs arrangements and other obligations at its local affiliates of which $15 million are secured by cash collateral.
Contractual Obligations
The following table summarizes the Company's contractual obligations existing as of December 31, 2013:
|
Total
|
2014
|
2015-2016
|
2017-2018
|
2019 & After
|
|||||||||||||||
|
Debt, including capital leases
|
$
|
730
|
|
$
|
106
|
|
$
|
213
|
|
$
|
15
|
|
$
|
396
|
|
||||
|
Purchase obligations
|
86
|
|
48
|
|
35
|
|
3
|
|
—
|
|
|||||||||
|
Interest payments on long-term debt
|
166
|
|
35
|
|
68
|
|
55
|
|
8
|
|
|||||||||
|
Operating leases
|
170
|
|
29
|
|
43
|
|
30
|
|
68
|
|
|||||||||
|
Total contractual obligations
|
$
|
1,152
|
|
$
|
218
|
|
$
|
359
|
|
$
|
103
|
|
$
|
472
|
|
||||
This table excludes amounts related to the Company's income tax liabilities associated with uncertain tax positions impacting the effective rate of $30 million as of December 31, 2013 as the Company is unable to make reasonable estimates for the periods in
46
which these liabilities may become due. The Company does not expect a significant payment related to these obligations to be made within the next twelve months.
Critical Accounting Estimates
The Company’s consolidated financial statements and accompanying notes as included in Item 8 “Financial Statements and Supplementary Data” of this Annual Report on Form 10-K have been prepared in conformity with accounting principles generally accepted in the United States (“GAAP”). Accordingly, the Company’s significant accounting policies have been disclosed in the consolidated financial statements and accompanying notes under Note 2 “Summary of Significant Accounting Policies.” The Company provides enhanced information that supplements such disclosures for accounting estimates when the estimate involves matters that are highly uncertain at the time the accounting estimate is made and different estimates or changes to an estimate could have a material impact on the reported financial position, changes in financial condition or results of operations.
When more than one accounting principle, or the method of its application, is generally accepted, management selects the principle or method that it considers to be the most appropriate given the specific circumstances. Application of these accounting principles requires the Company’s management to make estimates about the future resolution of existing uncertainties. Estimates are typically based upon historical experience, current trends, contractual documentation and other information, as appropriate. Due to the inherent uncertainty involving estimates, actual results reported in the future may differ from those estimates. In preparing these financial statements, management has made its best estimates and judgments of the amounts and disclosures in the financial statements.
Fair Value Measurements
The Company uses fair value measurements in the preparation of its financial statements, utilizing various inputs including those that can be readily observable, corroborated or are generally unobservable. The Company utilizes market-based data and valuation techniques that maximize the use of observable inputs and minimize the use of unobservable inputs. Additionally, the Company applies assumptions that market participants would use in pricing an asset or liability, including assumptions about risk.
Pension Plans
Many of the Company’s employees participate in defined benefit pension plans or retirement/termination indemnity plans. The Company has approximately $388 million in unfunded pension liabilities as of December 31, 2013, of which approximately $121 million and $267 million are attributable to U.S. and non-U.S. pension plans, respectively. The determination of the Company’s obligations and expense for its pension plans is dependent on the Company’s selection of certain assumptions used by actuaries in calculating such amounts. Selected assumptions are described in Note 10 “Employee Retirement Benefits” to the Company’s consolidated financial statements included in Item 8 “Financial Statements and Supplementary Data” of this Annual Report on Form 10-K, which are incorporated herein by reference, including the discount rate, expected long-term rate of return on plan assets and rate of increase in compensation.
Actual results that differ from assumptions used are accumulated and amortized over future periods and, accordingly, generally affect recognized expense in future periods. Therefore, assumptions used to calculate benefit obligations as of the annual measurement date directly impact the expense to be recognized in future periods. The primary assumptions affecting the Company’s accounting for employee benefits as of December 31, 2013 are as follows:
|
•
|
Long-term rate of return on plan assets: The expected long-term rate of return is used to calculate net periodic pension cost. The required use of the expected long-term rate of return on plan assets may result in recognized returns that are greater or less than the actual returns on those plan assets in any given year. Over time the expected long-term rate of return on plan assets is designed to approximate actual returns. The expected long-term rate of return for pension assets has been estimated based on various inputs, including historical returns for the different asset classes held by the Company’s trusts and its asset allocation, as well as inputs from internal and external sources regarding expected capital market returns, inflation and other variables.
|
In determining its pension expense for 2013, the Company used long-term rates of return on plan assets ranging from 2.2% to 8.25% outside the U.S. and 7% in the U.S. The Company has set the assumptions for its 2014 pension expense which range from 2.3% to 11.5% outside the U.S. and 7% in the U.S. Actual returns on U.S. pension assets for 2013, 2012 and 2011 were 9.2%, 9.6% and 18.2%, respectively, compared to the expected rate of return assumption of 7%, 7% and 7.5% respectively, for each of those years. The Company’s market-related value of pension assets reflects changes in the fair value of assets over a five-year period, with a one-third weighting to the most recent year. Market-related value was reset to fair value at October 1, 2010.
47
|
•
|
Discount rate: The discount rate is used to calculate pension obligations. The discount rate assumption is based on market rates for a hypothetical portfolio of high-quality corporate bonds rated Aa or better with maturities closely matched to the timing of projected benefit payments for each plan at its annual measurement date. The Company used discount rates ranging from 1.05% to 11.5% to determine its pension and other benefit obligations as of December 31, 2013, including weighted average discount rates of 4.75% for U.S. pension plans, and 4.3% for non-U.S. pension plans.
|
While the Company believes that these assumptions are appropriate, significant differences in actual experience or significant changes in these assumptions may materially affect the Company’s pension benefit obligations and its future expense. The following table illustrates the sensitivity to a change in certain assumptions for Company sponsored U.S. and non-U.S. pension plans on its 2013 funded status and 2014 pre-tax pension expense.
|
|
Impact on U.S. 2014 Pre-tax Pension Expense
|
Impact on
U.S. Plan 2013
Funded Status
|
Impact on Non-U.S. 2014 Pre-tax Pension Expense
|
Impact on
Non-U.S. Plan 2013
Funded Status
|
|||
|
25 basis point decrease in discount rate (a)(b)
|
- $1 million
|
-$31 million
|
+$2 million
|
-$29 million
|
|||
|
25 basis point increase in discount rate (a)(b)
|
+ $1 million
|
+$30 million
|
-$2 million
|
+$27 million
|
|||
|
25 basis point decrease in expected return on assets (a)
|
+$2 million
|
+$1 million
|
|||||
|
25 basis point increase in expected return on assets (a)
|
-$2 million
|
-$1 million
|
|||||
|
____________
|
|||||||
|
(a) Assumes all other assumptions are held constant.
|
|||||||
|
(b) Excludes impact of assets used to hedge discount rate volatility.
|
|||||||
Impairment of Goodwill, Long-Lived Assets and Certain Identifiable Intangibles
The Company performs either a qualitative or quantitative assessment of goodwill for impairment at the reporting unit level on an annual basis. Impairment testing is also required if an event or circumstance indicates that an impairment is more likely than not to have occurred. The qualitative assessment considers several factors at the reporting unit level including the excess of fair value over carrying value as of the last quantitative impairment test, the length of time since the last fair value measurement, the current carrying value, market and industry metrics, actual performance compared to forecast performance, and the current outlook on the business. If the qualitative assessment indicates it is more likely than not that goodwill is impaired, the reporting unit is quantitatively tested for impairment. To quantitatively test goodwill for impairment, the fair value of each reporting unit is determined and compared to its carrying value. If the carrying value exceeds fair value, then impairment may exist and further evaluation is required. Estimated fair values are based on the projected future discounted cash flows. The company assesses the reasonableness of these estimated fair values using market based multiples of comparable companies. If the carrying value exceeds the fair value, an impairment loss is measured and recognized. Goodwill fair value measurements are classified within Level 3 of the fair value hierarchy, which are generally determined using unobservable inputs.
Long-lived assets and intangible assets subject to amortization are required to be reviewed for impairment when certain indicators of impairment are present. Impairment exists if estimated future undiscounted cash flows associated with long-lived assets are not sufficient to recover the carrying value of such assets. Generally, when impairment exists the long-lived assets are adjusted to their respective fair values. In assessing long-lived assets for an impairment loss, assets are grouped with other assets and liabilities at the lowest level for which identifiable cash flows are largely independent of the cash flows of other assets and liabilities. Asset grouping requires a significant amount of judgment. Accordingly, facts and circumstances will influence how asset groups are determined for impairment testing. In assessing long-lived assets for impairment, management considered the Company’s product line portfolio, customers and related commercial agreements, labor agreements and other factors in grouping assets and liabilities at the lowest level for which identifiable cash flows are largely independent. Additionally, in determining fair value of long-lived assets, management uses appraisals, management estimates or discounted cash flow calculations.
Product Warranty and Recall
The Company accrues for warranty obligations for products sold based on management estimates, with support from the Company’s sales, engineering, quality and legal functions, of the amount that eventually will be required to settle such obligations. This accrual is based on several factors, including contractual arrangements, past experience, current claims, production changes, industry developments and various other considerations. The Company accrues for product recall claims related to potential financial
48
participation in customer actions to provide remedies as a result of actual or threatened regulatory or court actions or the Company’s determination of the potential for such actions. The Company's accrual for recall claims is based on specific facts and circumstances underlying individual claims with support from the Company’s engineering, quality and legal functions. Amounts accrued are based upon management’s best estimate of the amount that will ultimately be required to settle such claims.
Income Taxes
The Company is subject to income taxes in the U.S. and numerous non-U.S. jurisdictions. Significant judgment is required in determining the Company’s worldwide provision for income taxes, deferred tax assets and liabilities and the valuation allowance recorded against the Company’s net deferred tax assets. Deferred tax assets and liabilities are recorded for the future tax consequences attributable to differences between financial statement carrying amounts of existing assets and liabilities and their respective tax bases and operating loss and tax credit carry forwards.
Deferred tax assets and liabilities are measured using enacted tax rates expected to apply to taxable income in the years in which those temporary differences are expected to be recovered or settled. The Company records a valuation allowance to reduce deferred tax assets when, based on all available evidence, both positive and negative, it is more likely than not that such assets will not be realized. This assessment, which is completed on a jurisdiction-by-jurisdiction basis, requires significant judgment, and in making this evaluation, the evidence considered by the Company includes, historical and projected financial performance, as well as the nature, frequency and severity of recent losses along with any other pertinent information.
In the ordinary course of the Company’s business, there are many transactions and calculations where the ultimate tax determination is uncertain. The Company is regularly under audit by tax authorities. Accruals for tax contingencies are provided for as it relates to income tax risks and non-income tax risks, where appropriate.
Recent Accounting Pronouncements
See Note 2 “Summary of Significant Accounting Policies” to the accompanying consolidated financial statements under Item 8 “Financial Statements and Supplementary Data” of this Annual Report on Form 10-K for a discussion of recent accounting pronouncements.
Forward-Looking Statements
Certain statements contained or incorporated in this Annual Report on Form 10-K which are not statements of historical fact constitute “Forward-Looking Statements” within the meaning of the Private Securities Litigation Reform Act of 1995 (the “Reform Act”). Forward-looking statements give current expectations or forecasts of future events. Words such as “anticipate”, “expect”, “intend”, “plan”, “believe”, “seek”, “estimate” and other words and terms of similar meaning in connection with discussions of future operating or financial performance signify forward-looking statements. These statements reflect the Company’s current views with respect to future events and are based on assumptions and estimates, which are subject to risks and uncertainties including those discussed in Item 1A under the heading “Risk Factors” and elsewhere in this report. Accordingly, undue reliance should not be placed on these forward-looking statements. Also, these forward-looking statements represent the Company’s estimates and assumptions only as of the date of this report. The Company does not intend to update any of these forward-looking statements to reflect circumstances or events that occur after the statement is made and qualifies all of its forward-looking statements by these cautionary statements.
You should understand that various factors, in addition to those discussed elsewhere in this document, could affect the Company’s future results and could cause results to differ materially from those expressed in such forward-looking statements, including:
|
•
|
Visteon’s ability to satisfy its future capital and liquidity requirements; Visteon’s ability to access the credit and capital markets at the times and in the amounts needed and on terms acceptable to Visteon; Visteon’s ability to comply with covenants applicable to it; and the continuation of acceptable supplier payment terms.
|
|
•
|
Visteon’s ability to satisfy its pension and other postretirement employee benefit obligations, and to retire outstanding debt and satisfy other contractual commitments, all at the levels and times planned by management.
|
|
•
|
Visteon’s ability to access funds generated by its foreign subsidiaries and joint ventures on a timely and cost effective basis.
|
|
•
|
Changes in the operations (including products, product planning and part sourcing), financial condition, results of operations or market share of Visteon’s customers.
|
|
•
|
Changes in vehicle production volume of Visteon’s customers in the markets where it operates, and in particular changes in Ford’s and Hyundai Kia’s vehicle production volumes and platform mix.
|
49
|
•
|
Increases in commodity costs or disruptions in the supply of commodities, including steel, resins, aluminum, copper, fuel and natural gas.
|
|
•
|
Visteon’s ability to generate cost savings to offset or exceed agreed upon price reductions or price reductions to win additional business and, in general, improve its operating performance; to achieve the benefits of its restructuring actions; and to recover engineering and tooling costs and capital investments.
|
|
•
|
Visteon’s ability to compete favorably with automotive parts suppliers with lower cost structures and greater ability to rationalize operations; and to exit non-performing businesses on satisfactory terms, particularly due to limited flexibility under existing labor agreements.
|
|
•
|
Restrictions in labor contracts with unions that restrict Visteon’s ability to close plants, divest unprofitable, noncompetitive businesses, change local work rules and practices at a number of facilities and implement cost-saving measures.
|
|
•
|
The costs and timing of facility closures or dispositions, business or product realignments, or similar restructuring actions, including potential asset impairment or other charges related to the implementation of these actions or other adverse industry conditions and contingent liabilities.
|
|
•
|
Significant changes in the competitive environment in the major markets where Visteon procures materials, components or supplies or where its products are manufactured, distributed or sold.
|
|
•
|
Legal and administrative proceedings, investigations and claims, including shareholder class actions, inquiries by regulatory agencies, product liability, warranty, employee-related, environmental and safety claims and any recalls of products manufactured or sold by Visteon.
|
|
•
|
Changes in economic conditions, currency exchange rates, changes in foreign laws, regulations or trade policies or political stability in foreign countries where Visteon procures materials, components or supplies or where its products are manufactured, distributed or sold.
|
|
•
|
Shortages of materials or interruptions in transportation systems, labor strikes, work stoppages or other interruptions to or difficulties in the employment of labor in the major markets where Visteon purchases materials, components or supplies to manufacture its products or where its products are manufactured, distributed or sold.
|
|
•
|
Changes in laws, regulations, policies or other activities of governments, agencies and similar organizations, domestic and foreign, that may tax or otherwise increase the cost of, or otherwise affect, the manufacture, licensing, distribution, sale, ownership or use of Visteon’s products or assets.
|
|
•
|
Possible terrorist attacks or acts of war, which could exacerbate other risks such as slowed vehicle production, interruptions in the transportation system or fuel prices and supply.
|
|
•
|
The cyclical and seasonal nature of the automotive industry.
|
|
•
|
Visteon’s ability to comply with environmental, safety and other regulations applicable to it and any increase in the requirements, responsibilities and associated expenses and expenditures of these regulations.
|
|
•
|
Visteon’s ability to protect its intellectual property rights, and to respond to changes in technology and technological risks and to claims by others that Visteon infringes their intellectual property rights.
|
|
•
|
Visteon’s ability to quickly and adequately remediate control deficiencies in its internal control over financial reporting.
|
|
•
|
Other factors, risks and uncertainties detailed from time to time in Visteon’s Securities and Exchange Commission filings.
|
50
|
Item 7A.
|
Quantitative and Qualitative Disclosures About Market Risk
|
The primary market risks to which the Company is exposed include changes in foreign currency exchange rates, interest rates and certain commodity prices. The Company manages these risks through derivative instruments and various operating actions including fixed price contracts with suppliers and cost sourcing arrangements with customers. The Company's use of derivative instruments is limited to hedging activities and such instruments are not used for speculative or trading purposes, as per clearly defined risk management policies. Additionally, the Company's use of derivative instruments creates exposure to credit loss in the event of nonperformance by the counter-party to the derivative financial instruments. The Company limits this exposure by entering into agreements directly with a variety of major financial institutions with high credit standards and that are expected to fully satisfy their obligations under the contracts. Additionally, the Company's ability to utilize derivatives to manage market risk is dependent on credit conditions and market conditions given the current economic environment.
Foreign Currency Risk
The Company's net cash inflows and outflows exposed to the risk of changes in exchange rates arise from the sale of products in countries other than the manufacturing source, foreign currency denominated supplier payments, debt and other payables, subsidiary dividends and investments in subsidiaries. Where possible, the Company utilizes derivative financial instruments to manage foreign currency exchange rate risks. Forward and option contracts may be utilized to protect the Company's cash flow from adverse movements in exchange rates. Foreign currency exposures are reviewed periodically and any natural offsets are considered prior to entering into a derivative financial instrument. The Company's primary hedged operating exposures include the Euro, Korean Won, Czech Koruna, Hungarian Forint, Indian Rupee and Mexican Peso. Where possible, the Company utilizes a strategy of partial coverage for transactions in these currencies. As of December 31, 2013, the net fair value of foreign currency forward contracts was an asset of $4 million while at December 31, 2012, the net fair value of forward contracts was an asset of $21 million.
The hypothetical pre-tax gain or loss in fair value from a 10% favorable or adverse change in quoted currency exchange rates would be approximately $63 million and $55 million as of December 31, 2013 and 2012, respectively. These estimated changes assume a parallel shift in all currency exchange rates and include the gain or loss on financial instruments used to hedge loans to subsidiaries. Because exchange rates typically do not all move in the same direction, the estimate may overstate the impact of changing exchange rates on the net fair value of the Company's financial derivatives. It is also important to note that gains and losses indicated in the sensitivity analysis would generally be offset by gains and losses on the underlying exposures being hedged.
In addition to the transactional exposure described above, the Company's operating results are impacted by the translation of its foreign operating income into U.S. dollars. The Company does not enter into foreign exchange contracts to mitigate this exposure.
Interest Rate Risk
The Company is subject to interest rate risk, principally in relation to fixed rate debt. The Company may use derivative financial instruments to manage exposure to fluctuations in interest rates. However, as of December 31, 2013, the Company had no outstanding interest rate derivative instruments.
Prior to the April 6, 2011 Term Loan refinancing, the Company was subject to interest rate risk, principally in relation to variable rate debt. During the fourth quarter of 2010, the Company entered into an interest rate swap with a notional amount of $250 million related to the Term Loan. These swaps effectively converted designated cash flows associated with underlying interest payments on the Term Loan from a variable interest rate to a fixed interest rate and were designated as cash flow hedges. In conjunction with the term loan refinance, the Company terminated its outstanding interest rate swaps, which were settled for a loss of less than $1 million.
Approximately 58% and 85% of the Company's borrowings were effectively on a fixed rate basis as of December 31, 2013 and December 31, 2012, respectively. The Company continues to evaluate its interest rate exposure and may use swaps or other derivative instruments again in the future.
Commodity Risk
The Company's exposures to market risk from changes in the price of production material are managed primarily through negotiations with suppliers and customers, although there can be no assurance that the Company will recover all such costs. The Company continues to evaluate derivatives available in the marketplace and may decide to utilize derivatives in the future to manage select commodity risks if an acceptable hedging instrument is identified for the Company's exposure level at that time, as well as the effectiveness of the financial hedge among other factors.
51
|
Item 8.
|
Financial Statements and Supplementary Data
|
Visteon Corporation and Subsidiaries
Index to Consolidated Financial Statements
|
Page No.
|
|
52
MANAGEMENT’S REPORT ON INTERNAL CONTROL OVER FINANCIAL REPORTING
Management is responsible for establishing and maintaining adequate internal control over financial reporting as such term is defined under Rule 13a-15(f) of the Securities Exchange Act of 1934. Under the supervision and with the participation of the principal executive and financial officers of the Company, an evaluation of the effectiveness of internal control over financial reporting was conducted based on the framework in
Internal Control – Integrated Framework
issued by the Committee of Sponsoring Organizations (“the COSO 1992 Framework”) of the Treadway Commission.
During November 2013, Visteon Corporation acquired an additional 11% ownership interest in Yanfeng Visteon Automotive Electronics Co., Ltd. (“YFVE”) resulting in a 51% controlling equity interest. Accordingly, management excluded YFVE from its assessment of the effectiveness of the Company's internal control over financial reporting as of December 31, 2013. YFVE represented approximately 8% of the Company's assets as of December 31, 2013 and less than 1% of net sales for the year ended December 31, 2013.
Based on the evaluation performed under the COSO 1992 Framework as of December 31, 2013 and excluding YFVE, management has concluded that the Company’s internal control over financial reporting is effective.
Ernst & Young LLP, an independent registered public accounting firm, has audited the effectiveness of the Company’s internal control over financial reporting as of December 31, 2013, as stated in their report which is included herein.
53
Report of Independent Registered Public Accounting Firm
The Board of Directors and Shareholders
Visteon Corporation
We have audited Visteon Corporation's internal control over financial reporting as of December 31, 2013, based on criteria established in Internal Control-Integrated Framework issued by the Committee of Sponsoring Organizations of the Treadway Commission (1992 framework) (the COSO criteria). Visteon Corporation's management is responsible for maintaining effective internal control over financial reporting, and for its assessment of the effectiveness of internal control over financial reporting included in the accompanying Management's Report on Internal Control over Financial Reporting. Our responsibility is to express an opinion on the Company's internal control over financial reporting based on our audit.
We conducted our audit in accordance with the standards of the Public Company Accounting Oversight Board (United States). Those standards require that we plan and perform the audit to obtain reasonable assurance about whether effective internal control over financial reporting was maintained in all material respects. Our audit included obtaining an understanding of internal control over financial reporting, assessing the risk that a material weakness exists, testing and evaluating the design and operating effectiveness of internal control based on the assessed risk, and performing such other procedures as we considered necessary in the circumstances. We believe that our audit provides a reasonable basis for our opinion.
A company's internal control over financial reporting is a process designed to provide reasonable assurance regarding the reliability of financial reporting and the preparation of financial statements for external purposes in accordance with generally accepted accounting principles. A company's internal control over financial reporting includes those policies and procedures that (1) pertain to the maintenance of records that, in reasonable detail, accurately and fairly reflect the transactions and dispositions of the assets of the company; (2) provide reasonable assurance that transactions are recorded as necessary to permit preparation of financial statements in accordance with generally accepted accounting principles, and that receipts and expenditures of the company are being made only in accordance with authorizations of management and directors of the company; and (3) provide reasonable assurance regarding prevention or timely detection of unauthorized acquisition, use, or disposition of the company's assets that could have a material effect on the financial statements.
Because of its inherent limitations, internal control over financial reporting may not prevent or detect misstatements. Also, projections of any evaluation of effectiveness to future periods are subject to the risk that controls may become inadequate because of changes in conditions, or that the degree of compliance with the policies or procedures may deteriorate.
As indicated in the accompanying Management’s Report on Internal Control Over Financial Reporting, management’s assessment of and conclusion on the effectiveness of internal control over financial reporting did not include the internal controls of the fourth quarter acquired business of Yangfeng Visteon Automotive Electronics Co., LTD. (“YFVE”), which is included in the consolidated financial statements of Visteon Corporation and constituted 8% of total assets as of December 31, 2013 and less than 1% of sales, respectively, for the year then ended. Our audit of internal control over financial reporting of Visteon Corporation also did not include an evaluation of the internal control over financial reporting of the internal controls of financial reporting of YFVE.
In our opinion, Visteon Corporation maintained, in all material respects, effective internal control over financial reporting as of December 31, 2013, based on the COSO criteria.
We also have audited, in accordance with the standards of the Public Company Accounting Oversight Board (United States), the consolidated balance sheets of Visteon Corporation as of December 31, 2013 and 2012, and the related consolidated statements of operations, comprehensive income, changes in equity, and cash flows for the years then ended and our report dated February 25, 2014 expressed an unqualified opinion thereon.
/s/ Ernst & Young LLP
Detroit, Michigan
February 25, 2014
54
Report of Independent Registered Public Accounting Firm
The Board of Directors and Shareholders
Visteon Corporation
We have audited the accompanying consolidated balance sheets of Visteon Corporation as of December 31, 2013 and 2012, and the related consolidated statements of operations, comprehensive income, changes in equity, and cash flows for the years then ended. Our audits also included the 2013 and 2012 amounts in the financial statement schedule included in Item 15(a)(2). These financial statements and schedule are the responsibility of the Company's management. Our responsibility is to express an opinion on these financial statements and schedule based on our audits.
We conducted our audits in accordance with the standards of the Public Company Accounting Oversight Board (United States). Those standards require that we plan and perform the audit to obtain reasonable assurance about whether the financial statements are free of material misstatement. An audit includes examining, on a test basis, evidence supporting the amounts and disclosures in the financial statements. An audit also includes assessing the accounting principles used and significant estimates made by management, as well as evaluating the overall financial statement presentation. We believe that our audits provide a reasonable basis for our opinion.
In our opinion, the financial statements referred to above present fairly, in all material respects, the consolidated financial position of Visteon Corporation at December 31, 2013 and 2012, and the consolidated results of its operations and its cash flows for the years then ended, in conformity with U.S. generally accepted accounting principles. Also, in our opinion, the related financial statement schedule, when considered in relation to the basic financial statements as a whole, presents fairly in all material respects the information set forth therein for the years ended December 31, 2013 and 2012.
We also have audited, in accordance with the standards of the Public Company Accounting Oversight Board (United States), Visteon Corporation's internal control over financial reporting as of December 31, 2013, based on criteria established in Internal Control-Integrated Framework issued by the Committee of Sponsoring Organizations of the Treadway Commission (1992 framework) and our report dated February 25, 2014 expressed an unqualified opinion thereon.
/s/ Ernst & Young LLP
Detroit, Michigan
February 25, 2014
55
Report of Independent Registered Public Accounting Firm
To The Board of Directors and Shareholders of Visteon Corporation
In our opinion, the accompanying consolidated statements of operations, comprehensive income, shareholders’ equity (deficit) and cash flows for the year ended December 31, 2011 present fairly, in all material respects, the results of operations and cash flows of Visteon Corporation and its subsidiaries for the year ended December 31, 2011 in conformity with accounting principles generally accepted in the United States of America. In addition, in our opinion, the financial statement schedule listed in the index appearing under Item 15 (a) (2) for the year ended December 31, 2011 presents fairly, in all material respects, the information set forth therein when read in conjunction with the related consolidated financial statements. The Company's management is responsible for these financial statements and financial statement schedule. Our responsibility is to express an opinion on these financial statements and financial statement schedule based on our audit. We conducted our audit in accordance with the standards of the Public Company Accounting Oversight Board (United States). Those standards require that we plan and perform the audit to obtain reasonable assurance about whether the financial statements are free of material misstatement. Our audit of the financial statements included examining, on a test basis, evidence supporting the amounts and disclosures in the financial statements, assessing the accounting principles used and significant estimates made by management, and evaluating the overall financial statement presentation. Our audit also included performing such other procedures as we considered necessary in the circumstances. We believe that our audit provides a reasonable basis for our opinion.
/s/ PricewaterhouseCoopers LLP
Detroit, Michigan
February 27, 2012, except with respect to the effects of the presentation of discontinued operations and the adoption of the new comprehensive income disclosures discussed in Note 2, as to which the date is May 2, 2012, the change in the presentation of the segment disclosures as discussed in Note 19, as to which the date is February 28, 2013 and the change in the corporate cost allocation methodology for segment reporting as discussed in Note 19, as to which the date is February 25, 2014.
56
VISTEON CORPORATION AND SUBSIDIARIES
|
Year Ended December 31
|
|||||||||||
|
2013
|
2012
|
2011
|
|||||||||
|
(Dollars in Millions, Except Per Share Amounts)
|
|||||||||||
|
Sales
|
$
|
7,439
|
|
$
|
6,857
|
|
$
|
7,532
|
|
||
|
Cost of sales
|
6,755
|
|
6,268
|
|
6,914
|
|
|||||
|
Gross margin
|
684
|
|
589
|
|
618
|
|
|||||
|
Selling, general and administrative expenses
|
367
|
|
369
|
|
387
|
|
|||||
|
Equity in net income of non-consolidated affiliates
|
213
|
|
226
|
|
168
|
|
|||||
|
Restructuring expense
|
39
|
|
79
|
|
24
|
|
|||||
|
Interest expense
|
47
|
|
49
|
|
48
|
|
|||||
|
Interest income
|
8
|
|
14
|
|
21
|
|
|||||
|
Gain on Yanfeng transactions
|
465
|
|
—
|
|
—
|
|
|||||
|
Other expense, net
|
35
|
|
41
|
|
11
|
|
|||||
|
Income before income taxes
|
882
|
|
291
|
|
337
|
|
|||||
|
Provision for income taxes
|
107
|
|
121
|
|
127
|
|
|||||
|
Net income from continuing operations
|
775
|
|
170
|
|
210
|
|
|||||
|
Loss from discontinued operations, net of tax
|
—
|
|
(3
|
)
|
(56
|
)
|
|||||
|
Net income
|
775
|
|
167
|
|
154
|
|
|||||
|
Net income attributable to non-controlling interests
|
85
|
|
67
|
|
74
|
|
|||||
|
Net income attributable to Visteon Corporation
|
$
|
690
|
|
$
|
100
|
|
$
|
80
|
|
||
|
Basic earnings (loss) per share
|
|||||||||||
|
Continuing operations
|
$
|
13.80
|
|
$
|
1.95
|
|
$
|
2.65
|
|
||
|
Discontinued operations
|
—
|
|
(0.06
|
)
|
(1.09
|
)
|
|||||
|
Basic earnings per share attributable to Visteon Corporation
|
$
|
13.80
|
|
$
|
1.89
|
|
$
|
1.56
|
|
||
|
Diluted earnings (loss) per share
|
|||||||||||
|
Continuing operations
|
$
|
13.50
|
|
$
|
1.93
|
|
$
|
2.62
|
|
||
|
Discontinued operations
|
—
|
|
(0.05
|
)
|
(1.08
|
)
|
|||||
|
Diluted earnings per share attributable to Visteon Corporation
|
$
|
13.50
|
|
$
|
1.88
|
|
$
|
1.54
|
|
||
See accompanying notes to the consolidated financial statements.
57
VISTEON CORPORATION AND SUBSIDIARIES
CONSOLIDATED STATEMENTS OF COMPREHENSIVE INCOME
|
Year Ended December 31
|
|||||||||||
|
2013
|
2012
|
2011
|
|||||||||
|
(Dollars in Millions)
|
|||||||||||
|
Net income
|
$
|
775
|
|
$
|
167
|
|
$
|
154
|
|
||
|
Other comprehensive income (loss)
|
|||||||||||
|
Foreign currency translation adjustments
|
(47
|
)
|
73
|
|
(53
|
)
|
|||||
|
Benefit plans, net of tax
(a)
|
131
|
|
(134
|
)
|
(26
|
)
|
|||||
|
Unrealized hedging (loss) gains and other, net of tax
(b)
|
(10
|
)
|
22
|
|
(9
|
)
|
|||||
|
Other comprehensive income (loss), net of tax
|
74
|
|
(39
|
)
|
(88
|
)
|
|||||
|
Comprehensive income
|
849
|
|
128
|
|
66
|
|
|||||
|
Comprehensive income attributable to non-controlling interests
|
81
|
|
93
|
|
61
|
|
|||||
|
Comprehensive income attributable to Visteon Corporation
|
$
|
768
|
|
$
|
35
|
|
$
|
5
|
|
||
(a)
Other comprehensive income (loss) is net of a tax benefit of
$4 million
,
$11 million
and
$0 million
related to benefit plans for the year ended December 31, 2013, 2012 and 2011, respectively.
(b)
Other comprehensive income (loss) is net of a tax benefit of
$3 million
for the year ended December 31, 2013 and tax expense of
$6 million
and
$2 million
related to unrecognized hedging gains (loss) and other for the years ended December 31, 2012 and 2011, respectively.
See accompanying notes to the consolidated financial statements.
58
VISTEON CORPORATION AND SUBSIDIARIES
|
December 31
|
|||||||
|
2013
|
2012
|
||||||
|
(Dollars in Millions)
|
|||||||
|
ASSETS
|
|||||||
|
Cash and equivalents
|
$
|
1,677
|
|
$
|
825
|
|
|
|
Restricted cash
|
25
|
|
20
|
|
|||
|
Accounts receivable, net
|
1,227
|
|
1,162
|
|
|||
|
Inventories, net
|
472
|
|
385
|
|
|||
|
Other current assets
|
352
|
|
271
|
|
|||
|
Total current assets
|
3,753
|
|
2,663
|
|
|||
|
Property and equipment, net
|
1,414
|
|
1,326
|
|
|||
|
Investments in non-consolidated affiliates
|
228
|
|
756
|
|
|||
|
Intangible assets, net
|
447
|
|
332
|
|
|||
|
Other non-current assets
|
185
|
|
79
|
|
|||
|
Total assets
|
$
|
6,027
|
|
$
|
5,156
|
|
|
|
LIABILITIES AND EQUITY
|
|||||||
|
Short-term debt, including current portion of long-term debt
|
$
|
106
|
|
$
|
96
|
|
|
|
Accounts payable
|
1,232
|
|
1,027
|
|
|||
|
Accrued employee liabilities
|
202
|
|
175
|
|
|||
|
Other current liabilities
|
262
|
|
254
|
|
|||
|
Total current liabilities
|
1,802
|
|
1,552
|
|
|||
|
Long-term debt
|
624
|
|
473
|
|
|||
|
Employee benefits
|
440
|
|
571
|
|
|||
|
Deferred tax liabilities
|
137
|
|
181
|
|
|||
|
Other non-current liabilities
|
151
|
|
238
|
|
|||
|
Stockholders’ equity:
|
|||||||
|
Preferred stock (par value $0.01, 50 million shares authorized, none outstanding at December 31, 2013 and 2012)
|
—
|
|
—
|
|
|||
|
Common stock (par value $0.01, 250 million shares authorized, 54 million and 54 million shares issued, 48 million and 52 million shares outstanding at December 31, 2013 and 2012, respectively)
|
1
|
|
1
|
|
|||
|
Stock warrants
|
6
|
|
10
|
|
|||
|
Additional paid-in capital
|
1,291
|
|
1,269
|
|
|||
|
Retained earnings
|
956
|
|
266
|
|
|||
|
Accumulated other comprehensive loss
|
(12
|
)
|
(90
|
)
|
|||
|
Treasury stock
|
(322
|
)
|
(71
|
)
|
|||
|
Total Visteon Corporation stockholders’ equity
|
1,920
|
|
1,385
|
|
|||
|
Non-controlling interests
|
953
|
|
756
|
|
|||
|
Total equity
|
2,873
|
|
2,141
|
|
|||
|
Total liabilities and equity
|
$
|
6,027
|
|
$
|
5,156
|
|
|
See accompanying notes to the consolidated financial statements.
59
VISTEON CORPORATION AND SUBSIDIARIES
|
Year Ended December 31
|
|||||||||||
|
2013
|
2012
|
2011
|
|||||||||
|
(Dollars in Millions)
|
|||||||||||
|
Operating Activities
|
|||||||||||
|
Net income
|
$
|
775
|
|
$
|
167
|
|
$
|
154
|
|
||
|
Adjustments to reconcile net income to net cash provided from operating activities:
|
|||||||||||
|
Depreciation and amortization
|
262
|
|
259
|
|
316
|
|
|||||
|
Asset impairments
|
—
|
|
24
|
|
66
|
|
|||||
|
Equity in net income of non-consolidated affiliates, net of dividends remitted
|
(26
|
)
|
(122
|
)
|
(122
|
)
|
|||||
|
Stock-based compensation
|
15
|
|
25
|
|
39
|
|
|||||
|
Gain on Yanfeng transactions and sale of other joint ventures
|
(470
|
)
|
(19
|
)
|
—
|
|
|||||
|
Other non-cash items
|
6
|
|
26
|
|
20
|
|
|||||
|
Changes in assets and liabilities:
|
|||||||||||
|
Accounts receivable
|
(21
|
)
|
(38
|
)
|
(110
|
)
|
|||||
|
Inventories
|
(49
|
)
|
(26
|
)
|
(33
|
)
|
|||||
|
Accounts payable
|
97
|
|
(26
|
)
|
(25
|
)
|
|||||
|
Accrued income taxes
|
(54
|
)
|
10
|
|
1
|
|
|||||
|
Other assets and other liabilities
|
(223
|
)
|
(41
|
)
|
(131
|
)
|
|||||
|
Net cash provided from operating activities
|
312
|
|
239
|
|
175
|
|
|||||
|
Investing Activities
|
|||||||||||
|
Capital expenditures
|
(269
|
)
|
(229
|
)
|
(258
|
)
|
|||||
|
Proceeds from asset sales and business divestitures
|
977
|
|
191
|
|
14
|
|
|||||
|
Payments to acquire interests in joint venture
|
(48
|
)
|
—
|
|
(29
|
)
|
|||||
|
Cash acquired in consolidation of YFVE
|
38
|
|
—
|
|
—
|
|
|||||
|
Joint venture deconsolidation
|
—
|
|
—
|
|
(52
|
)
|
|||||
|
Other
|
—
|
|
(2
|
)
|
(6
|
)
|
|||||
|
Net cash provided from (used by) investing activities
|
698
|
|
(40
|
)
|
(331
|
)
|
|||||
|
Financing Activities
|
|||||||||||
|
Short-term debt, net
|
(20
|
)
|
5
|
|
17
|
|
|||||
|
Cash restriction, net
|
—
|
|
—
|
|
51
|
|
|||||
|
Proceeds from issuance of debt, net of issuance costs
|
204
|
|
831
|
|
503
|
|
|||||
|
Principal payments on debt
|
(6
|
)
|
(824
|
)
|
(513
|
)
|
|||||
|
Repurchase of common stock
|
(250
|
)
|
(50
|
)
|
—
|
|
|||||
|
Repurchase of long-term notes
|
(52
|
)
|
(52
|
)
|
—
|
|
|||||
|
Proceeds from rights offering, net of issuance costs
|
—
|
|
—
|
|
(33
|
)
|
|||||
|
Dividends paid to non-controlling interests
|
(22
|
)
|
(27
|
)
|
(31
|
)
|
|||||
|
Other
|
5
|
|
2
|
|
3
|
|
|||||
|
Net cash used by financing activities
|
(141
|
)
|
(115
|
)
|
(3
|
)
|
|||||
|
Effect of exchange rate changes on cash and equivalents
|
(17
|
)
|
18
|
|
(23
|
)
|
|||||
|
Net increase (decrease) in cash and equivalents
|
852
|
|
102
|
|
(182
|
)
|
|||||
|
Cash and equivalents at beginning of the year
|
825
|
|
723
|
|
905
|
|
|||||
|
Cash and equivalents at end of the year
|
$
|
1,677
|
|
$
|
825
|
|
$
|
723
|
|
||
|
Supplemental Disclosures:
|
|||||||||||
|
Cash paid for interest
|
$
|
43
|
|
$
|
48
|
|
$
|
51
|
|
||
|
Cash paid for income taxes, net of refunds
|
$
|
291
|
|
$
|
133
|
|
$
|
127
|
|
||
See accompanying notes to the consolidated financial statements.
60
VISTEON CORPORATION AND SUBSIDIARIES
CONSOLIDATED STATEMENTS OF CHANGES IN EQUITY
|
Total Visteon Corporation Stockholders' Equity
|
|||||||||||||||||||||||||||||||||||
|
Common
Stock
|
Stock
Warrants
|
Additional
Paid-In
Capital
|
Retained
Earnings
|
Accumulated
Other
Comprehensive
Income (Loss)
|
Treasury
Stock
|
Total Visteon Corporation Stockholders' Equity
|
Non-Controlling Interests
|
Total Equity
|
|||||||||||||||||||||||||||
|
(Dollars in Millions)
|
|||||||||||||||||||||||||||||||||||
|
Balance at December 31, 2010
|
$
|
1
|
|
$
|
29
|
|
$
|
1,099
|
|
$
|
86
|
|
$
|
50
|
|
$
|
(5
|
)
|
$
|
1,260
|
|
$
|
690
|
|
$
|
1,950
|
|
||||||||
|
Net income
|
—
|
|
—
|
|
—
|
|
80
|
|
—
|
|
—
|
|
80
|
|
74
|
|
154
|
|
|||||||||||||||||
|
Other comprehensive (loss) income
|
—
|
|
—
|
|
—
|
|
—
|
|
(75
|
)
|
—
|
|
(75
|
)
|
(13
|
)
|
(88
|
)
|
|||||||||||||||||
|
Stock-based compensation, net
|
—
|
|
—
|
|
41
|
|
—
|
|
—
|
|
(8
|
)
|
33
|
|
—
|
|
33
|
|
|||||||||||||||||
|
Warrant exercises
|
—
|
|
(16
|
)
|
25
|
|
—
|
|
—
|
|
—
|
|
9
|
|
—
|
|
9
|
|
|||||||||||||||||
|
Cash Dividends
|
—
|
|
—
|
|
—
|
|
—
|
|
—
|
|
—
|
|
—
|
|
(32
|
)
|
(32
|
)
|
|||||||||||||||||
|
Deconsolidation
|
—
|
|
—
|
|
—
|
|
—
|
|
—
|
|
—
|
|
—
|
|
(29
|
)
|
(29
|
)
|
|||||||||||||||||
|
Balance at December 31, 2011
|
$
|
1
|
|
$
|
13
|
|
$
|
1,165
|
|
$
|
166
|
|
$
|
(25
|
)
|
$
|
(13
|
)
|
$
|
1,307
|
|
$
|
690
|
|
$
|
1,997
|
|
||||||||
|
Net income
|
—
|
|
—
|
|
—
|
|
100
|
|
—
|
|
—
|
|
100
|
|
67
|
|
167
|
|
|||||||||||||||||
|
Other comprehensive (loss) income
|
—
|
|
—
|
|
—
|
|
—
|
|
(65
|
)
|
—
|
|
(65
|
)
|
26
|
|
(39
|
)
|
|||||||||||||||||
|
Stock-based compensation, net
|
—
|
|
—
|
|
26
|
|
—
|
|
—
|
|
(8
|
)
|
18
|
|
—
|
|
18
|
|
|||||||||||||||||
|
Repurchase of shares of common stock
|
—
|
|
—
|
|
—
|
|
—
|
|
—
|
|
(50
|
)
|
(50
|
)
|
—
|
|
(50
|
)
|
|||||||||||||||||
|
Warrant exercises
|
—
|
|
(3
|
)
|
5
|
|
—
|
|
—
|
|
—
|
|
2
|
|
—
|
|
2
|
|
|||||||||||||||||
|
Cash dividends
|
—
|
|
—
|
|
—
|
|
—
|
|
—
|
|
—
|
|
—
|
|
(27
|
)
|
(27
|
)
|
|||||||||||||||||
|
Common Stock contribution to U.S. pension plans
|
—
|
|
—
|
|
73
|
|
—
|
|
—
|
|
—
|
|
73
|
|
—
|
|
73
|
|
|||||||||||||||||
|
Balance at December 31, 2012
|
$
|
1
|
|
$
|
10
|
|
$
|
1,269
|
|
$
|
266
|
|
$
|
(90
|
)
|
$
|
(71
|
)
|
$
|
1,385
|
|
$
|
756
|
|
$
|
2,141
|
|
||||||||
|
Net income
|
—
|
|
—
|
|
—
|
|
690
|
|
—
|
|
—
|
|
690
|
|
85
|
|
775
|
|
|||||||||||||||||
|
Other comprehensive income (loss)
|
—
|
|
—
|
|
—
|
|
—
|
|
78
|
|
—
|
|
78
|
|
(4
|
)
|
74
|
|
|||||||||||||||||
|
Stock-based compensation, net
|
—
|
|
—
|
|
15
|
|
—
|
|
—
|
|
(1
|
)
|
14
|
|
—
|
|
14
|
|
|||||||||||||||||
|
Repurchase of shares of common stock
|
—
|
|
—
|
|
—
|
|
—
|
|
—
|
|
(250
|
)
|
(250
|
)
|
—
|
|
(250
|
)
|
|||||||||||||||||
|
Warrant exercises
|
—
|
|
(4
|
)
|
7
|
|
—
|
|
—
|
|
—
|
|
3
|
|
—
|
|
3
|
|
|||||||||||||||||
|
Cash dividends
|
—
|
|
—
|
|
—
|
|
—
|
|
—
|
|
—
|
|
—
|
|
(22
|
)
|
(22
|
)
|
|||||||||||||||||
|
Acquisition of business
|
—
|
|
—
|
|
—
|
|
—
|
|
—
|
|
—
|
|
—
|
|
138
|
|
138
|
|
|||||||||||||||||
|
Balance at December 31, 2013
|
$
|
1
|
|
$
|
6
|
|
$
|
1,291
|
|
$
|
956
|
|
$
|
(12
|
)
|
$
|
(322
|
)
|
$
|
1,920
|
|
$
|
953
|
|
$
|
2,873
|
|
||||||||
See accompanying notes to the consolidated financial statements.
61
VISTEON CORPORATION AND SUBSIDIARIES
NOTES TO CONSOLIDATED FINANCIAL STATEMENTS
Visteon Corporation (the “Company” or “Visteon”) is a global supplier of automotive systems, modules and components to global automotive original equipment manufacturers (“OEMs”). The Company’s operations are organized by global product lines including Climate, Electronics and Interiors and are conducted through a network of manufacturing operations, technical centers and joint ventures in every major geographic region of the world.
Basis of Presentation:
The Company's financial statements have been prepared in conformity with accounting principles generally accepted in the United States ("GAAP") on a going concern basis, which contemplates the continuity of operations, realization of assets and satisfaction of liabilities in the normal course of business.
Principles of Consolidation:
The consolidated financial statements include the accounts of the Company and its subsidiaries that are more than 50% owned and over which the Company exercises control. Investments in affiliates of greater than 20% and for which the Company does not exercise control, but does have the ability to exercise significant influence over operating and financial policies, are accounted for using the equity method. All other investments in non-consolidated affiliates are accounted for using the cost method.
Use of Estimates:
The preparation of financial statements in conformity with GAAP requires management to make estimates and assumptions that affect amounts reported herein. Considerable judgment is involved in making these determinations and the use of different estimates or assumptions could result in significantly different results. Management believes its assumptions and estimates are reasonable and appropriate. However, actual results could differ from those reported herein.
Reclassifications:
Certain prior period amounts have been reclassified to conform to current period presentation.
Revenue Recognition:
The Company records revenue when persuasive evidence of an arrangement exists, delivery occurs or services are rendered, the sales price or fee is fixed or determinable and collectibility is reasonably assured. The Company delivers products and records revenue pursuant to commercial agreements with its customers generally in the form of an approved purchase order, including the effects of contractual customer price productivity. The Company does negotiate discrete price changes with its customers, which are generally the result of unique commercial issues between the Company and its customers. The Company records amounts associated with discrete price changes as a reduction to revenue when specific facts and circumstances indicate that a price reduction is probable and the amounts are reasonably estimable. The Company records amounts associated with discrete price changes as an increase to revenue upon execution of a legally enforceable contractual agreement and when collectibility is reasonably assured.
Foreign Currency:
Assets and liabilities of the Company’s non-U.S. businesses are translated into U.S. Dollars at end-of-period exchange rates and the related translation adjustments are recorded in Accumulated other comprehensive loss in the consolidated balance sheets. The effects of remeasuring assets and liabilities of the Company’s non-U.S. businesses that use the U.S. Dollar as their functional currency are recorded as transaction gains and losses in the consolidated statements of operations. Income and expense accounts of the Company’s non-U.S. businesses are translated into U.S. Dollars at average-period exchange rates and are reflected in the consolidated statements of operations. Additionally, gains and losses resulting from transactions denominated in a currency other than the functional currency are recorded as transaction gains and losses in the consolidated statements of operations. Net transaction gains and losses increased net income by
$4 million
for the year ended December 31, 2013, but decreased net income by
$5 million
and
$4 million
in the years ended December 31, 2012 and 2011, respectively.
Restructuring Expense:
The Company defines restructuring expense to include costs directly associated with exit or disposal activities. Such costs include employee severance and termination benefits, special termination benefits, contract termination fees and penalties, and other exit or disposal costs. In general, the Company records involuntary employee-related exit and disposal costs when there is a substantive plan for employee severance and related costs are probable and estimable, with the exception of one-time termination benefits and employee retention costs, which are recorded when the employees are entitled to receive such benefits and the amount can be reasonably estimated. Contract termination fees and penalties and other exit and disposal costs are generally recorded when incurred.
Debt Issuance Costs:
The costs related to issuance or modification of long-term debt are deferred and amortized into interest expense over the life of each respective debt issue. Deferred amounts associated with debt extinguished prior to maturity are expensed upon extinguishment.
62
Other Costs:
Repair and maintenance costs, research and development costs, and pre-production operating costs are expensed as incurred. Research and development expenses include salary and related employee benefits, contractor fees, information technology, occupancy, telecommunications and depreciation. Research and development costs were
$325 million
in 2013,
$299 million
in 2012, and
$326 million
in 2011. Shipping and handling costs are recorded in the Company's consolidated statements of operations as "Cost of sales."
Net Income (Loss) Per Share Attributable to Visteon:
The Company uses the two-class method in computing basic and diluted earnings per share. Basic earnings per share is calculated by dividing net income attributable to Visteon, after deducting undistributed income allocated to participating securities, by the average number of shares of common stock outstanding. Diluted earnings per share is computed by dividing net income by the average number of common and potential dilutive common shares outstanding after deducting undistributed income allocated to participating securities. Performance based share units are considered contingently issuable shares, and are included in the computation of diluted earnings per share if their conditions have been satisfied as if the reporting date was the end of the contingency period.
Cash and Equivalents:
The Company considers all highly liquid investments purchased with a maturity of three months or less, including short-term time deposits, commercial paper, repurchase agreements and money market funds to be cash equivalents.
Restricted Cash:
Restricted cash represents amounts designated for uses other than current operations and includes
$10 million
related to the Letter of Credit Reimbursement and Security Agreement, and
$15 million
related to cash collateral for other corporate purposes at December 31, 2013.
Accounts Receivable:
Accounts receivable are stated at amounts estimated by management to be the net realizable value. An allowance for doubtful accounts is recorded when it is probable amounts will not be collected based on specific identification of customer circumstances or age of the receivable. The allowance for doubtful accounts balance was
$7 million
at both December 31, 2013 and December 31, 2012. Included in Selling, general and administrative expenses are provisions for estimated uncollectible accounts receivable of less than
$1 million
,
$3 million
, and
$8 million
for the years ended December 31, 2013 and 2012, and 2011.
Inventories:
Inventories are stated at the lower of cost, determined on a first-in, first-out (“FIFO”) basis, or market. Cost includes the cost of materials, direct labor, in-bound freight and the applicable share of manufacturing overhead. Inventories are reduced by an allowance for excess and obsolete inventories based on management’s review of on-hand inventories compared to historical and estimated future sales and usage.
Product Tooling:
Product tooling includes molds, dies and other tools used in production of a specific part or parts of the same basic design. It is generally required that non-reimbursable design and development costs for products to be sold under long-term supply arrangements be expensed as incurred and costs incurred for molds, dies and other tools that will be owned by the Company or its customers and used in producing the products under long-term supply arrangements be capitalized and amortized over the shorter of the expected useful life of the assets or the term of the supply arrangement. Contractually reimbursable design and development costs that would otherwise be expensed are recorded as an asset as incurred. Product tooling owned by the Company is capitalized as property and equipment and is amortized to cost of sales over its estimated economic life, generally not exceeding six years.The Company had receivables of
$53 million
and
$36 million
as of December 31, 2013 and 2012, respectively, related to production tools in progress, which will not be owned by the Company and for which there is a contractual agreement for reimbursement from the customer.
Property and Equipment:
Property and equipment is stated at cost or fair value for impaired assets. As a result of the adoption of fresh-start accounting, property and equipment was re-measured and adjusted to estimated fair value as of October 1, 2010. Depreciation expense is computed principally by the straight-line method over estimated useful lives for financial reporting purposes and by accelerated methods for income tax purposes in certain jurisdictions. Certain costs incurred in the acquisition or development of software for internal use are capitalized. Capitalized software costs are amortized using the straight-line method over estimated useful lives generally ranging from
3
to
8
years. The net book value of capitalized software costs was approximately
$5 million
and
$13 million
at December 31, 2013 and 2012, respectively. Related amortization expense was approximately
$6 million
for the years ended December 31, 2013, 2012 and 2011. Amortization expense of approximately
$2 million
,
$2 million
and
$1 million
is expected for the annual periods ended December 31, 2014, 2015 and 2016, respectively.
Asset impairment charges are recorded when events and circumstances indicate that such assets may not be recoverable and the undiscounted net cash flows estimated to be generated by those assets are less than their carrying amounts. If estimated future undiscounted cash flows are not sufficient to recover the carrying value of the assets, an impairment charge is recorded for the amount by which the carrying value of the assets exceeds fair value. The Company classifies assets and liabilities as held for sale when management approves and commits to a formal plan of sale, generally following board of director approval, and it is probable
63
that the sale will be completed within one year. The carrying value of assets and liabilities held for sale is recorded at the lower of carrying value or fair value less cost to sell, and the recording of depreciation is ceased. For impairment purposes, fair value is determined using appraisals, management estimates or discounted cash flow calculations.
Goodwill and Intangible Assets:
The Company performs either a qualitative or quantitative assessment of goodwill for impairment on an annual basis. Goodwill impairment testing is performed at the reporting unit level. The qualitative assessment considers several factors at the reporting unit level including the excess of fair value over carrying value as of the last quantitative impairment test, the length of time since the last fair value measurement, the current carrying value, market and industry metrics, actual performance compared to forecast performance, and the Company's current outlook on the business. If the qualitative assessment indicates it is more likely than not that goodwill is impaired, the reporting unit is quantitatively tested for impairment. To quantitatively test goodwill for impairment, the fair value of each reporting unit is determined and compared to the carrying value. If the carrying value exceeds the fair value, then impairment may exist and further evaluation is required.
Other indefinite-lived intangible assets are subject to impairment analysis annually or more frequently if an event occurs or circumstances indicate the carrying amount may be impaired. Indefinite-lived intangible assets are tested for impairment by comparing the fair value to the carrying value. If the carrying value exceeds the fair value, the asset is adjusted to fair value. Other definite-lived intangible assets are amortized over their estimated useful lives, and tested for impairment in accordance with the methodology discussed above under "Property and Equipment."
Product Warranty:
The Company accrues for warranty obligations at the time of sale based on management estimates, with input from sales, engineering, quality and legal functions, of the amount that eventually will be required to settle such obligations. This accrual is based on several factors, including contractual arrangements, past experience, current claims, production changes, industry developments and various other considerations. Product warranty liabilities are reviewed on a regular basis and adjusted to reflect actual experience.
Product Recall:
The Company accrues for product recall claims related to probable financial participation in customer actions to provide remedies to consumers as a result of actual or threatened regulatory or court actions or the Company’s determination of the potential for such actions. This accrual is based on management's best estimate after consideration of the individual fact patterns associated with specific claims, including input from the Company’s engineering, quality and legal functions.
Income Taxes:
Deferred tax assets and liabilities are recognized for the future tax consequences attributable to differences between financial statement carrying amounts of existing assets and liabilities and their respective tax bases and operating loss and tax credit carryforwards. Deferred tax assets and liabilities are measured using enacted tax rates expected to apply to taxable income in the years in which those temporary differences are expected to be recovered or settled. The Company records a valuation allowance to reduce deferred tax assets when it is more likely than not that such assets will not be realized. This assessment requires significant judgment, and must be done on a jurisdiction-by-jurisdiction basis. In determining the need for a valuation allowance, all available positive and negative evidence, including historical and projected financial performance, is considered along with any other pertinent information.
Fair Value Measurements:
The Company uses fair value measurements in the preparation of its financial statements, which utilize various inputs including those that can be readily observable, corroborated or are generally unobservable. The Company utilizes market-based data and valuation techniques that maximize the use of observable inputs and minimize the use of unobservable inputs. Additionally, the Company applies assumptions that market participants would use in pricing an asset or liability, including assumptions about risk.
Financial Instruments:
The Company uses derivative financial instruments, including forward contracts, swaps, and options to manage exposures to changes in currency exchange rates and interest rates. All derivative financial instruments are classified as held for purposes other than trading. The Company's policy specifically prohibits the use of derivatives for speculative purposes.
Business Combinations:
In accounting for business combinations, the purchase price of an acquired business is allocated to its identifiable assets and liabilities based on estimated fair values. The excess of the purchase price over the amount allocated to the assets and liabilities, if any, is recorded as goodwill. Determining the fair values of assets acquired and liabilities assumed requires management's judgment, the utilization of independent appraisal firms and often involves the use of significant estimates and assumptions with respect to the timing and amount of future cash flows, market rate assumptions, actuarial assumptions, and appropriate discount rates, among other items.
Discontinued Operations:
The Company reports financial results for discontinued operations separately from continuing operations to distinguish the financial impact of disposal transactions from ongoing operations. Discontinued operations reporting occurs
64
only when the operations and cash flows of a component of the Company's has been or will be eliminated from ongoing operations and when the Company will no longer have any significant continuing involvement in the operations of the component. For a component to be disposed of by sale, financial results are classified as discontinued only when held for sale criteria are met. For a component to be disposed of other than by sale, financial results are not classified as discontinued until abandonment, distribution, or exchange occurs depending on the manner of disposal.
On August 1, 2012, the Company completed the sale of its Lighting operations for proceeds of approximately
$70 million
. The Company recorded impairment charges principally related to property and equipment of approximately
$19 million
and
$66 million
during the years ended December 31, 2012 and 2011, respectively. The results of operations of the Lighting business have been reclassified to Loss from discontinued operations, net of tax in the Consolidated Statement of Operations for all periods presented. Discontinued operations are summarized as follows:
|
Year Ended December 31
|
|||||||
|
2012
|
2011
|
||||||
|
(Dollars in Millions)
|
|||||||
|
Sales
|
$
|
297
|
|
$
|
515
|
|
|
|
Cost of sales
|
264
|
|
490
|
|
|||
|
Gross margin
|
33
|
|
25
|
|
|||
|
Selling, general and administrative expenses
|
7
|
|
11
|
|
|||
|
Asset impairments
|
19
|
|
66
|
|
|||
|
Other expense, net
|
4
|
|
2
|
|
|||
|
Interest expense
|
2
|
|
2
|
|
|||
|
Income (loss) before income taxes
|
1
|
|
(56
|
)
|
|||
|
Provision for income taxes
|
4
|
|
—
|
|
|||
|
Net loss from discontinued operations attributable to Visteon Corporation
|
$
|
(3
|
)
|
$
|
(56
|
)
|
|
Recently Issued Accounting Pronouncements:
In February 2013, the Financial Accounting Standards Board ("FASB") issued ASU No. 2013-2,
"Reporting of Amounts Reclassified Out of Accumulated Other Comprehensive Income"
. This ASU requires companies to present, either in a note or parenthetically on the face of the financial statements, the effect of the amounts reclassified from each component of accumulated other comprehensive income based on its source and the income statement line items affected by the reclassification. This ASU is effective for interim and annual reporting periods beginning after December 15, 2012. The Company adopted these new disclosure requirements effective January 1, 2013.
In March 2013, the FASB issued ASU 2013-5,
"Foreign Currency Matters"
. The amendments in ASU 2013-5 resolve the diversity in practice about whether current literature applies to the release of the cumulative translation adjustment into net income when a parent either sells a part of all of its investment in a foreign entity or no longer holds a controlling financial interest in a subsidiary or group of assets that is a nonprofit activity or a business within a foreign entity. In addition, the amendments in ASU 2013-5 resolve the diversity in practice for the treatment of business combinations achieved in stages involving a foreign entity. ASU 2013-5 is effective for interim and annual reporting periods beginning after December 15, 2013. The Company does not expect this guidance to have a material impact on its consolidated financial statements.
On August 12, 2013, Visteon entered into a Master Agreement (the “Master Agreement”) with Huayu Automotive Systems Company Limited (“HASCO”), Yanfeng Visteon Automotive Trim Systems Co., Ltd. (“Yanfeng”) and Yanfeng Visteon Automotive Electronics Co., Ltd. (“YFVE”), pursuant to which, among other things, Visteon and HASCO agreed to modify their existing interests in automobile interiors and electronics joint ventures in the People’s Republic of China, including Yanfeng and YFVE. Pursuant to the Master Agreement, among other transactions, (i) Visteon agreed to sell its
50%
ownership interest in Yanfeng for cash of approximately
$928 million
, (ii) Visteon agreed to sell its ownership interests in other Yanfeng-related interiors joint ventures for additional aggregate cash of approximately
$96 million
, and (iii) Visteon agreed to subscribe to an additional
11%
ownership interest in YFVE for cash of approximately
$58 million
.
During the fourth quarter of 2013, Visteon completed some of the transactions contemplated under the Master Agreement including, but not limited to, the subscription to an additional 11% ownership interest in YFVE and the sale of its
50%
ownership interest in Yanfeng. The Company recorded gains on the transactions completed during the three months ended December 31, 2013 totaling
$465 million
. Other transactions contemplated under the Master Agreement not completed during the fourth quarter of 2013 remain
65
subject to substantive closing conditions, including government and regulatory approvals. Such transactions are expected to be substantially completed in multiple stages by June 30, 2015.
Restructuring of YFVE Electronics Investments
On November 7, 2013, Visteon made a cash payment of
$58 million
to subscribe to an additional
11%
ownership interest in YFVE. This step acquisition increased Visteon's direct ownership interest in YFVE from a non-controlling
40%
direct ownership interest to a controlling
51%
direct ownership interest. Accordingly, from the date of the step acquisition, the financial position, results of operations and cash flows of YFVE are consolidated into the Visteon financial statements as part of the Electronics business unit. Prior to the step acquisition Visteon accounted for YFVE as a non-consolidated affiliate under the equity method. Visteon applied business combination accounting and consolidated YFVE from November 1, 2013 forward, as activity between that date and the closing date of the acquisition was not material. On a preliminary basis, Visteon determined the purchase price of YFVE to be
$293 million
representing the aggregate of the consideration transferred to acquire the additional 11% ownership interest in YFVE, the estimated fair value of Visteon's previous 40% equity interest in YFVE, and the estimated fair value of the
49%
non-controlling interest in YFVE, as follows.
|
November 1, 2013
|
|||
|
(Dollars in Millions)
|
|||
|
Cash paid for additional 11% interest in YFVE
|
$
|
58
|
|
|
Fair value of Visteon's previous 40% equity interest in YFVE
|
97
|
|
|
|
Fair value of 49% non-controlling interest in YFVE
|
138
|
|
|
|
Total YFVE purchase price
|
$
|
293
|
|
The Company remeasured its previously held 40% equity interest in YFVE to fair value, resulting in a gain of
$52 million
inclusive of approximately
$3 million
related to foreign currency translation reclassified from Accumulated other comprehensive loss. Visteon also recorded 100% of the identifiable assets and liabilities of YFVE and a non-controlling interest in YFVE, all at respective fair values. Goodwill of
$51 million
was recorded, representing the excess of the purchase price over the net of the fair values of the identifiable assets and liabilities acquired of
$242 million
. The fair value of Visteon's previous 40% equity interest in YFVE and the fair value of the 49% non-controlling interest in YFVE were estimated using income and market approaches based on financial analysis methodologies (including the discounted cash flow analysis), projected financial information, management's estimates, available information, and reasonable and supportable assumptions. These fair value measurements are classified within level 3 of the fair value hierarchy.
The total YFVE purchase price of
$293 million
was allocated to the Visteon consolidated statement of financial position, as follows.
|
November 1, 2013
|
|||
|
(Dollars in Millions)
|
|||
|
Total YFVE purchase price
|
$
|
293
|
|
|
Cash and equivalents
|
96
|
|
|
|
Accounts receivable
|
75
|
|
|
|
Inventories
|
42
|
|
|
|
Other current assets
|
60
|
|
|
|
Property and equipment
|
42
|
|
|
|
Equity in net assets of non-consolidated affiliates
|
31
|
|
|
|
Intangible assets
|
105
|
|
|
|
Other non-current assets
|
2
|
|
|
|
Short-term debt
|
(34
|
)
|
|
|
Accounts payable
|
(106
|
)
|
|
|
Accrued employee liabilities
|
(9
|
)
|
|
|
Other current liabilities
|
(43
|
)
|
|
|
Other non-current liabilities
|
(19
|
)
|
|
|
Goodwill
|
$
|
51
|
|
In addition to goodwill of
$51 million
, intangible assets include
$89 million
,
$7 million
and
$9 million
, respectively, for estimated amounts recognized for the fair value of customer-related and developed technology assets, and land use rights. It is currently estimated that these intangible assets have a weighted average useful life of approximately
10
years,
10
years and
32
years,
66
respectively. Fair value estimates of these intangible assets were based on income approaches utilizing projected financial information, management's estimates, available information, and reasonable and supportable assumptions. The estimated fair values of property and equipment assets were based on a combination of cost and market approaches after considering the highest and best use of the assets. The estimated fair values of other assets and liabilities were based on management's estimates, available information, and reasonable and supportable assumptions. These fair value measurements are classified within level 3 of the fair value hierarchy.
The purchase price and related allocation are preliminary and may be revised as a result of adjustments made to the purchase price, additional information obtained regarding liabilities assumed, including, but not limited to, contingent liabilities, revisions of provisional estimates of fair values, including, but not limited to, the completion of independent appraisals and valuations related to property, plant and equipment and intangible assets, and certain tax attributes. Additionally, the pro forma effects of this acquisition would not materially impact the Company's reported results for any period presented, and as a result no pro forma financial information was presented.
Sale of 50% Ownership Interest in Yanfeng
On December 17, 2013, Visteon completed the sale of its
50%
ownership interest in Yanfeng for cash proceeds of
$928 million
(before applicable taxes). In connection with the sale, Visteon recorded a gain of
$413 million
inclusive of approximately
$31 million
related to foreign currency translation reclassified from Accumulated other comprehensive loss. Cash received from the sale of the Company's 50% investment in Yanfeng has been classified as net cash provided from investing activities on the consolidated statement of cash flows for the year ended December 31, 2013.
The Company recorded equity in the net income of non-consolidated affiliates of
$213 million
for the year ended December 31, 2013,
$226 million
for the year ended December 31, 2012 and
$168 million
for the year ended December 31, 2011, respectively.
|
•
|
Equity in net income of non-consolidated affiliates for the year ended December 31, 2013 includes
$27 million
representing Visteon's
50%
equity interest in a non-cash gain recorded by Yanfeng. The gain resulted from the deconsolidation of YFVE pursuant to Visteon's November 2013 step acquisition to acquire a controlling
51%
ownership interest in YFVE. In connection with the deconsolidation, Yanfeng recorded its retained non-controlling interest in YFVE at fair value, which exceeded the carrying value of net assets deconsolidated. The fair value of the retained non-controlling interest in YFVE was determined using financial analysis methodologies including the discounted cash flow analysis and the fair value measurement is classified within level 3 of the fair value hierarchy.
|
|
•
|
Equity in net income of non-consolidated affiliates for the year ended December 31, 2012 includes
$63 million
representing Visteon's equity interest in a non-cash gain recorded by Yanfeng. The gain resulted from the excess of fair value over carrying value of a former equity investee of Yanfeng that was consolidated effective June 1, 2012 pursuant to changes in the underlying joint venture agreement. The fair value was determined using financial analysis methodologies including the discounted cash flow analysis and the fair value measurement is classified within level 3 of the fair value hierarchy.
|
The Company monitors its investments in affiliates for indicators of other-than-temporary declines in value on an ongoing basis. If the Company determines that an “other-than-temporary” decline in value has occurred, an impairment loss will be recorded, which is measured as the difference between the recorded book value and the fair value of the investment. During 2012, the Company determined that an other-than-temporary decline in the value of its investment in Visteon TYC Corporation ("VTYC") had occurred based on anticipated sale transaction proceeds and recorded an impairment of
$5 million
. In January 2013, the Company completed the sale of its 50% equity interest in VTYC for proceeds of approximately
$17 million
and no additional gain or loss was recorded on the sale. Included in the Company’s retained earnings is undistributed income of non-consolidated affiliates accounted for under the equity method of approximately
$31 million
and
$231 million
at December 31, 2013 and 2012, respectively.
Investments in non-consolidated affiliates were
$228 million
and
$756 million
at December 31, 2013 and 2012, respectively. At December 31, 2013, non-consolidated affiliates accounted for under the equity method totaled
$189 million
and non-consolidated affiliates accounted for under the cost method totaled
$39 million
. Effective December 17, 2013, the Company changed from the equity method to the cost method of accounting for certain affiliates in connection with the closing of the sale of its 50% ownership interest in Yanfeng, including Yanfeng Visteon Jinqiao Automotive Trim Systems Co., Ltd. At December 31, 2012, substantially all non-consolidated affiliates were accounted for under the equity method.
67
A summary of the Company's investments in non-consolidated affiliates is provided below.
|
December 31
|
|||||||
|
2013
|
2012
|
||||||
|
(Dollars in Millions)
|
|||||||
|
Yanfeng Visteon Electronics (China) Investment Co., Ltd.
|
$
|
48
|
|
$
|
—
|
|
|
|
Yanfeng Visteon Jinqiao Automotive Trim Systems Co., Ltd.
|
38
|
|
31
|
|
|||
|
Wuhu Bonaire Auto Electrical Systems Co., Ltd.
|
27
|
|
26
|
|
|||
|
Duckyang Industry Co., Ltd.
|
29
|
|
29
|
|
|||
|
Japan Climate Systems Corporation
|
26
|
|
21
|
|
|||
|
Chongqing Changan Visteon Engine Control Systems Co., Ltd.
|
16
|
|
16
|
|
|||
|
Fawer Visteon Climate Control System Co., Ltd.
|
11
|
|
8
|
|
|||
|
Yanfeng
|
—
|
|
531
|
|
|||
|
YFVE
|
—
|
|
47
|
|
|||
|
Visteon TYC Corporation
|
—
|
|
16
|
|
|||
|
Dongfeng Visteon Automotive Trim Systems Co., Ltd.
|
—
|
|
15
|
|
|||
|
Jiangsu Toppower Automotive Electronics Co., Ltd.
|
—
|
|
12
|
|
|||
|
Others
|
33
|
|
4
|
|
|||
|
Total investments in non-consolidated affiliates
|
$
|
228
|
|
$
|
756
|
|
|
Summarized financial data is provided below for the Company’s non-consolidated affiliates accounted for under the equity method. Amounts included in the tables below represent 100% of the results of operations and balance sheet amounts for such non-consolidated affiliates. Yanfeng is considered a significant non-consolidated affiliate and is shown separately in the tables below.
|
Yanfeng
|
All Others
|
||||||||||||||
|
December 31
|
December 31
|
||||||||||||||
|
2013
|
2012
|
2013
|
2012
|
||||||||||||
|
(Dollars in Millions)
|
|||||||||||||||
|
Current assets
|
$
|
—
|
|
$
|
2,710
|
|
$
|
522
|
|
$
|
577
|
|
|||
|
Other assets
|
—
|
|
1,114
|
|
210
|
|
305
|
|
|||||||
|
Total assets
|
$
|
—
|
|
$
|
3,824
|
|
$
|
732
|
|
$
|
882
|
|
|||
|
Current liabilities
|
$
|
—
|
|
$
|
2,320
|
|
$
|
387
|
|
$
|
534
|
|
|||
|
Other liabilities
|
—
|
|
28
|
|
28
|
|
38
|
|
|||||||
|
Stockholders’ equity
|
—
|
|
1,476
|
|
317
|
|
310
|
|
|||||||
|
Total liabilities and equity
|
$
|
—
|
|
$
|
3,824
|
|
$
|
732
|
|
$
|
882
|
|
|||
|
Net Sales
|
Gross Margin
|
Net Income
|
|||||||||||||||||||||||||||||||||
|
December 31
|
December 31
|
December 31
|
|||||||||||||||||||||||||||||||||
|
2013
|
2012
|
2011
|
2013
|
2012
|
2011
|
2013
|
2012
|
2011
|
|||||||||||||||||||||||||||
|
(Dollars in Millions)
|
|||||||||||||||||||||||||||||||||||
|
Yanfeng
|
$
|
8,089
|
|
$
|
5,171
|
|
$
|
3,014
|
|
$
|
1,160
|
|
$
|
782
|
|
$
|
473
|
|
$
|
334
|
|
$
|
369
|
|
$
|
246
|
|
||||||||
|
All other
|
1,335
|
|
1,757
|
|
1,681
|
|
111
|
|
194
|
|
176
|
|
94
|
|
92
|
|
90
|
|
|||||||||||||||||
|
$
|
9,424
|
|
$
|
6,928
|
|
$
|
4,695
|
|
$
|
1,271
|
|
$
|
976
|
|
$
|
649
|
|
$
|
428
|
|
$
|
461
|
|
$
|
336
|
|
|||||||||
Yanfeng sales and gross margin for the year ended December 31, 2012 include approximately
$1,733 million
and
$278 million
, respectively, related to the results of operations for the five months ended May 31, 2012 of a former equity investee that was consolidated effective June 1, 2012. Yanfeng net income for the years ended December 31, 2013 and 2012 includes approximately
$54 million
and
$130 million
, respectively associated with non-cash gains. Net sales for all other affiliates for the years ended December 31, 2013 and 2012 included
$764 million
and
$802 million
, respectively related to Duckyang Industry Co., Ltd. ("Duckyang"). In October 2011, Visteon sold a
1%
interest in Duckyang and conveyed a board seat to the other partner. Following the transaction, Visteon held approximately
50%
of Duckyang's total shares outstanding and no longer controlled the board, thus Duckyang became one of the Company's non-consolidated affiliates.
68
NOTE 5
.
Restructuring Activities
The Company has undertaken various restructuring activities to achieve its strategic and financial objectives. Restructuring activities include, but are not limited to, plant closures, production relocation, administrative cost structure realignment and consolidation of available capacity and resources. The Company expects to finance restructuring programs through cash on hand, cash generated from operations, reimbursements pursuant to customer accommodation and support agreements or through cash available under its existing debt agreements, subject to the terms of applicable covenants. Restructuring costs are recorded as elements of a plan are finalized and the timing of activities and the amount of related costs are not likely to change. However, such costs are estimated based on information available at the time such charges are recorded. In general, management anticipates that restructuring activities will be completed within a time frame such that significant changes to the plan are not likely. Due to the inherent uncertainty involved in estimating restructuring expenses, actual amounts paid for such activities may differ from amounts initially estimated.
In November 2012 the Company announced a
$100 million
restructuring program designed to reduce fixed costs and to improve operational efficiency by addressing certain under-performing operations. In connection with that program, the Company announced a plan to restructure three European Interiors facilities and a plan to realign its corporate and administrative functions directly to their corresponding operational beneficiary to right-size such functions and reduce related costs. Through December 31, 2013, the Company recorded approximately
$76 million
of restructuring expenses under this program. The Company expects to record additional costs related to this program in future periods as underlying plans are finalized. Given the economically-sensitive and highly competitive nature of the automotive industry, the Company continues to closely monitor current market factors and industry trends taking action as necessary, including but not limited to, additional restructuring actions. However, there can be no assurance that any such actions will be sufficient to fully offset the impact of adverse factors on the Company or its results of operations, financial position and cash flows.
The Company recorded restructuring expenses of
$41 million
,
$79 million
, and
$34 million
, during the years ended December 31, 2013, 2012 and 2011, respectively. Significant restructuring programs are summarized below by product group.
Interiors
During the fourth quarter of 2012, the Company announced a plan to restructure three European Interiors facilities and recorded approximately
$30 million
for employee severance and termination benefits associated with approximately
230
employees. This amount remained accrued on the consolidated balance sheet as of December 31, 2012. During the year ended December 31, 2013, the Company recorded an additional
$4 million
of employee severance and termination benefit costs associated with this program and made cash payments of approximately
$16 million
for related employee severance and termination benefits. As of December 31, 2013 approximately $
18 million
remains accrued for this program.
During the third quarter of 2013, the Company announced a plan to restructure the workforce and related processes at an Interiors operation in Brazil. The Company recorded employee severance and termination benefit costs of
$8 million
associated with approximately
255
employees. The Company made cash payments of approximately
$4 million
for related employee severance and termination benefits during 2013. As of December 31, 2013 approximately $
4 million
remains accrued for this program.
Climate
During the fourth quarter of 2011, the Company commenced a program designed to commonize global business systems and processes across its Climate operations for the purpose of reducing costs. The Company recorded and paid cash to settle employee severance and termination benefits of
$19 million
for approximately
100
employees, and
$5 million
, respectively, for the years ended December 31, 2013 and 2012.
Electronics
During 2011 the Company announced its intention to permanently cease production and to close the Cadiz Electronics facility located in Spain. In connection with the announcement, the Company recorded
$24 million
of employee severance and termination benefits costs representing the minimum amount of employee separation costs pursuant to statutory regulations. This amount remained accrued on the consolidated balance sheet as of December 31, 2011. In January 2012 the Company reached agreements with the local unions and Spanish government for the closure of the Cadiz Electronics facility. During the first quarter of 2012 and in connection with the agreements, the Company recorded one-time termination benefits, in excess of the statutory minimum requirement, of approximately
$31 million
and other exit costs of
$5 million
. The Company also transferred land, building and machinery to the local municipality in Spain for the benefit of employees resulting in a loss of
$14 million
, which was recorded in Other (income) expense, net in the consolidated statements of operations. During the year ended December 31, 2012 the Company made
$49 million
of cash payments for employee severance and termination benefits and
$5 million
for other exit costs, primarily
69
governmental registration of contributed assets. Additionally, the Company recovered approximately
$23 million
of these costs pursuant to the 2010 Global Settlement and Release Agreement with Ford, including
$19 million
during 2012 and
$4 million
during 2011. Amounts recovered have been recorded as deferred revenue on the Company's consolidated balance sheet and are being amortized on a straight-line basis over the remaining life of supply contracts with the customer, or approximately
5
years.
Corporate
During 2012, the Company announced a program designed to realign its corporate and administrative functions directly to their corresponding operational beneficiary and to reduce corporate administrative costs. During the year ended December 31, 2012, the Company recorded severance and termination benefit costs of
$4 million
associated with approximately
30
employees. During the year ended December 31, 2013, the Company recorded additional severance and termination benefit costs under this program of
$9 million
associated with approximately
40
employees and paid cash to settle employee severance and termination benefits of
$9 million
. The Company expects to record additional expense related to this program in future periods as additional elements of the plan are finalized and the timing of activities and the amount of related costs are not likely to change.
Restructuring Reserves
Restructuring reserve balances of
$29 million
and
$39 million
at December 31, 2013 and 2012, respectively, are classified as Other current liabilities on the consolidated balance sheets. The Company anticipates that the activities associated with the restructuring reserve balance as of December 31, 2013 will be substantially completed by the end of 2014. The Company’s consolidated restructuring reserves and related activity are summarized below including amounts associated with discontinued operations.
|
Interiors
|
Climate
|
Electronics
|
Corporate
|
Total
|
|||||||||||||||
|
(Dollars in Millions)
|
|||||||||||||||||||
|
December 31, 2010
|
$
|
37
|
|
$
|
2
|
|
$
|
3
|
|
$
|
1
|
|
$
|
43
|
|
||||
|
Expenses
|
7
|
|
3
|
|
24
|
|
—
|
|
34
|
|
|||||||||
|
Reversals
|
(7
|
)
|
(1
|
)
|
(2
|
)
|
—
|
|
(10
|
)
|
|||||||||
|
Exchange
|
2
|
|
—
|
|
(2
|
)
|
—
|
|
—
|
|
|||||||||
|
Utilization
|
(33
|
)
|
(3
|
)
|
(4
|
)
|
(1
|
)
|
(41
|
)
|
|||||||||
|
December 31, 2011
|
$
|
6
|
|
$
|
1
|
|
$
|
19
|
|
$
|
—
|
|
$
|
26
|
|
||||
|
Expenses
|
34
|
|
5
|
|
36
|
|
4
|
|
79
|
|
|||||||||
|
Utilization
|
(6
|
)
|
(5
|
)
|
(54
|
)
|
(1
|
)
|
(66
|
)
|
|||||||||
|
December 31, 2012
|
$
|
34
|
|
$
|
1
|
|
$
|
1
|
|
$
|
3
|
|
$
|
39
|
|
||||
|
Expenses
|
13
|
|
19
|
|
—
|
|
9
|
|
41
|
|
|||||||||
|
Reversals
|
(1
|
)
|
—
|
|
(1
|
)
|
—
|
|
(2
|
)
|
|||||||||
|
Utilization
|
(21
|
)
|
(19
|
)
|
—
|
|
(9
|
)
|
(49
|
)
|
|||||||||
|
December 31, 2013
|
$
|
25
|
|
$
|
1
|
|
$
|
—
|
|
$
|
3
|
|
$
|
29
|
|
||||
During 2011, the Company reversed
$7 million
of previously established accruals for employee severance and termination benefits at a European Interiors facility pursuant to a contractual agreement to cancel the related social plan and
$2 million
of previously established accruals due to lower than estimated severance and termination benefit costs associated with the consolidation of the Company’s Electronics operations in South America.
Inventories consist of the following components:
|
December 31
|
|||||||
|
2013
|
2012
|
||||||
|
(Dollars in Millions)
|
|||||||
|
Raw materials
|
$
|
204
|
|
$
|
153
|
|
|
|
Work-in-process
|
191
|
|
174
|
|
|||
|
Finished products
|
104
|
|
78
|
|
|||
|
Valuation reserves
|
(27
|
)
|
(20
|
)
|
|||
|
$
|
472
|
|
$
|
385
|
|
||
70
Property and equipment, net consists of the following:
|
December 31
|
|||||||
|
2013
|
2012
|
||||||
|
(Dollars in Millions)
|
|||||||
|
Land
|
$
|
162
|
|
$
|
161
|
|
|
|
Buildings and improvements
|
301
|
|
269
|
|
|||
|
Machinery, equipment and other
|
1,309
|
|
1,137
|
|
|||
|
Construction in progress
|
145
|
|
100
|
|
|||
|
Total property and equipment
|
1,917
|
|
1,667
|
|
|||
|
Accumulated depreciation
|
(580
|
)
|
(421
|
)
|
|||
|
1,337
|
|
1,246
|
|
||||
|
Product tooling, net of amortization
|
77
|
|
80
|
|
|||
|
Property and equipment, net
|
$
|
1,414
|
|
$
|
1,326
|
|
|
In April 2012, the Company sold its corporate headquarters, consisting of land and building, which had a net book value of approximately
$60 million
, for cash proceeds of approximately
$80 million
and entered into an agreement to lease back the corporate offices over a period of
15
years. The gain on the sale of
$20 million
is being amortized into income on a straight-line basis over the term of the lease.
Property and equipment is depreciated principally using the straight-line method of depreciation over the related asset's estimated useful life. Generally, buildings and improvements are depreciated over a
40
-year estimated useful life, leasehold improvements are depreciated on a straight-line basis over the initial lease term period, and machinery, equipment and other are depreciated over estimated useful lives ranging from
3
to
15
years. Product tooling is amortized using the straight-line method over the estimated life of the tool, generally not exceeding
six
years. Depreciation and amortization expenses for property and equipment, including assets recorded under capital leases, are summarized as follows:
|
Year Ended December 31
|
|||||||||||
|
2013
|
2012
|
2011
|
|||||||||
|
(Dollars in Millions)
|
|||||||||||
|
Depreciation
|
$
|
207
|
|
$
|
209
|
|
$
|
254
|
|
||
|
Amortization
|
10
|
|
10
|
|
17
|
|
|||||
|
$
|
217
|
|
$
|
219
|
|
$
|
271
|
|
|||
71
Intangible assets at December 31, 2013 and 2012 were as follows:
|
December 31, 2013
|
December 31, 2012
|
||||||||||||||||||||||||
|
Estimated Weighted Average Useful Life (years)
|
Gross Carrying Value
|
Accumulated Amortization
|
Net Carrying Value
|
Gross Carrying Value
|
Accumulated Amortization
|
Net Carrying Value
|
|||||||||||||||||||
|
(Dollars in Millions)
|
|||||||||||||||||||||||||
|
Definite-Lived
|
|||||||||||||||||||||||||
|
Developed technology
|
8
|
$
|
219
|
|
$
|
88
|
|
$
|
131
|
|
$
|
209
|
|
$
|
60
|
|
$
|
149
|
|
||||||
|
Customer related
|
10
|
214
|
|
45
|
|
169
|
|
124
|
|
30
|
|
94
|
|
||||||||||||
|
Other
|
39
|
32
|
|
9
|
|
23
|
|
22
|
|
5
|
|
17
|
|
||||||||||||
|
Subtotal
|
$
|
465
|
|
$
|
142
|
|
$
|
323
|
|
$
|
355
|
|
$
|
95
|
|
$
|
260
|
|
|||||||
|
Indefinite-Lived
|
|||||||||||||||||||||||||
|
Goodwill
|
$
|
97
|
|
$
|
—
|
|
$
|
97
|
|
$
|
46
|
|
$
|
—
|
|
$
|
46
|
|
|||||||
|
Trade names
|
27
|
|
—
|
|
27
|
|
26
|
|
—
|
|
26
|
|
|||||||||||||
|
Subtotal
|
$
|
124
|
|
$
|
—
|
|
124
|
|
$
|
72
|
|
$
|
—
|
|
72
|
|
|||||||||
|
Total
|
$
|
589
|
|
$
|
142
|
|
$
|
447
|
|
$
|
427
|
|
$
|
95
|
|
$
|
332
|
|
|||||||
Changes in intangible asset gross carrying values and accumulated amortization are summarized in the table below.
|
2013
|
2012
|
||||||||||||||
|
Gross Carrying Value
|
Accumulated Amortization
|
Gross Carrying Value
|
Accumulated Amortization
|
||||||||||||
|
(Dollars in Millions)
|
|||||||||||||||
|
Balance January 1
|
$
|
427
|
|
$
|
95
|
|
$
|
404
|
|
$
|
51
|
|
|||
|
Additions
|
156
|
|
—
|
|
11
|
|
—
|
|
|||||||
|
Divestiture
|
—
|
|
—
|
|
(5
|
)
|
—
|
|
|||||||
|
Amortization
|
—
|
|
45
|
|
—
|
|
40
|
|
|||||||
|
Foreign currency
|
6
|
|
2
|
|
17
|
|
4
|
|
|||||||
|
Balance December 31
|
$
|
589
|
|
$
|
142
|
|
$
|
427
|
|
$
|
95
|
|
|||
Additions to intangible assets for 2013 are primarily attributable to the November 2013 step acquisition of YFVE. In connection with the preliminary purchase price allocation acquired intangible assets were recorded at estimated fair values, including customer related assets of approximately
$89 million
, land use rights of approximately
$9 million
and developed technology of approximately
$7 million
. Additionally, the Company recorded goodwill of approximately
$51 million
on the YFVE step acquisition for the excess of the purchase price over the net of the fair values of the identifiable assets and liabilities acquired.
The Company recorded approximately
$45 million
,
$40 million
and
$45 million
of amortization expense related to definite-lived intangible assets for the years ended December 31, 2013, 2012 and 2011 respectively. The Company currently estimates annual amortization expense to be
$50 million
for 2014, $
49 million
for 2015,
$48 million
for 2016,
$46 million
for 2017 and
$41 million
for 2018. Indefinite-lived intangible assets, including goodwill and trade names are not amortized but are tested for impairment at least annually. The Company performs its annual impairment testing as of the first day of the fourth quarter of each year. No impairment was identified during the periods presented. Goodwill is summarized by product group in the table below.
|
Climate
|
Electronics
|
Total
|
|||||||||
|
(Dollars in Millions)
|
|||||||||||
|
Balance January 1, 2012
|
$
|
36
|
|
$
|
—
|
|
$
|
36
|
|
||
|
Additions
|
10
|
|
—
|
|
10
|
|
|||||
|
Balance at December 31, 2012
|
$
|
46
|
|
$
|
—
|
|
$
|
46
|
|
||
|
Additions
|
—
|
|
51
|
|
51
|
|
|||||
|
Balance at December 31, 2013
|
$
|
46
|
|
$
|
51
|
|
$
|
97
|
|
||
72
The Company’s short and long-term debt consists of the following:
|
|
|
Weighted Average
Interest Rate
|
Carrying Value
|
||||||||||
|
Maturity
|
2013
|
2012
|
2013
|
2012
|
|||||||||
|
(Dollars in Millions)
|
|||||||||||||
|
Short-term debt
|
|||||||||||||
|
Current portion of long-term debt
|
7.7%
|
8.9%
|
$
|
2
|
|
$
|
3
|
|
|||||
|
Short-term borrowings
|
4.7%
|
3.3%
|
104
|
|
93
|
|
|||||||
|
Total short-term debt
|
$
|
106
|
|
$
|
96
|
|
|||||||
|
Long-term debt
|
|||||||||||||
|
6.75% Senior notes due April 15, 2019
|
2019
|
6.75%
|
6.75%
|
$
|
396
|
|
$
|
445
|
|
||||
|
HVCC USD term loan due May 30, 2016
|
2016
|
1.8%
|
N/A
|
100
|
|
—
|
|
||||||
|
HVCC KRW term loan due May 30, 2016
|
2016
|
3.7%
|
N/A
|
95
|
|
—
|
|
||||||
|
Other
|
2014-2018
|
5.7%
|
8.5%
|
33
|
|
28
|
|
||||||
|
Total long-term debt
|
$
|
624
|
|
$
|
473
|
|
|||||||
Short term borrowings
Short-term borrowings are primarily related to the Company's non-U.S. operations and are payable in various currencies. As of December 31, 2013, the Company had international affiliate short-term borrowings of $
104 million
, approximately $
68 million
of which is related to HVCC. As of December 31, 2012, the Company had international affiliate short-term borrowings of $
93 million
, approximately $
78 million
of which is related to HVCC. These borrowings are payable in both U.S. dollar and non-U.S. currencies including, but not limited to, the Euro, Korean Won, Turkish Lira, Russian Ruble and Chinese Yuan.
Short-term borrowings include an arrangement, through a subsidiary in France, to sell accounts receivable with recourse on an uncommitted basis. The amount of financing available is dependent on the amount of receivables less customary reserves. The Company pays a
25 basis points
servicing fee on all receivables sold, as well as a financing fee of three-month Euribor plus
95 basis points
on the advanced portion. At December 31, 2013 there were
$31 million
outstanding borrowings under the facility with
$52 million
of receivables pledged as security, which are recorded as "Other current assets" on the consolidated balance sheet. At December 31, 2012, there were
$15 million
outstanding borrowings under the facility with
$49 million
of receivables pledged as security.
Available borrowings on outstanding affiliate credit facilities as of December 31, 2013 is approximately
$291 million
and certain of these facilities have pledged receivables, inventory or equipment as security.
6.75% Senior Notes Due April 15, 2019
In April 2011, the Company completed the sale of
$500 million
aggregate principal amount of
6.75%
senior notes due
April 15, 2019
(the “Original Senior Notes”). The Original Senior Notes were sold to the initial purchasers who were party to a purchase agreement (the “Initial Purchasers”) for resale to qualified institutional buyers under Rule 144A and to persons outside the United States under Regulation S. The Original Senior Notes were used to repay the obligations under the Term Loan Credit Agreement (“Term Loan”) in the amount of
$498 million
, which the Company entered into on October 1, 2010. In 2011, the Company recorded a loss of
$24 million
on the early extinguishment of the Term Loan including
$21 million
of unamortized original issuance discount and debt fees that were recorded net of the Term Loan principal on the face of the Company’s consolidated balance sheets immediately prior to extinguishment.
During January 2012, the Company exchanged substantially identical senior notes (the "Senior Notes") registered under the Securities Act of 1933, as amended, for all of the Original Senior Notes. The Senior Notes were issued under an Indenture (the “Indenture”) among the Company, the subsidiary guarantors named therein, and The Bank of New York Mellon Trust Company, N.A., as trustee (the “Trustee”). The Indenture and the form of Senior Notes provide, among other things, that the Senior Notes are senior unsecured obligations. Interest is payable on the Senior Notes on April 15 and October 15 of each year until maturity on April 15, 2019. Each of the Company’s existing and future 100% owned domestic restricted subsidiaries that guarantee debt under the Company’s Revolver guarantee the Senior Notes.
73
The terms of the Indenture, among other things, limit the ability of the Company and certain of its subsidiaries to make restricted payments; restrict dividends or other payments of subsidiaries; incur additional debt; engage in transactions with affiliates; create liens on assets; engage in sale and leaseback transactions; and consolidate, merge or transfer all or substantially all of its assets and the assets of its subsidiaries. The Indenture provides for customary events of default which include (subject in certain cases to customary grace and cure periods), among others: nonpayment of principal or interest; breach of other agreements in the Indenture; defaults in failure to pay certain other indebtedness; the rendering of judgments to pay certain amounts of money against the Company and its subsidiaries; the failure of certain guarantees to be enforceable; and certain events of bankruptcy or insolvency. Generally, if an event of default occurs and is not cured within the time periods specified, the Trustee or the holders of at least 25% in principal amount of the then outstanding series of Senior Notes may declare all the Senior Notes of such series to be due and payable immediately.
Prior to April 15, 2014, the Company has the option to redeem up to
10%
of the Senior Notes during any 12-month period from issue date until April 15, 2014 for a
103%
redemption price, plus accrued and unpaid interest to the redemption date. The Company exercised this right in December 2012 to repurchase
$50 million
(
10%
) of its Senior Notes and in December 2013 to repurchase an additional
$50 million
(
10%
) of its Senior Notes. The Company recorded a
$2 million
loss on extinguishment of debt in both 2012 and 2013 related to the premium paid on the debt redemption. The Company also has the option to redeem a portion or all of the Senior Notes subject to a make-whole provision.
Beginning April 15, 2014, the Indenture allows for part or all of the Senior Notes to be redeemed at the following redemption prices (plus accrued and unpaid interest to the redemption date) during the 12 month period beginning on April 15 of the indicated years: 2014 at
105.063%
, 2015 at
103.375%
, 2016 at
101.688%
, and 2017 and thereafter at
100.000%
. The Indenture also contains optional redemption rights related to the proceeds from equity offerings.
HVCC Term Loans
During the first quarter of 2013, Halla Visteon Climate Control Corporation ("HVCC") entered into and fully drew on two unsecured bilateral term loan credit agreements with aggregate available borrowings of approximately
$195 million
. As of December 31, 2013, the USD equivalent of these agreements was $
195 million
. Both credit agreements mature in May 2016 and are subject to financial covenants requiring total debt to EBITDA of not greater than
3.2
x and a net interest coverage test of more than
3
x. The Company was in compliance with such covenants at December 31, 2013.
Other Long-Term Debt
Other long-term debt also includes amounts associated with the Company's non-U.S. operations and are payable in various currencies. As of December 31, 2013 and December 31, 2012, the Company had long-term international affiliate debt outstanding of
$33 million
and
$28 million
, respectively. These balances are payable in both U.S. and non-U.S. currencies including, but not limited to, the Euro, Korean Won, and Russian Ruble.
Included in other long-term debt at December 31, 2013 and 2012 is approximately $
17 million
and $
18 million
, respectively, attributable to a sale-leaseback arrangement for land and buildings located in Chihuahua, Mexico. In connection with the transaction, the Company received proceeds of
$19 million
and entered into an agreement to lease the land and buildings back over a
5
year period. This sale-leaseback is being accounted for as a direct financing arrangement, and the cash proceeds have been recorded as debt. The lease requires annual rental payments that are allocated between the reduction of indebtedness and interest expense using an incremental borrowing rate of
9.5%
. The Company will recognize the sale of the land and buildings at the end of the lease term and expects to record a gain of approximately
$3 million
.
Revolving Loan Credit Facility
The Company entered into a revolving loan credit agreement (the “Revolver”), by and among the Company and certain of the Company's subsidiaries, as borrowers, with a syndicate of lenders consisting of Morgan Stanley Senior Funding, Inc., as administrative agent, co-collateral agent, co-syndication agent and Bank of America, N.A., as co-collateral agent, and Barclays Capital, as co-syndication agent, dated October 1, 2010, which provided for a
$200 million
committed asset-based revolving credit facility. The Revolver requires the Company and its subsidiaries to comply with customary affirmative and negative covenants, and contains customary events of default. In April 2011, the Company and certain of its domestic subsidiaries entered into an amendment to the Revolver whereby the commitment amount was increased
$20 million
, to a total borrowing capacity of
$220 million
, subject to certain borrowing base requirements.
74
During April 2012, the Company entered into an amendment to the Revolver to allow for the sale of its Lighting business and for the sale and leaseback of the Company's U.S. corporate headquarters. In July 2012, the Revolver was amended to, among other things, allow entry into a bridge loan financing agreement and reduce the commitment under the Revolver to
$175 million
reflecting the anticipated reduction in borrowing base assets following the sale of the Lighting business. Additionally, the amendment modified restrictive covenants to permit asset dispositions, hedging and the incurrence of limited categories of indebtedness.
On January 28, 2013, the Company entered into an amendment to the Revolver to permit, among other things, the sale of certain Climate operations to Halla Climate Control Corporation ("Halla"), a 70% owned subsidiary of the Company. In anticipation of the associated reduction in borrowing base assets, the Company also reduced its commitment amount to
$130 million
. Advances under the Revolver are available until maturity in October 2015. The Revolver has a fee of
0.5%
per annum on the undrawn commitment. At December 31, 2013 and 2012, there were no outstanding borrowings under the Revolver. At December 31, 2013, the Company had available borrowings under the Revolver of approximately
$100 million
.
Letters of Credit
The Company has a
$15 million
letter of credit facility with US Bank National Association. In connection with the facility, the Company must maintain a collateral account equal to
103%
of the aggregate stated amount of issued letters of credit (or
110%
for non-U.S. currencies) and must reimburse any amounts drawn under issued letters of credit. As of December 31, 2013 and 2012, the Company had
$10 million
and
$9 million
, respectively, of outstanding letters of credit issued under this facility secured by restricted cash. Additionally, the Company had
$21 million
and
$14 million
of locally issued letters of credit to support various customs arrangements and other obligations at its local affiliates of which
$15 million
and
$6 million
are secured by cash collateral at December 31, 2013 and 2012, respectively.
Maturities
Debt obligations, at December 31, 2013, included maturities as follows: 2014 —
$106 million
; 2015 —
$16 million
; 2016 —
$197 million
; 2017 —
$15 million
; 2018 —
$0 million
; thereafter —
$396 million
.
Other
On July 4, 2012 the Company commenced a tender offer to purchase the remaining 30 percent of Halla. In connection with the tender offer, Visteon, through its wholly-owned Korean subsidiary Visteon Korea Holdings Corp., entered into a fully committed Korean debt facility of
1 trillion
Korean Won ("KRW") or
$881 million
(the "Bridge Loan"), under which, Visteon Korea Holdings Corp. borrowed
925 billion
KRW or
$815 million
. The Bridge Loan was secured by a pledge of all of the shares of capital stock of Halla owned directly or indirectly by Visteon. On July 30, 2012, Visteon Korea Holdings Corp. repaid approximately
910 billion
KRW or
$800 million
of previously borrowed amounts under the Bridge Loan. On August 24, 2012, Visteon Korea Holdings Corp. permanently reduced the available commitments under the Bridge Loan as amended and completed repayment of all outstanding loan amounts on August 28, 2012 as was allowed without penalty after following certain advance notice and other procedures. The Company incurred debt extinguishment costs of approximately
$4 million
and interest of
$5 million
during 2012 in connection with this financing arrangement.
Defined Benefit Plans
The Company sponsors pay related benefit plans for employees in the U.S., UK, Germany, Brazil, France, Mexico, Japan, Korea, India, Thailand, and Canada. Employees in the U.S. are no longer accruing benefits under the Company's defined benefit plans as these plans were frozen. The Company’s defined benefit plans are partially funded with the exception of certain supplemental benefit plans for executives and certain non-U.S. plans, primarily in Germany, which are unfunded.
During 2012 the Company offered an accelerated pension payment program to most of its U.S. defined benefit plan participants who are former employees with vested benefits not yet in pay status, whereby such participants could elect to receive a single lump sum payout. Approximately
70%
of eligible participants elected to receive a single lump sum payout resulting in a reduction of the Company's U.S. retirement plan obligations of
$408 million
and a reduction in plan assets of
$301 million
, respectively. Additionally, the Company recorded settlement losses of
$9 million
during the fourth quarter of 2012 in connection with the lump sum payments.
75
The Company's expense for defined benefit pension plans is provided in the table below, as follows:
|
U.S. Plans
|
Non-U.S. Plans
|
||||||||||||||||||||||
|
Year Ended December 31
|
Year Ended December 31
|
||||||||||||||||||||||
|
2013
|
2012
|
2011
|
2013
|
2012
|
2011
|
||||||||||||||||||
|
(Dollars in Millions)
|
|||||||||||||||||||||||
|
Costs Recognized in Income
|
|||||||||||||||||||||||
|
Service cost
|
$
|
—
|
|
$
|
—
|
|
$
|
5
|
|
$
|
23
|
|
$
|
18
|
|
$
|
6
|
|
|||||
|
Interest cost
|
47
|
|
70
|
|
73
|
|
27
|
|
28
|
|
28
|
|
|||||||||||
|
Expected return on plan assets
|
(62
|
)
|
(79
|
)
|
(75
|
)
|
(18
|
)
|
(18
|
)
|
(18
|
)
|
|||||||||||
|
Settlements and curtailments
|
—
|
|
9
|
|
(1
|
)
|
(1
|
)
|
4
|
|
—
|
|
|||||||||||
|
Amortization of losses and other
|
—
|
|
—
|
|
3
|
|
3
|
|
—
|
|
—
|
|
|||||||||||
|
Net pension (income) expense
|
$
|
(15
|
)
|
$
|
—
|
|
$
|
5
|
|
$
|
34
|
|
$
|
32
|
|
$
|
16
|
|
|||||
|
Weighted Average Assumptions
|
|||||||||||||||||||||||
|
Discount rate
|
3.95
|
%
|
4.85
|
%
|
5.50
|
%
|
4.10
|
%
|
5.70
|
%
|
5.95
|
%
|
|||||||||||
|
Compensation increase
|
N/A
|
|
N/A
|
|
3.50
|
%
|
3.45
|
%
|
3.70
|
%
|
3.55
|
%
|
|||||||||||
|
Long-term return on assets
|
7.00
|
%
|
7.00
|
%
|
7.50
|
%
|
4.75
|
%
|
5.05
|
%
|
5.40
|
%
|
|||||||||||
In addition the Company recorded
$1 million
of U.S. retirement benefit related restructuring expenses during 2013 and 2012.
The Company’s obligation for defined benefit pension plans is as follows:
|
U.S. Plans
|
Non-U.S. Plans
|
||||||||||||||
|
Year Ended December 31
|
Year Ended December 31
|
||||||||||||||
|
2013
|
2012
|
2013
|
2012
|
||||||||||||
|
(Dollars in Millions)
|
|||||||||||||||
|
Change in Benefit Obligation
|
|||||||||||||||
|
Benefit obligation — beginning
|
$
|
1,245
|
|
$
|
1,480
|
|
$
|
653
|
|
$
|
466
|
|
|||
|
Service cost
|
—
|
|
—
|
|
23
|
|
18
|
|
|||||||
|
Interest cost
|
47
|
|
70
|
|
27
|
|
28
|
|
|||||||
|
Actuarial (gain) loss
|
(119
|
)
|
67
|
|
3
|
|
128
|
|
|||||||
|
Settlements and curtailments
|
—
|
|
(301
|
)
|
(2
|
)
|
(44
|
)
|
|||||||
|
Foreign exchange translation
|
—
|
|
—
|
|
14
|
|
15
|
|
|||||||
|
Transfers In
|
—
|
|
—
|
|
—
|
|
60
|
|
|||||||
|
Benefits paid and other
|
(92
|
)
|
(71
|
)
|
(17
|
)
|
(18
|
)
|
|||||||
|
Benefit obligation — ending
|
$
|
1,081
|
|
$
|
1,245
|
|
$
|
701
|
|
$
|
653
|
|
|||
|
Change in Plan Assets
|
|
|
|
|
|||||||||||
|
Plan assets — beginning
|
$
|
966
|
|
$
|
1,151
|
|
$
|
404
|
|
$
|
348
|
|
|||
|
Actual return on plan assets
|
84
|
|
115
|
|
11
|
|
24
|
|
|||||||
|
Sponsor contributions
|
5
|
|
77
|
|
33
|
|
42
|
|
|||||||
|
Settlements
|
—
|
|
(301
|
)
|
(1
|
)
|
(38
|
)
|
|||||||
|
Foreign exchange translation
|
—
|
|
—
|
|
6
|
|
10
|
|
|||||||
|
Transfers In
|
—
|
|
—
|
|
—
|
|
36
|
|
|||||||
|
Benefits paid and other
|
(95
|
)
|
(76
|
)
|
(19
|
)
|
(18
|
)
|
|||||||
|
Plan assets — ending
|
$
|
960
|
|
|
$
|
966
|
|
$
|
434
|
|
$
|
404
|
|
||
|
Funded status at end of period
|
$
|
(121
|
)
|
$
|
(279
|
)
|
$
|
(267
|
)
|
$
|
(249
|
)
|
|||
|
Balance Sheet Classification
|
|
|
|
|
|||||||||||
|
Other non-current assets
|
$
|
8
|
|
$
|
—
|
|
$
|
2
|
|
$
|
2
|
|
|||
|
Accrued employee liabilities
|
(2
|
)
|
(2
|
)
|
(5
|
)
|
(3
|
)
|
|||||||
|
Employee benefits
|
(127
|
)
|
(277
|
)
|
(264
|
)
|
(248
|
)
|
|||||||
|
Accumulated other comprehensive loss:
|
|||||||||||||||
|
Actuarial (gain) loss
|
(98
|
)
|
39
|
|
93
|
|
81
|
|
|||||||
|
Tax effects/other
|
(2
|
)
|
—
|
|
(18
|
)
|
(12
|
)
|
|||||||
|
$
|
(100
|
)
|
$
|
39
|
|
$
|
75
|
|
$
|
69
|
|
||||
76
The accumulated benefit obligation for all defined benefit pension plans was
$1.68 billion
and
$1.81 billion
at December 31, 2013 and 2012, respectively. The projected benefit obligation, accumulated benefit obligation and fair value of plan assets for employee retirement plans with accumulated benefit obligations in excess of plan assets were
$1.44 billion
,
$1.37 billion
, and
$1.06 billion
, respectively, at December 31, 2013 and
$1.70 billion
,
$1.66 billion
and
$1.21 billion
, respectively, at December 31, 2012.
Assumptions used by the Company in determining its defined benefit pension obligations as of December 31, 2013 and December 31, 2012 are summarized in the following table.
|
U.S. Plans
|
Non-U.S. Plans
|
|||||||||||
|
Weighted Average Assumptions
|
2013
|
2012
|
2013
|
2012
|
||||||||
|
Discount rate
|
4.75
|
%
|
3.95
|
%
|
4.30
|
%
|
4.10
|
%
|
||||
|
Expected rate of return on assets
|
7.00
|
%
|
7.00
|
%
|
5.10
|
%
|
4.75
|
%
|
||||
|
Rate of increase in compensation
|
N/A
|
|
N/A
|
|
3.55
|
%
|
3.15
|
%
|
||||
Components of the net change in Accumulated other comprehensive loss related to defined benefit pension plans on the Company’s consolidated statements of changes in stockholders’ equity for the year ended December 31, 2013 and 2012 are as follows:
|
U.S. Plans
|
Non-U.S. Plans
|
||||||||||||||
|
2013
|
2012
|
2013
|
2012
|
||||||||||||
|
(Dollars in Millions)
|
|||||||||||||||
|
Actuarial (gains) / losses
|
$
|
(137
|
)
|
$
|
33
|
|
$
|
10
|
|
$
|
117
|
|
|||
|
Prior Service Credit
|
(2
|
)
|
—
|
|
—
|
|
—
|
|
|||||||
|
Deferred taxes
|
—
|
|
—
|
|
—
|
|
(10
|
)
|
|||||||
|
Currency/Other
|
—
|
|
—
|
|
4
|
|
7
|
|
|||||||
|
Reclassification to net income
|
—
|
|
(9
|
)
|
(2
|
)
|
(5
|
)
|
|||||||
|
$
|
(139
|
)
|
$
|
24
|
|
$
|
12
|
|
$
|
109
|
|
||||
The U.S. actuarial gains of
$137 million
for the year ended December 31, 2013 are primarily related to higher discount rate assumptions. Actuarial losses of
$3 million
for the non-U.S. retirement plans are expected to be realized during 2014.
Benefit payments, which reflect expected future service, are expected to be paid by the Company plans, as follows:
|
U.S. Plans
|
Non-U.S. Plans
|
||||||
|
(Dollars in Millions)
|
|||||||
|
2014
|
$
|
72
|
|
$
|
20
|
|
|
|
2015
|
69
|
|
19
|
|
|||
|
2016
|
68
|
|
21
|
|
|||
|
2017
|
67
|
|
23
|
|
|||
|
2018
|
67
|
|
26
|
|
|||
|
Years 2019 — 2023
|
339
|
|
177
|
|
|||
In the year ended December 31, 2013, cash contributions to the Company's U.S. and non-U.S. defined benefit pension plans were
$5 million
and
$33 million
, respectively. Additionally, the Company expects to make cash contributions to its U.S. defined benefit pension plans of
$14 million
in 2014. Contributions to non-U.S. defined benefit pension plans are expected to be
$37 million
during 2014. The Company’s expected 2014 contributions may be revised.
In January 2012 the Company contributed approximately
1.5 million
shares of common stock valued at approximately
$73 million
to its two largest U.S. defined benefit pension plans. This contribution was in excess of 2011 and 2012 plan year minimum required contributions for those plans by approximately
$40 million
. As of December 31, 2012, all shares previously contributed to the plans had been sold, with an average share price of approximately
$44
.
Substantially all of the Company’s defined benefit pension plan assets are managed by external investment managers and held in trust by third-party custodians. The selection and oversight of these external service providers is the responsibility of the investment committees and their advisors. The selection of specific securities is at the discretion of the investment manager and is subject to the provisions set forth by written investment management agreements and related policy guidelines regarding permissible investments, risk management practices and the use of derivative securities. Derivative securities may be used by investment managers as efficient substitutes for traditional securities, to reduce portfolio risks or to hedge identifiable economic exposures.
77
The use of derivative securities to create economic leverage to engage in unrelated speculation is expressly prohibited. External investment managers are prohibited from investing in any debt or equity securities related to the Company or its affiliates. The Company's equity is permitted when it is the result of a corporate contribution to the plan.
The primary objective of the pension funds is to pay the plans’ benefit and expense obligations when due. Given the relatively long time horizon of these obligations and their sensitivity to interest rates, the investment strategy is intended to improve the funded status of its U.S. and non-U.S. plans over time while maintaining a prudent level of risk. Risk is managed primarily by diversifying each plan’s target asset allocation across equity, fixed income securities and alternative investment strategies, and then maintaining the allocation within a specified range of its target. In addition, diversification across various investment subcategories within each plan is also maintained within specified ranges. The Company’s retirement plan asset allocation at December 31, 2013 and 2012 and target allocation for 2014 are as follows:
|
|
Target Allocation
|
Percentage of Plan Assets
|
|||||||||||||||
|
U.S.
|
Non-U.S.
|
U.S.
|
Non-U.S.
|
||||||||||||||
|
2014
|
2014
|
2013
|
2012
|
2013
|
2012
|
||||||||||||
|
Equity securities
|
33
|
%
|
25
|
%
|
34
|
%
|
44
|
%
|
24
|
%
|
15
|
%
|
|||||
|
Fixed income
|
28
|
%
|
65
|
%
|
13
|
%
|
15
|
%
|
64
|
%
|
74
|
%
|
|||||
|
Alternative strategies
|
39
|
%
|
5
|
%
|
52
|
%
|
39
|
%
|
6
|
%
|
7
|
%
|
|||||
|
Cash
|
—
|
%
|
5
|
%
|
1
|
%
|
2
|
%
|
6
|
%
|
4
|
%
|
|||||
|
100
|
%
|
100
|
%
|
100
|
%
|
100
|
%
|
100
|
%
|
100
|
%
|
||||||
The expected long-term rate of return for defined benefit pension plan assets has been chosen based on various inputs, including returns projected by various external sources for the different asset classes held by and to be held by the Company’s trusts and its targeted asset allocation. These projections incorporate both historical returns and forward looking views regarding capital market returns, inflation and other variables. Pension plan assets are valued at fair value using various inputs and valuation techniques. A description of the inputs and valuation techniques used to measure the fair value for each class of plan assets is included in Note 16 “Fair Value Measurements.”
Defined Contribution Plans
Most U.S. salaried employees and certain non-U.S. employees are eligible to participate in defined contribution plans by contributing a portion of their compensation, which is partially matched by the Company. Effective January 1, 2012, matching contributions for the U.S. defined contribution plan were increased to
100%
on the first
6%
of pay contributed. The expense related to matching contributions was approximately
$11 million
in 2013,
$14 million
in 2012, and
$5 million
in 2011 .
Other Postretirement Employee Benefit Plans
In the U.S. and Canada, the Company has a financial obligation for the cost of providing other postretirement health care and life insurance benefits to its employees under Company-sponsored plans. These plans generally pay for the cost of health care and life insurance for retirees and dependents, less retiree contributions and co-pays. Other postretirement benefit obligations were
$6 million
at December 31, 2013 and 2012.
The Visteon Corporation 2010 Incentive Plan (the “2010 Incentive Plan”)
provides for the grant of up to
5.6 million
shares of common stock for
restricted stock awards (“RSAs”), restricted stock units (“RSUs”),
non-qualified stock options ("Stock Options"), stock appreciation rights (“SARs”), performance based share units ("PSUs"), and other stock based awards. The Company's stock-based compensation instruments are accounted for as equity awards or liability awards based on settlement intention as follows.
|
•
|
For equity settled stock-based compensation instruments, compensation cost is measured based on grant date fair value of the award and is recognized over the applicable service period. For equity settled stock-based compensation instruments, the delivery of Company shares may be on a gross settlement basis or on a net settlement basis, as determined by the recipient. The Company's policy is to deliver such shares using treasury shares or issuing new shares.
|
|
•
|
Cash settled stock-based compensation instruments are subject to liability accounting. At period end, the vested portion of the obligation for cash settled stock-based compensation instruments is adjusted to fair value based on the period-ending market prices of the Company's common stock. Related compensation expense is recognized based on changes to the fair value over the applicable service period.
|
78
Generally, the Company's stock-based compensation instruments are subject to graded vesting and recognized on an accelerated basis. The settlement intention of the awards is at the discretion of the Organization and Compensation Committee of the Company's Board of Directors. The total stock-based compensation expense recognized and unrecognized was as follows:
|
Year Ended December 31
|
Unrecognized Stock-Based Compensation Expense
|
||||||||||||||
|
2013
|
2012
|
2011
|
December 31, 2013
|
||||||||||||
|
(Dollars in Millions)
|
|||||||||||||||
|
Restricted stock awards
|
$
|
3
|
|
$
|
17
|
|
$
|
31
|
|
$
|
3
|
|
|||
|
Restricted stock units
|
12
|
|
5
|
|
7
|
|
6
|
|
|||||||
|
Stock options
|
—
|
|
3
|
|
8
|
|
—
|
|
|||||||
|
Stock appreciation rights
|
1
|
|
1
|
|
1
|
|
—
|
|
|||||||
|
Performance based share units
|
13
|
|
5
|
|
—
|
|
23
|
|
|||||||
|
Total stock-based compensation expense
|
$
|
29
|
|
$
|
31
|
|
$
|
47
|
|
$
|
32
|
|
|||
Restricted Stock Awards and Restricted Stock Units
RSAs and RSUs expected to be settled in shares of the Company's common stock are recorded as equity awards. Grant date fair value is measured as the average of the high and low market price of the Company's common stock as traded on the New York Stock Exchange on the date of grant. The grant date fair value for the 2010 RSAs was estimated based on the weighted average trading prices of the Company’s common stock for the five business days immediately following the Effective Date. The Company granted
117,000
shares of RSAs during the year ended December 31, 2012, at weighted average grant date fair value of
$53.48
per share. Unrecognized compensation expense at December 31, 2013 was
$3 million
for non-vested RSAs and will be recognized on a weighted average basis over the remaining vesting period of less than
one
year. The Company granted
17,500
and
225,000
RSUs, expected to be settled in shares, during the year ended December 31, 2013 and December 31, 2012, respectively, at a weighted average grant date fair value of
$75.69
per share and
$43.47
per share, respectively. These awards generally vest in
one-third
increments on the grant date anniversary over a
three
year vesting period. Unrecognized compensation expense at December 31, 2013 was
$5 million
for non-vested RSUs and will be recognized over the remaining vesting period of less than
one
year.
RSUs expected to be settled in cash are accounted for as liability awards. The Company granted
1,000
and
71,000
RSUs, expected to be settled in cash, during the year ended December 31, 2013 and 2012, respectively, at weighted average grant date fair values
$59.34
per share and
$46.29
per share, respectively. The Company made cash settlement payments of
$8 million
and
$5 million
during the years ended December 31, 2013 and 2012, respectively. At December 31, 2013 and 2012,
$4 million
was recorded under Accrued employee liabilities in both years relating to RSUs while
$1 million
and
$6 million
, respectively, were recorded under Employee benefits relating to RSUs. These awards generally vest in
one-third
increments on the grant date anniversary over a
three
year vesting period. Unrecognized compensation expense at December 31, 2013 was
$1 million
for non-vested RSUs and will be recognized on a weighted average basis over the remaining vesting period of approximately
1.3
years. RSUs awarded under the Non-Employee Director Stock Unit Plan vest immediately but are not cash settled until the participant terminates service.
A summary of activity for RSAs and RSUs, including grants, vesting and forfeitures is provided below.
|
RSAs
|
RSUs
|
Weighted Average Grant Date Fair Value
|
|||||||
|
(In Thousands)
|
|||||||||
|
Non-vested at December 31, 2010
|
1,035
|
|
357
|
|
$
|
57.93
|
|
||
|
Granted
|
—
|
|
1
|
|
49.83
|
|
|||
|
Vested
|
(345
|
)
|
(93
|
)
|
57.93
|
|
|||
|
Forfeited
|
(34
|
)
|
(8
|
)
|
57.93
|
|
|||
|
Non-vested at December 31, 2011
|
656
|
|
257
|
|
57.92
|
|
|||
|
Granted
|
117
|
|
296
|
|
47.16
|
|
|||
|
Vested
|
(482
|
)
|
(123
|
)
|
58.02
|
|
|||
|
Forfeited
|
(63
|
)
|
(27
|
)
|
55.60
|
|
|||
|
Non-vested at December 31, 2012
|
228
|
|
403
|
|
51.20
|
|
|||
|
Granted
|
—
|
|
19
|
|
74.55
|
|
|||
|
Vested
|
(199
|
)
|
(200
|
)
|
54.76
|
|
|||
|
Forfeited
|
(10
|
)
|
(61
|
)
|
44.88
|
|
|||
|
Non-vested at December 31, 2013
|
19
|
|
161
|
|
$
|
48.26
|
|
||
79
Stock Options and Stock Appreciation Rights
Stock Options expected to be settled in shares of the Company's common stock are recorded as equity awards with an exercise price equal to the average of the high and low market price at which the Company's common stock was traded on the New York Stock Exchange on the date of grant. The grant date fair value of these awards is measured using the The Black-Scholes option pricing model. The Company granted
155,000
Stock Options during the year ended December 31, 2012. The weighted average grant date fair value of Stock Options granted during the year ended December 31, 2012 was
$25.16
per share. Stock Options generally vest in
one-third
increments on the grant date anniversary over a
three
year vesting period and have an expiration date
10
years from the date of grant. The Company received
$2 million
from stock options exercised during the year ended December 31, 2013. Unrecognized compensation expense for non-vested Stock Options at December 31, 2013 was less than
one million
and is expected to be recognized over a weighted average period of less than
one
year.
SARs expected to be settled in cash and are accounted for as liability awards with an exercise price equal to the average of the high and low market price at which the Company's common stock was traded on the New York Stock Exchange on the date of grant. The Company granted
32,000
SARs with a weighted average fair value of
$20.78
as of December 31, 2012. The fair value of SARs is determined at each period-end using the Black-Scholes option pricing model. At December 31, 2013 and 2012 the Company recorded approximately
$3 million
and
$2 million
, respectively, under the caption Accrued Employee benefits and recorded compensation expense of
$1 million
and
$1 million
, respectively. SARs generally vest in
one-third
increments on the grant date anniversary over a
three
year vesting period and have an expiration date
10
years from the date of grant. Unrecognized compensation expense at December 31, 2013 was less than
one million
for non-vested SARs and will be recognized on a weighted average basis over the remaining vesting period of less than
one
year.
The Black-Scholes option pricing model requires management to make various assumptions including the expected term, expected volatility, risk free interest rate, and dividend yield. The expected term represents the period of time that granted awards are expected to be outstanding and is estimated based on considerations including the vesting period, contractual term and anticipated employee exercise patterns. Expected volatility is calculated based on a rolling average of the daily stock closing prices of a peer group of companies with a period equal to the expected life of the award. The peer group of companies was used due to the relatively short history of the Company's common stock since its emergence from the bankruptcy. The peer group was established using the criteria of similar industry (utilizing product mix), size (measured by market capitalization), leverage (measured using debt to equity ratio) and length of history. The risk-free rate is based on the U.S. Treasury yield curve in relation to the contractual life of the stock-based compensation instrument. The dividend yield is based on historical patterns and future expectations for Company dividends.
Weighted average assumptions used to estimate the fair value of awards during the year ended and as of December 31, 2013 and 2012 are as follows:
|
Stock Options
|
SARs
|
|||||||||||||||
|
2013
|
2012
|
2011
|
2013
|
2012
|
2011
|
|||||||||||
|
Expected term (in years)
|
N/A
|
6
|
|
6
|
|
4.45
|
|
5.07
|
|
6
|
|
|||||
|
Expected volatility
|
N/A
|
48.96
|
%
|
46.37
|
%
|
42.14
|
%
|
51.69
|
%
|
50.30
|
%
|
|||||
|
Risk-free interest rate
|
N/A
|
1.12
|
%
|
2.59
|
%
|
1.51
|
%
|
0.74
|
%
|
0.98
|
%
|
|||||
|
Expected dividend yield
|
N/A
|
—
|
%
|
—
|
%
|
—
|
%
|
—
|
%
|
—
|
%
|
|||||
80
A summary of activity for Stock Options and SARs, including award grants, vesting and forfeitures is provided below.
|
Stock Options
|
Weighted Average
Exercise Price
|
SARs
|
Weighted Average
Exercise Price
|
||||||||||
|
(In Thousands)
|
(In Thousands)
|
||||||||||||
|
Outstanding at December 31, 2010
|
—
|
|
$
|
—
|
|
—
|
|
$
|
—
|
|
|||
|
Granted
|
482
|
|
72.60
|
|
94
|
|
74.08
|
|
|||||
|
Exercised
|
—
|
|
—
|
|
—
|
|
—
|
|
|||||
|
Forfeited or expired
|
(92
|
)
|
74.08
|
|
(10
|
)
|
74.08
|
|
|||||
|
Outstanding at December 31, 2011
|
390
|
|
72.26
|
|
84
|
|
74.08
|
|
|||||
|
Granted
|
155
|
|
53.57
|
|
32
|
|
53.57
|
|
|||||
|
Exercised
|
—
|
|
—
|
|
—
|
|
—
|
|
|||||
|
Forfeited or expired
|
(183
|
)
|
66.64
|
|
(18
|
)
|
68.06
|
|
|||||
|
Outstanding at December 31, 2012
|
362
|
|
67.13
|
|
98
|
|
68.36
|
|
|||||
|
Granted
|
—
|
|
—
|
|
—
|
|
—
|
|
|||||
|
Exercised
|
(36
|
)
|
55.88
|
|
(3
|
)
|
61.42
|
|
|||||
|
Forfeited or expired
|
(120
|
)
|
67.81
|
|
(19
|
)
|
66.80
|
|
|||||
|
Outstanding at December 31, 2013
|
206
|
|
$
|
68.74
|
|
76
|
|
$
|
69.06
|
|
|||
|
Exercisable at December 31, 2013
|
130
|
|
$
|
71.51
|
|
50
|
|
$
|
71.27
|
|
|||
|
Stock Options and SARs Outstanding
|
||||||||
|
Exercise Price
|
Number Outstanding
|
Weighted
Average
Remaining Life
|
Weighted
Average
Exercise Price
|
|||||
|
(In Thousands)
|
(In Years)
|
|||||||
|
$45.01 - $55.00
|
69
|
|
8.29
|
$
|
53.57
|
|
||
|
$55.01 - $65.00
|
5
|
|
7.25
|
$
|
62.28
|
|
||
|
$65.01 - $75.08
|
208
|
|
7.25
|
$
|
74.08
|
|
||
|
282
|
|
|||||||
Performance Based Share Units
PSUs that are expected to be settled in shares of the Company's common stock are recorded as equity awards. PSUs that are expected to be settled in cash are accounted for as liability awards. During the first quarter of 2012, the Company granted
188,000
PSUs. The number of such PSUs that will vest is based on the Company's achievement of targeted performance levels related to a pre-established relative total shareholder return ("RTSR") goal compared to its peer group of automotive companies over a three-year period, which may range from
0%
to
150%
of the target award amount. During the fourth quarter of 2012, the Company granted an additional
1,123,000
PSUs. The number of such PSU's that will vest is based on the Company's achievement of a pre-established total shareholder return ("TSR") metric over a three year period, which may range from
0%
to
100%
of the target award. PSUs will vest on December 31, 2015 and the final award will be determined by the Compensation Committee. A portion of each grant is expected to be settled in stock and cash.
For PSUs expected to be settled in shares of the Company's common stock, the grant date fair value was determined using the Monte Carlo valuation model. Unrecognized compensation expense at December 31, 2013 was
$15 million
for the non-vested portion of these awards and will be recognized over the remaining vesting period of approximately
1.94
years. For PSUs expected to be settled in cash, the period ending fair value of the obligation for these awards was determined using the Monte Carlo valuation model. Unrecognized compensation expense at December 31, 2013 was
$8 million
for the non-vested portion of these awards and will be recognized over the remaining vesting period of approximately
1.94
years.
The Monte Carlo valuation model requires management to make various assumptions including the expected volatility, risk free interest rate and dividend yield. Expected volatility of
33.00%
was calculated based on a rolling average of the daily stock closing prices of a peer group of companies with a period equal to the expected life of the award. The peer group of companies was used due to the relatively short history of the Company's common stock since its emergency from the bankruptcy. The peer group was established using the criteria of similar industry (utilizing product mix), size (measured by market capitalization), leverage
81
(measured using debt to equity ratio) and length of history. The risk-free rate of
0.13%
was based on the U.S. Treasury yield curve in relation to the contractual life of the stock-based compensation instrument. The dividend yield of
0.00%
is based on historical patterns and future expectations for Company dividends.
A summary of activity for PSUs, including award grants, vesting and forfeitures is provided below.
|
PSUs
|
Weighted Average Grant Date Fair Value
|
|||||
|
(In Thousands)
|
||||||
|
Granted
|
1,311
|
|
$
|
33.85
|
|
|
|
Forfeited
|
(57
|
)
|
$
|
45.57
|
|
|
|
Non-vested at December 31, 2012
|
1,254
|
|
$
|
33.32
|
|
|
|
Granted
|
—
|
|
$
|
—
|
|
|
|
Forfeited
|
(265
|
)
|
$
|
32.33
|
|
|
|
Non-vested at December 31, 2013
|
989
|
|
$
|
33.59
|
|
|
Other expense, net consists of the following:
|
Year Ended December 31
|
|||||||||||
|
2013
|
2012
|
2011
|
|||||||||
|
(Dollars in Millions)
|
|||||||||||
|
Transformation costs
|
$
|
40
|
|
$
|
33
|
|
$
|
7
|
|
||
|
Gain on sale of joint venture interest
|
(5
|
)
|
(19
|
)
|
—
|
|
|||||
|
Loss on debt extinguishment
|
2
|
|
6
|
|
24
|
|
|||||
|
UK Administration recovery
|
(2
|
)
|
—
|
|
(18
|
)
|
|||||
|
Loss on asset contribution
|
—
|
|
14
|
|
—
|
|
|||||
|
Asset impairments
|
—
|
|
5
|
|
—
|
|
|||||
|
Reorganization-related costs, net
|
—
|
|
2
|
|
8
|
|
|||||
|
Deconsolidation gains
|
—
|
|
—
|
|
(8
|
)
|
|||||
|
Gain on sale of assets
|
—
|
|
—
|
|
(2
|
)
|
|||||
|
$
|
35
|
|
$
|
41
|
|
$
|
11
|
|
|||
Year Ended December 31, 2013
Business transformation costs of
$40 million
for the year ended December 31, 2013, were related to financial and advisory services associated with continued execution of the Company's comprehensive value creation plan, including the following activities:
|
•
|
Climate consolidation - During the first quarter of 2013, Halla purchased certain subsidiaries and intellectual property of Visteon's global climate business for approximately
$410 million
. With effect from February 1, 2013,
this combined climate business has been operating under the
name of Halla Visteon Climate Control Corporation ("HVCC"), who is majority-owned by Visteon and headquartered in South Korea.
|
|
•
|
Electronics optimization - During the fourth quarter of 2013 the Company made a cash payment of $
58 million
to subscribe to an additional
11%
ownership interest in YFVE. This step acquisition increased Visteon's direct ownership interest in YFVE from a non-controlling
40%
direct ownership interest to a controlling
51%
direct ownership interest. Additionally, the Company invested $
48 million
during the fourth quarter of 2013 in a non-consolidated electronics holding company owned
50%
by Visteon and
50%
by Yanfeng. On January 13, 2014, Visteon reached an agreement to acquire the automotive electronics business of Johnson Controls for cash of $
265 million
. The acquisition is subject to certain regulatory and other consents and approvals and is expected to be completed in the second quarter of 2014.
|
|
•
|
Interiors strategy - The Company has determined that its Interiors business is not aligned with its long-term strategic goals and continues to explore alternatives including, but not limited to, divestiture, partnership or alliance. While the Company views Interiors as a non-core business, it continues to make commitments to this business and intends to divest in the future only under acceptable terms and conditions. On December 17, 2013, Visteon completed the sale of its
50%
|
82
ownership interest in Yanfeng Visteon Automotive Trim Systems Co., Ltd., ("Yanfeng") a significant interiors equity investee, for cash proceeds of $
928 million
(before applicable taxes). The Company's goal is to dispose of the remainder of its Interiors businesses in three separate transactions targeted for 2014. Due to certain liabilities and capital requirements of many of the these remaining businesses, the Company may be required to contribute cash to such businesses in connection with any disposition, which amounts could be material.
In connection with the preparation of the December 31, 2013 financial statements, the Company determined that an indicator of impairment existed in relation to the net assets of its Interiors business, which approximated $
220 million
as of December 31, 2013. Accordingly, the Company performed a recoverability test utilizing a probability weighted analysis of cash flows associated with continuing to run and operate the Interiors business and estimated cash flows associated with the potential sale of the Interiors business. As a result of the analysis, the Company concluded that the assets were not recoverable. However, no impairment was recorded as of December 31, 2013 as the fair value of the underlying assets were determined to be in excess of the respective carrying value. To the extent that a sale transaction becomes more likely to occur in future periods an impairment charge may be required and such charge could be material. As of December 31, 2013 the Company did not meet the specific criteria necessary for the Interiors assets to be considered held for sale.
|
•
|
Cost reduction program - In November 2012, the Company announced a
$100 million
restructuring program designed to reduce fixed costs and to improve operational efficiency by addressing certain under-performing operations. Through December 31, 2013, the Company recorded approximately
$76 million
for total inception to date expense under the program. The Company anticipates recording additional restructuring charges related to this program in future periods as underlying plans are finalized.
|
In June 2013, the Company completed the sale of its
20%
equity interest in Dongfeng Visteon Automotive Trim Systems Co., Ltd. ("Dongfeng") for proceeds of approximately
$20 million
and recognized a gain of approximately
$5 million
. Dongfeng is an interiors joint venture based in China with 2012 revenue of
$190 million
.
Loss on debt extinguishment of
$2 million
related to the
103%
redemption premium paid on the December 2013 repurchase of
$50 million
of the Company's 6.75% Senior Notes due April 15, 2019.
In September 2013, the Company received a distribution of
$2 million
under the United Kingdom Insolvency Act of 1986 resulting from the liquidation and recovery process associated with the estate of Visteon UK Limited, a company organized under the laws of England and Wales and a former indirect, wholly-owned subsidiary of the Company. The recovery was primarily related to various trade and loan receivables due from Visteon UK Limited to the Company at the March 2009 date of entry into administration.
Year Ended December 31, 2012
In August 2012, the Company sold its
50%
ownership interest in R-Tek Limited, a UK-based Interiors joint venture, for cash proceeds of approximately
$30 million
, which resulted in a gain of
$19 million
.
Loss on debt extinguishment of
$6 million
was comprised of
$4 million
related to unamortized amounts attributable to the Korean Bridge Loan that was repaid during the third quarter of 2012 and
$2 million
related to the
103%
redemption premium paid on the December 2012 repurchase of
$50 million
of the Company's 6.75% Senior Notes due April 15, 2019.
The Company recorded a loss of
$14 million
associated with assets, including land, building and machinery, contributed to the local municipality in Spain for the benefit of employees in connection with the closure of the Cadiz Electronics operation.
Year Ended December 31, 2011
In 2011, the Company recorded a loss of
$24 million
on the early extinguishment of the Term Loan including
$21 million
of unamortized original issuance discount and debt fees that were recorded net of the Term Loan principal on the face of the Company’s consolidated balance sheets immediately prior to extinguishment.
In December 2011, the Company received an initial distribution of
$18 million
, in connection with the liquidation and recovery process under the UK Administration, these amounts primarily represented recoveries on amounts owed to Visteon for various trade and loan receivables due from the UK Debtor.
83
Details of the Company's income tax provision from continuing operations are provided in the table below:
|
Year Ended December 31
|
|||||||||||
|
2013
|
2012
|
2011
|
|||||||||
|
(Dollars in Millions)
|
|||||||||||
|
Income (loss) before income taxes
(a)
|
|||||||||||
|
U.S
|
$
|
(112
|
)
|
$
|
(165
|
)
|
$
|
(141
|
)
|
||
|
Non-U.S
|
781
|
|
230
|
|
310
|
|
|||||
|
Total income before income taxes
|
$
|
669
|
|
$
|
65
|
|
$
|
169
|
|
||
|
Current tax provision
|
|||||||||||
|
U.S. federal
|
$
|
5
|
|
$
|
4
|
|
$
|
1
|
|
||
|
Non-U.S
|
165
|
|
125
|
|
126
|
|
|||||
|
U.S. state and local
|
1
|
|
1
|
|
1
|
|
|||||
|
Total current tax provision
|
171
|
|
130
|
|
128
|
|
|||||
|
Deferred tax provision (benefit)
|
|||||||||||
|
U.S. federal
|
—
|
|
(3
|
)
|
1
|
|
|||||
|
Non-U.S
|
(64
|
)
|
(6
|
)
|
(2
|
)
|
|||||
|
Total deferred tax provision (benefit)
|
(64
|
)
|
(9
|
)
|
(1
|
)
|
|||||
|
Provision for income taxes
|
$
|
107
|
|
$
|
121
|
|
$
|
127
|
|
||
|
(a)
Income (loss) before income taxes excludes equity in net income of non-consolidated affiliates.
|
|||||||||||
A summary of the differences between the provision for income taxes calculated at the U.S. statutory tax rate of
35%
and the consolidated provision for income taxes is shown below:
|
Year Ended December 31
|
|||||||||||
|
2013
|
2012
|
2011
|
|||||||||
|
(Dollars in Millions)
|
|||||||||||
|
Income before income taxes, excluding equity in net income of non-consolidated affiliates, at U.S. statutory rate of 35%
|
$
|
234
|
|
$
|
23
|
|
$
|
59
|
|
||
|
Impact of foreign operations
|
(71
|
)
|
75
|
|
45
|
|
|||||
|
State and local income taxes
|
(1
|
)
|
(2
|
)
|
4
|
|
|||||
|
Tax reserve adjustments
|
(52
|
)
|
12
|
|
22
|
|
|||||
|
Change in valuation allowance
|
86
|
|
(1
|
)
|
190
|
|
|||||
|
Fresh-start accounting and reorganization items, net
|
—
|
|
—
|
|
(215
|
)
|
|||||
|
Impact of tax law change
|
(32
|
)
|
1
|
|
18
|
|
|||||
|
Yanfeng transactions
|
(58
|
)
|
—
|
|
—
|
|
|||||
|
Other
|
1
|
|
13
|
|
4
|
|
|||||
|
Provision for income taxes
|
$
|
107
|
|
$
|
121
|
|
$
|
127
|
|
||
The favorable impact of foreign operations of
$71 million
includes a
$58 million
favorable variance due to income taxes on foreign earnings taxed at rates lower than the U.S. statutory rate,
$54 million
represents primarily U.S. foreign tax credit adjustments, and
$16 million
represents the reduction of U.S. income tax associated with the taxation of non-U.S. earnings due to transfers of offshore cash between countries (“look-through” rules). The American Taxpayer Relief Act of 2012 retroactively extended the “look-through” provisions to December 31, 2013 on January 2, 2013. Because tax law changes are recognized in the period in which new legislation is enacted, the
$16 million
was reflected as a favorable discrete adjustment in the first quarter of 2013, but due to the Company's valuation allowance in the U.S. there was no net impact to the Company's provision for income taxes in 2013 or 2012 related to this item. These amounts were partially offset by
$34 million
of non-U.S. withholding taxes and
$23 million
of U.S. and non-U.S. income taxes related to the repatriation of earnings. The U.S. income tax consequences of these items approximate
$47 million
and were entirely offset by the U.S. valuation allowance. Tax reserve adjustments of
$52 million
primarily relate
to reevaluating transfer pricing-related exposures in Europe and the United States due to audit closures during 2013. The
$32 million
impact of tax law changes is primarily attributable to tax reform in Mexico resulting in restoration of
84
deferred tax assets, including net operating loss carryforwards, which were partially offset by a related valuation allowance of
$26 million
. The favorable
$58 million
variance related to the Yanfeng transactions primarily reflects the tax benefit associated with available foreign tax credits. The U.S. income tax consequences associated with the Yanfeng transactions approximate
$54 million
and were fully offset by the U.S. valuation allowance.
During the fourth quarter of 2013, the Company’s Visteon Climate Control Beijing Co., Ltd. operations received high-tech status from the Chinese government resulting in a reduction of the corporate income tax rate from
25%
to
15%
applied retroactively from January 1, 2013. The
$7 million
income tax benefit from this incentive and
$3 million
benefit in other jurisdictions are included with the impact of foreign operations in the effective tax rate reconciliation above. The income tax benefit from foreign tax holidays was approximately
$3 million
and
$5 million
in 2012 and 2011, respectively, attributable mainly to the Company's Thailand manufacturing operations which benefit from various incentives that expire at various times in the future.
The Company’s provision for income tax for continuing operations was
$121 million
for year ended December 31, 2012. Significant components of the variance from the U.S. statutory rate include
$29 million
of non-U.S. withholding taxes,
$80 million
of U.S. and non-U.S. income taxes related to the planned repatriation of earnings from its unconsolidated and certain consolidated foreign affiliates, and
$16 million
of U.S. income tax associated with the "look-through" rules described above, partially offset by a
$50 million
favorable variance for foreign rate differentials. The U.S. income tax consequences in connection with the Company's earnings from these affiliates of approximately
$93 million
were offset with the U.S. valuation allowance. The tax reserve adjustments of
$12 million
primarily relate to interest accrued on tax positions related to prior periods. Other items impacting the effective rate of
$13 million
primarily represent U.S. tax adjustments offset by an equal and opposite amount against the U.S. valuation allowance.
The Company’s provision for income tax for continuing operations was
$127 million
for year ended December 31, 2011. Significant components of the variance from the U.S. statutory rate include
$34 million
of non-U.S. withholding taxes,
$55 million
of U.S. and non-U.S. income taxes related to the planned repatriation of earnings from its unconsolidated and certain consolidated foreign affiliates, partially offset by a
$44 million
favorable variance for foreign rate differentials. The U.S. income tax consequences in connection with the Company's earnings from these affiliates of approximately
$56 million
were offset with the U.S. valuation allowance. The tax reserve adjustments of
$22 million
includes
$15 million
related to unrecognized tax benefits that are embedded in other deferred tax attributes offset by the U.S. valuation allowance. The fresh-start accounting adjustments and reorganization items include true-up adjustments to the net deferred tax assets related to the derecognition of U.S. tax loss and credit carryforwards as a result of the annual limitation imposed under IRC Sections 382 and 383, the legal entity restructuring approved as part of the Plan of Reorganization which utilized U.S. tax loss and credit carryforwards pre-emergence and other matters, all of which impact both the underlying deferred taxes and the related valuation allowances. The
$18 million
impact of tax law changes reflects an increase in the tax rate in Korea which increased the Company's net deferred tax liabilities by
$6 million
, as well as tax law changes in Michigan resulting in the elimination of
$12 million
in net operating loss carryforwards which were fully offset by the related valuation allowance.
Deferred income taxes and related valuation allowances
Deferred income taxes are provided for temporary differences between amounts of assets and liabilities for financial reporting purposes and the basis of such assets and liabilities as measured by tax laws and regulations, as well as net operating loss, tax credit and other carryforwards. The Company has recorded a deferred tax liability, net of valuation allowances, for U.S. and non-U.S. income taxes and non-U.S. withholding taxes of approximately
$46 million
and
$83 million
as of December 31, 2013 and 2012, respectively, on the undistributed earnings of certain consolidated and unconsolidated foreign affiliates as such earnings are intended to be repatriated in the foreseeable future. The Company has not provided for deferred income taxes or foreign withholding taxes on the remainder of undistributed earnings from certain consolidated foreign affiliates because such earnings are considered to be permanently reinvested. It is not practicable to determine the amount of deferred tax liability on such earnings as the actual tax liability, if any, is dependent on circumstances existing when remittance occurs.
Deferred tax assets are required to be reduced by a valuation allowance if, based on all available evidence, both positive and negative, it is considered more likely than not that some portion or all of the recorded deferred tax assets will not be realized in future periods. Significant management judgment is required in determining the Company’s valuation allowance. In making this assessment, management considers evidence including, historical and projected financial performance, as well as the nature, frequency and severity of recent losses along with any other pertinent information.
In determining the need for a valuation allowance, the Company also evaluates existing valuation allowances. During 2013, certain Korean legal entities were merged which should result in the future utilization of foreign tax credits in Korea for which a valuation allowance was previously recorded, and consequently, the Company recognized a tax benefit of
$12 million
related to the elimination
85
of the related valuation allowance. During 2012, the Company recorded a tax benefit of
$8 million
attributable to the elimination of valuation allowances at several foreign subsidiaries in China, India and the Czech Republic. During the third quarter of 2011, the Company recorded a tax benefit of
$8 million
related to the reversal of a full valuation allowance with respect to the deferred tax assets of its UK subsidiary. During the fourth quarter of 2011, the Company recorded a
$66 million
impairment charge attributable to the Company's Lighting assets. Approximately
$16 million
of the impairment charge related to jurisdictions where deferred tax assets are fully offset by a valuation allowance. The remaining
$50 million
related to other foreign jurisdictions where the Company concluded, based on the available evidence, it was more likely than not that the deferred tax assets associated with these jurisdictions would not be realized.
The need to maintain valuation allowances against deferred tax assets in the U.S. and other affected countries will cause variability in the Company’s effective tax rate. The Company will maintain full valuation allowances against deferred tax assets in the U.S. and applicable foreign countries, including Germany, France, and Spain until sufficient positive evidence exists to reduce or eliminate the valuation allowances. At December 31, 2013 and 2012, the Company had net deferred tax assets, net of valuation allowances, of approximately
$42 million
and
$36 million
, respectively, in certain foreign jurisdictions, the realization of which is dependent on generating sufficient taxable income in future periods. While the Company believes it is more likely than not that these deferred tax assets will be realized, failure to achieve taxable income targets which considers, among other sources, future reversals of existing taxable temporary differences, would likely result in an increase in the valuation allowance in the applicable period.
The components of deferred income tax assets and liabilities are as follows:
|
December 31
|
|||||||
|
2013
|
2012
|
||||||
|
(Dollars in Millions)
|
|||||||
|
Deferred tax assets:
|
|||||||
|
Employee benefit plans
|
$
|
83
|
|
$
|
135
|
|
|
|
Capitalized expenditures for tax reporting
|
53
|
|
82
|
|
|||
|
Net operating losses and carryforwards
|
1,508
|
|
1,350
|
|
|||
|
All other
|
235
|
|
224
|
|
|||
|
Valuation allowance
|
(1,710
|
)
|
(1,695
|
)
|
|||
|
Total deferred tax assets
|
$
|
169
|
|
$
|
96
|
|
|
|
Deferred tax liabilities:
|
|||||||
|
Fixed assets and intangibles
|
$
|
116
|
|
$
|
111
|
|
|
|
Investment in foreign affiliates, including withholding tax
|
96
|
|
75
|
|
|||
|
All other
|
32
|
|
42
|
|
|||
|
Total deferred tax liabilities
|
$
|
244
|
|
$
|
228
|
|
|
|
Net deferred tax liabilities
|
$
|
75
|
|
$
|
132
|
|
|
|
Reported in Consolidated Balance Sheet as:
|
|||||||
|
Other current assets
|
$
|
36
|
|
$
|
26
|
|
|
|
Other non-current assets
|
69
|
|
28
|
|
|||
|
Other current liabilities
|
43
|
|
5
|
|
|||
|
Deferred tax liabilities non-current
|
137
|
|
181
|
|
|||
|
$
|
75
|
|
$
|
132
|
|
||
At December 31, 2013, the Company had available non-U.S. net operating loss carryforwards and tax credit carryforwards of
$1.6 billion
and
$12 million
, respectively, which have carryforward periods ranging from
5
years to
indefinite
. The Company had available U.S. federal net operating loss carryforwards of
$1.5 billion
at December 31, 2013, which will expire at various dates between
2028
and
2032
. U.S. foreign tax credit carryforwards are
$421 million
at December 31, 2013. These credits will begin to expire in
2015
. The Company had available tax-effected U.S. state operating loss carryforwards of
$26 million
at December 31, 2013, which will expire at various dates between
2015
and
2032
.
In connection with the Company's emergence from bankruptcy and resulting change in ownership on the Effective Date, an annual limitation was imposed on the utilization of U.S. net operating losses, U.S. credit carryforwards and certain U.S. built-in losses (collectively referred to as “tax attributes”) under Internal Revenue Code (“IRC”) Sections 382 and 383. The collective limitation is approximately
$120 million
per year on tax attributes in existence at the date of change in ownership. Additionally, the Company
86
has approximately
$437 million
of U.S. net operating loss carryforwards and
$145 million
of U.S. foreign tax credits that are not subject to any current limitation since they were realized after the Effective Date.
If the Company were to have another change in ownership within the meaning of IRC Sections 382 and 383, its tax attributes could be further limited to an amount equal to its market capitalization at the time of the subsequent ownership change multiplied by by the federal long-term tax exempt rate. The Company cannot provide any assurance that such an ownership change will not occur, in which case the availability of the Company's tax attributes could be significantly limited or possibly eliminated. In order to continue to protect the Company's pre and post-emergence period tax attributes and reduce the likelihood that the Company will experience an additional ownership change our second amended and restated certificate of incorporation provides, among other things, that any attempted transfer of the Company's securities during a Restricted Period shall be prohibited and void ab initio insofar as it purports to transfer ownership or rights in respect of such stock to the purported transferee to the extent that, as a result of such transfer, either any person or group of persons shall become a “5-percent shareholder” of Visteon pursuant to Treasury Regulation § 1.382-2T(g), other than a “direct public group” as defined in such regulation (a “Five-Percent Shareholder”), or the percentage stock ownership interest in Visteon of any Five-Percent Shareholder shall be increased.
The foregoing restriction does not apply to transfers if either the transferor or transferee gives written notice to the Board of Directors and obtains their approval. A Restricted Period means any period beginning when the Company's market capitalization falls below
$1.5 billion
(or such other level determined by the Board of Directors not more frequently than annually) and ending when such market capitalization has been above such threshold for 30 consecutive calendar days. These restrictions could prohibit or delay the accomplishment of an ownership change with respect to Visteon by (i) discouraging any person or group from being a Five-Percent Shareholder and (ii) discouraging any existing Five-Percent Shareholder from acquiring more than a minimal number of additional shares of Visteon's stock.
As of the end of 2013, valuation allowances totaling
$1.7 billion
have been recorded against the Company’s deferred tax assets where recovery of the deferred tax assets is unlikely. Of this amount,
$1.1 billion
relates to the Company’s deferred tax assets in the U.S. and
$571 million
relates to deferred tax assets in certain foreign jurisdictions, including Germany, a pass-through entity for U.S. tax purposes.
Unrecognized Tax Benefits
The Company operates in multiple jurisdictions throughout the world and the income tax returns of its subsidiaries in various tax jurisdictions are subject to periodic examination by respective tax authorities. The Company regularly assesses the status of these examinations and the potential for adverse and/or favorable outcomes to determine the adequacy of its provision for income taxes. The Company believes that it has adequately provided for tax adjustments that it believes are more likely than not to be realized as a result of any ongoing or future examination. Accounting estimates associated with uncertain tax positions require the Company to make judgments regarding the sustainability of each uncertain tax position based on its technical merits. If the Company determines it is more likely than not a tax position will be sustained based on its technical merits, the Company records the largest amount that is greater than 50% likely of being realized upon ultimate settlement. These estimates are updated at each reporting date based on the facts, circumstances and information available. Due to the complexity of these uncertainties, the ultimate resolution may result in a payment that is materially different from the Company's current estimate of the liabilities recorded.
Gross unrecognized tax benefits were
$73 million
at December 31, 2013 and
$117 million
at December 31, 2012, of which approximately
$30 million
and
$71 million
, respectively, represent the amount of unrecognized benefits that, if recognized, would impact the effective tax rate. The gross unrecognized tax benefit differs from that which would impact the effective tax rate due to uncertain tax positions embedded in other deferred tax attributes carrying a full valuation allowance. Since the uncertainty is expected to be resolved while a full valuation allowance is maintained, these uncertain tax positions should not impact the effective tax rate in current or future periods. The Company records interest and penalties related to uncertain tax positions as a component of income tax expense and related amounts accrued at December 31, 2013 and December 31, 2012 were
$23 million
and
$36 million
, respectively.
During the second quarter of 2013, the IRS commenced the audit of the Company's U.S. tax returns for the 2010 and 2011 tax years. At this stage in the audit, the Company is not aware of any proposed income tax adjustments that would have a material impact on the Company's effective tax rate due to the valuation allowances maintained against the Company's U.S. tax attributes. During the first quarter of 2013, the tax authorities in Spain completed an income tax examination related to the tax years 2006 through 2009 and the Company reached an agreement regarding its transfer pricing methodology resulting in a cash settlement of
$2 million
. During the second quarter of 2013, the Company paid
$2 million
to settle other tax matters (primarily in Mexico). Other net decreases in the Company's gross unrecognized tax benefits that impact the effective tax rate total approximately
$37 million
and primarily relate to reevaluating prior year uncertain tax positions associated with the examination in Spain which
87
further validated the transfer pricing methodologies to allocate income and expense among jurisdictions in Europe and the United States.
With few exceptions, the Company is no longer subject to U.S. federal tax examinations for years before 2009 or state and local, or non-U.S. income tax examinations for years before 2003. Although it is not possible to predict the timing of the resolution of all ongoing tax audits with accuracy, it is reasonably possible that certain tax proceedings in Asia (including Korea) could conclude within the next twelve months and result in a significant increase or decrease in the balance of gross unrecognized tax benefits. Given the number of years, jurisdictions and positions subject to examination, the Company is unable to estimate the full range of possible adjustments to the balance of unrecognized tax benefits. A reconciliation of the beginning and ending amount of unrecognized tax benefits is as follows:
|
Year Ended December 31
|
|||||||
|
2013
|
2012
|
||||||
|
(Dollars in millions)
|
|||||||
|
Beginning balance
|
$
|
117
|
|
$
|
123
|
|
|
|
Tax positions related to current period
|
|||||||
|
Additions
|
8
|
|
15
|
|
|||
|
Tax positions related to prior periods
|
|||||||
|
Additions
|
5
|
|
—
|
|
|||
|
Reductions
|
(51
|
)
|
(20
|
)
|
|||
|
Settlements with tax authorities
|
(4
|
)
|
—
|
|
|||
|
Lapses in statute of limitations
|
(2
|
)
|
(2
|
)
|
|||
|
Effect of exchange rate changes
|
—
|
|
1
|
|
|||
|
Ending balance
|
$
|
73
|
|
$
|
117
|
|
|
During 2012 Korean tax authorities commenced a review of the Company's Korean affiliates (including Halla) for tax years 2007 through 2012 and issued formal notice of assessments, including penalties, of approximately
$25 million
for alleged underpayment of withholding tax on dividends paid and other items, including certain management service fees charged by Visteon. During 2013, the Company's Korean affiliates have paid approximately
$23 million
to the Korean tax authorities, as required under Korean tax regulations, to pursue the appeals process. The Company believes that it is more likely than not that it will receive a favorable ruling when all of the available appeals have been exhausted. Also during 2012, Brazilian tax authorities issued tax assessment notices to Visteon Sistemas Automotivos (“Sistemas”) of approximately
$15 million
related to the sale of its chassis business to a third party. During 2013, after attempts to reopen an appeal of the administrative decision failed, Sistemas opened a judicial proceeding against the government to address the notice which required a deposit in the amount of the assessment in order to suspend the debt and allow Sistemas to operate regularly before the tax authorities. The Company believes that the risk of a negative outcome is remote once the matter is fully litigated at the highest judicial level. These appeal payments in Korea and Brazil, as well as contingent income tax refund claims associated with other jurisdictions, total
$47 million
as of December 31, 2013 and are included in Other non-current assets on the consolidated balance sheet.
Share Repurchase Program
In July 2012, the board of directors authorized the repurchase of up to
$100 million
of the Company's common stock. During 2012, the Company repurchased
1,005,559
shares of its outstanding common stock at an weighted average price of
$49.72
per share, excluding commissions, for the aggregate purchase price of
$50 million
. In January 2013, the board of directors reauthorized the previously authorized
$100 million
and increased the repurchase amount an additional
$200 million
, bringing the total share repurchase authorization to
$300 million
. In March 2013, the Company entered into an accelerated stock buyback ("ASB") program with a third-party financial institution to purchase shares of common stock for an aggregate purchase price of
$125 million
. Under the program, the Company paid the financial institution
$125 million
and received an initial delivery of
1,713,502
shares of common stock. The value of those shares on the date of delivery was
$100 million
at
$58.36
per share and is included in common stock held in treasury. On April 17, 2013, the program concluded, and the Company received an additional
495,576
shares.
In August 2013, the Company's board of directors raised the authorization of its remaining share repurchase program from
$125 million
to
$1 billion
over the next two years. The Company entered into another ASB program in August 2013 with a third-party financial institution to purchase shares of common stock for an aggregate purchase price of
$125 million
. The Company paid the financial institution
$125 million
and received an initial delivery of
1,368,925
shares of common stock. The value of those shares
88
on the date of delivery was
$100 million
at
$73.05
per share and is included in common stock held in treasury. On December 20, 2013, the program concluded and the Company received an additional
307,975
shares. As of December 31, 2013,
$875 million
remains authorized and available for repurchase through December 31, 2015. The Company anticipates that repurchases of common stock would occur from time to time in open market transactions, non-discretionary programs or in privately negotiated transactions depending on market and economic conditions, share price, trading volumes, alternative uses of capital and other factors.
Treasury Stock
The Company's board of directors has authorized a total of
$1.175 billion
in share repurchases since July of 2012, of which
$875 million
remains authorized and available for repurchase through December 31, 2015. As a result of the execution of this share repurchase program, the Company's treasury stock has increased. The
$125 million
ASB that completed on April 17, 2013 contributed a total of
2,209,078
shares to treasury stock in 2013. The
125 million
ASB that completed on December 20, 2013 contributed a total of
1,676,900
shares to treasury stock in 2013. In 2012, open market repurchases under the share repurchase program contributed a total of
1,005,559
shares to treasury stock. At December 31, 2013 and 2012, the Company held approximately
5,640,000
and
1,760,000
shares of common stock in treasury for use in satisfying obligations under employee incentive compensation arrangements. The Company values shares of common stock held in treasury at cost.
Warrants
The warrants to purchase up to
2,355,000
shares of common stock at an exercise price of
$9.66
per share, which expire ten years from issuance ("Ten Year Warrants") may be net share settled and are recorded as permanent equity in the Company’s consolidated balance sheets with
909
and
299,171
warrants outstanding at December 31, 2013 and 2012, respectively. The Ten Year Warrants were valued at
$15.00
per share on October 1, 2010 using the Black-Scholes option pricing model. Significant assumptions used in determining the fair value of such warrants at issuance included share price volatility and risk-free rate of return. The volatility assumption was based on the implied volatility and historical realized volatility for comparable companies. The risk-free rate assumption was based on U.S. Treasury bond yields.
The warrants to purchase up to
1,552,774
shares of common stock at an exercise price of
$58.8
per share, which expire five years from issuance ("Five Year Warrants") may be net share settled and are recorded as permanent equity in the Company’s consolidated balance sheets with
1,548,387
and
1,549,337
warrants outstanding at December 31, 2013 and 2012, respectively. The Five Year Warrants were valued at
$3.62
per share on October 1, 2010 using the Black-Scholes option pricing model. Significant assumptions used in determining the fair value of such warrants at issuance included share price volatility and risk-free rate of return. The volatility assumption was based on the implied volatility and historical realized volatility for comparable companies. The risk-free rate assumption was based on U.S. Treasury bond yields.
If the Company pays or declares a dividend or makes a distribution on common stock payable in shares of its common stock, the number of shares of common stock or other shares of common stock for which a Warrant (the Five Year Warrants and Ten Year Warrants, collectively) is exercisable shall be adjusted so that the holder of each Warrant shall be entitled upon exercise to receive the number of shares of common stock that such warrant holder would have owned or have been entitled to receive after the happening of any of the events described above, had such Warrant been exercised immediately prior to the happening of such event. In addition, if the Company pays an extraordinary dividend (as defined in each Warrant Agreement) to common share holders, then the exercise price shall be decreased effective immediately after the effective date of such extraordinary dividend, dollar-for-dollar by the fair market value of any securities or other assets paid or distributed on each share of common stock.
Non-Controlling Interests
Non-controlling interests in the Visteon Corporation economic entity are as follows:
|
December 31
|
|||||||
|
2013
|
2012
|
||||||
|
(Dollars in Millions)
|
|||||||
|
HVCC
|
$
|
777
|
|
$
|
723
|
|
|
|
YFVE
|
139
|
|
—
|
|
|||
|
Visteon Interiors Korea, Ltd.
|
22
|
|
20
|
|
|||
|
Other
|
15
|
|
13
|
|
|||
|
Total non-controlling interests
|
$
|
953
|
|
$
|
756
|
|
|
89
Pursuant to the November 2013 step acquisition of a controlling interest in YFVE, Visteon applied business combination accounting and consolidated YFVE. In connection with the purchase accounting, Visteon recorded the estimated fair value of the non-controlling interest in YFVE at
$138 million
.
During the first quarter of 2013, Halla Climate Control Corporation purchased certain subsidiaries and intellectual property of Visteon's global climate business for approximately
$410 million
. The transfer of Visteon's Climate operations to HVCC represented a common control transaction. Accordingly, the assets and liabilities were transferred at their respective carrying value and no gain or loss was recorded by the Company. HVCC designs, develops and manufactures automotive climate control products, including air-conditioning systems, modules, compressors, and heat exchangers for sale to global OEMs. The Company holds a
70%
interest in HVCC, a consolidated subsidiary.
Accumulated Other Comprehensive Income (Loss)
Changes in Accumulated other comprehensive income (loss) (“AOCI”) and reclassifications out of AOCI by component includes:
|
Year Ended December 31
|
|||||||
|
2013
|
2012
|
||||||
|
(Dollars in Millions)
|
|||||||
|
Changes in AOCI:
|
|||||||
|
Beginning balance
|
$
|
(90
|
)
|
$
|
(25
|
)
|
|
|
Other comprehensive income (loss) before reclassification, net of tax
|
124
|
|
(66
|
)
|
|||
|
Amounts reclassified from AOCI
|
(46
|
)
|
1
|
|
|||
|
Ending balance
|
$
|
(12
|
)
|
$
|
(90
|
)
|
|
|
Changes in AOCI by component:
|
|||||||
|
Foreign currency translation adjustments
|
|||||||
|
Beginning balance
|
$
|
11
|
|
$
|
(41
|
)
|
|
|
Other comprehensive (loss) income before reclassification, net of tax
|
(11
|
)
|
47
|
|
|||
|
Amounts reclassified from AOCI (a)
|
(37
|
)
|
5
|
|
|||
|
Ending balance
|
(37
|
)
|
11
|
|
|||
|
Benefit plans
|
|||||||
|
Beginning balance
|
(108
|
)
|
25
|
|
|||
|
Other comprehensive income (loss) before reclassification, net of tax (b)
|
131
|
|
(147
|
)
|
|||
|
Amounts reclassified from AOCI (c)
|
2
|
|
14
|
|
|||
|
Ending balance
|
25
|
|
(108
|
)
|
|||
|
Unrealized hedging gains (loss)
|
|||||||
|
Beginning balance
|
7
|
|
(9
|
)
|
|||
|
Other comprehensive income before reclassification, net of tax (d)
|
4
|
|
34
|
|
|||
|
Amounts reclassified from AOCI (e)
|
(11
|
)
|
(18
|
)
|
|||
|
Ending balance
|
—
|
|
7
|
|
|||
|
AOCI ending balance
|
$
|
(12
|
)
|
$
|
(90
|
)
|
|
(a) Amount included in Other expense in Consolidated Statement of Comprehensive Income.
(b) Net tax benefits of
$4 million
and
$11 million
are related to benefit plans for the year ended December 31, 2013 and 2012, respectively.
(c) Amount included in the computation of net periodic pension cost. (See Note 10 Employee retirement benefits for additional details.)
(d) Net tax benefit of
$3 million
and tax expense of
$6 million
are related to unrealized hedging gains (loss) for the year ended December 31, 2013 and 2012, respectively.
(e) Amount is included in Cost of sales in Consolidated Statement of Comprehensive Income.
Restricted Net Assets
Restricted net assets related to the Company’s non-consolidated affiliates were approximately
$228 million
and
$756 million
, respectively, as of December 31, 2013 and 2012. Restricted net assets related to the Company’s consolidated subsidiaries were approximately
$405 million
and
$165 million
, respectively as of December 31, 2013 and 2012. Restricted net assets of consolidated subsidiaries are attributable to the Company’s operations in China, where certain regulatory requirements and governmental restraints result in significant restrictions on the Company’s consolidated subsidiaries ability to transfer funds to the Company.
90
A summary of information used to compute basic and diluted earnings per share attributable to Visteon is as follows:
|
Year Ended December 31
|
|||||||||||
|
2013
|
2012
|
2011
|
|||||||||
|
(In Millions, Except Per Share Amounts)
|
|||||||||||
|
Numerator:
|
|||||||||||
|
Net income from continuing operations attributable to Visteon
|
$
|
690
|
|
$
|
103
|
|
$
|
136
|
|
||
|
Loss from discontinued operations, net of tax
|
—
|
|
(3
|
)
|
(56
|
)
|
|||||
|
Net income attributable to Visteon
|
$
|
690
|
|
$
|
100
|
|
$
|
80
|
|
||
|
Denominator:
|
|||||||||||
|
Average common stock outstanding - basic
|
50.0
|
|
52.9
|
|
51.2
|
|
|||||
|
Dilutive effect of warrants and PSUs
|
1.1
|
|
0.4
|
|
0.8
|
|
|||||
|
Diluted shares
|
51.1
|
|
53.3
|
|
52.0
|
|
|||||
|
Basic and Diluted Per Share Data:
|
|||||||||||
|
Basic earnings per share attributable to Visteon:
|
|||||||||||
|
Continuing operations
|
$
|
13.80
|
|
$
|
1.95
|
|
$
|
2.65
|
|
||
|
Discontinued operations
|
—
|
|
(0.06
|
)
|
(1.09
|
)
|
|||||
|
$
|
13.80
|
|
$
|
1.89
|
|
$
|
1.56
|
|
|||
|
Diluted earnings per share attributable to Visteon:
|
|||||||||||
|
Continuing operations
|
$
|
13.50
|
|
$
|
1.93
|
|
$
|
2.62
|
|
||
|
Discontinued operations
|
—
|
|
(0.05
|
)
|
(1.08
|
)
|
|||||
|
$
|
13.50
|
|
$
|
1.88
|
|
$
|
1.54
|
|
|||
The effect of certain common stock equivalents including warrants, performance-based share units, and stock options were excluded from the computation of weighted average diluted shares outstanding as inclusion of such items would be anti-dilutive, summarized
as follows.
|
Year Ended December 31
|
|||||||||||||||||||||||
|
2013
|
2012
|
2011
|
|||||||||||||||||||||
|
(In Millions, Except Per Share Amounts)
|
|||||||||||||||||||||||
|
Number of warrants
|
—
|
1.5
|
—
|
||||||||||||||||||||
|
Exercise price
|
$
|
—
|
$
|
58.80
|
$
|
—
|
|||||||||||||||||
|
Number of performance stock units
|
0.1
|
1.3
|
—
|
||||||||||||||||||||
|
Number of stock options
|
0.2
|
0.4
|
0.4
|
||||||||||||||||||||
|
Exercise price
|
$
|
44.55
|
|
-
|
$
|
74.08
|
|
$
|
44.55
|
|
-
|
$
|
74.08
|
|
$
|
44.55
|
|
-
|
$
|
74.08
|
|
||
Fair Value Hierarchy
The Company uses a three-level fair value hierarchy that categorizes assets and liabilities measured at fair value based on the observability of the inputs utilized in the valuation. The fair value hierarchy gives the highest priority to the quoted prices in active markets for identical assets and liabilities and lowest priority to unobservable inputs.
|
•
|
Level 1 – Financial assets and liabilities whose values are based on unadjusted quoted market prices for identical assets and liabilities in an active market that the Company has the ability to access.
|
|
•
|
Level 2 – Financial assets and liabilities whose values are based on quoted prices in markets that are not active or model inputs that are observable for substantially the full term of the asset or liability.
|
|
•
|
Level 3 – Financial assets and liabilities whose values are based on prices or valuation techniques that require inputs that are both unobservable and significant to the overall fair value measurement.
|
91
The fair value hierarchy for assets and liabilities measured at fair value on a recurring basis are as follows.
|
December 31, 2013
|
||||||||||||||||
|
(Dollars in Millions)
|
||||||||||||||||
|
Asset Category
|
Quoted Prices in Active Markets for Identical Assets (Level 1)
|
Significant Observable Inputs
(Level 2)
|
Significant Unobservable Inputs
(Level 3)
|
Total
|
||||||||||||
|
Retirement plan assets
|
$
|
380
|
|
$
|
467
|
|
$
|
547
|
|
$
|
1,394
|
|
||||
|
Foreign currency instruments
|
—
|
|
6
|
|
—
|
|
6
|
|
||||||||
|
Liability Category
|
||||||||||||||||
|
Foreign currency instruments
|
$
|
—
|
|
$
|
2
|
|
$
|
—
|
|
$
|
2
|
|
||||
|
December 31, 2012
|
||||||||||||||||
|
(Dollars in Millions)
|
||||||||||||||||
|
Asset Category
|
Quoted Prices in Active Markets for Identical Assets (Level 1)
|
Significant Observable Inputs
(Level 2)
|
Significant Unobservable Inputs
(Level 3)
|
Total
|
||||||||||||
|
Retirement plan assets
|
$
|
309
|
|
$
|
559
|
|
$
|
502
|
|
$
|
1,370
|
|
||||
|
Foreign currency instruments
|
—
|
|
22
|
|
—
|
|
22
|
|
||||||||
|
Liability Category
|
||||||||||||||||
|
Foreign currency instruments
|
$
|
—
|
|
$
|
1
|
|
$
|
—
|
|
$
|
1
|
|
||||
Foreign currency instruments are valued under an income approach using industry-standard models that consider various assumptions, including time value, volatility factors, current market and contractual prices for the underlying and non-performance risk. Substantially all of these assumptions are observable in the marketplace throughout the full term of the instrument, can be derived from observable data or are supported by observable levels at which transactions are executed in the marketplace. The carrying amounts of all other financial instruments approximate their fair values because of the relatively short-term maturity of these instruments.
Retirement Plan Assets
Retirement plan assets categorized as Level 1 include the following:
|
•
|
Cash and cash equivalents, which consist of U.S. and foreign currencies held by designated trustees. Foreign currencies held are reported in terms of U.S. dollars based on currency exchange rates readily available in active markets.
|
|
•
|
Registered investment companies are mutual funds that are registered with the Securities and Exchange Commission. Mutual fund shares are traded actively on public exchanges. The share prices for mutual funds are published at the close of each business day. Mutual funds contain both equity and fixed income securities.
|
|
•
|
Common and preferred stock include equity securities issued by U.S. and non-U.S. corporations. Common and preferred securities are traded actively on exchanges and price quotes for these shares are readily available.
|
|
•
|
Other investments include several miscellaneous assets and liabilities and are primarily comprised of liabilities related to pending trades and collateral settlements.
|
Retirement plan assets categorized as Level 2 include the following:
|
•
|
Treasury and government securities consist of bills, notes, bonds, and other fixed income securities issued directly by a non-U.S. treasury or by government-sponsored enterprises. These assets are valued using observable inputs.
|
|
•
|
Common trust funds are comprised of shares or units in commingled funds that are not publicly traded. The underlying assets in these funds (equity securities, fixed income securities and commodity-related securities) are publicly traded on exchanges and price quotes for the assets held by these funds are readily available.
|
|
•
|
Liability Driven Investing (“LDI”) is an investment strategy that utilizes swaps to hedge discount rate volatility. The swaps are collateralized on a daily basis resulting in counterparty exposure that is limited to one day’s activity. Swaps are a derivative product, utilizing a pricing model to calculate market value.
|
|
•
|
Corporate debt securities consist of fixed income securities issued by non-U.S. corporations. These assets are valued using a bid evaluation process with bid data provided by independent pricing sources.
|
92
Retirement plan assets categorized as Level 3 include the following:
|
•
|
Global tactical asset allocation funds (“GTAA”) are common trust funds comprised of shares or units in commingled funds that are not publicly traded. GTAA managers primarily invest in equity, fixed income and cash instruments, with the ability to change the allocation mix based on market conditions while remaining within their specific strategy guidelines. The underlying assets in these funds may be publicly traded (equities and fixed income) and price quotes may be readily available. Assets may also be invested in various derivative products whose prices cannot be readily determined.
|
|
•
|
Limited partnership hedge fund of funds (“HFF”) directly invest in a variety of hedge funds. The investment strategies of the underlying hedge funds are primarily focused on fixed income and equity based investments. There is currently minimal exposure to less liquid assets such as real estate or private equity in the portfolio. However, due to the private nature of the partnership investments, pricing inputs are not readily observable. Asset valuations are developed by the general partners that manage the partnerships.
|
|
•
|
Insurance contracts are reported at cash surrender value and have no observable inputs.
|
The fair values of the Company’s U.S. retirement plan assets are as follows:
|
December 31, 2013
|
||||||||||||||||
|
Asset Category
|
Quoted Prices in Active Markets for Identical Assets (Level 1)
|
Significant Observable Inputs (Level 2)
|
Significant Unobservable Inputs (Level 3)
|
Total
|
||||||||||||
|
(Dollars in Millions)
|
||||||||||||||||
|
Registered investment companies
|
$
|
234
|
|
$
|
—
|
|
$
|
—
|
|
$
|
234
|
|
||||
|
Common trust funds
|
—
|
|
273
|
|
—
|
|
273
|
|
||||||||
|
LDI
|
—
|
|
118
|
|
—
|
|
118
|
|
||||||||
|
GTAA
|
—
|
|
—
|
|
70
|
|
70
|
|
||||||||
|
HFF
|
—
|
|
—
|
|
247
|
|
247
|
|
||||||||
|
Cash and cash equivalents
|
10
|
|
—
|
|
—
|
|
10
|
|
||||||||
|
Insurance contracts
|
—
|
|
—
|
|
8
|
|
8
|
|
||||||||
|
Total
|
$
|
244
|
|
$
|
391
|
|
$
|
325
|
|
$
|
960
|
|
||||
|
December 31, 2012
|
||||||||||||||||
|
Asset Category
|
Quoted Prices in Active Markets for Identical Assets (Level 1)
|
Significant Observable Inputs (Level 2)
|
Significant Unobservable Inputs (Level 3)
|
Total
|
||||||||||||
|
(Dollars in Millions)
|
||||||||||||||||
|
Registered investment companies
|
$
|
163
|
|
$
|
—
|
|
$
|
—
|
|
$
|
163
|
|
||||
|
Common trust funds
|
—
|
|
354
|
|
—
|
|
354
|
|
||||||||
|
LDI
|
—
|
|
148
|
|
—
|
|
148
|
|
||||||||
|
GTAA
|
—
|
|
—
|
|
140
|
|
140
|
|
||||||||
|
HFF
|
—
|
|
—
|
|
139
|
|
139
|
|
||||||||
|
Cash and cash equivalents
|
14
|
|
—
|
|
—
|
|
14
|
|
||||||||
|
Insurance contracts
|
—
|
|
—
|
|
8
|
|
8
|
|
||||||||
|
Total
|
$
|
177
|
|
$
|
502
|
|
$
|
287
|
|
$
|
966
|
|
||||
93
The fair value measurements which used significant unobservable inputs are as follows:
|
Actual Return on Plan Assets
|
GTAA
|
HFF
|
Insurance Contracts
|
|||||||||
|
(Dollars in Millions)
|
||||||||||||
|
Ending balance at December 31, 2010
|
$
|
150
|
|
$
|
119
|
|
$
|
9
|
|
|||
|
Relating to assets still held at the reporting date
|
(8
|
)
|
(1
|
)
|
1
|
|
||||||
|
Purchases, sales and settlements
|
—
|
|
10
|
|
—
|
|
||||||
|
Ending balance at December 31, 2011
|
$
|
142
|
|
$
|
128
|
|
$
|
10
|
|
|||
|
Relating to assets still held at the reporting date
|
11
|
|
8
|
|
—
|
|
||||||
|
Purchases, sales and settlements
|
(13
|
)
|
3
|
|
—
|
|
||||||
|
Transfer out
|
—
|
|
—
|
|
(2
|
)
|
||||||
|
Ending balance at December 31, 2012
|
$
|
140
|
|
$
|
139
|
|
$
|
8
|
|
|||
|
Relating to assets still held at the reporting date
|
(16
|
)
|
15
|
|
—
|
|
||||||
|
Purchases, sales and settlements
|
(54
|
)
|
93
|
|
—
|
|
||||||
|
Ending balance at December 31, 2013
|
$
|
70
|
|
$
|
247
|
|
$
|
8
|
|
|||
The fair values of the Company’s Non-U.S. retirement plan assets are as follows:
|
December 31, 2013
|
||||||||||||||||
|
Asset Category
|
Quoted Prices in Active Markets for Identical Assets (Level 1)
|
Significant Observable Inputs (Level 2)
|
Significant Unobservable Inputs (Level 3)
|
Total
|
||||||||||||
|
(Dollars in Millions)
|
||||||||||||||||
|
Insurance contracts
|
$
|
—
|
|
$
|
—
|
|
$
|
210
|
|
$
|
210
|
|
||||
|
Treasury and government securities
|
22
|
|
35
|
|
—
|
|
57
|
|
||||||||
|
Registered investment companies
|
85
|
|
—
|
|
—
|
|
85
|
|
||||||||
|
Cash and cash equivalents
|
9
|
|
10
|
|
—
|
|
19
|
|
||||||||
|
Corporate debt securities
|
8
|
|
6
|
|
—
|
|
14
|
|
||||||||
|
Common trust funds
|
5
|
|
5
|
|
—
|
|
10
|
|
||||||||
|
Limited partnerships (HFF)
|
—
|
|
—
|
|
12
|
|
12
|
|
||||||||
|
Common and preferred stock
|
4
|
|
20
|
|
—
|
|
24
|
|
||||||||
|
Other
|
3
|
|
—
|
|
—
|
|
3
|
|
||||||||
|
Total
|
$
|
136
|
|
$
|
76
|
|
$
|
222
|
|
$
|
434
|
|
||||
|
December 31, 2012
|
||||||||||||||||
|
Asset Category
|
Quoted Prices in Active Markets for Identical Assets
(Level 1)
|
Significant Observable Inputs
(Level 2)
|
Significant Unobservable Inputs
(Level 3)
|
Total
|
||||||||||||
|
(Dollars in Millions)
|
||||||||||||||||
|
Insurance contracts
|
$
|
—
|
|
$
|
—
|
|
$
|
199
|
|
$
|
199
|
|
||||
|
Treasury and government securities
|
22
|
|
33
|
|
—
|
|
55
|
|
||||||||
|
Registered investment companies
|
52
|
|
—
|
|
—
|
|
52
|
|
||||||||
|
Cash and cash equivalents
|
18
|
|
—
|
|
—
|
|
18
|
|
||||||||
|
Corporate debt securities
|
8
|
|
9
|
|
—
|
|
17
|
|
||||||||
|
Common trust funds
|
5
|
|
8
|
|
—
|
|
13
|
|
||||||||
|
Limited partnerships (HFF)
|
—
|
|
—
|
|
16
|
|
16
|
|
||||||||
|
Common and preferred stock
|
16
|
|
—
|
|
—
|
|
16
|
|
||||||||
|
Other
|
11
|
|
7
|
|
—
|
|
18
|
|
||||||||
|
Total
|
$
|
132
|
|
$
|
57
|
|
$
|
215
|
|
$
|
404
|
|
||||
94
Fair value measurements which used significant unobservable inputs are as follows:
|
Actual Return on Plan Assets
|
Insurance Contracts
|
HFF
|
||||||
|
(Dollars in Millions)
|
||||||||
|
Ending balance at December 31, 2010
|
$
|
179
|
|
$
|
5
|
|
||
|
Relating to assets held at the reporting date
|
4
|
|
—
|
|
||||
|
Purchases, sales and settlements
|
(3
|
)
|
1
|
|
||||
|
Ending balance at December 31, 2011
|
$
|
180
|
|
$
|
6
|
|
||
|
Relating to assets held at the reporting date
|
16
|
|
4
|
|
||||
|
Purchases, sales and settlements
|
3
|
|
6
|
|
||||
|
Ending balance at December 31, 2012
|
$
|
199
|
|
$
|
16
|
|
||
|
Relating to assets held at the reporting date
|
12
|
|
1
|
|
||||
|
Purchases, sales and settlements
|
(1
|
)
|
(5
|
)
|
||||
|
Ending balance at December 31, 2013
|
$
|
210
|
|
$
|
12
|
|
||
Items Measured at Fair Value on a Non-recurring Basis
In addition to items that are measured at fair value on a recurring basis, the Company measures certain assets and liabilities at fair value on a non-recurring basis, which are not included in the table above. As these non-recurring fair value measurements are generally determined using unobservable inputs, these fair value measurements are classified within Level 3 of the fair value hierarchy. Items measured at fair value on a non-recurring basis during the year ended December 31, 2013 included the identifiable assets and liabilities in connection with the consolidation of YFVE. Assets measured at fair value on a non-recurring basis during the year ended December 31, 2012 included the retained interest in Duckyang, the equity in the net assets of Yanfeng, and the Lighting assets subject to the impairment analysis.
Fair Value of Debt
The fair value of debt was approximately
$755 million
and
$600 million
at December 31, 2013 and December 31, 2012, respectively. Fair value estimates were based on quoted market prices or current rates for the same or similar issues, or on the current rates offered to the Company for debt of the same remaining maturities. Accordingly, the Company's debt is classified as Level 1, "Market Prices" and Level 2, "Other Observable Inputs" in the fair value hierarchy, respectively.
The Company is exposed to various market risks including, but not limited to, changes in foreign currency exchange rates and market interest rates. The Company manages these risks through the use of derivative financial instruments. The maximum length of time over which the Company hedges the variability in the future cash flows for forecast transactions excluding those forecast transactions related to the payment of variable interest on existing debt is up to eighteen months from the date of the forecast transaction. The maximum length of time over which the Company hedges forecast transactions related to the payment of variable interest on existing debt is the term of the underlying debt. The use of derivative financial instruments creates exposure to credit loss in the event of nonperformance by the counter-party to the derivative financial instruments. The Company limits this exposure by entering into agreements directly with a variety of major financial institutions with high credit standards that are expected to fully satisfy their obligations under the contracts. Additionally, the Company’s ability to utilize derivatives to manage risks is dependent on credit and market conditions.
Accounting for Derivative Financial Instruments
Derivative financial instruments are recorded as assets or liabilities in the consolidated balance sheets at fair value. The fair values of derivatives used to hedge the Company’s risks fluctuate over time, generally in relation to the fair values or cash flows of the underlying hedged transactions or exposures. The accounting for changes in fair value of a derivative instrument depends on whether it has been designated and qualifies as part of a hedging relationship and, further, on the type of hedging relationship.
At inception, the Company formally designates and documents the financial instrument as a hedge of a specific underlying exposure, as well as the risk management objectives and strategies for undertaking the hedge transaction, including designation of the instrument as a fair value hedge, a cash flow hedge or a hedge of a net investment in a foreign operation. Additionally, at inception
95
and at least quarterly thereafter, the Company formally assesses whether the financial instruments that are used in hedging transactions are effective at offsetting changes in either the fair value or cash flows of the related underlying exposure.
For a designated cash flow hedge, the effective portion of the change in the fair value of the derivative instrument is recorded in Accumulated other comprehensive (loss) income in the consolidated balance sheet. When the underlying hedged transaction is realized, the gain or loss included in Accumulated other comprehensive (loss) income is recorded in earnings and reflected in the consolidated statement of operations on the same line as the gain or loss on the hedged item attributable to the hedged risk. Any ineffective portion of a financial instrument's change in fair value is immediately recognized in operating results. For a designated fair value hedge, both the effective and ineffective portions of the change in the fair value of the derivative instrument are recorded in earnings and reflected in the consolidated statement of operations on the same line as the gain or loss on the hedged item attributable to the hedged risk. For a designated net investment hedge, the effective portion of the change in the fair value of the derivative instrument is recorded as a cumulative translation adjustment in Accumulated other comprehensive (loss) income in the consolidated balance sheet. Cash flows associated with designated hedges are reported in the same category as the underlying hedged item. Derivatives not designated as a hedge are adjusted to fair value through operating results. Cash flows associated with derivatives are reported in Net cash provided from operating activities in the Company’s consolidated statements of cash flows.
Foreign Currency Exchange Rate Risk
The Company’s net cash inflows and outflows exposed to the risk of changes in foreign currency exchange rates arise from the sale of products in countries other than the manufacturing source, foreign currency denominated supplier payments, debt and other payables, subsidiary dividends and investments in subsidiaries. Where possible, the Company utilizes derivative financial instruments, including forward and option contracts, to protect the Company’s cash flow from changes in exchange rates. Foreign currency exposures are reviewed monthly and any natural offsets are considered prior to entering into a derivative financial instrument. The Company’s primary hedged foreign currency exposures include the Euro, Korean Won, Czech Koruna, Hungarian Forint, Indian Rupee and Mexican Peso. Where possible, the Company utilizes a strategy of partial coverage for transactions in these currencies.
As of December 31, 2013 and 2012, the Company had forward contracts to hedge changes in foreign currency exchange rates with notional amounts of approximately
$625 million
and
$554 million
, respectively. Fair value estimates of these contracts are based on quoted market prices and other observable inputs. A portion of these instruments have been designated as cash flow hedges with the effective portion of the gain or loss reported in the Accumulated other comprehensive (loss) income component of Stockholders’ equity in the Company’s consolidated balance sheet. The ineffective portion of these instruments is recorded as Cost of sales in the Company’s consolidated statement of operations.
Interest Rate Risk
On April 6, 2011, the Company refinanced its variable rate Term Loan with a fixed rate bond. In conjunction with the refinancing of the Term Loan, the Company terminated outstanding interest rate swaps with a notional amount of
$250 million
for a loss of less than
$1 million
. Approximately
58%
and
85%
of the Company's borrowings were effectively on a fixed rate basis as of December 31, 2013 and 2012, respectively. At December 31, 2013 and 2012 the Company had no interest rate swaps.
Financial Statement Presentation
The Company presents its derivative positions and any related material collateral under master netting agreements on a net basis. Derivative financial instruments designated and non-designated as hedging instruments are included in the Company’s consolidated balance sheets at December 31, 2013 and 2012 as follows.
|
Assets
|
Liabilities
|
|||||||||||||||||||
|
Risk Hedged
|
Classification
|
2013
|
2012
|
Classification
|
2013
|
2012
|
||||||||||||||
|
(Dollars in Millions)
|
||||||||||||||||||||
|
Designated
|
||||||||||||||||||||
|
Foreign currency
|
Other current assets
|
$
|
4
|
|
$
|
16
|
|
Other current assets
|
$
|
—
|
|
$
|
1
|
|
||||||
|
Foreign currency
|
Other current liabilities
|
2
|
|
1
|
|
Other current liabilities
|
4
|
|
1
|
|
||||||||||
|
Non-designated
|
||||||||||||||||||||
|
Foreign currency
|
Other current assets
|
3
|
|
6
|
|
Other current assets
|
1
|
|
—
|
|
||||||||||
|
$
|
9
|
|
$
|
23
|
|
$
|
5
|
|
$
|
2
|
|
|||||||||
96
|
Gross Amount Recognized
|
Gross Amounts Offset in the Statement of Financial Position
|
Net Amounts Presented in the Statement of Financial Position
|
||||||||||||||||||||||
|
December 31
|
December 31
|
December 31
|
||||||||||||||||||||||
|
Foreign currency derivatives
|
2013
|
2012
|
2013
|
2012
|
2013
|
2012
|
||||||||||||||||||
|
(Dollars in Millions)
|
||||||||||||||||||||||||
|
Assets
|
||||||||||||||||||||||||
|
Designated
|
$
|
4
|
|
$
|
17
|
|
$
|
—
|
|
$
|
1
|
|
$
|
4
|
|
$
|
16
|
|
||||||
|
Non-designated
|
3
|
|
6
|
|
1
|
|
—
|
|
2
|
|
6
|
|
||||||||||||
|
$
|
7
|
|
$
|
23
|
|
$
|
1
|
|
$
|
1
|
|
$
|
6
|
|
$
|
22
|
|
|||||||
|
Liabilities
|
||||||||||||||||||||||||
|
Designated
|
$
|
4
|
|
$
|
1
|
|
$
|
2
|
|
$
|
—
|
|
$
|
2
|
|
$
|
1
|
|
||||||
|
$
|
4
|
|
$
|
1
|
|
$
|
2
|
|
$
|
—
|
|
$
|
2
|
|
$
|
1
|
|
|||||||
Gains and losses on derivative financial instruments recorded in Cost of sales and Interest expense for the year ended December 31, 2013 and 2012 are as follows:
|
Amount of Gain (Loss)
|
|||||||||||||||||||||||
|
Recorded in AOCI, net of tax
|
Reclassified from AOCI into Income
|
Recorded in Income
|
|||||||||||||||||||||
|
2013
|
2012
|
2013
|
2012
|
2013
|
2012
|
||||||||||||||||||
|
(Dollars in Millions)
|
|||||||||||||||||||||||
|
Foreign currency risk – Cost of sales
|
|||||||||||||||||||||||
|
Cash flow hedges
|
$
|
(7
|
)
|
$
|
16
|
|
$
|
11
|
|
$
|
18
|
|
$
|
—
|
|
$
|
—
|
|
|||||
|
Non-designated cash flow hedges
|
—
|
|
—
|
|
—
|
|
—
|
|
1
|
|
(4
|
)
|
|||||||||||
|
$
|
(7
|
)
|
$
|
16
|
|
$
|
11
|
|
$
|
18
|
|
$
|
1
|
|
$
|
(4
|
)
|
||||||
Commodity Risk
The Company's exposures to market risk from changes in the price of production material are managed primarily through negotiations with suppliers and customers, although there can be no assurance that the Company will recover all such costs. While the Company periodically derivatives available in the marketplace, currently no such derivatives are utilized to manage or hedge the Company's commodity risks.
Concentrations of Credit Risk
Financial instruments including cash equivalents, derivative contracts, and accounts receivable, expose the Company to counter-party credit risk for non-performance. The Company’s counterparties for cash equivalents and derivative contracts are banks and financial institutions that meet the Company’s requirement of high credit standing. The Company’s counterparties for derivative contracts are substantial investment and commercial banks with significant experience using such derivatives. The Company manages its credit risk through policies requiring minimum credit standing and limiting credit exposure to any one counter-party and through monitoring counter-party credit risks. The Company’s concentration of credit risk related to derivative contracts at December 31, 2013 and 2012 is not material.
Hyundai Kia Automotive Group is one of the Company's largest customers, accounting for
33%
,
33%
and
31%
of total product sales in 2013, 2012 and 2011, respectively. Additionally, Ford is one of the Company's largest customers and accounted for
28%
,
27%
and
27%
of total product sales in 2013, 2012 and 2011, respectively. With the exceptions below, the Company’s credit risk with any individual customer does not exceed ten percent of total accounts receivable at December 31, 2013 and 2012, respectively.
|
2013
|
2012
|
||
|
Ford and its affiliates
|
20%
|
19%
|
|
|
Hyundai Mobis Company
|
15%
|
16%
|
|
|
Hyundai Motor Company
|
9%
|
10%
|
|
Management periodically performs credit evaluations of its customers and generally does not require collateral.
97
Litigation and Claims
In 2003, the Local Development Finance Authority of the Charter Township of Van Buren, Michigan (the “Township”) issued approximately
$28 million
in bonds finally maturing in 2032, the proceeds of which were used at least in part to assist in the development of the Company’s U.S. headquarters located in the Township. During January 2010, the Company and the Township entered into a settlement agreement (the “Settlement Agreement”) that, among other things, reduced the taxable value of the headquarters property to current market value and facilitated certain claims of the Township in the Company’s chapter 11 proceedings. The Settlement Agreement also provided that the Company would continue to negotiate in good faith with the Township in the event that property tax payments was inadequate to permit the Township to meet its payment obligations with respect to the bonds. In September 2013, the Township notified the Company in writing that it is estimating a shortfall in tax revenues of between
$25 million
and
$36 million
, which could render it unable to satisfy its payment obligations under the bonds, but made no specific monetary demand of the Company. The Company disputes the factual and legal assertions made by the Township and intends to vigorously defend the matter should the Township seek to commence a legal proceeding against the Company. The Company is not able to estimate the possible loss or range of loss in connection with this matter.
On March 29, 2012, the Korean Supreme Court ruled that regular bonuses should be included for purposes of calculating the ordinary wage of applicable employees, which was contrary to previous legal precedent and the position of the Korean Ministry of Employment and Labor. On December 18, 2013, the Korean Supreme Court issued an en banc decision clarifying that (i) regular bonuses, should be included for purposes of calculating such ordinary wage, and (ii) certain incentive pay and family allowances may also be included for purposes of calculating such ordinary wage if they were paid to employees as consideration for the labor actually provided by them. The court also indicated that employers could be excused from liability for excluding such regular bonuses from ordinary wages where an express or implied management-labor agreement or practice to exclude such amounts existed and to require such payment would cause “serious managerial difficulty.” The Company is evaluating the potential financial impact of these new court rulings, and is not able to determine at this time whether it will have a material impact on the results of operations and cash flows of its South Korean subsidiaries. However, the Company believes it qualifies for this provision for prior periods. In addition, on May 24, 2013, Halla Visteon Climate Control Union in Korea, representing
891
hourly employees of HVCC, filed a legal petition with Seoul Southern District Court, claiming unpaid statutory benefits for the past three years based on the initial Supreme Court ruling. The Company is in the process of evaluating these claims, but at this time is not able to estimate the possible loss or range of loss in connection with this matter.
In November 2013, the Company and Halla Visteon Climate Control Corp., the Company’s South Korean subsidiary (“HVCC”), jointly filed an Initial Notice of Voluntary Self-Disclosure statement with the U.S. Treasury Department’s Office of Foreign Assets Control (“OFAC”) regarding certain sales of automotive HVAC components by a minority-owned, Chinese joint venture of HVCC into Iran, which the Company updated in December 2013. Pursuant to the notice, the Company and HVCC are reviewing these matters and will furnish OFAC with the results of their investigation. OFAC may conclude that our actions resulted in violations of U.S. economic sanctions laws and warrant the imposition of civil penalties, such as fines, limitations on our ability to export products from the United States, and/or referral for further investigation by the U.S. Department of Justice. Any such fines or restrictions may be material to the Company’s financial results in the period in which they are imposed. Additionally, disclosure of this conduct and any fines or other action relating to this conduct could harm the Company’s reputation and have a material adverse effect on our business, operating results and financial condition. Although the Company plans to file its full report with OFAC by March 2014, it cannot predict when OFAC will conclude its review of that report or whether it will impose any of the potential penalties described above.
During January 2014, HVCC provided documents and information to the Korean Fair Trade Commission regarding certain subcontracting transactions and practices. HVCC's policy is to comply with all laws and regulations applicable to it and it intends to cooperate fully with the Korean Fair Trade Commission. At this time, HVCC is not able to estimate a reasonably possible range of loss that may ultimately result from this investigation.
The Company's operations in Brazil are subject to highly complex labor, tax, customs and other laws. While the Company believes that it is in compliance with such laws, it is periodically engaged in litigation regarding the application of these laws. As of December 31, 2013, the Company maintained accruals of approximately
$9 million
for claims aggregating approximately
$150 million
. The amounts accrued represent claims that are deemed probable of loss and are reasonably estimable based on the Company's assessment of the claims and prior experience with similar matters.
98
Several current and former employees of Visteon Deutschland GmbH (“Visteon Germany”) filed civil actions against Visteon Germany in various German courts beginning in August 2007 seeking damages for the alleged violation of German pension laws that prohibit the use of pension benefit formulas that differ for salaried and hourly employees without adequate justification. Several of these actions have been joined as pilot cases. In a written decision issued in April 2010, the Federal Labor Court issued a declaratory judgment in favor of the plaintiffs in the pilot cases. To date, more than
750
current and former employees have filed similar actions or have inquired as to or been granted additional benefits, and an additional
600
current and former employees are similarly situated. The Company's remaining reserve for unsettled cases is approximately
$8 million
and is based on the Company’s best estimate as to the number and value of the claims that will be made in connection with the pension plan. However, the Company’s estimate is subject to many uncertainties which could result in Visteon Germany incurring amounts in excess of the reserved amount of up to approximately
$9 million
.
On May 28, 2009, the Company filed voluntary petitions in the Court seeking reorganization relief under the provisions of chapter 11 of the Bankruptcy Code and continued to operate as debtors-in-possession until emergence on October 1, 2010. Substantially all pre-petition liabilities and claims relating to rejected executory contracts and unexpired leases have been settled under the plan of reorganization, however, the ultimate amounts to be paid in settlement of each those claims will continue to be subject to the uncertain outcome of litigation, negotiations and Bankruptcy Court decisions for a period of time after the emergence date.
In December of 2009, the Court granted the Debtors' motion in part authorizing them to terminate or amend certain other postretirement employee benefits, including health care and life insurance. On December 29, 2009, the IUE-CWA, the Industrial Division of the Communications Workers of America, AFL-CIO, CLC, filed a notice of appeal of the Court's order with the District Court. By order dated March 31, 2010, the District Court affirmed the Court's order in all respects. On April 1, 2010, the IUE filed a notice of appeal. On July 13, 2010, the Circuit Court reversed the order of the District Court as to the IUE-CWA and directed the District Court to, among other things, direct the Court to order the Company to take whatever action is necessary to immediately restore terminated or modified benefits to their pre-termination/modification levels. On July 27, 2010, the Company filed a Petition for Rehearing or Rehearing En Banc requesting that the Circuit Court review the panel’s decision, which was denied. By orders dated August 30, 2010, the Court ruled that the Company should restore certain other postretirement employee benefits to the appellant-retirees and also to salaried retirees and certain retirees of the International Union, United Automobile, Aerospace and Agricultural Implement Workers of America (“UAW”).
On September 1, 2010, the Company filed a Notice of Appeal to the District Court of the Court's decision to include non-appealing retirees, and on September 15, 2010 the UAW filed a Notice of Cross-Appeal. On July 25, 2012, the District Court ruled in favor of the Company on both appeals, and the UAW has appealed this ruling to the Circuit Court. The Company reached an agreement with the original appellants in late-September 2010, which resulted in the Company not restoring other postretirement employee benefits of such retirees. On September 30, 2010, the UAW filed a complaint, which it amended on October 1, 2010, in the United States District Court for the Eastern District of Michigan seeking, among other things, a declaratory judgment to prohibit the Company from terminating certain other postretirement employee benefits for UAW retirees after October 1, 2010. The parties reached a preliminary settlement agreement in January 2013, but it was later terminated by the plaintiffs. On October 22, 2013, the U.S. District Court for the Eastern District of Michigan issued an order denying the Company's motion to dismiss the UAW's complaint and granted its motion to transfer the case to the U.S. District Court for the District of Delaware. As of December 31, 2013, the Company maintains an accrual for claims that are deemed probable of loss and are reasonably estimable.
While the Company believes its accruals for litigation and claims are adequate, the final amounts required to resolve such matters could differ materially from recorded estimates and the Company's results of operations and cash flows could be materially affected.
Product Warranty and Recall
Amounts accrued for product warranty and recall claims are based on management’s best estimates of the amounts that will ultimately be required to settle such items. The Company’s estimates for product warranty and recall obligations are developed with support from its sales, engineering, quality and legal functions and include due consideration of contractual arrangements, past experience, current claims and related information, production changes, industry and regulatory developments and various other considerations. The Company can provide no assurances that it will not experience material claims in the future or that it will not incur significant costs to defend or settle such claims beyond the amounts accrued or beyond what the Company may recover from its suppliers.
99
The following table provides a reconciliation of changes in the product warranty and recall claims liability, inclusive of amounts of discontinued operations for the selected periods:
|
Year Ended December 31
|
|||||||
|
2013
|
2012
|
||||||
|
(Dollars in Millions)
|
|||||||
|
Beginning balance
|
$
|
57
|
|
$
|
66
|
|
|
|
Accruals for products shipped
|
17
|
|
19
|
|
|||
|
Changes in estimates
|
(8
|
)
|
(6
|
)
|
|||
|
Settlements
|
(17
|
)
|
(22
|
)
|
|||
|
Ending balance
|
$
|
49
|
|
$
|
57
|
|
|
Environmental Matters
The Company is subject to the requirements of federal, state, local and foreign environmental and occupational safety and health laws and regulations and ordinances. These include laws regulating air emissions, water discharge and waste management. The Company is also subject to environmental laws requiring the investigation and cleanup of environmental contamination at properties it presently owns or operates and at third-party disposal or treatment facilities to which these sites send or arranged to send hazardous waste. The Company is aware of contamination at some of its properties. These sites are in various stages of investigation and cleanup. The Company currently is, has been, and in the future may become the subject of formal or informal enforcement actions or procedures.
Costs related to environmental assessments and remediation efforts at operating facilities, previously owned or operated facilities, or other waste site locations are accrued when it is probable that a liability has been incurred and the amount of that liability can be reasonably estimated. Estimated costs are recorded at undiscounted amounts, based on experience and assessments, and are regularly evaluated. The liabilities are recorded in Other current liabilities and Other non-current liabilities in the consolidated balance sheets. At December 31, 2013, the Company had recorded a reserve of approximately
$1 million
for environmental matters. However, estimating liabilities for environmental investigation and cleanup is complex and dependent upon a number of factors beyond the Company’s control and which may change dramatically. Accordingly, although the Company believes its reserve is adequate based on current information, the Company cannot provide any assurance that its ultimate environmental investigation and cleanup costs and liabilities will not exceed the amount of its current reserve.
Guarantees and Commitments
The Company has guaranteed approximately
$43 million
for subsidiary lease payments under various arrangements generally spanning between one and ten years in duration, and
$6 million
for affiliate credit lines and other credit support agreements.
Operating Leases
At December 31, 2013, the Company had the following minimum rental commitments under non-cancelable operating leases: 2014 —
$29 million
; 2015 —
$25 million
; 2016 —
$18 million
; 2017 —
$16 million
; 2018 —
$14 million
; thereafter —
$68 million
. Rent expense was
$53 million
for the year ended December 31, 2013,
$44 million
for the year ended December 31, 2012, and
$44 million
for the year ended December 31, 2011, respectively.
Purchase Obligations
In January 2003, the Company commenced a
10
-year outsourcing agreement with International Business Machines (“IBM”) pursuant to which the Company outsources information technology services on a global basis. In 2010, the agreement was amended to include only legacy mainframe and data center services out of the U.S. with the ability to terminate for convenience during the term of the agreement. At the end of 2013, Visteon terminated the mainframe portion of the services. Expenses incurred under the IBM arrangement were approximately
$13 million
during the years ended December 31, 2013, 2012 and 2011. Expenses for 2014 are estimated to be
$2 million
.
Other Contingent Matters
Various legal actions, governmental investigations and proceedings and claims are pending or may be instituted or asserted in the future against the Company, including those arising out of alleged defects in the Company’s products; governmental regulations
100
relating to safety; employment-related matters; customer, supplier and other contractual relationships; intellectual property rights; product warranties; product recalls; and environmental matters. Some of the foregoing matters may involve compensatory, punitive or antitrust or other treble damage claims in very large amounts, or demands for recall campaigns, environmental remediation programs, sanctions, or other relief which, if granted, would require very large expenditures. The Company enters into agreements that contain indemnification provisions in the normal course of business for which the risks are considered nominal and impracticable to estimate.
Contingencies are subject to many uncertainties, and the outcome of individual litigated matters is not predictable with assurance. Reserves have been established by the Company for matters discussed in the immediately foregoing paragraph where losses are deemed probable and reasonably estimable. It is possible, however, that some of the matters discussed in the foregoing paragraph could be decided unfavorably to the Company and could require the Company to pay damages or make other expenditures in amounts, or a range of amounts, that cannot be estimated at December 31, 2013 and that are in excess of established reserves. The Company does not reasonably expect, except as otherwise described herein, based on its analysis, that any adverse outcome from such matters would have a material effect on the Company’s financial condition, results of operations or cash flows, although such an outcome is possible.
Under section 362 of the Bankruptcy Code, the filing of a bankruptcy petition automatically stayed most actions against a debtor, including most actions to collect pre-petition indebtedness or to exercise control over the property of the debtor’s estate. Substantially all pre-petition liabilities and claims relating to rejected executory contracts and unexpired leases have been settled under the Debtor’s plan of reorganization, however, the ultimate amounts to be paid in settlement of each those claims will continue to be subject to the uncertain outcome of litigation, negotiations and Court decisions for a period of time after the Effective Date.
The Company defines its operating segments as components of its business for which separate discrete financial information is available that is evaluated regularly by the chief operating decision-making group, in deciding the allocation of resources and in assessing performance. The Company’s chief operating decision making group, comprised of the Chief Executive Officer and Chief Financial Officer, evaluates the performance of the Company’s segments primarily based on net sales, before elimination of inter-company shipments, Adjusted EBITDA (non-GAAP financial measure) and operating assets. The Company’s operating structure is organized by global product lines, including: Climate, Electronics and Interiors. These global product lines have financial and operating responsibility over the design, development and manufacture of the Company’s product portfolio. Global customer groups are responsible for the business development of the Company’s product portfolio and overall customer relationships. Certain functions such as procurement, information technology and other administrative activities are managed on a global basis with regional deployment. The Company’s reportable segments are as follows:
|
•
|
Climate — The Company’s Climate product line includes climate air handling modules, powertrain cooling modules, heat exchangers, compressors, fluid transport and engine induction systems. Climate accounted for approximately
64%
,
62%
, and
52%
of the Company’s total product sales, excluding intra-product line eliminations, for the years ended December 31, 2013, 2012 and 2011, respectively.
|
|
•
|
Electronics — The Company’s Electronics product line includes audio systems, infotainment systems, driver information systems, powertrain and feature control modules, climate controls, and electronic control modules. Electronics accounted for approximately
19%
,
18%
, and
18%
of the Company’s total product sales, excluding intra-product line eliminations, for the years ended December 31, 2013 2012 and 2011, respectively.
|
|
•
|
Interiors — The Company’s Interiors product line includes instrument panels, cockpit modules, door trim and floor consoles. Interiors accounted for approximately
17%
,
20%
, and
30%
, of the Company’s total product sales, excluding intra-product line eliminations, for the years ended December 31, 2013, 2012 and 2011, respectively.
|
The accounting policies for the reportable segments are the same as those described in the Note 2 "Summary of Significant Accounting Policies” to the Company’s consolidated financial statements. Key financial measures reviewed by the Company’s chief operating decision makers are as follows.
101
Segment Sales
|
Year Ended December 31
|
|||||||||||
|
2013
|
2012
|
2011
|
|||||||||
|
(Dollars in Millions)
|
|||||||||||
|
Climate
|
$
|
4,871
|
|
$
|
4,286
|
|
$
|
4,053
|
|
||
|
Electronics
|
1,455
|
|
1,274
|
|
1,370
|
|
|||||
|
Interiors
|
1,261
|
|
1,388
|
|
2,282
|
|
|||||
|
Eliminations
|
(148
|
)
|
(91
|
)
|
(173
|
)
|
|||||
|
Total consolidated sales
|
$
|
7,439
|
|
$
|
6,857
|
|
$
|
7,532
|
|
||
Net sales to Hyundai Kia Automotive Group were
$2.5 billion
during the year ended December 31, 2013,
$2.2 billion
during the year ended December 31, 2012, and
$2.5 billion
during the year ended ended December 31, 2011. Net sales to Ford were
$2.1 billion
during the year ended December 31, 2013,
$1.9 billion
during the year ended December 31, 2012, and
$2.0 billion
during the year ended December 31, 2011.
Segment Adjusted EBITDA
The Company defines Adjusted EBITDA as net income attributable to the Company, plus net interest expense, provision for income taxes and depreciation and amortization, as further adjusted to eliminate the impact of asset impairments, gains or losses on divestitures, discontinued operations, net restructuring expenses and other reimbursable costs, non-cash stock-based compensation expense, certain employee charges and benefits, reorganization items and other non-operating gains and losses. Adjusted EBITDA is presented as a supplemental measure of the Company's financial performance that management believes is useful to investors because the excluded items may vary significantly in timing or amounts and/or may obscure trends useful in evaluating and comparing the Company's operating activities across reporting periods. Not all companies use identical calculations and, accordingly, the Company's presentation of Adjusted EBITDA may not be comparable to other similarly titled measures of other companies. Adjusted EBITDA is not a recognized term under accounting principles generally accepted in the United States (“U.S. GAAP”) and does not purport to be a substitute for net income as an indicator of operating performance or cash flows from operating activities as a measure of liquidity. Adjusted EBITDA has limitations as an analytical tool and is not intended to be a measure of cash flow available for management's discretionary use, as it does not consider certain cash requirements such as interest payments, tax payments and debt service requirements. In addition, the Company uses Adjusted EBITDA (i) as a factor in incentive compensation decisions, (ii) to evaluate the effectiveness of the Company's business strategies and (iii) the Company's credit agreements use measures similar to Adjusted EBITDA to measure compliance with certain covenants.
Segment Adjusted EBITDA for the years ended December 31, 2013 and 2012 is summarized below.
|
Year Ended December 31
|
|||||||||||
|
2013
|
2012
|
2011
|
|||||||||
|
(Dollars in Millions)
|
|||||||||||
|
Climate
|
$
|
443
|
|
$
|
370
|
|
$
|
352
|
|
||
|
Electronics
|
137
|
|
126
|
|
148
|
|
|||||
|
Interiors
|
183
|
|
178
|
|
230
|
|
|||||
|
Total segment Adjusted EBITDA
|
763
|
|
674
|
|
730
|
|
|||||
|
Reconciling Item:
|
|||||||||||
|
Corporate
|
(59
|
)
|
(48
|
)
|
(41
|
)
|
|||||
|
Total consolidated Adjusted EBITDA
|
$
|
704
|
|
$
|
626
|
|
$
|
689
|
|
||
During the first quarter of 2013, the Company changed its corporate cost allocation methodology for management reporting purposes. Accordingly, certain costs associated with the Company's corporate headquarters and other administrative support functions not allocated to the Company's operating segments and subject to the Company's previously announced corporate and administrative restructuring program have been separately reported for all periods presented as Corporate reconciling items.
102
The reconciliation of Adjusted EBITDA to net income attributable to Visteon for the years ended December 31, 2013, 2012 and 2011 is as follows:
|
Year Ended December 31
|
|||||||||||
|
2013
|
2012
|
2011
|
|||||||||
|
(Dollars in Millions)
|
|||||||||||
|
Total Adjusted EBITDA
|
$
|
704
|
|
$
|
626
|
|
$
|
689
|
|
||
|
Interest expense, net
|
39
|
|
35
|
|
27
|
|
|||||
|
Provision for income taxes
|
107
|
|
121
|
|
127
|
|
|||||
|
Depreciation and amortization
|
262
|
|
258
|
|
295
|
|
|||||
|
Restructuring expense
|
39
|
|
79
|
|
24
|
|
|||||
|
Gain on Yanfeng transactions
|
(465
|
)
|
—
|
|
—
|
|
|||||
|
Non-cash, stock-based compensation expense
|
17
|
|
25
|
|
39
|
|
|||||
|
Equity in gain of non-consolidated affiliate
|
(29
|
)
|
(63
|
)
|
—
|
|
|||||
|
Other
|
44
|
|
71
|
|
97
|
|
|||||
|
Net income attributable to Visteon
|
$
|
690
|
|
$
|
100
|
|
$
|
80
|
|
||
Segment Operating Assets
|
|
Inventories, net
|
Property and Equipment, net
|
|||||||||||||
|
2013
|
2012
|
2013
|
2012
|
||||||||||||
|
(Dollars in Millions)
|
|||||||||||||||
|
Climate
|
$
|
324
|
|
$
|
276
|
|
$
|
1,046
|
|
$
|
974
|
|
|||
|
Electronics
|
106
|
|
67
|
|
163
|
|
119
|
|
|||||||
|
Interiors
|
42
|
|
42
|
|
190
|
|
178
|
|
|||||||
|
Total segment operating assets
|
472
|
|
385
|
|
1,399
|
|
1,271
|
|
|||||||
|
Corporate
|
—
|
|
—
|
|
15
|
|
55
|
|
|||||||
|
Total consolidated operating assets
|
$
|
472
|
|
$
|
385
|
|
$
|
1,414
|
|
$
|
1,326
|
|
|||
Corporate includes property and equipment associated with the Company's corporate headquarters and other administrative support functions.
Segment Expenditures
|
|
Depreciation and Amortization
|
Capital Expenditures
|
|||||||||||||||||||||
|
Year Ended December 31
|
Year Ended December 31
|
||||||||||||||||||||||
|
2013
|
2012
|
2011
|
2013
|
2012
|
2011
|
||||||||||||||||||
|
(Dollars in Millions)
|
(Dollars in Millions)
|
||||||||||||||||||||||
|
Climate
|
$
|
194
|
|
$
|
180
|
|
$
|
187
|
|
$
|
187
|
|
$
|
152
|
|
$
|
168
|
|
|||||
|
Electronics
|
30
|
|
28
|
|
37
|
|
46
|
|
23
|
|
23
|
|
|||||||||||
|
Interiors
|
29
|
|
31
|
|
40
|
|
35
|
|
34
|
|
41
|
|
|||||||||||
|
Total segment
|
253
|
|
239
|
|
264
|
|
268
|
|
209
|
|
232
|
|
|||||||||||
|
Corporate
|
9
|
|
19
|
|
31
|
|
1
|
|
9
|
|
8
|
|
|||||||||||
|
Total consolidated
|
$
|
262
|
|
$
|
258
|
|
$
|
295
|
|
$
|
269
|
|
$
|
218
|
|
$
|
240
|
|
|||||
Corporate includes depreciation and amortization and capital expenditures attributable to the Company’s technical centers, corporate headquarters and other administrative and support functions.
103
Financial Information by Geographic Region
|
|
Sales
|
Property and Equipment, net
|
|||||||||||||||||
|
Year Ended December 31
|
|||||||||||||||||||
|
2013
|
2012
|
2011
|
2013
|
2012
|
|||||||||||||||
|
(Dollars in Millions)
|
|||||||||||||||||||
|
United States
|
$
|
1,403
|
|
$
|
1,239
|
|
$
|
1,104
|
|
$
|
67
|
|
$
|
113
|
|
||||
|
Mexico
|
40
|
|
17
|
|
15
|
|
21
|
|
21
|
|
|||||||||
|
Canada
|
93
|
|
95
|
|
105
|
|
21
|
|
25
|
|
|||||||||
|
Intra-region eliminations
|
—
|
|
(12
|
)
|
(6
|
)
|
—
|
|
—
|
|
|||||||||
|
North America
|
1,536
|
|
1,339
|
|
1,218
|
|
109
|
|
159
|
|
|||||||||
|
Germany
|
125
|
|
147
|
|
199
|
|
23
|
|
24
|
|
|||||||||
|
France
|
490
|
|
548
|
|
713
|
|
73
|
|
83
|
|
|||||||||
|
Portugal
|
574
|
|
539
|
|
468
|
|
99
|
|
85
|
|
|||||||||
|
Spain
|
236
|
|
264
|
|
421
|
|
35
|
|
32
|
|
|||||||||
|
Czech Republic
|
425
|
|
227
|
|
246
|
|
46
|
|
38
|
|
|||||||||
|
Hungary
|
290
|
|
282
|
|
321
|
|
69
|
|
69
|
|
|||||||||
|
Slovakia
|
405
|
|
374
|
|
339
|
|
58
|
|
54
|
|
|||||||||
|
Other Europe
|
233
|
|
200
|
|
178
|
|
72
|
|
24
|
|
|||||||||
|
Intra-region eliminations
|
(337
|
)
|
(190
|
)
|
(114
|
)
|
—
|
|
—
|
|
|||||||||
|
Europe
|
2,441
|
|
2,391
|
|
2,771
|
|
475
|
|
409
|
|
|||||||||
|
Korea
|
2,259
|
|
2,048
|
|
2,488
|
|
474
|
|
458
|
|
|||||||||
|
China
|
1,123
|
|
748
|
|
555
|
|
182
|
|
133
|
|
|||||||||
|
India
|
277
|
|
353
|
|
341
|
|
79
|
|
77
|
|
|||||||||
|
Japan
|
203
|
|
204
|
|
221
|
|
9
|
|
12
|
|
|||||||||
|
Thailand
|
347
|
|
339
|
|
225
|
|
30
|
|
28
|
|
|||||||||
|
Other Asia
|
9
|
|
12
|
|
19
|
|
—
|
|
—
|
|
|||||||||
|
Intra-region eliminations
|
(486
|
)
|
(424
|
)
|
(304
|
)
|
—
|
|
—
|
|
|||||||||
|
Asia
|
3,732
|
|
3,280
|
|
3,545
|
|
774
|
|
708
|
|
|||||||||
|
South America
|
411
|
|
423
|
|
511
|
|
56
|
|
50
|
|
|||||||||
|
Inter-region eliminations
|
(681
|
)
|
(576
|
)
|
(513
|
)
|
—
|
|
—
|
|
|||||||||
|
$
|
7,439
|
|
$
|
6,857
|
|
$
|
7,532
|
|
$
|
1,414
|
|
$
|
1,326
|
|
|||||
The decrease in sales in Korea of
$588 million
from 2011 to 2012 is due to the deconsolidation of Duckyang. Sales are attributable to geographic areas based on the location of the assets generating the sales.
104
On April 6, 2011, the Company completed the sale of $500 million aggregate principal amount of 6.75% senior notes due April 15, 2019 (the "Original Senior Notes"). In January 2012, the Company exchanged substantially identical senior notes (the "Senior Notes") that have been registered under Securities Act of 1933, as amended, for all of the Original Senior Notes. The Senior Notes were issued under an Indenture, dated April 6, 2011 (the “Indenture”), among the Company, the subsidiary guarantors named therein, and The Bank of New York Mellon Trust Company, N.A., as trustee (the “Trustee”). The Indenture and the form of Senior Notes provide, among other things, that the Senior Notes are senior unsecured obligations of the Company. Interest is payable on the Senior Notes on April 15 and October 15 of each year beginning on October 15, 2011 until maturity. Each of the Company’s existing and future wholly owned domestic restricted subsidiaries that guarantee debt under the Company’s revolving loan credit agreement guarantee the Senior Notes.
Guarantor Financial Statements
Certain subsidiaries of the Company (as listed below, collectively the “Guarantor Subsidiaries”) have guaranteed fully and unconditionally, on a joint and several basis, the obligation to pay principal and interest under the Company’s revolving loan credit agreement and the Senior Notes. The Guarantor Subsidiaries include: Visteon Electronics Corporation; Visteon European Holdings, Inc.; Visteon Global Treasury, Inc.; Visteon International Business Development, Inc.; Visteon International Holdings, Inc.; Visteon Global Technologies, Inc.; Visteon Systems, LLC; and VC Aviation Services, LLC.
The guarantor financial statements are comprised of the following condensed consolidating financial information:
|
•
|
The Parent Company, the issuer of the guaranteed obligations;
|
|
•
|
Guarantor subsidiaries, on a combined basis, as specified in the Indentures related to the Senior Notes;
|
|
•
|
Non-guarantor subsidiaries, on a combined basis;
|
|
•
|
Consolidating entries and eliminations representing adjustments to (a) eliminate intercompany transactions between or among the Parent Company, the guarantor subsidiaries and the non-guarantor subsidiaries, (b) eliminate the investments in subsidiaries, and (c) record consolidating entries.
|
105
VISTEON CORPORATION
CONDENSED CONSOLIDATING STATEMENTS OF OPERATIONS
|
Year Ended December 31, 2013
|
|||||||||||||||||||
|
Parent Company
|
Guarantor
Subsidiaries
|
Non-Guarantor
Subsidiaries
|
Eliminations
|
Consolidated
|
|||||||||||||||
|
(Dollars in Millions)
|
|||||||||||||||||||
|
Net sales
|
$
|
150
|
|
$
|
1,141
|
|
$
|
6,789
|
|
$
|
(641
|
)
|
$
|
7,439
|
|
||||
|
Cost of sales
|
295
|
|
908
|
|
6,193
|
|
(641
|
)
|
6,755
|
|
|||||||||
|
Gross margin
|
(145
|
)
|
233
|
|
596
|
|
—
|
|
684
|
|
|||||||||
|
Selling, general and administrative expenses
|
64
|
|
44
|
|
259
|
|
—
|
|
367
|
|
|||||||||
|
Equity in net income of non-consolidated affiliates
|
—
|
|
—
|
|
213
|
|
—
|
|
213
|
|
|||||||||
|
Restructuring expenses
|
6
|
|
—
|
|
33
|
|
—
|
|
39
|
|
|||||||||
|
Interest expense (income), net
|
35
|
|
(8
|
)
|
12
|
|
—
|
|
39
|
|
|||||||||
|
Gain on Yanfeng transactions
|
—
|
|
—
|
|
465
|
|
—
|
|
465
|
|
|||||||||
|
Other expense, net
|
42
|
|
—
|
|
(7
|
)
|
—
|
|
35
|
|
|||||||||
|
(Loss) income before income taxes and earnings of subsidiaries
|
(292
|
)
|
197
|
|
977
|
|
—
|
|
882
|
|
|||||||||
|
Provision for income taxes
|
1
|
|
—
|
|
106
|
|
—
|
|
107
|
|
|||||||||
|
(Loss) income before earnings of subsidiaries
|
(293
|
)
|
197
|
|
871
|
|
—
|
|
775
|
|
|||||||||
|
Equity in earnings of consolidated subsidiaries
|
983
|
|
699
|
|
—
|
|
(1,682
|
)
|
—
|
|
|||||||||
|
Net income
|
690
|
|
896
|
|
871
|
|
(1,682
|
)
|
775
|
|
|||||||||
|
Net income attributable to non-controlling interests
|
—
|
|
—
|
|
85
|
|
—
|
|
85
|
|
|||||||||
|
Net income attributable to Visteon Corporation
|
$
|
690
|
|
$
|
896
|
|
$
|
786
|
|
$
|
(1,682
|
)
|
$
|
690
|
|
||||
|
Year Ended December 31, 2012
|
|||||||||||||||||||
|
Parent Company
|
Guarantor
Subsidiaries
|
Non-Guarantor
Subsidiaries
|
Eliminations
|
Consolidated
|
|||||||||||||||
|
(Dollars in Millions)
|
|||||||||||||||||||
|
Net sales
|
$
|
247
|
|
$
|
1,392
|
|
$
|
6,229
|
|
$
|
(1,011
|
)
|
$
|
6,857
|
|
||||
|
Cost of sales
|
454
|
|
1,140
|
|
5,685
|
|
(1,011
|
)
|
6,268
|
|
|||||||||
|
Gross margin
|
(207
|
)
|
252
|
|
544
|
|
—
|
|
589
|
|
|||||||||
|
Selling, general and administrative expenses
|
99
|
|
61
|
|
209
|
|
—
|
|
369
|
|
|||||||||
|
Equity in net income of non-consolidated affiliates
|
—
|
|
—
|
|
226
|
|
—
|
|
226
|
|
|||||||||
|
Restructuring expenses
|
4
|
|
—
|
|
75
|
|
—
|
|
79
|
|
|||||||||
|
Interest expense (income), net
|
39
|
|
(3
|
)
|
(1
|
)
|
—
|
|
35
|
|
|||||||||
|
Other expense (income), net
|
33
|
|
—
|
|
8
|
|
—
|
|
41
|
|
|||||||||
|
(Loss) income before income taxes and earnings of subsidiaries
|
(382
|
)
|
194
|
|
479
|
|
—
|
|
291
|
|
|||||||||
|
Provision for income taxes
|
—
|
|
—
|
|
121
|
|
—
|
|
121
|
|
|||||||||
|
(Loss) income before earnings of subsidiaries
|
(382
|
)
|
194
|
|
358
|
|
—
|
|
170
|
|
|||||||||
|
Equity in earnings of consolidated subsidiaries
|
497
|
|
277
|
|
—
|
|
(774
|
)
|
—
|
|
|||||||||
|
Income from continuing operations
|
115
|
|
471
|
|
358
|
|
(774
|
)
|
170
|
|
|||||||||
|
(Loss) income from discontinued operations, net of tax
|
(15
|
)
|
42
|
|
(30
|
)
|
—
|
|
(3
|
)
|
|||||||||
|
Net income
|
100
|
|
513
|
|
328
|
|
(774
|
)
|
167
|
|
|||||||||
|
Net income attributable to non-controlling interests
|
—
|
|
—
|
|
67
|
|
—
|
|
67
|
|
|||||||||
|
Net income attributable to Visteon Corporation
|
$
|
100
|
|
$
|
513
|
|
$
|
261
|
|
$
|
(774
|
)
|
$
|
100
|
|
||||
106
|
Year Ended December 31, 2011
|
|||||||||||||||||||
|
Parent Company
|
Guarantor
Subsidiaries
|
Non-Guarantor
Subsidiaries
|
Eliminations
|
Consolidated
|
|||||||||||||||
|
(Dollars in Millions)
|
|||||||||||||||||||
|
Net sales
|
$
|
194
|
|
$
|
1,497
|
|
$
|
7,045
|
|
$
|
(1,204
|
)
|
$
|
7,532
|
|
||||
|
Cost of sales
|
391
|
|
1,200
|
|
6,527
|
|
(1,204
|
)
|
6,914
|
|
|||||||||
|
Gross margin
|
(197
|
)
|
297
|
|
518
|
|
—
|
|
618
|
|
|||||||||
|
Selling, general and administrative expenses
|
102
|
|
67
|
|
218
|
|
—
|
|
387
|
|
|||||||||
|
Equity in net income of non-consolidated affiliates
|
—
|
|
—
|
|
168
|
|
—
|
|
168
|
|
|||||||||
|
Restructuring expenses
|
—
|
|
—
|
|
24
|
|
—
|
|
24
|
|
|||||||||
|
Interest expense (income), net
|
38
|
|
(12
|
)
|
1
|
|
—
|
|
27
|
|
|||||||||
|
Other expense (income), net
|
27
|
|
(6
|
)
|
(10
|
)
|
—
|
|
11
|
|
|||||||||
|
(Loss) income before income taxes and earnings of subsidiaries
|
(364
|
)
|
248
|
|
453
|
|
—
|
|
337
|
|
|||||||||
|
Provision for income taxes
|
—
|
|
—
|
|
127
|
|
—
|
|
127
|
|
|||||||||
|
(Loss) income before earnings of subsidiaries
|
(364
|
)
|
248
|
|
326
|
|
—
|
|
210
|
|
|||||||||
|
Equity in earnings of consolidated subsidiaries
|
490
|
|
172
|
|
—
|
|
(662
|
)
|
—
|
|
|||||||||
|
Income from continuing operations
|
126
|
|
420
|
|
326
|
|
(662
|
)
|
210
|
|
|||||||||
|
(Loss) income from discontinued operations, net of tax
|
(46
|
)
|
57
|
|
(67
|
)
|
—
|
|
(56
|
)
|
|||||||||
|
Net income
|
80
|
|
477
|
|
259
|
|
(662
|
)
|
154
|
|
|||||||||
|
Net income attributable to non-controlling interests
|
—
|
|
—
|
|
74
|
|
—
|
|
74
|
|
|||||||||
|
Net income attributable to Visteon Corporation
|
$
|
80
|
|
$
|
477
|
|
$
|
185
|
|
$
|
(662
|
)
|
$
|
80
|
|
||||
107
VISTEON CORPORATION
CONDENSED CONSOLIDATING STATEMENTS OF COMPREHENSIVE INCOME
|
Year Ended December 31, 2013
|
|||||||||||||||||||
|
Parent Company
|
Guarantor
Subsidiaries
|
Non-Guarantor
Subsidiaries
|
Eliminations
|
Consolidated
|
|||||||||||||||
|
(Dollars in Millions)
|
|||||||||||||||||||
|
Net income
|
$
|
690
|
|
$
|
896
|
|
$
|
871
|
|
$
|
(1,682
|
)
|
$
|
775
|
|
||||
|
Other comprehensive income (loss), net of tax
|
|||||||||||||||||||
|
Foreign currency translation adjustments
|
(47
|
)
|
(48
|
)
|
(48
|
)
|
96
|
|
(47
|
)
|
|||||||||
|
Benefit plans, net of tax
|
132
|
|
32
|
|
(2
|
)
|
(31
|
)
|
131
|
|
|||||||||
|
Unrealized hedging (loss) gains and other, net of tax
|
(7
|
)
|
(7
|
)
|
(10
|
)
|
14
|
|
(10
|
)
|
|||||||||
|
Other comprehensive income (loss), net of tax
|
78
|
|
(23
|
)
|
(60
|
)
|
79
|
|
74
|
|
|||||||||
|
Comprehensive income
|
768
|
|
873
|
|
811
|
|
(1,603
|
)
|
849
|
|
|||||||||
|
Comprehensive income attributable to non-controlling interests
|
—
|
|
—
|
|
81
|
|
—
|
|
81
|
|
|||||||||
|
Comprehensive income attributable to Visteon Corporation
|
$
|
768
|
|
$
|
873
|
|
$
|
730
|
|
$
|
(1,603
|
)
|
$
|
768
|
|
||||
|
Year Ended December 31, 2012
|
|||||||||||||||||||
|
Parent Company
|
Guarantor
Subsidiaries
|
Non-Guarantor
Subsidiaries
|
Eliminations
|
Consolidated
|
|||||||||||||||
|
(Dollars in Millions)
|
|||||||||||||||||||
|
Net income
|
$
|
100
|
|
$
|
513
|
|
$
|
328
|
|
$
|
(774
|
)
|
$
|
167
|
|
||||
|
Other comprehensive (loss) income, net of tax
|
|||||||||||||||||||
|
Foreign currency translation adjustments
|
52
|
|
53
|
|
76
|
|
(108
|
)
|
73
|
|
|||||||||
|
Benefit plans, net of tax
|
(133
|
)
|
(126
|
)
|
(118
|
)
|
243
|
|
(134
|
)
|
|||||||||
|
Unrealized hedging (losses) gains and other, net of tax
|
16
|
|
16
|
|
22
|
|
(32
|
)
|
22
|
|
|||||||||
|
Other comprehensive (loss) income, net of tax
|
(65
|
)
|
(57
|
)
|
(20
|
)
|
103
|
|
(39
|
)
|
|||||||||
|
Comprehensive income
|
35
|
|
456
|
|
308
|
|
(671
|
)
|
128
|
|
|||||||||
|
Comprehensive income attributable to non-controlling interests
|
—
|
|
—
|
|
93
|
|
—
|
|
93
|
|
|||||||||
|
Comprehensive income attributable to Visteon Corporation
|
$
|
35
|
|
$
|
456
|
|
$
|
215
|
|
$
|
(671
|
)
|
$
|
35
|
|
||||
108
|
Year Ended December 31, 2011
|
|||||||||||||||||||
|
Parent Company
|
Guarantor
Subsidiaries
|
Non-Guarantor
Subsidiaries
|
Eliminations
|
Consolidated
|
|||||||||||||||
|
(Dollars in Millions)
|
|||||||||||||||||||
|
Net income
|
$
|
80
|
|
$
|
477
|
|
$
|
259
|
|
$
|
(662
|
)
|
$
|
154
|
|
||||
|
Other comprehensive income (loss), net of tax
|
|||||||||||||||||||
|
Foreign currency translation adjustments
|
(42
|
)
|
(47
|
)
|
(67
|
)
|
103
|
|
(53
|
)
|
|||||||||
|
Benefit plans, net of tax
|
(26
|
)
|
(3
|
)
|
(5
|
)
|
8
|
|
(26
|
)
|
|||||||||
|
Unrealized hedging (losses) gains and other, net of tax
|
(7
|
)
|
(8
|
)
|
(10
|
)
|
16
|
|
(9
|
)
|
|||||||||
|
Other comprehensive (loss) income, net of tax
|
(75
|
)
|
(58
|
)
|
(82
|
)
|
127
|
|
(88
|
)
|
|||||||||
|
Comprehensive income
|
5
|
|
419
|
|
177
|
|
(535
|
)
|
66
|
|
|||||||||
|
Comprehensive income attributable to non-controlling interests
|
—
|
|
—
|
|
61
|
|
—
|
|
61
|
|
|||||||||
|
Comprehensive income attributable to Visteon Corporation
|
$
|
5
|
|
$
|
419
|
|
$
|
116
|
|
$
|
(535
|
)
|
$
|
5
|
|
||||
109
VISTEON CORPORATION
CONDENSED CONSOLIDATING BALANCE SHEETS
|
December 31, 2013
|
|||||||||||||||||||
|
Parent Company
|
Guarantor
Subsidiaries
|
Non-Guarantor
Subsidiaries
|
Eliminations
|
Consolidated
|
|||||||||||||||
|
(Dollars in Millions)
|
|||||||||||||||||||
|
ASSETS
|
|||||||||||||||||||
|
Cash and equivalents
|
$
|
1,115
|
|
$
|
12
|
|
$
|
550
|
|
$
|
—
|
|
$
|
1,677
|
|
||||
|
Accounts receivable, net
|
363
|
|
566
|
|
1,298
|
|
(1,000
|
)
|
1,227
|
|
|||||||||
|
Inventories, net
|
13
|
|
21
|
|
438
|
|
—
|
|
472
|
|
|||||||||
|
Other current assets
|
30
|
|
41
|
|
306
|
|
—
|
|
377
|
|
|||||||||
|
Total current assets
|
1,521
|
|
640
|
|
2,592
|
|
(1,000
|
)
|
3,753
|
|
|||||||||
|
Property and equipment, net
|
12
|
|
20
|
|
1,382
|
|
—
|
|
1,414
|
|
|||||||||
|
Investment in affiliates
|
1,312
|
|
1,185
|
|
—
|
|
(2,497
|
)
|
—
|
|
|||||||||
|
Equity in net assets of non-consolidated affiliates
|
—
|
|
—
|
|
228
|
|
—
|
|
228
|
|
|||||||||
|
Intangible assets, net
|
—
|
|
15
|
|
432
|
|
—
|
|
447
|
|
|||||||||
|
Other non-current assets
|
46
|
|
1,389
|
|
138
|
|
(1,388
|
)
|
185
|
|
|||||||||
|
Total assets
|
$
|
2,891
|
|
$
|
3,249
|
|
$
|
4,772
|
|
$
|
(4,885
|
)
|
$
|
6,027
|
|
||||
|
LIABILITIES AND EQUITY
|
|||||||||||||||||||
|
Short-term debt, including current portion of long-term debt
|
$
|
144
|
|
$
|
47
|
|
$
|
311
|
|
$
|
(396
|
)
|
$
|
106
|
|
||||
|
Accounts payable
|
145
|
|
195
|
|
1,496
|
|
(604
|
)
|
1,232
|
|
|||||||||
|
Other current liabilities
|
102
|
|
16
|
|
346
|
|
—
|
|
464
|
|
|||||||||
|
Total current liabilities
|
391
|
|
258
|
|
2,153
|
|
(1,000
|
)
|
1,802
|
|
|||||||||
|
Long-term debt
|
404
|
|
46
|
|
1,562
|
|
(1,388
|
)
|
624
|
|
|||||||||
|
Employee benefits
|
142
|
|
2
|
|
296
|
|
—
|
|
440
|
|
|||||||||
|
Other non-current liabilities
|
34
|
|
3
|
|
251
|
|
—
|
|
288
|
|
|||||||||
|
Stockholders’ equity:
|
|||||||||||||||||||
|
Total Visteon Corporation stockholders’ equity
|
1,920
|
|
2,940
|
|
(443
|
)
|
(2,497
|
)
|
1,920
|
|
|||||||||
|
Non-controlling interests
|
—
|
|
—
|
|
953
|
|
—
|
|
953
|
|
|||||||||
|
Total equity
|
1,920
|
|
2,940
|
|
510
|
|
(2,497
|
)
|
2,873
|
|
|||||||||
|
Total liabilities and equity
|
$
|
2,891
|
|
$
|
3,249
|
|
$
|
4,772
|
|
$
|
(4,885
|
)
|
$
|
6,027
|
|
||||
110
|
December 31, 2012
|
|||||||||||||||||||
|
Parent Company
|
Guarantor
Subsidiaries
|
Non-Guarantor
Subsidiaries
|
Eliminations
|
Consolidated
|
|||||||||||||||
|
(Dollars in Millions)
|
|||||||||||||||||||
|
ASSETS
|
|||||||||||||||||||
|
Cash and equivalents
|
$
|
191
|
|
$
|
54
|
|
$
|
580
|
|
$
|
—
|
|
$
|
825
|
|
||||
|
Accounts receivable, net
|
279
|
|
676
|
|
1,138
|
|
(931
|
)
|
1,162
|
|
|||||||||
|
Inventories, net
|
15
|
|
23
|
|
347
|
|
—
|
|
385
|
|
|||||||||
|
Other current assets
|
24
|
|
32
|
|
235
|
|
—
|
|
291
|
|
|||||||||
|
Total current assets
|
509
|
|
785
|
|
2,300
|
|
(931
|
)
|
2,663
|
|
|||||||||
|
Property and equipment, net
|
20
|
|
62
|
|
1,244
|
|
—
|
|
1,326
|
|
|||||||||
|
Investment in affiliates
|
2,024
|
|
1,587
|
|
—
|
|
(3,611
|
)
|
—
|
|
|||||||||
|
Equity in net assets of non-consolidated affiliates
|
—
|
|
—
|
|
756
|
|
—
|
|
756
|
|
|||||||||
|
Intangible assets, net
|
86
|
|
45
|
|
201
|
|
—
|
|
332
|
|
|||||||||
|
Other non-current assets
|
14
|
|
—
|
|
70
|
|
(5
|
)
|
79
|
|
|||||||||
|
Total assets
|
$
|
2,653
|
|
$
|
2,479
|
|
$
|
4,571
|
|
$
|
(4,547
|
)
|
$
|
5,156
|
|
||||
|
LIABILITIES AND EQUITY
|
|||||||||||||||||||
|
Short-term debt, including current portion of long-term debt
|
$
|
266
|
|
$
|
24
|
|
$
|
225
|
|
$
|
(419
|
)
|
$
|
96
|
|
||||
|
Accounts payable
|
172
|
|
159
|
|
1,204
|
|
(508
|
)
|
1,027
|
|
|||||||||
|
Other current liabilities
|
76
|
|
27
|
|
326
|
|
—
|
|
429
|
|
|||||||||
|
Total current liabilities
|
514
|
|
210
|
|
1,755
|
|
(927
|
)
|
1,552
|
|
|||||||||
|
Long-term debt
|
450
|
|
—
|
|
29
|
|
(6
|
)
|
473
|
|
|||||||||
|
Employee benefits
|
258
|
|
34
|
|
279
|
|
—
|
|
571
|
|
|||||||||
|
Other non-current liabilities
|
46
|
|
7
|
|
366
|
|
—
|
|
419
|
|
|||||||||
|
Stockholders’ equity:
|
|||||||||||||||||||
|
Total Visteon Corporation stockholders’ equity
|
1,385
|
|
2,228
|
|
1,386
|
|
(3,614
|
)
|
1,385
|
|
|||||||||
|
Non-controlling interests
|
—
|
|
—
|
|
756
|
|
—
|
|
756
|
|
|||||||||
|
Total equity
|
1,385
|
|
2,228
|
|
2,142
|
|
(3,614
|
)
|
2,141
|
|
|||||||||
|
Total liabilities and equity
|
$
|
2,653
|
|
$
|
2,479
|
|
$
|
4,571
|
|
$
|
(4,547
|
)
|
$
|
5,156
|
|
||||
111
VISTEON CORPORATION
CONDENSED CONSOLIDATING STATEMENTS OF CASH FLOWS
|
Year Ended December 31, 2013
|
|||||||||||||||||||
|
Parent Company
|
Guarantor
Subsidiaries
|
Non-
Guarantor
Subsidiaries
|
Eliminations
|
Consolidated
|
|||||||||||||||
|
(Dollars in Millions)
|
|||||||||||||||||||
|
Net cash (used by) provided from operating activities
|
$
|
(242
|
)
|
$
|
1,244
|
|
$
|
(382
|
)
|
$
|
(308
|
)
|
$
|
312
|
|
||||
|
Investing activities
|
|||||||||||||||||||
|
Capital expenditures
|
(1
|
)
|
(6
|
)
|
(262
|
)
|
—
|
|
(269
|
)
|
|||||||||
|
Dividends received from consolidated affiliates
|
1,464
|
|
437
|
|
—
|
|
(1,901
|
)
|
—
|
|
|||||||||
|
Cash acquired in consolidation of YFVE
|
—
|
|
—
|
|
38
|
|
—
|
|
38
|
|
|||||||||
|
Proceeds from asset sales and business divestitures
|
—
|
|
—
|
|
977
|
|
—
|
|
977
|
|
|||||||||
|
Payments to acquire interest in joint venture
|
—
|
|
—
|
|
(48
|
)
|
—
|
|
(48
|
)
|
|||||||||
|
Net cash provided from investing activities
|
1,463
|
|
431
|
|
705
|
|
(1,901
|
)
|
698
|
|
|||||||||
|
Financing activities
|
|||||||||||||||||||
|
Short-term debt, net
|
—
|
|
—
|
|
(20
|
)
|
—
|
|
(20
|
)
|
|||||||||
|
Proceeds from issuance of debt, net of issuance costs
|
—
|
|
—
|
|
204
|
|
—
|
|
204
|
|
|||||||||
|
Principal payments on debt
|
—
|
|
—
|
|
(6
|
)
|
—
|
|
(6
|
)
|
|||||||||
|
Repurchase of long-term notes
|
(52
|
)
|
—
|
|
—
|
|
—
|
|
(52
|
)
|
|||||||||
|
Repurchase of common stock
|
(250
|
)
|
—
|
|
—
|
|
—
|
|
(250
|
)
|
|||||||||
|
Dividends paid to consolidated affiliates
|
—
|
|
(1,718
|
)
|
(491
|
)
|
2,209
|
|
—
|
|
|||||||||
|
Dividends paid to non-controlling interests
|
—
|
|
—
|
|
(22
|
)
|
—
|
|
(22
|
)
|
|||||||||
|
Other
|
5
|
|
—
|
|
—
|
|
—
|
|
5
|
|
|||||||||
|
Net cash used by financing activities
|
(297
|
)
|
(1,718
|
)
|
(335
|
)
|
2,209
|
|
(141
|
)
|
|||||||||
|
Effect of exchange rate changes on cash and equivalents
|
—
|
|
1
|
|
(18
|
)
|
—
|
|
(17
|
)
|
|||||||||
|
Net increase (decrease) in cash and equivalents
|
924
|
|
(42
|
)
|
(30
|
)
|
—
|
|
852
|
|
|||||||||
|
Cash and equivalents at beginning of period
|
191
|
|
54
|
|
580
|
|
—
|
|
825
|
|
|||||||||
|
Cash and equivalents at end of period
|
$
|
1,115
|
|
$
|
12
|
|
$
|
550
|
|
$
|
—
|
|
$
|
1,677
|
|
||||
112
|
Year Ended December 31, 2012
|
|||||||||||||||||||
|
Parent Company
|
Guarantor
Subsidiaries
|
Non-
Guarantor
Subsidiaries
|
Eliminations
|
Consolidated
|
|||||||||||||||
|
(Dollars in Millions)
|
|||||||||||||||||||
|
Net cash (used by) provided from operating activities
|
$
|
(143
|
)
|
$
|
121
|
|
$
|
261
|
|
$
|
—
|
|
$
|
239
|
|
||||
|
Investing activities
|
|||||||||||||||||||
|
Capital expenditures
|
(5
|
)
|
(11
|
)
|
(213
|
)
|
—
|
|
(229
|
)
|
|||||||||
|
Dividends received from consolidated affiliates
|
233
|
|
108
|
|
—
|
|
(341
|
)
|
—
|
|
|||||||||
|
Proceeds from divestitures and asset sales
|
93
|
|
11
|
|
87
|
|
—
|
|
191
|
|
|||||||||
|
Other
|
—
|
|
—
|
|
(2
|
)
|
—
|
|
(2
|
)
|
|||||||||
|
Net cash provided from (used by) investing activities
|
321
|
|
108
|
|
(128
|
)
|
(341
|
)
|
(40
|
)
|
|||||||||
|
Financing activities
|
|||||||||||||||||||
|
Short term debt, net
|
—
|
|
—
|
|
5
|
|
—
|
|
5
|
|
|||||||||
|
Proceeds from issuance of debt, net of issuance costs
|
—
|
|
—
|
|
831
|
|
—
|
|
831
|
|
|||||||||
|
Principal payments on debt
|
(1
|
)
|
—
|
|
(823
|
)
|
—
|
|
(824
|
)
|
|||||||||
|
Repurchase of long-term notes
|
(52
|
)
|
—
|
|
—
|
|
—
|
|
(52
|
)
|
|||||||||
|
Repurchase of common stock
|
(50
|
)
|
—
|
|
—
|
|
—
|
|
(50
|
)
|
|||||||||
|
Dividends paid to consolidated affiliates
|
—
|
|
(232
|
)
|
(109
|
)
|
341
|
|
—
|
|
|||||||||
|
Dividends paid to non-controlling interests
|
—
|
|
—
|
|
(27
|
)
|
—
|
|
(27
|
)
|
|||||||||
|
Other
|
2
|
|
—
|
|
—
|
|
—
|
|
2
|
|
|||||||||
|
Net cash (used by) provided from financing activities
|
(101
|
)
|
(232
|
)
|
(123
|
)
|
341
|
|
(115
|
)
|
|||||||||
|
Effect of exchange rate changes on cash and equivalents
|
—
|
|
2
|
|
16
|
|
—
|
|
18
|
|
|||||||||
|
Net increase (decrease) in cash and equivalents
|
77
|
|
(1
|
)
|
26
|
|
—
|
|
102
|
|
|||||||||
|
Cash and equivalents at beginning of period
|
114
|
|
55
|
|
554
|
|
—
|
|
723
|
|
|||||||||
|
Cash and equivalents at end of period
|
$
|
191
|
|
$
|
54
|
|
$
|
580
|
|
$
|
—
|
|
$
|
825
|
|
||||
113
|
Year Ended December 31, 2011
|
||||||||||||||||||||
|
Parent Company
|
Guarantor
Subsidiaries
|
Non-
Guarantor
Subsidiaries
|
Eliminations
|
Consolidated
|
||||||||||||||||
|
(Dollars in Millions)
|
||||||||||||||||||||
|
Net cash (used by) provided from operating activities
|
$
|
(163
|
)
|
$
|
(75
|
)
|
$
|
413
|
|
$
|
—
|
|
$
|
175
|
|
|||||
|
Investing activities
|
||||||||||||||||||||
|
Capital expenditures
|
(4
|
)
|
(12
|
)
|
(242
|
)
|
—
|
|
(258
|
)
|
||||||||||
|
Proceeds from divestitures and asset sales
|
—
|
|
—
|
|
14
|
|
—
|
|
14
|
|
||||||||||
|
Dividends received from consolidated affiliates
|
109
|
|
173
|
|
—
|
|
(282
|
)
|
—
|
|
||||||||||
|
Cash associated with deconsolidations
|
—
|
|
—
|
|
(52
|
)
|
—
|
|
(52
|
)
|
||||||||||
|
Payments to acquire interest in joint ventures
|
—
|
|
—
|
|
(29
|
)
|
—
|
|
(29
|
)
|
||||||||||
|
Other
|
—
|
|
—
|
|
(6
|
)
|
—
|
|
(6
|
)
|
||||||||||
|
Net cash provided from (used by) investing activities
|
105
|
|
161
|
|
(315
|
)
|
(282
|
)
|
(331
|
)
|
||||||||||
|
Financing activities
|
||||||||||||||||||||
|
Cash restriction, net
|
58
|
|
—
|
|
(7
|
)
|
—
|
|
51
|
|
||||||||||
|
Short term debt, net
|
—
|
|
—
|
|
17
|
|
—
|
|
17
|
|
||||||||||
|
Proceeds from issuance of debt, net of issuance costs
|
492
|
|
—
|
|
11
|
|
—
|
|
503
|
|
||||||||||
|
Rights offering fees
|
(33
|
)
|
—
|
|
—
|
|
—
|
|
(33
|
)
|
||||||||||
|
Principal payments on debt
|
(501
|
)
|
—
|
|
(12
|
)
|
—
|
|
(513
|
)
|
||||||||||
|
Dividends paid to consolidated affiliates
|
—
|
|
(109
|
)
|
(173
|
)
|
282
|
|
—
|
|
||||||||||
|
Dividends paid to non-controlling interests
|
—
|
|
—
|
|
(31
|
)
|
—
|
|
(31
|
)
|
||||||||||
|
Other
|
3
|
|
—
|
|
—
|
|
—
|
|
3
|
|
||||||||||
|
Net cash provided from (used by) financing activities
|
19
|
|
(109
|
)
|
(195
|
)
|
282
|
|
(3
|
)
|
||||||||||
|
Effect of exchange rate changes on cash and equivalents
|
—
|
|
(3
|
)
|
(20
|
)
|
—
|
|
(23
|
)
|
||||||||||
|
Net (decrease) increase in cash and equivalents
|
(39
|
)
|
(26
|
)
|
(117
|
)
|
—
|
|
(182
|
)
|
||||||||||
|
Cash and equivalents at beginning of period
|
153
|
|
81
|
|
671
|
|
—
|
|
905
|
|
||||||||||
|
Cash and equivalents at end of period
|
$
|
114
|
|
$
|
55
|
|
$
|
554
|
|
$
|
—
|
|
$
|
723
|
|
|||||
114
The following table presents summary quarterly financial data for continuing operations.
|
2013
|
2012
|
||||||||||||||||||||||||||||||
|
First Quarter
|
Second Quarter
|
Third Quarter
|
Fourth Quarter
|
First Quarter
|
Second Quarter
|
Third Quarter
|
Fourth Quarter
|
||||||||||||||||||||||||
|
(Dollars in Millions, Except Per Share Amounts)
|
|||||||||||||||||||||||||||||||
|
Net sales
|
$
|
1,856
|
|
$
|
1,892
|
|
$
|
1,733
|
|
$
|
1,958
|
|
$
|
1,717
|
|
$
|
1,693
|
|
$
|
1,624
|
|
$
|
1,823
|
|
|||||||
|
Gross margin
|
154
|
|
185
|
|
143
|
|
202
|
|
134
|
|
128
|
|
129
|
|
198
|
|
|||||||||||||||
|
Income before income taxes
|
66
|
|
125
|
|
80
|
|
611
|
|
13
|
|
127
|
|
72
|
|
79
|
|
|||||||||||||||
|
Income (loss) from continuing operations
|
84
|
|
86
|
|
60
|
|
545
|
|
(14
|
)
|
85
|
|
39
|
|
60
|
|
|||||||||||||||
|
Net income (loss)
|
84
|
|
86
|
|
60
|
|
545
|
|
(11
|
)
|
84
|
|
34
|
|
60
|
|
|||||||||||||||
|
Net income (loss) attributable to Visteon Corporation
|
$
|
69
|
|
$
|
65
|
|
$
|
43
|
|
$
|
513
|
|
$
|
(29
|
)
|
$
|
75
|
|
$
|
15
|
|
$
|
39
|
|
|||||||
|
Per Share Data:
|
|||||||||||||||||||||||||||||||
|
Basic earnings (loss) per share attributable to Visteon Corporation
|
$
|
1.34
|
|
$
|
1.30
|
|
$
|
0.87
|
|
$
|
10.56
|
|
$
|
(0.56
|
)
|
$
|
1.41
|
|
$
|
0.28
|
|
$
|
0.74
|
|
|||||||
|
Diluted earnings (loss) per share attributable to Visteon Corporation
|
$
|
1.33
|
|
$
|
1.29
|
|
$
|
0.85
|
|
$
|
10.32
|
|
$
|
(0.56
|
)
|
$
|
1.40
|
|
$
|
0.28
|
|
$
|
0.74
|
|
|||||||
Income before income taxes, income (loss) from continuing operations, and net income (loss) attributable to Visteon Corporation for the quarter ended December 31, 2013 included a total gain of
$465 million
, including a gain of
$413 million
from the sale of its 50% equity interest in Yanfeng and a gain of
$52 million
from the remeasurement of Visteon's previous
40%
equity interest in YFVE to fair value in connection with a step acquisition that resulted in a
51%
controlling ownership interest in YFVE. Additionally,
during the fourth quarter of 2013, Visteon recorded equity earnings of
$27 million
, representing its
50%
share of a
$54 million
non-cash gain at Yanfeng. The gain resulted from the deconsolidation of YFVE at Yanfeng pursuant to Visteon's November 2013 step acquisition.
Net income (loss) attributable to Visteon Corporation for the quarter ended March 31, 2012 included
$41 million
of restructuring expenses, in which
$36 million
was recorded in connection with the previously announced closure of the Company's Cadiz Electronics operation in El Puerto de Santa Maria, Spain. Net income (loss) attributable to Visteon Corporation for the quarter ended June 30, 2012 included
$63 million
representing Visteon's equity interest in a non-cash gain recorded by Yanfeng, a
50%
owned non-consolidated affiliate of the Company. Net income (loss) attributable to Visteon Corporation for the quarter ended December 31, 2012 included
$35 million
of restructuring expenses, including
$30 million
of employee severance and termination benefits attributable to the Company's Interiors operations in Europe and
$4 million
of employee severance and termination benefits attributable to realignment of corporate and administrative functions to product group operations.
115
|
Item 9.
|
Changes in and Disagreements With Accountants on Accounting and Financial Disclosure
|
None.
|
Item 9A.
|
Controls and Procedures
|
Disclosure Controls and Procedures
The Company maintains disclosure controls and procedures that are designed to ensure that information required to be disclosed in periodic reports filed with the SEC under the Securities Exchange Act of 1934 is recorded, processed, summarized, and reported within the time periods specified in the SEC’s rules and forms, and that such information is accumulated and communicated to the Company’s management, including its Chief Executive Officer and Chief Financial Officer, as appropriate, to allow timely decisions regarding required disclosure.
During November 2013, Visteon Corporation acquired an additional 11% ownership interest in Yanfeng Visteon Automotive Electronics Co., Ltd. (“YFVE”) resulting in a 51% controlling equity interest. Accordingly, management excluded YFVE from its assessment of the effectiveness of the Company's disclosure controls and procedures as of December 31, 2013. YFVE represented approximately 8% of the Company's assets as of December 31, 2013 and less than 1% of net sales for the year ended December 31, 2013.
As of December 31, 2013, an evaluation was performed under the supervision and with the participation of the Company’s management, including its Chief Executive and Financial Officers, of the effectiveness of the design and operation of disclosure controls and procedures, excluding YFVE. Based on that evaluation, the Chief Executive Officer and the Chief Financial Officer concluded that the Company’s disclosure controls and procedures were effective as of December 31, 2013.
Internal Control over Financial Reporting
Management’s report on internal control over financial reporting is presented in Item 8 “Financial Statements and Supplementary Data” of this Annual Report on Form 10-K along with the attestation report of Ernst & Young LLP, the Company’s independent registered public accounting firm, on the effectiveness of internal control over financial reporting as of December 31, 2013. Except in connection with the YFVE consolidation in the fourth quarter of 2013, there were no changes in the Company's internal control over financial reporting during the year ended December 31, 2013 that have materially affected, or are reasonably likely to materially affect, the Company's internal control over financial reporting. The Company is integrating YFVE into the Company's operations, compliance programs and internal control processes. Specifically, as permitted by SEC rules and regulations, the Company has excluded YFVE from management's evaluation of internal controls over financial reporting as of December 31, 2013.
|
Item 10.
|
Directors, Executive Officers and Corporate Governance
|
Except as set forth herein, the information required by Item 10 regarding its directors is incorporated by reference from the information under the captions “Item 1. Election of Directors,” “Corporate Governance - Board Committees,” "2014 Stockholder Proposals and Nominations" and “Section 16(a) Beneficial Ownership Reporting Compliance” in its 2014 Proxy Statement. The information required by Item 10 regarding its executive officers appears as Item 4A under Part I of this Annual Report on Form 10-K.
The Company has adopted a code of ethics, as such phrase is defined in Item 406 of Regulation S-K, that applies to all directors, officers and employees of the Company and its subsidiaries, including the Chief Executive Officer, the Executive Vice President and Chief Financial Officer and the Senior Vice President and Chief Accounting Officer. The code, entitled “Ethics and Integrity Policy,” is available on the Company's website at www.visteon.com.
|
Item 11.
|
Executive Compensation
|
The information required by Item 11 is incorporated by reference from the information under the captions “Compensation Committee Report,” “Executive Compensation” and “Director Compensation” in its 2014 Proxy Statement.
116
|
Item 12.
|
Security Ownership of Certain Beneficial Owners and Management and Related Stockholder Matters
|
Except as set forth herein, the information required by Item 12 is incorporated by reference from the information under the caption “Stock Ownership” in its 2014 Proxy Statement.
Equity Compensation Plan Information
The following table summarizes information as of December 31, 2013 relating to its equity compensation plans pursuant to which grants of stock options, stock appreciation rights, stock rights, restricted stock, restricted stock units and other rights to acquire shares of its common stock may be made from time to time.
|
Plan Category
|
Number of Securities to be Issued Upon Exercise of Outstanding Options, Warrants and Rights (a)(1)
|
Weighted-Average Exercise Price of Outstanding Options, Warrants and Rights(b)(1)
|
Number of Securities Remaining Available for Future Issuance Under Equity Compensation Plans (excluding securities reflected in column(a)) (c)(2)
|
|||||||
|
Equity compensation plans approved by security holders
|
—
|
|
$
|
—
|
|
—
|
|
|||
|
Equity compensation plans not approved by security holders (3)
|
1,438,309
|
|
$
|
68.82
|
|
2,702,859
|
|
|||
|
Total
|
1,438,309
|
|
$
|
68.82
|
|
2,702,859
|
|
|||
|
(1)
|
Comprised of stock options, stock appreciation rights, which may be settled in stock or cash at the election of the Company, and outstanding restricted stock and performance stock units, which may be settled in stock or cash at the election of the Company without further payment by the holder, granted pursuant to the Visteon Corporation 2010 Incentive Plan. Excludes 18,914 unvested shares of restricted common stock issued pursuant to the Visteon Corporation 2010 Incentive Plan. The weighted-average exercise price of outstanding options, warrants and rights does not take into account restricted stock or performance stock units that will be settled without any further payment by the holder.
|
|
(2)
|
Excludes an indefinite number of stock units that may be awarded under the Visteon Corporation Non-Employee Director Stock Unit Plan, which units may be settled in cash or shares of the Company's common stock. Such plan provides for an annual, automatic grant of stock units worth $95,000 to each non-employee director of the Company. There is no maximum number of securities that may be issued under this Plan, however, the Plan will terminate on December 15, 2020 unless earlier terminated by the Board of Directors.
|
|
(3)
|
The Visteon Corporation 2010 Incentive Plan was approved as part the Company's plan of reorganization, which is deemed to be approved by security holders for all other purposes.
|
|
Item 13.
|
Certain Relationships and Related Transactions, and Director Independence
|
The information required by Item 13 is incorporated by reference from the information under the captions “Corporate Governance - Director Independence” and “Transactions with Related Persons” in its 2014 Proxy Statement.
|
Item 14.
|
Principal Accountant Fees and Services
|
The information required by Item 14 is incorporated by reference from the information under the captions “Audit Fees” and “Audit Committee Pre-Approval Process and Policies” in its 2014 Proxy Statement.
117
|
Item 15.
|
Exhibits and Financial Statement Schedules
|
|
(a)
|
The following documents are filed as part of this report:
|
|
1.
|
Financial Statements
|
See “Index to Consolidated Financial Statements” in Part II, Item 8 hereof.
|
2.
|
Financial Statement Schedules
|
Schedule II — Valuation and Qualifying Accounts
All other financial statement schedules are omitted because they are not required or applicable under instructions contained in Regulation S-X or because the information called for is shown in the financial statements and notes thereto.
3.
Exhibits
The exhibits listed on the "Exhibit Index" on pages 121-124 hereof are filed with this report or incorporated by reference as set forth therein.
118
VISTEON CORPORATION AND SUBSIDIARIES
SCHEDULE II — VALUATION AND QUALIFYING ACCOUNTS
|
|
Balance at
Beginning
of Period
|
(Benefits)/
Charges to
Income
|
Deductions(a)
|
Other(b)
|
Balance
at End
of Period
|
||||||||||||||
|
(Dollars in Millions)
|
|||||||||||||||||||
|
Year Ended December 31, 2013:
|
|||||||||||||||||||
|
Allowance for doubtful accounts
|
$
|
7
|
|
$
|
—
|
|
$
|
—
|
|
$
|
—
|
|
$
|
7
|
|
||||
|
Valuation allowance for deferred taxes
|
1,695
|
|
86
|
|
—
|
|
(71
|
)
|
1,710
|
|
|||||||||
|
Year Ended December 31, 2012:
|
|||||||||||||||||||
|
Allowance for doubtful accounts
|
$
|
8
|
|
$
|
3
|
|
$
|
(4
|
)
|
$
|
—
|
|
$
|
7
|
|
||||
|
Valuation allowance for deferred taxes
|
1,657
|
|
(1
|
)
|
—
|
|
39
|
|
1,695
|
|
|||||||||
|
Year Ended December 31, 2011:
|
|||||||||||||||||||
|
Allowance for doubtful accounts
|
$
|
—
|
|
$
|
8
|
|
$
|
—
|
|
$
|
—
|
|
$
|
8
|
|
||||
|
Valuation allowance for deferred taxes
|
1,463
|
|
190
|
|
—
|
|
4
|
|
1,657
|
|
|||||||||
____________
|
(a)
|
Deductions represent uncollectible accounts charged off.
|
|
(b)
|
Valuation allowance for deferred taxes
|
Represents adjustments recorded through other comprehensive income, exchange and valuation allowance charges allocated to discontinued operations. In 2013, other also includes the utilization of U.S. tax attributes carrying a full valuation allowance related to the intra-entity sale of the climate business of $17 million, and the impact of converting U.S. foreign tax credits set to expire in 2013 to net operating loss deduction of $22 million.
119
Signatures
Pursuant to the requirements of Section 13 of the Securities Exchange Act of 1934, Visteon Corporation has duly caused this Report to be signed on its behalf by the undersigned, thereunto duly authorized.
|
VISTEON CORPORATION
|
||
|
By:
|
/s/ Michael J. Widgren
|
|
|
Michael J. Widgren
|
||
|
Senior Vice President, Corporate Controller and Chief Accounting Officer
|
||
Date: February 25, 2014
Pursuant to the requirements of the Securities Exchange Act of 1934, this Report has been signed below on February 28, 2014, by the following persons on behalf of Visteon Corporation and in the capacities indicated.
|
Signature
|
Title
|
|
|
/s/ TIMOTHY D. LEULIETTE
|
Director, President and Chief Executive Officer
|
|
|
Timothy D. Leuliette
|
(Principal Executive Officer)
|
|
|
/s/ JEFFREY M. STAFEIL
|
Executive Vice President and Chief Financial Officer
|
|
|
Jeffrey M. Stafeil
|
(Principal Financial Officer)
|
|
|
/s/ MICHAEL J. WIDGREN
|
Senior Vice President, Corporate Controller and Chief
|
|
|
Michael J. Widgren
|
Accounting Officer (Principal Accounting Officer)
|
|
|
/s/ DUNCAN H. COCROFT*
|
Director
|
|
|
Duncan H. Cocroft
|
||
|
/s/ JEFFREY D. JONES*
|
Director
|
|
|
Jeffrey D. Jones
|
||
|
/s/ ROBERT MANZO*
|
Director
|
|
|
Robert Manzo
|
||
|
/s/ FRANCIS M. SCRICCO*
|
Director
|
|
|
Francis M. Scricco
|
||
|
/s/ DAVID L. TREADWELL*
|
Director
|
|
|
David L. Treadwell
|
||
|
/s/ HARRY J. WILSON*
|
Director
|
|
|
Harry J. Wilson
|
||
|
/s/ KAM-HO GEORGE YUEN*
|
Director
|
|
|
Kam-Ho George Yuen
|
||
|
*By:
|
/s/ PETER M. ZIPARO
|
|
|
Peter M. Ziparo
|
||
|
Attorney-in-Fact
|
||
120
Exhibit Index
|
Exhibit No.
|
Description
|
|
|
2.1
|
Fifth Amended Joint Plan of Reorganization, filed August 31, 2010 (incorporated by reference to Exhibit 2.1 to the Current Report on Form 8-K of Visteon Corporation filed on September 7, 2010 (File No. 001-15827)).
|
|
|
2.2
|
Fourth Amended Disclosure Statement, filed June 30, 2010 (incorporated by reference to Exhibit 2.2 to the Current Report on Form 8-K of Visteon Corporation filed on September 7, 2010 (File No. 001-15827)).
|
|
|
3.1
|
Second Amended and Restated Certificate of Incorporation of Visteon Corporation (incorporated by reference to Exhibit 3.1 to the Registration Statement on Form 8-A of Visteon Corporation filed on September 30, 2010 (File No. 000-54138)).
|
|
|
3.2
|
Third Amended and Restated Bylaws of Visteon Corporation, as amended through February 28, 2012 (incorporated by reference to Exhibit 3.1 to the Current Report on Form 8-K of Visteon Corporation filed on March 1, 2012).
|
|
|
4.1
|
Warrant Agreement, dated as of October 1, 2010, by and between Visteon Corporation and Mellon Investor Services LLC (incorporated by reference to Exhibit 10.1 to the Registration Statement on Form 8-A of Visteon Corporation filed on September 30, 2010 (File No. 000-54138)).
|
|
|
4.2
|
Warrant Agreement, dated as of October 1, 2010, by and between Visteon Corporation and Mellon Investor Services LLC (incorporated by reference to Exhibit 10.2 to the Registration Statement on Form 8-A of Visteon Corporation filed on September 30, 2010 (File No. 000-54138)).
|
|
|
4.3
|
Form of Common Stock Certificate of Visteon Corporation (incorporated by reference to Exhibit 4.4 to the Current Report on Form 8-K of Visteon Corporation filed on October 1, 2010 (File No. 001-15827)).
|
|
|
4.4
|
Indenture, dated as of April 6, 2011, among Visteon Corporation, the guarantors party thereto and The Bank of New York Mellon Trust Company, N.A., as trustee, including the Form of 6.75% Senior Note due 2019 (incorporated by reference to Exhibit 4.1 to the Current Report on Form 8-K of Visteon Corporation filed on April 7, 2011 (File No. 001-15827)).
|
|
|
4.5
|
Indenture, dated as of December 20, 2011, by and between Visteon Corporation and The Bank of New York Mellon Trust Company, N.A., as trustee (incorporated by reference to Exhibit 4.4 to the Registration Statement on Form S-3 of Visteon Corporation filed on December 20, 2011 (File No. 333-178639)).
|
|
|
10.1
|
Registration Rights Agreement, dated as of October 1, 2010, by and among Visteon Corporation and certain investors listed therein (incorporated by reference to Exhibit 4.3 to the Current Report on Form 8-K of Visteon Corporation filed on October 1, 2010 (File No. 001-15827)).
|
|
|
10.2
|
Global Settlement and Release Agreement, dated September 29, 2010, by and among Visteon Corporation, Ford Motor Company and Automotive Components Holdings, LLC (incorporated by reference to Exhibit 10.4 to the Current Report on Form 8-K of Visteon Corporation filed on October 1, 2010 (File No. 001-15827)).
|
|
|
10.3
|
Form of Revolving Loan Credit Agreement, dated October 1, 2010, as amended and restated as of April 6, 2011, by and among Visteon Corporation, certain of its domestic subsidiaries signatory thereto, Morgan Stanley Senior Funding, Inc., as administrative agent and co-collateral agent, Bank of America, N.A., as co-collateral agent, and the lenders and L/C issuers party thereto (incorporated by reference to Exhibit 10.2 to the Current Report on Form 8-K of Visteon Corporation filed on April 7, 2011 (File No. 001-15827)).
|
|
|
10.3.1
|
Fourth Amendment to Revolving Loan Credit Agreement, dated as of April 3, 2012, by and among Visteon Corporation, certain of its domestic subsidiaries signatory thereto, Morgan Stanley Senior Funding, Inc., as administrative agent and co-collateral agent, Bank of America, N.A., as co-collateral agent, and the lenders and L/C issuers party thereto (incorporated by reference to Exhibit 10.5 to the Quarterly Report on Form 10-Q of Visteon Corporation filed on May 2, 2012).
|
|
|
10.3.2
|
Fifth Amendment to Revolving Loan Credit Agreement and Consent, dated as of July 3, 2012, by and among Visteon Corporation, certain of its domestic subsidiaries signatory thereto, Morgan Stanley Senior Funding, Inc., as administrative agent and co-collateral agent, Bank of America, N.A., as co-collateral agent, and the lenders and L/C issuers party thereto (incorporated by reference to Exhibit 10.2 to the Quarterly Report on Form 10-Q of Visteon Corporation filed on August 2, 2012).
|
|
|
10.3.3
|
Sixth Amendment to Revolving Loan Credit Agreement, dated as of January 28, 2013, by and among Visteon Corporation, certain of its domestic subsidiaries signatory thereto, Morgan Stanley Senior Funding, Inc., as administrative agent and co-collateral agent, Bank of America, N.A., as co-collateral agent, and the lenders and L/C issuers party thereto.
|
|
|
10.4
|
Visteon Corporation 2010 Incentive Plan (incorporated by reference to Exhibit 10.1 to the Registration Statement on Form S-8 of Visteon Corporation filed on September 30, 2010 (File No. 333-169695)).*
|
|
121
|
Exhibit No.
|
Description
|
|
|
10.4.1
|
Form of Terms and Conditions of Initial Restricted Stock Grants under the Visteon Corporation 2010 Incentive Plan (incorporated by reference to Exhibit 10.2 to the Registration Statement on Form S-8 of Visteon Corporation filed on September 30, 2010 (File No. 333-169695)).*
|
|
|
10.4.2
|
Form of Terms and Conditions of Initial Restricted Stock Unit Grants under the Visteon Corporation 2010 Incentive Plan (incorporated by reference to Exhibit 10.3 to the Registration Statement on Form S-8 of Visteon Corporation filed on September 30, 2010 (File No. 333-169695)).*
|
|
|
10.4.3
|
Form of Terms and Conditions of Nonqualified Stock Options under the Visteon Corporation 2010 Incentive Plan (incorporated by reference to Exhibit 10.10.3 to the Annual Report on Form 10-K of Visteon for the period ended December 31, 2010).*
|
|
|
10.4.4
|
Form of Terms and Conditions of Stock Appreciation Rights under the Visteon Corporation 2010 Incentive Plan (incorporated by reference to Exhibit 10.10.4 to the Annual Report on Form 10-K of Visteon for the period ended December 31, 2010).*
|
|
|
10.4.5
|
Form of Terms and Conditions of Restricted Stock Grants under the Visteon Corporation 2010 Incentive Plan (incorporated by reference to Exhibit 10.10.5 to the Annual Report on Form 10-K of Visteon for the period ended December 31, 2010).*
|
|
|
10.4.6
|
Form of Terms and Conditions of Restricted Stock Unit Grants under the Visteon Corporation 2010 Incentive Plan (incorporated by reference to Exhibit 10.10.6 to the Annual Report on Form 10-K of Visteon for the period ended December 31, 2010).*
|
|
|
10.4.7
|
Form of Terms and Conditions of Performance Unit Grants under the Visteon Corporation 2010 Incentive Plan (incorporated by reference to Exhibit 10.10.7 to the Annual Report on Form 10-K of Visteon for the period ended December 31, 2010).*
|
|
|
10.4.8
|
Form of Terms and Conditions of Performance Unit Grants under the Visteon Corporation 2010 Incentive Plan (incorporated by reference to Exhibit 10.1 to the Current Report on Form 8-K of Visteon Corporation filed on March 5, 2012).*
|
|
|
10.4.9
|
Restricted Stock Unit Grant Agreement for Timothy D. Leuliette under the Visteon Corporation 2010 Incentive Plan (incorporated by reference to Exhibit 10.3 to the Current Report on Form 8-K of Visteon Corporation filed on October 2, 2012).*
|
|
|
10.4.10
|
Performance Stock Unit Grant Agreement for Timothy D. Leuliette under the Visteon Corporation 2010 Incentive Plan (incorporated by reference to Exhibit 10.4 to the Current Report on Form 8-K of Visteon Corporation filed on October 2, 2012).*
|
|
|
10.4.11
|
Amendment, dated as of September 13, 2012, to the Terms and Conditions of Restricted Stock Grants under the Visteon Corporation 2010 Incentive Plan and the Terms and Conditions of Restricted Stock Unit Grants under the Visteon Corporation 2010 Incentive Plan (incorporated by reference to Exhibit 10.3 to the Current Report on Form 8-K of Visteon Corporation filed on September 18, 2012).*
|
|
|
10.4.12
|
Form of executive Performance Stock Unit Grant Agreement (incorporated by reference to Exhibit 10.3 to the Current Report on Form 8-K of Visteon Corporation filed on October 31, 2012).*
|
|
|
10.4.13
|
Form of executive Restricted Stock Unit Grant Agreement (incorporated by reference to Exhibit 10.4 to the Current Report on Form 8-K of Visteon Corporation filed on October 31, 2012).*
|
|
|
10.4.14
|
Restricted Stock Unit Grant Agreement, dated October 18, 2012, between Visteon Corporation and Francis M. Scricco, Chairman (incorporated by reference to Exhibit 10.18 to the Quarterly Report on Form 10-Q of Visteon Corporation filed on November 1, 2012).*
|
|
|
10.5
|
Visteon Corporation Amended and Restated Deferred Compensation Plan for Non-Employee Directors (incorporated by reference to Exhibit 10.11 to the Registration Statement on Form S-1 of Visteon Corporation filed on October 22, 2010 (File No. 333-107104)).*
|
|
|
10.6
|
Visteon Corporation 2010 Supplemental Executive Retirement Plan, as amended and restated (incorporated by reference to Exhibit 10.1 to the Quarterly Report on Form 10-Q of Visteon Corporation filed on November 3, 2011 (File No. 001-15827)).*
|
|
|
10.6.1
|
Amendment, dated as of September 13, 2012, to the Visteon Corporation 2010 Supplemental Executive Retirement Plan (incorporated by reference to Exhibit 10.1 to the Current Report on Form 8-K of Visteon Corporation filed on September 18, 2012).*
|
|
|
10.7
|
Visteon Corporation 2011 Savings Parity Plan (incorporated by reference to Exhibit 10.2 to the Quarterly Report on Form 10-Q of Visteon Corporation filed on November 3, 2011 (File No. 001-15827)).*
|
|
122
|
Exhibit No.
|
Description
|
|
|
10.7.1
|
Amendment, dated as of September 13, 2012, to the Visteon Corporation 2011 Savings Parity Plan, as amended through September 13, 2012 (incorporated by reference to Exhibit 10.2 to the Current Report on Form 8-K of Visteon Corporation filed on September 18, 2012).*
|
|
|
10.8
|
2010 Visteon Executive Severance Plan, as amended and restated as of October 18, 2012 (incorporated by reference to Exhibit 10.1 to the Current Report on Form 8-K of Visteon Corporation filed on October 31, 2012).*
|
|
|
10.9
|
Visteon Corporation Non-Employee Director Stock Unit Plan (incorporated by reference to Exhibit 10.15 to Amendment No. 2 to the Registration Statement on Form S-1 of Visteon Corporation filed on December 22, 2010 (File No. 333-170104)).*
|
|
|
10.1
|
Employment Agreement, dated as of December 12, 2011, between Visteon Engineering Services Ltd. and Robert C. Pallash (incorporated by reference to Exhibit 10.2 to the Quarterly Report on Form 10-Q of Visteon Corporation filed on May 2, 2012).*
|
|
|
10.11
|
P.R. China Employment Agreement, dated as of December 12, 2011, between Visteon Asia Pacific, Inc. and Robert C. Pallash (incorporated by reference to Exhibit 10.3 to the Quarterly Report on Form 10-Q of Visteon Corporation filed on May 2, 2012).*
|
|
|
10.12
|
Employment Agreement by and between Timothy D. Leuliette and Visteon Corporation, dated as of September 30, 2012 (incorporated by reference to Exhibit 10.1 to the Current Report on Form 8-K of Visteon Corporation filed on October 2, 2012).*
|
|
|
10.13
|
Change in Control Agreement by and between Timothy D. Leuliette and Visteon Corporation, dated as of September 30, 2012 (incorporated by reference to Exhibit 10.2 to the Current Report on Form 8-K of Visteon Corporation filed on October 2, 2012).*
|
|
|
10.14
|
Form of Change in Control Agreement between Visteon Corporation and executive officers of Visteon Corporation (incorporated by reference to Exhibit 10.2 to the Current Report on Form 8-K of Visteon Corporation filed on October 31, 2012).*
|
|
|
10.14.1
|
Schedule identifying substantially identical agreements to Officer Change in Control Agreement constituting Exhibit 10.14 hereto entered into by Visteon Corporation with Messrs. Sharnas, Stafeil, Thall and Widgren.*
|
|
|
10.15
|
Master Share Purchase Agreement, dated as of January 11, 2013, by and among Visteon Corporation, certain subsidiaries of Visteon Corporation, and Halla Climate Control Corporation (incorporated by reference to Exhibit 10.28 to the Annual Report on Form 10-K of Visteon for the period ended December 31, 2012).
|
|
|
10.16
|
Master Agreement, dated as of August 12, 2013, by and among VIHI, LLC, Huayu Automotive Systems Company Limited, Yanfeng Visteon Automotive Trim Systems Co., Ltd. and Yanfeng Visteon Automotive Electronics Co., Ltd. (incorporated by reference to Exhibit 10.1 to the Current Report on Form 8-K of Visteon Corporation filed on August 16, 2013).
|
|
|
10.17
|
Side Agreement, dated as of August 12, 2013, by and among VIHI, LLC, Huayu Automotive Systems Company Limited, Yanfeng Visteon Automotive Trim Systems Co., Ltd. (incorporated by reference to Exhibit 10.2 to the Current Report on Form 8-K of Visteon Corporation filed on August 16, 2013).
|
|
|
10.18
|
Purchase Agreement, dated as of January 12, 2014, by and between Johnson Controls, Inc. and Visteon Corporation (incorporated by reference to Exhibit 10.1 to the Current Report on Form 8-K of Visteon Corporation filed on January 15, 2014).
|
|
|
12.1
|
Statement re: Computation of Ratios.
|
|
|
14.1
|
Visteon Corporation - Ethics and Integrity Policy (code of business conduct and ethics) (incorporated by reference to Exhibit 14.1 to the Quarterly Report on Form 10-Q of Visteon dated July 30, 2008).
|
|
|
21.1
|
Subsidiaries of Visteon Corporation.
|
|
|
23.1
|
Consent of Independent Registered Public Accounting Firm, PricewaterhouseCoopers LLP.
|
|
|
23.2
|
Consent of Independent Registered Public Accounting Firm, Ernst & Young LLP.
|
|
|
24.1
|
Powers of Attorney relating to execution of this Annual Report on Form 10-K.
|
|
|
31.1
|
Rule 13a-14(a) Certification of Chief Executive Officer dated February 25, 2014.
|
|
|
31.2
|
Rule 13a-14(a) Certification of Chief Financial Officer dated February 25, 2014.
|
|
|
32.1
|
Section 1350 Certification of Chief Executive Officer dated February 25, 2014.
|
|
|
32.2
|
Section 1350 Certification of Chief Financial Officer dated February 25, 2014.
|
|
|
101.INS
|
XBRL Instance Document.**
|
|
123
|
Exhibit No.
|
Description
|
|
|
101.SCH
|
XBRL Taxonomy Extension Schema Document.**
|
|
|
101.CAL
|
XBRL Taxonomy Extension Calculation Linkbase Document.**
|
|
|
101.LAB
|
XBRL Taxonomy Extension Label Linkbase Document.**
|
|
|
101.PRE
|
XBRL Taxonomy Extension Presentation Linkbase Document.**
|
|
|
101.DEF
|
XBRL Taxonomy Extension Definition Linkbase Document.**
|
|
|
*
|
Indicates that exhibit is a management contract or compensatory plan or arrangement.
|
** Pursuant to Rule 406T of Regulation S-T, the Interactive Data Files as Exhibit 101 hereto are deemed not filed or part of a registration
statement or prospectus for purposes of Sections 11 or 12 of the Securities Act of 1933, as amended, are deemed not filed for purposes
of Section 18 of the Securities and Exchange Act of 1934, as amended, and otherwise are not subject to liability under those sections.
In lieu of filing certain instruments with respect to long-term debt of the kind described in Item 601(b)(4) of Regulation S-K, Visteon agrees to furnish a copy of such instruments to the Securities and Exchange Commission upon request.
124
TABLE OF CONTENTS
Part IItem 1. BusinessItem 1A. Risk FactorsItem 1B. Unresolved Staff CommentsItem 2. PropertiesItem 3. Legal ProceedingsItem 4. Mine Safety DisclosuresItem 4A. Executive Officers and Key EmployeesPart IIItem 5. Market For Registrant S Common Equity, Related Stockholder Matters and Issuer Purchases Of Equity SecuritiesItem 6. Selected Financial DataItem 7. Management S Discussion and Analysis Of Financial Condition and Results Of OperationsItem 7A. Quantitative and Qualitative Disclosures About Market RiskItem 8. Financial Statements and Supplementary DataNote 1. Description Of BusinessNote 2. Summary Of Significant Accounting PoliciesNote 3. Yanfeng TransactionsNote 4. Non-consolidated AffiliatesNote 5 . Restructuring ActivitiesNote 6. InventoriesNote 7. Property and EquipmentNote 8. Intangible AssetsNote 9. DebtNote 10. Employee Benefit PlansNote 11. Stock-based CompensationNote 12. Other Expense, NetNote 13. Income TaxesNote 14. Stockholders Equity and Non-controlling InterestsNote 15. Earnings Per ShareNote 16. Fair Value MeasurementsNote 17. Financial InstrumentsNote 18. Commitments and ContingenciesNote 19. Segment InformationNote 20. Condensed Consolidating Financial Information Of Guarantor SubsidiariesNote 21. Summary Quarterly Financial Data (unaudited)Item 9. Changes in and Disagreements with Accountants on Accounting and Financial DisclosureItem 9A. Controls and ProceduresPart IIIItem 10. Directors, Executive Officers and Corporate GovernanceItem 11. Executive CompensationItem 12. Security Ownership Of Certain Beneficial Owners and Management and Related Stockholder MattersItem 13. Certain Relationships and Related Transactions, and Director IndependenceItem 14. Principal Accountant Fees and ServicesPart IVItem 15. Exhibits and Financial Statement Schedules