VISTEON CORP
10-Ks and 10-Qs
|
|
|
|
|
|
|
|
|
|
|
|
|
|
|
|
|
|
|
|
|
|
|
|
|
|
|
|
|
|
|
|
|
|
|
|
|
|
|
|
|
|
|
|
|
|
|
|
|
|
|
|
|
UNITED STATES
SECURITIES AND EXCHANGE COMMISSION
Washington D.C. 20549
________________
FORM 10-Q
(Mark One)
|
þ
|
QUARTERLY REPORT PURSUANT TO SECTION 13 OR 15(d)
|
OF THE SECURITIES EXCHANGE ACT OF 1934
For the quarterly period ended September 30, 2012,
OR
|
¨
|
TRANSITION REPORT PURSUANT TO SECTION 13 OR 15(d)
|
OF THE SECURITIES EXCHANGE ACT OF 1934
For the transition period from ____________ to ____________
Commission file number 001-15827
VISTEON CORPORATION
(Exact name of registrant as specified in its charter)
|
State of Delaware
|
38-3519512
|
|
(State or other jurisdiction of incorporation or organization)
|
(I.R.S. Employer Identification No.)
|
|
One Village Center Drive, Van Buren Township, Michigan
|
48111
|
|
(Address of principal executive offices)
|
(Zip code)
|
Registrant’s telephone number, including area code: (800)-VISTEON
Not applicable
(Former name, former address and former fiscal year, if changed since last report)
Indicate by check mark whether the registrant: (1) has filed all reports required to be filed by Section 13 or 15(d) of the Securities Exchange Act of 1934 during the preceding 12 months (or for such shorter period that the Registrant was required to file such reports), and (2) has been subject to such filing requirements for the past 90 days. Yes
ü
No__
Indicate by check mark whether the registrant: has submitted electronically and posted on its corporate Web site, if any, every Interactive Data File required to be submitted and posted pursuant to Rule 405 of Regulation S-T (§232.405 of this chapter) during the preceding 12 months (or for such shorter period that the registrant was required to submit and post such files). Yes
ü
No __
Indicate by check mark whether the registrant is a large accelerated filer, an accelerated filer, a non-accelerated filer, or a smaller reporting company. See the definitions of “large accelerated filer," "accelerated filer” and "smaller reporting company" in Rule 12b-2 of the Exchange Act.
Large accelerated filer
ü
Accelerated filer __ Non-accelerated filer __ Smaller reporting company __
Indicate by check mark whether the registrant is a shell company (as defined in Rule 12b-2 of the Exchange Act). Yes __ No
ü
Indicate by check mark whether the registrant has filed all documents and reports required to be filed by Sections 12, 13 or 15(d) of the Securities Exchange Act of 1934 subsequent to the distribution of securities under a plan confirmed by a court. Yes
ü
No__
As of October 26, 2012, the registrant had outstanding 52,801,763 shares of common stock.
Exhibit index located on page number 55.
INDEX
FINANCIAL INFORMATION
|
ITEM 1.
|
CONSOLIDATED FINANCIAL STATEMENTS
|
VISTEON CORPORATION AND SUBSIDIARIES
(Dollars in Millions Except Per Share Amounts)
(Unaudited)
|
Three Months Ended
|
Nine Months Ended
|
||||||||||||||
|
September 30
|
September 30
|
||||||||||||||
|
2012
|
2011
|
2012
|
2011
|
||||||||||||
|
Sales
|
$
|
1,624
|
|
$
|
1,909
|
|
$
|
5,034
|
|
$
|
5,805
|
|
|||
|
Cost of sales
|
1,495
|
|
1,770
|
|
4,643
|
|
5,331
|
|
|||||||
|
Gross margin
|
129
|
|
139
|
|
391
|
|
474
|
|
|||||||
|
Selling, general and administrative expenses
|
89
|
|
95
|
|
267
|
|
291
|
|
|||||||
|
Interest expense
|
17
|
|
10
|
|
39
|
|
37
|
|
|||||||
|
Interest income
|
4
|
|
5
|
|
11
|
|
16
|
|
|||||||
|
Loss on debt extinguishment
|
4
|
|
—
|
|
4
|
|
24
|
|
|||||||
|
Equity in net income of non-consolidated affiliates
|
38
|
|
43
|
|
183
|
|
130
|
|
|||||||
|
Restructuring and other (income) expenses
|
(11
|
)
|
1
|
|
63
|
|
29
|
|
|||||||
|
Income from continuing operations before income taxes
|
72
|
|
81
|
|
212
|
|
239
|
|
|||||||
|
Provision for income taxes
|
33
|
|
25
|
|
102
|
|
87
|
|
|||||||
|
Income from continuing operations
|
39
|
|
56
|
|
110
|
|
152
|
|
|||||||
|
(Loss) income from discontinued operations, net of tax
|
(5
|
)
|
4
|
|
(3
|
)
|
8
|
|
|||||||
|
Net income
|
34
|
|
60
|
|
107
|
|
160
|
|
|||||||
|
Net income attributable to non-controlling interests
|
19
|
|
19
|
|
46
|
|
54
|
|
|||||||
|
Net income attributable to Visteon Corporation
|
$
|
15
|
|
$
|
41
|
|
$
|
61
|
|
$
|
106
|
|
|||
|
Basic earnings (loss) per share:
|
|||||||||||||||
|
Continuing operations
|
$
|
0.37
|
|
$
|
0.72
|
|
$
|
1.21
|
|
$
|
1.92
|
|
|||
|
Discontinued operations
|
(0.09
|
)
|
0.08
|
|
(0.06
|
)
|
0.15
|
|
|||||||
|
Basic earnings attributable to Visteon Corporation
|
$
|
0.28
|
|
$
|
0.80
|
|
$
|
1.15
|
|
$
|
2.07
|
|
|||
|
Diluted earnings (loss) per share:
|
|||||||||||||||
|
Continuing operations
|
$
|
0.37
|
|
$
|
0.71
|
|
$
|
1.20
|
|
$
|
1.89
|
|
|||
|
Discontinued operations
|
(0.09
|
)
|
0.08
|
|
(0.06
|
)
|
0.15
|
|
|||||||
|
Diluted earnings attributable to Visteon Corporation
|
$
|
0.28
|
|
$
|
0.79
|
|
$
|
1.14
|
|
$
|
2.04
|
|
|||
|
Comprehensive income:
|
|||||||||||||||
|
Comprehensive income (loss)
|
$
|
96
|
|
$
|
(102
|
)
|
$
|
163
|
|
$
|
110
|
|
|||
|
Comprehensive income (loss) attributable to Visteon Corporation
|
$
|
63
|
|
$
|
(84
|
)
|
$
|
103
|
|
$
|
74
|
|
|||
See accompanying notes to the consolidated financial statements.
1
VISTEON CORPORATION AND SUBSIDIARIES
(Dollars in Millions)
(Unaudited)
|
September 30
|
December 31
|
|||||||
|
2012
|
2011
|
|||||||
|
ASSETS
|
||||||||
|
Cash and equivalents
|
$
|
901
|
|
$
|
723
|
|
||
|
Restricted cash
|
19
|
|
23
|
|
||||
|
Accounts receivable, net
|
1,168
|
|
1,071
|
|
||||
|
Inventories
|
408
|
|
381
|
|
||||
|
Other current assets
|
265
|
|
296
|
|
||||
|
Total current assets
|
2,761
|
|
2,494
|
|
||||
|
Property and equipment, net
|
1,278
|
|
1,412
|
|
||||
|
Equity in net assets of non-consolidated affiliates
|
734
|
|
644
|
|
||||
|
Intangible assets, net
|
324
|
|
353
|
|
||||
|
Other non-current assets
|
73
|
|
66
|
|
||||
|
Total assets
|
$
|
5,170
|
|
$
|
4,969
|
|
||
|
LIABILITIES AND SHAREHOLDERS’ EQUITY
|
||||||||
|
Short-term debt, including current portion of long-term debt
|
$
|
89
|
|
$
|
87
|
|
||
|
Accounts payable
|
1,077
|
|
1,010
|
|
||||
|
Accrued employee liabilities
|
162
|
|
189
|
|
||||
|
Other current liabilities
|
248
|
|
267
|
|
||||
|
Total current liabilities
|
1,576
|
|
1,553
|
|
||||
|
Long-term debt
|
506
|
|
512
|
|
||||
|
Employee benefits
|
413
|
|
495
|
|
||||
|
Deferred tax liabilities
|
202
|
|
187
|
|
||||
|
Other non-current liabilities
|
251
|
|
225
|
|
||||
|
Shareholders’ equity:
|
||||||||
|
Preferred stock (par value $0.01, 50 million shares authorized, none outstanding at September 30, 2012 and December 31, 2011)
|
—
|
|
—
|
|
||||
|
Common stock (par value $0.01, 250 million shares authorized, 54 million and 52 million shares issued, 53 million and 52 million shares outstanding at September 30, 2012 and December 31, 2011, respectively)
|
1
|
|
1
|
|
||||
|
Stock warrants
|
13
|
|
13
|
|
||||
|
Additional paid-in capital
|
1,258
|
|
1,165
|
|
||||
|
Retained earnings
|
227
|
|
166
|
|
||||
|
Accumulated other comprehensive income (loss)
|
17
|
|
(25
|
)
|
||||
|
Treasury stock
|
(17
|
)
|
(13
|
)
|
||||
|
Total Visteon Corporation shareholders’ equity
|
1,499
|
|
1,307
|
|
||||
|
Non-controlling interests
|
723
|
|
690
|
|
||||
|
Total shareholders’ equity
|
2,222
|
|
1,997
|
|
||||
|
Total liabilities and shareholders’ equity
|
$
|
5,170
|
|
$
|
4,969
|
|
||
See accompanying notes to the consolidated financial statements.
2
VISTEON CORPORATION AND SUBSIDIARIES
(Dollars in Millions)
(Unaudited)
|
Nine Months Ended
|
|||||||
|
September 30
|
|||||||
|
2012
|
2011
|
||||||
|
Operating Activities
|
|||||||
|
Net income
|
$
|
107
|
|
$
|
160
|
|
|
|
Adjustments to reconcile net income to net cash provided from operating activities:
|
|||||||
|
Depreciation and amortization
|
196
|
|
248
|
|
|||
|
Equity in net income of non-consolidated affiliates, net of dividends remitted
|
(107
|
)
|
(88
|
)
|
|||
|
Loss on debt extinguishment
|
4
|
|
24
|
|
|||
|
Other non-cash items
|
33
|
|
26
|
|
|||
|
Changes in assets and liabilities:
|
|||||||
|
Accounts receivable
|
(58
|
)
|
(131
|
)
|
|||
|
Inventories
|
(54
|
)
|
(50
|
)
|
|||
|
Accounts payable
|
41
|
|
(19
|
)
|
|||
|
Other assets and other liabilities
|
1
|
|
(115
|
)
|
|||
|
Net cash provided from operating activities
|
163
|
|
55
|
|
|||
|
Investing Activities
|
|||||||
|
Capital expenditures
|
(146
|
)
|
(185
|
)
|
|||
|
Proceeds from business divestitures
|
100
|
|
—
|
|
|||
|
Proceeds from asset sales
|
88
|
|
11
|
|
|||
|
Other
|
(2
|
)
|
(13
|
)
|
|||
|
Net cash provided from (used by) investing activities
|
40
|
|
(187
|
)
|
|||
|
Financing Activities
|
|||||||
|
Short-term debt, net
|
2
|
|
11
|
|
|||
|
Proceeds from issuance of debt, net of issuance costs
|
812
|
|
503
|
|
|||
|
Principal payments on debt
|
(824
|
)
|
(513
|
)
|
|||
|
Cash restriction, net
|
—
|
|
52
|
|
|||
|
Rights offering fees
|
—
|
|
(33
|
)
|
|||
|
Dividends to non-controlling interests
|
(23
|
)
|
(29
|
)
|
|||
|
Other
|
—
|
|
3
|
|
|||
|
Net cash used by financing activities
|
(33
|
)
|
(6
|
)
|
|||
|
Effect of exchange rate changes on cash and equivalents
|
8
|
|
(9
|
)
|
|||
|
Net increase (decrease) in cash and equivalents
|
178
|
|
(147
|
)
|
|||
|
Cash and equivalents at beginning of period
|
723
|
|
905
|
|
|||
|
Cash and equivalents at end of period
|
$
|
901
|
|
$
|
758
|
|
|
See accompanying notes to the consolidated financial statements.
3
VISTEON CORPORATION AND SUBSIDIARIES
NOTES TO CONSOLIDATED FINANCIAL STATEMENTS
Description of Business:
Visteon Corporation (the “Company” or “Visteon”) is a supplier of climate, interiors and electronics systems, modules and components to global automotive original equipment manufacturers (“OEMs”). Headquartered in Van Buren Township, Michigan, Visteon has a workforce of approximately
22,000
employees and a network of manufacturing operations, technical centers and joint ventures in every major geographic region of the world.
Interim Financial Statements:
The unaudited consolidated financial statements of the Company have been prepared in accordance with the rules and regulations of the U.S. Securities and Exchange Commission ("SEC"). Certain information and footnote disclosures normally included in financial statements prepared in accordance with accounting principles generally accepted in the United States ("GAAP") have been condensed or omitted pursuant to such rules and regulations. These interim consolidated financial statements include all adjustments (consisting of normal recurring adjustments, except as otherwise disclosed) that management believes are necessary for a fair presentation of the results of operations, financial position and cash flows of the Company for the interim periods presented. Interim results are not necessarily indicative of full-year results.
Use of Estimates:
The preparation of the financial statements in conformity with GAAP requires management to make estimates, judgments and assumptions that affect amounts reported herein. Management believes that such estimates, judgments and assumptions are reasonable and appropriate. However, due to the inherent uncertainty involved, actual results may differ from those provided in the Company's consolidated financial statements.
Reclassifications:
Certain prior period amounts have been reclassified to conform to the current period presentation.
Principles of Consolidation:
The consolidated financial statements include the accounts of the Company and all subsidiaries that are more than 50% owned and over which the Company exercises control. Investments in affiliates of greater than 20% and for which the Company exercises significant influence but does not exercise control are accounted for using the equity method.
Revenue Recognition:
The Company records revenue when persuasive evidence of an arrangement exists, delivery occurs or services are rendered, the sales price is fixed or determinable and collectibility is reasonably assured. The Company ships product and records revenue pursuant to commercial agreements with its customers generally in the form of an approved purchase order, including the effects of contractual customer price productivity. The Company does negotiate discrete price changes with its customers, which are generally the result of unique commercial issues between the Company and its customers. The Company records amounts associated with discrete price changes as a reduction to revenue when specific facts and circumstances indicate that a price reduction is probable and the amounts are reasonably estimable. The Company records amounts associated with discrete price changes as an increase to revenue upon execution of a legally enforceable contractual agreement and when collectibility is reasonably assured.
Reorganization under Chapter 11 of the U.S. Bankruptcy Code:
On
May 28, 2009
, Visteon and certain of its U.S. subsidiaries (the “Debtors”) filed voluntary petitions for reorganization relief under chapter 11 of the United States Bankruptcy Code (the “Bankruptcy Code”) in the United States Bankruptcy Court for the District of Delaware (the “Court”) in response to sudden and severe declines in global automotive production during the latter part of 2008 and early 2009 and the resulting adverse impact on the Company’s cash flows and liquidity. On
August 31, 2010
, the Court entered an order confirming the Debtors’ joint plan of reorganization. On
October 1, 2010
(the “Effective Date”), all conditions precedent to the effectiveness of the Plan and related documents were satisfied or waived and the Company emerged from bankruptcy. The Company adopted fresh-start accounting upon emergence from the Chapter 11 Proceedings and became a new entity for financial reporting purposes as of the Effective Date.
Restricted Cash:
Restricted cash represents amounts designated for uses other than current operations and includes
$9 million
of collateral for the Letter of Credit Facility with US Bank National Association, and
$10 million
related to cash collateral for other corporate purposes at September 30, 2012.
New Accounting Pronouncements:
In June 2011, the Financial Accounting Standards Board ("FASB") issued guidance amending comprehensive income disclosures retrospectively, for fiscal years, and interim reporting periods within those years, beginning after December 15, 2011. This guidance requires disclosures of all non-owner changes (components of comprehensive income) in stockholders’ equity to be presented either in a single continuous statement of comprehensive income or in two separate but consecutive statements. The Company adopted these new disclosure requirements with effect from January 1, 2012.
In July 2012, the FASB issued guidance on testing indefinite-lived intangible assets for impairment. This guidance allows the
4
option first to assess qualitative factors to determine whether the existence of events and circumstances indicates that it is more likely than not that the indefinite-lived intangible asset is impaired or the option to bypass the qualitative assessment for any indefinite-lived intangible asset in any period and proceed directly to performing the quantitative impairment test. The Company does not expect this guidance to have a material impact on its consolidated financial statements.
In March 2012, the Company entered into an agreement for the sale of assets and liabilities associated with the Company's Lighting operations to Varroccorp Holding BV and Varroc Engineering Pvt. Ltd. (together, "Varroc Group") for proceeds of approximately
$90 million
, including
$20 million
related to the Company's 50% equity interest in Visteon TYC Corporation (“VTYC”) (collectively the "Lighting Transaction"). On
August 1, 2012
, the Company completed the Lighting Transaction, excluding the Company's investment in VTYC, for proceeds of approximately
$70 million
, subject to purchase price adjustments. During the quarterly period ended March 31, 2012, the Company determined that assets and liabilities subject to the Lighting Transaction, excluding the Company's investment in VTYC, met the "held for sale" criteria under U.S. GAAP. The Company recorded related asset impairment charges of approximately
$6 million
and
$19 million
, respectively, during the three and nine-month periods ended September 30, 2012.
The Lighting operations represent a component of the Company's business. Accordingly, the results of operations of the Lighting business have been reclassified to “(Loss) income from discontinued operations, net of tax” in the Consolidated Statements of Comprehensive Income for the three and nine-month periods ended September 30, 2012 and 2011. Discontinued operations are summarized as follows:
|
Three Months Ended
|
Nine Months Ended
|
||||||||||||||
|
September 30
|
September 30
|
||||||||||||||
|
2012
|
2011
|
2012
|
2011
|
||||||||||||
|
(Dollars in Millions)
|
|||||||||||||||
|
Sales
|
$
|
32
|
|
$
|
128
|
|
$
|
297
|
|
$
|
383
|
|
|||
|
Cost of sales
|
28
|
|
119
|
|
264
|
|
363
|
|
|||||||
|
Gross margin
|
4
|
|
9
|
|
33
|
|
20
|
|
|||||||
|
Selling, general and administrative expenses
|
1
|
|
3
|
|
7
|
|
9
|
|
|||||||
|
Asset impairments
|
6
|
|
—
|
|
19
|
|
—
|
|
|||||||
|
Interest expense
|
1
|
|
—
|
|
2
|
|
1
|
|
|||||||
|
Other expenses
|
1
|
|
2
|
|
4
|
|
2
|
|
|||||||
|
(Loss) income from discontinued operations before income taxes
|
(5
|
)
|
4
|
|
1
|
|
8
|
|
|||||||
|
Provision for income taxes
|
—
|
|
—
|
|
4
|
|
—
|
|
|||||||
|
Net (loss) income from discontinued operations attributable to Visteon Corporation
|
$
|
(5
|
)
|
$
|
4
|
|
$
|
(3
|
)
|
$
|
8
|
|
|||
5
Restructuring and other (income) / expenses consist of the following:
|
Three Months Ended
|
Nine Months Ended
|
||||||||||||||
|
September 30
|
September 30
|
||||||||||||||
|
2012
|
2011
|
2012
|
2011
|
||||||||||||
|
(Dollars in Millions)
|
|||||||||||||||
|
Restructuring expenses
|
$
|
2
|
|
$
|
1
|
|
$
|
44
|
|
$
|
18
|
|
|||
|
Loss on asset contribution
|
—
|
|
—
|
|
14
|
|
—
|
|
|||||||
|
Transformation costs
|
5
|
|
—
|
|
23
|
|
3
|
|
|||||||
|
Bankruptcy-related costs
|
1
|
|
—
|
|
1
|
|
8
|
|
|||||||
|
Gain on sale of joint venture interest
|
(19
|
)
|
—
|
|
(19
|
)
|
—
|
|
|||||||
|
$
|
(11
|
)
|
$
|
1
|
|
$
|
63
|
|
$
|
29
|
|
||||
Restructuring Activities
The Company has undertaken various restructuring activities to achieve its strategic and financial objectives. Restructuring activities include, but are not limited to, plant closures, production relocation, administrative cost structure realignment and consolidation of available capacity and resources. The Company expects to finance restructuring programs through cash on hand, cash generated from its ongoing operations, reimbursements pursuant to customer accommodation and support agreements or through cash available under its existing debt agreements, subject to the terms of applicable covenants. Restructuring costs are recorded when elements of a plan are finalized and the timing of activities and the amount of related costs are not likely to change. However, such costs are estimated based on information available at the time such charges are recorded. In general, management anticipates that restructuring activities will be completed within a time frame such that significant changes to the plan are not likely. Due to the inherent uncertainty involved in estimating restructuring expenses, actual amounts paid for such activities may differ from amounts initially estimated.
Given the economically-sensitive and highly competitive nature of the automotive industry, the Company continues to closely monitor current market factors and industry trends taking action as necessary, including but not limited to, additional restructuring actions. However, there can be no assurance that any such actions will be sufficient to fully offset the impact of adverse factors on the Company or its results of operations, financial position and cash flows.
At September 30, 2012 and December 31, 2011, restructuring liabilities of
$8 million
and
$26 million
, respectively, are classified as other current liabilities in the consolidated balance sheets. The Company anticipates that the activities associated with these reserves will be substantially completed by the end of 2012. The following is a summary of the Company's restructuring reserves and related activity for the nine months ended September 30, 2012.
|
Electronics
|
Interiors
|
Climate
|
Total
|
||||||||||||
|
(Dollars in Millions)
|
|||||||||||||||
|
December 31, 2011
|
$
|
19
|
|
$
|
6
|
|
$
|
1
|
|
$
|
26
|
|
|||
|
Expenses
|
36
|
|
4
|
|
1
|
|
41
|
|
|||||||
|
Utilization
|
(49
|
)
|
(3
|
)
|
(1
|
)
|
(53
|
)
|
|||||||
|
March 31, 2012
|
6
|
|
7
|
|
1
|
|
14
|
|
|||||||
|
Expenses
|
—
|
|
—
|
|
1
|
|
1
|
|
|||||||
|
Utilization
|
(5
|
)
|
—
|
|
(1
|
)
|
(6
|
)
|
|||||||
|
June 30, 2012
|
1
|
|
7
|
|
1
|
|
9
|
|
|||||||
|
Expenses
|
—
|
|
—
|
|
2
|
|
2
|
|
|||||||
|
Utilization
|
—
|
|
(1
|
)
|
(2
|
)
|
(3
|
)
|
|||||||
|
September 30, 2012
|
$
|
1
|
|
$
|
6
|
|
$
|
1
|
|
$
|
8
|
|
|||
During the first quarter of 2012, the Company recorded
$41 million
of restructuring expenses, including
$36 million
in connection with the previously announced closure of the Company's Cadiz Electronics operation in El Puerto de Santa Maria, Spain. In January
6
2012 the Company reached agreements with the local unions and Spanish government for the closure of its Cadiz operation, which were subsequently ratified by the employees in February 2012. Pursuant to the agreements, the Company agreed to pay one-time termination benefits, in excess of the statutory minimum requirement, of approximately
$31 million
. Additionally, the Company agreed to transfer land, building and machinery with a net book value of approximately
$14 million
for the benefit of the employees. The Company also recorded
$5 million
of other exit costs related to the Cadiz exit including amounts payable to the Spanish government in connection with the asset contribution. Utilization during the three months ended March 31, 2012 includes
$48 million
of payments to former Cadiz employees for employee severance and termination benefits. Payment of
$4 million
to the Spanish government in connection with the asset contribution was included in utilization for the three months ended June 30, 2012. The Company recovered approximately
$19 million
of such costs during the first half of 2012 pursuant to the Release Agreement with Ford for an aggregate recovery of
$23 million
when considering the
$4 million
received during 2011. Amounts recovered have been recorded as deferred revenue on the Company's consolidated balance sheet as further described in Note 9, "Other Liabilities".
During the nine months ended September 30, 2011, the Company recorded approximately
$27 million
of restructuring expenses, including
$22 million
for severance and termination benefits representing the minimum amount of employee separation costs pursuant to statutory regulations related to the closure of its Cadiz Electronics operation and
$5 million
for employee severance and termination benefits associated with previously announced actions at two European Interiors facilities. Additionally, the Company reversed approximately
$9 million
of previously recorded restructuring expenses, including
$7 million
for employee severance and termination benefits at a European Interiors facility pursuant to a March 2011 contractual agreement to cancel the related social plan and
$2 million
due to lower than estimated severance and termination benefit costs associated with the consolidation of the Company's Electronics operations in South America.
Other Activities
Business transformation costs of
$5 million
and
$23 million
were incurred during the three and nine months ended September 30, 2012, respectively, related to financial and advisory fees associated with the Company's transformation of its business portfolio and rationalization of its cost structure including, among other things, the investigation of potential transactions for the sale, merger or other combination of certain businesses.
The Company recorded bankruptcy-related costs of
$1 million
and
$8 million
during the nine-month periods ended September 30, 2012 and 2011, respectively, which were the result of amounts directly associated with the bankruptcy claims settlement process under Chapter 11.
In August 2012, the Company sold its 50% ownership interest in R-Tek Limited, a UK-based Interiors joint venture, for cash proceeds of approximately
$30 million
, resulting in a gain of
$19 million
.
Inventories are stated at the lower of cost, determined on a first-in, first-out basis, or market. A summary of inventories is provided below:
|
September 30
|
December 31
|
||||||
|
2012
|
2011
|
||||||
|
(Dollars in Millions)
|
|||||||
|
Raw materials
|
$
|
163
|
|
$
|
167
|
|
|
|
Work-in-process
|
181
|
|
174
|
|
|||
|
Finished products
|
89
|
|
64
|
|
|||
|
433
|
|
405
|
|
||||
|
Valuation reserves
|
(25
|
)
|
(24
|
)
|
|||
|
$
|
408
|
|
$
|
381
|
|
||
7
Other current assets are summarized as follows:
|
September 30
|
December 31
|
||||||
|
2012
|
2011
|
||||||
|
(Dollars in Millions)
|
|||||||
|
Recoverable taxes
|
$
|
92
|
|
$
|
99
|
|
|
|
Pledged accounts receivable
|
47
|
|
82
|
|
|||
|
Deposits
|
31
|
|
32
|
|
|||
|
Deferred tax assets
|
24
|
|
30
|
|
|||
|
Non-consolidated affiliate receivables
|
19
|
|
32
|
|
|||
|
Prepaid assets
|
19
|
|
17
|
|
|||
|
Foreign currency hedges
|
17
|
|
—
|
|
|||
|
Other
|
16
|
|
4
|
|
|||
|
$
|
265
|
|
$
|
296
|
|
||
Other non-current assets are summarized as follows:
|
September 30
|
December 31
|
||||||
|
2012
|
2011
|
||||||
|
(Dollars in Millions)
|
|||||||
|
Deferred tax assets
|
$
|
17
|
|
$
|
18
|
|
|
|
Reimbursable engineering costs
|
12
|
|
—
|
|
|||
|
Income tax receivable
|
10
|
|
11
|
|
|||
|
Deposits
|
7
|
|
7
|
|
|||
|
Debt issuance costs
|
6
|
|
8
|
|
|||
|
Other
|
21
|
|
22
|
|
|||
|
$
|
73
|
|
$
|
66
|
|
||
Property and equipment, net consists of the following:
|
September 30
|
December 31
|
||||||
|
2012
|
2011
|
||||||
|
(Dollars in Millions)
|
|||||||
|
Land
|
$
|
158
|
|
$
|
184
|
|
|
|
Buildings and improvements
|
264
|
|
311
|
|
|||
|
Machinery, equipment and other
|
1,082
|
|
985
|
|
|||
|
Construction in progress
|
73
|
|
106
|
|
|||
|
1,577
|
|
1,586
|
|
||||
|
Accumulated depreciation
|
(374
|
)
|
(254
|
)
|
|||
|
1,203
|
|
1,332
|
|
||||
|
Product tooling, net of amortization
|
75
|
|
80
|
|
|||
|
Property and equipment, net
|
$
|
1,278
|
|
$
|
1,412
|
|
|
Property and equipment is depreciated principally using the straight-line method of depreciation over estimated useful lives. Generally, buildings and improvements are depreciated over a
40
-year estimated useful life and machinery, equipment and other assets are depreciated over estimated useful lives ranging from
3
to
15
years. Product tooling is amortized using the straight-line
8
method over the estimated life of the tool, generally not exceeding
6
years. Depreciation and amortization expenses are summarized as follows:
|
Three Months Ended
|
Nine Months Ended
|
||||||||||||||
|
September 30
|
September 30
|
||||||||||||||
|
2012
|
2011
|
2012
|
2011
|
||||||||||||
|
(Dollars in Millions)
|
|||||||||||||||
|
Depreciation
|
$
|
51
|
|
$
|
69
|
|
$
|
158
|
|
$
|
200
|
|
|||
|
Amortization
|
3
|
|
5
|
|
8
|
|
14
|
|
|||||||
|
$
|
54
|
|
$
|
74
|
|
$
|
166
|
|
$
|
214
|
|
||||
On
April 17, 2012
, the Company sold its corporate headquarters, which had a net book value of approximately
$60 million
, for proceeds of approximately
$80 million
. In connection with the sale, the Company entered into an agreement to lease back the corporate offices over a period of
15
years. The resulting gain on the sale of
$20 million
is being recognized into income over the lease term on a straight-line basis.
The Company recorded equity in net income of non-consolidated affiliates of
$38 million
and
$43 million
for the three-month periods ended September 30, 2012 and 2011, respectively. For the nine-month periods ended September 30, 2012 and 2011, the Company recorded equity in net income of non-consolidated affiliates of
$183 million
and
$130 million
, respectively. Equity in net income of non-consolidated affiliates for the nine months ended September 30, 2012 includes
$63 million
representing Visteon's equity interest in a non-cash gain recorded by Yanfeng Visteon Automotive Trim Systems Co., Ltd (“Yanfeng”), a
50%
owned non-consolidated affiliate of the Company. The gain resulted from the excess of fair value over carrying value of a former equity investee of Yanfeng that was consolidated effective June 1, 2012 pursuant to changes in the underlying joint venture agreement. The amounts recorded by Yanfeng are based on preliminary estimates of enterprise value, which remain subject to finalization. Final determination of the values may result in adjustments to the amount of the gain reported herein. The Company had
$734 million
and
$644 million
of equity in the net assets of non-consolidated affiliates at September 30, 2012 and December 31, 2011, respectively. The following table presents summarized financial data for the Company’s non-consolidated affiliates and reflects 100% of the operating results of such affiliates.
|
Three Months Ended September 30
|
|||||||||||||||||||||||
|
Net Sales
|
Gross Margin
|
Net Income
|
|||||||||||||||||||||
|
2012
|
2011
|
2012
|
2011
|
2012
|
2011
|
||||||||||||||||||
|
(Dollars in Millions)
|
|||||||||||||||||||||||
|
Yanfeng
|
$
|
1,582
|
|
$
|
740
|
|
$
|
257
|
|
$
|
125
|
|
$
|
62
|
|
$
|
68
|
|
|||||
|
All other
|
404
|
|
211
|
|
46
|
|
38
|
|
15
|
|
19
|
|
|||||||||||
|
$
|
1,986
|
|
$
|
951
|
|
$
|
303
|
|
$
|
163
|
|
$
|
77
|
|
$
|
87
|
|
||||||
|
Nine Months Ended September 30
|
|||||||||||||||||||||||
|
Net Sales
|
Gross Margin
|
Net Income
|
|||||||||||||||||||||
|
2012
|
2011
|
2012
|
2011
|
2012
|
2011
|
||||||||||||||||||
|
(Dollars in Millions)
|
|||||||||||||||||||||||
|
Yanfeng
|
$
|
3,366
|
|
$
|
2,199
|
|
$
|
557
|
|
$
|
362
|
|
$
|
319
|
|
$
|
200
|
|
|||||
|
All other
|
1,284
|
|
603
|
|
140
|
|
108
|
|
59
|
|
60
|
|
|||||||||||
|
$
|
4,650
|
|
$
|
2,802
|
|
$
|
697
|
|
$
|
470
|
|
$
|
378
|
|
$
|
260
|
|
||||||
Yanfeng sales and gross margin for the three months ended September 30, 2012 include approximately
$727 million
and
$130 million
, respectively, related to activity of a former equity investee that was consolidated effective June 1, 2012. Yanfeng sales and gross margin for the nine months ended September 30, 2012 include approximately
$927 million
and
$170 million
, respectively, related to post-consolidation activity of the aforementioned equity investee. Yanfeng net income for the nine months ended September 30, 2012 includes approximately
$130 million
associated with a non-cash gain on the consolidation of a former equity investee. Net sales for all other non-consolidated affiliates for the three and nine-month periods ended September 30, 2012 included
9
$163 million
and
$571 million
, respectively, related to Duckyang. The Company commenced equity method accounting for Duckyang from October 2011 following the sale of a controlling ownership interest and deconsolidation from the Company's financial statements.
The Company monitors its investments in the net assets of non-consolidated affiliates for indicators of other-than-temporary declines in value on an ongoing basis. If the Company determines that such a decline has occurred, an impairment loss is recorded, which is measured as the difference between carrying value and fair value.
Intangible assets, net are comprised of the following:
|
September 30, 2012
|
December 31, 2011
|
||||||||||||||||||||||
|
Gross Carrying Value
|
Accumulated Amortization
|
Net Carrying Value
|
Gross Carrying Value
|
Accumulated Amortization
|
Net Carrying Value
|
||||||||||||||||||
|
(Dollars in Millions)
|
|||||||||||||||||||||||
|
Definite-lived intangible assets
|
|||||||||||||||||||||||
|
Developed technology
|
$
|
203
|
|
$
|
52
|
|
$
|
151
|
|
$
|
204
|
|
$
|
32
|
|
$
|
172
|
|
|||||
|
Customer related
|
121
|
|
26
|
|
95
|
|
119
|
|
16
|
|
103
|
|
|||||||||||
|
Other
|
21
|
|
4
|
|
17
|
|
20
|
|
3
|
|
17
|
|
|||||||||||
|
Total
|
$
|
345
|
|
$
|
82
|
|
$
|
263
|
|
$
|
343
|
|
$
|
51
|
|
$
|
292
|
|
|||||
|
Goodwill and indefinite-lived intangible assets (a)
|
|||||||||||||||||||||||
|
Goodwill
|
$
|
36
|
|
$
|
36
|
|
|||||||||||||||||
|
Trade names
|
25
|
|
25
|
|
|||||||||||||||||||
|
Total
|
61
|
|
61
|
|
|||||||||||||||||||
|
$
|
324
|
|
$
|
353
|
|
||||||||||||||||||
|
(a) Goodwill and trade names, substantially all of which relate to the Company's Climate reporting unit.
|
|||||||||||||||||||||||
The Company recorded approximately
$10 million
and
$30 million
of amortization expense related to definite-lived intangible assets for the three and nine-month periods ended September 30, 2012, respectively. The Company recorded approximately
$12 million
and
$34 million
of amortization expense related to definite-lived intangible assets for the three and nine-month periods ended September 30, 2011, respectively. The Company estimates annual amortization expense to be approximately
$40 million
through 2016. Goodwill and trade names are not amortized but are assessed for impairment annually, or earlier when events and circumstances indicate that it is more likely than not that such assets have been impaired.
10
Other current liabilities are summarized as follows:
|
September 30
|
December 31
|
||||||
|
2012
|
2011
|
||||||
|
(Dollars in Millions)
|
|||||||
|
Product warranty and recall reserves
|
$
|
40
|
|
$
|
42
|
|
|
|
Deferred income
|
37
|
|
21
|
|
|||
|
Non-income taxes payable
|
36
|
|
41
|
|
|||
|
Payables to non-consolidated affiliates
|
31
|
|
24
|
|
|||
|
Accrued interest payable
|
16
|
|
7
|
||||
|
Income taxes payable
|
13
|
|
29
|
|
|||
|
Restructuring reserves
|
8
|
|
26
|
|
|||
|
Accrued legal reserves
|
7
|
|
8
|
||||
|
Claims settlement accruals
|
2
|
|
9
|
|
|||
|
Foreign currency hedges
|
—
|
|
16
|
|
|||
|
Other accrued liabilities
|
58
|
|
44
|
|
|||
|
$
|
248
|
|
$
|
267
|
|
||
Other non-current liabilities are summarized as follows:
|
September 30
|
December 31
|
||||||
|
2012
|
2011
|
||||||
|
(Dollars in Millions)
|
|||||||
|
Income tax reserves
|
$
|
106
|
|
$
|
97
|
|
|
|
Deferred income
|
60
|
|
42
|
|
|||
|
Non-income taxes payable
|
45
|
|
44
|
|
|||
|
Product warranty and recall reserves
|
25
|
|
24
|
|
|||
|
Legal and environmental reserves
|
7
|
|
8
|
|
|||
|
Other accrued liabilities
|
8
|
|
10
|
|
|||
|
$
|
251
|
|
$
|
225
|
|
||
Current and non-current deferred income at September 30, 2012 of
$17 million
and
$37 million
, respectively, relate to various customer accommodation, support and other agreements. Revenue associated with these agreements is being recorded in relation to the delivery of associated products in accordance with the terms of the underlying agreement or over the estimated period of benefit to the customer, generally representing the duration of remaining production on current vehicle platforms. The Company recorded
$5 million
and
$15 million
of revenue associated with these payments during the three and nine-month periods ended September 30, 2012, respectively. The Company expects to record approximately
$5 million
,
$16 million
,
$14 million
,
$10 million
and
$9 million
of deferred amounts in the remainder of 2012 and the annual periods of 2013, 2014, 2015 and 2016, respectively.
11
As of September 30, 2012, the Company had debt outstanding of
$89 million
and
$506 million
classified as short-term debt and long-term debt, respectively. The Company’s short and long-term debt balances consist of the following:
|
|
September 30
|
December 31
|
|||||
|
2012
|
2011
|
||||||
|
(Dollars in Millions)
|
|||||||
|
Short-term debt
|
|||||||
|
Current portion of long-term debt
|
$
|
—
|
|
$
|
1
|
|
|
|
Other – short-term
|
89
|
|
86
|
|
|||
|
Total short-term debt
|
89
|
|
87
|
|
|||
|
Long-term debt
|
|||||||
|
6.75% senior notes due April 15, 2019
|
495
|
|
494
|
|
|||
|
Other
|
11
|
|
18
|
|
|||
|
Total long-term debt
|
506
|
|
512
|
|
|||
|
Total debt
|
$
|
595
|
|
$
|
599
|
|
|
As of September 30, 2012, the Company's revolving loan credit agreement had a borrowing capacity of
$156 million
, and no amounts were outstanding. On April 3, 2012, the Company entered into an amendment to the revolving loan credit agreement to allow for the potential sale of the Lighting assets as well as the sale and leaseback of the Company's U.S. corporate headquarters. On July 3, 2012, the Company entered into an amendment to the revolving loan credit agreement to, among other things, reduce the aggregate lending commitment to
$175 million
and modify certain restrictive covenants to permit certain asset dispositions, hedging and similar arrangements and the incurrence of limited categories of indebtedness.
In connection with the Company's
$15 million
Letter of Credit ("LOC") Facility with US Bank National Association, the Company must continue to maintain a collateral account equal to
103%
of the aggregated stated amount of the LOCs with reimbursement of any draws. As of September 30, 2012 and December 31, 2011, the Company had
$9 million
and
$11 million
of outstanding letters of credit issued under this facility and secured by restricted cash, respectively. In addition, the Company had
$13 million
of locally issued letters of credit to support various customs arrangements and other obligations at its local affiliates of which
$8 million
are securitized by cash collateral as of September 30, 2012.
As of September 30, 2012, the Company had affiliate debt outstanding of
$100 million
, with
$89 million
and
$11 million
classified in short-term and long-term debt, respectively. These balances are primarily related to the Company’s non-U.S. operations and are payable in non-U.S. currencies including, but not limited to, the Euro, Chinese Yuan, and Korean Won. Remaining availability on outstanding affiliate credit facilities is approximately
$193 million
and certain of these facilities have pledged receivables, inventory or equipment as security. Included in the Company's affiliate debt is an arrangement, through a subsidiary in France, to sell accounts receivable on an uncommitted basis. The amount of financing available is contingent upon the amount of receivables less certain reserves. The Company pays a
30 basis point
servicing fee on all receivables sold, as well as a financing fee of 3-month Euribor plus
75 basis point
s on the advanced portion. At September 30, 2012, there was
$13 million
of outstanding borrowings under the facility with
$47 million
of receivables pledged as security, which are recorded as Other current assets on the consolidated balance sheet.
On July 4, 2012 the Company's wholly owned subsidiary, Visteon Korea Holdings Corp., commenced a cash tender offer to purchase
32.0 million
shares of Halla Climate Control Corporation (“Halla”), a 70% owned subsidiary of the Company, representing the remaining 30% outstanding ownership interest. The tender offer and related costs were to be funded through a fully committed Korean debt facility of
1 trillion
KRW or
$881 million
(the "Bridge Loan"), under which Visteon Korea Holdings Corp. borrowed
925 billion
KRW or
$815 million
. The Bridge Loan was secured by a pledge of all of the shares of capital stock of Halla owned directly or indirectly by Visteon. On July 24, 2012 the tender offer expired without acceptance of the tendered shares. During August 2012 Visteon Korea Holdings Corp. repaid amounts previously borrowed and permanently reduced the available commitments under the Bridge Loan without penalty after following certain advance notice and other procedures. The Company incurred debt extinguishment costs of approximately
$4 million
and interest of
$5 million
during the three and nine-month periods ended September 30, 2012 in connection with this financing arrangement.
12
The fair value of debt was approximately
$621 million
at September 30, 2012 and
$587 million
at December 31, 2011. Fair value estimates were based on quoted market prices or current rates for the same or similar issues, or on the current rates offered to the Company for debt of the same remaining maturities.
Defined Contribution Plans
Most U.S. salaried employees and certain non-U.S. employees are eligible to participate in defined contribution plans by contributing a portion of their compensation, which is partially matched by the Company. Effective January 1, 2012, matching contributions for the U.S. defined contribution plan are
100%
on the first
6%
of pay contributed. The expense related to matching contributions was approximately $
3 million
and
$11 million
for the three-month and nine-month periods ended September 30, 2012, respectively. The expense related to matching contributions was approximately $
2 million
and $
4 million
for the three-month and nine-month periods ended September 30, 2011, respectively.
Defined Benefit Plans
The components of the Company’s net periodic benefit costs for the three-month periods ended September 30, 2012 and 2011 were as follows:
|
Retirement Plans
|
Health Care and Life Insurance Benefits
|
||||||||||||||||||||||
|
U.S. Plans
|
Non-U.S. Plans
|
||||||||||||||||||||||
|
2012
|
2011
|
2012
|
2011
|
2012
|
2011
|
||||||||||||||||||
|
(Dollars in Millions)
|
|||||||||||||||||||||||
|
Costs recognized in income
|
|||||||||||||||||||||||
|
Service cost
|
$
|
—
|
|
$
|
2
|
|
$
|
2
|
|
$
|
2
|
|
$
|
—
|
|
$
|
—
|
|
|||||
|
Interest cost
|
17
|
|
18
|
|
6
|
|
7
|
|
—
|
|
—
|
|
|||||||||||
|
Expected return on plan assets
|
(20
|
)
|
(19
|
)
|
(4
|
)
|
(5
|
)
|
—
|
|
—
|
|
|||||||||||
|
Special termination benefits
|
—
|
|
1
|
|
—
|
|
—
|
|
—
|
|
—
|
|
|||||||||||
|
Visteon sponsored plan net pension (income) expense
|
$
|
(3
|
)
|
$
|
2
|
|
$
|
4
|
|
$
|
4
|
|
$
|
—
|
|
$
|
—
|
|
|||||
The components of the Company’s net periodic benefit costs for the nine-month periods ended September 30, 2012 and 2011 were as follows:
|
Retirement Plans
|
Health Care and Life Insurance Benefits
|
||||||||||||||||||||||
|
U.S. Plans
|
Non-U.S. Plans
|
||||||||||||||||||||||
|
2012
|
2011
|
2012
|
2011
|
2012
|
2011
|
||||||||||||||||||
|
(Dollars in Millions)
|
|||||||||||||||||||||||
|
Costs recognized in income
|
|||||||||||||||||||||||
|
Service cost
|
$
|
—
|
|
$
|
4
|
|
$
|
5
|
|
$
|
5
|
|
$
|
—
|
|
$
|
—
|
|
|||||
|
Interest cost
|
52
|
|
55
|
|
20
|
|
21
|
|
—
|
|
—
|
|
|||||||||||
|
Expected return on plan assets
|
(59
|
)
|
(56
|
)
|
(13
|
)
|
(14
|
)
|
—
|
|
—
|
|
|||||||||||
|
Reinstatement (termination) of benefits
|
—
|
|
—
|
|
—
|
|
—
|
|
—
|
|
(2
|
)
|
|||||||||||
|
Special termination benefits
|
—
|
|
3
|
|
—
|
|
—
|
|
—
|
|
—
|
|
|||||||||||
|
Visteon sponsored plan net pension (income) expense
|
$
|
(7
|
)
|
$
|
6
|
|
$
|
12
|
|
$
|
12
|
|
$
|
—
|
|
$
|
(2
|
)
|
|||||
On January 9, 2012 the Company completed a contribution of approximately
1.5 million
shares of Visteon Corporation common stock valued at approximately
$73 million
to its two largest U.S. defined benefit plans. This contribution was in excess of 2011 and 2012 plan year minimum required contributions for those plans by approximately
$40 million
. As of September 30, 2012, all shares previously contributed to the plans had been sold, with an average share price of approximately
$44
.
During the nine-month period ended September 30, 2012, cash contributions to the Company's U.S. and non-U.S. retirement plans
13
were
$3 million
and
$9 million
, respectively. The Company anticipates additional cash contributions to its non-U.S. retirement plans of
$7 million
during 2012. The Company’s expected 2012 contributions may be revised.
On September 19, 2012, Visteon announced a lump sum payment option to certain former U.S. employees who are vested defined benefit plan participants not currently receiving monthly payments. The lump sum payment option, to be funded with pension plan assets, is offered from October 1 to November 9, 2012. The Company expects to record a non-cash settlement charge in connection with the lump sum payments, the amount of which will depend upon participation rate, value of assets and discount rate at year-end.
The Company, in connection with the appointment of a new Chief Executive Officer and President effective September 30, 2012, made an equity grant under the Visteon Corporation 2010 Incentive Plan consisting of
85,256
time-based restricted stock units and
345,914
performance based stock units. The restricted stock units vest in three equal annual installments on August 10, 2013, 2014, and 2015 subject to continued employment. The performance based stock units vest based on the Company's total shareholder return for the period between the grant date and December 31, 2015 and are subject to continued employment.
The Company's provision for income taxes in interim periods is computed by applying an estimated annual effective tax rate against income before income taxes, excluding equity in net income of non-consolidated affiliates for the period. Effective tax rates vary from period to period as separate calculations are performed for those countries where the Company's operations are profitable and whose results continue to be tax-effected and for those countries where full deferred tax valuation allowances exist and are maintained. The Company is also required to record the tax impact of certain other non-recurring tax items, including changes in judgment about valuation allowances and effects of changes in tax laws or rates, in the interim period in which they occur. The need to maintain valuation allowances against deferred tax assets in the U.S. and other affected countries will continue to cause variability in the Company's quarterly and annual effective tax rates. Full valuation allowances against deferred tax assets in the U.S. and applicable foreign countries will be maintained until sufficient positive evidence exists to reduce or eliminate them. In this regard, it is reasonably possible that existing valuation allowances on approximately
$5 million
of deferred tax assets could be eliminated during 2012 as the Company continues to monitor the ability to generate the necessary taxable earnings to recover the deferred tax assets in certain foreign jurisdictions.
The Company provides for U.S. and non-U.S. income taxes and non-U.S. withholding taxes on the projected future repatriations of the earnings from its non-U.S. operations at each tier of the legal entity structure. During the three-month and nine-month periods ended September 30, 2012, the Company recognized expense of
$5 million
and
$16 million
, respectively, reflecting the Company's forecasts which contemplate numerous financial and operational considerations that impact future repatriations.
The Company's provision for income taxes for the three-month and nine-month periods ended September 30, 2012 of
$33 million
and
$102 million
, respectively, includes income tax expense in countries where the Company is profitable, withholding taxes, changes in uncertain tax benefits, and the inability to record a tax benefit for pre-tax losses in the U.S. and certain other jurisdictions to the extent not offset by other categories of income.
The amount of income tax expense or benefit allocated to continuing operations is generally determined without regard to the tax effects of other categories of income or loss, such as other comprehensive income.
However, an exception to the general rule is provided when there is a pre-tax loss from continuing operations and net pre-tax income from other categories in the current year. In such instances, net pre-tax income from other categories must offset the current loss from operations, the tax benefit of such offset being reflected in continuing operations even when a valuation allowance has been established against the deferred tax assets. In instances where a valuation allowance is established against current year operating losses, net pre-tax income from other sources, including other comprehensive income, is considered when determining whether sufficient future taxable income exists to realize the deferred tax assets.
Unrecognized Tax Benefits
Gross unrecognized tax benefits were
$135 million
at September 30, 2012 and
$123 million
at December 31, 2011, of which approximately
$72 million
and
$69 million
, respectively, in each period represent the amount of unrecognized benefits that, if recognized, would impact the effective tax rate. The gross unrecognized tax benefit differs from that which would impact the effective tax rate due to uncertain tax positions embedded in other deferred tax attributes carrying a full valuation allowance. Since the uncertainty is expected to be resolved while a full valuation allowance is maintained, these uncertain tax positions should not
14
impact the effective tax rate in current or future periods. During the three-month and nine-month periods ended September 30, 2012, the Company increased its gross unrecognized tax benefits for positions expected to be taken in future tax returns, primarily related to the allocation of costs among our global operations, and foreign currency impacts. The Company records interest and penalties related to uncertain tax positions as a component of income tax expense. Accrued interest and penalties related to uncertain tax positions was
$34 million
at September 30, 2012 and
$28 million
at December 31, 2011.
The Company operates in multiple jurisdictions throughout the world and the income tax returns of its subsidiaries in various tax jurisdictions are subject to periodic examination by respective tax authorities. The Company regularly assesses the status of these examinations and the potential for adverse and/or favorable outcomes to determine the adequacy of its provision for income taxes. The Company believes that it has adequately provided for tax adjustments that it believes are more likely than not to be realized as a result of any ongoing or future examination.
Specifically, in June 2012, the Korean tax authorities commenced a review of Visteon's controlled subsidiary, Halla Climate Control Corporation ("Halla") for the tax years 2007 through 2011. In October 2012, the tax authorities issued a pre-assessment of approximately
$18 million
for alleged underpayment of withholding tax on dividends paid and other items, including certain management service fees charged by Visteon Corporation. The Company is considering potential next steps if the pre-assessment becomes finalized, including filing an appeal with the Korean Tax Tribunal. Pursuant to the Korean tax rules, it is possible a payment of the final assessment will need to be made in full in the fourth quarter of 2012 to pursue the appeals process. The Company believes it is more likely than not it will receive a favorable ruling when all of the available appeals have been exhausted.
With few exceptions, the Company is no longer subject to U.S. federal tax examinations for years before 2008 or state and local, or non-U.S. income tax examinations for years before 2002. Although it is not possible to predict the timing of the resolution of all ongoing tax audits with accuracy, it is reasonably possible that certain tax proceedings in Europe and Asia could conclude within the next twelve months and result in a significant change in the balance of gross unrecognized tax benefits. Given the number of years, jurisdictions and positions subject to examination, the Company is unable to estimate the full range of possible adjustments to the balance of unrecognized tax benefits. However, the Company believes it is reasonably possible that it will reduce the amount of its existing unrecognized tax benefits impacting the effective tax rate by
$1 million
to
$3 million
due to the lapse of statute of limitations.
The tables below provide a reconciliation of the carrying amount of total shareholders' equity, including shareholders' equity attributable to Visteon and equity attributable to non-controlling interests ("NCI") for the three and nine months ended September 30, 2012 and 2011.
|
Three Months Ended September 30
|
|||||||||||||||||||||||
|
2012
|
2011
|
||||||||||||||||||||||
|
Visteon
|
NCI
|
Total
|
Visteon
|
NCI
|
Total
|
||||||||||||||||||
|
(Dollars in Millions)
|
|||||||||||||||||||||||
|
Shareholders' equity beginning balance
|
$
|
1,433
|
|
$
|
695
|
|
$
|
2,128
|
|
$
|
1,443
|
|
$
|
713
|
|
$
|
2,156
|
|
|||||
|
Income from continuing operations
|
20
|
|
19
|
|
39
|
|
37
|
|
19
|
|
56
|
|
|||||||||||
|
(Loss) income from discontinued operations
|
(5
|
)
|
—
|
|
(5
|
)
|
4
|
|
—
|
|
4
|
|
|||||||||||
|
Net income
|
15
|
|
19
|
|
34
|
|
41
|
|
19
|
|
60
|
|
|||||||||||
|
Other comprehensive income (loss)
|
|||||||||||||||||||||||
|
Foreign currency translation adjustment
|
44
|
|
13
|
|
57
|
|
(102
|
)
|
(31
|
)
|
(133
|
)
|
|||||||||||
|
Pension and other postretirement benefits
|
2
|
|
—
|
|
2
|
|
(3
|
)
|
—
|
|
(3
|
)
|
|||||||||||
|
Unrealized hedging gains and other
|
2
|
|
1
|
|
3
|
|
(20
|
)
|
(6
|
)
|
(26
|
)
|
|||||||||||
|
Total other comprehensive income (loss)
|
48
|
|
14
|
|
62
|
|
(125
|
)
|
(37
|
)
|
(162
|
)
|
|||||||||||
|
Stock-based compensation, net
|
3
|
|
—
|
|
3
|
|
10
|
|
—
|
|
10
|
|
|||||||||||
|
Warrant exercises
|
—
|
|
—
|
|
—
|
|
4
|
|
—
|
|
4
|
|
|||||||||||
|
Dividends to non-controlling interests
|
—
|
|
(5
|
)
|
(5
|
)
|
—
|
|
(1
|
)
|
(1
|
)
|
|||||||||||
|
Shareholders' equity ending balance
|
$
|
1,499
|
|
$
|
723
|
|
$
|
2,222
|
|
$
|
1,373
|
|
$
|
694
|
|
$
|
2,067
|
|
|||||
15
|
Nine Months Ended September 30
|
|||||||||||||||||||||||
|
2012
|
2011
|
||||||||||||||||||||||
|
Visteon
|
NCI
|
Total
|
Visteon
|
NCI
|
Total
|
||||||||||||||||||
|
(Dollars in Millions)
|
|||||||||||||||||||||||
|
Shareholders' equity beginning balance
|
$
|
1,307
|
|
$
|
690
|
|
$
|
1,997
|
|
$
|
1,260
|
|
$
|
690
|
|
$
|
1,950
|
|
|||||
|
Income from continuing operations
|
64
|
|
46
|
|
110
|
|
98
|
|
54
|
|
152
|
|
|||||||||||
|
(Loss) income from discontinued operations
|
(3
|
)
|
—
|
|
(3
|
)
|
8
|
|
—
|
|
8
|
|
|||||||||||
|
Net income
|
61
|
|
46
|
|
107
|
|
106
|
|
54
|
|
160
|
|
|||||||||||
|
Other comprehensive income (loss)
|
|||||||||||||||||||||||
|
Foreign currency translation adjustment
|
25
|
|
10
|
|
35
|
|
(18
|
)
|
(13
|
)
|
(31
|
)
|
|||||||||||
|
Pension and other postretirement benefits
|
1
|
|
—
|
|
1
|
|
—
|
|
—
|
|
—
|
|
|||||||||||
|
Unrealized hedging gains and other
|
16
|
|
4
|
|
20
|
|
(14
|
)
|
(5
|
)
|
(19
|
)
|
|||||||||||
|
Total other comprehensive income (loss)
|
42
|
|
14
|
|
56
|
|
(32
|
)
|
(18
|
)
|
(50
|
)
|
|||||||||||
|
Stock-based compensation, net
|
16
|
|
—
|
|
16
|
|
30
|
|
—
|
|
30
|
|
|||||||||||
|
Common stock contribution to U.S. pension plans
|
73
|
|
—
|
|
73
|
|
—
|
|
—
|
|
—
|
|
|||||||||||
|
Warrant exercises
|
—
|
|
—
|
|
—
|
|
9
|
|
—
|
|
9
|
|
|||||||||||
|
Dividends to non-controlling interests
|
—
|
|
(27
|
)
|
(27
|
)
|
—
|
|
(32
|
)
|
(32
|
)
|
|||||||||||
|
Shareholders' equity ending balance
|
$
|
1,499
|
|
$
|
723
|
|
$
|
2,222
|
|
$
|
1,373
|
|
$
|
694
|
|
$
|
2,067
|
|
|||||
On July 30, 2012, Visteon's board of directors authorized the repurchase of up to
$100 million
of the Company's common stock over the subsequent two year period. The Company anticipates that repurchases of common stock, if any, would occur from time to time in open market transactions or in privately negotiated transactions depending on market and economic conditions, share price, trading volume, alternative uses of capital and other factors.
Non-controlling Interests
Non-controlling interests in the Visteon Corporation economic entity are as follows:
|
September 30
|
December 31
|
||||||
|
2012
|
2011
|
||||||
|
(Dollars in Millions)
|
|||||||
|
Halla Climate Control Corporation
|
$
|
692
|
|
$
|
660
|
|
|
|
Visteon Interiors Korea Ltd
|
19
|
|
20
|
|
|||
|
Other
|
12
|
|
10
|
|
|||
|
Total non-controlling interests
|
$
|
723
|
|
$
|
690
|
|
|
The Company holds a
70%
interest in Halla, a consolidated subsidiary. Halla is headquartered in South Korea with operations in North America, Europe and Asia. Halla designs, develops and manufactures automotive climate control products, including air conditioning systems, modules, compressors, and heat exchangers for sale to global OEMs.
16
Accumulated Other Comprehensive Income (Loss)
The Accumulated other comprehensive income (loss) (“AOCI”) category of Shareholders’ equity, net of tax, includes:
|
September 30
|
December 31
|
||||||
|
2012
|
2011
|
||||||
|
(Dollars in Millions)
|
|||||||
|
Foreign currency translation adjustments
|
$
|
(16
|
)
|
$
|
(41
|
)
|
|
|
Pension and other postretirement benefit adjustments
|
26
|
|
25
|
|
|||
|
Unrealized gains (losses) on derivatives
|
7
|
|
(9
|
)
|
|||
|
Total accumulated other comprehensive income (loss)
|
$
|
17
|
|
$
|
(25
|
)
|
|
Basic earnings (loss) per share of common stock is calculated by dividing reported net income (loss) attributable to Visteon by the average number of shares of common stock outstanding during the applicable period, adjusted for participating securities. Diluted earnings (loss) per share is computed by dividing net income (loss) attributable to Visteon by the average number of shares of common stock outstanding during the applicable period, adjusted for participating securities and the effect of dilutive potential common stock, such as stock warrants and stock options. The impact of participating securities and other dilutive potential common stock is not taken into consideration in a loss period as the impact would be anti-dilutive. Accordingly, participating securities and other dilutive potential common stock have been excluded from the computation of basic and diluted loss per share as applicable.
The table below provides details underlying the calculations of basic and diluted earnings (loss) per share.
|
Three Months Ended
|
Nine Months Ended
|
||||||||||||||
|
September 30
|
September 30
|
||||||||||||||
|
2012
|
2011
|
2012
|
2011
|
||||||||||||
|
(Dollars in Millions, Except Per Share Amounts)
|
|||||||||||||||
|
Numerator:
|
|||||||||||||||
|
Income from continuing operations
|
$
|
20
|
|
$
|
37
|
|
$
|
64
|
|
$
|
98
|
|
|||
|
(Loss) income from discontinued operations
|
(5
|
)
|
4
|
|
(3
|
)
|
8
|
|
|||||||
|
Net income attributable to Visteon
|
$
|
15
|
|
$
|
41
|
|
$
|
61
|
|
$
|
106
|
|
|||
|
Denominator:
|
|||||||||||||||
|
Average common stock outstanding
|
53.3
|
|
51.5
|
|
53.1
|
|
51.1
|
|
|||||||
|
Dilutive effect of warrants
|
0.5
|
|
0.5
|
|
0.4
|
|
0.9
|
|
|||||||
|
Diluted shares
|
53.8
|
|
52.0
|
|
53.5
|
|
52.0
|
|
|||||||
|
Basic and Diluted Earnings (Loss) Per Share Data:
|
|||||||||||||||
|
Basic earnings (loss) per share:
|
|||||||||||||||
|
Continuing operations
|
$
|
0.37
|
|
$
|
0.72
|
|
$
|
1.21
|
|
$
|
1.92
|
|
|||
|
Discontinued operations
|
(0.09
|
)
|
0.08
|
|
(0.06
|
)
|
0.15
|
|
|||||||
|
Basic earnings per share attributable to Visteon
|
$
|
0.28
|
|
$
|
0.80
|
|
$
|
1.15
|
|
$
|
2.07
|
|
|||
|
Diluted earnings (loss) per share:
|
|||||||||||||||
|
Continuing operations
|
$
|
0.37
|
|
$
|
0.71
|
|
$
|
1.20
|
|
$
|
1.89
|
|
|||
|
Discontinued operations
|
(0.09
|
)
|
0.08
|
|
(0.06
|
)
|
0.15
|
|
|||||||
|
Diluted earnings per share attributable to Visteon
|
$
|
0.28
|
|
$
|
0.79
|
|
$
|
1.14
|
|
$
|
2.04
|
|
|||
17
Fair Value Hierarchy
Financial assets and liabilities are categorized, based on the inputs to the valuation technique, into a three-level fair value hierarchy. The fair value hierarchy gives the highest priority to the quoted prices in active markets for identical assets and liabilities and lowest priority to unobservable inputs.
|
•
|
Level 1 – Financial assets and liabilities whose values are based on unadjusted quoted market prices for identical assets and liabilities in an active market that the Company has the ability to access.
|
|
•
|
Level 2 – Financial assets and liabilities whose values are based on quoted prices in markets that are not active or model inputs that are observable for substantially the full term of the asset or liability.
|
|
•
|
Level 3 – Financial assets and liabilities whose values are based on prices or valuation techniques that require inputs that are both unobservable and significant to the overall fair value measurement.
|
Financial Instruments
The Company’s net cash inflows and outflows exposed to the risk of changes in foreign currency exchange rates arise from the sale of products in countries other than the manufacturing source, foreign currency denominated supplier payments, debt and other payables, subsidiary dividends and investments in subsidiaries. Where possible, the Company utilizes derivative financial instruments, including forward and option contracts, to protect the Company’s cash flow from changes in exchange rates. Foreign currency exposures are reviewed monthly and natural offsets are considered prior to entering into a derivative financial instrument.
The Company’s primary foreign currency exposures include the Euro, Korean Won, Czech Koruna, Hungarian Forint and Mexican Peso. Where possible, the Company utilizes a strategy of partial coverage for transactions in these currencies. As of September 30, 2012 and December 31, 2011, the Company had forward contracts to hedge changes in foreign currency exchange rates with notional amounts of approximately
$564 million
and
$741 million
, respectively. Fair value estimates of these contracts are based on quoted market prices. A portion of these instruments has been designated as cash flow hedges with the effective portion of the gain or loss reported in the Accumulated other comprehensive income (loss) component of Shareholders’ equity in the Company’s consolidated balance sheets and the ineffective portion recorded as Cost of sales in the Company’s consolidated statements of comprehensive income.
Foreign currency hedge instruments are measured at fair value on a recurring basis under an income approach using industry-standard models that consider various assumptions, including time value, volatility factors, current market and contractual prices for the underlying and non-performance risk. Substantially all of these assumptions are observable in the marketplace throughout the full term of the instrument, can be derived from observable data, or are supported by observable levels at which transactions are executed in the marketplace. Accordingly, the Company's foreign currency instruments are classified as Level 2, “Other Observable Inputs” in the fair value hierarchy.
Financial Statement Presentation
The Company presents its derivative positions and any related material collateral under master netting agreements on a net basis. Derivative financial instruments designated and non-designated as hedging instruments are included in the Company’s consolidated balance sheets at September 30, 2012 and December 31, 2011 as follows:
|
Assets
|
Liabilities
|
|||||||||||||||||
|
September 30
|
December 31
|
September 30
|
December 31
|
|||||||||||||||
|
Classification
|
2012
|
2011
|
Classification
|
2012
|
2011
|
|||||||||||||
|
(Dollars in Millions)
|
(Dollars in Millions)
|
|||||||||||||||||
|
Designated:
|
Designated:
|
|||||||||||||||||
|
Other current assets
|
$
|
16
|
|
$
|
—
|
|
Other current assets
|
$
|
2
|
|
$
|
—
|
|
|||||
|
Other current liabilities
|
—
|
|
8
|
|
Other current liabilities
|
—
|
|
24
|
|
|||||||||
|
Non-designated:
|
Non-designated:
|
|||||||||||||||||
|
Other current assets
|
3
|
|
—
|
|
Other current assets
|
—
|
|
—
|
|
|||||||||
|
$
|
19
|
|
$
|
8
|
|
$
|
2
|
|
$
|
24
|
|
|||||||
18
Gains and losses associated with derivative financial instruments recorded in Cost of sales for the three-month periods ended September 30, 2012 and 2011 were as follows:
|
Amount of Gain (Loss)
|
|||||||||||||||||||||||
|
Recorded in AOCI, net of tax
|
Reclassified from AOCI into Income
|
Recorded in Income
|
|||||||||||||||||||||
|
Three months ended
|
Three months ended
|
Three months ended
|
|||||||||||||||||||||
|
September 30
|
September 30
|
September 30
|
|||||||||||||||||||||
|
2012
|
2011
|
2012
|
2011
|
2012
|
2011
|
||||||||||||||||||
|
(Dollars in Millions)
|
|||||||||||||||||||||||
|
Foreign currency risk – Cost of sales
|
|||||||||||||||||||||||
|
Cash flow hedges
|
$
|
2
|
|
$
|
(20
|
)
|
$
|
6
|
|
$
|
1
|
|
$
|
—
|
|
$
|
—
|
|
|||||
|
Non-designated cash flow hedges
|
—
|
|
—
|
|
—
|
|
—
|
|
(3
|
)
|
—
|
|
|||||||||||
|
$
|
2
|
|
$
|
(20
|
)
|
$
|
6
|
|
$
|
1
|
|
$
|
(3
|
)
|
$
|
—
|
|
||||||
Gains and losses associated with derivative financial instruments recorded in Cost of sales and Interest expense for the nine-month periods ended September 30, 2012 and 2011 were as follows:
|
Amount of Gain (Loss)
|
|||||||||||||||||||||||
|
Recorded in AOCI, net of tax
|
Reclassified from AOCI into Income
|
Recorded in Income
|
|||||||||||||||||||||
|
Nine months ended
|
Nine months ended
|
Nine months ended
|
|||||||||||||||||||||
|
September 30
|
September 30
|
September 30
|
|||||||||||||||||||||
|
2012
|
2011
|
2012
|
2011
|
2012
|
2011
|
||||||||||||||||||
|
(Dollars in Millions)
|
|||||||||||||||||||||||
|
Foreign currency risk – Cost of sales
|
|||||||||||||||||||||||
|
Cash flow hedges
|
$
|
16
|
|
$
|
(15
|
)
|
$
|
6
|
|
$
|
7
|
|
$
|
—
|
|
$
|
—
|
|
|||||
|
Non-designated cash flow hedges
|
—
|
|
—
|
|
—
|
|
—
|
|
(4
|
)
|
(4
|
)
|
|||||||||||
|
$
|
16
|
|
$
|
(15
|
)
|
$
|
6
|
|
$
|
7
|
|
$
|
(4
|
)
|
$
|
(4
|
)
|
||||||
|
Interest rate risk – Interest expense
|
|||||||||||||||||||||||
|
Cash flow hedges
|
$
|
—
|
|
$
|
1
|
|
$
|
—
|
|
$
|
—
|
|
$
|
—
|
|
$
|
—
|
|
|||||
Concentrations of Credit Risk
Financial instruments, including cash equivalents, marketable securities, derivative contracts and accounts receivable, expose the Company to counterparty credit risk for non-performance. The Company’s counterparties for cash equivalents, marketable securities and derivative contracts are banks and financial institutions that meet the Company’s requirement of high credit standing. The Company’s counterparties for derivative contracts are with investment and commercial banks with significant experience using such derivatives and is assessed on a net basis. The Company manages its credit risk through policies requiring minimum credit standing and limiting credit exposure to any one counterparty and through monitoring counterparty credit risks. The Company’s concentration of credit risk related to derivative contracts at September 30, 2012 and December 31, 2011 is not significant. With the exception of the customers below, the Company’s credit risk with any individual customer does not exceed ten percent of total accounts receivable at September 30, 2012 and December 31, 2011, respectively.
|
September 30
|
December 31
|
||
|
2012
|
2011
|
||
|
Ford and affiliates
|
27%
|
24%
|
|
|
Hyundai Mobis Company
|
15%
|
14%
|
|
|
Hyundai Motor Company
|
9%
|
10%
|
|
Management periodically performs credit evaluations of its customers and generally does not require collateral.
19
Guarantees and Commitments
The Company has guaranteed approximately
$37 million
of subsidiary lease payments under various arrangements generally spanning between one to ten years in duration, and
$6 million
for affiliate credit lines and other credit support agreements. In connection with an agreement entered in 2009 with the Pension Benefit Guarantee Corporation ("PBGC"), the Company agreed to provide a guarantee by certain affiliates of contingent pension obligations of up to
$30 million
, the term of this guarantee is dependent upon events as specifically set forth in the PBGC agreement.
Litigation and Claims
Several current and former employees of Visteon Deutschland GmbH (“Visteon Germany”) filed civil actions against Visteon Germany in various German courts beginning in August 2007 seeking damages for the alleged violation of German pension laws that prohibit the use of pension benefit formulas that differ for salaried and hourly employees without adequate justification. Several of these actions have been joined as pilot cases. In a written decision issued in April 2010, the Federal Labor Court issued a declaratory judgment in favor of the plaintiffs in the pilot cases. To date, more than
750
current and former employees have filed similar actions or have inquired as to or been granted additional benefits, and an additional
600
current and former employees are similarly situated. The Company's remaining reserve for unsettled cases is approximately
$6 million
and is based on the Company’s best estimate as to the number and value of the claims that will be made in connection with the pension plan. However, the Company’s estimate is subject to many uncertainties which could result in Visteon Germany incurring amounts in excess of the reserved amount of up to approximately
$8 million
.
The Company's operations in Brazil are subject to highly complex labor, tax, customs and other laws. While the Company believes that it is in compliance with such laws, it is periodically engaged in litigation regarding the application of these laws. As of September 30, 2012, the Company maintained accruals of approximately
$9 million
for claims aggregating approximately
$141 million
. The amounts accrued represent claims that are deemed probable of loss and are reasonably estimable based on the Company's assessment of the claims and prior experience with similar matters.
On
May 28, 2009
, the Debtors filed voluntary petitions in the Court seeking reorganization relief under the provisions of chapter 11 of the Bankruptcy Code. The Debtors’ chapter 11 cases have been assigned to the Honorable Christopher S. Sontchi and are being jointly administered as Case No. 09-11786. The Debtors continued to operate their business as debtors-in-possession under the jurisdiction of the Court and in accordance with the applicable provisions of the Bankruptcy Code and the orders of the Court until their emergence on
October 1, 2010
. Under section 362 of the Bankruptcy Code, the filing of a bankruptcy petition automatically stayed most actions against a debtor, including most actions to collect pre-petition indebtedness or to exercise control over the property of the debtor’s estate. Substantially all pre-petition liabilities and claims relating to rejected executory contracts and unexpired leases have been settled under the Debtor’s plan of reorganization, however, the ultimate amounts to be paid in settlement of each those claims will continue to be subject to the uncertain outcome of litigation, negotiations and Court decisions for a period of time after the Effective Date.
In December of 2009, the Court granted the Debtors' motion in part authorizing them to terminate or amend certain other postretirement employee benefits, including health care and life insurance. On December 29, 2009, the IUE-CWA, the Industrial Division of the Communications Workers of America, AFL-CIO, CLC, filed a notice of appeal of the Court's order with the District Court. By order dated March 31, 2010, the District Court affirmed the Court's order in all respects. On April 1, 2010, the IUE filed a notice of appeal. On July 13, 2010, the Circuit Court reversed the order of the District Court as to the IUE-CWA and directed the District Court to, among other things, direct the Court to order the Company to take whatever action is necessary to immediately restore terminated or modified benefits to their pre-termination/modification levels. On July 27, 2010, the Company filed a Petition for Rehearing or Rehearing En Banc requesting that the Circuit Court review the panel’s decision, which was denied. By orders dated August 30, 2010, the Court ruled that the Company should restore certain other postretirement employee benefits to the appellant-retirees and also to salaried retirees and certain retirees of the International Union, United Automobile, Aerospace and Agricultural Implement Workers of America (“UAW”). On September 1, 2010, the Company filed a Notice of Appeal to the District Court of the Court's decision to include non-appealing retirees, and on September 15, 2010 the UAW filed a Notice of Cross-Appeal. On July 25, 2012, the District Court ruled in the Company's favor on both appeals. The Company reached an agreement with the original appellants in late-September 2010, which resulted in the Company not restoring other postretirement employee benefits of such retirees. On September 30, 2010, the UAW filed a complaint, which it amended on October 1, 2010, in the United States District Court for the Eastern District of Michigan seeking, among other things, a declaratory judgment to prohibit the Company from terminating certain other postretirement employee benefits for UAW retirees after the Effective Date. The Company has filed a motion to dismiss the UAW's complaint and a motion to transfer the case to the District of Delaware, which motions
20
are pending. In July 2011, the Company engaged in mediation with the UAW, which was not successful. As of September 30, 2012, the Company maintains an accrual for claims that are deemed probable of loss and are reasonably estimable based on the Company's assessment of the claims and prior experience with similar matters.
While the Company believes its accruals for litigation and claims are adequate, the final amounts required to resolve such matters could differ materially from recorded estimates and the Company's results of operations and cash flows could be materially affected.
Product Warranty and Recall
Amounts accrued for product warranty and recall claims are based on management’s best estimates of the amounts that will ultimately be required to settle such items. The Company’s estimates for product warranty and recall obligations are developed with support from its sales, engineering, quality and legal functions and include due consideration of contractual arrangements, past experience, current claims and related information, production changes, industry and regulatory developments and various other considerations. The Company can provide no assurances that it will not experience material claims in the future or that it will not incur significant costs to defend or settle such claims beyond the amounts accrued or beyond what the Company may recover from its suppliers. The following table provides a reconciliation of changes in the product warranty and recall claims liability for the nine-month periods ended September 30, 2012 and 2011.
|
Nine Months Ended September 30
|
|||||||
|
2012
|
2011
|
||||||
|
(Dollars in Millions)
|
|||||||
|
Beginning balance
|
$
|
66
|
|
$
|
75
|
|
|
|
Accruals for products shipped
|
15
|
|
16
|
|
|||
|
Currency
|
(1
|
)
|
—
|
|
|||
|
Changes in estimates
|
(1
|
)
|
(11
|
)
|
|||
|
Settlements
|
(14
|
)
|
(12
|
)
|
|||
|
Ending balance
|
$
|
65
|
|
$
|
68
|
|
|
Environmental Matters
The Company is subject to the requirements of federal, state, local and foreign environmental and occupational safety and health laws and regulations and ordinances. These include laws regulating air emissions, water discharge and waste management. The Company is also subject to environmental laws requiring the investigation and cleanup of environmental contamination at properties it presently owns or operates and at third-party disposal or treatment facilities to which these sites send or arranged to send hazardous waste. The Company is aware of contamination at some of its properties. These sites are in various stages of investigation and cleanup. The Company currently is, has been, and in the future may become the subject of formal or informal enforcement actions or procedures.
Costs related to environmental assessments and remediation efforts at operating facilities, previously owned or operated facilities, or other waste site locations are accrued when it is probable that a liability has been incurred and the amount of that liability can be reasonably estimated. Estimated costs are recorded at undiscounted amounts, based on experience and assessments, and are regularly evaluated. The liabilities are recorded in Other current liabilities and Other non-current liabilities in the consolidated balance sheets. At September 30, 2012, the Company had recorded a reserve of approximately
$1 million
for environmental matters. However, estimating liabilities for environmental investigation and cleanup is complex and dependent upon a number of factors beyond the Company’s control and which may change dramatically. Accordingly, although the Company believes its reserve is adequate based on current information, the Company cannot provide any assurance that its ultimate environmental investigation and cleanup costs and liabilities will not exceed the amount of its current reserve.
Other Contingent Matters
Various legal actions, governmental investigations and proceedings and claims are pending or may be instituted or asserted in the future against the Company, including those arising out of alleged defects in the Company’s products; governmental regulations relating to safety; employment-related matters; customer, supplier and other contractual relationships; intellectual property rights; product warranties; product recalls; and environmental matters. Some of the foregoing matters may involve compensatory, punitive or antitrust or other treble damage claims in very large amounts, or demands for recall campaigns, environmental remediation programs, sanctions, or other relief which, if granted, would require very large expenditures. The Company enters into agreements
21
that contain indemnification provisions in the normal course of business for which the risks are considered nominal and impracticable to estimate.
Contingencies are subject to many uncertainties, and the outcome of individual litigated matters is not predictable with assurance. Reserves have been established by the Company for matters discussed in the immediately foregoing paragraph where losses are deemed probable and reasonably estimable. It is possible, however, that some of the matters discussed in the foregoing paragraph could be decided unfavorably to the Company and could require the Company to pay damages or make other expenditures in amounts, or a range of amounts, that cannot be estimated at September 30, 2012 and that are in excess of established reserves. The Company does not reasonably expect, except as otherwise described herein, based on its analysis, that any adverse outcome from such matters would have a material effect on the Company’s financial condition, results of operations or cash flows, although such an outcome is possible.
Segments are defined as components of an enterprise for which discrete financial information is available that is evaluated regularly by the chief operating decision-maker, or a decision-making group, in deciding the allocation of resources and in assessing performance. The Company’s Chief Operating Decision Making Group ("CODM Group"), comprised of the Chief Executive Officer (“CEO”) and Chief Financial Officer (“CFO”), evaluates the performance of the Company’s segments primarily based on net sales, before elimination of inter-company shipments, gross margin, Adjusted EBITDA (as defined below) and operating assets. Gross margin is defined as total sales less costs to manufacture and product development and engineering expenses. The Company defines Adjusted EBITDA as net income attributable to the Company, plus net interest expense, provision for income taxes and depreciation as further adjusted to eliminate the impact of asset impairments, gains or losses on divestitures, net restructuring expenses and other reimbursable costs, certain charges, reorganization items and other non-operating gains and losses. Operating assets include inventories and property and equipment utilized in the manufacture of the segments’ products.
The Company’s operating structure is organized by global product lines, including: Climate, Electronics and Interiors. These global product lines have financial and operating responsibility over the design, development and manufacture of the Company’s product portfolio. Global customer groups are responsible for the business development of the Company’s product portfolio and overall customer relationships. Certain functions such as procurement, information technology and other administrative activities are managed on a global basis with regional deployment. The Company’s reportable segments are as follows:
|
•
|
Climate — The Company’s Climate product line includes climate air handling modules, powertrain cooling modules, heat exchangers, compressors, fluid transport and engine induction systems.
|
|
•
|
Electronics — The Company’s Electronics product line includes audio systems, infotainment systems, driver information systems, powertrain and feature control modules, climate controls, and electronic control modules.
|
|
•
|
Interiors — The Company’s Interiors product line includes instrument panels, cockpit modules, door trim and floor consoles.
|
Segment Sales and Gross Margin
|
|
Sales
|
Gross Margin
|
|||||||||||||||||||||||||||||
|
Three Months Ended
|
Nine Months Ended
|
Three Months Ended
|
Nine Months Ended
|
||||||||||||||||||||||||||||
|
September 30
|
September 30
|
September 30
|
September 30
|
||||||||||||||||||||||||||||
|
2012
|
2011
|
2012
|
2011
|
2012
|
2011
|
2012
|
2011
|
||||||||||||||||||||||||
|
(Dollars in Millions)
|
|||||||||||||||||||||||||||||||
|
Climate
|
$
|
1,024
|
|
$
|
1,003
|
|
$
|
3,112
|
|
$
|
3,040
|
|
$
|
89
|
|
$
|
78
|
|
$
|
259
|
|
$
|
256
|
|
|||||||
|
Electronics
|
298
|
|
338
|
|
919
|
|
1,047
|
|
19
|
|
30
|
|
76
|
|
104
|
|
|||||||||||||||
|
Interiors
|
313
|
|
606
|
|
1,070
|
|
1,854
|
|
21
|
|
31
|
|
56
|
|
114
|
|
|||||||||||||||
|
Eliminations
|
(11
|
)
|
(38
|
)
|
(67
|
)
|
(136
|
)
|
—
|
|
—
|
|
—
|
|
—
|
|
|||||||||||||||
|
Total consolidated
|
$
|
1,624
|
|
$
|
1,909
|
|
$
|
5,034
|
|
$
|
5,805
|
|
$
|
129
|
|
$
|
139
|
|
$
|
391
|
|
$
|
474
|
|
|||||||
Segment Adjusted EBITDA
Through March 31, 2012, the Company evaluated performance based on Adjusted EBITDA on a consolidated basis as a performance measure and for planning and forecasting activities. Effective April 1, 2012, the Company began utilizing Adjusted EBITDA as a key performance measure considering key transformation efforts including the sale of the Company's lighting business completed
22
on August 1, 2012. Adjusted EBITDA by segment for the three and nine months ended September 30, 2012 and 2011 is presented below:
|
Adjusted EBITDA
|
|||||||||||||||
|
Three Months Ended
|
Nine Months Ended
|
||||||||||||||
|
September 30
|
September 30
|
||||||||||||||
|
2012
|
2011
|
2012
|
2011
|
||||||||||||
|
(Dollars in Millions)
|
|||||||||||||||
|
Climate
|
$
|
70
|
|
$
|
69
|
|
$
|
216
|
|
$
|
228
|
|
|||
|
Electronics
|
13
|
|
33
|
|
58
|
|
96
|
|
|||||||
|
Interiors
|
45
|
|
55
|
|
131
|
|
180
|
|
|||||||
|
Discontinued operations
|
3
|
|
11
|
|
27
|
|
27
|
|
|||||||
|
Total consolidated
|
$
|
131
|
|
$
|
168
|
|
$
|
432
|
|
$
|
531
|
|
|||
Adjusted EBITDA is presented as a supplemental measure of the Company's performance that management believes is useful to investors because the excluded items may vary significantly in timing or amounts and/or may obscure trends useful in evaluating and comparing the Company's operating activities across reporting periods. The Company defines Adjusted EBITDA as net income attributable to Visteon, plus net interest expense, provision for income taxes and depreciation and amortization, as further adjusted to eliminate the impact of asset impairments, gains or losses on divestitures, net restructuring expenses and other reimbursable costs, certain employee charges and benefits, reorganization items, and other non-operating gains and losses. Additionally, amounts below are inclusive of the Company's discontinued operations. Because not all companies use identical calculations this presentation of Adjusted EBITDA may not be comparable to other similarly titled measures of other companies.
Adjusted EBITDA is not a recognized term under GAAP and does not purport to be a substitute for net income as an indicator of operating performance or cash flows from operating activities as a measure of liquidity. Adjusted EBITDA has limitations as an analytical tool and is not intended to be a measure of cash flow available for management's discretionary use, as it does not consider certain cash requirements such as interest payments, tax payments and debt service requirements. In addition, the Company uses Adjusted EBITDA (i) as a factor in incentive compensation decisions, (ii) to evaluate the effectiveness of the Company's business strategies, and (iii) the Company's credit agreements use measures similar to Adjusted EBITDA to measure compliance with certain debt covenants.
A reconciliation of Adjusted EBITDA to Net income attributable to Visteon is as follows:
|
Three Months Ended
|
Nine Months Ended
|
|||||||||||||||
|
September 30
|
September 30
|
|||||||||||||||
|
2012
|
2011
|
2012
|
2011
|
|||||||||||||
|
(Dollars in Millions)
|
||||||||||||||||
|
Total Adjusted EBITDA
|
$
|
131
|
|
$
|
168
|
|
$
|
432
|
|
$
|
531
|
|
||||
|
Interest expense, net
|
13
|
|
5
|
|
28
|
|
21
|
|
||||||||
|
Loss on debt extinguishment
|
4
|
|
—
|
|
4
|
|
24
|
|
||||||||
|
Provision for income taxes
|
33
|
|
25
|
|
102
|
|
87
|
|
||||||||
|
Depreciation and amortization
|
64
|
|
81
|
|
195
|
|
232
|
|
||||||||
|
Restructuring and other expenses
|
(11
|
)
|
1
|
|
63
|
|
29
|
|
||||||||
|
Equity investment gain
|
—
|
|
—
|
|
(63
|
)
|
—
|
|
||||||||
|
Other non-operating costs, net
|
5
|
|
8
|
|
12
|
|
13
|
|
||||||||
|
Discontinued operations
|
8
|
|
7
|
|
30
|
|
19
|
|
||||||||
|
Net income attributable to Visteon
|
$
|
15
|
|
$
|
41
|
|
$
|
61
|
|
$
|
106
|
|
||||
23
Segment Operating Assets
|
|
Inventories, net
|
Property and Equipment, net
|
|||||||||||||
|
September 30
|
December 31
|
September 30
|
December 31
|
||||||||||||
|
2012
|
2011
|
2012
|
2011
|
||||||||||||
|
(Dollars in Millions)
|
|||||||||||||||
|
Climate
|
$
|
290
|
|
$
|
236
|
|
$
|
942
|
|
$
|
934
|
|
|||
|
Electronics
|
66
|
|
66
|
|
120
|
|
144
|
|
|||||||
|
Interiors
|
49
|
|
47
|
|
164
|
|
171
|
|
|||||||
|
Other
|
—
|
|
32
|
|
—
|
|
42
|
|
|||||||
|
Total product groups
|
405
|
|
381
|
|
1,226
|
|
1,291
|
|
|||||||
|
Corporate
|
3
|
|
—
|
|
52
|
|
121
|
|
|||||||
|
Total consolidated
|
$
|
408
|
|
$
|
381
|
|
$
|
1,278
|
|
$
|
1,412
|
|
|||
Other includes assets of the Company's discontinued Lighting operations as of December 31, 2011 (Inventories, net of
$31 million
and Property and equipment, net of
$42 million
). These assets were sold in connection with the sale of the Lighting business on August 1, 2012 . See Note 2, "Discontinued Operations" for further details.
On April 6, 2011, the Company completed the sale of
$500 million
aggregate principal amount of
6.75%
senior notes due April 15, 2019 (the "Original Senior Notes"). In January 2012, the Company exchanged substantially identical senior notes (the "Senior Notes") that have been registered under Securities Act of 1933, as amended, for all of the Original Senior Notes. The Senior Notes were issued under an Indenture (the “Indenture”), among the Company, the subsidiary guarantors named therein, and The Bank of New York Mellon Trust Company, N.A., as trustee. The Indenture and the form of Senior Notes provide, among other things, that the Senior Notes be senior unsecured obligations of the Company. Interest is payable on the Senior Notes on April 15 and October 15 of each year beginning on October 15, 2011 until maturity. Each of the Company’s existing and future wholly owned domestic restricted subsidiaries that guarantee debt under the Company’s revolving loan credit agreement guarantee the Senior Notes.
Guarantor Financial Statements
Certain subsidiaries of the Company (as listed below, collectively the “Guarantor Subsidiaries”) have guaranteed fully and unconditionally, on a joint and several basis, the obligation to pay principal and interest under the Company’s revolving loan credit agreement and the Senior Notes. The Guarantor Subsidiaries include: Visteon Electronics Corporation; Visteon European Holdings, Inc.; Visteon Global Treasury, Inc.; Visteon International Business Development, Inc.; Visteon International Holdings, Inc.; Visteon Global Technologies, Inc.; Visteon Systems, LLC; and VC Aviation Services, LLC.
The guarantor financial statements are comprised of the following condensed consolidating financial information:
|
•
|
The Parent Company, the issuer of the guaranteed obligations;
|
|
•
|
Guarantor subsidiaries, on a combined basis, as specified in the Indenture related to the Senior Notes;
|
|
•
|
Non-guarantor subsidiaries, on a combined basis;
|
|
•
|
Consolidating entries and eliminations representing adjustments to (a) eliminate intercompany transactions between or among the Parent Company, the guarantor subsidiaries and the non-guarantor subsidiaries, (b) eliminate the investments in subsidiaries, and (c) record consolidating entries.
|
Certain prior period amounts have been reclassified to conform to current period presentation.
24
VISTEON CORPORATION
CONDENSED CONSOLIDATING STATEMENTS OF COMPREHENSIVE INCOME
|
Three Months Ended September 30, 2012
|
|||||||||||||||||||
|
Parent Company
|
Guarantor
Subsidiaries
|
Non-Guarantor
Subsidiaries
|
Eliminations
|
Consolidated
|
|||||||||||||||
|
(Dollars in Millions)
|
|||||||||||||||||||
|
Sales
|
$
|
70
|
|
$
|
320
|
|
$
|
1,435
|
|
$
|
(201
|
)
|
$
|
1,624
|
|
||||
|
Cost of sales
|
128
|
|
265
|
|
1,303
|
|
(201
|
)
|
1,495
|
|
|||||||||
|
Gross margin
|
(58
|
)
|
55
|
|
132
|
|
—
|
|
129
|
|
|||||||||
|
Selling, general and administrative expenses
|
25
|
|
14
|
|
50
|
|
—
|
|
89
|
|
|||||||||
|
Interest expense, net
|
11
|
|
—
|
|
2
|
|
—
|
|
13
|
|
|||||||||
|
Loss on debt extinguishment
|
1
|
|
—
|
|
3
|
|
—
|
|
4
|
|
|||||||||
|
Equity in net income of non-consolidated affiliates
|
—
|
|
—
|
|
38
|
|
—
|
|
38
|
|
|||||||||
|
Restructuring and other expenses (income)
|
5
|
|
—
|
|
(16
|
)
|
—
|
|
(11
|
)
|
|||||||||
|
(Loss) income from continuing operations before income taxes and earnings of subsidiaries
|
(100
|
)
|
41
|
|
131
|
|
—
|
|
72
|
|
|||||||||
|
Provision for income taxes
|
2
|
|
—
|
|
31
|
|
—
|
|
33
|
|
|||||||||
|
(Loss) income from continuing operations before earnings of subsidiaries
|
(102
|
)
|
41
|
|
100
|
|
—
|
|
39
|
|
|||||||||
|
Equity in earnings of consolidated subsidiaries
|
120
|
|
70
|
|
—
|
|
(190
|
)
|
—
|
|
|||||||||
|
Income from continuing operations
|
18
|
|
111
|
|
100
|
|
(190
|
)
|
39
|
|
|||||||||
|
(Loss) income from discontinued operations, net of tax
|
(3
|
)
|
4
|
|
(6
|
)
|
—
|
|
(5
|
)
|
|||||||||
|
Net income
|
15
|
|
115
|
|
94
|
|
(190
|
)
|
34
|
|
|||||||||
|
Net income attributable to non-controlling interests
|
—
|
|
—
|
|
19
|
|
—
|
|
19
|
|
|||||||||
|
Net income attributable to Visteon Corporation
|
$
|
15
|
|
$
|
115
|
|
$
|
75
|
|
$
|
(190
|
)
|
$
|
15
|
|
||||
|
Comprehensive income:
|
|||||||||||||||||||
|
Comprehensive income
|
$
|
61
|
|
$
|
165
|
|
$
|
157
|
|
$
|
(287
|
)
|
$
|
96
|
|
||||
|
Comprehensive income attributable to Visteon Corporation
|
$
|
61
|
|
$
|
165
|
|
$
|
124
|
|
$
|
(287
|
)
|
$
|
63
|
|
||||
|
Three Months Ended September 30, 2011
|
|||||||||||||||||||
|
Parent Company
|
Guarantor
Subsidiaries
|
Non-Guarantor
Subsidiaries
|
Eliminations
|
Consolidated
|
|||||||||||||||
|
(Dollars in Millions)
|
|||||||||||||||||||
|
Sales
|
$
|
50
|
|
$
|
377
|
|
$
|
1,790
|
|
$
|
(308
|
)
|
$
|
1,909
|
|
||||
|
Cost of sales
|
94
|
|
318
|
|
1,666
|
|
(308
|
)
|
1,770
|
|
|||||||||
|
Gross margin
|
(44
|
)
|
59
|
|
124
|
|
—
|
|
139
|
|
|||||||||
|
Selling, general and administrative expenses
|
25
|
|
17
|
|
53
|
|
—
|
|
95
|
|
|||||||||
|
Interest expense (income), net
|
10
|
|
(5
|
)
|
—
|
|
—
|
|
5
|
|
|||||||||
|
Equity in net income of non-consolidated affiliates
|
—
|
|
—
|
|
43
|
|
—
|
|
43
|
|
|||||||||
|
Restructuring and other expenses
|
—
|
|
—
|
|
1
|
|
—
|
|
1
|
|
|||||||||
|
(Loss) income from continuing operations before income taxes and earnings of subsidiaries
|
(79
|
)
|
47
|
|
113
|
|
—
|
|
81
|
|
|||||||||
|
Provision for income taxes
|
6
|
|
—
|
|
19
|
|
—
|
|
25
|
|
|||||||||
|
(Loss) income from continuing operations before earnings of subsidiaries
|
(85
|
)
|
47
|
|
94
|
|
—
|
|
56
|
|
|||||||||
|
Equity in earnings of consolidated subsidiaries
|
133
|
|
15
|
|
—
|
|
(148
|
)
|
—
|
|
|||||||||
|
Income from continuing operations
|
48
|
|
62
|
|
94
|
|
(148
|
)
|
56
|
|
|||||||||
|
(Loss) income from discontinued operations, net of tax
|
(7
|
)
|
14
|
|
(3
|
)
|
—
|
|
4
|
|
|||||||||
|
Net income
|
41
|
|
76
|
|
91
|
|
(148
|
)
|
60
|
|
|||||||||
|
Net income attributable to non-controlling interests
|
—
|
|
—
|
|
19
|
|
—
|
|
19
|
|
|||||||||
|
Net income attributable to Visteon Corporation
|
$
|
41
|
|
$
|
76
|
|
$
|
72
|
|
$
|
(148
|
)
|
$
|
41
|
|
||||
|
Comprehensive loss:
|
|||||||||||||||||||
|
Comprehensive loss
|
$
|
(84
|
)
|
$
|
(65
|
)
|
$
|
(48
|
)
|
$
|
95
|
|
$
|
(102
|
)
|
||||
|
Comprehensive loss attributable to Visteon Corporation
|
$
|
(84
|
)
|
$
|
(65
|
)
|
$
|
(30
|
)
|
$
|
95
|
|
$
|
(84
|
)
|
||||
25
|
Nine Months Ended September 30, 2012
|
|||||||||||||||||||
|
Parent Company
|
Guarantor
Subsidiaries
|
Non-Guarantor
Subsidiaries
|
Eliminations
|
Consolidated
|
|||||||||||||||
|
(Dollars in Millions)
|
|||||||||||||||||||
|
Sales
|
$
|
172
|
|
$
|
1,038
|
|
$
|
4,627
|
|
$
|
(803
|
)
|
$
|
5,034
|
|
||||
|
Cost of sales
|
347
|
|
856
|
|
4,243
|
|
(803
|
)
|
4,643
|
|
|||||||||
|
Gross margin
|
(175
|
)
|
182
|
|
384
|
|
—
|
|
391
|
|
|||||||||
|
Selling, general and administrative expenses
|
59
|
|
47
|
|
161
|
|
—
|
|
267
|
|
|||||||||
|
Interest expense (income), net
|
30
|
|
(2
|
)
|
—
|
|
—
|
|
28
|
|
|||||||||
|
Loss on debt extinguishment
|
1
|
|
—
|
|
3
|
|
—
|
|
4
|
|
|||||||||
|
Equity in net income of non-consolidated affiliates
|
—
|
|
—
|
|
183
|
|
—
|
|
183
|
|
|||||||||
|
Restructuring and other expenses
|
21
|
|
—
|
|
42
|
|
—
|
|
63
|
|
|||||||||
|
(Loss) income from continuing operations before income taxes and earnings of subsidiaries
|
(286
|
)
|
137
|
|
361
|
|
—
|
|
212
|
|
|||||||||
|
Provision for income taxes
|
3
|
|
—
|
|
99
|
|
—
|
|
102
|
|
|||||||||
|
(Loss) income from continuing operations before earnings of subsidiaries
|
(289
|
)
|
137
|
|
262
|
|
—
|
|
110
|
|
|||||||||
|
Equity in earnings of consolidated subsidiaries
|
365
|
|
189
|
|
—
|
|
(554
|
)
|
—
|
|
|||||||||
|
Income from continuing operations
|
76
|
|
326
|
|
262
|
|
(554
|
)
|
110
|
|
|||||||||
|
(Loss) income from discontinued operations, net of tax
|
(15
|
)
|
42
|
|
(30
|
)
|
—
|
|
(3
|
)
|
|||||||||
|
Net income
|
61
|
|
368
|
|
232
|
|
(554
|
)
|
107
|
|
|||||||||
|
Net income attributable to non-controlling interests
|
—
|
|
—
|
|
46
|
|
—
|
|
46
|
|
|||||||||
|
Net income attributable to Visteon Corporation
|
$
|
61
|
|
$
|
368
|
|
$
|
186
|
|
$
|
(554
|
)
|
$
|
61
|
|
||||
|
Comprehensive income:
|
|||||||||||||||||||
|
Comprehensive income
|
$
|
103
|
|
$
|
412
|
|
$
|
294
|
|
$
|
(646
|
)
|
$
|
163
|
|
||||
|
Comprehensive income attributable to Visteon Corporation
|
$
|
103
|
|
$
|
412
|
|
$
|
234
|
|
$
|
(646
|
)
|
$
|
103
|
|
||||
|
Nine Months Ended September 30, 2011
|
|||||||||||||||||||
|
Parent Company
|
Guarantor
Subsidiaries
|
Non-Guarantor
Subsidiaries
|
Eliminations
|
Consolidated
|
|||||||||||||||
|
(Dollars in Millions)
|
|||||||||||||||||||
|
Sales
|
$
|
138
|
|
$
|
1,149
|
|
$
|
5,436
|
|
$
|
(918
|
)
|
$
|
5,805
|
|
||||
|
Cost of sales
|
301
|
|
916
|
|
5,032
|
|
(918
|
)
|
5,331
|
|
|||||||||
|
Gross margin
|
(163
|
)
|
233
|
|
404
|
|
—
|
|
474
|
|
|||||||||
|
Selling, general and administrative expenses
|
75
|
|
48
|
|
168
|
|
—
|
|
291
|
|
|||||||||
|
Interest expense (income), net
|
30
|
|
(10
|
)
|
1
|
|
—
|
|
21
|
|
|||||||||
|
Loss on debt extinguishment
|
24
|
|
—
|
|
—
|
|
—
|
|
24
|
|
|||||||||
|
Equity in net income of non-consolidated affiliates
|
—
|
|
—
|
|
130
|
|
—
|
|
130
|
|
|||||||||
|
Restructuring and other expenses
|
11
|
|
—
|
|
18
|
|
—
|
|
29
|
|
|||||||||
|
(Loss) income from continuing operations before income taxes and earnings of subsidiaries
|
(303
|
)
|
195
|
|
347
|
|
—
|
|
239
|
|
|||||||||
|
Provision (benefit) for income taxes
|
1
|
|
(2
|
)
|
88
|
|
—
|
|
87
|
|
|||||||||
|
(Loss) income from continuing operations before earnings of subsidiaries
|
(304
|
)
|
197
|
|
259
|
|
—
|
|
152
|
|
|||||||||
|
Equity in earnings of consolidated subsidiaries
|
431
|
|
162
|
|
—
|
|
(593
|
)
|
—
|
|
|||||||||
|
Income from continuing operations
|
127
|
|
359
|
|
259
|
|
(593
|
)
|
152
|
|
|||||||||
|
(Loss) income from discontinued operations, net of tax
|
(21
|
)
|
41
|
|
(12
|
)
|
—
|
|
8
|
|
|||||||||
|
Net income
|
106
|
|
400
|
|
247
|
|
(593
|
)
|
160
|
|
|||||||||
|
Net income attributable to non-controlling interests
|
—
|
|
—
|
|
54
|
|
—
|
|
54
|
|
|||||||||
|
Net income attributable to Visteon Corporation
|
$
|
106
|
|
$
|
400
|
|
$
|
193
|
|
$
|
(593
|
)
|
$
|
106
|
|
||||
|
Comprehensive income:
|
|||||||||||||||||||
|
Comprehensive income
|
$
|
74
|
|
$
|
367
|
|
$
|
192
|
|
$
|
(523
|
)
|
$
|
110
|
|
||||
|
Comprehensive income attributable to Visteon Corporation
|
$
|
74
|
|
$
|
367
|
|
$
|
156
|
|
$
|
(523
|
)
|
$
|
74
|
|
||||
26
VISTEON CORPORATION
CONDENSED CONSOLIDATING BALANCE SHEETS
|
September 30, 2012
|
|||||||||||||||||||
|
Parent Company
|
Guarantor
Subsidiaries
|
Non-Guarantor
Subsidiaries
|
Eliminations
|
Consolidated
|
|||||||||||||||
|
(Dollars in Millions)
|
|||||||||||||||||||
|
ASSETS
|
|||||||||||||||||||
|
Cash and equivalents
|
$
|
296
|
|
$
|
52
|
|
$
|
553
|
|
$
|
—
|
|
$
|
901
|
|
||||
|
Accounts receivable, net
|
296
|
|
657
|
|
1,119
|
|
(904
|
)
|
1,168
|
|
|||||||||
|
Inventories
|
15
|
|
24
|
|
369
|
|
—
|
|
408
|
|
|||||||||
|
Other current assets
|
18
|
|
30
|
|
236
|
|
—
|
|
284
|
|
|||||||||
|
Total current assets
|
625
|
|
763
|
|
2,277
|
|
(904
|
)
|
2,761
|
|
|||||||||
|
Property and equipment, net
|
21
|
|
63
|
|
1,194
|
|
—
|
|
1,278
|
|
|||||||||
|
Investment in affiliates
|
2,048
|
|
1,640
|
|
—
|
|
(3,688
|
)
|
—
|
|
|||||||||
|
Equity in net assets of non-consolidated affiliates
|
—
|
|
—
|
|
734
|
|
—
|
|
734
|
|
|||||||||
|
Intangible assets, net
|
78
|
|
48
|
|
198
|
|
—
|
|
324
|
|
|||||||||
|
Other non-current assets
|
9
|
|
1
|
|
67
|
|
(4
|
)
|
73
|
|
|||||||||
|
Total assets
|
$
|
2,781
|
|
$
|
2,515
|
|
$
|
4,470
|
|
$
|
(4,596
|
)
|
$
|
5,170
|
|
||||
|
LIABILITIES AND SHAREHOLDERS’ EQUITY
|
|||||||||||||||||||
|
Short-term debt, including current portion of long-term debt
|
$
|
226
|
|
$
|
20
|
|
$
|
218
|
|
$
|
(375
|
)
|
$
|
89
|
|
||||
|
Accounts payable
|
200
|
|
174
|
|
1,229
|
|
(526
|
)
|
1,077
|
|
|||||||||
|
Other current liabilities
|
74
|
|
35
|
|
305
|
|
(4
|
)
|
410
|
|
|||||||||
|
Total current liabilities
|
500
|
|
229
|
|
1,752
|
|
(905
|
)
|
1,576
|
|
|||||||||
|
Long-term debt
|
499
|
|
—
|
|
12
|
|
(5
|
)
|
506
|
|
|||||||||
|
Employee benefits
|
238
|
|
30
|
|
145
|
|
—
|
|
413
|
|
|||||||||
|
Other non-current liabilities
|
45
|
|
6
|
|
402
|
|
—
|
|
453
|
|
|||||||||
|
Shareholders’ equity:
|
|||||||||||||||||||
|
Total Visteon Corporation shareholders’ equity
|
1,499
|
|
2,250
|
|
1,436
|
|
(3,686
|
)
|
1,499
|
|
|||||||||
|
Non-controlling interests
|
—
|
|
—
|
|
723
|
|
—
|
|
723
|
|
|||||||||
|
Total shareholders’ equity
|
1,499
|
|
2,250
|
|
2,159
|
|
(3,686
|
)
|
2,222
|
|
|||||||||
|
Total liabilities and shareholders’ equity
|
$
|
2,781
|
|
$
|
2,515
|
|
$
|
4,470
|
|
$
|
(4,596
|
)
|
$
|
5,170
|
|
||||
27
|
December 31, 2011
|
|||||||||||||||||||
|
Parent Company
|
Guarantor
Subsidiaries
|
Non-Guarantor
Subsidiaries
|
Eliminations
|
Consolidated
|
|||||||||||||||
|
(Dollars in Millions)
|
|||||||||||||||||||
|
ASSETS
|
|||||||||||||||||||
|
Cash and equivalents
|
$
|
114
|
|
$
|
55
|
|
$
|
554
|
|
$
|
—
|
|
$
|
723
|
|
||||
|
Accounts receivable, net
|
235
|
|
540
|
|
1,015
|
|
(719
|
)
|
1,071
|
|
|||||||||
|
Inventories
|
18
|
|
25
|
|
338
|
|
—
|
|
381
|
|
|||||||||
|
Other current assets
|
29
|
|
53
|
|
237
|
|
—
|
|
319
|
|
|||||||||
|
Total current assets
|
396
|
|
673
|
|
2,144
|
|
(719
|
)
|
2,494
|
|
|||||||||
|
|
|
|
|
|
|||||||||||||||
|
Property and equipment, net
|
89
|
|
81
|
|
1,242
|
|
—
|
|
1,412
|
|
|||||||||
|
Investment in affiliates
|
1,873
|
|
1,533
|
|
—
|
|
(3,406
|
)
|
—
|
|
|||||||||
|
Equity in net assets of non-consolidated affiliates
|
—
|
|
—
|
|
644
|
|
—
|
|
644
|
|
|||||||||
|
Intangible assets, net
|
82
|
|
59
|
|
212
|
|
—
|
|
353
|
|
|||||||||
|
Other non-current assets
|
14
|
|
23
|
|
55
|
|
(26
|
)
|
66
|
|
|||||||||
|
Total assets
|
$
|
2,454
|
|
$
|
2,369
|
|
$
|
4,297
|
|
$
|
(4,151
|
)
|
$
|
4,969
|
|
||||
|
|
|
|
|
|
|
|
|
||||||||||||
|
LIABILITIES AND SHAREHOLDERS’ EQUITY
|
|
|
|
|
|
|
|
|
|||||||||||
|
Short-term debt, including current portion of long-term debt
|
$
|
90
|
|
$
|
13
|
|
$
|
217
|
|
$
|
(233
|
)
|
$
|
87
|
|
||||
|
Accounts payable
|
170
|
|
210
|
|
1,116
|
|
(486
|
)
|
1,010
|
|
|||||||||
|
Other current liabilities
|
70
|
|
21
|
|
365
|
|
—
|
|
456
|
|
|||||||||
|
Total current liabilities
|
330
|
|
244
|
|
1,698
|
|
(719
|
)
|
1,553
|
|
|||||||||
|
|
|
|
|
|
|||||||||||||||
|
Long-term debt
|
497
|
|
—
|
|
41
|
|
(26
|
)
|
512
|
|
|||||||||
|
Employee benefits
|
301
|
|
47
|
|
147
|
|
—
|
|
495
|
|
|||||||||
|
Other non-current liabilities
|
19
|
|
5
|
|
388
|
|
—
|
|
412
|
|
|||||||||
|
Shareholders’ equity:
|
|
|
|
|
|
||||||||||||||
|
Total Visteon Corporation shareholders’ equity
|
1,307
|
|
2,073
|
|
1,333
|
|
(3,406
|
)
|
1,307
|
|
|||||||||
|
Non-controlling interests
|
—
|
|
—
|
|
690
|
|
—
|
|
690
|
|
|||||||||
|
Total shareholders’ equity
|
1,307
|
|
2,073
|
|
2,023
|
|
(3,406
|
)
|
1,997
|
|
|||||||||
|
Total liabilities and shareholders’ equity
|
$
|
2,454
|
|
$
|
2,369
|
|
$
|
4,297
|
|
$
|
(4,151
|
)
|
$
|
4,969
|
|
||||
28
VISTEON CORPORATION
CONDENSED CONSOLIDATING STATEMENTS OF CASH FLOWS
|
Nine Months Ended September 30, 2012
|
|||||||||||||||||||
|
Parent Company
|
Guarantor
Subsidiaries
|
Non-
Guarantor
Subsidiaries
|
Eliminations
|
Consolidated
|
|||||||||||||||
|
(Dollars in Millions)
|
|||||||||||||||||||
|
Net cash (used by) provided from operating activities
|
$
|
(75
|
)
|
$
|
101
|
|
$
|
137
|
|
$
|
—
|
|
$
|
163
|
|
||||
|
Investing activities
|
|||||||||||||||||||
|
Capital expenditures
|
(4
|
)
|
(8
|
)
|
(134
|
)
|
—
|
|
(146
|
)
|
|||||||||
|
Dividends received from consolidated subsidiaries
|
169
|
|
63
|
|
—
|
|
(232
|
)
|
—
|
|
|||||||||
|
Proceeds from business divestitures
|
14
|
|
—
|
|
86
|
|
—
|
|
100
|
|
|||||||||
|
Proceeds from asset sales
|
79
|
|
8
|
|
1
|
|
—
|
|
88
|
|
|||||||||
|
Other
|
—
|
|
—
|
|
(2
|
)
|
—
|
|
(2
|
)
|
|||||||||
|
Net cash provided from (used by) investing activities
|
258
|
|
63
|
|
(49
|
)
|
(232
|
)
|
40
|
|
|||||||||
|
Financing activities
|
|
|
|
|
|
||||||||||||||
|
Short-term debt, net
|
—
|
|
—
|
|
2
|
|
—
|
|
2
|
|
|||||||||
|
Proceeds from issuance of debt, net of issuance costs
|
—
|
|
—
|
|
812
|
|
—
|
|
812
|
|
|||||||||
|
Principal payments on debt
|
(1
|
)
|
—
|
|
(823
|
)
|
—
|
|
(824
|
)
|
|||||||||
|
Dividends paid to consolidated subsidiaries
|
—
|
|
(168
|
)
|
(64
|
)
|
232
|
|
—
|
|
|||||||||
|
Dividends to non-controlling interests
|
—
|
|
—
|
|
(23
|
)
|
—
|
|
(23
|
)
|
|||||||||
|
Net cash used by financing activities
|
(1
|
)
|
(168
|
)
|
(96
|
)
|
232
|
|
(33
|
)
|
|||||||||
|
Effect of exchange rate changes on cash and equivalents
|
—
|
|
1
|
|
7
|
|
—
|
|
8
|
|
|||||||||
|
Net increase (decrease) in cash and equivalents
|
182
|
|
(3
|
)
|
(1
|
)
|
—
|
|
178
|
|
|||||||||
|
Cash and equivalents at beginning of period
|
114
|
|
55
|
|
554
|
|
—
|
|
723
|
|
|||||||||
|
Cash and equivalents at end of period
|
$
|
296
|
|
$
|
52
|
|
$
|
553
|
|
$
|
—
|
|
$
|
901
|
|
||||
29
|
Nine Months Ended September 30, 2011
|
||||||||||||||||||||
|
Parent Company
|
Guarantor
Subsidiaries
|
Non-
Guarantor
Subsidiaries
|
Eliminations
|
Consolidated
|
||||||||||||||||
|
(Dollars in Millions)
|
||||||||||||||||||||
|
Net cash (used by) provided from operating activities
|
$
|
(120
|
)
|
$
|
(76
|
)
|
$
|
251
|
|
$
|
—
|
|
$
|
55
|
|
|||||
|
Investing activities
|
||||||||||||||||||||
|
Capital expenditures
|
(3
|
)
|
(10
|
)
|
(172
|
)
|
—
|
|
(185
|
)
|
||||||||||
|
Dividends received from consolidated subsidiaries
|
57
|
|
149
|
|
—
|
|
(206
|
)
|
—
|
|
||||||||||
|
Proceeds from asset sales
|
—
|
|
—
|
|
11
|
|
—
|
|
11
|
|
||||||||||
|
Other
|
—
|
|
—
|
|
(13
|
)
|
—
|
|
(13
|
)
|
||||||||||
|
Net cash provided from (used by) investing activities
|
54
|
|
139
|
|
(174
|
)
|
(206
|
)
|
(187
|
)
|
||||||||||
|
Financing activities
|
||||||||||||||||||||
|
Cash restriction, net
|
55
|
|
—
|
|
(3
|
)
|
—
|
|
52
|
|
||||||||||
|
Short term debt, net
|
—
|
|
—
|
|
11
|
|
—
|
|
11
|
|
||||||||||
|
Proceeds from issuance of debt, net of issuance costs
|
492
|
|
—
|
|
11
|
|
—
|
|
503
|
|
||||||||||
|
Principal payments on debt
|
(501
|
)
|
—
|
|
(12
|
)
|
—
|
|
(513
|
)
|
||||||||||
|
Dividends paid to consolidated subsidiaries
|
—
|
|
(57
|
)
|
(149
|
)
|
206
|
|
—
|
|
||||||||||
|
Rights offering fees
|
(33
|
)
|
—
|
|
—
|
|
—
|
|
(33
|
)
|
||||||||||
|
Dividends to non-controlling interests
|
—
|
|
—
|
|
(29
|
)
|
—
|
|
(29
|
)
|
||||||||||
|
Other
|
3
|
|
—
|
|
—
|
|
—
|
|
3
|
|
||||||||||
|
Net cash provided from (used by) financing activities
|
16
|
|
(57
|
)
|
(171
|
)
|
206
|
|
(6
|
)
|
||||||||||
|
Effect of exchange rate changes on cash and equivalents
|
—
|
|
1
|
|
(10
|
)
|
—
|
|
(9
|
)
|
||||||||||
|
Net (decrease) increase in cash and equivalents
|
(50
|
)
|
7
|
|
(104
|
)
|
—
|
|
(147
|
)
|
||||||||||
|
Cash and equivalents at beginning of period
|
153
|
|
81
|
|
671
|
|
—
|
|
905
|
|
||||||||||
|
Cash and equivalents at end of period
|
$
|
103
|
|
$
|
88
|
|
$
|
567
|
|
$
|
—
|
|
$
|
758
|
|
|||||
30
|
ITEM 2.
|
MANAGEMENT’S DISCUSSION AND ANALYSIS OF FINANCIAL CONDITION AND RESULTS OF OPERATIONS
|
Management’s Discussion and Analysis (“MD&A”) is intended to help the reader understand the results of operations, financial condition and cash flows of Visteon Corporation (“Visteon” or the “Company”). MD&A is provided as a supplement to, and should be read in conjunction with, the Company’s Annual Report on Form 10-K for the fiscal year ended December 31, 2011, as filed with the Securities and Exchange Commission on February 27, 2011 and the financial statements and accompanying notes to the financial statements included elsewhere herein.
Executive Summary
Description of Business
Visteon is a global supplier of climate, electronics, and interiors systems, modules and components to automotive original equipment manufacturers (“OEMs”) including BMW, Chrysler, Daimler, Ford, General Motors, Honda, Hyundai, Kia, Nissan, PSA Peugeot Citroën, Renault, Toyota and Volkswagen. The Company has a broad network of manufacturing operations, technical centers and joint venture operations throughout the world, supported by approximately 22,000 employees dedicated to the design, development, manufacture and support of its product offering and its global customers.
Automotive Industry
The Company conducts its business in the automotive industry, which is capital intensive, highly competitive and sensitive to economic conditions. During the first nine months of 2012, the global automotive industry experienced modest growth fueled by demand from certain emerging markets, which, along with improvements in North America and Asia light vehicle sales and production, more than offset declines in Europe and South America. Light vehicle sales and production levels by geographic region are provided below for the three and nine-month periods ended September 30, 2012 and 2011.
|
Light Vehicle Sales
|
Light Vehicle Production
|
Light Vehicle Sales
|
Light Vehicle Production
|
||||||||||||||||||||||||||||||||
|
Three Months Ended September 30
|
Three Months Ended September 30
|
Nine Months Ended September 30
|
Nine Months Ended September 30
|
||||||||||||||||||||||||||||||||
|
2012
|
2011
|
Change
|
2012
|
2011
|
Change
|
2012
|
2011
|
Change
|
2012
|
2011
|
Change
|
||||||||||||||||||||||||
|
(Production Units in Millions)
|
|||||||||||||||||||||||||||||||||||
|
Global
|
19.5
|
|
18.5
|
|
5.4
|
%
|
19.1
|
|
18.8
|
|
1.7
|
%
|
59.7
|
|
56.4
|
|
5.9
|
%
|
60.8
|
|
56.8
|
|
7.0
|
%
|
|||||||||||
|
North America
|
4.2
|
|
3.8
|
|
10.9
|
%
|
3.6
|
|
3.2
|
|
14.1
|
%
|
12.8
|
|
11.4
|
|
12.9
|
%
|
11.6
|
|
9.7
|
|
19.6
|
%
|
|||||||||||
|
South America
|
1.7
|
|
1.5
|
|
13.5
|
%
|
1.2
|
|
1.1
|
|
1.7
|
%
|
4.4
|
|
4.1
|
|
5.8
|
%
|
3.1
|
|
3.3
|
|
(4.8
|
)%
|
|||||||||||
|
Europe
|
4.3
|
|
4.5
|
|
(4.8
|
)%
|
4.3
|
|
4.5
|
|
(5.9
|
)%
|
14.0
|
|
14.6
|
|
(4.5
|
)%
|
14.5
|
|
15.2
|
|
(4.3
|
)%
|
|||||||||||
|
China
|
4.6
|
|
4.1
|
|
10.9
|
%
|
4.3
|
|
4.1
|
|
6.0
|
%
|
13.8
|
|
12.9
|
|
7.1
|
%
|
13.3
|
|
12.6
|
|
6.1
|
%
|
|||||||||||
|
Japan/Korea
|
1.7
|
|
1.5
|
|
9.0
|
%
|
3.2
|
|
3.3
|
|
(2.4
|
)%
|
5.3
|
|
4.2
|
|
26.0
|
%
|
10.6
|
|
8.8
|
|
20.7
|
%
|
|||||||||||
|
India
|
0.8
|
|
0.7
|
|
9.5
|
%
|
0.9
|
|
0.9
|
|
(2.6
|
)%
|
2.5
|
|
2.3
|
|
11.2
|
%
|
2.9
|
|
2.7
|
|
4.7
|
%
|
|||||||||||
|
ASEAN
|
0.7
|
|
0.7
|
|
7.9
|
%
|
1.0
|
|
0.8
|
|
19.4
|
%
|
2.1
|
|
1.9
|
|
7.2
|
%
|
2.8
|
|
2.4
|
|
20.6
|
%
|
|||||||||||
|
Source: IHS Automotive
|
|||||||||||||||||||||||||||||||||||
North America light vehicle sales increased during the three and nine-month periods ended September 30, 2012. Higher sales levels and inventory restocking by Japanese OEMs have contributed to increased production levels in North America. European light vehicle production and sales were lower in the three and nine-month periods ended September 30, 2012 as weakened economic conditions resulting from the region's continuing sovereign-debt crisis weighed on consumer confidence. Production overcapacity in Europe has prompted certain OEMs to announce significant production cuts and plant closures, which are expected to result in further declines in the last quarter of 2012. Light vehicle production in South America decreased during the nine-month period ended September 30, 2012, reflecting lower sales on weak demand for vehicles in Brazil and Argentina. However, favorable bank lending programs and government tax incentives caused an increase in automotive sales and production in Brazil during the three months ended September 30, 2012. Further deterioration of market conditions, primarily in Europe, resulting in a sustained adverse impact on the global automotive sector could adversely impact the Company’s financial results, including potential asset impairments and restructuring charges.
31
Financial Results Summary
The Company's sales for the three and nine-month periods ended September 30, 2012 were distributed by product group, geographic region, and customer as follows:
Three Months Ended September 30, 2012
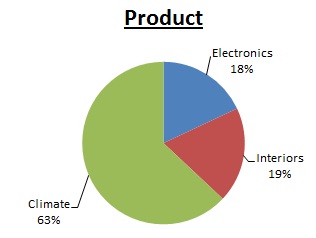
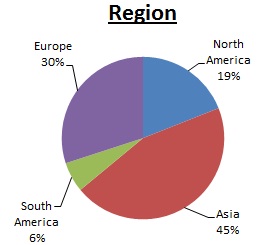
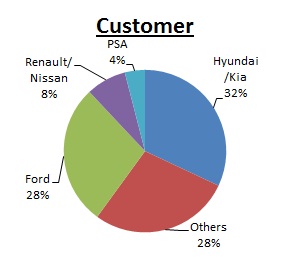
Nine Months Ended September 30, 2012
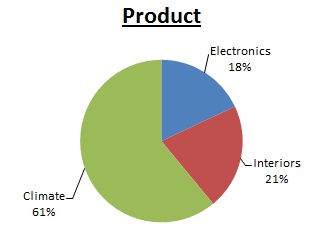
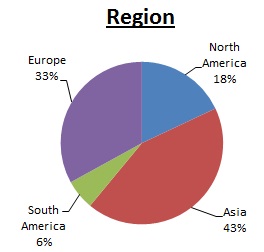
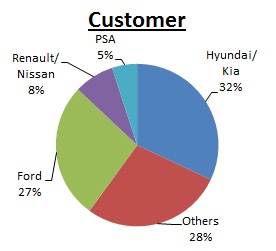
Visteon recorded net sales of $1,624 million for the third quarter of 2012, a decrease of $285 million from the same period in 2011. For the nine months ended September 30, 2012, the Company recorded sales of $5,034 million, a decrease of $771 million compared to 2011. The deconsolidation of Duckyang Industry Co. Ltd., a Korean interiors joint venture, decreased sales by $178 million and $479 million for the three and nine months ended September 30, 2012, respectively. Sales for the three and nine months ended September 30, 2012 were also impacted by unfavorable currency of $131 million and $272 million, respectively. Higher production volumes for the Climate product group, primarily in North America and Asia, were partially offset by declines for the Interiors and Electronics product groups in Europe and South America. Customer pricing and the non-recurrence of customer agreements, contributed to the remaining decreases in sales for the three and nine months ended September 30, 2012.
For the third quarter of 2012, the Company reported net income attributable to Visteon of $15 million, or $0.28 per diluted share. For the nine months ended September 30, 2012, the Company reported net income attributable to Visteon of $61 million, or $1.14 per diluted share. Net income for the nine months ended September 30, 2012 included $63 million of equity in the net income of non-consolidated affiliates due to a non-cash gain at Yanfeng Visteon Automotive Trim Systems Co. Ltd ("Yanfeng") related to the excess of fair value over carrying value of a former equity investee that was consolidated effective June 1, 2012 pursuant to changes in the underlying joint venture agreement.
For the nine months ended September 30, 2012 and 2011 cash provided from operating activities was $163 million and $55 million, respectively. As of September 30, 2012, Visteon had global cash balances of $920 million, including $19 million of restricted cash. Total debt was $595 million as of September 30, 2012.
Strategic Transformation
On May 28, 2009, Visteon and certain of its U.S. subsidiaries (the “Debtors”) filed voluntary petitions for reorganization relief under chapter 11 of the United States Bankruptcy Code (the “Bankruptcy Code”) in the United States Bankruptcy Court for the District of Delaware (the “Court”) (the “Chapter 11 Proceedings”) in response to sudden and severe declines in global automotive production during the latter part of 2008 and early 2009 and the resulting adverse impact on the Company’s cash flows and liquidity. On August 31, 2010 (the “Confirmation Date”), the Court entered an order (the “Confirmation Order”) confirming the Debtors’
32
joint plan of reorganization (as amended and supplemented, the “Plan”). On October 1, 2010 (the “Effective Date”), all conditions precedent to the effectiveness of the Plan and related documents were satisfied or waived and the Company emerged from bankruptcy and became a new entity for financial reporting purposes. Accordingly, the consolidated financial statements for the reporting entity subsequent to the Effective Date (the “Successor”) are not comparable to the consolidated financial statements for the reporting entity prior to the Effective Date (the “Predecessor”).
Following emergence from the Chapter 11 Proceedings, the Company continued its efforts to transform its business portfolio and to rationalize its cost structure including, among other things, the investigation of potential transactions for the sale, merger or other combination of certain businesses. Related business transformation costs of $5 million and $23 million were incurred during the three and nine months ended September 30, 2012, respectively, which relate to financial and advisory fees associated with the Company's continued efforts to transform its business portfolio and to rationalize its cost structure. Transformation activities during the three months ended September 30, 2012 included the following:
|
•
|
On August 31, 2012, Visteon completed the sale of its 50% ownership interest in R-Tek Ltd., a UK-based Interiors joint venture, for proceeds of approximately $30 million, resulting in a net gain on the sale of approximately $19 million.
|
|
•
|
On August 1, 2012 the Company completed the sale of its Lighting business for cash proceeds of approximately $70 million, subject to purchase price adjustments.
|
|
•
|
On July 4, 2012 Visteon, through its wholly-owned Korean subsidiary, Visteon Korea Holdings Corp., commenced a cash tender offer to purchase the remaining 30 percent (32.0 million shares) of its 70% owned affiliate, Halla Climate Control Corporation ("Halla"), for 913 billion Korean Won ("KRW") or approximately $805 million. On July 24, 2012 the tender offer expired without acceptance of the tendered shares.
|
|
•
|
In July 2012, Visteon and Yanfeng, a 50% owned non-consolidated affiliate of the Company, terminated their non-binding memorandum of understanding signed by the parties in late 2011 with respect to a potential transaction that would have combined the majority of Visteon’s Interiors business with Yanfeng. The Company continues to explore sale transaction alternatives for its Interiors business.
|
On September 19, 2012, the Company announced a comprehensive shareholder value creation strategy. In connection with this strategy the Company announced its intention to combine its wholly owned climate businesses into a single climate organization under Halla. The Company anticipates completion of the climate business combination during the three months ended March 31, 2013. Additionally, on November 1, 2012 the Company announced a program designed to reduce fixed costs and to improve operational efficiency by addressing certain under-performing operations. The Company anticipates that it will record related restructuring and other charges beginning in the quarterly period ending December 31, 2012 and into 2013, as these plans are finalized.
33
Consolidated Results of Operations - Three Months Ended September 30, 2012 and 2011
The Company's consolidated results of operations for the three months ended September 30, 2012 and 2011 were as follows:
|
Three Months Ended September 30
|
|||||||||||
|
2012
|
2011
|
Change
|
|||||||||
|
(Dollars in Millions)
|
|||||||||||
|
Sales
|
$
|
1,624
|
|
$
|
1,909
|
|
$
|
(285
|
)
|
||
|
Cost of sales
|
1,495
|
|
1,770
|
|
(275
|
)
|
|||||
|
Gross margin
|
129
|
|
139
|
|
(10
|
)
|
|||||
|
Selling, general and administrative expenses
|
89
|
|
95
|
|
(6
|
)
|
|||||
|
Interest expense, net
|
13
|
|
5
|
|
8
|
|
|||||
|
Loss on debt extinguishment
|
4
|
|
—
|
|
4
|
|
|||||
|
Equity in net income of non-consolidated affiliates
|
38
|
|
43
|
|
(5
|
)
|
|||||
|
Restructuring and other (income) expenses
|
(11
|
)
|
1
|
|
(12
|
)
|
|||||
|
Income before income taxes
|
72
|
|
81
|
|
(9
|
)
|
|||||
|
Provision for income taxes
|
33
|
|
25
|
|
8
|
|
|||||
|
Income from continuing operations
|
39
|
|
56
|
|
(17
|
)
|
|||||
|
(Loss) income from discontinued operations
|
(5
|
)
|
4
|
|
(9
|
)
|
|||||
|
Net income
|
34
|
|
60
|
|
(26
|
)
|
|||||
|
Net income attributable to non-controlling interests
|
19
|
|
19
|
|
—
|
|
|||||
|
Net income attributable to Visteon
|
$
|
15
|
|
$
|
41
|
|
$
|
(26
|
)
|
||
|
Adjusted EBITDA*
|
$
|
131
|
|
$
|
168
|
|
$
|
(37
|
)
|
||
|
*
Adjusted EBITDA is a Non-GAAP financial measure, as further discussed
below.
|
|||||||||||
Sales
The Company's consolidated sales totaled $1,624 million for the three-month period ended September 30, 2012, which represents a decrease of $285 million when compared to the same period of 2011. Approximately $178 million of this decrease is due to the deconsolidation of Duckyang Industry Co. Ltd ("Duckyang"), an Interiors joint venture, which resulted from the October 2011 sale of a controlling ownership interest in the entity. Unfavorable currency of $131 million, primarily attributable to the Euro and Korean Won currencies, also contributed to the decline. Production volumes increased sales by $33 million, primarily associated with Asia and North America partially offset by declines in Europe. Additionally, other reductions of $9 million were associated with price productivity net of design actions and commercial agreements.
Gross Margin
The Company recorded gross margin of $129 million for the three-month period ended September 30, 2012 compared to $139 million for the same period of 2011. The decrease in gross margin of $10 million was associated with unfavorable currency of $21 million, unfavorable product mix of $18 million, and the impact of the Duckyang deconsolidation of $2 million. Favorable manufacturing cost performance of $15 million, lower depreciation and amortization expense of $13 million and other reductions including customer recoveries of $9 million, were partial offsets. Favorable manufacturing cost performance was primarily driven by increases in cost recoveries and material and manufacturing efficiencies in excess of price productivity.
Selling, General and Administrative Expenses
Selling, general, and administrative expenses were $89 million and $95 million during the three-month periods ended September 30, 2012 and 2011, respectively. The decrease of $6 million was primarily due to lower compensation costs and favorable foreign currency, partially offset by higher professional fees, corporate office rent expense, and bad debt expense.
34
Interest Expense, Net
Interest expense for the three-month period ended September 30, 2012 of $17 million included $8 million on the 6.75% senior notes due April 15, 2019, $5 million related to the Korean Bridge Loan, and $4 million associated with affiliate debt, commitment fees and amortization of debt issuance costs. During the three-month period ended September 30, 2011, interest expense was $10 million, including $8 million on the 6.75% senior notes due April 15, 2019 and $2 million associated with affiliate debt, commitment fees and amortization of debt issuance costs. Interest income of $4 million for three months ended September 30, 2012 decreased by $1 million when compared to $5 million for the same period of 2011 due to lower average cash balances and rates.
Loss on Debt Extinguishment
Loss on debt extinguishment of $4 million for the three months ended September 30, 2012 was related to unamortized amounts attributable to the Korean Bridge Loan that was repaid during third quarter 2012.
Equity in Net Income of Non-consolidated Affiliates
Equity in the net income of non-consolidated affiliates totaled $38 million and $43 million for the three-month periods ended September 30, 2012 and 2011, respectively, representing a decrease of $5 million. The following table presents summarized financial data for the Company's non-consolidated affiliates. The amounts included in the table below represent 100% of the results of operations of such non-consolidated affiliates accounted for under the equity method.
|
Net Sales
|
Gross Margin
|
Net Income
|
|||||||||||||||||||||
|
Three Months Ended September 30
|
Three Months Ended September 30
|
Three Months Ended September 30
|
|||||||||||||||||||||
|
2012
|
2011
|
2012
|
2011
|
2012
|
2011
|
||||||||||||||||||
|
(Dollars in Millions)
|
|||||||||||||||||||||||
|
Yanfeng
|
$
|
1,582
|
|
$
|
740
|
|
$
|
257
|
|
$
|
125
|
|
$
|
62
|
|
$
|
68
|
|
|||||
|
All other
|
404
|
|
211
|
|
46
|
|
38
|
|
15
|
|
19
|
|
|||||||||||
|
$
|
1,986
|
|
$
|
951
|
|
$
|
303
|
|
$
|
163
|
|
$
|
77
|
|
$
|
87
|
|
||||||
Yanfeng net sales and gross margin for the three months ended September 30, 2012 include approximately $726 million and $131 million, respectively, related to a former equity investee that was consolidated effective June 1, 2012. The increase in net sales for all other non-consolidated affiliates includes $163 million related to Duckyang.
Restructuring and Other (Income) / Expenses
Restructuring and other (income) / expenses consist of the following:
|
Three Months Ended September 30
|
|||||||
|
2012
|
2011
|
||||||
|
(Dollars in Millions)
|
|||||||
|
Restructuring expenses
|
$
|
2
|
|
$
|
1
|
|
|
|
Transformation costs
|
5
|
|
—
|
|
|||
|
Bankruptcy-related costs
|
1
|
|
—
|
|
|||
|
Gain on sale of joint venture interest
|
(19
|
)
|
—
|
|
|||
|
$
|
(11
|
)
|
$
|
1
|
|
||
During the three-months ended September 30, 2012, the Company recorded $2 million of restructuring expenses associated with 15 voluntary employee separations associated with the Climate action announced in the fourth quarter of 2011.
35
The following is a summary of the Company's consolidated restructuring reserve and related activity for the three-month period ended September 30, 2012.
|
|
Electronics
|
Interiors
|
Climate
|
Total
|
|||||||||||
|
(Dollars in Millions)
|
|||||||||||||||
|
Restructuring reserve - June 30, 2012
|
$
|
1
|
|
$
|
7
|
|
$
|
1
|
|
$
|
9
|
|
|||
|
Expenses
|
—
|
|
—
|
|
2
|
|
2
|
|
|||||||
|
Utilization
|
—
|
|
(1
|
)
|
(2
|
)
|
(3
|
)
|
|||||||
|
Restructuring reserve - September 30, 2012
|
$
|
1
|
|
$
|
6
|
|
$
|
1
|
|
$
|
8
|
|
|||
Utilization of $3 million during the third quarter of 2012 represents payments of $2 million for employee severance and termination benefits related to the Climate action and $1 million reflecting consulting and legal costs related to previously announced restructuring actions. Given the economically-sensitive and highly competitive nature of the automotive industry, the Company continues to closely monitor current market factors and industry trends taking action as necessary, including but not limited to, additional restructuring actions. However, there can be no assurance that such actions will be sufficient to fully offset the impact of adverse factors on the Company or its results of operations, financial position and cash flows.
The Company continued its efforts to transform its business portfolio and to rationalize its cost structure including, among other things, the investigation of potential transactions for the sale, merger or other combination of certain businesses. Business transformation costs of $5 million incurred during the three-month period ended September 30, 2012 relates principally to financial and advisory fees.
In August 2012, Visteon sold its 50% ownership interest in R-Tek Ltd., a UK-based Interiors joint venture, for cash proceeds of approximately $30 million, resulting in a gain of $19 million.
Income Taxes
The Company's provision for income taxes of $33 million for the three-month period ended September 30, 2012 represents an increase of $8 million when compared with $25 million in the same period of 2011. The increase in tax expense reflects the non-recurrence of approximately $15 million in tax benefits related primarily to the release of valuation allowances in foreign subsidiaries and the release of reserves associated with unrecognized tax benefits as a result of audit closures. These increases in tax expense were partially offset by overall lower earnings in those countries where the Company is profitable, which includes the year-over-year impact of changes in the mix of earnings and differing tax rates between jurisdictions and other items.
Discontinued Operations
In connection with the Lighting Transaction, the results of operations of the Lighting business have been reclassified to “(Loss) income from discontinued operations, net of tax” in the Consolidated Statements of Comprehensive Income for the three-month periods ended September 30, 2012 and 2011, and are detailed as follows:
|
Three Months Ended September 30
|
|||||||
|
2012
|
2011
|
||||||
|
(Dollars in Millions)
|
|||||||
|
Sales
|
$
|
32
|
|
$
|
128
|
|
|
|
Cost of sales
|
28
|
|
119
|
|
|||
|
Gross margin
|
4
|
|
9
|
|
|||
|
Selling, general and administrative expenses
|
1
|
|
3
|
|
|||
|
Asset impairments
|
6
|
|
—
|
|
|||
|
Interest expense
|
1
|
|
—
|
|
|||
|
Other expense
|
1
|
|
2
|
|
|||
|
(Loss) income from discontinued operations before income taxes
|
(5
|
)
|
4
|
|
|||
|
Provision for income taxes
|
—
|
|
—
|
|
|||
|
(Loss) income from discontinued operations, net of tax
|
$
|
(5
|
)
|
$
|
4
|
|
|
36
On August 1, 2012, the Company completed the Lighting Transaction, excluding the Company's investment in VTYC, for proceeds of approximately
$70 million
, subject to purchase price adjustments. The Company recorded an asset impairment charge of $6 million for the three-month period ended September 30, 2012, representing the difference between the carrying value of the assets subject to sale and the sale proceeds.
Net Income
Net income attributable to Visteon was $15 million for the three-month period ended September 30, 2012 compared to a net income of $41 million for the same period of 2011, representing a decrease of $26 million. Adjusted EBITDA (as defined below) was $131 million for the three month period ended September 30, 2012, representing a decrease of $37 million when compared with Adjusted EBITDA of $168 million for the same period of 2011. The Company's Adjusted EBITDA decreased primarily due to unfavorable currency, unfavorable product volume, and price productivity in excess of material and manufacturing efficiencies.
Adjusted EBITDA is presented as a supplemental measure of the Company's financial performance that management believes is useful to investors because the excluded items may vary significantly in timing or amounts and/or may obscure trends useful
in evaluating and comparing the Company's operating activities across reporting periods. The Company defines Adjusted EBITDA as net income attributable to the Company, plus net interest expense, provision for income taxes and depreciation and amortization, as further adjusted to eliminate the impact of asset impairments, gains or losses on divestitures, net restructuring expenses and other reimbursable costs, certain employee charges and benefits, reorganization items and other non-operating gains and losses. Additionally, amounts below are inclusive of the Company's discontinued operations. Not all companies use identical calculations and, accordingly, the Company's presentation of Adjusted EBITDA may not be comparable to other similarly titled measures of other companies.
Adjusted EBITDA is not a recognized term under accounting principles generally accepted in the United States (“GAAP”) and does not purport to be a substitute for net income as an indicator of operating performance or cash flows from operating activities as a measure of liquidity. Adjusted EBITDA has limitations as an analytical tool and is not intended to be a measure of cash flow available for management's discretionary use, as it does not consider certain cash requirements such as interest payments, tax payments and debt service requirements. In addition, the Company uses Adjusted EBITDA (i) as a factor in incentive compensation decisions, (ii) to evaluate the effectiveness of the Company's business strategies and (iii) because the Company's credit agreements use measures similar to Adjusted EBITDA to measure compliance with certain covenants. Adjusted EBITDA, as determined and measured by the Company should not be compared to similarly titled measures reported by other companies. The reconciliation of Adjusted EBITDA to net income attributable to Visteon for the three month periods ended September 30, 2012 and 2011 is as follows:
|
Three Months Ended September 30
|
||||||||||||
|
2012
|
2011
|
Change
|
||||||||||
|
(Dollars in Millions)
|
||||||||||||
|
Adjusted EBITDA
|
$
|
131
|
|
$
|
168
|
|
$
|
(37
|
)
|
|||
|
Depreciation and amortization
|
64
|
|
81
|
|
(17
|
)
|
||||||
|
Restructuring and other (income) expense
|
(11
|
)
|
1
|
|
(12
|
)
|
||||||
|
Interest expense, net
|
13
|
|
5
|
|
8
|
|
||||||
|
Provision for income taxes
|
33
|
|
25
|
|
8
|
|
||||||
|
Loss on debt extinguishment
|
4
|
|
—
|
|
4
|
|
||||||
|
Other non-operating costs, net
|
5
|
|
8
|
|
(3
|
)
|
||||||
|
Discontinued operations
|
8
|
|
7
|
|
1
|
|
||||||
|
Net income attributable to Visteon
|
$
|
15
|
|
$
|
41
|
|
$
|
(26
|
)
|
|||
Segment Results of Operations - Three Months Ended September 30, 2012 and 2011
The Company's operating structure is organized by global product lines, including Climate, Electronics and Interiors. These global product lines have financial and operating responsibility over the design, development and manufacture of the Company's product portfolio. Global customer groups are responsible for the business development of the Company's product portfolio and overall customer relationships. Certain functions such as procurement, information technology and other administrative activities are managed on a global basis with regional deployment.
37
The Company's reportable segments are as follows:
|
•
|
Climate - The Company's Climate product line includes climate air handling modules, powertrain cooling modules, heat exchangers, compressors, fluid transport and engine induction systems.
|
|
•
|
Electronics - The Company's Electronics product line includes audio systems, infotainment systems, driver information systems, powertrain and feature control modules, climate controls, and electronic control modules.
|
|
•
|
Interiors - The Company's Interiors product line includes instrument panels, cockpit modules, door trim and floor consoles.
|
Sales by Segment
|
|
Climate
|
Electronics
|
Interiors
|
Eliminations
|
Total
|
||||||||||||||
|
(Dollars in Millions)
|
|||||||||||||||||||
|
Three months ended September 30, 2011
|
$
|
1,003
|
|
$
|
338
|
|
$
|
606
|
|
$
|
(38
|
)
|
$
|
1,909
|
|
||||
|
Volume and mix
|
92
|
|
(15
|
)
|
(59
|
)
|
15
|
|
33
|
|
|||||||||
|
Currency
|
(69
|
)
|
(21
|
)
|
(41
|
)
|
—
|
|
(131
|
)
|
|||||||||
|
Duckyang deconsolidation
|
—
|
|
—
|
|
(190
|
)
|
12
|
|
(178
|
)
|
|||||||||
|
Other
|
(2
|
)
|
(4
|
)
|
(3
|
)
|
—
|
|
(9
|
)
|
|||||||||
|
Three months ended September 30, 2012
|
$
|
1,024
|
|
$
|
298
|
|
$
|
313
|
|
$
|
(11
|
)
|
$
|
1,624
|
|
||||
Climate sales increased during the three-month period ended September 30, 2012 by $21 million. Higher production volumes and net new business increased sales by $92 million, primarily attributable to Asia and North America. Unfavorable currency related to the Euro, Indian Rupee and Korean Won, resulted in a decrease of $69 million. Other changes, totaling $2 million, reflected price productivity, partially offset by increases in revenue related to commodity pricing and design actions.
Electronics sales decreased during the three-month period ended September 30, 2012 by $40 million. Customer sourcing actions and production volume declines lowered sales by $15 million, primarily reflecting weak European economic conditions. Unfavorable currency, primarily driven by the weakening of the Euro, further decreased sales by $21 million. Other changes, totaling $4 million, reflected price productivity, partially offset by increases in revenue related to commodity pricing and design actions.
Interiors sales decreased during the three-month period ended September 30, 2012 by $293 million. Sales decreased $190 million due to the deconsolidation of Duckyang, which resulted from the Company's sale of a controlling ownership interest in October 2011. Sales were further decreased by lower production volumes in Europe and South America of $28 million and $13 million, respectively. Unfavorable currency of $41, primarily related to the Euro and Brazilian Real of $25 million and $11 million, respectively, further reduced sales. Other changes decreased sales by $3 million including the impact of customer accommodation agreements and price productivity.
Cost of Sales by Segment
|
|
Climate
|
Electronics
|
Interiors
|
Eliminations
|
Total
|
||||||||||||||
|
(Dollars in Millions)
|
|||||||||||||||||||
|
Three months ended September 30, 2011
|
$
|
925
|
|
$
|
308
|
|
$
|
575
|
|
$
|
(38
|
)
|
$
|
1,770
|
|
||||
|
Material
|
(4
|
)
|
(19
|
)
|
(232
|
)
|
27
|
|
(228
|
)
|
|||||||||
|
Freight and duty
|
10
|
|
(4
|
)
|
(5
|
)
|
—
|
|
1
|
|
|||||||||
|
Labor and overhead
|
(4
|
)
|
(2
|
)
|
(29
|
)
|
—
|
|
(35
|
)
|
|||||||||
|
Depreciation and amortization
|
(9
|
)
|
(4
|
)
|
(3
|
)
|
—
|
|
(16
|
)
|
|||||||||
|
Other
|
17
|
|
—
|
|
(14
|
)
|
—
|
|
3
|
|
|||||||||
|
Three months ended September 30, 2012
|
$
|
935
|
|
$
|
279
|
|
$
|
292
|
|
$
|
(11
|
)
|
$
|
1,495
|
|
||||
Climate material costs decreased $4 million, including $32 million related to design changes, purchasing improvements and other changes, partially offset by $28 million related to higher production volumes net of currency. Freight and duty increased $10 million, labor and overhead decreased $4, depreciation and amortization decreased $9 million while other costs including engineering, launch and other costs increased by $17 million.
38
Electronics material costs decreased $19 million, including $13 million related to lower production volumes net of currency and $6 million related to the impact of design changes, purchasing improvements, and other changes. Labor and overhead decreased $2 million and depreciation and amortization decreased $4 million.
Interiors material costs decreased $232 million, $176 million related to the deconsolidation of the Duckyang joint venture, $54 million related to lower production volumes net of currency and $2 million related to the impact of design changes, purchasing improvements, and other changes. Labor and overhead decreased $29 million, including $14 million related to the deconsolidation of the Duckyang joint venture, $18 million related to lower production volumes net of currency, while other costs increased $3 million. Depreciation and amortization decreased $3 million and other costs decreased $14 primarily due to customer cost recoveries for engineering, design and development.
Adjusted EBITDA by Segment
Effective April 1, 2012, the Company began utilizing Adjusted EBITDA as its primary measure for evaluating the performance of its global product lines. Adjusted EBITDA by global product line for the three months ended September 30, 2012 and 2011 is presented below:
|
Three Months Ended September 30
|
|||||||||||
|
2012
|
2011
|
Change
|
|||||||||
|
(Dollars in Millions)
|
|||||||||||
|
Climate
|
$
|
70
|
|
$
|
69
|
|
$
|
1
|
|
||
|
Electronics
|
13
|
|
33
|
|
(20
|
)
|
|||||
|
Interiors
|
45
|
|
55
|
|
(10
|
)
|
|||||
|
Discontinued operations
|
3
|
|
11
|
|
(8
|
)
|
|||||
|
Total consolidated
|
$
|
131
|
|
$
|
168
|
|
$
|
(37
|
)
|
||
Changes in Adjusted EBITDA by global product line are presented below:
|
|
Climate
|
Electronics
|
Interiors
|
Total
|
|||||||||||
|
(Dollars in Millions)
|
|||||||||||||||
|
Three months ended September 30, 2011
|
$
|
69
|
|
$
|
33
|
|
$
|
55
|
|
$
|
157
|
|
|||
|
Volume and mix
|
7
|
|
(11
|
)
|
(14
|
)
|
(18
|
)
|
|||||||
|
Currency
|
(4
|
)
|
(2
|
)
|
(9
|
)
|
(15
|
)
|
|||||||
|
Other
|
(2
|
)
|
(7
|
)
|
13
|
|
4
|
|
|||||||
|
Three months ended September 30, 2012
|
$
|
70
|
|
$
|
13
|
|
$
|
45
|
|
128
|
|
||||
|
Discontinued operations
|
3
|
|
|||||||||||||
|
Total
|
$
|
131
|
|
||||||||||||
Adjusted EBITDA for the three months ended September 30, 2012 decreased compared to the same period of 2011. The decrease resulted from lower production volume, unfavorable product mix and currency. Other increases include the net performance impact of design changes and purchasing improvements, offset by customer productivity, engineering, freight, launch and other costs.
39
Consolidated Results of Operations - Nine Months Ended September 30, 2012 and 2011
The Company's consolidated results of operations for the nine months ended September 30, 2012 and 2011 were as follows:
|
Nine Months Ended September 30
|
|||||||||||
|
2012
|
2011
|
Change
|
|||||||||
|
(Dollars in Millions)
|
|||||||||||
|
Sales
|
$
|
5,034
|
|
$
|
5,805
|
|
$
|
(771
|
)
|
||
|
Cost of sales
|
4,643
|
|
5,331
|
|
(688
|
)
|
|||||
|
Gross margin
|
391
|
|
474
|
|
(83
|
)
|
|||||
|
Selling, general and administrative expenses
|
267
|
|
291
|
|
(24
|
)
|
|||||
|
Interest expense, net
|
28
|
|
21
|
|
7
|
|
|||||
|
Loss on debt extinguishment
|
4
|
|
24
|
|
(20
|
)
|
|||||
|
Equity in net income of non-consolidated affiliates
|
183
|
|
130
|
|
53
|
|
|||||
|
Restructuring and other expenses
|
63
|
|
29
|
|
34
|
|
|||||
|
Income before income taxes
|
212
|
|
239
|
|
(27
|
)
|
|||||
|
Provision for income taxes
|
102
|
|
87
|
|
15
|
|
|||||
|
Income from continuing operations
|
110
|
|
152
|
|
(42
|
)
|
|||||
|
(Loss) income from discontinued operations
|
(3
|
)
|
8
|
|
(11
|
)
|
|||||
|
Net income
|
107
|
|
160
|
|
(53
|
)
|
|||||
|
Net income attributable to non-controlling interests
|
46
|
|
54
|
|
(8
|
)
|
|||||
|
Net income attributable to Visteon
|
$
|
61
|
|
$
|
106
|
|
$
|
(45
|
)
|
||
|
Adjusted EBITDA*
|
$
|
432
|
|
$
|
531
|
|
$
|
(99
|
)
|
||
|
*
Adjusted EBITDA is a Non-GAAP financial measure, as further discussed
below.
|
|||||||||||
Sales
Consolidated sales totaled $5,034 million for the nine-month period ended September 30, 2012, which represents a decrease of $771 million when compared to the same period of 2011. The deconsolidation of Duckyang resulted in a decrease of approximately $479 million and unfavorable currency, primarily attributable to the Euro, Korean Won and Indian Rupee, decreased sales by $272 million. Other reductions of $82 million were associated with price productivity net of design actions and commercial agreements. Higher net production volumes and favorable product mix increased sales by $62 million as volume increases and net new business in Asia and North America more than offset production volume declines in Europe and South America.
Gross Margin
The Company recorded gross margin of $391 million for the nine-month period ended September 30, 2012 compared to $474 million for the same period of 2011. The decrease in margin of $83 million was associated with unfavorable product mix of $54 million, unfavorable currency of $50 million, the Duckyang deconsolidation of $7, and unfavorable net cost performance of $3 million. Cost performance was primarily driven by price productivity and commercial agreements material and manufacturing efficiencies in excess of price productivity. Lower depreciation and amortization expenses on tangible and intangible assets improved margin by $31 million.
Selling, General and Administrative Expenses
Selling, general, and administrative expenses were $267 million and $291 million during the nine-month periods ended September 30, 2012 and 2011, respectively. The decrease was primarily due to reduced employee overhead costs and foreign currency, partially offset by increased corporate office rent expense, professional fees and the deconsolidation of the Duckyang joint venture.
Interest Expense, Net
Interest expense for the nine-month period ended September 30, 2012 of $39 million included $25 million associated with the 6.75% senior notes due April 15, 2019, $6 million associated with commitment fees and amortization of debt issuance costs, $5
40
million related to the Korean Bridge Loan, and $3 million related to affiliate debt. During the nine-month period ended September 30, 2011, interest expense was $37 million, including $17 million related to the 6.75% senior notes due April 15, 2019, $11 million related to the Company's $500 million secured term loan due October 1, 2017 (terminated in April 2011), $5 million on affiliate debt, and $4 million related to commitment fees and the amortization of debt issuance costs. Interest income of $11 million for the nine-month period ended September 30, 2012 decreased by $5 million when compared to $16 million for the same period of 2011 due to lower average cash balances and interest rates.
Loss on Debt Extinguishment
Loss on debt extinguishment decreased by $20 million to $4 million when compared to $24 million in the same period in 2011. Loss on debt extinguishment of $4 million for the nine months ended September 30, 2012 was related to unamortized amounts attributable to the Korean Bridge Loan that was repaid during third quarter 2012. Loss on debt extinguishment of $24 million for the nine months ended September 30, 2011 related to unamortized discount and debt issue costs associated with the Company's Term Loan which was repaid in conjunction with the April 6, 2011 sale of the 6.75% $500 million principal notes due April 15, 2019.
Equity in Net Income of Non-consolidated Affiliates
Equity in the net income of non-consolidated affiliates totaled $183 million and $130 million for the nine-month periods ended September 30, 2012 and 2011, respectively, representing an increase of $53 million. Equity earnings for the nine months ended September 30, 2012 included $63 million representing Visteon's equity interest in a non-cash gain recorded by Yanfeng resulting from the excess of fair value over the carrying value of a former equity investee that was consolidated effective June 1, 2012. The following table presents summarized financial data for the Company's non-consolidated affiliates. The amounts included in the table below represent 100% of the results of operations of such non-consolidated affiliates accounted for under the equity method.
|
Net Sales
|
Gross Margin
|
Net Income
|
|||||||||||||||||||||
|
Nine Months Ended September 30
|
Nine Months Ended September 30
|
Nine Months Ended September 30
|
|||||||||||||||||||||
|
2012
|
2011
|
2012
|
2011
|
2012
|
2011
|
||||||||||||||||||
|
(Dollars in Millions)
|
|||||||||||||||||||||||
|
Yanfeng
|
$
|
3,366
|
|
$
|
2,199
|
|
$
|
557
|
|
$
|
362
|
|
$
|
319
|
|
$
|
200
|
|
|||||
|
All other
|
1,284
|
|
603
|
|
140
|
|
108
|
|
59
|
|
60
|
|
|||||||||||
|
$
|
4,650
|
|
$
|
2,802
|
|
$
|
697
|
|
$
|
470
|
|
$
|
378
|
|
$
|
260
|
|
||||||
Yanfeng sales and gross margin for the nine months ended September 30, 2012 include approximately $927 million and $171 million, respectively, related to post-consolidation activity of the aforementioned former equity investee that was consolidated effective June 1, 2012. Yanfeng net income includes approximately $130 million associated with a non-cash gain on the consolidation of a former equity investee. The increase in sales for all other non-consolidated affiliates includes $571 million related to Duckyang.
Restructuring and Other (Income) / Expenses
Restructuring and other expenses consist of the following:
|
Nine Months Ended September 30
|
|||||||
|
2012
|
2011
|
||||||
|
(Dollars in Millions)
|
|||||||
|
Restructuring expenses
|
$
|
44
|
|
$
|
18
|
|
|
|
Loss on asset contribution
|
14
|
|
—
|
|
|||
|
Transformation costs
|
23
|
|
3
|
|
|||
|
Bankruptcy-related costs
|
1
|
|
8
|
|
|||
|
Gain on sale of joint venture interest
|
(19
|
)
|
—
|
|
|||
|
$
|
63
|
|
$
|
29
|
|
||
41
During the nine-month period ended September 30, 2012, the Company recorded $44 million of restructuring expenses, including $36 million recorded in connection with the previously announced closure of the Cadiz Electronics operation in El Puerto de Santa Maria, Spain. Additionally, the Company agreed to transfer land, building and machinery with a net book value of approximately $14 million for the benefit of the employees. The Company also recorded approximately $7 million for employee severance and termination benefits during the nine-month period ended September 30, 2012 including $3 million associated with the separation of approximately 250 employees at a South American Interiors facility and $4 million associated with 70 voluntary employee separations associated with the Climate action announced in the fourth quarter of 2011.
During the nine-month period ended September 30, 2011, the Company recorded $27 million of restructuring expenses, including $22 million for severance and termination benefits related to the announced closure of the Company's Cadiz Electronics operation and $5 million for employee severance and termination benefits associated with previously announced actions at two European Interiors facilities. Additionally, the Company reversed approximately $9 million of previously established accruals, including $7 million for employee severance and termination benefits at a European Interiors facility pursuant to a March 2011 contractual agreement to cancel the related social plan and an additional $2 million for employee and severance and termination benefits at a South American Electronics facility.
The following is a summary of the Company's consolidated restructuring reserves and related activity for the nine-month period ended September 30, 2012.
|
|
Electronics
|
Interiors
|
Climate
|
Total
|
|||||||||||
|
(Dollars in Millions)
|
|||||||||||||||
|
Restructuring reserve - December 31, 2011
|
$
|
19
|
|
$
|
6
|
|
$
|
1
|
|
$
|
26
|
|
|||
|
Expenses
|
36
|
|
4
|
|
4
|
|
44
|
|
|||||||
|
Utilization
|
(54
|
)
|
(4
|
)
|
(4
|
)
|
(62
|
)
|
|||||||
|
Restructuring reserve - September 30, 2012
|
$
|
1
|
|
$
|
6
|
|
$
|
1
|
|
$
|
8
|
|
|||
Utilization of $62 million during the first nine months of 2012 represents payments of $55 million for employee severance and termination benefits, $4 million in connection with the asset contribution for the Cadiz exit, and $3 million reflecting lease termination, consulting, and legal costs related to previously announced restructuring actions. Given the economically-sensitive and highly competitive nature of the automotive industry, the Company continues to closely monitor current market factors and industry trends taking action as necessary, including but not limited to, additional restructuring actions. However, there can be no assurance that such actions will be sufficient to fully offset the impact of adverse factors on the Company or its results of operations, financial position and cash flows.
The Company continued its efforts to transform its business portfolio and to rationalize its cost structure including, among other things, the investigation of potential transactions for the sale, merger or other combination of certain businesses. Business transformation costs of $23 million and $3 million incurred during the nine-month periods ended September 30, 2012 and 2011, respectively, relate principally to financial and advisory fees. The Company recorded bankruptcy-related costs of $1 million and $8 million for the nine-month periods ended September 30, 2012 and September 30, 2011, respectively, which are comprised of amounts directly associated with the bankruptcy claims settlement process under Chapter 11.
In August 2012, Visteon sold its 50% ownership interest in R-Tek Ltd., a UK-based Interiors joint venture, for cash proceeds of approximately $30 million, resulting in a gain of $19 million.
Income Taxes
The Company's provision for income taxes of $102 million for the nine-month period ended September 30, 2012 represents an increase of $15 million when compared with $87 million in the same period of 2011. The increase in tax expense reflects the non-recurrence of approximately $20 million in tax benefits related primarily to the release of valuation allowances in foreign subsidiaries and the release of reserves associated with unrecognized tax benefits as a result of audit closures. Additionally, the increase includes $6 million of deferred tax expense related to Visteon's equity interest in a non-cash equity investment gain recorded by Yanfeng, a 50% owned non-consolidated affiliate of the Company and other items. These increases in tax expense were partially offset by overall lower earnings in those countries where the Company is profitable, which includes the year-over-year impact of changes in the mix of earnings and differing tax rates between jurisdictions.
Discontinued Operations
42
In connection with the Lighting Transaction, the results of operations of the Lighting business have been reclassified to “(Loss) income from discontinued operations, net of tax” in the Consolidated Statements of Comprehensive Income for the nine-month periods ended September 30, 2012 and 2011, and are detailed as follows:
|
Nine Months Ended September 30
|
||||||||
|
2012
|
2011
|
|||||||
|
(Dollars in Millions)
|
||||||||
|
Sales
|
$
|
297
|
|
$
|
383
|
|
||
|
Cost of sales
|
264
|
|
363
|
|
||||
|
Gross margin
|
33
|
|
20
|
|
||||
|
Selling, general and administrative expenses
|
7
|
|
9
|
|
||||
|
Asset impairments
|
19
|
|
—
|
|
||||
|
Interest expense
|
2
|
|
1
|
|
||||
|
Other expenses
|
4
|
|
2
|
|
||||
|
Income from discontinued operations before income taxes
|
1
|
|
8
|
|
||||
|
Provision for income taxes
|
4
|
|
—
|
|
||||
|
(Loss) income from discontinued operations, net of tax
|
$
|
(3
|
)
|
$
|
8
|
|
||
On August 1, 2012, the Company completed the Lighting Transaction, excluding the Company's investment in VTYC, for proceeds of approximately
$70 million
. The Company recorded an asset impairment charge of $19 million for the nine-month period ended September 30, 2012, representing the difference between the carrying value of the assets subject to sale and the sale proceeds.
Included in the provision for income taxes for the nine-month period ended September 30, 2012 is $4 million related to the establishment of a valuation allowance against certain deferred tax credits in Mexico, the realization of which is no longer considered more likely than not due to insufficient projected future taxable income.
Net Income
Net income attributable to Visteon was $61 million for the nine-month period ended September 30, 2012 compared to $106 million for the same period of 2011, representing a decrease of $45 million. Net income attributable to Visteon for the nine months ended September 30, 2012 included $63 million of increased equity in the net income of non-consolidated affiliates resulting from a non-cash gain at Yanfeng. Adjusted EBITDA (as defined below) was $432 million for the nine-month period ended September 30, 2012, representing a decrease of $99 million when compared with Adjusted EBITDA of $531 million for the same period of 2011. The Company's Adjusted EBITDA decreased in the nine-month period of 2012 as compared with 2011 primarily due to foreign currency impacts of the Euro and Indian Rupee and European production volume declines.
Adjusted EBITDA is presented as a supplemental measure of the Company's financial performance that management believes is useful to investors because the excluded items may vary significantly in timing or amounts and/or may obscure trends useful in evaluating and comparing the Company's operating activities across reporting periods. The Company defines Adjusted EBITDA as net income attributable to the Company, plus net interest expense, provision for income taxes and depreciation and amortization, as further adjusted to eliminate the impact of asset impairments, gains or losses on divestitures, net restructuring expenses and other reimbursable costs, certain employee charges and benefits, reorganization items and other non-operating gains and losses. Additionally, amounts below are inclusive of the Company's discontinued operations. Not all companies use identical calculations and, accordingly, the Company's presentation of Adjusted EBITDA may not be comparable to other similarly titled measures of other companies.
Adjusted EBITDA is not a recognized term under accounting principles generally accepted in the United States (“GAAP”) and does not purport to be a substitute for net income as an indicator of operating performance or cash flows from operating activities as a measure of liquidity. Adjusted EBITDA has limitations as an analytical tool and is not intended to be a measure of cash flow available for management's discretionary use, as it does not consider certain cash requirements such as interest payments, tax payments and debt service requirements. In addition, the Company uses Adjusted EBITDA (i) as a factor in incentive compensation decisions, (ii) to evaluate the effectiveness of the Company's business strategies and (iii) because the Company's credit agreements use measures similar to Adjusted EBITDA to measure compliance with certain covenants. Adjusted EBITDA, as determined and measured by the Company should not be compared to similarly titled measures reported by other companies.
43
The reconciliation of Adjusted EBITDA to net income attributable to Visteon for the nine-month periods ended September 30, 2012 and 2011 is as follows:
|
Nine Months Ended September 30
|
||||||||||||
|
2012
|
2011
|
Change
|
||||||||||
|
(Dollars in Millions)
|
||||||||||||
|
Adjusted EBITDA
|
$
|
432
|
|
$
|
531
|
|
$
|
(99
|
)
|
|||
|
Depreciation and amortization
|
195
|
|
232
|
|
(37
|
)
|
||||||
|
Restructuring and other expenses
|
63
|
|
29
|
|
34
|
|
||||||
|
Equity investment gain
|
(63
|
)
|
—
|
|
(63
|
)
|
||||||
|
Interest expense, net
|
28
|
|
21
|
|
7
|
|
||||||
|
Provision for income taxes
|
102
|
|
87
|
|
15
|
|
||||||
|
Loss on debt extinguishment
|
4
|
|
24
|
|
(20
|
)
|
||||||
|
Other non-operating costs, net
|
12
|
|
13
|
|
(1
|
)
|
||||||
|
Discontinued operations
|
30
|
|
19
|
|
11
|
|
||||||
|
Net income attributable to Visteon
|
$
|
61
|
|
$
|
106
|
|
$
|
(45
|
)
|
|||
Segment Results of Operations - Nine Months Ended September 30, 2012 and 2011
The Company's operating structure is organized by global product lines, including: Climate, Electronics and Interiors. These global product lines have financial and operating responsibility over the design, development and manufacture of the Company's product portfolio. Global customer groups are responsible for the business development of the Company's product portfolio and overall customer relationships. Certain functions such as procurement, information technology and other administrative activities are managed on a global basis with regional deployment. The Company's reportable segments are as follows:
|
•
|
Climate - The Company's Climate product line includes climate air handling modules, powertrain cooling modules, heat exchangers, compressors, fluid transport and engine induction systems.
|
|
•
|
Electronics - The Company's Electronics product line includes audio systems, infotainment systems, driver information systems, powertrain and feature control modules, climate controls, and electronic control modules.
|
|
•
|
Interiors - The Company's Interiors product line includes instrument panels, cockpit modules, door trim and floor consoles.
|
Sales by Segment
|
|
Climate
|
Electronics
|
Interiors
|
Eliminations
|
Total
|
||||||||||||||
|
(Dollars in Millions)
|
|||||||||||||||||||
|
Nine months ended September 30, 2011
|
$
|
3,040
|
|
$
|
1,047
|
|
$
|
1,854
|
|
$
|
(136
|
)
|
$
|
5,805
|
|
||||
|
Volume and mix
|
256
|
|
(72
|
)
|
(155
|
)
|
33
|
|
62
|
|
|||||||||
|
Currency
|
(138
|
)
|
(44
|
)
|
(90
|
)
|
—
|
|
(272
|
)
|
|||||||||
|
Duckyang deconsolidation
|
—
|
|
—
|
|
(515
|
)
|
36
|
|
(479
|
)
|
|||||||||
|
Other
|
(46
|
)
|
(12
|
)
|
(24
|
)
|
—
|
|
(82
|
)
|
|||||||||
|
Nine months ended September 30, 2012
|
$
|
3,112
|
|
$
|
919
|
|
$
|
1,070
|
|
$
|
(67
|
)
|
$
|
5,034
|
|
||||
Climate sales increased during the nine-month period ended September 30, 2012 by $72 million. Higher production volumes and net new business, primarily in Asia and North America, increased sales by $256 million. Unfavorable currency, primarily related to the Euro and Korean Won resulted in a decrease of $138 million. Other changes decreased sales by $46 million and reflected price productivity, partially offset by increases in revenue related to commodity pricing and design actions.
Electronics sales decreased during the nine-month period ended September 30, 2012 by $128 million. Customer sourcing actions and production volume declines reflecting weakened economic conditions in Europe decreased sales by $72 million. Unfavorable currency, primarily related to the Euro, further decreased sales by $44 million. Other changes, totaling $12 million, reflected price productivity, partially offset by increases in revenue related to commodity pricing and design actions.
44
Interiors sales decreased during the nine-month period ended September 30, 2012 by $784 million. Sales decreased due to the deconsolidation of Duckyang by $515 million. Lower production volumes in Europe and South America of $93 million and $40 million, respectively, further reduced sales. Unfavorable currency related to the Euro and Brazilian Real decreased sales $84 million. Other reductions, totaling $24 million, include $13 million from a 2011 customer settlement agreement in South America, customer accommodation agreements and price productivity, partially offset by increases in revenue related to commodity pricing and design actions.
Cost of Sales by Segment
|
|
Climate
|
Electronics
|
Interiors
|
Eliminations
|
Total
|
||||||||||||||
|
(Dollars in Millions)
|
|||||||||||||||||||
|
Nine months ended September 30, 2011
|
$
|
2,784
|
|
$
|
943
|
|
$
|
1,740
|
|
$
|
(136
|
)
|
$
|
5,331
|
|
||||
|
Material
|
47
|
|
(53
|
)
|
(609
|
)
|
69
|
|
(546
|
)
|
|||||||||
|
Freight and duty
|
10
|
|
(8
|
)
|
(13
|
)
|
—
|
|
(11
|
)
|
|||||||||
|
Labor and overhead
|
(1
|
)
|
(26
|
)
|
(81
|
)
|
—
|
|
(108
|
)
|
|||||||||
|
Depreciation and amortization
|
(20
|
)
|
(10
|
)
|
(8
|
)
|
—
|
|
(38
|
)
|
|||||||||
|
Other
|
33
|
|
(3
|
)
|
(15
|
)
|
—
|
|
15
|
|
|||||||||
|
Nine months ended September 30, 2012
|
$
|
2,853
|
|
$
|
843
|
|
$
|
1,014
|
|
$
|
(67
|
)
|
$
|
4,643
|
|
||||
Climate material costs increased $47 million, including $107 million related to higher production volumes net of currency partially offset by $60 million related to design changes, purchasing improvements, and other changes. Depreciation and amortization decreased $20 million while freight increased $10 million and launch, engineering and other expenses increased by $33 million.
Electronics material costs decreased $53 million, including $38 million related to lower production volumes net of currency and $15 million related to the impact of design changes, purchasing improvements, and other changes. Labor and overhead decreased $26 million, including $21 million related to lower production volumes net of currency. Depreciation and amortization decreased $10 million while other manufacturing expense was lower by $3 million.
Interiors material costs decreased $609 million, including $472 million related to the deconsolidation of Duckyang, $127 million related to lower production volumes net of currency and $10 million related to the impact of design changes, purchasing improvements, and other changes. Labor and overhead decreased $81 million, including $36 million related to the deconsolidation of Duckyang and $45 million related to lower production volumes net of currency and other changes. Freight decreased $13 million and depreciation and amortization decreased $8 million while other costs decreased $15 million primarily due to customer cost recoveries for engineering, design and development.
Adjusted EBITDA by Segment
Effective April 1, 2012, the Company began utilizing Adjusted EBITDA as its primary measure for evaluating the performance of its global product lines. Adjusted EBITDA by global product line for the nine months ended September 30, 2012 and 2011 is presented below:
|
Nine Months Ended September 30
|
|||||||||||
|
2012
|
2011
|
Change
|
|||||||||
|
(Dollars in Millions)
|
|||||||||||
|
Climate
|
$
|
216
|
|
$
|
228
|
|
$
|
(12
|
)
|
||
|
Electronics
|
58
|
|
96
|
|
(38
|
)
|
|||||
|
Interiors
|
131
|
|
180
|
|
(49
|
)
|
|||||
|
Discontinued operations
|
27
|
|
27
|
|
—
|
|
|||||
|
Total consolidated
|
$
|
432
|
|
$
|
531
|
|
$
|
(99
|
)
|
||
45
Changes in Adjusted EBITDA by global product line are presented below:
|
|
Climate
|
Electronics
|
Interiors
|
Total
|
|||||||||||
|
(Dollars in Millions)
|
|||||||||||||||
|
Nine months ended September 30, 2011
|
$
|
228
|
|
$
|
96
|
|
$
|
180
|
|
$
|
504
|
|
|||
|
Volume and mix
|
17
|
|
(28
|
)
|
(43
|
)
|
(54
|
)
|
|||||||
|
Currency
|
(18
|
)
|
(8
|
)
|
(14
|
)
|
(40
|
)
|
|||||||
|
Other
|
(11
|
)
|
(2
|
)
|
8
|
|
(5
|
)
|
|||||||
|
Nine months ended September 30, 2012
|
$
|
216
|
|
$
|
58
|
|
$
|
131
|
|
405
|
|
||||
|
Discontinued operations
|
27
|
|
|||||||||||||
|
Total
|
$
|
432
|
|
||||||||||||
Adjusted EBITDA for the nine months ended September 30, 2012 decreased compared to the same period of 2011. The decrease resulted from lower production volumes, unfavorable product mix and currency. Other decreases include the net performance impact of design changes and purchasing improvements, more than offset by customer productivity, freight, launch, engineering, and other costs.
Liquidity
Overview
The Company's primary liquidity needs are related to the funding of general business requirements, including working capital requirements, capital expenditures, debt service, employee retirement benefits and restructuring actions. The Company funds its liquidity needs with cash flows from operating activities, a substantial portion of which is generated by the Company's international subsidiaries. Accordingly, the Company utilizes a combination of cash repatriation strategies, including dividends, royalties, intercompany loan repayments and other distributions and advances to provide the funds necessary to meet obligations globally. The Company's ability to access funds from its subsidiaries using these repatriation strategies is subject to, among other things, customary regulatory and statutory requirements and contractual arrangements including joint venture agreements and local debt agreements. Additionally, such repatriation strategies may be adjusted or modified as the Company continues to, among other things, rationalize its business portfolio and cost structure. As of September 30, 2012, the Company had total cash balances of $920 million, including restricted cash of $19 million. Cash balances totaling $549 million were located in jurisdictions outside of the United States, of which, approximately $160 million is considered permanently reinvested for funding ongoing operations outside of the U.S. If such permanently reinvested funds are needed for operations in the U.S. or in other jurisdictions, the Company would be required to accrue additional tax expense, primarily related to foreign withholding taxes.
The Company's ability to fund its liquidity needs is dependent on the level, variability and timing of its customers' worldwide vehicle production, which may be adversely affected by many factors including, but not limited to, general economic conditions, specific industry conditions, financial markets, competitive factors and legislative and regulatory changes. During the first nine months of 2012, economic conditions in Europe continued to be adversely impacted by sovereign debt issues and economic growth in China remained slower than recent historical growth rates. Accordingly, the Company continues to closely monitor the macroeconomic environment and its impact on vehicle production volumes in relation to the Company's specific cash needs. Further, the Company's intra-year needs are impacted by seasonal effects in the industry, such as mid-year shutdowns, the subsequent ramp-up of new model production and the additional year-end shutdowns by primary customers.
To the extent that the Company's liquidity needs exceed cash provided by its operating activities, the Company would look to cash balances on hand; cash available through existing financing vehicles such as the Company's $175 million asset-based revolving loan credit facility, subject to a borrowing base which may be impacted by potential sale agreements and of which none was outstanding as of September 30, 2012; the sale of businesses or other assets as permitted under the credit agreements; affiliate working capital lines of credit of which the Company had approximately $193 million available as of September 30, 2012, and other contractual arrangements; and then to potential additional capital through the debt or equity markets. Access to these markets is influenced by the Company's credit ratings. On July 5, 2012, following the Company's announcement of the Korean tender offer, Moody's and S&P reaffirmed Visteon's corporate ratings, although Moody's changed the 2019 unsecured bond B2 rating outlook to negative. At September 30, 2012, Visteon's corporate credit ratings were B1 and B+ by Moody's and S&P, respectively, both with a stable outlook.
On July 3, 2012, Visteon amended its revolving loan credit agreement to, among other things, reduce the aggregate lending commitment to $175 million, permit the Korean Bridge Loan, and modify certain covenants. The Company also amended the
46
revolving loan credit agreement on April 3, 2012 to permit the sale and leaseback of the Company's corporate headquarters and the Lighting Transaction. As of September 30, 2012 the Company had no outstanding borrowings or letter of credit obligations under its revolving loan credit agreement with $156 million available for borrowing. Future borrowing base capacity under the facility may be impacted by the sale of assets.
Business divestiture and asset sale transactions have provided approximately $188 million in net cash proceeds during 2012. In September 2012, the Company sold the corporate airplane for approximately $8 million in proceeds. On August 31, 2012, Visteon completed the sale of its 50% ownership interest in R-Tek Ltd., a UK-based Interiors joint venture, for proceeds of approximately $30 million. On August 1, 2012, the Company completed the Lighting Transaction, excluding the Company's investment in VTYC, for proceeds of approximately $70 million. In April 2012, the Company completed a sale and leaseback transaction associated with the Grace Lake Corporate Center, which is located in Van Buren Township, Michigan for approximately $80 million in cash. In September 2012, the Company announced a shareholder value creation strategy that may result in additional business divestiture and asset sale transactions in the future. Cash proceeds in excess of amounts deemed necessary for operating liquidity and ongoing business investment, if any, resulting from such potential future transactions would be evaluated for various uses including, but not limited to, addressing the Company's capital structure and pension liabilities.
Other
On July 30, 2012, Visteon's board of directors authorized the repurchase of up to $100 million of the Company's common stock over the subsequent two year period. The Company anticipates that repurchases of common stock, if any, would occur from time to time in open market transactions or in privately negotiated transactions depending on market and economic conditions, share price, trading volume, alternative uses of capital and other factors. As of September 30, 2012, no stock had been repurchased.
In June 2012, the Korean tax authorities commenced a review of Visteon's controlled subsidiary, Halla Climate Control Corporation ("Halla") for the tax years 2007 through 2011. In October 2012, the tax authorities issued a pre-assessment of approximately $18 million for alleged underpayment of withholding tax on dividends paid and other items, including certain management service fees charged by Visteon Corporation. The Company is considering potential next steps if the pre-assessment becomes finalized, including filing an appeal with the Korean Tax Tribunal. Pursuant to the Korean tax rules, it is possible a payment of the final assessment will need to be made in full in the fourth quarter of 2012 to pursue the appeals process. The Company believes it is more likely than not it will receive a favorable ruling when all of the available appeals have been exhausted.
In January 2012, the Company contributed approximately 1.5 million shares of its common stock valued at approximately $73 million into its two largest U.S. defined benefit pension plans. This share contribution substantially reduces the Company's future cash pension funding requirements for 2012 and 2013. As of September 30, 2012, all shares previously contributed to the plans had been sold, with an average share price of approximately $44.
Cash Flows
Operating Activities
Cash provided from operating activities increased $108 million during the nine-month period ended September 30, 2012 to $163 million, compared with $55 million for the same period in 2011. The increase is primarily due to improved net trade working capital flows, lower bankruptcy related payments, lower pension payments, and lower receivables from joint ventures, partially offset by lower net income, as adjusted for non-cash items.
Free Cash Flow is presented as a supplemental measure of the Company's liquidity that management believes is useful to investors in analyzing the Company's ability to service and repay its debt. The Company defines Free Cash Flow as cash flow from operating activities less capital expenditures. Not all companies use identical calculations, so this presentation of Free Cash Flow may not be comparable to other similarly titled measures of other companies. Free Cash Flow is not a recognized term under GAAP and does not purport to be a substitute for cash flows from operating activities as a measure of liquidity. Free Cash Flow has limitations as an analytical tool as it does not reflect cash used to service debt and does not reflect funds available for investment or other discretionary uses. In addition, the Company uses Free Cash Flow (i) as a factor in incentive compensation decisions and (ii) for planning and forecasting future periods. A reconciliation of Free Cash Flow to cash provided from operating activities is provided in the following table.
|
Nine Months Ended
|
|||||||
|
September 30
|
|||||||
|
2012
|
2011
|
||||||
|
(Dollars in Millions)
|
|||||||
|
Cash provided by operating activities
|
$
|
163
|
|
$
|
55
|
|
|
|
Capital expenditures
|
(146
|
)
|
(185
|
)
|
|||
|
Free Cash Flow
|
$
|
17
|
|
$
|
(130
|
)
|
|
Investing Activities
Cash provided from investing activities during the nine-month period ended September 30, 2012 was $40 million, compared to a use of $187 million for the same period in 2011 - for a net change of $227 million. Investing cash activities during the nine-month period ended September 30, 2012 included approximately $100 million of proceeds from the Lighting and R-Tek divestitures and $88 million of proceeds from asset sales primarily related to the Company's corporate headquarters, which partially offset capital spending of $146 million.
Financing Activities
Cash used by financing activities increased $27 million during the nine-month period ended September 30, 2012 to $33 million, compared with $6 million for the same period in 2011. The $33 million used by financing activities during the nine-month period ended September 30, 2012 included dividends paid to non-controlling interests, repayment of Lighting related term debt in Asia Pacific in connection with the Lighting divestiture, and the Korean Bridge Loan draw down net of fees and subsequent repayment in connection with the cash tender offer for the outstanding shares of Halla. Financing activities during the nine-month period ended September 30, 2011 included the termination and payoff of the existing $498 million term loan, settlement of reorganization related professional fees, and dividends paid to non-controlling interests, partially offset by issuance of $500 million in senior notes, a reduction in restricted cash related to the disbursement of previously escrowed funds to settle reorganization related rights offering and other financing fees, and an increase in affiliate debt.
Debt and Capital Structure
In connection with the July 4, 2012 tender offer to purchase the remaining 30 percent of Halla, Visteon, through its wholly-owned Korean subsidiary Visteon Korea Holdings Corp., entered into a fully committed Korean debt facility of 1 trillion Korean Won ("KRW") or $
881 million
(the "Bridge Loan"), under which, Visteon Korea Holdings Corp. borrowed 925 billion KRW or $815 million. The Bridge Loan was secured by a pledge of all of the shares of capital stock of Halla owned directly or indirectly by Visteon. On July 3, 2012, the Company entered into an amendment to the revolving loan credit agreement, to among other things, permit the the Bridge Loan and to reduce the aggregate lending commitment to $175 million reflecting the anticipation of the Lighting Transaction and sale of the Company's corporate headquarters.
On July 30, 2012, Visteon Korea Holdings Corp. repaid approximately 910 billion KRW or $800 million of previously borrowed amounts under the Bridge Loan and amended the Bridge Loan to provide, among other things, for the ability to make additional borrowings at a future date in exchange for the payment of a commitment fee of 0.5 percent per annum (the "Amended Bridge Loan"). Interest on the Amended Bridge Loan was based on the average yield rate quoted by certain bond pricing agencies in respect of KRW denominated non-guaranteed bank debentures with a remaining maturity of one year, plus an annual margin of
3.00 percent
. On August 24, 2012, Visteon Korea Holdings Corp. permanently reduced the available commitments under the Amended Bridge Loan and completed repayment of all outstanding loan amounts on August 28, 2012 as was allowed without penalty after following certain advance notice and other procedures. The Company incurred debt extinguishment costs of approximately $4 million and interest of $5 million during the three and nine months ended September 30, 2012 in connection with this financing arrangement.
Other information related to the Company's debt is set forth in Note 10, "Debt", to the consolidated financial statements included herein under Item 1. For additional information, refer to the Company's Annual Report on Form 10-K for the year ended December 31, 2011 for specific debt agreements and additional information related to covenants and restrictions.
Off-Balance Sheet Arrangements
On September 27, 2011, the Company extended its $15 million Letters of Credit ("LOC") Facility with US Bank National
48
Association through September 30, 2013. The Company must continue to maintain a collateral account with U.S. Bank equal to 103% of the aggregated stated amount of the LOCs with reimbursement for any draws. As of September 30, 2012, the Company had $9 million of outstanding letters of credit issued under this facility and secured by restricted cash. In addition, the Company had $13 million of locally issued letters of credit to support various customs arrangements and other obligations at its local affiliates of which $8 million are secured by cash collateral.
The Company has guaranteed approximately $37 million for subsidiary lease payments under various arrangements generally spanning between one to ten years in duration, and approximately $6 million for affiliate credit lines and other credit support agreements. During January 2009, the Company reached an agreement with the PBGC pursuant to U.S. federal pension law provisions that permit the agency to seek protection when a plant closing results in termination of employment for more than 20 percent of employees covered by a pension plan. In connection with this agreement, the Company agreed to provide a guarantee by certain affiliates of certain contingent pension obligations of up to $30 million, the term of this guarantee is dependent upon certain contingent events as set forth in the PBGC Agreement. These guarantees have not, nor does the Company expect they are reasonably likely to have, a material current or future effect on the Company’s financial position, results of operations or cash flows.
Fair Value Measurements
The Company uses fair value measurements in the preparation of its financial statements, which utilize various inputs including those that can be readily observable, corroborated or generally unobservable. The Company utilizes market-based data and valuation techniques that maximize the use of observable inputs and minimize the use of unobservable inputs. Additionally, the Company applies assumptions that market participants would use in pricing an asset or liability, including assumptions about risk. The primary financial instruments that are recorded at fair value in the Company's financial statements are derivative instruments.
The Company's use of derivative instruments creates exposure to credit loss in the event of nonperformance by the counterparty to the derivative financial instruments. The Company limits this exposure by entering into agreements directly with a variety of major financial institutions with high credit standards and that are expected to fully satisfy their obligations under the contracts. Fair value measurements related to derivative assets take into account the non-performance risk of the respective counterparty, while derivative liabilities take into account the non-performance risk of Visteon and its foreign affiliates. The hypothetical gain or loss from a 100 basis point change in non-performance risk would be less than $1 million for the fair value of foreign currency derivatives as of September 30, 2012.
Recent Accounting Pronouncements
See Note 1 “Basis of Presentation” to the accompanying consolidated financial statements under Item 1 “Financial Statements” of this Quarterly Report on Form 10-Q for a discussion of recent accounting pronouncements.
Forward-Looking Statements
Certain statements contained or incorporated in this Quarterly Report on Form 10-Q which are not statements of historical fact constitute “Forward-Looking Statements” within the meaning of the Private Securities Litigation Reform Act of 1995 (the “Reform Act”). Forward-looking statements give current expectations or forecasts of future events. Words such as “anticipate”, “expect”, “intend”, “plan”, “believe”, “seek”, “estimate” and other words and terms of similar meaning in connection with discussions of future operating or financial performance signify forward-looking statements. These statements reflect the Company’s current views with respect to future events and are based on assumptions and estimates, which are subject to risks and uncertainties including those discussed in Item 1A under the heading “Risk Factors” and elsewhere in this report. Accordingly, undue reliance should not be placed on these forward-looking statements. Also, these forward-looking statements represent the Company’s estimates and assumptions only as of the date of this report. The Company does not intend to update any of these forward-looking statements to reflect circumstances or events that occur after the statement is made and qualifies all of its forward-looking statements by these cautionary statements.
You should understand that various factors, in addition to those discussed elsewhere in this document, could affect the Company’s future results and could cause results to differ materially from those expressed in such forward-looking statements, including:
|
•
|
Visteon’s ability to satisfy its future capital and liquidity requirements; Visteon’s ability to access the credit and capital markets at the times and in the amounts needed and on terms acceptable to Visteon; Visteon’s ability to comply with covenants applicable to it; and the continuation of acceptable supplier payment terms.
|
|
•
|
Visteon’s ability to execute on its transformational plans and cost reduction initiatives in the amounts and on the timing
|
49
contemplated.
|
•
|
Visteon’s ability to satisfy its pension and other postretirement employee benefit obligations, and to retire outstanding debt and satisfy other contractual commitments, all at the levels and times planned by management.
|
|
•
|
Visteon’s ability to access funds generated by its foreign subsidiaries and joint ventures on a timely and cost effective basis.
|
|
•
|
Changes in the operations (including products, product planning and part sourcing), financial condition, results of operations or market share of Visteon’s customers.
|
|
•
|
Changes in vehicle production volume of Visteon’s customers in the markets where it operates, and in particular changes in Ford’s and Hyundai Kia’s vehicle production volumes and platform mix.
|
|
•
|
Increases in commodity costs or disruptions in the supply of commodities, including steel, resins, aluminum, copper, fuel and natural gas.
|
|
•
|
Visteon’s ability to generate cost savings to offset or exceed agreed upon price reductions or price reductions to win additional business and, in general, improve its operating performance; to achieve the benefits of its restructuring actions; and to recover engineering and tooling costs and capital investments.
|
|
•
|
Restrictions in labor contracts with unions that restrict Visteon’s ability to close plants, divest unprofitable, noncompetitive businesses, change local work rules and practices at a number of facilities and implement cost-saving measures.
|
|
•
|
The costs and timing of facility closures or dispositions, business or product realignments, or similar restructuring actions, including potential asset impairment or other charges related to the implementation of these actions or other adverse industry conditions and contingent liabilities.
|
|
•
|
Significant changes in the competitive environment in the major markets where Visteon procures materials, components or supplies or where its products are manufactured, distributed or sold.
|
|
•
|
Legal and administrative proceedings, investigations and claims, including shareholder class actions, inquiries by regulatory agencies, product liability, warranty, employee-related, environmental and safety claims and any recalls of products manufactured or sold by Visteon.
|
|
•
|
Changes in economic conditions, currency exchange rates, changes in foreign laws, regulations or trade policies or political stability in foreign countries where Visteon procures materials, components or supplies or where its products are manufactured, distributed or sold.
|
|
•
|
Shortages of materials or interruptions in transportation systems, labor strikes, work stoppages or other interruptions to or difficulties in the employment of labor in the major markets where Visteon purchases materials, components or supplies to manufacture its products or where its products are manufactured, distributed or sold.
|
|
•
|
Changes in laws, regulations, policies or other activities of governments, agencies and similar organizations, domestic and foreign, that may tax or otherwise increase the cost of, or otherwise affect, the manufacture, licensing, distribution, sale, ownership or use of Visteon’s products or assets.
|
|
•
|
Possible terrorist attacks or acts of war, which could exacerbate other risks such as slowed vehicle production, interruptions in the transportation system or fuel prices and supply.
|
|
•
|
The cyclical and seasonal nature of the automotive industry.
|
|
•
|
Visteon’s ability to comply with environmental, safety and other regulations applicable to it and any increase in the requirements, responsibilities and associated expenses and expenditures of these regulations.
|
|
•
|
Visteon’s ability to protect its intellectual property rights, and to respond to changes in technology and technological risks and to claims by others that Visteon infringes their intellectual property rights.
|
|
•
|
Visteon’s ability to quickly and adequately remediate control deficiencies in its internal control over financial reporting.
|
|
•
|
Other factors, risks and uncertainties detailed from time to time in Visteon’s Securities and Exchange Commission filings.
|
50
|
ITEM 3.
|
QUANTITATIVE AND QUALITATIVE DISCLOSURES ABOUT MARKET RISK
|
The primary market risks to which the Company is exposed include changes in foreign currency exchange rates, interest rates and certain commodity prices. The Company manages these risks through derivative instruments and various operating actions including fixed price contracts with suppliers and cost sourcing arrangements with customers. The Company's use of derivative instruments is limited to hedging activities and such instruments are not used for speculative or trading purposes, as per clearly defined risk management policies. Additionally, the Company's use of derivative instruments creates exposure to credit loss in the event of nonperformance by the counterparty to the derivative financial instruments. The Company limits this exposure by entering into agreements directly with a variety of major financial institutions with high credit standards and that are expected to fully satisfy their obligations under the contracts. Additionally, the Company's ability to utilize derivatives to manage market risk is dependent on credit conditions and market conditions given the current economic environment.
Foreign Currency Risk
The Company's net cash inflows and outflows exposed to the risk of changes in exchange rates arise from the sale of products in countries other than the manufacturing source, foreign currency denominated supplier payments, debt and other payables, subsidiary dividends and investments in subsidiaries. Where possible, the Company utilizes derivative financial instruments to manage foreign currency exchange rate risks. Forward and option contracts may be utilized to protect the Company's cash flow from adverse movements in exchange rates. Foreign currency exposures are reviewed periodically and any natural offsets are considered prior to entering into a derivative financial instrument. The Company's primary foreign exchange operating exposures include the Euro, Korean Won, Czech Koruna, Hungarian Forint and Mexican Peso. Where possible, the Company utilizes a strategy of partial coverage for transactions in these currencies. As of September 30, 2012, the net fair value of foreign currency forward contracts was an asset of $17 million while at December 31, 2011 the net fair value of forward contracts was a liability of $16 million.
The hypothetical pre-tax gain or loss in fair value from a 10% favorable or adverse change in quoted currency exchange rates would be approximately $56 million and $74 million as of September 30, 2012 and December 31, 2011, respectively. These estimated changes assume a parallel shift in all currency exchange rates and include the gain or loss on financial instruments used to hedge loans to subsidiaries. Because exchange rates typically do not all move in the same direction, the estimate may overstate the impact of changing exchange rates on the net fair value of the Company's financial derivatives. It is also important to note that gains and losses indicated in the sensitivity analysis would generally be offset by gains and losses on the underlying exposures being hedged.
In addition to the transactional exposure described above, the Company's operating results are impacted by the translation of its foreign operating income into U.S. dollars. The Company does not enter into foreign exchange contracts to mitigate this exposure.
Interest Rate Risk
The Company is subject to interest rate risk, principally in relation to fixed rate debt. The Company may use derivative financial instruments to manage exposure to fluctuations in interest rates. However, as of September 30, 2012, the Company had no outstanding interest rate derivative instruments.
Prior to the April 6, 2011 Term Loan refinancing, the Company was subject to interest rate risk, principally in relation to variable rate debt. During the fourth quarter of 2010, the Company entered into an interest rate swap with a notional amount of $250 million related to the Term Loan. These swaps effectively converted designated cash flows associated with underlying interest payments on the Term Loan from a variable interest rate to a fixed interest rate and were designated as cash flow hedges. In conjunction with the term loan refinance, the Company terminated its outstanding interest rate swaps, which were settled for a loss of less than $1 million.
Approximately 86% and 87% of the Company's borrowings were effectively on a fixed rate basis as of September 30, 2012 and December 31, 2011, respectively. The Company continues to evaluate its interest rate exposure and may use swaps or other derivative instruments again in the future.
Commodity Risk
The Company's exposures to market risk from changes in the price of production material are managed primarily through negotiations with suppliers and customers, although there can be no assurance that the Company will recover all such costs. The Company continues to evaluate derivatives available in the marketplace and may decide to utilize derivatives in the future to manage select commodity risks if an acceptable hedging instrument is identified for the Company's exposure level at that time, as well as the effectiveness of the financial hedge among other factors.
|
ITEM 4.
|
CONTROLS AND PROCEDURES
|
Disclosure Controls and Procedures
The Company maintains disclosure controls and procedures that are designed to ensure that information required to be disclosed in periodic reports filed with the SEC under the Securities Exchange Act of 1934 is recorded, processed, summarized, and reported within the time periods specified in the SEC’s rules and forms, and that such information is accumulated and communicated to the Company’s management, including its Chief Executive Officer and Chief Financial Officer, as appropriate, to allow timely decisions regarding required disclosure.
As of September 30, 2012, an evaluation was performed under the supervision and with the participation of the Company’s management, including its Chief Executive and Financial Officers, of the effectiveness of the design and operation of disclosure controls and procedures. Based on that evaluation, the Chief Executive Officer and the Chief Financial Officer concluded that the Company’s disclosure controls and procedures were effective as of September 30, 2012.
Internal Control over Financial Reporting
There were no changes in the Company's internal control over financial reporting during the quarterly period ended September 30, 2012 that have materially affected, or are reasonably likely to materially affect, the Company's internal control over financial reporting.
OTHER INFORMATION
|
ITEM 1.
|
LEGAL PROCEEDINGS
|
See the information above under Note 17, "Commitments and Contingencies," to the consolidated financial statements which is incorporated herein by reference.
|
ITEM 1A.
|
RISK FACTORS
|
Certain tax benefit preservation provisions of our corporate documents could delay or prevent a change of control, even if that change would be beneficial to stockholders.
Our second amended and restated certificate of incorporation provides, among other things, that any attempted transfer of the Company's securities during a Restricted Period shall be prohibited and void
ab initio
insofar as it purports to transfer ownership or rights in respect of such stock to the purported transferee to the extent that, as a result of such transfer, either any person or group of persons shall become a “5-percent shareholder” of Visteon pursuant to Treasury Regulation § 1.382-2T(g), other than a “direct public group” as defined in such regulation (a “Five-Percent Shareholder”), or the percentage stock ownership interest in Visteon of any Five-Percent Shareholder shall be increased.
The foregoing restriction does not apply to transfers if either the transferor or transferee gives written notice to the Board of Directors and obtains their approval. A Restricted Period means any period beginning when the Company's market capitalization falls below $1.5 billion (or such other level determined by the Board of Directors not more frequently than annually) and ending when such market capitalization has been above such threshold for 30 consecutive calendar days.
These restrictions could prohibit or delay the accomplishment of an ownership change with respect to Visteon by (i) discouraging any person or group from being a Five-Percent Shareholder and (ii) discouraging any existing Five-Percent Shareholder from acquiring more than a minimal number of additional shares of Visteon's stock.
For other information regarding factors that could affect the Company's results of operations, financial condition and liquidity, see the risk factors discussed in Part I, "Item 1A. Risk Factors" in the Company's Annual Report on Form 10-K for the year ended December 31, 2011. See also, "Forward-Looking Statements" included in Part I, Item 2 of this Quarterly Report on Form 10-Q.
|
ITEM 2.
|
UNREGISTERED SALES OF EQUITY SECURITIES AND USE OF PROCEEDS
|
The following table summarizes information relating to purchases made by or on behalf of the Company, or an affiliated purchaser, of shares of the Company’s common stock during the third quarter of 2012.
Issuer Purchases of Equity Securities
52
|
Period
|
Total
Number of
Shares (or Units)
Purchased(1)
|
Average
Price Paid
per Share
(or Unit)
|
Total Number
of Shares (or units)
Purchased as Part
of Publicly
Announced Plans
or Programs(2)
|
Approximate
Dollar Value
of Shares (or Units)
that May Yet Be
Purchased Under the
Plans or Programs(2) (in millions)
|
|||||
|
July 1, 2012 to July 31, 2012
|
8,529
|
|
$
|
32.43
|
|
—
|
$
|
100
|
|
|
August 1, 2012 to August 31, 2012
|
99,885
|
|
$
|
38.80
|
|
—
|
$
|
100
|
|
|
September 1, 2012 to September 30, 2012
|
—
|
|
—
|
|
—
|
$
|
100
|
|
|
|
Total
|
108,414
|
|
$
|
38.30
|
|
—
|
$
|
100
|
|
|
(1)
|
This column includes only shares surrendered to the Company by employees to satisfy tax withholding obligations in connection with the vesting of restricted stock and stock unit awards made pursuant to the Visteon Corporation 2010 Incentive Plan.
|
(2) On July 30, 2012, Visteon's board of directors authorized the repurchase of up to $100 million of the Company's common stock over the subsequent two year period. The Company anticipates that repurchases of common stock, if any, would occur from time to time in open market transactions or in privately negotiated transactions depending on market and economic conditions, share price, trading volume, alternative uses of capital and other factors.
|
ITEM 6.
|
EXHIBITS
|
See Exhibit Index on Page 55.
SIGNATURE
Pursuant to the requirements of the Securities Exchange Act of 1934, the registrant has duly caused this report to be signed on its behalf by the undersigned, thereunto duly authorized.
|
VISTEON CORPORATION
|
||
|
By:
|
/s/ Michael J. Widgren
|
|
|
Michael J. Widgren
|
||
|
Vice President, Corporate Controller, Chief Accounting Officer and Interim Chief Financial Officer
|
||
Date: November 1, 2012
54
Exhibit Index
|
Exhibit No.
|
Description
|
|
|
3.1
|
Third Amended and Restated Bylaws of Visteon Corporation, as amended effective as of September 13, 2012 (incorporated by reference to Exhibit 3.1 to the Current Report on Form 8-K of Visteon Corporation filed on September 18, 2012).
|
|
|
10.1
|
KRW 1 Trillion Bridge Loan Agreement, dated as of July 4, 2012, by and among Visteon Korea Holdings Company and Kookmin Bank (incorporated by reference to Exhibit 10.1 to the Quarterly Report on Form 10-Q of Visteon Corporation filed on August 2, 2012).
.
|
|
|
10.2
|
Fifth Amendment to Revolving Loan Credit Agreement and Consent, dated as of July 3, 2012, by and among Visteon Corporation, certain of its domestic subsidiaries signatory thereto, Morgan Stanley Senior Funding, Inc., as administrative agent and co-collateral agent, Bank of America, N.A., as co-collateral agent, and the lenders and L/C issuers party thereto (incorporated by reference to Exhibit 10.2 to the Quarterly Report on Form 10-Q of Visteon Corporation filed on August 2, 2012).
|
|
|
10.3
|
Amendment and Restatement Relating Bridge Facility Agreement, dated as of July 30, 2012, by and among Visteon Korea Holdings Corporation and Kookmin Bank (incorporated by reference to Exhibit 10.3 to the Quarterly Report on Form 10-Q of Visteon Corporation filed on August 2, 2012).
|
|
|
10.4
|
Employment Agreement by and between Timothy D. Leuliette and Visteon Corporation, dated as of September 30, 2012 (incorporated by reference to Exhibit 10.1 to the Current Report on Form 8-K of Visteon Corporation filed on October 2, 2012).*
|
|
|
10.5
|
Change in Control Agreement by and between Timothy D. Leuliette and Visteon Corporation, dated as of September 30, 2012 (incorporated by reference to Exhibit 10.2 to the Current Report on Form 8-K of Visteon Corporation filed on October 2, 2012).*
|
|
|
10.6
|
Restricted Stock Unit Grant Agreement for Timothy D. Leuliette under the Visteon Corporation 2010 Incentive Plan (incorporated by reference to Exhibit 10.3 to the Current Report on Form 8-K of Visteon Corporation filed on October 2, 2012).*
|
|
|
10.7
|
Performance Stock Unit Grant Agreement for Timothy D. Leuliette under the Visteon Corporation 2010 Incentive Plan (incorporated by reference to Exhibit 10.4 to the Current Report on Form 8-K of Visteon Corporation filed on October 2, 2012).*
|
|
|
10.8
|
Amendment, dated as of September 13, 2012, to the Visteon Corporation 2010 Supplemental Executive Retirement Plan (incorporated by reference to Exhibit 10.1 to the Current Report on Form 8-K of Visteon Corporation filed on September 18, 2012).*
|
|
|
10.9
|
Amendment, dated as of September 13, 2012, to the Visteon Corporation 2011 Savings Parity Plan, as amended through September 13, 2012 (incorporated by reference to Exhibit 10.2 to the Current Report on Form 8-K of Visteon Corporation filed on September 18, 2012)*
|
|
|
10.1
|
Amendment, dated as of September 13, 2012, to the Terms and Conditions of Restricted Stock Grants under the Visteon Corporation 2010 Incentive Plan and the Terms and Conditions of Restricted Stock Unit Grants under the Visteon Corporation 2010 Incentive Plan (incorporated by reference to Exhibit 10.3 to the Current Report on Form 8-K of Visteon Corporation filed on September 18, 2012).*
|
|
|
10.11
|
Separation Agreement by and between Martin E. Welch III and Visteon Corporation, dated as of October 3, 2012 (incorporated by reference to Exhibit 10.1 to the Current Report on Form 8-K of Visteon Corporation filed on October 4, 2012).*
|
|
|
10.12
|
Separation Agreement by and between Donald J. Stebbins and Visteon Corporation, dated as of August 10, 2012 (incorporated by reference to Exhibit 10.1 to the Current Report on Form 8-K of Visteon Corporation filed on August 13, 2012).*
|
|
|
10.13
|
Letter Agreement, dated August 10, 2012, relating to the appointment of Timothy D. Leuliette as Interim Chairman of the Board, Interim Chief Executive Officer and Interim President (incorporated by reference to Exhibit 10.2 to the Current Report on Form 8-K of Visteon Corporation filed on August 13, 2012).*
|
|
|
10.14
|
2010 Visteon Executive Severance Plan, as amended and restated as of October 18, 2012
(incorporated by reference to Exhibit 10.1 to the Current Report on Form 8-K of Visteon Corporation filed on October 31, 2012).*
|
|
|
10.15
|
Form of Change in Control Agreement between Visteon Corporation and executive officers of Visteon Corporation (incorporated by reference to Exhibit 10.2 to the Current Report on Form 8-K of Visteon Corporation filed on October 31, 2012).*
|
|
|
10.16
|
Form of executive Performance Stock Unit Grant Agreement (incorporated by reference to Exhibit 10.3 to the Current Report on Form 8-K of Visteon Corporation filed on October 31, 2012).*
|
|
|
10.17
|
Form of executive Restricted Stock Unit Grant Agreement (incorporated by reference to Exhibit 10.4 to the Current Report on Form 8-K of Visteon Corporation filed on October 31, 2012).*
|
|
|
10.18
|
Restricted Stock Unit Grant Agreement, dated October 18, 2012, between Visteon Corporation and Francis M. Scricco, Chairman.*
|
|
|
31.1
|
Rule 13a-14(a) Certification of Chief Executive Officer dated November 1, 2012.
|
|
55
|
Exhibit No.
|
Description
|
|
|
31.2
|
Rule 13a-14(a) Certification of Chief Financial Officer dated November 1, 2012.
|
|
|
32.1
|
Section 1350 Certification of Chief Executive Officer dated November 1, 2012.
|
|
|
32.2
|
Section 1350 Certification of Chief Financial Officer dated November 1, 2012.
|
|
|
101.INS
|
XBRL Instance Document.**
|
|
|
101.SCH
|
XBRL Taxonomy Extension Schema Document.**
|
|
|
101.CAL
|
XBRL Taxonomy Extension Calculation Linkbase Document.**
|
|
|
101.LAB
|
XBRL Taxonomy Extension Label Linkbase Document.**
|
|
|
101.PRE
|
XBRL Taxonomy Extension Presentation Linkbase Document.**
|
|
|
101.DEF
|
XBRL Taxonomy Extension Definition Linkbase Document.**
|
|
|
*
|
Indicates that exhibit is a management contract or compensatory plan or arrangement.
|
|
**
|
Pursuant to Rule 406T of Regulation S-T, the Interactive Data Files as Exhibit 101 hereto are deemed not filed or part of a registration statement or prospectus for purposes of Sections 11 or 12 of the Securities Act of 1933, as amended, are deemed not filed for purposes of Section 18 of the Securities and Exchange Act of 1934, as amended, and otherwise are not subject to liability under those sections.
|
In lieu of filing certain instruments with respect to long-term debt of the kind described in Item 601(b)(4) of Regulation S-K, Visteon agrees to furnish a copy of such instruments to the Securities and Exchange Commission upon request.
56
TABLE OF CONTENTS
Part IItem 1. Consolidated Financial StatementsNote 1. Basis Of PresentationNote 2. Discontinued OperationsNote 3. Restructuring and Other (income) / ExpensesNote 4. InventoriesNote 5. Other AssetsNote 6. Property and EquipmentNote 7. Non-consolidated AffiliatesNote 8. Intangible AssetsNote 9. Other LiabilitiesNote 10. DebtNote 11. Employee Retirement BenefitsNote 12. Share Based CompensationNote 13. Income TaxesNote 14. Shareholders Equity and Non-controlling InterestsNote 15. Earnings (loss) Per ShareNote 16. Fair Value Measurements and Financial InstrumentsNote 17. Commitments and ContingenciesNote 18. Segment InformationNote 19. Condensed Consolidating Financial Information Of Guarantor SubsidiariesItem 2. Management S Discussion and Analysis Of Financial Condition and Results Of OperationsItem 3. Quantitative and Qualitative Disclosures About Market RiskItem 4. Controls and ProceduresPart IIItem 1. Legal ProceedingsItem 1A. Risk FactorsItem 2. Unregistered Sales Of Equity Securities and Use Of ProceedsItem 6. Exhibits