VISTEON CORP
10-Ks and 10-Qs
|
|
|
|
|
|
|
|
|
|
|
|
|
|
|
|
|
|
|
|
|
|
|
|
|
|
|
|
|
|
|
|
|
|
|
|
|
|
|
|
|
|
|
|
|
|
|
|
|
|
|
|
|
UNITED STATES
SECURITIES AND EXCHANGE COMMISSION
Washington D.C. 20549
________________
FORM 10-Q
(Mark One)
|
þ
|
QUARTERLY REPORT PURSUANT TO SECTION 13 OR 15(d)
|
OF THE SECURITIES EXCHANGE ACT OF 1934
For the quarterly period ended
September 30, 2015
,
OR
|
¨
|
TRANSITION REPORT PURSUANT TO SECTION 13 OR 15(d)
|
OF THE SECURITIES EXCHANGE ACT OF 1934
For the transition period from ____________ to ____________
Commission file number 001-15827
VISTEON CORPORATION
(Exact name of registrant as specified in its charter)
|
State of Delaware
|
38-3519512
|
|
(State or other jurisdiction of incorporation or organization)
|
(I.R.S. Employer Identification No.)
|
|
One Village Center Drive, Van Buren Township, Michigan
|
48111
|
|
(Address of principal executive offices)
|
(Zip code)
|
Registrant’s telephone number, including area code: (800)-VISTEON
Not applicable
(Former name, former address and former fiscal year, if changed since last report)
Indicate by check mark whether the registrant: (1) has filed all reports required to be filed by Section 13 or 15(d) of the Securities Exchange Act of 1934 during the preceding 12 months (or for such shorter period that the Registrant was required to file such reports), and (2) has been subject to such filing requirements for the past 90 days. Yes
ü
No__
Indicate by check mark whether the registrant: has submitted electronically and posted on its corporate Web site, if any, every Interactive Data File required to be submitted and posted pursuant to Rule 405 of Regulation S-T (§232.405 of this chapter) during the preceding 12 months (or for such shorter period that the registrant was required to submit and post such files). Yes
ü
No __
Indicate by check mark whether the registrant is a large accelerated filer, an accelerated filer, a non-accelerated filer, or a smaller reporting company. See the definitions of “large accelerated filer," "accelerated filer” and "smaller reporting company" in Rule 12b-2 of the Exchange Act.
Large accelerated filer
ü
Accelerated filer __ Non-accelerated filer __ Smaller reporting company __
Indicate by check mark whether the registrant is a shell company (as defined in Rule 12b-2 of the Exchange Act). Yes __ No
ü
Indicate by check mark whether the registrant has filed all documents and reports required to be filed by Sections 12, 13 or 15(d) of the Securities Exchange Act of 1934 subsequent to the distribution of securities under a plan confirmed by a court. Yes
ü
No__
As of
October 30, 2015
, the registrant had outstanding
40,822,620
shares of common stock.
Exhibit index located on page number 63.
1
Visteon Corporation and Subsidiaries
Index
|
Part I - Financial Information
|
Page
|
|
|
Item 1 - Consolidated Financial Statements
|
||
|
Consolidated Statements of Comprehensive Income (Unaudited)
|
||
|
Consolidated Balance Sheets (Unaudited)
|
||
|
Consolidated Statements of Cash Flows (Unaudited)
|
||
|
Notes to Consolidated Financial Statements (Unaudited)
|
||
|
Item 2 - Management's Discussion and Analysis of Financial Condition and Results of Operations
|
||
|
Item 3 - Quantitative and Qualitative Disclosures about Market Risk
|
||
|
Item 4 - Controls and Procedures
|
||
|
Part II - Other Information
|
||
|
Item 1 - Legal Proceedings
|
||
|
Item 1A - Risk Factors
|
||
|
Item 2 - Unregistered Sales of Equity Securities and Use of Proceeds
|
||
|
Item 6 - Exhibits
|
||
|
Signatures
|
||
|
Exhibit Index
|
||
2
Financial Information
|
Item 1.
|
Consolidated Financial Statements
|
VISTEON CORPORATION AND SUBSIDIARIES
(Dollars in Millions Except Per Share Amounts)
(Unaudited)
|
Three Months Ended September 30
|
Nine Months Ended September 30
|
||||||||||||||
|
2015
|
2014
|
2015
|
2014
|
||||||||||||
|
Sales
|
$
|
808
|
|
$
|
793
|
|
$
|
2,436
|
|
$
|
1,798
|
|
|||
|
Cost of sales
|
703
|
|
700
|
|
2,120
|
|
1,575
|
|
|||||||
|
Gross margin
|
105
|
|
93
|
|
316
|
|
223
|
|
|||||||
|
Selling, general and administrative expenses
|
59
|
|
70
|
|
182
|
|
164
|
|
|||||||
|
Restructuring expense
|
3
|
|
8
|
|
18
|
|
22
|
|
|||||||
|
Interest expense
|
3
|
|
6
|
|
15
|
|
21
|
|
|||||||
|
Interest income
|
1
|
|
2
|
|
2
|
|
6
|
|
|||||||
|
Loss on debt extinguishment
|
—
|
|
—
|
|
5
|
|
23
|
|
|||||||
|
Equity in net (loss) income of non-consolidated affiliates
|
(3
|
)
|
(2
|
)
|
8
|
|
5
|
|
|||||||
|
Gain on sale of non-consolidated affiliates
|
—
|
|
—
|
|
62
|
|
2
|
|
|||||||
|
Other expense, net
|
7
|
|
20
|
|
15
|
|
42
|
|
|||||||
|
Income (loss) before income taxes
|
31
|
|
(11
|
)
|
153
|
|
(36
|
)
|
|||||||
|
Provision for income taxes
|
10
|
|
10
|
|
43
|
|
21
|
|
|||||||
|
Net income (loss) from continuing operations
|
21
|
|
(21
|
)
|
110
|
|
(57
|
)
|
|||||||
|
(Loss) income from discontinued operations, net of tax
|
(11
|
)
|
22
|
|
2,194
|
|
(35
|
)
|
|||||||
|
Net income (loss)
|
10
|
|
1
|
|
2,304
|
|
(92
|
)
|
|||||||
|
Net income attributable to non-controlling interests
|
5
|
|
22
|
|
41
|
|
65
|
|
|||||||
|
Net income (loss) attributable to Visteon Corporation
|
$
|
5
|
|
$
|
(21
|
)
|
$
|
2,263
|
|
$
|
(157
|
)
|
|||
|
Basic earnings (loss) per share:
|
|||||||||||||||
|
Continuing operations
|
$
|
0.39
|
|
$
|
(0.59
|
)
|
$
|
2.17
|
|
$
|
(1.62
|
)
|
|||
|
Discontinued operations
|
(0.27
|
)
|
0.11
|
|
50.58
|
|
(1.78
|
)
|
|||||||
|
Basic earnings (loss) per share attributable to Visteon Corporation
|
$
|
0.12
|
|
$
|
(0.48
|
)
|
$
|
52.75
|
|
$
|
(3.40
|
)
|
|||
|
Diluted earnings (loss) per share:
|
|||||||||||||||
|
Continuing operations
|
$
|
0.38
|
|
$
|
(0.59
|
)
|
$
|
2.12
|
|
$
|
(1.62
|
)
|
|||
|
Discontinued operations
|
(0.26
|
)
|
0.11
|
|
49.43
|
|
(1.78
|
)
|
|||||||
|
Diluted earnings (loss) per share attributable to Visteon Corporation
|
$
|
0.12
|
|
$
|
(0.48
|
)
|
$
|
51.55
|
|
$
|
(3.40
|
)
|
|||
|
Comprehensive income (loss):
|
|||||||||||||||
|
Comprehensive (loss) income
|
$
|
(18
|
)
|
$
|
(105
|
)
|
$
|
2,305
|
|
$
|
(185
|
)
|
|||
|
Comprehensive (loss) income attributable to Visteon Corporation
|
$
|
(19
|
)
|
$
|
(112
|
)
|
$
|
2,277
|
|
$
|
(236
|
)
|
|||
See accompanying notes to the consolidated financial statements.
3
VISTEON CORPORATION AND SUBSIDIARIES
(Dollars in Millions)
|
(Unaudited)
|
|||||||
|
September 30
|
December 31
|
||||||
|
2015
|
2014
|
||||||
|
ASSETS
|
|||||||
|
Cash and equivalents
|
$
|
2,860
|
|
$
|
476
|
|
|
|
Short-term investments
|
52
|
|
—
|
|
|||
|
Restricted cash
|
8
|
|
9
|
|
|||
|
Accounts receivable, net
|
554
|
|
531
|
|
|||
|
Inventories, net
|
202
|
|
208
|
|
|||
|
Current assets held for sale
|
17
|
|
1,660
|
|
|||
|
Other current assets
|
198
|
|
250
|
|
|||
|
Total current assets
|
3,891
|
|
3,134
|
|
|||
|
Property and equipment, net
|
341
|
|
363
|
|
|||
|
Intangible assets, net
|
141
|
|
156
|
|
|||
|
Investments in non-consolidated affiliates
|
58
|
|
99
|
|
|||
|
Non-current assets held for sale
|
—
|
|
1,426
|
|
|||
|
Other non-current assets
|
435
|
|
145
|
|
|||
|
Total assets
|
$
|
4,866
|
|
$
|
5,323
|
|
|
|
LIABILITIES AND EQUITY
|
|||||||
|
Short-term debt, including current portion of long-term debt
|
$
|
33
|
|
$
|
29
|
|
|
|
Accounts payable
|
506
|
|
485
|
|
|||
|
Accrued employee liabilities
|
122
|
|
114
|
|
|||
|
Current liabilities held for sale
|
11
|
|
987
|
|
|||
|
Other current liabilities
|
287
|
|
217
|
|
|||
|
Total current liabilities
|
959
|
|
1,832
|
|
|||
|
Long-term debt
|
349
|
|
587
|
|
|||
|
Employee benefits
|
453
|
|
489
|
|
|||
|
Deferred tax liabilities
|
34
|
|
53
|
|
|||
|
Non-current liabilities held for sale
|
—
|
|
432
|
|
|||
|
Other non-current liabilities
|
223
|
|
109
|
|
|||
|
Stockholders’ equity:
|
|||||||
|
Preferred stock (par value $0.01, 50 million shares authorized, none outstanding at September 30, 2015 and December 31, 2014)
|
—
|
|
—
|
|
|||
|
Common stock (par value $0.01, 250 million shares authorized, 55 million and 54 million shares issued, and 41 million and 44 million shares outstanding at September 30, 2015 and December 31, 2014, respectively)
|
1
|
|
1
|
|
|||
|
Stock warrants
|
1
|
|
3
|
|
|||
|
Additional paid-in capital
|
1,244
|
|
1,246
|
|
|||
|
Retained earnings
|
2,924
|
|
661
|
|
|||
|
Accumulated other comprehensive loss
|
(285
|
)
|
(299
|
)
|
|||
|
Treasury stock
|
(1,200
|
)
|
(747
|
)
|
|||
|
Total Visteon Corporation stockholders’ equity
|
2,685
|
|
865
|
|
|||
|
Non-controlling interests
|
163
|
|
956
|
|
|||
|
Total equity
|
2,848
|
|
1,821
|
|
|||
|
Total liabilities and equity
|
$
|
4,866
|
|
$
|
5,323
|
|
|
See accompanying notes to the consolidated financial statements.
4
VISTEON CORPORATION AND SUBSIDIARIES
(Dollars in Millions)
(Unaudited)
|
Nine Months Ended
September 30 |
|||||||
|
2015
|
2014
|
||||||
|
Operating Activities
|
|||||||
|
Net income (loss)
|
$
|
2,304
|
|
$
|
(92
|
)
|
|
|
Adjustments to reconcile net income to net cash provided from operating activities:
|
|||||||
|
Gain on Climate Transaction
|
(2,332
|
)
|
—
|
|
|||
|
Gain on sale of non-consolidated affiliates
|
(62
|
)
|
(2
|
)
|
|||
|
Asset impairments and losses on divestitures
|
17
|
|
188
|
|
|||
|
Depreciation and amortization
|
147
|
|
205
|
|
|||
|
Loss on debt extinguishment
|
5
|
|
23
|
|
|||
|
Equity in net income of non-consolidated affiliates, net of dividends remitted
|
—
|
|
7
|
|
|||
|
Pension settlement gain
|
—
|
|
(25
|
)
|
|||
|
Non-cash stock-based compensation
|
7
|
|
7
|
|
|||
|
Other non-cash items
|
4
|
|
14
|
|
|||
|
Changes in assets and liabilities:
|
|||||||
|
Accounts receivable
|
(7
|
)
|
5
|
|
|||
|
Inventories
|
(29
|
)
|
(33
|
)
|
|||
|
Accounts payable
|
48
|
|
(58
|
)
|
|||
|
Accrued income taxes
|
135
|
|
14
|
|
|||
|
Other assets and other liabilities
|
37
|
|
(73
|
)
|
|||
|
Net cash provided from operating activities
|
274
|
|
180
|
|
|||
|
Investing Activities
|
|||||||
|
Proceeds from Climate Transaction
|
2,664
|
|
—
|
|
|||
|
Capital expenditures
|
(151
|
)
|
(209
|
)
|
|||
|
Short-term investments
|
(52
|
)
|
—
|
|
|||
|
Acquisition of businesses, net of cash acquired
|
—
|
|
(308
|
)
|
|||
|
Loan to non-consolidated affiliate
|
(10
|
)
|
—
|
|
|||
|
Proceeds from sale of non-consolidated affiliates
|
91
|
|
62
|
|
|||
|
Other business divestitures and acquisitions
|
(19
|
)
|
—
|
|
|||
|
Other
|
8
|
|
(6
|
)
|
|||
|
Net cash provided from (used by) investing activities
|
2,531
|
|
(461
|
)
|
|||
|
Financing Activities
|
|||||||
|
Short-term debt, net
|
(1
|
)
|
42
|
|
|||
|
Proceeds from issuance of debt, net of issuance costs
|
—
|
|
618
|
|
|||
|
Principal payments on debt
|
(250
|
)
|
(16
|
)
|
|||
|
Repurchase of long-term notes
|
—
|
|
(419
|
)
|
|||
|
Repurchase of common stock
|
(500
|
)
|
(500
|
)
|
|||
|
Dividends paid to non-controlling interests
|
(31
|
)
|
(84
|
)
|
|||
|
Exercised warrants and stock options
|
24
|
|
17
|
|
|||
|
Other
|
(1
|
)
|
(2
|
)
|
|||
|
Net cash used by financing activities
|
(759
|
)
|
(344
|
)
|
|||
|
Effect of exchange rate changes on cash and equivalents
|
(13
|
)
|
(17
|
)
|
|||
|
Net increase (decrease) in cash and equivalents
|
2,033
|
|
(642
|
)
|
|||
|
Cash and equivalents at beginning of the period
|
827
|
|
1,677
|
|
|||
|
Cash and equivalents at end of the period
|
$
|
2,860
|
|
$
|
1,035
|
|
|
1
The Company has combined cash flows from discontinued operations with cash flows from continuing operations within the operating, investing and financing categories. As such, cash and equivalents above include amounts reflected in current assets held for sale on the Consolidated Balance Sheets.
See accompanying notes to the consolidated financial statements.
5
VISTEON CORPORATION AND SUBSIDIARIES
NOTES TO CONSOLIDATED FINANCIAL STATEMENTS
Visteon Corporation (the “Company” or “Visteon”) is a global supplier of automotive systems, modules and components to automotive original equipment manufacturers (“OEMs”) worldwide including Ford, Nissan, Renault, Mazda, BMW, General Motors and Honda. Headquartered in Van Buren Township, Michigan, Visteon has a current workforce of approximately
11,000
employees dedicated to the design, development, manufacture and support of its product offerings and its global customers. The Company's manufacturing and engineering footprint is principally located outside of the U.S., with a heavy concentration in low-cost geographic regions.
Visteon delivers value for its customers and stockholders through its technology-focused core vehicle cockpit electronics business. The Company's vehicle cockpit electronics product line includes audio systems, infotainment systems, driver information systems, connectivity and telematics solutions and electronic control modules. The Company's vehicle cockpit electronics business is comprised of and reported under the Electronics segment. In addition to the Electronics segment, the Company has residual operations in South America and Europe previously associated with the Interiors and Climate businesses, not subject to discontinued operations classification, that comprise the Other segment.
Climate
On
June 9, 2015
, Visteon Corporation and its wholly owned subsidiary, VIHI, LLC (collectively, “Visteon”) completed the sale to Hahn & Co. Auto Holdings Co., Ltd. (“Hahn”) and Hankook Tire Co., Ltd. (“Hankook” and, together with Hahn, the “Purchasers”) of all of its shares of Halla Visteon Climate Control Corporation, a Korean corporation (“HVCC”), for approximately $
3.4 billion
, or KRW
52,000
per share, after adjusting for the 2014 dividend paid by HVCC to Visteon (the “Climate Transaction”), pursuant to and in accordance with the Share Purchase Agreement, dated as of December 17, 2014 (the “Purchase Agreement”), among Visteon and the Purchasers. See Note 3 "Discontinued Operations" for additional disclosures. The Company received net cash proceeds of approximately
$2.7 billion
and recognized a pre-tax gain of approximately
$2.3 billion
in connection with the closing of the Climate Transaction.
In connection with the closing of the Climate Transaction, Visteon, HVCC and/or the Purchasers have entered into certain other agreements, including a transition agreement (pursuant to which the parties will provide certain transition services for a specified period following the closing), a remediation agreement (pursuant to which Visteon will provide certain information technology services for a period of time), engineering and support agreements (pursuant to which the parties will support certain operations of the other following the closing), and a letter agreement (pursuant to which Visteon has agreed to purchase from HVCC certain electronics operations located in India).
Electronics
On
July 1, 2014
, the Company completed the acquisition of substantially all of the global automotive electronics business of Johnson Controls Inc. (the "Electronics Acquisition") for an aggregate purchase price of
$299 million
funded with cash on hand, including
$31 million
of cash and equivalents at the acquired business. The operating results for the business acquired have been included in the Electronics segment from the date of acquisition. The Electronics Acquisition was accounted for as a business combination, with the purchase price allocated as of
July 2014
and finalized as of September 2015.
Interiors
In
May 2014
, pursuant to a Master Purchase Agreement, as subsequently amended, Visteon agreed to divest substantially all of its global Interiors business (the "Interiors Divestiture") in exchange for the assumption of certain liabilities related to the Company's Interiors business and the payment of nominal cash consideration. Effective
November 1, 2014
, the Company closed on the majority of the Interiors Divestiture (the "Master Closing"). Subsequent to the Master Closing, Visteon completed the sale of Interiors operations in India and Thailand on
December 1, 2014
and
February 2, 2015
, respectively. Remaining operations subject to the Interiors Divestiture are located in Argentina and Brazil and are expected to close during 2015. Assets and liabilities associated with these operations continue to meet the "held for sale" criteria at
September 30, 2015
and were classified as "Other current assets" or "Other current liabilities" in the consolidated balance sheets. These remaining transactions are subject to various conditions, including regulatory and antitrust approvals, receipt of other third party consents and approvals and other customary closing conditions, and may be subject to further cash impacts based on purchase price adjustments at the time of closing. The Company expects to record losses in connection with the Argentina and Brazil portions of the Interiors Divestiture in future periods upon closing, which are estimated to be approximately
$20 million
.
6
In preparing the
September 30, 2015
, financial statements, the Company determined that an indicator of impairment existed in relation to the long-lived assets of the Berlin, Germany interiors operation that is not subject to the Interiors Divestiture. Accordingly, the Company performed a recoverability test utilizing a probability weighted analysis of cash flows associated with continuing the operations and estimated cash flows associated with the potential sale of the operations. As a result of the analysis, the Company concluded that the assets were not recoverable. However, as the fair value of the underlying assets were determined to be in excess of the respective carrying value, no impairment was recorded as of
September 30, 2015
. The Company did not meet the specific criteria considered necessary for the Berlin, Germany interiors operation to be considered held for sale as of
September 30, 2015
.
Subsequently on October 30, 2015, Visteon entered into an agreement to sell and transfer its equity ownership in Visteon Deutschland GmbH, which operates the Berlin, Germany interiors plant with 2014 annual sales of approximately
$115 million
, to APCH Automotive Plastic Components Holding GmbH. Visteon will contribute cash and other assets in an amount approximately equivalent to the estimated net pension related liabilities of
$190 million
. The Company expects to record an estimated loss of
$100 million
in connection with the sale, anticipated to occur on or around December 1, 2015.
The unaudited consolidated financial statements of the Company have been prepared in accordance with the rules and regulations of the U.S. Securities and Exchange Commission. Certain information and footnote disclosures normally included in financial statements prepared in accordance with accounting principles generally accepted in the United States ("U.S. GAAP") have been condensed or omitted pursuant to such rules and regulations. These interim consolidated financial statements include all adjustments (consisting of normal recurring adjustments, except as otherwise disclosed) that management believes are necessary for a fair presentation of the results of operations, financial position and cash flows of the Company for the interim periods presented. Interim results are not necessarily indicative of full-year results.
Principles of Consolidation:
The consolidated financial statements include the accounts of the Company and all subsidiaries that are more than 50% owned and over which the Company exercises control. Investments in affiliates of greater than 20% and for which the Company exercises significant influence but does not exercise control are accounted for using the equity method. All other investments in non-consolidated affiliates are accounted for using the cost method.
Use of Estimates:
The preparation of the financial statements in conformity with U.S. GAAP requires management to make estimates, judgments and assumptions that affect amounts reported herein. Management believes that such estimates, judgments and assumptions are reasonable and appropriate. However, due to the inherent uncertainty involved, actual results may differ from those provided in the Company's consolidated financial statements.
Reclassifications:
Certain prior period amounts have been reclassified to conform to the current period presentation.
Other Expense, Net:
Other expense, net includes transformation initiatives, integration costs and a provision for losses on recoverable non-income based taxes. Transformation initiatives include financial and advisory fees incurred in connection with execution of the Company's comprehensive value creation plan and certain severance costs associated with the Electronics Acquisition and the Climate Transaction. Transformation initiatives also include favorable hedging and exchange impacts of
$19 million
for the
nine
-month period ended
September 30, 2015
, related to the Climate Transaction proceeds.
Integration costs include costs associated with re-branding, facility modification, information technology readiness and related professional services necessary to integrate businesses associated with the Electronics Acquisition. The Company expects to incur total integration costs of
$40 million
over a two-year period through the end of 2015, of which
$29 million
has been incurred through
September 30, 2015
.
7
|
Three Months Ended
September 30 |
Nine Months Ended
September 30 |
||||||||||||||
|
2015
|
2014
|
2015
|
2014
|
||||||||||||
|
(Dollars in Millions)
|
|||||||||||||||
|
Transformation initiatives
|
$
|
5
|
|
$
|
11
|
|
$
|
4
|
|
$
|
18
|
|
|||
|
Integration costs
|
2
|
|
4
|
|
11
|
|
11
|
|
|||||||
|
Loss on asset contribution
|
—
|
|
3
|
|
—
|
|
3
|
|
|||||||
|
Provision for losses on recoverable taxes
|
—
|
|
—
|
|
—
|
|
8
|
|
|||||||
|
Other
|
—
|
|
2
|
|
—
|
|
2
|
|
|||||||
|
$
|
7
|
|
$
|
20
|
|
$
|
15
|
|
$
|
42
|
|
||||
Cash and Equivalents:
The Company considers all highly liquid investments purchased with a maturity of three months or less, including short-term time deposits, commercial paper, repurchase agreements and money market funds to be cash equivalents. As of
September 30, 2015
the Company's cash balances are invested in a diversified portfolio of cash and cash equivalents including money market funds, commercial paper rated A2/P2 and above with maturity under three months, time deposits and other short-term cash investments, which mature under three months with highly rated banking institutions. The cost of such funds approximates fair value based on the nature of the investment.
Short-term Investments:
Short-term investments of $52 million as of
September 30, 2015
include corporate bonds and asset backed securities with maturities between three and twelve months held as part of the Company's separately managed accounts. The cost of these Level 1 investments approximates fair value.
Restricted Cash:
Restricted cash represents amounts designated for uses other than current operations and includes
$6 million
related to the Letter of Credit Facility with US Bank National Association, and
$2 million
related to cash collateral for other corporate purposes at
September 30, 2015
.
Investments in Affiliates:
The Company recorded a loss for equity in the net income of affiliates of
$3 million
and
$2 million
for the three-month periods ended
September 30, 2015
and
2014
, respectively. For the
nine
-month periods ended
September 30, 2015
, and
2014
, the Company recorded equity in the net income of affiliates of
$8 million
and
$5 million
, respectively. Investments in affiliates were
$58 million
and
$99 million
at
September 30, 2015
and
December 31, 2014
, respectively. At
September 30, 2015
, affiliates accounted for under the equity method totaled
$47 million
and affiliates accounted for under the cost method totaled
$11 million
. The Company monitors its investments in affiliates for indicators of other-than-temporary declines in value on an ongoing basis. If the Company determines that such a decline has occurred, an impairment loss is recorded, which is measured as the difference between carrying value and fair value.
In June 2015, the Company completed the sale of its
12.5%
ownership interest in Yangfeng Visteon Jinqiao Automotive Trim Systems Co., Ltd. ("Jinqiao"), a Chinese automotive supplier for proceeds of approximately
$91 million
and recorded a pre-tax gain of
$62 million
during the
nine
months ended
September 30, 2015
.
In April 2014, the Company completed the sale of its
50%
ownership interest in Duckyang Industry Co., Ltd. ("Duckyang"), a Korean automotive interiors supplier. In connection with the transaction, the Company received total cash of approximately
$31 million
, including
$6 million
of dividends. The Company recorded a pre-tax gain of approximately
$2 million
on this transaction during the
nine
months ended
September 30, 2014
.
Product Warranty and Recall:
Amounts accrued for product warranty and recall claims are based on management’s best estimates of the amounts that will ultimately be required to settle such items. The Company’s estimates for product warranty and recall obligations are developed with support from its sales, engineering, quality and legal functions and include due consideration of contractual arrangements, past experience, current claims and related information, production changes, industry and regulatory developments and various other considerations. The Company can provide no assurances that it will not experience material claims in the future or that it will not incur significant costs to defend or settle such claims beyond the amounts accrued or beyond what the Company may recover from its suppliers. During the
nine
months ended
September 30, 2015
, the Company recorded
$13 million
as changes in estimates for customer actions related to defective supplier parts. The following table provides a reconciliation of changes in the product warranty and recall claims liability.
8
|
Nine Months Ended September 30
|
|||||||
|
2015
|
2014
|
||||||
|
(Dollars in Millions)
|
|||||||
|
Beginning balance
|
$
|
21
|
|
$
|
23
|
|
|
|
Accruals for products shipped
|
11
|
|
6
|
|
|||
|
Changes in estimates
|
13
|
|
—
|
|
|||
|
Foreign currency
|
(3
|
)
|
—
|
|
|||
|
Settlements
|
(12
|
)
|
(8
|
)
|
|||
|
Ending balance
|
$
|
30
|
|
$
|
21
|
|
|
Recently Issued Accounting Pronouncements:
In April 2014, the Financial Accounting Standards Board ("FASB") issued Accounting Standards Update ("ASU") No. 2014-8, "Reporting Discontinued Operations and Disclosures of Disposals of Components of an Entity". This ASU changes the requirements for reporting discontinued operations to disposals of components of an entity that represent strategic shifts that have a major effect on an entity’s operations and financial results and does not prohibit continuing involvement. The standard also expands the disclosures for discontinued operations and requires new disclosures related to individually material disposals that do not qualify for discontinued operations reporting. The guidance was effective for interim and annual periods beginning after December 15, 2014, and should be applied prospectively. The Company adopted this new standard prospectively with effect from January 1, 2015.
In May 2014, the FASB issued ASU No. 2014-9, "Revenue from Contracts with Customers", which is the new comprehensive revenue recognition standard that will supersede existing revenue recognition guidance under U.S. GAAP. The standard's core principle is that a company will recognize revenue when it transfers promised goods or services to a customer in an amount that reflects the consideration to which the company expects to be entitled in exchange for those goods and services. To achieve this principle, an entity identifies the contract with a customer, identifies the separate performance obligations in the contract, determines the transaction price, allocates the transaction price to the separate performance obligations and recognizes revenue when each separate performance obligation is satisfied. This ASU allows for both retrospective and prospective methods of adoption. In July 2015, the FASB approved a one-year deferral of the effective date of the standard. As such, the new standard will become effective for annual and interim periods beginning after December 15, 2017 with early adoption on the original effective date permitted. The Company is currently evaluating the impact of adopting this standard on its consolidated financial statements.
In February 2015, the FASB issued ASU No. 2015-2, "Consolidation (Topic 810)—Amendments to the Consolidation Analysis", which provides guidance on evaluating whether a reporting entity should consolidate certain legal entities. Specifically, the amendments modify the evaluation of whether limited partnerships and similar legal entities are variable interest entities ("VIEs") or voting interest entities. Further, the amendments eliminate the presumption that a general partner should consolidate a limited partnership, as well as affect the consolidation analysis of reporting entities that are involved with VIEs, particularly those that have fee arrangements and related party relationships. This new guidance is effective for interim and annual reporting periods beginning after December 15, 2015, with early adoption permitted. A reporting entity may apply the amendments using a modified retrospective approach or a full retrospective application. The Company does not expect the adoption of this ASU to have a material impact on its consolidated financial statements.
In April 2015, the FASB issued ASU No. 2015-3, "Simplifying the Presentation of Debt Issuance Cost". The ASU requires debt issuance costs associated with a recognized debt liability to be presented on the balance sheet as a direct deduction from the carrying amount of the corresponding debt liability. This new guidance is effective for interim and annual reporting periods beginning after December 15, 2015, with early adoption permitted. An entity should apply the new guidance on a retrospective basis. The Company does not expect the adoption of this ASU to have a material impact on its consolidated financial statements.
In May 2015, the FASB issued ASU 2015-7, “Fair Value Measurement (Topic 820): Disclosures for Investments in Certain Entities That Calculate Net Asset Value per Share (or Its Equivalent)”. This amendment removes the requirement to categorize within the fair value hierarchy all investments for which fair value is measured using the net asset value per share. This new guidance is effective for interim and annual reporting periods beginning after December 15, 2015, with early adoption permitted. A reporting entity should apply the amendments retrospectively to all periods presented. The Company does not expect the adoption of this ASU to have a material impact on its consolidated financial statements.
9
The operations subject to the Interiors Divestiture and Climate Transaction met conditions required to qualify for discontinued operations reporting. Accordingly, the results of operations for the Interiors and Climate businesses have been reclassified to (Loss) income from discontinued operations, net of tax in the consolidated statements of comprehensive income for the
three and nine
-month periods ended
September 30, 2015
and
2014
. The results of operations for the three months ended September 30, 2015 includes certain South America operations subject to the Interiors Divestiture, expected to close during 2015.
Discontinued operations are summarized as follows:
|
Three Months Ended
September 30 |
Nine Months Ended
September 30 |
||||||||||||||
|
2015
|
2014
|
2015
|
2014
|
||||||||||||
|
(Dollars in Millions)
|
|||||||||||||||
|
Sales
|
$
|
16
|
|
$
|
1,385
|
|
$
|
2,184
|
|
$
|
4,402
|
|
|||
|
Cost of sales
|
21
|
|
1,279
|
|
2,021
|
|
4,008
|
|
|||||||
|
Gross margin
|
(5
|
)
|
106
|
|
163
|
|
394
|
|
|||||||
|
Selling, general and administrative expenses
|
1
|
|
50
|
|
76
|
|
148
|
|
|||||||
|
Gain on Climate Transaction
|
—
|
|
—
|
|
2,332
|
|
—
|
|
|||||||
|
Loss and impairment on Interiors Divestiture
|
1
|
|
15
|
|
17
|
|
188
|
|
|||||||
|
Restructuring expense
|
—
|
|
7
|
|
2
|
|
12
|
|
|||||||
|
Interest expense, net
|
—
|
|
2
|
|
2
|
|
5
|
|
|||||||
|
Equity in net income of non-consolidated affiliates
|
—
|
|
4
|
|
6
|
|
10
|
|
|||||||
|
Other expense, net
|
3
|
|
2
|
|
8
|
|
11
|
|
|||||||
|
(Loss) income from discontinued operations before income taxes
|
(10
|
)
|
34
|
|
2,396
|
|
40
|
|
|||||||
|
Provision for income taxes
|
1
|
|
12
|
|
202
|
|
75
|
|
|||||||
|
(Loss) income from discontinued operations, net of tax
|
(11
|
)
|
22
|
|
2,194
|
|
(35
|
)
|
|||||||
|
Net income attributable to non-controlling interests
|
—
|
|
17
|
|
24
|
|
47
|
|
|||||||
|
Net (loss) income from discontinued operations attributable to Visteon
|
$
|
(11
|
)
|
$
|
5
|
|
$
|
2,170
|
|
$
|
(82
|
)
|
|||
During the
nine
-month period ended
September 30, 2015
, the Company received
$3.4 billion
of gross proceeds and recorded a
$2.3 billion
in pre-tax gain associated with the Climate Transaction. A summary of the gain is summarized below (dollars in millions):
|
|
||||
|
Gross proceeds
|
(1)
|
$
|
3,423
|
|
|
Korea withholding tax
|
(2)
|
(377
|
)
|
|
|
Professional fees
|
(3)
|
(20
|
)
|
|
|
Korea security transaction tax
|
(4)
|
(17
|
)
|
|
|
Divested cash balances
|
(5)
|
(345
|
)
|
|
|
Net cash provided from investing activities
|
2,664
|
|
||
|
Net assets divested, excluding cash balances
|
(5)
|
(557
|
)
|
|
|
Information technology separation and service obligations
|
(6)
|
(53
|
)
|
|
|
Employee related charges
|
(7)
|
(45
|
)
|
|
|
Electronics business repurchase obligation
|
(8)
|
(50
|
)
|
|
|
Professional fees
|
(3)
|
(4
|
)
|
|
|
Korea withholding tax recoverable
|
(2)
|
377
|
|
|
|
Net gain on Climate Transaction
|
$
|
2,332
|
|
|
(1) Gross proceeds of
$3.423 billion
were received in connection with the Climate Transaction, translated at a spot rate of
1121.5
KRW to USD on June 9, 2015. Impacts of related hedging activities and exchange on proceeds conversion into USD are included in the Company's consolidated statements of comprehensive income as "Other expense, net" for the
nine
months ended
September 30, 2015
.
10
(2) The Company remitted Korean withholding tax of
$377 million
, reducing proceeds classified as net cash provided from investing activities within the Company's consolidated statements of cash flows for the
nine
months ended
September 30, 2015
. The Company believes it is more likely than not that such amounts will be recovered within one to five years after transaction close. The withholding tax recoverable, including subsequent exchange and interest impacts, is classified within the Company's consolidated balance sheets as "Other non-current assets" as of
September 30, 2015
.
(3) Professional fees of
$24 million
, representing fees paid to financial advisors, were based on a percentage of the gross proceeds, partially offset by previously paid retainer fees of
$4 million
, for a net payment of
$20 million
reducing proceeds classified as net cash provided from investing activities within the Company's consolidated statements of cash flows for the
nine
months ended
September 30, 2015
.
(4) Security transaction taxes of
$17 million
were remitted to the Korean government as of the transaction close, reducing proceeds classified as net cash provided from investing activities within the Company's consolidated statements of cash flows for the
nine
months ended
September 30, 2015
.
(5) Net assets of
$902 million
, including assets, liabilities, accumulated other comprehensive income and non-controlling interests, were divested in connection with the Climate Transaction. Divested assets included
$345 million
of cash balances, reflected as a reduction of transaction proceeds classified as net cash provided from investing activities within the Company's consolidated statements of cash flows for the
nine
months ended
September 30, 2015
.
(6) In connection with the Climate Transaction, the Company has entered an agreement pursuant to which Visteon will provide information technology ongoing and separation services for HVCC to fully operate as an independent entity with estimated costs of approximately
$53 million
. The remaining information technology liability is included in the Company's consolidated balance sheets as "Other current liabilities" as of
September 30, 2015
.
(7) Employee related charges of
$45 million
include bonus payments, the Company's assumption of incentive plan liabilities, and impacts of employment change in control provisions. Bonus payments of
$30 million
are classified in the Company's net cash provided from operating activities within the Company's consolidated statements of cash flows for the
nine
months ended
September 30, 2015
. Amounts remaining to be paid are included in the Company's consolidated balance sheets as "Accrued employee liabilities" as of
September 30, 2015
.
(8) In connection with the Climate Transaction, the Company has entered an agreement to purchase certain electronics operations located in India, expected to close in 2016 after legal separation and regulatory approvals are met. The Company has recorded a repurchase obligation of
$50 million
, representing the estimated purchase price of the subject business. The Company continues to consolidate the business, with net assets of approximately
$22 million
, based on the Company’s continued controlling financial interest. The Company’s controlling financial interest was evaluated based on continued operating control and obligation to fund losses or benefit from earnings. The business is included in a legal entity currently owned by HVCC and therefore the Electronics business assets are not available for general corporate purposes. The repurchase commitment is included in the Company’s consolidated balance sheets as “Other current liabilities” as of
September 30, 2015
.
During the three and
nine
months ended
September 30, 2015
, the Company recorded additional losses and adjustments related to the Interiors Divestiture of $1 million and
$17 million
, respectively, including
$3 million
attributable to the sale of operations in Thailand during February 2015. Consideration associated with the Interiors Divestiture remains subject to further adjustments.
Assets and liabilities related to the Interiors and Climate businesses have been reclassified as held for sale in the consolidated balance sheets. As of
September 30, 2015
, held for sale balances include assets and liabilities associated with operations subject to the Interiors Divestiture located in Argentina and Brazil.
11
Held for sale balances are summarized as follows:
|
September 30
|
December 31
|
||||||
|
2015
|
2014
|
||||||
|
(Dollars in Millions)
|
|||||||
|
ASSETS HELD FOR SALE
|
|||||||
|
Cash and equivalents
|
$
|
—
|
|
$
|
351
|
|
|
|
Restricted cash
|
—
|
|
—
|
|
|||
|
Accounts receivable, net
|
13
|
|
845
|
|
|||
|
Inventories, net
|
4
|
|
334
|
|
|||
|
Other current assets
|
—
|
|
130
|
|
|||
|
Total current assets held for sale
|
17
|
|
1,660
|
|
|||
|
Property and equipment, net
|
—
|
|
1,077
|
|
|||
|
Intangible assets, net
|
—
|
|
251
|
|
|||
|
Investments in non-consolidated affiliates
|
—
|
|
66
|
|
|||
|
Other non-current assets
|
—
|
|
32
|
|
|||
|
Total non-current assets held for sale
|
—
|
|
1,426
|
|
|||
|
Total assets held for sale
|
$
|
17
|
|
$
|
3,086
|
|
|
|
LIABILITIES HELD FOR SALE
|
|||||||
|
Short-term debt, including current portion of long-term debt
|
$
|
—
|
|
$
|
113
|
|
|
|
Accounts payable
|
8
|
|
718
|
|
|||
|
Employee benefits
|
3
|
|
66
|
|
|||
|
Other current liabilities
|
—
|
|
90
|
|
|||
|
Total current liabilities held for sale
|
11
|
|
987
|
|
|||
|
Long-term debt
|
—
|
|
252
|
|
|||
|
Employee benefits
|
—
|
|
77
|
|
|||
|
Deferred tax liabilities
|
—
|
|
67
|
|
|||
|
Other non-current liabilities
|
—
|
|
36
|
|
|||
|
Total non-current liabilities held for sale
|
—
|
|
432
|
|
|||
|
Total liabilities held for sale
|
$
|
11
|
|
$
|
1,419
|
|
|
The Company has combined cash flows from discontinued operations with cash flows from continuing operations within the operating, investing and financing categories within the consolidated statements of cash flows. Cash and non-cash items for certain operating and investing activities related to discontinued operations for the
nine
months ended
September 30, 2015
and
2014
are as follows:
|
Nine Months Ended
September 30 |
|||||||
|
2015
|
2014
|
||||||
|
(Dollars in Millions
|
|||||||
|
Depreciation and amortization
|
$
|
85
|
|
$
|
151
|
|
|
|
Asset impairments and losses on divestiture
|
$
|
17
|
|
$
|
188
|
|
|
|
Capital expenditures
|
$
|
81
|
|
$
|
153
|
|
|
12
During the
three and nine
-month periods ended
September 30, 2015
, the Company recorded
$3 million
and
$20 million
of restructuring expenses, respectively, net of reversals, including
$2 million
for the nine months ended
September 30, 2015
, related to discontinued operations. Given the economically-sensitive and highly competitive nature of the automotive industry, the Company continues to closely monitor current market factors and industry trends taking action as necessary, including but not limited to, additional restructuring actions. However, there can be no assurance that any such actions will be sufficient to fully offset the impact of adverse factors on the Company or its results of operations, financial position and cash flows.
Electronics
In connection with the Electronics Acquisition, the Company commenced a restructuring program designed to achieve cost savings through transaction synergies. Through
September 30, 2015
, the Company has recorded approximately
$51 million
of restructuring expenses under this program, net of reversals, associated with approximately
1,000
employees, and expects to incur up to approximately
$60 million
of restructuring costs during the program. During the
three and nine
months ended
September 30, 2015
, the Company recorded
$2 million
and
$14 million
, respectively, net of reversals, of severance and termination benefits under this program associated with approximately
400
employees. During both the three and nine months ended September 30, 2014, the Company recorded
$5 million
of severance and termination benefits under this program associated with approximately
115
employees, which was initiated during the third quarter of 2014. The Company anticipates recording additional restructuring charges related to this program in future periods as underlying plans are finalized. Approximately
$23 million
remains accrued at
September 30, 2015
.
Corporate
The Company previously announced a restructuring program designed to reduce fixed costs and to improve operational efficiency by addressing certain under-performing operations. In connection with that program, the Company announced plans to realign its corporate and administrative functions directly to their corresponding operational beneficiary. The Company recorded
$1 million
and
$4 million
for restructuring expenses during the three and nine months ended
September 30, 2015
, respectively, primarily related to severance and termination benefits. As of
September 30, 2015
,
$3 million
remains accrued for this program.
Other
During
2014
, the Company recorded
$10 million
and
$28 million
for the
three and nine
months ended
September 30, 2014
, respectively, of restructuring expenses, including
$7 million
and
$12 million
for the
three and nine
months ended
September 30, 2014
, respectively, related to discontinued operations. The expenses primarily related to employee and severance termination benefits, associated with Other operations, including the following activities:
|
•
|
During the three months ended September 30, 2014, the Company recorded
$6 million
of severance and termination benefits, classified as discontinued operations, associated with approximately
100
employees at two European Interiors facilities in Spain.
|
|
•
|
The closure of a Climate facility located in Quilmes, Argentina. In connection with the closure, the Company recorded
$3 million
and
$13 million
for the three and nine months ended September 30, 2014, respectively, of restructuring expenses, primarily related to severance and termination benefits associated with approximately
270
employees. Approximately
$1 million
remains accrued at
September 30, 2015
.
|
|
•
|
The closure of a Climate facility located in Port Elizabeth, South Africa. In connection with the closure, the Company recorded and paid cash to settle
$2 million
of restructuring expenses, primarily related to severance and termination benefits associated with approximately
90
employees.
|
|
•
|
During the second quarter of 2014, the Company recorded an additional
$5 million
of restructuring expenses, classified as discontinued operations, of which
$4 million
remains accrued as of
September 30, 2015
, in addition to
$2 million
associated with a previously announced program for the fundamental reorganization of operations at a facility in Brazil. The Company retained approximately
$6 million
of restructuring reserves as part of the Interiors Divestiture.
|
13
Restructuring Reserves
Restructuring reserve balances of
$33 million
and
$39 million
at
September 30, 2015
and
December 31, 2014
, respectively, are classified as "Other current liabilities" on the consolidated balance sheets. The Company anticipates that the activities associated with the restructuring reserve balance will be substantially completed by the first half of 2016. The Company’s consolidated restructuring reserves and related activity are summarized below, including amounts associated with discontinued operations.
|
Electronics
|
Corporate
|
Other
|
Total
|
||||||||||||
|
(Dollars in Millions)
|
|||||||||||||||
|
December 31, 2014
|
$
|
30
|
|
$
|
—
|
|
$
|
9
|
|
$
|
39
|
|
|||
|
Expense
|
3
|
|
—
|
|
1
|
|
4
|
|
|||||||
|
Utilization
|
(2
|
)
|
—
|
|
(1
|
)
|
(3
|
)
|
|||||||
|
Foreign currency
|
(3
|
)
|
—
|
|
(1
|
)
|
(4
|
)
|
|||||||
|
March 31, 2015
|
28
|
|
—
|
|
8
|
|
36
|
|
|||||||
|
Expense
|
9
|
|
3
|
|
1
|
|
13
|
|
|||||||
|
Utilization
|
(4
|
)
|
—
|
|
(2
|
)
|
(6
|
)
|
|||||||
|
Foreign currency
|
1
|
|
—
|
|
—
|
|
1
|
|
|||||||
|
June 30, 2015
|
34
|
|
3
|
|
7
|
|
44
|
|
|||||||
|
Expense
|
6
|
|
1
|
|
—
|
|
7
|
|
|||||||
|
Utilization
|
(13
|
)
|
(1
|
)
|
—
|
|
(14
|
)
|
|||||||
|
Reversals
|
(4
|
)
|
—
|
|
—
|
|
(4
|
)
|
|||||||
|
September 30, 2015
|
$
|
23
|
|
$
|
3
|
|
$
|
7
|
|
$
|
33
|
|
|||
Utilization represents payments for severance and other employee termination benefits and special termination benefits reclassified to pension and other postretirement employee benefit liabilities, where such payments are made from the Company’s benefit plans.
During October 2015, the Company announced a restructuring program designed to reduce the workforce at a European Electronics facility. The Company expects to record restructuring charges of approximately
$15 million
during the fourth quarter of 2015, primarily related to severance and termination benefit costs.
Inventories consist of the following components:
|
September 30
|
December 31
|
||||||
|
2015
|
2014
|
||||||
|
(Dollars in Millions)
|
|||||||
|
Raw materials
|
$
|
115
|
|
$
|
117
|
|
|
|
Work-in-process
|
50
|
|
43
|
|
|||
|
Finished products
|
55
|
|
62
|
|
|||
|
Valuation reserves
|
(18
|
)
|
(14
|
)
|
|||
|
$
|
202
|
|
$
|
208
|
|
||
14
Other current assets are comprised of the following components:
|
September 30
|
December 31
|
||||||
|
2015
|
2014
|
||||||
|
(Dollars in Millions)
|
|||||||
|
Joint venture receivables
|
$
|
55
|
|
$
|
52
|
|
|
|
Recoverable taxes
|
50
|
|
78
|
|
|||
|
Contractually reimbursable engineering costs
|
39
|
|
36
|
|
|||
|
Prepaid assets and deposits
|
28
|
|
30
|
|
|||
|
Deferred tax assets
|
18
|
|
20
|
|
|||
|
Non-trade receivables
|
1
|
|
28
|
|
|||
|
Other
|
7
|
|
6
|
|
|||
|
$
|
198
|
|
$
|
250
|
|
||
Non-trade receivables represent accounts receivable that the Company is invoicing on behalf of the buyer of the Interiors business. In connection with the Interiors Divestiture, the Company is invoicing on behalf of the buyer until underlying contractual customer agreements are transferred or otherwise modified.
Other non-current assets are comprised of the following components:
|
September 30
|
December 31
|
||||||
|
2015
|
2014
|
||||||
|
(Dollars in Millions)
|
|||||||
|
Recoverable taxes
|
$
|
383
|
|
$
|
58
|
|
|
|
Deferred tax assets
|
21
|
|
23
|
|
|||
|
Contractually reimbursable engineering costs
|
1
|
|
31
|
|
|||
|
Other
|
30
|
|
33
|
|
|||
|
$
|
435
|
|
$
|
145
|
|
||
Recoverable taxes include Korean capital gains tax withheld by the Purchasers and paid to the Korean government in connection with the Climate Transaction of
$359 million
adjusted for currency and interest impacts. The Company has initiated filings with the Korean tax authorities pursuing a refund of the capital gains tax pursuant to the applicable income tax treaty with Korea and believes it is more likely than not that such amount will be recovered over the subsequent one to five years.
Current and non-current contractually reimbursable engineering costs of
$39 million
and
$1 million
, respectively, at
September 30, 2015
and
$36 million
and
$31 million
, respectively, at
December 31, 2014
, are related to pre-production design and development costs incurred pursuant to long-term supply arrangements that are contractually guaranteed for reimbursement by customers. The Company expects to receive cash reimbursement payments of approximately
$11 million
during the remainder of 2015,
$28 million
in 2016, and
$1 million
from 2017 through 2019.
15
Property and equipment, net consists of the following:
|
September 30
|
December 31
|
||||||
|
2015
|
2014
|
||||||
|
(Dollars in Millions)
|
|||||||
|
Land
|
$
|
16
|
|
$
|
17
|
|
|
|
Buildings and improvements
|
71
|
|
66
|
|
|||
|
Machinery, equipment and other
|
359
|
|
337
|
|
|||
|
Construction in progress
|
53
|
|
64
|
|
|||
|
499
|
|
484
|
|
||||
|
Accumulated depreciation
|
(174
|
)
|
(136
|
)
|
|||
|
325
|
|
348
|
|
||||
|
Product tooling, net of amortization
|
16
|
|
15
|
|
|||
|
$
|
341
|
|
$
|
363
|
|
||
Property and equipment is depreciated principally using the straight-line method of depreciation over the related asset's estimated useful life. Generally, buildings and improvements are depreciated over a
40
-year estimated useful life, leasehold improvements are depreciated on a straight-line basis over the initial lease term period, and machinery, equipment and other are depreciated over estimated useful lives ranging from
3
to
15
years. Product tooling is amortized using the straight-line method over the estimated life of the tool, generally not exceeding
six
years. Depreciation and amortization expenses for property and equipment are summarized as follows:
|
Three Months Ended
September 30 |
Nine Months Ended
September 30 |
||||||||||||||
|
2015
|
2014
|
2015
|
2014
|
||||||||||||
|
(Dollars in Millions)
|
|||||||||||||||
|
Depreciation
|
$
|
17
|
|
$
|
20
|
|
$
|
49
|
|
$
|
40
|
|
|||
|
Amortization
|
—
|
|
1
|
|
2
|
|
2
|
|
|||||||
|
$
|
17
|
|
$
|
21
|
|
$
|
51
|
|
$
|
42
|
|
||||
Intangible assets, net at
September 30, 2015
and
December 31, 2014
, are comprised of the following:
|
September 30, 2015
|
December 31, 2014
|
||||||||||||||||||||||||
|
Estimated Weighted Average Useful Life (years)
|
Gross Carrying Value
|
Accumulated Amortization
|
Net Carrying Value
|
Gross Carrying Value
|
Accumulated Amortization
|
Net Carrying Value
|
|||||||||||||||||||
|
(Dollars in Millions)
|
|||||||||||||||||||||||||
|
Definite-Lived:
|
|||||||||||||||||||||||||
|
Developed technology
|
7
|
$
|
39
|
|
$
|
18
|
|
$
|
21
|
|
$
|
39
|
|
$
|
13
|
|
$
|
26
|
|
||||||
|
Customer related
|
10
|
85
|
|
16
|
|
69
|
|
87
|
|
10
|
|
77
|
|
||||||||||||
|
Other
|
32
|
8
|
|
1
|
|
7
|
|
8
|
|
1
|
|
7
|
|
||||||||||||
|
Subtotal
|
132
|
|
35
|
|
97
|
|
134
|
|
24
|
|
110
|
|
|||||||||||||
|
Indefinite-Lived:
|
|||||||||||||||||||||||||
|
Goodwill
|
44
|
|
—
|
|
44
|
|
46
|
|
—
|
|
46
|
|
|||||||||||||
|
Total
|
$
|
176
|
|
$
|
35
|
|
$
|
141
|
|
$
|
180
|
|
$
|
24
|
|
$
|
156
|
|
|||||||
16
The Company recorded approximately
$3 million
and
$11 million
of amortization expense related to definite-lived intangible assets for the
three and nine
-month periods ended
September 30, 2015
. The Company currently estimates annual amortization expense to be
$15 million
for
2015
,
$14 million
for
2016
,
$12 million
for
2017
,
$12 million
for
2018
and
$12 million
for
2019
. Indefinite-lived intangible assets are not amortized but are tested for impairment at least annually, or earlier when events and circumstances indicate that it is more likely than not that such assets have been impaired.
A roll forward of the carrying amounts of intangible assets is presented below:
|
Definite-lived intangibles
|
Indefinite-lived intangibles
|
||||||||||||||||||
|
Developed Technology
|
Customer Related
|
Other
|
Goodwill
|
Total
|
|||||||||||||||
|
(Dollars in Millions)
|
|||||||||||||||||||
|
Electronics:
|
|||||||||||||||||||
|
December 31, 2014
|
$
|
26
|
|
$
|
77
|
|
$
|
7
|
|
$
|
46
|
|
$
|
156
|
|
||||
|
Foreign currency
|
—
|
|
(2
|
)
|
—
|
|
(2
|
)
|
(4
|
)
|
|||||||||
|
Amortization
|
(5
|
)
|
(6
|
)
|
—
|
|
—
|
|
(11
|
)
|
|||||||||
|
September 30, 2015
|
$
|
21
|
|
$
|
69
|
|
$
|
7
|
|
$
|
44
|
|
$
|
141
|
|
||||
Other current liabilities are summarized as follows:
|
September 30
|
December 31
|
||||||
|
2015
|
2014
|
||||||
|
(Dollars in Millions)
|
|||||||
|
Electronics operations repurchase commitment
|
$
|
50
|
|
$
|
—
|
|
|
|
Information technology separation and service obligations
|
48
|
|
10
|
|
|||
|
Income taxes payable
|
34
|
|
11
|
|
|||
|
Restructuring reserves
|
33
|
|
39
|
|
|||
|
Rent and royalties
|
29
|
|
24
|
|
|||
|
Product warranty and recall accruals
|
19
|
|
11
|
|
|||
|
Non-income taxes payable
|
13
|
|
13
|
|
|||
|
Joint venture payables
|
13
|
|
22
|
|
|||
|
Dividends payable
|
8
|
|
—
|
|
|||
|
Deferred income
|
7
|
|
14
|
|
|||
|
Foreign currency hedges
|
3
|
|
15
|
|
|||
|
Non-trade payables
|
1
|
|
24
|
|
|||
|
Deferred income taxes
|
—
|
|
3
|
|
|||
|
Other
|
29
|
|
31
|
|
|||
|
$
|
287
|
|
$
|
217
|
|
||
In connection with the Climate Transaction, the Company entered an agreement to purchase certain electronics operations located in India, expected to close in 2016 after legal separation and regulatory approvals are met. The Company has recorded a repurchase commitment of
$50 million
, representing the estimated purchase price of the subject business.
Information technology separation and service obligations were established in connection with the Climate Transaction and Interiors Divestiture, representing ongoing and separation services for the divested businesses to operate as independent entities. As of
September 30, 2015
and
December 31, 2014
remaining obligations totaled
$48 million
and
$10 million
, respectively.
Non-trade payables represent accounts payable for purchases the Company has made on behalf of the buyer of the Interiors business. In connection with the Interiors Divestiture, the Company agreed to continue to pay suppliers on behalf of the buyer until underlying contractual supplier agreements are transferred or otherwise modified.
17
Other non-current liabilities are summarized as follows:
|
September 30
|
December 31
|
||||||
|
2015
|
2014
|
||||||
|
(Dollars in Millions)
|
|||||||
|
Income tax reserves
|
$
|
174
|
|
$
|
45
|
|
|
|
Deferred income
|
17
|
|
20
|
|
|||
|
Product warranty and recall accruals
|
11
|
|
10
|
|
|||
|
Non-income tax reserves
|
10
|
|
19
|
|
|||
|
Other
|
11
|
|
15
|
|
|||
|
$
|
223
|
|
$
|
109
|
|
||
Income tax reserves include
$133 million
related to the anticipated U.S. income tax after the utilization of available net operating loss carry-forwards and other tax attributes in connection with the Climate Transaction as well as reserves for uncertain tax benefits, including interest and penalties, of
$41 million
. See Note 12, "Income Taxes" for additional details.
The Company’s short and long-term debt consists of the following:
|
September 30
|
December 31
|
||||||
|
2015
|
2014
|
||||||
|
(Dollars in Millions)
|
|||||||
|
Short-Term Debt:
|
|||||||
|
Current portion of long-term debt
|
$
|
2
|
|
$
|
8
|
|
|
|
Short-term borrowings
|
31
|
|
21
|
|
|||
|
$
|
33
|
|
$
|
29
|
|
||
|
Long-Term Debt:
|
|||||||
|
Term debt facility
|
$
|
346
|
|
$
|
583
|
|
|
|
Other
|
3
|
|
4
|
|
|||
|
$
|
349
|
|
$
|
587
|
|
||
Short-Term Debt
Short-term borrowings are related to the Company's non-U.S. joint ventures and are payable in Chinese Yuan and Russian Ruble. As of
September 30, 2015
and
December 31, 2014
, the Company had international affiliate short-term borrowings of $
31 million
and $
21 million
, respectively. Short-term borrowings increased in
2015
primarily due to increased working capital needs at a consolidated joint venture in China. Available borrowings on outstanding affiliate credit facilities as of
September 30, 2015
, are approximately
$18 million
.
Long-Term Debt
The Credit Agreement, dated as of
April 9, 2014
and as amended by Waiver and Amendment No. 1 dated as of
March 25, 2015
(the “Credit Agreement”), by and among the Company, as borrower, each lender from time to time party thereto, each letter of credit issuer from time to time party thereto and Citibank, N.A., as administrative agent, provides for (i) an aggregate principal of
$350 million
(the “Term Facility”) and (ii) a
$200 million
revolving credit facility (the “Revolving Facility”). The Term Facility matures on
April 9, 2021
and the Revolving Facility matures on
April 9, 2019
. The Credit Agreement requires the Company and its subsidiaries to comply with customary affirmative and negative covenants, including financial covenants and contains customary events of default. The Company was in compliance with such covenants at
September 30, 2015
.
18
The Company originally entered into a
$600 million
delayed draw Term Loan Facility on
April 9, 2014
and subsequently executed an Amendment to the Credit Agreement on
March 25, 2015
. The Amendment, among other things, provided for certain modifications to the Credit Agreement to permit Visteon’s sale of its ownership interest in HVCC (Climate Transaction) and otherwise to update the Credit Agreement to account for HVCC no longer being a subsidiary of Visteon following the Climate Transaction. While certain waivers granted under the Amendment became effective on
March 25, 2015
, other waivers became effective concurrent with the consummation of the Climate Transaction on
June 9, 2015
. Under the Amendment, Term Lenders agreed to waive a requirement of the Credit Agreement that
100%
of the net cash proceeds received by the Borrower or any of its Restricted Subsidiaries from the Climate Transaction be used to prepay the Term Loans so long as such net cash proceeds are used to prepay the Term Loans within five business days of the receipt of such net cash proceeds in an amount sufficient to reduce the aggregate principal amount of Term Loans outstanding after giving effect to such prepayment to no more than
$350 million
.
Visteon consummated the Climate Transaction on
June 9, 2015
and subsequently paid down
$246 million
term loan principal on
June 12, 2015
to reduce the outstanding aggregate principal amount of the Term Facility to approximately
$350 million
. In connection with the principal reduction, the
0.25%
mandatory quarterly prepayment obligation was considered completed, therefore the Company will cease making quarterly amortization payments. During the
nine
months ended
September 30, 2015
, the Company recorded
$5 million
of Loss on Debt Extinguishment costs, representing unamortized original issue discount, debt fees and amendment fees associated with the pay-down.
Other Long-Term Debt
As of
September 30, 2015
and
December 31, 2014
, the Company had
$3 million
and
$4 million
, respectively, of other long-term debt outstanding, primarily related to information technology software leases.
Defined Benefit Plans
The Company's net periodic benefit costs for all defined benefit plans, including discontinued operations, for the three-month periods ended
September 30, 2015
and
2014
were as follows:
|
U.S. Plans
|
Non-U.S. Plans
|
||||||||||||||
|
2015
|
2014
|
2015
|
2014
|
||||||||||||
|
(Dollars in Millions)
|
|||||||||||||||
|
Costs Recognized in Income:
|
|||||||||||||||
|
Service cost
|
$
|
—
|
|
$
|
—
|
|
$
|
1
|
|
$
|
6
|
|
|||
|
Interest cost
|
8
|
|
9
|
|
6
|
|
6
|
|
|||||||
|
Expected return on plan assets
|
(11
|
)
|
(12
|
)
|
(4
|
)
|
(4
|
)
|
|||||||
|
Settlements and curtailments
|
—
|
|
(25
|
)
|
—
|
|
—
|
|
|||||||
|
Amortization of losses and other
|
—
|
|
—
|
|
1
|
|
1
|
|
|||||||
|
Net pension (income) expense
|
$
|
(3
|
)
|
$
|
(28
|
)
|
$
|
4
|
|
$
|
9
|
|
|||
The Company's net periodic benefit costs for all defined benefit plans, including discontinued operations, for the
nine
-month periods ended
September 30, 2015
and
2014
were as follows:
|
U.S. Plans
|
Non-U.S. Plans
|
||||||||||||||
|
2015
|
2014
|
2015
|
2014
|
||||||||||||
|
(Dollars in Millions)
|
|||||||||||||||
|
Costs Recognized in Income:
|
|||||||||||||||
|
Service cost
|
$
|
—
|
|
$
|
—
|
|
$
|
14
|
|
$
|
18
|
|
|||
|
Interest cost
|
25
|
|
34
|
|
18
|
|
18
|
|
|||||||
|
Expected return on plan assets
|
(32
|
)
|
(43
|
)
|
(15
|
)
|
(12
|
)
|
|||||||
|
Settlements and curtailments
|
—
|
|
(25
|
)
|
—
|
|
—
|
|
|||||||
|
Amortization of losses and other
|
—
|
|
—
|
|
6
|
|
2
|
|
|||||||
|
Net pension (income) expense
|
$
|
(7
|
)
|
$
|
(34
|
)
|
$
|
23
|
|
$
|
26
|
|
|||
19
During the
nine
-month period ended
September 30, 2015
, cash contributions to the Company's non-U.S. defined benefit pension plan were
$13 million
. The Company expects to make cash contributions to its U.S. defined benefit pension plans of
$1 million
and contributions to non-U.S. defined benefit pension plans of
$21 million
in
2015
. The Company’s expected
2015
contributions may be revised.
Defined Contribution Plans
Most U.S. salaried employees and certain non-U.S. employees are eligible to participate in defined contribution plans by contributing a portion of their compensation, which is partially matched by the Company. For the U.S. defined contribution plan, the Company matches
100%
of contributions on the first
6%
of pay contributed. The expense related to matching contributions was approximately
$2 million
and
$3 million
for the three months ended
September 30, 2015
and
2014
, respectively. The expense related to matching contributions was approximately
$8 million
and
$11 million
for the
nine
months ended
September 30, 2015
and
2014
, respectively.
During the
three and nine
-month periods ended
September 30, 2015
, the Company recorded a provision for income tax on continuing operations of
$10 million
and
$43 million
, respectively, which includes income tax expense in countries where the Company is profitable, withholding taxes, changes in uncertain tax benefits, and the inability to record a tax benefit for pre-tax losses in the U.S. and certain other jurisdictions due to valuation allowances. Pre-tax losses from continuing operations in jurisdictions where valuation allowances are maintained and no income tax benefits are recognized totaled
$31 million
and
$147 million
, for the
nine
months ended
September 30, 2015
and
2014
, respectively, resulting in an increase in the Company's effective tax rate in those periods.
The Company provides for U.S. and non-U.S. income taxes and non-U.S. withholding taxes on the projected future repatriations of the earnings from its non-U.S. operations that are not considered permanently reinvested at each tier of the legal entity structure. During the
nine
-month periods ended
September 30, 2015
and
2014
, the Company recognized expense of
$4 million
and
$3 million
, respectively, reflecting the Company's forecasts which contemplate numerous financial and operational considerations that impact future repatriations.
The Company's provision for income taxes in interim periods is computed by applying an estimated annual effective tax rate against income before income taxes, excluding equity in net income of non-consolidated affiliates for the period. Effective tax rates vary from period to period as separate calculations are performed for those countries where the Company's operations are profitable and whose results continue to be tax-effected and for those countries where full deferred tax valuation allowances exist and are maintained. The Company is also required to record the tax impact of certain other non-recurring tax items, including changes in judgments about valuation allowances and uncertain tax positions, and changes in tax laws or rates, in the interim period in which they occur.
The need to maintain valuation allowances against deferred tax assets in the U.S. and other affected countries will cause variability in the Company’s quarterly and annual effective tax rates. Full valuation allowances against deferred tax assets in the U.S. and applicable foreign countries will be maintained until sufficient positive evidence exists to reduce or eliminate them. The factors considered by management in its determination of the probability of the realization of the deferred tax assets include, but are not limited to, recent adjusted historical financial results, historical taxable income, projected future taxable income, the expected timing of the reversals of existing temporary differences and tax planning strategies. If, based upon the weight of available evidence, it is more likely than not the deferred tax assets will not be realized, a valuation allowance is recorded.
In connection with the Climate Transaction, completed during the second quarter of 2015, the Company recorded anticipated U.S. income tax of
$147 million
, related to the gain on sale, which represents the net amount of U.S. tax after the utilization of available net operating loss carry-forwards and other tax attributes, under the more likely than not assumption the Korean withholding taxes as described further below will be refunded one to five years post-closing. As of
September 30, 2015
, the anticipated U.S. income tax was reduced to
$133 million
reflecting the ability to offset the gain on the sale against estimated U.S. taxable loss recognized during the
third
quarter of
2015
. This amount is reflected as discontinued operations income tax expense and the related liability is included in "Other non-current liabilities" on the consolidated balance sheets.
20
Unrecognized Tax Benefits
Gross unrecognized tax benefits at
September 30, 2015
and
December 31, 2014
, including amounts attributable to discontinued operations, were
$39 million
and
$60 million
, respectively. Of these amounts approximately
$37 million
and
$40 million
represent the amount of unrecognized benefits that, if recognized, would impact the effective tax rate. The gross unrecognized tax benefit differs from that which would impact the effective tax rate due to uncertain tax positions embedded in other deferred tax attributes carrying a full valuation allowance. Since the uncertainty is expected to be resolved while a full valuation allowance is maintained, these uncertain tax positions should not impact the effective tax rate in current or future periods. The Company records interest and penalties related to uncertain tax positions as a component of income tax expense and related amounts accrued at
September 30, 2015
and
December 31, 2014
were
$4 million
and
$27 million
, respectively.
There were several items that impacted the Company’s unrecognized tax benefits resulting in a
$4 million
net reduction in income tax expense, inclusive of interest and penalties, for the
nine
-month period ended
September 30, 2015
, of which
$7 million
income tax benefit was reflected in continuing operations, partially offset by
$3 million
income tax expense reflected in discontinued operations. During the first quarter of 2015, the Company received a favorable order from the Joint Commissioner of Income Tax in India related to numerous appeals in connection with assessments initiated over seven years ago associated with the transfer price used to value certain share transactions. During the first and second quarters of 2015, the Internal Revenue Service ("IRS") completed consecutive audits of the Company's U.S. climate affiliate for the 2011 through 2013 tax years. In connection with the Climate Transaction, the Company eliminated substantially all of the unrecognized tax benefits associated with the climate legal entities by
$21 million
. Also in connection with this transaction, the amount of unrecognized tax benefits that impact the rate increased by
$19 million
to reflect the anticipated U.S. income tax related to the 2015 tax year after utilizing available tax attributes. As described further below, as a consequence of the Company abandoning its pursuit of further appeals related to the alleged underpayment of withholding tax on dividends paid from its Korean affiliates, the Company recorded
$7 million
of income tax expense related to dividends paid from its former Korean affiliates in 2013 and 2014.
With few exceptions, the Company is no longer subject to U.S. federal tax examinations for years before 2012 or state and local, or non-U.S. income tax examinations for years before 2003 although U.S. net operating losses carried forward into open tax years technically remain open to adjustment. During the third quarter of 2015, the IRS contacted the Company to begin the examination process of the Company's U.S. tax returns for the 2012 and 2013 tax years. Although it is not possible to predict the timing of the resolution of all ongoing tax audits with accuracy, it is reasonably possible that certain tax proceedings in Europe and Asia (including Korea) could conclude within the next twelve months and result in a significant increase or decrease in the balance of gross unrecognized tax benefits. Given the number of years, jurisdictions and positions subject to examination, the Company is unable to estimate the full range of possible adjustments to the balance of unrecognized tax benefits. A reconciliation of the beginning and ending amount of unrecognized tax benefits including amounts attributable to discontinued operations is as follows:
|
Nine Months Ended
September 30, 2015 |
|||
|
(Dollars in Millions)
|
|||
|
Beginning balance
|
$
|
60
|
|
|
Tax positions related to current period:
|
|||
|
Additions
|
4
|
|
|
|
Tax positions related to prior periods:
|
|||
|
Additions
|
12
|
|
|
|
Reductions
|
(35
|
)
|
|
|
Settlements with tax authorities
|
(1
|
)
|
|
|
Effect of exchange rate changes
|
(1
|
)
|
|
|
Ending balance
|
$
|
39
|
|
In connection with the Climate Transaction,
$377 million
of Korean capital gains tax was withheld by the Purchasers and paid to the Korean government. The Company has initiated filings with the Korean tax authorities pursuing a refund of the capital gains tax pursuant to the applicable income tax treaty with Korea and believes it is more likely than not that such amount will be recovered over the subsequent one to five years. Also in connection with the Climate Transaction, the Company withdrew its appeals related to the alleged underpayment of withholding tax on dividends paid from its former Korean affiliates through 2012 and eliminated the various income tax refund claims previously recorded at the Climate legal entities. As a consequence of these actions, the Company established a long-term income tax receivable of
$377 million
as of June 30, 2015, and reduced its previous balance by approximately
$12 million
, of which
$7 million
was reflected in discontinued operations income tax expense and
$5 million
reflected as discontinued operations related to the gain on the Climate Transaction. During the
third
quarter, the weakening of the
21
Korean won resulted in a
$20 million
decrease in the long-term income receivable, which was partially offset by a
$2 million
increase attributable to the accrual of interest, with both amounts reflected in discontinued operations income tax expense and resulting in a
$359 million
long-term income tax receivable, including impacts of exchange and interest, as of September 30, 2015.
During 2012, Brazil tax authorities issued tax assessment notices to Visteon Sistemas Automotivos (“Sistemas”) of approximately
$10 million
, adjusted for currency impacts, related to the sale of its chassis business to a third party. During 2013, after attempts to reopen an appeal of the administrative decision failed, Sistemas opened a judicial proceeding against the government to address the notice, which required a deposit in the amount of the assessment to suspend the debt and allow Sistemas to operate regularly before the tax authorities. The Company believes that the risk of a negative outcome is remote once the matter is fully litigated at the highest judicial level.
Appeal payments in Korea and Brazil, as well as contingent income tax refund claims associated with other jurisdictions, including applicable accrued interest income and exchange impacts, total
$373 million
as of
September 30, 2015
and are included in Other non-current assets on the consolidated balance sheets.
Changes in equity for the three months ended
September 30, 2015
and
2014
are as follows:
|
2015
|
2014
|
||||||||||||||||||||||
|
Visteon
|
NCI
|
Total
|
Visteon
|
NCI
|
Total
|
||||||||||||||||||
|
(Dollars in Millions)
|
|||||||||||||||||||||||
|
Three Months Ended September 30
|
|||||||||||||||||||||||
|
Beginning balance
|
$
|
2,688
|
|
$
|
162
|
|
$
|
2,850
|
|
$
|
1,311
|
|
$
|
910
|
|
$
|
2,221
|
|
|||||
|
Net income (loss) from continuing operations
|
16
|
|
5
|
|
21
|
|
(26
|
)
|
5
|
|
(21
|
)
|
|||||||||||
|
Net (loss) income from discontinued operations
|
(11
|
)
|
—
|
|
(11
|
)
|
5
|
|
17
|
|
22
|
|
|||||||||||
|
Net (loss) income
|
5
|
|
5
|
|
10
|
|
(21
|
)
|
22
|
|
1
|
|
|||||||||||
|
Other comprehensive income (loss)
|
|||||||||||||||||||||||
|
Foreign currency translation adjustments
|
(23
|
)
|
(4
|
)
|
(27
|
)
|
(52
|
)
|
(13
|
)
|
(65
|
)
|
|||||||||||
|
Benefit plans
|
2
|
|
—
|
|
2
|
|
(37
|
)
|
—
|
|
(37
|
)
|
|||||||||||
|
Unrealized hedging (loss) gain
|
(3
|
)
|
—
|
|
(3
|
)
|
(2
|
)
|
(2
|
)
|
(4
|
)
|
|||||||||||
|
Total other comprehensive income (loss)
|
(24
|
)
|
(4
|
)
|
(28
|
)
|
(91
|
)
|
(15
|
)
|
(106
|
)
|
|||||||||||
|
Stock-based compensation, net
|
1
|
|
—
|
|
1
|
|
3
|
|
—
|
|
3
|
|
|||||||||||
|
Warrant exercises
|
15
|
|
—
|
|
15
|
|
5
|
|
—
|
|
5
|
|
|||||||||||
|
Business acquisitions
|
—
|
|
—
|
|
—
|
|
—
|
|
46
|
|
46
|
|
|||||||||||
|
Dividends to non-controlling interests
|
—
|
|
—
|
|
—
|
|
—
|
|
7
|
|
7
|
|
|||||||||||
|
Ending balance
|
$
|
2,685
|
|
$
|
163
|
|
$
|
2,848
|
|
$
|
1,207
|
|
$
|
970
|
|
$
|
2,177
|
|
|||||
22
Changes in equity for the
nine
months ended
September 30, 2015
and
2014
are as follows:
|
2015
|
2014
|
||||||||||||||||||||||
|
Visteon
|
NCI
|
Total
|
Visteon
|
NCI
|
Total
|
||||||||||||||||||
|
(Dollars in Millions)
|
|||||||||||||||||||||||
|
Nine Months Ended September 30
|
|||||||||||||||||||||||
|
Beginning balance
|
$
|
865
|
|
$
|
956
|
|
$
|
1,821
|
|
$
|
1,920
|
|
$
|
953
|
|
$
|
2,873
|
|
|||||
|
Net income (loss) from continuing operations
|
93
|
|
17
|
|
110
|
|
(75
|
)
|
18
|
|
(57
|
)
|
|||||||||||
|
Net income (loss) from discontinued operations
|
2,170
|
|
24
|
|
2,194
|
|
(82
|
)
|
47
|
|
(35
|
)
|
|||||||||||
|
Net income (loss)
|
2,263
|
|
41
|
|
2,304
|
|
(157
|
)
|
65
|
|
(92
|
)
|
|||||||||||
|
Other comprehensive income (loss)
|
|||||||||||||||||||||||
|
Foreign currency translation adjustments
|
(23
|
)
|
(16
|
)
|
(39
|
)
|
(46
|
)
|
(14
|
)
|
(60
|
)
|
|||||||||||
|
Benefit plans
|
35
|
|
1
|
|
36
|
|
(36
|
)
|
—
|
|
(36
|
)
|
|||||||||||
|
Unrealized hedging gains
|
2
|
|
2
|
|
4
|
|
3
|
|
—
|
|
3
|
|
|||||||||||
|
Total other comprehensive income (loss)
|
14
|
|
(13
|
)
|
1
|
|
(79
|
)
|
(14
|
)
|
(93
|
)
|
|||||||||||
|
Stock-based compensation, net
|
13
|
|
—
|
|
13
|
|
18
|
|
—
|
|
18
|
|
|||||||||||
|
Warrant exercises
|
30
|
|
—
|
|
30
|
|
5
|
|
—
|
|
5
|
|
|||||||||||
|
Share repurchase
|
(500
|
)
|
—
|
|
(500
|
)
|
(500
|
)
|
—
|
|
(500
|
)
|
|||||||||||
|
Business (divestitures) acquisitions
|
—
|
|
(785
|
)
|
(785
|
)
|
—
|
|
46
|
|
46
|
|
|||||||||||
|
Dividends to non-controlling interests
|
—
|
|
(36
|
)
|
(36
|
)
|
—
|
|
(80
|
)
|
(80
|
)
|
|||||||||||
|
Ending balance
|
$
|
2,685
|
|
$
|
163
|
|
$
|
2,848
|
|
$
|
1,207
|
|
$
|
970
|
|
$
|
2,177
|
|
|||||
Share Repurchase Program
As of January 1, 2014, a total of
$875 million
previously authorized by the Company's board of directors remained available for share repurchase. On May 8, 2014, the Company entered into an accelerated stock buyback ("ASB") program with a third-party financial institution to purchase shares of common stock for an aggregate purchase price of
$500 million
. Under the program, the Company paid the financial institution
$500 million
and received an initial delivery of
3,394,157
shares of common stock using a reference price of
$92.07
, and an additional delivery of
1,129,001
shares of common stock following the conclusion of the hedge period which determined a certain minimum amount of shares guaranteed under a portion of the program that had a maximum per share price of
$100.54
. On October 15, 2014, the capped portion of the program concluded, and the Company received an additional
112,269
shares. The final settlement price for all shares delivered under the capped portion of the program was
$96.19
. On May 1, 2015, the uncapped portion of the program concluded and the Company received an additional
534,214
shares. The final settlement price for all shares delivered under the uncapped portion of the program was
$97.25
.
On June 11, 2015, the Company’s board of directors authorized an additional
$125 million
of share repurchase for a total of
$500 million
available through
December 31, 2015
. On June 16, 2015, the Company entered into a new ASB program with a third-party financial institution to purchase shares of common stock for an aggregate purchase price of
$500 million
. Under the program, the Company paid the financial institution
$500 million
and received an initial delivery of
3,712,297
shares of common stock, which is approximately
80%
of the total number of shares of the Company’s common stock expected to be repurchased under the ASB Agreement based on the closing price of the Company’s common stock on June 15, 2015. The final number of shares to be repurchased will be based on the average of the daily volume-weighted average prices of the Company’s common stock during the term of the transaction, less an agreed discount and subject to adjustments pursuant to the terms and conditions of the ASB Agreement. The final settlement of the transaction under the ASB Agreement is expected to occur by the end of 2015 but may be accelerated at the option of the third-party financial institution.
The Company anticipates that additional repurchases of common stock, if any, would occur from time to time in open market or privately negotiated transactions depending on market and economic conditions, share price, trading volume, alternative uses of capital and other.
23
Non-Controlling Interests
Non-controlling interests in the Visteon Corporation economic entity are as follows:
|
September 30
|
December 31
|
||||||
|
2015
|
2014
|
||||||
|
(Dollars in Millions)
|
|||||||
|
HVCC
|
$
|
—
|
|
$
|
798
|
|
|
|
Yanfeng Visteon Automotive Electronics Co., Ltd. ("YFVE")
|
123
|
|
118
|
|
|||
|
Shanghai Visteon Automotive Electronics, Co., Ltd.
|
39
|
|
39
|
|
|||
|
Other
|
1
|
|
1
|
|
|||
|
$
|
163
|
|
$
|
956
|
|
||
Accumulated Other Comprehensive Income (Loss)
Changes in Accumulated other comprehensive income (loss) (“AOCI”) and reclassifications out of AOCI by component include:
|
Three Months Ended
September 30 |
Nine Months Ended
September 30 |
||||||||||||||
|
2015
|
2014
|
2015
|
2014
|
||||||||||||
|
(Dollars in Millions)
|
|||||||||||||||
|
Changes in AOCI:
|
|||||||||||||||
|
Beginning balance
|
$
|
(261
|
)
|
$
|
—
|
|
$
|
(299
|
)
|
$
|
(12
|
)
|
|||
|
Other comprehensive (loss) income before reclassification, net of tax
|
(25
|
)
|
(59
|
)
|
(67
|
)
|
(37
|
)
|
|||||||
|
Amounts reclassified from AOCI
|
1
|
|
(32
|
)
|
(3
|
)
|
(42
|
)
|
|||||||
|
Climate divestiture
|
—
|
|
—
|
|
84
|
|
—
|
|
|||||||
|
Ending balance
|
$
|
(285
|
)
|
$
|
(91
|
)
|
$
|
(285
|
)
|
$
|
(91
|
)
|
|||
|
Changes in AOCI by Component:
|
|||||||||||||||
|
Foreign currency translation adjustments
|
|||||||||||||||
|
Beginning balance
|
$
|
(138
|
)
|
$
|
(31
|
)
|
$
|
(138
|
)
|
$
|
(37
|
)
|
|||
|
Other comprehensive income (loss) before reclassification, net of tax (a)
|
(23
|
)
|
(52
|
)
|
(86
|
)
|
(46
|
)
|
|||||||
|
Climate divestiture (b)
|
—
|
|
—
|
|
63
|
|
—
|
|
|||||||
|
Ending balance
|
(161
|
)
|
(83
|
)
|
(161
|
)
|
(83
|
)
|
|||||||
|
Benefit plans
|
|||||||||||||||
|
Beginning balance
|
(123
|
)
|
26
|
|
(156
|
)
|
25
|
|
|||||||
|
Other comprehensive (loss) income before reclassification, net of tax (a)
|
—
|
|
(13
|
)
|
8
|
|
(13
|
)
|
|||||||
|
Amounts reclassified from AOCI (c)
|
2
|
|
(24
|
)
|
7
|
|
(23
|
)
|
|||||||
|
Climate divestiture (b)
|
—
|
|
—
|
|
20
|
|
—
|
|
|||||||
|
Ending balance
|
(121
|
)
|
(11
|
)
|
(121
|
)
|
(11
|
)
|
|||||||
|
Unrealized hedging gain (loss)
|
|||||||||||||||
|
Beginning balance
|
—
|
|
5
|
|
(5
|
)
|
—
|
|
|||||||
|
Other comprehensive (loss) income before reclassification, net of tax (d)
|
(2
|
)
|
6
|
|
11
|
|
22
|
|
|||||||
|
Amounts reclassified from AOCI (e)
|
(1
|
)
|
(8
|
)
|
(10
|
)
|
(19
|
)
|
|||||||
|
Climate divestiture (b)
|
—
|
|
—
|
|
1
|
|
—
|
|
|||||||
|
Ending balance
|
(3
|
)
|
3
|
|
(3
|
)
|
3
|
|
|||||||
|
Total AOCI
|
$
|
(285
|
)
|
$
|
(91
|
)
|
$
|
(285
|
)
|
$
|
(91
|
)
|
|||
(a) There were no income tax effects for either period due to the recording of valuation allowance.
(b) Amounts are included in Income from discontinued operations, net of tax, on the consolidated statements of comprehensive income.
(c) Amount included in the computation of net periodic pension cost. (See Note 11, "Employee Benefit Plans" for additional details.)
(d) Net tax benefit of
$1 million
is related to unrealized hedging (loss) gain for both the three months ended
September 30, 2015
and
2014
. Net tax expense of
$2 million
and
$1 million
are related to unrealized hedging gain for the
nine
months ended
September 30, 2015
and
2014
, respectively.
(e) Amount is included in Cost of sales in consolidated statements of comprehensive income.
24
Stock Warrants
During the
three and nine
months ended
September 30, 2015
, approximately
266,000
and
569,000
warrants, respectively, were converted to shares of common stock at an exercise price of
$58.80
per share.
Basic earnings (loss) per share is calculated by dividing net income attributable to Visteon by the weighted average number of shares of common stock outstanding. Diluted earnings per share is computed by dividing net income by the weighted average number of common and potential dilutive common shares outstanding. Performance based share units are considered contingently issuable shares, and are included in the computation of diluted earnings per share based on the number of shares that would be issuable if the reporting date were the end of the contingency period and if the result would be dilutive.
The table below provides details underlying the calculations of basic and diluted earnings (loss) per share:
|
Three Months Ended
September 30 |
Nine Months Ended
September 30 |
||||||||||||||
|
2015
|
2014
|
2015
|
2014
|
||||||||||||
|
(In Millions, Except Per Share Amounts)
|
|||||||||||||||
|
Numerator:
|
|||||||||||||||
|
Net income (loss) from continuing operations attributable to Visteon
|
$
|
16
|
|
$
|
(26
|
)
|
$
|
93
|
|
$
|
(75
|
)
|
|||
|
(Loss) income from discontinued operations, net of tax
|
(11
|
)
|
5
|
|
2,170
|
|
(82
|
)
|
|||||||
|
Net income (loss) attributable to Visteon
|
$
|
5
|
|
$
|
(21
|
)
|
$
|
2,263
|
|
$
|
(157
|
)
|
|||
|
Denominator:
|
|||||||||||||||
|
Average common stock outstanding - basic
|
40.5
|
|
44.0
|
|
42.9
|
|
46.2
|
|
|||||||
|
Dilutive effect of warrants and PSUs
|
0.9
|
|
—
|
|
1.0
|
|
—
|
|
|||||||
|
Diluted shares
|
41.4
|
|
44.0
|
|
43.9
|
|
46.2
|
|
|||||||
|
Basic and Diluted Per Share Data:
|
|||||||||||||||
|
Basic earnings (loss) per share attributable to Visteon:
|
|||||||||||||||
|
Continuing operations
|
$
|
0.39
|
|
$
|
(0.59
|
)
|
$
|
2.17
|
|
$
|
(1.62
|
)
|
|||
|
Discontinued operations
|
(0.27
|
)
|
0.11
|
|
50.58
|
|
(1.78
|
)
|
|||||||
|
$
|
0.12
|
|
$
|
(0.48
|
)
|
$
|
52.75
|
|
$
|
(3.40
|
)
|
||||
|
Diluted earnings (loss) per share attributable to Visteon:
|
|||||||||||||||
|
Continuing operations
|
$
|
0.38
|
|
$
|
(0.59
|
)
|
$
|
2.12
|
|
$
|
(1.62
|
)
|
|||
|
Discontinued operations
|
(0.26
|
)
|
0.11
|
|
49.43
|
|
(1.78
|
)
|
|||||||
|
$
|
0.12
|
|
$
|
(0.48
|
)
|
$
|
51.55
|
|
$
|
(3.40
|
)
|
||||
The impact of dilutive potential common stock is not taken into consideration in loss periods as the impact would be anti-dilutive. Accordingly, dilutive potential common stocks have been excluded from the computation of basic and diluted earnings (loss) per share for the three and nine months ended September 30, 2014, as applicable.
|
September 30, 2014
|
|||||||||||||||
|
Three Months Ended
|
Nine Months Ended
|
||||||||||||||
|
(In Millions, Except Per Share Amounts)
|
|||||||||||||||
|
Number of warrants
|
1.5
|
1.5
|
|||||||||||||
|
Exercise price
|
$58.80
|
$58.80
|
|||||||||||||
|
Number of performance stock units
|
1.0
|
1.0
|
|||||||||||||
|
Number of stock options
|
0.1
|
0.1
|
|||||||||||||
|
Exercise price
|
$
|
53.48
|
|
-
|
$
|
84.67
|
|
$
|
53.48
|
|
-
|
$
|
84.67
|
|
|
25
The Company uses a three-level fair value hierarchy that categorizes assets and liabilities measured at fair value based on the observability of the inputs utilized in the valuation. The fair value hierarchy gives the highest priority to the quoted prices in active markets for identical assets and liabilities and lowest priority to unobservable inputs.
|
•
|
Level 1 – Financial assets and liabilities whose values are based on unadjusted quoted market prices for identical assets and liabilities in an active market that the Company has the ability to access.
|
|
•
|
Level 2 – Financial assets and liabilities whose values are based on quoted prices in markets that are not active or model inputs that are observable for substantially the full term of the asset or liability.
|
|
•
|
Level 3 – Financial assets and liabilities whose values are based on prices or valuation techniques that require inputs that are both unobservable and significant to the overall fair value measurement.
|
Items Measured at Fair Value on a Non-recurring Basis
In addition to items that are measured at fair value on a recurring basis, the Company measures certain assets and liabilities at fair value on a non-recurring basis. During the
three and nine
-month periods ended
September 30, 2015
and as further described in Note 3, "Discontinued Operations", the fair value of the assets and liabilities subject to the Interiors Divestiture were measured for an impairment test. For purposes of the recoverability test, the fair values of related assets and liabilities were determined using other observable inputs and were classified within Level 2 of the fair value hierarchy.
Fair Value of Debt
The Company's fair value of debt excluding debt included in Liabilities held for sale was approximately
$382 million
and
$613 million
at
September 30, 2015
and
December 31, 2014
, respectively. Fair value estimates were based on the current rates offered to the Company for debt of the same remaining maturities. Accordingly, the Company's debt fair value disclosures are classified as Level 2, "Other Observable Inputs" in the fair value hierarchy.
Financial Instruments
Foreign Exchange Risk:
The Company’s net cash inflows and outflows exposed to the risk of changes in foreign currency exchange rates arise from the sale of products in countries other than the manufacturing source, foreign currency denominated supplier payments, debt and other payables, subsidiary dividends and investments in subsidiaries. The Company utilizes derivative financial instruments, including forward and option contracts, to protect the Company’s cash flow from changes in exchange rates. Foreign currency exposures are reviewed monthly and any natural offsets are considered prior to entering into a derivative financial instrument. The Company’s current primary hedged foreign currency exposures include the Euro, Japanese Yen and Mexican Peso. Where possible, the Company utilizes a strategy of partial coverage for transactions in these currencies.
Foreign currency hedge instruments are measured at fair value on a recurring basis under an income approach using industry-standard models that consider various assumptions, including time value, volatility factors, current market and contractual prices for the underlying and non-performance risk. Substantially all of these assumptions are observable in the marketplace throughout the full term of the instrument, can be derived from observable data, or are supported by observable levels at which transactions are executed in the marketplace. Accordingly, the Company's foreign currency instruments are classified as Level 2, "Other Observable Inputs" in the fair value hierarchy.
As of
September 30, 2015
and
December 31, 2014
, the Company had derivative instruments that consisted primarily of option and forward contracts to hedge changes in foreign currency exchange rates with notional amounts of approximately
$237 million
and
$2,884 million
, respectively, maturities of these instruments generally do not exceed eighteen months. Approximately
$89 million
and
$150 million
of the notional amounts of these instruments as of
September 30, 2015
and
December 31, 2014
, respectively, have been designated as cash flow hedges with the effective portion of the gain or loss reported in the "Accumulated other comprehensive loss" component of Stockholders’ equity in the Company’s consolidated balance sheets and such gains and losses will be reclassified at the time the underlying hedged transactions are realized. The ineffective portion of these instruments is recorded as cost of sales in the Company’s consolidated statements of comprehensive income, the impact of which is immaterial for the
three and nine
month periods ended
September 30, 2015
and
2014
, respectively. Approximately
$660 million
as of December 31, 2014 has been designated as a hedge of the Company's net investment in HVCC with the effective portion of the gain or loss reported in the AOCI component of Stockholders’ equity in the Company’s consolidated balance sheets. The gain or loss from the non-designated portion of this foreign currency option contract is recorded as "Other expense, net" in the Company’s consolidated statement of operations.
26
During 2015, the Company entered into currency exchange derivatives with a notional amount of
$150 million
to manage foreign currency exposure on certain non-U.S. denominated foreign entities. These derivatives have been designated as hedges of the Company's net investments in European affiliates with the effective portion of the gain or loss reported in the "Accumulated other comprehensive loss" component of Stockholder's equity in the Company's consolidated balance sheet. There was no ineffectiveness associated with these derivatives as of
September 30, 2015
and the fair value of such derivatives was an asset of
$1 million
.
In December 2014, the Company entered into a foreign currency option contract with a notional amount of
$2,229 million
to manage foreign currency exposure on anticipated KRW denominated proceeds in connection with the Climate Transaction. During the six months ended June 30, 2015, the Company entered into offsetting foreign currency option contracts and non-deliverable forwards with notional amounts of
$2,229 million
each to lower related premium expenses. Final settlement of these hedges occurred during the second quarter in connection with the closing of the Climate Transaction. The Company recorded a loss of
$6 million
for the
nine
months ended
September 30, 2015
, reflecting the change in the fair value of the foreign currency option and forward contracts, which was classified as "Other expense, net" in the Company’s consolidated statements of comprehensive income.
Interest Rate Risk:
The Company is subject to interest rate risk principally in relation to variable-rate debt. The Company uses derivative financial instruments to manage exposure to fluctuations in interest rates in connection with its risk management policies. During 2015, the Company entered into interest rate swaps with a notional amount of
$150 million
that effectively convert designated cash flows associated with underlying interest payments on the Term Facility from a variable interest rate to a fixed interest rate, the maturities of these swaps will not exceed the underlying Term Facility. The instruments have been designated as cash flow hedges with the effective portion of the gain or loss reported in "Accumulated other comprehensive loss" component of Stockholders' equity in the Company's consolidated balance sheets and such gains and losses will be reclassified at the time the underlying hedged transactions are realized. The ineffective portion of these swaps is assessed based on the hypothetical derivative method and is recorded as interest expense in the Company's consolidated statements of comprehensive income. As of
September 30, 2015
there was no ineffectiveness associated with these derivatives and the fair value was a liability of
$2 million
.
The interest rate swaps are valued under an income approach using industry-standard models that consider various assumptions, including time value, volatility factors, current market and contractual prices for the underlying and non-performance risk. Substantially all of these assumptions are observable in the marketplace throughout the full term of the instrument, can be derived from observable data or are supported by observable levels at which transactions are executed in the marketplace. Accordingly, the Company's interest rate swaps are classified as Level 2, "Other Observable Inputs" in the fair value hierarchy.
Financial Statement Presentation
The Company presents its derivative positions and any related material collateral under master netting agreements on a net basis. Derivative financial instruments designated and non-designated as hedging instruments are included in the Company’s consolidated balance sheets at
September 30, 2015
and
December 31, 2014
, as follows:
|
Gross Amount Recognized
|
Gross Amounts Offset in the Statement of Financial Position
|
Net Amounts Presented in the Statement of Financial Position
|
||||||||||||||||||||||
|
September 30
|
December 31
|
September 30
|
December 31
|
September 30
|
December 31
|
|||||||||||||||||||
|
2015
|
2014
|
2015
|
2014
|
2015
|
2014
|
|||||||||||||||||||
|
(Dollars in Millions)
|
||||||||||||||||||||||||
|
Other Current Assets:
|
||||||||||||||||||||||||
|
Designated-Foreign Currency Derivatives
|
$
|
5
|
|
$
|
5
|
|
$
|
3
|
|
$
|
2
|
|
$
|
2
|
|
$
|
3
|
|
||||||
|
Other Current Liabilities:
|
||||||||||||||||||||||||
|
Designated-Foreign Currency Derivatives
|
$
|
—
|
|
$
|
6
|
|
$
|
—
|
|
$
|
1
|
|
$
|
—
|
|
$
|
5
|
|
||||||
|
Designated-Interest Rate Swaps
|
2
|
|
—
|
|
—
|
|
—
|
|
2
|
|
—
|
|
||||||||||||
|
Non-designated
|
—
|
|
10
|
|
—
|
|
—
|
|
—
|
|
10
|
|
||||||||||||
|
$
|
2
|
|
$
|
16
|
|
$
|
—
|
|
$
|
1
|
|
$
|
2
|
|
$
|
15
|
|
|||||||
27
Gains and losses on derivative financial instruments recorded in cost of sales for the
three and nine
-month periods ended
September 30, 2015
and
2014
are as follows:
|
Recorded in AOCI, net of tax
|
Reclassified from AOCI into Income
|
Recorded in Income
|
||||||||||||||||||||||
|
2015
|
2014
|
2015
|
2014
|
2015
|
2014
|
|||||||||||||||||||
|
(Dollars in Millions)
|
||||||||||||||||||||||||
|
Three Months Ended September 30
|
||||||||||||||||||||||||
|
Cost of sales:
|
||||||||||||||||||||||||
|
Cash flow hedges
|
$
|
(1
|
)
|
$
|
(2
|
)
|
$
|
1
|
|
$
|
8
|
|
$
|
—
|
|
$
|
—
|
|
||||||
|
Non-designated cash flow hedges
|
—
|
|
—
|
|
—
|
|
—
|
|
(1
|
)
|
(1
|
)
|
||||||||||||
|
$
|
(1
|
)
|
$
|
(2
|
)
|
$
|
1
|
|
$
|
8
|
|
$
|
(1
|
)
|
$
|
(1
|
)
|
|||||||
|
Nine Months Ended September 30
|
||||||||||||||||||||||||
|
Cost of sales:
|
||||||||||||||||||||||||
|
Cash flow hedges
|
$
|
13
|
|
$
|
3
|
|
$
|
10
|
|
$
|
19
|
|
$
|
—
|
|
$
|
—
|
|
||||||
|
Non-designated cash flow hedges
|
—
|
|
—
|
|
—
|
|
—
|
|
(4
|
)
|
(2
|
)
|
||||||||||||
|
Other expense, net:
|
||||||||||||||||||||||||
|
KRW option and forward contracts
|
(4
|
)
|
—
|
|
(8
|
)
|
—
|
|
2
|
|
—
|
|
||||||||||||
|
$
|
9
|
|
$
|
3
|
|
$
|
2
|
|
$
|
19
|
|
$
|
(2
|
)
|
$
|
(2
|
)
|
|||||||
Concentrations of Credit Risk
Financial instruments including cash equivalents, derivative contracts, and accounts receivable, expose the Company to counter-party credit risk for non-performance. The Company’s counterparties for cash equivalents and derivative contracts are banks and financial institutions that meet the Company’s requirement of high credit standing. The Company’s counterparties for derivative contracts are substantial investment and commercial banks with significant experience using such derivatives. The Company manages its credit risk through policies requiring minimum credit standing and limiting credit exposure to any one counter-party and through monitoring counter-party credit risks.
The Company's credit risk with any individual customer does not exceed ten percent of total accounts receivables except for Ford and its affiliates which represent
22%
of the Company's accounts receivables at
September 30, 2015
and
December 31, 2014
, respectively.
Litigation and Claims
In 2003, the Local Development Finance Authority of the Charter Township of Van Buren, Michigan (the “Township”) issued approximately
$28 million
in bonds finally maturing in 2032, the proceeds of which were used at least in part to assist in the development of the Company’s U.S. headquarters located in the Township. During January 2010, the Company and the Township entered into a settlement agreement (the “Settlement Agreement”) that, among other things, reduced the taxable value of the headquarters property to current market value and facilitated certain claims of the Township in the Company’s chapter 11 proceedings. The Settlement Agreement also provided that the Company would continue to negotiate in good faith with the Township in the event that property tax payments was inadequate to permit the Township to meet its payment obligations with respect to the bonds. In September 2013, the Township notified the Company in writing that it is estimating a shortfall in tax revenues of between
$25 million
and
$36 million
, which could render it unable to satisfy its payment obligations under the bonds. On May 12, 2015, the Township commenced a proceeding against the Company in the U. S. Bankruptcy Court for the District of Delaware in connection with the foregoing. Upon the Company’s motion to dismiss, the Township dismissed the proceeding before the Delaware Bankruptcy Court and re-commenced the proceeding against the Company in the Michigan Wayne County Circuit Court on July 2, 2015. The Township is seeking a declaratory judgment that, among other things, the Company is responsible under the Settlement Agreement for payment of any shortfall in the bond debt service payments. The Company disputes the factual and legal assertions made by the Township and intends to vigorously defend the matter. The Company is not able to estimate the possible loss or range of loss in connection with this matter.
In November 2013, the Company and HVCC, jointly filed an Initial Notice of Voluntary Self-Disclosure statement with the U.S. Treasury Department’s Office of Foreign Assets Control (“OFAC”) regarding certain sales of automotive HVAC components by a minority-owned, Chinese joint venture of HVCC into Iran. The Company updated that notice in December 2013, and subsequently
28
filed a voluntary self-disclosure regarding these sales with OFAC in March 2014. In May 2014, the Company voluntarily filed a supplementary self-disclosure identifying additional sales of automotive HVAC components by the Chinese joint venture, as well as similar sales involving an HVCC subsidiary in China, totaling approximately
$12 million
, and filed a final voluntary-self disclosure with OFAC on October 17, 2014. OFAC is currently reviewing the results of the Company’s investigation. Following that review, OFAC may conclude that the disclosed sales resulted in violations of U.S. economic sanctions laws and warrant the imposition of civil penalties, such as fines, limitations on the Company's ability to export products from the United States, and/or referral for further investigation by the U.S. Department of Justice. Any such fines or restrictions may be material to the Company’s financial results in the period in which they are imposed, but at this time is not able to estimate the possible loss or range of loss in connection with this matter. Additionally, disclosure of this conduct and any fines or other action relating to this conduct could harm the Company’s reputation and have a material adverse effect on our business, operating results and financial condition. The Company cannot predict when OFAC will conclude its own review of our voluntary self-disclosures or whether it may impose any of the potential penalties described above.
The Company's operations in Brazil are subject to highly complex labor, tax, customs and other laws. While the Company believes that it is in compliance with such laws, it is periodically engaged in litigation regarding the application of these laws. As of
September 30, 2015
, the Company maintained accruals of approximately
$7 million
for claims aggregating approximately
$108 million
. The amounts accrued represent claims that are deemed probable of loss and are reasonably estimable based on the Company's assessment of the claims and prior experience with similar matters.
Several current and former employees of Visteon Deutschland GmbH (“Visteon Germany”) filed civil actions against Visteon Germany in various German courts beginning in August 2007 seeking damages for the alleged violation of German pension laws that prohibit the use of pension benefit formulas that differ for salaried and hourly employees without adequate justification. Several of these actions have been joined as pilot cases. In a written decision issued in April 2010, the Federal Labor Court issued a declaratory judgment in favor of the plaintiffs in the pilot cases. To date, more than
750
current and former employees have filed similar actions or have inquired as to or been granted additional benefits, and an additional
600
current and former employees are similarly situated. The Company's remaining reserve for unsettled cases is approximately
$8 million
and is based on the Company’s best estimate as to the number and value of the claims that will be made in connection with the pension plan. However, the Company’s estimate is subject to many uncertainties which could result in Visteon Germany incurring amounts in excess of the reserved amount of up to approximately
$10 million
.
During the Company’s bankruptcy proceedings, in December of 2009, the Delaware Bankruptcy Court granted the Company’s motion in part authorizing them to terminate or amend certain other postretirement employee benefits, including health care and life insurance. On December 29, 2009, the IUE-CWA, the Industrial Division of the Communications Workers of America, AFL-CIO, and CLC (the “IUE”) appealed such decision to the U.S. District Court for the District of Delaware. In March of 2010, the U.S. District Court for the District of Delaware affirmed the Delaware Bankruptcy Court's order in all respects, which the IUE appealed to the U.S. Court of Appeals for the Third Circuit. In July 2010, the U.S. Court of Appeals for the Third Circuit reversed the order of the U.S. District Court for the District of Delaware as to the IUE and directed the U.S. District Court for the District of Delaware to, among other things, direct the Delaware Bankruptcy Court to order the Company to take whatever action is necessary to immediately restore terminated or modified benefits to their pre-termination/modification levels. In August of 2010, the Delaware Bankruptcy Court ordered the Company to restore certain other postretirement employee benefits to the appellant-retirees but also to salaried retirees and certain retirees of the International Union, United Automobile, Aerospace and Agricultural Implement Workers of America (“UAW”). In September of 2010, the Company reached an agreement with the original IUE appellants, which resulted in the Company not restoring other postretirement employee benefits of such retirees, and the Company appealed the Delaware Bankruptcy Court's decision to include the UAW non-appealing retirees to the U.S. District Court for the District of Delaware. In September of 2010, the UAW also filed a complaint in the U. S. District Court for the Eastern District of Michigan seeking, among other things, a declaratory judgment to prohibit the Company from terminating certain other postretirement employee benefits for UAW retirees after October 1, 2010. In July of 2012, the U.S. District Court for the District of Delaware ruled in favor of the Company on its appeal, which the UAW appealed to the U.S. Court of Appeals for the Third Circuit. In August of 2014, the U.S. Court of Appeals for the Third Circuit affirmed the U.S. District Court for the District of Delaware’s rulings. The UAW filed a petition for rehearing, which the U.S. Court of Appeals for the Third Circuit denied on October 2, 2014.
On October 22, 2013, the U.S. District Court for the Eastern District of Michigan granted the Company’s motion to transfer the case back to the U.S. District Court for the District of Delaware. The UAW filed a petition for a writ of mandamus with the U.S. Court of Appeals for the Sixth Circuit, requesting the court vacate the transfer of the case. In May 2014, the U.S. Court of Appeals for the Sixth Circuit denied the UAW's petition. The UAW requested a panel rehearing or rehearing en banc, which was denied by the Sixth Circuit Court of Appeals on August 13, 2014. On July 9, 2015, the U.S. District Court for the District of Delaware entered a judgment in favor of the Company, which the Company believes should resolve the matter.
29
On May 28, 2009, the Company filed voluntary petitions in the Court seeking reorganization relief under the provisions of chapter 11 of the Bankruptcy Code and continued to operate as debtors-in-possession until emergence on October 1, 2010. Substantially all pre-petition liabilities and claims relating to rejected executory contracts and unexpired leases have been settled under the plan of reorganization, however, the ultimate amounts to be paid in settlement of each those claims will continue to be subject to the uncertain outcome of litigation, negotiations and Bankruptcy Court decisions for a period of time after the emergence date.
As of
September 30, 2015
, the Company maintains an accrual for claims that are deemed probable of loss and are reasonably estimable. While the Company believes its accruals for litigation and claims are adequate, the final amounts required to resolve such matters could differ materially from recorded estimates and the Company's results of operations and cash flows could be materially affected.
Loan Guarantees and Commitments
The Company provided a
$56 million
revolving credit facility in connection with the Interiors Divestiture Master Closing. As of
September 30, 2015
, there were no draws on this facility. The seller-backed facility is expected to be reduced over the next several months as buyer credit facilities ramp up and the seller-backed facility can also be reduced if the buyer adds working capital facilities in Russia and Thailand. The seller-backed facility has a maturity of three years, an interest rate of Libor plus
5%
and a default rate of interest for any interest and/or principal payment defaults. As of
September 30, 2015
, this revolving credit facility to the buyer was reduced to
$39 million
as additional receivable financing became available to the buyer.
The Company provided a
$40 million
loan guarantee to Yanfeng Visteon Electronics (China) Investment Co., Ltd. ("YFVIC"), a
50%
owned joint venture, in connection with the October 2014 YFVIC acquisition of a
49%
direct ownership interest in Yanfeng Visteon Automotive Electronics Co., Ltd. ("YFVE"). The guarantee contains standard non-payment provisions to cover the borrowers in event of non-payment of principal, accrued interest, and other fees for its
five
year tenor.
Environmental Matters
The Company is subject to the requirements of federal, state, local and foreign environmental and occupational safety and health laws and regulations and ordinances. These include laws regulating air emissions, water discharge and waste management. The Company is also subject to environmental laws requiring the investigation and cleanup of environmental contamination at properties it presently owns or operates and at third-party disposal or treatment facilities to which these sites send or arranged to send hazardous waste. The Company is aware of contamination at some of its properties. These sites are in various stages of investigation and cleanup. The Company currently is, has been, and in the future may become the subject of formal or informal enforcement actions or procedures.
Costs related to environmental assessments and remediation efforts at operating facilities, previously owned or operated facilities, or other waste site locations are accrued when it is probable that a liability has been incurred and the amount of that liability can be reasonably estimated. Estimated costs are recorded at undiscounted amounts, based on experience and assessments, and are regularly evaluated. The liabilities are recorded in Other current liabilities and Other non-current liabilities in the consolidated balance sheets. At
September 30, 2015
, and
December 31, 2014
, the Company had recorded a reserve of less than
$1 million
for environmental matters. However, estimating liabilities for environmental investigation and cleanup is complex and dependent upon a number of factors beyond the Company’s control and which may change dramatically. Accordingly, although the Company believes its reserve is adequate based on current information, the Company cannot provide any assurance that its ultimate environmental investigation and cleanup costs and liabilities will not exceed the amount of its current reserve.
Other Contingent Matters
Various legal actions, governmental investigations and proceedings and claims are pending or may be instituted or asserted in the future against the Company, including those arising out of alleged defects in the Company’s products; governmental regulations relating to safety; employment-related matters; customer, supplier and other contractual relationships; intellectual property rights; product warranties; product recalls; and environmental matters. Some of the foregoing matters may involve compensatory, punitive or antitrust or other treble damage claims in very large amounts, or demands for recall campaigns, environmental remediation programs, sanctions, or other relief which, if granted, would require very large expenditures. The Company enters into agreements that contain indemnification provisions in the normal course of business for which the risks are considered nominal and impracticable to estimate.
Contingencies are subject to many uncertainties, and the outcome of individual litigated matters is not predictable with assurance. Reserves have been established by the Company for matters discussed in the immediately foregoing paragraph where losses are
30
deemed probable and reasonably estimable. It is possible, however, that some of the matters discussed in the foregoing paragraph could be decided unfavorably to the Company and could require the Company to pay damages or make other expenditures in amounts, or a range of amounts, that cannot be estimated at
September 30, 2015
and that are in excess of established reserves. The Company does not reasonably expect, except as otherwise described herein, based on its analysis, that any adverse outcome from such matters would have a material effect on the Company’s financial condition, results of operations or cash flows, although such an outcome is possible.
Financial results for the Company's reportable segments have been prepared using a management approach, which is consistent with the basis and manner in which financial information is evaluated by the Company's chief operating decision-making group in allocating resources and in assessing performance. The Company’s chief operating decision making group, comprised of the Chief Executive Officer and Chief Financial Officer, evaluates the performance of the Company’s segments primarily based on net sales, before elimination of inter-company shipments, Adjusted EBITDA (non-GAAP financial measure) and operating assets.
Within each of the global product groups, certain facilities manufacture a broader range of the Company's total product line offering and are not limited to the primary product line.
During the three months ended June 30, 2015, and in connection with the Climate Transaction, the Company classified its previously HVCC owned climate operations as discontinued operations for current and comparable periods. Certain Visteon wholly owned climate facilities with 2014 annual sales of approximately
$125 million
are subject to future negotiation under the terms of the Share Purchase Agreement and are classified within the Company's Other segment.
The Company’s current reportable segments are as follows:
|
•
|
Electronics - The Company’s Electronics product line includes audio systems, infotainment systems, driver information systems, connectivity and telematics solutions, climate controls, and electronic control modules.
|
|
•
|
Other - The Company’s Other product line includes certain South America and European operations previously associated with the Climate and Interiors businesses but not subject to discontinued operations classification.
|
Segment Sales
|
Three Months Ended
September 30 |
Nine Months Ended
September 30 |
||||||||||||||
|
2015
|
2014
|
2015
|
2014
|
||||||||||||
|
(Dollars in Millions)
|
|||||||||||||||
|
Electronics
|
$
|
771
|
|
$
|
760
|
|
$
|
2,332
|
|
$
|
1,642
|
|
|||
|
Other
|
37
|
|
46
|
|
123
|
|
197
|
|
|||||||
|
Eliminations
|
—
|
|
(13
|
)
|
(19
|
)
|
(41
|
)
|
|||||||
|
Total consolidated sales
|
$
|
808
|
|
$
|
793
|
|
$
|
2,436
|
|
$
|
1,798
|
|
|||
Segment Adjusted EBITDA
During the three months ended March 31, 2015, the Company changed its definition of Adjusted EBITDA to exclude the impact of discontinued operations. Accordingly, Adjusted EBITDA for historical periods has been recast in a manner consistent with the Company's new definition.
Adjusted EBITDA is defined by the Company as net income attributable to the Company, plus net interest expense, provision for income taxes and depreciation and amortization, as further adjusted to eliminate the impact of discontinued operations, equity in net income of non-consolidated affiliates, net income attributable to non-controlling interests, gains or losses on divestitures, net restructuring expenses and other reimbursable costs, loss on debt extinguishment, non-cash stock-based compensation expense, certain employee charges and benefits, reorganization items and other non-operating gains and losses.
Adjusted EBITDA is presented as a supplemental measure of the Company's financial performance that management believes is useful to investors because the excluded items may vary significantly in timing or amounts and/or may obscure trends useful in evaluating and comparing the Company's operating activities across reporting periods. Not all companies use identical calculations and, accordingly, the Company's presentation of Adjusted EBITDA may not be comparable to other similarly titled measures of
31
other companies. Adjusted EBITDA is not a recognized term under U.S. GAAP and does not purport to be a substitute for net income as an indicator of operating performance or cash flows from operating activities as a measure of liquidity.
Adjusted EBITDA has limitations as an analytical tool and is not intended to be a measure of cash flow available for management's discretionary use, as it does not consider certain cash requirements such as interest payments, tax payments and debt service requirements. In addition, the Company uses Adjusted EBITDA (i) as a factor in incentive compensation decisions, (ii) to evaluate the effectiveness of the Company's business strategies and (iii) the Company's credit agreements use measures similar to Adjusted EBITDA to measure compliance with certain covenants.
Segment Adjusted EBITDA is summarized below:
|
Three Months Ended
September 30 |
Nine Months Ended
September 30 |
||||||||||||||
|
2015
|
2014
|
2015
|
2014
|
||||||||||||
|
(Dollars in Millions)
|
|||||||||||||||
|
Electronics
|
$
|
80
|
|
$
|
50
|
|
$
|
250
|
|
$
|
157
|
|
|||
|
Other
|
(2
|
)
|
(7
|
)
|
(8
|
)
|
(11
|
)
|
|||||||
|
Segment Adjusted EBITDA
|
78
|
|
43
|
|
242
|
|
146
|
|
|||||||
|
Corporate
|
(13
|
)
|
(13
|
)
|
(39
|
)
|
(44
|
)
|
|||||||
|
Adjusted EBITDA
|
$
|
65
|
|
$
|
30
|
|
$
|
203
|
|
$
|
102
|
|
|||
The reconciliation of Adjusted EBITDA to net income attributable to Visteon is as follows:
|
Three Months Ended
September 30 |
Nine Months Ended
September 30 |
||||||||||||||
|
2015
|
2014
|
2015
|
2014
|
||||||||||||
|
(Dollars in Millions)
|
|||||||||||||||
|
Adjusted EBITDA
|
$
|
65
|
|
$
|
30
|
|
$
|
203
|
|
$
|
102
|
|
|||
|
Depreciation and amortization
|
20
|
|
25
|
|
62
|
|
54
|
|
|||||||
|
Restructuring expense
|
3
|
|
8
|
|
18
|
|
22
|
|
|||||||
|
Interest expense, net
|
2
|
|
4
|
|
13
|
|
15
|
|
|||||||
|
Loss on debt extinguishment
|
—
|
|
—
|
|
5
|
|
23
|
|
|||||||
|
Equity in net loss (income) of non-consolidated affiliates
|
3
|
|
2
|
|
(8
|
)
|
(5
|
)
|
|||||||
|
Gain on sale of non-consolidated affiliates
|
—
|
|
—
|
|
(62
|
)
|
(2
|
)
|
|||||||
|
Other expense, net
|
7
|
|
20
|
|
15
|
|
42
|
|
|||||||
|
Provision for income taxes
|
10
|
|
10
|
|
43
|
|
21
|
|
|||||||
|
Loss (income) from discontinued operations, net of tax
|
11
|
|
(22
|
)
|
(2,194
|
)
|
35
|
|
|||||||
|
Net income attributable to non-controlling interests
|
5
|
|
22
|
|
41
|
|
65
|
|
|||||||
|
Non-cash, stock-based compensation expense
|
2
|
|
3
|
|
7
|
|
9
|
|
|||||||
|
Pension settlement gain
|
—
|
|
(25
|
)
|
—
|
|
(25
|
)
|
|||||||
|
Other
|
(3
|
)
|
4
|
|
—
|
|
5
|
|
|||||||
|
Net income (loss) attributable to Visteon Corporation
|
$
|
5
|
|
$
|
(21
|
)
|
$
|
2,263
|
|
$
|
(157
|
)
|
|||
Segment Operating Assets
|
|
Inventories, net
|
Property and Equipment, net
|
|||||||||||||
|
September 30
|
December 31
|
September 30
|
December 31
|
||||||||||||
|
2015
|
2014
|
2015
|
2014
|
||||||||||||
|
(Dollars in Millions)
|
|||||||||||||||
|
Electronics
|
$
|
181
|
|
$
|
187
|
|
$
|
303
|
|
$
|
317
|
|
|||
|
Other
|
21
|
|
21
|
|
24
|
|
26
|
|
|||||||
|
Total segment operating assets
|
202
|
|
208
|
|
327
|
|
343
|
|
|||||||
|
Corporate
|
—
|
|
—
|
|
14
|
|
20
|
|
|||||||
|
Total consolidated operating assets
|
$
|
202
|
|
$
|
208
|
|
$
|
341
|
|
$
|
363
|
|
|||
32
|
Item 2.
|
Management's Discussion and Analysis of Financial Condition and Results of Operations
|
Management’s Discussion and Analysis (“MD&A”) is intended to help the reader understand the results of operations, financial condition and cash flows of Visteon Corporation (“Visteon” or the “Company”). MD&A is provided as a supplement to, and should be read in conjunction with, the Company’s Annual Report on Form 10-K for the fiscal year ended December 31, 2014 filed with the Securities and Exchange Commission on February 26, 2015, Form 8-K subsequently filed on September 11, 2015 to recast operating results after giving effect to Climate HVCC discontinued operations, and the financial statements and accompanying notes to the financial statements included elsewhere herein.
Description of Business
Visteon Corporation (the “Company” or “Visteon”) is a global supplier of automotive systems, modules and components to automotive original equipment manufacturers (“OEMs”) worldwide including Ford, Nissan, Renault, Mazda, BMW, General Motors and Honda. Headquartered in Van Buren Township, Michigan, Visteon has a current workforce of approximately
11,000
employees dedicated to the design, development, manufacture and support of its product offerings and its global customers. The Company's manufacturing and engineering footprint is principally located outside of the U.S., with a heavy concentration in low-cost geographic regions.
Visteon delivers value for its customers and stockholders through its technology-focused core vehicle cockpit electronics business. The Company's vehicle cockpit electronics product line includes audio systems, infotainment systems, driver information systems, connectivity and telematics solutions and electronic control modules. The Company's vehicle cockpit electronics business is comprised of and reported under the Electronics segment. In addition to the Electronics segment, the Company has residual operations in South America and Europe previously associated with the Interiors and Climate businesses, not subject to discontinued operations classification, that comprise the Other segment.
Shareholder Value Creation Plan
In September 2012, the Company announced a comprehensive shareholder value creation plan that has transformed and continues to transform the Company's business operations. The Company has completed the most significant objectives as outlined in the plan and is now well positioned to capture growth in the cockpit electronics market that is expected to grow at two times the pace of the overall automotive industry. Visteon continues to operate as a publicly traded company with revenues primarily derived from its remaining Electronics business. The Company's Electronics business offers innovative vehicle cockpit electronic products to customers including audio systems, infotainment systems, driver information systems, connectivity and telematics solutions, climate controls, and electronic control modules.
A summary of the most recent significant activities of the shareholder value creation plan are summarized below.
On June 9, 2015, Visteon Corporation and its wholly owned subsidiary, VIHI, LLC (collectively, “Visteon”) completed the sale to Hahn & Co. Auto Holdings Co., Ltd. (“Hahn”) and Hankook Tire Co., Ltd. (“Hankook” and, together with Hahn, the “Purchasers”) of all of its shares of Halla Visteon Climate Control Corporation, a Korean corporation (“HVCC”), for approximately $
3.4 billion
, or KRW
52,000
per share, after adjusting for the 2014 dividend paid by HVCC to Visteon and exchange impacts (the “Climate Transaction”), pursuant to and in accordance with the Share Purchase Agreement, dated as of December 17, 2014 (the “Share Purchase Agreement”), among Visteon and the Purchasers. The Company received net cash proceeds of approximately
$2.7 billion
and recognized a pre-tax gain of approximately $2.3 billion. See Note 3 "Discontinued Operations" for additional disclosures.
In connection with the closing of the Climate Transaction, Visteon, HVCC and/or the Purchasers have entered into certain other agreements, including a transition agreement (pursuant to which the parties will provide certain transition services for a specified period following the closing), a remediation agreement (pursuant to which Visteon will provide certain information technology services for a period of time), engineering and support agreements (pursuant to which the parties will support certain operations of the other following the closing), and a letter agreement (pursuant to which Visteon has agreed to purchase from HVCC certain electronics operations located in India).
33
The agreement to purchase certain electronics operations located in India is expected to close in 2016 after legal separation and regulatory approvals are met. The Company has recorded a repurchase obligation of
$50 million
, representing the estimated purchase price of the subject business. The Company continues to consolidate the business, with net assets of approximately $22 million, based on the Company’s continued controlling financial interest. The Company’s controlling financial interest was evaluated based on continued operating control and obligation to fund losses or benefit from earnings. The business is included within a legal entity currently owned by HVCC and therefore the Electronics business assets are not available for general corporate purposes.
Based on current market conditions, the Company has announced its intention to return a portion of the Climate Transaction proceeds to stockholders, ranging from approximately $2.5 billion to $2.75 billion, through a structured series of actions including repurchases of common stock and/or a special dividend. During the second quarter of 2015, the Company entered into a $500 million accelerated share repurchase as the first of these shareholder return actions. The Company also prepaid $246 million on its Term Loan Facility and intends to use the remaining proceeds from the Climate Transaction for general corporate purposes, which may include investments in restructuring and strategic investments to support the continued expansion of the vehicle cockpit electronics business. As of
September 30, 2015
the remaining Climate Transaction proceeds are invested in a diversified portfolio of cash and cash equivalents and short-term cash investments including money market funds, time deposits and commercial paper rated A2/P2 and above with maturities under three months and other short-term investments, with maturities between three and twelve months with highly rated banking institutions. The cost of such funds approximates fair value based on the nature of the investment.
On
July 1, 2014
, the Company completed the acquisition of substantially all of the global automotive electronics business of Johnson Controls Inc. for an aggregate purchase price of
$299 million
funded with cash on hand, including
$31 million
of cash and equivalents at the acquired business. The operating results for the business acquired have been included in the Electronics segment from the date of acquisition. The Electronics Acquisition was accounted for as a business combination, with the purchase price allocated as of July 2014.
In May 2014 Visteon reached an agreement to divest substantially all of its global Interiors business (the "Interiors Divestiture") pursuant to a Master Purchase Agreement, as subsequently amended. Effective November 1, 2014, the Company closed on the majority of the Interiors Divestiture (the "Master Closing"). Subsequent to the Master Closing, Visteon completed the sale of Interiors operations in India and Thailand on December 1, 2014 and February 2, 2015, respectively. During the
three and nine
-month periods ended
September 30, 2015
, the Company recorded additional losses and adjustments of
$17 million
, respectively, in connection with the Interiors Divestiture, including
$3 million
attributable to the sale of operations in Thailand.
Remaining Interiors operations subject to the Interiors Divestiture are located in Argentina and Brazil and are expected to close during 2015. Assets and liabilities associated with these operations met the "held for sale" criteria at
September 30, 2015
and were classified as "Other current assets" or "Other current liabilities" in the consolidated balance sheets. These remaining transactions are subject to various conditions, including regulatory and antitrust approvals, receipt of other third party consents and approvals and other customary closing conditions, and may be subject to further cash impacts based on purchase price adjustments at the time of closing. The Company expects to record losses in connection with the Argentina and Brazil portions of the Interiors Divestiture in future periods upon closing, which are estimated to be approximately
$20 million
.
In preparing the
September 30, 2015
, financial statements, the Company determined that an indicator of impairment existed in relation to the long-lived assets of the Berlin, Germany interiors operation that is not subject to the Interiors Divestiture. Accordingly, the Company performed a recoverability test utilizing a probability weighted analysis of cash flows associated with continuing the operations and estimated cash flows associated with the potential sale of the operations. As a result of the analysis, the Company concluded that the assets were not recoverable. However, as the fair value of the underlying assets were determined to be in excess of the respective carrying value, no impairment was recorded as of
September 30, 2015
. The Company did not meet the specific criteria considered necessary for the Berlin, Germany interiors operation to be considered held for sale as of
September 30, 2015
.
Subsequently on October 30, 2015, Visteon entered into an agreement to sell and transfer its equity ownership in Visteon Deutschland GmbH, which operates the Berlin, Germany interiors plant with 2014 annual sales of approximately $115 million, to APCH Automotive Plastic Components Holding GmbH. Visteon will contribute cash and other assets in an amount approximately equivalent to the estimated net pension related liabilities of $190 million. The Company expects to record an estimated loss of $100 million in connection with the sale, anticipated to occur on or around December 1, 2015.
34
Executive Summary
The Company's Electronics sales for the three months ended
September 30, 2015
totaled
$808 million
and were distributed by product group, geographic region, and customer as follows:
Three Months Ended September 30, 2015
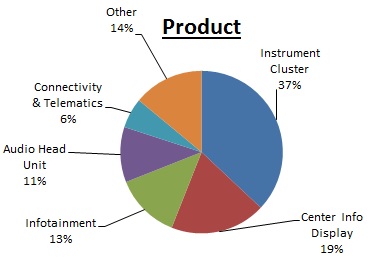
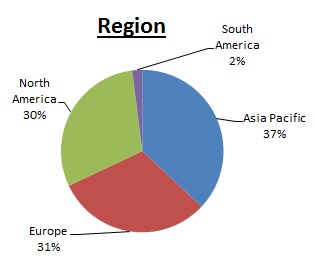
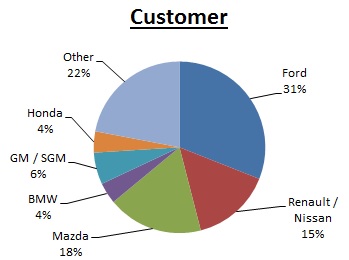
Nine Months Ended September 30, 2015
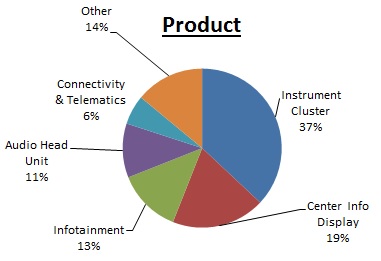
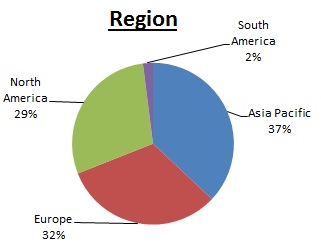
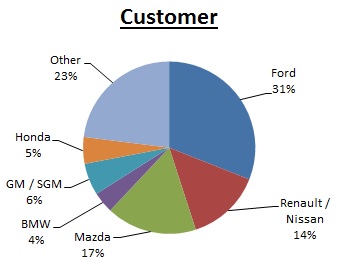
The Company conducts its business in the global automotive industry, which is capital intensive, highly competitive and sensitive to economic conditions. The Company's business is heavily concentrated in markets outside of the U.S. Accordingly, the Company is subject to primary attendant risks associated with foreign currency exchange and political factors. Additionally, the Company's business is highly sensitive to changes in the global economy that impact consumer spending and global vehicle production volumes.
During the third quarter of
2015
the global automotive industry continued to experience modest growth driven by North America, Europe and India, partially offset by South America, China, and Japan. Although China production volumes experienced a contraction during the third quarter, volumes are slightly higher than
2014
for the year to date and the full year forecasts. Production in North America increased during the third quarter based on continuing strength in demand, growing exports, and increased localization of production. Europe production also increased as steady growth in the region was partially offset by a challenging Russian market. Production in the remaining regions was mixed due to varying economic, political and social factors.
35
Light vehicle production levels for the
three and nine
months ended
September 30, 2015
and
2014
, by geographic region are provided below:
|
Three Months Ended
September 30 |
Nine Months Ended
September 30 |
||||||||||||||||
|
2015
|
2014
|
Change
|
2015
|
2014
|
Change
|
||||||||||||
|
(Units in Millions)
|
|||||||||||||||||
|
Global
|
20.7
|
|
20.7
|
|
0.1
|
%
|
65.6
|
|
65.1
|
|
0.9
|
%
|
|||||
|
North America
|
4.4
|
|
4.2
|
|
4.6
|
%
|
13.2
|
|
12.8
|
|
3.0
|
%
|
|||||
|
South America
|
0.8
|
|
1.0
|
|
(21.1
|
)%
|
2.4
|
|
2.9
|
|
(17.6
|
)%
|
|||||
|
Europe
|
4.8
|
|
4.6
|
|
4.5
|
%
|
15.7
|
|
15.2
|
|
3.5
|
%
|
|||||
|
China
|
5.0
|
|
5.3
|
|
(5.0
|
)%
|
17.0
|
|
16.7
|
|
1.8
|
%
|
|||||
|
Japan/Korea
|
3.2
|
|
3.2
|
|
(1.3
|
)%
|
9.8
|
|
10.3
|
|
(4.5
|
)%
|
|||||
|
India
|
1.0
|
|
0.9
|
|
6.0
|
%
|
2.9
|
|
2.7
|
|
6.0
|
%
|
|||||
|
ASEAN
|
0.9
|
|
0.9
|
|
0.6
|
%
|
2.8
|
|
2.9
|
|
(3.0
|
)%
|
|||||
|
Source: IHS Automotive
|
|||||||||||||||||
Significant aspects of the Company's financial results during the
three and nine
-month periods ended
September 30, 2015
include the following:
|
•
|
The Company recorded sales of
$808 million
for the three months ended
September 30, 2015
, representing an increase of
$15 million
when compared with the same period of
2014
. The increase was primarily due to higher production volumes in Asia, and new business, partially offset by Euro and Japanese Yen currency impacts.
|
|
•
|
The Company recorded sales of
$2,436 million
for the
nine
months ended
September 30, 2015
, representing an increase of
$638 million
when compared with the same period of
2014
. The increase was primarily due to the Electronics Acquisition, higher production volumes, and new business, partially offset by Euro and Japanese Yen currency impacts.
|
|
•
|
Gross margin was
$105 million
or
13.0%
of sales for the three months ended
September 30, 2015
, compared to
$93 million
or
11.7%
of sales for the same period of
2014
. The increase was primarily attributable to increased production volumes, new business and improved cost performance, partially offset by a pension settlement gain recognized in 2014.
|
|
•
|
Gross margin was
$316 million
or
13.0%
of sales for the
nine
months ended
September 30, 2015
, compared to
$223 million
or
12.4%
of sales for the same period of
2014
. The increase was primarily attributable to the Electronics Acquisition and improved cost performance, partially offset by the weakening Euro and a pension settlement gain recognized in 2014.
|
|
•
|
Net income attributable to Visteon was
$5 million
for the three months ended
September 30, 2015
, compared to a net loss of
$21 million
for the same period of
2014
. Net income for the three months ended
September 30, 2015
included an increase in gross margin of
$12 million
and a decrease in selling, general and administrative expenses of
$11 million
, restructuring charges of
$5 million
, other expenses of
$13 million
and non-controlling interests of
$17 million
, partially offset by a decrease in income from discontinued operations, net of tax of
$33 million
.
|
|
•
|
Net income attributable to Visteon was
$2.3 billion
for the
nine
months ended
September 30, 2015
, compared to a net loss of
$157 million
for the same period of
2014
. Net income for the three months ended
September 30, 2015
included the Climate Transaction pre-tax gain of $2.3 billion, classified as income from discontinued operations and a $62 million gain on sale of its 12.5% ownership interest in Yanfeng Visteon Jinqiao Automotive Trim Systems Company, Limited.
|
|
•
|
Including discontinued operations, the Company generated
$274 million
of cash from operating activities for the
nine
months ended
September 30, 2015
, an increase of
$94 million
compared with the same period of
2014
, including lower working capital use, recovery of capitalized engineering programs and lower restructuring payments.
|
|
•
|
Total cash and short-term investments, including restricted cash of
$8 million
and short-term investments of
$52 million
, was
$2,920 million
as of
September 30, 2015
, or
$2,435 million
higher than
December 31, 2014
, primarily attributable to the Climate Transaction proceeds. The Company's total debt was
$382 million
as of
September 30, 2015
, or
$234 million
lower than
December 31, 2014
, primarily attributable to the pay-down of term loan principal.
|
36
Consolidated Results of Operations - Three Months Ended
September 30, 2015
and
2014
The Company's consolidated results of operations for the three months ended
September 30, 2015
and
2014
were as follows:
|
Three Months Ended September 30
|
|||||||||||
|
2015
|
2014
|
Change
|
|||||||||
|
(Dollars in Millions)
|
|||||||||||
|
Sales
|
$
|
808
|
|
$
|
793
|
|
$
|
15
|
|
||
|
Cost of sales
|
703
|
|
700
|
|
3
|
|
|||||
|
Gross margin
|
105
|
|
93
|
|
12
|
|
|||||
|
Selling, general and administrative expenses
|
59
|
|
70
|
|
(11
|
)
|
|||||
|
Restructuring expense
|
3
|
|
8
|
|
(5
|
)
|
|||||
|
Interest expense, net
|
2
|
|
4
|
|
(2
|
)
|
|||||
|
Equity in net loss of non-consolidated affiliates
|
(3
|
)
|
(2
|
)
|
(1
|
)
|
|||||
|
Other expense, net
|
7
|
|
20
|
|
(13
|
)
|
|||||
|
Provision for income taxes
|
10
|
|
10
|
|
—
|
|
|||||
|
Net income (loss) from continuing operations
|
21
|
|
(21
|
)
|
42
|
|
|||||
|
(Loss) income from discontinued operations
|
(11
|
)
|
22
|
|
(33
|
)
|
|||||
|
Net income
|
10
|
|
1
|
|
9
|
|
|||||
|
Net income attributable to non-controlling interests
|
5
|
|
22
|
|
(17
|
)
|
|||||
|
Net income (loss) attributable to Visteon Corporation
|
$
|
5
|
|
$
|
(21
|
)
|
$
|
26
|
|
||
|
Adjusted EBITDA*
|
$
|
65
|
|
$
|
30
|
|
$
|
35
|
|
||
|
*
Adjusted EBITDA is a Non-GAAP financial measure, as further discussed
below.
|
|||||||||||
Sales
Sales for the three months ended
September 30, 2015
totaled
$808 million
, which represents an increase of
$15 million
compared with the same period of
2014
. Favorable volumes and product mix increased sales by $83 million, primarily in Asia. Unfavorable currency decreased sales by $51 million, primarily attributable to the weakening Euro and Japanese Yen. Other reductions were associated with customer pricing, net of design savings.
Cost of Sales
Cost of sales increased
$3 million
for the three months ended
September 30, 2015
when compared with the same period in
2014
. The increase includes $77 million attributable to increased production volumes, new business, as well as changes in product mix, representing the variable nature of material and labor costs. Foreign currency decreased cost of sales by $53 million primarily attributable to weakening Euro. Net efficiencies decreased cost of sales by $29 million. These efficiencies related to material, design, and usage economics, and manufacturing efficiencies, were partially offset by a pension settlement gain recognized in 2014.
Gross Margin
Gross margin was
$105 million
or
13.0%
of sales for the three months ended
September 30, 2015
compared to
$93 million
or
11.7%
of sales for the same period of
2014
. The
$12 million
increase in gross margin included $6 million from favorable volumes and mix. Gross margin also included $21 million of favorable net cost performance, driven by material and manufacturing cost efficiencies which more than offset customary pricing productivity given to customers. The increases in gross margin were partially offset by a pension settlement gain recognized in 2014.
Selling, General and Administrative Expenses
Selling, general, and administrative expenses were
$59 million
and
$70 million
during the three months ended
September 30, 2015
and
2014
, respectively. The decrease is primarily related to net efficiencies and favorable currency impacts.
37
Restructuring Expense
Electronics:
In connection with the Electronics Acquisition, the Company commenced a restructuring program designed to achieve cost savings through transaction synergies. The program is designed to achieve annual cost savings of approximately $70 million, with the majority of these savings achieved by the end of 2015. Through
September 30, 2015
, the Company has recorded approximately
$51 million
of restructuring expenses under this program, net of reversals, associated with approximately
1,000
employees, and expects to incur up to approximately
$60 million
of restructuring costs during the program. During the three months ended
September 30, 2015
, the Company recorded
$2 million
of severance and termination benefits, net of reversals, under this program. During the three months ended September 30, 2014, the Company recorded
$5 million
of severance and termination benefits under this program associated with approximately
115
employees, which was initiated during the third quarter of 2014. Approximately
$23 million
remains accrued at
September 30, 2015
.
Corporate:
The Company previously announced a restructuring program designed to reduce fixed costs and to improve operational efficiency by addressing certain under-performing operations. In connection with that program, the Company announced plans to realign its corporate and administrative functions directly to their corresponding operational beneficiary. During the three months ended
September 30, 2015
, the Company recorded
$1 million
for restructuring expenses, primarily related to severance and termination benefits associated with certain executives. As of
September 30, 2015
,
$3 million
remains accrued for this program.
Other:
During the
third
quarter of
2014
, the Company recorded
$10 million
of restructuring expenses, including
$7 million
classified as discontinued operations, related to employee and severance termination benefits associated with Other operations, including the following activities:
|
•
|
The Company recorded
$3 million
of restructuring expenses, related to severance and termination benefits in connection with the previously announced closure of a Climate facility located in Quilmes, Argentina. Approximately
$1 million
remains accrued at
September 30, 2015
.
|
|
•
|
The Company recorded $6 million of severance and termination benefits associated with approximately 100 employees at two European Interiors facilities in Spain.
|
Restructuring reserve balances of
$33 million
at
September 30, 2015
are classified as "Other current liabilities" on the consolidated balance sheets. The Company anticipates that the activities associated with the restructuring reserve balance will be substantially completed by the first half of 2016. The Company's restructuring reserves and related activity are summarized below for the three months ended
September 30, 2015
.
|
|
Electronics
|
Corporate
|
Other
|
Total
|
|||||||||||
|
(Dollars in Millions)
|
|||||||||||||||
|
June 30, 2015
|
$
|
34
|
|
$
|
3
|
|
$
|
7
|
|
$
|
44
|
|
|||
|
Expense
|
6
|
|
1
|
|
—
|
|
7
|
|
|||||||
|
Utilization
|
(13
|
)
|
(1
|
)
|
—
|
|
(14
|
)
|
|||||||
|
Reversals
|
(4
|
)
|
—
|
|
—
|
|
(4
|
)
|
|||||||
|
September 30, 2015
|
$
|
23
|
|
$
|
3
|
|
$
|
7
|
|
$
|
33
|
|
|||
Utilization represents payments for severance and other employee termination benefits and special termination benefits reclassified to pension and other postretirement employee benefit liabilities, where such payments are made from the Company’s benefit plans.
During October 2015, the Company announced a restructuring program designed to reduce the workforce at a European Electronics facility. The Company expects to record restructuring charges of approximately
$15 million
during the fourth quarter of 2015, primarily related to severance and termination benefit costs.
Interest Expense, Net
Interest expense, net, was
$2 million
and
$4 million
for the three months ended
September 30, 2015
and
2014
, respectively. Interest expense for the three months ended September 30, 2015 and 2014 is primarily related to the Company's Term Facility with original principal of $600 million and paid down to $350 million following the Climate Transaction in June 2015.
38
Equity in Net Loss of Non-Consolidated Affiliates
Equity in net loss of non-consolidated affiliates was
$3 million
and
$2 million
for the three-month periods ended
September 30, 2015
and
2014
respectively. The increase in losses is primarily attributable to the Company's equity interest in Yanfeng Visteon Investment Company ("YFVIC") due to advanced engineering spend for new programs and reduced volumes as a result of the weakening domestic market in China.
Other Expense, Net
Other expense, net consists of the following:
|
Three Months Ended
September 30 |
|||||||
|
2015
|
2014
|
||||||
|
(Dollars in Millions)
|
|||||||
|
Transformation initiatives
|
$
|
5
|
|
$
|
11
|
|
|
|
Integration costs
|
2
|
|
4
|
|
|||
|
Loss on asset contribution
|
—
|
|
3
|
|
|||
|
Other
|
—
|
|
2
|
|
|||
|
$
|
7
|
|
$
|
20
|
|
||
The Company recorded transformation initiatives of
$5 million
and
$11 million
for the three months ended
September 30, 2015
and
2014
, respectively. Transformation initiatives include financial and advisory fees incurred in connection with execution of the Company's comprehensive value creation plan and certain severance costs associated with the Electronics Acquisition and the Climate Transaction.
Integration costs include costs associated with re-branding, facility modification, information technology readiness and related professional services necessary to integrate businesses associated with the Electronics Acquisition. The Company expects to incur total integration costs of
$40 million
over a two-year period through the end of 2015.
During the three months ended
September 30, 2014
, the Company contributed land and building with net book value of
$3 million
to the local municipalities in Quilmes, Argentina for the benefit of former employees.
Income Taxes
The Company's provision for income taxes of
$10 million
for the three months ended
September 30, 2015
is unchanged when compared to the same period of
2014
. An increase of $6 million primarily attributable to the non-recurrence of a tax benefit related to the partial elimination of valuation allowances in Mexico during the third quarter of 2014 was offset by lower withholding taxes and the impact of changes in the mix of earnings and differing tax rates between jurisdictions.
39
Discontinued Operations
The results of operations for Interiors and Climate businesses subject to the Interiors Divestiture and Climate Transaction have been reclassified to "(Loss) income from discontinued operations, net of tax" in the consolidated statements of comprehensive income for the three months ended
September 30, 2015
and
2014
. The results of operations for the three months ended September 30, 2015 includes certain South America operations subject to the Interiors Divestiture, expected to close during 2015. Discontinued operations are summarized as follows:
|
Three Months Ended
September 30 |
|||||||
|
2015
|
2014
|
||||||
|
(Dollars in Millions)
|
|||||||
|
Sales
|
$
|
16
|
|
$
|
1,385
|
|
|
|
Cost of sales
|
21
|
|
1,279
|
|
|||
|
Gross margin
|
(5
|
)
|
106
|
|
|||
|
Selling, general and administrative expenses
|
1
|
|
50
|
|
|||
|
Loss and impairment on Interiors Divestiture
|
1
|
|
15
|
|
|||
|
Restructuring expense
|
—
|
|
7
|
|
|||
|
Interest expense, net
|
—
|
|
2
|
|
|||
|
Equity in net income of non-consolidated affiliates
|
—
|
|
4
|
|
|||
|
Other expense, net
|
3
|
|
2
|
|
|||
|
(Loss) income from discontinued operations before income taxes
|
(10
|
)
|
34
|
|
|||
|
Provision for income taxes
|
1
|
|
12
|
|
|||
|
(Loss) income from discontinued operations, net of tax
|
$
|
(11
|
)
|
$
|
22
|
|
|
Net Income (Loss)
Net income attributable to Visteon was
$5 million
for the three months ended
September 30, 2015
, compared to a net loss of
$21 million
for the same period of
2014
. Net income for the three months ended
September 30, 2015
included an increase in gross margin of
$12 million
and a decrease in selling, general and administrative expenses of
$11 million
, restructuring charges of
$5 million
, other expenses of
$13 million
and non-controlling interests of
$17 million
, partially offset by a decrease in income from discontinued operations, net of tax of
$33 million
.
Adjusted EBITDA (a non-GAAP financial measure, as defined below) was
$65 million
for the three months ended
September 30, 2015
, representing an increase of
$35 million
when compared with Adjusted EBITDA of
$30 million
for the same period of
2014
. The increase in Adjusted EBITDA included $6 million of favorable volume and mix, primarily attributable to the Electronics Acquisition. Currency movements were neutral for the three months ended
September 30, 2015
as the favorable impact on selling, general and administrative expenses offset the unfavorable impact on gross margin. Favorable net cost performance impacted Adjusted EBITDA for the three months ended
September 30, 2015
by $29 million. Material and manufacturing cost efficiencies and lower selling, general and administrative expenses more than offset customer pricing.
Adjusted EBITDA is defined by the Company as net income attributable to the Company, plus net interest expense, provision for income taxes and depreciation and amortization, as further adjusted to eliminate the impact of discontinued operations, equity in net income of non-consolidated affiliates, net income attributable to non-controlling interests, gains or losses on divestitures, net restructuring expenses and other reimbursable costs, loss on debt extinguishment, non-cash stock-based compensation expense, certain employee charges and benefits, reorganization items and other non-operating gains and losses. During the three months ended March 31, 2015, the Company changed its definition of Adjusted EBITDA to exclude the impact of discontinued operations. Accordingly, Adjusted EBITDA for historical periods has been recast in a manner consistent with the Company's new definition.
40
Adjusted EBITDA is not a recognized term under accounting principles generally accepted in the United States and does not purport to be a substitute for net income as an indicator of operating performance or cash flows from operating activities as a measure of liquidity. Adjusted EBITDA has limitations as an analytical tool and is not intended to be a measure of cash flow available for management's discretionary use, as it does not consider certain cash requirements such as interest payments, tax payments and debt service requirements. In addition, the Company uses Adjusted EBITDA (i) as a factor in incentive compensation decisions, (ii) to evaluate the effectiveness of the Company's business strategies and (iii) because the Company's credit agreements use measures similar to Adjusted EBITDA to measure compliance with certain covenants. Adjusted EBITDA is presented as a supplemental measure of the Company's financial performance that management believes is useful to investors because the excluded items may vary significantly in timing or amounts and/or may obscure trends useful in evaluating and comparing the Company's operating activities across reporting periods. Not all companies use identical calculations and, accordingly, the Company's presentation of Adjusted EBITDA may not be comparable to other similarly titled measures of other companies.
The reconciliation of Adjusted EBITDA to net income attributable to Visteon for the three months ended
September 30, 2015
and
2014
, is as follows:
|
Three Months Ended September 30
|
|||||||||||
|
2015
|
2014
|
Change
|
|||||||||
|
(Dollars in Millions)
|
|||||||||||
|
Adjusted EBITDA
|
$
|
65
|
|
$
|
30
|
|
$
|
35
|
|
||
|
Depreciation and amortization
|
20
|
|
25
|
|
(5
|
)
|
|||||
|
Restructuring expense
|
3
|
|
8
|
|
(5
|
)
|
|||||
|
Interest expense, net
|
2
|
|
4
|
|
(2
|
)
|
|||||
|
Equity in net loss of non-consolidated affiliates
|
3
|
|
2
|
|
1
|
|
|||||
|
Other expense, net
|
7
|
|
20
|
|
(13
|
)
|
|||||
|
Provision for income taxes
|
10
|
|
10
|
|
—
|
|
|||||
|
Loss (income) from discontinued operations, net of tax
|
11
|
|
(22
|
)
|
33
|
|
|||||
|
Net income attributable to non-controlling interests
|
5
|
|
22
|
|
(17
|
)
|
|||||
|
Non-cash, stock-based compensation
|
2
|
|
3
|
|
(1
|
)
|
|||||
|
Pension settlement gain
|
—
|
|
(25
|
)
|
25
|
|
|||||
|
Other
|
(3
|
)
|
4
|
|
(7
|
)
|
|||||
|
Net income (loss) attributable to Visteon Corporation
|
$
|
5
|
|
$
|
(21
|
)
|
$
|
26
|
|
||
Segment Results of Operations - Three Months Ended
September 30, 2015
and
2014
The Company's operating structure is organized by global product lines, including Electronics and Other. These global product lines have financial and operating responsibility over the design, development and manufacture of the Company's product portfolio. Certain functions such as procurement, information technology and other administrative activities are managed on a global basis with regional deployment. The Company's reportable segments are as follows:
|
•
|
Electronics - The Company's Electronics segment provides vehicle cockpit electronics products to customers, including audio systems, infotainment systems, driver information systems, connectivity and telematics solutions, climate controls, and electronic control modules.
|
|
•
|
Other - The Company's Other product line includes entities located in Europe, South America, and South Africa previously associated with the Interiors and Climate businesses but not subject to the Interiors Divestiture or the Climate Transaction.
|
41
Sales by Segment
|
|
Electronics
|
Other
|
Eliminations
|
Total
|
|||||||||||
|
(Dollars in Millions)
|
|||||||||||||||
|
Three months ended September 30, 2014
|
$
|
760
|
|
$
|
46
|
|
$
|
(13
|
)
|
$
|
793
|
|
|||
|
Volume and mix
|
77
|
|
(7
|
)
|
13
|
|
83
|
|
|||||||
|
Currency
|
(49
|
)
|
(2
|
)
|
—
|
|
(51
|
)
|
|||||||
|
Price productivity and other
|
(17
|
)
|
—
|
|
—
|
|
(17
|
)
|
|||||||
|
Three months ended September 30, 2015
|
$
|
771
|
|
$
|
37
|
|
$
|
—
|
|
$
|
808
|
|
|||
Electronics sales increased during the three months ended
September 30, 2015
by
$11 million
. Higher production volumes and new business, primarily in Asia, increased sales by $77 million. Unfavorable currency, primarily related to the Euro and Japanese Yen, decreased sales by $49 million. Other reductions reflected customer pricing net of design changes.
Other sales decreased during the three months end
September 30, 2015
by
$9 million
, including unfavorable volume and product mix of $7 million primarily reflecting the wind down of certain South America businesses and currency of $2 million primarily related to the weakening Euro.
Cost of Sales by Segment
|
|
Electronics
|
Other
|
Eliminations
|
Total
|
|||||||||||
|
(Dollars in Millions)
|
|||||||||||||||
|
Three months ended September 30, 2014
|
$
|
674
|
|
$
|
39
|
|
$
|
(13
|
)
|
$
|
700
|
|
|||
|
Material
|
7
|
|
(2
|
)
|
13
|
|
18
|
|
|||||||
|
Freight and duty
|
(1
|
)
|
(2
|
)
|
—
|
|
(3
|
)
|
|||||||
|
Labor and overhead
|
(6
|
)
|
(3
|
)
|
—
|
|
(9
|
)
|
|||||||
|
Engineering
|
(10
|
)
|
—
|
|
—
|
|
(10
|
)
|
|||||||
|
Depreciation and amortization
|
(2
|
)
|
(4
|
)
|
—
|
|
(6
|
)
|
|||||||
|
Other
|
2
|
|
11
|
|
—
|
|
13
|
|
|||||||
|
Three months ended September 30, 2015
|
$
|
664
|
|
$
|
39
|
|
$
|
—
|
|
$
|
703
|
|
|||
Electronics cost of sales decreased during the three months ended
September 30, 2015
by $10 million. Electronics material costs increased by $7 million driven by higher production volumes and new business partially offset by cost efficiencies and currency. Electronics freight and duty, labor and overhead, and engineering costs all decreased reflecting currency impacts and cost efficiencies. Other costs increased related to the non-recurrence of a pension settlement gain in 2014.
Cost of sales for the Other product group decreased primarily reflecting lower production volumes related to the wind down for certain programs in South America. Other costs increased related to the non-recurrence of a pension settlement gain in 2014.
Net engineering costs are comprised of gross engineering expenses related to forward model program development and advanced engineering activities, partially offset by engineering cost recoveries from customers. Electronics gross engineering expenses were $97 million for the three months ended
September 30, 2015
, a decrease of $12 million compared to the same period of
2014
. Engineering recoveries were $18 million for the three months ended
September 30, 2015
, a decrease of $2 million compared to the same period of
2014
. Engineering cost recoveries can fluctuate period to period depending on underlying contractual terms and conditions and achievement of related development milestones.
42
Adjusted EBITDA by Segment
Adjusted EBITDA by segment for the three months ended
September 30, 2015
and
2014
is presented in the table below.
|
Three Months Ended September 30
|
|||||||||||
|
2015
|
2014
|
Change
|
|||||||||
|
(Dollars in Millions)
|
|||||||||||
|
Electronics
|
$
|
80
|
|
$
|
50
|
|
$
|
30
|
|
||
|
Other
|
(2
|
)
|
(7
|
)
|
5
|
|
|||||
|
Segment Adjusted EBITDA
|
78
|
|
43
|
|
35
|
|
|||||
|
Corporate
|
(13
|
)
|
(13
|
)
|
—
|
|
|||||
|
Adjusted EBITDA
|
$
|
65
|
|
$
|
30
|
|
$
|
35
|
|
||
Changes in Adjusted EBITDA by segment are presented in the table below.
|
|
Electronics
|
Other
|
Total
|
||||||||
|
(Dollars in Millions)
|
|||||||||||
|
Three months ended September 30, 2014
|
$
|
50
|
|
$
|
(7
|
)
|
$
|
43
|
|
||
|
Volume and mix
|
6
|
|
—
|
|
6
|
|
|||||
|
Currency
|
1
|
|
—
|
|
1
|
|
|||||
|
Other
|
23
|
|
5
|
|
28
|
|
|||||
|
Three months ended September 30, 2015
|
$
|
80
|
|
$
|
(2
|
)
|
78
|
|
|||
|
Corporate
|
(13
|
)
|
|||||||||
|
Total
|
$
|
65
|
|
||||||||
Electronics Adjusted EBITDA increased
$30 million
for the three months ended
September 30, 2015
when compared to the same period of
2014
. Higher volumes and new business, increased Adjusted EBITDA by $6 million. Currency was marginally positive for the quarter with favorable impacts of the Chinese Renminbi, British Pound, Brazilian Real, and Japanese Yen offsetting unfavorable impacts of the Euro. Other increases are attributable to material and manufacturing cost efficiencies net of customer price productivity.
Other Adjusted EBITDA for the three months ended
September 30, 2015
increased by
$5 million
compared to the same period of
2014
related to cost efficiencies and reduced corporate billings.
43
Consolidated Results of Operations -
Nine Months Ended
September 30, 2015
and
2014
The Company's consolidated results of operations for the
nine
months ended
September 30, 2015
and
2014
were as follows:
|
Nine Months Ended September 30
|
|||||||||||
|
2015
|
2014
|
Change
|
|||||||||
|
(Dollars in Millions)
|
|||||||||||
|
Sales
|
$
|
2,436
|
|
$
|
1,798
|
|
$
|
638
|
|
||
|
Cost of sales
|
2,120
|
|
1,575
|
|
545
|
|
|||||
|
Gross margin
|
316
|
|
223
|
|
93
|
|
|||||
|
Selling, general and administrative expenses
|
182
|
|
164
|
|
18
|
|
|||||
|
Restructuring expense
|
18
|
|
22
|
|
(4
|
)
|
|||||
|
Interest expense, net
|
13
|
|
15
|
|
(2
|
)
|
|||||
|
Loss on debt extinguishment
|
5
|
|
23
|
|
(18
|
)
|
|||||
|
Equity in net income of non-consolidated affiliates
|
8
|
|
5
|
|
3
|
|
|||||
|
Gain on sale of non-consolidated affiliates
|
62
|
|
2
|
|
60
|
|
|||||
|
Other expense, net
|
15
|
|
42
|
|
(27
|
)
|
|||||
|
Provision for income taxes
|
43
|
|
21
|
|
22
|
|
|||||
|
Net income (loss) from continuing operations
|
110
|
|
(57
|
)
|
167
|
|
|||||
|
Income (loss) from discontinued operations
|
2,194
|
|
(35
|
)
|
2,229
|
|
|||||
|
Net income (loss)
|
2,304
|
|
(92
|
)
|
2,396
|
|
|||||
|
Net income attributable to non-controlling interests
|
41
|
|
65
|
|
(24
|
)
|
|||||
|
Net income (loss) attributable to Visteon Corporation
|
$
|
2,263
|
|
$
|
(157
|
)
|
$
|
2,420
|
|
||
|
Adjusted EBITDA*
|
$
|
203
|
|
$
|
102
|
|
$
|
101
|
|
||
|
*
Adjusted EBITDA is a Non-GAAP financial measure, as further discussed
below.
|
|||||||||||
Sales
Sales for the
nine
months ended
September 30, 2015
totaled
$2,436 million
, which represents an increase of
$638 million
compared with the same period of
2014
. The largest driver of the sales increase was the Electronics Acquisition of $691 million. Additionally, customer volumes, new business and product mix increased sales by $110 million. Favorable volumes, new business and product mix increased sales in the Electronics Product Group by $145 million but this increase was partially offset by the wind-down of certain programs which impacted Other Product Group sales. Unfavorable currency decreased sales by $124 million, primarily attributable to the weakening Euro and Japanese Yen. Other reductions of $39 million were associated with customer pricing, net of design savings.
Cost of Sales
Cost of sales for the nine months ended September 30, 2015 totaled $2,120 million, which represents an increase of
$545 million
for the
nine
months ended
September 30, 2015
when compared with the same period in
2014
. The increase includes $699 million attributable to increased production volumes, including the Electronics Acquisition, new business, as well as changes in product mix, representing the variable nature of material and labor costs. Foreign currency decreased cost of sales by $107 million, primarily attributable to the weakening Euro. Net efficiencies related to material, design, and economics decreased cost of sales by $56 million. Other costs increased by $9 million and included the impacts of a pension settlement gain recognized in 2014, partially offset by manufacturing cost efficiencies.
Gross Margin
Gross margin was
$316 million
or
13.0%
of sales for the
nine
months ended
September 30, 2015
compared to
$223 million
or
12.4%
of sales for the same period of
2014
. The
$93 million
increase in gross margin included $102 million from favorable volumes and mix, including the impacts of the Electronics Acquisition. Gross margin also included $29 million of favorable net cost performance, driven by material and manufacturing cost efficiencies, which more than offset customary pricing productivity given to customers. These increases were partially offset by $17 million of unfavorable currency, primarily attributable to the weakening Euro, and a pension settlement gain recognized in 2014.
44
Selling, General and Administrative Expenses
Selling, general, and administrative expenses were
$182 million
and
$164 million
during the
nine
months ended
September 30, 2015
and
2014
, respectively. The increase is primarily related to the Electronics Acquisition, partially offset by the impacts of the weakening Euro, and net efficiencies.
Restructuring Expense
Electronics:
In connection with the Electronics Acquisition, the Company commenced a restructuring program designed to achieve cost savings through transaction synergies. The program is designed to achieve annual cost savings of $70 million by the end of 2016. Through
September 30, 2015
, the Company has recorded approximately
$51 million
of restructuring expenses under this program, net of reversals, associated with approximately
1,000
employees, and expects to incur up to approximately
$60 million
of restructuring costs during the program. During the
nine
months ended
September 30, 2015
and September 30, 2014, the Company recorded
$14 million
, net of reversals, and
$5 million
, respectively, of severance and termination benefits under this program associated with approximately
400
employees. Approximately
$23 million
remains accrued at
September 30, 2015
.
Corporate:
The Company previously announced a restructuring program designed to reduce fixed costs and to improve operational efficiency by addressing certain under-performing operations. In connection with that program, the Company announced plans to realign its corporate and administrative functions directly to their corresponding operational beneficiary. During the
nine
months ended
September 30, 2015
and
2014
, the Company recorded
$4 million
and
$1 million
, respectively, for restructuring expenses, primarily related to severance and termination benefits associated with certain executives. As of
September 30, 2015
,
$3 million
remains accrued for this program.
Other:
During the
nine
months ended
September 30, 2014
, the Company recorded
$28 million
of restructuring expenses, including
$12 million
classified as discontinued operations, related to employee and severance termination benefits, primarily including the following activities.
|
•
|
The Company recorded
$13 million
and
$2 million
of restructuring expenses, associated with the previously announced closure of Climate operations in Quilmes, Argentina and Port Elizabeth, South Africa, respectively. Approximately
$1 million
remains accrued at
September 30, 2015
.
|
|
•
|
The Company recorded $6 million of severance and termination benefits associated with approximately 100 employees at two European Interiors facilities in Spain.
|
|
•
|
In connection with the previously announced restructuring of three Interiors facilities in France, the Company recorded an additional
$5 million
of restructuring expenses, of which
$4 million
remains accrued as of
September 30, 2015
, in addition to
$2 million
associated with a previously announced program for the fundamental reorganization of operations at a facility in Brazil. The Company retained approximately
$6 million
of restructuring reserves as part of the Interiors Divestiture.
|
The Company's restructuring reserves and related activity, including
$2 million
of expense attributable to discontinued operations, are summarized below for the
nine
months ended
September 30, 2015
.
|
|
Electronics
|
Corporate
|
Other
|
Total
|
|||||||||||
|
(Dollars in Millions)
|
|||||||||||||||
|
December 31, 2014
|
$
|
30
|
|
$
|
—
|
|
$
|
9
|
|
$
|
39
|
|
|||
|
Expense
|
18
|
|
4
|
|
2
|
|
24
|
|
|||||||
|
Utilization
|
(19
|
)
|
(1
|
)
|
(3
|
)
|
(23
|
)
|
|||||||
|
Reversals
|
(4
|
)
|
—
|
|
—
|
|
(4
|
)
|
|||||||
|
Foreign currency
|
(2
|
)
|
—
|
|
(1
|
)
|
(3
|
)
|
|||||||
|
September 30, 2015
|
$
|
23
|
|
$
|
3
|
|
$
|
7
|
|
$
|
33
|
|
|||
Utilization represents payments for severance and other employee termination benefits and special termination benefits reclassified to pension and other postretirement employee benefit liabilities, where such payments are made from the Company’s benefit plans.
45
During October 2015, the Company announced a restructuring program designed to reduce the workforce at a European Electronics facility. The Company expects to record restructuring charges of approximately
$15 million
during the fourth quarter of 2015, primarily related to severance and termination benefit costs.
Interest Expense, Net
Interest expense, net of
$13 million
for the
nine
months ended
September 30, 2015
is primarily associated with the Company's Term Facility due April 9, 2021 with original principal of $600 million and prepaid down to $350 million following the Climate Transaction in June 2015. During the
nine
months ended
September 30, 2014
, interest expense, net was
$15 million
, primarily including interest expense of $10 million associated with the Company's 6.75% Senior Notes which were redeemed in April 2014 and interest expense of $7 million associated with the Company's Term Facility at original principal balance of $600 million.
Loss on Debt Extinguishment
Loss on debt extinguishment of
$5 million
during the
nine
months ended
September 30, 2015
reflect unamortized original issue discount and debt and amendment fees associated with the pay-down of
$246 million
term loan principal on June 12, 2015 to reduce the outstanding aggregate principal of the Term Facility to approximately $350 million. In connection with the principal reduction, the 0.25% mandatory quarterly prepayment obligation was considered met, therefore Visteon will cease making quarterly amortization payments.
Loss on debt extinguishment of
$23 million
during the
nine
months ended
September 30, 2014
reflected the redemption premium and unamortized original issue discount, debt fees and other debt issue costs associated with the redemption of all of the remaining $400 million 6.75% Senior Notes due April 2019. $50 million of the 6.75% senior notes was redeemed at a 103% premium on April 10, 2014, and the $350 million was redeemed at a 105.063% premium on May 9, 2014.
Equity in Net Income of Non-Consolidated Affiliates
Equity in net income of non-consolidated affiliates was
$8 million
and
$5 million
for the
nine
-month periods ended
September 30, 2015
and
2014
respectively. The increase was primarily attributable to dividend recognition for a cost basis investment.
Gain on Sale of Non-Consolidated Affiliates
During the
nine
months ended
September 30, 2015
, the Company completed the sale of its 12.5% ownership interest in Yanfeng Visteon Jinqiao Automotive Trim Systems Company, Limited, a Chinese automotive interiors supplier, for proceeds of $91 million and recorded a pre-tax gain on sale of $62 million.
During the
nine
months ended
September 30, 2014
, the Company completed the sale of its 50% ownership interest in Duckyang Industry Co., Ltd. ("Duckyang"), a Korean automotive interiors supplier. The Company recorded a pre-tax gain of approximately $2 million on this transaction.
Other Expense, Net
Other expense, net consist of the following:
|
Nine Months Ended
September 30 |
|||||||
|
2015
|
2014
|
||||||
|
(Dollars in Millions)
|
|||||||
|
Transformation initiatives
|
$
|
4
|
|
$
|
18
|
|
|
|
Integration costs
|
11
|
|
11
|
|
|||
|
Loss on asset contribution
|
—
|
|
3
|
|
|||
|
Provision for losses on recoverable taxes
|
—
|
|
8
|
|
|||
|
Other
|
—
|
|
2
|
|
|||
|
$
|
15
|
|
$
|
42
|
|
||
The Company recorded transformation initiatives of
$4 million
and
$18 million
of net expense for the
nine
months ended
September 30, 2015
and
2014
, respectively. Transformation initiatives include financial and advisory services incurred in connection with execution of the Company's comprehensive value creation plan and certain severance costs associated with the
46
Electronics Acquisition and the Climate Transaction. Transformation initiatives also include favorable hedging and exchange impacts of $19 million for the
nine
months ended
September 30, 2015
, related to the Climate Transaction proceeds.
Integration costs include costs associated with re-branding, facility modification, information technology readiness and related professional services necessary to integrate businesses associated with the Electronics Acquisition. The Company expects to incur total integration costs of
$40 million
over a two-year period through the end of 2015, of which $18 million had been incurred in 2014 and
$11 million
has been incurred during the
nine
months ended
September 30, 2015
.
During the
nine
months ended
September 30, 2014
, the Company recorded
$8 million
to adjust recoverable value-added taxes to net realizable value attributable to business exit activities.
During the
nine
months ended
September 30, 2014
, the Company contributed land and building with net book value of
$3 million
to the local municipalities in Quilmes, Argentina for the benefit of former employees.
Income Taxes
The Company's provision for income taxes of
$43 million
for the
nine
months ended
September 30, 2015
represents an increase of
$22 million
when compared with
$21 million
in the same period of
2014
. The increase in tax expense is primarily attributable to the overall increase in earnings, including the impact of changes in the mix of earnings and differing tax rates between jurisdictions, and $8 million related to the tax associated with the sale of its non-consolidated affiliate located in China during the second quarter of
2015
, and $5 million related to the non-recurrence of a tax benefit related to the partial elimination of valuation allowances in Mexico during the third quarter of 2014. These increases were partially offset by an $8 million reduction in unrecognized tax benefits, including interest and penalties, related primarily to favorable audit developments in Asia during the first quarter of
2015
.
Discontinued Operations
The results of operations for Interiors and Climate businesses subject to the Interiors Divestiture and Climate Transaction, respectively, have been reclassified to "Income (loss) from discontinued operations, net of tax" in the consolidated statements of comprehensive income for the
nine
months ended
September 30, 2015
and
2014
. Discontinued operations are as follows:
|
Nine Months Ended
September 30 |
|||||||
|
2015
|
2014
|
||||||
|
(Dollars in Millions)
|
|||||||
|
Sales
|
$
|
2,184
|
|
$
|
4,402
|
|
|
|
Cost of sales
|
2,021
|
|
4,008
|
|
|||
|
Gross margin
|
163
|
|
394
|
|
|||
|
Selling, general and administrative expenses
|
76
|
|
148
|
|
|||
|
Loss and impairments on Interiors Divestiture
|
17
|
|
188
|
|
|||
|
Gain on Climate Transaction
|
2,332
|
|
—
|
|
|||
|
Restructuring expense
|
2
|
|
12
|
|
|||
|
Interest expense, net
|
2
|
|
5
|
|
|||
|
Equity in net income of non-consolidated affiliates
|
6
|
|
10
|
|
|||
|
Other expense, net
|
8
|
|
11
|
|
|||
|
Income from discontinued operations before income taxes
|
2,396
|
|
40
|
|
|||
|
Provision for income taxes
|
202
|
|
75
|
|
|||
|
Income (loss) from discontinued operations, net of tax
|
$
|
2,194
|
|
$
|
(35
|
)
|
|
47
During the
nine
-month period ended
September 30, 2015
, the Company received
$3.4 billion
of gross proceeds and recorded a pre-tax gain of
$2.3 billion
associated with the Climate Transaction. A summary of the gain is summarized below (dollars in millions):
|
|
||||
|
Gross proceeds
|
(1)
|
$
|
3,423
|
|
|
Korea withholding tax
|
(2)
|
(377
|
)
|
|
|
Professional fees
|
(3)
|
(20
|
)
|
|
|
Korea security transaction tax
|
(4)
|
(17
|
)
|
|
|
Divested cash balances
|
(5)
|
(345
|
)
|
|
|
Net cash provided from investing activities
|
2,664
|
|
||
|
Net assets divested, excluding cash balances
|
(5)
|
(557
|
)
|
|
|
Information technology separation and service obligations
|
(6)
|
(53
|
)
|
|
|
Employee related charges
|
(7)
|
(45
|
)
|
|
|
Electronics business repurchase obligation
|
(8)
|
(50
|
)
|
|
|
Professional fees
|
(3)
|
(4
|
)
|
|
|
Korea withholding tax recoverable
|
(2)
|
377
|
|
|
|
Net gain on Climate Transaction
|
$
|
2,332
|
|
|
(1) Gross proceeds of
$3.423 billion
were received in connection with the Climate Transaction, translated at a spot rate of
1,121.5
KRW to USD on June 9, 2015. Impacts of related hedging activities and exchange on proceeds conversion into USD are included in the Company's consolidated statements of comprehensive income as "Other expense, net" for the
nine
months ended
September 30, 2015
.
(2) The Company remitted Korean withholding tax of
$377 million
, reducing proceeds classified as net cash provided from investing activities within the Company's consolidated statements of cash flows for the
nine
months ended
September 30, 2015
. The Company believes it is more likely than not that such amounts will be recovered within one to five years after transaction close. The withholding tax recoverable, including subsequent exchange and interest impacts, is classified within the Company's consolidated balance sheets as "Other non-current assets" as of
September 30, 2015
.
(3) Professional fees of
$24 million
, representing professional fees paid to financial advisors, were based on a percentage of the gross proceeds, partially offset by previously paid retainer fees of
$4 million
, for a net payment of
$20 million
reducing proceeds classified as net cash provided from investing activities within the Company's consolidated statements of cash flows for the
nine
months ended
September 30, 2015
.
(4) Security transaction taxes of
$17 million
were remitted to the Korean government as of the transaction close, reducing proceeds classified as net cash provided from investing activities within the Company's consolidated statements of cash flows for the
nine
months ended
September 30, 2015
.
(5) Net assets of
$902 million
, including assets, liabilities, accumulated other comprehensive income and non-controlling interests, were divested in connection with the Climate Transaction. Divested assets included
$345 million
of cash balances, reflected as a reduction of transaction proceeds classified as net cash provided from investing activities within the Company's consolidated statements of cash flows for the
nine
months ended
September 30, 2015
.
(6) In connection with the Climate Transaction, the Company has entered an agreement pursuant to which Visteon will provide information technology ongoing and separation services for HVCC to fully operate as an independent entity with estimated costs of approximately
$53 million
. The remaining information technology liability is included in the Company's consolidated balance sheets as "Other current liabilities" as of
September 30, 2015
.
(7) Employee related charges of
$45 million
include bonus payments, the Company's assumption of incentive plan liabilities, and impacts of employment change in control provisions. Bonus payments of
$30 million
are classified in the Company's net cash provided from operating activities within the Company's consolidated statements of cash flows for the
nine
months ended
September 30, 2015
. Amounts remaining to be paid are included in the Company's consolidated balance sheets as "Accrued employee liabilities" as of
September 30, 2015
.
48
(8) In connection with the Climate Transaction, the Company has entered an agreement to purchase certain electronics operations located in India, expected to close in 2016 after legal separation and regulatory approvals are met. The Company has recorded a repurchase obligation of
$50 million
, representing the estimated purchase price of the subject business. The Company continues to consolidate the business, with net assets of approximately $22 million, based on the Company’s continued controlling financial interest. The Company’s controlling financial interest was evaluated based on continued operating control and obligation to fund losses or benefit from earnings. The business is included in a legal entity currently owned by HVCC and therefore the Electronics business assets are not available for general corporate purposes.The repurchase commitment is included in the Company's consolidated balance sheets as "Other current liabilities" as of
September 30, 2015
.
During the
nine
month period ended
September 30, 2015
, the Company recorded additional losses and adjustments related to the Interiors Divestiture of
$17 million
, including
$3 million
attributable to the sale of operations in Thailand. Consideration associated with the Interiors Divestiture remains subject to further adjustments including working capital adjustments.
Net Income (Loss)
Net income attributable to Visteon was
$2,263 million
million for the
nine
months ended
September 30, 2015
compared to net loss of
$157 million
for the same period of
2014
. The increase of
$2,420 million
included the Climate Transaction pre-tax gain of $2,332 million, classified as income from discontinued operations and a $62 million gain on sale of its 12.5% ownership interest in Yanfeng Visteon Jinqiao Automotive Trim Systems Company, Limited.
Adjusted EBITDA (a non-GAAP financial measure, as defined below) was
$203 million
for the
nine
months ended
September 30, 2015
, representing an increase of
$101 million
when compared with Adjusted EBITDA of
$102 million
for the same period of
2014
. The increase in Adjusted EBITDA included $69 million of favorable volume and mix, primarily attributable to the Electronics Acquisition. Currency movements unfavorably impacted Adjusted EBITDA for the
nine
months ended
September 30, 2015
by $10 million, largely related to the weakening Euro. Favorable net cost performance impacted Adjusted EBITDA for the
nine
months ended
September 30, 2015
by $42 million. Material cost efficiencies, and lower selling, general and administrative expense and engineering expense, more than offset customer pricing and increased warranty expense.
Adjusted EBITDA is defined by the Company as net income attributable to the Company, plus net interest expense, provision for income taxes and depreciation and amortization, as further adjusted to eliminate the impact of discontinued operations, equity in net income of non-consolidated affiliates, net income attributable to non-controlling interests, gains or losses on divestitures, net restructuring expenses and other reimbursable costs, loss on debt extinguishment, non-cash stock-based compensation expense, certain employee charges and benefits, reorganization items and other non-operating gains and losses. During the three months ended March 31, 2015, the Company changed its definition of Adjusted EBITDA to exclude the impact of discontinued operations. Accordingly, Adjusted EBITDA for historical periods has been recast in a manner consistent with the Company's new definition.
Adjusted EBITDA is not a recognized term under accounting principles generally accepted in the United States and does not purport to be a substitute for net income as an indicator of operating performance or cash flows from operating activities as a measure of liquidity. Adjusted EBITDA has limitations as an analytical tool and is not intended to be a measure of cash flow available for management's discretionary use, as it does not consider certain cash requirements such as interest payments, tax payments and debt service requirements. In addition, the Company uses Adjusted EBITDA (i) as a factor in incentive compensation decisions, (ii) to evaluate the effectiveness of the Company's business strategies and (iii) because the Company's credit agreements use measures similar to Adjusted EBITDA to measure compliance with certain covenants. Adjusted EBITDA is presented as a supplemental measure of the Company's financial performance that management believes is useful to investors because the excluded items may vary significantly in timing or amounts and/or may obscure trends useful in evaluating and comparing the Company's operating activities across reporting periods. Not all companies use identical calculations and, accordingly, the Company's presentation of Adjusted EBITDA may not be comparable to other similarly titled measures of other companies.
49
The reconciliation of Adjusted EBITDA to net income attributable to Visteon for the
nine
months ended
September 30, 2015
and
2014
, is as follows:
|
Nine Months Ended September 30
|
|||||||||||
|
2015
|
2014
|
Change
|
|||||||||
|
(Dollars in Millions)
|
|||||||||||
|
Adjusted EBITDA
|
$
|
203
|
|
$
|
102
|
|
$
|
101
|
|
||
|
Depreciation and amortization
|
62
|
|
54
|
|
8
|
|
|||||
|
Restructuring expense
|
18
|
|
22
|
|
(4
|
)
|
|||||
|
Interest expense, net
|
13
|
|
15
|
|
(2
|
)
|
|||||
|
Loss on debt extinguishment
|
5
|
|
23
|
|
(18
|
)
|
|||||
|
Equity in net income of non-consolidated affiliates
|
(8
|
)
|
(5
|
)
|
(3
|
)
|
|||||
|
Gain on sale of non-consolidated affiliates
|
(62
|
)
|
(2
|
)
|
(60
|
)
|
|||||
|
Other expense, net
|
15
|
|
42
|
|
(27
|
)
|
|||||
|
Provision for income taxes
|
43
|
|
21
|
|
22
|
|
|||||
|
(Income) loss from discontinued operations, net of tax
|
(2,194
|
)
|
35
|
|
(2,229
|
)
|
|||||
|
Net income attributable to non-controlling interests
|
41
|
|
65
|
|
(24
|
)
|
|||||
|
Non-cash, stock-based compensation expense
|
7
|
|
9
|
|
(2
|
)
|
|||||
|
Pension settlement gain
|
—
|
|
(25
|
)
|
25
|
|
|||||
|
Other
|
—
|
|
5
|
|
(5
|
)
|
|||||
|
Net income (loss) attributable to Visteon Corporation
|
$
|
2,263
|
|
(157
|
)
|
$
|
2,420
|
|
|||
Segment Results of Operations -
Nine Months Ended September 30, 2015
and
2014
The Company's operating structure is organized by global product lines, including Electronics and Other. These global product lines have financial and operating responsibility over the design, development and manufacture of the Company's product portfolio. Certain functions such as procurement, information technology and other administrative activities are managed on a global basis with regional deployment. The Company's reportable segments are as follows:
|
•
|
Electronics - The Company's Electronics segment provides vehicle cockpit electronics products to customers, including audio systems, infotainment systems, driver information systems, connectivity and telematics solutions, climate controls, and electronic control modules.
|
|
•
|
Other - The Company's Other product line includes entities located in South America and Europe previously associated with the Interiors business but not subject to the Interiors Divestiture.
|
Sales by Segment
|
|
Electronics
|
Other
|
Eliminations
|
Total
|
|||||||||||
|
(Dollars in Millions)
|
|||||||||||||||
|
Nine months ended September 30, 2014
|
$
|
1,642
|
|
$
|
197
|
|
$
|
(41
|
)
|
$
|
1,798
|
|
|||
|
Volume and mix
|
145
|
|
(57
|
)
|
22
|
|
110
|
|
|||||||
|
Currency
|
(109
|
)
|
(15
|
)
|
—
|
|
(124
|
)
|
|||||||
|
Electronics Acquisition
|
691
|
|
—
|
|
—
|
|
691
|
|
|||||||
|
Price productivity and other
|
(37
|
)
|
(2
|
)
|
—
|
|
(39
|
)
|
|||||||
|
Nine months ended September 30, 2015
|
$
|
2,332
|
|
$
|
123
|
|
$
|
(19
|
)
|
$
|
2,436
|
|
|||
Electronics sales increased during the
nine
months ended
September 30, 2015
by
$690 million
. The largest driver of the sales increase was attributable to the Electronics Acquisition which increased sales by
$691 million
. Higher production volumes in Europe and Asia also increased sales by $145 million. Unfavorable currency, primarily related to the Euro and the Japanese Yen, decreased sales by $109 million. Other changes, totaling $37 million, reflected customer pricing net of design changes.
Other sales decreased during the
nine
months end
September 30, 2015
by
$74 million
, primarily reflecting the wind down of certain South America businesses and unfavorable currency of $15 million, primarily related to the Euro.
50
Cost of Sales by Segment
|
|
Electronics
|
Other
|
Eliminations
|
Total
|
|||||||||||
|
(Dollars in Millions)
|
|||||||||||||||
|
Nine months ended September 30, 2014
|
$
|
1,419
|
|
$
|
197
|
|
$
|
(41
|
)
|
$
|
1,575
|
|
|||
|
Material
|
463
|
|
(36
|
)
|
22
|
|
449
|
|
|||||||
|
Freight and duty
|
8
|
|
(7
|
)
|
—
|
|
1
|
|
|||||||
|
Labor and overhead
|
30
|
|
(19
|
)
|
—
|
|
11
|
|
|||||||
|
Engineering
|
52
|
|
—
|
|
—
|
|
52
|
|
|||||||
|
Depreciation and amortization
|
13
|
|
(7
|
)
|
—
|
|
6
|
|
|||||||
|
Other
|
24
|
|
2
|
|
—
|
|
26
|
|
|||||||
|
Nine months ended September 30, 2015
|
$
|
2,009
|
|
$
|
130
|
|
$
|
(19
|
)
|
$
|
2,120
|
|
|||
Substantially all of the increase in Electronics cost of sales is attributable to the Electronics Acquisition effective July 1, 2014.
Additionally Electronics material costs, freight and duty, and labor and overhead were impacted by higher production volumes, favorable currency, and cost efficiencies. Warranty costs also increased by $6 million in comparison to the same period last year, attributable to two customer actions related to defective supplier parts. The Company plans to pursue supplier reimbursement for these particular warranty issues in future periods.
Other segment cost of sales decreased by
$67 million
, primarily reflecting lower production volumes related to the wind down for certain programs in South America partially offset by the non-recurrence of a 2014 pension settlement gain.
Net engineering costs are comprised of gross engineering expenses related to forward model program development and advanced engineering activities, partially offset by engineering cost recoveries from customers. Gross engineering expenses were $287 million for the
nine
months ended
September 30, 2015
, an increase of $76 million compared to the same period of
2014
. Engineering recoveries were $57 million for the
nine
months ended
September 30, 2015
, an increase of $24 million compared to the same period of
2014
. Engineering cost recoveries can fluctuate period to period depending on underlying contractual terms and conditions and achievement of related development milestones.
Adjusted EBITDA by Segment
Adjusted EBITDA by segment for the
nine
months ended
September 30, 2015
and
2014
is presented in the table below.
|
Nine Months Ended September 30
|
|||||||||||
|
2015
|
2014
|
Change
|
|||||||||
|
(Dollars in Millions)
|
|||||||||||
|
Electronics
|
$
|
250
|
|
$
|
157
|
|
$
|
93
|
|
||
|
Other
|
(8
|
)
|
(11
|
)
|
3
|
|
|||||
|
Segment Adjusted EBITDA
|
242
|
|
146
|
|
96
|
|
|||||
|
Corporate
|
(39
|
)
|
(44
|
)
|
5
|
|
|||||
|
Adjusted EBITDA
|
$
|
203
|
|
$
|
102
|
|
$
|
101
|
|
||
Changes in Adjusted EBITDA by segment are presented in the table below.
|
|
Electronics
|
Other
|
Total
|
||||||||
|
(Dollars in Millions)
|
|||||||||||
|
Nine months ended September 30, 2014
|
$
|
157
|
|
$
|
(11
|
)
|
$
|
146
|
|
||
|
Volume and mix
|
74
|
|
(5
|
)
|
69
|
|
|||||
|
Currency
|
(9
|
)
|
(1
|
)
|
(10
|
)
|
|||||
|
Other
|
28
|
|
9
|
|
37
|
|
|||||
|
Nine months ended September 30, 2015
|
$
|
250
|
|
$
|
(8
|
)
|
242
|
|
|||
|
Corporate
|
(39
|
)
|
|||||||||
|
Total
|
$
|
203
|
|
||||||||
51
Electronics Adjusted EBITDA increased
$93 million
for the
nine
months ended
September 30, 2015
when compared to the same period of
2014
. Higher volumes, including the Electronics Acquisition, and favorable product mix increased Adjusted EBITDA by $74 million. Currency, primarily related to the Euro, had an unfavorable impact of $9 million. Other impacts of $28 million primarily reflected material and manufacturing cost efficiencies, partially offset by customer price productivity, increased warranty expense, and higher engineering expense. The increase in warranty expense was attributable to two customer actions related to defective supplier parts. The Company plans to pursue supplier reimbursement for these particular warranty issues in future periods.
Other Adjusted EBITDA for the
nine
months ended
September 30, 2015
decreased by
$3 million
compared to the same period of
2014
due to lower production volumes and the weakening Euro.
Liquidity
The Company’s primary liquidity needs are related to the funding of general business requirements, including working capital, capital expenditures, debt service, employee retirement benefits and restructuring actions. The Company's primary sources of liquidity are cash flows from operations, existing cash balances, asset sales, and borrowings under available credit facilities, if necessary. To the extent the Company generates discretionary cash flow, it will be evaluated for and may be used for optional prepayments of existing indebtedness, strategic acquisitions, additional share repurchases, and/or general corporate purposes.
As of
September 30, 2015
, the Company had total cash and short-term investments balances of
$2,920 million
, including
$8 million
of restricted cash and
$52 million
of short-term investments. Cash balances totaling $332 million were located in jurisdictions outside of the United States, of which approximately $220 million is considered permanently reinvested for funding ongoing operations outside of the U.S. If such permanently reinvested funds are needed for operations in the U.S., the Company would be required to accrue additional tax expense, primarily related to foreign withholding taxes.
The Company's ability to fund its liquidity needs is dependent on the level, variability and timing of its customers' worldwide vehicle production, which may be affected by many factors including, but not limited to, general economic conditions, specific industry conditions, financial markets, competitive factors and legislative and regulatory changes. The Company monitors the macroeconomic environment and its impact on vehicle production volumes in relation to the Company's specific cash needs. The Company's intra-year needs are impacted by seasonal effects in the industry, such as mid-year shutdowns, the subsequent ramp-up of new model production and the additional year-end shutdowns by primary customers.
Significant Cash Sources and Availability
To the extent that the Company's liquidity needs exceed cash provided by its operating activities, the Company would look to cash balances on hand which includes cash provided from its $350 million Term Facility that matures on April 9, 2021, or cash available through existing financing facilities such as its $200 million revolving credit facility that matures on April 9, 2019 ("Revolving Facility") or other affiliate working capital lines of credit, the sale of businesses or other assets as permitted under credit agreements, other contractual arrangements, and potential additional capital through debt or equity markets.
The Company originally entered into a $600 million delayed draw Term Loan Facility on April 9, 2014 and subsequently executed an Amendment to the Credit Agreement on
March 25, 2015
. The Amendment, among other things, provided for certain modifications to the Credit Agreement to permit Visteon’s sale of its ownership interest in HVCC (Climate Transaction) and otherwise to update the Credit Agreement to account for HVCC no longer being a subsidiary of Visteon following the Climate Transaction. While certain waivers granted under the Amendment became effective on
March 25, 2015
, the amendments relating to the Climate Transaction became effective concurrent with the consummation of the Climate Transaction on
June 9, 2015
. Under the Amendment, Term Lenders agreed to waive a requirement of the Credit Agreement that
100%
of the net cash proceeds received by the Borrower or any of its Restricted Subsidiaries from the Climate Transaction be used to prepay the Term Loans so long as such net cash proceeds are used to prepay the Term Loans within five business days of the receipt of such net cash proceeds in an amount sufficient to reduce the aggregate principal amount of Term Loans outstanding after giving effect to such prepayment to no more than
$350 million
. In conjunction with the Amendment, the facilities were upgraded to BB and Ba3 by S&P and Moody's, respectively.
Visteon consummated the Climate Transaction on June 9, 2015 and subsequently paid down $246 million of term loan principal on June 12, 2015 to reduce the aggregate principal amount of the Term Loans outstanding to approximately $350 million. In connection with the principal reduction, the 0.25% mandatory quarterly prepayment obligation was considered completed, and therefore the Company will cease making quarterly amortization payments.
52
As of
September 30, 2015
, $350 million face value was outstanding under the Term Facility, and there were no outstanding borrowings under the Revolving Facility. Availability under outstanding affiliate credit facilities as of
September 30, 2015
is approximately $18 million.
Access to additional capital through the debt or equity markets is influenced by the Company's credit ratings. At
September 30, 2015
, the Company's corporate credit ratings were B1 by Moody's with a stable outlook and B+ by S&P with a positive outlook.
Climate Transaction
Based on current market conditions, the Company has announced its intention to return a portion of the Climate Transaction proceeds to stockholders, ranging from approximately $2.5 billion to $2.75 billion, through a structured series of actions including repurchases of common stock and/or a special dividend. On June 16, 2015, the Company entered into a $500 million accelerated share repurchase as the first of these shareholder return actions. The Company also prepaid $246 million on its Term Loan Facility and intends to use the remaining proceeds from the Climate Transaction for general corporate purposes, which may include investments in restructuring and strategic investments to support the continued expansion of the vehicle cockpit electronics business.
As of
September 30, 2015
the remaining Climate Transaction proceeds are invested in a diversified portfolio of cash and cash equivalents and short-term cash investments including money market funds, time deposits and commercial paper rated A2/P2 and above with maturities under three months and other short-term investments, with maturities between three and twelve months with highly rated banking institutions. The cost of such funds approximates fair value based on the nature of the investment.
Interiors Divestiture
In connection with the Interiors Divestiture
, the Company agreed to provide a $56 million revolving credit facility to the buyer, which was subsequently amended to $39 million as of July 24, 2015. As of
September 30, 2015
, there were no draws on this facility. Draws under this seller-backed facility will only be available if certain of the external credit facilities are fully drawn, and any draws on the seller-backed facility generally must be repaid prior to the repayment of the external credit facilities. The seller-backed facility has a maturity of three years, an interest rate of Libor plus 5% and a
default rate of interest for any interest and/or principal payment defaults
.
The remaining Interiors Divestiture transactions are subject to various conditions, including regulatory and antitrust approvals, receipt of other third party consents and approvals and other customary closing conditions, and may be subject to further cash impacts based on purchase price adjustments at the time of closing, which amounts may be material.
On October 30, 2015, Visteon entered into an agreement to sell and transfer its equity ownership in Visteon Deutschland GmbH, which operates an automotive interiors plant in Berlin, Germany with annual 2014 sales of approximately $130 million, to APCH Automotive Plastic Components Holding GmbH. Visteon will contribute cash and other assets in an amount approximately equivalent to the estimated net pension related liabilities of $190 million. The Company expects to record an estimated loss of $100 million in connection with the sale, anticipated to occur on or around December 1, 2015.
Share Repurchase Program
Visteon's board authorized share repurchase of $875 million in 2014. On May 8, 2014, the Company announced an accelerated share buy-back ("ASB") program with a third-party financial institution to repurchase shares of common stock for an aggregate purchase price of $500 million. Approximately $250 million of this program was completed on October 15, 2014 at a final settlement price of $96.19. The remaining $250 million of this program concluded on May 1, 2015 at a final settlement price of $97.25. On June 11, 2015, the Company’s board of directors authorized an additional $125 million of share repurchase for a total of $500 million available for share repurchase. On June 16, 2015, the Company entered into a new ASB program with a third-party financial institution to purchase shares of common stock for an aggregate purchase price of
$500 million
. Under the program, the Company paid the financial institution
$500 million
and received an initial delivery of
3,712,297
shares of common stock, which is approximately
80%
of the total number of shares of the Company’s common stock expected to be repurchased under the ASB Agreement based on the closing price of the Company’s common stock on June 15, 2015. The final number of shares to be repurchased will be based on the average of the daily volume-weighted average prices of the Company’s common stock during the term of the transaction, less an agreed discount and subject to adjustments pursuant to the terms and conditions of the ASB Agreement. The final settlement of the transaction under the ASB Agreement is expected to occur by the end of 2015 but may be accelerated at the option of the third-party financial institution.
53
The Company anticipates that additional repurchases of common stock, if any, would occur from time to time in open market or privately negotiated transactions depending on market and economic conditions, share price, trading volume, alternative uses of capital and other.
Restructuring
At
September 30, 2015
, the Company had restructuring accruals totaling
$33 million
, including amounts associated with discontinued operations. The Company anticipates that the activities associated with the restructuring reserve balance will be substantially completed by the first half of 2016. These accruals are primarily attributable to a restructuring program designed to achieve annual cost savings of approximately $70 million by the end of 2016 through synergies associated with the Electronics Acquisition. Through
September 30, 2015
, the Company has recorded approximately
$51 million
of restructuring expenses under this program, associated with approximately
1,000
employees, and expects to incur up to approximately
$60 million
of restructuring costs during the program.
During October 2015, the Company announced a restructuring program designed to reduce the workforce at a European Electronics facility. The Company expects to record restructuring charges of approximately
$15 million
during the fourth quarter of 2015, primarily related to severance and termination benefit costs.
Other
In connection with the Electronics Acquisition, the Company expects to incur total integration costs of
$40 million
, of which $29 million has been incurred through September 30, 2015. Of the integration costs incurred, $18 million was paid in 2014, and $11 million were paid during the first
nine
months of 2015. Remaining integration costs, primarily attributable to the migration of information systems, are expected to be incurred and paid by year ending December 31, 2015.
Cash contributions to non-U.S. retirement plans are expected to be $21 million during 2015 and cash contributions to U.S. retirement plans are expected to be $1 million during 2015. Estimated cash contributions for 2016 through 2018, under current regulations and market assumptions, are approximately $36 million, including $10 million related to the Company's expected fourth quarter 2015 sale of Visteon Deutschland GmbH.
In connection with the Climate Transaction,
$377 million
of Korean capital gains tax was withheld by the Purchasers and paid to the Korean government. The Company has initiated filings with the Korean tax authorities pursuing a refund of the capital gains tax pursuant to the applicable income tax treaty with Korea and believes it is more likely than not that such amount will be recovered over the subsequent one to five years. Also in connection with the Climate Transaction, the Company withdrew its appeals related to the alleged underpayment of withholding tax on dividends paid from its former Korean affiliates through 2012 and eliminated the various income tax refund claims previously recorded at the Climate legal entities. As a consequence of these actions, the Company established a long-term income tax receivable of $377 million, subsequently reduced by $18 million of exchange and interest impacts, and reduced its previous balance by approximately
$12 million
, of which
$7 million
was reflected in discontinued operations income tax expense and
$5 million
reflected as discontinued operations related to the gain on the Climate Transaction. During 2012, Brazilian tax authorities issued tax assessment notices to Visteon Sistemas Automotivos (“Sistemas”) of approximately
$10 million
related to the sale of its chassis business to a third party. During 2013, after attempts to reopen an appeal of the administrative decision failed, Sistemas opened a judicial proceeding against the government to address the notice which required a deposit in the amount of the assessment in order to suspend the debt and allow Sistemas to operate regularly before the tax authorities. The Company believes that the risk of a negative outcome is remote once the matter is fully litigated at the highest judicial level. These appeal payments in Korea and Brazil, as well as contingent income tax refund claims associated with other jurisdictions, total
$373 million
as of
September 30, 2015
and are included in Other non-current assets on the consolidated balance sheets.
54
Cash Flows
The Company has combined cash flows from discontinued operations with cash flows from continuing operations within the operating, investing and financing categories in the Consolidated Statements of Cash Flows of the Company's consolidated financial statements in this Quarterly Report on Form 10-Q for all periods presented. As such, the discussion below includes both continuing and discontinued operations.
Operating Activities
Including discontinued operations, the Company generated
$274 million
of cash provided from operating activities during the
nine
months ended
September 30, 2015
, compared to
$180 million
during the same period of
2014
for an increase of
$94 million
. The increase is primarily attributable to lower working capital requirements including $53 million in connection with the HVCC climate operations divestiture and payment delays of $20 million attributable to system conversions at two operating facilities and calendar timing of payments, during the nine months ended September 30, 2015. Additional increases in cash provided from operating activities include higher capitalized engineering recoveries of $17 million and lower restructuring payments of $25 million, offset by lower dividends from non-consolidated affiliates of $9 million and a Korean withholding tax refund of $10 million received during the same period of 2014.
Investing Activities
Net cash provided from investing activities during the
nine
months ended
September 30, 2015
totaled
$2,531 million
, compared to cash used by investing activities of
$461 million
for the same period in
2014
, for an increase in net cash provided from investing activities of
$2,992 million
. During the first nine months ended September 30, 2015, cash provided by investing activities was primarily due to $2,664 million of Climate Transaction proceeds net of tax, transaction costs and divested cash balances, $91 million in proceeds from the sale of the Company's 12.5% ownership in Yanfeng Visteon Jinqiao Automotive Trim Systems Company, Limited, and a $58 million decrease in capital spending related to divested operations, offset partially by investments in short-term securities of $52 million, a $10 million shareholder loan to Yanfeng Visteon Investment Co., Ltd., and a $15 million Interiors Divestiture working capital settlement. During the nine months ended September 30, 2014, cash used by investing activities included $308 million used for the acquisition of business, net of cash acquired in 2014, which reflected $264 million for the Electronics Acquisition and $44 million for a Climate Acquisition. In addition, during the nine months ended September 30, 2014, cash used by investing activities included $11 million for two cost basis investments. Cash provided by investing activities during the nine months ended September 30, 2014 included $64 million of proceeds from the sale of various interests owned by Yanfeng Visteon Automotive Electronics Co. Ltd. ("YFVE") and the sale of the Company's 50% ownership interest in Duckyang Industries Co., Ltd.
Financing Activities
Cash used by financing activities of
$759 million
for the
nine
months ended
September 30, 2015
compared to
$344 million
for the same period in
2014
, for an increase in cash used by financing activities of
$415 million
. The change is primarily due to the prepayment of the Company's term facility including fees of $250 million for the
nine
months ending
September 30, 2015
as compared to net cash proceeds of $171 million during the same period of the prior year in which the Company redeemed 6.75% Senior Notes due 2019 (face value $400 million and redemption payment including premium of $419 million) and borrowed $600 million on the new Term Facility (face value $600 million and proceeds net of original issue discount and financing fees of $590 million). Additional cash used by financing activities include the impacts of lower net affiliate debt draws in the first
nine
months of
2015
compared to the same period in
2014
of $57 million. These increases were partially offset by $53 million lower payments to non-controlling interests, primarily reflecting Yangfeng Visteon Electronics Co., Ltd. dividend payments totaling $46 million primarily associated with the Yangfeng Transactions in 2014 and dividend payments to HVCC affiliates’ minority owners of $8 million during the first nine months of 2014. The Company launched $500 million in accelerated share repurchase programs during both the nine months ended September 30,
2015
and
2014
. The Company also received higher cash proceeds of $7 million for option and stock warrant exercises during the nine months ended September 30, 2015.
55
Debt and Capital Structure
Additional information related to the Company’s debt is set forth in Note 10, “Debt” to the consolidated financial statements included herein under Item 1. For additional information, refer to the Company's Annual Report on Form 10-K for the year ended
December 31, 2014
, for specific debt agreements and additional information related to covenants and restrictions.
Off-Balance Sheet Arrangements
The Company renewed its $15 million Letter of Credit ("LOC") Facility with U.S. Bank National Association for two years on September 30, 2015. Under the terms of the LOC facility, the Company must maintain a collateral account with U.S. Bank equal to 103% of the aggregated stated amount of the issued LOCs (or 110% for non-U.S. currencies) with reimbursement for any draws. As of
September 30, 2015
, the Company had $6 million of outstanding letters of credit issued under this facility and secured by restricted cash. In addition, the Company's affiliates had $15 million of locally issued letters of credit to support various customs arrangements and other obligations, with $1 million secured by cash collateral.
In connection with the Interiors Divestiture
, the Company agreed to provide a $56 million revolving credit facility to the buyer. As of
September 30, 2015
, there were no draws on this facility. Draws under this seller-backed facility will only be available if certain of the external credit facilities are fully drawn, and any draws on the seller-backed facility generally must be repaid prior to the repayment of the external credit facilities. The seller-backed facility has a maturity of three years, an interest rate of Libor plus 5% and a
default rate of interest for any interest and/or principal payment defaults
. This revolving credit facility to the buyer is $39 million as of
September 30, 2015
.
The Company provided a
$40 million
loan guarantee to Yanfeng Visteon Electronics (China) Investment Co., Ltd. ("YFVIC"), a 50% owned joint venture, in connection with the October 2014 YFVIC acquisition of a
49%
direct ownership interest in YFVE. The guarantee contains standard non-payment provisions to cover the borrowers in event of non-payment of principal, accrued interest, and other fees for its
five
year tenor.
Fair Value Measurements
The Company uses fair value measurements in the preparation of its financial statements, utilizing various inputs including those that can be readily observable, corroborated or are generally unobservable. The Company utilizes market-based data and valuation techniques that maximize the use of observable inputs and minimize the use of unobservable inputs. Additionally, the Company applies assumptions that market participants would use in pricing an asset or liability, including assumptions about risk.
In accounting for business combinations, the purchase price of an acquired business is allocated to its identifiable assets and liabilities based on estimated fair values. The excess of the purchase price over the amount allocated to the assets and liabilities, if any, is recorded as goodwill. Determining the fair values of assets acquired and liabilities assumed requires management's judgment, the utilization of independent appraisal firms and often involves the use of significant estimates and assumptions with respect to the timing and amount of future cash flows, market rate assumptions, actuarial assumptions, and appropriate discount rates, among other items.
In addition, to perform impairment testing for long-lived assets held and used, the Company occasionally engages independent appraisal firms with respect to the fair value of long-lived assets utilizing appraised values including cost and market approaches.
Recent Accounting Pronouncements
See Note 1 “Basis of Presentation” to the accompanying consolidated financial statements under Item 1 “Financial Statements" of this Quarterly Report on Form 10-Q for a discussion of recent accounting pronouncements.
56
Forward-Looking Statements
Certain statements contained or incorporated in this Quarterly Report on Form 10-Q which are not statements of historical fact constitute “Forward-Looking Statements” within the meaning of the Private Securities Litigation Reform Act of 1995 (the “Reform Act”). Forward-looking statements give current expectations or forecasts of future events. Words such as “anticipate”, “expect”, “intend”, “plan”, “believe”, “seek”, “estimate” and other words and terms of similar meaning in connection with discussions of future operating or financial performance signify forward-looking statements. These statements reflect the Company’s current views with respect to future events and are based on assumptions and estimates, which are subject to risks and uncertainties including those discussed in Item 1A under the heading “Risk Factors” and elsewhere in this report. Accordingly, undue reliance should not be placed on these forward-looking statements. Also, these forward-looking statements represent the Company’s estimates and assumptions only as of the date of this report. The Company does not intend to update any of these forward-looking statements to reflect circumstances or events that occur after the statement is made and qualifies all of its forward-looking statements by these cautionary statements.
You should understand that various factors, in addition to those discussed elsewhere in this document, could affect the Company’s future results and could cause results to differ materially from those expressed in such forward-looking statements, including:
|
•
|
Visteon’s ability to satisfy its future capital and liquidity requirements; Visteon’s ability to access the credit and capital markets at the times and in the amounts needed and on terms acceptable to Visteon; Visteon’s ability to comply with covenants applicable to it; and the continuation of acceptable supplier payment terms.
|
|
•
|
Visteon’s ability to satisfy its pension and other postretirement employee benefit obligations, and to retire outstanding debt and satisfy other contractual commitments, all at the levels and times planned by management.
|
|
•
|
Visteon’s ability to access funds generated by its foreign subsidiaries and joint ventures on a timely and cost effective basis.
|
|
•
|
Changes in the operations (including products, product planning and part sourcing), financial condition, results of operations or market share of Visteon’s customers.
|
|
•
|
Changes in vehicle production volume of Visteon’s customers in the markets where it operates, and in particular changes in Ford’s vehicle production volumes and platform mix.
|
|
•
|
Increases in commodity costs or disruptions in the supply of commodities, including aluminum, copper, fuel and natural gas.
|
|
•
|
Visteon’s ability to generate cost savings to offset or exceed agreed upon price reductions or price reductions to win additional business and, in general, improve its operating performance; to achieve the benefits of its restructuring actions; and to recover engineering and tooling costs and capital investments.
|
|
•
|
Visteon’s ability to compete favorably with automotive parts suppliers with lower cost structures and greater ability to rationalize operations; and to exit non-performing businesses on satisfactory terms, particularly due to limited flexibility under existing labor agreements.
|
|
•
|
Restrictions in labor contracts with unions that restrict Visteon’s ability to close plants, divest unprofitable, noncompetitive businesses, change local work rules and practices at a number of facilities and implement cost-saving measures.
|
|
•
|
The costs and timing of facility closures or dispositions, business or product realignments, or similar restructuring actions, including potential asset impairment or other charges related to the implementation of these actions or other adverse industry conditions and contingent liabilities.
|
|
•
|
Significant changes in the competitive environment in the major markets where Visteon procures materials, components or supplies or where its products are manufactured, distributed or sold.
|
|
•
|
Legal and administrative proceedings, investigations and claims, including shareholder class actions, inquiries by regulatory agencies, product liability, warranty, employee-related, environmental and safety claims and any recalls of products manufactured or sold by Visteon.
|
|
•
|
Changes in economic conditions, currency exchange rates, changes in foreign laws, regulations or trade policies or political stability in foreign countries where Visteon procures materials, components or supplies or where its products are manufactured, distributed or sold.
|
|
•
|
Shortages of materials or interruptions in transportation systems, labor strikes, work stoppages or other interruptions to or difficulties in the employment of labor in the major markets where Visteon purchases materials, components or supplies to manufacture its products or where its products are manufactured, distributed or sold.
|
|
•
|
Changes in laws, regulations, policies or other activities of governments, agencies and similar organizations, domestic and foreign, that may tax or otherwise increase the cost of, or otherwise affect, the manufacture, licensing, distribution, sale, ownership or use of Visteon’s products or assets.
|
|
•
|
Possible terrorist attacks or acts of war, which could exacerbate other risks such as slowed vehicle production, interruptions in the transportation system or fuel prices and supply.
|
57
|
•
|
The cyclical and seasonal nature of the automotive industry.
|
|
•
|
Visteon’s ability to comply with environmental, safety and other regulations applicable to it and any increase in the requirements, responsibilities and associated expenses and expenditures of these regulations.
|
|
•
|
Visteon’s ability to protect its intellectual property rights, and to respond to changes in technology and technological risks and to claims by others that Visteon infringes their intellectual property rights.
|
|
•
|
Visteon’s ability to quickly and adequately remediate control deficiencies in its internal control over financial reporting.
|
|
•
|
Other factors, risks and uncertainties detailed from time to time in Visteon’s Securities and Exchange Commission filings.
|
58
|
Item 3.
|
Quantitative and Qualitative Disclosures About Market Risk
|
The primary market risks to which the Company is exposed include changes in foreign currency exchange rates, interest rates and certain commodity prices. The Company manages these risks through derivative instruments and various operating actions including fixed price contracts with suppliers and cost sourcing arrangements with customers. The Company's use of derivative instruments is limited to mitigation of market risks, including hedging activities. However, derivative instruments are not used for speculative or trading purposes, as per clearly defined risk management policies. Additionally, the Company's use of derivative instruments creates exposure to credit loss in the event of non-performance by the counter-party to the derivative financial instruments. The Company limits this exposure by entering into agreements directly with a variety of major financial institutions with high credit standards and that are expected to fully satisfy their obligations under the contracts. Additionally, the Company's ability to utilize derivatives to manage market risk is dependent on credit conditions and market conditions given the current economic environment.
Foreign Currency Risk
The Company's net cash inflows and outflows exposed to the risk of changes in exchange rates arise from the sale of products in countries other than the manufacturing source, foreign currency denominated supplier payments, debt and other payables, subsidiary dividends, investments in subsidiaries and anticipated foreign currency denominated transaction proceeds. Where possible, the Company utilizes derivative financial instruments to manage foreign currency exchange rate risks. Forward and option contracts may be utilized to protect the Company's cash flow from adverse movements in exchange rates. Foreign currency exposures are reviewed periodically and any natural offsets are considered prior to entering into a derivative financial instrument. The Company’s primary hedged foreign currency exposures include the Euro, Japanese Yen, and Mexican Peso. Where possible, the Company utilizes a strategy of partial coverage for transactions in these currencies. As of
September 30, 2015
, the net fair value of foreign currency forward and option contracts was an asset of $2 million while at
December 31, 2014
, the net fair value of forward and option contracts was a liability of $12 million, maturities of these instruments generally do not exceed eighteen months.
The hypothetical pre-tax gain or loss in fair value from a 10% favorable or adverse change in quoted currency exchange rates would be approximately $24 million and $238 million for foreign currency derivative financial instruments as of
September 30, 2015
and
December 31, 2014
, respectively. These estimated changes assume a parallel shift in all currency exchange rates and include the gain or loss on financial instruments used to hedge loans to subsidiaries. Because exchange rates typically do not all move in the same direction, the estimate may overstate the impact of changing exchange rates on the net fair value of the Company's financial derivatives. It is also important to note that gains and losses indicated in the sensitivity analysis would generally be offset by gains and losses on the underlying exposures being hedged.
In addition to the transactional exposure described above, the Company's operating results are impacted by the translation of its foreign operating income into U.S. dollars.
Interest Rate Risk
The Company is subject to interest rate risk, principally in relation to variable rate debt. The Company may use derivative financial instruments to manage exposure to fluctuations in interest rates.
During 2015, the Company entered into interest rate swaps with a notional amount of $150 million that effectively convert designated cash flows associated with underlying interest payments on the Term Facility from a variable interest rate to a fixed interest rate, the maturities of these swaps will not exceed the underlying Term Facility. The instruments have been designated as cash flow hedges with the effective portion of the gain or loss reported in the Accumulated other comprehensive income component of Stockholders' equity in the Company's consolidated balance sheets and such gains and losses will be reclassified at the time the underlying hedged transactions are realized. The ineffective portion of these swaps is assessed based on the hypothetical derivative method and is recorded as interest expense in the Company's consolidated statements of comprehensive income. As of
September 30, 2015
there was no ineffectiveness associated with these derivatives and the fair value was a liability of $2 million.
The Company significantly reduced interest rate exposure after the swap transactions by reducing variable rate basis of debt to approximately 59% from 99% as of
September 30, 2015
and
December 31, 2014
, respectively.
Commodity Risk
The Company's exposures to market risk from changes in the price of production material are managed primarily through negotiations with suppliers and customers, although there can be no assurance that the Company will recover all such costs. The Company continues to evaluate derivatives available in the marketplace and may decide to utilize derivatives in the future to
59
manage select commodity risks if an acceptable hedging instrument is identified for the Company's exposure level at that time, as well as the effectiveness of the financial hedge among other factors.
|
Item 4.
|
Controls and Procedures
|
Disclosure Controls and Procedures
The Company maintains disclosure controls and procedures that are designed to ensure that information required to be disclosed in periodic reports filed with the SEC under the Securities Exchange Act of 1934 is recorded, processed, summarized, and reported within the time periods specified in the SEC’s rules and forms, and that such information is accumulated and communicated to the Company’s management, including its Chief Executive Officer and Chief Financial Officer, as appropriate, to allow timely decisions regarding required disclosure.
On
July 1, 2014
, the Company completed the acquisition of substantially all of the global automotive electronics business of Johnson Controls Inc. (the "Electronics Acquisition") for an aggregate purchase price of
$299 million
, including
$31 million
of cash and equivalents at the acquired business. As noted in our Annual Report on Form 10-K for the fiscal year ended
December 31, 2014
, management excluded entities acquired in the Electronics Acquisition from its assessment of the effectiveness of the Company's internal control over financial reporting as of
December 31, 2014
. The acquired global electronics business of Johnson Controls represented approximately 12% of the Company's total assets as of
December 31, 2014
and 9% of sales for the year ended
December 31, 2014
.
As of
September 30, 2015
, an evaluation was performed under the supervision and with the participation of the Company’s management, including its Chief Executive and Financial Officers, of the effectiveness of the design and operation of disclosure controls and procedures, excluding all entities which were newly acquired in 2014. Based on that evaluation, the Chief Executive Officer and the Chief Financial Officer concluded that the Company’s disclosure controls and procedures were effective as of
September 30, 2015
.
Internal Control over Financial Reporting
There were no changes in the Company's internal control over financial reporting during the three months ended
September 30, 2015
that have materially affected, or are reasonably likely to materially affect, the Company's internal control over financial reporting. The Company is integrating entities acquired in the Electronics Acquisition into the Company's operations, compliance programs and internal control processes. Specifically, as permitted by SEC rules and regulations, the Company has excluded these newly acquired entities from management's evaluation of internal controls over financial reporting as of
December 31, 2014
.
60
Other Information
|
Item 1.
|
Legal Proceedings
|
See the information above under Note 16, "Commitments and Contingencies," to the consolidated financial statements which is incorporated herein by reference.
|
Item 1A.
|
Risk Factors
|
For information regarding factors that could affect the Company's results of operations, financial condition and liquidity, see the risk factors discussed in Part I, "Item 1A. Risk Factors" in the Company's Annual Report on Form 10-K for the year ended
December 31, 2014
. See also, "Forward-Looking Statements" included in Part I, Item 2 of this Quarterly Report on Form 10-Q.
|
Item 2.
|
Unregistered Sales of Equity Securities and Use of Proceeds
|
The following table summarizes information relating to purchases made by or on behalf of the Company, or an affiliated purchaser, of shares of the Company’s common stock during the
third
quarter of
2015
.
|
Period
|
Total Number of Shares (or Units) Purchased (1)
|
Average Price Paid per Share (or Unit)
|
Total Number of Shares (or units) Purchased as Part of Publicly Announced Plans or Programs (2)
|
Approximate Dollar Value of Shares (or Units) that May Yet Be Purchased Under the Plans or Programs (2) (in millions)
|
||||||
|
Jul. 1, 2015 to Jul. 31, 2015
|
15,473
|
|
$99.65
|
—
|
|
$0
|
||||
|
Aug. 1, 2015 to Aug. 31, 2015
|
—
|
|
—
|
|
—
|
|
$0
|
|||
|
Sep. 1, 2015 to Sep. 30, 2015
|
2,361
|
|
$101.37
|
—
|
|
$0
|
||||
|
Total
|
17,834
|
|
$99.87
|
—
|
|
$0
|
||||
|
(1)
|
This column includes 17,834 shares surrendered to the Company by employees to satisfy tax withholding obligations in connection with the vesting of restricted share and stock unit awards made pursuant to the Visteon Corporation 2010 Incentive Plan.
|
|
(2)
|
On June 11, 2015, the board of directors increased its share repurchase program authorization by $125 million, to a total authorization to repurchase up to $1.125 billion of the Company’s common stock from the beginning of the program until December 31, 2015. In June 2015, the Company entered into an accelerated stock buyback (“ASB”) program with Goldman, Sachs & Co. (“Goldman”) to repurchase shares of common stock for an aggregate purchase price of $500 million. Under this ASB program, the Company paid Goldman $500 million and received an initial delivery of 3,712,297 shares of common stock using a reference price of $107.75. This ASB program is expected to be concluded by December 30, 2015.
|
|
Item 6.
|
Exhibits
|
The exhibits listed on the "Exhibit Index" on Page 63 hereof are filed with this report or incorporated by reference as set forth therein.
61
Signatures
Pursuant to the requirements of Section 13 of the Securities Exchange Act of 1934, Visteon Corporation has duly caused this Report to be signed on its behalf by the undersigned, thereunto duly authorized.
|
VISTEON CORPORATION
|
||
|
By:
|
/s/ Stephanie S. Marianos
|
|
|
Stephanie S. Marianos
|
||
|
Assistant Controller and Chief Accounting Officer
|
||
Date:
November 5, 2015
62
Exhibit Index
|
Exhibit No.
|
Description
|
|
|
31.1
|
Rule 13a-14(a) Certification of Chief Executive Officer dated November 5, 2015.
|
|
|
31.2
|
Rule 13a-14(a) Certification of Chief Financial Officer dated November 5, 2015.
|
|
|
32.1
|
Section 1350 Certification of Chief Executive Officer dated November 5, 2015.
|
|
|
32.2
|
Section 1350 Certification of Chief Financial Officer dated November 5, 2015.
|
|
|
101.INS
|
XBRL Instance Document.**
|
|
|
101.SCH
|
XBRL Taxonomy Extension Schema Document.**
|
|
|
101.CAL
|
XBRL Taxonomy Extension Calculation Linkbase Document.**
|
|
|
101.LAB
|
XBRL Taxonomy Extension Label Linkbase Document.**
|
|
|
101.PRE
|
XBRL Taxonomy Extension Presentation Linkbase Document.**
|
|
|
101.DEF
|
XBRL Taxonomy Extension Definition Linkbase Document.**
|
|
|
*
|
Indicates that exhibit is a management contract or compensatory plan or arrangement.
|
** Pursuant to Rule 406T of Regulation S-T, the Interactive Data Files as Exhibit 101 hereto are deemed not filed or part of a registration
statement or prospectus for purposes of Sections 11 or 12 of the Securities Act of 1933, as amended, are deemed not filed for purposes
of Section 18 of the Securities and Exchange Act of 1934, as amended, and otherwise are not subject to liability under those sections.
In lieu of filing certain instruments with respect to long-term debt of the kind described in Item 601(b)(4) of Regulation S-K, Visteon agrees to furnish a copy of such instruments to the Securities and Exchange Commission upon request.
63
TABLE OF CONTENTS
Part IItem 1. Consolidated Financial StatementsNote 1. Description Of BusinessNote 2. Summary Of Significant Accounting PoliciesNote 3. Discontinued OperationsNote 4. Restructuring ActivitiesNote 5. InventoriesNote 6. Other AssetsNote 7. Property and Equipment, NetNote 8. Intangible Assets, NetNote 9. Other LiabilitiesNote 10. DebtNote 11. Employee Benefit PlansNote 12. Income TaxesNote 13. Stockholders Equity and Non-controlling InterestsNote 14. Earnings (loss) Per ShareNote 15. Fair Value Measurements and Financial InstrumentsNote 16. Commitments and ContingenciesNote 17. Segment InformationItem 2. Management's Discussion and Analysis Of Financial Condition and Results Of OperationsItem 3. Quantitative and Qualitative Disclosures About Market RiskItem 4. Controls and ProceduresPart IIItem 1. Legal ProceedingsItem 1A. Risk FactorsItem 2. Unregistered Sales Of Equity Securities and Use Of ProceedsItem 6. Exhibits