VERICEL CORP
10-Ks and 10-Qs
|
|
|
|
|
|
|
|
|
|
|
|
|
|
|
|
|
|
|
|
|
|
|
|
|
|
|
|
|
|
|
|
|
|
|
|
|
|
|
|
|
|
|
|
|
|
|
|
|
|
|
|
|
|
|
|
|
|
|
|
|
|
|
|
|
SECURITIES AND EXCHANGE COMMISSION
Washington, D.C. 20549
Form 10-K
x
ANNUAL REPORT PURSUANT TO SECTION 13 OR 15(d) OF THE SECURITIES EXCHANGE ACT OF 1934
for the fiscal year ended December 31, 2017
or
o
TRANSITION REPORT PURSUANT TO SECTION 13 OR 15(d) OF THE SECURITIES EXCHANGE ACT OF 1934
Commission File Number 001-35280
VERICEL CORPORATION
(Exact name of registrant as specified in its charter)
|
Michigan
|
|
94-3096597
|
|
(State or other jurisdiction of incorporation or organization)
|
|
(I.R.S. Employer Identification No.)
|
64 Sidney Street
Cambridge, MA 02139
(Address of principal executive offices, including zip code)
Registrant’s telephone number, including area code:
(800) 556-0311
Securities registered pursuant to Section 12(b) of the Act:
|
Title of Class
|
|
Name of Each Exchange on Which Registered
|
||
|
Common Stock (No par value)
|
|
The NASDAQ Stock Market, Inc.
|
||
Securities registered pursuant to Section 12(g) of the Act:
None
Indicate by check mark if the registrant is a well-known seasoned issuer, as defined in Rule 405 of the Securities Act. Yes
o
No
x
Indicate by check mark if the registrant is not required to file reports pursuant to Section 13 or Section 15(d) of the Act. Yes
o
No
x
Indicate by check mark whether the registrant (1) has filed all reports required to be filed by Section 13 or 15(d) of the Securities Exchange Act of 1934 during the preceding 12 months (or for such shorter period that the registrant was required to file such reports), and (2) has been subject to such filing requirements for the past 90 days. Yes
x
No
o
Indicate by check mark whether the registrant has submitted electronically and posted on its corporate Web site, if any, every Interactive Data File required to be submitted and posted pursuant to Rule 405 of Regulation S-T (§ 232.405 of this chapter) during the preceding 12 months (or for such shorter period that the registrant was required to submit and post such files). Yes
x
No
o
Indicate by check mark if disclosure of delinquent filers pursuant to Item 405 of Regulation S-K (§ 229.405) is not contained herein, and will not be contained, to the best of registrant’s knowledge, in definitive proxy or information statements incorporated by reference in Part III of this Form 10-K or any amendment to this Form 10-K.
x
Indicate by check mark whether the registrant is a large accelerated filer, an accelerated filer, a non-accelerated filer, smaller reporting company, or an emerging growth company. See the definitions of “large accelerated filer,” “accelerated filer” “smaller reporting company” and “emerging growth company” in Rule 12b-2 of the Exchange Act.
|
Large accelerated filer -
o
|
|
Accelerated filer -
x
|
|
Non-accelerated filer -
o
|
|
Smaller reporting company -
o
|
|
(Do not check if a smaller reporting company)
|
|
Emerging growth company -
o
|
If an emerging growth company, indicate by check mark if the registrant has elected not to use the extended transition period for complying with any new or revised financial accounting standards provided pursuant to Section 13(a) of the Exchange Act.
o
Indicate by check mark whether the registrant is a shell company (as defined in Rule 12b-2 of the Exchange Act). Yes
o
No
x
The aggregate market value of the registrant’s Common Stock, no par value per share (“Common Stock”), held by non-affiliates of the registrant (based on the closing sales price of the Common Stock as reported on the NASDAQ Capital Market) on June 30, 2017 was approximately $107,971,565. This computation excludes shares of Common Stock held by directors, officers and each person who holds 5% or more of the outstanding shares of Common Stock, since such persons may be deemed to be affiliates of the registrant. This determination of affiliate status is not necessarily a conclusive determination for other purposes.
As of
February 28, 2018
, 36,103,211 shares of Common Stock, no par value per share, were outstanding.
DOCUMENTS INCORPORATED BY REFERENCE
|
Document
|
|
Form 10-K Reference
|
|
Proxy Statement for the Annual Meeting of Shareholders scheduled for May 2, 2018
|
|
Items 10, 11, 12, 13 and 14 of Part III
|
VERICEL CORPORATION
ANNUAL REPORT ON FORM 10-K
TABLE OF CONTENTS
|
|
|
Page
|
|
|
PART I
|
|
|
Item 1.
|
||
|
Item 1A.
|
||
|
Item 1B.
|
||
|
Item 2.
|
||
|
Item 3.
|
||
|
Item 4.
|
||
|
|
PART II
|
|
|
Item 5.
|
||
|
Item 6.
|
||
|
Item 7.
|
||
|
Item 7A.
|
||
|
Item 8.
|
||
|
Item 9.
|
||
|
Item 9A.
|
||
|
Item 9B.
|
||
|
|
PART III
|
|
|
Item 10.
|
||
|
Item 11.
|
||
|
Item 12.
|
||
|
Item 13.
|
||
|
Item 14.
|
||
|
|
PART IV
|
|
|
Item 15.
|
||
|
Item 16.
|
||
2
Cautionary Note Regarding Forward-Looking Statements
This Annual Report on Form 10-K contains certain statements that describe our management’s beliefs concerning future business conditions, plans and prospects, growth opportunities and the outlook for our business based upon information currently available. Such statements are “forward-looking” statements within the meaning of the Private Securities Litigation Reform Act of 1995. Wherever possible, we have identified these forward-looking statements by words such as “will,” “may,” “anticipates,” “believes,” “intends,” “estimates,” “expects,” “projects” and similar phrases. These forward-looking statements are based upon assumptions our management believes are reasonable. Such forward-looking statements are subject to risks and uncertainties which could cause our actual results, performance and achievements to differ materially from those expressed in, or implied by, these statements, including, among others, the risks and uncertainties listed in this Annual Report on Form 10-K under “Part I, Item 1A Risk Factors”.
Because our forward-looking statements are based on estimates and assumptions that are subject to significant business, economic and competitive uncertainties, many of which are beyond our control or are subject to change, actual results could be materially different and any or all of our forward-looking statements may turn out to be wrong. Forward-looking statements speak only as of the date made and can be affected by assumptions we might make or by known or unknown risks and uncertainties. Many factors mentioned in our discussion in this Annual Report on Form 10-K will be important in determining future results. Consequently, we cannot assure you that our expectations or forecasts expressed in such forward-looking statements will be achieved. Except as required by law, we undertake no obligation to publicly update any of our forward-looking or other statements, whether as a result of new information, future events, or otherwise.
3
Except for the historical information presented, the matters discussed in this Report, including our product development and commercialization goals and expectations, our plans and anticipated timing and results of clinical development activities, potential market opportunities, revenue expectations and the potential advantages and applications of our products and product candidates under development, include forward-looking statements that involve risks and uncertainties. Our actual results may differ significantly from the results discussed in the forward-looking statements. Factors that could cause or contribute to such differences include, but are not limited to, those discussed under the caption “Risk Factors.” Unless the context requires otherwise, references to “we,” “us,” “our” and “Vericel” refer to Vericel Corporation.
Item 1.
Business
General Information
Vericel Corporation is a leader in advanced cell therapies for the sports medicine and severe burn care markets, and a developer of patient-specific expanded cell therapies for use in the treatment of patients with severe diseases and conditions. We currently have two marketed autologous cell therapy products in the United States. MACI
®
(autologous cultured chondrocytes on porcine collagen membrane) is an autologous cellularized scaffold product indicated for the repair of symptomatic, single or multiple full-thickness cartilage defects of the knee with or without bone involvement in adults that was approved by the U.S. Food and Drug Administration (FDA) on December 13, 2016. The first shipment and implantation of MACI occurred on January 31, 2017. At the end of the second quarter, we removed MACI's predecessor, Carticel
®
(autologous cultured chondrocytes), from the market. Carticel is an autologous chondrocyte implant indicated for the repair of symptomatic cartilage defects of the femoral condyle (medial, lateral or trochlea), caused by acute or repetitive trauma, in patients who have had an inadequate response to a prior arthroscopic or other surgical repair procedure (e.g., debridement, microfracture, drilling/abrasion arthroplasty, or osteochondral allograft/autograft). We also market Epicel
®
(cultured epidermal autografts), a permanent skin replacement Humanitarian Use Device (HUD) for the treatment of patients with deep-dermal or full-thickness burns comprising greater than or equal to 30 percent of total body surface area (TBSA).
Our Strategy
Our objective is to become the leading developer in advanced cell therapies for the sports medicine and severe burn care markets.
To achieve this objective, we intend to:
|
•
|
Increase MACI revenue by increasing the number of surgeons implanting MACI and the average number of implants per surgeon;
|
|
•
|
Increase Epicel revenue by expanding the number of burn centers consistently using Epicel;
|
|
•
|
Lower the marginal manufacturing costs for MACI and Epicel through increased volume;
|
|
•
|
Generate positive operating income by keeping the growth in commercial expense lower than the growth in revenue
|
Acquisition of Sanofi’s CTRM Business
On May 30, 2014, we completed the acquisition of the Cell Therapy and Regenerative Medicine (CTRM) business of Sanofi, a French
société anonyme
(Sanofi), certain assets, including all of the outstanding equity interests of Genzyme Biosurgery ApS (now known as Vericel Denmark ApS), a wholly-owned subsidiary of Sanofi, and a portfolio of patents and patent applications of Sanofi and certain of its subsidiaries, and assumed certain liabilities for purposes of acquiring the portion of the CTRM business, which researches, develops, manufactures, markets and sells Carticel, MACI and Epicel.
We obtained MACI through its acquisition by Genzyme Corporation, a subsidiary of Sanofi, of Verigen AG (Verigen) in 2005. As part of its acquisition of Verigen, Genzyme Corporation agreed to make cash payments to Verigen upon the achievement of developmental milestones relating to regulatory approvals and the commercialization of MACI in the United States. In connection with our acquisition of the CTRM business, we paid approximately $3.2 million in October 2014 in full settlement of any and all potential obligations to Verigen related to MACI developmental milestones.
4
Our Products
Carticel and MACI are both cell therapy products for the treatment of cartilage defects in the knee and Epicel (cultured epidermal autografts) is a permanent skin replacement for the treatment of patients with severe deep-dermal or full-thickness burns comprising greater than or equal to 30 percent of TBSA. MACI was approved by the FDA on December 13, 2016 and the first shipment and implantation of MACI occurred on January 31, 2017. We stopped manufacturing and marketing Carticel in the second quarter of 2017.
Carticel and MACI
Background of Cartilage Defects
Damage to cartilage in the knee can occur from acute or repetitive trauma from playing sports, exercising, work related physical demands, or performing everyday activities. When damaged, cartilage in the knee does not usually heal on its own. If left untreated, cartilage defects can progress and lead to degenerative joint disease, osteoarthritis and potentially require total knee replacement, a poor option for younger and more active patients.
For patients diagnosed with cartilage defects, there are several treatment options, including arthroscopic debridement/chondroplasty, marrow stimulation techniques such as microfracture (a minimally invasive procedure that can be performed arthroscopically), osteochondral autografts for smaller cartilage injuries, osteochondral allografts, and autologous chondrocyte implantation (ACI). More recently other products, sourced from allogeneic tissue have been commercialized. These products include DeNovo
®
NT (Zimmer Biomet), Cartiform
®
(Arthrex) and Prochondrix
®
(Allosource), which are subject to human tissue regulation. Products subject only to FDA human tissue regulations are not required to obtain a Biologics License prior to being marketed. Products, like MACI, which must meet the requirements for a Biologics License Application before being marketed, are required to demonstrate the clinical efficacy equal or superior to a standard of care.
Carticel was the first FDA-approved autologous cartilage repair product for the repair of symptomatic cartilage defects. Carticel is indicated for the repair of symptomatic cartilage defects of the femoral condyle (medial, lateral or trochlea) caused by acute or repetitive trauma, in patients who have had an inadequate response to a prior arthroscopic or other surgical repair procedure such as debridement (the removal of damaged or defective cartilage), microfracture (the creation of tiny fractures in the bone to encourage new cartilage), drilling/abrasion arthroplasty, or osteochondral allograft/autograft (transferring cartilage from one joint to another). Carticel received a BLA approval in 1997 and was marketed in the U.S. until the second quarter of 2017 at which time it was replaced by MACI. MACI was approved on December 13, 2016 by the FDA.
MACI is an autologous cellular scaffold product consisting of autologous cultured chondrocytes seeded onto a resorbable Type I/III porcine-derived collagen membrane. Autologous cultured chondrocytes are human-derived cells which are obtained from a sample of the patient's own cartilage for the manufacture of MACI. An orthopedic surgeon obtains the sample by taking a cartilage biopsy during an initial arthroscopic procedure. Vericel isolates the patient’s chondrocytes, the cells that produce cartilage, from the biopsy and expands them in a manufacturing process compliant with current Good Manufacturing Practices (cGMP). The expanded cells are then seeded onto a resorbable collagen membrane prior to shipment. During a second surgical procedure, MACI is implanted into the cartilage defect(s). MACI may produce a durable repair tissue with characteristics similar to the native cartilage. A key driver of ACI’s therapeutic advantage relative to other approaches, such as microfracture, is that autologous chondrocytes have the potential to produce the hyaline-like cartilage that is naturally present in the knee, rather than fibrous cartilage which lacks the durability and wear characteristics of hyaline cartilage. Carticel is a cell suspension and requires the suturing of a periosteal flap to contain the cell suspension in the defect. This procedure can be tedious and technically challenging, requiring a large incision or arthrotomy. The MACI implant ships with the cells uniformly seeded, using proprietary means, on a collagen membrane therefore eliminating the need to suture a membrane in place to confine the cell suspension to the defect area. This allows the implantation of MACI through a smaller incision or mini arthrotomy for focal defects. MACI is simply trimmed to the size of the defect and fixed to the bone with an off-the-shelf surgical fibrin sealant. MACI is expanding the ACI market since MACI shares the clinical advantages of Carticel while being less invasive, shortening procedure time, and eliminating the need for a periosteal harvest and suture fixation of the periosteal patch. In addition, MACI is indicated for a broader range of cartilage defects of the knee, ensures more uniform distribution of the cells in the cartilage defect and is supported by Phase 3 clinical data demonstrating a statistically significant improvement in pain and function scores compared to microfracture.
The pivotal clinical trial supporting MACI registration in Europe and approval in the U.S., the Superiority of MACI Implant versus Microfracture Treatment in patients with symptomatic articular cartilage defects in the knee (SUMMIT) trial, was completed in 2012. Analysis of this 144 patient study demonstrated at Week 104 a statistically significant greater improvement in the co-primary endpoint of pain and function for those patients treated with MACI compared to microfracture.
5
MACI received marketing authorization in Europe in June 2013 by meeting the requirements of the Advanced Therapy and Medicinal Product (ATMP) guidelines based on the results of the SUMMIT trial in which MACI was manufactured at, and supplied from, our Cambridge, Massachusetts site. MACI became available in the EU in 2000 and Australia in 2002. We temporarily suspended the marketing of MACI in Europe as of September 2014 primarily due to low utilization and an unfavorable pricing environment. Lifting of the suspension has been pending the registration of a new manufacturing facility in Europe prior to the 5 year renewal deadline of June 2018. In consultation with the EMA and Danish Authorities, we have explored the option of using the current Cambridge, Massachusetts manufacturing facility to supply product to the EU. However, the differences between FDA regulations and European regulations governing tissue engineered ATMPs would require significant infrastructure changes that make lifting the suspension in the EU not feasible at this time. Therefore, the European manufacturing authorization for MACI will expire by its terms at the end of June 2018.
Market Opportunity for MACI
In the U.S. annually, there are approximately 1 million cartilage repair procedures in the knee. Of these, only approximately 50,000 are full thickness defects greater than 2 cm
2
. Approximately 10,000 of the patients with these types of defects meet our target market criteria, which include being between the ages of 18 to 55, having adequate medical coverage and leading an active lifestyle.
Typical initial cartilage surgical procedures include chondroplasty (debridement) and/or microfracture. These two procedures account for 98% of all cartilage surgical procedures. Although initial microfracture results demonstrate pain score improvement generally, only patients with Class 1 (i.e., smallest defects) do not experience deterioration after 18 months. Patients seeking retreatment account for about 2.5% of the cartilage surgical repair market and often receive either allograft, autograft or ACI. Treatment with Carticel and MACI provides an opportunity to replace the damaged cartilage with a durable cartilage tissue.
In the U.S., the physician target audience which repairs cartilage defects is very concentrated and is comprised of a group of physicians who self-identify as or have the formal specialty of sports medicine physicians. We believe this target audience is approximately 3,000 physicians. During 2017 we announced the expansion of our field force from 28 to 40 representatives, the vast majority of whom we anticipate to be employed and in the field by the beginning of the second quarter of 2018. Most private payers have a medical policy that allows treatment with MACI. During 2017, the 20 largest payers implemented a formal medical policy or provided access for MACI, representing over 85% of lives covered by commercial plans.
In the year ended
December 31, 2017
, Carticel and MACI generated net revenues of approximately
$43.9 million
. Over the last four years the percentage of total product revenue has on average been 21%, 25%, 21% and 33% from the first to the fourth quarters and is driven by the seasonality of both MACI and Epicel sales. MACI revenue is stronger in the second quarter and fourth quarter due to a number of factors including insurance copay limits and the time of year patients prefer to start rehabilitation.
Epicel
Epicel (cultured epidermal autografts) is a permanent skin replacement for full thickness burns greater than or equal to 30% of TBSA. Epicel is currently the only FDA-approved autologous epidermal product available for large total surface area burns. Currently, approximately 100 patients are treated with Epicel in the U.S. each year. In the year ended
December 31, 2017
, net revenues were
$18.9 million
for Epicel.
Epicel is produced by isolating and expanding keratinocytes, which are the predominant cell type in the epidermis or outer layer of the skin, obtained from a small biopsy of a patient’s healthy skin. Epicel is an important treatment option for patients with severe burns because these patients are generally understood to need a keratinocyte-based epithelium and there is very little skin, which is the only other source of keratinocyte-based epithelium, available for autografts for these patients.
Epicel is a cell-based product that is regulated by the Center for Biologics Evaluation and Research (CBER) under medical device authorities. Epicel was designated as a HUD in 1998 and a Humanitarian Device Exemption (HDE) application for the product was submitted in 1999. HUDs are devices that are intended for diseases or conditions that affect not more than 8,000 individuals annually in the United States. On December 13, 2016, Section 3052 of the 21st Century Cures Act (Pub. L. No. 114-255) changed the population estimate required to qualify for the HUD designation from "fewer than 4,000" to "not more than 8,000."
On February 18, 2016, the FDA approved our HDE supplement to revise the labeled indications of use to specifically include pediatric patients and to add pediatric labeling. Due to the change in the label to include use in pediatric patients, the FDA
6
determined that Epicel met the eligibility criteria to be sold for profit as long as the number of devices distributed in any calendar year does not exceed the annual distribution number (ADN). The ADN is defined as the number of devices reasonably needed to treat, diagnose or cure a population of 8,000 individuals per year in the United States. The FDA has determined that the ADN for Epicel is 360,400 devices. The holder of the HDE must immediately notify FDA if the number of devices distributed during a calendar year exceeds the ADN. The revised product label also now specifies that the probable benefit of Epicel, mainly related to survival, was demonstrated in two Epicel clinical experience databases and a physician-sponsored study comparing outcomes in patients with massive burns treated with Epicel relative to the standard care.
Market Opportunity for Epicel
Each year in the U.S., more than 40,000 people are hospitalized for burns. More than 2,000 of these patients are treated for burns covering more than 30% of their TBSA, the labeled indication for Epicel. Currently, the mortality rate for this group is approximately 34%, partially due to the lack of healthy tissue from which to harvest autografts. Although age can vary, the typical Epicel patient is young and has suffered full thickness burns due to occupational, household or auto accidents, trash burning with gasoline, inappropriate use of space heaters or carelessness with flammable materials. Many of the most severely burned patients are medivac transported to one of the 128 specialized burn centers across the U.S. While the average acute care hospital has less than 3 admissions for burns annually, these specialized burn centers average over 200 admissions per year.
Relative to clinical need, we believe Epicel is underutilized due to lack of consistent promotional effort. In 2014, a single sales representative supported Epicel. In 2016 we expanded our Epicel sales force to five, where it currently remains. We expect Epicel’s utility to continue to grow as commercial and medical efforts are appropriately dedicated to the product and providers.
Epicel revenue is subject to seasonal fluctuations mostly associated with the use of heating elements during the colder months, with higher use occurring in the winter months of the first and fourth quarters, and decreased use occurring in the hot summer months of the third quarter. However, in any single year, this trend can be absent due to the extreme variability inherent with Epicel’s patient volume. The variability between the same quarters in consecutive years has been as high as 11% of the annual volume for Epicel.
Ixmyelocel-T Technology Platform
Our development stage portfolio includes ixmyelocel-T, a unique patient-specific multicellular therapy derived from an adult patient’s own bone marrow which utilizes our proprietary, highly automated and scalable manufacturing system. The patient-specific multicellular therapy was under development for the treatment of advanced heart failure due to ischemic dilated cardiomyopathy (DCM).
Ixmyelocel-T was granted a U.S. Orphan Drug designation by the FDA for the treatment of DCM. We completed enrolling and treating patients in our completed Phase 2b ixCELL-DCM study in February 2015. Patients were followed for 12 months for the primary efficacy endpoint of major cardiac adverse events (MACE). On March 10, 2016, we announced the trial had met its primary endpoint of reduction in clinical cardiac events and that the incidence of adverse events, including serious adverse events, in patients treated with ixmyelocel-T was comparable to patients in the placebo group. Patients were then followed for an additional 12 months for safety. Because the trial met the primary endpoint, patients who received placebo or were randomized to ixmyelocel-T in the double-blind portion of the trial but did not receive ixmyelocel-T were offered the option to receive ixmyelocel-T. We successfully treated the last patients in February 2017, and the last follow-up visit occurred in February 2018. In addition, we have conducted clinical studies for the treatment of critical limb ischemia, and an ixmyelocel-T investigator-initiated clinical study was conducted for the treatment of craniofacial reconstruction.
On September 29, 2017, the FDA indicated we would be required to conduct at least one additional Phase 3 clinical study to support a BLA for ixmyelocel-T. Given the expense required to conduct further development and our focus on growing our existing commercial products and becoming profitable, at this time we have no current plans to initiate or fund a Phase 3 trial on our own, but instead are seeking a partner to fund further development.
Production
Cell Manufacturing and Cell Production Components
Our cell-manufacturing facility is located in Cambridge, Massachusetts, and is used for U.S. manufacturing and distribution of MACI and Epicel. The production of Carticel ceased in the second quarter of 2017. The Cambridge facility also houses our research and development function, which is responsible for process development, release assay development, and technology transfers between sites and departments.
7
Through September 2017 we operated a centralized cell manufacturing facility in Ann Arbor, Michigan. The facility supported the final stage of the open label extension of the ixCELL-DCM clinical trial conducted in the United States and Canada. At this time, there are no further manufacturing activities being conducted in the Ann Arbor facility. It will take time and resources to reinitiate manufacturing capabilities in the future.
Research & Development
The bulk of our ongoing research and development activities are focused on exploring methods that improve our ability to efficiently manufacture high quality cell therapy products for patients. We have performed an in depth analysis of the cell culture processes used in the manufacturing of Epicel MACI and ixmyelocel-T, and have identified several areas for their potential improvement. Therefore, our research and development program is focused on the many facets of process development for all of our products including, but not limited to, tissue procurement and processing, cell culture surface and media modification, and other process efficiencies.
Patents and Proprietary Rights
Our success depends in part on our ability, and the ability of our future licensors, to obtain patent protection for our products and processes.
As part of the acquired CTRM business of Sanofi, we acquired a multinational intellectual property estate. The intellectual property estate includes patents and patent applications directed to chondrocyte implants and technologies related to the determination of the presence of chondrocytes in the cell cultures used to produce the chondrocyte implants. Although we do not own any patents or patent applications relating to Epicel, many of the processes and techniques are trade secrets and would be difficult to replicate without significant investment and time. We own issued patents directed to the combinations of chondrocytes and collagen membranes used in MACI, which expired in August of 2017 abroad. We own issued patents directed to methods of determination of the presence of chondrocytes in cell cultures used to produce both Carticel and MACI, which are scheduled to expire October 2029 in the US and in April 2028 abroad. We have one pending US application and one pending European application directed to a device related to MACI. When these patents and data exclusivity expire, our opportunity to establish or maintain product revenue could be substantially reduced. See “Government Regulation - Product Approval” and
“
Risk Factors
-
Risks Related to Intellectual Property
”
below for additional information. In addition, the processes and technologies related to ixmyelocel-T include certain issued United States patents. Certain patent equivalents to the United States patents have also been issued in other jurisdictions.
We also own a broadly filed trademark portfolio with registrations for Carticel, MACI, and Epicel.
We may rely on certain licenses granted by third parties, for certain patent rights, including for future product candidates. If we breach such agreements or otherwise fail to comply with such agreements, or if such agreements expire or are otherwise terminated, we may lose our rights in such patents.
We also rely on trade secrets and un-patentable know-how that we seek to protect, in part, by confidentiality agreements. It is our policy to require our employees, consultants, contractors, manufacturers, outside scientific collaborators and sponsored researchers and other advisors to execute confidentiality agreements upon the commencement of employment or consulting relationships with us. These agreements provide that all confidential information developed or made known to the individual during the course of the individual’s relationship with us is to be kept confidential and not disclosed to third parties except in specific limited circumstances. We also require signed confidentiality or material transfer agreements from any company that is to receive our confidential information. In the case of employees, consultants and contractors, the agreements generally provide that all inventions conceived by the individual while rendering services to us shall be assigned to us as the exclusive property of Vericel. There can be no assurance, however, that these agreements will not be breached, that we would have adequate remedies for any breach, or that our trade secrets or un-patentable know-how will not otherwise become known or be independently developed by competitors.
Our success will also depend in part on our ability to develop additional commercially viable products without infringing the proprietary rights of others. We do not believe any of our approved products or our currently contemplated products or processes infringe any existing valid issued patent. However, the results of patent litigation are unpredictable, and no assurance can be given that patents do not exist or could not be filed which would have an adverse effect on our ability to market our products or maintain our competitive position with respect to our products. If our technology components, designs, products, processes or other subject matter are claimed under other existing United States or foreign patents, or are otherwise protected by third-party proprietary rights, we may be subject to infringement actions. In such event, we may challenge the validity of such patents or other proprietary rights or we may be required to obtain licenses from such companies in order to develop, manufacture or market our products.
8
There can be no assurances that we would be able to obtain such licenses or that such licenses, if available, could be obtained on commercially reasonable terms. Furthermore, the failure either to develop a commercially viable alternative or obtain such licenses could result in delays in marketing our proposed products or the inability to proceed with the development, manufacture or sale of products requiring such licenses, which could have a material adverse effect on our business, financial condition and results of operations. If we are required to defend ourselves against charges of patent infringement or to protect our proprietary rights against third parties, substantial costs will be incurred regardless of whether we are successful. Such proceedings are typically protracted with no certainty of success. An adverse outcome could subject us to significant liabilities to third parties and force us to curtail or cease our development and sale of our products and processes.
Certain of our research has been funded or may become funded in part by a Small Business Innovation Research (SBIR) grant obtained from the Department of Health and Human Services or by other governmental grants. As a result of such funding, the United States government has certain rights in the technology developed with such funding. These rights include a non-exclusive, fully paid-up, worldwide license under such inventions for any governmental purpose. We believe that the licensed patents that relate to this technology under the SBIR grant have expired.
Sales and Marketing
Both our marketed and development stage products are specialty products with focused physician and institutional call points. The U.S. MACI sales organization is comprised of approximately 44 employees, including Cell Therapy Specialists and Regional Sales Directors. The target audience is a concentrated (approximately 3,000) set of sports medicine orthopedic surgeons.
Most private payers have a medical policy that allows treatment with MACI, and all of the top 20 payers have a formal medical policy for MACI or ACI in general. For those private payers which have not yet approved a medical policy for MACI, for medically appropriate cases, we can often obtain approval on a case by case basis.
On May 15, 2017, we entered into a distribution agreement with Orsini Pharmaceutical Services, Inc. (Orsini) to appoint Orsini as a specialty pharmacy distributor of MACI to patients' physicians and other healthcare providers. The initial term of the distribution agreement will end on May 15, 2019 with the option of
two
additional
two
-year terms. We ship the product directly to the surgical suite. Orsini purchases and takes title to MACI upon delivery of the product.
Sales of Epicel are supported by five Cell Therapy Specialists. Since there are approximately 128 specialized burn centers with a smaller number treating large burn patients in the U.S., increasing coverage to the majority of the target centers is feasible with only a small number of incremental Cell Therapy Specialists.
Government Regulation
Our research and development activities and the manufacturing and marketing of our products are subject to the laws and regulations of governmental authorities in the United States and other countries in which our products will be marketed. Specifically, in the United States, the FDA regulates drugs, biologics and medical devices and requires new product approvals or clearances to assure safety and effectiveness of these products. Governments in other countries have similar requirements for testing and marketing. In the United States, in addition to meeting FDA regulations, we are also subject to other federal laws, such as the Occupational Safety and Health Act and the Environmental Protection Act, as well as certain state laws.
Some human cell or tissue products that are intended for implantation, transplantation, infusion, or transfer into a human recipient are regulated as human cell, tissue, and cellular and tissue-based products (HCT/Ps) and do not require the FDA’s premarket review. If these cell or tissue products do not meet the FDA’s requirements for regulation as an HCT/P they require a premarket review and a marketing authorization. The type of marketing authorization required depends on how the product is regulated by the FDA. With the exception of Epicel (an HDE medical device), our cell products are regulated as biological products that require an approved BLA to be marketed in the U.S. Commercial production of these products needs to occur in FDA-registered facilities in compliance with cGMP requirements for biologics. Epicel is a humanitarian use medical device that has an approved HDE application.
Regulatory Process
The FDA regulates biologics under the Federal Food, Drug, and Cosmetic Act (FFDCA) and the Public Health Service Act, and their implementing regulations. Obtaining approval of a BLA for new biological products is a lengthy process leading from development of a new product through preclinical and clinical testing. This process takes a number of years and the expenditure of significant resources. There can be no assurance that our current or future product candidates will ultimately receive approval.
9
The FFDCA and other federal and state statutes and regulations govern the research, testing, manufacture, safety, labeling, storage, record-keeping, approval, distribution, use, adverse event reporting, advertising and promotion of our products. Noncompliance with applicable requirements can result in civil penalties, recall, injunction or seizure of products, refusal of the government to approve our product approval applications or to allow us to enter into government supply contracts, withdrawal of previously approved applications and criminal prosecution.
Product Approval
In order to obtain FDA license, or approval of, a new biological product, sponsors must submit proof of safety, purity and potency, or effectiveness. In most cases, such proof entails extensive nonclinical, also known as preclinical studies in animal models and well-controlled clinical trials in human subjects. The testing, preparation of necessary applications and processing of those applications by the FDA is expensive, may take several years to complete and could have an uncertain outcome. The FDA regulatory review and approval process is complex and can result in requests for additional data, increased development cost, time to market delays, or preclude us from bringing to market new products. The FDA may also require post-marketing studies and risk evaluation and mitigation strategies (REMS) as condition to approval. These requirements will add to the cost of regulatory compliance and the cost to sell our products, due to complex distribution and restricted commercial operations. Product approvals may be withdrawn if compliance with applicable regulations is not maintained or if safety issues are identified during routine safety monitoring following commercialization. For patented technologies, product development and the regulatory review/approval process can materially reduce the period during which we will have the exclusive right to exploit such technologies. Regulatory exclusivity may offer some additional protection. As a biologic, MACI is entitled to twelve years of data exclusivity from date of approval.
Adequate and well-controlled clinical studies are required by the FDA for approval of a BLA. To conduct a clinical trial in the U.S., the study sponsor is required to submit an Investigational New Drug (IND) application including the study protocol prior to commencing human clinical trials. The submission must be supported by data, typically including the results of nonclinical, manufacturing and laboratory testing. The conduct of the nonclinical tests must comply with Good Laboratory Practice, and applicable cGMP requirements. Long term nonclinical testing, such as animal reproductive toxicity and carcinogenicity, is conducted if warranted and is submitted to the IND to support a future BLA. Following the initial submission of the IND, the FDA has 30 days to review the application and raise safety and other clinical trial issues. If questions or objections are not raised within that period, the clinical trial may commence according to the investigational protocol submitted to the FDA and following Institutional Review Board (IRB) approvals for each of the clinical sites where the study will be conducted. Protocol amendments need to be submitted and approved by the FDA prior to implementation. We have submitted several INDs for ixmyelocel-T, and we conducted clinical investigations under these INDs. Clinical studies can also be conducted outside of the U.S. with or without a U.S. IND. However, a clinical trial application (CTA) or IND is required to be submitted to the local competent regulatory authority for the conduct of human clinical trials. The CTA has similar data requirements to those of an IND.
Carticel, MACI and ixmyelocel-T are regulated by the FDA as biologics. For products that are regulated as biologics, the FDA requires: (i) nonclinical animal testing to establish a safety profile and/or a starting dose for initiation of clinical trials in humans; (ii) submission to the FDA of an IND application, which must become effective prior to the initiation of human clinical trials; (iii) adequate and well-controlled clinical trials to demonstrate the safety, purity and potency, or effectiveness, of the product for its intended use; (iv) submission to the FDA of a BLA; and (v) review and approval of the BLA as well as pre-approval inspections of the manufacturing facility by the FDA.
For purposes of BLA approval, human clinical trials are typically conducted in three sequential phases that may sometimes overlap:
|
•
|
Phase 1—The biological product is initially tested for safety and tolerability. In the case of biological products and those for severe or life-threatening diseases, the initial human testing is generally conducted in patients. These trials may also provide early evidence on effectiveness.
|
|
•
|
Phase 2—These trials are conducted in a limited number of subjects in the target population to determine a safe and effective dosage to evaluate in Phase 3 and to identify possibly related adverse effects and safety risks. Multiple Phase 2 clinical trials may be conducted by the sponsor to obtain information prior to beginning larger and more expensive Phase 3 clinical trials.
|
|
•
|
Phase 3—Phase 3 trials are undertaken to provide evidence of clinical efficacy and to further evaluate dosage, potency, and safety in an expanded patient population at multiple clinical trial sites. Phase 3 studies are performed after preliminary evidence suggesting effectiveness of the product has been obtained, and are intended to establish the overall benefit-risk relationship of the investigational product, and to provide an adequate basis for product approval and labeling.
|
10
Post-approval clinical trials, sometimes referred to as Phase 4 clinical trials, may be conducted after initial marketing approval. These trials may be required by the FDA as a condition of approval and are used to gain additional experience from the treatment of patients in the intended therapeutic indication, particularly for long-term safety follow-up. The FDA has express statutory authority to require post-market clinical trials to address safety issues. All of these trials must be conducted in accordance with good clinical practice (GCP) requirements in order protect the health and safety of human subjects and for the data to be considered reliable for regulatory purposes.
During all phases of clinical development, regulatory agencies require extensive monitoring and auditing of all clinical activities, clinical data, and clinical trial investigators. Annual progress reports detailing the results of the clinical trials must be submitted to the IND. Written IND safety reports must be promptly submitted to the FDA and the investigators for serious and unexpected adverse events; any findings from other studies, tests in laboratory animals or in vitro testing that suggest a significant risk for human subjects; or any clinically important increase in the rate of a serious suspected adverse reaction over that listed in the protocol or investigator brochure. The sponsor must submit an IND safety report within 15 calendar days after the sponsor determines that the information qualifies for reporting. The sponsor also must notify the FDA of any unexpected fatal or life-threatening suspected adverse reaction within seven calendar days after the sponsor’s initial receipt of the information.
Phase 1, Phase 2, and Phase 3 clinical trials may not be completed successfully or within any specified period, or at all. Regulatory authorities, a data safety monitoring board or the sponsor may suspend a clinical trial at any time on various grounds, including a finding that the participants are being exposed to an unacceptable health risk. Similarly, an IRB can suspend or terminate approval of a clinical trial at its institution if the clinical trial is not being conducted in accordance with the IRB’s requirements or if the biological product has been associated with unexpected serious harm to patients.
A drug being studied in clinical trials may be made available to individual patients in certain circumstances. Pursuant to the 21st Century Cures Act, or Cures Act, which was signed into law in December 2016, the manufacturer of an investigational drug for a serious disease or condition is required to make available, such as by posting on its website, its policy on evaluating and responding to requests for individual patient access to such investigational drug. This requirement applies on the later of 60 calendar days after the date of enactment of the Cures Act or the first initiation of a Phase 2 or Phase 3 trial of the investigational drug.
Concurrent with clinical trials, companies usually complete additional animal studies and must also develop additional information about the physical characteristics of the biological product as well as finalize a process for manufacturing the product in commercial quantities in accordance with cGMP requirements. To help reduce the risk of the introduction of adventitious agents with the use of biological products, the PHS Act emphasizes the importance of manufacturing control for products whose attributes cannot be precisely defined. The manufacturing process must be capable of consistently producing quality batches of the product candidate and, among other things, the sponsor must develop methods for testing the identity, strength, quality, potency, and purity of the final biological product. Additionally, appropriate packaging must be selected and tested and stability studies must be conducted to demonstrate that the biological product candidate does not undergo unacceptable deterioration over its shelf life.
After completion of the required clinical testing, a BLA is prepared and submitted to the FDA. FDA review and approval of the BLA is required before marketing of the product may begin in the United States. The BLA must include the results of all nonclinical, clinical, and other testing and a compilation of data relating to the quality and manufacture of the product, including, chemistry, manufacture, and controls, to demonstrate the safety, purity and potency, or efficacy, of the product based on these results. The cost of preparing and submitting a BLA is substantial. Under federal law, the submission of most BLAs is subject to an application user fee, as well as an annual prescription drug product program user fees, which may total several million dollars and are increased annually.
The FDA has 60 days from its receipt of a BLA to determine whether the application will be accepted for filing based on the agency’s threshold determination that it is sufficiently complete to permit substantive review. Once the submission is accepted for filing, the FDA begins an in-depth review. The FDA has agreed to certain performance goals in the review of BLAs, including to review 90 percent of standard BLAs within 10 months from the date the application is accepted for filing. Although FDA often meets its user fee performance goals, the FDA can extend these timelines as warranted. The FDA usually refers applications for novel biologics, or biologics which present difficult questions of safety or efficacy, to an advisory committee-typically a panel that includes clinicians and other experts-for review, evaluation, and a recommendation as to whether the application should be approved. The FDA is not bound by the recommendation of an advisory committee, but it generally follows such recommendations. Before approving a BLA, the FDA will typically inspect one, or more, clinical sites to assure compliance with GCP. Additionally, the FDA will inspect the facility or the facilities at which the biologic is manufactured as part of a pre-approval inspection. The FDA will not approve the product unless it verifies that compliance with requirements for cGMP is satisfactory and the BLA contains data that provide substantial evidence that the biologic is safe, pure and potent, or effective, for the intended use.
11
For certain products, the FDA also will not approve the product if the manufacturer is not in compliance with the Good Tissue Practices (GTP). These are FDA regulations that govern the methods used in, and the facilities and controls used for, the manufacture of HCT/Ps, which are human cells or tissue intended for implantation, transplant, infusion, or transfer into a human recipient. The primary intent of the GTP requirements is to ensure that cell and tissue based products are manufactured in a manner designed to prevent the introduction, transmission and spread of communicable disease. FDA regulations also require tissue establishments to register and list their HCT/Ps with the FDA and, when applicable, to evaluate donors through screening and testing. To assure cGMP, GTP and GCP compliance, an applicant must incur significant expenditure of time, money and effort in the areas of training, record keeping, production, and quality control.
After the FDA evaluates the BLA and the manufacturing facilities, it issues either an approval letter or a complete response letter. A complete response letter means that the BLA will not be approved in its present form and generally outlines the deficiencies in the submission. Complete responses may require substantial additional testing, or information, in order for the FDA to reconsider the application. If and when those deficiencies have been addressed to the FDA’s satisfaction, the FDA will issue an approval letter. The agency will review such resubmissions in two or six months depending on the type of information included. The FDA approval is never guaranteed, and the FDA may refuse to approve a BLA if the regulatory requirements are not satisfied.
An approval letter authorizes commercial marketing of the biologic with specific prescribing information for specific indications. The approval for a biologic may be significantly more limited than requested in the application, including limitations on the specific diseases and dosages or the indications for use, which could restrict the commercial value of the product. The FDA may also require that certain contraindications, warnings, or precautions be included in the product labeling. In addition, as a condition of BLA approval, the FDA may require a REMS to help ensure that the benefits of the biologic outweigh the potential risks. REMS can include medication guides, communication plans for healthcare professionals, and elements to assure safe use (ETASU). ETASU can include, but are not limited to, special training or certification for prescribing or dispensing, dispensing only under certain circumstances, special monitoring, and the use of patient registries. The requirement for a REMS or use of a companion diagnostic with a biologic can materially affect the potential market and profitability of the biologic. Moreover, product approval may require, as a condition of approval, substantial post-approval testing and surveillance to monitor the biologic’s safety or efficacy. Once granted, product approvals may be withdrawn if compliance with regulatory requirements and standards is not maintained or problems are identified following initial marketing.
Under current requirements, facilities manufacturing biological products for commercial distribution must be registered with the FDA. In addition to the preclinical studies and clinical trials, the BLA includes a description of the facilities, equipment and personnel involved in the manufacturing process. A biologics license, which is the product’s approval, is granted on the basis of inspections of the applicant’s facilities in which the primary focus is on compliance with cGMP and the ability to consistently manufacture the product in the facility in accordance with the BLA. If the FDA finds the results of the inspection unsatisfactory, it may decline to approve the BLA, resulting in a delay in production and commercialization of products.
Regulation of Combination Products in the United States
Certain products may be comprised of components that would normally be regulated under different types of regulatory authorities and frequently by different centers at the FDA. These products are known as combination products. Specifically, under regulations issued by the FDA, a combination product may be:
|
•
|
A product comprised of two or more regulated components that are physically, chemically, or otherwise combined or mixed and produced as a single entity;
|
|
•
|
Two or more separate products packaged together in a single package or as a unit and comprised of drug and device products, device and biological products, or biological and drug products;
|
|
•
|
A drug, or device, or biological product packaged separately that according to its investigational plan or proposed labeling is intended for use only with an approved individually specified drug, or device, or biological product where both are required to achieve the intended use, indication, or effect and where upon approval of the proposed product the labeling of the approved product would need to be changed, e.g., to reflect a change in intended use, dosage form, strength, route of administration, or significant change in dose; or
|
|
•
|
Any investigational drug, device, or biological product packaged separately that according to its proposed labeling is for use only with another individually specified investigational drug, device, or biological product where both are required to achieve the intended use, indication, or effect.
|
12
Under the FFDCA, the FDA is charged with assigning a center with primary jurisdiction, or a lead center, for review of a combination product. That determination is based on the “primary mode of action” of the combination product. Thus, if the primary mode of action of a device-biologic combination product is attributable to the biologic product, the FDA center responsible for premarket review of the biologic product would have primary jurisdiction for the combination product. The FDA has also established an Office of Combination Products to address issues surrounding combination products and provide more certainty to the regulatory review process. That office serves as a focal point for combination product issues for agency reviewers and industry. It is also responsible for developing guidance and regulations to clarify the regulation of combination products, and for assignment of the FDA center that has primary jurisdiction for review of combination products where the jurisdiction is unclear or in dispute.
Accelerated Approval for Regenerative Advanced Therapies
As part of the 21st Century Cures Act, Congress recently amended the FFDCA to create an accelerated approval pathway for regenerative advanced therapies, which include cell therapies, therapeutic tissue engineering products, human cell and tissue products, and combination products using any such therapies or products. Regenerative advanced therapies do not include those human cells, tissues, and cellular and tissue based products regulated solely under section 361 of the Public Health Service Act and 21 CFR Part 1271. The new program is intended to facilitate efficient development and expedite review of regenerative advanced therapies, which are intended to treat, modify, reverse, or cure a serious or life-threatening disease or condition. A sponsor may request that the FDA designate a drug as a regenerative advanced therapy concurrently with or at any time after submission of an IND. The FDA has 60 calendar days to determine whether the drug meets the criteria, including whether there is preliminary clinical evidence indicating that the drug has the potential to address unmet medical needs for a serious or life-threatening disease or condition. A new drug application or BLA for a regenerative advanced therapy may be eligible for priority
review or accelerated approval through surrogate or intermediate endpoints reasonably likely to predict long-term clinical benefit, or reliance upon data obtained from a meaningful number of sites. Therapies with a Regenerative Medicine Advanced Therapy (RMAT) designation will be eligible for accelerated approval through, as appropriate:
(i) Surrogate or intermediate endpoints reasonably likely to predict long-term clinical benefit; or
(ii) Reliance upon data obtained from a meaningful number of sites, including through expansion to additional sites, as appropriate.
Another benefit of RMAT designation is that it creates the option to meet post-approval requirements beyond the standard, controlled clinical trial. Post-approval requirements can be met through:
|
•
|
Clinical evidence, clinical studies, patient registries, or other sources of real world evidence, such as electronic health records;
|
|
•
|
The collection of larger confirmatory data sets; or
|
|
•
|
Post-approval monitoring of all patients treated with such therapy prior to approval of the therapy.
|
Finally, the designation also includes early interactions with the FDA to discuss any potential surrogate or intermediate endpoint to be used to support accelerated approval.
Humanitarian Device Exemption
Unless an exemption applies, each medical device commercially distributed in the United States requires either a substantial equivalence determination under a premarket notification submission pursuant to Section 510(k) of the FFDCA, or an approval of a premarket approval application (PMA). The FDA provides an incentive for the development of certain devices intended to benefit patients by treating or diagnosing a disease or condition that affects or is manifested in not more than 8,000 individuals in the United States per year. These devices receive a HUD designation and may be eligible for marketing approval under an HDE application. An HDE application is a premarket approval application that seeks an exemption from the effectiveness requirement that would otherwise apply to the application. FDA approval of an HDE application authorizes the applicant to market the device.
To obtain approval for a HUD, an HDE application is submitted to the FDA. An HDE application is similar in both form and content to a PMA application in that the applicant must demonstrate a reasonable assurance of safety, but in an HDE application, the applicant seeks an exemption from the PMA requirement of demonstrating a reasonable assurance of effectiveness. An HDE application is not required to contain the results of scientifically valid clinical investigations demonstrating that the device is effective for its intended purpose. The application, however, must contain sufficient information for the FDA to determine that the device does not pose an unreasonable or significant risk of illness or injury, and that the probable benefit to health outweighs the risk of injury or illness from its use, taking into account the probable risks and benefits of currently available devices or alternative
13
forms of treatment. Additionally, the applicant must demonstrate that no comparable devices are available to treat or diagnose the disease or condition, and that they could not otherwise bring the device to market.
Except in certain circumstances, HUDs approved under an HDE cannot be sold for an amount that exceeds the costs of research and development, fabrication, and distribution of the device (i.e., for profit). Under the current HDE provision, as amended by FDASIA, a device is eligible to be sold for profit after receiving HDE approval if the device is intended for the treatment or diagnosis of a disease or condition that occurs in pediatric patients or in a pediatric subpopulation, and such device is labeled for use in pediatric patients or in a pediatric subpopulation in which the disease or condition occurs; or is intended for the treatment or diagnosis of a disease or condition that does not occur in pediatric patients or that occurs in pediatric patients in such numbers that the development of the device for such patients is impossible, highly impracticable, or unsafe. If the FDA makes a determination that a HUD meets the eligibility criteria, the HUD is permitted to be sold for profit after receiving HDE approval as long as the number of devices distributed in any calendar year does not exceed the ADN for the device. The holder of the HDE must immediately notify the FDA if the number of devices distributed during a calendar year exceeds the ADN. The ADN is determined by the FDA when the agency approves the original HDE application; or when the agency approves an HDE supplement for an HDE approved before the enactment of FDASIA if the HDE holder seeks a determination for the HUD in an HDE supplement based upon the profit-making eligibility criteria, and the FDA determines that the HUD meets the eligibility criteria.
FDA Post-Approval Requirements
Maintaining substantial compliance with applicable federal, state, local, and foreign statutes and regulations requires the expenditure of substantial time and financial resources. Rigorous and extensive FDA regulation of biological products and devices continues after approval, particularly with respect to cGMP. We will rely, and expect to continue to rely, on third parties to manufacture or supply certain components, equipment, disposable devices, testing and other materials used in our manufacturing process for any products that we commercialize or may commercialize. Manufacturers of our products are required to comply with applicable requirements in the cGMP regulations, including quality control and quality assurance and maintenance of records and documentation. We cannot be certain that we or our present or future suppliers will be able to comply with the cGMP and other FDA regulatory requirements. Other post-approval requirements applicable to biological products include reporting of cGMP deviations that may affect the identity, potency, purity and overall safety of a distributed product, record-keeping requirements, monitoring and reporting of adverse effects, reporting updated safety and efficacy information, periodic reporting requirements and complying with electronic record and signature requirements. Similarly, there are a number of post-marketing requirements for devices, including medical device reporting regulations that require manufacturers to report to the FDA if a device may have caused or contributed to a death or serious injury or malfunctioned in a way that would likely cause or contribute to a death or serious injury if it were to recur; and corrections and removal reporting regulations that require manufacturers to report to the FDA field corrections and product recalls or removals if undertaken to reduce a risk to health posed by the device or to remedy a violation of the FFDCA that may present a risk to health. Additionally, devices must comply with the cGMP requirements that are set forth in the FDA’s Quality System Regulation (QSR), including complaint handling and corrective and preventative actions.
After a BLA is approved, the biological product also may be subject to official lot release. As part of the manufacturing process, the manufacturer is required to perform certain tests on each lot of the product before it is released for distribution. If the product is subject to official release by the FDA, the manufacturer submits samples of each lot of product to the FDA together with a release protocol showing a summary of the history of manufacture of the lot and the results of all of the manufacturer’s tests performed on the lot. The FDA also may perform certain confirmatory tests on lots of some products, such as viral vaccines, before releasing the lots for distribution by the manufacturer. In addition, the FDA conducts laboratory research related to the regulatory standards on the safety, purity, potency, and effectiveness of biological products. After approval of biologics, manufacturers must address any safety issues that arise, are subject to recalls or a halt in manufacturing, and are subject to periodic inspection after approval.
Discovery of previously unknown problems or the failure to comply with the applicable regulatory requirements, by us or our suppliers, may result in restrictions on the marketing of a product or withdrawal of the product from the market as well as possible civil or criminal sanctions and adverse publicity. FDA sanctions could include refusal to approve pending applications, license revocation, withdrawal of an approval, clinical hold, warning or untitled letters, product recalls, product seizures, total or partial suspension of production or distribution, injunctions, fines, refusals of government contracts, mandated corrective advertising or communications with doctors, debarment, restitution, disgorgement of profits, or civil or criminal penalties. Any agency or judicial enforcement action could have a material adverse effect on us.
Biological product and medical device manufacturers and other entities involved in the manufacture and distribution of approved biological products and devices are required to register their facilities with the FDA and certain state agencies, and are subject to periodic unannounced inspections by the FDA and certain state agencies for compliance with cGMP and other laws. In addition, changes to the manufacturing process or facility generally require prior FDA approval before being implemented and
14
other types of changes to the approved product, such as adding new indications and additional labeling claims, are also subject to further FDA review and approval, with certain exceptions.
Pediatric Research Equity Act
Under the Pediatric Research Equity Act, or PREA, a BLA or BLA supplement claiming a new indication must contain data to assess the safety and effectiveness of the biological product for the claimed indications in all relevant pediatric subpopulations and to support dosing and administration for each pediatric subpopulation for which the product is safe and effective, for a new product, new indication or dosage form. The intent of PREA is to compel sponsors whose products have pediatric applicability to study those products in pediatric populations, rather than ignoring pediatric indications for adult indications that could be more economically desirable. The FDA may grant deferrals for submission of data or full or partial waivers. By its terms, PREA does not apply to any biological product for an indication for which orphan designation has been granted, unless the FDA issues regulations saying otherwise. Because the FDA has not issued any such regulations, submission of a pediatric assessment is not required for an application to market a product for an orphan-designated indication, and waivers are not needed at this time. However, if only one indication for a product has orphan designation, a pediatric assessment may still be required for any applications to market that same product for the non-orphan indication(s).
U.S. Patent Term Restoration and Marketing Exclusivity
Depending upon the timing, duration, and specifics of the FDA approval of the use of our current or future product candidates, some of our U.S. patents may be eligible for limited patent term extension under the Drug Price Competition and Patent Term Restoration Act of 1984, commonly referred to as the Hatch-Waxman Amendments. Patent term restoration can compensate for time lost during product development and the regulatory review process by returning up to five years of patent life for a patent that covers a new product or its use. However, patent term restoration cannot extend the remaining term of a patent beyond a total of 14 years from the product’s approval date. The period of patent term restoration is generally one-half the time between the effective date of an IND (falling after issuance of the patent) and the submission date of a BLA, plus the time between the submission date of the BLA and the approval of that application, except that the review period is reduced by any time during which the applicant failed to exercise due diligence. Only one patent applicable to an approved biological product is eligible for the extension and the application for the extension must be submitted prior to the expiration of the patent. The application for patent term extension is subject to approval by the United States Patent and Trademark Office, or PTO, in consultation with the FDA. We cannot be certain that the PTO and the FDA will grant a patent term extension related to MACI.
A biological product can obtain pediatric market exclusivity in the United States. This six-month exclusivity, which runs from the end of other exclusivity protection or patent term, may be granted based on the voluntary completion of a pediatric study in accordance with an FDA-issued “Written Request” for such a study.
Biosimilars
The Patient Protection and Affordable Care Act, or the Affordable Care Act, includes the Biologics Price Competition and Innovation Act of 2009. That Act created an approval pathway authorizing the FDA to approve biosimilars and interchangeable biosimilars. Biosimilars are biological products which are “highly similar” to a previously approved biologic product or “reference product” and for which there are no clinically meaningful differences between the biosimilar product and the reference product in terms of the safety, purity, and potency as shown through analytical studies, animal studies and a clinical study or studies. For the FDA to approve a biosimilar product as interchangeable with a reference product, the agency must find that the biosimilar product can be expected to produce the same clinical results as the reference product and, for products administered multiple times, the biosimilar and the reference biologic may be switched after one has been previously administered without increasing safety risks or risks of diminished efficacy relative to exclusive use of the reference biologic. A reference biologic is granted 12 years of exclusivity from the time of first licensure of the reference product.
Advertising and Promotion
The FDA closely regulates the post-approval marketing and promotion of biologics and devices including regulating through standards and regulations for direct-to-consumer advertising and promotional activities involving the internet. The agency also prohibits the off-label promotion of biologics and devices, and provides guidance on industry-sponsored scientific and educational activities to ensure that these activities are not promotional. Any claims we make for our products in advertising or promotion must be appropriately balanced with important safety information and otherwise adequately substantiated. Failure to comply with these requirements can result in adverse publicity and significant penalties, including the issuance of untitled or warning letters directing a company to correct deviations from FDA standards, corrective advertising, a requirement that future advertising and
15
promotional materials be pre-cleared by the FDA, injunctions, and federal and state civil and criminal investigations and prosecutions.
While doctors are free to prescribe any product approved by the FDA for use, a company can only make claims relating to safety and effectiveness of a biological product or device that are consistent with the FDA approval or clearance, and the company is allowed to actively market and promote a biological product or device only for the particular use and treatment approved or cleared by the FDA. For BLAs, changes to some of the conditions established in an approved application, including changes in indications, labeling, or manufacturing processes or facilities, require submission and FDA approval of a new BLA or BLA supplement before the change can be implemented. A BLA supplement for a new indication typically requires clinical data similar to that in the original application, and the FDA uses the same procedures and actions in reviewing BLA supplements as it does in reviewing BLAs. Similarly, changes to approved or cleared devices may require FDA’s premarket review.
Orphan Drug
Under the Orphan Drug Act, the FDA may grant orphan drug designation to biologics intended to treat a rare disease or condition, generally a disease or condition that affects fewer than 200,000 individuals in the United States, or affects more than 200,000 individuals in the United States and for which there is no reasonable expectation that the cost of developing and making available in the United States a drug for such disease or condition will be recovered from sales of such drug. Orphan drug designation must be requested before submitting a BLA. After the FDA grants orphan drug designation, the generic identity of the biologic and its potential orphan use are disclosed publicly by the FDA. Orphan drug designation does not necessarily convey any advantage in, or shorten the duration of, the regulatory review and approval process. The first BLA applicant to receive FDA approval for a particular product to treat a particular disease with FDA orphan drug designation is entitled to a seven-year exclusive marketing period in the United States for that product, for that indication. During the seven-year exclusivity period, the FDA may not approve any other applications to market the same drug for the same disease, except in limited circumstances, such as a showing of clinical
superiority to the product with orphan drug exclusivity. Orphan drug exclusivity, which would most likely run concurrently with the exclusivity, if any, received from the time of first licensure of a reference product, does not prevent the FDA from approving a different biologic for the same disease or condition, or the same biologic for a different disease or condition. Among the other benefits of orphan drug designation are tax credits for certain research and a waiver of the BLA application user fee.
The Food and Drug Administration Safety and Innovation Act (FDASIA) added Section 529 to the FFDCA. Pursuant to that provision, the FDA will award priority review vouchers to sponsors of rare pediatric disease product applications that meet certain criteria after approval of the application. The priority review voucher may be used by the sponsor or sold/transferred to another.
Anti-Kickback and False Claims Laws
In the United States, the research, manufacturing, distribution, sale and promotion of biological products and devices are subject to regulation by various federal, state and local authorities in addition to the FDA, including the Centers for Medicare & Medicaid Services, other divisions of the U.S. Department of Health and Human Services (e.g., the Office of Inspector General), the U.S. Department of Justice, state Attorneys General, and other federal, state and local government agencies. For example, sales, marketing and scientific/educational grant programs must comply with the Anti-Kickback Statute, as amended, the False Claims Act, as amended, the privacy regulations promulgated under the Health Insurance Portability and Accountability Act, or HIPAA, and similar state laws. If products are made available to authorized users of the Federal Supply Schedule of the General Services Administration, additional laws and requirements apply. All of these activities are also potentially subject to federal and state consumer protection and unfair competition laws.
As noted above, in the United States, we are subject to complex laws and regulations pertaining to healthcare “fraud and abuse,” including, but not limited to, the federal Anti-Kickback Statute, the federal False Claims Act, and other state and federal laws and regulations. The Anti-Kickback Statute makes it illegal for any person, including a biological product manufacturer (or a party acting on its behalf) to knowingly and willfully solicit, receive, offer, or pay any remuneration that is intended to induce the referral of business, including the purchase or order of an item for which payment may be made under a federal healthcare program, such as Medicare or Medicaid. Violations of this law are punishable by up to five years in prison, criminal fines, administrative civil money penalties, and exclusion from participation in federal healthcare programs. In addition, many states have adopted laws similar to the Anti-Kickback Statute. Some of these state prohibitions apply to the referral of patients for healthcare services reimbursed by any insurer, not just federal healthcare programs such as Medicare and Medicaid. Due to the breadth of these federal and state anti-kickback laws and the potential for additional legal or regulatory change in this area, it is possible that our sales and marketing practices and/or our relationships with physicians might be challenged under anti-kickback laws, which could harm us. Because we commercialize products that could be reimbursed under a federal healthcare program and other governmental healthcare programs, we have developed a comprehensive compliance program that establishes internal controls to facilitate adherence to the rules and program requirements to which we are subject.
16
The federal False Claims Act prohibits anyone from, among other things, knowingly presenting, or causing to be presented, for payment to federal programs (including Medicare and Medicaid) claims for items or services, including biological products, that are false or fraudulent. Although we would not submit claims directly to payers, manufacturers can be held liable under these laws if they are deemed to “cause” the submission of false or fraudulent claims by, for example, providing inaccurate billing or coding information to customers or promoting a product off-label. In addition, our activities relating to the reporting of wholesaler or estimated retail prices for our products, the reporting of prices used to calculate Medicaid rebate information and other information affecting federal, state, and third-party reimbursement for our products, and the sale and marketing of our products, are subject to scrutiny under this law. For example, pharmaceutical companies have been prosecuted under the federal False Claims Act in connection with their off-label promotion of drugs. Penalties for a False Claims Act violation include three times the actual damages sustained by the government, plus mandatory civil penalties of between $10,781 and $21,563 for each separate false claim, the potential for exclusion from participation in federal healthcare programs, and, although the federal False Claims Act is a civil statute, conduct that results in a False Claims Act violation may also implicate various federal criminal statutes. If the government were to allege that we were, or convict us of, violating these false claims laws, we could be subject to a substantial fine and may suffer a decline in our stock price. In addition, private individuals have the ability to bring actions under the federal False Claims Act and certain states have enacted laws modeled after the federal False Claims Act.
There are also an increasing number of state laws that require manufacturers to make reports to states on pricing and marketing information. Many of these laws contain ambiguities as to what is required to comply with the laws. In addition, a provision of the Patient Protection and Affordable Care Act, referred to as the Sunshine Act, requires biological product manufacturers to track and report to the federal government certain payments or other transfers of value made to physicians and teaching hospitals made in the previous calendar year. These laws may affect our sales, marketing, and other promotional activities by imposing administrative and compliance burdens on us. In addition, given the lack of clarity with respect to these laws and their implementation, our reporting actions could be subject to the penalty provisions of the pertinent state and federal authorities.
International Regulation
In addition to regulations in the United States, a variety of foreign regulations govern clinical trials, commercial sales, and distribution of product candidates. The marketing authorization approval process and requirements vary from country to country, and the review timelines may be longer or shorter than that required for FDA approval.
European Union (EU) pharmaceutical legislation requires Marketing Authorization Holders (MAH) in the EU to comply with the Pediatric Investigational Plan (PIP) that is in place as a post-authorization commitment agreed with the Pediatric Committee or PDCO within EMA to undergo an initial license renewal procedure within five years after initial market authorization. In the case of MACI which has a suspended license due to a European manufacturing facility closure, this would require the registration, qualification and approval of an EU compliant cGMP manufacturing facility before the end of the applicable renewal period in June 2018. However, we are not planning to take such actions prior to the expiration of the marketing authorization for MACI at the end of June 2018.
Pharmaceutical Coverage, Pricing, and Reimbursement
In the United States and other countries, sales of any products for which we receive regulatory approval for commercial sale will depend in part on the availability of reimbursement from third-party payers, including government health administrative authorities, managed care providers, private health insurers, and other organizations. Third-party payers are increasingly examining the medical necessity and cost effectiveness of medical products and services in addition to safety and efficacy and, accordingly, significant uncertainty exists as to the reimbursement status of newly approved therapeutics. Third-party reimbursement adequate to enable us to realize an appropriate return on our investment in research and product development may not be available for our products.
Competitive Environment for Cartilage Repair and Burn Treatment
The biotechnology and medical device industries are characterized by rapidly evolving technology and intense competition. Our competitors include major multinational medical device companies, pharmaceutical companies, biotechnology companies and stem cell companies operating in the fields of tissue engineering, regenerative medicine, orthopedics and neural medicine. Many of these companies are well-established and possess technical, research and development, financial, and sales and marketing resources significantly greater than ours. In addition, many of our smaller potential competitors have formed strategic collaborations, partnerships and other types of joint ventures with larger, well-established industry competitors that afford these companies potential research and development and commercialization advantages in the technology and therapeutic areas currently being pursued by us. Academic institutions, governmental agencies and other public and private research organizations are also conducting and
17
financing research activities which may produce products directly competitive to those being commercialized by us. Moreover, many of these competitors may be able to obtain patent protection, obtain FDA and other regulatory approvals and begin commercial sales of their products before us.
For patients diagnosed with cartilage defects, there are several treatment options, including arthroscopic debridement/chondroplasty, marrow stimulation techniques such as microfracture, osteochondral autografts for smaller cartilage injuries, allografts, and autologous chondrocyte implants for larger, more complex injuries.
The main competing treatments for MACI in the U.S. are microfracture and osteochondral allograft. Microfracture, a minimally invasive procedure that can be performed during the initial arthroscopic procedure, involves creating small fractures in the underlying bone allowing bone marrow to enter the defect. This treatment eventually forms a weaker form of cartilage which can offer shorter term relief but is at high risk of breaking down in larger defects. Short term results are generally considered good in smaller cartilage defects. This treatment is sometimes augmented with allograft derived products such as Cartiform
®
marketed by Arthrex and Prochondrix
®
marketed by Allosource. The osteochondral allograft procedure involves the transplant of a bone and cartilage graft from a deceased donor. The donor tissue is distributed by multiple companies. Other competitive treatments in the U.S. include a juvenile donor-derived allograft product DeNovo
®
NT from Zimmer Holdings Inc. (Zimmer Biomet).
MACI is the only FDA-approved ACI product on the market in the United States. We are aware of two ACI products in development. Histogenics Corporation began a Phase 3 study of its Neocart implant in February 2010. Neocart is an autologous chondrocyte tissue implant under development for treatment of symptomatic articular cartilage lesions on the femur. Aesculap Biologics, LLC initiated a Phase 3 study in 2014 of NovoCart 3D, a matrix induced autologous chondrocyte product designed to repair articular cartilage defects of the knee.
Patients suffering catastrophic burns over a significant portion of TBSA have few options for permanent skin coverage. When undamaged skin is available, a procedure known as meshed split-thickness auto-grafting can be considered. However, this option becomes less viable as the percentage of TBSA burn increases. Epicel is a potentially lifesaving therapy and represents the only option for patients with TBSA burns greater than 70%. Avita Medical is developing ReCell
®
, a device which enables the on-site preparation of an autologous epithelial cell suspension, intended for the treatment of lower TBSA (<50%) burns. Avita has fully enrolled its pivotal trial and projects PMA approval of ReCell in 2018. In 2016 the FDA approved limited usage of ReCell under a special compassionate use protocol with limited expansions to this usage in 2017 and 2018.
In the general area of cell-based therapies, we potentially compete with a variety of companies, most of whom are specialty medical products or biotechnology companies. Some of these, such as Arthrex and Zimmer, are well-established and have substantial technical and financial resources compared to ours. However, as cell-based products are only just emerging as viable medical therapies, many of our potential competitors are smaller biotechnology and specialty medical products companies.
Employees
As of
December 31, 2017
, we employed approximately 205 full-time employees. A significant number of our management and professional employees have had prior experience with pharmaceutical, biotechnology or medical product companies. None of our employees are covered by collective bargaining agreements, and management considers relations with our employees to be good.
Executive Officers
The following table presents our executive officers and key employees and their respective ages and positions as of
December 31, 2017
:
|
Name
|
Position
|
Age
|
Executive
Officer Since
|
|||
|
Dominick C. Colangelo
|
President and Chief Executive Officer
|
53
|
2013
|
|||
|
Daniel R. Orlando
|
Chief Operating Officer
|
52
|
2012
|
|||
|
Gerard Michel
|
Chief Financial Officer & Vice President of Corporate Development
|
54
|
2014
|
|||
Dominick C. Colangelo —
Mr. Colangelo joined Vericel Corporation in 2013 with more than twenty years of executive management and corporate development experience in the biopharmaceutical industry, including nearly a decade with Eli Lilly and Company. During his career, he has held a variety of executive positions of increasing responsibility in product development, pharmaceutical operations, sales and marketing, and corporate development. He has extensive experience in the acquisition,
18
development and commercialization of products across a variety of therapeutic areas. During his tenure at Eli Lilly and Company, Mr. Colangelo held positions as Director of Strategy and Business Development for Lilly’s Diabetes Product Group and also served as a founding Managing Director of Lilly Ventures. Mr. Colangelo received his B.S.B.A. in Accounting, Magna Cum Laude, from the State University of New York at Buffalo and a J.D. degree, with Honors, from the Duke University School of Law.
Daniel R. Orlando —
Mr. Orlando joined Vericel as Chief Commercial Officer in August of 2012. Mr. Orlando served as interim Chief Executive Officer of Vericel from December 2012 to March 2013. He has more than 20 years of commercial product preparation and launch experience including leadership roles in sales, marketing and most recently as a vice president of business development for North and South America at Takeda Pharmaceuticals U.S.A., Inc., a wholly owned subsidiary of Takeda Pharmaceutical Limited (Takeda North America) from January 1999 to March 2012. As an early employee at Takeda North America, he served as the original brand director for Actos, which became the #1 branded anti-diabetic agent in the United States. Mr. Orlando’s initial pharmaceutical experience came in progressively expanding roles in sales and marketing at Abbott Laboratories. He holds an MBA from Florida Atlantic University and a BA in Economics with Honors from the University of Florida.
Gerard Michel —
Mr. Michel joined Vericel in June of 2014 with over 25 years of experience in the pharmaceutical industry across multiple functional areas. He has considerable experience in business development, raising capital and executing successful financial transactions. Mr. Michel was formerly Chief Financial Officer and Vice President, Corporate Development of Biodel Inc. from November 2007 to May 2014, where he oversaw strategic development, fundraising and capital structure management, marketing efforts, investor relations, and financial reporting and internal controls. Prior to his role at Biodel, from August 2002 to November 2007, Mr. Michel served as Chief Financial Officer and Vice President of Corporate Development of NPS Pharmaceuticals Inc., where he led the first syndicated royalty monetization. Prior to that, Mr. Michel was a Principal at Booz Allen Hamilton Inc. and also held a variety of commercial roles at both Lederle Labs and Wyeth Labs. Mr. Michel holds an M.S. in Microbiology from the University of Rochester School of Medicine, an M.B.A. from the Simon School of Business, and a B.S. in both Biology and Geology from the University of Rochester.
Available Information
Additional information about Vericel is contained at our website, www.vcel.com. Information on our website is not incorporated by reference into this report. We make available on our website free of charge our Annual Reports on Form 10-K, Quarterly Reports on Form 10-Q and Current Reports on Form 8-K as soon as reasonably practicable after those reports are filed with the Securities and Exchange Commission (SEC). Our reports filed with the SEC are also made available to read and copy at the SEC’s Public Reference Room at 100 F Street, NE, Washington, D.C. 20549. You may obtain information about the Public Reference Room by calling the SEC at 1-800-SEC-0330. Reports filed with the SEC are also made available on its website at www.sec.gov. The following Corporate Governance documents are also posted on the Investor Relations section of our website: Code of Business Conduct and Ethics, Code of Ethics for Senior Financial Officers, Board Member Attendance at Annual Meetings Policy, Director Nominations Policy, Shareholder Communications with Directors Policy and the Charters for each of the Committees of the Board of Directors.
19
Item 1A.
Risk Factors
Our operations and financial results are subject to various risks and uncertainties, including those described below, that could adversely affect our business, financial condition, results of operations, cash flows, and trading price of our common stock. The risks and uncertainties described below are not the only ones we face. There may be additional risks and uncertainties that are not known to us or that we do not consider to be material at this time. If the events described in these risks occur, our business, financial condition, and results of operations would likely suffer.
Risks Related to our Business
We may experience significant quarterly and annual fluctuations in our results of operations due to a number of factors.
Our quarterly and annual results of operations may fluctuate significantly due to a variety of factors, many of which are outside of our control. This variability may lead to volatility in our stock price as investors and research analysts respond to quarterly fluctuations. In addition, comparing our results of operations on a period-to-period basis, particularly on a sequential quarterly basis, may not be meaningful. You should not rely on our past results as an indication of our future performance.
Factors that may affect our results of operations include:
|
•
|
the timing of new orders and revenue recognition for new and prior year orders;
|
|
•
|
seasonal buying patterns of our customers;
|
|
•
|
volatility in the sales of our products;
|
|
•
|
volume of revenues;
|
|
•
|
our ability to increase sales to our existing customers, particularly larger customers;
|
|
•
|
our ability to attract new customers;
|
|
•
|
our ability to develop and achieve market adoption of our products;
|
|
•
|
the impact of a recession or any other adverse global economic conditions on our business;
|
|
•
|
erosion in margins or significant fluctuations in revenues caused by changing customer demand;
|
|
•
|
the timing and cost of our sales force expansion and hiring personnel and of large expenses such as third-party professional services;
|
|
•
|
stock-based compensation expenses, which vary along with changes to our stock price;
|
|
•
|
fluctuations in foreign currency exchange rates; and
|
|
•
|
future accounting pronouncements or changes in accounting rules or our accounting policies.
|
The foregoing factors are difficult to forecast, and these, as well as other factors, could materially adversely affect our quarterly and annual results of operations. There can be no assurance that the level of revenues and profits, if any, achieved by us in any particular fiscal period, will not be significantly lower than in other comparable fiscal periods. For example, the rate at which biopsies convert to implants has been consistent over the last five years. We cannot be certain that this rate will remain constant in the future, and if this rate were to decline, our revenue growth could be negatively impacted. In addition, our expense levels are based, in part, on our expectations as to future revenues. As a result, if future revenues are below expectations, net income or loss may be disproportionately affected by a reduction in revenues, as any corresponding reduction in expenses may not be proportionate to the reduction in revenues.
If we fail to achieve our quarterly forecasts, if our forecasts fall below the expectations of investors or research analysts, or if our actual results fail to meet the expectations of investors or research analysts, our stock price may decline.
Seasonal sales patterns and other variations related to our revenue recognition may cause significant fluctuations in our results of operations and cash flows and may prevent us from achieving our quarterly or annual forecasts, which may cause our stock price to decline.
We have received a significantly higher percentage of product orders in the second and fourth quarters of each fiscal year. We generally see increased orders in our second and fourth quarters, and our sales are typically greatest in the fourth quarter. As a result, a significantly higher percentage of our annual revenues have historically been recognized in our second and fourth quarters
due to a number of factors, including insurance copay limits and the time of year patients prefer to start rehabilitation. We expect to continue to experience this seasonality effect in subsequent years.
Our quarterly growth in revenues also may not match up to new orders we receive in a given quarter, which could mask the impact of seasonal variations. This mismatch can be due to the timing of revenue recognition.
Seasonal and other variations related to our revenue recognition may cause significant fluctuations in our results of operations and cash flows, may make it challenging for an investor to predict our performance on a quarterly basis and may prevent us from achieving our quarterly or annual forecasts or meeting or exceeding the expectations of research analysts or investors, which in turn may cause our stock price to decline.
20
Our operating results will be harmed if we are unable to effectively manage and sustain our future growth or scale our operations.
There can be no assurance that we will be able to manage our future growth efficiently or profitably. Our business is unproven on a large scale and actual revenue and operating margins, or revenue and margin growth, may be less than expected. If we are unable to scale our production capabilities efficiently or maintain pricing without significant discounting, we may fail to achieve expected operating margins, which would have a material and adverse effect on our operating results. Growth may also stress our ability to adequately manage our operations, quality of products, safety and regulatory compliance. If growth significantly decreases it will negatively impact our cash reserves, and we may be required to obtain additional financing, which may increase indebtedness or result in dilution to shareholders. Further, there can be no assurance that we would be able to obtain additional financing on acceptable terms if at all.
We have incurred losses, anticipate continuing to incur losses and may not achieve or maintain profitability for some time or at all.
We have incurred net losses each year since our inception in 1989, including net losses of
$17.3 million
and
$19.6 million
for the years ended December 31,
2017
and
2016
, respectively. As of December 31,
2017
, we had accumulated a deficit of approximately
$360.9 million
and had
$26.9 million
of cash. Based on our current plan and cash on hand, we believe that we are positioned to sustain our operations until at least March 31, 2019.
Although we believe we will achieve profitability without the need to raise additional capital, we may continue to incur significant operating losses over the next several years despite sales increasing and margins improving, due to continuing expenses related to our research and development programs, and the expense associated with continuing the commercialization of our approved products. We cannot predict with any certainty the amount of future losses. Our ability to maintain profitability will depend on, among other things, increasing sales of our current products, improving gross margins, successfully commercializing our new products, completing the development of our future product candidates, timely initiation and completion of clinical trials, obtaining regulatory approvals, establishing manufacturing, sales and marketing arrangements with third parties, maintaining supplies of key manufacturing components and the possible acquisition and development of complementary products. Therefore, we may not be able to achieve or sustain profitability.
In the longer term, we may need to raise additional funds in order to continue to complete product development programs and complete clinical trials needed to obtain approval for and commercialize our future product candidates or to capitalize on potential strategic opportunities. We cannot be certain that actual results will not differ materially from our current projections and that current capital will be sufficient to achieve profitability nor that funding will be available on favorable terms, if at all. Some of the factors that will impact our ability to raise additional capital and our overall success include:
|
•
|
The ability to maintain our manufacturing facility's compliance with FDA requirements including establishment and product fees;
|
|
•
|
The requirements to maintain marketing authorization and licenses from regulatory bodies in the United States and other countries in good standing;
|
|
•
|
The liquidity and market volatility of our equity securities;
|
|
•
|
Regulatory and manufacturing requirements and uncertainties;
|
|
•
|
Staying ahead of technological developments by competitors;
|
|
•
|
The rate and degree of progress of our product development; and
|
|
•
|
The rate of regulatory approval to proceed with clinical development programs.
|
We have access to certain amounts of financing through a revolving line of credit from our Loan and Security Agreement, dated as of September 9, 2016, as amended (SVB-MidCap Facility), with Silicon Valley Bank, MidCap Financial Trust and MidCap Funding III Trust (together, MidCap) and we have access to capital through an at-the-market Sales Agreement with Cowen and Company, LLC (Cowen), dated October 10, 2016 (ATM). There are certain factors, such as volume of trading in our common stock and our stock price and the ability to terminate the agreements with notice, which limit the amount that can be raised in a short period of time through the SVB-MidCap revolving line of credit and the ATM. In addition there are limits to our borrowing level with SVB and MidCap based on a minimum net revenue covenant and accounts receivable balance. If funding is needed and we cannot raise such funds, we will not be able to develop, manufacture or enhance products, take advantage of future opportunities, or respond to competitive pressures or unanticipated requirements, which would have a material adverse impact on our business, financial condition and results of operations.
21
Failure to enter into written agreements with payers for reimbursement of our products and to obtain adequate reimbursement and reimbursement rates could have a material adverse effect on our financial condition and operating results.
In July 2016, we entered in an agreement Dohmen Life Science Services, LLC (DLSS) under which DLSS provided patient support and reimbursement services for both Carticel and MACI. Under the arrangement with DLSS and other providers, we assumed the credit and collection risk of third party payers not paying for our products. On May 15, 2017, we entered into a new distribution agreement with Orsini to appoint Orsini as a specialty pharmacy distributor of MACI to patients' physicians and other healthcare providers. Orsini purchases and takes title to MACI upon shipment of the product. Orsini assumes credit and collection risk related to the end customers. We and DLSS mutually terminated our agreement in June 2017. The Company's total revenue and accounts receivable balances is concentrated in Orsini as its largest customer of Carticel and MACI with
35%
percent of our total Carticel and MACI revenues and
46%
percent of our total accounts receivable balances for the year ended December 31, 2017, see note 4 for further information. Either party may terminate the agreement on ninety days’ notice or upon the occurrence of other customary termination events. We rely on Orsini’s contracts with third-party payers for reimbursement. This customer concentration increases credit risk and the loss or a significant reduction in business from Orsini could materially decrease our revenues and have a material adverse impact on our results of operations.
Failing to maintain and obtain written agreements from payers for
reimbursement of our products or to obtain adequate reimbursement rates could have a material adverse effect on our financial condition and operating results. In addition, healthcare providers are under pressure to increase profitability and reduce costs. In response, certain healthcare providers are limiting coverage or reducing reimbursement rates for the products we provide. We cannot predict the extent to which reimbursement for our products will be affected by initiatives to reduce costs for healthcare providers. Failure to collect from such payers or to obtain or maintain written agreements with such payers or obtaining lower than estimated reimbursement for our products would adversely affect our business, financial conditions and results of operations.
We may not be able to raise the required capital to conduct our operations, develop and commercialize our future product candidates
and
otherwise grow
and
expand
our
business.
Notwithstanding the net proceeds we received from previous public offerings, sales under the ATM and the availability of funds under the SVB-MidCap revolving line of credit and the ATM, we may require substantial additional capital resources for strategic opportunities.
In order to grow and expand our business, to introduce other new product candidates into the marketplace, we may need to raise additional funds. We may also need significant additional funds or a collaborative partner, or both, to finance the research and development activities of our future cell therapy product candidates for additional indications or in additional markets.
Our future capital requirements will depend upon many factors, including:
•
Continued scientific progress in our research, clinical and development programs;
•
Costs and timing of conducting clinical trials and seeking regulatory approvals;
•
Competing technological and market developments;
•
Avoiding infringement and misappropriation of third-party intellectual property;
•
Obtaining valid and enforceable patents that give us a competitive advantage;
•
Our ability to establish additional collaborative relationships;
•
Our ability to scale up our production capabilities for larger quantities of our products;
•
The effect of commercialization activities and facility expansions, if and as required; and
•
Complementary business acquisitions or development opportunities.
On October 10, 2016, we entered into our ATM with Cowen, pursuant to which we may sell shares of our common stock through Cowen, as sales agent, in registered transactions from our shelf registration statement filed in June 2015, for aggregate proceeds of up to
$25.0 million
. Shares of common stock sold under the ATM are to be sold at market prices. We will pay up to 3% of the gross proceeds to Cowen as a commission.
2,340,879
shares of common stock have been sold to date under the ATM and as of
December 31, 2017
had remaining capacity of approximately
$16.7 million
. The extent to which we rely on the ATM as a source of funding will depend on a number of factors, including the prevailing market price of our common stock and the extent to which we are able to secure working capital from other sources. If obtaining sufficient funding from the ATM were to prove impracticable or prohibitively dilutive, we may need to secure other sources of funding in order to satisfy our working capital needs. Even if we sell the maximum amount we are eligible to sell to under the ATM, we may need additional capital to fully implement our business, operating and development plans. Should the financing we require to sustain our working capital needs be unavailable or prohibitively expensive should we require it, the consequences may have a material adverse effect on our business, operating results, financial condition and prospects.
22
We may try to access the public or private equity markets if conditions are favorable to complete a financing, even if we do not have an immediate need for additional capital at that time, or whenever we require additional operating capital. In addition, we may seek collaborative relationships, incur debt and access other available funding sources. This additional funding may not be available to us on reasonable terms, or at all. Some of the factors that will impact our ability to raise additional capital and our overall success include:
|
•
|
Our ability to further commercialize our products;
|
|
•
|
The rate and degree of progress of our product development;
|
|
•
|
The rate of regulatory approval to proceed with clinical developmental programs;
|
|
•
|
The level of success achieved in clinical trials;
|
|
•
|
The requirements for marketing authorization from regulatory bodies in the United States and other countries;
|
|
•
|
The liquidity and market volatility of our equity securities; and
|
|
•
|
Regulatory and manufacturing requirements and uncertainties, and technological developments by competitors.
|
If adequate funds are not available in the future, we may not be able to develop or enhance our products, take advantage of future opportunities, or respond to competitive pressures or unanticipated requirements and we may be required to delay or terminate research and development programs, curtail capital expenditures, and reduce business development and other operating activities, which would have a material adverse impact on our business, financial condition and results of operations.
Failure to maintain required regulatory approvals would severely limit our ability to sell our products.
We must maintain our domestic regulatory approvals to continue to commercialize our products in the United States. We must demonstrate the safety, purity and potency, or efficacy, of cell therapy products to obtain FDA regulatory approval prior to marketing in the United States. Demonstration of safety and efficacy requires the conduct of nonclinical studies and well-controlled clinical trials in compliance with FDA, International Conference of Harmonization (ICH) and applicable local regulations. The FDA regulatory review process to obtain marketing approval is a rigorous process that requires demonstrating the ability to manufacture the product in compliance with (cGMP) in addition to demonstrating a favorable risk/benefit profile and making certain post-marketing commitments.
We must maintain our foreign regulatory approvals in compliance with regulatory requirements and applicable local regulations to allow for commercialization outside the U.S. Regulatory requirements outside the U.S. often require additional studies and data to obtain registration. Timelines can also be longer than those in the U.S.
The safety, potency and purity of our products must be monitored to be in compliance with FDA requirements for safety, cGMP, and all other applicable regulations. This requires adverse event monitoring and reporting to regulatory agencies, as well as submission and approval of any changes in the manufacturing process. Our manufacturing and testing facilities are subject to FDA periodic inspections for compliance with cGMP requirements. Failure to meet regulatory requirements and post-marketing commitments and maintain cGMP compliance could result in severe and detrimental regulatory actions, including the loss of marketing approval.
Any changes in the regulatory requirements that affect our products and/or future product candidates could prevent, limit or delay our ability to market or develop new product candidates.
FDA regulations establish the regulatory requirements for drugs, devices and biological products. Our cell therapy products are regulated as devices or biologics under current regulations. Biologics require Biologics License Application (BLA) approval in the U.S. prior to being marketed. The regulations and guidance that govern the approval of biological products for marketing in the U.S. are subject to review and change by the FDA and could have an adverse impact on our ability to continue to market our products and bring new products to the market.
Our products and product development programs are based on novel technologies and are inherently risky.
Our products are subject to the inherent risks of failure associated with the development of new products based on novel technologies. The innovative nature of our therapeutics creates significant challenges in regard to product development and optimization, manufacturing, regulatory environment and emerging regulations, third-party reimbursement and market acceptance. For instance, in April 2017, we received notification from one of our service providers of a contractual dispute between the service provider and the third-party payer related to certain of its insurance reimbursement claims associated with Carticel and MACI surgeries performed in 2016 and the first quarter of 2017, which could result in the claims being paid on an out-of-network basis or at a lower amount than anticipated. Therapeutic advancements are generally ahead of development and release of regulatory
23
guidance and requirements. The lack of established precedents and evolving regulatory policy for novel products can pose significant challenges in product and clinical development, which can decrease the chances of regulatory success.
Our products represent new classes of therapy that the marketplace may not understand or accept. Furthermore, the success of our products is dependent on wider acceptance by the medical community.
While our products have had some commercial success to date, the broader market may not understand or accept our products. Our products represent new treatments or therapies and compete with a number of more conventional products and therapies manufactured and marketed by others. The new nature of our products creates significant challenges in regard to product development and optimization, manufacturing, regulations, and third-party reimbursement. For instance, in April 2017, we received notification from one of our service providers of a contractual dispute between the service provider and the third-party payer related to certain of its insurance reimbursement claims associated with Carticel and MACI surgeries performed in 2016 and the first quarter of 2017, which could result in the claims being paid on an out-of-network basis or at a lower amount than anticipated. As a result, the commercialization of our current products and the development pathway for our potential new products may be subject to increased scrutiny, as compared to the pathway for more conventional products.
The degree of market acceptance of any of our marketed or potential new products will depend on a number of factors, including:
•
The clinical safety and effectiveness of our products and their demonstrated advantage over alternative treatment methods;
•
Our ability to demonstrate to healthcare providers that our products provide a therapeutic advancement over standard of care or other competitive products / methods;
•
Our ability to educate healthcare providers on the autologous use of patient-specific human tissue, to avoid potential confusion with and differentiate ourselves from the ethical controversies associated with human fetal tissue and engineered human tissue;
•
Our ability to educate healthcare providers, patients and payers on the safety and adverse reactions involving our products;
•
Our ability to meet supply and demand and develop a core group of medical professionals familiar with and committed to the use of our products; and
•
The cost-effectiveness of our products and the reimbursement policies of government and third-party payers.
If the medical community or patients do not accept the safety and effectiveness of our products, it could negatively affect our sales, which would have a material adverse impact on our business, financial condition and operations.
Our inability to complete our product development activities successfully would materially limit our ability to operate or finance our operations.
In order to obtain regulatory approval to commercialize future cell product candidates in the United States, we must conduct adequate and well-controlled clinical trials to demonstrate the safety and effectiveness in compliance with current regulatory requirements. We may not be able to successfully complete the development of future product candidates, or successfully market our technologies or future product candidates. We, and any of our potential collaborators, may encounter problems and delays relating to research and development, regulatory approval and intellectual property rights of our technologies and future product candidates. Our research and development programs may not be successful, and our cell culture technologies and future product candidates may not facilitate the production of cells outside the human body with the expected results. Our technologies and cell product candidates may not prove to be safe and effective in clinical trials, and we may not obtain the requisite regulatory approvals for our product candidates. If any of these events occur, our future prospects may be adversely impacted.
We must successfully complete our nonclinical and clinical development program to be able to demonstrate safety and efficacy to seek marketing approval of our future cell therapy product candidates. Lack of efficacy and or safety events can lead to the discontinuation of clinical development, and this can occur at any stage of the clinical development program. We may experience numerous unforeseen events during development that can delay or prevent commercialization of our future development candidates.
The results of early stage clinical trials do not ensure success in later clinical trials, and interim results are not necessarily predictive of final results. Data obtained from clinical activities are not always conclusive and may be susceptible of varying interpretations, which could delay, limit or prevent regulatory approval.
24
Our planned clinical trials may not begin or be completed on schedule, if at all. Typically, if a biological product is intended to treat a chronic disease, safety and efficacy data must be gathered over an extended period of time, which can range from six months to three years or more.
With respect to any clinical trials affecting our approved products or future development candidates, failures or delays can occur at any stage of the trials, and may be directly or indirectly caused by a variety of factors, including but not limited to:
|
•
|
Delays in securing clinical investigators or trial sites for our clinical trials and their subsequent performance in conducting accurate and reliable trials on a timely basis;
|
|
•
|
Delays in obtaining IRB and other regulatory approvals to commence a clinical trial;
|
|
•
|
Slower than anticipated rates of patient recruitment and enrollment in our clinical trials, or failing to reach the targeted number of patients due to competition for patients from other trials;
|
|
•
|
Limited or no availability of coverage, reimbursement and adequate payment from health maintenance organizations and other third party payers for the use of biological products supplied for use in our clinical trials;
|
|
•
|
Negative or inconclusive results from clinical trials;
|
|
•
|
Unforeseen adverse effects interrupting, delaying, or halting clinical trials of any future therapeutic product candidates, and possibly resulting in the FDA or other regulatory authorities denying approval of any future therapeutic product candidates;
|
|
•
|
Unforeseen safety issues;
|
|
•
|
Approval and introduction of new therapies or changes in standards of practice or regulatory requirements or guidance that render our clinical trial endpoints or the targeting of our proposed indications obsolete;
|
|
•
|
Inability to monitor patients adequately during or after treatment or problems with investigator or patient compliance with the trial protocols;
|
|
•
|
Inability to replicate in large controlled trials safety and efficacy data obtained from a limited number of patients in uncontrolled trials;
|
|
•
|
Inability or unwillingness of medical investigators to follow our clinical protocols; and
|
|
•
|
Unavailability of clinical trial supplies.
|
The FDA, the IRBs, and the sponsor monitor the progress of clinical trials and they may suspend or terminate a clinical trial at any time due to patient safety or other considerations. The FDA may impose a clinical hold on our trials because of safety concerns that have arisen for products or product candidates that are similar to our product candidates. Even when successful clinical results are reported for a product from a completed clinical trial, the durability of response may not be sustained over time, or may not be sufficient to support regulatory approval.
Our current product development activities include but are not limited to projects directed at expanding clinical indications, and decreasing the cost of manufacturing our products. These production process changes may alter the functionality of our cells and require various additional levels of experimental and clinical testing and evaluation. Any such testing could lengthen the time before these product enhancements would be commercially available.
Failure of third parties, including for example Matricel GmbH, to manufacture or supply certain components, equipment, disposable devices and other materials used in our MACI or Epicel cell manufacturing processes would impair our cell product development and commercialization.
We rely on third parties, including Matricel GmbH (Matricel) to manufacture and/or supply certain of our devices/manufacturing equipment and to manufacture and/or supply certain components, equipment, disposable devices and other materials used in our cell manufacturing process to manufacture our marketed cell therapy products and to develop our product candidates. In many instances these third parties serve as our sole suppliers. For example, Matricel is the sole supplier of the membrane for MACI. It would be difficult to obtain alternate sources of supply on a short-term basis. If any of our manufacturers or suppliers fails to perform its respective obligations, or if our supply of certain components, equipment, disposable devices and other materials is limited or interrupted, it could impair our ability to manufacture our products, which would delay our ability to market our commercial products or future product candidates or conduct clinical trials on a timely and cost-competitive basis, if at all.
Many of our suppliers are sole or single source suppliers. We do not have long term supply agreements with many of our third‑party sole or single source suppliers of certain components and other materials used in our cell manufacturing process to manufacture our marketed cell therapy products. We purchase our required supply on a purchase order basis, and at any time the third-party suppliers could stop supplying our orders. FDA approval of a new supplier may be required if these materials become unavailable from our current suppliers. Although there may be other suppliers that have equivalent materials that would be available to us, FDA approval of any alternate suppliers, if required, could take several months or a year or more to obtain, if able to be obtained at all. Any delay, interruption or cessation of production by our third party suppliers of important materials, or any delay
25
in qualifying new materials, if necessary, would prevent or delay our ability to manufacture products. In addition, a supplier’s variation in a raw material or testing, either unknown to us or incompatible with our manufacturing process, or any other problem with our materials, testing or components, would prevent or delay our ability to manufacture products. These delays may limit our ability to meet demand for our products, which would have a material adverse impact on our business, results of operations and financial condition.
We may be unable to establish any agreements with third party suppliers or to do so on acceptable terms. Even if we are able to establish agreements with third‑party suppliers, reliance on third‑party suppliers entails additional risks, including the possible breach of the supply agreement by the third party, and the possible termination or nonrenewal of the agreement by the third party at a time that is costly or inconvenient for us.
In addition, we may not be able to continue our present arrangements with our suppliers, supplement existing relationships, establish and maintain new relationships or be able to identify and obtain the ancillary materials that are necessary to develop our product candidates in the future. Our dependence upon third parties for the supply and manufacture of these items could adversely affect our ability to develop and deliver commercial and commercially feasible products on a timely and competitive basis.
Failure by our third-party manufacturers, including Matricel, to comply with the regulatory requirements set forth by the FDA with respect to our products could limit our ability to manufacture commercial products.
Third-party manufacturers, such as Matricel, are subject to inspection by the FDA for current Good Manufacturing Practice, or cGMP, compliance, as well as for their ability to manufacture the components, products or product candidates in compliance with the established process and procedure for the product or product candidate during an inspection. We may compete with other companies for access to these manufacturers’ facilities and may be subject to delays in manufacture if the manufacturers give other clients higher priority than they give to us. If we are unable to secure and maintain third-party manufacturing capacity, the development and sales of our products and product candidates, if approved, and our financial performance may be materially affected.
Manufacturers of FDA-regulated products are obligated to operate in accordance with FDA-mandated requirements. A failure of any of our third-party manufacturers to establish and follow cGMP requirements and to document their adherence to such practices may lead to significant delays in the availability of material for clinical trials, may delay or prevent filing or approval of marketing applications for our future product candidates, and may cause delays or interruptions in the availability of our products for commercial distribution. This could result in higher costs to us or deprive us of potential product revenues.
Complying with cGMP, ICH and other non-U.S. regulatory requirements will require that we expend time, money, and effort in production, recordkeeping, and quality control to assure that the product or product candidate meets applicable specifications and other requirements. We, or our contracted manufacturing facility, must also pass a pre-approval inspection by the FDA for future product candidates, and are subject to routine FDA cGMP inspections. Failure to address any FDA observations in a timely manner, pass pre-approval inspections or comply with cGMP requirements can result in delays to approvals for future product candidates and/or regulatory action that can limit the ability to manufacture commercial products. As a result, our business, financial condition, and results of operations may be materially harmed.
If we do not manage inventory in an effective and efficient manner, it could adversely affect our results of operations.
Many factors affect the efficient use and planning of inventory of certain components and other materials used in our cell manufacturing process to manufacture our marketed products, such as effectiveness of predicting demand, effectiveness of preparing manufacturing to meet demand, efficiently meeting product demand requirements and expiration of materials in inventory. We may be unable to manage our inventory efficiently, keep inventory within expected budget goals, keep inventory on hand or manage it efficiently, control expired inventory or keep sufficient inventory of materials to meet product demand due to our dependence on third party suppliers. Finally, we can provide no assurance that we can keep inventory costs within our target levels. Failure to do so may harm our long term growth prospects.
The manufacture of cell therapy products is characterized by inherent risks and challenges and has proven to be a costly endeavor relative to manufacturing other therapeutic products.
The manufacture of cell therapy products, such as our products and product candidates, is highly complex and is characterized by inherent risks and challenges such as biological raw material inconsistencies, logistical challenges, significant quality control and assurance requirements, manufacturing complexity, and significant manual processing. Unlike products that rely on chemicals for efficacy, such as most pharmaceuticals, cell therapy products are difficult to characterize due to the inherent variability of biological input materials. When manufacturing autologous cell therapies, the number and the composition of the cell population
26
varies from patient to patient, in part due to the age of the patient, since the therapy is dependent on patient-specific physiology. Such variability in the number and composition of these cells could adversely affect our ability to manufacture autologous cell therapies in a cost-effective manner and meet acceptable product release specifications for use in a clinical trial or, if approved, for commercial sale.
Difficulty in characterizing biological materials or their interactions creates greater risk in the manufacturing process. We attempt to mitigate risk associated with the manufacture of biologics by continuing to improve the characterization of all of our input materials, utilizing multiple vendors for supply of qualified biological materials, and manufacturing some of these materials ourselves. However, there can be no assurance that we will be able to maintain adequate sources of biological materials or that biological materials that we maintain in inventory will yield finished products that satisfy applicable product release criteria. Our inability to obtain necessary biological materials or to successfully manufacture cell therapy products that incorporate such materials could have a material adverse effect on our results of operations.
There can be no assurance that we or any third party contractors with whom we enter into strategic relationships will be successful in streamlining manufacturing operations and implementing efficient, low-cost manufacturing capabilities and processes that will enable us to meet the quality, price and production standards or production volumes to achieve profitability. Our failure to develop these manufacturing processes in a timely manner could prevent us from achieving our growth and profitability objectives as projected or at all.
We have limited manufacturing capacity and our commercial manufacturing operations in the U.S. depend on one facility. If the facility is destroyed or we experience any manufacturing difficulties, disruptions or delays, this could limit supply of our products or adversely affect our ability to conduct clinical trials and our business would be adversely impacted.
We presently conduct all of our commercial manufacturing operations in the U.S. at one facility located in Cambridge, Massachusetts. As a result, all of the commercial manufacturing of our marketed products, MACI and Epicel, for the U.S. market takes place at a single U.S. facility. If regulatory, manufacturing or other problems require us to discontinue production at the Cambridge facility, we will not be able to supply our products to our patients, which would adversely impact our business. If this facility or the equipment in it is significantly damaged or destroyed by fire, flood, power loss or similar events, we will not be able to quickly or inexpensively replace our manufacturing capacity or may not be able to replace our facility at all. In the event of a temporary or protracted loss of this facility or equipment, we might not be able to transfer manufacturing to a third party. Even if we could transfer manufacturing from one facility to a third party, the shift would likely be expensive and time-consuming, particularly since an alternative facility would need to comply with the applicable regulatory and quality standard requirements whereby validation and FDA approval would be required before any products manufactured at that facility could be made commercially available.
Furthermore, there are no current manufacturing activities at the Ann Arbor facility. It will take time and resources to reinstate manufacturing capabilities in the future. We may not be able to quickly or inexpensively replace our manufacturing capacity at our facility or a new facility for ixmyelocel-T.
While we do maintain insurance coverage against damage to our property and equipment, if we have underestimated our insurance needs, we will not have sufficient insurance to cover losses above and beyond the limits on our policies.
We may rely on third parties to conduct some of our clinical trials, and their failure to perform their obligations in a timely or competent manner may delay development and/or impact commercialization, if approved, of our current and future
product candidates.
We may use clinical research organizations (CROs) to assist in the conduct of our clinical trials. We may face delays outside of our control if these parties do not perform their obligations in a timely or competent fashion, or if we are forced to change service providers. Any third party that we hire to conduct clinical trials may also provide services to our competitors, which could compromise the performance of their obligations to us. If we experience significant delays in the progress of our clinical trials, the commercial prospects for our current and future product candidates could be harmed and our ability to generate product revenue would be delayed or prevented. In addition, we and any provider that we retain will be subject to GCP requirements. If GCP and other regulatory requirements are not adhered to by us or our third-party providers or clinical investigators, the conduct of the trial may be compromised and the development and commercialization of our current and future product candidates could be delayed or approval may never be obtained.
Any failure by a CRO, a clinical trial site, or clinical investigator, or us to successfully accomplish clinical trial monitoring, data collection, safety monitoring and data management other services in a timely manner and in compliance with regulatory requirements could have a material adverse effect on our ability to utilize the trial to obtain regulatory approval or complete clinical
27
development of our product candidates to support regulatory approval. Problems with the timeliness or quality of the work of a CRO or a clinical trial site or clinical investigator may lead us to seek to terminate the relationship and use an alternate provider. However, making such changes may be costly and may delay our trials, could affect regulatory approval and contractual restrictions may make such a change difficult or impossible. Additionally, it may be difficult to find a replacement organization that can conduct our trials in an acceptable manner and at an acceptable cost.
A cyber security incident could result in a loss of confidential data, give rise to remediation and other expenses, expose us to liability under HIPAA, consumer protection laws, or other common law theories, subject us to litigation and federal and state governmental inquiries, damage our reputation, and otherwise be disruptive to our business.
We collect and store sensitive information, including intellectual property and personally identifiable information, on our networks. The secure maintenance of this information is critical to our business operations. We have implemented multiple layers of security measures to protect this confidential data through technology, processes, and our people; we utilize current security technologies; and our defenses are monitored and routinely reviewed by internal and external parties. Despite these efforts, threats from malicious persons and groups, new vulnerabilities, and advanced new attacks against information systems create risk of cyber security incidents. There can be no assurance that we will not be subject to cyber security incidents that bypass our security measures, result in loss of personal health information or other data subject to privacy laws or disrupt our information systems or business. As a result, cyber security and the continued development and enhancement of our controls, processes and practices designed to protect our information systems from attack, damage or unauthorized access remain a priority for us. As cyber threats continue to evolve, we may be required to expend significant additional resources to continue to modify or enhance our protective measures or to investigate and remediate any cyber security vulnerabilities. The occurrence of any of these events could result in interruptions, delays, the loss, access, misappropriation, disclosure or corruption of data, liability under privacy, security and consumer protection laws or litigation under these or other laws, including common law theories, and subject us to federal and state governmental inquiries, any of which could have a material adverse effect on our financial position and results of operations and harm our business reputation.
We are subject to significant regulation with respect to the manufacturing of our products.
All of those involved in the preparation of a cellular therapy for commercial sale or clinical trials, including our existing supply contract manufacturers and clinical trial investigators, are subject to extensive and continuing government regulations by the FDA and comparable agencies in other jurisdictions. Components of a finished therapeutic product approved for commercial sale or used in late-stage clinical trials must be manufactured in accordance with cGMP. These regulations govern manufacturing processes and procedures and the implementation and operation of quality systems to control and assure the quality of investigational products and products approved for sale. Our facilities and quality systems and the facilities and quality systems of some or all of our third party contractors and suppliers are subject to pre-approval and routine FDA inspections for compliance with the applicable regulations as a condition of FDA approval of our products.
Our manufacturing facility in Cambridge, Massachusetts was inspected by the FDA in 2016 in connection with our commercialization of Carticel and for the pre-approval inspection for MACI. On May 27, 2016 and September 13, 2016, the FDA issued a Form 483 List of Inspectional Observations. A Form 483 is issued when, in an investigator’s judgment, the observed conditions or practices observed during an FDA inspection of the manufacturing facility indicate that an FDA-regulated product may be in violation of FDA’s requirements. We have completed or have planned remedial measures to improve our manufacturing process and have responded to all FDA observations and received FDA approval for MACI on December 13, 2016. Generally, if any FDA inspection or audit identifies a failure to comply with applicable regulations or if a violation of our product specifications or applicable regulation occurs independent of such an inspection or audit, we or the FDA may require remedial measures that may be costly and/or time consuming for us or a third party to implement and that may include the temporary or permanent suspension of a clinical trial or commercial sales, recalls, warning letters, market withdrawals, seizures or the temporary or permanent closure of a facility. Any such remedial measures imposed upon us or third parties with whom we contract could materially harm our business.
We could incur significant costs complying with environmental and health and safety requirements, or as a result of liability for contamination or other harm caused by hazardous materials that we use.
Our research and development and manufacturing processes involve the use of hazardous materials. We are subject to federal, state, local and foreign environmental requirements, including regulations governing the use, manufacture, handling, storage and disposal of hazardous materials, discharge to air and water, the cleanup of contamination and occupational health and safety matters. We cannot eliminate the risk of contamination or injury resulting from hazardous materials, and we may incur liability as a result of any contamination or injury. Under some environmental laws and regulations, we could also be held responsible for costs relating to any contamination at our past or present facilities and at third party waste disposal sites where we have sent wastes.
28
These could include costs relating to contamination that did not result from any violation of law, and in some circumstances, contamination that we did not cause. We may incur significant expenses in the future relating to any failure to comply with environmental laws. Any such future expenses or liability could have a significant negative impact on our financial condition. The enactment of stricter laws or regulations, the stricter interpretation of existing laws and regulations or the requirement to undertake the investigation or remediation of currently unknown environmental contamination at our own or third party sites may require us to make additional expenditures, which could be material.
In order to obtain marketing authorization of any of our current or future cell therapy product candidates in the United States, the FDA requires us to submit a BLA or marketing application, which is subject to the agency’s detailed review.
Cell therapy products require FDA review under an appropriate marketing application prior to commercialization. Future cell therapy candidates would be subject to FDA’s biological product requirements and would require submission of a BLA. The BLA is a request for permission to introduce, or deliver for introduction, a biologic product into interstate commerce in the U.S. and undergoes a detailed and rigorous review by the FDA. The review process includes pre-approval inspections of the manufacturing facility. Additionally, approval may rely on post-market commitments. These commitments may include costly activities, such as additional clinical trials, and failure to meet these commitments can result in negative actions by the FDA, such as withdrawal of the product from the market.
The BLA for MACI was submitted on January 4, 2016, and subsequently approved by the FDA on December 13, 2016. The Cambridge manufacturing facility was subject to a pre-approval inspection to demonstrate the capabilities to manufacture the product under cGMP requirements in compliance with the procedures provided in the BLA. The MACI regulatory approval in the U.S. is associated with a number of post-marketing commitments, including conducting a pediatric clinical study in the U.S. Conducting this study will require funding and resources.
Our business, financial condition, results of operation and cash flows could be significantly and negatively affected by substantial governmental regulations.
Our products are subject to rigorous regulation by the FDA and numerous other federal, state and foreign governmental authorities. Overall, there appears to be a trend toward more stringent regulation worldwide, and we do not anticipate this trend to dissipate in the near future.
In general, the development, testing, labeling, manufacturing and marketing of our products are subject to extensive regulation and review by numerous governmental authorities both in the United States and abroad. The regulatory process requires the expenditure of significant time, effort and expense to bring new products to market. For example, the FDA approved Epicel as a HUD pursuant to an HDE application. A HUD is a medical device intended to benefit patients in the treatment or diagnosis of a disease or condition that affects not more than 8,000 individuals in the United States per year. A HUD with an approved HDE is approved by the FDA for marketing. However, IRB approval is required before a HUD can be used at a facility, with the exception of emergency use. The HDE holder is responsible for ensuring that a HUD approved under an HDE is administered only in facilities having an IRB constituted and acting in accordance with the agency’s regulation governing IRBs, including continuing review of use of the device. HUDs are also subject to additional FDA requirements, such as adverse event reporting and the submission of updated information on a periodic basis to demonstrate that the HUD designation is still valid. Failure to meet FDA requirements pertaining to a HUD could result in the suspension or revocation of the HDE.
If the HDE is suspended or revoked, marketing approval for Epicel would require the submission and approval of a premarket approval application (PMA) in order to be made commercially available. The PMA process is costly, lengthy and uncertain. A PMA must be supported by extensive data, including, but not limited to, technical, preclinical, clinical trial, manufacturing and labeling data, to demonstrate to the FDA’s satisfaction the safety and efficacy of the device for its intended use. If the HDE approval for Epicel was withdrawn, and we were unable to obtain approval of a PMA, we could not market Epicel for sale in the U.S.
We are also required to implement and maintain stringent reporting, labeling and record keeping procedures. More specifically, in the United States, both before and after a product is commercially released, we have ongoing responsibilities under FDA regulations. Compliance with the FDA’s requirements, including the FDA’s cGMP recordkeeping regulations, labeling and promotional requirements and adverse event reporting regulations, is subject to continual review and is monitored rigorously through periodic inspections by the FDA and submission of annual reports. Our failure to comply with U.S. federal, state and foreign governmental regulations could lead to the issuance of warning letters or untitled letters, the imposition of injunctions, suspensions or loss of regulatory approvals, product recalls, and termination of distribution, product seizures or civil penalties. In the most extreme cases, criminal sanctions or closure of our manufacturing facility are possible.
29
In addition, the pharmaceutical, biologic and medical device industries also are subject to many complex laws and regulations governing Medicare and Medicaid reimbursement and targeting healthcare fraud and abuse, with these laws and regulations being subject to interpretation. In many instances, the industry does not have the benefit of significant regulatory or judicial interpretation of these laws and regulations. In certain public statements, governmental authorities have taken positions on issues for which little official interpretation was previously available. Some of these positions appear to be inconsistent with common practices within the industry but have not previously been challenged.
Various federal and state agencies have become increasingly vigilant in recent years in their investigation of various business practices, such as through the enforcement of the federal Anti-kickback Statute and the federal False Claims Act. Governmental and regulatory actions against us can result in various actions that could adversely impact our operations, including:
|
•
|
The recall or seizure of products;
|
|
•
|
The suspension or revocation of the authority necessary for the production or sale of a product;
|
|
•
|
The suspension of shipments from particular manufacturing facilities;
|
|
•
|
The imposition of fines and penalties;
|
|
•
|
The delay of our ability to introduce new products into the market;
|
|
•
|
Our exclusion or the exclusion of our products from being reimbursed by federal and state healthcare programs (such as Medicare, Medicaid, Veterans Administration, or VA, health programs and Civilian Health and Medical Program Uniformed Service, or CHAMPUS); and
|
|
•
|
Other civil or criminal prosecution or sanctions against us or our employees, such as fines, penalties or imprisonment.
|
Any of these actions, in combination or alone, or even a public announcement that we are being investigated for possible violations of these laws, could have a material adverse effect on our business, financial condition, results of operations and cash flows.
In the United States, if the FDA were to conclude that we are not in compliance with applicable laws or regulations or that any of our products are ineffective or pose an unreasonable health risk, the FDA could ban such products, detain or seize adulterated or misbranded products, order a recall, repair, replacement, or refund of payment of certain products, refuse to grant pending applications, refuse to provide certificates to foreign governments for exports, and/or require us to notify healthcare professionals and others that the products present unreasonable risks of substantial harm to the public health. The FDA may also impose operating restrictions on a companywide basis, enjoin and restrain certain violations of applicable law pertaining to our products and assess civil or criminal penalties against our officers, employees or us. The FDA may also recommend prosecution to the United States Department of Justice (DOJ). Adverse regulatory action, depending on its magnitude, may restrict us from effectively marketing and selling our products.
In many of the foreign countries in which our products may be marketed in the future, we will be subject to regulations affecting, among other things, clinical efficacy, product standards, packaging requirements, labeling requirements, import/export restrictions, tariff regulations, duties and tax requirements. Many of the regulations applicable to our products in these countries, such as the Medicinal Products Directive and the ATMP guidelines, governing products in the EU, are similar to those of the FDA. In addition, in many countries the national health or social security organizations may require our products to be qualified before they can be marketed with the benefit of reimbursement eligibility. Failure to receive or delays in the receipt of relevant foreign qualifications could also be detrimental to our future growth.
As both U.S. and foreign government regulators have become increasingly stringent, we may be subject to more rigorous regulation by governmental authorities in the future. Our products and our operations are also often subject to the rules of industrial standards bodies, such as the International Standards Organization, or ISO. If we fail to adequately address any of these regulations, our business will be harmed.
Changes to our products or future product candidates may require regulatory approvals.
Changes or modifications in the manufacturing process may require the submission of supplements to our BLAs, HDE application, and Investigational New Drug applications (INDs). These supplements require the generation of data to support the change, and review and approval by the FDA to obtain authorization for the change in the commercial product or in the investigational biological product before they can be implemented. Obtaining regulatory approvals for these changes may require the conduct of new studies and purchase of new equipment to justify the change. This can be costly and time consuming. Regulatory delays can adversely impact our ability to improve our products and to introduce new products in a timely manner. This can be detrimental to our future growth.
30
If we or our suppliers fail to comply with ongoing FDA or other foreign regulatory authority requirements, or if we experience unanticipated problems with our products, these products could be subject to restrictions or withdrawal from the market.
The manufacturing processes, reporting requirements, post-approval clinical data and promotional activities for each of our products is subject to continued regulatory reporting and periodic inspections by the FDA, as well as other domestic and foreign regulatory agencies. In particular, we and our suppliers are required to comply with cGMP and GTP regulations for the manufacture of our products and other regulations which include methods and documentation of production controls, labeling, packaging, storage and shipment of any product to name a few. Regulatory agencies, such as the FDA, enforce the cGMP, GTP and other regulations through periodic inspections and reporting. For example, the holder of an approved BLA or HDE is obligated to monitor and report adverse events, and product failures, including critical deviations and lack of efficacy. A BLA or HDE device holder must maintain regulatory compliance for all aspects of the applicable regulations or can be subject to regulatory action, including recall or withdrawal from the market.
Product manufacturers are subject to payment of annual prescription drug product program user fees and their facilities are subject to periodic inspections by the FDA and other regulatory agencies for compliance with cGMP and other applicable regulations. If at any time we or a regulatory agency discovers a previously unknown safety concern with a product, such as a serious adverse event of unanticipated severity or frequency that cannot be adequately managed and changes the risk-benefit profile of the product, or there are problems with the facility where the product is manufactured, a regulatory agency may impose restrictions relative to that product or the manufacturing facility, including suspension of manufacturing recall or withdrawal of the product from the market.
Advertising and promotional materials, including educational and website material, must comply with the FDA’s promotional and advertising regulations in addition to other potentially applicable federal and state laws, and such materials for biologics are subject to submission and review by the Center for Biologics Evaluation and Research.
The failure by us or one of our suppliers to comply with applicable legal statutes and regulations administered by the FDA and other regulatory agencies, or the failure to timely and adequately respond to any adverse inspectional or review observations, or product safety issues, could result in, among other things, any of the following enforcement actions:
|
•
|
Untitled letters, warning letters, fines, injunctions, consent decrees and civil penalties;
|
|
•
|
Unanticipated expenditures to address or defend such actions;
|
|
•
|
Client notifications for repair, replacement, or refunds of a device;
|
|
•
|
Recall, detention or seizure of our products;
|
|
•
|
Operating restrictions or partial suspension or total shutdown of production;
|
|
•
|
Denying, refusing or delaying our requests for approval of new products or proposed changes to existing products;
|
|
•
|
Operating restrictions;
|
|
•
|
Withdrawing product approvals that have already been granted;
|
|
•
|
Refusal to approve a pending marketing application, such as a BLA or supplements to a BLA submitted by us;
|
|
•
|
Refusal to grant export approval for our products; or
|
|
•
|
Criminal prosecution.
|
If any of these actions were to occur it would harm our reputation and cause our product sales and profitability to suffer, preventing us from generating revenue. Furthermore, our key suppliers may have compliance issues which could impact our ability to manufacture our products on a timely basis and in the required quantities.
Our marketed products may be used by physicians for indications that are not approved by the FDA. If the FDA finds that we marketed our products in a manner that promoted off-label use, we may be subject to civil or criminal penalties.
Under the FFDCA and other laws, we are prohibited from promoting our products for off-label uses. This means, for example, that we may not make claims about the use of any of our marketed products, including MACI or Epicel, outside of their approved labeling and indications. Therefore, our sales representatives may not proactively discuss or provide information on off-label uses. The FDA does not, however, restrict physicians from prescribing products for off-label uses in the practice of medicine. Should the FDA determine that our activities constitute the promotion of off-label uses, the FDA could bring an action to prevent us from distributing MACI or Epicel for the off-label use and could impose fines and penalties on us and our executives. In addition, failure to follow FDA rules and guidelines relating to promotion and advertising can result in, among other things, the FDA’s refusal to approve a product, the suspension or withdrawal of an approved product from the market, product recalls, fines, disgorgement of money, operating restrictions, injunctions or criminal prosecutions.
31
If the Office of Inspector General within the Department of Health and Human Services, the DOJ, or another federal or state agency determines that we have promoted off-label use of our products, we may be subject to various penalties, including civil or criminal penalties, and the off-label use of our products may result in injuries that lead to product liability suits, which could be costly to our business.
In addition to the FDA restrictions on our marketed products, several other types of state and federal healthcare laws have been applied by the DOJ and state attorneys general to restrict certain marketing practices in the pharmaceutical industry. While physicians may prescribe products for off-label uses and indications, if other federal or state regulatory authorities determine that we have engaged in off-label promotion through remuneration, kickbacks or other monetary benefits to prescribers, we may be subject to civil or criminal penalties and could be prohibited from participating in government healthcare programs such as Medicaid and Medicare. In addition, government agencies or departments could conclude that we have engaged in off-label promotion and, potentially, caused the submission of false claims. Even if we are successful in resolving such matters without incurring penalties, responding to investigations or prosecutions will likely result in substantial costs and could significantly and adversely impact our reputation and divert management’s attention and resources, which could have a material adverse effect on our business, operating results, financial condition and ability to finance our operations. In addition, the off-label use of our products may increase the risk of injury to patients, and, in turn, the risk of product liability claims. Product liability claims are expensive to defend and could divert our management’s attention and result in substantial damage awards against us.
The use of our products and future product candidates may expose us to product liability claims, and we may not be able to obtain adequate insurance. As a result, such claims could affect our earnings and financial condition.
We face an inherent business risk of exposure to product liability claims in the event that the manufacture and/or use of our products during clinical trials, or after commercialization, results in adverse events. Moreover, we derive the raw materials for our products from patients serving as their own donors, the production process is complex, and the handling requirements are specific, all of which increase the likelihood of quality failures and subsequent product liability claims. We may not be able to obtain or maintain product liability insurance on acceptable terms with adequate coverage or at all. If we are unable to obtain insurance, or if claims against us substantially exceed our coverage, then our business could be adversely impacted. Excessive insurance costs or uninsured claims would increase our operating loss and adversely affect our financial condition. Whether or not we are ultimately successful in any product liability litigation, such litigation could consume substantial amounts of our financial and managerial resources and could result in, among other things:
|
•
|
Significant awards against us;
|
|
•
|
Substantial litigation costs;
|
|
•
|
Recall of the product;
|
|
•
|
Injury to our reputation;
|
|
•
|
Withdrawal of clinical trial participants; or
|
|
•
|
Adverse regulatory action.
|
Any of these results could have a material adverse effect on our business, financial condition and results of operations.
The price and sale of any of our products may be limited by health insurance coverage and government regulation.
Maintaining and growing sales of our products will depend in large part on the availability of adequate coverage and the extent to which third-party payers, including health insurance companies, health maintenance organizations, and government health administration authorities such as the military, Medicare and Medicaid, private insurance plans and managed care programs will pay for the cost of the products and related treatment. Hospitals and other healthcare provider clients that purchase our products typically bill various third-party payers to cover all or a portion of the costs and fees associated with the procedures in which such products are used, sometimes including the cost of the purchase of these products. Third-party payers are also increasingly attempting to contain healthcare costs by demanding price discounts or rebates and limiting both coverage and the amounts that they will pay for certain products, and, as a result, they may not cover or continue to provide adequate payment for our products. We might need to conduct post-marketing studies in order to demonstrate the cost-effectiveness of our products and current and future product candidates to such payers’ satisfaction. Such studies might require us to commit a significant amount of management time and financial and other resources. Our products and future products might not ultimately be considered cost-effective. Adequate third-party reimbursement might not be available to enable us to maintain price levels sufficient to realize an appropriate return on investment in our products and future product development. If coverage and adequate reimbursement are not available, reimbursement is available only to limited levels, or if our costs of production increase faster than increases in reimbursement
32
levels, we may not be able to successfully grow the sales of our products or commercialize any current and future product candidates for which marketing approval is obtained.
In April 2017, we were notified of a contractual dispute between Vital Care and a third-party payer. The dispute was resolved in July 2017, and the initial negotiated reimbursement resulted in an estimated sales allowance of
$1.4 million
. As a result of the continuing evaluation and assessment of these expected payments, our estimates for expected payments could change.
Coverage decisions and payment amounts are established at the discretion of the individual third-party payer, and the regulations that govern pricing, coverage and reimbursement vary widely from country to country. Many private payers in the United States, however, use coverage decisions and payment amounts determined by the Centers for Medicare & Medicaid Services (CMS), as guidelines in setting their coverage and reimbursement policies. While certain procedures using our products are currently covered by Medicare and other third-party payers, future action by CMS or other government agencies, including the imposition of coverage and reimbursement limitations, may diminish payments to physicians, outpatient centers and/or hospitals for covered services. As a result, we cannot be certain that the procedures performed with our products will be reimbursed at a cost-effective level or reimbursed at all.
Furthermore, the healthcare industry in the United States has experienced a trend toward cost containment as government and private insurers seek to control healthcare costs by imposing lower payment rates and negotiating reduced contract rates with service providers. Increasingly, third-party payers have attempted to control costs by challenging the prices charged for medical products. Therefore, we cannot be certain that the procedures performed with our products will be reimbursed at a cost-effective level. Nor can we be certain that third-party payers using a methodology that sets amounts based on the type of procedure performed, such as those utilized in many privately managed care systems and by Medicare, will view the cost of our products to be justified so as to incorporate such costs into the overall cost of the procedure. Moreover, we are unable to predict what changes will be made to the reimbursement methodologies used by third-party payers in the future. We cannot be sure that reimbursement will be available for any product that we commercialize and, if reimbursement is available, the level of such reimbursement. Reimbursement may impact the demand for, or the price of, any product or product candidate for which we obtain marketing approval. If reimbursement is not available or is available only to limited levels, we may not be able to successfully commercialize any product or product candidate for which we obtain marketing approval.
We face intense competition in the markets targeted by our products. Many of our competitors have substantially greater resources than we do, and we expect that all of our products will face intense competition from existing or future products.
All of our products face intense competition from existing and future products marketed by large companies. These competitors may successfully market products that compete with our products, identify and bring to market new product candidates earlier than we do, or develop products that are more effective or less costly than our products. These competitive factors could require us to conduct substantial new research and development activities to establish new product targets, which would be costly and time consuming. These activities can adversely impact our ability to effectively commercialize products and achieve revenue and profits.
If we do not keep pace with our competitors and with technological and market changes, our products will become less attractive or obsolete and our business may suffer.
The markets for our products are highly competitive, subject to rapid technological changes, and vary for different product candidates and processes that directly compete with our products. Our competitors in the medical and biotechnology industries may have superior products, research and development, manufacturing, and marketing capabilities, financial resources or marketing positions. Furthermore, our competitors may have developed, or could in the future develop, new technologies that compete with our products or even render our products obsolete.
To the extent that others develop new technologies that address the targeted application for our products, our business will suffer. Finally, if we are unable to continue to develop and market new products and technologies in a timely manner, the demand for our products may decrease or our products could become obsolete, and our revenue may decline or our growth prospects may be adversely affected.
We may be subject to future product liability litigation which could be expensive and our insurance coverage may not be adequate.
Although we are not currently subject to any product liability proceedings and we have no reserves for product liability disbursements, we may incur material liabilities relating to product liability claims in the future, including product liability claims arising out of the usage of our products. Although we currently carry product liability insurance in an amount consistent with
33
industry practices, our insurance coverage and any reserves we may maintain in the future for product related liabilities may not be adequate and our business could suffer material adverse consequences.
Ethical, legal, social and other concerns surrounding the use of human tissue in synthetic biologically engineered products may negatively affect public perception of us or our products, or may result in increased scrutiny of our products and any future product candidates from a regulatory perspective, thereby reducing demand for our products, restricting our ability to market our products, or adversely affecting the market price for our common stock.
The commercial success of our products depends in part on general public acceptance of the use of human tissue for the treatment of human diseases and other conditions. While not as controversial as the use of embryonic stem cells and fetal tissue, the use of adult tissue has been the subject of substantial debate regarding related ethical, legal and social issues. We do not use embryonic stem cells or fetal tissue, but the public may not be able to, or may fail to, differentiate our autologous use of adult tissue from the use by others of embryonic stem cells or fetal tissue. This could result in a negative perception of our company or our products.
Future adverse events in the field of cellular based therapy or changes in public policy could also result in greater governmental regulation of our products and potential regulatory uncertainty or delay relating to any required testing or approval.
Restrictions on use of animal-derived materials could harm our product development and commercialization efforts.
Some of the manufacturing materials and/or components that we use in, and which are critical to, implementation of our technology involve the use of animal-derived products, including fetal bovine serum. Supplier changes or regulatory actions may limit or restrict the availability of such materials for clinical and commercial use for a variety of reasons including contamination or perceived risk of contamination with an adventitious agent, such as bovine spongiform encephalopathy, in one of our suppliers’ herds. This may lead to a restricted supply of the serum currently required for our product manufacturing processes. Any restrictions on these materials would impose a potential competitive disadvantage for our products or prevent our ability to manufacture our cell products. The FDA and other regulatory agencies have issued regulations for controls over bovine material in animal feed. These regulations do not appear to affect our ability to purchase the manufacturing materials we currently use. However, regulatory agencies may introduce new regulations that could affect our operations. Our inability to develop or obtain alternative compounds would harm our product development and commercialization efforts. There are certain limitations in the supply of certain animal-derived materials, which may lead to delays in our ability to complete clinical trials or eventually to meet the anticipated market demand for our cell products.
Health care reform measures and changes in policies, funding, staffing and leadership at the FDA and other agencies could hinder or prevent the commercial success of our products.
In the United States, there have been a number of legislative and regulatory changes to the healthcare system in ways that could affect our future results of operations and the future results of operations of our potential customers.
Furthermore, there have been and continue to be a number of initiatives at the federal and state levels that seek to reduce healthcare costs. In March 2010, President Obama signed into law the Patient Protection and Affordable Care Act of 2010, as amended by the Health Care and Education Reconciliation Act (jointly, the Affordable Care Act), which includes measures to significantly change the way health care is financed by both governmental and private insurers.
The future of the Affordable Care Act and its impact on the pharmaceutical industry and the healthcare system remains uncertain. Some of the provisions of the Affordable Care Act have yet to be fully implemented, while certain provisions have been subject to judicial and Congressional challenges. In January 2017, Congress voted to adopt a budget resolution for fiscal year 2017, that while not a law, is widely viewed as the first step toward the passage of legislation that would repeal certain aspects of the Affordable Care Act, and Congress has indicated that it will repeal and replace the Affordable Care Act. Further, on January 20, 2017, President Trump signed an Executive Order directing federal agencies with authorities and responsibilities under the Affordable Care Act to waive, defer, grant exemptions from, or delay the implementation of any provision of the Affordable Care Act that would impose a fiscal burden on states or a cost, fee, tax, penalty or regulatory burden on individuals, healthcare providers, health insurers, or manufacturers of pharmaceuticals or medical devices. Congress also could consider subsequent legislation to replace, modify or repeal elements of the Affordable Care Act.
While we cannot predict what impact on federal reimbursement policies this law or any replacement law will have in general or specifically on any product we may commercialize in the future, modifications to the Affordable Care Act or any replacement thereof may result in downward pressure on reimbursement, which could negatively affect market acceptance of new products. Any rebates, discounts, taxes costs or regulatory or systematic changes on healthcare resulting from the Affordable Care Act or its replacement may have a significant effect on our profitability in the future. We cannot
34
predict whether the Affordable Care Act will continue or what other laws or proposals will be made or adopted, or what impact these efforts may have on us.
Individual states have become increasingly aggressive in passing legislation and implementing regulations designed to control product pricing, including price or patient reimbursement constraints, discounts, restrictions on certain product access, and marketing cost disclosure and transparency measures, and designed to encourage importation from other countries and bulk purchasing. Legally-mandated price controls on payment amounts by third-party payers or other restrictions could harm our business, results of operations, financial condition and prospects.
Regional healthcare authorities and individual hospitals are increasingly using bidding procedures to determine what products and which suppliers will be included in their healthcare programs. This can reduce demand for our products or put pressure on our product pricing, which could negatively affect our business, results of operations, financial condition and prospects.
Given recent federal and state government initiatives directed at lowering the total cost of healthcare, the executive branch, Congress and state legislatures will likely continue to focus on healthcare reform and the reform of the Medicare and Medicaid programs. While we cannot predict the full outcome of any such government action or legislation, it may harm our ability to market our products and generate revenues.
Furthermore, regulatory authorities’ assessment of the data and results required to demonstrate safety and effectiveness can change over time and can be affected by many factors, such as the emergence of new information, including on other products, changing policies and agency funding, staffing and leadership. We cannot be sure whether future changes to the regulatory environment will be favorable or unfavorable to our business prospects.
Tissue-based products are regulated differently in different countries. These requirements may be costly and result in delay or otherwise preclude the distribution of our products in some foreign countries, any of which would adversely affect our ability to generate operating revenues.
Tissue based products are regulated differently in different countries. Many foreign jurisdictions have a different, and potentially more difficult, regulatory pathway for human tissue based products, which may prohibit the distribution of these products until the applicable regulatory agencies grant marketing approval, or licensure. The process of obtaining regulatory approval is lengthy, expensive and uncertain, and we may never seek such approvals, or if we do, we may never gain those approvals. Furthermore, any adverse events in our clinical trials could negatively impact our products and product candidates.
Competitor companies may be able to take advantage of additional FDA guidance and new expedited programs designed for cell therapies to develop and/or commercialize new products in a shorter time period than previously predicted or in certain cases without a BLA.
Recognizing the importance of the cell therapy field, Congress included several provisions related to regenerative medicine in the 21st Century Cures Act, signed into law on December 13, 2016. Building on the FDA’s existing expedited programs available to regenerative medicine products, one of these provisions established a new program to help foster the development and approval of these products: the RMAT designation.
On November 16, 2017, the FDA also announced a comprehensive policy framework for the development and oversight of regenerative medicine products, including novel cellular therapies. This framework completes a risk-based regulatory approach that further describes the appropriate pathway for products that contain tissue or cells including more clearly defining which products may be considered only minimally manipulated or for homologous use.
With these changes in guidance and expedited programs, competitors may be able to make sales in the U.S. with minimally manipulated or homologous use products without the necessity of a BLA. In addition, competitors may also be able to obtain accelerated approval of new cell therapy products through use of RMAT designation.
The current credit and financial market conditions may exacerbate certain risks affecting our business.
We rely upon third parties for certain aspects of our business, including collaboration partners, wholesale distributors, contract clinical trial providers, contract manufacturers and third-party suppliers. Because of the recent tightening of global credit and the volatility in the financial markets, there may be a delay or disruption in the performance or satisfaction of commitments to us by these third parties, which could adversely affect our business.
35
We are dependent on our key manufacturing, quality and other management personnel and the loss of any of these individuals could harm our business.
Our success depends in large part upon the efforts of our key management and manufacturing and quality staff. The loss of any of these individuals, or our inability to attract and retain highly qualified scientific and management personnel in a timely manner, could materially and adversely affect our business and our future prospects. In the future, we may need to seek additional manufacturing and quality staff members. There is a high demand for highly trained manufacturing and quality personnel in our industry. We face competition for such personnel from other companies, research and academic institutions and other entities. We do not know whether we will be able to attract, train and retain highly qualified manufacturing and quality personnel in the future, which could have a material adverse effect on our business, financial condition and results of operations. A loss of one or more of our key personnel could severely and negatively impact our operations. Our key personnel are employed “at-will,” and any of them may elect to pursue other opportunities at any time. We have no present intention of obtaining key man life insurance on any of our key management, manufacturing, quality or other personnel.
Risks Related to Intellectual Property
If we are unable to protect the confidentiality of our proprietary information and know-how related to these products, our competitive position would be impaired and our business, financial condition and results of operations could be adversely affected.
Some of our technology, including our knowledge regarding the processing of our products, is unpatented and is maintained by us as trade secrets. In an effort to protect these trade secrets, we require our employees, consultants, collaborators and advisors to execute confidentiality agreements upon the commencement of their relationships with us. These agreements require that all confidential information developed by the individual or made known to the individual by us during the course of the individual’s relationship with us be kept confidential and not disclosed to third parties. These agreements, however, may not provide us with adequate protection against improper use or disclosure of confidential information, and these agreements may be breached. A breach of confidentiality could affect our competitive position. In addition, in some situations, these agreements may conflict with, or be subject to, the rights of third parties with whom our employees, consultants, collaborators or advisors have previous employment or consulting relationships. Also, others may independently develop substantially equivalent proprietary information and techniques or otherwise gain access to our trade secrets.
Adequate remedies may not exist in the event of unauthorized use or disclosure of our confidential information. The disclosure of our trade secrets would impair our competitive position and could have a material adverse effect on our business, financial condition and results of operations.
We have no patent protection for Epicel.
We have no issued patents or pending patent applications relating to Epicel. While we attempt to protect our proprietary information as trade secrets through certain agreements with our employees, consultants, agents and other organizations to which we disclose our proprietary information, we cannot give any assurance that these agreements will provide effective protection for our proprietary information in the event of unauthorized use or disclosure of such information. If other cultured epidermal autografts are approved and marketed, we will be unable to prevent them from competing with Epicel in the marketplace. We expect that the presence of one or more competing products would reduce our market share and could negatively impact price levels and third party reimbursement for Epicel, any of which would materially affect our business.
Some of our issued patents relating to MACI have already expired and others may be insufficient to protect our business.
We have issued patents in the United States and in certain foreign countries that relate to the combinations of chondrocytes and collagen membranes used in MACI. However, some of these have expired. Other patent filings that include technology relevant to MACI (e.g., its production and/or use, and/or related compositions) include both granted patents outside the U.S., and pending applications both inside and outside the U.S.; these are expected to expire, absent any extensions between 2028 and 2033. Whether or not these patent filings are or will be issued patents, they may not be sufficient to protect our product revenue. We may be subject to increased competition and our opportunity to establish or maintain product revenue could be substantially reduced or eliminated if our patents fail to issue or expire, or are revoked.
The patents we own may not be of sufficient scope or strength to provide us with significant commercial protection or commercial advantage, and competitors may be able to design around our patents or develop products that provide outcomes that are similar
36
to ours without infringing on our intellectual property rights. In addition, we cannot be certain that any of our pending patent applications will be issued or that the scope of the claims in our pending patent applications will not be significantly narrowed or determined to be invalid.
If our patents and proprietary rights do not provide substantial protection, then our business and competitive position will suffer.
Our success depends in large part on our ability to develop or license intellectual property rights to protect our proprietary products and technologies. This involves complex legal, scientific, and factual questions and uncertainties. We rely upon patent, trade secret, copyright and contract laws to protect proprietary technology and trademark law to protect brand identities. However, we cannot assure you that any patent applications filed by, assigned to, or licensed to us will be granted, and that the scope of any of our issued or licensed patents will be sufficiently broad to offer meaningful protection. In addition, our issued patents or patents licensed to us could be successfully challenged, invalidated, held to be unenforceable, or circumvented so that our patent rights would not create an effective competitive barrier. We also cannot assure you that the inventors of the patents and applications that we own or license were the first to invent or the first to file on the inventions, or that a third party will not claim ownership in one of our patents or patent applications. We cannot assure you that a third party does not have or will not obtain patents that dominate the patents we own or license now or in the future.
Patent law relating to the scope of claims in the biotechnology field is evolving and our patent rights in this country and abroad are subject to this uncertainty. From time to time, the U.S. Supreme Court (Supreme Court), other federal courts, the U.S. Congress or the United States Patent and Trademark Office (USPTO) may change the standards of patentability and any such changes could have a negative impact on our business. There have been several cases involving “gene patents” and diagnostic claims that have been considered by the Supreme Court. For example, on March 20, 2012, the Supreme Court issued a decision in Mayo Collaborative v. Prometheus Laboratories (Prometheus) a case involving patent claims directed to optimizing the amount of drug administered to a specific patient. According to that decision, Prometheus’ claims failed to add enough inventive content to the underlying correlations to allow the processes they describe to qualify as patent-eligible processes that apply natural laws. On June 13, 2013, the Supreme Court issued a decision in the Myriad case. According to the decision, claims directed to genomic DNA cover unpatentable subject matter. However, claims directed to cDNA are patent eligible subject matter.
On December 10, 2014, the USPTO published the 2014 Interim Guidance on Patent Subject Matter Eligibility. On May 4, 2016, the USPTO issued a memorandum addressing “Formulating a Subject Matter Eligibility Rejection and Evaluating the Applicant’s Response to a Subject Matter Eligibility Rejection”. This memorandum provides guidance to patent examiners for examining claims reciting laws of nature/natural principles, natural phenomena, and/or natural products for patent eligibility in view of the Supreme Court decisions in Prometheus and Myriad. We cannot assure you that our patent portfolio or our efforts to seek patent protection for our technology and products will not be negatively impacted by the guidance issued by the USPTO, the decisions described above, rulings in other cases, or changes in guidance or procedures issued by the USPTO.
There can be no assurance that the Supreme Court’s decision in either the Myriad or Prometheus case will not have a negative impact on biotechnology patents generally or the ability of biotechnology companies to obtain or enforce their patents in the future. Such negative decisions by the Supreme Court could have a material adverse effect on our existing patent portfolio and our ability to protect and enforce our intellectual property in the future.
We also rely on trade secrets and un-patentable know-how that we seek to protect, in part, by confidentiality agreements with our employees, consultants, suppliers and licensees. These agreements may be breached, and we might not have adequate remedies for any breach. Our competitors may also independently develop technologies substantially equivalent or superior to ours. If this were to occur, our business and competitive position would suffer.
Obtaining and maintaining our patent protection depends on compliance with various procedural, document submissions, fee payment and other requirements imposed by governmental patent agencies, and our patent protection could be reduced or eliminated for non-compliance with these requirements.
Periodic maintenance fees on any issued patent are due to be paid to the USPTO and foreign patent agencies in several stages over the lifetime of the patent. The USPTO and various foreign governmental patent agencies require compliance with a number of procedural, documentary, fee payment and other similar provisions during the patent application process. While an inadvertent lapse can in many cases be cured by payment of a late fee or by other means in accordance with the applicable rules, there are situations in which noncompliance can result in abandonment or lapse of the patent or patent application, resulting in partial or complete loss of patent rights in the relevant jurisdiction. Non-compliance events that could result in abandonment or lapse of a patent or patent application include, but are not limited to, failure to respond to official actions within prescribed time limits, non-
37
payment of fees and failure to properly legalize and submit formal documents. If we fail to maintain the patents and patent applications covering our products or current and future product candidates, our competitive position would be adversely affected.
With respect to MACI and ixmyelocel-T, if we are unable to obtain and enforce patents and to protect our trade secrets, others could use our technology to compete with us, which could limit opportunities for us to generate revenues by licensing our technology and selling products.
Our success will depend in part on our ability to obtain and enforce patents and maintain trade secrets in the United States and in other countries. If we are unsuccessful in obtaining and enforcing patents, our competitors could use our technology and create products that compete with our products, without paying license fees or royalties to us.
The preparation, filing, and prosecution of patent applications can be costly and time consuming. Our limited financial resources may not permit us to pursue patent protection of all of our technology and products throughout the world.
Even if we are able to obtain issued patents covering our technology or products, we may have to incur substantial legal fees and other expenses to enforce our patent rights in order to protect our technology and products from infringing uses. We may not have the financial resources to finance the litigation required to preserve our patent and trade secret rights.
A successful challenge to our trademarks could force us to rebrand Epicel or MACI.
We rely on our trademarks to distinguish our products from the products of our competitors, and have registered or applied to register a number of these trademarks. Third parties may challenge our use of the trademarks. In the event that our trademarks are successfully challenged, we could be forced to rebrand our products, which could result in loss of brand recognition and could require us to devote resources to advertising and marketing these new brands.
Intellectual property litigation could harm our business. We may be subject to patent infringement claims that could be costly to defend, which may limit our ability to use disputed technologies, and which could prevent us from pursuing research and development or commercialization of some of our products, require us to pay licensing fees to have freedom to operate and/or result in monetary damages or other liability for us.
The success of our business will depend significantly on our ability to operate without infringing patents and other proprietary rights of others. Our cell processing system and cell compositions utilize a wide variety of technologies and we can give no assurance that we have identified or can identify all inventions and patents that may be infringed by development and manufacture of our cell compositions. If the technology that we use infringes a patent held by others, we could be sued for monetary damages by the patent holder or its licensee, or we could be prevented from continuing research, development, and commercialization of products that rely on that technology, unless we are able to obtain a license to use the patent. The cost and availability of a license to a patent cannot be predicted, and the likelihood of obtaining a license at an acceptable cost would be lower if the patent holder or any of its licensees is using the patent to develop or market a product with which any of our existing or future product candidates or our products would compete. If we could not obtain a necessary license, we would need to develop or obtain rights to alternative technologies, which could prove costly and could cause delays in product development, or we could be forced to discontinue the development or marketing of any products that were developed using the technology covered by the patent.
Although we have not been subject to any filed patent infringement claims, patents could exist or could be filed which would prohibit or limit our ability to market our products or maintain our competitive position. In the event of an intellectual property dispute, we may be forced to litigate. Such litigation is typically protracted and the results are unpredictable. Intellectual property litigation would divert management’s attention from developing our products and would force us to incur substantial costs regardless of whether we are successful. An adverse outcome could subject us to significant liabilities to third parties including treble damages and the opposing party’s attorney fees, and force us to pay significant license fees and royalties or cease the development and sale of our products and processes.
We have hired and expect to continue to hire individuals who have experience in cell culture and cell based therapeutics and may have confidential trade secret or proprietary information of third parties. We caution these individuals not to use or reveal this third-party information, but we cannot assure you that these individuals will not use or reveal this third-party information. Thus, we could be sued for misappropriation of proprietary information and trade secrets. Such claims are expensive to defend and could divert our attention and could result in substantial damage awards and injunctions that could have a material adverse effect on our business, financial condition or results of operations.
38
We may become involved in lawsuits to protect or enforce our intellectual property, which could be expensive, time consuming and unsuccessful and have a material adverse effect on the success of our business.
Competitors may infringe our patents or misappropriate or otherwise violate our intellectual property rights. To counter infringement or unauthorized use, litigation may be necessary in the future to enforce or defend our intellectual property rights, to protect our trade secrets or to determine the validity and scope of our own intellectual property rights or the proprietary rights of others. Also, third parties may initiate legal proceedings against us to challenge the validity or scope of intellectual property rights we own or control. These proceedings can be expensive and time consuming. Many of our current and potential competitors have the ability to dedicate substantially greater resources to defend their intellectual property rights than we can. Accordingly, despite our efforts, we may not be able to prevent third parties from infringing upon or misappropriating our intellectual property.
Litigation could result in substantial costs and diversion of management resources, which could harm our business and financial results. In addition, in an infringement proceeding, a court may decide that a patent owned by or licensed to us is invalid or unenforceable, or may refuse to stop the other party from using the technology at issue on the grounds that our patents do not cover the technology in question. An adverse result in any litigation proceeding could put one or more of our patents at risk of being invalidated, held unenforceable or interpreted narrowly.
Furthermore, because of the substantial amount of discovery required in connection with intellectual property litigation, there is a risk that some of our confidential information could be compromised by disclosure during this type of litigation. There could also be public announcements of the results of hearings, motions or other interim proceedings or developments. If securities analysts or investors perceive these results to be negative, it could have a material adverse effect on our business, financial condition or results of operations.
If we infringe the rights of third parties we could be prevented from selling products, forced to pay damages, and defend against litigation
.
If our products, methods, processes and other technologies infringe the proprietary rights of other parties, we could incur substantial costs and we may have to: obtain licenses, which may not be available on commercially reasonable terms, if at all; abandon an infringing product; redesign our products or processes to avoid infringement; stop using the subject matter claimed in the patents held by others; pay damages; and/or defend litigation or administrative proceedings which may be costly whether we win or lose, and which could result in a substantial diversion of our financial and management resources.
Intellectual property rights do not necessarily address all potential threats to our competitive advantage.
The degree of future protection afforded by our intellectual property rights is uncertain because intellectual property rights have limitations, and may not adequately protect our business, or permit us to maintain our competitive advantage. The following examples are illustrative:
|
•
|
Others may be able to make products that are the same as or similar to our products or product candidates, but that are not covered by the claims of the patents that we own or have exclusively licensed;
|
|
•
|
We or any strategic partners might not have been the first to make the inventions covered by the issued patents or pending patent applications that we own or have exclusively licensed;
|
|
•
|
We might not have been the first to file patent applications covering certain of our inventions;
|
|
•
|
Others may independently develop similar or alternative technologies or duplicate any of our technologies without infringing our intellectual property rights;
|
|
•
|
It is possible that our pending patent applications will not lead to issued patents;
|
|
•
|
Issued patents that we own or have exclusively licensed may not provide us with any competitive advantages, or may be held invalid or unenforceable as a result of legal challenges;
|
|
•
|
Our competitors might conduct research and development activities in the U.S. and other countries that provide a safe harbor from patent infringement claims for certain research and development activities, as well as in countries where we do not have patent rights and then use the information learned from such activities to develop competitive products for sale in our major commercial markets;
|
|
•
|
We may not develop additional proprietary technologies that are patentable; and
|
|
•
|
The patents of others may have an adverse effect on our business.
|
Others may challenge our patent or other intellectual property rights or sue us for infringement.
39
Risks Related to an Investment in our Common Stock
Our common stock price has been volatile and future sales of shares of common stock could have an adverse effect on the market price of such shares.
The market price of shares of our common stock has been volatile, ranging in closing price between $2.50 and $6.00 during the year ended December 31,
2017
. The price of our common stock may continue to fluctuate in response to a number of events and factors, such as:
|
•
|
Clinical trial results;
|
|
•
|
The amount of our cash resources and our ability to obtain additional funding;
|
|
•
|
Announcements of research activities, business developments, technological innovations or new products by us or our competitors;
|
|
•
|
Entering into or terminating strategic relationships;
|
|
•
|
Regulatory developments in both the United States and abroad;
|
|
•
|
Disputes concerning patents or proprietary rights;
|
|
•
|
Changes in our revenues or expense levels;
|
|
•
|
Changes in our pricing policies or the pricing policies of our competitors;
|
|
•
|
Seasonal or other variations in patient demand for MACI and Epicel;
|
|
•
|
Demand for and clinical acceptance of products;
|
|
•
|
The timing of sales of products and of the introduction of new products;
|
|
•
|
Public concern regarding the safety, efficacy or other aspects of the products or methodologies we are developing;
|
|
•
|
News or reports from other stem cell, cell therapy or regenerative medicine companies;
|
|
•
|
Reports by securities analysts;
|
|
•
|
Status of the investment markets;
|
|
•
|
Loss of key personnel;
|
|
•
|
Concerns related to management transitions; and
|
|
•
|
Delisting from the NASDAQ Capital Market.
|
Any of these events may cause the price of our shares to fall, which may adversely affect our business and financing opportunities. In addition, the stock market in general and the market prices for biotechnology companies in particular have experienced significant volatility recently that often has been unrelated to the operating performance or financial conditions of such companies. These broad market and industry fluctuations may adversely affect the trading price of our common stock, regardless of our operating performance or prospects.
Our failure to meet the continued listing requirements of The NASDAQ Capital Market could result in a de-listing of our common stock.
If we fail to satisfy the continued listing requirements of The NASDAQ Capital Market, such as the corporate governance requirements or the minimum closing bid price requirement, NASDAQ may take steps to de-list our common stock. Such a de-listing would likely have a negative effect on the price of our common stock and would impair your ability to sell or purchase our common stock when you wish to do so. In the event of a de-listing, we would take actions to restore our compliance with NASDAQ’s listing requirements, but we can provide no assurance that any such action taken by us would allow our common stock to become listed again, stabilize the market price or improve the liquidity of our common stock, prevent our common stock from dropping below the NASDAQ minimum bid price requirement or prevent future non-compliance with NASDAQ’s listing requirements.
The sale of our common stock through future equity offerings may cause dilution and could cause the price of our common stock to decline.
In the year ended
December 31, 2017
, we sold an aggregate gross amount of approximately
$7.2 million
(net of
$0.3 million
in commission and issuance costs) worth of shares of common stock pursuant to our ATM with Cowen. The ATM, which as of December 31,
2017
had remaining capacity of approximately
$16.7 million
allows us to sell our common stock from time to time under a registration statement on Form S-3 filed in June 2015, pursuant to which we registered $100.0 million of our securities for public sale.
Sales of our common stock offered through future equity offerings may result in substantial dilution to the interests of other holders of our common stock. The sale of a substantial number of shares of our common stock to investors, or anticipation of such sales, could make it more difficult for us to sell equity or equity-related securities in the future at a time and at a price that we might otherwise wish to effect sales.
40
We do not anticipate paying dividends on our common stock, and accordingly, shareholders must rely on stock appreciation for any return on their investment.
We have never declared or paid cash dividends on our common stock and do not expect to do so in the foreseeable future. The declaration of dividends is subject to the discretion of our board of directors and will depend on various factors, including our operating results, financial condition, future prospects and any other factors deemed relevant by our board of directors. You should not rely on an investment in our company if you require dividend income from your investment in our company. The success of your investment will likely depend entirely upon any future appreciation of the market price of our common stock, which is uncertain and unpredictable. There is no guarantee that our common stock will appreciate in value.
Our SVB-MidCap Facility contains restrictions that limit our flexibility in operating our business. We may be required to make a prepayment or repay the outstanding indebtedness earlier than we expect if a prepayment event or an event of default occurs, including a material adverse change with respect to us, which could have a materially adverse effect on our business
.
The SVB-MidCap Facility contains various covenants that limit our ability to engage in specified types of transactions. These covenants limit our ability to, among other things:
•
convey, sell, lease or otherwise dispose of certain parts of our business or property;
•
change the nature of our business;
•
enter into certain change in control or acquisition transactions;
•
incur or assume certain debt;
•
grant certain types of liens on our assets;
•
maintain certain collateral accounts;
•
pay dividends or make certain distributions to our stockholders;
•
make certain investments;
•
enter into material transactions with affiliates;
•
make or permit certain payments on subordinate debt; and
•
become an “investment company” as defined under the Investment Company Act of 1940, as
amended.
In addition, the SVB-MidCap Facility obliges us to comply with certain affirmative covenants, including the achievement of certain minimum revenue thresholds.
The restrictive and affirmative covenants of the SVB-MidCap Facility could cause us to be unable to pursue business opportunities that we or our stockholders may consider beneficial. For instance, as a result of the adjustment to our revenue reserve calculated in April 2017, we were not in compliance with the minimum monthly net revenue covenant. We entered into an amendment to the SVB-MidCap Facility to enable compliance with these covenants, but there is no guarantee we will be able to comply with these revised covenants going forward. The revenue covenants were updated in the third modification of the SVB-MidCap Facility in December 2017.
A breach of any of these covenants could result in an event of default under the SVB-MidCap Facility. An event of default will also occur if, among other things, a material adverse change in our business, operations or condition occurs, which could potentially include negative results in clinical trials, or a material impairment of the prospect of our repayment of any portion of the amounts we owe under the SVB-MidCap Facility occurs. In the case of a continuing event of default under the agreement, SVB and MidCap could elect to declare all amounts outstanding to be immediately due and payable, proceed against the collateral in which we granted SVB and MidCap a security interest under the SVB-MidCap Facility, or otherwise exercise the rights of a secured creditor. Amounts outstanding under the Loan and Security Agreement are secured by all of our existing and future assets, excluding intellectual property, which is subject to a negative pledge arrangement. In addition, the amount we have access to under the revolving line of credit that is part of the SVB-MidCap Facility is automatically adjusted based on certain factors, including the amount of eligible accounts receivable. In the event this amount is reduced after a drawdown, to an amount below what we have already borrowed, the difference may need to be repaid to comply with the agreement. If a significant reduction occurred in the future, we may need to repay additional amounts, which could have a material adverse effect on our business and cash flows.
Efforts to comply with securities laws and regulations require management resources, and we still may fail to comply.
As directed by Section 404 of the Sarbanes-Oxley Act of 2002, the SEC adopted rules requiring public companies to include a report of management on their internal controls over financial reporting in their annual reports on Form 10-K. The independent registered public accounting firm auditing our financial statements is required to attest to the effectiveness of our internal controls
41
over financial reporting. If, in any year, we are unable to conclude that we have effective internal controls over financial reporting or if our independent registered public accounting firm is required to, but is unable to provide us with a report as to the effectiveness of our internal controls over financial reporting, investors could lose confidence in the reliability of our financial statements, which could result in a decrease in the value of our securities.
Our corporate documents and Michigan law contain provisions that may make it more difficult for us to be acquired.
Our Board of Directors (Board) has the authority, without shareholder approval, to issue additional shares of preferred stock and to fix the rights, preferences, privileges and restrictions of these shares without any further vote or action by our shareholders. Michigan law contains a statute that makes it more difficult for a 10% shareholder, or its officers, to acquire a company. This authority, together with certain provisions of our charter documents, may have the effect of making it more difficult for a third party to acquire, or of discouraging a third-party from attempting to acquire, control of our company. This effect could occur even if our shareholders consider the change in control to be in their best interest. We have adopted a shareholder rights plan, the purpose of which is, among other things, to enhance our Board’s ability to protect shareholder interests and to ensure that shareholders receive fair treatment in the event any coercive takeover attempt of our company is made in the future. The shareholder rights plan could make it more difficult for a third party to acquire, or could discourage a third party from acquiring, our company or a large block of our company’s common stock.
42
Item 1B.
Unresolved Staff Comments
Not applicable.
Item 2.
Properties
We lease approximately 50,000 square feet in Cambridge, Massachusetts and 26,000 square feet in Ann Arbor, Michigan. The Cambridge lease expires in February 2022. The facilities include clean rooms, laboratories and office space. The Ann Arbor lease agreement expires in April 2018 and we are reducing the square footage in Ann Arbor to only office space required for certain shared services. We believe that our facilities are adequate to meet our current needs. Additional facilities may be required to support expansion for research and development activities or to assume manufacturing operations.
Item 3.
Legal Proceedings
We are currently not party to any material legal proceedings, although from time to time we may become involved in disputes in connection with the operation of our business.
Item 4.
Mine Safety Disclosures
Not applicable.
43
Item 5.
Market for Registrant’s Common Equity, Related Shareholder Matters and Issuer Purchase of Equity Securities
Our common stock is currently quoted on the NASDAQ Capital Market under the symbol “VCEL”. The following table sets forth the high and low closing prices per share of common stock as reported on the NASDAQ Stock Market.
Price Range of Common Stock
|
|
High
|
Low
|
||||||
|
Year ended December 31, 2016
|
|
|
|
|
||||
|
First Quarter
|
$
|
6.08
|
|
$
|
1.79
|
|
||
|
Second Quarter
|
6.03
|
|
2.07
|
|
||||
|
Third Quarter
|
2.95
|
|
2.09
|
|
||||
|
Fourth Quarter
|
4.10
|
|
2.05
|
|
||||
|
Year ended December 31, 2017
|
|
|
|
|
||||
|
First Quarter
|
$
|
3.10
|
|
$
|
2.50
|
|
||
|
Second Quarter
|
3.45
|
|
2.55
|
|
||||
|
Third Quarter
|
6.00
|
|
3.00
|
|
||||
|
Fourth Quarter
|
5.98
|
|
3.65
|
|
||||
As of February 28, 2018 there were approximately 200 holders of record of the common stock. We have never paid any cash dividends on our common stock and we do not anticipate paying such cash dividends in the foreseeable future. We currently anticipate that we will retain all future earnings, if any, for use in the development of our business.
Stock Performance Graph
The following graph shows the total stockholder return of an investment of $100 in cash on December 31, 2013 through December 31, 2017 for (i) our common stock, (ii) the NASDAQ Composite Index (U.S.) and (iii) the NASDAQ Biotechnology Index. Pursuant to applicable SEC rules, all values assume reinvestment of the full amount of all dividends, however, no dividends have been declared on our common stock to date. The stockholder return shown on the graph below is not necessarily indicative of future performance, and we do not make or endorse any predictions as to future stockholder returns.
Stock Price Comparison
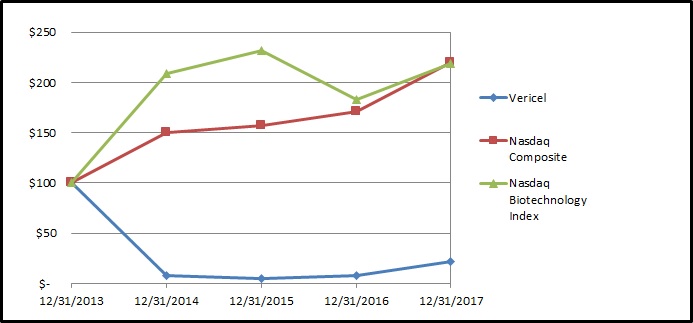
44
Equity Compensation Plan Information as of
December 31, 2017
The following table sets forth information as of
December 31, 2017
with respect to compensation plans (including individual compensation arrangements) under which equity securities are authorized for issuances:
|
|
Number of Securities
to be Issued upon Exercise
of Outstanding Options,
Warrants and Rights
|
Weighted Average
Exercise Price of
Outstanding
Options, Warrants
and Rights
|
Number of Securities
Remaining Available
for Future Issuance
Under Equity
Compensation Plans
(2)
|
|||||||
|
Equity compensation plans approved by security holders (employees and directors)
(1)
|
4,528,426
|
|
$
|
3.77
|
|
4,427,722
|
|
|||
|
Employee stock purchase plan
(1)
|
27,506
|
|
$
|
4.63
|
|
570,489
|
|
|||
(1)
The material features of these securities are described in note 7 of the Consolidated Financial Statements.
(2)
Shares issuable under the 2017 Omnibus Incentive Plan.
Recent Sales of Unregistered Securities
On December 18, 2015, we entered into a Securities Exchange Agreement with Stonepine Capital, LP (Stonepine), pursuant to which Stonepine exchanged an aggregate of 1,250,000 shares of our common stock for 1,250 shares of our Series A Convertible Preferred Stock (the Exchange). Upon the closing of the Exchange on December 23, 2015, we issued the Series A Convertible Preferred Stock to Stonepine without registration under the Securities Act in reliance on the example from registration contained in Section 3(a)(9) of the Securities Act. On November 22, 2016, Stonepine converted the 1,250 shares of Series A Convertible Preferred Stock for 1,250,000 shares of our Common Stock.
On December 21, 2017, Vericel received a payment comprised of an upfront license fee from Innovative Cellular Therapeutics CO., LTD. (ICT) discussed in note 15 and purchase of $4.0 million for a warrant for 818,424 shares of the Company’s common stock based on the closing price as of December 6, 2017 of $4.90 at an exercise price of $0.01 per share. On December 27, 2017, ICT exercised the warrant via a cashless exercise in exchange for 816,850 shares of the Company’s common stock. There were no warrants issued to ICT outstanding as of December 31, 2017.
Issuer Purchases of Equity Securities
There were no repurchases of shares of common stock made during the year ended
December 31, 2017
.
45
Item 6.
Selected Financial Data
The data for each of the five years in the period ended
December 31, 2017
are derived from our Consolidated Financial Statements. The selected historical financial data for the financial position of our Company as of
December 31, 2017
and
2016
and the results of their operations for each of the three years in the period ended
December 31, 2017
presented below should be read together with our consolidated financial statements and the notes to those statements and “Item 7 Management’s Discussion and Analysis of Financial Condition and Results of Operations,” included elsewhere in this Form 10-K.
|
|
Year Ended December 31,
|
|||||||||||||||||||
|
(In thousands, except per share amounts)
|
2017
|
2016
|
2015
|
2014
|
2013
|
|||||||||||||||
|
Product sales, net
|
$
|
62,760
|
|
$
|
54,383
|
|
$
|
51,168
|
|
$
|
28,796
|
|
$
|
19
|
|
|||||
|
Other
|
1,164
|
|
—
|
|
—
|
|
—
|
|
—
|
|
||||||||||
|
Total revenue
|
63,924
|
|
54,383
|
|
51,168
|
|
28,796
|
|
19
|
|
||||||||||
|
Cost of product sales
(a)
|
30,354
|
|
28,307
|
|
26,470
|
|
17,293
|
|
4
|
|
||||||||||
|
Gross profit
|
33,570
|
|
26,076
|
|
24,698
|
|
11,503
|
|
15
|
|
||||||||||
|
Research and development
|
12,944
|
|
15,295
|
|
18,890
|
|
21,263
|
|
15,104
|
|
||||||||||
|
Selling, general and administrative
|
35,610
|
|
27,388
|
|
22,479
|
|
13,774
|
|
5,875
|
|
||||||||||
|
Loss on impairment of intangible asset
(b)
|
—
|
|
2,638
|
|
—
|
|
—
|
|
—
|
|
||||||||||
|
Total operating expenses
|
48,554
|
|
45,321
|
|
41,369
|
|
35,037
|
|
20,979
|
|
||||||||||
|
Loss from operations
|
(14,984
|
)
|
(19,245
|
)
|
(16,671
|
)
|
(23,534
|
)
|
(20,964
|
)
|
||||||||||
|
Other income (expense):
|
|
|
|
|
|
|
|
|
||||||||||||
|
(Increase) decrease in fair value of warrants
(c)
|
(257
|
)
|
—
|
|
324
|
|
(27
|
)
|
5,337
|
|
||||||||||
|
Bargain purchase gain
(d)
|
—
|
|
—
|
|
—
|
|
3,473
|
|
—
|
|
||||||||||
|
Loss on extinguishment of debt
(e)
|
(860
|
)
|
—
|
|
—
|
|
—
|
|
—
|
|
||||||||||
|
Interest income
|
14
|
|
8
|
|
36
|
|
24
|
|
16
|
|
||||||||||
|
Other (expense) income
|
(92
|
)
|
(15
|
)
|
(20
|
)
|
150
|
|
—
|
|
||||||||||
|
Interest expense
|
(1,107
|
)
|
(314
|
)
|
(9
|
)
|
(6
|
)
|
(11
|
)
|
||||||||||
|
Total other (expense) income
|
(2,302
|
)
|
(321
|
)
|
331
|
|
3,614
|
|
5,342
|
|
||||||||||
|
Net loss
|
$
|
(17,286
|
)
|
$
|
(19,566
|
)
|
$
|
(16,340
|
)
|
$
|
(19,920
|
)
|
$
|
(15,622
|
)
|
|||||
|
Net loss per share attributable to common shareholders (Basic and Diluted)
|
$
|
(0.52
|
)
|
$
|
(1.18
|
)
|
$
|
(0.97
|
)
|
$
|
(2.23
|
)
|
$
|
(6.95
|
)
|
|||||
|
(a) Revenue from commercial operations began in June 2014 following the acquisition of the CTRM business. Prior to June 2014, we were a development stage entity which is an entity focused on early stage business activity including research and development and market research.
|
||||||||||||||||||||
|
(b) The loss on impairment of intangible asset in 2016 is related to write-off of the commercial use rights for certain products (primarily Carticel). Upon the approval of MACI in December 2016 and the replacement of Carticel with MACI, it was determined the Carticel related intangible asset was fully impaired as of December 31, 2016.
|
||||||||||||||||||||
|
(c) Fluctuations in the fair value of the warrants are due to the reduction in the time to maturity and changes in our stock price.
|
||||||||||||||||||||
|
(d) The bargain purchase gain is a result of the CTRM business acquisition.
|
||||||||||||||||||||
|
(e) In December 2017 we modified our debt arrangement which resulted in a loss incurred for fees expensed upon the extinguishment of the old debt and fees related to the new debt discussed in note 6.
|
||||||||||||||||||||
46
|
|
December 31,
|
|||||||||||||||||||
|
(In thousands)
|
2017
|
2016
|
2015
|
2014
|
2013
|
|||||||||||||||
|
Cash
|
$
|
26,862
|
|
$
|
22,978
|
|
$
|
14,581
|
|
$
|
30,343
|
|
$
|
8,059
|
|
|||||
|
Working capital
(a)
|
37,416
|
|
31,870
|
|
15,235
|
|
29,661
|
|
3,155
|
|
||||||||||
|
Property and equipment, net
|
4,071
|
|
3,875
|
|
4,049
|
|
2,892
|
|
739
|
|
||||||||||
|
Total assets
|
54,577
|
|
48,598
|
|
34,309
|
|
47,579
|
|
9,215
|
|
||||||||||
|
Total liabilities
|
32,037
|
|
23,890
|
|
12,179
|
|
11,938
|
|
5,321
|
|
||||||||||
|
Total shareholders' equity (deficit)
|
22,540
|
|
24,708
|
|
22,130
|
|
35,641
|
|
3,894
|
|
||||||||||
|
(a) We define working capital as current assets less current liabilities.
|
||||||||||||||||||||
47
Item 7.
Management’s Discussion and Analysis of Financial Condition and Results of Operations
Safe Harbor Statement under The Private Securities Litigation Reform Act of 1995
Our reports, filings and other public announcements contain certain statements that describe our management’s beliefs concerning future business conditions, plans and prospects, growth opportunities and the outlook for our business and the electric transmission industry based upon information currently available. Such statements are “forward-looking” statements within the meaning of the Private Securities Litigation Reform Act of 1995. Wherever possible, we have identified these forward-looking statements by words such as “will,” “may,” “anticipates,” “believes,” “intends,” “estimates,” “expects,” “projects” and similar phrases. These forward-looking statements are based upon assumptions our management believes are reasonable. Such forward-looking statements are subject to risks and uncertainties which could cause our actual results, performance and achievements to differ materially from those expressed in, or implied by, these statements, including, among others, the risks and uncertainties listed in this report under “Item 1A Risk Factors” and in our other reports filed with the SEC from time to time.
Because our forward-looking statements are based on estimates and assumptions that are subject to significant business, economic and competitive uncertainties, many of which are beyond our control or are subject to change, actual results could be materially different and any or all of our forward-looking statements may turn out to be wrong. Forward-looking statements speak only as of the date made and can be affected by assumptions we might make or by known or unknown risks and uncertainties. Many factors mentioned in our discussion in this report will be important in determining future results. Consequently, we cannot assure you that our expectations or forecasts expressed in such forward-looking statements will be achieved. Except as required by law, we undertake no obligation to publicly update any of our forward-looking or other statements, whether as a result of new information, future events, or otherwise.
Overview
Vericel Corporation is a leader in advanced cell therapies for the sports medicine and severe burn care markets, and a developer of patient-specific expanded cell therapies for use in the treatment of patients with severe diseases and conditions. We currently have two FDA marketed autologous cell therapy products in the United States. MACI
®
(autologous cultured chondrocytes on porcine collagen membrane) is an autologous cellularized scaffold product indicated for the repair of symptomatic, single or multiple full-thickness cartilage defects of the knee with or without bone involvement in adults that was approved by the FDA on December 13, 2016. The first shipment and implantation of MACI occurred on January 31, 2017. At the end of the second quarter of 2017, we removed MACI’s predecessor, Carticel
®
(autologous cultured chondrocytes), from the market. Carticel is an autologous chondrocyte implant indicated for the repair of symptomatic cartilage defects of the femoral condyle (medial, lateral or trochlea), caused by acute or repetitive trauma, in patients who have had an inadequate response to a prior arthroscopic or other surgical repair procedure (e.g., debridement, microfracture, drilling/abrasion arthroplasty, or osteochondral allograft/autograft). We also market Epicel
®
(cultured epidermal autografts), a permanent skin replacement HUD for the treatment of patients with deep-dermal or full-thickness burns comprising greater than or equal to 30 percent of TBSA.
Manufacturing
We have a cell-manufacturing facility in Cambridge, Massachusetts which is used for U.S. manufacturing and distribution of MACI and Epicel, and also was used for manufacturing of MACI for the SUMMIT study conducted for approval in Europe and the U.S. Throughout 2016 and early 2017, we also operated a centralized cell manufacturing facility in Ann Arbor, Michigan. The Ann Arbor facility previously supported the open label extension portion of the ixCELL-DCM clinical trial conducted in the United States and Canada.
Product Portfolio
Our approved and marketed products include two approved autologous cell therapy products: MACI, a third generation autologous implant for the repair of symptomatic, full-thickness cartilage defects of the knee in adult patients and Epicel (cultured epidermal autografts), a permanent skin replacement for full thickness burns in adults and pediatrics with greater than or equal to 30% of TBSA also currently marketed in the U.S. We also own Carticel (autologous cultured chondrocytes), a first-generation product for ACI which is no longer marketed in the U.S. Our product candidate portfolio included ixmyelocel-T, a patient-specific multicellular therapy for the treatment of advanced heart failure due to DCM. On September 29, 2017, the FDA indicated we would be required to conduct at least one additional phase 3 clinical study to support a BLA for ixmyelocel-T. Given the expense required to conduct further development and our focus on growing our existing commercial products and becoming profitable, at this time we have no current plans to initiate or fund a Phase 3 trial on our own, but instead are seeking a partner to fund further development.
48
Carticel and MACI
Carticel, a first-generation ACI product for the treatment and repair of cartilage defects in the knee, was the first FDA-approved autologous cartilage repair product. Carticel was replaced at the end of the second quarter of 2017 by MACI, which was approved on December 13, 2016 by the FDA. MACI is a third generation autologous implant for the repair of symptomatic, single or multiple full-thickness cartilage defects of the knee with or without bone involvement in adults. The first shipment and implantation of MACI occurred on January 31, 2017, and we stopped manufacturing and marketing Carticel at the end of the second quarter in 2017.
In the U.S., the physician target audience which repairs cartilage defects is very concentrated and is comprised of a group of physicians who self-identify as or have the formal specialty of sports medicine physicians. We believe this target audience is approximately 3,000 physicians. During 2017 we announced the expansion of our field force from 28 to 40 representatives, the vast majority of whom we anticipate to be employed and in the field by the beginning of the second quarter of 2018.
Most private payers have a medical policy that allows treatment with MACI. All of the top 20 payers for Carticel have a formal medical policy for MACI or ACI in general. For those private payers which have not yet approved a medical policy for MACI, for medically appropriate cases, we can often obtain approval on a case by case basis. In the year ended
December 31, 2017
, net revenues were
$43.9 million
for Carticel and MACI.
Epicel
Epicel is a permanent skin replacement for full thickness burns greater than or equal to 30% of TBSA. Epicel is regulated by the CBER under medical device authorities, and is the only FDA-approved autologous epidermal product available for large total surface area burns. Epicel was designated as a HUD in 1998 and an HDE application for the product was submitted in 1999. HUDs are devices that are intended for diseases or conditions that affect fewer than 8,000 individuals annually in the United States. Under an HDE approval, a HUD cannot be sold for an amount that exceeds the cost of research and development, fabrication and distribution unless certain conditions are met. In the year ended
December 31, 2017
, net revenues were
$18.9 million
for Epicel.
A HUD is eligible to be sold for profit after receiving HDE approval if the device meets certain eligibility criteria, including where the device is intended for the treatment of a disease or condition that occurs in pediatric patients and such device is labeled for use in pediatric patients. If the FDA determines that a HUD meets the eligibility criteria, the HUD is permitted to be sold for profit as long as the number of devices distributed in any calendar year does not exceed the ADN. The ADN is defined as the number of devices reasonably needed to treat a population of 8,000 individuals per year in the United States.
On February 18, 2016, the FDA approved our HDE supplement to revise the labeled indications of use to specifically include pediatric patients and to add pediatric labeling. The revised product label also now specifies that the probable benefit of Epicel, mainly related to survival, was demonstrated in two Epicel clinical experience databases and a physician-sponsored study comparing outcomes in patients with massive burns treated with Epicel relative to standard care. Due to the change in the label to specifically include use in pediatric patients, Epicel is no longer subject to the HDE profit restrictions. In conjunction with adding the pediatric labeling and meeting the pediatric eligibility criteria, the FDA has determined the ADN number for Epicel is 360,400 which is approximately 50 times larger than the volume of grafts sold in 2017. We currently have a 5-person field force.
Ixmyelocel-T
Our preapproval stage portfolio includes ixmyelocel-T, a unique patient-specific multicellular therapy derived from an adult patient’s own bone marrow which utilizes our proprietary, highly automated and scalable manufacturing system. The patient-specific multicellular therapy was developed for the treatment of advanced heart failure due to DCM.
Ixmyelocel-T has been granted a U.S. Orphan Drug designation by the FDA for the treatment of DCM. We completed enrolling and treating patients in our completed Phase 2b ixCELL-DCM study in February, 2015. Patients were followed for 12 months for the primary efficacy endpoint of major cardiac adverse events, or MACE. On March 10, 2016, we announced the trial had met its primary endpoint of reduction in clinical cardiac events and that the incidence of adverse events, including serious adverse events, in patients treated with ixmyelocel-T was comparable to patients in the placebo group. Patients were then followed for an additional 12 months for safety. Because the trial met the primary endpoint, patients who received placebo or were randomized to ixmyelocel-T in the double-blind portion of the trial but did not receive ixmyelocel-T have been offered the option to receive ixmyelocel-T. We successfully treated the last patients in February, 2017, and the last follow-up visit will occur approximately
49
one year later. In addition, we have conducted clinical studies for the treatment of critical limb ischemia, and an ixmyelocel-T investigator-initiated clinical study was conducted for the treatment of craniofacial reconstruction.
On September 29, 2017, the FDA indicated we would be required to conduct at least one additional phase 3 clinical study to support a BLA for ixmyelocel-T. Given the expense required to conduct further development and our focus on growing our existing commercial products and becoming profitable, at this time we have no current plans to initiate or fund a Phase 3 trial on our own but instead are seeking a partner to fund further development.
ICT License Agreement
On May 10, 2017, we announced that we had entered into a License Agreement (License Agreement) with ICT, a leading cell therapy company and developer of CAR-T cell therapy for cancer treatment, for the development and distribution of our product portfolio in Greater China, South Korea, Singapore, and other countries in Asia. As discussed in note 15, we received
$5.2 million
(gross of withholding tax), of which
$4.0 million
was allocated to the warrant based on the fair value on the date of grant as described in note 11 of the consolidated financial statements, and the remaining
$1.2 million
was allocated as consideration for the License Agreement. In accordance with multiple-element arrangement accounting, we allocated the payment among the multiple deliverables.
Results of Operations
Net Loss
Our net loss for the year ended
December 31, 2017
totaled
$17.3 million
which includes a loss on extinguishment of debt of
$0.9 million
. Our net loss for the year ended
December 31, 2016
totaled
$19.6 million
which includes a $2.6 million impairment of intangible asset charge related to the write-off of the commercial use rights primarily due to Carticel’s replacement with MACI. Our net loss for the year ended December 31,
2015
totaled
$16.3 million
.
|
|
Year Ended December 31,
|
|||||||||||
|
(In thousands)
|
2017
|
2016
|
2015
|
|||||||||
|
Net revenues
|
$
|
63,924
|
|
$
|
54,383
|
|
$
|
51,168
|
|
|||
|
Cost of product sales
|
30,354
|
|
28,307
|
|
26,470
|
|
||||||
|
Gross profit
|
33,570
|
|
26,076
|
|
24,698
|
|
||||||
|
Total operating expenses
|
48,554
|
|
45,321
|
|
41,369
|
|
||||||
|
Loss from operations
|
(14,984
|
)
|
(19,245
|
)
|
(16,671
|
)
|
||||||
|
Other (expense) income
|
(2,302
|
)
|
(321
|
)
|
331
|
|
||||||
|
Net loss
|
$
|
(17,286
|
)
|
$
|
(19,566
|
)
|
$
|
(16,340
|
)
|
|||
Net Revenues
Net revenues (comprised of gross revenue from sales net of provision for cash discounts) increased for the year ended
December 31, 2017
compared to
December 31, 2016
primarily due to an increase in cartilage implants as a result of the MACI launch and a significant increase in burn centers utilizing Epicel while also executing price increases. In addition, we recognized license revenue in connection with the granting of product licenses. See further details of the product license revenue in note 4 of the consolidated financial statements. Cash discounts for the years ended
December 31, 2015
and
2016
were $0.9 million and $0.5 million, respectively, and were not material in 2017.
Net revenues increased for the year ended
December 31, 2016
compared to
December 31, 2015
primarily due to higher average price we charged for Carticel in 2016 offset by the closure of Marrow Donation, LLC in 2015.
50
Net revenues for the years ended
December 31, 2017
,
2016
and
2015
are shown below.
|
|
Year Ended December 31,
|
|||||||||||
|
Net revenue by product (In thousands)
|
2017
|
2016
|
2015
|
|||||||||
|
Carticel and MACI
|
$
|
43,902
|
|
$
|
38,871
|
|
$
|
35,212
|
|
|||
|
Epicel
|
18,858
|
|
15,512
|
|
15,242
|
|
||||||
|
Bone Marrow
|
—
|
|
—
|
|
714
|
|
||||||
|
License Revenue
|
1,164
|
|
—
|
|
$
|
—
|
|
|||||
|
|
$
|
63,924
|
|
$
|
54,383
|
|
$
|
51,168
|
|
|||
Seasonality.
Over the last four years the percentage of total product revenue has on average been 21%, 25%, 21% and 33% from the first to the fourth quarters and is driven by the seasonality of both MACI and Epicel sales. MACI revenue is stronger in the second quarter and fourth quarter due to a number of factors including insurance copay limits and the time of year patients prefer to start rehabilitation. Epicel revenue is also subject to seasonal fluctuations mostly associated with the use of heating elements during the colder months, with stronger sales occurring in the winter months of the first and fourth quarters, and weaker sales occurring in the hot summer months of the third quarter. However, in any single year, this trend can be absent due to the extreme variability inherent with Epicel’s patient volume. The variability between the same quarters in consecutive years has been as high as 11% of the annual volume for Epicel.
Gross Profit and Gross Profit Ratio
|
Year Ended December 31,
|
||||||||||||
|
(In thousands)
|
2017
|
2016
|
2015
|
|||||||||
|
Gross profit
|
$
|
33,570
|
|
$
|
26,076
|
|
$
|
24,698
|
|
|||
|
Gross profit %
|
52.5
|
%
|
47.9
|
%
|
48.3
|
%
|
||||||
Gross profit increased for the year ended December 31, 2017 compared to 2016 due primarily to an increase in Carticel, MACI and Epicel sales combined with our highly fixed manufacturing cost structure described above. Gross profit remained consistent for the year ended December 31, 2016 compared to 2015.
Research and Development Costs
|
|
Year Ended December 31,
|
|||||||||||
|
(In thousands)
|
2017
|
2016
|
2015
|
|||||||||
|
Research and development costs
|
$
|
12,944
|
|
$
|
15,295
|
|
$
|
18,890
|
|
|||
The following table summarizes the approximate allocation of cost for our research and development projects:
|
|
Year Ended December 31,
|
|||||||||||
|
(In thousands)
|
2017
|
2016
|
2015
|
|||||||||
|
Dilated Cardiomyopathy
|
$
|
4,909
|
|
$
|
8,195
|
|
$
|
8,937
|
|
|||
|
MACI
|
5,390
|
|
2,811
|
|
5,497
|
|
||||||
|
Carticel
|
424
|
|
2,153
|
|
2,798
|
|
||||||
|
Epicel
|
2,221
|
|
2,136
|
|
1,658
|
|
||||||
|
Total research and development costs
|
$
|
12,944
|
|
$
|
15,295
|
|
$
|
18,890
|
|
|||
Research and development expenses for the year ended December 31,
2017
were
$12.9 million
compared to
$15.3 million
for the year ended
December 31, 2016
. The decrease was primarily related to a decrease in expenditures for ixmyelocel-T (ixCELL-DCM study) as a result of the decision to no longer pursue a Phase 3 trial, partially offset by an increase in MACI expenditures.
Research and development expenses for the year ended December 31,
2016
were
$15.3 million
compared to
$18.9 million
for the year ended
December 31, 2015
. The decrease was primarily due to lower expenses incurred for MACI. In 2015, $2.4 million
51
regulatory costs were incurred for the MACI BLA submission filing fee paid to the FDA, other regulatory consulting expenses related to the MACI BLA filing and expenses incurred for the HDE supplement submission to obtain an exemption from the profit prohibition and to revise the labeled indications for use of Epicel. In addition, development expenses related to the ixCELL-DCM study for dilated cardiomyopathy decreased due to a lower population of patients who had been originally assigned to the placebo group in the double blind portion of the trial receiving ixmyelocel-T in the open label extension portion of the trial compared to those who received the treatment in 2015. Carticel research and development expenses related to process development decreased as the Company focused on the introduction of MACI. These decreases were offset by an increase in Epicel related research and development.
Selling, General and Administrative Costs
|
|
Year Ended December 31,
|
|||||||||||
|
(In thousands)
|
2017
|
2016
|
2015
|
|||||||||
|
Selling, general and administrative costs
|
$
|
35,610
|
|
$
|
27,388
|
|
$
|
22,479
|
|
|||
|
Loss on impairment of intangible asset
|
—
|
|
2,638
|
|
—
|
|
||||||
Selling, general and administrative expenses for the years ended December 31,
2017
and
2016
increased to
$35.6 million
from
$27.4 million
, respectively. The increase in selling, general and administrative expenses in 2017 is due primarily to an incremental $3.6 million in employee related expenses driven mainly by the expanded MACI sales force, $3.0 million in additional marketing program expenses to support the MACI launch and $1.1 million increase in costs associated with our reimbursement and patient support services.
Selling, general and administrative expenses for the years ended December 31, 2016 and 2015 were
$27.4 million
and
$22.5 million
, respectively. The increase in selling, general and administrative expenses in 2016 is due primarily to an increase in start-up costs and reporting fees with our new reimbursement and patient support services for Carticel of $1.5 million. In addition, expenses increased due to an increase in shared facility fees of $0.8 million, technology infrastructure of $0.6 million, an increase in personnel costs of $0.5 million, professional services including legal fees of $0.3 million related to the preparation for the potential launch of MACI and an increase in bad debt expense of $0.2 million as a result of the transfer of collection risk to Vericel.
The loss on impairment of intangible asset is related to the write-off of the commercial use rights for certain products (primarily Carticel). Upon the approval of MACI in December 2016 and the replacement of Carticel with MACI, we determined the Carticel-related intangible asset was fully impaired as of December 31, 2016.
Other Income (Expense)
|
|
Year Ended December 31,
|
|||||||||||
|
(In thousands)
|
2017
|
2016
|
2015
|
|||||||||
|
(Increase) decrease in fair value of warrants
|
$
|
(257
|
)
|
$
|
—
|
|
$
|
324
|
|
|||
|
Loss on extinguishment of debt
|
(860
|
)
|
—
|
|
—
|
|
||||||
|
Foreign currency translation (loss)
|
—
|
|
—
|
|
—
|
|
||||||
|
Interest income
|
14
|
|
8
|
|
36
|
|
||||||
|
Other (expense) income
|
(92
|
)
|
(15
|
)
|
(20
|
)
|
||||||
|
Interest expense
|
(1,107
|
)
|
(314
|
)
|
(9
|
)
|
||||||
|
Total other (expense) income
|
$
|
(2,302
|
)
|
$
|
(321
|
)
|
$
|
331
|
|
|||
The change in other income and expense for the year ended December 31,
2017
compared to
2016
is due primarily to interest expense and the loss on extinguishment of debt related to our modification and expansion of our credit term facilities, and the change in warrant value as a result of the increase in our stock price. Fluctuations in the fair value of the warrants in future periods could result in significant non-cash adjustments to the condensed consolidated financial statements, however, any income or expense recorded will not impact our cash, operating expenses or cash flow.
The change in other income and expense for the year ended December 31, 2016 compared to 2015 is due primarily to interest expense related to the outstanding revolver and credit term loans.
52
Stock Compensation
Non-cash stock-based compensation expense included in cost of goods sold, research and development expenses and general, selling and administrative expenses is summarized in the following table:
|
|
Years Ended December 31,
|
|||||||||||
|
(in thousands)
|
2017
|
2016
|
2015
|
|||||||||
|
Cost of goods sold
|
$
|
428
|
|
$
|
427
|
|
$
|
308
|
|
|||
|
Research and development
|
506
|
|
497
|
|
555
|
|
||||||
|
General, selling and administrative
|
1,746
|
|
1,575
|
|
1,884
|
|
||||||
|
Total non-cash stock-based compensation expense
|
$
|
2,680
|
|
$
|
2,499
|
|
$
|
2,747
|
|
|||
The increase in stock-based compensation expense is due primarily to fluctuations in stock prices which impacts the fair value of the options awarded and the expense recognized in the period.
Liquidity and Capital Resources
We are currently focused on utilizing our technology to identify, develop and commercialize innovative therapies that enable the body to repair and regenerate damaged tissues and organs to restore normal structure and function. Since the acquisition in 2014 of the CTRM Business of Sanofi, the sales of Carticel, MACI and Epicel therapies have constituted nearly all of our product sales revenues. With the approval of MACI and replacement of Carticel with MACI, we expect the sales of MACI and Epicel therapies will constitute nearly all of our product sales revenues. Additionally, we are focusing significant resources to grow our commercial business.
We have raised significant funds in order to complete our product development programs, and complete clinical trials needed to market and commercialize our products. To date, we have financed our operations primarily through public and private sales of our equity securities, funds from the SVB-Mid-Cap Facility and funds from our at-the-market sales agreement (ATM Agreement) with Cowen. While we believe that, based on our current cash on hand, we are in a position to sustain operations through at least March 2019, if actual results differ from our projections, we may need to access additional capital.
On October 10, 2016 we entered into an ATM Agreement with Cowen as sales agent to sell, from time to time, our common stock, no par value per share (ATM Shares), having an aggregate sale price of up to $25.0 million, through an “at the market offering” program. The ATM Shares are issued pursuant to our shelf registration statement on Form S-3 (File No. 333-205336). We filed a prospectus supplement, dated October 10, 2016, with the Securities and Exchange Commission in connection with the offer and sale of the ATM Shares sold under the ATM Agreement. During the year ended December 31, 2017, we raised net proceeds of
$7.2 million
(net of
$0.3 million
in commission and issuance costs) and sold
1,983,023
shares of common stock. We are obliged to pay 3% of the gross proceeds to Cowen as a commission. As of
December 31, 2017
, approximately
$16.7 million
of net capacity remained under the ATM Agreement.
Our cash totaled
$26.9 million
at
December 31, 2017
. The primary uses of cash included
$13.2 million
for our operations and working capital requirements. This use of funds was attributed largely to our operating loss due to an increase in expenditures for sales and marketing initiatives and investment in research and development activities in 2017, reduced by noncash charges including
$2.7 million
in stock compensation expense and
$1.6 million
in depreciation and amortization expense. Working capital requirements increased due to
$1.4 million
in accounts payable primarily related to timing of payments and a
$1.2 million
increase in accounts receivable as a result in the increase of days sales outstanding related to the change in reimbursement and patient support service providers.
The change in cash used for investing activities is the result of property plant and equipment purchases of
$1.5 million
primarily for manufacturing upgrades and leasehold improvements through
December 31, 2017
.
The change in cash used for investing activities is the result of material property plan and equipment purchases of $1.4 million primary for purchases in connection with the integration of the CTRM business through
December 31, 2016
.
The change in cash provided from financing activities is the result of proceeds of $8.2 million from the issuance of common stock primarily due to sale of common shares under the at-the-market sales agreement and the exercise of stock options, net increase in debt of $6.4 million as a result of the modified debt agreement, and proceeds of $4.0 million upon the issuance of warrants in conjunction with a license agreement.
53
The change in cash provided from financing activities is the result of the December
2016
equity raise as well as ATM activity in
2016
, all of which did not occur in the year ended
December 31, 2015
.
On December 6, 2017, we replaced the existing term loan and revolving line of credit agreement with SVB and MidCap Financial Services, or MidCap, which provide access to up to $25.0 million. The updated debt financing consists of a $15.0 million term loan which was drawn at the closing and up to $10.0 million of a revolving line of credit. The term loans are interest only (indexed to Wall Street Journal (WSJ) Prime plus 4.25%) until December 1, 2018 followed by 36 equal monthly payments of principal plus interest maturing December 6, 2021. Per the initial terms of the agreement, the revolving credit is limited to a borrowing base calculated using eligible accounts receivable maturing December 6, 2021 with an interest rate indexed to WSJ Prime plus 1.25%. In connection with the SVB-MidCap facility, the Company must remain in compliance with minimum monthly net revenue covenants (determined in accordance with U.S. GAAP), measured on a trailing twelve month basis. The December 31, 2018 minimum revenue covenant is set at
$63.6 million
. SVB and MidCap also have the ability to call debt based on material adverse change clauses which are subjectively determinable and result in a
subjective acceleration clause. We do not believe any material adverse changes have occurred. While we believe the acceleration of the due date may be reasonably possible, it is not probable and therefore, the debt is classified in current and non-current liabilities. SVB and MidCap have a shared first priority perfected security interest in all of our assets other than intellectual property. As of
December 31, 2017
, there was an outstanding balance of
$15.0 million
under the term loan and
$2.5 million
under the revolving line of credit.
While we believe that, based on our current cash on hand, we are in a position to sustain operations through at least March 2019, if actual results differ from our projections or we pursue other strategic opportunities, we may need to access additional capital. In addition, if our revenues do not meet the existing threshold set forth in the debt covenants, and we are unable to renegotiate those thresholds, SVB could call the debt immediately. Such events could result in the need for additional funds. However, we may not be able to obtain financing on acceptable terms or at all. The terms of any financing may adversely affect the holdings or the rights of our shareholders. If we need additional funds and we are unable to obtain funding on a timely basis, we may need to significantly curtail our operations including our research and development programs in an effort to provide sufficient funds to continue our operations, which could adversely affect our business prospects. Actual cash requirements may differ from projections and will depend on many factors, including continued scientific progress in our research and development programs, the scope and results of clinical trials, the time and costs involved in obtaining regulatory approvals, the costs involved in filing, prosecuting and enforcing patents, competing technological and market developments, costs of possible acquisition or development of complementary business activities, the cost of product launch and market acceptance of those products and commercialization of newly approved products.
Contractual Obligations
We lease facilities in Ann Arbor, Michigan and Cambridge, Massachusetts. In March 2016, we amended our current lease in Cambridge to, among other provisions, extend the term until February 2022. Under the amendment, the landlord will contribute approximately $2.0 million toward the cost of tenant improvements. The
contribution toward the cost of tenant improvements is recorded as deferred rent on our consolidated balance sheet and is amortized to our consolidated statement of operations as reductions to rent expense over the lease term. Through
December 31, 2017
, we have recorded a tenant improvement of $
1.7 million
.
In addition to the property leases, we also lease an offsite warehouse, various vehicles and computer equipment.
See note 15 to the consolidated financial statements for further information.
Future minimum payments related to our operating, capital leases, contractual obligations including interest on outstanding term loans are as follows:
|
|
|
Payments Due by Period
|
||||||||||||||||||||||||||
|
Contractual Obligations
|
Total
|
2018
|
2019
|
2020
|
2021
|
2022
|
More than
5 Years |
|||||||||||||||||||||
|
Operating leases
|
$
|
19,336
|
|
$
|
4,878
|
|
$
|
4,564
|
|
$
|
4,575
|
|
$
|
4,558
|
|
$
|
761
|
|
$
|
—
|
|
|||||||
|
Purchase commitments
|
3,055
|
|
713
|
|
608
|
|
578
|
|
578
|
|
578
|
|
—
|
|
||||||||||||||
|
Capital leases
|
92
|
|
80
|
|
6
|
|
2
|
|
2
|
|
2
|
|
—
|
|
||||||||||||||
|
Debt and Interest
|
$
|
18,656
|
|
$
|
1,726
|
|
$
|
6,038
|
|
$
|
5,603
|
|
$
|
5,289
|
|
$
|
—
|
|
$
|
—
|
|
|||||||
|
Total
|
$
|
41,139
|
|
$
|
7,397
|
|
$
|
11,216
|
|
$
|
10,758
|
|
$
|
10,427
|
|
$
|
1,341
|
|
$
|
—
|
|
|||||||
54
Critical Accounting Estimates
The preparation of our consolidated financial statements in accordance with U.S. generally accepted accounting principles (GAAP) requires management to make estimates and assumptions that could materially impact the consolidated financial statements and disclosures based on varying assumptions. We believe our estimates and assumptions are reasonable; however, actual results and the timing of the recognition of such amounts could differ from these estimates.
The following is a list of accounting policies that are most significant to the portrayal of our financial condition and results of operations and/or that require management’s most difficult, subjective or complex judgments.
Revenue Recognition and Net Product Sales
— Revenue from sales to a customer (distributor, hospital or other party) is recognized in accordance with ASC 605,
Revenue Recognition
and SAB Topic 104,
R
eve
nue Recognition
(ASC 605), when (i) persuasive evidence of an arrangement exists, (ii) the goods are shipped or delivered and implanted, depending on shipping terms, (iii) title and risk of loss pass to the customer and (iv) collectability is reasonably assured. Shipping and handling costs are included as a component of revenue. Revenue from sales where the patient is the customer and a third party payer (insurance company, etc.) pays all or some of the product price on the patient's behalf are accounted for under ASC 954-605,
Health Care Entities - Revenue Recognition
(ASC 954).
Prior to July 1, 2016, the Company sold Carticel through a distributor and followed ASC 605,
Revenue Recognition
and SAB Topic 104
Revenue Recognition
to record revenue. This distributor purchased and took title to Carticel upon shipment of the product and assumed credit and collection risk related to the end customers. The distributor worked with the payers on behalf of patients and surgeons to ensure medical coverage and to obtain reimbursement for Carticel implantation procedures. Under this arrangement, the distributor is the Company's customer. The Company retained responsibility for shipment of the product to the surgical suite. Revenue was recorded for Carticel upon occurrence of the surgery, net of provisions for rebates and cash discounts. Such rebates and discounts were $0.5 million for the year ended December 31, 2016. There were no material rebates or cash discounts for year ended December 31, 2017. These rebates and prompt payment cash discounts were established by the Company at the time of sale, based on actual experience adjusted to reflect known changes in the factors that impact such reserves. Adjustments to these reserves had historically not been significant.
On June 30, 2016, the Company reduced the scope of the agreement with its exclusive distributor by terminating their services for a significant portion of its Carticel sales. On July 1, 2016, the Company transitioned to a direct sales model for Carticel and MACI after launch whereby the Company retained credit and collection risk from the patient as the end customer. The Company utilized a new provider, Dohmen Life Science Services, LLC (DLSS), to provide patient support services but this provider did not purchase and take title to Carticel or MACI. Under this arrangement, the patient is the Company's customer. On May 15, 2017, the Company and DLSS mutually terminated the agreement effective June 30, 2017. The Company also utilized Vital Care Inc. and its franchisees as a second provider to expand the available network of contracted third-party payers for Carticel and MACI. Under this direct sales model, the patient bears the ultimate financial responsibility for the purchase of Carticel or MACI and as such the Company recognized revenue in accordance with ASC 954-605,
Health Care Entities - Revenue Recognition
. The third party payer (insurance company, government, etc.) pays all or some of the product price on the patient’s behalf.
Under the direct sales model, the Company recognizes product revenues from sales of Carticel and MACI upon implantation at which time the claim is billable to patient’s insurance provider on behalf of the patient and is billed by either DLSS or Vital Care. The Company assumed counterparty risk for the third party reimbursement payment from the payer and from the patient co-pay. Prior authorization or confirmation of coverage level by the patient’s private insurance plan, hospital or government payer is a prerequisite to the shipment of product to a patient. The Company's net product revenues are calculated by estimating expected payments for insurance, hospital or patient payments at the time it invoices and recognizes revenue. To support this direct sales model, the Company utilized DLSS to provide administrative services associated with case management and reimbursement support and to provide billing and collection services. The Company utilized Vital Care to provide similar billing and collection services for a subset of insurance payers and patients.
In April 2017, the Company was notified of a contractual dispute between Vital Care and a third-party payer and as a result, during the three months ended March 31, 2017, the Company increased its estimated revenue allowances, reducing revenue by $2.1 million related to 2016 sales and $0.7 million related to 2017 sales to reflect the lower reimbursement that would be obtained if the claims were ultimately required to be treated as out-of-network. In July 2017, the dispute was resolved and the negotiated reimbursement resulted in the Company's ability to initially reduce its estimated sales allowances by $1.4 million which resulted in additional revenue in the second quarter of 2017 related to sales which originated primarily in 2016. As a result of the continuing evaluation and assessment of these expected payments, the Company's estimates for expected payments could change. Other than this adjustment the other adjustments recorded during 2017 related to our estimation under ASC 954-605, Health Care Entities - Revenue Recognition were not significant.
55
On May 15, 2017, the Company entered into a distribution agreement with Orsini Pharmaceutical Services, Inc. (Orsini) to appoint Orsini as a specialty pharmacy distributor of MACI to patients' physicians and other healthcare providers. The initial term of the distribution agreement will end on May 15, 2019 with the option of 2 additional two-year terms.
Stock-Based Compensation
— Our accounting for stock-based compensation requires us to determine the fair value of common stock issued in the form of stock option awards. We use the value of our common stock at the date of the grant in the calculation of the fair value of our share-based awards. The fair value of stock options held by our employees is determined using a Black-Scholes option valuation method, which is a valuation technique that is acceptable for share-based payment accounting. Key assumptions in determining fair value include volatility, risk-free interest rate, dividend yield and expected term. The assumptions used in calculating the fair value of stock options represent our best estimates, however; these estimates involve inherent uncertainties and the application of management judgment. As a result, if factors change and different assumptions are used, the stock-based compensation expense could be materially different in the future. In addition, we are required to estimate the expected forfeiture rate and only recognize expense for those stock options expected to vest over the service period. We estimate the forfeiture rate considering the historical experience of our stock-based awards. If the actual forfeiture rate is different from the estimate, we adjust the expense accordingly.
Warrants —
Warrants that could require cash settlement or have anti-dilution price protection provisions are recorded as liabilities at their estimated fair value at the date of issuance, with subsequent changes in estimated fair value recorded in other income (expense) in our statement of operations in each subsequent period. In general, warrants are measured using the Black-Scholes valuation model. The Black-Scholes model is based, in part, upon inputs for which there is little observable market data, requiring us to develop our own assumptions. Inherent in the model are assumptions related to expected stock-price volatility, expected life, risk-free interest rate and dividend yield. The assumptions used in calculating the estimated fair value of the warrants represent our best estimates; however, these estimates involve inherent uncertainties and the application of management judgment. As a result, if factors change and different assumptions are used, the warrant liability and the change in estimated fair value could be materially different.
Research and Development Expenses
–– Research and development costs, including internal and contract research costs, are expensed as incurred. Research and development expenses consist mainly of clinical trial costs, manufacturing of clinical material, process development costs, other preclinical studies, pharmacoeconomic research, grants to outside investigators including medical education and personnel costs.
Tax Valuation Allowance
— A valuation allowance is recorded if it is more likely than not that a deferred tax asset will not be realized. We provided a full valuation allowance on our deferred tax assets that primarily consist of cumulative federal net operating losses. Due to our three year cumulative loss position, history of operating losses and losses expected to be incurred in the foreseeable future, a full valuation allowance against our net deferred tax assets was considered necessary.
The summary of significant accounting policies should be read in conjunction with our consolidated financial statements and related notes and this discussion of our results of operations.
Off-Balance Sheet Arrangements
We have no off-balance sheet arrangements that have or are reasonably likely to have a material effect on our financial condition.
Recent Accounting Pronouncements
See note 3 to the consolidated financial statements.
Item 7A.
Quantitative and Qualitative Disclosures About Market Risk
As of
December 31, 2017
, we would not expect our operating results or cash flows to be affected to any significant degree by the effect of a sudden change in market interest rates or credit conditions on our securities portfolio.
We believe that the interest rate risk related to our accounts receivable is not significant. We manage the risk associated with these accounts through periodic reviews of the carrying value for non-collectability and establishment of appropriate allowances. We do not enter into hedging transactions and do not purchase derivative instruments.
56
We operate in the United States only. We are primarily exposed to foreign exchange risk with respect to recognized assets and liabilities due to vendors in countries outside the United States which are typically paid in Euro and/or Danish Krone. We do not enter into hedging transactions and do not purchase derivative instruments.
57
Item 8.
Financial Statements and Supplementary Data
|
|
Page
|
58
Report of Independent Registered Public Accounting Firm
To the Board of Directors and Shareholders of Vericel Corporation:
Opinions on the Financial Statements and Internal Control over Financial Reporting
We have audited the accompanying consolidated balance sheets of Vericel Corporation and its subsidiaries
as of December 31, 2017 and 2016,
and the related consolidated statements of operations, shareholders’ equity, comprehensive loss and cash flows for each of the three years in the period ended December 31, 2017, including the related notes (collectively referred to as the “consolidated financial statements”).
We also have audited the Company's internal control over financial reporting as of December 31, 2017, based on criteria established in
Internal Control - Integrated Framework
(2013) issued by the Committee of Sponsoring Organizations of the Treadway Commission (COSO).
In our opinion, the consolidated financial statements referred to above present fairly, in all material respects, the financial position of the Company as of December 31, 2017 and 2016
,
and the results of its operations and its cash flows for each of the three years in the period ended December 31, 2017
in conformity with accounting principles generally accepted in the United States of America. Also in our opinion, the Company maintained, in all material respects, effective internal control over financial reporting as of December 31, 2017, based on criteria established in
Internal Control - Integrated Framework
(2013) issued by the COSO.
Basis for Opinions
The Company's management is responsible for these consolidated financial statements, for maintaining effective internal control over financial reporting, and for its assessment of the effectiveness of internal control over financial reporting, included in Management’s Report on Internal Control over Financial Reporting under Item 9A. Our responsibility is to express opinions on the Company’s consolidated financial statements and on the Company's internal control over financial reporting based on our audits. We are a public accounting firm registered with the Public Company Accounting Oversight Board (United States) ("PCAOB") and are required to be independent with respect to the Company in accordance with the U.S. federal securities laws and the applicable rules and regulations of the Securities and Exchange Commission and the PCAOB.
We conducted our audits in accordance with the standards of the PCAOB. Those standards require that we plan and perform the audits to obtain reasonable assurance about whether the consolidated financial statements are free of material misstatement, whether due to error or fraud, and whether effective internal control over financial reporting was maintained in all material respects.
Our audits of the consolidated financial statements included performing procedures to assess the risks of material misstatement of the consolidated financial statements, whether due to error or fraud, and performing procedures that respond to those risks. Such procedures included examining, on a test basis, evidence regarding the amounts and disclosures in the consolidated financial statements. Our audits also included evaluating the accounting principles used and significant estimates made by management, as well as evaluating the overall presentation of the consolidated
financial statements. Our audit of internal control over financial reporting included obtaining an understanding of internal control over financial reporting, assessing the risk that a material weakness exists, and testing and evaluating the design and operating effectiveness of internal control based on the assessed risk. Our audits also included performing such other procedures as we considered necessary in the circumstances. We believe that our audits provide a reasonable basis for our opinions.
Emphasis of Matter
As discussed in Note 1 to the consolidated financial statements, the Company’s debt facility includes financial and nonfinancial covenants. If the Company is not in compliance with these covenants the debt may be called by the lender.
Definition and Limitations of Internal Control over Financial Reporting
A company’s internal control over financial reporting is a process designed to provide reasonable assurance regarding the reliability of financial reporting and the preparation of financial statements for external purposes in accordance with generally accepted accounting principles. A company’s internal control over financial reporting includes those policies and procedures that (i) pertain to the maintenance of records that, in reasonable detail, accurately and fairly reflect the transactions and dispositions of the assets of the company; (ii) provide reasonable assurance that transactions are recorded as necessary to
59
permit preparation of financial statements in accordance with generally accepted accounting principles, and that receipts and expenditures of the company are being made only in accordance with authorizations of management and directors of the company; and (iii) provide reasonable assurance regarding prevention or timely detection of unauthorized acquisition, use, or disposition of the company’s assets that could have a material effect on the financial statements.
Because of its inherent limitations, internal control over financial reporting may not prevent or detect misstatements. Also, projections of any evaluation of effectiveness to future periods are subject to the risk that controls may become inadequate because of changes in conditions, or that the degree of compliance with the policies or procedures may deteriorate.
/s/PricewaterhouseCoopers LLP
Boston, Massachusetts
March 5, 2018
We have served as the Company’s auditor since 1996, which is when the Company became subject to SEC reporting requirements. We have not determined the specific year we began serving as auditor of the Company.
60
VERICEL CORPORATION
(amounts in thousands)
|
|
December 31,
|
|||||||
|
|
2017
|
2016
|
||||||
|
ASSETS
|
|
|
|
|
||||
|
Current assets:
|
|
|
|
|
||||
|
Cash
|
$
|
26,862
|
|
$
|
22,978
|
|
||
|
Accounts receivable (net of allowance for doubtful accounts of $249 and $225, respectively)
|
18,270
|
|
17,093
|
|
||||
|
Inventory
|
3,793
|
|
3,488
|
|
||||
|
Other current assets
|
1,581
|
|
1,164
|
|
||||
|
Total current assets
|
50,506
|
|
44,723
|
|
||||
|
Property and equipment, net
|
4,071
|
|
3,875
|
|
||||
|
Total assets
|
$
|
54,577
|
|
$
|
48,598
|
|
||
|
LIABILITIES AND SHAREHOLDERS’ EQUITY
|
|
|
|
|
||||
|
Current liabilities:
|
|
|
|
|
||||
|
Accounts payable
|
$
|
5,552
|
|
$
|
6,535
|
|
||
|
Accrued expenses
|
5,573
|
|
4,523
|
|
||||
|
Short term deferred rent
|
420
|
|
3
|
|
||||
|
Warrant liabilities
|
1,014
|
|
757
|
|
||||
|
Current portion of term loan credit agreement (net of deferred costs of $67 and $110, respectively)
|
350
|
|
779
|
|
||||
|
Other
|
181
|
|
256
|
|
||||
|
Total current liabilities
|
13,090
|
|
12,853
|
|
||||
|
Revolving and term loan credit agreement (net of deferred costs of $196 and $293, respectively)
|
16,888
|
|
9,318
|
|
||||
|
Long term deferred rent
|
2,059
|
|
1,687
|
|
||||
|
Other long term debt
|
—
|
|
32
|
|
||||
|
Total liabilities
|
32,037
|
|
23,890
|
|
||||
|
COMMITMENTS AND CONTINGENCIES (Note 15)
|
|
|
|
|
||||
|
Shareholders’ equity:
|
|
|
|
|
||||
|
Series B-2 non-voting convertible preferred stock, no par value: shares authorized and reserved — 39; shares issued and outstanding — 0 and 12, respectively
|
—
|
|
38,389
|
|
||||
|
Common stock, no par value; shares authorized — 75,000; shares issued and outstanding — 35,861 and 31,595, respectively
|
383,020
|
|
329,720
|
|
||||
|
Warrants
|
397
|
|
190
|
|
||||
|
Accumulated deficit
|
(360,877
|
)
|
(343,591
|
)
|
||||
|
Total shareholders’ equity
|
22,540
|
|
24,708
|
|
||||
|
Total liabilities and shareholders’ equity
|
$
|
54,577
|
|
$
|
48,598
|
|
||
The accompanying Notes to Consolidated Financial Statements are an integral part of these statements.
61
VERICEL CORPORATION
(In thousands, except per share amounts)
|
|
Year Ended December 31,
|
|||||||||||
|
|
2017
|
2016
|
2015
|
|||||||||
|
Product sales, net
|
$
|
62,760
|
|
$
|
54,383
|
|
$
|
51,168
|
|
|||
|
Other
|
1,164
|
|
—
|
|
—
|
|
||||||
|
Total revenue
|
$
|
63,924
|
|
$
|
54,383
|
|
$
|
51,168
|
|
|||
|
Cost of product sales
|
30,354
|
|
28,307
|
|
26,470
|
|
||||||
|
Gross profit
|
33,570
|
|
26,076
|
|
24,698
|
|
||||||
|
Research and development
|
12,944
|
|
15,295
|
|
18,890
|
|
||||||
|
Selling, general and administrative
|
35,610
|
|
27,388
|
|
22,479
|
|
||||||
|
Loss on impairment of intangible asset
|
—
|
|
2,638
|
|
—
|
|
||||||
|
Total operating expenses
|
48,554
|
|
45,321
|
|
41,369
|
|
||||||
|
Loss from operations
|
(14,984
|
)
|
(19,245
|
)
|
(16,671
|
)
|
||||||
|
Other income (expense):
|
|
|
|
|
|
|
||||||
|
(Increase) decrease in fair value of warrants
|
(257
|
)
|
—
|
|
324
|
|
||||||
|
Loss on extinguishment of debt
|
(860
|
)
|
—
|
|
—
|
|
||||||
|
Interest income
|
14
|
|
8
|
|
36
|
|
||||||
|
Other (expense) income
|
(92
|
)
|
(15
|
)
|
(20
|
)
|
||||||
|
Interest expense
|
(1,107
|
)
|
(314
|
)
|
(9
|
)
|
||||||
|
Total other (expense) income
|
(2,302
|
)
|
(321
|
)
|
331
|
|
||||||
|
Net loss
|
$
|
(17,286
|
)
|
$
|
(19,566
|
)
|
$
|
(16,340
|
)
|
|||
|
Net loss per share attributable to common shareholders (Basic and Diluted)
|
$
|
(0.52
|
)
|
$
|
(1.18
|
)
|
$
|
(0.97
|
)
|
|||
|
Weighted average number of common shares outstanding (Basic and Diluted)
|
33,355
|
|
23,093
|
|
23,760
|
|
||||||
The accompanying Notes to Consolidated Financial Statements are an integral part of these statements.
62
VERICEL CORPORATION
CONSOLIDATED STATEMENTS OF SHAREHOLDERS’ EQUITY
(In thousands)
|
|
Preferred Stock
|
Common Stock
|
Treasury Stock
|
Warrants
|
Accumulated
Other Comprehensive |
Accumulated
|
Total
Shareholders’ |
||||||||||||||||||||||||||||||
|
|
Shares
|
Amount
|
Shares
|
Amount
|
Shares
|
Amount
|
Amount
|
Loss
|
Deficit
|
Equity
|
|||||||||||||||||||||||||||
|
BALANCE, DECEMBER 31, 2014
|
12
|
|
38,389
|
|
23,786
|
|
305,008
|
|
—
|
|
—
|
|
—
|
|
(71
|
)
|
(307,685
|
)
|
35,641
|
|
|||||||||||||||||
|
Net loss
|
|
|
|
|
|
|
|
|
|
|
|
|
(16,340
|
)
|
(16,340
|
)
|
|||||||||||||||||||||
|
Common stock exchanged for preferred stock and held in treasury shares
|
1
|
|
3,150
|
|
|
|
|
|
(1,250
|
)
|
(3,150
|
)
|
|
|
|
|
—
|
|
|||||||||||||||||||
|
Compensation expense related to stock options granted
|
|
|
|
|
|
|
2,747
|
|
|
|
|
|
2,747
|
|
|||||||||||||||||||||||
|
Stock option exercises
|
|
|
|
|
3
|
|
11
|
|
|
|
|
|
11
|
|
|||||||||||||||||||||||
|
Foreign currency translation adjustment
|
|
|
|
|
71
|
|
|
71
|
|
||||||||||||||||||||||||||||
|
BALANCE, DECEMBER 31, 2015
|
13
|
|
$
|
41,539
|
|
23,789
|
|
$
|
307,766
|
|
(1,250
|
)
|
$
|
(3,150
|
)
|
—
|
|
—
|
|
$
|
(324,025
|
)
|
$
|
22,130
|
|
||||||||||||
|
Net loss
|
(19,566
|
)
|
(19,566
|
)
|
|||||||||||||||||||||||||||||||||
|
Conversion of Series A preferred stock for common stock
|
(1
|
)
|
(3,150
|
)
|
|
|
|
|
1,250
|
|
3,150
|
|
—
|
|
|||||||||||||||||||||||
|
Compensation expense related to stock options granted, net of forfeitures
|
2,499
|
|
2,499
|
|
|||||||||||||||||||||||||||||||||
|
Issuance of common stock, net of issuance costs of $1,653
|
7,538
|
|
18,868
|
|
18,868
|
|
|||||||||||||||||||||||||||||||
|
Stock option exercises
|
39
|
|
120
|
|
120
|
|
|||||||||||||||||||||||||||||||
|
Shares issued under the Employee Stock Purchase Plan
|
229
|
|
467
|
|
467
|
|
|||||||||||||||||||||||||||||||
|
Issuance of warrants
|
|
|
190
|
|
190
|
|
|||||||||||||||||||||||||||||||
|
BALANCE, DECEMBER 31, 2016
|
12
|
|
$
|
38,389
|
|
31,595
|
|
$
|
329,720
|
|
—
|
|
$
|
—
|
|
$
|
190
|
|
$
|
—
|
|
$
|
(343,591
|
)
|
$
|
24,708
|
|
||||||||||
|
Net loss
|
(17,286
|
)
|
(17,286
|
)
|
|||||||||||||||||||||||||||||||||
|
Conversion of Series B-1 or B-2 preferred stock for common stock (Note 9)
|
(12
|
)
|
(38,389
|
)
|
1,094
|
|
38,389
|
|
|
|
|
|
—
|
|
|||||||||||||||||||||||
|
Compensation expense related to stock options granted, net of forfeitures
|
2,680
|
|
2,680
|
|
|||||||||||||||||||||||||||||||||
|
Issuance of common stock, net of issuance costs of $311
|
1,983
|
|
7,188
|
|
7,188
|
|
|||||||||||||||||||||||||||||||
|
Stock option exercises
|
199
|
|
608
|
|
608
|
|
|||||||||||||||||||||||||||||||
|
Shares issued under the Employee Stock Purchase Plan
|
173
|
|
425
|
|
425
|
|
|||||||||||||||||||||||||||||||
|
Issuance of warrants (Note 11)
|
|
|
207
|
|
207
|
|
|||||||||||||||||||||||||||||||
|
Exercise of warrants resulting in the issuance of common stock (Note 11)
|
817
|
|
4,010
|
|
4,010
|
|
|||||||||||||||||||||||||||||||
|
BALANCE, DECEMBER 31, 2017
|
—
|
|
|
$
|
—
|
|
|
35,861
|
|
|
$
|
383,020
|
|
|
—
|
|
|
$
|
—
|
|
|
$
|
397
|
|
$
|
—
|
|
|
$
|
(360,877
|
)
|
|
$
|
22,540
|
|
||
The accompanying Notes to Consolidated Financial Statements are an integral part of these statements.
63
VERICEL CORPORATION
CONSOLIDATED STATEMENTS OF COMPREHENSIVE LOSS
(In thousands
)
|
|
Year Ended December 31,
|
|||||||||||
|
|
2017
|
2016
|
2015
|
|||||||||
|
Net loss
|
$
|
(17,286
|
)
|
$
|
(19,566
|
)
|
$
|
(16,340
|
)
|
|||
|
Foreign currency translation
|
—
|
|
—
|
|
71
|
|
||||||
|
Comprehensive loss
|
$
|
(17,286
|
)
|
$
|
(19,566
|
)
|
$
|
(16,269
|
)
|
|||
The accompanying Notes to Consolidated Financial Statements are an integral part of these statements.
64
VERICEL CORPORATION
(In thousands)
|
|
Year Ended December 31,
|
|||||||||||
|
|
2017
|
2016
|
2015
|
|||||||||
|
Operating activities:
|
|
|
|
|
|
|
||||||
|
Net loss
|
$
|
(17,286
|
)
|
$
|
(19,566
|
)
|
$
|
(16,340
|
)
|
|||
|
Adjustments to reconcile net loss to net cash used for operating activities:
|
|
|
|
|
|
|
||||||
|
Depreciation and amortization
|
1,612
|
|
1,886
|
|
1,592
|
|
||||||
|
Impairment of intangible asset
|
—
|
|
2,638
|
|
—
|
|
||||||
|
Stock compensation expense
|
2,680
|
|
2,499
|
|
2,747
|
|
||||||
|
Inventory provision
|
352
|
|
137
|
|
627
|
|
||||||
|
Change in fair value of warrants
|
257
|
|
—
|
|
(324
|
)
|
||||||
|
Loss on extinguishment of debt
|
860
|
|
—
|
|
—
|
|
||||||
|
Foreign currency translation loss
|
37
|
|
5
|
|
67
|
|
||||||
|
Gain on sale of fixed assets
|
(115
|
)
|
—
|
|
(35
|
)
|
||||||
|
Deferred rent expense
|
(13
|
)
|
670
|
|
—
|
|
||||||
|
Write down of asset retirement obligation
|
—
|
|
—
|
|
(268
|
)
|
||||||
|
Changes in operating assets and liabilities:
|
|
|
|
|
|
|
||||||
|
Inventory
|
(657
|
)
|
(2,245
|
)
|
(86
|
)
|
||||||
|
Deferred Rent
|
798
|
|
898
|
|
—
|
|
||||||
|
Accounts receivable
|
(1,177
|
)
|
(6,174
|
)
|
(2,728
|
)
|
||||||
|
Other current assets
|
(261
|
)
|
(701
|
)
|
572
|
|
||||||
|
Accounts payable
|
(1,361
|
)
|
(1,076
|
)
|
1,726
|
|
||||||
|
Accrued expenses
|
1,050
|
|
920
|
|
(764
|
)
|
||||||
|
Other non-current assets and liabilities, net
|
41
|
|
217
|
|
(132
|
)
|
||||||
|
Net cash used for operating activities
|
(13,183
|
)
|
(19,892
|
)
|
(13,346
|
)
|
||||||
|
Investing activities:
|
|
|
|
|
|
|
||||||
|
Expenditures for property, plant and equipment
|
(1,510
|
)
|
(1,415
|
)
|
(2,427
|
)
|
||||||
|
Other
|
—
|
|
—
|
|
35
|
|
||||||
|
Net cash used for investing activities
|
(1,510
|
)
|
(1,415
|
)
|
(2,392
|
)
|
||||||
|
Financing activities:
|
|
|
|
|
|
|
||||||
|
Net proceeds from issuance of common stock
|
8,220
|
|
19,455
|
|
11
|
|
||||||
|
Deferred financing costs
|
(30
|
)
|
(213
|
)
|
—
|
|
||||||
|
Proceeds from exercise of warrants (Note 11)
|
4,010
|
|
—
|
|
—
|
|
||||||
|
Borrowings under revolving and term loan credit agreements
|
14,793
|
|
12,710
|
|
—
|
|
||||||
|
Warrants issued in connection with debt arrangement
|
207
|
|
190
|
|
—
|
|
||||||
|
Payments on term loan credit agreement
|
(889
|
)
|
(2,400
|
)
|
—
|
|
||||||
|
Payments on long-term debt
|
(7,151
|
)
|
(38
|
)
|
(35
|
)
|
||||||
|
Fee on long-term debt
|
(583
|
)
|
—
|
|
—
|
|
||||||
|
Net cash provided by (used in) financing activities
|
18,577
|
|
29,704
|
|
(24
|
)
|
||||||
|
Net increase (decrease) in cash
|
3,884
|
|
8,397
|
|
(15,762
|
)
|
||||||
|
Cash at beginning of period
|
22,978
|
|
14,581
|
|
30,343
|
|
||||||
|
Cash at end of period
|
$
|
26,862
|
|
$
|
22,978
|
|
$
|
14,581
|
|
|||
|
Supplemental cash flow information (non-cash):
|
|
|
|
|
|
|
||||||
|
Shares exchanged between common and preferred stock
|
(38,389
|
)
|
(3,150
|
)
|
3,150
|
|
||||||
|
Additions to equipment in process included in accounts payable
|
341
|
|
18
|
|
42
|
|
||||||
The accompanying Notes to Consolidated Financial Statements are an integral part of these statements.
65
VERICEL CORPORATION
NOTES TO CONSOLIDATED FINANCIAL STATEMENTS
1.
Organization
Vericel Corporation, a Michigan corporation (the Company, Vericel, we, us or our), was incorporated in March 1989 and began employee-based operations in 1991. On May 30, 2014, Vericel completed the acquisition of certain assets and assumed certain liabilities of Sanofi, a French
société anonyme
(Sanofi), including all of the outstanding equity interests of Genzyme Biosurgery ApS (Genzyme Denmark or the Danish subsidiary) (now known as Vericel Denmark ApS), a wholly-owned subsidiary of Sanofi, and a portfolio of patents and patent applications of Sanofi and certain of its subsidiaries for purposes of acquiring the portion of the cell therapy and regenerative medicine business (the CTRM Business), which researches, develops, manufactures, markets and sells the MACI
®
and Epicel
®
products. The Company is a fully integrated, commercial-stage biopharmaceutical company dedicated to the identification, development and commercialization of innovative therapies that enable the body to repair and regenerate damaged tissues and organs to restore normal structure and function. Vericel has marketed products and developmental stage product candidates, and the Company’s goal is to become the leader in cell therapy and regenerative medicine by developing, manufacturing and marketing best-in-class therapies for patients with significant unmet medical needs.
The Company operates its business primarily in the U.S. in
one
reportable segment — the research, product development, manufacture and distribution of patient-specific, expanded cellular therapies to repair and regenerate damaged tissues and organs to normal structure and function.
The accompanying consolidated financial statements have been prepared on a basis which assumes that the Company will continue as a going concern and contemplates the realization of assets and satisfaction of liabilities and commitments in the normal course of business. As of
December 31, 2017
, the Company has an accumulated deficit of
$360.9 million
and had a net loss of
$17.3 million
during 2017. The Company had cash of
$26.9 million
as of
December 31, 2017
. The Company expects that existing cash together with its
term loan and revolving line of credit agreement with Silicon Valley Bank (SVB) and MidCap Financial Services (MidCap) (the
SVB-MidCap facility), will be sufficient to support the Company's
current operations through at least March 31, 2019
. In connection with the SVB-MidCap facility,
the Company must remain in compliance with minimum monthly net revenue covenants (determined in accordance with U.S. GAAP), measured on a trailing twelve month basis. The December 31, 2018 minimum revenue covenant is set at
$63.6 million
.
SVB and MidCap also have the ability to call debt based on material adverse change clauses which are subjectively determinable and result in a
subjective acceleration clause.
If the Company's cash requirements exceed its current expectations, or if it is not in compliance with the monthly net revenue covenants or the subjective acceleration clauses are triggered under the SVB-MidCap Facility, then SVB may call the debt resulting in the Company immediately needing additional funds. As of
December 31, 2017
, the Company was in compliance with the minimum revenue covenant set forth in the Third Loan Modification Agreement between the Company, SVB and MidCap. The Company may seek additional funding through debt or equity financings including the at-the-market sales agreement in place with
Cowen and Company, LLC
. However, the Company may not be able to obtain financing on acceptable terms or at all. The terms of any financing may adversely affect the holdings or the rights of the Company's shareholders. If the Company needs additional funds and is unable to obtain funding on a timely basis, the Company may need to significantly curtail its operations in an effort to provide sufficient funds to continue its operations, which could adversely affect its business prospects.
2. Summary of Significant Accounting Policies
Principles of Consolidation
The consolidated financial statements include the accounts of Vericel and its wholly-owned subsidiaries, Marrow Donation, LLC, located in San Diego, California, and Vericel Denmark ApS, in Kastrup, Demark (collectively, the Company). All inter-company transactions and accounts have been eliminated in consolidation. Marrow Donation, LLC and Vericel Denmark ApS ceased operations in 2015.
Use of Estimates
The preparation of financial statements in accordance with accounting principles generally accepted in the United States of America requires management to make estimates and assumptions that affect the reported amounts of assets and liabilities and disclosures of contingent assets and liabilities at the date of the financial statements and the reported amounts of expenses during the reported period. Actual results could differ from those estimates.
66
Consolidated Statement of Cash Flows
The following table presents certain supplementary cash flows information for the years ended December 31, 2017, 2016 and 2015:
|
Year Ended December 31,
|
|||||||||||
|
(In thousands)
|
2017
|
2016
|
2015
|
||||||||
|
Interest paid (net of interest capitalized)
|
$
|
931
|
|
$
|
226
|
|
$
|
—
|
|
||
|
Income tax withholding paid
|
100
|
|
—
|
|
—
|
|
|||||
Inventory
Inventories are measured at the lower of cost and net realizable value. Cost is calculated based upon standard-cost which approximates costs determined on the first-in, first-out method. The Company periodically reviews its inventories for excess or obsolescence and write-down obsolete or other unmarketable inventory to its estimated net realizable value. If the actual net realizable value is less than that estimated by us, or if it is determined that inventory utilization will further diminish based on estimates of demand, additional inventory write-downs may be required. In all cases, product inventory is carried at the lower of cost or its estimated net realizable value. Amounts written down are charged to cost of sales.
Accounts Receivable
Accounts receivable are initially recorded at the contractual amount owed by the customer. Allowances for doubtful accounts are established when the facts and circumstances indicate that a receivable may not be collectible.
Property, Plant and Equipment
Property, plant and equipment are initially measured and recognized at acquisition cost, including any directly attributable cost of preparing the asset for its intended use or, in the case of assets acquired in a business combination, at fair value as at the date of the combination. After initial measurement, property, plant and equipment are carried at cost less accumulated depreciation and impairment. Repair and maintenance costs of property, plant and equipment are expensed as incurred.
The depreciable value of property, plant and equipment, net of any residual value, is depreciated on a straight line basis over the useful life of the asset. The useful life of an asset is usually equivalent to its economic life. The useful lives of property, plant and equipment are as follows:
•
Equipment and computers:
3
to
5 years
•
Furniture and fixtures:
5 years
•
Building improvements and leasehold improvements: Shorter of the remaining life of the lease or
7 years
The costs of assets retired or otherwise disposed of and the accumulated depreciation thereon are removed from the accounts, with any gain or loss realized upon sale or disposal credited or charged to operations.
Intangible Assets and Other Long Lived Assets
Intangible assets are initially measured at acquisition cost, including any directly attributable costs of preparing the asset for its intended use or, in the case of assets acquired in a business combination at fair value as at the date of the combination. Identifiable intangible assets related to commercial rights are amortized on a straight line basis over their expected useful lives. Amortization of intangible assets is recognized in these financial statements under Costs of product sales.
Intangible assets and long-lived assets are assessed for potential impairment when there is evidence that events or changes in circumstances indicate that the carrying amount of an asset may not be recovered. An impairment loss would be recognized when an asset’s fair value, determined based on undiscounted cash flows expected to be generated by the asset, is less than its carrying amount. The impairment loss would be measured as the amount by which the asset’s carrying value exceeds its fair value and recognized in these financial statements. Intangible assets are carried at cost less accumulated amortization and impairment. Upon the approval of MACI in December 2016 and the replacement of Carticel with MACI, it was determined that the Carticel commercial rights intangible asset was fully impaired as of December 31, 2016 resulting in a loss on intangible asset impairment of
$2.6
67
million
. The value of the intangible assets was determined using the income approach based on projected cash flows attributed to the commercial rights.
Revenue Recognition and Net Product Sales
Revenue from sales to a customer (distributor, hospital or other party) is recognized in accordance with ASC 605,
Revenue Recognition
and SAB Topic 104,
R
eve
nue Recognition
(ASC 605), when (i) persuasive evidence of an arrangement exists, (ii) the goods are shipped or delivered and implanted, depending on shipping terms, (iii) title and risk of loss pass to the customer and (iv) collectability is reasonably assured. Shipping and handling costs are included as a component of revenue. Revenue from sales where the patient is the customer and a third party payer (insurance company, etc.) pays all or some of the product price on the patient's behalf are accounted for under ASC 954-605,
Health Care Entities - Revenue Recognition
(ASC 954).
Prior to July 1, 2016, the Company sold Carticel through a distributor and followed ASC 605,
Revenue Recognition
and SAB Topic 104
Revenue Recognition
to record revenue. This distributor purchased and took title to Carticel upon shipment of the product and assumed credit and collection risk related to the end customers. The distributor worked with the payers on behalf of patients and surgeons to ensure medical coverage and to obtain reimbursement for Carticel implantation procedures. Under this arrangement, the distributor is the Company's customer. The Company retained responsibility for shipment of the product to the surgical suite. Revenue was recorded for Carticel upon occurrence of the surgery, net of provisions for rebates and cash discounts. Such rebates and discounts were
$0.5 million
for the year ended December 31, 2016. There were
no
material rebates or cash discounts for year ended December 31, 2017. These rebates and prompt payment cash discounts were established by the Company at the time of sale, based on actual experience adjusted to reflect known changes in the factors that impact such reserves. Adjustments to these reserves had historically not been significant.
On June 30, 2016, the Company reduced the scope of the agreement with its exclusive distributor by terminating their services for a significant portion of its Carticel sales. On July 1, 2016, the Company transitioned to a direct sales model for Carticel and MACI after launch whereby the Company retained credit and collection risk from the patient as the end customer. The Company utilized a new provider, Dohmen Life Science Services, LLC (DLSS), to provide patient support services but this provider did not purchase and take title to Carticel or MACI. Under this arrangement, the patient is the Company's customer. On May 15, 2017, the Company and DLSS mutually terminated the agreement effective June 30, 2017. The Company also utilized Vital Care Inc. and its franchisees as a second provider to expand the available network of contracted third-party payers for Carticel and MACI. Under this direct sales model, the patient bears the ultimate financial responsibility for the purchase of Carticel or MACI and as such the Company recognized revenue in accordance with ASC 954-605,
Health Care Entities - Revenue Recognition
. The third party payer (insurance company, government, etc.) pays all or some of the product price on the patient’s behalf.
Under the direct sales model, the Company recognizes product revenues from sales of Carticel and MACI upon implantation at which time the claim is billable to patient’s insurance provider on behalf of the patient and is billed by either DLSS or Vital Care. The Company assumed counterparty risk for the third party reimbursement payment from the payer and from the patient co-pay. Prior authorization or confirmation of coverage level by the patient’s private insurance plan, hospital or government payer is a prerequisite to the shipment of product to a patient. The Company's net product revenues are calculated by estimating expected payments for insurance, hospital or patient payments at the time it invoices and recognizes revenue. To support this direct sales model, the Company utilized DLSS to provide administrative services associated with case management and reimbursement support and to provide billing and collection services. The Company utilized Vital Care to provide similar billing and collection services for a subset of insurance payers and patients.
In April 2017, we were was notified of a contractual dispute between Vital Care and a third-party payer and as a result, during the three months ended March 31, 2017, we increased our estimated revenue allowances, reducing revenue by
$2.1 million
related to 2016 sales and
$0.7 million
related to 2017 sales to reflect the lower reimbursement that would be obtained if the claims were ultimately required to be treated as out-of-network. In July 2017, the dispute was resolved and the negotiated reimbursement resulted in our ability to initially reduce our estimated sales allowances by
$1.4 million
which resulted in additional revenue in the second quarter of 2017 related to sales which originated primarily in 2016. As a result of the continuing evaluation and assessment of these expected payments, our estimates for expected payments could change. Other than this adjustment the other adjustments recorded during 2017 related to our estimation under ASC 954-605,
Health Care Entities - Revenue Recognition
were not significant.
On May 15, 2017, the Company entered into a distribution agreement with Orsini Pharmaceutical Services, Inc. (Orsini) to appoint Orsini as a specialty pharmacy distributor of MACI to patients' physicians and other healthcare providers. The initial term of the distribution agreement will end on May 15, 2019 with the option of 2 additional two-year terms.
68
Other Revenue
Other revenue represents the amount of revenue recorded upon the license grant to Innovative Cellular Therapeutics CO., LTD. (ICT) discussed in note 15. The Company received
$1.2 million
from ICT for licenses and the technology for Carticel, MACI, Epicel and Ixmyelocel-T and related payments. The license grant and related arrangement is accounted for under the multiple-element arrangement guidance (arrangements with more than one deliverable). As a result, interpretation and judgment is required to determine the appropriate accounting for these transactions including how the arrangement consideration should be allocated among potential multiple deliverables and developing an estimate of the stand-alone selling price of each deliverable. For multiple-element arrangements, revenue is allocated to each unit of accounting based on their relative selling prices. Relative selling prices are based on management's best estimate of the selling price. As a result of the assessment of the fair value, the Company's estimates could impact the timing or amount of revenue recognition.
In accordance with the multiple element arrangement accounting, we allocated the upfront payment from ICT to the multiple deliverables which include the license, a training obligation, and product supply. Based upon our determination of the best estimate of selling price of each of these deliverables, the majority of the upfront payment was allocated to the license. The license was delivered in December of 2017 and as such revenue of
$1.2 million
was recorded in 2017.
Research and Development Expense
Research and development activities represent a significant part of the Company’s business. These expenditures relate to the development of new products, improvement of existing products, technical support of products and compliance with governmental regulations for the protection of consumers and patients. Research and development expenses are expensed as incurred.
Stock-Based Compensation
The Company’s accounting for stock-based compensation requires it to determine the fair value of common stock issued in the form of stock option awards. The Company uses the value of its common stock at the date of the grant in the calculation of the fair value of its share-based awards. The fair value of stock options held by the employees is determined using a Black-Scholes option valuation method, which is a valuation technique that is acceptable for share-based payment accounting. Key assumptions in determining fair value include volatility, risk-free interest rate, dividend yield and expected term. The assumptions used in calculating the fair value of stock options represent the Company’s best estimates, however; these estimates involve inherent uncertainties and the application of management judgment. As a result, if factors change and different assumptions are used, the stock-based compensation expense could be materially different in the future. In addition, the Company estimates the expected forfeiture rate and only recognize expense for those stock options expected to vest over the service period. The estimated forfeiture rate considers the historical experience of the Company’s stock-based awards. If the actual forfeiture rate is different from the estimate, expense is adjusted accordingly.
The Company also has an Employee Stock Purchase Plan (ESPP) which is a compensatory plan. Compensation expense is recorded based on the fair value of the purchase options at the grant date, which corresponds to the first day of each purchase period, and is amortized over the purchase period.
Comprehensive Loss
Comprehensive loss is the change in common stockholders’ equity during a period arising from any gain or loss realized related to foreign currency translation. Since 2015, when we ceased operations in Denmark, foreign currency translation has been recognized in the statement of operations. As a result there are no remaining differences between net loss and comprehensive loss for 2017 and 2016.
Income Taxes
Deferred tax assets are recognized for deductible temporary differences and tax credit carryforwards and deferred tax liabilities are recognized for taxable temporary differences. Deferred tax assets are reduced by a valuation allowance when, in the opinion of management, it is more likely than not that some portion or all of the deferred tax assets will not be realized.
The Company records uncertain tax positions in the financial statements only if it is more likely than not that the uncertain tax position will be sustained upon examination by the taxing authorities. The Company records interest and penalties related to uncertain tax positions in income tax expense.
69
Net Loss Per Share Attributable to Common Shareholders
Basic and diluted earnings (loss) per share is calculated using the two-class method. Basic earnings (loss) per share which is based on an earnings allocation formula that determines earnings (loss) per share for the holders of the Company’s common shares and holders of the Series B preferred stock. The Series B preferred stock shares contain participation rights in undistributed earnings, but do not share in the losses of the Company. The accumulated but undeclared dividends on the Series B preferred stock of
$7.6 million
and
$6.7 million
for the years ended December 31,
2016
and
2015
, respectively, are treated as a reduction of earnings attributable to common shareholders. There were no undeclared dividends for the year ended
December 31, 2017
. Diluted earnings (loss) per share includes convertible securities or common equivalent share (stock options and warrants) in addition to the Company's common shares. Common equivalent shares and treasury stock are not included in the diluted per share calculation where the effect of their inclusion would be anti-dilutive.
Financial Instruments
The Company’s financial instruments include receivables for which the current carrying amounts approximate market value based upon their short-term nature.
Warrants
Warrants that could be cash settled or have anti-dilution price protection provisions are recorded as liabilities at their estimated fair value at the date of issuance, with subsequent changes in estimated fair value recorded in other income (expense) in our statement of operations in each subsequent period. Warrants that meet the requirements for equity classification are recorded at fair value with no subsequent remeasurement. In general, warrants are measured using the Black-Scholes valuation model. The methodology is based, in part, upon inputs for which there is little or no observable market data, requiring the Company to develop its own assumptions. The assumptions used in calculating the estimated fair value of the warrants represent our best estimates; however, these estimates involve inherent uncertainties and the application of management judgment. As a result, if factors change and different assumptions are used, the change in estimated fair value of the warrant liability for those warrants that could be cash settled or have anti-dilution price protection provisions, could be materially different.
3. Recent Accounting Pronouncements
Revenue Recognition
In May 2014, the Financial Accounting Standards Board (FASB) issued authoritative guidance requiring entities to apply a new model for recognizing revenue from contracts with customers and the reporting of principal versus agent considerations. The guidance will supersede the current revenue recognition guidance and require entities to evaluate their revenue recognition arrangements using a five step model to determine when a customer obtains control of a transferred good or service. The guidance is currently effective for annual reporting periods beginning after December 15, 2017 and may be adopted using a full or modified retrospective application. The Company has completed its assessment of the new standard and does not expect a material impact to the consolidated financial statements for the Company's performance obligations satisfied upon delivery. For transactions with multiple performance obligations, including the ICT license agreement, we are assessing the impact on the change in standard for any future obligations. The Company does not have variable pricing arrangements that are retrospective or represent a material right to its customers. The guidance becomes effective for the year beginning January 1, 2018 and the Company will adopt the guidance using the modified retrospective approach.
Accounting for Leases
The FASB issued guidance to increase transparency and comparability among organizations by recognizing lease assets and lease liabilities on the balance sheet and disclosing key information about leasing arrangements. In accordance with the updated guidance, lessees are required to recognize the assets and liabilities arising from operating leases on the balance sheet. The guidance is effective for annual reporting periods beginning after December 15, 2018, including interim periods within 2018. The Company is currently reviewing the potential impact of adopting the new guidance.
Statement of Cash Flows Presentation
The FASB issued guidance to address diversity in practice with respect to how certain cash receipts and cash payments are presented and classified in the statement of cash flows. The updated guidance addresses eight specific cash flow issues with the objective of reducing the existing diversity that occurs in practice. The guidance is effective for annual reporting periods beginning
70
after December 15, 2017, including interim periods within those fiscal years. The Company adopted the new guidance early. As a result of the adoption of this standard, in the 2017 cash flow statement we presented
$0.6 million
of fees paid to the lender in connection with the refinancing as a financing activity.
Share-based Payment Accounting for Modifications
The FASB issued clarifying guidance in amendments to the accounting for share-based payments and the application of modification accounting. The update provides clarity and reduces both diversity in practice and cost and complexity when applying modification guidance. The guidance is effective for annual reporting periods beginning after December 15, 2017, including interim periods within 2017. The Company has adopted the new guidance for the period ended December 31, 2017 and there were no impacts to the consolidated financial statements.
4. Concentration of Credit Risk
On May 15, 2017, the Company and DLSS mutually terminated their agreement effective June 30, 2017. On May 15, 2017, the Company entered into a distribution agreement with Orsini as a specialty pharmacy distributor of MACI and has engaged a third party services provider to provide the patient support program previously provided by DLSS and to manage patient cases for MACI. The Company’s receivables risk is now more concentrated, and the concentration of credit risk also shifted for the Company.
The Company's total revenue and accounts receivable balances were comprised of the following concentrations from its largest customers of Carticel, MACI and Epicel, as follows:
|
Revenue Concentration
|
Accounts Receivable Concentration
|
|||||||||||||
|
Year Ended December 31,
|
December 31,
|
|||||||||||||
|
2017
|
2016
|
2015
|
2017
|
2016
|
||||||||||
|
Carticel and MACI
|
35
|
%
|
31
|
%
|
66
|
%
|
46
|
%
|
1
|
%
|
||||
|
Epicel
|
10
|
%
|
11
|
%
|
12
|
%
|
3
|
%
|
5
|
%
|
||||
71
5. Selected Balance Sheet Components
Inventory
Inventory as of
December 31, 2017
and
2016
:
|
(In thousands)
|
2017
|
2016
|
||||||
|
Raw materials
|
$
|
3,532
|
|
$
|
3,214
|
|
||
|
Work-in-process
|
226
|
|
257
|
|
||||
|
Finished goods
|
35
|
|
17
|
|
||||
|
Inventory
|
$
|
3,793
|
|
$
|
3,488
|
|
||
Property and Equipment
Property and Equipment, net as of
December 31, 2017
and
2016
:
|
(In thousands)
|
2017
|
2016
|
||||||
|
Machinery and equipment
|
$
|
1,249
|
|
$
|
3,150
|
|
||
|
Furniture, fixtures and office equipment
|
872
|
|
931
|
|
||||
|
Computer equipment and software
|
3,536
|
|
3,147
|
|
||||
|
Leasehold improvements
|
4,213
|
|
3,332
|
|
||||
|
Construction in process
|
822
|
|
408
|
|
||||
|
|
10,692
|
|
10,968
|
|
||||
|
Less accumulated depreciation
|
(6,621
|
)
|
(7,093
|
)
|
||||
|
Property and Equipment
|
$
|
4,071
|
|
$
|
3,875
|
|
||
Depreciation expense for the years ended
December 31, 2017
,
2016
and
2015
were
$1.6 million
,
$1.6 million
and
$1.3 million
, respectively.
Accrued Expenses
Accrued Expenses as of
December 31, 2017
and
2016
:
|
(In thousands)
|
2017
|
2016
|
|||||||
|
Bonus
|
$
|
2,693
|
|
$
|
2,433
|
|
|||
|
Employee related accruals
|
2,389
|
|
1,668
|
|
|||||
|
Other accrued expenses
|
491
|
|
422
|
|
|||||
|
Accrued expenses
|
$
|
5,573
|
|
$
|
4,523
|
|
|||
72
|
6.
|
|
On December 6, 2017, we replaced the existing term loan and revolving line of credit agreement with SVB and MidCap Financial Services, or MidCap, which provide access to up to
$25.0 million
. The updated debt financing consists of a
$15.0 million
term loan which was drawn at the closing and up to
$10.0 million
of a revolving line of credit. The term loans are interest only (indexed to Wall Street Journal (WSJ) Prime plus
4.25%
) until December 1, 2018 followed by
36
equal monthly payments of principal plus interest maturing December 6, 2021. Under the terms of the agreement, the revolving credit is limited to a borrowing base calculated using eligible accounts receivable and maturing December 6, 2021 with an interest rate indexed to WSJ Prime plus
1.25%
.
The Company is subject to various financial and nonfinancial covenants including but not limited to a monthly minimum net revenue covenant
(determined in accordance with GAAP), measured on a trailing twelve month basis
. SVB and MidCap have the ability to call debt based on material adverse change clauses which are subjectively determinable and result in a
subjective acceleration clause. SVB and MidCap have a shared first priority perfected security interest in all assets of the Company other than intellectual property. As of
December 31, 2017
, there was an outstanding balance of
$15.0 million
under the term loan and
$2.5 million
under the revolving line of credit. The weighted average interest rate on the outstanding term and revolving credit loans as of December 31, 2017 was
8.32%
in addition to a final payment of
3.6%
of the term loan due upon maturity. The remaining capacity under the revolving line of credit as of
December 31, 2017
was
$7.5 million
and we were, and continue to be, in compliance with our financial and non-financial debt covenants. Warrants were issued in conjunction with the modified debt agreement as discussed in note 11.
Annual principal payments on debt at December 31, 2017, are as follows:
|
(in thousands)
|
|||
|
Years Ending December 31,
|
Amount
|
|
|
|
2018
|
$
|
417
|
|
|
2019
|
5,000
|
|
|
|
2020
|
5,000
|
|
|
|
2021
|
7,083
|
|
|
|
2022
|
—
|
|
|
|
Thereafter
|
—
|
|
|
|
|
$
|
17,500
|
|
In determining whether the debt replacement is to be accounted for as a debt extinguishment or a debt modification, the Company considered whether creditors remained the same or changed and whether the changes in debt terms are substantial. After performing the assessment in accordance with accounting guidance for the modification of debt arrangements, the term loan portion was determined to be accounted for as a debt extinguishment and the revolving credit agreement was considered a debt modification. As a result, the unamortized deferred financing costs, lender fees and warrant issuance costs allocated to the term loan were recognized as a loss on extinguishment of debt of
$0.9 million
. Fees allocated to the revolving credit agreement will be deferred over the life of the new revolving debt arrangement.
7.
Stock-Based Compensation
Stock Option and Equity Incentive Plans
The Company has historically had various stock incentive plans and agreements that provide for the issuance of nonqualified and incentive stock options as well as other equity awards. Such awards may be granted by the Company’s Board of Directors to certain of the Company’s employees, directors and consultants. Options granted under these plans expire no later than
ten years
from the date of grant, and other than those granted to non-employee directors, generally become exercisable over a
four
year period, under a graded-vesting methodology, following the date of grant. The Company generally issues new shares upon the exercise of stock options.
The 2017 Omnibus Incentive Plan (2017 Plan) was approved by the Company's shareholders on May 3, 2017 at the annual meeting of shareholders. The 2017 Plan provides incentives through the grant of stock options, stock appreciation rights, restricted stock awards and restricted stock units. The exercise price of stock options granted under the 2017 Plan shall not be less than the fair market value of the Company’s common stock on the date of grant. The 2017 Plan replaced the 1992 Stock Option Plan, the 2001 Stock Option Plan, the Amended and Restated 2004 Equity Incentive Plan and the 2009 Second Amended and Restated Omnibus Incentive Plan (Prior Plans), and
no
new awards have been granted under the Prior Plans. However, the expiration or forfeiture of options previously granted under the Prior Plans will increase the awards available for issuance under the 2017 Plan.
73
As of
December 31, 2017
, there were
4,427,722
shares available for future grant under the 2017 Plan.
Employee Stock Purchase Plan
Employees are able to purchase stock under the Vericel Corporation Employee Stock Purchase Plan (ESPP). The ESPP allows for the issuance of an aggregate of
1,000,000
shares of common stock of which
429,511
have been granted since the inception of the benefit in 2015. Participation in this plan is available to substantially all employees. The ESPP is a compensatory plan accounted for under the expense recognition provisions of the share-based payment accounting standards. Compensation expense is recorded based on the fair market value of the purchase options at the grant date, which corresponds to the first day of each purchase period and is amortized over the purchase period. In January 2018, employees purchased
27,506
shares resulting in proceeds from the sale of common stock of
$0.1 million
under the ESPP for the fourth quarter of 2017. The total share-based compensation expense for the ESPP for the years ended
December 31, 2017
,
2016
, and
2015
was approximately
$0.2 million
,
$0.2 million
, and
$0.1 million
, respectively.
Service-Based Stock Options
During the year ended
December 31, 2017
, the Company granted
1,686,210
service-based options to purchase common stock. The exercise price of the options is the fair market value per share of common stock on the grant date, generally vest over
four years
(other than
105,000
non-employee options which vest over
one year
) and have a term of
ten years
. The weighted average grant-date fair value of service-based options granted during the years ended
December 31, 2017
,
2016
, and
2015
was
$1.99
,
$2.15
and
$2.22
, respectively.
The net compensation costs recorded for the service-based stock options related to employees and directors (including the impact of forfeitures) for the years ended
December 31, 2017
,
2016
, and
2015
were
$2.5 million
,
$2.3 million
and
$2.7 million
, respectively.
Stock Compensation Expense
Non-cash stock-based compensation expense (employee stock purchase plan and service-based stock options) is summarized in the following table:
|
|
Years Ended December 31,
|
|||||||||||
|
(in thousands)
|
2017
|
2016
|
2015
|
|||||||||
|
Cost of goods sold
|
$
|
428
|
|
$
|
427
|
|
$
|
308
|
|
|||
|
Research and development
|
506
|
|
497
|
|
555
|
|
||||||
|
General, selling and administrative
|
1,746
|
|
1,575
|
|
1,884
|
|
||||||
|
Total non-cash stock-based compensation expense
|
$
|
2,680
|
|
$
|
2,499
|
|
$
|
2,747
|
|
|||
The fair value of each service-based stock option grant for the reported periods is estimated on the date of the grant using the Black-Scholes option-pricing model using the weighted average assumptions noted in the following table.
|
|
Year Ended December 31,
|
|||||
|
Service-Based Stock Options
|
2017
|
2016
|
2015
|
|||
|
Expected dividend rate
|
—%
|
—%
|
—%
|
|||
|
Expected stock price volatility
|
79.7 – 88.2%
|
78.7 – 92.2%
|
77.4 – 88.1%
|
|||
|
Risk-free interest rate
|
1.39 – 2.3%
|
1.1 – 2.1%
|
1.5 – 2.0%
|
|||
|
Expected life (years)
|
5.5 - 6.3
|
5.5 – 6.3
|
5.5 – 6.3
|
|||
The following table summarizes the activity for service-based stock options for the indicated periods:
74
|
Service-Based Stock Options
|
Options
|
Weighted Average
Exercise Price
|
Weighted Average
Remaining
Contractual Term
|
Aggregate
Intrinsic
Value
|
|||||||||
|
Outstanding at December 31, 2016
|
3,355,692
|
|
$
|
4.66
|
|
8.2
|
$
|
610
|
|
||||
|
Granted
|
1,686,210
|
|
$
|
2.82
|
|
||||||||
|
Exercised
|
(198,564
|
)
|
$
|
3.06
|
|
|
|
||||||
|
Expired
|
(114,318
|
)
|
$
|
17.98
|
|
||||||||
|
Forfeited
|
(200,594
|
)
|
$
|
3.32
|
|
||||||||
|
Outstanding at December 31, 2017
|
4,528,426
|
|
$
|
3.77
|
|
8.0
|
$
|
10,776
|
|
||||
|
Exercisable at December 31, 2017
|
2,099,655
|
|
$
|
4.76
|
|
|
$
|
4,618
|
|
||||
As of
December 31, 2017
there was approximately
$2.9 million
, of total unrecognized compensation cost related to non-vested service-based stock options granted under the 2017 Plan and the Prior Plans. As of December 31, 2017,
2,135,334
shares are expected to vest. That cost is expected to be recognized over a weighted-average period of
2.8
years.
The total intrinsic value of stock options vested for the years ended
December 31, 2017
,
2016
, and
2015
was
$0.7 million
,
$0.1 million
and
$0.1 million
, respectively.
75
8.
Shareholders’ Equity
At-the-Market Sales Agreement
On October 10, 2016, the Company entered into our at-the-market sales agreement with Cowen (ATM Agreement), pursuant to which the Company may sell shares of our common stock through Cowen, as sales agent, in registered transactions from our shelf registration statement filed in June 2015, for aggregate proceeds of up to
$25.0 million
. Shares of common stock sold under the ATM are to be sold at market prices. The Company will pay up to
3%
of the gross proceeds to Cowen as a commission. A total of
2,340,879
shares of common stock have been sold under the ATM Agreement of which
1,983,023
were sold in 2017 for proceeds of
$7.2 million
(net of
$0.3 million
in commission and issuance costs) and as of
December 31, 2017
the ATM Agreement had remaining capacity of approximately
$16.7 million
. We currently intend to use the net proceeds for research, development, manufacturing, and general and administrative expenses, and for other general corporate purposes.
Dividends
No cash dividends have been declared or paid by the Company since its inception.
9. Preferred Stock
Shareholder Rights Plan
In August 2011, the Board of Directors of the Company adopted a Shareholder Rights Plan, as set forth in the Shareholder Rights Agreement between the Company and the rights agent, the purpose of which is, among other things, to enhance the Board’s ability to protect shareholder interests and to ensure that shareholders receive fair treatment in the event any coercive takeover attempt of the Company is made in the future. The Shareholder Rights Plan could make it more difficult for a third party to acquire, or could discourage a third party from acquiring, the Company or a large block of the Company’s common stock. In March 2012, the Board approved an amendment to the Shareholder Rights Plan to enable Eastern Capital Limited and its affiliates to purchase up to
49.9%
of the shares of common stock of the Company without becoming an “acquiring person” and thereby triggering the stockholder rights, with the limitations under the Shareholder Rights Plan remaining in effect for all other stockholders of the Company.
In connection with the adoption of the Shareholder Rights Plan, the Board of Directors of the Company declared a dividend distribution of
one
preferred stock purchase right (Right) for each outstanding share of common stock to stockholders of record as of the close of business on August 15, 2011. In addition,
one
Right will automatically attach to each share of common stock issued between August 15, 2011 and the distribution date. As a result of the October 2013 reverse stock split, the number of Rights associated with each share of common stock was automatically proportionately adjusted so that (i)
twenty
rights were then associated with each outstanding share of common stock and (ii) so long as the Rights are attached to the common stock,
twenty
rights shall be deemed to be delivered for each share of common stock issued or transferred by the Company in the future. The Rights currently are not exercisable and are attached to and trade with the outstanding shares of common stock. Each Right entitles the registered holder of common stock to purchase from the Company a unit consisting of one ten-thousandth of a share (Unit) of Series A Junior Participating Preferred Stock,
no
par value per share, at a cash exercise prices of
$30.00
per Unit. There are currently
45,000
shares authorized and
zero
issued and outstanding. Under the Shareholder Rights Plan, the Rights become exercisable if a person or group becomes an “acquiring person” by acquiring
15%
or more of the outstanding shares of common stock or if a person or group commences a tender offer that would result in that person owning
15%
or more of the common stock. If a person or group becomes an “acquiring person,” each holder of a Right (other than the acquiring person and its affiliates, associates and transferees) would be entitled to purchase, at the then-current exercise price, such number of shares of the Company’s preferred stock which are equivalent to shares of common stock having a value of twice the exercise price of the Right. If the Company is acquired in a merger or other business combination transaction after any such event, each holder of a Right would then be entitled to purchase, at the then-current exercise price, shares of the acquiring company’s common stock having a value of twice the exercise price of the Right.
The Rights may be redeemed in whole, but not in part, at a price of
$0.001
per Right (payable in cash, common stock or other consideration deemed appropriate by the Board of Directors) by the Board of Directors only until the earlier of (i) the time at which any person becomes an “acquiring person” or (ii) the expiration date of the Rights Agreement. Immediately upon the action of the Board of Directors ordering redemption of the Rights, the Right will terminate and thereafter the only right of the holders of Rights will be to receive the redemption price. The Rights will expire at the close of business on August 15, 2021, unless previously redeemed or exchanged by the Company as described above.
76
Series B Convertible Preferred Stock
On March 9, 2012, the Company completed the sale of
12,308
shares of Series B-1 Non-Voting Convertible Preferred Stock (Series B-1 preferred stock) at an offering price of
$3,250
per share. In addition to the Series B-1 preferred stock, which was issued at the closing, the Company also authorized Series B-2 Voting Convertible preferred Stock (Series B-2 preferred stock). The Series B-1 preferred stock and Series B-2 preferred stock collectively are referred to as the Series B preferred stock. The Series B preferred stock is convertible, at the option of the holder thereof at any time after the
five
year anniversary of the closing of the offering, into shares of common stock at a conversion price of
$3.25
per share of common stock, at a conversion ratio of one share of preferred stock for
fifty
shares of common stock.
On February 10, 2017, the Company sent notice to Eastern Capital Limited (Eastern), the holder of shares of the Company’s Series B-1 Non-Voting Convertible Preferred Stock or Series B-2 Voting Convertible Preferred Stock (Preferred Stock), informing Eastern of the Company's election to convert all
12,308
of the outstanding shares of Preferred Stock held by Eastern, plus
9,570
shares of Preferred Stock in accumulated but undeclared dividends thereon, into
1,093,892
shares of the Company's common stock pursuant to the terms of the Amended and Restated Certificate of Designations, Preferences and Rights of Series B-1 Non-Voting Preferred Stock and Series B-2 Voting Preferred Stock of the Company (Mandatory Conversion). After the Mandatory Conversion on March 9, 2017,
no
shares of Preferred Stock of the Company remain outstanding.
Recent Sales of Unregistered Securities
On December 18, 2015, we entered into a Securities Exchange Agreement with Stonepine Capital, LP (Stonepine), pursuant to which Stonepine exchanged an aggregate of
1,250,000
shares of our common stock for
1,250
shares of our Series A Convertible Preferred Stock (the Exchange). Upon the closing of the Exchange on December 23, 2015, we issued the Series A Convertible Preferred Stock to Stonepine without registration under the Securities Act in reliance on the example from registration contained in Section 3(a)(9) of the Securities Act. On November 22, 2016, Stonepine converted the
1,250
shares of Series A Convertible Preferred Stock for
1,250,000
shares of our Common Stock.
10. Net Loss Per Common Share
The following reflects the net loss attributable to common shareholders and share data used in the basic and diluted earnings per share computations using the two class method:
|
|
Year Ended December 31,
|
|||||||||||
|
(Amounts in thousands, except per share amounts)
|
2017
|
2016
|
2015
|
|||||||||
|
Numerator:
|
|
|
|
|
||||||||
|
Net loss
|
$
|
(17,286
|
)
|
$
|
(19,566
|
)
|
$
|
(16,340
|
)
|
|||
|
Less: earnings attributable to convertible preferred stock
|
—
|
|
7,579
|
|
6,736
|
|
||||||
|
Numerator of basic and diluted EPS
|
$
|
(17,286
|
)
|
$
|
(27,145
|
)
|
$
|
(23,076
|
)
|
|||
|
Denominator:
|
|
|
|
|
|
|
||||||
|
Denominator for basic and diluted EPS: weighted-average common shares outstanding
|
33,355
|
|
23,093
|
|
23,760
|
|
||||||
|
Net loss per share attributable to common shareholders (basic and diluted)
|
$
|
(0.52
|
)
|
$
|
(1.18
|
)
|
$
|
(0.97
|
)
|
|||
Common equivalent shares and treasury stock are not included in the diluted per share calculation where the effect of their inclusion would be anti-dilutive. The aggregate number of common equivalent shares (related to options, warrants, preferred stock and treasury stock) that have been excluded from the computations of diluted net loss per common share for the years ended
December 31, 2017
,
2016
and
2015
was
5.4 million
,
5.3 million
and
6.7 million
, respectively.
11. Stock Purchase Warrants
The Company has historically issued warrants to purchase shares of the Company’s common stock in connection with certain of its common stock offerings and in September 2016 and December 2017 (collectively the Debt Warrants) the Company issued warrants in connection with the amended debt agreement discussed in note 6. The warrants issued in August 2013 (August 2013 Warrants) include anti-dilution price protection provisions that could require cash settlement of the warrants and accordingly requiring the warrants to be recorded as liabilities of the Company at the estimated fair value at the balance sheet date, with changes
77
in estimated fair value recorded as income or expense (non-cash) in the Company’s statement of operations in each subsequent period. The Debt Warrants meet the requirements for equity classification. The following table describes the outstanding warrants:
|
|
August 2013 Warrants
|
September 2016 Warrants
|
December 2017 Warrants
|
|||
|
Exercise price
|
$4.80
|
$2.48
|
$4.27
|
|||
|
Expiration date
|
August 16, 2018
|
September 9, 2022
|
December 6, 2023
|
|||
|
Total shares issuable on exercise
|
724,950
|
117,074
|
53,902
|
|||
On December 7, 2017, the Company issued an additional
53,902
warrants to
two
holders in conjunction with the modified loan agreement described in note 6 (December 2017 Warrants). The initial valuation of the warrants issued in December 2017 was partially recorded as debt issuance costs and is being amortized over the remaining life of the loan agreement to interest expense and a portion was expensed as a loss on extinguishment of debt. The December 2017 Warrants are treated as equity instruments recorded at fair value with no subsequent remeasurement. Pursuant to the warrants, the holders may exercise their warrants for an aggregate of
53,902
shares of the Company’s common stock.
The fair value of the warrants described in the table above is measured using the Black-Scholes valuation model. Inherent in the Black-Scholes valuation model are assumptions related to expected stock-price volatility, expected life, risk-free interest rate and dividend yield. The Company estimates the volatility of its common stock based on historical volatility that matches the expected remaining life of the warrants. The risk-free interest rate is based on the U.S. Treasury zero-coupon yield curve on the grant date for a maturity similar to the expected remaining life of the warrants. The expected life of the warrants is assumed to be equivalent to their remaining contractual term. The dividend rate is based on the historical rate, which the Company anticipates to remain at
zero
.
78
The assumptions used by the Company are summarized in the following table:
|
August 2013 Warrants
|
December 31, 2017
|
December 31, 2016
|
||||||
|
Closing stock price
|
$
|
5.45
|
|
$
|
3.00
|
|
||
|
Expected dividend yield
|
—
|
%
|
—
|
%
|
||||
|
Expected stock price volatility
|
63.7
|
%
|
97.9
|
%
|
||||
|
Risk-free interest rate
|
1.65
|
%
|
1.03
|
%
|
||||
|
Expected life (years)
|
0.62
|
|
1.62
|
|
||||
|
September 2016 Warrants
|
September 9, 2016
|
|||
|
Closing stock price
|
$
|
2.20
|
|
|
|
Expected dividend rate
|
—
|
%
|
||
|
Expected stock price volatility
|
89.8
|
%
|
||
|
Risk-free interest rate
|
1.4
|
%
|
||
|
Expected life (years)
|
6.00
|
|
||
|
December 2017 Warrants
|
December 6, 2017
|
|||
|
Closing stock price
|
$
|
5.10
|
|
|
|
Expected dividend rate
|
—
|
%
|
||
|
Expected stock price volatility
|
86.4
|
%
|
||
|
Risk-free interest rate
|
2.2
|
%
|
||
|
Expected life (years)
|
6.00
|
|
||
ICT Warrants
On December 21, 2017, the Company received
$5.2 million
(gross of withholding tax) from Innovative Cellular Therapeutics CO., LTD. (ICT), of which
$4.0 million
was allocated to the purchase of a warrant for
818,424
shares of the Company's common stock based on the fair value on the date of grant and the remaining
$1.2 million
was allocated as consideration for the license agreement described in note 4. The fair value of the warrant was based on the closing price as of December 6, 2017 of
$4.90
at an exercise price of
$0.01
per share. On December 27, 2017, ICT exercised the warrant via a cashless exercise in exchange for
816,850
shares of the Company’s common stock. There were
no
warrants issued to ICT outstanding as of December 31, 2017.
12. Fair Value Measurements
The Company’s fair value measurements are classified and disclosed in one of the following three categories:
|
•
|
Level 1: Unadjusted quoted prices in active markets that are accessible at the measurement date for identical, unrestricted assets or liabilities;
|
|
•
|
Level 2: Quoted prices in markets that are not active, or inputs which are observable, either directly or indirectly, for substantially the full term of the asset or liability;
|
|
•
|
Level 3: Prices or valuation techniques that require inputs that are both significant to the fair value measurement and unobservable (i.e., supported by little or no market activity).
|
The following table summarizes the valuation of the Company’s financial instruments that are measured at fair value on a recurring basis:
|
|
December 31, 2017
|
December 31, 2016
|
||||||||||||||||||||||||||||||
|
|
Fair value measurement category
|
Fair value measurement category
|
||||||||||||||||||||||||||||||
|
(In thousands)
|
Total
|
Level 1
|
Level 2
|
Level 3
|
Total
|
Level 1
|
Level 2
|
Level 3
|
||||||||||||||||||||||||
|
Liabilities:
|
|
|
|
|
|
|
|
|
|
|
|
|
|
|
|
|
||||||||||||||||
|
Warrant liabilities
|
$
|
1,014
|
|
$
|
—
|
|
$
|
1,014
|
|
$
|
—
|
|
$
|
757
|
|
$
|
—
|
|
$
|
757
|
|
$
|
—
|
|
||||||||
79
The fair values of the warrants are measured using the Black-Scholes valuation model. See note 11 for further discussion of the significant observable inputs use to measure the warrant liabilities.
The following table summarizes the change in the estimated fair value of the Company’s warrant liabilities:
|
Warrant Liabilities (In thousands)
|
|
|||
|
Balance at December 31, 2015
|
$
|
757
|
|
|
|
Change in fair value
|
—
|
|
||
|
Balance at December 31, 2016
|
757
|
|
||
|
Change in fair value
|
257
|
|
||
|
Balance at December 31, 2017
|
$
|
1,014
|
|
|
13. Income Taxes
Income (loss) before income taxes for U.S and non-U.S operations was as follows:
|
|
Year Ended December 31,
|
|||||||||||
|
|
2017
|
2016
|
2015
|
|||||||||
|
U.S. loss
|
$
|
(17,066
|
)
|
$
|
(19,302
|
)
|
$
|
(16,235
|
)
|
|||
|
Non U.S. loss
|
(220
|
)
|
(264
|
)
|
(105
|
)
|
||||||
|
|
$
|
(17,286
|
)
|
$
|
(19,566
|
)
|
$
|
(16,340
|
)
|
|||
A reconciliation of income taxes computed using the federal statutory rate to the taxes reported in the consolidated statements of operations is as follows:
|
|
Year Ended December 31,
|
|||||||||||
|
(In thousands)
|
2017
|
2016
|
2015
|
|||||||||
|
Loss before income taxes
|
$
|
(17,286
|
)
|
$
|
(19,566
|
)
|
$
|
(16,340
|
)
|
|||
|
Federal statutory rate
|
34
|
%
|
34
|
%
|
34
|
%
|
||||||
|
Taxes computed at federal statutory rate
|
(5,877
|
)
|
(6,652
|
)
|
(5,556
|
)
|
||||||
|
State taxes (net of federal benefit)
|
(1,106
|
)
|
(1,016
|
)
|
(392
|
)
|
||||||
|
Warrants
|
—
|
|
—
|
|
(118
|
)
|
||||||
|
Nondeductible stock compensation
|
563
|
|
549
|
|
543
|
|
||||||
|
Federal and State Rate Change
|
11,749
|
|
(614
|
)
|
—
|
|
||||||
|
Other
|
116
|
|
56
|
|
57
|
|
||||||
|
Adjustment to prior year filed returns
|
—
|
|
—
|
|
(5,203
|
)
|
||||||
|
Change in valuation allowance
|
(5,445
|
)
|
7,677
|
|
10,669
|
|
||||||
|
Reported income taxes
|
$
|
—
|
|
$
|
—
|
|
$
|
—
|
|
|||
Deferred tax assets consist of the following:
|
|
Year Ended December 31,
|
|||||||
|
(In thousands)
|
2017
|
2016
|
||||||
|
Net operating loss carryforwards
|
$
|
10,487
|
|
$
|
10,343
|
|
||
|
Employee benefits and stock compensation
|
2,128
|
|
2,896
|
|
||||
|
Research and development costs
|
8,275
|
|
13,659
|
|
||||
|
Fixed assets
|
508
|
|
700
|
|
||||
|
Inventory reserve
|
2,568
|
|
1,898
|
|
||||
|
Other, net
|
282
|
|
196
|
|
||||
|
Total deferred tax assets
|
24,248
|
|
29,692
|
|
||||
|
Valuation allowance
|
(24,248
|
)
|
(29,692
|
)
|
||||
|
Net deferred tax assets
|
$
|
—
|
|
$
|
—
|
|
||
80
As of December 31, 2017, the Company’s U.S. federal and state tax net operating loss carryforwards available to offset future profits, after considering the annual Section 382 limit described below, are
$42.7 million
and
$24.4 million
, respectively. These net operating loss carryforwards will expire between 2018 and 2037. The projected annual limitation on the use of the net operating losses that existed prior to September 17, 2014 as a result of our change in control in 2014 per Section 382 of the Internal Revenue Code is
$0.8 million
. As a result, a significant portion of the net operating losses and tax credit carryforwards will expire prior to their utilization, regardless of the level of future profitability.
In accordance with the accounting guidance for income taxes, the Company estimated whether recoverability of its deferred tax assets is “more likely than not,” based on forecasts of taxable income in the related tax jurisdictions. In this estimate, the Company uses historical results, projected future operating results based upon approved business plans, eligible carry forward periods, tax planning opportunities and other relevant considerations. Based on these factors, including historical losses incurred by the Company, a full valuation allowance for the deferred tax assets, including the deferred tax assets for the aforementioned net operating losses and credits, has been provided since they are not more likely than not to be realized. If the Company achieves profitability, these deferred tax assets may be available to offset future income taxes. The change in the valuation allowance was a decrease of
$5.4 million
and increase of
$7.7 million
for the years ended December 31, 2017 and 2016, respectively.
The Company assesses uncertain tax positions in accordance with the guidance for accounting for uncertain tax positions. This pronouncement prescribes a recognition threshold and measurement methodology for recording within the financial statements uncertain tax positions taken, or expected to be taken, in the Company’s income tax returns. To the extent the uncertain tax positions do not meet the “more likely than not” threshold, the Company has derecognized such positions. To the extent the uncertain tax positions meet the “more likely than not” threshold, the Company has measured and recorded the highest probable benefit, and have established appropriate reserves for benefits that exceed the amount likely to be sustained upon examination. The Company currently has not recorded any uncertain tax positions and does not anticipate that the unrecognized tax benefits will significantly increase or decrease within the next twelve months.
The Company files U.S. federal, Arkansas, Arizona, Colorado, Florida, Illinois, Massachusetts, Michigan, Tennessee and Texas income tax returns. Due to the Company’s net operating loss carryforwards, Federal income tax returns from incorporation are still subject to examination. Michigan tax returns for the year ended December 31, 2013 and forward are subject to examination. Massachusetts tax returns for the year ended December 31, 2015 and forward are subject to examination.
On December 22, 2017 the Tax Cuts and Jobs Act (Tax Act) was enacted. The Tax Act contains significant changes to corporate taxation, including the reduction of the corporate tax rate from
35
percent to
21
percent, increased deductions for capital spending, limitations on interest expense deductions, implementation of a territorial tax system, and imposition of a tax on deemed repatriated earnings of foreign subsidiaries. The Company remeasured the deferred taxes based on the enacted rate of
21
percent which resulted in an increase to tax expense of
$11.7 million
.
14. Employee Savings Plan
The Company has a 401(k) savings plan that allows participating employees to contribute a portion of their salary, subject to annual limits and minimum qualifications. The Board may, at its sole discretion, approve Company matching contributions to the plan. The Company made contributions of
$0.6 million
,
$0.6 million
and
$0.5 million
for the years ended
December 31,
2017
,
2016
and
2015
, respectively.
15. Commitments and Contingencies
Licenses, Royalties and Collaborative Agreements
Matricel —
In October 2015, the Company signed a long-term supply agreement with Matricel GmbH for the ACI-Maix collagen membrane used in the manufacture of MACI. Matricel supplied ACI-Maix membranes used in the production of MACI when it was previously marketed outside the U.S. by Genzyme Corporation, a Sanofi company. Under the agreement, the Company has committed to purchase annually approximately
$0.6 million
per year. The agreement is effective until December 31, 2022 and contains a
5
-year renewal option by the Company and an additional
5
-year automatic renewal, unless otherwise terminated.
Manufacture, Supply and Other Agreements —
The Company has entered into various agreements relating to the manufacture of its products and the supply of certain components. If the manufacturing or supply agreements expire or are otherwise terminated, the Company may not be able to identify and obtain ancillary materials that are necessary to develop its products and such expiration and termination could have a material effect on the Company’s business.
ICT License Agreement—
On May 10, 2017, the Company announced that it has entered into a License Agreement (License Agreement) with Innovative Cellular Therapeutics CO., LTD. (ICT), a leading cell therapy company and developer of CAR-T
81
cell therapy for cancer treatment, for the development and distribution of the Company's product portfolio in Greater China, South Korea, Singapore, and other countries in Asia. On December 21, 2017, the Company received
$5.2 million
(gross of withholding tax), of which
$4.0 million
was allocated to the warrant based on the fair value on the date of grant as described in note 11 and the remaining
$1.2 million
was allocated as consideration for the license agreement and recognized in 2017 under multiple deliverable accounting guidance. ICT acquired an exclusive license to certain patent rights, know-how and intellectual property relating to Carticel, MACI, ixmyelocel-T, and Epicel. The initiation of the technology transfer, the license grants in the License Agreement and the warrant purchase were contingent upon the Company’s receipt of the upfront payment. The Company is eligible to receive approximately
$8.0 million
in development and commercial milestones. ICT has also agreed to pay tiered royalties to the Company equal to a percentage of net sales of each Licensed Product in the low double digits for the commercial life of the applicable Licensed Product. ICT will be responsible for funding the development of the programs and manufacturing of the products for commercialization in China and the rest of the territory.
Contractual Obligations
The Company leases facilities in Ann Arbor, Michigan and Cambridge, Massachusetts. In March 2016, the Company amended its current lease in Cambridge to extend the terms until February 2022. Under the amendment, the landlord will contribute approximately
$2.0 million
toward the cost of tenant improvements. The contribution toward the cost of tenant improvements is recorded as deferred rent on the Company's consolidated balance sheet and is amortized to our consolidated statement of operations as reductions to rent expense over the lease term. Through
December 31, 2017
, the Company has recorded a tenant improvement of
$1.7 million
. In addition to the property leases, the Company also leases an offsite warehouse, various vehicles and computer equipment.
Future minimum payments related to our operating and capital leases, and contractual obligations including interest on outstanding term loans are as follows:
|
|
|
Payments Due by Period
|
||||||||||||||||||||||||||
|
Contractual Obligations
|
Total
|
2018
|
2019
|
2020
|
2021
|
2022
|
More than
5 Years |
|||||||||||||||||||||
|
Operating leases
|
$
|
19,336
|
|
$
|
4,878
|
|
$
|
4,564
|
|
$
|
4,575
|
|
$
|
4,558
|
|
$
|
761
|
|
$
|
—
|
|
|||||||
|
Purchase commitments
|
3,055
|
|
713
|
|
608
|
|
578
|
|
578
|
|
578
|
|
—
|
|
||||||||||||||
|
Capital leases
|
$
|
92
|
|
$
|
80
|
|
$
|
6
|
|
$
|
2
|
|
$
|
2
|
|
$
|
2
|
|
$
|
—
|
|
|||||||
|
Total
|
22,483
|
|
5,671
|
|
5,178
|
|
5,155
|
|
5,138
|
|
1,341
|
|
—
|
|
||||||||||||||
Rent expense for the years ended
December 31, 2017
,
2016
and
2015
, was
$5.6 million
,
$4.8 million
and
$4.9 million
, respectively.
82
16. Supplementary Quarterly Financial Information (unaudited)
Quarterly earnings per share amounts may not sum to the totals for each of the years, since quarterly computations are based on weighted average common shares outstanding during each quarter.
|
In thousands, except per share data)
|
First Quarter
|
Second Quarter
|
Third Quarter
|
Fourth Quarter
|
Year
|
|||||||||||||||
|
2017
|
||||||||||||||||||||
|
Revenues
|
$
|
9,361
|
|
$
|
16,953
|
|
$
|
14,260
|
|
$
|
23,350
|
|
$
|
63,924
|
|
|||||
|
Gross profit
|
2,252
|
|
9,283
|
|
7,074
|
|
14,961
|
|
33,570
|
|
||||||||||
|
Loss from operations
|
(9,623
|
)
|
(2,521
|
)
|
(4,031
|
)
|
1,191
|
|
(14,984
|
)
|
||||||||||
|
Net (loss) profit
|
(9,778
|
)
|
(2,388
|
)
|
(5,407
|
)
|
287
|
|
(17,286
|
)
|
||||||||||
|
Net (loss) profit per share (Basic and Diluted)
|
(0.31
|
)
|
(0.07
|
)
|
(0.16
|
)
|
0.01
|
|
(0.52
|
)
|
||||||||||
|
2016
|
||||||||||||||||||||
|
Revenues
|
$
|
14,108
|
|
$
|
12,823
|
|
$
|
10,929
|
|
$
|
16,523
|
|
$
|
54,383
|
|
|||||
|
Gross profit (loss)
|
7,548
|
|
5,523
|
|
4,073
|
|
8,932
|
|
26,076
|
|
||||||||||
|
Loss from operations
|
(1,992
|
)
|
(4,984
|
)
|
(6,380
|
)
|
(5,889
|
)
|
(19,245
|
)
|
||||||||||
|
Net loss
|
(3,650
|
)
|
(3,044
|
)
|
(6,675
|
)
|
(6,197
|
)
|
(19,566
|
)
|
||||||||||
|
Net loss per share (Basic and Diluted)
|
(0.24
|
)
|
(0.22
|
)
|
(0.38
|
)
|
(0.34
|
)
|
(1.18
|
)
|
||||||||||
Item 9.
Changes in and Disagreements with Accountants on Accounting and Financial Disclosure
There are none to report.
Item 9A.
Controls and Procedures
Evaluation of Disclosure Controls and Procedures
Management of the Company, with the participation of its certifying officers, evaluated the effectiveness of the Company’s disclosure controls and procedures as defined in Rules 13a-15(e) and 15d-15(e) under the Exchange Act. Based on the evaluation as of December 31, 2017, the Company's Certifying Officers concluded that the Company’s disclosure controls and procedures were effective.
The Company has established disclosure controls and procedures designed to ensure that information required to be disclosed by the Company in the reports that it files or submits under the Securities and Exchange Act of 1934, as amended (the “Exchange Act”), is recorded, processed, summarized and reported within the time periods specified in the Commission’s rules and forms, and that such information is accumulated and communicated to management of the Company, with the participation of its Chief Executive Officer and Chief Financial Officer (its “Certifying Officers”), as appropriate, to allow timely decisions regarding required disclosure.
Management’s Report on Internal Control over Financial Reporting
Our management is responsible for establishing and maintaining adequate internal control over financial reporting (as defined in Rules 13a-15(f) and 15d-15(f) under the Exchange Act). Our internal control over financial reporting is a process designed under the supervision of our CEO and CFO to provide reasonable assurance regarding the reliability of financial reporting and the preparation of our financial statements for external purposes in accordance with generally accepted accounting principles. Management evaluated the effectiveness of our internal control over financial reporting using the criteria set forth by the Committee of Sponsoring Organizations of the Treadway Commission (COSO) in
Internal Control
-
Integrated Framework
(2013). Management concluded our internal control over financial reporting was effective as of December 31, 2017.
The effectiveness of the Company’s internal control over financial reporting as of December 31, 2017 has been audited by PricewaterhouseCoopers LLP, an independent registered public accounting firm, as stated in their report which appears in Item 8 of this form 10-K.
83
Changes in Internal Control over Financial Reporting
During the three months ended December 31, 2017, there were no material changes made in our internal control over financial reporting (as such term is defined in Rules 13a-15(f) and 15d-15(f) of the Exchange Act).
Item 9B.
Other Information
Not applicable.
84
Certain information required by Part III is omitted from this Annual Report on Form 10-K, and is incorporated by reference to our definitive Proxy Statement to be filed with the Securities and Exchange Commission pursuant to Regulation 14A in connection with our 2018 Annual Meeting of Shareholders scheduled for May 2, 2018.
Item 10.
Directors, Executive Officers and Corporate Governance
The information relating to our directors is incorporated by reference to the Proxy Statement as set forth under the caption “Election of Directors.” Information relating to our executive officers is set forth in Part I of this Report under the caption “Executive Officers.”
Information with respect to delinquent filings pursuant to Item 405 of Regulation S-K is incorporated by reference to the Proxy Statement as set forth under the caption “Section 16(a) Beneficial Ownership Reporting Compliance.”
Item 11.
Executive Compensation
The information relating to executive compensation is incorporated by reference to the Proxy Statement under the caption “Executive Compensation and Related Information.”
Item 12.
Security Ownership of Certain Beneficial Owners and Management, and Related Shareholder Matters
The information relating to ownership of our equity securities by certain beneficial owners and management is incorporated by reference to the Proxy Statement as set forth under the caption “Stock Ownership of Certain Beneficial Owners and Management.”
Item 13.
Certain Relationships and Related Transactions, and Director Independence
The information relating to certain relationships and related person transactions is incorporated by reference to the Proxy Statement under the caption “Certain Relationships and Related Party Transactions.”
Item 14.
Principal Accountant Fees and Services
The information relating to principal accountant fees and services is incorporated by reference to the Proxy Statement under the caption “Ratification of Appointment of Independent Registered Public Accounting Firm.”
85
Item 15.
Exhibits and Financial Statement Schedules
(a) The following documents are filed as part of this Annual Report on Form 10-K:
1. Financial Statements (see Item 8).
2. All information is included in the Financial Statements or Notes thereto.
3. Exhibits:
See Exhibit Index.
Item 16.
Form 10-K Summary
This Annual Report on Form 10-K does not include a summary.
86
EXHIBIT INDEX
|
Exhibit No.
|
|
Description
|
|
|
|
|
|
3.1
|
|
|
|
|
|
|
|
3.2
|
|
|
|
|
|
|
|
3.3
|
|
|
|
|
|
|
|
3.4
|
|
|
|
|
|
|
|
3.5
|
||
|
|
|
|
|
3.6
|
|
|
|
|
|
|
|
4.1
|
|
|
|
|
|
|
|
4.2
|
|
|
|
|
|
|
|
4.3
|
|
|
|
|
|
|
|
4.4
|
|
|
|
|
|
|
|
10.1 #
|
|
|
|
|
|
|
|
10.2 #
|
|
|
|
|
|
|
|
10.3 #
|
|
|
|
|
|
|
|
10.4 #
|
|
|
87
|
Exhibit No.
|
|
Description
|
|
10.5
|
|
|
|
|
|
|
|
10.6 #
|
|
|
|
|
|
|
|
10.7 #
|
|
|
|
|
|
|
|
10.8
|
|
|
|
|
|
|
|
10.9
|
|
|
|
|
|
|
|
10.10 #
|
||
|
10.11
|
||
|
|
|
|
|
10.12
|
||
|
|
|
|
|
10.13
|
||
|
|
|
|
|
10.14 #
|
||
|
|
|
|
|
10.16
|
.
|
|
|
10.17
|
||
|
10.18 †
|
||
|
10.19
|
||
88
|
Exhibit No.
|
|
Description
|
|
10.20
|
||
|
10.21 †
|
||
|
10.22
|
||
|
10.23 †
|
||
|
10.24
|
||
|
10.25 †
|
||
|
10.26 †
|
||
|
10.27
|
||
|
10.28 †
|
||
|
10.29 †
|
||
|
10.30 †
|
||
|
10.31
|
||
|
10.32
|
||
|
10.33 †
|
||
89
|
Exhibit No.
|
|
Description
|
|
10.34 †
|
|
|
|
10.35 †
|
||
|
10.36 †
|
||
|
10.37 †
|
||
|
10.38 †
|
||
|
10.39 #
|
||
|
10.40 #
|
||
|
10.41 #
|
||
|
10.42
|
||
|
10.43
|
||
|
10.44
|
||
|
10.45
|
||
|
10.46 †
|
||
|
10.47 †
|
||
|
10.48
|
||
90
|
Exhibit No.
|
|
Description
|
|
10.49
|
||
|
10.50
|
||
|
10.51
|
||
|
10.52
|
||
|
10.53
|
||
|
10.54
|
||
|
10.55
|
||
|
10.56** †
|
||
|
10.57** †
|
||
|
10.58
|
||
|
21.1**
|
||
|
|
|
|
|
23.1**
|
||
|
|
|
|
|
31.1**
|
||
|
|
|
|
|
31.2**
|
||
|
|
|
|
|
32.1**
|
||
|
|
|
|
|
101.INS**
|
XBRL Instance Document
|
|
|
|
|
|
|
101.SCH**
|
XBRL Taxonomy Extension Schema Document
|
|
|
|
|
|
|
101.CAL**
|
XBRL Taxonomy Extension Calculation Linkbase Document
|
|
|
|
|
|
|
101.LAB**
|
XBRL Taxonomy Extension Label Linkbase Document
|
|
91
|
Exhibit No.
|
|
Description
|
|
|
|
|
|
101.PRE**
|
XBRL Taxonomy Extension Presentation Linkbase Document
|
|
|
|
|
|
|
101.DEF**
|
XBRL Taxonomy Extension Definition Linkbase Document
|
|
#
Management contract or compensatory plan or arrangement covering executive officers or directors of Vericel.
†
Confidential treatment status has been granted as to certain portions thereto, which portions are omitted and filed separately with the Securities and Exchange Commission.
** Filed herewith.
92
SIGNATURES
Pursuant to the requirements of Section 13 or 15(d) of the Securities Exchange Act of 1934, the registrant has duly caused this report to be signed on its behalf by the undersigned, thereunto duly authorized.
|
Date:
|
March 5, 2018
|
|
|
Vericel Corporation
|
||
|
|
|
|
|
|
/s/ DOMINICK C. COLANGELO
|
|
|
|
Dominick C. Colangelo
|
|
|
|
President and Chief Executive Officer
|
|
|
|
(Principal Executive Officer)
|
|
Pursuant to the requirements of the Securities Exchange Act of 1934, this Annual Report on Form 10-K has been signed on behalf of the registrant on
March 5, 2018
by the following persons in the capacities indicated.
|
Signature
|
|
Title
|
|
|
|
|
|
/s/ DOMINICK C. COLANGELO
|
|
President and Chief Executive Officer, Director
|
|
Dominick C. Colangelo
|
|
(Principal Executive Officer)
|
|
|
|
|
|
/s/ GERARD J. MICHEL
|
|
Chief Financial Officer and Vice President
|
|
Gerard J. Michel
|
|
of Corporate Development
|
|
|
|
(Principal Financial and Accounting Officer)
|
|
|
|
|
|
/s/ ROBERT L. ZERBE, M.D.
|
|
Chairman of the Board of Directors
|
|
Robert L. Zerbe, M.D.
|
|
|
|
|
|
|
|
/s/ ALAN L. RUBINO
|
|
Director
|
|
Alan L. Rubino
|
|
|
|
|
|
|
|
/s/ HEIDI M. HAGEN
|
|
Director
|
|
Heidi M. Hagen
|
|
|
|
|
|
|
|
/s/ STEVEN C. GILMAN
|
|
Director
|
|
Steven C. Gilman
|
|
|
|
|
|
|
|
/s/ KEVIN F. MCLAUGHLIN
|
|
Director
|
|
Kevin F. McLaughlin
|
|
|
|
|
|
|
|
/s/ PAUL K. WOTTON
|
|
Director
|
|
Paul K. Wotton
|
|
|
93
TABLE OF CONTENTS
Part IItem 1. BusinessItem 1A. Risk FactorsItem 1B. Unresolved Staff CommentsItem 2. PropertiesItem 3. Legal ProceedingsItem 4. Mine Safety DisclosuresPart IIItem 5. Market For Registrant S Common Equity, Related Shareholder Matters and Issuer Purchase Of Equity SecuritiesItem 6. Selected Financial DataItem 7. Management S Discussion and Analysis Of Financial Condition and Results Of OperationsItem 7A. Quantitative and Qualitative Disclosures About Market RiskItem 8. Financial Statements and Supplementary DataItem 9. Changes in and Disagreements with Accountants on Accounting and Financial DisclosureItem 9A. Controls and ProceduresItem 9B. Other InformationPart IIIItem 10. Directors, Executive Officers and Corporate GovernanceItem 11. Executive CompensationItem 12. Security Ownership Of Certain Beneficial Owners and Management, and Related Shareholder MattersItem 13. Certain Relationships and Related Transactions, and Director IndependenceItem 14. Principal Accountant Fees and ServicesPart IVItem 15. Exhibits and Financial Statement SchedulesItem 16. Form 10-k Summary