VERACYTE, INC.
10-Ks and 10-Qs
|
|
|
|
|
|
|
|
|
|
|
|
|
|
|
|
|
|
|
|
|
|
|
|
|
|
|
|
|
|
|
|
|
|
|
|
|
|
|
|
|
|
|
|
UNITED STATES
SECURITIES AND EXCHANGE COMMISSION
Washington, D.C. 20549
Form 10-K
(Mark One)
|
ý
|
ANNUAL REPORT PURSUANT TO SECTION 13 OR 15(d) OF THE SECURITIES EXCHANGE ACT OF 1934
|
For the fiscal year ended
December 31, 2016
|
o
|
TRANSITION REPORT PURSUANT TO SECTION 13 OR 15(d) OF THE SECURITIES EXCHANGE ACT OF 1934
|
For the transition period from to
Commission File Number 001-36156
VERACYTE, INC.
(Exact Name of Registrant as Specified in its Charter)
|
Delaware
(State or Other Jurisdiction of
Incorporation or Organization)
|
20-5455398
(I.R.S. Employer
Identification Number)
|
|||
6000 Shoreline Court, Suite 300
South San Francisco, California 94080
(Address of Principal Executive Offices, Including Zip Code)
(650) 243-6300
(Registrant's Telephone Number, Including Area Code)
Securities Registered Pursuant to Section 12(b) of the Act:
|
Title of Each Class
|
|
Name of Each Exchange on Which Registered
|
||
|
Common Stock, par value $0.001 per share
|
|
The NASDAQ Stock Market LLC
|
||
Securities Registered Pursuant to Section 12(g) of the Act:
None
Indicate by check mark if the registrant is a well-known seasoned issuer, as defined in Rule 405 of the Securities Act. Yes
o
No
ý
Indicate by check mark if the registrant is not required to file reports pursuant to Section 13 or 15(d) of the Act. Yes
o
No
ý
Indicate by check mark whether the registrant: (1) has filed all reports required to be filed by Section 13 or 15(d) of the Securities Exchange Act of 1934 during the preceding 12 months (or for such shorter period that the registrant was required to file such reports), and (2) has been subject to such filing requirements for the past 90 days. Yes
ý
No
o
Indicate by check mark whether the registrant has submitted electronically and posted on its corporate Web site, if any, every Interactive Data File required to be submitted and posted pursuant to Rule 405 of Regulation S-T during the preceding 12 months (or for such shorter period that the registrant was required to submit and post such files). Yes
ý
No
o
Indicate by check mark if disclosure of delinquent filers pursuant to Item 405 of Regulation S-K is not contained herein, and will not be contained, to the best of registrant's knowledge, in definitive proxy or information statements incorporated by reference in Part III of this Form 10-K or any amendment to this Form 10-K.
ý
Indicate by check mark whether the registrant is a large accelerated filer, an accelerated filer, a non-accelerated filer, or a smaller reporting company. See the definitions of "large accelerated filer," "accelerated filer" and "smaller reporting company" in Rule 12b-2 of the Exchange Act. (Check one):
|
Large accelerated filer
|
o
|
Accelerated filer
|
ý
|
Non-accelerated filer
|
o
|
Smaller reporting company
|
o
|
|
(Do not check if a
smaller reporting company)
|
|||||||
Indicate by check mark whether the registrant is a shell company (as defined in Rule 12b-2 of the Exchange Act). Yes
o
No
ý
As of
June 30, 2016
, the aggregate market value of common stock held by non-affiliates of the registrant was approximately
$87.5 million
, based on the closing price of the common stock as reported on The NASDAQ Global Market for that date.
The number of shares of the registrant's Common Stock outstanding as of
February 24, 2017
was
33,848,284
DOCUMENTS INCORPORATED BY REFERENCE
Item 10 (as to directors and Section 16(a) Beneficial Ownership Reporting Compliance), 11, 12, 13 and 14 of Part III incorporate by reference information from the registrant's proxy statement to be filed with the Securities and Exchange Commission in connection with the solicitation of proxies for the registrant's 2017 Annual Meeting of Stockholders to be held on June 6, 2017.
TABLE OF CONTENTS
|
Item No.
|
Page No.
|
|
|
|
|
|
|
|
|
|
|
|
|
BUSINESS
This report contains forward-looking statements within the meaning of the Private Securities Litigation Reform Act of 1995. When used in this report, the words "expects," "anticipates," "intends," "estimates," "plans," "believes," "continuing," "ongoing," and similar expressions are intended to identify forward-looking statements. These are statements that relate to future events and include, but are not limited to, the factors that may impact our financial results; our expectations regarding revenue; our expectations with respect to our future research and development, general and administrative and selling and marketing expenses and our anticipated uses of our funds; our expectations regarding capital expenditures; our anticipated cash needs and our estimates regarding our capital requirements; our need for additional financing; potential future sources of cash; our business strategy and our ability to execute our strategy; our ability to achieve and maintain reimbursement from third-party payers at acceptable levels and our expectations regarding the timing of reimbursement; the estimated size of the global markets for our tests; the attributes and potential benefits of our tests and any future tests we may develop to patients, physicians and payers; the factors we believe drive demand for and reimbursement of our tests; our ability to sustain or increase demand for our tests; our intent to expand into other clinical areas; our ability to develop new tests, and the timeframes for development or commercialization; our ability to get our data and clinical studies accepted in peer-reviewed publications; our dependence on and the terms of our agreement with TCP, and on other strategic relationships, and the success of those relationships; our beliefs regarding our laboratory capacity; the applicability of clinical results to actual outcomes; our expectations regarding our international expansion; the occurrence, timing, outcome or success of clinical trials or studies; the ability of our tests to impact treatment decisions; our beliefs regarding our competitive position; our compliance with federal, state and international regulations; the potential impact of regulation of our tests by the FDA or other regulatory bodies; the impact of new or changing policies, regulation or legislation, or of judicial decisions, on our business; ; the impact of seasonal fluctuations and economic conditions on our business; our belief that we have taken reasonable steps to protect our intellectual property; the impact of accounting pronouncements and our critical accounting policies, judgments, estimates, models and assumptions on our financial results; and anticipated trends and challenges in our business and the markets in which we operate.
Forward-looking statements are based on our current plans and expectations and involve risks and uncertainties which could cause actual results to differ materially. These risks and uncertainties include, but are not limited to, those risks discussed in Part I, Item 1A of this report, as well as risks and uncertainties related to: our limited operating history and history of losses since inception; our ability to increase usage of and reimbursement for our tests; our dependence on a limited number of payers for a significant portion of our revenue; the complexity, time and expense associated with billing and collecting for our test; current and future laws, regulations and judicial decisions applicable to our business, including potential regulation by the FDA or by regulatory bodies outside of the United States; changes in legislation related to the U.S. healthcare system; our dependence on strategic relationships and collaborations; unanticipated delays in research and development efforts; our ability to develop and commercialize new products and the timing of commercialization; our ability to successfully enter new product or geographic markets; our ability to conduct clinical studies and the outcomes of such clinical studies; the applicability of clinical results to actual outcomes; trends and challenges in our business; our ability to compete against other companies, products and technologies; our ability to protect our intellectual property; and our ability to obtain capital when needed. These forward-looking statements speak only as of the date hereof. We expressly disclaim any obligation or undertaking to update any forward-looking statements contained herein to reflect any change in our expectations with regard thereto or any change in events, conditions or circumstances on which any such statement is based.
When used in this report, all references to "Veracyte," the "company," "we," "our" and "us" refer to Veracyte, Inc.
Veracyte, Afirma, Percepta, Envisia, the Veracyte logo and the Afirma logo are our trademarks. We also refer to trademarks of other corporations or organizations in this report.
This annual report contains statistical data and estimates that we obtained from industry publications and reports. These publications typically indicate that they have obtained their information from sources they believe to be reliable, but do not guarantee the accuracy and completeness of their information. Some data contained in this annual report is also based on our internal estimates. Although we have not independently verified the third-party data, we are responsible for its inclusion in the annual report and believe it to be reasonable.
1
General
We are a leading genomic diagnostics company that is fundamentally improving patient care by resolving diagnostic uncertainty with evidence that is trustworthy and actionable. Our products uniquely combine genomic technology, clinical science and machine learning to provide answers that give physicians and patients a clear path forward without risky, costly surgery that is often unnecessary.
Our vision is to lead a transformation of diagnostics with a new genomic standard of truth. Our goal is to drive shareholder value by improving patient outcomes and reducing the cost of healthcare.
The role of genomic information in medical practice is evolving rapidly and has affected the diagnosis of disease as well as treatment decisions. Over the past decade, molecular diagnostic tests that analyze genomic material from surgical tissue samples have emerged as an important complement to evaluations performed by pathologists. Information at the molecular level enables one to understand more fully the makeup and specific subtype of disease to improve diagnosis. In many cases, the genomic information derived from these samples can help guide treatment decisions as part of the standard of care.
While genomic and technological advances are fueling the imagination about what is possible in medicine, we remain focused on delivering tests that change clinical decision making and improve patient outcomes.
We deploy machine learning methods and RNA expression to improve diagnostic clarity for cancer and other diseases. In our thyroid and lung cancer indications, diagnosis can be ambiguous in approximately 15-70% of patients undergoing diagnostic evaluation. Our tests provide clarity of diagnosis that can in turn guide treatment decisions in approximately half of those cases, eliminating costly, risky surgeries and other unnecessary medical procedures, improving the lives of patients and saving the healthcare system money.
Since our founding in 2008, we have commercialized three genomic tests that we believe are transforming diagnostics: the Afirma Gene Expression Classifier, or GEC, for thyroid cancer; the Percepta Bronchial Genomic Classifier for lung cancer; and the Envisia Genomic Classifier for idiopathic pulmonary fibrosis, or IPF. Collectively, we believe these three tests address a $2 billion global market opportunity.
Patients typically access our tests through their physician during the diagnostic process. All of our testing services are made available through our clinical reference laboratories located in San Francisco, California and Austin, Texas, which are each certified under the Clinical Laboratory Improvement Amendments of 1988, or CLIA.
The published evidence supporting our tests demonstrates the robustness of our science and clinical studies. Patients and physicians can access our full list of publications on our website. Nearly 30 clinical studies covering our products have been published, including two landmark clinical validation papers published in
The New England Journal of Medicine
. We continue to build upon our extensive library of clinical evidence. We also expect to continue expanding our offerings in thyroid cancer, lung cancer and interstitial lung diseases such as IPF, as well as other cancer indications that we believe will benefit from our technology and approach.
We believe our focus on developing clinically useful tests that change patient care is enabling the company to set new standards in genomic test reimbursement. Our flagship product, the Afirma GEC, is now covered for more than 200 million people in the U.S. for use in thyroid cancer diagnosis and our second commercial product, the Percepta classifier, is the first genomic test to gain Medicare coverage for improved lung cancer screening and diagnosis.
Company Background
We were incorporated in Delaware as Calderome, Inc. in August 2006. Calderome operated as an incubator until early 2008. We changed our name to Veracyte, Inc. in March 2008. Our principal executive offices are located at 6000 Shoreline Court, Suite 300, South San Francisco, California 94080 and our telephone number is (650) 243-6300. Our website address is www.veracyte.com. Our website and the information contained therein or connected thereto are not intended to be incorporated into this Annual Report on Form 10-K.
We make available free of charge on our website our annual report on Form 10-K, quarterly reports on Form 10-Q, current reports on Form 8-K and amendments to those reports as soon as reasonably practicable after we electronically file or furnish such materials to the Securities and Exchange Commission, or SEC. The reports are also available at www.sec.gov.
2
Fourth Quarter and Full-Year 2016 Financial Results
|
•
|
Revenue
for the three- and twelve-month periods ended December 31, 2016 was $18.3 million and $65.1 million, respectively, an increase of 30% and 31% over the prior year.
|
|
•
|
Afirma Gene Expression Classifier (GEC) Reported Volume
for the three- and twelve-month periods ended December 31, 2016 was 6,313 and 23,237, respectively, an increase of 13% and 20% over the prior year.
|
|
•
|
Operating Expenses
for the three- and twelve-month periods ended December 31, 2016, were $21.9 million and $93.9 million, respectively, an increase of 0% and 13% over the prior year.
|
|
•
|
Net Loss and Comprehensive Loss
for the three- and twelve-month periods ended December 31, 2016 was ($4.4) million and ($31.4) million, respectively, a 45% and 7% reduction from the prior year.
|
|
•
|
Cash and cash equivalents
was $59.2 million at December 31, 2016. During the twelve-month period ended December 31, 2016, the company raised $51.1 million in capital, including $19.2 million in net proceeds from its March 2016 debt financing and $31.9 million in net proceeds from a public offering of common stock.
|
|
•
|
Cash Burn
for the three- and twelve-month periods ended December 31, 2016 (which is defined as net cash used in operating activities and purchases of property and equipment), was $4.7 million and $32.2 million, respectively, a 33% and 3% improvement compared to the prior year.
|
2016 and Recent Business Highlights
Reimbursement:
|
•
|
Executed a Blues group-purchasing agreement in April 2016, accelerating Blues plan in-network contracting and overall reimbursement for the Afirma GEC thyroid cancer test. As of February 28, 2017, the company has more than 70 million Blues plan members under coverage and nearly 25 million under contract.
|
|
•
|
Expanded overall covered lives for the Afirma GEC by 50 million to nearly 225 million and overall contracted lives by 25 million to over 155 million as of February 28, 2017.
|
|
•
|
Achieved draft Medicare coverage policies for the Percepta Bronchial Genomic Classifier for use in lung cancer screening and diagnosis, leading to two final policies scheduled to become effective in March 2017.
|
Clinical Evidence and Commercial Expansion:
|
•
|
Clinical utility and cost-effectiveness data for the Percepta classifier were presented at the American Thoracic Society and the CHEST annual meetings, further suggesting that use of the Percepta classifier changes patient care and reduces healthcare costs as intended.
|
|
•
|
Launched the Envisia Genomic Classifier at the CHEST annual meeting in October 2016, in conjunction with the presentation of new data suggesting the test’s ability to significantly improve the diagnosis of IPF without the need for risky, expensive surgery.
|
Pipeline Advancements:
|
•
|
Presented data at the American Thyroid Association meeting in September 2016, demonstrating the potential for a next-generation Afirma GEC, planned for 2017 introduction, to substantially increase the percentage of patients with benign thyroid nodules who may be able to avoid unnecessary surgery.
|
|
•
|
Data were published in the
Journal of the National Cancer Institute
suggesting the potential for the “field of injury” technology behind Veracyte’s Percepta classifier to enable lung cancer detection using a simple, non-invasive nasal swab test.
|
3
Our Products
We strive to develop and commercialize products that become the standard of care. Since our founding in 2008 we have commercialized three products:
Afirma Thyroid FNA Analysis
- The center piece of our Afirma solution is the Afirma GEC, which employs a proprietary 142-gene signature to determine whether thyroid nodules previously classified by cytopathology as indeterminate can be reclassified as benign, thus enabling the patient to avoid an unnecessary surgery. An additional 25 genes are used to differentiate uncommon neoplasm subtypes. The Afirma GEC was the first product of its kind to market and we believe it is the clear market leader in its indication.
Percepta Bronchial Genomic Classifier -
The 23-gene Percepta classifier improves lung cancer screening and diagnosis by identifying patients at low risk of cancer among those whose lung nodules are not clearly benign or malignant following traditional evaluation. The test analyzes genomic changes that occur in the epithelial cells lining the airways of current or former smokers to assess a patient’s risk of having lung cancer, without the need to test the often-hard-to-reach nodule directly. The Percepta classifier is the first product of its kind to market and the first to obtain Medicare coverage for the improved screening and diagnosis of lung cancer.
Envisia Genomic Classifier
- Commercialized in October 2016, the Envisia classifier is designed to improve physicians’ ability to differentiate idiopathic pulmonary fibrosis, or IPF, from other interstitial lung diseases, or ILD, without the need for invasive and potentially risky surgery. The Envisia classifier uses machine learning coupled with powerful, deep RNA sequencing to detect the presence or absence of usual interstitial pneumonia, or UIP, a classic diagnostic pattern whose presence is essential for the diagnosis of IPF. The Envisia classifier is the first product of its kind to market and we expect it to gain Medicare coverage in 2018.
Our Pipeline
We believe we have a rich pipeline to sustain long-term growth. We characterize the stages of a product’s development as progressing from discovery to development, to commercialization, to Medicare coverage and, finally, to private insurance coverage. The following pipeline describes internally developed products, product extensions and new indications. We also continue to evaluate acquisitions of intellectual property and corporate acquisitions that we believe answer the right clinical questions.
Endocrinology
|
•
|
Enhanced Afirma GEC
- We are developing a product enhancement to our current Afirma test, which we believe will maintain the Afirma GEC's high sensitivity and negative predictive value, while potentially further increasing the test's specificity and thus the number of benign surgeries that can potentially be avoided.
|
|
•
|
Risk of Recurrence
- We are in the discovery phase for a risk of recurrence classifier.
|
Pulmonology
|
•
|
Expanded Indications for the Percepta
Classifier -
We are evaluating enhancements to our product, which we envision would allow us to expand the intended use population for our test.
|
|
•
|
Nasal Classifier
- We are in the discovery phase for a nasal test, based on our proprietary “field of injury” technology, that would potentially allow us to test patients at a different point in the clinical pathway of care.
|
|
•
|
Rx Response
- We are in the discovery phase for a test that could help guide treatment decisions for IPF patients based upon their genomic profile.
|
Market Opportunity
We believe diagnostic uncertainty is a critical healthcare issue that leads to hundreds of thousands of unnecessary surgeries, delayed or potentially harmful treatments and billions of wasted healthcare dollars each year. We believe that our three commercial tests address a $2 billion global market opportunity and that our markets are expanding due to increased screening or other market factors.
4
Thyroid Market Opportunity for Our Afirma Solution
Each year in the United States, we estimate that among the 525,000 patients who undergo a fine needle aspiration, or FNA, biopsy, 15 to 30 percent of results are inconclusive, or indeterminate, meaning not clearly benign or malignant. Historically, most of these patients were directed to thyroid surgery for a more definitive diagnosis. Following surgery, however, 70 to 80 percent of cases proved to be benign, meaning the surgery was unnecessary. We believe our Afirma test classifies approximately 50% of the indeterminate cases on which it is used as benign, thereby potentially enabling up to 80,000 surgeries to be avoided annually.
We believe the addressable market opportunity for our Afirma solution is approximately $800 million globally, $500 million in the United States and $300 million internationally. We believe that we have penetrated approximately 25 to 30 percent of the United States thyroid FNA market for the Afirma GEC. We currently do not have meaningful operations or sales outside the United States.
We announced in 2016 that we are working on an enhanced version of our Afirma GEC that we believe will further reduce unnecessary surgeries by reclassifying inconclusive biopsies as benign from 50% currently up to 70% while maintaining high sensitivity and negative predictive value, or NPV (i.e., probability that patients with a negative test result truly do not have thyroid cancer).
Lung Cancer Market Opportunity for Our Percepta Classifier
Lung cancer is often difficult to diagnose without invasive, risky and costly surgeries. Approximately 225,000 people are diagnosed with lung cancer each year in the U.S. and nearly 160,000 people die annually from lung cancer. We estimate that approximately 1.8 to 2.0 million lung nodules are identified in patients in the United States each year and that doctors perform approximately 350,000 bronchoscopies on these patients. A bronchoscopy is a non-surgical procedure that is often used to evaluate patients with potentially cancerous lung nodules. We estimate that approximately 140,000 of these patients have inconclusive bronchoscopy results and could potentially benefit from our test. We believe our Percepta product can classify approximately 44% of these patients as low risk or very low risk for lung cancer, saving approximately 60,000 patients from potentially having to undergo diagnostic surgeries.
We believe the addressable market opportunity for our Percepta product is approximately $425 million to $525 million in the United States and over $200 million in Europe. We anticipate the market will expand significantly over the coming years as lung cancer screening programs are implemented in the United States and physicians embrace bronchoscopy as a standard, less-invasive diagnostic modality for evaluating lung nodules and lesions.
In February 2017, Palmetto GBA, a Medicare Administrative Contractor or MAC, issued a final coverage policy for the Percepta classifier under the Medicare MolDx program. The LCD makes the Percepta classifier the first genomic test to be covered by Medicare for improved lung cancer screening and diagnosis. The policy will become effective on March 13, 2017 and provides a framework for other MolDx-participating MACs to follow. CGS Administrators, LLC also issued a final LCD for the Percepta test and Noridian Healthcare Solutions is expected to similarly finalize its draft LCD. These final decisions will make the Percepta classifier a covered benefit for more than 35 million individuals, or nearly two thirds of the 57 million Medicare beneficiaries in the United States. We are currently building our commercial operations to support the commercialization of the Percepta classifier.
IPF Market Opportunity for Our Envisia Classifier
Each year in the United States and Europe, up to 200,000 patients are suspected of having an ILD, including IPF, which is among the most common and deadly of these lung-scarring diseases. IPF is notoriously difficult to diagnose, often leading to treatment delays, repeated misdiagnoses, patient distress and added healthcare expense. Physicians routinely use high-resolution computed tomography imaging, or HRCT, to identify UIP, the pattern whose presence is essential to IPF diagnosis. This approach, however, frequently provides inconclusive results, leading many patients to require surgery to secure a more definitive diagnosis using surgical histopathology. These surgeries are risky and expensive, and many patients are too frail to undergo the procedure. Of the approximate 200,000 patients evaluated for ILD, we estimate that approximately 75% or 150,000 patients receive an uncertain diagnosis and are candidates for our Envisia test.
We believe the addressable market opportunity for our Envisia product is approximately $300 million to $350 million in the United States and over $200 million in Europe. We began making the Envisia classifier available to a limited number of institutions in December 2016 and plan to continue a controlled availability as we build the full package of clinical evidence to support Medicare reimbursement.
5
Scientific Background
In the past, clinicians made diagnoses from biopsy samples by looking at them under a microscope. Technology has advanced far beyond this, and scientists now have the ability to decipher genomic patterns that reside in the DNA and RNA of the biopsies we test. Ultimately, we search for patterns that tell us whether or not the biopsy contains the disease in question. We do this by using a whole-genome approach. This means we look at all of the human genes, including their expression patterns and their variants and mutations, rather than just looking at a few selected genes that we think may be important. This complex information requires computer-based algorithms to make sense of the patterns. This comprehensive measurement of the human genome allows us to detect signals from genes we may not have previously suspected to be involved in disease.
We use machine learning computer-based algorithms to match genomic patterns with clinical truth, or the true diagnosis. For example, when we train an algorithm on RNA sequencing data, we teach it to associate a set of expression patterns with disease and a different set of patterns with lack of disease. When algorithms are trained on enough examples with clinical truth, they learn to find that pattern in samples they have never encountered, thus allowing the algorithm to predict disease in a clinical setting.
Our core products are built around algorithms that either rule-in or rule-out disease. Due to the complex, sometimes rare, subtypes of various diseases like cancer, we develop and train our machine learning algorithms using a diverse set of patient samples so that they are equipped to recognize patterns across the whole spectrum of conditions that may be encountered in the clinic.
Our process uses commercially available reagents and instruments with our own proprietary process and protocols, which results in RNA extraction from the range of biopsies used in our clinical development studies and our commercial laboratory tests.
Technology
Our technology approach is comprised of a number of key attributes:
Core Expertise in Broad-based Genomic Analysis
- Our team of bioinformatics and computational scientists possess extensive knowledge of both existing computational methods as well as the capacity to develop proprietary methods as needed for algorithm design. We demonstrated our ability to utilize large amounts of genomic data with machine learning algorithms in the development of the Afirma GEC on microarrays. We have extended this capability substantially by accessing genomic features through deep RNA sequencing. This allows us to use a combination of expression analysis as well as mutations and variants to build our sophisticated machine learning algorithms, all on the same platform.
Platform-Agnostic Approach
- We are not reliant on any one technology platform to measure genomic signals; in fact, we may take advantage of a multitude of genomic methodologies to develop future tests. When we developed the Afirma GEC in 2008, microarray technologies were a cost-effective discovery technology compared to other approaches that were nascent at the time. More recently, the rapid cost reductions achieved in next generation sequencing platforms have allowed us to pursue our whole genome approach to biomarker discovery using a range of genomic features obtained through both DNA and RNA sequencing. From this vast array of sequence data, our algorithms select those genomic signals that inform on the disease in question, in the relevant biopsy sample. We continue to evaluate potential opportunities to use new genomic discoveries and technologies to further improve patient care.
Proprietary Capabilities in Analyzing Small, Heterogeneous Cytology Samples -
We have developed proprietary technology, intellectual property and know-how for optimized methods for extraction and analysis of nanogram quantities of RNA from small biopsy samples. Our focus is on redefining clinical truth, using patient samples obtained through less-invasive techniques, thereby increasing access to our technology by a larger patient population. While others can extract RNA from these small biopsies, we believe our process optimized and scaled for high-throughput clinical testing and large-scale clinical development studies, such as those involving amplification and hybridization to high-density microarrays.
Precision and Reproducibility
- We have in place standard operating procedures governing reagents, materials, instruments and controls and extensive experience from numerous verification studies performed for our tests. We apply the same high-quality control methods that were developed for our reagents and processes, along with our proprietary software for automation, sample tracking, data quality control and statistical analysis, to our development process.
6
Studies Validating Test Performance and Clinical Utility
In 2010, the Centers for Disease Control and Prevention published the “ACCE” model as a paradigm for establishing evidence to confirm the safety and effectiveness of molecular diagnostic tests. ACCE derives its name from the main criteria for evaluating such tests, including analytic validity, clinical validity and clinical utility. This model has been adopted by most technology assessment groups, professional societies and payers. We fully embrace this paradigm of evidence development and we strive to provide the highest level of scientific evidence to support our test claims.
We believe that developing an extensive library of rigorous clinical evidence to support our tests is critical to driving inclusion in clinical guidelines, securing reimbursement and gaining physician adoption. We make our published research, abstracts from medical conferences and other product information available on our website at www.veracyte.com. Our website and the information contained therein or connected thereto are not intended to be incorporated into this Annual Report on Form 10-K.
Our Afirma product is supported by more than 20 published scientific studies, including a prospective, multicenter clinical validation study published in
The New England Journal of Medicine
, which suggested that the test can reduce the number of unnecessary surgeries by 50 percent. The Afirma product is recommended in leading practice guidelines and is covered for over 200 million lives in the United States, including through Medicare and most commercial insurance plans.
Our Percepta test is supported by six published scientific studies, including data published in
The New England Journal of Medicine
, which demonstrate the test’s accuracy in identifying patients who are at low risk of cancer following inconclusive results from bronchoscopy. These patients may then be monitored with CT scans in lieu of undergoing surgery - a frequent next step at this juncture of the clinical pathway. A clinical utility study published in the journal
CHEST
suggested that use of the test may reduce unnecessary surgeries by 50 percent in the target patient population.
We continue to build our library of clinical evidence to support our Envisia product. Our test is supported by one clinical validation study with a second validation (manuscript) in process, one analytical validation study, and two clinical utility studies that demonstrate the unmet clinical need and potential utility of the test when used by subspecialty physicians. We plan to launch a prospective multicenter randomized trial to demonstrate the clinical utility of the test compared to the current standard of care.
Commercial Operations
Our commercial infrastructure, including our sales, marketing, managed care, and customer care functions, is critical to our ongoing success. We have built a strong domestic sales, marketing and reimbursement capability that interacts directly with users of our products, as well as payers and other stakeholders involved in the diagnostic workup of a patient.
Our sales team is structured to sell all of our products; we do not maintain a separate sales force for each product. Currently, our sales force is comprised of our Product Specialists, who are accountable for select geographic territories; Institutional Channel Managers, who maintain and grow our relationships at multi-disciplinary hospital and integrated delivery network customers; Account Managers, who manage existing client relationships; and Clinical Science Specialists, who focus on addressing medical and clinical education in the field.
In September 2016, we terminated our U.S. co-promotion agreement with Genzyme Corporation, which we had entered in 2012. In anticipation of this event, we hired additional sales people and, as of December 31, 2016, we had 45 field sales people. In 2017, we expect to invest further in our sales force and to hire an additional 15-20 field sales people, mostly in the first half of the year.
To date, substantially all of our revenue has been derived from customers we serve in the United States. Through December 31, 2016, we derived substantially all of our revenue from our Afirma solution, including cytopathology services and the Afirma GEC.
Through third-party promotion agreements and distribution agreements, we entered the Brazil market in 2014 and the Israel, Middle East and North Africa markets in 2015. We do not expect meaningful revenue from international sales in the near future.
Industry trade shows or events provide us with an opportunity to make important product announcements, communicate directly with our clients and partners and to interact with key opinion leaders who impact our business. We typically attend a number of select industry conferences, including the Annual Meeting of the American Thyroid Association, or ATA; the Annual Scientific and Clinical Congress of the American Association of Clinical Endocrinologists, or AACE; the Endocrine Society’s Annual Meeting, or ENDO; the American Thoracic Society’s International Conference, or ATS; and the American College of Chest Physician’s CHEST Annual Meeting.
7
Laboratory Operations
We perform all of our genomic testing in our CLIA-certified laboratory in South San Francisco, California. We perform slide preparation and staining for cytopathology on fine needle aspiration, or FNA, samples in our CLIA certified laboratory in Austin, Texas. Our South San Francisco facility is responsible for quality assurance oversight, licensing and regulatory compliance and maintenance for both of our laboratories to ensure data integrity and consistent, validated processes.
We receive samples for testing directly from the following sources:
FNAs for Afirma GEC Only
- Institutions and other clients, such as laboratories, that perform their own cytopathology may send us FNA samples from indeterminate results to perform the Afirma GEC. From time-to-time we refer to this as our “Afirma Diagnostic Partner” model. We receive about 15% of our FNA samples and over 50% of our Afirma GEC volume from this source and we believe it is the fastest-growing segment of our business.
FNAs for Cytopathology and Reflexed Afirma GECs
- About 85% of the FNA samples we receive from ordering physicians include the request for cytopathology assessment and if results are indeterminate, the Afirma GEC is to be performed. We partner with Thyroid Cytopathology Partners, or TCP, to perform the cytopathology review. Less than 50% of our Afirma GEC volume comes from this model.
Bronchoscopy Samples for Percepta Classifier
- Institutions and laboratories that perform their own cytopathology may send us samples collected during the bronchoscopy procedure and order genomic testing with the Percepta classifier when bronchoscopy results are inconclusive.
In 2016, we moved into a state-of-the-art laboratory space that we built out in South San Francisco, California. We believe that we have sufficient laboratory capacity to accommodate volume growth for our existing products and products in our pipeline.
We rely on TCP to provide professional cytopathology diagnoses on thyroid FNA samples pursuant to a pathology services agreement. TCP has the exclusive right to provide the cytopathology diagnoses on FNA samples that are referred to us at a fixed price per test with volume discounts. TCP can terminate the agreement upon our failure to pay any amounts due under the contract, and either we or TCP can terminate the agreement upon the insolvency of the other party, breach of the agreement by the other party, termination or breach of the service terms or the suspension or termination of the necessary regulatory licenses and approvals needed to perform the FNA diagnoses. TCP is co-located in a portion of our facilities in Austin, Texas and reimburses us for a portion of our actual out-of-pocket rental and related operating expense costs. Our agreement with TCP was effective until December 31, 2015 and thereafter automatically renews every year unless either party provides notice of intent not to renew at least twelve months prior to the end of the then-current term.
Our quality assurance function oversees the quality of our laboratories as well as the quality systems used in research and development, client services, billing operations and sales and marketing. We have an established quality management system compliant with federal and state regulations and standards that we believe achieves excellence in operations across the entire business. We continuously monitor and strive to improve our quality program and believe our implementation of these processes has supported our achievement of product performance, customer satisfaction and retention and a philosophy of continuous improvement.
Reimbursement Strategy
We employ a multi-pronged strategy designed to achieve broad coverage and reimbursement for our tests:
|
•
|
Compile a Growing Library of Peer-reviewed Studies that Demonstrate the Test Is Effective
- To date, several peer-reviewed articles and review papers have been published and have helped support our efforts aimed at widespread adoption and reimbursement of our genomic tests. In each disease area we pursue, we intend to conduct studies in order to develop robust library of evidence.
|
|
•
|
Meet the Evidence Standards Necessary to Be Consistent with Leading Clinical Guidelines
- We believe inclusion in leading clinical practice guidelines plays an important role in payers' coverage decisions. For example, the data published on the Afirma GEC to date is consistent with the recommendations of the widely-recognized American Thyroid Association and National Comprehensive Cancer Network clinical practice guidelines.
|
8
|
•
|
Execute an Internal Managed Care and Claims Adjudication Function as Part of Our Core Business Operations
- We believe that obtaining adequate and widespread reimbursement is a critical factor in our long-term success. We employ a team of in-house claims processing and reimbursement specialists who work with payers, physician practices and patients to obtain maximum reimbursement.
|
|
•
|
Cultivate a Network of Key Opinion Leaders -
Key opinion leaders are able to influence clinical practice by publishing research and determining whether new tests should be integrated into practice guidelines. We collaborate with key opinion leaders early in the development process to ensure our clinical studies are designed and executed in a way that clearly demonstrates the benefits of our tests to patients, physicians and payers. Ongoing studies to support real world experience with our tests are also a key component of our efforts to collaborate with physician thought leaders.
|
|
•
|
Established Payer Relationships and In-network Contracts -
We believe that positive engagement with payers leads to coverage decisions and facilitates our efforts on coverage and contract decisions for subsequent tests.
|
Coverage, Coding and Reimbursement
Revenue from our Afirma tests comes from several sources, including commercial third-party payers, such as insurance companies and health maintenance organizations, government payers, such as Medicare and Medicaid, and patients. We believe that reimbursement for our lung products will be derived from similar sources, but with a greater proportion coming from Medicare and potentially Medicaid due to the older age of the target patient population.
We received Medicare coverage for our Afirma GEC in 2012 and since that time our Medicare rate has remained approximately $3,200 for our test. We bill payers directly for the Afirma GEC using a unique Current Procedural Terminology code, or CPT code 81545.
To date, a high percentage of FNA samples received are accessioned for cytopathology, for which we bill both the technical and professional component using established CPT codes.
In February 2017, Palmetto GBA, a Medicare Administrative Contractor or MAC, issued a final coverage policy for our Percepta classifier through the Medicare MolDx program and CGS Administrators, LLC followed suit. We expect to receive a final coverage decision in the first half of 2017 from Noridian Healthcare Solutions, the remaining MAC that issued a draft local coverage policy for the test in 2016. We plan to bill payers directly for the Percepta classifier using a “miscellaneous” CPT code until we seek and obtain a specific code for the test.
We rely on a small number of third-party payers for a significant portion of our revenue, the loss of one or more of which would have a negative effect on our business. For the years ended December 31, 2016, 2015 and 2014, respectively, revenue was represented by the indicated percent for each payer:
|
•
|
Medicare accounted for 27%, 26% and 26% of our revenue;
|
|
•
|
UnitedHealthcare accounted for 12%, 14% and 18% of our revenue; and
|
|
•
|
Aetna accounted for 8%, 9% and 11% of our revenue.
|
Competition
We believe the principal competitive factors in the markets we target with our tests include:
|
•
|
the ability of the test to answer the appropriate clinical question at the right point in the clinical pathway;
|
|
•
|
the quality and strength of clinical validation and utility data;
|
|
•
|
confidence in diagnostic results backed by analytical verification data;
|
|
•
|
the extent of reimbursement and in-network payer contracts;
|
|
•
|
inclusion in practice guidelines;
|
|
•
|
cost-effectiveness; and
|
|
•
|
ease of use.
|
We believe we compete favorably on the factors described above with our Afirma solution and are positioning ourselves to compete effectively on these factors with our Percepta and Envisia classifiers.
9
Our principal competition for the Afirma GEC comes from traditional methods used by physicians to diagnose thyroid cancer. Physicians in the United States have historically recommended that patients with indeterminate diagnoses from cytopathology results be considered for surgery to remove all or part of the thyroid to rule out cancer. This practice has been the standard of care in the United States, as well as in many international markets, for many years, and we continue to educate physicians about the benefits of our test in order to change clinical practice.
We also face competition from companies and academic institutions that use next generation sequencing technology or other methods to measure mutational markers such as BRAF and KRAS, along with numerous other mutations. These organizations include Interpace Diagnostics Group, Inc., Rosetta Genomics Ltd., and others who are developing new products or technologies that may compete with our tests. In the future, we may also face competition from companies developing new products or technologies.
With the Percepta and Envisia tests, we believe our primary competition will similarly come from traditional methods used by physicians to diagnose the related diseases. For the Percepta test, we expect competition from companies focused on lung cancer such as Integrated Diagnostics, Inc. We also anticipate facing potential competition from companies offering or developing approaches for assessing malignancy risk in patients with lung nodules using alternative samples, such as blood, urine or sputum. However, such "liquid biopsies" are often used earlier in the diagnostic paradigm—for instance, to screen for cancer—or to gauge risk of recurrence or response to treatment.
In general, we also face competition from commercial laboratories, such as Laboratory Corporation of America Holdings, Quest Diagnostics Incorporated and Sonic Healthcare USA with strong infrastructure to support the commercialization of diagnostic services. We face potential competition from companies such as Illumina, Inc. and Thermo Fisher Scientific Inc., both of which have entered the clinical diagnostics market. Other potential competitors include companies that develop diagnostic products, such as Roche Diagnostics, a division of Roche Holding Ltd, Siemens AG and Qiagen N.V.
Competitors may develop their own versions of our solution in countries in which we do not have patents or where our intellectual property rights are not recognized and compete with us in those countries, including encouraging the use of their solution by physicians in other countries.
Many of our potential competitors have widespread brand recognition and substantially greater financial, technical and research and development resources and selling and marketing capabilities than we do. Others may develop products with prices lower than ours, which could be viewed by physicians and payers as functionally equivalent to our solution, or offer solutions at prices designed to promote market penetration, which could force us to lower the list price of our solutions and affect our ability to achieve profitability. If we are unable to change clinical practice in a meaningful way or compete successfully against current and future competitors, we may be unable to increase market acceptance and sales of our products, which could prevent us from increasing our revenue or achieving profitability and could cause the market price of our common stock to decline. As we add new tests and services, we will face many of these same competitive risks for these new tests.
Regulation
Clinical Laboratory Improvement Amendments of 1988, or CLIA
As a clinical reference laboratory, we are required to hold certain federal, state and local licenses, certifications and permits to conduct our business. Under CLIA, we are required to hold a certificate applicable to the type of laboratory examinations we perform and to comply with standards covering personnel, facilities administration, quality systems and proficiency testing.
We have current certificates under CLIA to perform testing at each of our locations. To renew our CLIA certificates, we are subject to survey and inspection every two years to assess compliance with program standards. The regulatory and compliance standards applicable to the testing we perform may change over time, and any such changes could have a material effect on our business.
If one of our clinical reference laboratories is out of compliance with CLIA requirements, we may be subject to sanctions such as suspension, limitation or revocation of our CLIA certificate, as well as directed plan of correction, state on-site monitoring, civil money penalties, civil injunctive suit or criminal penalties. We must maintain CLIA compliance and certification to be eligible to bill for diagnostic services provided to Medicare beneficiaries. If we were to be found out of compliance with CLIA requirements and subjected to sanction, our business could be harmed.
10
State Laboratory Licensing
California Laboratory Licensing
In addition to federal certification requirements of laboratories under CLIA, licensure is required and maintained for our South San Francisco clinical reference laboratory under California law. Such laws establish standards for the day-to-day operation of a clinical reference laboratory, including the training and skills required of personnel and quality control. In addition, California laws mandate proficiency testing, which involves testing of specimens that have been specifically prepared for the laboratory.
If our clinical reference laboratory is out of compliance with California standards, the California Department of Public Health, or CDPH, may suspend, restrict or revoke our license to operate our clinical reference laboratory, assess substantial civil money penalties, or impose specific corrective action plans. Any such actions could materially affect our business. We maintain a current license in good standing with CDPH. However, we cannot provide assurance that CDPH will at all times in the future find us to be in compliance with all such laws.
New York Laboratory Licensing
Our clinical reference laboratories are required to be licensed by New York, under New York laws and regulations before we receive specimens from New York State. The license establishes standards for:
quality management systems;
qualifications, responsibilities, and training;
facility design and resource management;
pre-analytic, analytic (including validation and quality control), and post-analytic systems; and
quality assessments and improvements.
New York law also mandates proficiency testing for laboratories licensed under New York state law, regardless of whether such laboratories are located in New York. If a laboratory is out of compliance with New York statutory or regulatory standards, the New York State Department of Health, or NYSDOH, may suspend, limit, revoke or annul the laboratory's New York license, censure the holder of the license or assess civil money penalties. Statutory or regulatory noncompliance may result in a laboratory's operator being found guilty of a misdemeanor under New York law. NYSDOH also must approve the LDT before the test is offered in New York; approval has been received for the Afirma GEC and the Percepta classifier. Should we be found out of compliance with New York laboratory standards of practice, we could be subject to such sanctions, which could harm our business. We maintain a current license in good standing with NYSDOH for our South San Francisco and Austin laboratories. We cannot provide assurance that the NYSDOH will at all times find us to be in compliance with applicable laws.
Other States' Laboratory Licensing
In addition to New York and California, other states including Florida, Maryland, Pennsylvania and Rhode Island, require licensing of out-of-state laboratories under certain circumstances. We have obtained licenses from states where we believe we are required to be licensed, and believe we are in compliance with applicable licensing laws.
From time to time, we may become aware of other states that require out-of-state laboratories to obtain licensure in order to accept specimens from the state, and it is possible that other states do have such requirements or will have such requirements in the future. If we identify any other state with such requirements or if we are contacted by any other state advising us of such requirements, we intend to comply with such requirements.
United States
Food and Drug Administration: Diagnostic Kits
Diagnostic kits, including collection systems, that are sold and distributed through interstate commerce are regulated as medical devices by the FDA. Devices subject to FDA regulation must undergo premarket review prior to commercialization unless the device is of a type exempted from such review. In addition, manufacturers of medical devices must comply with various regulatory requirements under the Federal Food, Drug, and Cosmetic Act, or FDC Act, and implementing regulations promulgated
11
under that Act. Entities that fail to comply with FDA requirements may be subject to issuance of notice of observations, untitled or warning letters, and can be liable for criminal or civil penalties, such as recalls, import detentions, seizures, or injunctions, including orders to cease manufacturing.
The FDC Act classifies medical devices into one of three categories based on the risks associated with the device and the level of control necessary to provide reasonable assurance of safety and effectiveness. Class I devices are deemed to be low risk and are subject to the fewest regulatory controls. Many Class I devices are exempt from FDA premarket review requirements. For Class II devices, the FDA generally requires clearance through the premarket notification, or 510(k) clearance process. Class III devices are generally the highest risk devices and are subject to the highest level of regulatory control to provide reasonable assurance of the device's safety and effectiveness. Class III devices must typically be approved by the FDA before they are marketed.
Generally, establishments that manufacture or distribute devices, including manufacturers, repackagers and relabelers, specification developers, and initial importers, are required to register their establishments with the FDA and provide the FDA a list of the devices that they handle at their facilities.
After a device is placed on the market, numerous regulatory requirements apply. These include: all of the relevant elements of the Quality System Regulation, or QSR, labeling regulations, restrictions on promotion and advertising, the Medical Device Reporting regulation (which requires that manufacturers report to the FDA if their device may have caused or contributed to a death or serious injury or malfunctioned in a way that would likely cause or contribute to a death or serious injury if it were to recur), and the Reports of Corrections and Removals regulation (which requires manufacturers to report certain recalls and field actions to the FDA).
The FDA has issued a regulation outlining specific requirements for "specimen transport and storage containers." "Specimen transport and storage containers" are medical devices "intended to contain biological specimens, body waste, or body exudate during storage and transport" so that the specimen can be used effectively for diagnostic examination. A specimen transport and storage container that is not labeled or otherwise represented as sterile, is a Class I exempt device. It is subject to MDR requirements, the reporting of corrections and removals, registration and listing. It is exempt from premarket review and from QSR requirements, except for recordkeeping and complaint handling requirements, so long as no sterility claims are made. Our facility is registered with the FDA as a specification developer, which means that we can sell the collection system under our own name and outline the specifications used to make the collection system, but a third party assembles the collection system for us. The containers we provide for collection and transport of Afirma GEC and Percepta samples from a physician to our clinical reference laboratory are listed as Class I devices with the FDA. We also plan to list our sample collection containers for Envisia samples with the FDA as Class I devices. If the FDA were to determine that our sample collection containers are not Class I devices, we would be required to file 510(k) applications and obtain FDA clearance to use the containers, which could be time consuming and expensive.
The FDA enforces the requirements described above by various means, including inspection and market surveillance. If the FDA finds a violation, it can institute a wide variety of enforcement actions, ranging from an Untitled Letter or Warning Letter to more severe sanctions such as:
fines, injunctions, and civil penalties;
recall or seizure of products;
operating restrictions, partial suspension or total shutdown of production; and
criminal prosecution.
Federal Oversight of Laboratory Developed Tests and Research Use Only Products
Clinical laboratory tests like our proprietary genomic tests are regulated under CLIA, as administered by CMS, as well as by applicable state laws. Clinical laboratory tests that are developed and validated by a laboratory for its own use, which are referred to as laboratory developed tests, or LDTs, currently are generally not subject to FDA regulation, although reagents, instruments, software or components provided by third parties and used to perform LDTs may be subject to regulation. We believe that the Afirma GEC and the Percepta and Envisia classifiers are LDTs. FDA currently exercises its enforcement discretion for LDTs. In October 2014, the FDA published draft guidance documents describing the framework by which they might regulate LDTs. The framework is similar to the guidance they issued previously. The comment period ended in February 2015. In November 2016, the FDA announced that they would not issue a final guidance on the oversight of LDTs. In January 2017, the FDA issued a discussion paper on LDTs to synthesis of all the feedback received from various stakeholders; this did not represent a formal position of the FDA, nor is it enforceable.
12
Some of the materials we use for our tests and that we may use for future tests are for research use only, or RUO. An RUO product is not intended for human clinical use and must be labeled "For Research Use Only. Not for use in diagnostic procedures." RUOs are a separate regulatory category and are not considered medical devices. They are therefore not subject to the FDA regulatory requirements discussed above. They cannot make any claims related to safety, effectiveness, or diagnostic utility or be intended for human clinical diagnostic or prognostic use. In November 2013, the FDA issued guidance regarding "Commercially Distributed In-Vitro Diagnostic Products Labeled for Research Use Only or Investigational Use Only."
We cannot predict the ultimate form or impact of any such RUO, LDT or other guidance and the potential effect on our solutions or materials used to perform our diagnostic services. While we qualify all materials used in our diagnostic services according to CLIA regulations, we cannot be certain that the FDA might not promulgate rules or issue guidance documents that could affect our ability to purchase materials necessary for the performance of our diagnostic services. Should any of the reagents obtained by us from vendors and used in conducting our diagnostic services be affected by future regulatory actions, our business could be adversely affected by those actions, including increasing the cost of service or delaying, limiting or prohibiting the purchase of reagents necessary to perform the service.
We cannot provide any assurance that FDA regulation, including premarket review, will not be required in the future for our diagnostic services, whether through additional guidance or regulations issued by the FDA, new enforcement policies adopted by the FDA or new legislation enacted by Congress. Legislative proposals addressing oversight of LDTs were introduced in recent years, and we expect that new legislative proposals will be introduced from time to time. It is possible that legislation could be enacted into law or regulations or guidance could be issued by the FDA which may result in new or increased regulatory requirements for us to continue to offer our tests or to develop and introduce new tests.
If premarket review, including approval, is required, our business could be negatively affected until such review is completed and clearance to market or approval is obtained, and the FDA could require that we stop selling our tests pending premarket clearance or approval. If our tests are allowed to remain on the market but there is uncertainty about the legal status of our services, if we are required by the FDA to label them investigational, or if labeling claims the FDA allows us to make are limited, order levels may decline and reimbursement may be adversely affected. The regulatory process may involve, among other things, successfully completing additional clinical studies and submitting a premarket notification or filing a PMA application with the FDA. If premarket review is required by the FDA, there can be no assurance that our tests will be cleared or approved on a timely basis, if at all, nor can there any be assurance that labeling claims will be consistent with our current claims or adequate to support continued adoption of and reimbursement for our solutions. Ongoing compliance with FDA regulations would increase the cost of conducting our business, and subject us to heightened requirements of the FDA and penalties for failure to comply with these requirements. We may also decide voluntarily to pursue FDA premarket review of our tests if we determine that doing so would be appropriate.
Health Insurance Portability and Accountability Act
Under the federal Health Insurance Portability and Accountability Act of 1996, or HIPAA, the Department of Health and Human Services, or HHS, has issued regulations to protect the privacy and security of protected health information used or disclosed by health care providers, such as us. HIPAA also regulates standardization of data content, codes and formats used in health care transactions and standardization of identifiers for health plans and providers. Penalties for violations of HIPAA regulations include civil and criminal penalties.
We have developed and implemented policies and procedures designed to comply with these regulations. The requirements under these regulations may change periodically and could have an effect on our business operations if compliance becomes substantially more costly than under current requirements.
In addition to federal privacy regulations, there are a number of state laws governing confidentiality of health information that are applicable to our business. New laws governing privacy may be adopted in the future from time to time. We have taken steps to comply with health information privacy requirements to which we are aware that we are subject. However, we can provide no assurance that we are or will remain in compliance with diverse privacy requirements in all of the jurisdictions in which we do business. Failure to comply with privacy requirements could result in civil or criminal penalties, which could have a materially adverse effect on our business.
13
Corporate Practice of Medicine
Numerous states, including California and Texas, have enacted laws prohibiting corporations such as us from practicing medicine and employing or engaging physicians to practice medicine. These laws are designed to prevent interference in the medical decision-making process by anyone who is not a licensed physician. This prohibition is generally referred to as the prohibition against the corporate practice of medicine. Violation of this prohibition may result in civil or criminal fines, as well as sanctions imposed against us or the professional through licensing proceedings. The pathologists who review and classify thyroid FNA cytopathology results for Afirma are employed by Thyroid Cytopathology Partners, a Texas professional association, pursuant to services agreement between us and TCP. Pursuant to the agreement, we pay TCP a monthly fee on a per FNA basis, and TCP manages and supervises the pathologists who perform the cytopathology services as a component of the Afirma solution. TCP is managed by Pathology Resources Consultants, or PRC, which provides management and other services to medical practitioners. We have entered into a services agreement with PRC in connection with our arrangement with TCP, pursuant to which we engaged PRC exclusively to manage the pathology services being provided by TCP. Our agreement with PRC was effective until December 31, 2015 and thereafter automatically renews every year unless either party provides notice of intent not to renew at least twelve months prior to the end of the then-current term.
Federal and State Physician Self-Referral Prohibitions
We are subject to the federal physician self-referral prohibitions, commonly known as the Stark Law, and to similar restrictions under California's Physician Ownership and Referral Act, or PORA. Together these restrictions generally prohibit us from billing a patient or any governmental or private payer for any diagnostic services when the physician ordering the service, or any member of such physician's immediate family, has an investment interest in or compensation arrangement with us, unless the arrangement meets an exception to the prohibition.
Both the Stark Law and PORA contain an exception for compensation paid to a physician for personal services rendered by the physician. We have compensation arrangements with a number of physicians for personal services, such as speaking engagements and consulting activities. We have structured these arrangements with terms intended to comply with the requirements of the personal services exception to Stark and PORA.
However, we cannot be certain that regulators would find these arrangements to be in compliance with Stark, PORA or similar state laws. We would be required to refund any payments we receive pursuant to a referral prohibited by these laws to the patient, the payer or the Medicare program, as applicable.
Sanctions for a violation of the Stark Law include the following:
•
denial of payment for the services provided in violation of the prohibition;
•
refunds of amounts collected by an entity in violation of the Stark Law;
•
a civil penalty of up to $15,000 for each service arising out of the prohibited referral;
•
possible exclusion from federal healthcare programs, including Medicare and Medicaid; and
•
a civil penalty of up to $100,000 against parties that enter into a scheme to circumvent the Stark Law's prohibition.
These prohibitions apply regardless of the reasons for the financial relationship and the referral. No finding of intent to violate the Stark Law is required for a violation. In addition, knowing violations of the Stark Law may also serve as the basis for liability under the Federal False Claims Act.
Further, a violation of PORA is a misdemeanor and could result in civil penalties and criminal fines. Finally, other states have self-referral restrictions with which we have to comply that differ from those imposed by federal and California law. While we have attempted to comply with the Stark Law, PORA and similar laws of other states, it is possible that some of our financial arrangements with physicians could be subject to regulatory scrutiny at some point in the future, and we cannot provide assurance that we will be found to be in compliance with these laws following any such regulatory review.
Federal and State Anti-Kickback Laws
The Federal health care program Anti-kickback Law makes it a felony for a person or entity, including a laboratory, to knowingly and willfully offer, pay, solicit or receive remuneration, directly or indirectly, in order to induce business that is reimbursable under any federal health care program. A violation of the Anti-kickback Law may result in imprisonment for up to five years and fines of up to $250,000 in the case of individuals and $500,000 in the case of organizations. Convictions under the Anti-kickback Law result in mandatory exclusion from federal health care programs for a minimum of five years. In addition, HHS has the authority to impose civil assessments and fines and to exclude health care providers and others engaged in prohibited
14
activities from Medicare, Medicaid and other federal health care programs. Actions which violate the Anti-kickback Law also incur liability under the Federal False Claims Act, which prohibits knowingly presenting, or causing to be presented, a false or fraudulent claim for payment to the U.S. Government.
Although the Anti-kickback Law applies only to federal health care programs, a number of states, including California, have passed statutes substantially similar to the Anti-kickback Law pursuant to which similar types of prohibitions are made applicable to all other health plans and third- party payers. Both California's fee-splitting statute, Business and Professions Code Section 650, and its Medi-Cal anti-kickback statute, Welfare and Institutions Code Section 14107.2, have been interpreted by the California Attorney General and California courts in substantially the same way as HHS and the courts have interpreted the Anti-kickback Law. A violation of Section 650 is punishable by imprisonment and fines of up to $50,000. A violation of Section 14107.2 is punishable by imprisonment and fines of up to $10,000.
Federal and state law enforcement authorities scrutinize arrangements between health care providers and potential referral sources to ensure that the arrangements are not designed as a mechanism to induce patient care referrals or induce the purchase or prescribing of particular products or services. The law enforcement authorities, the courts and Congress have also demonstrated a willingness to look behind the formalities of a transaction to determine the underlying purpose of payments between health care providers and actual or potential referral sources. Generally, courts have taken a broad interpretation of the scope of the Anti-kickback Law, holding that the statute may be violated if merely one purpose of a payment arrangement is to induce referrals or purchases.
In addition to statutory exceptions to the Anti-kickback Law, regulations provide for a number of safe harbors. If an arrangement meets the provisions of a safe harbor, it is deemed not to violate the Anti-kickback Law. An arrangement must fully comply with each element of an applicable safe harbor in order to qualify for protection. There are no regulatory safe harbors to California's Section 650.
Among the safe harbors that may be relevant to us is the discount safe harbor. The discount safe harbor potentially applies to discounts provided by providers and suppliers, including laboratories, to physicians or institutions. If the terms of the discount safe harbor are met, the discounts will not be considered prohibited remuneration under the Anti-kickback Law. California does not have a discount safe harbor. However, as noted above, Section 650 has generally been interpreted consistent with the Anti-kickback Law.
The personal services safe harbor to the Anti-kickback Law provides that remuneration paid to a referral source for personal services will not violate the Anti-kickback Law provided all of the elements of that safe harbor are met. One element is that if the agreement is intended to provide for the services of the physician on a periodic, sporadic or part-time basis, rather than on a full-time basis for the term of the agreement, the agreement specifies exactly the schedule of such intervals, their precise length, and the exact charge for such intervals. Our personal services arrangements with some physicians may not meet the specific requirement of this safe harbor that the agreement specify exactly the schedule of the intervals of time to be spent on the services because the nature of the services, such as speaking engagements, does not lend itself to exact scheduling and therefore meeting this element of the personal services safe harbor is impractical. Failure to meet the terms of the safe harbor does not render an arrangement illegal. Rather, the government may evaluate such arrangements on a case-by-case basis, taking into account all facts and circumstances.
While we believe that we are in compliance with the Anti-kickback Law and Section 650, there can be no assurance that our relationships with physicians, academic institutions and other customers will not be subject to investigation or challenge under such laws. If imposed for any reason, sanctions under the Anti-kickback Law and Section 650 could have a negative effect on our business.
Other Federal and State Fraud and Abuse Laws
In addition to the requirements discussed above, several other health care fraud and abuse laws could have an effect on our business. For example, provisions of the Social Security Act permit Medicare and Medicaid to exclude an entity that charges the federal health care programs substantially in excess of its usual charges for its services. The terms "usual charge" and "substantially in excess" are ambiguous and subject to varying interpretations.
Further, the Federal False Claims Act prohibits a person from knowingly submitting a claim, making a false record or statement in order to secure payment or retaining an overpayment by the federal government. In addition to actions initiated by the government itself, the statute authorizes actions to be brought on behalf of the federal government by a private party having knowledge of the alleged fraud. Because the complaint is initially filed under seal, the action may be pending for some time before the defendant is even aware of the action. If the government is ultimately successful in obtaining redress in the matter or if the plaintiff succeeds
15
in obtaining redress without the government's involvement, then the plaintiff will receive a percentage of the recovery. Finally, the Social Security Act includes its own provisions that prohibit the filing of false claims or submitting false statements in order to obtain payment. Violation of these provisions may result in fines, imprisonment or both, and possible exclusion from Medicare or Medicaid programs. California has an analogous state false claims act applicable to all payers, as do many other states; however, we may not be aware of all such rules and statutes and cannot provide assurance that we will be in compliance with all such laws and regulations.
International
Many countries in which we may offer any of our tests in the future have anti-kickback regulations prohibiting providers from offering, paying, soliciting or receiving remuneration, directly or indirectly, in order to induce business that is reimbursable under any national health care program. In situations involving physicians employed by state-funded institutions or national health care agencies, violation of the local anti-kickback law may also constitute a violation of the United States Foreign Corrupt Practices Act, or FCPA.
The FCPA prohibits any U.S. individual, business entity or employee of a U.S. business entity to offer or provide, directly or through a third party, including any potential distributors we may rely on in certain markets, anything of value to a foreign government official with corrupt intent to influence an award or continuation of business or to gain an unfair advantage, whether or not such conduct violate local laws. In addition, it is illegal for a company that reports to the SEC to have false or inaccurate books or records or to fail to maintain a system of internal accounting controls. We will also be required to maintain accurate information and control over sales and distributors' activities that may fall within the purview of the FCPA, its books and records provisions and its anti-bribery provisions.
The standard of intent and knowledge in the Anti-Bribery cases is minimal-intent and knowledge are usually inferred from that fact that bribery took place. The accounting provisions do not require intent. Violations of the FCPA's anti-bribery provisions for corporations and other business entities are subject to a fine of up to $2 million and officers, directors, stockholders, employees, and agents are subject to a fine of up to $100,000 and imprisonment for up to five years. Other countries, including the United Kingdom and other OECD Anti-Bribery Convention members, have similar anti-corruption regulations, such as the United Kingdom Bribery Act.
When marketing our tests outside of the United States, we may be subject to foreign regulatory requirements governing human clinical testing, prohibitions on the import of tissue necessary for us to perform our tests or restrictions on the export of tissue imposed by countries outside of the United States or the import of tissue into the United States, and marketing approval. These requirements vary by jurisdiction, differ from those in the United States and may in some cases require us to perform additional pre-clinical or clinical testing. In many countries outside of the United States, coverage, pricing and reimbursement approvals are also required.
Patents and Proprietary Technology
In order to remain competitive, we must develop and maintain protection of the proprietary aspects of our technologies. To that end, we rely on a combination of patents, copyrights and trademarks, as well as contracts, such as confidentiality, invention assignment and licensing agreements. We also rely upon trade secret laws to protect unpatented know-how and continuing technological innovation. In addition, we have what we consider to be reasonable security measures in place to maintain confidentiality. Our intellectual property strategy is intended to develop and maintain our competitive position.
We have thirteen issued patents that expire between 2029 and 2032 related to methods used in the Afirma diagnostic platform, in addition to fourteen pending U.S. utility patent applications and two pending Patent Cooperation Treaty, or PCT, patent applications. Some of these U.S. utility patent applications have pending foreign counterparts. We also exclusively licensed intellectual property, including rights to two issued patents that will expire between 2030 and 2032, and three pending U.S. utility patent applications in the thyroid space that would expire between 2030 and 2033 once issued, related to methods that are used in the Afirma diagnostic test, some of which have foreign counterparts.
In the lung diagnostic space, we exclusively license intellectual property rights to seven pending patent applications and one issued patent in the United States and abroad. Patents issuing from the licensed portfolio will expire between 2024 and 2028. In addition, we own a PCT application and a pending U.S. application related to our Percepta test. The PCT application is currently in the process of being nationalized in Australia, Canada, China, Europe, Japan, and South Korea. We also own two applications related to other lung diseases, and a PCT application, a pending U.S. application, two ex-U.S. applications, and one provisional U.S. application related to Envisia. Any patents granted from our current lung cancer patent applications will expire no earlier than 2035 and those from the interstitial lung disease patent applications will expire no earlier than from 2034 to 2037.
16
We intend to file additional patent applications in the United States and abroad to strengthen our intellectual property rights; however, our patent applications (including the patent applications listed above) may not result in issued patents in a timely fashion or at all, and we cannot assure investors that any patents that have issued or might issue will protect our technology. We may receive notices of claims of potential infringement from third parties in the future.
We hold registered trademarks in the United States for "Veracyte," "Afirma," "Percepta," and the Afirma logo and have pending federal trademark applications for "Envisia” and the new "Veracyte" logo. We also hold registered trademarks in various jurisdictions outside of the United States.
We require all employees and technical consultants working for us to execute confidentiality agreements, which provide that all confidential information received by them during the course of the employment, consulting or business relationship be kept confidential, except in specified circumstances. Our agreements with our research employees provide that all inventions, discoveries and other types of intellectual property, whether or not patentable or copyrightable, conceived by the individual while he or she is employed by us are assigned to us. We cannot provide any assurance, however, that employees and consultants will abide by the confidentiality or assignment terms of these agreements. Despite measures taken to protect our intellectual property, unauthorized parties might copy aspects of our technology or obtain and use information that we regard as proprietary.
Research and Development Expenses
Research and development expenses were $15.3 million, $12.8 million and $9.8 million for the years ended December 31, 2016, 2015, and 2014, respectively.
Employees
At December 31, 2016, we had 216 employees, of which 40 work in laboratory operations, 34 in research and development and clinical development, 61 in selling and marketing, and 81 in general and administrative, including 46 in billing and client services, 13 in information technology and 13 in finance. None of our employees are the subject of collective bargaining arrangements, and our management considers its relationships with employees to be good.
Environmental Matters
Our operations require the use of hazardous materials (including biological materials) which subject us to a variety of federal, state and local environmental and safety laws and regulations. Some of these regulations provide for strict liability, holding a party potentially liable without regard to fault or negligence. We could be held liable for damages and fines as a result of our, or others’, business operations should contamination of the environment or individual exposure to hazardous substances occur. We cannot predict how changes in laws or new regulations will affect our business, operations or the cost of compliance.
Raw Materials and Suppliers
We procure reagents, equipment, chips and other materials that we use to perform our tests from sole suppliers. We also purchase components used in our collection kits from sole-source suppliers. Some of these items are unique to these suppliers and vendors. In addition, we utilize a sole source to assemble and distribute our sample collection kits. While we have developed alternate sourcing strategies for these materials and vendors, we cannot be certain whether these strategies will be effective or the alternative sources will be available when we need them. If these suppliers can no longer provide us with the materials we need to perform the tests and for our collection kits, if the materials do not meet our quality specifications or are otherwise unusable, if we cannot obtain acceptable substitute materials, or if we elect to change suppliers, an interruption in test processing could occur, we may not be able to deliver patient reports and we may incur higher one-time switching costs. Any such interruption may significantly affect our future revenue, cause us to incur higher costs, and harm our customer relationships and reputation. In addition, in order to mitigate these risks, we maintain inventories of these supplies at higher levels than would be the case if multiple sources of supply were available. If our test volume decreases or we switch suppliers, we may hold excess inventory with expiration dates that occur before use which would adversely affect our losses and cash flow position. As we introduce any new test, we may experience supply issues as we ramp test volume.
Legal Proceedings
From time to time, we may be party to lawsuits in the ordinary course of business. We are currently not a party to any material legal proceedings.
17
Risks Related to Our Business
We are an emerging growth company with a history of losses, and we expect to incur net losses for the foreseeable future and may never achieve or sustain profitability.
We have incurred net losses since our inception. For the year ended December 31, 2016, we had a net loss of $31.4 million and we expect to incur additional losses in 2017 and in future years. As of December 31, 2016, we had an accumulated deficit of $180.1 million. We may never achieve revenue sufficient to offset our expenses. Over the next couple of years, we expect to continue to devote substantially all of our resources to increase adoption of, and reimbursement for our Afirma tests, Percepta, our lung cancer test, which we launched in April 2015, Envisia, our test for idiopathic pulmonary fibrosis, or IPF, which we launched in October 2016, and the development of additional tests. We may never achieve or sustain profitability, and our failure to achieve and sustain profitability in the future could cause the market price of our common stock to decline.
Our financial results currently depend solely on sales of our Afirma tests, and we will need to generate sufficient revenue from this and other diagnostic solutions to grow our business.
All of our revenue to date has been derived from the sale of our Afirma tests, which are used in the diagnosis of thyroid cancer. Over the next few years, we expect to continue to derive a substantial portion of our revenue from sales of our Afirma tests. In 2017, we anticipate that we will begin recognizing revenue from the sale of our Percepta test, used in the diagnosis of lung cancer. We also launched our Envisia test to help improve the diagnosis of interstitial lung disease, specifically IPF, in October 2016. Once genomic tests such as our Percepta and Envisia are clinically validated and commercially available for patient testing, we must continue to develop and publish evidence that our tests are informing clinical decisions in order for them to receive positive coverage decisions by payers. Without coverage policies, our tests may not be reimbursed and we will not be able to recognize revenue. We cannot guarantee that tests we commercialize will gain positive coverage decisions and therefore, we may never realize revenue from the samples we test once commercialized. In addition, we are in various stages of research and development for other diagnostic solutions that we may offer, but there can be no assurance that we will be able to identify other diseases that can be effectively addressed or, if we are able to identify such diseases, whether or when we will be able to successfully commercialize solutions for these diseases and obtain the evidence and coverage decisions from payers. If we are unable to increase sales and expand reimbursement for Afirma, or successfully obtain coverage and reimbursement for our Percepta and Envisia tests or develop and commercialize other solutions, our revenue and our ability to achieve and sustain profitability would be impaired, and the market price of our common stock could decline.
We depend on a few payers for a significant portion of our revenue and if one or more significant payers stops providing reimbursement or decreases the amount of reimbursement for our tests, our revenue could decline.
Revenue for tests performed on patients covered by Medicare and UnitedHealthcare was 27% and 12%, respectively, of our revenue for the year ended December 31, 2016, compared with 26% and 14%, respectively, in the year ended December 31, 2015. The percentage of our revenue derived from significant payers is expected to fluctuate from period to period as our revenue increases, as additional payers provide reimbursement for our tests or if one or more payers were to stop reimbursing for our tests or change their reimbursed amounts. Effective January 2012, Palmetto GBA, the regional Medicare administrative contractor, or MAC, that handled claims processing for Medicare services with jurisdiction at that time, issued coverage and payment determinations for the Afirma Gene Expression Classifier, or GEC. On a five-year rotational basis, Medicare requests bids for its regional MAC services. Any future changes in the MAC processing or coding for Medicare claims for the Afirma GEC could result in a change in the coverage or reimbursement rates for such products, or the loss of coverage.
On March 1, 2015, a separate CPT code, or Current Procedural Terminology code, for the Afirma GEC was issued. In November 2016, CMS revised its final 2017 gapfill rate for the Afirma GEC and determined that the current rate of $3,200 per test would be maintained in 2017. This rate replaces the previously released lower gapfill amount announced on September 30, 2016, for which we filed a reconsideration request. After the reconsideration request, we were notified that the final 2017 rate is $3,222 per test. A decrease in the current Medicare payment rate for our tests will decrease our revenue from Medicare and may also decrease the payment rates for some of our commercial payers if they tie their allowable rates to the Medicare rate, which could have an adverse effect on our business, financial condition and results of operations.
18
Although we have entered into contracts with certain third-party payers that establish in-network allowable rates of reimbursement for our Afirma tests, payers may suspend or discontinue reimbursement at any time, may require or increase co-payments from patients, or may reduce the reimbursement rates paid to us. Any such actions could have a negative effect on our revenue.
If payers do not provide reimbursement, rescind or modify their reimbursement policies, delay payments for our tests, recoup past payments, or if we are unable to successfully negotiate additional reimbursement contracts, our commercial success could be compromised.
Physicians might not order our tests unless payers reimburse a substantial portion of the test price. There is significant uncertainty concerning third-party reimbursement of any test incorporating new technology, including our tests. Reimbursement by a payer may depend on a number of factors, including a payer's determination that these tests are:
|
•
|
not experimental or investigational;
|
|
•
|
pre-authorized and appropriate for the specific patient;
|
|
•
|
cost-effective;
|
|
•
|
supported by peer-reviewed publications; and
|
|
•
|
included in clinical practice guidelines.
|
Since each payer makes its own decision as to whether to establish a coverage policy or enter into a contract to reimburse our tests, seeking these approvals is a time-consuming and costly process.
We do not have a contracted rate of reimbursement with many payers for the Afirma test, and we do not have any contracted reimbursement with respect to the Percepta and Envisia tests. Without a contracted rate for reimbursement, our claims are often denied upon submission, and we must appeal the claims. The appeals process is time consuming and expensive, and may not result in payment. In cases where there is no contracted rate for reimbursement, there is typically a greater patient co-insurance or co-payment requirement which may result in further delay or decreased likelihood of collection. Payers may attempt to recoup prior payments after review, sometimes after significant time has passed, which would impact future revenue.
We expect to continue to focus substantial resources on increasing adoption, coverage and reimbursement for the Afirma GEC, the Afirma Malignancy Classifiers, launched in May 2014, the Percepta test, launched in April 2015, and the Envisia test, launched in October 2016, as well as any other future tests we may develop. We believe it will take several years to achieve coverage and contracted reimbursement with a majority of third-party payers. However, we cannot predict whether, under what circumstances, or at what payment levels payers will reimburse for our tests. Also, payer consolidation is underway and creates uncertainty as to whether coverage and contracts with existing payers will remain in effect. Finally, commercial payers may tie their allowable rates to Medicare rates, and should Medicare reduce their rates as they did with the Afirma test in September 2016, we may be negatively impacted. Our failure to establish broad adoption of and reimbursement for our tests, or our inability to maintain existing reimbursement from payers, will negatively impact our ability to generate revenue and achieve profitability, as well as our future prospects and our business.
We may experience limits on our revenue if physicians decide not to order our tests.
If we are unable to create or maintain demand for our tests in sufficient volume, we may not become profitable. To generate demand, we will need to continue to educate physicians about the benefits and cost-effectiveness of our tests through published papers, presentations at scientific conferences, marketing campaigns and one-on-one education by our sales force. In addition, our ability to obtain and maintain adequate reimbursement from third-party payers will be critical to generating revenue.
Several existing guidelines and historical practices in the United States regarding indeterminate thyroid nodule fine needle aspiration, or FNA, results recommend a full or partial surgical thyroidectomy in most cases. Accordingly, physicians may be reluctant to order a diagnostic solution that may suggest surgery is unnecessary where some current guidelines and historical practice have typically led to such procedures. Moreover, our diagnostic services often are performed at a specialized clinical reference laboratory rather than by a pathologist in a local laboratory, so pathologists may be reluctant to support our services. In
19
addition, guidelines for the diagnosis and treatment of thyroid nodules may subsequently be revised to recommend another type of treatment protocol, and these changes may result in medical practitioners deciding not to use the Afirma test. These facts may make physicians reluctant to convert to using or continuing to use the Afirma test, which could limit our ability to generate revenue and our ability to achieve profitability. To the extent international markets have existing practices and standards of care that are different than those in the United States, we may face challenges with the adoption of the Afirma test outside the United States. We will face similar challenges with our other tests.
Due to how we recognize revenue, our quarterly operating results are likely to fluctuate.
For tests performed where we have an agreed upon reimbursement rate or we are able to reasonably estimate the amount that will ultimately be realized at the time delivery of a patient report is complete, such as in the case of Medicare and certain other payers, we recognize the related revenue upon delivery of a patient report to the prescribing physician based on the amount we expect to ultimately realize. We determine the amount we expect to ultimately realize based on a per payer, per contract or agreement basis. In the first period in which revenue is accrued for a particular payer, a one-time increase in revenue generally occurs. Upon ultimate collection, the amount received from Medicare and other payers where reimbursement was estimated is compared to previous estimates and the amount accrued is adjusted accordingly. In situations where we cannot reasonably estimate the amount that will ultimately be collected, we recognize revenue on the cash basis. We have little visibility as to when we will receive payment for our diagnostic tests, and we must appeal negative payment decisions, which delays collections. Should we recognize revenue from payers on an accrual basis and later determine the judgments underlying estimated reimbursement change, or were incorrect at the time we accrued such revenue, our financial results could be negatively impacted in future quarters. As a result, comparing our operating results on a period-to-period basis may not be meaningful. You should not rely on our past results as an indication of our future performance. In addition, these fluctuations in revenue may make it difficult for us, for research analysts and for investors to accurately forecast our revenue and operating results. If our revenue or operating results fall below expectations, the price of our common stock would likely decline.
We rely on sole suppliers for some of the reagents, equipment, chips and other materials used to perform our tests, and we may not be able to find replacements or transition to alternative suppliers.
We rely on sole suppliers for critical supply of reagents, equipment, chips and other materials that we use to perform our tests. We also purchase components used in our collection kits from sole-source suppliers. Some of these items are unique to these suppliers and vendors. In addition, we utilize a sole source to assemble and distribute our sample collection kits. While we have developed alternate sourcing strategies for these materials and vendors, we cannot be certain whether these strategies will be effective or the alternative sources will be available when we need them. If these suppliers can no longer provide us with the materials we need to perform the tests and for our collection kits, if the materials do not meet our quality specifications or are otherwise unusable, if we cannot obtain acceptable substitute materials, or if we elect to change suppliers, an interruption in test processing could occur, we may not be able to deliver patient reports and we may incur higher one-time switching costs. Any such interruption may significantly affect our future revenue, cause us to incur higher costs, and harm our customer relationships and reputation. In addition, in order to mitigate these risks, we maintain inventories of these supplies at higher levels than would be the case if multiple sources of supply were available. If our test volume decreases or we switch suppliers, we may hold excess inventory with expiration dates that occur before use which would adversely affect our losses and cash flow position. As we introduce any new test, we may experience supply issues as we ramp test volume.
We depend on a specialized cytopathology practice to perform the cytopathology component of our Afirma test, and our ability to perform our diagnostic solution would be harmed if we were required to secure a replacement.
We rely on Thyroid Cytopathology Partners, P.A., or TCP, to provide cytopathology professional diagnoses on thyroid FNA samples pursuant to a pathology services agreement. Pursuant to this agreement, TCP has the exclusive right to provide the cytopathology diagnoses on FNA samples at a fixed price per test. We have also agreed to allow TCP to co-locate in a portion of our facilities in Austin, Texas. Our agreement with TCP was effective through December 31, 2015 and automatically renews every year thereafter unless either party provides notice of intent not to renew at least 12 months prior to the end of the then-current term.
20
If TCP were not able to support our current test volume or future increases in test volume or to provide the quality of services we require, or if we were unable to agree on commercial terms and our relationship with TCP were to terminate, our business would be harmed until we were able to secure the services of another cytopathology provider. There can be no assurance that we would be successful in finding a replacement that would be able to conduct cytopathology diagnoses at the same volume or with the same high-quality results as TCP. Locating another suitable cytopathology provider could be time consuming and would result in delays in processing Afirma tests until a replacement was fully integrated with our test processing operations.
If we are unable to support demand for our commercial tests, our business could suffer.
As demand for our tests grows, we will need to continue to scale our testing capacity and processing technology, expand customer service, billing and systems processes and enhance our internal quality assurance program. We will also need additional certified laboratory scientists and other scientific and technical personnel to process higher volumes of our tests. We cannot assure you that any increases in scale, related improvements and quality assurance will be successfully implemented or that appropriate personnel will be available. Failure to implement necessary procedures, transition to new processes or hire the necessary personnel could result in higher costs of processing tests, quality control issues or inability to meet demand. There can be no assurance that we will be able to perform our testing on a timely basis at a level consistent with demand, or that our efforts to scale our operations will not negatively affect the quality of test results. If we encounter difficulty meeting market demand or quality standards, our reputation could be harmed and our future prospects and our business could suffer.
Changes in healthcare policy, including legislation reforming the U.S. healthcare system, may have a material adverse effect on our financial condition and operations.
The Patient Protection and Affordable Care Act, as amended by the Health Care and Education Affordability Reconciliation Act, collectively the ACA, enacted in March 2010, makes changes that are expected to significantly affect the pharmaceutical and medical device industries and clinical laboratories. Effective January 1, 2013, the ACA includes a 2.3% excise tax on the sale of certain medical devices sold outside of the retail setting. Although a moratorium has been imposed on this excise tax for 2016 and 2017, the excise tax is scheduled to be restored in 2018.
Other significant measures contained in the ACA include, for example, coordination and promotion of research on comparative clinical effectiveness of different technologies and procedures, initiatives to revise Medicare payment methodologies, such as bundling of payments across the continuum of care by providers and physicians, and initiatives to promote quality indicators in payment methodologies. The ACA also includes significant new fraud and abuse measures, including required disclosures of financial arrangements with physician customers, lower thresholds for violations and increasing potential penalties for such violations. In addition, the ACA establishes an Independent Payment Advisory Board, or IPAB, to reduce the per capita rate of growth in Medicare spending. The IPAB has broad discretion to propose policies to reduce expenditures, which may have a negative effect on payment rates for services. The IPAB proposals may affect payments for clinical laboratory services beginning in 2016 and for hospital services beginning in 2020. We are monitoring the effect of the ACA to determine the trends and changes that may be necessitated by the legislation, any of which may potentially affect our business.
In the beginning of 2017, the U.S. Congress and the President of the United States took actions to repeal the ACA and indicated an intent to replace it with another act. We cannot predict what a new act would include and cannot quantify the effect on our business.
In addition to the ACA, the effect of which on our business cannot presently be fully quantified, various healthcare reform proposals have also emerged from federal and state governments. For example, in February 2012, Congress passed the Middle Class Tax Relief and Job Creation Act of 2012, which in part reset the clinical laboratory payment rates on the Medicare Clinical Laboratory Fee Schedule, or CLFS, by 2% in 2013. In addition, under the Budget Control Act of 2011, which is effective for dates of service on or after April 1, 2013, Medicare payments, including payments to clinical laboratories, are subject to a reduction of 2% due to the automatic expense reductions (sequester) until fiscal year 2024. Reductions resulting from the Congressional sequester are applied to total claims payment made; however, they do not currently result in a rebasing of the negotiated or established Medicare or Medicaid reimbursement rates.
State legislation on reimbursement applies to Medicaid reimbursement and managed Medicaid reimbursement rates within that state. Some states have passed or proposed legislation that would revise reimbursement methodology for clinical laboratory payment rates under those Medicaid programs. We cannot predict whether future healthcare initiatives will be implemented at the federal or state level or in countries outside of the United States in which we may do business, or the effect any future legislation
21
or regulation will have on us. The taxes imposed by the new federal legislation, cost reduction measures and the expansion in the role of the U.S. government in the healthcare industry may result in decreased revenue, lower reimbursement by payers for our tests or reduced medical procedure volumes, all of which may adversely affect our business, financial condition and results of operations. In addition, sales of our tests outside the United States subject our business to foreign regulatory requirements and cost-reduction measures, which may also change over time.
Ongoing calls for deficit reduction at the federal government level and reforms to programs such as the Medicare program to pay for such reductions may affect the pharmaceutical, medical device and clinical laboratory industries. Currently, clinical laboratory services are excluded from the Medicare Part B co-insurance and co-payment as preventative services. Any requirement for clinical laboratories to collect co-payments from patients may increase our costs and reduce the amount ultimately collected.
CMS announced plans to bundle payments for clinical laboratory diagnostic tests together with other services performed during hospital outpatient visits under the Hospital Outpatient Prospective Payment System. For calendar year 2016, CMS maintained an exemption for molecular pathology tests from this bundling provision. It is possible that this exemption could be removed by CMS in future rule making, which might result in lower reimbursement for tests performed in this setting.
The Protecting Access to Medicare Act of 2014, or PAMA, includes a substantial new payment system for clinical laboratory tests under the CLFS. Under PAMA, laboratories that receive the majority of their Medicare revenues from payments made under the CLFS would report initially and then on a subsequent three-year basis thereafter (or annually for advanced diagnostic laboratory tests, or ADLTs), private payer payment rates and volumes for their tests. The final PAMA ruling was issued June 17, 2016, indicating that data for reporting for the new PAMA process will begin in 2017 and the new market based rates will take effect January 1, 2018. We believe that the final PAMA regulations are generally favorable for us. The private payer rate will be calculated based on claims whose adjudication is final and will include patient deductible and co-insurance amounts. Additionally, we believe our Afirma GEC as well as our Percepta test, once covered, would be considered ADLTs and that we can determine when to seek ADLT status. We cannot assure you that reimbursement rates under the final regulations for tests like ours will not be adversely affected.
Because of Medicare billing rules, we may not receive reimbursement for all tests provided to Medicare patients.
Under current Medicare billing rules, payment for our tests performed on Medicare beneficiaries who were hospital inpatients at the time the tissue samples were obtained and whose tests were ordered less than 14 days from discharge must be bundled into the payment that the hospital receives for the inpatient services provided. Medicare billing rules also require hospitals to bill for our tests when ordered for hospital outpatients less than 14 days following the date of the hospital procedure where the tissue samples were obtained. Accordingly, we are required to bill individual hospitals for tests performed on Medicare beneficiaries during these time frames. We cannot ensure that hospitals will pay us for tests performed that fall under these rules. We cannot assure you that Medicare will not change this limitation in the future.
If the FDA were to begin regulating our tests, we could incur substantial costs and delays associated with trying to obtain premarket clearance or approval.
Clinical laboratory tests have long been subject to comprehensive regulations under the Clinical Laboratory Improvement Amendments of 1988, or CLIA, as well as by applicable state laws. Most laboratory developed tests, or LDTs, are not currently subject to regulation by the U.S. Food and Drug Administration, or FDA, although reagents, instruments, software or components provided by third parties and used to perform LDTs may be subject to regulation. While the FDA maintains its authority to regulate LDTs, it has chosen to exercise its enforcement discretion not to regulate LDTs as medical devices. We believe that the Afirma GEC and the Percepta and Envisia classifiers are LDTs. In October 2014, the FDA issued draft guidance, entitled "Framework for Regulatory Oversight of LDTs," proposing the phased-in enforcement of premarket review requirements for most LDTs. The framework is similar to previously issued guidance. There is no timeframe in which the FDA must issue final guidance documents. If the guidance were enacted, our tests could be required to comply with FDA regulations applicable to medical devices.
In January 2017 the FDA issued a “Discussion Paper on Laboratory Developed Tests” following input it received from multiple stakeholders who had commented on its 2014 draft guidance. While the FDA specifically states in its Discussion Paper that it does not represent a final version of the LDT draft guidance documents that were published in 2014, it is designed to provide a possible approach to spark further dialogue. The suggested LDT framework could grandfather many types of LDTs without requiring new premarket review or quality management requirements. It is also suggesting a four-year phased implementation of market authorization requirements for some types of tests.
22
If the FDA were to require us to seek clearance or approval for our existing tests or any of our future products for clinical use, we may not be able to obtain such approvals on a timely basis, or at all. While we believe our current tests would likely qualify for the “grandfathered” tests treatment, there can be no assurance of what the FDA might ultimately require if it issued final guidance. If premarket reviews were required, our business could be negatively impacted if we were required to stop selling our products pending their clearance or approval. In addition, the launch of any new products that we develop could be delayed by the implementation of future FDA guidance. The cost of complying with premarket review requirements, including obtaining clinical data, could be significant. In addition, future regulation by the FDA could subject our business to further regulatory risks and costs. Failure to comply with applicable regulatory requirements of the FDA could result in enforcement action, including receiving untitled or warning letters, fines, injunctions, or civil or criminal penalties. Any such enforcement action would have a material adverse effect on our business, financial condition and operations. In addition, our sample collection containers are listed as Class I devices with the FDA. If the FDA were to determine that they are not Class I devices, we would be required to file 510(k) applications and obtain FDA clearance to use the containers, which could be time consuming and expensive.
Some of the materials we use for our tests and that we may use for future tests are labeled for research use only. In November 2013, the FDA finalized guidance regarding the sale and use of products labeled for research or investigational use only. Among other things, the guidance advises that the FDA continues to be concerned about distribution of research or investigational use only products intended for clinical diagnostic use and that the manufacturer's objective intent for the product's intended use will be determined by examining the totality of circumstances, including advertising, instructions for clinical interpretation, presentations that describe clinical use, and specialized technical support, surrounding the distribution of the product in question. The FDA has advised that if evidence demonstrates that a product is inappropriately labeled for research or investigational use only, the device would be misbranded and adulterated within the meaning of the Federal Food, Drug and Cosmetic Act. Some of the reagents, instruments, software or components obtained by us from suppliers for use in our products are currently labeled as research or investigational-use only products. If the FDA were to undertake enforcement actions, some of our suppliers might cease selling research or investigational-use only products to us, and any failure to obtain an acceptable substitute could significantly and adversely affect our business, financial condition and results of operations, including increasing the cost of testing or delaying, limiting or prohibiting the purchase of reagents, instruments, software or components necessary to perform testing.
If we are unable to compete successfully, we may be unable to increase or sustain our revenue or achieve profitability.
Our principal competition for our tests comes from traditional methods used by physicians to diagnose and manage patient care decisions. For example, with our Afirma test, practice guidelines in the United States have historically recommended that patients with indeterminate diagnoses from cytopathology results be considered for surgery to remove all or part of the thyroid to rule out cancer. This practice has been the standard of care in the United States for many years, and we need to continue to educate physicians about the benefits of the Afirma test to change clinical practice.
We also face competition from companies and academic institutions that use next generation sequencing technology or other methods to measure mutational markers such as BRAF and KRAS, along with numerous other mutations. These organizations include Interpace Diagnostics Group, Inc., Rosetta Genomics Ltd., and others who are developing new products or technologies that may compete with our tests. In the future, we may also face competition from companies developing new products or technologies.
With the Percepta and Envisia tests, we believe our primary competition will similarly come from traditional methods used by physicians to diagnose the related diseases. For the Percepta test, we expect competition from companies focused on lung cancer such as Integrated Diagnostics, Inc. We also anticipate facing potential competition from companies offering or developing approaches for assessing malignancy risk in patients with lung nodules using alternative samples, such as blood, urine or sputum. However, such "liquid biopsies" are often used earlier in the diagnostic paradigm—for instance, to screen for cancer—or to gauge risk of recurrence or response to treatment.
In general, we also face competition from commercial laboratories, such as Laboratory Corporation of America Holdings, Quest Diagnostics Incorporated and Sonic Healthcare USA, with strong infrastructure to support the commercialization of diagnostic services. We face potential competition from companies such as Illumina, Inc. and Thermo Fisher Scientific Inc., both of which have entered the clinical diagnostics market. Other potential competitors include companies that develop diagnostic products, such as Roche Diagnostics, a division of Roche Holding Ltd, Siemens AG and Qiagen N.V.
23
In addition, competitors may develop their own versions of our solutions in countries we may seek to enter where we do not have patents or where our intellectual property rights are not recognized and compete with us in those countries, including encouraging the use of their solutions by physicians in other countries.
To compete successfully, we must be able to demonstrate, among other things, that our diagnostic test results are accurate and cost effective, and we must secure a meaningful level of reimbursement for our products.
Many of our potential competitors have widespread brand recognition and substantially greater financial, technical and research and development resources, and selling and marketing capabilities than we do. Others may develop products with prices lower than ours that could be viewed by physicians and payers as functionally equivalent to our solutions, or offer solutions at prices designed to promote market penetration, which could force us to lower the list price of our solutions and affect our ability to achieve profitability. If we are unable to change clinical practice in a meaningful way or to compete successfully against current and future competitors, we may be unable to increase market acceptance and sales of our products, which could prevent us from increasing our revenue or achieving profitability and could cause the market price of our common stock to decline. As we add new tests and services, we will face many of these same competitive risks for these new tests.
The loss of members of our senior management team or our inability to attract and retain key personnel could adversely affect our business.
Our success depends largely on the skills, experience and performance of key members of our executive management team and others in key management positions. The efforts of each of these persons together will be critical to us as we continue to develop our technologies and test processes and focus on our growth. If we were to lose one or more of these key employees, we may experience difficulties in competing effectively, developing our technologies and implementing our business strategy.
In addition, our research and development programs and commercial laboratory operations depend on our ability to attract and retain highly skilled scientists. We may not be able to attract or retain qualified scientists and technicians in the future due to the intense competition for qualified personnel among life science businesses, particularly in the San Francisco Bay Area. Our success in the development and commercialization of advanced diagnostics requires a significant medical and clinical staff to conduct studies and educate physicians and payers on the merits of our tests in order to achieve adoption and reimbursement. We are in a highly competitive industry to attract and retain this talent. As a public company located in the San Francisco Bay Area, we also face intense competition for highly skilled finance and accounting personnel. If we are unable to attract and retain finance and accounting personnel experienced in public company financial reporting, we risk being unable to close our books and file our public documents on a timely basis. Additionally, our success depends on our ability to attract and retain qualified sales people. We recently significantly expanded our sales force as we transitioned out of our Genzyme Corporation co-promotion agreement in the United States. There can be no assurance that we will be successful in maintaining and growing our business. Additionally, as we increase our sales channels for new tests we commercialize, including the Percepta and Envisia tests, we may have difficulties recruiting and training additional sales personnel or retaining qualified salespeople, which could cause a delay or decline in the rate of adoption of our tests. Finally, our business requires specialized capabilities in reimbursement, billing, and other areas and there may be a shortage of qualified individuals. If we are not able to attract and retain the necessary personnel to accomplish our business objectives, we may experience constraints that could adversely affect our ability to support our research and development, clinical laboratory, sales and reimbursement, billing and finance efforts. All of our employees are at will, which means that either we or the employee may terminate their employment at any time. We do not carry key man insurance for any of our employees.
We may be unable to manage our future growth effectively, which could make it difficult to execute our business strategy.
In addition to the need to scale our testing capacity, future growth, including our transition to a multi-product company with international operations, will impose significant added responsibilities on management, including the need to identify, recruit, train and integrate additional employees with the necessary skills to support the growing complexities of our business. Rapid and significant growth may place strain on our administrative, financial and operational infrastructure. Our ability to manage our business and growth will require us to continue to improve our operational, financial and management controls, reporting systems and procedures. We have implemented an internally developed data warehouse, which is critical to our ability to track our diagnostic services and patient reports delivered to physicians, as well as to support our financial reporting systems. The time and resources required to optimize these systems is uncertain, and failure to complete optimization in a timely and efficient manner could adversely affect our operations. If we are unable to manage our growth effectively, it may be difficult for us to execute our business strategy and our business could be harmed.
24
Billing for our diagnostic tests is complex, and we must dedicate substantial time and resources to the billing process to be paid.
Billing for clinical laboratory testing services is complex, time consuming and expensive. Depending on the billing arrangement and applicable law, we bill various payers, including Medicare, insurance companies and patients, all of which have different billing requirements. We generally bill third-party payers for our diagnostic tests and pursue reimbursement on a case-by-case basis where pricing contracts are not in place. To the extent laws or contracts require us to bill patient co-payments or co-insurance, we must also comply with these requirements. We may also face increased risk in our collection efforts, including potential write-offs of doubtful accounts and long collection cycles, which could adversely affect our business, results of operations and financial condition.
Several factors make the billing process complex, including:
|
•
|
differences between the list price for our tests and the reimbursement rates of payers;
|
|
•
|
compliance with complex federal and state regulations related to billing Medicare;
|
|
•
|
risk of government audits related to billing Medicare;
|
|
•
|
disputes among payers as to which party is responsible for payment;
|
|
•
|
differences in coverage and in information and billing requirements among payers, including the need for prior authorization and/or advanced notification;
|
|
•
|
the effect of patient co-payments or co-insurance;
|
|
•
|
changes to billing codes used for our tests;
|
|
•
|
incorrect or missing billing information; and
|
|
•
|
the resources required to manage the billing and claims appeals process.
|
Standard industry billing codes, known as CPT codes, that we use to bill for cytopathology do not generally exist for our proprietary molecular diagnostic tests. Therefore, until such time that we are awarded and are able to use a designated CPT code specific to our tests, we use "miscellaneous" codes for claim submissions. These codes can change over time. When codes change, there is a risk of an error being made in the claim adjudication process. These errors can occur with claims submission, third-party transmission or in the processing of the claim by the payer. Claim adjudication errors may result in a delay in payment processing or a reduction in the amount of the payment received. Coding changes, therefore, may have an adverse effect on our revenues. Even when we receive a designated CPT code specific to our tests, such as the one for the Afirma GEC that became effective January 1, 2016, there can be no assurance that payers will recognize these codes in a timely manner or that the process of transitioning to such a code and updating their billing systems and ours will not result in errors, delays in payments and a related increase in accounts receivable balances.
As we introduce new tests, we will need to add new codes to our billing process as well as our financial reporting systems. Failure or delays in effecting these changes in external billing and internal systems and processes could negatively affect our collection rates, revenue, and cost of collecting.
Additionally, our billing activities require us to implement compliance procedures and oversight, train and monitor our employees, challenge coverage and payment denials, assist patients in appealing claims, and undertake internal audits to evaluate compliance with applicable laws and regulations as well as internal compliance policies and procedures. Payers also conduct external audits to evaluate payments, which add further complexity to the billing process. If the payer makes an overpayment determination, there is a risk that we may be required to return some portion of prior payments we have received. These billing complexities, and the related uncertainty in obtaining payment for our tests, could negatively affect our revenue and cash flow, our ability to achieve profitability, and the consistency and comparability of our results of operations.
25
We rely on a third-party provider to transmit claims to payers, and any delay in transmitting claims could have an adverse effect on our revenue.
While we manage the overall processing of claims, we rely on a third-party provider to transmit the actual claims to payers based on the specific payer billing format. We have previously experienced delays in claims processing when our third-party provider made changes to its invoicing system, and again when it did not submit claims to payers within the timeframe we require. Additionally, coding for diagnostic tests may change, and such changes may cause short-term billing errors that may take significant time to resolve. If claims are not submitted to payers on a timely basis or are erroneously submitted, or if we are required to switch to a different provider to handle claim submissions, we may experience delays in our ability to process these claims and receipt of payments from payers, or possibly denial of claims for lack of timely submission, which would have an adverse effect on our revenue and our business.
Our future success will depend in part on our ability to successfully transition from our relationship with Genzyme to co-promote Afirma in the United States.
We sell Afirma in the United States through our internal sales team and, until recently, also through a co-promotion agreement with Genzyme Corporation, which we terminated effective September 2016. In connection with the transition, we have hired additional sales personnel to sell our Afirma tests. If we are unsuccessful in transitioning the sales and marketing of the Afirma test from Genzyme solely to our internal sales and marketing personnel, we may experience declining test volumes and associated declines in revenue. We may not be able to market or sell the Afirma test effectively enough to maintain or increase demand for the test, or without significant additional sales and marketing efforts and expense. Our failure to do so successfully without the benefit of Genzyme’s efforts could have an adverse effect on our business, financial condition and results of operations.
Developing new products involves a lengthy and complex process, and we may not be able to commercialize on a timely basis, or at all, other products we are developing.
We continually seek to develop enhancements to our current test offerings and additional diagnostic solutions that requires us to devote considerable resources to research and development. There can be no assurance that we will be able to identify other diseases that can be effectively addressed with our molecular cytology platform. In addition, if we identify such diseases, we may not be able to develop products with the diagnostic accuracy necessary to be clinically useful and commercially successful. We may face challenges obtaining sufficient numbers of samples to validate a genomic signature for a molecular diagnostic product. We launched the Percepta test in April 2015 and the Envisia test in October 2016. We still must complete studies that meet the clinical evidence required to obtain reimbursement, which studies are currently underway.
In order to develop and commercialize diagnostic tests, we need to:
|
•
|
expend significant funds to conduct substantial research and development;
|
|
•
|
conduct successful analytical and clinical studies;
|
|
•
|
scale our laboratory processes to accommodate new tests; and
|
|
•
|
build the commercial infrastructure to market and sell new products.
|
Our product development process involves a high degree of risk and may take several years. Our product development efforts may fail for many reasons, including:
|
•
|
failure to identify a genomic signature in biomarker discovery;
|
|
•
|
inability to secure sufficient numbers of samples at an acceptable cost and on an acceptable timeframe to conduct analytical and clinical studies; or
|
|
•
|
failure of clinical validation studies to support the effectiveness of the test.
|
26
Typically, few research and development projects result in commercial products, and success in early clinical studies often is not replicated in later studies. At any point, we may abandon development of a product candidate or we may be required to expend considerable resources repeating clinical studies, which would adversely affect the timing for generating potential revenue from a new product and our ability to invest in other products in our pipeline. If a clinical validation study fails to demonstrate the prospectively defined endpoints of the study or if we fail to sufficiently demonstrate analytical validity, we might choose to abandon the development of the product, which could harm our business. In addition, competitors may develop and commercialize competing products or technologies faster than us or at a lower cost.
If we are unable to develop products to keep pace with rapid technological, medical and scientific change, our operating results and competitive position could be harmed.
In recent years, there have been numerous advances in technologies relating to diagnostics, particularly diagnostics that are based on genomic information. These advances require us to continuously develop our technology and to work to develop new solutions to keep pace with evolving standards of care. Our solutions could become obsolete unless we continually innovate and expand our product offerings to include new clinical applications. If we are unable to develop new products or to demonstrate the applicability of our products for other diseases, our sales could decline and our competitive position could be harmed.
We may acquire businesses or assets, form joint ventures or make investments in other companies or technologies that could harm our operating results, dilute our stockholders' ownership, increase our debt or cause us to incur significant expense.
We acquired Allegro Diagnostics Corp. in September 2014, and we may pursue additional acquisitions of complementary businesses or assets, as well as technology licensing arrangements as part of our business strategy. We also may pursue strategic alliances that leverage our core technology and industry experience to expand our offerings or distribution, or make investments in other companies. To date, we have limited experience with respect to acquisitions and the formation of strategic alliances and joint ventures. We may not be able to integrate acquisitions successfully into our existing business, and we could assume unknown or contingent liabilities. In addition, we may not realize the expected benefits of an acquisition or investment. Any acquisitions made by us also could result in significant write-offs or the incurrence of debt and contingent liabilities, any of which could harm our operating results. Integration of acquired companies or businesses we may acquire in the future also may require management resources that otherwise would be available for ongoing development of our existing business. We may not identify or complete these transactions in a timely manner, on a cost-effective basis, or at all, and we may not realize the anticipated benefits of any acquisition, technology license, strategic alliance, joint venture or investment.
To finance any acquisitions or investments, we may choose to issue shares of our stock as consideration, which would dilute the ownership of our stockholders. If the price of our common stock is low or volatile, we may not be able to acquire other companies for stock. Alternatively, it may be necessary for us to raise additional funds for these activities through public or private financings. Additional funds may not be available on terms that are favorable to us, or at all. If these funds are raised through the sale of equity or convertible debt securities, dilution to our stockholders could result. Our current loan and security agreement contains covenants that could limit our ability to sell debt securities or obtain additional debt financing arrangements, which could affect our ability to finance acquisitions or investments other than through the issuance of stock.
If we fail to comply with federal and state licensing requirements, we could lose the ability to perform our tests or experience disruptions to our business.
We are subject to CLIA, a federal law that regulates clinical laboratories that perform testing on specimens derived from humans for the purpose of providing information for the diagnosis, prevention or treatment of disease. CLIA regulations mandate specific quality standards, personnel qualifications and responsibilities, facility administration, general laboratory systems, quality assessment, quality control, pre-analytic, analytic, and post-analytic systems and proficiency testing. CLIA certification is also required for us to be eligible to bill state and federal healthcare programs, as well as many private third-party payers. To renew these certifications, we are subject to survey and inspection every two years. Moreover, CLIA inspectors may make random inspections of our clinical reference laboratories. With our recent relocation of our South San Francisco CLIA laboratory to our new building, we may be subject to additional inspections or audits by federal or state regulatory agencies to maintain our CLIA certificate. If we were to relocate our Texas facility, we might be subject to the same inspections or audits at our new facility.
27
We are also required to maintain state licenses to conduct testing in our laboratories. California, New York, Texas, among other states' laws, require that we maintain a license and comply with state regulation as a clinical laboratory. Other states may have similar requirements or may adopt similar requirements in the future. In addition, both of our clinical laboratories are required to be licensed on a test-specific basis by New York State. We have received approval for the Afirma and Percepta tests. We will be required to obtain approval for other tests we may offer in the future. New York law also mandates proficiency testing for laboratories licensed under New York state law, regardless of whether such laboratories are located in New York. If we were to lose our CLIA certificate or California license for our South San Francisco laboratory, whether as a result of revocation, suspension or limitation, we would no longer be able to perform the Afirma GEC or Percepta tests, which would eliminate our primary source of revenue and harm our business. If we were to lose our CLIA certificate for our Austin laboratory, we would need to move the receipt and storage of FNAs, as well as the slide preparation for cytopathology, to South San Francisco, which could result in a delay in processing tests during that transition and increased costs. If we were to lose our licenses issued by New York or by other states where we are required to hold licenses, we would not be able to test specimens from those states. New tests we may develop may be subject to new approvals by regulatory bodies such as New York State, and we may not be able to offer our new tests until such approvals are received.
We may experience limits on our revenue if patients decide not to use our tests.
Some patients may decide not to use our tests because of price, all or part of which may be payable directly by the patient if the patient's insurer denies reimbursement in full or in part. There is a growing trend among insurers to shift more of the cost of healthcare to patients in the form of higher co-payments or premiums, and this trend is accelerating which puts patients in the position of having to pay more for our tests. Implementation of provisions of the ACA has also resulted in increases in premiums and reductions in coverage for some patients. These events may result in patients delaying or forgoing medical checkups or treatment due to their inability to pay for our tests, which could have an adverse effect on our revenue.
Complying with numerous statutes and regulations pertaining to our business is an expensive and time-consuming process, and any failure to comply could result in substantial penalties.
Our operations are subject to other extensive federal, state, local, and foreign laws and regulations, all of which are subject to change. These laws and regulations currently include, among others:
|
•
|
the Federal Health Insurance Portability and Accountability Act of 1996, or HIPAA, which established comprehensive federal standards with respect to the privacy and security of protected health information and requirements for the use of certain standardized electronic transactions, and amendments made in 2013 to HIPAA under the Health Information Technology for Economic and Clinical Health Act, or HITECH, which strengthen and expand HIPAA privacy and security compliance requirements, increase penalties for violators, extend enforcement authority to state attorneys general, and impose requirements for breach notification;
|
|
•
|
Medicare billing and payment regulations applicable to clinical laboratories;
|
|
•
|
the Federal Anti-Kickback Statute, which prohibits knowingly and willfully offering, paying, soliciting, or receiving remuneration, directly or indirectly, in exchange for or to induce either the referral of an individual, or the furnishing, arranging for, or recommending of an item or service that is reimbursable, in whole or in part, by a federal healthcare program;
|
|
•
|
the Federal Stark physician self-referral law (and state equivalents), which prohibits a physician from making a referral for certain designated health services covered by the Medicare program, including laboratory and pathology services, if the physician or an immediate family member has a financial relationship with the entity providing the designated health services, unless the financial relationship falls within an applicable exception to the prohibition;
|
|
•
|
the Federal Civil Monetary Penalties Law, which prohibits, among other things, the offering or transfer of remuneration to a Medicare or state health care program beneficiary if the person knows or should know it is likely to influence the beneficiary's selection of a particular provider, practitioner, or supplier of services reimbursable by Medicare or a state health care program, unless an exception applies;
|
28
|
•
|
the Federal False Claims Act, which imposes liability on any person or entity that, among other things, knowingly presents, or causes to be presented, a false or fraudulent claim for payment to the federal government;
|
|
•
|
other federal and state fraud and abuse laws, such as anti-kickback laws, prohibitions on self-referral, fee-splitting restrictions, prohibitions on the provision of products at no or discounted cost to induce physician or patient adoption, and false claims acts, which may extend to services reimbursable by any third-party payer, including private insurers;
|
|
•
|
the prohibition on reassignment of Medicare claims, which, subject to certain exceptions, precludes the reassignment of Medicare claims to any other party;
|
|
•
|
the rules regarding billing for diagnostic tests reimbursable by the Medicare program, which prohibit a physician or other supplier from marking up the price of the technical component or professional component of a diagnostic test ordered by the physician or other supplier and supervised or performed by a physician who does not "share a practice" with the billing physician or supplier;
|
|
•
|
state laws that prohibit other specified practices related to billing such as billing physicians for testing that they order, waiving co-insurance, co-payments, deductibles, and other amounts owed by patients, and billing a state Medicaid program at a price that is higher than what is charged to other payers; and
|
|
•
|
the Foreign Corrupt Practices Act of 1977, and other similar laws, which apply to our international activities.
|
We have adopted policies and procedures designed to comply with these laws and regulations. In the ordinary course of our business, we conduct internal reviews of our compliance with these laws. Our compliance is also subject to governmental review. The growth of our business and sales organization and our expansion outside of the United States may increase the potential of violating these laws or our internal policies and procedures. We believe that we are in material compliance with all statutory and regulatory requirements, but there is a risk that one or more government agencies could take a contrary position. These laws and regulations are complex and are subject to interpretation by the courts and by government agencies. If one or more such agencies alleges that we may be in violation of any of these requirements, regardless of the outcome, it could damage our reputation and adversely affect important business relationships with third parties, including managed care organizations and other commercial third-party payers. Any action brought against us for violation of these or other laws or regulations, even if we successfully defend against it, could cause us to incur significant legal expenses and divert our management's attention from the operation of our business. If our operations are found to be in violation of any of these laws and regulations, we may be subject to any applicable penalty associated with the violation, including civil and criminal penalties, damages and fines, we could be required to refund payments received by us, and we could be required to curtail or cease our operations. Any of the foregoing consequences could seriously harm our business and our financial results.
International expansion of our business exposes us to business, regulatory, political, operational, financial and economic risks associated with doing business outside of the United States.
Our business strategy includes international expansion in select countries, and may include developing and maintaining physician outreach and education capabilities outside of the United States, establishing agreements with laboratories, and expanding our relationships with international payers. Doing business internationally involves a number of risks, including:
|
•
|
multiple, conflicting and changing laws and regulations such as tax laws, privacy laws, export and import restrictions, employment laws, regulatory requirements and other governmental approvals, permits and licenses;
|
|
•
|
failure by us to obtain regulatory approvals where required for the use of our solutions in various countries;
|
|
•
|
complexities associated with managing multiple payer reimbursement regimes, government payers or patient self-pay systems;
|
|
•
|
logistics and regulations associated with shipping tissue samples, including infrastructure conditions and transportation delays;
|
29
|
•
|
challenges associated with establishing laboratory partners, including proper sample collection techniques, inventory management, sample logistics, billing and promotional activities;
|
|
•
|
limits on our ability to penetrate international markets if we are not able to process tests locally;
|
|
•
|
financial risks, such as longer payment cycles, difficulty in collecting from payers, the effect of local and regional financial crises, and exposure to foreign currency exchange rate fluctuations;
|
|
•
|
natural disasters, political and economic instability, including wars, terrorism, and political unrest, outbreak of disease, boycotts, curtailment of trade and other business restrictions; and
|
|
•
|
regulatory and compliance risks that relate to maintaining accurate information and control over activities that may fall within the purview of the Foreign Corrupt Practices Act of 1977, including both its books and records provisions and its anti-bribery provisions.
|
Any of these factors could significantly harm our future international expansion and operations and, consequently, our revenue and results of operations.
If we are sued for product liability or errors and omissions liability, we could face substantial liabilities that exceed our resources.
The marketing, sale and use of our current or future tests could lead to product liability claims if someone were to allege that the tests failed to perform as they were designed. We may also be subject to liability for errors in the results we provide to physicians or for a misunderstanding of, or inappropriate reliance upon, the information we provide. Our Afirma GEC is performed on FNA samples that are diagnosed as indeterminate by standard cytopathology review. We report results as benign or suspicious to the prescribing physician. Under certain circumstances, we might report a result as benign that later proves to have been malignant. This could be the result of the physician having poor nodule sampling in collecting the FNA, performing the FNA on a different nodule than the one that is malignant or failure of the GEC to perform as intended. We may also be subject to similar types of claims related to our Afirma Malignancy Classifiers and our Percepta and Envisia tests, as well as tests we may develop in the future. A product liability or errors and omissions liability claim could result in substantial damages and be costly and time consuming for us to defend. Although we maintain product liability and errors and omissions insurance, we cannot assure you that our insurance would fully protect us from the financial impact of defending against these types of claims or any judgments, fines or settlement costs arising out of any such claims. Any product liability or errors and omissions liability claim brought against us, with or without merit, could increase our insurance rates or prevent us from securing insurance coverage in the future. Additionally, any product liability lawsuit could cause injury to our reputation or cause us to suspend sales of our products and solutions. The occurrence of any of these events could have an adverse effect on our business and results of operations.
If our laboratory in South San Francisco becomes inoperable due to an earthquake or either of our laboratories becomes inoperable for any other reason, we will be unable to perform our testing services and our business will be harmed.
We perform all of the Afirma GEC, Percepta and Envisia testing at our laboratory in South San Francisco, California. Our laboratory in Austin, Texas accepts and stores substantially all FNA samples pending transfer to our California laboratory for Afirma GEC processing. The laboratories and equipment we use to perform our tests would be costly to replace and could require substantial lead time to replace and qualify for use if they became inoperable. Either of our facilities may be harmed or rendered inoperable by natural or man-made disasters, including earthquakes, flooding and power outages, which may render it difficult or impossible for us to perform our testing services for some period of time or to receive and store samples. The inability to perform our tests for even a short period of time may result in the loss of customers or harm our reputation, and we may be unable to regain those customers in the future. Although we maintain insurance for damage to our property and the disruption of our business, this insurance may not be sufficient to cover all of our potential losses and may not continue to be available to us on acceptable terms, if at all.
30
If we cannot enter into new clinical study collaborations, our product development and subsequent commercialization could be delayed.
In the past, we have entered into clinical study collaborations, and our success in the future depends in part on our ability to enter into additional collaborations with highly regarded institutions. This can be difficult due to internal and external constraints placed on these organizations. Some organizations may limit the number of collaborations they have with any one company so as to not be perceived as biased or conflicted. Organizations may also have insufficient administrative and related infrastructure to enable collaboration with many companies at once, which can extend the time it takes to develop, negotiate and implement a collaboration. Moreover, it may take longer to obtain the samples we need which could delay our trials, publications, and product launches and reimbursement. Additionally, organizations often insist on retaining the rights to publish the clinical data resulting from the collaboration. The publication of clinical data in peer-reviewed journals is a crucial step in commercializing and obtaining reimbursement for our diagnostic tests, and our inability to control when and if results are published may delay or limit our ability to derive sufficient revenue from them.
If we use hazardous materials in a manner that causes contamination or injury, we could be liable for resulting damages.
We are subject to federal, state and local laws, rules and regulations governing the use, discharge, storage, handling and disposal of biological material, chemicals and waste. We cannot eliminate the risk of accidental contamination or injury to employees or third parties from the use, storage, handling or disposal of these materials. In the event of contamination or injury, we could be held liable for any resulting damages, remediation costs and any related penalties or fines, and any liability could exceed our resources or any applicable insurance coverage we may have. The cost of compliance with these laws and regulations may become significant, and our failure to comply may result in substantial fines or other consequences, and either could negatively affect our operating results.
Our inability to raise additional capital on acceptable terms in the future may limit our ability to develop and commercialize new solutions and technologies and expand our operations.
We expect continued capital expenditures and operating losses over the next several years as we expand our infrastructure, commercial operations and research and development activities. We may seek to raise additional capital through equity offerings, debt financings, collaborations or licensing arrangements. Additional funding may not be available to us on acceptable terms, or at all. If we raise funds by issuing equity securities, dilution to our stockholders could result. Any equity securities issued also may provide for rights, preferences or privileges senior to those of holders of our common stock. The terms of debt securities issued or borrowings could impose significant restrictions on our operations. The incurrence of additional indebtedness or the issuance of certain equity securities could result in increased fixed payment obligations and could also result in restrictive covenants, such as limitations on our ability to incur additional debt or issue additional equity, limitations on our ability to acquire or license intellectual property rights, and other operating restrictions that could adversely affect our ability to conduct our business. Our current credit agreement imposes restrictions on our operations, increases our fixed payment obligations, and has restrictive covenants. In addition, the issuance of additional equity securities by us, or the possibility of such issuance, may cause the market price of our common stock to decline. In the event that we enter into collaborations or licensing arrangements to raise capital, we may be required to accept unfavorable terms. These agreements may require that we relinquish or license to a third-party on unfavorable terms our rights to technologies or product candidates that we otherwise would seek to develop or commercialize ourselves, or reserve certain opportunities for future potential arrangements when we might be able to achieve more favorable terms. If we are not able to secure additional funding when needed, we may have to delay, reduce the scope of or eliminate one or more research and development programs or selling and marketing initiatives. In addition, we may have to work with a partner on one or more of our products or development programs, which could lower the economic value of those programs to our company.
Security breaches, loss of data and other disruptions to us or our third-party service providers could compromise sensitive information related to our business or prevent us from accessing critical information and expose us to liability, which could adversely affect our business and our reputation.
In the ordinary course of our business, we and our third-party service providers collect and store sensitive data, including legally protected health information, personally identifiable information about our patients, credit card information, intellectual property, and our proprietary business and financial information. We manage and maintain our applications and data utilizing a combination of on-site systems, managed data center systems and cloud-based data center systems. We face a number of risks relative to our protection of, and our service providers' protection of, this critical information, including loss of access, inappropriate disclosure and inappropriate access, as well as risks associated with our ability to identify and audit such events.
31
The secure processing, storage, maintenance and transmission of this critical information is vital to our operations and business strategy, and we devote significant resources to protecting such information. Although we take measures to protect sensitive information from unauthorized access or disclosure, our information technology and infrastructure may be vulnerable to attacks by hackers or viruses or otherwise breached due to employee error, malfeasance or other activities. While we are not aware of any such attack or breach, if such event would occur and cause interruptions in our operations, our networks would be compromised and the information we store on those networks could be accessed by unauthorized parties, publicly disclosed, lost or stolen. Any such access, disclosure or other loss of information could result in legal claims or proceedings, liability under laws that protect the privacy of personal information, such as HIPAA, and regulatory penalties. Unauthorized access, loss or dissemination could also disrupt our operations, including our ability to process tests, provide test results, bill payers or patients, process claims and appeals, provide customer assistance services, conduct research and development activities, collect, process and prepare company financial information, provide information about our tests and other patient and physician education and outreach efforts through our website, manage the administrative aspects of our business and damage our reputation, any of which could adversely affect our business.
In addition, the interpretation and application of consumer, health-related and data protection laws in the United States, Europe and elsewhere are often uncertain, contradictory and in flux. It is possible that these laws may be interpreted and applied in a manner that is inconsistent with our practices. If so, this could result in government-imposed fines or orders requiring that we change our practices, which could adversely affect our business. In addition, in October 2015, the European Court of Justice invalidated a safe-harbor agreement between the United States and European Union member-states, which addressed how U.S. companies handle personal information of European customers. On May 4, 2016, the European Commission published a new Regulation and a new Directive regarding personal data privacy. The Regulation went into force on May 24, 2016 and shall apply beginning May 25, 2018. The Directive went into force on May 5, 2016 and EU member states must transpose it into their national law by May 6, 2018. As a result, we may need to modify the way we treat such information. Complying with these various laws could cause us to incur substantial costs or require us to change our business practices, systems and compliance procedures in a manner adverse to our business.
If we cannot license rights to use technologies on reasonable terms, we may not be able to commercialize new products in the future.
In the future, we may license third-party technology to develop or commercialize new products. In return for the use of a third-party's technology, we may agree to pay the licensor royalties based on sales of our solutions. Royalties are a component of cost of revenue and affect the margins on our solutions. We may also need to negotiate licenses to patents and patent applications after introducing a commercial product. Our business may suffer if we are unable to enter into the necessary licenses on acceptable terms, or at all, if any necessary licenses are subsequently terminated, if the licensors fail to abide by the terms of the license or fail to prevent infringement by third parties, or if the licensed patents or other rights are found to be invalid or unenforceable.
If we are unable to protect our intellectual property effectively, our business would be harmed.
We rely on patent protection as well as trademark, copyright, trade secret and other intellectual property rights protection and contractual restrictions to protect our proprietary technologies, all of which provide limited protection and may not adequately protect our rights or permit us to gain or keep any competitive advantage. If we fail to protect our intellectual property, third parties may be able to compete more effectively against us and we may incur substantial litigation costs in our attempts to recover or restrict use of our intellectual property.
We apply for and in-license patents covering our products and technologies and uses thereof, as we deem appropriate, however we may fail to apply for patents on important products and technologies in a timely fashion or at all, or we may fail to apply for patents in potentially relevant jurisdictions. We have thirteen issued patents that expire between 2029 and 2032 related to methods used in the Afirma diagnostic platform, in addition to fourteen pending U.S. utility patent applications and two pending Patent Cooperation Treaty, or PCT, patent applications. Some of these U.S. utility patent applications have pending foreign counterparts. We also exclusively licensed intellectual property, including rights to two issued patents that will expire between 2030 and 2032, and three pending U.S. utility patent applications in the thyroid space that would expire between 2030 and 2033 once issued, related to methods that are used in the Afirma diagnostic test, some of which have foreign counterparts. In the lung diagnostic space, we exclusively license intellectual property rights to seven pending patent applications and one issued patent in the United States and abroad. Patents issuing from the licensed portfolio will expire between 2024 and 2028. In addition, we own a PCT application and a pending U.S. application related to our Percepta test. The PCT application is currently in the process of being
32
nationalized in Australia, Canada, China, Europe, Japan, and South Korea. We also own two applications related to other lung diseases, and a PCT application, a pending U.S. application, two ex-U.S. applications, and one provisional U.S. application related to Envisia. Any patents granted from our current lung cancer patent applications will expire no earlier than 2035 and those from the interstitial lung disease patent applications will expire no earlier than from 2034 to 2037. It is possible that none of our pending patent applications will result in issued patents in a timely fashion or at all, and even if patents are granted, they may not provide a basis for intellectual property protection of commercially viable products, may not provide us with any competitive advantages, or may be challenged and invalidated by third parties. It is possible that others will design around our current or future patented technologies. We may not be successful in defending any challenges made against our patents or patent applications. Any successful third-party challenge to our patents could result in the unenforceability or invalidity of such patents and increased competition to our business. The outcome of patent litigation can be uncertain and any attempt by us to enforce our patent rights against others may not be successful, or, if successful, may take substantial time and result in substantial cost, and may divert our efforts and attention from other aspects of our business.
The patent positions of life sciences companies can be highly uncertain and involve complex legal and factual questions for which important legal principles remain unresolved. No consistent policy regarding the breadth of claims allowed in such companies' patents has emerged to date in the United States or elsewhere. Courts frequently render opinions in the biotechnology field that may affect the patentability of certain inventions or discoveries, including opinions that may affect the patentability of methods for analyzing or comparing nucleic acids.
In particular, the patent positions of companies engaged in the development and commercialization of genomic diagnostic tests are particularly uncertain. Various courts, including the U.S. Supreme Court, have rendered decisions that affect the scope of patentability of certain inventions or discoveries relating to certain diagnostic tests and related methods. These decisions state, among other things, that patent claims that recite laws of nature (for example, the relationship between blood levels of certain metabolites and the likelihood that a dosage of a specific drug will be ineffective or cause harm) are not themselves patentable. What constitutes a law of nature is uncertain, and it is possible that certain aspects of genomic diagnostics tests would be considered natural laws. Accordingly, the evolving case law in the United States may adversely affect our ability to obtain patents and may facilitate third-party challenges to any owned and licensed patents.
The laws of some foreign countries do not protect intellectual property rights to the same extent as the laws of the United States, and we may encounter difficulties protecting and defending such rights in foreign jurisdictions. The legal systems of many other countries do not favor the enforcement of patents and other intellectual property protection, particularly those relating to biotechnology, which could make it difficult for us to stop the infringement of our patents in such countries. Proceedings to enforce our patent rights in foreign jurisdictions could result in substantial cost and divert our efforts and attention from other aspects of our business.
Changes in either the patent laws or in interpretations of patent laws in the United States or other countries may diminish the value of our intellectual property. We cannot predict the breadth of claims that may be allowed or enforced in our patents or in third-party patents. We may not develop additional proprietary products, methods and technologies that are patentable.
In addition to pursuing patents on our technology, we take steps to protect our intellectual property and proprietary technology by entering into agreements, including confidentiality agreements, non-disclosure agreements and intellectual property assignment agreements, with our employees, consultants, academic institutions, corporate partners and, when needed, our advisors. Such agreements may not be enforceable or may not provide meaningful protection for our trade secrets or other proprietary information in the event of unauthorized use or disclosure or other breaches of the agreements, and we may not be able to prevent such unauthorized disclosure. If we are required to assert our rights against such party, it could result in significant cost and distraction.
Monitoring unauthorized disclosure is difficult, and we do not know whether the steps we have taken to prevent such disclosure are, or will be, adequate. If we were to enforce a claim that a third-party had illegally obtained and was using our trade secrets, it would be expensive and time consuming, and the outcome would be unpredictable. In addition, courts outside the United States may be less willing to protect trade secrets.
We may also be subject to claims that our employees have inadvertently or otherwise used or disclosed trade secrets or other proprietary information of their former employers, or to claims that we have improperly used or obtained such trade secrets. Litigation may be necessary to defend against these claims. If we fail in defending such claims, in addition to paying monetary damages, we may lose valuable intellectual property rights and face increased competition to our business. A loss of key research personnel work product could hamper or prevent our ability to commercialize potential products, which could harm our business.
33
Even if we are successful in defending against these claims, litigation could result in substantial costs and be a distraction to management.
Further, competitors could attempt to replicate some or all of the competitive advantages we derive from our development efforts, willfully infringe our intellectual property rights, design around our protected technology or develop their own competitive technologies that fall outside of our intellectual property rights. Others may independently develop similar or alternative products and technologies or replicate any of our products and technologies. If our intellectual property does not adequately protect us against competitors' products and methods, our competitive position could be adversely affected, as could our business.
We have not registered certain of our trademarks in all of our potential markets. If we apply to register these trademarks, our applications may not be allowed for registration in a timely fashion or at all, and our registered trademarks may not be maintained or enforced. In addition, opposition or cancellation proceedings may be filed against our trademark applications and registrations, and our trademarks may not survive such proceedings. If we do not secure registrations for our trademarks, we may encounter more difficulty in enforcing them against third parties than we otherwise would.
To the extent our intellectual property offers inadequate protection, or is found to be invalid or unenforceable, we would be exposed to a greater risk of direct competition. If our intellectual property does not provide adequate coverage of our competitors' products, our competitive position could be adversely affected, as could our business. Both the patent application process and the process of managing patent disputes can be time consuming and expensive.
We may be involved in litigation related to intellectual property, which could be time-intensive and costly and may adversely affect our business, operating results or financial condition.
We may receive notices of claims of direct or indirect infringement or misappropriation or misuse of other parties' proprietary rights from time to time. Some of these claims may lead to litigation. We cannot assure you that we will prevail in such actions, or that other actions alleging misappropriation or misuse by us of third-party trade secrets, infringement by us of third-party patents and trademarks or other rights, or the validity of our patents, trademarks or other rights, will not be asserted or prosecuted against us.
We might not have been the first to make the inventions covered by each of our pending patent applications and we might not have been the first to file patent applications for these inventions. To determine the priority of these inventions, we may have to participate in interference proceedings, derivation proceedings, or other post-grant proceedings declared by the U.S. Patent and Trademark Office that could result in substantial cost to us. No assurance can be given that other patent applications will not have priority over our patent applications. In addition, recent changes to the patent laws of the United States allow for various post-grant opposition proceedings that have not been extensively tested, and their outcome is therefore uncertain. Furthermore, if third parties bring these proceedings against our patents, we could experience significant costs and management distraction.
Litigation may be necessary for us to enforce our patent and proprietary rights or to determine the scope, coverage and validity of the proprietary rights of others. The outcome of any litigation or other proceeding is inherently uncertain and might not be favorable to us, and we might not be able to obtain licenses to technology that we require on acceptable terms or at all. Further, we could encounter delays in product introductions, or interruptions in product sales, as we develop alternative methods or products. In addition, if we resort to legal proceedings to enforce our intellectual property rights or to determine the validity, scope and coverage of the intellectual property or other proprietary rights of others, the proceedings could be burdensome and expensive, even if we were to prevail. Any litigation that may be necessary in the future could result in substantial costs and diversion of resources and could have a material adverse effect on our business, operating results or financial condition.
As we move into new markets and applications for our products, incumbent participants in such markets may assert their patents and other proprietary rights against us as a means of slowing our entry into such markets or as a means to extract substantial license and royalty payments from us. Our competitors and others may now and, in the future, have significantly larger and more mature patent portfolios than we currently have. In addition, future litigation may involve patent holding companies or other adverse patent owners who have no relevant product revenue and against whom our own patents may provide little or no deterrence or protection. Therefore, our commercial success may depend in part on our non-infringement of the patents or proprietary rights of third parties. Numerous significant intellectual property issues have been litigated, and will likely continue to be litigated, between existing and new participants in our existing and targeted markets and competitors may assert that our products infringe their intellectual property rights as part of a business strategy to impede our successful entry into or growth in those markets. Third parties may assert that we are employing their proprietary technology without authorization. In addition, our competitors and others
34
may have patents or may in the future obtain patents and claim that making, having made, using, selling, offering to sell or importing our products infringes these patents. We could incur substantial costs and divert the attention of our management and technical personnel in defending against any of these claims. Parties making claims against us may be able to obtain injunctive or other relief, which could block our ability to develop, commercialize and sell products, and could result in the award of substantial damages against us. In the event of a successful claim of infringement against us, we may be required to pay damages and ongoing royalties, and obtain one or more licenses from third parties, or be prohibited from selling certain products. We may not be able to obtain these licenses on acceptable terms, if at all. We could incur substantial costs related to royalty payments for licenses obtained from third parties, which could negatively affect our financial results. In addition, we could encounter delays in product introductions while we attempt to develop alternative methods or products to avoid infringing third-party patents or proprietary rights. Defense of any lawsuit or failure to obtain any of these licenses could prevent us from commercializing products, and the prohibition of sale of any of our products could materially affect our business and our ability to gain market acceptance for our products.
Furthermore, because of the substantial amount of discovery required in connection with intellectual property litigation, there is a risk that some of our confidential information could be compromised by disclosure during this type of litigation. In addition, during the course of this kind of litigation, there could be public announcements of the results of hearings, motions or other interim proceedings or developments. If securities analysts or investors perceive these results to be negative, it could have a substantial adverse effect on the price of our common stock.
In addition, our agreements with some of our customers, suppliers or other entities with whom we do business require us to defend or indemnify these parties to the extent they become involved in infringement claims, including the types of claims described above. We could also voluntarily agree to defend or indemnify third parties in instances where we are not obligated to do so if we determine it would be important to our business relationships. If we are required or agree to defend or indemnify third parties in connection with any infringement claims, we could incur significant costs and expenses that could adversely affect our business, operating results, or financial condition.
Our ability to use our net operating loss carryforwards may be limited and may result in increased future tax liability to us.
We have incurred net losses since our inception and may never achieve profitability. To the extent that we continue to generate taxable losses, unused losses will carry forward to offset future taxable income, if any, until such unused losses expire. We may be unable to use these losses to offset income before those unused losses expire. Generally, a change of more than 50% in the ownership of a corporation’s stock, by value, over a three-year period constitutes an ownership change for U.S. federal income tax purposes. An ownership change may limit a company’s ability to use its net operating loss carryforwards attributable to the period prior to such change. In the event we have undergone an ownership change under Section 382 of the Internal Revenue Code, if we earn net taxable income, our ability to use our pre-change net operating loss carryforwards to offset U.S. federal taxable income may become subject to limitations, which could potentially result in increased future tax liability to us.
Risks Related to Being a Public Company
We will continue to incur increased costs and demands on management as a result of compliance with laws and regulations applicable to public companies, which could harm our operating results.
As a public company, we will continue to incur significant legal, accounting, consulting and other expenses that we did not incur as a private company, including costs associated with public company reporting requirements. In addition, the Sarbanes-Oxley Act of 2002 and the Dodd-Frank Act of 2010, as well as rules implemented by the Securities and Exchange Commission, or the SEC, and The NASDAQ Stock Market, impose a number of requirements on public companies, including with respect to corporate governance practices. Our management and other personnel will need to devote a substantial amount of time to these compliance and disclosure obligations. Moreover, these rules and regulations have and will continue to increase our legal, accounting and financial compliance costs and make some activities more complex, time-consuming and costly. We also expect that it will continue to be expensive for us to maintain director and officer liability insurance.
35
If we are unable to implement and maintain effective internal control over financial reporting, investors may lose confidence in the accuracy and completeness of our reported financial information and the market price of our common stock may be negatively affected.
As a public company, we are required to maintain internal control over financial reporting and to report any material weaknesses in such internal control. Section 404 of the Sarbanes-Oxley Act of 2002 requires that we evaluate and determine the effectiveness of our internal control over financial reporting and provide a management report on our internal controls on an annual basis. If we have material weaknesses in our internal control over financial reporting, we may not detect errors on a timely basis and our financial statements may be materially misstated. We have only recently compiled the systems, processes and documentation necessary to comply with Section 404 of the Sarbanes-Oxley Act. We will need to maintain and enhance these processes and controls as we grow, and we will require additional management and staff resources to do so. Additionally, even if we conclude our internal controls are effective for a given period, we may in the future identify one or more material weaknesses in our internal controls, in which case our management will be unable to conclude that our internal control over financial reporting is effective. Moreover, when we are no longer an emerging growth company, our independent registered public accounting firm will be required to issue an attestation report on the effectiveness of our internal control over financial reporting. Even if our management concludes that our internal control over financial reporting is effective, our independent registered public accounting firm may conclude that there are material weaknesses with respect to our internal controls or the level at which our internal controls are documented, designed, implemented or reviewed.
If we are unable to conclude that our internal control over financial reporting is effective, or when we are no longer an emerging growth company, if our auditors were to express an adverse opinion on the effectiveness of our internal control over financial reporting because we had one or more material weaknesses, investors could lose confidence in the accuracy and completeness of our financial disclosures, which could cause the price of our common stock to decline. Irrespective of compliance with Section 404, any failure of our internal control over financial reporting could have a material adverse effect on our reported operating results and harm our reputation. Internal control deficiencies could also result in a restatement of our financial results.
We are an emerging growth company and may elect to comply with reduced public company reporting requirements applicable to emerging growth companies, which could make our common stock less attractive to investors.
We are an emerging growth company, as defined under the Securities Act of 1933, or the Securities Act. We will remain an emerging growth company until December 31, 2018, although if our revenue exceeds $1 billion in any fiscal year before that time, we would cease to be an emerging growth company as of the end of that fiscal year. In addition, if the market value of our common stock that is held by non-affiliates exceeds $700 million as of the last business day of our second fiscal quarter of any fiscal year before the end of that five-year period, we would cease to be an emerging growth company as of December 31 of that year. As an emerging growth company, we may choose to take advantage of exemptions from various reporting requirements applicable to certain other public companies, including not being required to comply with the auditor attestation requirements of Section 404 of the Sarbanes-Oxley Act of 2002, reduced financial statement and financial-related disclosures, reduced disclosure obligations regarding executive compensation in our periodic reports and proxy statements, and exemptions from the requirement of holding a nonbinding advisory vote on executive compensation and obtaining stockholder approval of any golden parachute payments not previously approved by our stockholders. If some investors find our common stock less attractive as a result of any choices to reduce future disclosure we may make, there may be a less active trading market for our common stock and our stock price may be more volatile.
Risks Related to Our Common Stock
Our stock price may be volatile, and you may not be able to sell shares of our common stock at or above the price you paid.
The trading price of our common stock is likely to continue to be highly volatile and could be subject to wide fluctuations in response to various factors, some of which are beyond our control. These factors include:
|
•
|
actual or anticipated variations in our and our competitors' results of operations;
|
|
•
|
announcements by us or our competitors of new products, commercial relationships or capital commitments;
|
|
•
|
changes in reimbursement by current or potential payers, including governmental payers;
|
36
|
•
|
issuance of new securities analysts' reports or changed recommendations for our stock;
|
|
•
|
fluctuations in our revenue, due in part to the way in which we recognize revenue;
|
|
•
|
actual or anticipated changes in regulatory oversight of our products;
|
|
•
|
developments or disputes concerning our intellectual property or other proprietary rights;
|
|
•
|
commencement of, or our involvement in, litigation;
|
|
•
|
announced or completed acquisitions of businesses or technologies by us or our competitors;
|
|
•
|
any major change in our management; and
|
|
•
|
general economic conditions and slow or negative growth of our markets.
|
In addition, the stock market in general, and the market for stock of life sciences companies and other emerging growth companies in particular, has experienced extreme price and volume fluctuations that have often been unrelated or disproportionate to the operating performance of those companies. Broad market and industry factors may seriously affect the market price of our common stock, regardless of our actual operating performance. These fluctuations may be even more pronounced if the trading volume of our stock remains low. In addition, in the past, following periods of volatility in the overall market and the market price of a particular company's securities, securities class action litigation has often been instituted against these companies. This litigation, if instituted against us, could result in substantial costs and a diversion of our management's attention and resources.
If securities or industry analysts issue an adverse opinion regarding our stock or do not publish research or reports about our company, our stock price and trading volume could decline.
The trading market for our common stock will depend in part on the research and reports that equity research analysts publish about us, our business and our competitors. We do not control these analysts or the content and opinions or financial models included in their reports. Securities analysts may elect not to provide research coverage of our company, and such lack of research coverage may adversely affect the market price of our common stock. The price of our common stock could also decline if one or more equity research analysts downgrade our common stock or if those analysts issue other unfavorable commentary or cease publishing reports about us or our business. If one or more equity research analysts cease coverage of our company, we could lose visibility in the market, which in turn could cause our stock price to decline.
Insiders have substantial control over us and will be able to influence corporate matters.
As of February 24, 2017, directors and executive officers and their affiliates beneficially owned, in the aggregate, 34% of our outstanding capital stock. As a result, these stockholders will be able to exercise significant influence over all matters requiring stockholder approval, including the election of directors and approval of significant corporate transactions, such as a merger or other sale of our company or its assets. This concentration of ownership could limit stockholders' ability to influence corporate matters and may have the effect of delaying or preventing a third-party from acquiring control over us.
Anti-takeover provisions in our charter documents and under Delaware law could discourage, delay or prevent a change in control and may affect the trading price of our common stock.
Provisions in our restated certificate of incorporation and our amended and restated bylaws may have the effect of delaying or preventing a change of control or changes in our management. Our restated certificate of incorporation and amended and restated bylaws include provisions that:
|
•
|
authorize our board of directors to issue, without further action by the stockholders, up to 5.0 million shares of undesignated preferred stock;
|
|
•
|
require that any action to be taken by our stockholders be effected at a duly called annual or special meeting and not by written consent;
|
37
|
•
|
specify that special meetings of our stockholders can be called only by our board of directors, our chairman of the board, or our chief executive officer;
|
|
•
|
establish an advance notice procedure for stockholder approvals to be brought before an annual meeting of our stockholders, including proposed nominations of persons for election to our board of directors;
|
|
•
|
establish that our board of directors is divided into three classes, Class I, Class II and Class III, with each class serving staggered terms;
|
|
•
|
provide that our directors may be removed only for cause;
|
|
•
|
provide that vacancies on our board of directors may, except as otherwise required by law, be filled only by a majority of directors then in office, even if less than a quorum;
|
|
•
|
specify that no stockholder is permitted to cumulate votes at any election of directors; and
|
|
•
|
require a super-majority of votes to amend certain of the above-mentioned provisions.
|
In addition, we are subject to the provisions of Section 203 of the Delaware General Corporation Law regulating corporate takeovers. Section 203 generally prohibits us from engaging in a business combination with an interested stockholder subject to certain exceptions.
We have never paid dividends on our capital stock, and we do not anticipate paying dividends in the foreseeable future.
We have never paid dividends on any of our capital stock and currently intend to retain any future earnings to fund the growth of our business. In addition, our credit agreement restricts our ability to pay cash dividends on our common stock and we may also enter into credit agreements or other borrowing arrangements in the future that will restrict our ability to declare or pay cash dividends on our common stock. Any determination to pay dividends in the future will be at the discretion of our board of directors and will depend on our financial condition, operating results, capital requirements, general business conditions and other factors that our board of directors may deem relevant. As a result, capital appreciation, if any, of our common stock will be the sole source of gain for the foreseeable future.
38
None.
On April 29, 2015, we signed a non-cancelable lease agreement for approximately 59,000 square feet to serve as our South San Francisco, California headquarters and laboratory. The lease began in June 2015 and ends in March 2026, and contains extension of lease term and expansion options. Certain expansion options were waived by the Company on February 8, 2017 in exchange for consideration of $500,000. We also lease approximately 10,400 square feet of office and laboratory space in Austin, Texas, under a lease that expires in July 2018, with an option for us to extend the lease for an additional five years.
We are not currently a party to any material legal proceedings. We may from time to time become involved in legal proceedings arising in the ordinary course of business.
Not applicable.
EXECUTIVE OFFICERS OF THE REGISTRANT
Our executive officers and their ages and positions as of February 24, 2017, are as set forth below:
|
Name
|
Age
|
Position
|
|||
|
Bonnie H. Anderson
|
58
|
|
Chairman, President and Chief Executive Officer
|
||
|
Julie A. Brooks
|
71
|
|
General Counsel and Secretary
|
||
|
Keith S. Kennedy
|
47
|
|
Chief Financial Officer
|
||
|
Christopher M. Hall
|
48
|
|
Chief Operating Officer
|
||
Bonnie H. Anderson
has served as our Chief Executive Officer and as a member of our board of directors since February 2008. From August 2013 to February 2017, she served as our President, and in December 2016, she was appointed Chairman of the Board of Directors. Prior to joining us, Ms. Anderson was an independent strategic consultant from April 2006 to January 2008, including as a strategic consultant for us from July 2007 to January 2008. Ms. Anderson was a Vice President at Beckman Coulter, Inc., a manufacturer of biomedical testing instrument systems, tests and supplies, from September 2000 to March 2006. She currently serves as a director of Castle Biosciences, Inc. and as a trustee emeritus of the Keck Graduate Institute of Applied Life Sciences. Ms. Anderson holds a B.S. in Medical Technology from Indiana University of Pennsylvania.
Julie A. Brooks
has served as our General Counsel and Secretary since March 2014. Prior to joining us, Ms. Brooks was a legal consultant for Auxogyn, Inc., a women's health company, from September 2013 to December 2013. From June 2013 to September 2013, Ms. Brooks served as Vice President, General Counsel for Bayer HealthCare LLC, which acquired Conceptus, Inc., a medical device company, in June 2013, where she served as Executive Vice President, General Counsel and Secretary from November 2009 through June 2013. Previously, from November 2007 through October 2009, Ms. Brooks was Senior Vice President, General Counsel and Secretary of Perlegen Sciences, a genomics company. Ms. Brooks has also held executive roles with a number of medical device, healthcare IT, eCommerce and healthcare services companies, including Virgin HealthCare, Access Health and Westmark International. Ms. Brooks holds a B.A. in Comparative Literature and an M.B.A. from the University of Washington, a J.D. from Santa Clara University and a Masters of Law in Taxation from Georgetown University Law Center.
Keith S. Kennedy
, age 47, has served as our Chief Financial Officer since December 2016. Prior to joining us, Mr. Kennedy provided strategic counsel and consulting services from his consulting practice from September 2015 to November 2016, including advisory services to Pennant Park Investment Advisors. From February 2012 to August 2015, Mr. Kennedy served at MCG Capital Corporation, a commercial finance company, as President and Chief Executive Officer from March 2014 to August 2015, as Chief
39
Financial Officer, Chief Accounting Officer and Treasurer from May 2012 to March 2014 and as Executive Vice President and Managing Director from February 2012 to April 2012. From May 2011 to February 2012, Mr. Kennedy served as an Executive-in-Residence at Arlington Capital Partners. From October 2009 to April 2011, Mr. Kennedy pursued principal investing, including serving as Executive-in-Residence at J.I. Kislak, Inc from March 2010 to September 2010. From October 2002 to September 2009, Mr. Kennedy served as Managing Director at GE Capital, Inc. From September 1999 to October 2002, Mr. Kennedy worked as a manager of transaction services at Ernst & Young LLP. Mr. Kennedy served in the U.S. Air Force from December 1992 to December 1996. Mr. Kennedy holds a B.S. in Accounting with high distinction from Indiana University and holds an M.B.A. from the College of William & Mary. Mr. Kennedy is a chartered financial analyst and certified public accountant.
Christopher M. Hall
has served as our Chief Operating Officer since September 2014 and in February 2017, he was appointed as our President. Mr. Hall served as our Chief Commercial Officer from March 2010 to September 2014. Prior to joining us, Mr. Hall served as Chief Business Officer of Celera Corporation, a diagnostics company focusing on personalized disease management, from October 2008 to February 2010. From August 2002 to February 2010, Mr. Hall served in various executive and senior positions at Berkeley HeartLab, Inc., a cardiovascular disease management company that was acquired by Celera in October 2007, including Chief Clinical Operations Officer and Vice President of Marketing. Mr. Hall holds a B.A. in Economics and Political Science from DePauw University and an M.B.A. from Harvard Business School.
Market Information
Our common stock commenced trading on The NASDAQ Global Market under the symbol "VCYT" on October 30, 2013. Prior to that time, there was no public market for our common stock. The following table sets forth the high and low sales prices of our common stock, on a per share basis, as reported by The NASDAQ Global Market, for the periods indicated:
|
High
|
Low
|
||||||
|
2016
|
|
|
|
|
|||
|
Fourth Quarter
|
$
|
8.45
|
|
$
|
5.82
|
|
|
|
Third Quarter
|
$
|
7.96
|
|
$
|
4.83
|
|
|
|
Second Quarter
|
$
|
5.98
|
|
$
|
4.81
|
|
|
|
First Quarter
|
$
|
7.31
|
|
$
|
4.21
|
|
|
|
2015
|
|
|
|
|
|||
|
Fourth Quarter
|
$
|
8.15
|
|
$
|
4.69
|
|
|
|
Third Quarter
|
$
|
12.47
|
|
$
|
4.59
|
|
|
|
Second Quarter
|
$
|
12.20
|
|
$
|
7.24
|
|
|
|
First Quarter
|
$
|
9.74
|
|
$
|
6.50
|
|
|
As of February 24, 2017, there were approximately 23 holders of record of our common stock. However, because many of our outstanding shares are held in accounts with brokers and other institutions, we have more beneficial owners.
Dividend Policy
We have never declared or paid dividends on our common stock and do not expect to pay dividends on our common stock for the foreseeable future. Instead, we anticipate that all of our earnings in the foreseeable future will be used for the operation and growth of our business. Any future determination to declare dividends will be subject to the discretion of our board of directors and will depend on various factors, including applicable laws, our results of operations, financial condition, future prospects, and any other factors deemed relevant by our board of directors. In addition, the terms of our credit agreement restrict our ability to pay dividends on our common stock, and we may also enter into credit agreements or other borrowing arrangements in the future that will further restrict our ability to declare or pay dividends on our common stock.
40
Stock Performance Graph
The following information is not deemed to be "soliciting material" or to be "filed" with the Securities and Exchange Commission or subject to Regulation 14A or 14C under the Securities Exchange Act of 1934 (the "Exchange Act") or to the liabilities of Section 18 of the Exchange Act, and will not be deemed to be incorporated by reference into any filing under the Securities Act of 1933 or the Exchange Act, except to the extent we specifically incorporate it by reference into such a filing.
The graph below shows the cumulative total stockholder return (change in stock price plus reinvested dividends) assuming the investment of $100.00 on the date specified in each of our common stock, The NASDAQ Global Market Index, and the NASDAQ Biotechnology Index for the period commencing on October 30, 2013 (the first day of trading of our common stock) and ending on December 31, 2016. The comparisons in the table are required by the Securities and Exchange Commission and are not intended to forecast or be indicative of future performance of our common stock.
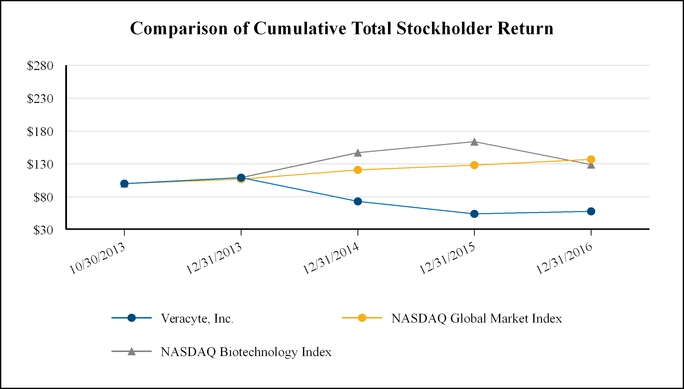
|
October 30,
2013 |
December 31,
2013 |
December 31,
2014 |
December 31,
2015 |
December 31,
2016 |
|||||||||||||||
|
Veracyte, Inc.
|
$
|
100.00
|
|
$
|
109.00
|
|
$
|
73.00
|
|
$
|
54.00
|
|
$
|
58.00
|
|
||||
|
NASDAQ Global Market Index
|
$
|
100.00
|
|
$
|
107.00
|
|
$
|
121.00
|
|
$
|
128.00
|
|
$
|
137.00
|
|
||||
|
NASDAQ Biotechnology Index
|
$
|
100.00
|
|
$
|
109.00
|
|
$
|
147.00
|
|
$
|
164.00
|
|
$
|
129.00
|
|
||||
The information set forth below should be read in conjunction with "Item 7. Management's Discussion and Analysis of Financial Condition and Results of Operations" and our audited financial statements and related notes included elsewhere in this annual report. The selected balance sheet data at December 31, 2016 and 2015 and the selected statements of operations data for each of the years ended December 31, 2016, 2015 and 2014 have been derived from our audited financial statements that are included elsewhere in this report. The selected balance sheet data at December 31, 2014, 2013 and 2012 and the selected statements of operations data for the years ended December 31, 2013 and 2012 have been derived from our audited financial statements not included in this report. The financial data are historical and are not necessarily indicative of results to be expected in any future period (in thousands of dollars, except share and per share data and GECs reported):
41
|
|
Year Ended December 31,
|
||||||||||||||||||
|
|
2016
|
2015
|
2014
|
2013
|
2012
|
||||||||||||||
|
Statements of Operations Data:
|
|
|
|
|
|
|
|
|
|
|
|||||||||
|
Revenue
|
$
|
65,085
|
|
$
|
49,503
|
|
$
|
38,190
|
|
$
|
21,884
|
|
$
|
11,628
|
|
||||
|
Operating expenses:
|
|
|
|
|
|
|
|
|
|
|
|||||||||
|
Cost of revenue(1)
|
25,462
|
|
21,497
|
|
16,606
|
|
12,607
|
|
7,584
|
|
|||||||||
|
Research and development(1)
|
15,324
|
|
12,796
|
|
9,804
|
|
7,810
|
|
6,608
|
|
|||||||||
|
Selling and marketing(1)
|
28,248
|
|
25,293
|
|
21,932
|
|
12,540
|
|
8,447
|
|
|||||||||
|
General and administrative(1)
|
23,787
|
|
22,583
|
|
18,854
|
|
12,100
|
|
7,918
|
|
|||||||||
|
Intangible asset amortization
|
1,067
|
|
800
|
|
—
|
|
—
|
|
—
|
|
|||||||||
|
Total operating expenses(1)
|
93,888
|
|
82,969
|
|
67,196
|
|
45,057
|
|
30,557
|
|
|||||||||
|
Loss from operations
|
(28,803
|
)
|
(33,466
|
)
|
(29,006
|
)
|
(23,173
|
)
|
(18,929
|
)
|
|||||||||
|
Interest expense
|
(2,757
|
)
|
(378
|
)
|
(439
|
)
|
(233
|
)
|
—
|
|
|||||||||
|
Other income (expense), net
|
202
|
|
140
|
|
72
|
|
(2,174
|
)
|
280
|
|
|||||||||
|
Net loss
|
$
|
(31,358
|
)
|
$
|
(33,704
|
)
|
$
|
(29,373
|
)
|
$
|
(25,580
|
)
|
$
|
(18,649
|
)
|
||||
|
Net loss per common share, basic and diluted
|
$
|
(1.09
|
)
|
$
|
(1.30
|
)
|
$
|
(1.36
|
)
|
$
|
(6.15
|
)
|
$
|
(28.68
|
)
|
||||
|
Shares used in computing net loss per common share, basic and diluted
|
28,830,472
|
|
25,994,193
|
|
21,639,374
|
|
4,158,664
|
|
650,333
|
|
|||||||||
|
Other Operating Data:
|
|
|
|
|
|
|
|
|
|||||||||||
|
GECs reported
|
23,237
|
|
19,421
|
|
14,061
|
|
9,716
|
|
4,993
|
|
|||||||||
|
(1)
|
Includes employee stock-based compensation as follows:
|
|
|
Year Ended December 31,
|
||||||||||||||||||
|
|
2016
|
2015
|
2014
|
2013
|
2012
|
||||||||||||||
|
Cost of revenue
|
$
|
126
|
|
$
|
100
|
|
$
|
51
|
|
$
|
34
|
|
$
|
26
|
|
||||
|
Research and development
|
1,322
|
|
1,178
|
|
790
|
|
250
|
|
131
|
|
|||||||||
|
Selling and marketing
|
1,594
|
|
1,326
|
|
707
|
|
169
|
|
111
|
|
|||||||||
|
General and administrative
|
3,336
|
|
2,998
|
|
2,000
|
|
794
|
|
407
|
|
|||||||||
|
Total stock-based compensation
|
$
|
6,378
|
|
$
|
5,602
|
|
$
|
3,548
|
|
$
|
1,247
|
|
$
|
675
|
|
||||
Balance Sheets Data:
|
|
As of December 31,
|
||||||||||||||||||
|
|
2016
|
2015
|
2014
|
2013
|
2012
|
||||||||||||||
|
Cash and cash equivalents
|
$
|
59,219
|
|
$
|
39,084
|
|
$
|
35,014
|
|
$
|
71,220
|
|
$
|
14,002
|
|
||||
|
Working capital
|
62,093
|
|
33,192
|
|
26,203
|
|
61,019
|
|
7,390
|
|
|||||||||
|
Total assets
|
101,034
|
|
75,247
|
|
64,839
|
|
79,630
|
|
19,067
|
|
|||||||||
|
Convertible preferred stock
|
—
|
|
—
|
|
—
|
|
—
|
|
63,372
|
|
|||||||||
|
Accumulated deficit
|
(180,084
|
)
|
(148,726
|
)
|
(115,022
|
)
|
(85,649
|
)
|
(60,069
|
)
|
|||||||||
|
Total stockholders' equity (deficit)
|
59,581
|
|
51,252
|
|
41,374
|
|
56,443
|
|
(58,471
|
)
|
|||||||||
42
The following discussion and analysis of financial condition and results of operations should be read together with the financial statements and the related notes included in Item 8 of Part II of this Annual Report on Form 10-K. This discussion and analysis contains certain forward-looking statements that involve risks and uncertainties. Our actual results may differ materially from those discussed below. Factors that could cause or contribute to such differences include, but are not limited to, those identified below and those set forth under the section entitled "Risk Factors" in Item 1A, and other documents we file with the Securities and Exchange Commission. Historical results are not necessarily indicative of future results.
Overview
We are a leading genomic diagnostics company that is fundamentally improving patient care by resolving diagnostic uncertainty with evidence that is trustworthy and actionable. Our products uniquely combine genomic technology, clinical science and machine learning to provide answers that give physicians and patients a clear path forward without risky, costly surgery that is often unnecessary.
The role of genomic information in medical practice is evolving rapidly and has affected the diagnosis of disease as well as treatment decisions. Over the past decade, molecular diagnostic tests that analyze genomic material from surgical tissue samples have emerged as an important complement to evaluations performed by pathologists. Information at the molecular level enables one to understand more fully the makeup and specific subtype of disease to improve diagnosis. In many cases, the genomic information derived from these samples can help guide treatment decisions as part of the standard of care.
We deploy machine learning methods and RNA expression to improve diagnostic clarity for cancer and other diseases. In our thyroid and lung cancer indications, diagnosis can be ambiguous in approximately 15-70% of patients undergoing diagnostic evaluation. Our tests provide clarity of diagnosis that can in turn guide treatment decisions in approximately half of those cases, eliminating costly, risky surgeries and other unnecessary medical procedures, improving the lives of patients and saving the healthcare system money.
Since our founding in 2008, we have commercialized three genomic tests that we believe are transforming diagnostics: the Afirma Gene Expression Classifier, or GEC, for thyroid cancer; the Percepta Bronchial Genomic Classifier for lung cancer; and the Envisia Genomic Classifier for idiopathic pulmonary fibrosis, or IPF. Collectively, we believe these three tests address a $2 billion global market opportunity.
The published evidence supporting our tests demonstrates the robustness of our science and clinical studies. Patients and physicians can access our full list of publications on our website. Nearly 30 clinical studies covering our products have been published, including two landmark clinical validation papers published in
The New England Journal of Medicine
. We continue to build upon our extensive library of clinical evidence. We also expect to continue expanding our offerings in thyroid cancer, lung cancer and interstitial lung diseases such as IPF as well as other cancer indications that we believe will benefit from our technology and approach.
We believe our focus on developing clinically useful tests that change patient care is enabling the company to set new standards in genomic test reimbursement. Our flagship product, the Afirma GEC, is now covered for more than 200 million people in the U.S. for use in thyroid cancer diagnosis and our second commercial product, the Percepta classifier, is the first genomic test to gain Medicare coverage for improved lung cancer screening and diagnosis.
Fourth Quarter and Full-Year 2016 Financial Results
|
•
|
Revenue
for the three- and twelve-month periods ended December 31, 2016 was $18.3 million and $65.1 million, respectively, an increase of 30% and 31% over the prior year.
|
|
•
|
Afirma Gene Expression Classifier (GEC) Reported Volume
for the three- and twelve-month periods ended December 31, 2016 was 6,313 and 23,237, respectively, an increase of 13% and 20% over the prior year.
|
|
•
|
Operating Expenses
for the three- and twelve-month periods ended December 31, 2016, were $21.9 million and $93.9 million, respectively, an increase of 0% and 13% over the prior year.
|
43
|
•
|
Net Loss and Comprehensive Loss
for the three- and twelve-month periods ended December 31, 2016 was ($4.4) million and ($31.4) million, respectively, a 45% and 7% reduction from the prior year.
|
|
•
|
Cash and cash equivalents
was $59.2 million at December 31, 2016. During the twelve-month period ended December 31, 2016, the company raised $51.1 million in capital, including $19.2 million in net proceeds from its March 2016 debt financing and $31.9 million in net proceeds from a public offering of common stock.
|
|
•
|
Cash Burn
for the three- and twelve-month periods ended December 31, 2016 (which is defined as net cash used in operating activities and purchases of property and equipment), was $4.7 million and $32.2 million, respectively, a 33% and 3% improvement compared to the prior year.
|
2016 and Recent Business Highlights
Reimbursement:
|
•
|
Executed a Blues group-purchasing agreement in April 2016, accelerating Blues plan in-network contracting and overall reimbursement for the Afirma GEC thyroid cancer test. As of February 28, 2017, the company has more than 70 million Blues plan members under coverage and nearly 25 million under contract.
|
|
•
|
Expanded overall covered lives for the Afirma GEC by 50 million to nearly 225 million and overall contracted lives by 25 million to over 155 million as of February 28, 2017.
|
|
•
|
Achieved draft Medicare coverage policies for the Percepta Bronchial Genomic Classifier for use in lung cancer screening and diagnosis, leading to two final policies scheduled to become effective in March 2017.
|
Clinical Evidence and Commercial Expansion:
|
•
|
Clinical utility and cost-effectiveness data for the Percepta classifier were presented at the American Thoracic Society and the CHEST annual meetings, further suggesting that use of the Percepta classifier changes patient care and reduces healthcare costs as intended.
|
|
•
|
Launched the Envisia Genomic Classifier at the CHEST annual meeting in October 2016, in conjunction with the presentation of new data suggesting the test’s ability to significantly improve the diagnosis of IPF without the need for risky, expensive surgery.
|
Pipeline Advancements:
|
•
|
Presented data at the American Thyroid Association meeting in September 2016, demonstrating the potential for a next-generation Afirma GEC, planned for 2017 introduction, to substantially increase the percentage of patients with benign thyroid nodules who may be able to avoid unnecessary surgery.
|
|
•
|
Data were published in the
Journal of the National Cancer Institute
suggesting the potential for the “field of injury” technology behind Veracyte’s Percepta classifier to enable lung cancer detection using a simple, non-invasive nasal swab test.
|
Factors Affecting Our Performance
The Number of FNAs We Receive and GECs Performed
The growth in our business is tied to the number of FNAs we receive and the number of GECs performed. Approximately 84% of FNAs we receive are for the Afirma solution, which consists of services related to rendering a cytopathology diagnosis, and if the cytopathology result is indeterminate, the GEC is performed. The remaining approximate 16% of FNAs are received from customers performing cytopathology and when the cytopathology result is indeterminate, the FNA is sent to us for the GEC only. The rate at which adoption occurs in these two settings will cause these two percentages to fluctuate over time. Less than 1% of the FNA samples we receive for cytopathology have insufficient cellular material from which to render a cytopathology
44
diagnosis. We only bill the technical component, including slide preparation, for these tests. For results that are benign or suspicious/malignant by cytopathology, we bill for these services when we issue the report to the physician. If the cytopathology result is indeterminate, defined as atypia/follicular lesions of undetermined significance (AUS/FLUS) or suspicious for FN/HCN, we perform the GEC. Historically, approximately 14%-17% of samples we have received for the Afirma solution have yielded indeterminate results by cytopathology. Approximately 5%-10% of the samples for GEC testing have insufficient RNA from which to render a result. The GEC can be reported as Benign, Suspicious or No Result. We bill for the GEC Benign and GEC Suspicious results only. After the GEC is completed, we issue the cytopathology report for the indeterminate results as well as the GEC report, and then bill for both of these tests. We incur costs of collecting and shipping the FNAs and a portion of the costs of performing tests where we cannot ultimately issue a patient report. Because we cannot bill for all samples received, the number of FNAs received does not directly correlate to the total number of patient reports issued and the amount billed.
Continued Adoption of and Reimbursement for Afirma
Revenue growth depends on both our ability to achieve broader reimbursement at increased levels from third-party payers and to expand our base of prescribing physicians and increase our penetration in existing accounts. Because some payers consider the GEC experimental and investigational, we may not receive payment for tests and payments we receive may not be at acceptable levels. We expect our revenue growth will increase as more payers make a positive coverage decision and as payers enter into contracts with us, which should enhance our accrued revenue and cash collections. To drive increased adoption of Afirma, we increased our sales force over the last several years, along with increasing our marketing efforts. We have hired institutional channel managers to focus on the institutional segment, where accounts generally send us FNAs for the GEC only, and account managers, dedicated to serving existing accounts, thereby freeing up our product specialists to focus on transacting new business. If we are unable to expand the base of prescribing physicians and penetration within these accounts at an acceptable rate, or if we are not able to execute our strategy for increasing reimbursement, we may not be able to effectively increase our revenue.
How We Recognize Revenue
We recognize revenue on an accrual basis when we are able to make a reasonable estimate of reimbursement at the time delivery is complete. In the first period in which revenue is accrued for a particular payer or test, there generally is a one-time increase in revenue. Until we have contracts with payers or can reasonably estimate the amount that will ultimately be received, we recognize the related revenue on the cash basis. As we commercialize new products, we will need to be able to make a reasonable estimate of the amount that will ultimately be received from each payer for each new product offering prior to being able to recognize the related revenue on an accrual basis. Because the timing and amount of cash payments received from payers as well as one-time increases in revenue from newly accrued payers are difficult to predict, we expect that our revenue will fluctuate significantly in any given quarter.
As of December 31, 2016, cumulative amounts billed at list price for tests processed which were not recognized as revenue upon delivery of a patient report because our accrual revenue recognition criteria were not met and for which we have not collected cash or written off as uncollectible, totaled approximately $161.2 million.
As of December 31, 2015, cumulative amounts billed at list price for tests processed which were not recognized as revenue upon delivery of a patient report because our accrual revenue recognition criteria were not met and for which we have not collected cash or written off as uncollectible, totaled $134 million. Of this amount, we recognized revenue of approximately $7.5 million in the year ended December 31, 2016, when cash was received.
Our average reimbursement per GEC was approximately $2,300 for the quarter ended December 31, 2016 as compared with approximately $2,200 for the same period in 2015. The average quarterly reimbursement ranged from $2,100 to $2,300 in 2016 as compared to a range of $2,200 to $2,300 in 2015. The average GEC reimbursement rate will change over time due to a number of factors, including medical coverage decisions by payers, the effects of contracts signed with payers, changes in allowed amounts by payers, our ability to successfully win appeals for payment, and our ability to collect cash payments from third-party payers and individual patients. Historical average reimbursement is not necessarily indicative of future average reimbursement.
45
We calculate the average GEC reimbursement from all payers, whether they are on the cash or an accrual basis, for tests that are on average a year old, since it can take a significant period of time to collect from some payers. We use an average of reimbursement for tests provided over two quarters as it reduces the effects of temporary volatility and seasonal effects. Thus the average reimbursement per GEC represents the total cash collected to date against GEC tests performed during the relevant period divided by the number of GEC tests performed during that same period.
Generally, cash we receive is collected within 12 months of the date the test is billed. We cannot provide any assurance as to when, if ever, or to what extent any of these amounts will be collected. Notwithstanding our efforts to obtain payment for these tests, payers may deny our claims, in whole or in part, and we may never receive revenue from previously performed but unpaid tests. Revenue from these tests, if any, may not be equal to the billed amount due to a number of factors, including differences in reimbursement rates, the amounts of patient co-payments and co-insurance, the existence of secondary payers and claims denials. Finally, when we increase our list price, as we did in July 2015, it will increase the cumulative amounts billed.
We incur expense for tests in the period in which the test is conducted and recognize revenue for tests in the period in which our revenue recognition criteria are met. Accordingly, any revenue that we recognize as a result of cash collection in respect of previously performed but unpaid tests will favorably impact our liquidity and results of operations in future periods.
Impact of Genzyme Co-promotion Agreements
From January 2012 through September 9, 2016, we were party to a Co-Promotion Agreement with Genzyme to market the Afirma solution in the United States. The agreement required that we pay a certain percentage of our cash receipts from the sale of the Afirma solution to Genzyme, which percentage decreased over time, ranging from 50% in 2012 to 15% beginning January 1, 2015. We received a $10.0 million upfront co-promotion fee from Genzyme under the Co-Promotion Agreement, which we amortized over the estimated useful life based on the provisions of the agreement as a reduction to selling and marketing expenses.
On March 9, 2016, we gave Genzyme notice of termination of the Agreement effective September 9, 2016 and the amortization of the upfront co-promotion fee was extended to that date. The final payments totaling $4.0 million under the Agreement were made in September 2016. We amortized $948,000 of the $10.0 million upfront co-promotion fee in the year ended December 31, 2016, compared to $1.9 million in the same period in 2015. The upfront co-promotion fee was fully amortized as of September 30, 2016.
Under the Ex-U.S. Agreement, or Ex-U.S. Agreement, we have agreed to pay Genzyme 25% of net revenue from the sale of the Afirma GEC test in Brazil and Singapore over a five-year period commencing January 1, 2015. Beginning in the fourth year of the agreement, which was effective in February 2015, if we terminate the agreement for convenience, we may be required to pay a termination fee contingent on the number of GEC billable results generated.
Development of Additional Products
We currently rely on sales of Afirma to generate all of our revenue. In May 2014, we commercially launched our Afirma Malignancy Classifiers, which we believe enhances our Afirma Thyroid FNA Analysis as a comprehensive way to manage thyroid nodule patients and serve our current base of prescribing physicians. We are also pursuing development or acquisition of products for additional diseases to increase and diversify our revenue. We launched the Percepta test in April 2015. Additionally, we introduced in October 2016 a solution for interstitial lung disease, our Envisia Genomic Classifier, that will offer an alternative to surgery by developing a genomic signature to classify samples collected through less invasive bronchoscopy techniques. We expect to continue to invest heavily in research and development in order to expand the capabilities of our solutions and to develop additional products. Our success in developing or acquiring new products will be important in our efforts to grow our business by expanding the potential market for our products and diversifying our sources of revenue.
Timing of Our Research and Development Expenses
We deploy state-of-the-art and costly genomic technologies in our biomarker discovery experiments, and our spending on these technologies may vary substantially from quarter to quarter. We also spend a significant amount to secure clinical samples that can be used in discovery and product development as well as clinical validation studies. The timing of these research and development activities is difficult to predict, as is the timing of sample acquisitions. If a substantial number of clinical samples are acquired in a given quarter or if a high-cost experiment is conducted in one quarter versus the next, the timing of these
46
expenses can affect our financial results. We conduct clinical studies to validate our new products as well as on-going clinical studies to further the published evidence to support our commercialized tests. As these studies are initiated, start-up costs for each site can be significant and concentrated in a specific quarter. Spending on research and development, for both experiments and studies, may vary significantly by quarter depending on the timing of these various expenses.
Financial Overview
Revenue
Through December 31, 2016, all of our revenue have been derived from the sale of Afirma. To date, Afirma has been delivered primarily to physicians in the United States. We generally invoice third-party payers upon delivery of a patient report to the prescribing physician. As such, we take the assignment of benefits and the risk of cash collection from the third-party payer and individual patients. Third-party payers in excess of 10% of revenue and their related revenue as a percentage of total revenue were as follows:
|
|
Year Ended
December 31,
|
|||||||
|
|
2016
|
2015
|
2014
|
|||||
|
Medicare
|
27
|
%
|
26
|
%
|
26
|
%
|
||
|
UnitedHealthcare
|
12
|
%
|
14
|
%
|
18
|
%
|
||
|
Aetna
|
8
|
%
|
9
|
%
|
11
|
%
|
||
|
47
|
%
|
49
|
%
|
55
|
%
|
|||
For tests performed where we can reasonably estimate the amount we will ultimately receive at the time delivery is complete, such as in the case of Medicare and certain other payers, we recognize the related revenue upon delivery of a patient report to the prescribing physician based on the established billing rate less contractual and other adjustments to arrive at the amount that we expect to ultimately receive. We determine the amount we expect to ultimately receive based on a per payer, per contract or agreement basis. Upon ultimate collection, the amount received where reimbursement was estimated is compared to previous estimates and the amount accrued is adjusted accordingly. In other situations, where we cannot reasonably estimate the amount that will be ultimately received, we recognize revenue on the cash basis. The incremental accrued revenue and decrease in loss from operations as a result of additional payers meeting our revenue recognition criteria was
$4.1 million
,
$0.7 million
and
$0.8 million
for tests delivered in the years ended December 31, 2016, 2015 and 2014, respectively. The incremental accrued revenue decreased loss per common share by
$0.13
,
$0.03
and
$0.04
for the years ended December 31, 2016, 2015 and 2014, respectively. Our ability to increase our revenue will depend on our ability to penetrate the market, obtain positive coverage policies from additional third-party payers, obtain reimbursement and/or enter into contracts with additional third-party payers for our current and new tests, and increase reimbursement rates for tests performed. Finally, should we recognize revenue on an accrual basis and later determine the judgments underlying estimated reimbursement change, our financial results could be negatively impacted in future quarters.
Cost of Revenue
The components of our cost of revenue are materials and service costs, including cytopathology testing services, stock-based compensation expense, direct labor costs, equipment and infrastructure expenses associated with testing samples, shipping charges to transport samples, and allocated overhead including rent, information technology, equipment depreciation and utilities. Costs associated with performing tests are recorded as the test is processed regardless of whether or when revenue is recognized with respect to that test. As a result, our cost of revenue as a percentage of revenue may vary significantly from period to period because we do not recognize all revenue in the period in which the associated costs are incurred. We expect cost of revenue in absolute dollars to increase as the number of tests we perform increases and from the higher costs of our new facility. However, we expect that the cost per test will decrease over time due to leveraging fixed costs, efficiencies we may gain as test volume increases and from automation, process efficiencies and other cost reductions. As we introduce new tests, initially our cost of revenue will be high and will increase disproportionately our aggregate cost of revenue until we achieve efficiencies in processing these new tests.
47
Research and Development
Research and development expenses include costs incurred to develop our technology, collect clinical samples and conduct clinical studies to develop and support our products. These costs consist of personnel costs, including stock-based compensation expense, prototype materials, laboratory supplies, consulting costs, costs associated with setting up and conducting clinical studies at domestic and international sites, and allocated overhead including rent, information technology, equipment depreciation and utilities. We expense all research and development expenses in the periods in which they are incurred. We expect to incur significant research and development expenses as we continue to invest in research and development activities related to developing additional products and evaluating various platforms. We incurred research and development expenses in 2016 for the development and launch of Envisia and for the continued development and support of the Afirma and Percepta tests. In 2017, we expect to incur research and development expenses on ongoing evidence development for our Afirma. Percepta and Envisia classifiers.
Selling and Marketing
Selling and marketing expenses consist of personnel costs, including stock-based compensation expense, direct marketing expenses, consulting costs, and allocated overhead including rent, information technology, equipment depreciation and utilities. In addition, co-promotion fees paid to Genzyme, net of amortization of the upfront fee received, are included in selling and marketing expenses. Beginning in November 2014, our personnel and marketing costs increased as we took on more sales and marketing responsibilities related to Afirma, but these increases were offset by the lower rate we were required to pay Genzyme under the Co-Promotion Agreement beginning in January 2015. On March 9, 2016, we gave Genzyme notice of termination of the Co-Promotion Agreement effective September 9, 2016. Consequently, in 2016, we further expanded our internal sales force and increased our marketing spending as we transitioned out of the relationship. We have also incurred increased selling and marketing expense as a result of investments in our lung product portfolio. We believe selling and marketing expenses will continue to increase as we launch and promote our new tests.
General and Administrative
General and administrative expenses include those from executive, finance and accounting, human resources, legal, billing and client services, and quality and regulatory functions. These expenses include personnel costs, including stock-based compensation expense, audit and legal expenses, consulting costs, costs associated with being a public company, and allocated overhead including rent, information technology, equipment depreciation and utilities. We expect these expenses to continue to grow as we build our general and administration infrastructure and to stabilize thereafter.
Intangible Asset Amortization
Intangible asset amortization began in April 2015 when we launched the Percepta test and as a result reclassified the indefinite-lived intangible asset to a finite-lived intangible asset. The finite-lived intangible asset with a cost of $16.0 million is being amortized over 15 years, using the straight-line method.
Interest Expense
Interest expense is attributable to our borrowings under our loan and security agreement and the credit agreement that replaced it.
Other Income (Expense), Net
Other income (expense), net consists primarily of sublease rental income and interest income received from payers and from our cash equivalents.
48
Critical Accounting Policies and Estimates
Our management's discussion and analysis of our financial condition and results of operations is based on our audited financial statements, which have been prepared in accordance with United States generally accepted accounting principles, or U.S. GAAP. The preparation of the financial statements requires us to make estimates and assumptions that affect the reported amounts of assets and liabilities and the disclosure of contingent assets and liabilities at the date of the financial statements, as well as the reported revenue generated and expenses incurred during the reporting periods. Our estimates are based on our historical experience and on various other factors that we believe are reasonable under the circumstances, the results of which form the basis for making judgments about the carrying value of assets and liabilities that are not readily apparent from other sources. Actual results may differ from these estimates under different assumptions or conditions and any such differences may be material. We believe that the accounting policies discussed below are critical to understanding our historical and future performance, as these policies relate to the more significant areas involving management's judgments and estimates.
Revenue Recognition
We recognize revenue in accordance with the provisions of Accounting Standards Codification (“ASC”) 954-605,
Health Care Entities — Revenue Recognition
. Our revenue is generated from the provision of diagnostic services. The service is completed upon the delivery of test results to the prescribing physician, at which time we bill for the service. We recognize revenue related to billings for tests delivered on an accrual basis when amounts that will ultimately be realized can be reasonably estimated. The estimates of amounts that will ultimately be realized require significant judgment by management. Until a contract has been negotiated with a commercial payer or governmental program, our tests may or may not be covered by these entities’ existing reimbursement policies. In addition, patients do not enter into direct agreements with us that commit them to pay any portion of the cost of the tests in the event that their insurance declines to reimburse us. We may bill the patient directly for these amounts in the form of co-payments and co-insurance in accordance with their insurance carrier and health plans. In the absence of contracted reimbursement coverage or the ability to reasonably estimate the amount that will ultimately be realized for our services, revenue is recognized on the cash basis.
We use judgment in determining if we are able to make a reasonable estimate of what will be ultimately realized. We also use judgment in estimating the amounts we expect to collect by payer. Our judgments will continue to evolve in the future as we continue to gain payment experience.
Business Combination
We account for acquisitions using the acquisition method of accounting which requires the recognition of tangible and identifiable intangible assets acquired and liabilities assumed at their estimated fair values as of the business combination date. We allocate any excess purchase price over the estimated fair value assigned to the net tangible and identifiable intangible assets acquired and liabilities assumed to goodwill. Transaction costs are expensed as incurred in general and administrative expenses. Results of operations and cash flows of acquired companies are included in our operating results from the date of acquisition.
Finite-lived Intangible Assets
Finite-lived intangible assets relates to intangible assets reclassified from indefinite-lived intangible assets, following the launch of Percepta in April 2015. We amortize finite-lived intangible assets using the straight-line method, over their estimated useful life. The estimated useful life of 15 years was used for the intangible asset related to Percepta based on management's estimate of product life, product life of other diagnostic tests and patent life. We test this finite-lived intangible asset for impairment when events or circumstances indicate a reduction in the fair value below its carrying amount. There was no impairment for the years ended December 31, 2016 and 2015.
Goodwill
Goodwill, derived from our acquisition of Allegro, is reviewed for impairment on an annual basis or more frequently if events or circumstances indicate that it may be impaired. Our goodwill evaluation is based on both qualitative and quantitative assessments regarding the fair value of goodwill relative to its carrying value. We have determined that we operate in a single segment and have a single reporting unit associated with the development and commercialization of diagnostic products. In the event we determine that it is more likely than not the carrying value of the reporting unit is higher than its fair value, quantitative testing is performed comparing recorded values to estimated fair values. If impairment is present, the impairment loss is measured as the
49
excess of the recorded goodwill over its implied fair value. We perform our annual evaluation of goodwill during the fourth quarter of each fiscal year. There was no impairment for the years ended
December 31, 2016
and
2015
.
Stock-based Compensation
We recognize stock-based compensation expense for only those shares underlying stock options and restricted stock units that we expect to vest on a straight-line basis over the requisite service period of the award. We estimate the fair value of stock options using a Black-Scholes option-pricing model, which requires the input of highly subjective assumptions, including the option's expected term and stock price volatility. In addition, judgment is also required in estimating the number of stock-based awards that are expected to be forfeited. Forfeitures are estimated based on historical experience at the time of grant and revised, if necessary, in subsequent periods if actual forfeitures differ from those estimates. The assumptions used in calculating the fair value of share-based payment awards represent management's best estimates, but these estimates involve inherent uncertainties and the application of management's judgment. As a result, if factors change and we use different assumptions, our stock-based compensation expense could be materially different in the future.
Results of Operations
Comparison of the Years Ended December 31, 2016, 2015 and 2014 (in thousands of dollars, except percentages)
|
|
Year Ended December 31,
|
||||||||||||||||||||||||
|
|
2016
|
Change
|
%
|
2015
|
Change
|
%
|
2014
|
||||||||||||||||||
|
Revenue
|
$
|
65,085
|
|
$
|
15,582
|
|
31
|
%
|
$
|
49,503
|
|
$
|
11,313
|
|
30
|
%
|
$
|
38,190
|
|
||||||
|
Operating expense:
|
|
|
|
|
|
|
|
|
|
|
|
|
|
|
|||||||||||
|
Cost of revenue
|
25,462
|
|
3,965
|
|
18
|
%
|
21,497
|
|
4,891
|
|
29
|
%
|
16,606
|
|
|||||||||||
|
Research and development
|
15,324
|
|
2,528
|
|
20
|
%
|
12,796
|
|
2,992
|
|
31
|
%
|
9,804
|
|
|||||||||||
|
Selling and marketing
|
28,248
|
|
2,955
|
|
12
|
%
|
25,293
|
|
3,361
|
|
15
|
%
|
21,932
|
|
|||||||||||
|
General and administrative
|
23,787
|
|
1,204
|
|
5
|
%
|
22,583
|
|
3,729
|
|
20
|
%
|
18,854
|
|
|||||||||||
|
Intangible asset amortization
|
1,067
|
|
267
|
|
33
|
%
|
800
|
|
800
|
|
—
|
|
—
|
|
|||||||||||
|
Total operating expenses
|
93,888
|
|
10,919
|
|
13
|
%
|
82,969
|
|
15,773
|
|
23
|
%
|
67,196
|
|
|||||||||||
|
Loss from operations
|
(28,803
|
)
|
4,663
|
|
14
|
%
|
(33,466
|
)
|
(4,460
|
)
|
(15
|
)%
|
(29,006
|
)
|
|||||||||||
|
Interest expense
|
(2,757
|
)
|
(2,379
|
)
|
629
|
%
|
(378
|
)
|
61
|
|
14
|
%
|
(439
|
)
|
|||||||||||
|
Other income (expense), net
|
202
|
|
62
|
|
44
|
%
|
140
|
|
68
|
|
94
|
%
|
72
|
|
|||||||||||
|
Net loss and comprehensive loss
|
$
|
(31,358
|
)
|
$
|
2,346
|
|
7
|
%
|
$
|
(33,704
|
)
|
$
|
(4,331
|
)
|
(15
|
)%
|
$
|
(29,373
|
)
|
||||||
Revenue
Revenue increased
$15.6 million
, or
31%
, for the year ended December 31, 2016 compared to the same period in 2015. The increase was primarily due to the increased adoption of Afirma and the resultant increase in tests delivered, especially the proportion of GEC tests reported and additional payers meeting our revenue recognition criteria for accrual. Revenue recognized when cash is received has decreased because more payers who were previously recognized on the cash basis have met our revenue recognition criteria and are recognized on an accrual basis.
Revenue increased
$11.3 million
, or
30%
, for the year ended December 31, 2015 compared to the same period in 2014. The increase was primarily due to increased adoption of Afirma and the resultant increase in tests delivered, especially the proportion of GEC tests reported, and, to a lesser extent, additional payers meeting our revenue recognition criteria for accrual, partially offset by a decrease in revenue recorded when cash is received. Cash revenue for the year December 31, 2015 was positively impacted by $0.5 million of catch-up payments.
50
Revenue recognized on an accrual basis and when cash is received for the years ended December 31, 2016, 2015 and 2014 was as follows (in thousands of dollars, except percentages):
|
|
Year Ended December 31,
|
|||||||||||||||||||
|
|
2016
|
%
|
2015
|
%
|
2014
|
%
|
||||||||||||||
|
Revenue recognized on an accrual basis
|
$
|
47,099
|
|
72
|
%
|
$
|
27,043
|
|
55
|
%
|
$
|
12,545
|
|
33
|
%
|
|||||
|
Revenue recognized when cash is received
|
17,986
|
|
28
|
%
|
22,460
|
|
45
|
%
|
25,645
|
|
67
|
%
|
||||||||
|
Total
|
$
|
65,085
|
|
100
|
%
|
$
|
49,503
|
|
100
|
%
|
$
|
38,190
|
|
100
|
%
|
|||||
Cost of revenue
Comparison of the years ended December 31, 2016, 2015 and 2014 is as follows (in thousands of dollars, except percentages):
|
|
Year Ended December 31,
|
||||||||||||||||||||||||
|
|
2016
|
Change
|
%
|
2015
|
Change
|
%
|
2014
|
||||||||||||||||||
|
Cost of revenue:
|
|
|
|
|
|
|
|
|
|
|
|
|
|
|
|||||||||||
|
Reagents, chips, consumables and related
|
$
|
9,639
|
|
$
|
2,131
|
|
28
|
%
|
$
|
7,508
|
|
$
|
2,238
|
|
42
|
%
|
$
|
5,271
|
|
||||||
|
Cytopathology fees and related costs
|
5,963
|
|
427
|
|
8
|
%
|
5,536
|
|
975
|
|
21
|
%
|
4,561
|
|
|||||||||||
|
Sample collection
|
3,458
|
|
334
|
|
11
|
%
|
3,124
|
|
593
|
|
23
|
%
|
2,531
|
|
|||||||||||
|
Direct labor
|
3,195
|
|
667
|
|
26
|
%
|
2,528
|
|
719
|
|
40
|
%
|
1,809
|
|
|||||||||||
|
Other
|
3,207
|
|
406
|
|
14
|
%
|
2,801
|
|
366
|
|
15
|
%
|
2,434
|
|
|||||||||||
|
Total
|
$
|
25,462
|
|
$
|
3,965
|
|
18
|
%
|
$
|
21,497
|
|
$
|
4,891
|
|
29
|
%
|
$
|
16,606
|
|
||||||
Cost of revenue increased
$4.0 million
, or
18%
, for the year ended December 31, 2016 compared to the same period in 2015. Given our continued focus on GEC growth and the adoption of the Afirma test, GEC tests increased by 20% and cytopathology tests increased by 7%. The increase in reagents, chips, consumables and related costs is associated primarily with increased GEC test volume and commission expense to a supplier corresponding increased GEC test volume, as well as additional payers meeting our revenue recognition criteria for accrual in 2016. The increase in cytopathology fees is related to the volume increase in FNA samples processed. The increase in sample collection costs is primarily related to increased volume of samples. The increase in direct labor is associated with an average lab headcount increase of 19%, the increase in sample volume, and the mix shift to relatively more GECs versus cytopathology tests, as more labor hours are incurred on GEC tests compared to cytopathology tests and at a higher average employee cost. Other costs are primarily indirect costs, such as facilities allocation, depreciation and equipment maintenance, which increased as a result of increased allocable costs, mainly due to our move into a larger facility in early 2016.
Cost of revenue increased
$4.9 million
, or
29%
, for the year ended December 31, 2015 compared to the same period in 2014. Given our continued focus on GEC growth and the adoption of the Afirma test, GEC tests increased by 38% and cytopathology tests increased by 13%. The increase in reagents, chips, consumables and related costs is associated primarily with increased GEC test volume. The increase in cytopathology fees is related to the volume increase in FNA samples processed. The increase in sample collection costs is primarily related to increased volume of samples. The increase in direct labor is associated with the increase in sample volume and the mix shift to relatively more GECs versus cytopathology tests, as more labor hours are incurred on GEC tests compared to cytopathology tests and at a higher average employee cost. Other costs are primarily indirect costs, such as facilities allocation, depreciation and equipment maintenance, which increased as a result of increased allocable costs and increased allocation to cost of revenue due to an average headcount increase of 34%.
51
Research and development
Comparison of the years ended December 31, 2016, 2015 and 2014 is as follows (in thousands of dollars, except percentages):
|
|
Year Ended December 31,
|
||||||||||||||||||||||||
|
|
2016
|
Change
|
%
|
2015
|
Change
|
%
|
2014
|
||||||||||||||||||
|
Research and development expense:
|
|
|
|
|
|
|
|
|
|
|
|
|
|
|
|||||||||||
|
Personnel-related expense
|
$
|
6,846
|
|
$
|
932
|
|
16
|
%
|
$
|
5,914
|
|
$
|
1,380
|
|
30
|
%
|
$
|
4,534
|
|
||||||
|
Stock-based compensation expense
|
1,322
|
|
144
|
|
12
|
%
|
1,178
|
|
388
|
|
49
|
%
|
790
|
|
|||||||||||
|
Direct R&D expense
|
4,202
|
|
796
|
|
23
|
%
|
3,406
|
|
672
|
|
25
|
%
|
2,734
|
|
|||||||||||
|
Other expense
|
2,954
|
|
656
|
|
29
|
%
|
2,298
|
|
552
|
|
32
|
%
|
1,746
|
|
|||||||||||
|
Total
|
$
|
15,324
|
|
$
|
2,528
|
|
20
|
%
|
$
|
12,796
|
|
$
|
2,992
|
|
31
|
%
|
$
|
9,804
|
|
||||||
Research and development expense increased
$2.5 million
, or
20%
, for the year ended December 31, 2016 compared to the same period in 2015. The increase in personnel-related expense was primarily due to an 8% increase in average headcount including an increase in senior level positions, and increased accrued bonuses as a result of increased bonus targets and performance. The increase in stock-based compensation expense reflects option grants to new and existing employees. The increase in direct R&D expense was primarily due to materials purchased for research and development experiments. Other expense increased primarily as a result of depreciation and increased information technology and facilities expenses that were related to research and development activities.
Research and development expense increased
$3.0 million
, or
31%
, for the year ended December 31, 2015 compared to the same period in 2014. The increase in personnel-related expense was primarily due to increased accrued bonuses as a result of increased bonus targets and performance as well as an 18% increase in average headcount in 2015 compared to 2014. The increase in stock-based compensation expense reflects option grants to new and existing employees. The increase in direct R&D expense was primarily due to increased clinical expenses associated with our ongoing thyroid studies and the Percepta clinical utility study and materials purchased for research and development experiments. Other expense increased primarily as a result of consulting and increased information technology and facilities expenses that were related to research and development activities.
Selling and marketing
Comparison of the years ended December 31, 2016, 2015 and 2014 is as follows (in thousands of dollars, except percentages):
|
|
Year Ended December 31,
|
||||||||||||||||||||||||
|
|
2016
|
Change
|
%
|
2015
|
Change
|
%
|
2014
|
||||||||||||||||||
|
Selling and marketing expense:
|
|
|
|
|
|
|
|
|
|
|
|
|
|
|
|
|
|||||||||
|
Genzyme co-promotion expense, net
|
$
|
5,103
|
|
$
|
(264
|
)
|
|
(5
|
)%
|
$
|
5,367
|
|
$
|
(4,366
|
)
|
|
(45
|
)%
|
$
|
9,733
|
|
||||
|
Personnel-related expense
|
15,473
|
|
$
|
3,406
|
|
|
28
|
%
|
12,067
|
|
3,946
|
|
|
49
|
%
|
8,121
|
|
||||||||
|
Stock-based compensation expense
|
1,594
|
|
$
|
268
|
|
|
20
|
%
|
1,326
|
|
619
|
|
|
88
|
%
|
707
|
|
||||||||
|
Direct marketing expense
|
2,957
|
|
$
|
89
|
|
|
3
|
%
|
2,868
|
|
1,324
|
|
|
86
|
%
|
1,544
|
|
||||||||
|
Other expense
|
3,121
|
|
$
|
(544
|
)
|
|
(15
|
)%
|
3,665
|
|
1,838
|
|
|
101
|
%
|
1,827
|
|
||||||||
|
Total
|
$
|
28,248
|
|
$
|
2,955
|
|
|
12
|
%
|
$
|
25,293
|
|
$
|
3,361
|
|
|
15
|
%
|
$
|
21,932
|
|
||||
52
Selling and marketing expense increased
$3.0 million
, or
12%
, for the year ended December 31, 2016 compared to the same period in 2015. The decrease in Genzyme co-promotion expense, net, reflects the termination of the Co-Promotion Agreement in September 2016 offset by higher co-promotion fees from an increase in cash collections for Afirma up to the termination of the Co-Promotion Agreement as compared to the same period in the prior year. The increase in personnel-related expense was primarily due to a 30% increase in average headcount of our sales and marketing team as a result of the termination of the Co-Promotion Agreement, as well as increased commissions. The increase in stock-based compensation expense reflects option grants to new and existing employees. The decrease in other expense was primarily due to a reduction of consulting expenses.
Selling and marketing expense increased
$3.4 million
, or
15%
, for the year ended December 31, 2015 compared to the same period in 2014. The decrease in Genzyme co-promotion expense, net, reflects a reduction in the co-promotion percentage rate payable to Genzyme in 2015 as compared to 2014, partially offset by growth in cash collections. The increase in personnel-related expense was primarily due to a 47% increase in average headcount of our sales and marketing team in 2015 compared to 2014, as well as increased commissions and accrued bonus as a result of increased performance and bonus targets. The increase in stock-based compensation expense reflects option grants to new and existing employees. The increase in direct marketing expense was due primarily to expenses associated with Afirma, including trade shows, market research, advertising, public relations, speaker programs and, to a lesser extent, lung-related marketing expenses. The increase in other expense was primarily due to an increase in consulting expenses and, to a lesser extent, an increase in information technology and facilities expenses that were related to sales and marketing activities.
General and administrative
Comparison of the years ended December 31, 2016, 2015 and 2014 is as follows (in thousands of dollars, except percentages):
|
|
Year Ended December 31,
|
||||||||||||||||||||||||
|
|
2016
|
Change
|
%
|
2015
|
Change
|
%
|
2014
|
||||||||||||||||||
|
General and administrative expense:
|
|
|
|
|
|
|
|
|
|
|
|
|
|
|
|||||||||||
|
Personnel-related expense
|
$
|
12,630
|
|
$
|
2,235
|
|
22
|
%
|
$
|
10,395
|
|
$
|
832
|
|
9
|
%
|
$
|
9,563
|
|
||||||
|
Stock-based compensation expense
|
3,336
|
|
$
|
338
|
|
11
|
%
|
2,998
|
|
998
|
|
50
|
%
|
2,000
|
|
||||||||||
|
Professional fees expense
|
4,455
|
|
$
|
(623
|
)
|
(12
|
)%
|
5,078
|
|
553
|
|
12
|
%
|
4,525
|
|
||||||||||
|
Rent and other facilities expense
|
2,470
|
|
$
|
(156
|
)
|
(6
|
)%
|
2,626
|
|
1,122
|
|
75
|
%
|
1,504
|
|
||||||||||
|
Other expense
|
896
|
|
$
|
(590
|
)
|
(40
|
)%
|
1,486
|
|
224
|
|
18
|
%
|
1,262
|
|
||||||||||
|
Total
|
$
|
23,787
|
|
$
|
1,204
|
|
5
|
%
|
$
|
22,583
|
|
$
|
3,729
|
|
20
|
%
|
$
|
18,854
|
|
||||||
General and administrative expense increased
$1.2 million
, or
5%
, for the year ended December 31, 2016 compared to the same period in 2015. The increase in personnel-related expense was primarily due to a 9% increase in average headcount in 2016 compared to 2015, increased accrued bonuses as a result of increased bonus targets and performance, and higher employee separation costs. The increase in stock-based compensation expense was primarily due to option grants to new and existing employees. The decrease in professional fees was primarily due to lower audit and legal expenses. The decrease in rent and other facilities expense was largely due to incurring more months of facilities expenses in 2015 for our new South San Francisco facility and our previous space, for which the lease ended in March 2016. The decrease in other expense was primarily due to consulting expense of approximately $1.2 million in 2015, largely related to accounting services that did not recur as we hired full-time staff, partially offset by higher general administrative expenses.
General and administrative expense increased
$3.7 million
, or
20%
, for the year ended December 31, 2015 compared to the same period in 2014. The increase in personnel-related expense was primarily due to increased accrued bonuses as a result of increased bonus targets and performance, as well as an 18% increase in average headcount in 2015 compared to 2014, offset by bonus and severance of $1.2 million associated with the Allegro acquisition in 2014. The increase in stock-based compensation expense was primarily due to option grants to new and existing employees. The increase in professional fees includes higher accounting, audit, legal and other corporate expenses including insurance, offset by $0.5 million of professional and consulting fees associated with the Allegro acquisition in 2014. The increase in rent and other facilities expense was largely due to incurring expense for our new South San Francisco facility, as well as our previous space, for which the lease ended in March 2016. While
53
we did not begin to make rent payments for our new South San Francisco facility until April 2016, in accordance with GAAP, the rent is expensed on a straight-line basis over the lease period. Prior to utilizing the space, this rent expense was being charged to general and administrative in the amount of approximately $0.5 million per quarter. The increase in other expense was due primarily to an increase in consulting expense of approximately $0.5 million and other expenses, partially offset by decreases in information technology and facilities costs as a result of higher allocations to other functions due to increased average headcount in other functions.
Interest expense
Interest expense increased $2.4 million for the year ended December 31, 2016 compared to the same period in 2015, primarily due to interest on the initial term loan of $25.0 million under a credit agreement entered into in March 2016. Interest expense decreased $61,000 for the year ended December 31, 2015 compared to the same period in 2014, primarily due to the debt modification under our amended loan and security agreement entered into in December 2014.
Other income (expense), net
Other income (expense), net, increased $62,000 for the year ended December 31, 2016 compared to the same period in 2015, primarily due to interest income received. Other income (expense), net, increased $68,000 for the year ended December 31, 2015 compared to the same period in 2014, primarily due to interest income received.
Liquidity and Capital Resources
We have incurred net losses since our inception. For the years ended December 31, 2016, 2015 and 2014, we had a net loss of $31.4 million, $33.7 million and $29.4 million, respectively, and we expect to incur additional losses in 2017 and in future years. As of December 31, 2016, we had an accumulated deficit of $180.1 million. We may never achieve revenue sufficient to offset our expenses.
In November 2016, we issued and sold
5,723,300
shares of common stock in a public offering, at a price of
$6.00
per share. We raised
$32.1 million
in net proceeds, after deducting expenses of
2.2 million
.
In April 2015, we completed a private placement of 4,907,975 shares of our common stock to certain accredited investors at a purchase price of $8.15 per share. Gross proceeds to us were $40.0 million and we received $37.3 million in net proceeds, after deducting placement agent fees and other expenses payable by us of $2.7 million.
We believe our existing cash and cash equivalents of $59.2 million as of December 31, 2016 and our revenue during the 12 months following March 1, 2017 will be sufficient to meet our anticipated cash requirements for at least the 12 months following March 1, 2017.
From inception through December 31, 2016, we have received $250.0 million in net proceeds from various sources to finance our operations, including net proceeds of $78.6 million from sales of our preferred stock, net proceeds of $59.2 million from our IPO, net proceeds of $37.3 million from our sale of common stock in a private placement, net proceeds of $31.9 million from our sale of common stock in a public offering, $10.0 million from the Co-Promotion Agreement, net borrowings of $4.9 million under our loan and security agreement, $24.5 million under our credit agreement, $3.2 million from the exercise of stock options and purchases of stock under the employee stock purchase plan and conversion of accrued interest to long-term debt of $0.4 million.
In March 2016, we entered into a credit agreement, or Credit Agreement, with Visium Healthcare Partners, LP, or Visium. Under the Credit Agreement, two term loans are available to us with an aggregate principal amount of up to $40.0 million. We drew down the initial $25.0 million term loan, or Initial Term Loan, on March 30, 2016. On or prior to June 30, 2017, we may request the second term loan of up to $15.0 million, or the Second Term Loan. The Initial Term Loan and the Second Term Loan are referred to as Term Loans, which mature on March 31, 2022.
The Term Loans bear interest at a fixed rate of 12.0% per annum, payable quarterly at the end of each March, June,
September and December. No principal payments will be due during an interest-only period, commencing on the funding date for the Initial Term Loan, or Initial Borrowing Date, and continuing through and including March 31, 2020. We are obligated to repay the outstanding principal amounts under the Term Loans in eight equal installments during the final two years under the Credit Agreement. For any quarterly interest payment through and including the 16th interest payment date after
54
the Initial Borrowing Date, so long as no event of default has occurred and is then continuing, we may elect to pay interest in cash on the outstanding principal amounts of the Term Loans at a fixed rate of 9.0%, with the remaining 3.0% of the 12.0% interest paid-in-kind by adding such paid-in-kind interest to the outstanding principal amounts of the Term Loans. We elected to pay interest in-kind for the quarters ended June 30, 2016 and September 30, 2016 and have recorded $385,000 of paid-in-kind interest through December 31, 2016.
We may prepay the outstanding principal amount under the Term Loans subject to a minimum of $5.0 million of principal amount or a whole multiple of $1.0 million in excess thereof plus accrued and unpaid interest and a prepayment premium. The prepayment premium will be assessed on the principal amount repaid and will equal (i) 24.0% less the aggregate amount of all interest payments in cash, if the prepayment is made on or prior to March 31, 2018, (ii) 4.0%, if the prepayment is made after March 31, 2018 and on or prior to March 31, 2019, (iii) 2.0%, if the prepayment is made after March 31, 2019 and on or prior to March 31, 2020, and (iv) 1.0%, if the prepayment is made after March 31, 2020 and on or prior to March 31, 2021. After March 31, 2021 there is no prepayment premium.
Our obligations under the Credit Agreement are secured by a security interest in substantially all of our assets. The Credit Agreement contains customary representations, warranties and events of default, as well as affirmative and negative covenants. The negative covenants include, among other provisions, covenants that limit or restrict our ability to incur liens, make investments, incur indebtedness, merge with or acquire other entities, dispose of assets, make dividends or other distributions to holders of our equity interests, engage in any material new line of business or enter into certain transactions with affiliates, in each case subject to certain exceptions. The Credit Agreement also includes financial covenants requiring minimum cash and cash equivalents balances and minimum revenues. To the extent we form or acquire certain subsidiaries domiciled in the United States, those subsidiaries are required to be guarantors of our obligations under the Credit Agreement. As of December 31, 2016, we were in compliance with the loan covenants.
In June 2013, we entered into a loan and security agreement as subsequently amended (“2013 Loan Agreement”) with a financial institution that provided for borrowings of up to $10.0 million in aggregate. Borrowings under the 2013 Loan Agreement totaled $5.0 million, which was outstanding at January 1, 2015 and into 2016 until such amount was repaid in full upon entering into the Credit Agreement discussed above.
In conjunction with the acquisition of Allegro in September 2014, we issued 964,377 shares of our common stock, paid $2.7 million in cash, settled in cash outstanding indebtedness of Allegro totaling $4.3 million, and paid severance and bonus to Allegro personnel of $1.2 million.
We expect that our near- and longer-term liquidity requirements will continue to consist of selling and marketing expenses, research and development expenses, working capital and general corporate expenses associated with the growth of our business. However, we may also use cash to acquire or invest in complementary businesses, technologies, services or products that would change our cash requirements. If we are not able to generate revenue to finance our cash requirements, we will need to finance future cash needs primarily through public or private equity offerings, debt financings, borrowings or strategic collaborations or licensing arrangements. If we raise funds by issuing equity securities, dilution to stockholders could result. Any equity securities issued also may provide for rights, preferences or privileges senior to those of holders of our common stock. The terms of debt securities issued or borrowings could impose significant restrictions on our operations. The incurrence of additional indebtedness or the issuance of certain equity securities could result in increased fixed payment obligations and could also result in restrictive covenants, such as limitations on our ability to incur additional debt or issue additional equity, limitations on our ability to acquire or license intellectual property rights and other operating restrictions that could adversely affect our ability to conduct our business. Our Credit Agreement imposes restrictions on our operations, increases our fixed payment obligations and has restrictive covenants. In addition, the issuance of additional equity securities by us, or the possibility of such issuance, may cause the market price of our common stock to decline. In the event that we enter into collaborations or licensing arrangements to raise capital, we may be required to accept unfavorable terms. These agreements may require that we relinquish or license to a third-party on unfavorable terms our rights to technologies or product candidates that we otherwise would seek to develop or commercialize ourselves, or reserve certain opportunities for future potential arrangements when we might be able to achieve more favorable terms. If we are not able to secure additional funding when needed, we may have to delay, reduce the scope of or eliminate one or more research and development programs or selling and marketing initiatives, or forgo potential acquisitions or investments. In addition, we may have to work with a partner on one or more of our products or development programs, which could lower the economic value of those programs to us.
55
The following table summarizes our cash flows for the years ended December 31, 2016, 2015 and 2014 (in thousands of dollars):
|
|
Years Ended December 31,
|
||||||||||
|
|
2016
|
2015
|
2014
|
||||||||
|
Cash used in operating activities
|
$
|
(27,982
|
)
|
$
|
(26,965
|
)
|
$
|
(27,632
|
)
|
||
|
Cash used in investing activities
|
(4,212
|
)
|
(6,698
|
)
|
(9,010
|
)
|
|||||
|
Cash provided by financing activities
|
52,329
|
|
37,733
|
|
436
|
|
|||||
Cash Flows from Operating Activities
Cash used in operating activities for the year ended December 31, 2016 was $28.0 million. The net loss of $31.4 million includes non-cash charges of $0.9 million in amortization of the deferred fee received from Genzyme, offset primarily by $6.4 million of stock-based compensation expense, $3.5 million of depreciation and amortization, which includes $1.1 million of intangible asset amortization, $0.4 million from conversion of accrued interest to long-term debt and $0.3 million in interest and prepayment penalty relating to the repayment of our borrowings under our 2013 Loan Agreement. Cash used as a result of changes in operating assets and liabilities of $6.4 million is primarily due to an increase in accounts receivable of $5.3 million and a decrease in accounts payable of $1.4 million.
Cash used in operating activities for the year ended December 31, 2015 was $27.0 million. The net loss of $33.7 million includes non-cash charges of $1.9 million in amortization of the deferred fee received from Genzyme, offset primarily by $5.6 million of stock-based compensation expense, $2.3 million of depreciation and amortization, which includes $0.8 million intangible asset amortization following the launch of Percepta in April 2015, $0.1 million in amortization of debt discount and issuance costs and debt balloon interest expense, and $0.1 million of bad debt expense. The increase in net operating assets of $0.5 million was due to an increase of $0.9 million in deferred rent, accounts payable and accrued liabilities primarily from deferred rent from the lease for our new South San Francisco facility, offset by $0.4 million from an increase in accounts receivable due to increases in Afirma adoption and additional payers meeting our revenue recognition criteria for accrual.
Cash used in operating activities for the year ended December 31, 2014 was $27.6 million. The net loss of $29.4 million includes non-cash charges of $2.3 million in amortization of the deferred fee received from Genzyme, offset primarily by $3.5 million of stock-based compensation expense, $1.2 million of depreciation and amortization, $0.2 million in amortization of debt discount and issuance costs and debt balloon interest expense, and $0.1 million of bad debt expense. The increase in net operating assets of $0.9 million was primarily due to a $2.0 million increase in accounts receivable due to increases in Afirma adoption and new payers for whom revenue is recognized on an accrual basis, a $1.1 million increase in supplies inventory due to the increased volume of testing performed and a strategic decision to increase our inventory on hand, offset by a $2.2 million net increase in accounts payable and accrued liabilities resulting from the timing of payments.
Cash Flows from Investing Activities
Cash used in investing activities for year ended December 31, 2016 was $4.2 million for the acquisition of property and equipment, primarily for the build out of office space and the laboratory for our new South San Francisco facility.
Cash used in investing activities for the year ended December 31, 2015 was $6.7 million. The investing activities for the year ended December 31, 2015 consisted of $6.2 million used for the acquisition of property and equipment, primarily for the build out of office space and the new laboratory for our new South San Francisco facility and $0.5 million used as collateral for an irrevocable standby letter of credit as security for our new South San Francisco facility.
Cash used in investing activities for the year ended December 31, 2014 was $9.0 million. The investing activities for the year ended December 31, 2014 consisted of $6.9 million of net cash used for the acquisition of Allegro, $2.0 million used for the purchase of laboratory equipment, software and leasehold improvements, and $0.1 million of restricted use cash to cover the hold-back liabilities associated with the acquisition of Allegro.
56
Cash Flows from Financing Activities
Cash provided by financing activities for the year ended December 31, 2016 was $52.3 million. The financing activities for the year ended December 31, 2016 consisted of $31.9 million of net proceeds from the issuance of common stock in a public offering, $24.5 million of net proceeds from the draw-down of the Initial Term Loan under the Credit Agreement and $1.2 million from the exercise of options to purchase our common stock and purchases under the employee stock purchase plan, partially offset by the payment of $5.0 million for the remaining principal balance and a $0.3 million of end-of-term payment and prepayment penalty related to the 2013 Loan Agreement that we repaid on March 30, 2016.
Cash provided by financing activities for the year ended December 31, 2015 was $37.7 million, consisting of $37.3 million of net proceeds from the sale of our common stock in a private placement and $0.7 million of cash received from the exercise of options to purchase our common stock, offset by $0.2 million spent on deferred stock offering costs related to our shelf registration statement.
Cash provided by financing activities for the year ended December 31, 2014 of $0.4 million consisted of $0.7 million we received from the exercise of options to purchase our common stock, offset by $0.1 million of IPO-related disbursements and a $0.1 million end-of-term payment on the 2013 Loan Agreement.
Contractual Obligations
The following table summarizes certain contractual obligations as of December 31, 2016 (in thousands of dollars):
|
|
Payments Due by Period
|
||||||||||||||||||
|
|
Fiscal Year 2017
|
Fiscal Year 2018 to 2019
|
Fiscal Year 2020 to 2021
|
Fiscal Year 2022 and Beyond
|
Total
|
||||||||||||||
|
Operating lease obligations
|
$
|
2,143
|
|
$
|
4,128
|
|
$
|
4,226
|
|
$
|
9,812
|
|
$
|
20,309
|
|
||||
|
Long-term debt obligations
|
—
|
|
—
|
|
22,212
|
|
3,173
|
|
25,385
|
|
|||||||||
|
Supplies purchase commitments
|
1,727
|
|
—
|
|
—
|
|
—
|
|
1,727
|
|
|||||||||
|
Capital lease obligation
|
317
|
|
634
|
|
—
|
|
—
|
|
951
|
|
|||||||||
|
Total
|
$
|
4,187
|
|
$
|
4,762
|
|
$
|
26,438
|
|
$
|
12,985
|
|
$
|
48,372
|
|
||||
In December 2016, we entered into a capital lease for equipment which expires in December 2019.
In April 2015, we signed a non-cancelable lease agreement for approximately 59,000 square feet to serve as our new headquarters and laboratory facility in South San Francisco. The lease began in June 2015 and expires in March 2026, and contains extension of lease term and expansion options.
In November 2012, we entered into a non-cancelable lease agreement commencing February 2013 for our laboratory and office space in Austin, Texas. The lease expires in July 2018.
Off-balance Sheet Arrangements
We have not entered into any off-balance sheet arrangements.
JOBS Act Accounting Election
We are an emerging growth company, as defined in the Jumpstart Our Business Startups Act of 2012, or the JOBS Act. Under the JOBS Act, emerging growth companies can delay adopting new or revised accounting standards issued subsequent to the enactment of the JOBS Act until such time as those standards apply to private companies. We have irrevocably elected not to avail ourselves of this exemption from new or revised accounting standards and, therefore, will be subject to the same new or revised accounting standards as other public companies that are not emerging growth companies.
57
Recent Accounting Pronouncements
In August 2014, FASB issued ASU No. 2014-15,
Presentation of Financial Statements Going Concern - Disclosure of Uncertainties about an Entity’s Ability to Continue as a Going Concern
. The amendments require management to assess an entity’s ability to continue as a going concern by incorporating and expanding upon certain principles that are currently in U.S. auditing standards. Specifically, the amendments: (1) provide a definition of the term substantial doubt; (2) require an evaluation every reporting period including interim periods; (3) provide principles for considering the mitigating effect of management’s plans; (4) require certain disclosures when substantial doubt is alleviated as a result of consideration of management’s plans; (5) require an express statement and other disclosures when substantial doubt is not alleviated; and (6) require an assessment for a period of one year after the date that the financial statements are issued (or available to be issued). ASU 2014-15 will be effective for annual periods ending after December 15, 2016 and interim periods within annual periods beginning after December 15, 2016 with early adoption permitted. ASU 2014-15 will be effective for us beginning with our annual report for 2016 and interim periods thereafter. We have adopted this ASU and there is no impact on our financial statements.
In April 2015, the FASB issued ASU No. 2015-3,
Simplifying the Presentation of Debt Issuance Costs
, to require debt issuance costs to be presented as an offset against debt outstanding. The update does not change current guidance on the recognition and measurement of debt issuance costs. The ASU is effective for interim and annual periods beginning after December 15, 2015. Adoption of the ASU is retrospective to each prior period presented. We adopted this ASU and the retrospective adjustment of the prior period presentation was not material.
In November 2015, the FASB issued ASU 2015-17,
Balance Sheet Classification of Deferred Taxes
. The ASU requires that deferred tax assets and liabilities be classified as noncurrent in the statement of financial position, thereby simplifying the guidance that required an entity to separate deferred assets and liabilities into current and noncurrent amounts, and was effective for us beginning in the first quarter of 2016. We early-adopted this ASU as of December 31, 2015 and the impact of adoption on our statement of financial position was not material.
In February 2016, the FASB issued ASU No. 2016-2,
Leases
. This ASU is aimed at making leasing activities more transparent and comparable, and requires substantially all leases be recognized by lessees on their balance sheet as a right-of-use asset and corresponding lease liability, including leases currently accounted for as operating leases. The ASU will be effective for interim and annual periods beginning after December 15, 2018. Early adoption is permitted. We are currently evaluating the potential effect of this standard on our financial statements.
In March 2016, the FASB issued ASU 2016-9,
Compensation - Stock Compensation
, related to the tax effects of share-based awards. The ASU requires that all the tax effects of share-based awards be recorded through the income statement, thereby simplifying the current guidance that requires excess tax benefits and certain excess tax deficiencies to be recorded in equity. The ASU is effective for interim and annual periods beginning after December 15, 2016. We do not anticipate that the adoption of this ASU will have a significant impact on our financial statements.
In November 2016, the FASB issued ASU 2016-18,
Statement of Cash Flows - Restricted Cash.
This ASU requires that restricted cash and restricted cash equivalents be included with cash and cash equivalents when reconciling the beginning-of-period and end-of-period total amounts shown on the statement of cash flows. The ASU will be effective for interim and annual periods beginning after December 15, 2017. We do not anticipate that the adoption of this ASU will have a significant impact on our financial statements.
We are exposed to market risks in the ordinary course of our business. These risks primarily relate to interest rates. We had cash and cash equivalents of $59.2 million as of December 31, 2016 which consisted of bank deposits and money market funds. Such interest-bearing instruments carry a degree of risk; however, a hypothetical 10% change in interest rates during any of the periods presented would not have had a material impact on our audited financial statements.
58
Veracyte, Inc.
Index to Financial Statements
|
|
Page No.
|
59
Report of Independent Registered Public Accounting Firm
The Board of Directors and Stockholders
Veracyte, Inc.
We have audited the accompanying balance sheets of Veracyte, Inc. as of December 31, 2016 and 2015, and the related statements of operations and comprehensive loss, stockholders' equity, and cash flows for each of the three years in the period ended December 31, 2016. These financial statements are the responsibility of the Company's management. Our responsibility is to express an opinion on these financial statements based on our audits.
We conducted our audits in accordance with the standards of the Public Company Accounting Oversight Board (United States). Those standards require that we plan and perform the audit to obtain reasonable assurance about whether the financial statements are free of material misstatement. We were not engaged to perform an audit of the Company's internal control over financial reporting. Our audits included consideration of internal control over financial reporting as a basis for designing audit procedures that are appropriate in the circumstances, but not for the purpose of expressing an opinion on the effectiveness of the Company's internal control over financial reporting. Accordingly, we express no such opinion. An audit includes examining, on a test basis, evidence supporting the amounts and disclosures in the financial statements, assessing the accounting principles used and significant estimates made by management, and evaluating the overall financial statement presentation. We believe that our audits provide a reasonable basis for our opinion.
In our opinion, the financial statements referred to above present fairly, in all material respects, the financial position of Veracyte, Inc. at December 31, 2016 and 2015, and the results of its operations and its cash flows for each of the three years in the period ended December 31, 2016, in conformity with U.S. generally accepted accounting principles.
/s/ Ernst & Young LLP
Redwood City, California
March 1, 2017
60
VERACYTE, INC.
(in thousands of dollars, except share and per share amounts)
|
As of December 31,
|
|||||||
|
2016
|
2015
|
||||||
|
Assets
|
|||||||
|
Current assets:
|
|||||||
|
Cash and cash equivalents
|
$
|
59,219
|
|
$
|
39,084
|
|
|
|
Accounts receivable
|
8,756
|
|
3,503
|
|
|||
|
Supplies inventory
|
3,475
|
|
3,767
|
|
|||
|
Prepaid expenses and other current assets
|
2,057
|
|
1,442
|
|
|||
|
Restricted cash
|
120
|
|
118
|
|
|||
|
Total current assets
|
73,627
|
|
47,914
|
|
|||
|
Property and equipment, net
|
11,480
|
|
10,314
|
|
|||
|
Finite-lived intangible assets, net
|
14,133
|
|
15,200
|
|
|||
|
Goodwill
|
1,057
|
|
1,057
|
|
|||
|
Restricted cash
|
603
|
|
603
|
|
|||
|
Other assets
|
134
|
|
159
|
|
|||
|
Total assets
|
$
|
101,034
|
|
$
|
75,247
|
|
|
|
Liabilities and Stockholders' Equity
|
|||||||
|
Current liabilities:
|
|||||||
|
Accounts payable
|
$
|
2,424
|
|
$
|
5,085
|
|
|
|
Accrued liabilities
|
9,110
|
|
8,689
|
|
|||
|
Deferred Genzyme co-promotion fee
|
—
|
|
948
|
|
|||
|
Total current liabilities
|
11,534
|
|
14,722
|
|
|||
|
Long-term debt
|
24,918
|
|
4,990
|
|
|||
|
Capital lease liability, net of current portion
|
599
|
|
—
|
|
|||
|
Deferred rent, net of current portion
|
4,402
|
|
4,283
|
|
|||
|
Total liabilities
|
41,453
|
|
23,995
|
|
|||
|
Commitments and contingencies
|
|
|
|
|
|||
|
Stockholders' equity:
|
|||||||
|
Preferred stock, $0.001 par value; 5,000,000 shares authorized, no shares issued and outstanding as of December 31, 2016 and 2015
|
—
|
|
—
|
|
|||
|
Common stock, $0.001 par value; 125,000,000 shares authorized, 33,762,278 and 27,685,291 shares issued and outstanding as of December 31, 2016 and 2015, respectively
|
34
|
|
28
|
|
|||
|
Additional paid-in capital
|
239,631
|
|
199,950
|
|
|||
|
Accumulated deficit
|
(180,084
|
)
|
(148,726
|
)
|
|||
|
Total stockholders' equity
|
59,581
|
|
51,252
|
|
|||
|
Total liabilities and stockholders' equity
|
$
|
101,034
|
|
$
|
75,247
|
|
|
The accompanying notes are an integral part of these financial statements.
61
VERACYTE, INC.
(in thousands of dollars, except share and per share amounts)
|
|
Year Ended December 31,
|
||||||||||
|
|
2016
|
2015
|
2014
|
||||||||
|
Revenue
|
$
|
65,085
|
|
$
|
49,503
|
|
$
|
38,190
|
|
||
|
Operating Expenses:
|
|||||||||||
|
Cost of revenue
|
25,462
|
|
21,497
|
|
16,606
|
|
|||||
|
Research and development
|
15,324
|
|
12,796
|
|
9,804
|
|
|||||
|
Selling and marketing
|
28,248
|
|
25,293
|
|
21,932
|
|
|||||
|
General and administrative
|
23,787
|
|
22,583
|
|
18,854
|
|
|||||
|
Intangible asset amortization
|
1,067
|
|
800
|
|
—
|
|
|||||
|
Total operating expenses
|
93,888
|
|
82,969
|
|
67,196
|
|
|||||
|
Loss from operations
|
(28,803
|
)
|
(33,466
|
)
|
(29,006
|
)
|
|||||
|
Interest expense
|
(2,757
|
)
|
(378
|
)
|
(439
|
)
|
|||||
|
Other income, net
|
202
|
|
140
|
|
72
|
|
|||||
|
Net loss and comprehensive loss
|
$
|
(31,358
|
)
|
$
|
(33,704
|
)
|
$
|
(29,373
|
)
|
||
|
Net loss per common share, basic and diluted
|
$
|
(1.09
|
)
|
$
|
(1.30
|
)
|
$
|
(1.36
|
)
|
||
|
Shares used to compute net loss per common share, basic and diluted
|
28,830,472
|
|
25,994,193
|
|
21,639,374
|
|
|||||
The accompanying notes are an integral part of these financial statements.
62
VERACYTE, INC.
Statements of Stockholders' Equity
(in thousands of dollars, except share and per share amounts)
|
|
Common Stock
|
Additional
Paid-in
Capital
|
Accumulated
Deficit
|
Total
Stockholders'
Equity
|
||||||||||||||
|
|
||||||||||||||||||
|
|
||||||||||||||||||
|
|
Shares
|
Amount
|
||||||||||||||||
|
Balance at December 31, 2013
|
21,143,313
|
|
$
|
21
|
|
$
|
142,071
|
|
$
|
(85,649
|
)
|
$
|
56,443
|
|
||||
|
Issuance of common stock on exercise of stock options
|
402,100
|
|
1
|
|
674
|
|
—
|
|
675
|
|
||||||||
|
Issuance of common stock on cashless exercise of stock warrant
|
13,739
|
|
—
|
|
—
|
|
—
|
|
—
|
|
||||||||
|
Common stock subject to repurchase
|
|
|
—
|
|
3
|
|
—
|
|
3
|
|
||||||||
|
Issuance of common stock for acquisition
|
964,377
|
|
1
|
|
10,077
|
|
|
|
10,078
|
|
||||||||
|
Stock-based compensation expense (employee)
|
—
|
|
—
|
|
3,388
|
|
—
|
|
3,388
|
|
||||||||
|
Stock-based compensation expense (non-employee)
|
—
|
|
—
|
|
160
|
|
—
|
|
160
|
|
||||||||
|
Net loss and comprehensive loss
|
—
|
|
—
|
|
—
|
|
(29,373
|
)
|
(29,373
|
)
|
||||||||
|
Balance at December 31, 2014
|
22,523,529
|
|
23
|
|
156,373
|
|
(115,022
|
)
|
41,374
|
|
||||||||
|
Issuance of common stock on exercise of stock options
|
253,787
|
|
—
|
|
722
|
|
—
|
|
722
|
|
||||||||
|
Sale of common stock in a private placement, net of issuance costs of $2,742
|
4,907,975
|
|
5
|
|
37,253
|
|
—
|
|
37,258
|
|
||||||||
|
Stock-based compensation expense (employee)
|
—
|
|
—
|
|
5,302
|
|
—
|
|
5,302
|
|
||||||||
|
Stock-based compensation expense (non-employee)
|
—
|
|
—
|
|
110
|
|
—
|
|
110
|
|
||||||||
|
Stock-based compensation expense (ESPP)
|
—
|
|
—
|
|
190
|
|
—
|
|
190
|
|
||||||||
|
Net loss and comprehensive loss
|
—
|
|
—
|
|
—
|
|
(33,704
|
)
|
(33,704
|
)
|
||||||||
|
Balance at December 31, 2015
|
27,685,291
|
|
28
|
|
199,950
|
|
(148,726
|
)
|
51,252
|
|
||||||||
|
Issuance of common stock on exercise of stock options
|
212,740
|
|
—
|
|
538
|
|
—
|
|
538
|
|
||||||||
|
Issuance of common stock under employee stock purchase plan (ESPP)
|
140,947
|
|
—
|
|
678
|
|
—
|
|
678
|
|
||||||||
|
Sale of common stock in a public offering, net of issuance costs of $2,247
|
5,723,300
|
|
6
|
|
32,087
|
|
32,093
|
|
||||||||||
|
Stock-based compensation expense (employee)
|
—
|
|
—
|
|
6,046
|
|
—
|
|
6,046
|
|
||||||||
|
Stock-based compensation expense (non-employee)
|
—
|
|
—
|
|
15
|
|
—
|
|
15
|
|
||||||||
|
Stock-based compensation expense (ESPP)
|
—
|
|
—
|
|
317
|
|
—
|
|
317
|
|
||||||||
|
Net loss and comprehensive loss
|
—
|
|
—
|
|
—
|
|
(31,358
|
)
|
(31,358
|
)
|
||||||||
|
Balance at December 31, 2016
|
33,762,278
|
|
$
|
34
|
|
$
|
239,631
|
|
$
|
(180,084
|
)
|
$
|
59,581
|
|
||||
The accompanying notes are an integral part of these financial statements.
63
VERACYTE, INC.
(in thousands of dollars)
|
|
Year Ended December 31,
|
||||||||||
|
|
2016
|
2015
|
2014
|
||||||||
|
Operating activities
|
|
|
|
|
|
|
|||||
|
Net loss
|
$
|
(31,358
|
)
|
$
|
(33,704
|
)
|
$
|
(29,373
|
)
|
||
|
Adjustments to reconcile net loss to net cash used in operating activities:
|
|
|
|
|
|
|
|||||
|
Depreciation and amortization
|
3,511
|
|
2,254
|
|
1,175
|
|
|||||
|
Bad debt expense
|
68
|
|
105
|
|
54
|
|
|||||
|
Loss on disposal of property and equipment
|
12
|
|
—
|
|
—
|
|
|||||
|
Genzyme co-promotion fee amortization
|
(948
|
)
|
(1,897
|
)
|
(2,269
|
)
|
|||||
|
Stock-based compensation
|
6,378
|
|
5,602
|
|
3,548
|
|
|||||
|
Conversion of accrued interest to long-term debt
|
385
|
|
—
|
|
—
|
|
|||||
|
Amortization of debt discount and issuance costs
|
173
|
|
46
|
|
97
|
|
|||||
|
Interest on debt balloon payment and prepayment penalty
|
206
|
|
79
|
|
81
|
|
|||||
|
Changes in operating assets and liabilities:
|
|
|
|
|
|
|
|||||
|
Accounts receivable
|
(5,321
|
)
|
(558
|
)
|
(1,961
|
)
|
|||||
|
Supplies inventory
|
292
|
|
(71
|
)
|
(1,129
|
)
|
|||||
|
Prepaid expenses and current other assets
|
(415
|
)
|
304
|
|
(38
|
)
|
|||||
|
Other assets
|
25
|
|
(42
|
)
|
(46
|
)
|
|||||
|
Accounts payable
|
(1,441
|
)
|
(3,546
|
)
|
1,874
|
|
|||||
|
Accrued liabilities and deferred rent
|
451
|
|
4,463
|
|
355
|
|
|||||
|
Net cash used in operating activities
|
(27,982
|
)
|
(26,965
|
)
|
(27,632
|
)
|
|||||
|
Investing activities
|
|
|
|
|
|
|
|||||
|
Purchases of property and equipment
|
(4,210
|
)
|
(6,165
|
)
|
(2,024
|
)
|
|||||
|
Cash remitted for acquisition, net of cash received
|
—
|
|
—
|
|
(6,916
|
)
|
|||||
|
Change in restricted cash
|
(2
|
)
|
(533
|
)
|
(70
|
)
|
|||||
|
Net cash used in investing activities
|
(4,212
|
)
|
(6,698
|
)
|
(9,010
|
)
|
|||||
|
Financing activities
|
|
|
|
|
|
|
|||||
|
Proceeds from the issuance of long-term debt, net of debt issuance costs
|
24,452
|
|
—
|
|
—
|
|
|||||
|
Proceeds from issuance of common stock in a private placement, net of issuance costs
|
—
|
|
37,258
|
|
—
|
|
|||||
|
Proceeds from issuance of common stock in a public offering, net of issuance costs
|
31,949
|
|
|||||||||
|
Commissions and issuance costs relating to initial public offering
|
—
|
|
—
|
|
(129
|
)
|
|||||
|
Payment of long-term debt
|
(5,000
|
)
|
—
|
|
—
|
|
|||||
|
Payment of end-of-term debt obligation and prepayment penalty
|
(288
|
)
|
—
|
|
(110
|
)
|
|||||
|
Payment of deferred stock offering costs
|
—
|
|
(247
|
)
|
—
|
|
|||||
|
Proceeds from the exercise of common stock options and employee stock purchases
|
1,216
|
|
722
|
|
675
|
|
|||||
|
Net cash provided by financing activities
|
52,329
|
|
37,733
|
|
436
|
|
|||||
|
Net increase (decrease) in cash and cash equivalents
|
20,135
|
|
4,070
|
|
(36,206
|
)
|
|||||
|
Cash and cash equivalents at beginning of period
|
39,084
|
|
35,014
|
|
71,220
|
|
|||||
|
Cash and cash equivalents at end of period
|
$
|
59,219
|
|
$
|
39,084
|
|
$
|
35,014
|
|
||
|
Supplementary cash flow information of non-cash investing and financing activities:
|
|
|
|
|
|
|
|||||
|
Fair value of common stock issued for acquisition
|
—
|
|
—
|
|
$
|
10,078
|
|
||||
|
Non-cash issuance of long-term debt
|
—
|
|
—
|
|
5,000
|
|
|||||
|
Non-cash repayment of long-term debt
|
—
|
|
—
|
|
(5,000
|
)
|
|||||
|
Net receivable for reimbursement of public offering issuance costs
|
$
|
144
|
|
—
|
|
—
|
|
||||
|
Purchases of property and equipment included in accounts payable and accrued liabilities
|
363
|
|
$
|
1,825
|
|
383
|
|
||||
|
Issuance of common stock from the non-cash exercise of common stock warrants
|
—
|
|
—
|
|
187
|
|
|||||
|
Supplementary cash flow information:
|
|||||||||||
|
Cash paid for interest on debt
|
2,149
|
|
278
|
|
307
|
|
|||||
|
Cash paid for tax
|
7
|
|
22
|
|
—
|
|
|||||
The accompanying notes are an integral part of these financial statements.
64
1. Organization and Description of Business
Veracyte, Inc. ("Veracyte" or the "Company") was incorporated in the state of Delaware on August 15, 2006 as Calderome, Inc. Calderome operated as an incubator until early 2008. On March 4, 2008, the Company changed its name to Veracyte, Inc. Veracyte is a molecular diagnostics company that uses genomic technology to resolve diagnostic ambiguity. The Company targets diseases in which large numbers of patients undergo invasive and costly diagnostic procedures that could have been avoided with a more accurate diagnosis from a cytology sample. By improving diagnosis, the Company helps patients avoid such unnecessary invasive procedures and surgeries while reducing healthcare costs.
The Company's first commercial solution, the Afirma® Thyroid FNA Analysis, centers on the proprietary Afirma Gene Expression Classifier ("GEC"). The Afirma GEC helps physicians reduce the number of unnecessary surgeries by employing a proprietary 142-gene signature to determine whether thyroid nodules previously classified by cytopathology as indeterminate can be reclassified as benign. The Afirma GEC is offered directly or as part of a comprehensive solution that also includes cytopathology. Additionally, the Afirma Malignancy Classifiers were launched in May 2014. The Company currently markets and sells Afirma in the United States, in select foreign countries through a co-promotion agreement with Genzyme Corporation, a subsidiary of Sanofi, and through other distributors.
In April 2015, the Company entered the lung cancer diagnostics market with the Percepta® Bronchial Genomic Classifier, a genomic test to resolve ambiguity in lung cancer diagnosis. In October 2016, the Company introduced a second product in pulmonology, the Envisia
™
Genomic Classifier, designed to help in the assessment of patients suspected to have idiopathic pulmonary fibrosis.
The Company's operations are based in South San Francisco, California and Austin, Texas, and it operates in one segment in the United States.
2. Summary of Significant Accounting Policies
Basis of Presentation
The Company's financial statements have been prepared in accordance with accounting principles generally accepted in the United States ("GAAP"). The financial statements include the accounts of the Company and its former wholly-owned subsidiary, which was dissolved in June 2015. For periods prior to the subsidiary dissolution, all intercompany accounts and transactions were eliminated in consolidation. Certain amounts have been reclassified on the balance sheet at December 31, 2015 to conform with the adoption of Accounting Standards Update (“ASU”) No. 2015-3,
Simplifying the Presentation of Debt Issuance Costs.
Use of Estimates
The preparation of financial statements in conformity with GAAP requires management to make estimates and assumptions that affect the reported amounts of assets and liabilities and disclosure of contingent assets and liabilities as of the date of the financial statements and the reported amounts of revenue and expenses during the reporting period. Significant items subject to such estimates include: revenue recognition; contractual allowances; the useful lives of property and equipment; the recoverability of long-lived assets; the estimation of the fair value of intangible assets; stock options; income tax uncertainties, including a valuation allowance for deferred tax assets; and contingencies. The Company bases these estimates on historical and anticipated results, trends, and various other assumptions that the Company believes are reasonable under the circumstances, including assumptions as to future events. These estimates form the basis for making judgments about the carrying values of assets and liabilities and recorded revenue and expenses that are not readily apparent from other sources. Actual results could differ from those estimates and assumptions.
Liquidity
The Company has incurred net losses since its inception and expects to incur additional losses in 2017 and in future years. As of
December 31, 2016
, the Company had an accumulated deficit of
$180.1 million
. The Company may never achieve revenue sufficient to offset its expenses. The Company believes its cash and cash equivalents of
$59.2 million
as of
December 31, 2016
and its revenue from sales in 2017 will be sufficient to meet its anticipated cash requirements for at least the next 12 months.
65
VERACYTE, INC.
Notes to Financial Statements (Continued)
2. Summary of Significant Accounting Policies (Continued)
In November 2016, the Company issued and sold
5,723,300
shares of its common stock in a public offering, at a price of
$6.00
per share. The Company raised
$32.1 million
in net proceeds, after deducting expenses of
$2.2 million
.
In March 2016, the Company entered into a credit agreement and drew down the initial
$25.0 million
term loan of which,
$5.0 million
was used to pay the outstanding balance of the Company’s existing long-term debt as discussed in Note 8 - Debt.
In April 2015, the Company issued and sold
4,907,975
shares of its common stock in a private placement, at a price of
$8.15
per share. The Company received
$37.3 million
in net proceeds, after deducting expenses of
$2.7 million
.
If the Company is not able to generate revenue to finance its cash requirements, the Company will need to finance future cash needs primarily through public or private equity offerings, debt financings, borrowings or strategic collaborations or licensing arrangements. If the Company is not able to secure additional funding when needed, on acceptable terms, it may have to delay, reduce the scope of or eliminate one or more research and development programs or selling and marketing initiatives which may have a material adverse effect on the Company's business, results of operations, financial condition and/or its ability to fund its scheduled obligations on a timely basis or at all.
Concentrations of Credit Risk and Other Risks and Uncertainties
The majority of the Company's cash and cash equivalents are deposited with
one
major financial institution in the United States. Deposits in this institution may exceed the amount of insurance provided on such deposits. The Company has not experienced any losses on its deposits of cash and cash equivalents.
Several of the components of the Company's sample collection kit and test reagents are obtained from single-source suppliers. If these single-source suppliers fail to satisfy the Company's requirements on a timely basis, it could suffer delays in being able to deliver its diagnostic solutions, a possible loss of revenue, or incur higher costs, any of which could adversely affect its operating results.
The Company is also subject to credit risk from its accounts receivable related to its sales. The Company generally does not perform evaluations of customers' financial condition and generally does not require collateral.
Through
December 31, 2016
, all of the Company's revenue have been derived from the sale of Afirma. To date, Afirma has been delivered primarily to physicians in the United States. The Company's third-party payers in excess of 10% of revenue and their related revenue as a percentage of total revenue were as follows:
|
|
Year Ended December 31,
|
|||||||
|
|
2016
|
2015
|
2014
|
|||||
|
Medicare
|
27
|
%
|
|
26
|
%
|
|
26
|
%
|
|
UnitedHealthcare
|
12
|
%
|
|
14
|
%
|
|
18
|
%
|
|
Aetna
|
8
|
%
|
|
9
|
%
|
|
11
|
%
|
|
47
|
%
|
|
49
|
%
|
|
55
|
%
|
|
The Company's significant third-party payers and their related accounts receivable balance as a percentage of total accounts receivable were as follows:
|
|
December 31,
|
||||
|
|
2016
|
2015
|
|||
|
Medicare
|
18
|
%
|
31
|
%
|
|
|
UnitedHealthcare
|
8
|
%
|
25
|
%
|
|
|
Aetna
|
4
|
%
|
23
|
%
|
|
66
VERACYTE, INC.
Notes to Financial Statements (Continued)
2. Summary of Significant Accounting Policies (Continued)
No other third-party payer represented more than 10% of the Company's accounts receivable balances as of those dates.
Cash Equivalents
Cash equivalents consist of short-term, highly liquid investments with original maturities of three months or less from the date of purchase. Cash equivalents consist of amounts invested in a money market account primarily consisting of U.S. Treasury reserves.
Restricted Cash
The Company had deposits of
$120,000
and
$118,000
as of
December 31, 2016
and
December 31, 2015
, respectively, included in current assets. The deposit at
December 31, 2016
was a pledge for corporate credit cards and the deposit at
December 31, 2015
was restricted from withdrawal and held by a bank in the form of collateral for irrevocable standby letters of credit held as security for the lease of the Company's former headquarters and laboratory facilities in South San Francisco that expired March 31, 2016. The Company also had deposits of
$603,000
included in long-term assets as of
December 31, 2016
and
December 31, 2015
, restricted from withdrawal and held by a bank in the form of collateral for an irrevocable standby letter of credit held as security for the lease of the Company's South San Francisco facility signed in April 2015.
Supplies Inventory
Supplies inventory consists of test reagents and other consumables primarily used in the sample collection kits and in cytopathology and GEC test processing and are valued at the lower of cost or market value. Cost is determined using actual costs on a first-in, first-out basis.
Property and Equipment
Property and equipment are stated at cost less accumulated depreciation and amortization. Depreciation is computed using the straight-line method over the estimated useful lives of the assets, generally between
three
and
five years
. Leasehold improvements are amortized using the straight-line method over the shorter of the estimated useful life of the asset or the term of the lease. Maintenance and repairs are charged to expense as incurred, and improvements and betterments are capitalized. When assets are retired or otherwise disposed of, the cost and accumulated depreciation are removed from the balance sheet and any resulting gain or loss is reflected in the statements of operations and comprehensive loss in the period realized.
Business Combination
The Company accounts for acquisitions using the acquisition method of accounting which requires the recognition of tangible and identifiable intangible assets acquired and liabilities assumed at their estimated fair values as of the business combination date. The Company allocates any excess purchase price over the estimated fair value assigned to the net tangible and identifiable intangible assets acquired and liabilities assumed to goodwill. Transaction costs are expensed as incurred in general and administrative expenses. Results of operations and cash flows of acquired companies are included in the Company's operating results from the date of acquisition.
Finite-lived Intangible Assets
Finite-lived intangible assets relate to intangible assets reclassified from indefinite-lived intangible assets, following the launch of Percepta in April 2015. The Company amortizes finite-lived intangible assets using the straight-line method over their estimated useful life. The estimated useful life of
15 years
was used for the intangible asset related to the Percepta test based on management's estimate of product life, product life of other diagnostic tests and patent life. The Company tests this finite-lived intangible asset for impairment when events or circumstances indicate a reduction in the fair value below its carrying amount. There was
no
impairment for either of the years ended
December 31, 2016
or
2015
.
67
VERACYTE, INC.
Notes to Financial Statements (Continued)
2. Summary of Significant Accounting Policies (Continued)
Goodwill
Goodwill, derived from the Company's acquisition of Allegro Diagnostics Corp. (Allegro), is reviewed for impairment on an annual basis or more frequently if events or circumstances indicate that it may be impaired. The Company's goodwill evaluation is based on both qualitative and quantitative assessments regarding the fair value of goodwill relative to its carrying value. The Company has determined that it operates in a single segment and has a single reporting unit associated with the development and commercialization of diagnostic products. In the event the Company determines that it is more likely than not the carrying value of the reporting unit is higher than its fair value, quantitative testing is performed comparing recorded values to estimated fair values. If impairment is present, the impairment loss is measured as the excess of the recorded goodwill over its implied fair value. The Company performs its annual evaluation of goodwill during the fourth quarter of each fiscal year. There was
no
impairment for the years ended
December 31, 2016
,
2015
or
2014
.
Fair Value of Financial Instruments
The carrying amounts of certain financial instruments including cash and cash equivalents, accounts receivable, prepaid expenses and other current assets, accounts payable and accrued liabilities approximate fair value due to their relatively short maturities.
Revenue Recognition
The Company recognizes revenue in accordance with the provision of ASC 954-605,
Health Care Entities—Revenue Recognition
("ASC 954")
.
The Company's revenue is generated from the provision of diagnostic services. The service is completed upon the delivery of test results to the prescribing physician, at which time the Company bills for the service. The Company recognizes revenue related to billings for tests delivered on an accrual basis when amounts that will ultimately be realized can be estimated. The estimates of amounts that will ultimately be realized requires significant judgment by management. Until a contract has been negotiated with a commercial payer or governmental program, the Company's tests may or may not be covered by these entities' existing reimbursement policies. In addition, patients do not enter into direct agreements with the Company that commit them to pay any portion of the cost of the tests in the event that their insurance declines to reimburse the Company.
The Company may bill the patient directly for these amounts in the form of co-payments and co-insurance in accordance with their insurance carrier and health plans. In the absence of contracted reimbursement or the ability to estimate the amount that will ultimately be realized for the Company's services, revenue is recognized on the cash basis.
Revenue recognized for the years ended
December 31, 2016
,
2015
and
2014
was as follows (in thousands of dollars):
|
|
Year Ended December 31,
|
|||||||||||||||||||
|
|
2016
|
2015
|
2014
|
|||||||||||||||||
|
Revenue recognized on the accrual basis
|
$
|
47,099
|
|
72
|
%
|
$
|
27,043
|
|
55
|
%
|
$
|
12,545
|
|
33
|
%
|
|||||
|
Revenue recognized on the cash basis
|
17,986
|
|
28
|
%
|
22,460
|
|
45
|
%
|
25,645
|
|
67
|
%
|
||||||||
|
Total
|
$
|
65,085
|
|
100
|
%
|
$
|
49,503
|
|
100
|
%
|
$
|
38,190
|
|
100
|
%
|
|||||
Prior to July 1, 2016, the Company believes it did not have a consistent enough payment history to accrue a significant portion of its Afirma tests delivered to customers and, as noted above, recognized revenue on the cash basis for such tests. The Company has been analyzing the amounts received for tests performed since commercialization and during the quarter ended September 30, 2016, sufficient information developed to support a reasonable estimate of the amount of revenue to accrue upon test delivery for a number of payers that had been previously recognized on the cash basis. In determining the amount to accrue for a particular test, the Company considered factors such as payer coverage, whether there is a reimbursement contract between the payer and the Company, timeliness of payment, payment as a percentage of agreed upon rate (if applicable), amount paid per test and any current developments or changes that could impact reimbursement. As a result, the Company recognized
$3.5 million
of incremental revenue during the quarter ended September 30, 2016 upon test delivery that previously would not have been recognized until cash was received. Tests performed prior to July 1, 2016 that did not meet the Company’s accrual criteria at the time of delivery will continue to be recognized as revenue on the cash basis. However, the Company expects the amount of revenue
68
VERACYTE, INC.
Notes to Financial Statements (Continued)
2. Summary of Significant Accounting Policies (Continued)
to be recognized on the cash basis for Afirma to decline in future periods since subsequent to September 2016 relatively few tests will be performed for which a reasonable estimate of revenue to accrue will not have been made at the time of delivery.
The incremental accrued revenue and decrease in loss from operations as a result of additional payers meeting the Company's accrual revenue recognition criteria was
$4.1 million
,
$0.7 million
and
$0.8 million
for tests delivered in the years ended December 31, 2016, 2015 and 2014, respectively. The incremental accrued revenue decreased loss per common share by
$0.13
,
$0.03
and
$0.04
for the years ended December 31, 2016, 2015 and 2014, respectively.
Cost of Revenue
Cost of revenue is expensed as incurred and includes material and service costs, cytopathology testing services performed by a third-party pathology group, stock-based compensation expense, direct labor costs, equipment and infrastructure expenses associated with testing samples, shipping charges to transport samples, and allocated overhead including rent, information technology, equipment depreciation and utilities.
Research and Development
Research and development expenses are charged to operations as incurred. Research and development expenses include payroll and personnel-related expenses, stock-based compensation expense, prototype materials, laboratory supplies, consulting costs, costs associated with setting up and conducting clinical studies at domestic and international sites, and allocated overhead including rent, information technology, equipment depreciation and utilities.
Income Taxes
The Company accounts for income taxes under the liability method. Under this method, deferred tax assets and liabilities are determined based on the difference between the financial statement and tax bases of assets and liabilities using enacted tax rates in effect for the year in which the differences are expected to affect taxable income. Valuation allowances are established when necessary to reduce deferred tax assets to the amounts expected to be realized.
The Company assesses all material positions taken in any income tax return, including all significant uncertain positions, in all tax years that are still subject to assessment or challenge by relevant taxing authorities. The Company's assessment of an uncertain tax position begins with the initial determination of the position's sustainability and is measured at the largest amount of benefit that is more-likely-than-not of being realized upon ultimate settlement. As of each balance sheet date, unresolved uncertain tax positions must be reassessed, and the Company will determine whether (i) the factors underlying the sustainability assertion have changed and (ii) the amount of the recognized tax benefit is still appropriate. The recognition and measurement of tax benefits requires significant judgment. Judgments concerning the recognition and measurement of a tax benefit may change as new information becomes available.
Stock-based Compensation
Stock-based compensation expense for equity instruments issued to employees is measured based on the grant-date fair value of the awards. The fair value of each employee stock option is estimated on the date of grant using the Black-Scholes option-pricing model. The Company recognizes compensation costs on a straight-line basis for all employee stock-based compensation awards that are expected to vest over the requisite service period of the awards, which is generally the awards' vesting period. Forfeitures are required to be estimated at the time of grant and revised, if necessary, in subsequent periods if actual forfeitures differ from those estimates.
Equity awards issued to non-employees are valued using the Black-Scholes option-pricing model and are subject to re-measurement as the underlying equity awards vest.
69
VERACYTE, INC.
Notes to Financial Statements (Continued)
2. Summary of Significant Accounting Policies (Continued)
Net Loss per Common Share
Basic net loss per common share is calculated by dividing net loss attributable to common stockholders by the weighted-average number of common shares outstanding during the period, without consideration of common stock equivalents. Diluted net loss per common share is computed by dividing net loss attributable to common stockholders by the weighted-average number of common share equivalents outstanding for the period determined using the treasury stock method. Potentially dilutive securities consisting of options to purchase common stock, restricted stock units and shares subject to purchase under our employee stock purchase plan are considered to be common stock equivalents and were excluded from the calculation of diluted net loss per common share because their effect would be anti-dilutive for all periods presented.
Recent Accounting Pronouncements
In May 2014, the Financial Accounting Standards Board ("FASB") issued ASU 2014-09,
Revenue from Contracts with Customers
(Topic 606), to supersede nearly all existing revenue recognition guidance under GAAP. The core principle of ASU 2014-09 is to recognize revenues when promised goods or services are transferred to customers in an amount that reflects the consideration that is expected to be received for those goods or services. ASU 2014-09 defines a five-step process to achieve this core principle and, in doing so, it is possible more judgment and estimates may be required within the revenue recognition process than are required under existing GAAP, including identifying performance obligations in a contract, estimating the amount of variable consideration to include in the transaction price and allocating the transaction price to each separate performance obligation. The Company will adopt the new revenue standard as of January 1, 2018 using the modified retrospective method. The Company has also completed its assessment of the first step which included identifying the Company’s customers. The Company is currently assessing the remainder of the steps and is in the process of evaluating the effect of adoption of the new revenue standard on its financial statements.
In August 2014, FASB issued ASU No. 2014-15,
Presentation of Financial Statements Going Concern - Disclosure of Uncertainties about an Entity’s Ability to Continue as a Going Concern
. The amendments require management to assess an entity’s ability to continue as a going concern by incorporating and expanding upon certain principles that are currently in U.S. auditing standards. Specifically, the amendments: (1) provide a definition of the term substantial doubt; (2) require an evaluation every reporting period including interim periods; (3) provide principles for considering the mitigating effect of management’s plans; (4) require certain disclosures when substantial doubt is alleviated as a result of consideration of management’s plans; (5) require an express statement and other disclosures when substantial doubt is not alleviated; and (6) require an assessment for a period of one year after the date that the financial statements are issued (or available to be issued). ASU 2014-15 will be effective for annual periods ending after December 15, 2016 and interim periods within annual periods beginning after December 15, 2016 with early adoption permitted. ASU 2014-15 is effective for the Company beginning with its annual report for 2016 and interim periods thereafter. The Company has adopted this ASU and there is no impact on its financial statements.
In April 2015, the FASB issued ASU No. 2015-3,
Simplifying the Presentation of Debt Issuance Costs
, to require debt issuance costs to be presented as an offset against debt outstanding. The update does not change current guidance on the recognition and measurement of debt issuance costs. The ASU is effective for interim and annual periods beginning after December 15, 2015. Adoption of the ASU is retrospective to each prior period presented. The Company has adopted this ASU and the retrospective adjustment of the prior period presentation was not material.
In November 2015, the FASB issued ASU 2015-17,
Balance Sheet Classification of Deferred Taxes
. The ASU requires that deferred tax assets and liabilities be classified as noncurrent in the statement of financial position, thereby simplifying the guidance that required an entity to separate deferred assets and liabilities into current and noncurrent amounts, and was effective for the Company beginning in the first quarter of 2016. The Company early-adopted this ASU as of December 31, 2015 and the impact of adoption on its statement of financial position was not material.
In February 2016, the FASB issued ASU No. 2016-2,
Leases
. This ASU is aimed at making leasing activities more transparent and comparable, and requires substantially all leases be recognized by lessees on their balance sheet as a right-of-use asset and corresponding lease liability, including leases currently accounted for as operating leases. The ASU will be effective for interim and annual periods beginning after December 15, 2018. Early adoption is permitted. The Company is currently evaluating the potential effect of this standard on its financial statements.
70
VERACYTE, INC.
Notes to Financial Statements (Continued)
2. Summary of Significant Accounting Policies (Continued)
In March 2016, the FASB issued ASU 2016-9,
Compensation - Stock Compensation
, related to the tax effects of share-based awards. The ASU requires that all the tax effects of share-based awards be recorded through the income statement, thereby simplifying the current guidance that requires excess tax benefits and certain excess tax deficiencies to be recorded in equity. The ASU is effective for interim and annual periods beginning after December 15, 2016. The Company does not anticipate that the adoption of this ASU will have a significant impact on its financial statements.
In November 2016, the FASB issued ASU 2016-18,
Statement of Cash Flows - Restricted Cash.
This ASU requires that restricted cash and restricted cash equivalents be included with cash and cash equivalents when reconciling the beginning-of-period and end-of-period total amounts shown on the statement of cash flows. The ASU will be effective for interim and annual periods beginning after December 15, 2017. The Company does not anticipate that the adoption of this ASU will have a significant impact on its financial statements.
3. Net Loss Per Share
The following outstanding common stock equivalents have been excluded from diluted net loss per common share for the years ended
December 31, 2016
,
2015
and
2014
because their inclusion would be anti-dilutive:
|
|
Year Ended December 31,
|
|||||||
|
|
2016
|
2015
|
2014
|
|||||
|
Shares of common stock subject to outstanding options
|
5,093,454
|
|
4,086,640
|
|
3,035,614
|
|
||
|
Employee stock purchase plan
|
36,651
|
|
15,561
|
|
—
|
|
||
|
Restricted stock units
|
25,000
|
|
—
|
|
—
|
|
||
|
Total common stock equivalents
|
5,155,105
|
|
4,102,201
|
|
3,035,614
|
|
||
4. Business Combination
In September 2014, the Company acquired Allegro via a merger with Full Moon Acquisition, Inc., a wholly-owned subsidiary of the Company focused on the development of genomic tests to improve the preoperative diagnosis of lung cancer. Allegro merged with Full Moon, (the "Merger"), with Allegro surviving the Merger as a wholly-owned subsidiary of the Company. The subsidiary was dissolved in June 2015. At the effective time of the Merger, each share of the common stock of Full Moon issued and outstanding immediately prior to the effective time of the Merger was automatically converted into
one
share of common stock of Allegro and represented the only outstanding common stock of Allegro at the effective time of the Merger; all previously issued and outstanding shares of common stock of Allegro were canceled. The Series A preferred stock of Allegro issued and outstanding immediately prior to the effective time of the Merger was canceled and automatically converted into the right to receive a total of
964,377
shares of the Company's common stock and
$2.7 million
in cash. Outstanding indebtedness of Allegro totaling
$4.3 million
was settled in cash by the Company on the effective date of the Merger. All outstanding stock options under Allegro's equity incentive plan were canceled.
The acquisition of Allegro accelerated the Company's entry into the pulmonology diagnostics market. Allegro's lung cancer test is designed to help physicians determine which patients with lung nodules who have had an inconclusive bronchoscopy result are at low risk for cancer and can thus be safely monitored with CT scans rather than undergoing invasive procedures. The Company launched the Percepta test in April 2015.
The Merger was accounted for using the acquisition method of accounting with the Company treated as the accounting acquirer. The purchase price was allocated based on the estimated fair value of the assets acquired and liabilities assumed at the date of the acquisition.
The Company incurred approximately
$0.5 million
in acquisition-related costs related to the Merger, which primarily consisted of legal, accounting and valuation-related expenses. In addition, the Company incurred
$1.2 million
related to transaction bonuses and severance payments to former Allegro employees associated with the Merger. These expenses were recorded in general and administrative expense in the accompanying statements of operations and comprehensive loss.
71
VERACYTE, INC.
Notes to Financial Statements (Continued)
4. Business Combination (Continued)
The acquisition consideration was comprised of (in thousands of dollars):
|
Veracyte common stock
|
$
|
10,078
|
|
|
Cash
|
2,725
|
|
|
|
Payment of outstanding indebtedness
|
4,290
|
|
|
|
Total acquisition consideration
|
$
|
17,093
|
|
The common stock consideration of
$10.1 million
was determined based on the closing price of the Company's common stock on September 16, 2014 (
$10.45
per share).
The fair value of the assets acquired and liabilities assumed at the closing date of the Merger are summarized below (in thousands of dollars):
|
Cash and cash equivalents
|
$
|
29
|
|
|
Other assets, net
|
7
|
|
|
|
In-process research and development (IPR&D)
|
16,000
|
|
|
|
Goodwill
|
1,057
|
|
|
|
Total net assets acquired
|
$
|
17,093
|
|
The fair value of IPR&D was determined using the multi-period excess earnings method of the income approach, which estimates the economic benefits of the IPR&D over multiple time periods by identifying the cash flows associated with the use of the asset, based on forecasts prepared by management, and deducting a periodic charge reflecting a fair return for the use of contributory assets. The forecasted cash flows were discounted based on a discount rate of
18.5%
. The discount rate represents the Company's weighted average return on assets and was benchmarked against the internal rate of return and cost of capital of guideline publicly traded companies. The fair value of the IPR&D was capitalized as of the closing date of the Merger and was accounted for as an indefinite-lived intangible asset prior to the beginning of amortization.
Amortization of the IPR&D began in April 2015 when research and development activities were deemed to be completed and is recorded on a straight-line basis. The amortization period of the IPR&D is over its estimated useful life of
15 years
after taking into consideration expected use of the asset, legal or regulatory provisions that may limit or extend the life of the asset, as well as the effects of obsolescence and other economic factors. Amortization of
$1.1 million
and
$0.8 million
was recorded for the years ended
December 31, 2016
and
2015
, respectively, and accumulated amortization was
$1.9 million
and
$0.8 million
as of
December 31, 2016
and
2015
, respectively. Amortization expense will be approximately
$1.1 million
per year.
Goodwill, which represents the purchase price in excess of the fair value of net assets acquired, is not expected to be deductible for income tax purposes. This goodwill is reflective of the value derived from the acceleration of the Company's entry into the pulmonology market.
Pro Forma Financial Information (Unaudited)
The following pro forma financial information is based on the historical financial statements of the Company and presents the Company's results as if the Merger had occurred as of January 1, 2013 (in thousands of dollars):
|
|
Year Ended
December 31, |
||||||
|
|
2014
|
2013
|
|||||
|
Revenue
|
$
|
38,190
|
|
$
|
21,884
|
|
|
|
Net loss
|
$
|
(29,090
|
)
|
$
|
(28,605
|
)
|
|
72
VERACYTE, INC.
Notes to Financial Statements (Continued)
4. Business Combination (Continued)
The pro forma results present the combined historical results of operations with adjustments to reflect one-time charges including:
|
•
|
The reversal of costs related to transaction bonuses and other payments to employees and acquisition-related expenses directly related to the Merger of
$2.2 million
for the year ended
December 31, 2014
; and
|
|
•
|
the elimination of interest expense related to Allegro indebtedness of
$2.3 million
and
$4.5 million
for the years ended
December 31, 2014
and
2013
, respectively.
|
The pro forma information presented does not purport to present what the actual results would have been had the Merger actually occurred on January 1, 2013, nor is the information intended to project results for any future period.
5. Balance Sheet Components
Property and Equipment, Net
Property and equipment consisted of the following (in thousands of dollars):
|
|
Year Ended December 31,
|
||||||
|
|
2016
|
2015
|
|||||
|
Leasehold improvements
|
$
|
5,861
|
|
$
|
789
|
|
|
|
Laboratory equipment
|
6,441
|
|
5,501
|
|
|||
|
Computer equipment
|
1,177
|
|
1,046
|
|
|||
|
Software, including software developed for internal use
|
1,937
|
|
1,353
|
|
|||
|
Furniture and fixtures
|
1,131
|
|
242
|
|
|||
|
Construction-in-process
|
1,769
|
|
6,823
|
|
|||
|
Total property and equipment, at cost
|
18,316
|
|
15,754
|
|
|||
|
Accumulated depreciation and amortization
|
(6,836
|
)
|
(5,440
|
)
|
|||
|
Total property and equipment, net
|
$
|
11,480
|
|
$
|
10,314
|
|
|
Depreciation and amortization expense was
$2.4 million
,
$1.5 million
and
$1.2 million
for the years ended
December 31, 2016
,
2015
and
2014
, respectively.
Equipment under a capital lease was purchased in December 2016 but was not available for use at December 31, 2016, and as such, there was no amortization expense for equipment under capital lease in 2016.
Accrued Liabilities
Accrued liabilities consisted of the following (in thousands of dollars):
|
|
Year Ended December 31,
|
||||||
|
|
2016
|
2015
|
|||||
|
Accrued compensation expense
|
$
|
6,120
|
|
$
|
4,212
|
|
|
|
Accrued Genzyme co-promotion fees
|
—
|
|
2,089
|
|
|||
|
Accrued other
|
2,990
|
|
2,388
|
|
|||
|
Total accrued liabilities
|
$
|
9,110
|
|
$
|
8,689
|
|
|
73
6. Fair Value Measurements
The Company records its financial assets and liabilities at fair value. The carrying amounts of certain financial instruments of the Company, including cash and cash equivalents, prepaid expenses and other current assets, accounts payable and accrued liabilities, approximate fair value due to their relatively short maturities. The carrying value of the Company's debt approximates its fair value because the interest rate approximates market rates that the Company could obtain for debt with similar terms. The estimated fair value of the Company’s debt is estimated using the net present value of the payments, discounted at an interest rate that is consistent with market interest rates, which is a Level II input. The accounting guidance for fair value provides a framework for measuring fair value, clarifies the definition of fair value, and expands disclosures regarding fair value measurements. Fair value is defined as the price that would be received to sell an asset or paid to transfer a liability (an exit price) in an orderly transaction between market participants at the reporting date. The accounting guidance establishes a three-tiered hierarchy, which prioritizes the inputs used in the valuation methodologies in measuring fair value as follows:
|
•
|
Level I: Inputs which include quoted prices in active markets for identical assets and liabilities.
|
|
•
|
Level II: Inputs other than Level I that are observable, either directly or indirectly, such as quoted prices for similar assets or liabilities; quoted prices in markets that are not active; or other inputs that are observable or can be corroborated by observable market data for substantially the full term of the assets or liabilities.
|
|
•
|
Level III: Unobservable inputs that are supported by little or no market activity and that are significant to the fair value of the assets or liabilities.
|
The fair value of the Company's financial assets, which consist only of money market funds, was
$58.7 million
and
$37.5 million
as of
December 31, 2016
and
2015
respectively, and are Level I assets as described above.
7. Commitments and Contingencies
Operating Leases
The Company leases its headquarters and laboratory facilities in South San Francisco, California under a non-cancelable lease agreement for approximately
59,000
square feet. The lease began in June 2015 and ends in March 2026 and contains extension of lease term and expansion options. Certain expansion options were waived by the Company on February 8, 2017 in exchange for consideration of
$500,000
. The Company had deposits of
$603,000
included in long-term assets as of
December 31, 2016
and
2015
, restricted from withdrawal and held by a bank in the form of collateral for an irrevocable standby letter of credit held as security for the lease of the South San Francisco facility.
The Company also leases laboratory and office space in Austin, Texas under a lease that expires on July 31, 2018. The Company provided a cash security deposit of
$75,000
, which is included in other assets in the Company's balance sheets as of
December 31, 2016
and
2015
.
Future minimum lease payments under non-cancelable operating leases as of
December 31, 2016
are as follows (in thousands of dollars):
|
Year Ending December 31,
|
Amounts
|
||
|
2017
|
$
|
2,143
|
|
|
2018
|
2,102
|
|
|
|
2019
|
2,026
|
|
|
|
2020
|
2,082
|
|
|
|
2021
|
2,144
|
|
|
|
Thereafter
|
9,812
|
|
|
|
Total minimum lease payments
|
$
|
20,309
|
|
74
The Company recognizes rent expense on a straight-line basis over the non-cancelable lease period. Rent expense was
$2.0 million
,
$1.9 million
and
$852,000
for the years ended
December 31, 2016
,
2015
and
2014
, respectively.
Capital Lease
The Company entered into a capital lease in December 2016 for
$1.2 million
of equipment and the associated equipment has not been placed into service as of
December 31, 2016
. Amortization of the equipment will commence when the equipment is placed into service and ready for its intended use. The Company paid an upfront amount of
$330,000
and the present value of the total future minimum lease payments of
$874,000
, which is a non-cash investing transaction for 2016, comprises a short-term portion of
$275,000
, included in accrued liabilities, and a long-term portion of
$599,000
, included in capital lease liability, on the Company's balance sheet as of
December 31, 2016
. As of
December 31, 2016
, the annual future minimum lease payments will be
$317,000
for each of 2017, 2018 and 2019.
Supplies Purchase Commitments
The Company had non-cancelable purchase commitments with suppliers to purchase a minimum quantity of supplies for approximately
$1.7 million
at
December 31, 2016
.
Contingencies
From time to time, the Company may be involved in legal proceedings arising in the ordinary course of business. The Company believes there is no litigation pending that could have, individually or in the aggregate, a material adverse effect on its financial position, results of operations or cash flows.
Credit Agreement
In March 2016, the Company entered into a credit agreement (the “Credit Agreement”) with Visium Healthcare Partners, LP (“Visium”). Under the Credit Agreement,
two
term loans are available to the Company with an aggregate principal amount of up to
$40.0 million
. The Company drew down the initial
$25.0 million
term loan (the “Initial Term Loan”) on March 30, 2016, of which
$5.0 million
was used to pay the outstanding balance of the Company’s existing long-term debt, which was cancelled at that date. On or prior to June 30, 2017, the Company may request the second term loan of up to
$15.0 million
(the “Second Term Loan” and together with the Initial Term Loan, the “Term Loans”). The Term Loans mature on March 31, 2022.
The Term Loans bear interest at a fixed rate of
12.0%
per annum, payable quarterly at the end of each March, June, September and December. No principal payments will be due during an interest-only period, commencing on the funding date for the Initial Term Loan (the “Initial Borrowing Date”) and continuing through and including March 31, 2020. The Company is obligated to repay the outstanding principal amounts under the Term Loans in
eight
equal installments during the final
two
years under the Credit Agreement. For any quarterly interest payment through and including the 16th interest payment date after the Initial Borrowing Date, so long as no event of default has occurred and is then continuing, the Company may elect to pay interest in cash on the outstanding principal amounts of the Term Loans at a fixed rate of
9.0%
, with the remaining
3.0%
of the
12.0%
interest paid-in-kind by adding such paid-in-kind interest to the outstanding principal amounts of the Term Loans. The Company elected to pay interest in-kind for the quarters ended June 30, 2016 and September 30, 2016 and has recorded
$385,000
of paid-in-kind interest through
December 31, 2016
.
The Company may prepay the outstanding principal amount under the Term Loans subject to a minimum of
$5.0 million
of principal amount or a whole multiple of
$1 million
in excess thereof plus accrued and unpaid interest and a prepayment premium. The prepayment premium will be assessed on the principal amount repaid and will equal (i)
24.0%
less the aggregate amount of all interest payments in cash, if the prepayment is made on or prior to March 31, 2018, (ii)
4.0%
, if the prepayment is made after March 31, 2018 and on or prior to March 31, 2019, (iii)
2.0%
, if the prepayment is made after March 31, 2019 and on or prior to March 31, 2020, and (iv)
1.0%
, if the prepayment is made after March 31, 2020 and on or prior to March 31, 2021. After March 31, 2021 there is no prepayment premium.
75
The Company’s obligations under the Credit Agreement are secured by a security interest in substantially all of its assets. The Credit Agreement contains customary representations, warranties and events of default, as well as affirmative and negative covenants. The negative covenants include, among other provisions, covenants that limit or restrict the Company’s ability to incur liens, make investments, incur indebtedness, merge with or acquire other entities, dispose of assets, make dividends or other distributions to holders of its equity interests, engage in any material new line of business or enter into certain transactions with affiliates, in each case subject to certain exceptions. To the extent the Company forms or acquires certain subsidiaries domiciled in the United States, those subsidiaries are required to be guarantors of the Company’s obligations under the Credit Agreement. As of
December 31, 2016
, the Company was in compliance with the loan covenants.
Concurrent with entering into the Credit Agreement, the Company entered into an agreement with Visium pursuant to which, for a period of
one
year following the Initial Borrowing Date, Visium has the right to participate in certain future equity financings of the Company in an amount of up to
$5.0 million
with no preferential terms.
As of
December 31, 2016
, the net debt obligation for borrowings made under the Credit Agreement was as follows (in thousands of dollars):
|
|
December 31, 2016
|
||
|
Debt principal
|
$
|
25,385
|
|
|
Unamortized debt issuance costs
|
(467
|
)
|
|
|
Net debt obligation
|
$
|
24,918
|
|
Future principal payments under the Credit Agreement are as follows (in thousands of dollars):
|
Year Ending December 31,
|
|||
|
2020
|
$
|
9,519
|
|
|
2021
|
12,693
|
|
|
|
2022
|
3,173
|
|
|
|
Total
|
$
|
25,385
|
|
Loan and Security Agreement
In June 2013, the Company entered into a loan and security agreement ("Original Loan") with a financial institution. The Original Loan provided for term loans of up to
$10.0 million
in aggregate. The Company drew down
$5.0 million
in funds under the agreement in June 2013, and did not draw the remaining
$5.0 million
on or before the expiration date of March 31, 2014. The Company was required to repay the outstanding principal in
30
equal installments beginning
18 months
after the date of the borrowing and was due in full in June 2017. The Original Loan had an interest rate of
6.06%
per annum, carried prepayment penalties of
2.25%
and
1.50%
for prepayment within one and two years, respectively, and
0.75%
thereafter.
In December 2014, the Company amended certain terms and conditions of the Original Loan ("Amended Loan"). The Amended Loan provided for term loans of up to
$15.0 million
in aggregate, in
three
tranches of
$5.0 million
each. The Company borrowed
$5.0 million
under the first tranche in December 2014 and used the funds for repayment of the
$5.0 million
in principal outstanding under the Original Loan, in a cashless transaction. In addition, the Company paid the accrued but unpaid interest of
$14,000
due on the Original Loan and the related end-of-term payment of
$110,000
. The Amended Loan waived the prepayment premium of
$75,000
under the Original Loan and reduced the end-of-term payment of
$225,000
under the Original Loan to
$110,000
. In November 2015, the Company further amended the loan to extend the availability of the second
$5.0 million
tranche under the Amended Loan through June 30, 2016 from
December 31, 2015
originally.
76
The carrying value of the debt approximated its fair value because the interest rate approximated market rates that the Company could have obtained for debt with similar terms. Under the Amended Loan borrowing, the Company was required to repay the outstanding principal in
24
equal installments beginning
24 months
after the date of the borrowing and was due in full in December 2018. The first tranche of the Amended Loan bore interest at a rate of
5.00%
per annum. The Amended Loan carried prepayment penalties of
2.00%
and
1.00%
for prepayments within one and two years, respectively, and
no
prepayment penalty thereafter. In connection with the Amended Loan, the Company paid approximately
$45,000
in third-party fees.
The Amended Loan resulted in a debt modification under ASC 470-50,
Modifications and Extinguishments,
as the change in present value of the remaining cash flows associated with the Original Loan and Amended Loan was not substantial.
Upon execution of the Original Loan, the Company issued the financial institution a warrant to purchase shares of Series C convertible preferred stock at
$7.56
per share. At the time of issuance, the aggregate fair value of the warrant for the
24,801
shares exercisable under the warrant was
$175,000
. The fair value of the warrant was deducted from total proceeds, resulting in a debt discount to be amortized to interest expense over
48 months
, through the maturity date of the Original Loan, using the effective interest rate method, and was recorded as a preferred stock warrant liability. The warrant was converted to a warrant to purchase the Company's common stock upon the completion of the Company's IPO. The financial institution exercised the warrant with respect to
24,801
shares through a cashless exercise in March 2014, resulting in the issuance of
13,739
shares of the Company's common stock.
Borrowings under the 2013 Loan Agreement totaled
$5.0 million
, which was outstanding at January 1, 2015 and into 2016 until such amount was repaid upon the Company entering into the Credit Agreement discussed above.
As of
December 31, 2015
, the net debt obligation under the Amended Loan was as follows (in thousands of dollars):
|
|
|||
|
|
2015
|
||
|
Debt and unpaid accrued end-of-term payment
|
$
|
5,082
|
|
|
Unamortized note discount
|
(92
|
)
|
|
|
Net debt obligation
|
$
|
4,990
|
|
Interest Expense
Interest expense was as follows (in thousands of dollars):
|
|
Year Ended
December 31, |
||||||||||
|
|
2016
|
2015
|
2014
|
||||||||
|
Nominal interest
|
$
|
2,378
|
|
$
|
253
|
|
$
|
296
|
|
||
|
Amortization and write-off of debt discount and debt issuance costs
|
173
|
|
46
|
|
62
|
|
|||||
|
End-of-term payment interest and prepayment penalty
|
206
|
|
79
|
|
81
|
|
|||||
|
Total
|
$
|
2,757
|
|
$
|
378
|
|
$
|
439
|
|
||
77
9. Stockholders' Equity
Common Stock
The Company's Restated Certificate of Incorporation authorizes the Company to issue
125,000,000
shares of common stock with a par value of
$0.001
per share. The holder of each share of common stock shall have
one
vote for each share of stock. The common stockholders are also entitled to receive dividends whenever funds and assets are legally available and when declared by the Board of Directors, subject to the prior rights of holders of all series of convertible preferred stock outstanding.
No
dividends have been declared as of
December 31, 2016
.
As of
December 31, 2016
and
2015
, the Company had reserved shares of common stock for issuance as follows:
|
|
December 31,
|
||||
|
|
2016
|
2015
|
|||
|
Stock options and restricted stock units issued and outstanding
|
5,251,832
|
|
4,179,521
|
|
|
|
Stock options and restricted stock units available for grant under stock option plans
|
887,724
|
|
1,058,359
|
|
|
|
Common stock available for the Employee Stock Purchase Plan
|
609,053
|
|
750,000
|
|
|
|
Total
|
6,748,609
|
|
5,987,880
|
|
|
In November 2016, the Company completed a public offering of
5,723,300
shares of its common stock at a price of
$6.00
per share. Gross proceeds to the Company were
$34.3 million
and the Company raised net proceeds of
$32.1 million
, after deducting underwriting discounts and commissions and other expenses of
$2.2 million
. At December 31, 2016, the Company had
$200,000
receivable from the underwriters for reimbursement of other expenses, which is included in prepaid expenses and other current assets in the Company's balance sheet.
In April 2015, the Company completed a private placement of
4,907,975
shares of its common stock to certain accredited investors at a purchase price of
$8.15
per share. Gross proceeds to the Company were
$40.0 million
and the Company received
$37.3 million
in net proceeds, after deducting placement agent fees and other expenses of
$2.7 million
.
10. Stock Incentive Plans
Stock Plans
In February 2008, the Company adopted the 2008 Stock Plan (the "2008 Plan"). The 2008 Plan provides for the granting of options to purchase common stock and common stock to employees, directors and consultants of the Company. The Company may grant incentive stock options ("ISOs"), non-statutory stock options ("NSOs") or restricted stock under the 2008 Plan. ISOs may only be granted to Company employees (including directors who are also considered employees). NSOs and restricted stock may be granted to Company employees, directors and consultants. Options may be granted for terms of up to
ten
years from the date of grant, as determined by the Board of Directors, provided however, that with respect to an ISO granted to a person who owns stock representing more than
10%
of the voting power of all classes of stock of the Company, the term shall be for no more than
five
years from the date of grant. The exercise price of options granted must be at a price no less than
100%
of the estimated fair value of the shares on the date of grant, as determined by the Board of Directors, provided however, that with respect to an ISO granted to an employee who at the time of grant of such option owns stock representing more than
10%
of the voting power of all classes of stock of the Company, the exercise price shall not be less than
110%
of the estimated fair value of the shares on the date of grant.
In October 2013, the Company adopted the 2013 Stock Incentive Plan (the "2013 Plan"). The 2013 Plan was subsequently approved by the Company's stockholders and became effective on November 4, 2013, immediately before the closing of the Company's IPO. Following the effectiveness of the 2013 Plan, no additional options will be granted under the 2008 Plan. An aggregate of
1,700,000
shares were initially reserved for issuance under the 2013 Plan. In addition, to the extent that any awards outstanding or subject to vesting restrictions under the 2008 Plan are subsequently forfeited or terminated for any reason before
78
VERACYTE, INC.
Notes to Financial Statements (Continued)
10. Stock Incentive Plans (Continued)
being exercised or settled, the shares of common stock reserved for issuance pursuant to such awards as of the closing of the IPO will become available for issuance under the 2013 Plan. The remaining shares available for grant under the 2008 Plan became available for issuance under the 2013 Plan upon the closing of the IPO. On the first day of each year from 2014 to 2023, the 2013 Plan authorizes an annual increase of the lesser of
4%
of outstanding shares on the last day of the immediately preceding fiscal year or a lesser amount as determined by the Company's Board of Directors. As of December 31, 2016,
887,724
shares were available for future issuance under the 2013 Plan.
Pursuant to the 2013 Plan, stock options, restricted shares, stock units, including restricted stock units and stock appreciation rights may be granted to employees, consultants, and outside directors of the Company. Options granted may be either ISOs or NSOs.
Stock options are governed by stock option agreements between the Company and recipients of stock options. ISOs and NSOs may be granted under the 2013 Plan at an exercise price of not less than
100%
of the fair market value of the common stock on the date of grant, determined by the Compensation Committee of the Board of Directors. Options become exercisable and expire as determined by the Compensation Committee, provided that the term of ISOs may not exceed ten years from the date of grant. Stock option agreements may provide for accelerated exercisability in the event of an optionee's death, disability, or retirement or other events.
Stock units are governed by stock unit agreements between the Company and recipients of stock units. Stock units may be granted under the 2013 Plan and the number of stock units awarded are determined by the Compensation Committee of the Board of Directors. Stock units vest and expire as determined by the Compensation Committee. Stock unit agreements may provide for accelerated vesting in the event of a stock unit holder's death, disability, or retirement or other events.
Any outside director who was not previously an employee and who first joins the Company's Board of Directors on or after the effective date of the 2013 Plan will be automatically granted an initial NSO to purchase
35,000
shares of common stock upon first becoming a member of the Board of Directors.
Twenty-five percent
of the shares subject to the initial option will vest and become exercisable on the first anniversary of the date of grant. The balance (
i.e.,
the remaining
75%
) will vest and become exercisable over
three years
in equal monthly installments. On the first business day after each regularly scheduled annual meeting of stockholders, each outside director who was not elected to the Board of Directors for the first time at such meeting and who will continue serving as a member of the Board of Directors thereafter will be automatically granted an option to purchase
10,000
shares of common stock, provided that the outside director has served on the Board of Directors for at least
six months
. Each annual option will vest and become exercisable on the first anniversary of the date of grant, or immediately prior to the next regular annual meeting of the Company's stockholders following the date of grant if the meeting occurs prior to the first anniversary date. The options granted to outside directors will have a per share exercise price equal to
100%
of the fair market value of the underlying shares on the date of grant and will become fully vested in the event of a change of control. In addition, such options will terminate on the earlier of (i) the day before the
10
th anniversary of the date of grant or (ii) the date
12 months
after the termination of the outside director's service for any reason.
The following table summarizes activity under the Company's stock incentive plans (aggregate intrinsic value in thousands):
|
|
Shares
Available
for Grant
|
Stock Options
Outstanding |
Weighted
Average Exercise Price |
Weighted Average
Remaining Contractual Life (Years) |
Aggregate
Intrinsic Value |
||||||||||
|
Balance—December 31, 2015
|
1,058,359
|
|
4,179,521
|
|
$
|
8.03
|
|
7.50
|
$
|
6,511
|
|
||||
|
Additional shares authorized
|
1,114,416
|
|
—
|
|
|
|
|
|
|
||||||
|
Granted - stock options
|
(1,618,250
|
)
|
1,618,250
|
|
6.30
|
|
|
|
|
||||||
|
Granted - restricted stock units
|
(25,000
|
)
|
25,000
|
|
|||||||||||
|
Canceled
|
358,199
|
|
(358,199
|
)
|
10.29
|
|
|
|
|
||||||
|
Exercised
|
—
|
|
(212,740
|
)
|
2.53
|
|
|
|
|
||||||
|
Balance—December 31, 2016
|
887,724
|
|
5,251,832
|
|
$
|
7.56
|
|
7.24
|
$
|
8,515
|
|
||||
|
Options vested and exercisable—December 31, 2016
|
|
|
2,628,328
|
|
$
|
7.42
|
|
5.89
|
$
|
6,008
|
|
||||
|
Options vested and expected to vest—December 31, 2016
|
|
|
4,962,370
|
|
$
|
7.58
|
|
7.16
|
$
|
8,254
|
|
||||
79
VERACYTE, INC.
Notes to Financial Statements (Continued)
10. Stock Incentive Plans (Continued)
The aggregate intrinsic value was calculated as the difference between the exercise price of the options to purchase common stock and the fair market value of the Company's common stock, which was
$7.74
and
$7.20
per share as of December 31, 2016 and 2015, respectively.
The weighted average fair value of options to purchase common stock granted was
$3.35
,
$5.12
and
$9.08
for the years ended December 31, 2016, 2015 and 2014, respectively.
The aggregate estimated grant date fair value of employee options to purchase common stock vested during the years ended December 31, 2016, 2015 and 2014 was
$5.8 million
,
$5.3 million
and
$1.6 million
, respectively.
The intrinsic value of stock options exercised was
$0.9 million
,
$1.8 million
and
$3.2 million
for the years ended December 31, 2016, 2015 and 2014, respectively.
The weighted average fair value of restricted stock units granted was
$7.47
for the year ended December 31, 2016. Restricted stock units were first issued in December 2016 and there were no restricted stock units vested for the year ended December 31, 2016.
Employee Stock Purchase Plan
In May 2015, the Company's stockholders approved the Company's Employee Stock Purchase Plan ("ESPP"). The ESPP provides eligible employees with an opportunity to purchase common stock from the Company and to pay for their purchases through payroll deductions. The ESPP will be implemented through a series of offerings of purchase rights to eligible employees. Under the ESPP, the Compensation Committee of the Company's Board of Directors may specify offerings with a duration of not more than
12 months
, and may specify shorter purchase periods within each offering. During each purchase period, payroll deductions will accumulate, without interest. On the last day of the purchase period, accumulated payroll deductions will be used to purchase common stock for employees participating in the offering.
The purchase price will be specified pursuant to the offering, but cannot, under the terms of the ESPP, be less than
85%
of the fair market value per share of the Company's common stock on either the offering date or on the purchase date, whichever is less.
The Company's Board of Directors has determined that the purchase periods initially shall have a duration of
six months
, that the first purchase period began on August 3, 2015 and that the purchase price will be
85%
of the fair market value per share of the Company's common stock on either the offering date or the purchase date, whichever is less. The length of the purchase period applicable to U.S. employees and the purchase price may not be changed without the approval of the independent members of the Compensation Committee of the Company's Board of Directors. The Compensation Committee has determined that if the fair market value of a share of the Company's common stock on any purchase date within a particular offering period is less than the fair market value on the start date of that offering period, then the offering period will automatically terminate and the employees in that offering period will automatically be transferred and enrolled in a new offering period which will begin on the next day following such purchase date.
No employee is permitted to accrue, under the ESPP, a right to purchase stock of the Company having a value in excess of
$25,000
of the fair market value of such stock (determined at the time the right is granted) for each calendar year.
80
VERACYTE, INC.
Notes to Financial Statements (Continued)
10. Stock Incentive Plans (Continued)
Stock-based Compensation
The following table summarizes stock-based compensation expense related to stock options, restricted stock units and the ESPP for the years ended December 31, 2016, 2015 and 2014, and are included in the statements of operations and comprehensive loss as follows (in thousands of dollars):
|
|
Year Ended December 31,
|
||||||||||
|
|
2016
|
2015
|
2014
|
||||||||
|
Cost of revenue
|
$
|
126
|
|
$
|
100
|
|
$
|
51
|
|
||
|
Research and development
|
1,322
|
|
1,178
|
|
790
|
|
|||||
|
Selling and marketing
|
1,594
|
|
1,326
|
|
707
|
|
|||||
|
General and administrative
|
3,336
|
|
2,998
|
|
2,000
|
|
|||||
|
Total stock-based compensation expense
|
$
|
6,378
|
|
$
|
5,602
|
|
$
|
3,548
|
|
||
As of December 31, 2016, the Company had
$9.3 million
of unrecognized compensation expense related to unvested stock options and restricted stock units, which is expected to be recognized over an estimated weighted-average period of
2.50 years
.
The estimated grant-date fair value of employee stock options was calculated using the Black-Scholes option-pricing model, based on the following assumptions:
|
|
Year Ended December 31,
|
||||
|
|
2016
|
2015
|
2014
|
||
|
Weighted-average volatility
|
52.49 - 56.36%
|
52.56 - 68.82%
|
70.19 - 78.54%
|
||
|
Weighted-average expected term (years)
|
5.50 - 6.27
|
5.50 - 6.08
|
5.50 - 6.08
|
||
|
Risk-free interest rate
|
1.16 - 2.09%
|
1.55 - 2.03%
|
1.66 - 2.04%
|
||
|
Expected dividend yield
|
—
|
—
|
—
|
||
The estimated fair value of non-employee stock options was calculated using the Black-Scholes option-pricing model, based on the following assumptions:
|
|
Year Ended December 31,
|
||||
|
|
2016
|
2015
|
2014
|
||
|
Weighted-average volatility
|
52.77 - 65.85%
|
64.72 - 74.48%
|
73.20 - 74.48%
|
||
|
Weighted-average expected term (years)
|
7.80 - 8.56
|
7.92 - 10.00
|
8.75 - 10.00
|
||
|
Risk-free interest rate
|
1.39 - 2.30%
|
1.78 - 2.29%
|
2.09 - 2.20%
|
||
|
Expected dividend yield
|
—
|
—
|
—
|
||
The estimated grant date fair value of the ESPP shares was calculated using the Black-Scholes option-pricing model, based on the following assumptions:
|
Year Ended December 31,
|
|||
|
|
2016
|
2015
|
|
|
Weighted-average volatility
|
46.38 - 75.72%
|
53.57 - 58.10%
|
|
|
Weighted-average expected term (years)
|
0.50 - 1.00
|
0.49 - 0.99
|
|
|
Risk-free interest rate
|
0.40 - 0.50%
|
0.17 - 0.33%
|
|
|
Expected dividend yield
|
—
|
—
|
|
81
11. Genzyme Co-Promotion Agreement
In January 2012, the Company and Genzyme Corporation ("Genzyme") executed a co-promotion agreement for the co-exclusive rights and license to promote and market the Company's Afirma thyroid diagnostic solution in the United States and in
40
named countries. In exchange, the Company received a
$10.0 million
upfront co-promotion fee from Genzyme in February 2012. Under the terms of the agreement, Genzyme received a percentage of U.S. cash receipts that the Company has received related to Afirma as co-promotion fees. The percentage was
50%
in 2012,
40%
from January 2013 through February 2014, and
32%
beginning in February 2014.
In November 2014, the Company signed an Amended and Restated U.S. Co-Promotion Agreement ("Amended Agreement") with Genzyme. Under the Amended Agreement, the co-promotion fees Genzyme receives as a percentage of U.S. cash receipts were reduced from
32%
to
15%
beginning January 1, 2015. Through August 11, 2014, the Company amortized the
$10.0 million
upfront co-promotion fee on a straight-line basis over a
four
-year period, which was management's estimate of the life of the agreement, in part because after that period either party could have terminated the agreement without penalty. Effective August 12, 2014, the Company extended the amortization period from January 2016 to June 2016, the modified earliest period either party could terminate the agreement without penalty. The Company accounted for the change in accounting estimate prospectively. The agreement was terminable by either party with
six months
prior notice, however, under the Amended Agreement, neither party could terminate the agreement for convenience prior to June 30, 2016. The agreement with Genzyme was to expire in 2027. On March 9, 2016, the Company gave Genzyme notice of termination of the Amended Agreement effective September 9, 2016 and the amortization of the upfront co-promotion fee was further extended to that date. The extension of the amortization period had no impact on the Company's 2016 financial statements on an annual basis.
In February 2015, the Company entered into an Ex-U.S. Co-promotion Agreement with Genzyme for the promotion of the Afirma GEC test with exclusivity in
five
countries outside the United States initially and in other countries agreed to from time to time. The agreement commenced on January 1, 2015 and continues until December 31, 2019, with extension of the agreement possible upon agreement of the parties. Country-specific terms have been established under this agreement for Brazil and Singapore and a right of first negotiation has been established for Canada, the Netherlands and Italy. The Company pays Genzyme
25%
of net revenue from the sale of the Afirma GEC test in Brazil and Singapore over a
five
-year period commencing January 1, 2015. These payments have been immaterial for all periods presented. Beginning in the fourth year of the agreement, if the Company terminates the agreement for convenience, the Company may be required to pay a termination fee contingent on the number of GEC billable results generated during the 12 months immediately prior to the notice of termination.
The Company incurred
$6.1 million
,
$7.3 million
and
$12.0 million
in co-promotion expense, excluding the amortization of the upfront co-promotion fee, in the years ended December 31, 2016, 2015 and 2014, respectively, which is included in selling and marketing expenses in the statements of operations and comprehensive loss. The Company had
no
obligation to Genzyme at December 31, 2016 compared to
$2.1 million
at December 31, 2015, which is included in accrued liabilities on the Company's balance sheets.
The Company amortized
$0.9 million
,
$1.9 million
and
$2.3 million
of the
$10.0 million
upfront co-promotion fee in the years ended December 31, 2016, 2015 and 2014, respectively, which is reflected as a reduction to selling and marketing expenses in the statements of operations and comprehensive loss.
12. Thyroid Cytopathology Partners
In 2010, the Company entered into an arrangement with Pathology Resource Consultants, P.A. ("PRC") to set up and manage a specialized pathology practice to provide testing services to the Company. There is
no
direct monetary compensation from the Company to PRC as a result of this arrangement. The Company's service agreement is with the specialized pathology practice, Thyroid Cytopathology Partners, ("TCP"), and was effective through December 31, 2015, and thereafter automatically renews every year unless either party provides notice of intent not to renew at least
12 months
prior to the end of the then-current term. Under the service agreement, the Company pays TCP based on a fixed price per test schedule, which is reviewed periodically for changes in market pricing. Subsequent to December 2012, an amendment to the service agreement allows TCP to sublease a portion of the Company's facility in Austin, Texas. The Company does not have an ownership interest in or provide any form of financial or other support to TCP.
82
The Company has concluded that TCP represents a variable interest entity and that the Company is not the primary beneficiary as it does not have the ability to direct the activities that most significantly impact TCP's economic performance. Therefore, the Company does not consolidate TCP. All amounts paid to TCP under the service agreement are expensed as incurred and included in cost of revenue in the statements of operations and comprehensive loss. The Company incurred
$5.1 million
,
$4.7 million
and
$4.0 million
for the years ended
December 31, 2016
,
2015
and
2014
, respectively, in cytopathology testing and evaluation services expenses with TCP. The Company's outstanding obligations to TCP for cytopathology testing services were
$426,000
and
$820,000
as of
December 31, 2016
and
2015
, respectively, and are included in accounts payable in the Company's balance sheets.
TCP reimburses the Company for TCP's proportionate share of the Company's rent and related operating expenses for the leased facility. TCP's portion of rent and related operating expenses for the shared space at the Austin, Texas facility was
$103,000
,
$90,000
and
$86,000
for the years ended
December 31, 2016
,
2015
and
2014
and is included other income, net in the Company's statements of operations and comprehensive loss.
13. Income Taxes
The Company generated a pretax loss of
$31.4 million
,
$33.7 million
and
$29.4 million
in the United States for the years ended
December 31, 2016
,
2015
and
2014
, respectively. Since inception, the Company has not generated any pretax income or loss outside of the United States. The Company recorded
no
provision for income taxes during the years ended
December 31, 2016
,
2015
or
2014
.
The Company follows FASB ASC No. 740,
Income Taxes for the Computation and Presentation of its Tax Provision.
The following table presents a reconciliation of the tax expense computed at the statutory federal rate and the Company's tax expense for the periods presented (in thousands of dollars):
|
|
Year Ended December, 31,
|
||||||||||
|
|
2016
|
2015
|
2014
|
||||||||
|
U.S. federal taxes at statutory rate
|
$
|
(10,662
|
)
|
$
|
(11,459
|
)
|
$
|
(9,987
|
)
|
||
|
State tax (net of federal benefit)
|
20
|
|
(30
|
)
|
5
|
|
|||||
|
Permanent differences
|
153
|
|
96
|
|
64
|
|
|||||
|
Incentive stock options
|
1,095
|
|
789
|
|
672
|
|
|||||
|
Tax credits
|
(677
|
)
|
(581
|
)
|
(461
|
)
|
|||||
|
Change in valuation allowance
|
10,071
|
|
11,185
|
|
9,707
|
|
|||||
|
Total
|
$
|
—
|
|
$
|
—
|
|
$
|
—
|
|
||
83
VERACYTE, INC.
Notes to Financial Statements (Continued)
13. Income Taxes (Continued)
Deferred income taxes reflect the net tax effects of temporary differences between the carrying amounts of assets and liabilities for financial reporting purposes and the amounts used for income tax purposes. Significant components of the Company's deferred tax assets and liabilities are as follows (in thousands of dollars):
|
|
Year Ended December 31,
|
||||||||||
|
|
2016
|
2015
|
2014
|
||||||||
|
Deferred tax assets:
|
|
|
|
|
|
|
|||||
|
Net operating loss carryforwards
|
$
|
61,674
|
|
$
|
52,262
|
|
$
|
41,971
|
|
||
|
Research and development credits
|
3,174
|
|
2,497
|
|
1,916
|
|
|||||
|
Stock-based compensation
|
2,847
|
|
1,825
|
|
826
|
|
|||||
|
Genzyme co-promotion agreement
|
—
|
|
330
|
|
995
|
|
|||||
|
Accruals, deferred rent and other
|
4,511
|
|
4,698
|
|
3,381
|
|
|||||
|
Gross deferred tax assets
|
72,206
|
|
61,612
|
|
49,089
|
|
|||||
|
Valuation allowance
|
(65,975
|
)
|
(55,101
|
)
|
(43,439
|
)
|
|||||
|
Net deferred tax assets
|
6,231
|
|
6,511
|
|
5,650
|
|
|||||
|
Deferred tax liabilities:
|
|
|
|
|
|
|
|||||
|
Property and equipment
|
(1,180
|
)
|
(1,215
|
)
|
(60
|
)
|
|||||
|
In-process research and development
|
(5,051
|
)
|
(5,296
|
)
|
(5,590
|
)
|
|||||
|
Gross deferred tax liabilities
|
(6,231
|
)
|
(6,511
|
)
|
(5,650
|
)
|
|||||
|
Net deferred tax liabilities
|
(6,231
|
)
|
(6,511
|
)
|
(5,650
|
)
|
|||||
|
Net deferred taxes
|
$
|
—
|
|
$
|
—
|
|
$
|
—
|
|
||
In November 2015, the FASB issued ASU 2015-17,
Balance Sheet Classification of Deferred Taxes
, related to balance sheet classification of deferred taxes. The ASU requires that deferred tax assets and liabilities be classified as noncurrent in the statement of financial position, thereby simplifying the guidance that required an entity to separate deferred assets and liabilities into current and noncurrent amounts, and was effective for the Company beginning in the first quarter of 2016. The Company early-adopted the ASU as of December 31, 2015 and its statement of financial position as of this date reflects the revised classification of current deferred tax assets and liabilities as noncurrent.
The Company has established a full valuation allowance against its net deferred tax assets due to the uncertainty surrounding realization of such assets. The valuation allowance increased
$10.9 million
,
$11.7 million
and
$10.6 million
during the years ended
December 31, 2016
,
2015
and
2014
, respectively.
As of
December 31, 2016
, the Company had net operating loss carryforwards of approximately
$169.1 million
and
$84.2 million
available to reduce future taxable income, if any, for federal and state income tax purposes, respectively. Of these amounts,
$1.6 million
represent federal and state excess tax deductions from stock-based compensation, which will be recorded as an adjustment to additional paid-in capital when they reduce tax payable. The U.S. federal net operating loss carryforwards will begin to expire in 2026 while for state purposes, the net operating losses began to expire in 2016.
As of
December 31, 2016
, the Company had net credit carryforwards of approximately
$3.3 million
and
$2.7 million
available to reduce future taxable income, if any, for federal and state income tax purposes, respectively. The federal credit carryforwards begin to expire in
2028
. California credits have no expiration date. Other state credit carryforwards begin to expire in
2023
.
On December 18, 2015, The Consolidated Appropriations Act of 2014 was signed into law, which retroactively reinstated and made permanent the federal research tax credit provisions from January 1, 2015 through December 31, 2015.
The Internal Revenue Code of 1986, as amended, imposes restrictions on the utilization of net operating losses and tax credits in the event of an "ownership change" of a corporation. Accordingly, a company's ability to use net operating losses and tax credits may be limited as prescribed under Internal Revenue Code Section 382 and 383 ("IRC Section 382"). Events which may cause limitations in the amount of the net operating losses or tax credits that the Company may use in any one year include, but are not
84
VERACYTE, INC.
Notes to Financial Statements (Continued)
13. Income Taxes (Continued)
limited to, a cumulative ownership change of more than 50% over a three-year period. Utilization of the federal and state net operating losses may be subject to substantial annual limitation due to the ownership change limitations provided by the IRC Section 382 rules and similar state provisions. In the event the Company has any changes in ownership, net operating losses and research and development credit carryovers could be limited and may expire unutilized.
Uncertain Tax Positions
As of
December 31, 2016
, the Company had unrecognized tax benefits of
$2.2 million
, none of which would currently affect the Company's effective tax rate if recognized due to the Company's deferred tax assets being fully offset by a valuation allowance. The Company does not anticipate that the amount of unrecognized tax benefits relating to tax positions existing at
December 31, 2016
will significantly increase or decrease within the next 12 months.
A reconciliation of the beginning and ending amount of unrecognized tax benefits is as follows (in thousands of dollars):
|
|
Year Ended December 31,
|
||||||||||
|
|
2016
|
2015
|
2014
|
||||||||
|
Unrecognized tax benefits, beginning of period
|
$
|
1,871
|
|
$
|
1,571
|
|
$
|
727
|
|
||
|
Gross increases—tax position in prior period
|
—
|
|
—
|
|
548
|
|
|||||
|
Gross decreases—tax position in prior period
|
—
|
|
—
|
|
—
|
|
|||||
|
Gross increases—current period tax position
|
351
|
|
300
|
|
296
|
|
|||||
|
Lapse of statute of limitations
|
—
|
|
—
|
|
—
|
|
|||||
|
Unrecognized tax benefits, end of period
|
$
|
2,222
|
|
$
|
1,871
|
|
$
|
1,571
|
|
||
It is the Company's policy to include penalties and interest expense related to income taxes as a component of other income (expense), net, and interest expense, respectively, as necessary. There was
no
interest expense or penalties related to unrecognized tax benefits recorded through
December 31, 2016
.
The Company's major tax jurisdictions are the United States and California. All of the Company's tax years will remain open for examination by the Federal and state tax authorities for
three
and
four years
, respectively, from the date of utilization of the net operating loss or research and development credit. The Company does not have any tax audits pending.
14. 401(k) Plan
The Company sponsors a 401(k) defined contribution plan covering all employees. Employer contributions to the plan were
$262,000
and
$103,000
for the years ended
December 31, 2016
and
2015
, respectively. There were no employer contributions to the plan for the year ended
December 31, 2014
.
15. Selected Quarterly Financial Data (Unaudited)
The following table presents selected unaudited financial data for each of the eight quarters in the two-year period ended
December 31, 2016
. The Company believes this information reflects all recurring adjustments necessary to fairly present this information when read in conjunction with the Company's financial statements and the related notes. Net loss per common share, basic and diluted, for the four quarters of each fiscal year may not sum to the total for the fiscal year because of the different number of shares outstanding during each period. The results of operations for any quarter are not necessarily indicative of the results to be expected for any future period (in thousands of dollars, except for share and per share data):
85
|
Quarter Ended
|
March 31
|
June 30
|
September 30
|
December 31
|
|||||||||||
|
2016:
|
|
|
|
|
|
|
|
|
|||||||
|
Revenue
|
$
|
13,550
|
|
$
|
14,675
|
|
$
|
18,603
|
|
$
|
18,257
|
|
|||
|
Net loss
|
(10,075
|
)
|
(11,243
|
)
|
(5,637
|
)
|
(4,403
|
)
|
|||||||
|
Net loss per common share, basic and diluted
|
(0.36
|
)
|
(0.40
|
)
|
(0.20
|
)
|
(0.14
|
)
|
|||||||
|
Shares used to compute net loss per common share, basic and diluted
|
27,817,993
|
|
27,859,918
|
|
27,916,819
|
|
31,705,603
|
|
|||||||
|
2015:
|
|
|
|
|
|
|
|
|
|||||||
|
Revenue
|
$
|
11,218
|
|
$
|
11,908
|
|
$
|
12,335
|
|
$
|
14,042
|
|
|||
|
Net loss
|
(7,610
|
)
|
(9,136
|
)
|
(8,945
|
)
|
(8,013
|
)
|
|||||||
|
Net loss per common share, basic and diluted
|
(0.34
|
)
|
(0.35
|
)
|
(0.32
|
)
|
(0.29
|
)
|
|||||||
|
Shares used to compute net loss per common share, basic and diluted
|
22,539,723
|
|
26,048,934
|
|
27,640,806
|
|
27,672,806
|
|
|||||||
Not applicable.
Evaluation of Disclosure Controls and Procedures
We maintain "disclosure controls and procedures," as such term is defined in Rule 13a-15(e) under the Securities Exchange Act of 1934, or Exchange Act, that are designed to ensure that information required to be disclosed by us in reports that we file or submit under the Exchange Act is recorded, processed, summarized, and reported within the time periods specified in Securities and Exchange Commission rules and forms, and that such information is accumulated and communicated to our management, including our Chief Executive Officer and Chief Financial Officer, as appropriate, to allow timely decisions regarding required disclosure. In designing and evaluating our disclosure controls and procedures, management recognized that disclosure controls and procedures, no matter how well conceived and operated, can provide only reasonable, not absolute, assurance that the objectives of the disclosure controls and procedures are met. Our disclosure controls and procedures have been designed to meet reasonable assurance standards. Additionally, in designing disclosure controls and procedures, our management necessarily was required to apply its judgment in evaluating the cost-benefit relationship of possible disclosure controls and procedures. The design of any disclosure controls and procedures also is based in part upon certain assumptions about the likelihood of future events, and there can be no assurance that any design will succeed in achieving its stated goals under all potential future conditions.
Based on their evaluation as of the end of the period covered by this Annual Report on Form 10-K, our Chief Executive Officer and Chief Financial Officer have concluded that, as of such date, our disclosure controls and procedures were effective at the reasonable assurance level.
Management's Annual Report on Internal Control Over Financial Reporting
Our management is responsible for establishing and maintaining adequate internal control over financial reporting as defined in Rule 13a-15(f) under the Exchange Act. Because of its inherent limitations, internal control over financial reporting may not prevent or detect misstatements. Projections of any evaluation of the effectiveness of internal control to future periods are subject to the risk that controls may become inadequate because of changes in conditions, or that the degree of compliance with policies or procedures may deteriorate. Under the supervision and with the participation of our management, including our Chief Executive Officer and Chief Financial Officer, we conducted an evaluation of the effectiveness of our internal control over financial reporting as of December 31, 2016 using the criteria established in
Internal Control Integrated Framework
("2013 Framework") issued by the Committee of Sponsoring Organizations of the Treadway Commission ("COSO").
86
Based on our evaluation using those criteria, our management has concluded that, as of December 31, 2016, our internal control over financial reporting was effective to provide reasonable assurance regarding the reliability of financial reporting and the preparation of financial statements for external purposes in accordance with generally accepted accounting principles.
This Annual Report on Form 10-K does not include an attestation report of our registered public accounting firm on our internal control over financial reporting due to an exemption established by the JOBS Act for "emerging growth companies."
Changes in Internal Control over Financial Reporting
There were no changes in our internal control over financial reporting (as such term is defined in Rule 13a-15(f) under the Exchange Act) identified in connection with the evaluation identified above that occurred during the quarter ended December 31, 2016 that have materially affected, or are reasonably likely to materially affect, our internal control over financial reporting.
None.
87
The information required by this item with respect to directors is incorporated by reference from the information under the caption “Election of Directors,” contained in our proxy statement to be filed with the Securities and Exchange Commission no later than 120 days from the end of our fiscal year ended December 31, 2016 in connection with the solicitation of proxies for our 2017 Annual Meeting of Stockholders, or the Proxy Statement. Certain information required by this item concerning executive officers is set forth in Part I of this Report under the caption “Executive Officers of the Registrant” and is incorporated herein by reference.
There have been no material changes to the procedures by which stockholders may recommend nominees to our Board of Directors.
Item 405 of Regulation S-K calls for disclosure of any known late filing or failure by an insider to file a report required by Section 16(a) of the Exchange Act. This disclosure is contained in the section entitled “Section 16(a) Beneficial Ownership Reporting Compliance” in the Proxy Statement and is incorporated herein by reference.
We have adopted a Code of Business Conduct and Ethics that applies to all of our officers and employees, including our Chairman, President and Chief Executive Officer, our Chief Financial Officer and other employees who perform financial or accounting functions. The Code of Business Conduct and Ethics sets forth the basic principles that guide the business conduct of our employees. We have also adopted a Senior Financial Officers’ Code of Ethics that specifically applies to our Chairman, President and Chief Executive Officer, our Chief Financial Officer, and key management employees. Stockholders may request a free copy of our Code of Business Conduct and Ethics and our Senior Financial Officers’ Code of Ethics by contacting Veracyte, Inc., Attention: Chief Financial Officer, 6000 Shoreline Court, Suite 300, South San Francisco, California 94080.
To date, there have been no waivers under our Code of Business Conduct and Ethics or Senior Financial Officers’ Code of Ethics. We intend to disclose future amendments to certain provisions of our Code of Business Conduct and Ethics or Senior Financial Officers’ Code of Ethics or waivers of such Codes granted to executive officers and directors on our website at http://www.veracyte.com within four business days following the date of such amendment or waiver.
Our Board of Directors has appointed an Audit Committee, comprised of Ms. Karin Eastham, as Chairwoman, Dr. Fred E. Cohen and Kevin K. Gordon. The Board of Directors has determined that Ms. Eastham qualifies as an Audit Committee Financial Expert under the definition outlined by the Securities and Exchange Commission. In addition, each of the members of the Audit Committee qualifies as an "independent director" under the current rules of The NASDAQ Stock Market and Securities and Exchange Commission rules and regulations.
The information required by this item is incorporated by reference from the information under the captions “Election of Directors-Director Compensation” and “Executive Compensation” contained in the Proxy Statement.
The information required by this item is incorporated by reference to the disclosure appearing under the headings “Security Ownership of Certain Beneficial Owners and Management” and “Executive Compensation-Equity Compensation Plan Information” contained in the Proxy Statement.
The information required by this item is incorporated by reference from the information under the caption “Election of Directors-Certain Relationships and Related Transactions” and “-Director Independence” contained in the Proxy Statement.
The information required by this item is incorporated by reference from the information under the caption “Ratification of the Appointment of Independent Registered Public Accounting Firm” contained in the Proxy Statement.
88
|
(a)
|
Documents filed as part of this report
|
1. Financial Statements:
Reference is made to the Index to Financial Statements of Veracyte, Inc. included in Item 8 of Part II hereof.
2. Financial Statement Schedules
All schedules have been omitted because they are not required, not applicable, or the required information is included in the financial statements or notes thereto.
3. Exhibits
See Item 15(b) below. Each management contract or compensating plan or arrangement required to be filed has been identified.
|
(b)
|
Exhibits
|
|
Exhibit Number
|
Description
|
||
|
3.1
|
|
Restated Certificate of Incorporation of the Registrant (incorporated by reference to Exhibit 3.1 to the Registrant's Current Report on Form 8-K filed November 8, 2013).
|
|
|
|
|
||
|
3.2
|
|
Amended and Restated Bylaws of the Registrant (incorporated by reference to Exhibit 3.2 to the Registrant's Current Report on Form 8-K filed November 8, 2013).
|
|
|
|
|
||
|
4.1
|
|
Form of Common Stock Certificate (incorporated by reference to Exhibit 4.1 to the Registrant's Registration Statement on Form S-1 (File No. 333-191282), as amended, declared effective on October 29, 2013).
|
|
|
|
|
||
|
4.2
|
|
Second Amended and Restated Investors Rights Agreement, dated November 6, 2012, between the Registrant and certain investors (incorporated by reference to Exhibit 4.2 to the Registrant's Registration Statement on Form S-1 (File No. 333-191282), as amended, declared effective on October 29, 2013).
|
|
|
|
|
||
|
4.3
|
|
Amendment to Second Amended and Restated Investors Rights Agreement, dated June 14, 2013, between the Registrant and certain investors (incorporated by reference to Exhibit 4.3 to the Registrant's Registration Statement on Form S-1 (File No. 333-191282), as amended, declared effective on October 29, 2013).
|
|
|
|
|
||
|
10.1
|
|
#
|
Form of Indemnification Agreement between the Registrant and its officers and directors (incorporated by reference to Exhibit 10.1 to the Registrant's Registration Statement on Form S-1 (File No. 333-191282), as amended, declared effective on October 29, 2013).
|
|
|
|
|
|
|
10.2
|
|
#
|
2008 Stock Plan and forms of agreements thereunder (incorporated by reference to Exhibit 10.2 to the Registrant's Registration Statement on Form S-1 (File No. 333-191282), as amended, declared effective on October 29, 2013).
|
|
|
|
|
|
|
10.3
|
|
#
|
2013 Stock Incentive Plan (incorporated by reference to Exhibit 10.3 to the Registrant's Registration Statement on Form S-1 (File No. 333-191282), as amended, declared effective on October 29, 2013).
|
89
|
Exhibit Number
|
Description
|
||
|
10.4
|
|
# *
|
Forms of agreements under the 2013 Stock Incentive Plan.
|
|
|
|
|
|
|
10.5
|
|
#
|
Veracyte, Inc. Employee Stock Purchase Plan (incorporated by reference to Exhibit 10.1 to the Registrant's Quarterly Report on Form 10-Q for the quarterly period ended June 30, 2015, as amended).
|
|
|
|
|
|
|
10.6
|
|
|
Lease Agreement between Riata Holdings, L.P., as landlord, and the Registrant, as tenant, dated November 28, 2012 (incorporated by reference to Exhibit 10.6 to the Registrant's Registration Statement on Form S-1 (File No. 333-191282), as amended, declared effective on October 29, 2013).
|
|
|
|
|
|
|
10.7
|
|
|
First Amendment to Lease Agreement dated as of January 7, 2014 by and between Riata Holdings, L.P. and the Registrant (incorporated by reference to Exhibit 10.7 to the Registrant's Annual Report on Form 10-K for the year ended December 31, 2013 filed March 20, 2014).
|
|
|
|
|
|
|
10.8
|
|
|
Office Building Lease by and between American Fund US Investments LP and the Registrant dated April 29, 2015 (incorporated by reference to Exhibit 10.2 to the Registrant's Quarterly Report on Form 10-Q for the quarterly period ended June 30, 2015, as amended).
|
|
10.9
|
|
*
|
First Amendment to Office Building Lease dated May 3, 2016 by and between American Fund US Investments LP and the Registrant.
|
|
10.10
|
|
*
|
Second Amendment to Office Building Lease dated February 8, 2017 by and between CRP 6000 Shoreline, L.L.C. and the Registrant.
|
|
|
|
|
|
|
10.11
|
|
#
|
Employment Agreement, dated as of February 15, 2008, between Bonnie Anderson and the Registrant (incorporated by reference to Exhibit 10.10 to the Registrant's Registration Statement on Form S-1 (File No. 333- 191282), as amended, declared effective on October 29, 2013).
|
|
|
|
|
|
|
10.12
|
|
#
|
Amendment to Bonnie Anderson Employment Agreement, dated as of December 22, 2008, between Bonnie Anderson and the Registrant (incorporated by reference to Exhibit 10.11 to the Registrant's Registration Statement on Form S-1 (File No. 333-191282), as amended, declared effective on October 29, 2013).
|
|
|
|
|
|
|
10.13
|
|
#
|
Amendment No. 2 to Bonnie Anderson Employment Agreement, effective as of March 11, 2009, between Bonnie Anderson and the Registrant (incorporated by reference to Exhibit 10.12 to the Registrant's Registration Statement on Form S-1 (File No. 333-191282), as amended, declared effective on October 29, 2013).
|
|
10.14
|
|
#
|
Amended and Restated Change of Control and Severance Agreement, effective as of May 14, 2015, between Bonnie Anderson and the Registrant (incorporated by reference to Exhibit 10.1 to the Registrant's Quarterly Report on Form 10-Q for the quarterly period ended March 31, 2015, as amended).
|
|
|
|
|
|
|
10.15
|
|
#
|
Amended and Restated Change of Control and Severance Agreement, effective as of May 14, 2015, between Christopher Hall and the Registrant (incorporated by reference to Exhibit 10.3 to the Registrant's Quarterly Report on Form 10-Q for the quarterly period ended March 31, 2015, as amended).
|
|
|
|
|
|
|
10.16
|
|
#
|
Amended and Restated Change of Control and Severance Agreement, effective as of May 14, 2015, between Shelly Guyer and the Registrant (incorporated by reference to Exhibit 10.2 to the Registrant's Quarterly Report on Form 10-Q for the quarterly period ended March 31, 2015, as amended).
|
|
|
|
|
|
|
10.17
|
|
#
|
Amended and Restated Change of Control and Severance Agreement, effective as of May 14, 2015, between Julie Brooks and the Registrant (incorporated by reference to Exhibit 10.4 to the Registrant's Quarterly Report on Form 10-Q for the quarterly period ended March 31, 2015, as amended).
|
|
|
|
|
|
|
10.18
|
|
# *
|
Change of Control and Severance Agreement, effective as of February 15, 2017, between Keith Kennedy and the Registrant.
|
90
|
Exhibit Number
|
Description
|
||
|
10.19
|
|
#
|
Offer Letter dated as of April 8, 2013 with Shelly D. Guyer (incorporated by reference to Exhibit 10.17 to the Registrant's Registration Statement on Form S-1 (File No. 333-191282), as amended, declared effective on October 29, 2013).
|
|
|
|
|
|
|
10.20
|
|
#
|
Offer Letter dated as of January 28, 2010 with Christopher M. Hall (incorporated by reference to Exhibit 10.18 to the Registrant's Registration Statement on Form S-1 (File No. 333-191282), as amended, declared effective on October 29, 2013).
|
|
|
|
|
|
|
10.21
|
|
†
|
Pathology Services Agreement dated as of November 12, 2010 between Brazos Valley Pathology, P.A. D/B/A Reitpath and the Registrant (incorporated by reference to Exhibit 10.19 to the Registrant's Registration Statement on Form S-1 (File No. 333-191282), as amended, declared effective on October 29, 2013).
|
|
|
|
|
|
|
10.22
|
|
|
Approval of the Registrant to the Assignment of the Pathology Services Agreement with Brazos Valley Pathology to Thyroid Cytopathology Partners, P.A. as of May 18, 2011 (incorporated by reference to Exhibit 10.20 to the Registrant's Registration Statement on Form S-1 (File No. 333-191282), as amended, declared effective on October 29, 2013).
|
|
|
|
|
|
|
10.23
|
|
|
First Amendment to Pathology Services Agreement dated as of December 19, 2012 between Thyroid Cytopathology Partners, P.A. and the Registrant (incorporated by reference to Exhibit 10.21 to the Registrant's Registration Statement on Form S-1 (File No. 333-191282), as amended, declared effective on October 29, 2013).
|
|
|
|
|
|
|
10.24
|
|
|
Second Amendment to Pathology Services Agreement dated as of January 1, 2014 by and between the Registrant and Thyroid Cytopathology Partners, P.A. (incorporated by reference to Exhibit 10.23 to the Registrant's Annual Report on Form 10-K for the year ended December 31, 2013).
|
|
|
|
|
|
|
10.25
|
|
†
|
Ex-U.S. Co-Promotion Agreement between the Registrant and Genzyme Corporation (incorporated by reference to Exhibit 10.26 to the Registrant's Annual Report Form 10-K for the year ended December 31, 2015, as amended).
|
|
10.26
|
|
|
Credit Agreement dated as of March 25, 2016 by and among Veracyte, Inc. as Borrower, Visium Healthcare Partners, LP, as Administrative Agent, the Guarantors from time to time party thereto and the Lenders from time to time party thereto (incorporated by reference to Exhibit 10.1 to the Registrant’s Quarterly Report on Form 10-Q for the quarterly period ended March 31, 2016).
|
|
10.27
|
|
|
Security Agreement dated March 30, 2016 between Veracyte, Inc. and Visium Healthcare Partners, LP, as Administrative Agent (incorporated by reference to Exhibit 10.2 to the Registrant’s Quarterly Report on Form 10-Q for the quarterly period ended March 31, 2016).
|
|
10.28
|
|
|
Pledge Agreement dated March 30, 2016 between Veracyte, Inc. and Visium Healthcare Partners, LP, as Administrative Agent (incorporated by reference to Exhibit 10.3 to the Registrant’s Quarterly Report on Form 10-Q for the quarterly period ended March 31, 2016).
|
|
10.29
|
|
|
Letter agreement regarding potential opportunity to purchase common equity interests dated March 30, 2016 between Veracyte, Inc. and Visium Healthcare Partners, LP (incorporated by reference to Exhibit 10.4 to the Registrant’s Quarterly Report on Form 10-Q for the quarterly period ended March 31, 2016).
|
|
10.30
|
|
*
|
First Amendment to Credit Agreement dated as of December 14, 2016 by and among Veracyte, Inc. as Borrower, Visium Healthcare Partners, LP, as Administrative Agent, the Guarantors from time to time party thereto and the Lenders from time to time party thereto.
|
|
12.1
|
|
*
|
Statement Regarding Computation of Ratios.
|
|
|
|
|
|
|
23.1
|
|
*
|
Consent of independent registered public accounting firm.
|
|
|
|
|
|
|
24.1
|
|
*
|
Power of Attorney (see the signature page of this Annual Report on Form 10-K).
|
91
|
Exhibit Number
|
Description
|
||
|
|
|
|
|
|
31.1
|
|
*
|
Principal Executive Officer's Certification Pursuant to Section 302 of the Sarbanes-Oxley Act of 2002.
|
|
|
|
|
|
|
31.2
|
|
*
|
Principal Financial Officer's Certification Pursuant to Section 302 of the Sarbanes-Oxley Act of 2002.
|
|
|
|
|
|
|
32.1
|
|
* **
|
Certification Pursuant to 18 U.S.C. § 1350 (Section 906 of the Sarbanes-Oxley Act of 2002).
|
|
|
|
|
|
|
32.2
|
|
* **
|
Certification Pursuant to 18 U.S.C. § 1350 (Section 906 of the Sarbanes-Oxley Act of 2002).
|
|
|
|
|
|
|
101.INS
|
|
|
XBRL Instance Document
|
|
|
|
|
|
|
101.SCH
|
|
|
XBRL Taxonomy Extension Schema
|
|
|
|
|
|
|
101.CAL
|
|
|
XBRL Taxonomy Extension Calculation Linkbase
|
|
|
|
|
|
|
101.DEF
|
|
|
XBRL Taxonomy Extension Definition Linkbase
|
|
|
|
|
|
|
101.LAB
|
|
|
XBRL Taxonomy Extension Label Linkbase
|
|
|
|
|
|
|
101.PRE
|
|
|
XBRL Taxonomy Extension Presentation Linkbase
|
_____________________________________________
|
†
|
Confidential treatment has been granted with respect to certain portions of this Exhibit.
|
|
|
#
|
Indicates management contract or compensatory plan or arrangement.
|
|
|
*
|
Filed herewith.
|
|
|
**
|
In accordance with Item 601(b)(32)(ii) of Regulation S-K and SEC Release No. 34-47986, the certifications furnished in Exhibits 32.1 and 32.2 hereto are deemed to accompany this Form 10-K and will not be deemed "filed" for purposes of Section 18 of the Securities Exchange Act of 1934 (the "Exchange Act") or deemed to be incorporated by reference into any filing under the Exchange Act or the Securities Act of 1933 except to the extent that the registrant specifically incorporates it by reference.
|
|
Copies of the above exhibits not contained herein are available to any stockholder, upon payment of a reasonable per page fee, upon written request to: Chief Financial Officer, Veracyte, Inc., 6000 Shoreline Court, Suite 300, South San Francisco, California 94080.
|
(c)
|
Financial Statement Schedules
|
Reference is made to Item 15(a) 2 above.
92
Not applicable.
SIGNATURES
Pursuant to the requirements of Section 13 or 15(d) of the Securities Exchange Act of 1934, the registrant has duly caused this report to be signed on its behalf by the undersigned, thereunto duly authorized.
|
|
|
VERACYTE, INC.
|
|
|
By:
|
/s/ BONNIE H. ANDERSON
|
||
|
|
Bonnie H. Anderson
Chairman and Chief Executive Officer
|
||
Date:
March 1, 2017
POWER OF ATTORNEY
KNOW ALL PERSONS BY THESE PRESENT, that each person whose signature appears below constitutes and appoints Bonnie H. Anderson and Keith S. Kennedy, and each of them, his true and lawful attorneys-in-fact, each with full power of substitution, for him or her in any and all capacities, to sign any amendments to this annual report on Form 10-K and to file the same, with exhibits thereto and other documents in connection therewith, with the Securities and Exchange Commission, hereby ratifying and confirming all that each of said attorneys-in-fact or their substitute or substitutes may do or cause to be done by virtue hereof.
Pursuant to the requirements of the Securities Exchange Act of 1934, this report has been signed below by the following persons, on behalf of the registrant on the dates and the capacities indicated.
|
Signature
|
|
Title
|
|
Date
|
|
|
|
|
|
|
|
/s/ BONNIE H. ANDERSON
|
Chairman and Chief Executive Officer (Principal Executive Officer)
|
March 1, 2017
|
||
|
Bonnie H. Anderson
|
|
|
||
|
/s/ KEITH S. KENNEDY
|
Chief Financial Officer (Principal Financial and Accounting Officer)
|
March 1, 2017
|
||
|
Keith S. Kennedy
|
|
|
||
|
/s/ JOHN L. BISHOP
|
Lead Independent Director
|
March 1, 2017
|
||
|
John L. Bishop
|
|
|
||
|
/s/ FRED E. COHEN, M.D., D.PHIL.
|
Director
|
|
March 1, 2017
|
|
|
Fred E. Cohen, M.D., D.Phil.
|
|
|||
|
/s/ KARIN EASTHAM
|
Director
|
|
March 1, 2017
|
|
|
Karin Eastham
|
|
|||
|
/s/ ROBERT S. EPSTEIN
|
Director
|
|
March 1, 2017
|
|
|
Robert S. Epstein
|
|
|||
|
/s/ KEVIN K. GORDON
|
Director
|
|
March 1, 2017
|
|
|
Kevin K. Gordon
|
|
|||
|
/s/ EVAN JONES
|
Director
|
|
March 1, 2017
|
|
|
Evan Jones
|
|
|||
|
/s/ TINA S. NOVA, PH.D.
|
Director
|
|
March 1, 2017
|
|
|
Tina S. Nova, Ph.D.
|
|
|||
|
/s/ JESSE I. TREU, PH.D.
|
Director
|
|
March 1, 2017
|
|
|
Jesse I. Treu, Ph.D.
|
|
|||
93
TABLE OF CONTENTS
Part IItem 1. BusinessItem 1A. Risk FactorsItem 1B. Unresolved Staff CommentsItem 2. PropertiesItem 3. Legal ProceedingsItem 4. Mine Safety DisclosurePart IIItem 5. Market For Registrant's Common Equity, Related Stockholder Matters and Issuer Purchases Of Equity SecuritiesItem 6. Selected Financial DataItem 7. Management's Discussion and Analysis Of Financial Condition and Results Of OperationsItem 7A. Quantitative and Qualitative Disclosures About Market RiskItem 8. Financial Statements and Supplementary DataNote 8. Debt (continued)Item 9. Changes in and Disagreements with Accountants on Accounting and Financial DisclosureItem 9A. Controls and ProceduresItem 9B. Other InformationPart IIIItem 10. Directors, Executive Officers and Corporate GovernanceItem 11. Executive CompensationItem 12. Security Ownership Of Certain Beneficial Owners and Management and Related Stockholder MattersItem 13. Certain Relationships and Related Transactions, and Director IndependenceItem 14. Principal Accountant Fees and ServicesPart IVItem 15. Exhibits and Financial Statement SchedulesItem 16. Form 10-k Summary