VONAGE HOLDINGS CORP
10-Ks and 10-Qs
|
|
|
|
|
|
|
|
|
|
|
|
|
|
|
|
|
|
|
|
|
|
|
|
|
|
|
|
|
|
|
|
|
|
|
|
UNITED STATES SECURITIES AND EXCHANGE COMMISSION • WASHINGTON, D.C. 20549
|
FORM 10-K
|
x
|
Annual Report Pursuant to Section 13 or 15(d) of The Securities Exchange Act of 1934
|
or
|
o
|
Transition Report Pursuant to Section 13 or 15(d) of The Securities Exchange Act of 1934
|
||
|
For the fiscal year ended December 31, 2016
|
For the transition period from
to
|
|||||
Commission file number 001-32887
VONAGE HOLDINGS CORP.
(Exact name of registrant as specified in its charter)
|
Delaware
|
11-3547680
|
|
|
(State or other jurisdiction of
incorporation or organization)
|
(I.R.S. Employer Identification No.)
|
|
|
23 Main Street, Holmdel, New Jersey
|
07733
|
|
|
(Address of principal executive offices)
|
(Zip Code)
|
|
Registrant’s telephone number, including area code:
(732) 528-2600
Securities registered pursuant to Section 12(b) of the Act:
|
Title of each class
|
Name of each exchange on which registered
|
|
|
Common Stock, Par Value $0.001 Per Share
|
The New York Stock Exchange
|
|
Securities registered pursuant to Section 12(g) of the Act:
Indicate by check mark if the registrant is a well-known seasoned issuer, as defined in Rule 405 of the Securities Act. Yes
o
No
x
Indicate by check mark if the registrant is not required to file reports pursuant to Section 13 or Section 15(d) of the Act. Yes
o
No
x
Indicate by check mark whether the registrant (1) has filed all reports required to be filed by Section 13 or 15(d) of the Securities Exchange Act of 1934 during the preceding 12 months (or for such shorter period that the registrant was required to file such reports), and (2) has been subject to such filing requirements for the past 90 days. Yes
x
No
o
Indicate by check mark whether the registrant has submitted electronically and posted on its corporate Web site, if any, every Interactive Data File required to be submitted and posted pursuant to Rule 405 of Regulations S-T (§232.405 of this chapter) during the preceding 12 months (or for such shorter period that the registrant was required to submit and post such files). Yes
x
No
o
Indicate by check mark if disclosure of delinquent filers pursuant to Item 405 of Regulation S-K (§229.405 of this chapter) is not contained herein, and will not be contained, to the best of registrant’s knowledge, in definitive proxy or information statements incorporated by reference in Part III of this Form 10-K or any amendment to this Form 10-K.
x
Indicate by check mark whether the registrant is a large accelerated filer, an accelerated filer, a non-accelerated filer or a smaller reporting company. See the definitions of “large accelerated filer”, “accelerated filer” and “smaller reporting company” in Rule 12b-2 of the Exchange Act. Check one:
x
Large accelerated filer
o
Accelerated filer
o
Non-accelerated filer (Do not check if a smaller reporting company)
o
Smaller reporting company
Indicate by check mark whether the registrant is a shell company (as defined in Rule 12b-2 of the Exchange Act). Yes
o
No
x
The aggregate market value of the voting and non-voting common equity held by non-affiliates of the registrant at
June 30, 2016
was
$1,136,593,480
based on the closing price of $6.10 per share.
The number of shares outstanding of the registrant’s common stock as of
January 31, 2017
was
219,678,428
.
Documents Incorporated By Reference
Selected portions of the Vonage Holdings Corp. definitive Proxy Statement, which will be filed with the Securities and Exchange Commission within 120 days after
December 31, 2016
, are incorporated by reference in Part III of this Form 10-K.
VONAGE HOLDINGS CORP.
FORM 10-K
FOR THE FISCAL YEAR ENDED
December 31, 2016
TABLE OF CONTENTS
|
|
|
Page
|
|
PART I
|
||
|
Item 1.
|
||
|
Item 1A.
|
||
|
Item 1B.
|
||
|
Item 2.
|
||
|
Item 3.
|
||
|
Item 4.
|
||
|
PART II
|
||
|
Item 5.
|
||
|
Item 6.
|
||
|
Item 7.
|
||
|
Item 7A.
|
||
|
Item 8.
|
||
|
Item 9.
|
||
|
Item 9A.
|
||
|
Item 9B.
|
||
|
PART III
|
||
|
Item 10.
|
||
|
Item 11.
|
||
|
Item 12.
|
||
|
Item 13.
|
||
|
Item 14.
|
||
|
PART IV
|
||
|
Item 15.
|
||
FORWARD-LOOKING STATEMENTS
VONAGE ANNUAL REPORT 2016
|
FORWARD-LOOKING STATEMENTS
|
This Annual Report on Form 10-K contains statements and other information which are deemed to be “forward-looking” within the meaning of the Private Securities Litigation Reform Act of 1995 (the “Litigation Reform Act”). These forward-looking statements and other information are based on our beliefs as well as assumptions made by us using information currently available.
The words "plan," “anticipate,” “believe,” “estimate,” “expect,” “intend,” “will,” “should” and similar expressions, as they relate to us, are intended to identify forward-looking statements. Such statements reflect our current views with respect to future events, are subject to certain risks, uncertainties, and assumptions, and are not a guarantee of future performance. Should one or more of these risks or uncertainties materialize, or should underlying assumptions prove incorrect, actual results may vary materially from those described in such forward-looking statements or information. In light of the significant uncertainties in these forward-looking statements, you should not place undue reliance on these forward-looking statements. The forward-looking statements and information contained in this Annual Report on Form 10-K relate to events and state our beliefs and the assumptions made by us only as to the date of this Annual Report on Form 10-K. We do not intend to update these forward-looking statements, except as required by law.
In accordance with the provisions of the Litigation Reform Act, we are making investors aware that such forward-looking statements, because they relate to future events, are by their very nature subject to many important factors that could cause actual results to differ materially from those contemplated by the forward-looking statements contained in this Annual Report on Form 10-K, any exhibits to this Form 10-K and other public statements we make. Such factors include, but are not limited to: the competition we face; the expansion of competition in the cloud communications market; our ability to adapt to rapid changes in the cloud communications market; the nascent state of the cloud communications for business market; our ability to retain customers and attract new customers; the risk associated with developing and maintaining effective internal sales teams and effective distribution channels; risks related to the acquisition or integration of businesses we have acquired; security breaches and other compromises of information security; risks associated with sales of our services to medium-sized and enterprise customers; our reliance on third party hardware and software; our dependence on third party facilities, equipment, systems and services; system disruptions or flaws in our technology and systems; our ability to scale our business and grow efficiently; our dependence on third party vendors; the impact of fluctuations in economic conditions, particularly on our small and medium business customers; our ability to comply with data privacy and related regulatory matters; our ability to obtain or maintain relevant intellectual property licenses; failure to protect our trademarks and internally developed software; fraudulent use of our name or services; intellectual property and other litigation that have been and may be brought against us; reliance on third parties for our 911 services; uncertainties relating to regulation of VoIP services; risks associated with legislative, regulatory or judicial actions regarding our CPaaS products; the impact of governmental export controls or sanctions on our CPaaS products; our ability to establish and expand strategic alliances; risks associated with operating abroad; risks associated with the taxation of our business; risks associated with a material weakness in our internal controls; our dependence upon key personnel; governmental regulation and taxes in our international operations; liability under anti-corruption laws; our dependence on our customers' existing broadband connections; differences between our services and traditional telephone service; restrictions in our debt agreements that may limit our operating flexibility; foreign currency exchange risk; the market for our stock; our ability to obtain additional financing if required; any reinstatement of holdbacks by our credit card processors; our history of net losses and ability to achieve consistent profitability in the future; and other factors that are set forth in the “Risk Factors” section and other sections of this Annual Report on Form 10-K, as well as in our Quarterly Reports on Form 10-Q and Current Reports on Form 8-K.
|
FINANCIAL INFORMATION PRESENTATION
|
For the financial information discussed in this Annual Report on Form 10-K, other than per share and per line amounts, dollar amounts are presented in thousands, except where noted. All trademarks are the property of their owners.
1 VONAGE ANNUAL REPORT 2016
ITEM 1.
Business
|
OVERVIEW AND STRATEGY
|
We are a leading provider of cloud communications services for businesses and consumers. Our business services transform the way people work and businesses operate through a portfolio of communications solutions that enable internal collaboration among employees, while also keeping companies closely connected with their customers, across any mode of communication, on any cloud-connected device. Vonage customers can choose among or combine two separate service delivery options to suit their specific cloud communication needs. They can buy Vonage Business as a subscription and they can buy our Vonage API Platform and consume our cloud communication as a service product as programmable modules, delivered via application program interfaces (“APIs”). We also provide a robust suite of feature-rich residential communication solutions.
Business
For our Business customers, we provide innovative, cloud-based Unified Communications as a Service, or UCaaS, solutions, comprised of integrated voice, text, video, data, collaboration, and mobile applications over our flexible, scalable Session Initiation Protocol (SIP) based Voice over Internet Protocol, or VoIP, network. Through our acquisition of Nexmo in 2016, we also offer Communications Platform as a Service, or CPaaS, solutions designed to enhance the way businesses communicate with their customers by embedding communications into apps, websites and business processes. In combination, our products and services permit our business customers to communicate with their customers and employees through any cloud-connected device, in any place, at any time without the often costly investment required with on-site equipment. We have a robust set of product families tailored to serve the full range of the business value chain, from the small and medium business, or SMB, market, through mid-market and enterprise markets. We provide customers with multiple deployment options, designed to provide the reliability and quality of service they demand. We provide customers the ability to integrate our cloud communications platform with many cloud-based productivity and CRM solutions, including Google’s G Suite, Zendesk, Salesforce’s Sales Cloud, Oracle, and Clio.
Our Business strategy is to support the full range of business customers, using two product families: Vonage Essentials, based on our proprietary call processing platform that is purpose-built for SMB and mid-market customers; and Vonage Premier, based on Broadsoft’s call processing platform in combination with other Vonage cloud based solutions, which serves larger customers, from mid-market businesses through large enterprises. We also organized our salesforce to address the full business market. We believe operating two platforms at scale enables us to deliver the right products and solutions to address the needs of diverse customers while maximizing our subscriber economics, regardless of segment served. Revenues are generated primarily through the sale of subscriptions for our UCaaS services. Our revenue generation efforts are focused on customer acquisition and retention as well as providing additional services to existing customers as they grow and scale.
Our diverse customer base spans a wide variety of industries, including manufacturing, automotive, legal, information technology, financial services, construction, real estate, engineering, healthcare, and non-profit.
Vonage Essentials.
Vonage Essentials customers subscribe to our cloud-based communication services, delivered through our proprietary platform that is purpose-built for SMB and mid-market
customers. Essentials provides a cost-effective, scalable, feature-rich solution, delivered over-the-top of a customer’s broadband, typically month-to-month without a commitment. Vonage Essentials is sold primarily through our direct telesales and online channels, and is increasingly sold through our channel partners and field sales teams. We believe the strength of the Vonage brand directly contributes to a lower-cost customer acquisition model and provides attractive subscriber economics.
Vonage Premier.
Our Vonage Premier offerings are tailor-made for the large mid-market and enterprise segments. Vonage Premier is a feature-rich/fully managed solution that utilizes Broadsoft Inc.’s ("Broadsoft") enterprise-grade call processing platform, in combination with other cloud services like advanced contact center, video conferencing and speak2dial, and can be provided with high-level quality of service ("QoS"), which is generally delivered over our national MPLS network, with 21 network Points of Presence (POPs) across the country. Vonage can also provide QoS-level quality over-the-top of the customer’s broadband through our Smart-WAN router solution. Customers value our proprietary provisioning and feature-management tool, named Zeus, which enables the rapid deployment of solutions directly by Vonage while giving full visibility to our channel partners and our customers. Further differentiating Vonage is our robust service delivery team comprised of team members specializing in project management, voice and data provisioning, and line number porting. This team is intensely focused on providing an outstanding customer experience, and is rapidly becoming a competitive differentiator.
Our Vonage Premier offering is sold primarily through our channel partners, and our field and enterprise sales teams, and generally requires a three-year contract. We are a preferred provider for many of the largest master agents in the country, harnessing a network of over 20,000 sub agents selling both Vonage Premier and Vonage Essentials. We believe we have one of the largest multi-channel distribution sales platforms in our industry to serve the full range of business customers. We plan to capitalize on the growing adoption of cloud-based communications and collaboration solutions by continuing to expand our salesforce, expand into new markets, and enhance our relationships with existing customers to provide additional functionality and overall business value that can be achieved with our UCaaS platform.
Nexmo, the Vonage API Platform
. We are a global leader in the CPaaS segment of the cloud communications market, providing innovative communication APIs for text messaging and voice communications, allowing developers and enterprises to embed contextual communications into mobile apps, websites and business workflows via text, social media, chat apps and voice. With just few lines of code, developers can send and receive text messages and build programmable voice applications. Nexmo, the Vonage API Platform can scale from one API call to billions. The platform makes it easy for any of our over 200,000 developers to access communication services via software and APIs. Through Nexmo we have a global network of interconnected carriers delivering our API-based communications platform, enabling businesses to communicate with their customers reliably and with ease, no matter where in the world they are located. The addition of our Nexmo products to our Business offering allows our customers to address their full communications needs, from employee to employee communications through business to customer communications.
Consumer
For our Consumer customers, we enable users to access and utilize our services and features, via a single “identity,” either a number or user name, regardless of how they are connected to the Internet, including over 3G, LTE, Cable, or DSL broadband networks. This
2 VONAGE ANNUAL REPORT 2016
technology enables us to offer our Consumer customers attractively priced voice and messaging services and other features around the world on a variety of devices.
Our Consumer strategy is focused on the continued penetration of our core North American markets, where we will continue to provide value in international long distance and target under-served ethnic segments. The markets for international long distance allow us to leverage our VoIP network by providing customers a low-cost and feature-rich alternative to services offered by telecom, cable, and international calling card providers.
We generate revenue through the acquisition and retention of Consumer customers. We are focused on optimizing the Consumer business for profitability to improve the strong cash flows of the business. During 2016, we continued our disciplined focus on marketing efficiency by shifting customer acquisition spend to our higher performing channels, improving the quality of customers we acquire and driving lower churn, all of which drive higher customer life-time value. This focus has led to a reallocation of marketing spend to our Business segment.
The result of these initiatives has been to create a strong cash flow business which provides financial stability, as well as cost synergies and structural advantages to our Business segment.
Services outside of the United States
. We currently have UCaaS and consumer operations in the United States, United Kingdom, and Canada and believe that our low-cost Internet based communications platform enables us to cost effectively deliver voice and messaging services to other locations throughout the world. Through Nexmo, we have operations in the United States, United Kingdom, Hong Kong, and Singapore, and provide CPaaS solutions to our customers located in many countries around the world.
Information on our revenues, operating income, and identifiable assets appears in Note 1 to our consolidated financial statements included in Item 8 hereof.
We had approximately
2.3 million
combined consumer subscriber lines and business seats as of
December 31, 2016
. Customers in the United States represented
91%
of our consolidated revenues at
December 31, 2016
, with the balance in Canada, the United Kingdom, and other countries.
|
SERVICE OFFERINGS
|
Business
We provide a robust feature-rich range of communication services enabling businesses to interact with their customers, prospects and partners in a more efficient and effective manner. We provide services ranging from basic dial tone to services such as call queue, conferencing, call groups, mobile functionality, CRM integration, and detailed analytics - allowing our customers a high level of visibility into their business at prices that are often significantly lower than that of traditional on premises solutions. These services can be delivered over-the-top of the customers’ existing connectivity or bundled through our private MPLS connectivity service. Today more than over 638,000 business seats rely on Vonage to meet their communication needs, putting Vonage in a leading position within the UCaaS space. Our services are delivered through either proprietary networks or through trusted third parties to ensure our offerings provide all of the critical functions business needed for one of their most important business tools.
Vonage Essentials
. Vonage Essentials is targeted to smaller customers and utilizes our proprietary call processing platform, which is purpose built for SMB customers to deliver cloud-based communication services. It provides a cost-effective, scalable, feature-rich solution, delivered over-the-top of a customer’s broadband. We offer a number of service plans which include basic metered extensions to unlimited calling plans. Our standard lines come fully functional with numerous standard features. Unlimited Extensions is our most popular business service plan. Under this plan businesses can make flat rate, unlimited domestic calls (U.S. and Canada) each month. As of
December 31, 2016, over 95% of our business customers were on an unlimited usage domestic calling plan. SMBs may also choose metered extension plans under which they are charged per-minute usage for both domestic and international calls. This plan is primarily used by customers with temporary or seasonal workers to save resources where phones are not heavily used during the workday.
Our standard features include: Admin Portal, Call Announce, Call Continuity, Call Screening, Call Waiting, Caller ID, Directory Assistance (411), Dynamic Caller ID, Emergency Assistance (911), Do Not Disturb, Multiple Devices on One Extension, Set Caller ID, Seven-Digit Dialing, Voicemail, Call Continuity, Work From Anywhere, Cell Phone Integration, Vonage Business Mobile, Never Miss a Call, Web Portal Interface, and Call Pass.
In addition to our standard functionality we have a number of add-on services for an additional monthly fee, including: Paperless Fax, Call Group, Call Queue, Conference Bridge, Main Company Number, Toll Free Number, Local or Geographic Number, Voicemail Transcription, On-Demand or Company Call Recording Service, Call Monitoring Services with Listen, Whisper and Barge, and Paging Groups.
All of our Vonage Essentials offerings allow free access to our mobile application. The mobile application allows users to choose WiFi, 3G and 4G and the extended features provide caller ID as if the user were calling from their office. Additional features include the ability to update account profiles, manage devices, and contact call logs directly from their mobile devices. We also offer virtual extensions, which connects employees to a business phone number through their mobile phones. A virtual extension is an additional dedicated direct dial number forwarded to the employee's mobile phone number, allowing employees to be reached from anywhere.
Vonage Premier.
Vonage Premier is a purpose-built cloud based platform for mid-market and enterprise customers, providing a complete set of enhanced unified communication and collaboration services, including: voice, data, video, mobile and contact center services. We focus on customers for whom guaranteed quality of service and uniformity of services across all locations is critical. We deliver services to this customer base over our private, nationwide, fully redundant, secure IP MPLS network using 21 network POPs that allow us to deliver dedicated, secure and private bandwidth utilizing all forms of last mile technologies including T1, NxT1, EoC and Fiber and bandwidth ranging from 1.5Mbps to 1Gbps. Services we deliver include Wide Area Networking (WAN), Internet Access, MPLS VPN, Managed Firewall, Hosted UCaaS, Hosted Video Conferencing, Web Collaboration, Secure Instant Messaging & Presence, Mobility and Fixed Mobile Convergence, and Hosted Contact Center.
Vonage Premier services include advanced features such as Single Number Reach (which provides each user one number, available over numerous devices including desk phones, tablets and smartphones), Shared Line Appearance, Busy Lamp Field, Phone Paging, Outlook Integration, IM, Presence, and Video. Vonage also delivers Session Initiation Protocol (SIP) Trunking, over the same network, to customers using premises PBXs, with the ability to overlay UCaaS features where the premises PBX is deficient or for disaster recovery and business continuity requirements. This product also supports a hybrid deployment where some locations may be fully hosted and others may continue to use the premises PBX. Vonage Premier customers also have the ability to utilize our gUnify middleware layer to integrate communications with the core, Software-as-a-Service (SaaS)-based business applications that companies use as part of their every-day workflow, such as Google for Work, Salesforce, Zendesk, and others.
Vonage Premier customers also receive access to a custom-built portal through which they can fully administer all services, online bill pay, manage trouble tickets, manage bandwidth and services, access detailed Call Analytics, and execute Moves, Adds and Changes.
Nexmo, the Vonage API Platform
. We are a global leader in the CPaaS segment of the cloud communications market, providing innovative communication APIs for text messaging and voice communications, allowing developers and enterprises to embed
3 VONAGE ANNUAL REPORT 2016
contextual communications into mobile apps, websites and business workflows via text, social media, chat apps and voice. With just few lines of code, developers can send and receive text messages and build programmable voice applications. Nexmo, the Vonage API Platform can scale from one API call to billions. The platform makes it easy for any of our over 200,000 developers to access communication services via software and APIs. Through Nexmo we have a global network of interconnected carriers delivering our API-based communications platform, enabling businesses to communicate with their customers reliably and with ease, no matter where in the world they are located. The addition of our Nexmo products to our Business offering allows our customers to address their full communications needs, from employee to employee communications through business to customer communications.
Consumer
Our home telephone replacement services are offered to customers through several service plans with different pricing structures. The service plans include basic features such as voicemail, call waiting, and call forwarding as well as unique features such as Simulring, Visual Voicemail and Extensions. We also charge for local and international calling outside of plan limits.
We have two primary Consumer offerings: Vonage World and Vonage North America. For a flat monthly fee, Vonage World customer plans include unlimited domestic calling (U.S., Canada, and Puerto Rico) and unlimited calling to landline phones in more than 60 countries, including India, Mexico, and China, and unlimited calling to mobile phones in certain of those countries. The Vonage North America plan includes unlimited calling across the U.S., Canada, Mexico and Puerto Rico. Each of our Consumer calling plans provides a number of basic features including call waiting, caller ID with name, call forwarding, and voicemail. Our plans also include unlimited Vonage Visual Voicemail, which is “readable voicemail” delivered via email or SMS text message, Vonage Extensions, which extends the plan, and in-bound calling, to additional phone numbers and devices, and selective call block, which allows users to block unwanted calls. We also offer, in some cases for additional fees, features such as area code selection, virtual phone number, and web-enabled voicemail.
Our mobile services include enhancements to our Consumer calling plans as well as mobile applications that can be initially downloaded for iPhone ® , iPad ® , iPod touch ® , and Android ® OS devices for free.
In order to access our consumer services, a customer need only connect a standard telephone to a broadband Internet connection through a small Vonage-enabled device. In order to access our business services, a customer need only connect through a VoIP-enabled telephone. After connecting the device, our customers can use their telephone to make and receive calls. Vonage-enabled devices allow customers to use the Internet connection for their computer and telephones at the same time while ensuring a high quality calling experience. We also offer a cordless multi-phone system solution. Our plug-and-play Vonage-enabled devices permit portability as customers can take their Vonage device to different locations where broadband service is available. We generally have not charged new customers for the adapters permitting use of our service.
|
NETWORK OPERATIONS
|
The Vonage network uses our customer’s existing or Vonage procured high-speed broadband Internet service to allow calls over the Internet either from a standard telephone through a Vonage-enabled device or through soft phone software or mobile client applications. Our UCaaS services are not dependent on any specific type or provider of Internet service, and our customers are free to change their Internet service provider in response to a competitive alternative, or because they have moved to a different location. For many of our Vonage Premier customers, our UCaaS services are delivered over the Company's private, nationwide, fault tolerant, secure IP MPLS network under multi-year contracts to provide the high level of interconnection quality and
the ability to offer service level agreements (SLA) guaranteeing certain levels of voice service performance.
Our network is scalable and geographically distributed for robustness, high availability, and reliability across multiple call processing sites, using regional data interconnection points, where calls to non-Vonage customers are interconnected with the public switched telephone network. We periodically assess the locations of our regional data connection points in connection with efforts to improve the quality of and efficiency in delivering our service. Our interconnections with the public switched telephone network, or IP/SIP networks, are made pursuant to commercial agreements we have with several telecommunications providers. Under these agreements, we transfer calls originated by our customers to other carriers who connect the call to the called party or connect peer to peer. We have a varying degree of settlement arrangements with our carrier partners for indirect third party or direct termination of our calls. The calls are routed from our network to other carriers’ interconnected circuits at co-location facilities in which we lease space. This method of connecting to the public switched telephone or IP/SIP networks allows us to expand capacity quickly, as necessary to meet call volume, and to provide redundancy within our network.
Because Vonage’s system is standards based and not constrained to use any specific broadband service provider to connect to our customers, we can centrally manage and share resources across our customer base to minimize capital investment when entering new markets.
The following are also important in supporting our network operations:
•
Network Operations Center
. We currently maintain a network operations center at our headquarters with monitoring redundancies at several points within our network. The network operations center monitors and manages the status and health of our network elements, allowing us to manage our network in real time, respond to alert notifications, and re-route network traffic as needed. We pursue a multi-faceted approach to managing our network to ensure high call quality and reliable communications services to our customers. For Business customers, we have operational centers on-site to monitor and manage network access traffic. We may consolidate these network operations centers in the future if greater efficiencies can be obtained.
•
Back Office Systems
. In addition to our network management systems, we have developed a number of software systems that enable us to manage our network and service offerings more efficiently and effectively. Key aspects of these systems include:
◦
Network Quality Metrics
. We have implemented a suite of advanced Big Data analysis tools that allow us to monitor and troubleshoot the performance of our calling and data network, customer premises equipment, and other associated calling elements in near real-time. This suite is proprietary and was developed specifically to address the needs that Vonage has in monitoring, analyzing, understanding, troubleshooting, maintaining, and operating a world-class consumer VoIP platform.
◦
Web Portal
. We provide a fully functional customer Web portal that allows our customers to configure and manage almost all aspects of their service on the Internet without requiring intervention of a customer-care representative. The portal permits customers to add and change features and phone numbers, update billing information, and access call usage and billing details.
◦
Emergency Calling Service and Enhanced 911 Service
. We have deployed E-911 service to approximately 99.99% of our U.S. consumer and small and home office customer base that is comparable to the emergency calling services provided to customers of traditional wireline telephone companies in the same area. Our E-911 service does not support the calls of our soft phone software users. The emergency calls of our soft phone software users are supported by a national call center. Not all Vonage products require 911 service capabilities, such as our mobile client products but we are fully compliant with E911 requirements of the Federal Communications Commission ("FCC") for VOIP Interconnected providers. To enable us to effectively
4 VONAGE ANNUAL REPORT 2016
deploy and provide our E-911 service, we maintain an agreement with a provider that assists us in delivering emergency calls to an emergency service dispatcher at the public safety answering point, or PSAP, in the area of the customer’s registered location and terminating E-911 calls. We also contract for the national call center that operates 24 hours a day, seven days a week to receive certain emergency calls and for the maintenance of PSAP databases for the purpose of deploying and operating E-911 services. The databases include contact, technical infrastructure, boundary, and routing information for delivery of calls to a PSAP or emergency service providers in the United States.
•
Local Number Portability
. Our system allows our telephone replacement customers to port telephone numbers, which allows new customers to retain their existing telephone numbers when subscribing to our services. We rely on agreements with two service providers to facilitate the transfer of customer telephone numbers. In addition, we have engaged a provider that performs the third party verification of pertinent local number portability information from our subscribers prior to porting a customer from a local telephone company to us.
•
Security
. We have developed a service architecture and platform that uses industry-standard security techniques and allows us to remotely manage customer devices. Any Vonage-enabled device used by our customers can be securely managed by us, and these devices use authentication mechanisms to identify themselves to our service in order to place and receive calls. We regularly update our protocols and systems to protect against unauthorized access. As discussed in "Item 1A Risk Factors", security breaches and other cybersecurity or technological risks could compromise our information, systems and network and expose us to liability, which could have a material adverse effect on our business, financial condition, and operating results.
|
MARKETING
|
Our marketing objective is to help drive growth and revenue across our business and consumer markets. We employ an integrated multi-channel approach to marketing, whereby we evaluate and focus our efforts on efficient marketing vehicles to accomplish our goals with the greatest return on investment. To do this, we make use of both broad-reaching and highly-targeted media channels.
For our business customers, our primary source of lead acquisition is digital marketing in the form of search engine marketing, digital advertising, social media advertising, and affiliate programs. We also utilize database marketing and lead aggregators to source business leads. We have a significant strategy of using third-party and proprietary events to source business leads and convert prospects.
For our residential customers, we have highly optimized our acquisition approach and focus mainly on digital advertising channels.
We make use of marketing research to gain consumer insights into brand, product, and service performance, and utilize those learnings to improve our messaging and media plans. Market research is also leveraged in the areas of testing, retention marketing, and product marketing to ensure we bring compelling products and services to market for our customers.
We believe our brand is a meaningful factor for customers as they consider business services. We invest in our brand in order to retain and expand our customer base and to position Vonage as a technology leader that delivers innovative, unified communication services, serving the full range of businesses and Enterprises. We expect these investments to continue as we further establish Vonage as a leading business services brand.
|
SALES AND DISTRIBUTION
|
Inside Sales
Customers can subscribe to our consumer services at our websites, http://www.vonage.com, http://www.vonage.ca, http://www.vonage.co.uk and several affiliate websites, or through multiple toll free numbers including 1-877-4VONAGE. Business customers can subscribe to our services at our websites, including https://business.vonage.com/, http://www.vonagebusiness.com, https://enterprise.vonage.com, and https://www.nexmo.com, or through toll free numbers including 1-877-862-2562 and 1- 855-593-7326.
Field Sales
We utilize our team of over 145 sales agents, primarily based in geographic territories comprising customers and prospects, which we refer to as our field sales team, to market and sell our business services. These field sales agents utilize a consistent, automated, highly-structured sales process to effectively educate prospective customers regarding our services. We have developed a scalable model applicable to both existing and new markets. We now have sales offices throughout the United States,.
Channel Sales
In addition to inside sales and our field sales team, we also have a dedicated team focused on channel sales who work with our channel partners to market and sell our business services, which helps to broaden our sales distribution. In 2016, we continued to develop and expand this channel program by adding new senior management, channel managers, and additional national master agents. We now have a broad and deep coverage of the U.S. market through a network of over 20,000 sub agents and resellers.
Enterprise Sales
In order to continue to expand in the Enterprise segment, which we define as businesses larger than 1,000 seats, Our enterprise sales organization is uniquely positioned to provide high quality business services for Enterprise, through our fully managed solution, which utilizes BroadSoft’s enterprise-grade call processing platform, with a broad portfolio of products delivered over our own private, national MPLS network, with 21 Points-of-Presence (POPs) across the country and our own team of service delivery project managers using our proprietary provisioning tool Zeus, as well as our industry leading CPaaS products.
Retail Sales
In addition to our inside sales channel, we also offer our consumer services through our retail channel. In 2016, as part of our continued efforts to lower customer acquisition costs, we shifted our retail strategy to a grab-and-go strategy within large retailers to better leverage the strength of the Vonage brand. We believe that the availability of our services through premier retailers, with well-located shelf placement increases our ability to acquire mainstream consumers by reaching them in a familiar and interactive shopping environment. National and regional retailers provide Vonage with a wide footprint to distribute our service. Concurrently, we have also reduced our use of the assisted-selling face-to-face channel, which had a higher customer acquisition cost.
Customer Support
Consumer.
We offer our customers support 24 hours a day, seven days a week through both our comprehensive online account management website and our toll free number. Many customers use our self-service website when they have a question or problem with their service and are able to resolve their concerns online without needing to speak to a customer care representative. Our customers can manage almost all aspects of their accounts online. This capability empowers our customers through self-service and reduces our customer care expenses.
5 VONAGE ANNUAL REPORT 2016
Customers who cannot or do not wish to resolve their questions through our website may contact a customer care representative through our toll free number. We staff our customer care organization through a combination of our own employees and outsourced customer care representatives. All new customer care representatives are trained through an established program developed by Vonage. We also have a separate team that provides advanced technical support for resolving customers’ complex issues. We use extensive monitoring of call quality and customer satisfaction scores to determine additional training or coaching requirements for individual associates and to drive continuous improvement in our processes, policies, and technology. We offer support in English, Spanish, Tagalog and French Canadian.
Small and Medium Businesses.
We have specialized teams of customer care representatives to work with customers in every stage of their life cycle, including porting specialists to transfer (port) existing phone numbers, an order entry team to help customers bring their new phone system online, as well as billing and product specialists. Customers can also utilize our extensive online support resources, complete with cataloged feature descriptions, how-to videos and other key resources to help them enable the many system features.
Additionally, our representatives have ready access to a full support team - from technical support pros and billing specialists, to engineers and product experts.
Medium and Large Enterprise.
Our larger business customers benefit from a robust service delivery team comprised of team members specializing in project management, voice and data provisioning, and line number porting.
Billing
All customer billing for our communication services is automated. We bill in advance for monthly recurring services and fees. We collect all fees from our customers’ credit card, debit card, checks, wire transfer, ACH or electronic check payment (“ECP”). All usage related charges are billed no more than 30 days in arrears. By collecting monthly subscription fees in advance and certain other charges within the same billing cycle as they are incurred, we are able to reduce the amount of accounts receivable that we have outstanding, thus allowing us to have lower working capital requirements. Collecting in this manner also helps us mitigate bad debt exposure, which is recorded as a reduction to revenue. If a customer’s payment is declined or returned we generally suspend services. Historically, in most cases, we are able to correct the problem with the customer within the current monthly billing cycle. Generally, for our consumer services, if the customer’s credit card, debit card or ECP cannot be successfully processed during three billing cycles (i.e. the current and two subsequent monthly billing cycles), we terminate the account. For customers in grace or suspend status we have enabled one-time cash payments through an arrangement with MoneyGram. Generally, for our Essentials customers, we will make several attempts to collect payment. If after approximately fifteen days we have not successfully collected the balance due, the customer’s account services are suspended. If after 30 days the account is still in a suspended status, the account is cancelled. Generally, for our Premier customers, if after 60 days we have not successfully collected the balance due, the customer’s account services are suspended. If after seven additional days the account is still in a suspended status, the account in cancelled. For our Nexmo customers, we require prepayment from our smaller customers. For Nexmo's larger customers we issue invoices in arrears for usage. For Nexmo's postpaid customers, we review customers on a case by case basis before suspending or terminating services.
|
INTELLECTUAL PROPERTY
|
We believe that our technological position depends primarily on the experience, technical expertise, and creative ability of our employees. We routinely review our technological developments with our technology staff and business units to identify the aspects of our technology that provide us with a technological or commercial advantage and seek intellectual property (including patent) protection
as appropriate to protect such key proprietary technology in the United States and internationally, based on our assessment in light of applicable law. Our company policies require our employees to assign intellectual property rights developed in the scope of or in relation to our business to us and to treat proprietary know-how and materials as our confidential information.
In addition to developing technology and intellectual property, from time to time we evaluate opportunities for potential licensing and acquisition of third-party technology and intellectual property that may provide us with a strategic or commercial advantage in exchange for royalties or other consideration. As a result of these efforts, we have acquired multiple U.S. and foreign patents, and obtained licenses to numerous other patents. From time to time we receive letters from third parties inviting us to obtain patent licenses that might be relevant to our business. From time to time, we also have become involved in litigation alleging that our products or services infringe on third party patents or other intellectual property rights. See “Item 3. - Legal Proceedings-IP Matters.”
We are the owner of numerous United States and international trademarks and service marks and have applied for registration of our trademarks and service marks in the United States and abroad to establish and protect our brand names as part of our intellectual property strategy. Examples of our registered marks include Vonage®, Vonage Mobile®, Vonage Extensions®, and Nexmo ®.
We endeavor to protect our internally developed systems and technologies and maintain our trademarks and service marks. Typically, we enter into confidentiality agreements with our employees, consultants, partners, customers, and vendors in an effort to control access to and dissemination of our technology, software, business plans, documentation, and other proprietary information and trade secrets.
|
COMPETITION
|
We face continued strong competition from traditional telephone companies, cable companies, wireless companies, alternative communication providers, direct unified communications providers, legacy consumer VOIP businesses, large technology incumbents, and collaboration providers in the consumer, mobile, SMB and enterprise markets. Because most of our target customers are already purchasing communications services from one or more of these providers, our success is dependent upon our ability to attract these customers away from their existing providers. We believe that the principal competitive factors affecting our ability to attract and retain customers are price, call quality, brand awareness, customer service, network and system reliability, service features and capabilities, scalability, usability, simplicity and mobile integration.
Traditional telephone and cable companies
The traditional telephone and cable companies are our primary competitors for our broadband telephone services. Traditional telephone companies in particular have historically dominated their regional markets. These competitors include AT&T, Verizon and CenturyLink, as well as rural incumbents such as Frontier Communications. Cable company competitors include companies such as Altice, Charter Communications, Comcast Corporation, and Cox Communications. These traditional phone and cable company competitors are substantially larger and better capitalized than we are and have the advantage of a large existing customer base. Many of these competitors are continuing to make substantial investments in delivering broadband Internet access, VoIP phone service, and cable television to their customers and they often have larger product development and marketing budgets than us. Providing home phone, Internet access, and cable television to many of our existing and potential customers may enhance their image as trusted providers of services.
The traditional phone and cable companies own networks that include a “last mile” connection to substantially all of our existing and potential domestic customers as well as the places our customers
6 VONAGE ANNUAL REPORT 2016
call domestically. As a result, the vast majority of the calls placed by a Vonage customer are carried over the “last mile” by a traditional phone company, and we indirectly pay access charges to these competitors for each of these calls. In contrast, traditional wireline providers do not pay us when their customers call our customers.
Cable companies and, in many cases traditional phone companies, are also aggressively using their existing customer relationships to bundle services. For example, they bundle Internet access, cable television, and home phone service with an implied price for the phone service that may be significantly below ours. In addition, such competitors may in the future require new customers or existing customers making changes to their service to purchase voice services when purchasing high speed Internet access. Certain traditional phone companies are also able to bundle wireless telephone service. Many of these competitors are able to advertise on their local access channels with no significant out-of-pocket cost and through mailings in bills with little marginal cost. They also receive advertising time as part of their relationships with television networks and are able to use this time to promote their telephone service offerings.
Traditional phone and cable companies’ ownership of Internet connections to our customers could enable them to detect and interfere with the completion of our customers’ calls. While we are not aware of any such occurrence, it is unclear whether current regulations would permit these companies to degrade the quality of, give low priority to or block entirely the information packets and other data we transmit over their lines. In addition, these companies may attempt to charge their customers more for using our services.
Many traditional phone and cable companies routinely send technicians to customers’ premises to initiate service. Although this is expensive, it also can be more attractive to customers than installing their own router. In addition, these technicians may install an independent source of power, which can give customers assurance that their phone service will not be interrupted during power outages.
The traditional phone and cable companies have long-standing relationships with regulators, legislators, lobbyists, and the media. This can be an advantage for them because legislative, regulatory or judicial developments in our rapidly evolving industry could have a negative impact on us.
In many cases, we charge prices that are lower than prices charged by the traditional phone and cable companies. We believe that we also currently compete successfully with the traditional phone and cable companies on the basis of the features we offer that they may not (such as area code selection, portable service, virtual phone numbers, and readable voice mail). We offer many of these features at no extra charge.
Wireless telephone companies
We also compete with wireless phone companies, such as AT&T, Sprint, T-Mobile, and Verizon Wireless, for both our broadband telephone services, international long distance, and our mobile services. Some consumers use wireless phones, instead of VoIP phones, as a replacement for a wireline phone. Also, wireless phone companies increasingly are providing wireless broadband Internet access to their customers. As wireless providers offer more minutes at lower prices and other services that improve calling quality, their services have become more attractive to households as a competitive replacement for wireline service. In addition, wireless providers are also offering standalone wireless home services as well as the ability to link multiple devices for telephony service. Wireless telephone companies have a strong retail presence and have significant financial resources. We are developing next-generation services to meet the emerging needs of mobile and other connected device users by delivering easy-to-use applications that provide significant cost savings in large existing markets. We believe that our efforts will capitalize on favorable trends including the proliferation of low or no-cost Wi-Fi and other broadband around the world, accelerating smart phone adoption rates, and the growth of social communities.
Alternative communications providers
We also compete against alternative communication providers such as Twilio, magicJack, Ooma, Skype, and WhatsApp, some of which are larger than us and have the ability to devote greater resources to their communications services. Some of these service providers, including Internet product and software companies, have chosen to sacrifice telephony revenue in order to gain market share or attract users to their platform and have offered their services at low prices or for free. While not all of these competitors currently offer the ability to call or be called by anyone not using their service, line portability, E911 service, and customer service, in the future they may integrate such capabilities into their service offerings. As we continue the introduction of applications that integrate different forms of voice, video, messaging, and other services over multiple devices, we face competition from emerging competitors focused on similar integration, as well as from alternative communication providers.
There is a continuing trend toward consolidation of competitive companies, including the acquisition of alternative communication providers by Internet product and software companies with significant resources. In addition, certain of our competitors have partnered and may in the future partner with other competitors to offer products and services, leveraging their collective competitive positions. We also are subject to the risk of future disruptive technologies, which could give rise to significant new competition.
In connection with our international long distance business, we face competition from low-cost international calling cards and VoIP providers in addition to traditional telephone companies, cable companies, and wireless companies.
In connection with our cloud communications products, we face competition from the traditional telephone and cable companies discussed above, as well as from vendors of premises-based solutions and/or hosted solutions, including the following:
•
Independent cloud services providers such as Twilio, EvolveIP, Jive, Mitel, RingCentral, ShoretelConnect, Fuse Networks, West Unified Communications Services, and 8x8;
•
Premises-based business communication equipment providers such as Alcatel-Lucent, Avaya, Cisco, Huawei, Interactive Intelligence, Mitel, NEC, Shoretel, and Unify;
•
Hosted communication services providers based on technologies from Avaya, Broadsoft, Cisco, Microsoft, Mitel, Unify and other vendors of technology platforms;
•
Traditional technology companies such as Microsoft and Google; and
•
Emerging competitors in technology companies such as Amazon, Salesforce, and Facebook.
As the cloud communications market evolves, and the convergence of voice, video, messaging, mobility and data networking technologies accelerates, we may face competition in the future from companies that do not currently compete in the market, including companies that currently compete in other sectors, companies that serve consumer rather than business customers, or companies which expand their market presence to include cloud communications.
|
SEGMENT INFORMATION
|
ASC 280 "
Segment Reporting
" establishes reporting standards for an enterprise's business segments and related disclosures about its products, services, geographic areas and major customers. Under ASC 280, the method for determining what information to report is based upon the way management organizes the operating segments within the Company for making operating decisions and assessing financial performance. Our chief operating decision-makers review revenue and gross margin information for each of our reportable segments, but do not review operating expenses on a segment by segment basis. In addition, with the exception of goodwill and intangible assets, we do not identify or allocate our assets by the reportable segments.
7 VONAGE ANNUAL REPORT 2016
Historically, we have had two operating segments that we have aggregated for reporting purposes. In 2016, as a result of the acquisition of Nexmo, we no longer meet the aggregation criteria for operating segments and now have the following
two
reportable segments:
Business
For our Business customers, we provide innovative, cloud-based Unified Communications as a Service, or UCaaS, solutions, comprised of integrated voice, text, video, data, collaboration, and mobile applications over our flexible, scalable Session Initiation Protocol (SIP) based Voice over Internet Protocol, or VoIP, network. Through Nexmo, the Vonage API Platform, we also offer Communications Platform as a Service, or CPaaS, solutions designed to enhance the way businesses communicate with their customers embedding communications into apps, websites and business processes. Together we have a robust set of product families tailored to serve the full range of the business value chain, from the small and medium business, or SMB, market, through mid-market and enterprise markets. We provide customers with multiple deployment options, designed to provide the reliability and quality of service they demand. We provide customers the ability to integrate our cloud communications platform with many cloud-based productivity and CRM solutions, including Google’s G Suite, Zendesk, Salesforce’s Sales Cloud, Oracle, Clio, and other CRM solutions. In combination, our products and services permit our business customers to communicate with their customers and employees through any cloud-connected device, in any place, at any time without the often costly investment required with on-site equipment.
Consumer
For our Consumer customers, we enable users to access and utilize our UCaaS services and features, via a single “identity,” either a number or user name, regardless of how they are connected to the Internet, including over 3G, LTE, Cable, or DSL broadband networks. This technology enables us to offer our Consumer customers attractively priced voice and messaging services and other features around the world on a variety of devices.
|
FINANCIAL INFORMATION ABOUT GEOGRAPHIC AREAS
|
For information regarding the Company's revenues and long-lived assets attributable to our U.S. and foreign countries for the last three fiscal years see Note 14 to the Company's consolidated financial statements.
|
EMPLOYEES
|
As of
December 31, 2016
, we had
1,883
employees. None of our employees are subject to a collective bargaining agreement.
|
AVAILABLE INFORMATION
|
We were incorporated in Delaware in May 2000 and changed our name to Vonage Holdings Corp. in February 2001. We maintain a website with the address www.vonage.com. References to our website are provided as a convenience, and the information contained on our website is not included as a part of, or incorporated by reference into, this Annual Report on Form 10-K. Other than an investor’s own Internet access charges, we make available free of charge through our website our Annual Report on Form 10-K, Quarterly Reports on Form 10-Q, Current Reports on Form 8-K, and amendments to these reports, as soon as reasonably practicable after we have electronically filed such material with, or furnished such material to, the U.S. Securities and Exchange Commission (SEC). Copies are also available, without charge, by writing to Vonage’s Investor Relations Department at Vonage Holdings Corp., 23 Main Street, Holmdel, NJ 07733 or calling us at 732.365.1328 or sending an email through the Vonage Investor Relations website at http://ir.vonage.com/. Reports filed with the SEC may be viewed at www.sec.gov or obtained at the SEC Public Reference Room in Washington, D.C. Information regarding the operation of the Public Reference Room may be obtained by calling the SEC at 1-800-SEC-0330.
8 VONAGE ANNUAL REPORT 2016
ITEM 1A.
Risk Factors
You should carefully consider the risks below, as well as all of the other information contained in this Annual Report on Form 10-K and our financial statements and the related notes included elsewhere in this Annual Report on Form 10-K, in evaluating our company and our business. Any of these risks could materially adversely affect our business, financial condition and results of operations and the trading price of our common stock.
For the financial information discussed in this Annual Report on Form 10-K, other than per share and per line amounts, dollar amounts are presented in thousands, except where noted.
If we are unable to compete successfully, we could lose market share and revenue.
The Unified Communications as a service, or UCaaS, and Communications Platform as a service, or CPaaS, industries, which we refer to as our business services, are highly competitive. We also provide consumer services. We face intense competition from a broad set of companies, including:
|
•
|
traditional telephone and wireless service providers such as AT&T, Verizon Communications, CenturyLink, Sprint, T-Mobile, and Verizon Wireless;
|
|
•
|
cable companies such as Altice, Cablevision, Comcast Corporation, Cox Communications, and Spectrum; and
|
|
•
|
software as a service (SaaS) companies and other alternative communication providers, such as Twilio, EvolveIP, Jive, Mitel, RingCentral, Shoretel, Thinking Phone, West Unified Communications Services, 8x8 and other providers of cloud communications services.
|
Many of these providers are substantially larger and better capitalized than we are and have the advantage of greater name and brand name recognition and a large existing customer base. These service providers may have the ability to devote greater resources to their communications services and may be able to respond more quickly and effectively than we can to new or changing opportunities. Because most of our target Consumer customers are already purchasing communications services from one or more of these providers, our success is dependent upon our ability to attract target customers away from their existing providers. Our competitors' financial resources may allow them to offer services at prices below cost or even for free in order to maintain and gain market share or otherwise improve their competitive positions. Some of our competitors also could use their greater financial resources to develop and market telephony and messaging services with more attractive features and more robust customer service. In addition, because of the other services our competitors provide, some of these service providers choose to offer cloud communications services as part of a bundle that includes other products, such as high speed Internet access and wireless telephone service. These bundled offers may enable our competitors to offer cloud communications services at prices with which we may not be able to compete or to offer functionality that integrates cloud communications services with their other offerings, both of which may be more desirable. As we continue the introduction of applications that integrate different forms of voice and messaging services over multiple devices, we face competition from emerging competitors focused on similar integration, as well as from established alternative communication providers. Any of these competitive factors could make it more difficult for us to attract and retain customers, reduce our market share and revenues, or cause us to lower our prices or offer additional features that may result in additional costs without commensurate price increases. In order to compete with such service providers, we may have to reduce our prices, which would impair
our profitability, or offer additional features that may cause us to incur additional costs without commensurate price increases.
To the extent that these or other companies strengthen their offerings to small and medium businesses, we may have to reduce our prices, increase promotions, or offer additional features, which may adversely impact our revenues and profitability.
In connection with our emphasis on the international long distance market for consumer customers, we face competition from low-cost international calling cards, digital calling cards and VoIP providers in addition to traditional telephone companies, cable companies, and wireless companies. To the extent that these providers target marketing to the same ethnic segments that we target or strengthen their offerings to these segments, we may have to reduce our prices or increase promotions, which would impair our profitability, or offer additional features that may cause us to incur additional costs without commensurate price increase.
As a result of increasing competition, domestic and international telephony and messaging rates have generally decreased during the past few years, and we expect this trend to continue. Continued rate pressures or increasing cost to use our services could lessen or eliminate the pricing advantage that we maintain over certain competitors and cause customers or potential customers to select alternative providers or cause us to lower our prices, which would adversely impact our revenues and profitability.
As the cloud communications services market evolves, and the convergence of voice, video, messaging, mobility and data networking technologies accelerates, we may face competition in the future from companies that do not currently compete in the cloud communications services market, including companies that currently compete in other sectors, companies that serve consumer rather than business customers, or companies which expand their market presence to include business communications.
As the cloud communications services market evolves, combining voice, video, messaging and data networks, and information technology and communication applications, opportunity is created for new competitors to enter the cloud communications services market and offer competing products. This new competition may take many forms, and may offer products and applications similar to ours. If these new competitors emerge, the cloud communications services market will become increasingly competitive and we may not be able to maintain or improve our market position. Our failure to do so could materially and adversely affect our business and results of operations.
If we fail to adapt to rapid changes in the market for cloud communications services, then our products and services could become obsolete.
The market for our products and services is constantly and rapidly evolving as we and our competitors introduce new and enhanced products and services and react to changes in the cloud communications services industry and customer demands. We may not be able to develop or acquire new products and plans or product and plan enhancements that compete effectively with present or emerging cloud communications services technologies or differentiate our products and plans based on functionality and performance. In addition, we may not be able to establish or maintain strategic alliances that will permit enhancement opportunities or innovative distribution methods for our products and plans.
To address these issues, we are targeting revenue growth in large, existing markets, which require us to enhance our current products and plans, and develop new products and plans on a timely basis to keep pace with market needs and satisfy the increasingly sophisticated requirements of customers. If we are unable to attract users of these services our net revenues may fail to grow as we expect.
9 VONAGE ANNUAL REPORT 2016
Cloud communications services are complex, and new products and plans and enhancements to existing products and plans can require long development and testing periods. Any delays in developing and releasing new or enhanced products and plans could cause us to lose revenue opportunities and customers. Any technical flaws in products we release could diminish the innovative impact of the products and have a negative effect on customer adoption and our reputation.
We also are subject to the risk of future disruptive technologies. New products based on new technologies or new industry standards could render our existing products obsolete and unmarketable. If new technologies develop that are able to deliver competing voice and messaging services at lower prices, better or more conveniently, it could have a material adverse effect on us.
The market for our CPaaS products and platform is relatively nascent and may not experience the growth that we anticipate.
The utilization of application program interfaces (“APIs”) for text messaging and voice communications, allowing developers and businesses to embed contextual, programmable communications into mobile apps, websites and business systems, remains a relatively new market, and developers and organizations may not yet recognize the need for, or benefits of, our products and platform. It is important that we are able to educate developers, organizational leaders, and other potential customers regarding our products and platform in order to help grow our market share, The market for our products and platform or our share of that market could fail to grow significantly. If the CPaaS market, or our share of that market, does not experience significant growth, then our business, results of operations and financial condition could be adversely affected.
If we are unsuccessful at retaining customers or attracting new consumer or business customers we may experience a reduction in revenue or may be required to spend more money or alter our marketing approaches to grow our customer base.
Our rate of customer terminations for our UCaaS services could increase in the future if customers are not satisfied with the quality and reliability of our network, the value proposition of our products, and the ability of our customer service to meet the needs and expectations of our customers. We measure customer terminations for our consumer customers by average monthly customer churn and for our UCaaS business customers by average monthly revenue churn. Competition from traditional telephone companies, cable companies, wireless companies, alternative communications providers, low-cost international calling cards, disruptive technologies, general economic conditions, and our ability to activate and register new customers on our networks, also influence our churn rate. For our CPaaS customers, our ability to grow revenue depends, in part, on our ability to maintain and grow usage of our platform by new and existing customers. If we are not able to increase customer usage of our products, our revenue may decline which would adversely impact our business, results of operations and financial condition. Our CPaaS customers are charged based on their usage of our products and generally our customers do not have long-term contractual financial commitments to us, therefore, usage rates may fluctuate at any time. A material decline in the usage of our products could cause us to spend significantly more on sales and marketing than we currently budget in order to maintain or increase revenue from customers, which could adversely affect our business, results of operations and financial condition. In addition, our agreements with customers typically provide for service level commitments. If we are unable to meet these commitments or if we suffer extended periods of downtime for our products or platform, our business, results of operations and financial condition could be adversely affected.
The success of our CPaaS products depends in part on attracting new customers in a cost-effective manner. The failure to do so could materially and adversely affect our business.
The success of our business relies in part on the manner in which we use, and the cost effectiveness of, a variety of marketing channels used to promote our products and platform and attract new customers. We use developer events and developer evangelism, search engine marketing and optimization, and other marketing efforts such as
regional customer events, email campaigns, advertising and public relations events. These methods are prioritized depending on effectiveness and efficiency, and may be altered if costs increase dramatically. Alternative, less expensive channels, may not be as effective as our preferred channels. Our continued success requires that we continue to attract new customers in a cost-effective manner. If we fail to do so, our revenues may decrease and our operating results would suffer.
Our success in the cloud communications market for our business services depends in part on developing and maintaining effective distribution channels, including our internal direct sales team, third-party resellers, and value-added distributors. The failure to develop and maintain these channels could materially and adversely affect our business.
A portion of our business revenue is generated through our direct sales, or “field sales,” team. This channel consists of sales agents that market and sell our business services products to customers to customers through direct, commonly face-to-face interaction. This channel may generate an increasing portion of our business revenue in the future. Our continued success requires that we continue developing and maintaining a successful sales organization. If we fail to do so, or if our sales agents are not successful in their sales efforts, our sales may decrease and our operating results would suffer.
A portion of our business revenue is generated through indirect channel sales. These channels consist of third-party resellers and value-added distributors that market and sell our business services products to customers. These channels may generate an increasing portion of our business revenue in the future. Generally, we do not have long-term contracts with these third-party resellers and value-added distributors, and the loss of or reduction in sales through these third parties could materially reduce our revenues. We also compete for preference amongst our current or potential resellers with our competitors. Our continued success requires that we continue developing and maintaining successful relationships with these third-party resellers and value-added distributors. If we fail to do so, or if our resellers are not successful in their sales efforts, our sales may decrease and our operating results would suffer.
We may face difficulties related to the acquisition or integration of businesses, which could harm our growth or operating results.
Beginning with our acquisition of Vocalocity in 2013, we have made a number of acquisitions related to the UCaaS market, including Telesphere Networks, Ltd. in 2014, Simple Signal, Inc. and iCore Networks, Inc. in 2015 and Nexmo Inc., in 2016. However, acquisition and integration activities require substantial management time and resources. Acquisitions of existing businesses, including Nexmo, involve substantial risks, including the risk that we may not be able to integrate the operations, personnel, services, or technologies, the potential disruption of our ongoing businesses, the diversion of management attention, the maximization of financial and strategic opportunities, the difficulty in developing or maintaining controls and procedures, and the dilution to our existing stockholders from the issuance of additional shares of common stock. We may elect to acquire additional businesses or assets in the future. However, we cannot predict or guarantee that we will be able to identify suitable acquisition candidates or consummate any acquisition. As a result of these and other risks, we may not produce anticipated revenue, profitability, or synergies.
Acquisitions may require us to issue equity securities, use our cash resources, incur debt or contingent liabilities, amortize intangibles, or write-off acquisition-related expenses. If we are unable to successfully integrate any acquired businesses or assets we may not receive the intended benefits of such acquisition. In addition, we cannot predict market reactions to any acquisitions we may make or to any failure to announce any future acquisitions.
Further, while we conduct due diligence in connection with acquisition and joint venture opportunities, there may be risks or liabilities that such due diligence efforts fail to discover, are not disclosed to us, or that we inadequately assess. The discovery of material liabilities associated with acquisitions or joint venture opportunities, economic
10 VONAGE ANNUAL REPORT 2016
risks faced by joint venture partners, or any failure of joint venture partners to perform their obligations could adversely affect our business, results of operations, and financial condition.
Security breaches and other cybersecurity or technological risks could compromise our information systems and network and expose us to liability, which would cause our business and reputation to suffer and which could have a material adverse effect on our business, financial condition, and operating results.
There are several inherent risks to engaging in a technology business, including our reliance on our data centers and networks, and the use and interconnectivity of those networks. A significant portion of our operations relies heavily on our ability to provide secure processing, storage and transmission of confidential and other sensitive data, including intellectual property, proprietary business information, and personally identifiable information of our customers and employees, in our data centers and on our networks. The secure processing, storage, and transmission of this information is critical to our operations and business strategy. As seen in our industry and others, these activities have been, and will continue to be, subject to continually evolving cybersecurity or other technological risks. Targeted attacks, such as advanced persistent threat (APT) is prevalent throughout the Internet and associated with the theft of intellectual property and state-sponsored espionage. Due to the nature of our business and reliance on the Internet, we are susceptible to this type of attack. In addition, physical security of devices located within our offices, and/or remote devices, pose cybersecurity and other technological risks that could negatively impact our business and reputation.
We also operate Internet based, worldwide data, voice, video communications, and messaging services and electronic billing, which require the transmission of confidential information over public networks that may or may not support end to end security. Despite our security measures, which include the development, operation and maintenance of systems and processes that are designed to protect consumer information and prevent fraudulent credit card transactions and other security breaches, our information technology and infrastructure may be vulnerable to attacks by hackers or breached due to error, malfeasance or other disruptions by a current or former employee or third-party provider and our failure to mitigate such fraud or breaches may adversely affect our operating results. Any such breach could compromise our systems and network and the information stored there could be accessed, publicly disclosed, lost or stolen. Any such access, disclosure or other loss of information could result in legal claims or proceedings, liability under laws that protect the privacy of personal information, regulatory penalties, disruption to our operations, damage to our reputation, and a loss of confidence in our products and services, and our ability to keep personally identifiable information confidential, which could adversely affect our business.
We have been subject to cyber incidents from external sources including “brute force” and distributed denial of service attacks, as well as attacks that introduce fraudulent VoiP traffic. Although these incidents have not had a material adverse effect financially or on our ability to provide services, this may not continue to be the case going forward. There can be no assurance that cyber incidents will not occur in the future, potentially more frequently and/or on a more significant scale.
We have taken steps designed to improve the security of our networks and computer systems and our physical space. Despite these defensive measures, there can be no assurance that we are adequately protecting our information or that we will not experience future incidents. The expenses associated with protecting our information could reduce our operating margins. We maintain insurance intended to cover some of these risks, however, this insurance may not be sufficient to cover all of our losses from any future breaches of our systems. In addition, third parties with which we do business may also be sources of cybersecurity or other technological risks. We outsource certain functions, which results in the storage and processing of customer information by third parties. While we engage in certain actions to reduce the exposure resulting from outsourcing, unauthorized access, loss or destruction of data or other cyber incidents could occur, resulting in similar costs and consequences as those discussed above.
We make available on our website our privacy policy, which describes how we collect, use, and disclose our customers' personal information. To the extent we expand our operations into new geographies, we may become subject to local data security, privacy, data retention, and disclosure laws and regulations. It may be difficult for us to comply with these laws and regulations if they were deemed to be applicable to us. In addition, risks related to cybercrime and fraud increase when establishing a global presence.
We are subject to Payment Card Industry (“PCI”) data security standards, which require periodic audits by independent third parties to assess compliance. PCI data security standards are a comprehensive set of requirements for enhancing payment account data security that was developed by the PCI Security Standards Council including American Express, Discover Financial Services, JCB International, MasterCard Worldwide, and VISA Inc., to help facilitate the broad adoption of consistent data security measures. Failure to comply with the security requirements as identified in subsequent audits or rectify a security issue may result in fines. While we believe it is unusual, restrictions on accepting payment cards, including a complete restriction, may be imposed on companies that are not compliant. Further, the law relating to the liability of providers of online payment services is currently unsettled and states may enact their own rules with which we may not comply.
We rely on third party providers to process and guarantee payments made by Vonage and its affiliates’ subscribers, up to certain limits, and we may be unable to prevent our customers from fraudulently receiving goods and services. Our liability risk will increase if a larger fraction of our Vonage transactions involve fraudulent or disputed credit card transactions. Any costs we incur as a result of fraudulent or disputed transactions could harm our business. In addition, the functionality of our current billing system relies on certain third party vendors delivering services. If these vendors are unable or unwilling to provide services, we will not be able to charge for our services in a timely or scalable fashion, which could significantly decrease our revenue and have a material adverse effect on our business, financial condition and operating results.
Sales of our business services to medium-sized and enterprise customers involve significant risks which, if not managed effectively, could materially and adversely affect our business and results of operations.
As we continue to expand our sales efforts to medium-sized and larger businesses, we may incur higher selling expense and longer, more complex, sales cycles. Customers in this market segment may also require bespoke features and integration services, increasing the complexity and expense related to the sales and delivery process. As a result, we may devote greater sales and support to these customers, which may result in increased costs and a strain on our support resources. These factors could materially and adversely affect our results of operations and our overall ability to grow our customer base.
Our ability to provide our telephony service and manage related customer accounts is dependent upon third-party facilities, equipment, and systems, the failure of which could cause delays of or interruptions to our service, damage our reputation, cause us to lose customers, limit our growth, and affect our financial condition.
Our success depends on our ability to provide quality and reliable telephony service, which is in part dependent upon the proper functioning of facilities and equipment owned and operated by third parties and is, therefore, beyond our control. Unlike traditional wireline telephone service or wireless service, our telephony service typically requires our customers to have an operative broadband Internet connection and an electrical power supply, which are provided by the customer's Internet service provider and electric utility company, respectively, and not by us. The quality of some broadband Internet connections may be too poor for customers to use our telephony services properly. In addition, if there is any interruption to a customer's broadband Internet service or electrical power supply, that customer will be unable to make or receive calls, including emergency calls, using our telephony service.
11 VONAGE ANNUAL REPORT 2016
We outsource several of our network functions to third-party providers. For example, we outsource the maintenance of our regional data connection points, which are the facilities at which our network interconnects with the public switched telephone network. If our third-party service providers fail to maintain these facilities properly, or fail to respond quickly to problems, our customers may experience service interruptions. Interruptions in our service caused by third-party facilities have in the past caused and may in the future cause us to lose customers or cause us to offer substantial customer credits, which could adversely affect our revenue and profitability. If interruptions adversely affect the perceived reliability of our service, we may have difficulty attracting new customers, and our brand, reputation, and growth will be negatively impacted.
In order to access our consumer services, a customer needs to connect a standard telephone to a broadband Internet connection through a Vonage-enabled device that we provide. Although we closely monitor inventory levels, if we are unable to procure a sufficient number of devices from our suppliers in a timely manner, including as a result of a failure by a component supplier, we would be delayed in activating new customers and may lose these customers.
While we believe that relations with our current third party providers are good, and we have contracts in place with these vendors, there can be no guarantee that these third party providers will be able or willing to supply services to us in the future on commercially reasonable terms, or that we will be able to engage alternative or additional providers. We believe that we could replace our current third party providers, however, our ability to provide our services may be impacted during any transition, which could have an adverse effect on our business, financial condition or results of operations.
We rely on third-party vendors that may be difficult to replace or may not perform adequately.
For our CPaaS customers, we rely on Softlayer to provide substantially all of the cloud infrastructure that hosts our CPaaS products and platform. Our CPaaS customers require uninterrupted performance of this platform and we are therefore vulnerable to service interruptions at Softlayer. We may experience interruptions, delays and outages in Softlayer’s service and availability due to a variety of factors, including infrastructure changes, human or software errors, website hosting disruptions and capacity constraints caused by technical failures, natural disasters, fraud or security attacks. To the extent that we do not effectively address interruptions, delays and outages in Softlayer’s service and availability or capacity constraints, our business, results of operations and financial condition may be adversely affected.
In some cases we rely on purchased or leased hardware and software licensed from third parties in order to provide our UCaaS services. For example, Broadsoft, Inc. provides us with infrastructure, call termination and origination services, and other hardware and software in connection with our Premier offerings. We also integrate third-party licensed software components into our platform. This hardware and software may not continue to be available on commercially reasonable terms or pricing or may fail to continue to be updated to remain competitive. The loss of the right to use this third party hardware or software may increase our expenses or impact the provisioning of our services. The failure of this third party hardware or software could materially impact the performance of our UCaaS services and may cause material harm to our business or results of operations.
We outsource some of our cloud infrastructure to Amazon Web Services, or AWS, which hosts certain of our products and platform. Customers of our products need to be able to access our platform at any time, without interruption or degradation of performance. AWS runs its own platform that we access, and we are, therefore, vulnerable to service interruptions at AWS. To the extent that we do not effectively address capacity constraints, either through AWS or alternative providers of cloud infrastructure, our business, results of operations and financial condition may be adversely affected. In addition, any changes in service levels from AWS may adversely affect our ability to meet our customers’ requirements.
Flaws in our technology and systems or our failure to adapt our systems to any new Internet Protocol could cause delays or
interruptions of service, which could damage our reputation, cause us to lose customers, and limit our growth.
Although we have designed our service network to reduce the possibility of disruptions or other outages, our service may be disrupted by problems with our technology and systems, such as malfunctions in our Vonage-enabled device that we provide to customers, software or facilities and overloading of our network. As we attract new subscribers, we expect increased call volume that we need to manage to avoid network interruptions. In particular, as we have marketed to different international long distance markets, we have seen international call volumes to targeted countries increase. During the next few years we expect wide-spread industry adoption of a new Internet Protocol, which is a set of standard communications and routing mechanisms. Customers may experience periodic delays of service caused by the industry transition to this new Internet Protocol. Interruptions have caused and may in the future cause us to lose customers and offer substantial customer credits, which could adversely affect our revenue and profitability. Network interruptions have also impaired our ability at times to sign-up new customers and the ability of customers to manage their accounts. If service interruptions or other outages adversely affect the perceived reliability of our telephony service or customer service, we may have difficulty attracting and retaining customers and our brand reputation and growth may suffer.
In addition, we utilize third-party Internet-based or “cloud” computing services in connection with some of our business operations. Any disruption to the internet or to our third-party Web hosting or cloud computing providers, including technological or business-related disruptions, could adversely impact the experience of our customers and have adverse effects on our operations. In addition, fires, floods, earthquakes, power losses, telecommunications failures, and similar "Acts of God" could damage these systems and hardware or cause them to fail completely. While we do maintain redundant systems consistent with industry best practices, including standby data centers, certain events could result in downtime for our operations and could adversely affect our business.
Our Business segment is growing rapidly, and any inability to scale our business and grow efficiently could materially and adversely harm our business and results of operations.
As our Business segment expands, we will need to continue to improve our application architecture, integrate our products and applications across our technology platforms, integrate with third-party systems, and maintain infrastructure performance. We expect the number of users, the amount of data transferred and processed, the number of locations where our service is being used, and the volume of communications over our networks to continue to expand. To address this growth, we will need to scale our systems and customer services organization. Our ability to execute on these initiatives may impact system and network performance, customer satisfaction, and ultimately, sales and revenue. These efforts may also divert management resources. These factors may materially and adversely harm our business and results of operations.
We depend on third party vendors to supply, configure and deliver the phones that we sell. Any delays in delivery, or failure to operate effectively with our own servers and systems, may result in delay or failure of our services, which could harm our business, financial condition and results of operations.
We rely on Yealink Inc. and Polycom, Inc. to provide, and a single fulfillment agent to configure and deliver, the phones that we offer for sale to our customers that use our UCaaS services. If these third parties are unable to deliver phones of acceptable quality or quantity, or in a timely manner, we may be forced to offer replacements at a higher cost than what is currently contracted. In addition, these phones must interoperate with our servers and systems. If either of our providers changes the operation of their phones, we may be required to engage in development efforts to ensure that the new phones interoperate with our system. The failure of our vendor-supplied phones to operate effectively with our system could impact our customers’ ability to use our services and could cause customers to cancel our services, which may cause material harm to our business or results of operations.
12 VONAGE ANNUAL REPORT 2016
We market our products and services to small and medium-sized businesses, which may be disproportionately impacted by fluctuations in economic conditions.
We market our products to small and medium-sized businesses. Customers in this market may be affected by economic downturns to a greater extent, and may have more limited financial resources, than larger or more established businesses. If customers in our Business markets experience financial hardship as a result of a weak economy, the demand for our services could be materially and adversely affected.
The storage, processing, and use of personal information and related data subjects us to evolving governmental laws and regulation, commercial standards, contractual obligations, and other legal obligations related to consumer and data privacy, which may have a material impact on our costs, use of our products and services, or expose us to increased liability.
Federal, state, local and foreign laws and regulations, commercial obligations and industry standards, each provide for obligations and restrictions with respect to data privacy and security, as well as the collection, storage, retention, protection, use, processing, transmission, sharing, disclosure and protection of personal information and other customer data. The evolving nature of these obligations and restrictions dictates that differing interpretations, inconsistency or conflicts among countries or rules, and general uncertainty impact the application to our business.
These obligations and restrictions may limit our ability to collect, store, process, use, transmit and share data with our customers, employees, and third party providers and to allow our customers to collect, store, retain, protect, use, process, transmit, share and disclose data with others through our products and services. Compliance with, and other burdens imposed by, such obligations and restrictions could increase the cost of our operations and impact our ability to market our products and services through effective segmentation.
Examples of key data privacy and security related obligations and restrictions include the European Union General Data Protection Regulation (GDPR). The GDPR was adopted in April 2016 and comprehensively regulates the processing of personal data of any individual residing in the EU. The GDPR effectively requires any company processing data of EU individuals to develop a comprehensive privacy program. The GDPR becomes effective on May 25, 2018. In addition, in January 2017, the European Commission introduced a new proposed ePrivacy regulation that would restrict communications service provider’s ability to use metadata and content from communications services. In order to become effective, the proposal needs to be adopted by the European Council and European Parliament. In October 2016, the Federal Communications Commission adopted a new privacy rules for the U.S. communications industry. These rules greatly extended the scope of FCC privacy regulation. Numerous parties have filed petitions for reconsideration at the FCC on the new privacy rules.
Failure to comply with obligations and restrictions related to applicable data protection laws, regulations, standards, and codes of conduct, as well as our own posted privacy policies and contractual commitments could subject us to lawsuits, fines, criminal penalties, statutory damages, consent decrees, injunctions, adverse publicity, loss of user confidence in our services, and loss of users, which could materially harm our business. Additionally, third-party contractors may have access to customer or employee data. If these or other third-party vendors violate obligations and restrictions related to applicable data protection laws or our policies, such violations may also put our customers’ or employees’ information at risk and could in turn have a material and adverse effect on our business.
If we fail to protect our internally developed systems, technology, and software and our trademarks, we may become involved in costly litigation or our business or brand may be harmed.
Our ability to compete effectively is dependent in large part upon the maintenance and protection of systems and software that we have developed internally based on open standards. While we own over 150 issued U.S. patents (and a number of foreign patents) and more
than 170 pending U.S. patent applications (and a number of foreign patent applications), we cannot patent much of the technology that is important to our business. Our pending patent applications may not be granted. Any issued patent that we own may be challenged, narrowed, invalidated, or circumvented. To date, we have relied on patent, copyright and trade secret laws, as well as confidentiality procedures and licensing arrangements, to establish and protect our rights to this technology. We typically enter into confidentiality agreements with our employees, consultants, customers, partners, and vendors in an effort to control access to and distribution of technology, software, documentation, and other information. Despite these precautions, it may be possible for a third party to copy or otherwise obtain and use this technology without authorization. Policing unauthorized use of this technology is difficult. The steps we take may not prevent misappropriation of the technology we rely on. In addition, effective protection may be unavailable or limited in some jurisdictions outside the United States, Canada, and the United Kingdom. Litigation may be necessary in the future to enforce or protect our rights or to determine the validity and scope of the rights of others. That litigation could cause us to incur substantial costs and divert resources away from our daily business, which in turn could materially adversely affect our business.
The unlicensed use of our brands by third parties could harm our reputation, cause confusion among our customers, and impair our ability to market our services. To that end, we have registered numerous trademarks and service marks and have applied for registration of our trademarks and service marks in the United States and abroad to establish and protect our brand names as part of our intellectual property strategy. If our applications receive objections or are successfully opposed by third parties, it may be difficult for us to prevent third parties from using our brand without our permission. Moreover, successful opposition to our applications might encourage third parties to make additional oppositions or commence trademark infringement proceedings against us, which could be costly and time consuming to defend against. If we decide to take limited or no action to protect our trademarks, our trademark rights may be diluted and subject to challenge or invalidation, which could materially and adversely affect our brand in the marketplace.
Third parties may fraudulently use our name to obtain access to customer accounts and other personal information, use our services to commit fraud or steal our services or equipment, which could damage our reputation, limit our growth, and cause us to incur additional expenses.
Our customers have been subject to “phishing,” which occurs when a third party calls or sends an email or pop-up message to a customer that claims to be from a business or organization that provides services to the customer. The purpose of the inquiry is typically to encourage the customer to visit a bogus website designed to look like a website operated by the legitimate business or organization or provide information to the operator. At the bogus website, the operator attempts to trick the customer into divulging customer account or other personal information such as credit card information or to introduce viruses through “Trojan horse” programs to the customers’ computers. This has resulted in identity theft from our customers and the unauthorized use of Vonage services. Third parties have also used our communications services to commit fraud. Although we have engaged a third party to assist in the shutdown of purported phishing sites, if we are unable to detect and prevent “phishing,” use of our services for fraud, and similar activities, our brand reputation and growth may suffer and we may incur additional costs, including costs to increase security, or be required to credit significant amounts to customers.
Third parties also have used our communications services and obtained delivery of our equipment without paying, including by submitting fraudulent credit card information. This has resulted in our incurring the cost of providing the services, including incurring call termination fees, or providing the equipment without any corresponding revenues. We have implemented anti-fraud procedures in order to limit the expenses resulting from theft of service or equipment. If our procedures are not effective, theft of service or equipment could significantly increase our expenses and negatively impact our profitability.
13 VONAGE ANNUAL REPORT 2016
Certain rights to third party patents and technology may not be available, which may decrease the quality of our products or services or subject us to liability.
We may seek to obtain rights to third party technology in the future, but may not be able to agree upon commercially reasonable terms or at all with respect to obtaining such rights. If we are unable to extend existing licenses or are unable to obtain rights to other technology that may be commercially advantageous or necessary for our product and service offerings, we may experience a decrease in the quality of our products or services or we may lose the ability to provide our products and services on a non-infringing basis until alternative technology or suitable alternative products and services can be developed, identified, obtained (through acquisition, license or other grants of rights), and integrated.
We may be subject to damaging and disruptive intellectual property litigation that could materially and adversely affect our business, results of operations, and financial condition, as well as the continued viability of our company.
There has been substantial litigation in the cloud communications, UCaaS, VoIP, telecommunications, hosted services, and related industries regarding intellectual property rights and, given the rapid technological change in our industry, expansion into new technological and geographical markets, and our continual development of new products and services, we and/or our commercial partners may be subject to infringement claims from time to time. For example, we may be unaware of filed patent applications and issued patents that could include claims that might be interpreted to cover our products and services. We have been subject to patent infringement claims in the past, are currently named as a defendant in several proceedings that relate to alleged patent infringement, and from time to time we receive letters from third parties offering an opportunity for us to obtain licenses to patents that may be relevant to our business or alleging that our services infringe upon third party patents or other intellectual property. See “Item 3. - Legal Proceedings-IP Matters.”
Parties making claims of infringement may be able to obtain injunctive or other equitable relief that could effectively block our ability to provide our services and could cause us to pay substantial royalties, licensing fees, damages or settlement fees. Our agreements with certain customers, vendors, or partners may obligate us to defend or indemnify them in connection with such claims of infringement, further increasing our costs of defense and potential liability. Although we generally limit our contractual liability regarding such obligations, we may incur significant liability with respect to them, and disputes with our customers, vendors or partners over such obligations may have an adverse relationship on our relations with those entities. The defense of any lawsuit could divert management’s efforts and attention from ordinary business operations and result in time-consuming and expensive litigation, regardless of the merits of such claims. These outcomes may:
|
>
|
result in the loss of a substantial number of existing customers or prohibit the acquisition of new customers;
|
|
>
|
cause us to accelerate expenditures to preserve existing revenues;
|
|
>
|
cause existing or new vendors to require prepayments or letters of credit;
|
|
>
|
cause our credit card processors to demand reserves or letters of credit or make holdbacks;
|
|
>
|
result in substantial employee layoffs;
|
|
>
|
materially and adversely affect our brand in the marketplace and cause a substantial loss of goodwill;
|
|
>
|
cause our stock price to decline significantly;
|
|
>
|
materially and adversely affect our liquidity, including our ability to pay debts and other obligations as they become due;
|
|
>
|
cause us to change our business methods or services;
|
|
>
|
require us to cease certain business operations or offering certain products and services; and
|
|
>
|
lead to our bankruptcy or liquidation.
|
We rely on third parties to provide a portion of our customer service representatives, provide aspects of our E-911 service, which differs from traditional 911 service, and initiate local number portability for our customers. If these third parties do not provide our customers with reliable, high-quality service, our reputation will be harmed and we may lose customers.
We offer our customers support 24 hours a day, seven days a week through both our comprehensive online account management website and our toll free number. Our customer support is currently provided via United States based employees as well as third party partners located in the United States, Philippines, Costa Rica, Chile, Mexico, and India. We offer support in English, Spanish, and French Canadian. Our third-party providers generally represent us without identifying themselves as independent parties. The ability to support our customers may be disrupted by natural disasters, inclement weather conditions, civil unrest, and other adverse events in the locations where our customer support is provided.
We also contract for services required to provide E-911 services including assistance in routing emergency calls, terminating E-911 calls, operating a national call center that is available 24 hours a day, seven days a week to receive certain emergency calls, and maintaining PSAP databases for the purpose of deploying and operating E-911 services. Interruptions in service from our vendor could cause failures in our customers’ access to E-911 services and expose us to liability and damage our reputation.
We also have agreements with companies that initiate our local number portability, which allow new customers to retain their existing telephone numbers when subscribing to our services.
If any of these third parties do not provide reliable, high-quality service, our reputation and our business will be harmed. In addition, industry consolidation among providers of services to us may impact our ability to obtain these services or increase our expense for these services.
Our services are subject to regulation in the United States, United Kingdom, and Canada, and future legislative, regulatory or judicial actions could adversely affect our business and expose us to liability.
Our business has developed in a relatively lightly regulated environment. However, the United States, United Kingdom, and Canada have applied some traditional telephone company regulations to VoIP and continue to evaluate how VoIP should be regulated. The effects of future regulatory developments are uncertain. At the federal level in the U.S., the Federal Communications Commission (“FCC”) has imposed certain telecommunications regulations on VoIP services including:
|
>
|
Requirements to provide E911 service;
|
|
>
|
Communications Assistance for Law Enforcement Act (“CALEA”) obligations;
|
|
>
|
Obligation to support Universal Service;
|
|
>
|
Customer Proprietary Network Information (“CPNI”) requirements;
|
|
>
|
Disability access obligations;
|
|
>
|
Local Number Portability requirements;
|
|
>
|
Service discontinuance notification obligations;
|
|
>
|
Outage reporting requirements; and
|
14 VONAGE ANNUAL REPORT 2016
|
>
|
Rural call completion reporting and rules related to ring signal integrity.
|
In general, the focus of interconnected VoIP telecommunications regulation is at the federal level. On November 12, 2004, the FCC issued a declaratory ruling providing that our service is subject to federal regulation and preempted the Minnesota Public Utilities Commission from imposing certain of its regulations on us. While this ruling does not exempt us from all state oversight of our service, it effectively prevents state telecommunications regulators from imposing certain burdensome and inconsistent market entry requirements and certain other state utility rules and regulations on our service. As such, Vonage is subject to relatively few state regulatory requirements including:
|
>
|
Payment of state and local E911 fees; and
|
|
>
|
State Universal Service support obligations.
|
In Canada, the Canadian Radio-television and Telecommunications Commission (“CRTC”) regulates VoIP service. CRTC VoIP regulations include:
|
>
|
Requirement to provide 911 service; and
|
|
>
|
Local Number Portability requirements.
|
In the UK, we are subject to regulation in the UK by the Office of Communications (“OFCOM”). OFCOM VoIP regulations include:
|
>
|
Requirement to provide 999/112 service; and
|
|
>
|
Number Portability requirements.
|
Vonage seeks to comply with all applicable regulatory requirements. We could, however, be subject to regulatory enforcement action if a regulator does not believe that we are complying with applicable regulations.
In addition, the regulatory framework for VoIP service is still evolving and it is possible that Vonage could be subject to additional regulatory obligations and/or existing regulatory obligations could be modified or expanded. For instance, several states public utility commissions are attempting to regulate ‘fixed’ VoIP provided by cable companies. These states believe that the FCC’s 2004 Vonage Preemption Order did not preempt regulation of these ‘fixed’ services. The effects of future regulatory developments are uncertain. Future legislative, judicial or other regulatory actions could have a negative effect on our business. If we become subject to the rules and regulations applicable to telecommunications providers in individual states, we may incur significant litigation and compliance costs, and we may have to restructure our service offerings, exit certain markets, or raise the price of our services, any of which could cause our services to be less attractive to customers. In addition, future regulatory developments could increase our cost of doing business and limit our growth.
The regulatory framework for CPaaS services is not developed;
future legislative, regulatory or judicial actions on CPaaS could adversely affect our business and expose us to liability.
In most countries where we offer CPaaS products, it is not clear how CPaaS fits into the communications regulatory framework. Regulators could claim that our CPaaS products are subject to licensing and substantive communications regulatory requirements or could modify their regulatory requirements to make it clear that CPaaS products are covered. For instance, the proposed Electronic Communications Code released by the European Commission in October 2016, which if adopted by the European Council and European Parliament would update the communications law framework in the EU, arguably subjects CPaaS services to many traditional telecommunications regulations.
Future legislative, judicial or other regulatory actions could have a negative effect on our business. If our CPaaS products become subject to the rules and regulations applicable to communications providers, we may incur significant litigation and compliance costs, and we may have to restructure our service offerings, exit certain markets, or raise the price of our services, any of which could cause our services to be less attractive to customers. In addition, future regulatory developments could increase our cost of doing business and limit our growth.
Customer misuse of our CPaaS products in violation of the Telephone Consumer Protection Act may cause us to face litigation risk.
The Telephone Consumer Protection Act of 1991 restricts telemarketing and the use of automatic SMS text messages without proper consent. The scope and interpretation of the laws that are or may be applicable to the delivery of text messages are continuously evolving and developing. If we do not comply with these laws or regulations or if we become liable under these laws or regulations due to the failure of our customers to comply with these laws by obtaining proper consent, we could face liability.
Our CPaaS products may be subject to governmental export controls and economic sanctions regulations that could impair our ability to compete in international markets due to licensing requirements and subject us to liability if we are not in compliance with applicable laws.
Our products and services may be subject to export control and economic sanctions regulations, including the U.S. Export Administration Regulations, U.S. Customs regulations and various economic and trade sanctions regulations administered by the U.S. Treasury Department's Office of Foreign Assets Controls. Our products and services must be offered and sold in compliance with these laws and regulations. If we do not comply with these laws or regulations or if we become liable under these laws or regulations due to the failure of our customers to comply with these laws by obtaining proper consent, we could face liability. In addition, changes in our products or services, changes in applicable regulations, or change in the target of such regulations, could also result in decreased use of our products and services, or in our decreased ability to sell our products or provide our services to existing or prospective customers with international operations. Any decreased use of our products and services or limitation on our ability to export our products and provide our services could adversely affect our business, results of operations and financial condition.
If we are unable to establish and expand effective strategic relationships our ability to grow revenues and offer new products under commercially attractive terms may be inhibited, which could adversely affect our business, results of operations, and financial condition.
An element of our strategy is to develop and maintain strategic relationships. We have or are pursuing relationships in the U.S. retail industry as well as with entities in the business markets. The continued development of these relationships may assist us in enhancing our brand, introducing our products and services to larger numbers and types of customers, developing and implementing new products and services, and generating additional revenue. We may not be able to enter into new relationships on economic terms favorable to us. In addition, if we lose any of our important strategic relationships or if strategic relationships fail to benefit us as expected, our ability to grow revenues and offer new products may be inhibited, which could adversely affect our business, results of operations, and financial condition. In addition, inefficiencies or fraud on the part of mass merchant retailers or vendors associated with our assisted selling programs could adversely affect our business, results of operations, and financial condition.
Our business is subject to country-specific governmental regulation and related actions and taxes that may increase our costs or impact our product offerings.
In the United States, Canada, and United Kingdom, we are not a regulated telecommunications business. Our services are also in use in countries outside of the United States, Canada, and the United Kingdom, including countries where providing VoIP services is or may be illegal. We may need to change our service offerings to avoid regulation as a telecommunications business in a jurisdiction, or if we are treated as a regulated telecommunications business, we may be required to incur additional expenses. In addition, if governments believe that we are providing unauthorized service in their countries, they may pursue fines, penalties, or other governmental action, including criminal action, that may damage our brand and reputation. If we use a local
15 VONAGE ANNUAL REPORT 2016
partner to provide services in a country and the local partner does not comply with applicable governmental regulations, we may face additional regulation, liabilities, penalties or other governmental action, and our brand and reputation may be harmed.
In addition to the risk of being directly subjected to regulation, decisions by foreign regulators to increase the charge for terminating international calls into their countries may adversely impact our ability to attract and retain international long distance customers in the U.S., U.K., and Canada. For example, our Vonage World offering includes calling to over 60 countries. Regulatory actions in any of these countries, which has occurred in the past, could cause increased costs, impact margin, cause us to remove a country from Vonage World, and impact churn and gross line additions. These regulatory actions may be taken without notice and cause us to react quickly to changing market conditions. These efforts could divert management’s efforts and attention from ordinary business operations which could materially and adversely affect our results of operations.
As a United States-based company, any foreign subsidiary or joint venture that we use for international operations may be subject to a variety of governmental regulations in the countries where we market our products, including tariffs and taxes. For example, distributions of earnings and other payments, including interest, received from our foreign subsidiaries may be subject to withholding taxes imposed by the jurisdiction in which such entities are formed or operating, which will reduce the amount of after-tax cash we can receive. In general, as a United States corporation, we may claim a foreign tax credit against our federal income tax expense for such foreign withholding taxes and for foreign income taxes paid directly by foreign corporate entities in which we own 10% or more of the voting stock. The ability to claim such foreign tax credits and to utilize net foreign losses is, however, subject to numerous limitations, and we may incur incremental tax costs as a result of these limitations or because we are not currently in a tax-paying position in the United States. We may also be required to include in our income for United States federal income tax purposes our proportionate share of certain earnings of those foreign subsidiaries that are classified as “controlled foreign corporations” without regard to whether distributions have been actually received from such subsidiaries.
Our CPaaS offerings may be subject to liability for historic and future sales, use and similar taxes, that may increase our costs or impact our product offerings.
In some United States tax jurisdictions in which we conduct operations, sales and use and telecommunications taxes could apply to our CPaaS products. Historically, we have not billed or collected these taxes from our CPaaS customers. It is possible that some tax jurisdictions may assert that such taxes are applicable to our CPaaS products, which could result in tax assessments, penalties and interest, and we may be required to collect such taxes on our CPaaS customers in the future. Such tax assessments, penalties and interest or future requirements may adversely affect our business, results of operations and financial condition. To the extent that we decide to collect such taxes from our CPaaS customers in the future, we may have some customers that question the incremental tax charges and some may seek to negotiate lower pricing from us, which could adversely affect our business, results of operations and financial condition.
The global scope of our operations may subject us to potentially adverse tax consequences.
We generally report our taxable income in various jurisdictions worldwide based upon our business operations in those jurisdictions. Intercompany relationships are subject to complex transfer pricing regulations in various jurisdictions. If revenue and taxing authorities disagree with positions we have taken we could be required to pay additional taxes, interest and penalties, which could result in one-time tax charges, higher effective tax rates, reduced cash flows and lower overall profitability of our operations. In addition, changes in tax laws of countries in which we do business could change on a prospective or retroactive basis, and any such changes could increase our liabilities for taxes, interest and penalties, and therefore could harm our business, cash flows, results of operations and financial position.
An unremediated material weakness in our internal control over financial reporting could adversely affect our reputation, business or stock price.
As described under “Item 9A - Controls and Procedures,” we have identified a control deficiency constituting a material weakness in our internal control over financial reporting related to our controls over the preparation of the annual tax provision. A material weakness is a deficiency, or combination of deficiencies, in internal control over financial reporting such that there is a reasonable possibility that a material misstatement of our annual or interim consolidated financial statements will not be prevented or detected on a timely basis. Although we have developed and are implementing a plan to remediate this material weakness and believe, based on our evaluation to date, that this material weakness will be remediated during 2017, we cannot assure you that this will occur within the contemplated timeframe. Moreover, we cannot assure you that we will not identify additional material weaknesses in our internal control over financial reporting in the future. If we are unable to remediate the material weakness, our ability to record, process and report financial information accurately, and to prepare financial statements within the time periods specified by the rules and forms of the Securities and Exchange Commission, could be adversely affected. The occurrence of or failure to remediate the material weakness may adversely affect our reputation and business and the market price of our common stock and any other securities we may issue.
We are dependent on a small number of individuals, and if we lose key personnel upon whom we are dependent, our business will be adversely affected.
Many of the key responsibilities of our business have been assigned to a relatively small number of individuals. Our future success depends to a considerable degree on the vision, skills, experience, and effort of our senior management. The loss of the services of these officers could have a material adverse effect on our business. In addition, our continued growth depends on our ability to attract and retain experienced key employees.
We are subject to risks that are inherent in operating abroad, including country-specific risks.
Some of our research and development personnel and facilities are located in Israel. Political, economic and military conditions in Israel directly affect our operations. For example, increased violence or armed conflict in the Middle East may disrupt travel and communications in the region, harming our operations there. Furthermore, some of our employees in Israel are obligated to perform up to 36 days of military reserve duty annually and may be called to active duty in a time of crisis. The absence of these employees for significant periods may cause us to operate inefficiently during these periods.
We may be exposed to liabilities under the Foreign Corrupt Practices Act, the UK Bribery Act, and similar laws, and any determination that we violated any of these laws could have a material adverse effect on our business.
We are subject to the Foreign Corrupt Practice Act ("FCPA"), the UK Bribery Act and other laws that prohibit improper payments or offers of payments to foreign governments and their officials and political parties by persons and entities for the purpose of obtaining or retaining business. We have operations, agreements with third parties, and make sales internationally. In addition, we plan to expand our international operations through potential joint ventures with local partners. Our international activities create the risk of unauthorized payments or offers of payments by one of our employees, consultants, partners, sales agents or distributors, even though these parties are not always subject to our control. It is our policy to prohibit these practices by our employees, consultants, partners, sales agents or distributors, however, our existing safeguards and any future improvements may prove to be less than effective, and our employees, consultants, partners, sales agents or distributors may engage in conduct for which we might be held responsible. Violations of the FCPA, the UK Bribery Act or other laws may result in severe criminal or civil sanctions, and we may be subject
16 VONAGE ANNUAL REPORT 2016
to other liabilities, which could negatively affect our business, operating results, and financial condition.
The success of our business relies on customers’ continued and unimpeded access to broadband service. Providers of broadband services may be able to block our services or charge their customers more for also using our services, which could adversely affect our revenue and growth.
Our customers must have broadband access to the Internet in order to use our service. Some providers of broadband access, including outside of the United States, may take measures that affect their customers’ ability to use our service, such as degrading the quality of the data packets we transmit over their lines, giving those packets low priority, giving other packets higher priority than ours, blocking our packets entirely or attempting to charge their customers more for also using our services.
In the United States, there continues to be some uncertainty regarding whether suppliers of broadband Internet access have a legal obligation to allow their customers to access and use our service without interference. On February 26, 2015, the FCC adopted neutrality rules that would protect against interference by suppliers of broadband Internet access. Several parties filed appeals which are pending at the D.C. Circuit Court of Appeals. Oral arguments at the D.C. Circuit Court of Appeals were held on December 4, 2015. On June 14, 2016, the D.C. Circuit of Appeals denied the appeals. Several parties filed a petition for rehearing en banc on July 29, 2016.
If customers do not accept the differences between our service and traditional telephone service, they may choose to remain with their current telephone service provider or may choose to return to service provided by traditional telephone companies.
For certain users, aspects of our service are not the same as traditional telephone service. Our continued growth is dependent on the adoption of our services by mainstream customers, so these differences are important. For example:
|
>
|
Both our E-911 and emergency calling services are different, in significant respects, from the 911 service associated with traditional wireline and wireless telephone providers and, in certain cases, with other VoIP providers.
|
|
>
|
In the event of a power loss or Internet access interruption experienced by a customer, our service is interrupted. Unlike some of our competitors, we have not installed batteries at customer premises to provide emergency power for our customers’ equipment if they lose power, although we do have backup power systems for our network equipment and service platform.
|
|
>
|
Our customers may experience lower call quality than they are used to from traditional wireline telephone companies, including static, echoes, and delays in transmissions.
|
|
>
|
Our customers may experience higher dropped-call rates than they are used to from traditional wireline telephone companies.
|
|
>
|
Customers who obtain new phone numbers from us do not appear in the phone book and their phone numbers are not available through directory assistance services offered by traditional telephone companies.
|
|
>
|
Our customers cannot accept collect calls.
|
|
>
|
Our customers cannot call premium-rate telephone numbers such as 1-900 numbers and 976 numbers.
|
If customers do not accept the differences between our service and traditional telephone service, they may choose to remain
with their current telephone service provider or may choose to return to service provided by traditional telephone companies.
The debt agreements governing our financing contain restrictions that may limit our flexibility in operating our business or executing on our acquisition strategy.
On June 3, 2016, we entered into Amendment No. 1 to the Amended and Restated Credit Agreement (the “2016 Credit Facility”) consisting of a $125,000 senior secured term loan and a $325,000 revolving credit facility. The 2016 Credit Facility contains customary representations and warranties and affirmative covenants that limit our ability and/or the ability of certain of our subsidiaries to engage in specified types of transactions. These covenants and other restrictions may under certain circumstances limit, but not necessarily preclude, our and certain of our subsidiaries’ ability to, among other things:
|
>
|
consolidate or merge;
|
|
>
|
create liens;
|
|
>
|
incur additional indebtedness;
|
|
>
|
dispose of assets;
|
|
>
|
consummate acquisitions;
|
|
>
|
make investments; or
|
|
>
|
pay dividends and other distributions.
|
Under the 2016 Credit Facility, we are required to comply with the following financial covenants: specified maximum consolidated leverage ratio, specified minimum consolidated fixed coverage charge ratio, minimum cash position and maximum capital expenditures. Our ability to comply with such financial and other covenants may be affected by events beyond our control, so we may not be able to comply with these covenants. A breach of any such covenant could result in a default under the 2016 Credit Facility. In that case, the lenders could elect to declare due and payable immediately all amounts due under the 2016 Credit Facility, including principal and accrued interest.
Significant foreign currency exchange rate fluctuations could adversely affect our financial results.
Because our consolidated financial statements are presented in U.S. dollars, increases or decreases in the value of the U.S. dollar relative to other currencies in which we transact business could materially adversely affect our financial results. For example, Nexmo collects revenues in Euros, and accordingly the strengthening of the U.S. dollar relative to the Euro adversely affects our revenue and operating results presented in U.S. dollars. In addition, on June 23, 2016, the United Kingdom (U.K.) held a referendum in which a majority of voters approved an exit from the European Union (E.U.), commonly referred to as "Brexit." As a result of the referendum, it is expected that the British government will begin negotiating the terms of the U.K.'s withdrawal from the E.U. Brexit caused significant volatility in global stock markets and currency exchange rate fluctuations that resulted in the strengthening of the U.S. dollar against foreign currencies in which we conduct business, such as the British Pound, Euro and other currencies. Such strengthening of the U.S. dollar relative to other currencies may adversely affect our revenue and operating results. In addition, changes to U.K. border and immigration policy could likewise occur as a result of Brexit, affecting our U.K. operation's ability to recruit and retain employees from outside the U.K.
The market price of our common stock has been and may continue to be volatile, and purchasers of our common stock could incur substantial losses.
Securities markets experience significant price and volume fluctuations. This market volatility, as well as general economic conditions, could cause the market price of our common stock to fluctuate substantially. The trading price of our common stock has been, and is likely to continue to be, volatile. Many factors that are beyond our control may significantly affect the market price of our shares. These factors include:
17 VONAGE ANNUAL REPORT 2016
|
>
|
changes in our earnings or variations in operating results;
|
|
>
|
any shortfall in revenue or increase in losses from levels expected by securities analysts;
|
|
>
|
judgments in litigation;
|
|
>
|
operating performance of companies comparable to us;
|
|
>
|
general economic trends and other external factors; and
|
|
>
|
market conditions and competitive pressures that prevent us from executing on our future growth initiatives.
|
If any of these factors causes the price of our common stock to fall, investors may not be able to sell their common stock at or above their respective purchase prices.
If we require additional capital, we may not be able to obtain additional financing on favorable terms or at all.
We may need to pursue additional financing to respond to new competitive pressures, pay extraordinary expenses such as litigation settlements or judgments or fund growth, including through acquisitions. Because of our past significant losses and our limited tangible assets, we do not fit traditional credit lending criteria, which, in particular, could make it difficult for us to obtain loans or to access the capital markets. In addition, the credit documentation for our recent financing contains affirmative and negative covenants that affect, and in many respects may significantly limit or prohibit, among other things, our and certain of our subsidiaries’ ability to incur, refinance or modify indebtedness and create liens.
Our credit card processors have the ability to impose significant holdbacks in certain circumstances. The reinstatement of such holdbacks likely would have a material adverse effect on our liquidity.
Under our credit card processing agreements with our Visa, MasterCard, American Express, and Discover credit card processors, the credit card processor has the right, in certain circumstances, including adverse events affecting our business, to impose a holdback of our advanced payments purchased using a Visa, MasterCard, American Express, or Discover credit card, as applicable, or demand additional reserves or other security. If circumstances were to occur that would allow any of these processors to reinstate a holdback, the negative impact on our liquidity likely would be significant. In addition, our Visa and MasterCard credit card processing agreement may be terminated by the credit card processor at its discretion if we are deemed to be financially insecure. As a significant portion of payments to us are made through Visa and MasterCard credit cards, if the credit card processor does not assist in transitioning our business to another credit card processor, the negative impact on our liquidity likely would be significant. There were no cash reserves and cash-collateralized letters of credit with any credit card processors as of December 31, 2016.
We have incurred cumulative losses since our inception and may not achieve consistent profitability in the future.
While we achieved net income attributable to Vonage of
$17,907
for the year ended
December 31, 2016
, our accumulated deficit is
$637,113
from our inception through
December 31, 2016
. Although we believe we will achieve consistent profitability in the future, we ultimately may not be successful. We believe that our ability to achieve consistent profitability will depend, among other factors, on our ability to continue to achieve and maintain substantive operational improvements and structural cost reductions while maintaining and growing our net revenues. In addition, certain of the costs of our business are not within our control and may increase. For example, we and other telecommunications providers are subject to regulatory termination charges imposed by regulatory authorities in countries to which customers make calls, such as India where regulatory authorities
have been petitioned by local providers to consider termination rate increases. As we attract additional international long distance callers, we will be more affected by these increases to the extent that we are unable to offset such costs by passing through price increases to customers.
We may be unable to fully realize the benefits of our net operating loss (“NOL”) carry forwards if an ownership change occurs.
If we were to experience a “change in ownership” under Section 382 of the Internal Revenue Code (“Section 382”), the NOL carry forward limitations under Section 382 would impose an annual limit on the amount of the future taxable income that may be offset by our NOL generated prior to the change in ownership. If a change in ownership were to occur, we may be unable to use a significant portion of our NOL to offset future taxable income. In general, a change in ownership occurs when, as of any testing date, there has been a cumulative change in the stock ownership of the corporation held by 5% stockholders of more than 50 percentage points over an applicable three-year period. For these purposes, a 5% stockholder is generally any person or group of persons that at any time during an applicable three-year period has owned 5% or more of our outstanding common stock. In addition, persons who own less than 5% of the outstanding common stock are grouped together as one or more “public group” 5% stockholders. Under Section 382, stock ownership would be determined under complex attribution rules and generally includes shares held directly, indirectly (though intervening entities), and constructively (by certain related parties and certain unrelated parties acting as a group). We have implemented a Tax Benefits Preservation Plan intended to provide a meaningful deterrent effect against acquisitions that could cause a change in ownership, however this is not a guarantee against such a change in ownership.
Our certificate of incorporation and bylaws and the agreements governing our indebtedness contain provisions that could delay or discourage a takeover attempt, which could prevent the completion of a transaction in which our stockholders could receive a substantial premium over the then-current market price for their shares.
Certain provisions of our restated certificate of incorporation and our second amended and restated bylaws may make it more difficult for, or have the effect of discouraging, a third party from acquiring control of us or changing our board of directors and management. These provisions:
|
>
|
permit our board of directors to issue additional shares of common stock and preferred stock and to establish the number of shares, series designation, voting powers (if any), preferences, other special rights, qualifications, limitations or restrictions of any series of preferred stock;
|
|
>
|
limit the ability of stockholders to amend our restated certificate of incorporation and second amended and restated bylaws, including supermajority requirements;
|
|
>
|
allow only our board of directors, Chairman of the board of directors or Chief Executive Officer to call special meetings of our stockholders;
|
|
>
|
eliminate the ability of stockholders to act by written consent;
|
|
>
|
require advance notice for stockholder proposals and director nominations;
|
|
>
|
limit the removal of directors and the filling of director vacancies; and
|
|
>
|
establish a classified board of directors with staggered three-year terms.
|
In addition, a change of control would constitute an event of default under our 2015 Credit Facility. Upon the occurrence of an event of default, the lenders could elect to declare due and payable
18 VONAGE ANNUAL REPORT 2016
immediately all amounts due under our 2015 Credit Facility, including principal and accrued interest, and may take action to foreclose upon the collateral securing the indebtedness.
Under our 2015 Credit Facility, a “change of control” would result from the occurrence of, among other things, the acquisition by any person or group (other than our Chairman, Jeffrey Citron and his majority-controlled affiliates) of 35% or more of the voting and/or economic interest of our outstanding common stock on a fully-diluted basis.
Such provisions could have the effect of depriving stockholders of an opportunity to sell their shares at a premium over prevailing market prices. Any delay or prevention of, or significant payments required to be made upon, a change of control transaction or changes in our board of directors or management could deter potential acquirors or prevent the completion of a transaction in which our stockholders could receive a substantial premium over the then-current market price for their shares.
ITEM 1B.
Unresolved Staff Comments
Not applicable.
The following is a summary of our offices and locations:
|
Location
|
Business Use
|
Square
Footage
|
|
Lease
Expiration
Date
|
|
|
Holmdel, New Jersey
|
Corporate Headquarters, Network Operations, Customer Services, Sales and Marketing, Administration
|
350,000
|
|
2023
|
|
|
New York, New York
|
Sales and Marketing, Administration, and Product Development
|
10,166
|
|
2026
|
|
|
Dallas, Texas
|
Sales and Marketing, Administration, and Product Development
|
5,567
|
|
2021
|
|
|
Atlanta, Georgia
|
Sales and Marketing, Administration, and Product Development
|
90,209
|
|
2020
|
|
|
Scottsdale, Arizona
|
Network Operations, Customer Services, Marketing, and Administration
|
37,870
|
|
2021
|
|
|
Englewood, Colorado
|
Sales and Marketing
|
9,573
|
|
2021
|
|
|
Minneapolis, Minnesota
|
Sales and Marketing
|
2,206
|
|
2017
|
|
|
Murray, Utah
|
Sales and Marketing
|
1,062
|
|
2017
|
|
|
Oak Brook, Illinois
|
Sales and Marketing
|
4,890
|
|
2019
|
|
|
Houston, Texas
|
Sales and Marketing
|
4,040
|
|
2020
|
|
|
McLean, Virginia
|
Network Operations, Customer Services, Sales and Marketing, Administration
|
33,656
|
|
2017
|
|
|
Philadelphia, Pennsylvania
|
Network Operations, Customer Services, Sales and Marketing
|
5,795
|
|
2020
|
|
|
San Francisco, CA
|
Sales and Marketing, Administration, and Customer Services
|
5,000
|
|
2018
|
|
|
London, United Kingdom
|
Sales and Marketing, Administration
|
10,185
|
|
2020
|
|
|
Tel Aviv, Israel
|
Application Development
|
7,158
|
|
2020
|
|
|
|
|
577,377
|
|
|
|
We sublease 52,000 square feet of office space in our Holmdel, NJ location to a third party. We believe that the facilities that
we occupy are adequate for our current needs and do not anticipate leasing any material additional space.
19 VONAGE ANNUAL REPORT 2016
ITEM 3.
Legal Proceedings
Litigation
From time to time, in addition to those identified below, we are subject to legal proceedings, claims, investigations, and proceedings in the ordinary course of business, including claims of alleged infringement of third-party patents and other intellectual property rights, commercial, employment, and other matters. From time to time, we also receive letters or other communications from third parties inviting us to obtain patent licenses that might be relevant to our business or alleging that our services infringe upon third party patents or other intellectual property. In accordance with generally accepted accounting principles, we make a provision for a liability when it is both probable that a liability has been incurred and the amount of the loss or range of loss can be reasonably estimated. These provisions, if any, are reviewed at least quarterly and adjusted to reflect the impacts of negotiations, settlements, rulings, advice of legal counsel, and other information and events pertaining to a particular case. Litigation is inherently unpredictable. We believe that we have valid defenses with respect to the legal matters pending against us and are vigorously defending these matters. Given the uncertainty surrounding litigation and our inability to assess the likelihood of a favorable or unfavorable outcome in the above noted matters and our inability to reasonably estimate the amount of loss or range of loss, it is possible that the resolution of one or more of these matters could have a material adverse effect on our consolidated financial position, cash flows or results of operations.
IP Matters
Bear Creek Technologies, Inc.
On February 22, 2011, Bear Creek Technologies, Inc. (“Bear Creek”) filed a lawsuit against Vonage Holdings Corp., Vonage America Inc., Vonage Marketing LLC, and Aptela Inc. (the latter two entities being former subsidiaries of Vonage Holdings Corp. now merged into Vonage America Inc. and Vonage Business Inc., respectively) in the United States District Court for the Eastern District of Virginia alleging that Vonage’s and Aptela’s products and services are covered by United States Patent No. 7,889,722, entitled “System for Interconnecting Standard Telephony Communications Equipment to Internet Protocol Networks” (the “'722 Patent”). The suit also named numerous other defendants. On August 17, 2011, the Court dismissed Bear Creek’s case against the Vonage entities and Aptela, and all but
one
of the other defendants. Later, on August 17, 2011, Bear Creek re-filed its complaint in the United States District Court for the District of Delaware against the same Vonage entities; and re-filed its complaint in the United States District Court for the Eastern District of Virginia against Aptela. On May 2, 2012, the litigations against Vonage and Aptela were consolidated for pretrial proceedings with
twelve
other actions in the District of Delaware. Vonage filed an answer to Bear Creek’s complaint, including counterclaims of non-infringement and invalidity of the ‘722 patent. Aptela, which filed a motion to dismiss Bear Creek’s complaint on September 27, 2011, has not yet answered, as its motion remains pending. On November 5, 2012, Bear Creek filed an answer to Vonage’s counterclaims. On July 17, 2013, the Court stayed the case pending resolution of the reexamination of the ‘722 patent requested by Cisco Systems, Inc. (“Cisco”), described below. On May 5, 2015, the Court closed the case, with leave to reopen if further attention by the Court is required.
A request for reexamination of the validity of the ‘722 Patent was filed on September 12, 2012 by Cisco. Cisco’s request was granted on November 28, 2012. On March 24, 2014, the United States Patent and Trademark Office issued an Action Closing Prosecution, confirming its rejection of all claims of the ‘722 patent. Bear Creek’s November 14, 2014 appeal of that decision to the Patent Trial and Appeal Board was denied on December 29, 2015. Bear Creek appealed the Board’s decision to the United States Court of Appeals for the Federal Circuit. Briefing on the appeal is complete and pending oral argument before the Court on March 13, 2017.
RPost Holdings, Inc.
On August 24, 2012, RPost Holdings, Inc., RPost Communications Limited, and RMail Limited (collectively,
“RPost”) filed a lawsuit against StrongMail Systems, Inc. (“StrongMail”) in the United States District Court for the Eastern District of Texas alleging that StrongMail’s products and services, including its electronic mail marketing services, are covered by United States Patent Nos. 8,224,913, 8,209,389, 8,161,104, 7,966,372, and 6,182,219. On February 11, 2013, RPost filed an amended complaint, adding
27
new defendants, including Vonage America Inc. RPost’s amended complaint alleges willful infringement of the RPost patents by Vonage and each of the other new defendants because they are customers of StrongMail. StrongMail has agreed to fully defend and indemnify Vonage in this lawsuit. Vonage answered the complaint on May 7, 2013. On September 17, 2015, the Court ordered the consolidation for pre-trial purposes of this case with other cases by RPost. The lead case has been administratively closed and stayed since January 30, 2014 due to multiple pending actions by third parties regarding ownership of the patents at issue. On December 1, 2016, the parties in the consolidated actions filed a joint notice regarding status of the co-pending actions. Plaintiffs requested that the stay be lifted, while defendants maintain that the stay should remain in place.
AIP Acquisition LLC
. On January 3, 2014, AIP Acquisition LLC (“AIP”), filed a lawsuit against Vonage Holdings Corp., Vonage America, Inc., and Vonage Marketing LLC in the U.S. District Court for the District of Delaware alleging that Vonage’s products and services are covered by United States Patent No. 7,269,247. Vonage filed an answer and counterclaims on February 25, 2014. AIP filed an amended complaint on March 18, 2014, which Vonage answered on April 4, 2014. On April 8, 2014, the Court stayed the case pending final resolution of non-party Level 3’s inter partes review request of United States Patent No. 7,724,879, which is a continuation of the ‘247 patent. On October 8, 2014, the Patent Office issued a Final Written Decision, finding all challenged claims of the ‘879 patent to be invalid. On November 10, 2015, the Federal Circuit rejected AIP’s appeal and affirmed the Patent Office’s rejection of the ‘879 patent.
Cisco petitioned for inter partes review of the ‘247 patent on November 25, 2014, which was granted on May 20, 2015. On May 18, 2016, the Patent Office issued a Final Written Decision, finding all challenged claims of the ‘247 patent to be invalid. AIP appealed to the Federal Circuit, filing its opening brief on December 15, 2016. On December 20, 2016, the Patent Office filed a notice of intervention in the appellate proceedings. Both the Patent Office’s and Cisco’s responsive briefs are due on March 13, 2017.
Commercial Litigation
Merkin & Smith, et als
. On September 27, 2013, Arthur Merkin and James Smith filed a putative class action lawsuit against Vonage America, Inc. in the Superior Court of the State of California, County of Los Angeles, alleging that Vonage violated California’s Unfair Competition Law by charging its customers fictitious 911 taxes and fees. On October 30, 2013, Vonage filed a notice removing the case to the United States District Court for the Central District of California. On November 26, 2013, Vonage filed its Answer to the Complaint. On December 4, 2013, Vonage filed a Motion to Compel Arbitration, which the Court denied on February 4, 2014. On March 5, 2014, Vonage appealed that decision to the United States Court of Appeals for the Ninth Circuit. On March 26, 2014, the district court proceedings were stayed pending the appeal. On February 29, 2016, the Ninth Circuit reversed the district court’s ruling and remanded with instructions to grant the motion to compel arbitration. On March 22, 2016, Merkin and Smith filed a petition for rehearing. On May 4, 2016, the Ninth Circuit withdrew its February 29, 2016 decision and issued a new order reversing the district court’s order and remanded with instructions to compel arbitration. The Ninth Circuit also declared as moot the petition for rehearing. On June 27, 2016, the lower court stayed the case pending arbitration. A joint status report was filed with the District Court on December 23, 2016.
Regulation
Telephony services are subject to a broad spectrum of state and federal regulations. Because of the uncertainty over whether Voice
20 VONAGE ANNUAL REPORT 2016
over Internet Protocol (“VoIP”) should be treated as a telecommunications or information service, we have been involved in a substantial amount of state and federal regulatory activity. Implementation and interpretation of the existing laws and regulations is ongoing and is subject to litigation by various federal and state agencies and courts. Due to the uncertainty over the regulatory classification of VoIP service, there can be no assurance that we will not be subject to new regulations or existing regulations under new interpretations, and that such change would not introduce material additional costs to our business.
Federal - Net Neutrality
Clear and enforceable net neutrality rules make it more difficult for broadband Internet service providers to block or discriminate against Vonage service. In addition, explicitly applying net neutrality rules to wireless broadband Internet service providers could create greater opportunities for VoIP applications that run on wireless broadband Internet service. In December 2010, the FCC adopted net neutrality rules that applied strong net neutrality rules to wired broadband Internet service providers and limited rules to wireless broadband Internet service providers. On January 14, 2014, the D.C. Circuit Court of Appeals vacated a significant portion of the 2010 rules. On May 15, 2014, the FCC issued a Notice of Proposed Rulemaking (NPRM) proposing new net neutrality rules. After public response to the NPRM, the FCC adopted new neutrality rules on February 26, 2015. These rules prohibit broadband Internet service providers from: (1) blocking or throttling lawful content applications, or services; (2) imposing paid prioritization arrangements; and (3) unreasonably interfering or unreasonably disadvantaging consumers or edge providers. In addition, broadband Internet service providers are required to make certain disclosures regarding their network management practices, network performance, and commercial terms. These net neutrality rules apply the same requirements to wired and wireless broadband Internet service providers. Several parties have filed appeals which are pending at the D.C. Circuit Court of Appeals. Oral arguments at the D.C. Circuit Court of Appeals were held on December 4, 2015. On June 14, 2016, the D.C. Circuit of Appeals denied the appeals. Several parties filed a petition for rehearing en banc on July 29, 2016. The petition is pending.
Federal - Lifeline Reform
On March 31, 2016, the FCC adopted an order modernizing the Lifeline program. The Lifeline program previously subsidized voice service for low-income customers and is one component of the federal universal service fund. The order refocuses the program to subsidize broadband. Increased adoption of broadband services expands the market for Vonage services. The order will also likely increase the overall size of the federal universal fund and lead to increased USF contribution levels for Vonage services subject to assessment for federal USF.
Federal - Rural Call Completion Issues
On February 7, 2013, the FCC released a Notice of Proposed Rulemaking (NPRM) on rural call completion issues. The NPRM proposed new detailed reporting requirements to gauge rural call completion performance. Rural carriers have argued that VoIP provider call completion performance to rural areas is generally poor. On October 28, 2013, the FCC adopted an order on rural call completion imposing new reporting obligations and restricting certain call signaling practices. The call signaling rules went into effect on January 31, 2014. We filed for extensions of the rules, which the FCC granted, and as of April 17, 2014, we were compliant with the FCC call signaling rules. The effective date for the reporting requirements was April 1, 2015. We could be subject to an FCC enforcement action in the future in the event the FCC took the position that our rural call completion performance is inadequate or we were not compliant with the FCC’s order.
Federal - Numbering Rights
On April 18, 2013, the FCC issued a Notice of Proposed Rulemaking (NPRM) that proposed to modify FCC rules to allow VoIP providers to directly access telephone numbers. In addition, the FCC granted a waiver from its existing rules to allow Vonage to conduct a trial of direct access to telephone numbers. The trial would allow the FCC to obtain real-world data on direct access to telephone numbers
by VoIP providers to inform consideration of the NPRM. Direct access to telephone numbers would facilitate IP to IP interconnection, which may allow VoIP providers to provide higher quality, lower cost services, promote the deployment of innovative new voice services, and experience reductions in the cost of telephony services. Vonage successfully completed the trial in certain markets and filed the required reports on the trial with the FCC. On January 31, 2014, the FCC Wireline Competition Bureau issued a positive report on the trial, concluding that Vonage's successful trial confirmed the technical feasibility of interconnected VoIP providers obtaining telephone numbers directly from the numbering administrators. On June 18, 2015, the FCC adopted an order that modifies its rules to allow interconnected VoIP providers to directly access telephone numbers. Part of the order required approval from the Office of Management and Budget ("OMB") prior to the rule change becoming effective. On February 4, 2016, the FCC announced that OMB had approved the order and would begin accepting applications for authorization beginning on February 18, 2016. Vonage applied for authorization, and on March 31, 2016 received authorization. On December 23, 2015, the National Association of Regulatory Utility Commissioners filed an appeal of the June 18, 2015 FCC order at the D.C. Circuit Court of Appeals. The D.C. Circuit held oral argument on this appeal on February 8, 2017.
Federal - Privacy Rules
On April 1, 2016, the FCC issued a Notice of Proposed Rulemaking (NPRM) that proposed the adoption of privacy rules for providers of broadband Internet access service and updating its rules for voice services to make them consistent with the proposed privacy rules for broadband Internet access services. In addition to regulating customer proprietary network information (CPNI), a category of information that the FCC has traditionally regulated for voice services, the FCC proposed to regulate use of customer personal information (PI), a broader set of information than CPNI, by broadband and voice service providers. Further, the NPRM would regulate voice and broadband provider privacy policies and data security practices, including imposing vicarious liability for vendors who handle PI and CPNI on behalf of a broadband or voice provider. Finally, the NPRM would impose another data breach reporting notification obligation on voice and broadband providers on top of existing state data breach notification requirements. The FCC adopted its new privacy rules at its October 27, 2016 open meeting. The rules do not provide for vicarious liability for vendors and provide an exemption from the rules in certain instances for business voice customers. Numerous parties have filed petitions for reconsideration.
State Telecommunications Regulation
In general, the focus of interconnected VoIP telecommunications regulation is at the federal level. On November 12, 2004, the FCC issued a declaratory ruling providing that our service is subject to federal regulation and preempted the Minnesota Public Utilities Commission (“MPUC”) from imposing certain of its regulations on us. The FCC's decision was based on its conclusion that our service is interstate in nature and cannot be separated into interstate and intrastate components. On March 21, 2007, the United States Court of Appeals for the 8th Circuit affirmed the FCC's declaratory ruling preempting state regulation of our service.
While this ruling does not exempt us from all state oversight of our service, it effectively prevents state telecommunications regulators from imposing certain burdensome and inconsistent market entry requirements and certain other state utility rules and regulations on our service. State regulators continue to probe the limits of federal preemption in their attempts to apply state telecommunications regulation to interconnected VoIP service. On July 16, 2009, the Nebraska Public Service Commission and the Kansas Corporation Commission filed a petition with the FCC seeking a declaratory ruling or, alternatively, adoption of a rule declaring that state authorities may apply universal service funding requirements to nomadic VoIP providers. We participated in the FCC proceedings on the petition. On November 5, 2010, the FCC issued a declaratory ruling that allowed states to assess state USF on nomadic VoIP providers on a going forward basis provided that the states comply with certain conditions to ensure that imposing state USF does not conflict with federal law or policy. More recently on July 28, 2015, the MPUC found that it has
21 VONAGE ANNUAL REPORT 2016
authority to regulate Charter’s fixed, interconnected VoIP service. Charter challenged the MPUC’s order at the U.S. District Court for Minnesota. This challenge is currently pending. We expect that state public utility commissions and state legislators will continue their attempts to apply state telecommunications regulations to VoIP service.
State and Municipal Taxes
In accordance with generally accepted accounting principles, we make a provision for a liability for taxes when it is both probable that a liability has been incurred and the amount of the liability or range of liability can be reasonably estimated. These provisions are reviewed at least quarterly and adjusted to reflect the impacts of negotiations, settlements, rulings, advice of legal counsel, and other information and events pertaining to a particular case. For a period of time, we did not collect or remit state or municipal taxes (such as sales, excise, utility, use, and ad valorem taxes), fees or surcharges (“Taxes”) on the charges to our customers for our services, except that we historically complied with the New Jersey sales tax. We have received inquiries or demands
from a number of state and municipal taxing and 911 agencies seeking payment of Taxes that are applied to or collected from customers of providers of traditional public switched telephone network services. Although we have consistently maintained that these Taxes do not apply to our service for a variety of reasons depending on the statute or rule that establishes such obligations, we are now collecting and remitting sales taxes in certain of those states including a number of states that have changed their statutes to expressly include VoIP. In addition, many states address how VoIP providers should contribute to support public safety agencies, and in those states we remit fees to the appropriate state agencies. We could also be contacted by state or municipal taxing and 911 agencies regarding Taxes that do explicitly apply to VoIP and these agencies could seek retroactive payment of Taxes. As such, we have a reserve of
$1,763
as of
December 31, 2016
as our best estimate of the potential tax exposure for any retroactive assessment. We believe the maximum estimated exposure for retroactive assessments is approximately
$2,600
as of
December 31, 2016
.
ITEM 4.
Mine Safety Disclosures
Not Applicable.
22 VONAGE ANNUAL REPORT 2016
ITEM 5.
Market for Registrant’s Common Equity, Related Stockholder Matters and Issuer Purchases of Equity Securities
Price Range of Common Stock
Our common stock has been listed on the New York Stock Exchange under the ticker symbol “VG” since May 24, 2006. Prior to that time, there was no public market for our common stock. The
following table sets forth the high and low sales prices for our common stock as reported on the NYSE for the quarterly periods indicated.
|
|
Price Range of Common Stock
|
||||||
|
|
High
|
Low
|
|||||
|
2016
|
|||||||
|
Fourth quarter
|
$
|
7.57
|
|
$
|
6.10
|
|
|
|
Third quarter
|
$
|
6.75
|
|
$
|
5.43
|
|
|
|
Second quarter
|
$
|
6.29
|
|
$
|
3.82
|
|
|
|
First quarter
|
$
|
5.88
|
|
$
|
4.13
|
|
|
|
2015
|
|||||||
|
Fourth quarter
|
$
|
7.42
|
|
$
|
5.61
|
|
|
|
Third quarter
|
$
|
6.69
|
|
$
|
4.59
|
|
|
|
Second quarter
|
$
|
5.20
|
|
$
|
4.44
|
|
|
|
First quarter
|
$
|
5.16
|
|
$
|
3.74
|
|
|
Holders
At January 31, 2017, we had approximately 457 stockholders of record. This number does not include beneficial owners whose shares are held in street name.
Dividends
We have never paid cash dividends on our common stock, and we do not anticipate paying any cash dividends on our common stock for at least the next 12 months. We intend to retain all of our earnings, if any, for general corporate purposes, and, if appropriate, to finance the expansion of our business.
23 VONAGE ANNUAL REPORT 2016
Stock Performance Graph
The graphs below and related information shall not be deemed “soliciting material” or “filed” with the Securities and Exchange Commission or otherwise subject to the liabilities of Section 18 of the Securities Exchange Act of 1934 (the “Exchange Act”), nor shall such information be deemed incorporated by reference into any filing under the Securities Act of 1933 (the “Securities Act”) or the Exchange Act, except to the extent we specifically request that such information be treated as soliciting material or specifically incorporate such information by reference into a document filed under the Securities Act or the Exchange Act.
The graph below compares the cumulative total return of our common stock between December 31,
2011
and
December 31, 2016
, with the cumulative total return of (1) NASDAQ Telecommunications, (2) the S&P 500, and (3) the NYSE Composite (DJ). This graph assumes the investment of $100 on December 31,
2011
in our common stock, the NASDAQ Telecommunications, the S&P 500, and the NYSE Composite (DJ), and assumes the reinvestment of dividends, if any.
|
COMPARISON OF THE CUMULATIVE TOTAL RETURN ON COMMON STOCK BETWEEN DECEMBER 31, 2011 AND DECEMBER 31, 2016
|
Among Vonage Holdings Corp., the NASDAQ Telecommunications, S&P 500, and the NYSE Composite (DJ).
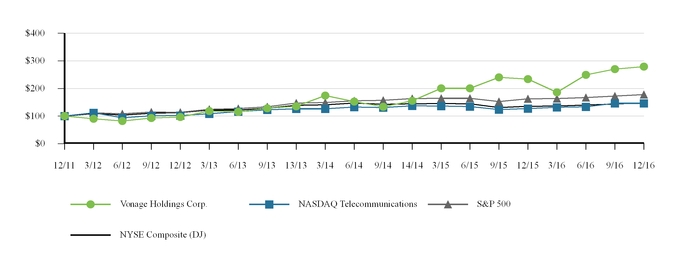
|
|
December 31,
|
||||||||||||||||||
|
|
2012
|
|
2013
|
|
2014
|
|
2015
|
|
2016
|
|
|||||||||
|
Vonage Holdings Corp.
|
$
|
96.73
|
|
$
|
135.92
|
|
$
|
155.51
|
|
$
|
234.29
|
|
$
|
279.59
|
|
||||
|
NASDAQ Telecommunications
|
$
|
102.00
|
|
$
|
126.50
|
|
$
|
137.77
|
|
$
|
127.44
|
|
$
|
146.39
|
|
||||
|
S&P 500
|
$
|
113.41
|
|
$
|
146.98
|
|
$
|
163.72
|
|
$
|
162.53
|
|
$
|
178.02
|
|
||||
|
NASDAQ Composite (DJ)
|
$
|
112.93
|
|
$
|
139.10
|
|
$
|
144.97
|
|
$
|
135.66
|
|
$
|
147.88
|
|
||||
24 VONAGE ANNUAL REPORT 2016
Due to the recent acquisitions, the company entered into the UCaaS and the CPaaS businesses. The management believe that the above indexes may not be the best indexes for comparison purpose for our new business model. In addition, Vonage Holdings Corp. is part of the Russell 2000 Index. The management decided to replace the S&P 500 and NYSE Composite (DJ) with Russell 2000 Index and NASDAQ Computer.
The graph below compares the cumulative total return of our common stock between December 31,
2011
and
December 31, 2016
, with the cumulative total return of (1) NASDAQ Telecommunications, (2) Russell 2000 Index, and (3) NASDAQ Computer. This graph assumes the investment of $100 on December 31,
2011
in our common stock, NASDAQ Telecommunications, Russell 2000 Index, and NASDAQ Computer, and assumes the reinvestment of dividends, if any.
|
COMPARISON OF THE CUMULATIVE TOTAL RETURN ON COMMON STOCK BETWEEN DECEMBER 31, 2011 AND DECEMBER 31, 2016
|
Among Vonage Holdings Corp., the NASDAQ Telecommunications, the Russell 2000 Index, and the NASDAQ Computer.
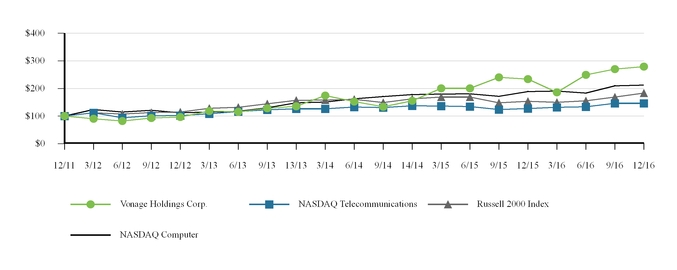
|
|
December 31,
|
||||||||||||||||||
|
|
2012
|
|
2013
|
|
2014
|
|
2015
|
|
2016
|
|
|||||||||
|
Vonage Holdings Corp.
|
$
|
96.73
|
|
$
|
135.92
|
|
$
|
155.51
|
|
$
|
234.29
|
|
$
|
279.59
|
|
||||
|
NASDAQ Telecommunications
|
$
|
102.00
|
|
$
|
126.50
|
|
$
|
137.77
|
|
$
|
127.44
|
|
$
|
146.39
|
|
||||
|
Russell 2000 Index
|
$
|
114.63
|
|
$
|
157.05
|
|
$
|
162.60
|
|
$
|
153.31
|
|
$
|
183.17
|
|
||||
|
NASDAQ Computer
|
$
|
112.48
|
|
$
|
148.41
|
|
$
|
177.91
|
|
$
|
189.02
|
|
$
|
212.21
|
|
||||
Common Stock repurchases
See Note 8 – Common Stock of the Notes to Financial Statements (Part IV of this Form 10-K) for information regarding common stock repurchases by quarter.
On February 7, 2013, Vonage's Board of Directors discontinued the remainder of the
$50,000
repurchase program, announced on July 25, 2012, effective at the close of business on February 12, 2013, with
$16,682
remaining, and authorized a new program to repurchase up to
$100,000
of the Company's outstanding shares. The 2013
$100,000
repurchase program expired on December 31, 2014, with
$219
remaining.
On December 9, 2014, Vonage's Board of Directors authorized a new program for the Company to repurchase up to
$100,000
of its outstanding common stock. Repurchases under the 2014
$100,000
repurchase program are expected to be made over a four-year period beginning in 2015. Under this program, the timing and
amount of repurchases will be determined by management based on its evaluation of market conditions, the trading price of the stock and will vary based on available capital resources and other financial and operational performance, market conditions, securities law limitations, and other factors. Repurchases may be made in the open market or through private transactions from time to time. The repurchases will be made using available cash balances. In any period, cash used in financing activities related to common stock repurchases may differ from the comparable change in stockholders' equity, reflecting timing differences between the recognition of share repurchase transactions and their settlement for cash.
During the three months ended
December 31, 2016
, we did not repurchase Vonage Holdings Corp. common stock. As of
December 31, 2016
, approximately
$52,043
remained of our 2014
$100,000
repurchase program.
25 VONAGE ANNUAL REPORT 2016
ITEM 6.
Selected Financial Data
The following table sets forth our selected historical financial information. The statement of operations and cash flow data for the years ended
December 31, 2016
,
2015
, and
2014
and the balance sheet data as of
December 31, 2016
and
2015
are derived from our audited consolidated financial statements and related notes included elsewhere in this Annual Report on Form 10-K. The statement of operations and cash flow data for the years ended December 31,
2013
and
2012
and the balance sheet data as of
December 31,
2014
,
2013
and
2012
are derived from our audited consolidated financial statements and related notes not included in this Annual Report on Form 10-K. The results included below and elsewhere are not necessarily indicative of our future performance. You should read this information together with “Management’s Discussion and Analysis of Financial Condition and Results of Operations” and our consolidated financial statements and the related notes included elsewhere in this Annual Report on Form 10-K.
|
|
For the years ended December 31,
|
||||||||||||||||||
|
(In thousands, except per share amounts)
|
2016 (1)
|
|
2015 (2)
|
|
2014 (3)
|
|
2013 (4)
|
|
2012
|
|
|||||||||
|
Statement of Operations Data:
|
|||||||||||||||||||
|
Total revenues
|
$
|
955,621
|
|
$
|
895,072
|
|
$
|
868,854
|
|
$
|
829,067
|
|
$
|
849,114
|
|
||||
|
Operating Expenses:
|
|||||||||||||||||||
|
Cost of services (5)
|
321,373
|
|
261,768
|
|
231,383
|
|
237,244
|
|
259,224
|
|
|||||||||
|
Cost of goods sold
|
33,777
|
|
34,210
|
|
36,500
|
|
37,586
|
|
39,133
|
|
|||||||||
|
Sales and marketing
|
330,969
|
|
347,896
|
|
373,737
|
|
366,307
|
|
340,130
|
|
|||||||||
|
Engineering and development
|
29,759
|
|
27,220
|
|
20,869
|
|
14,794
|
|
17,304
|
|
|||||||||
|
General and administrative
|
123,304
|
|
109,153
|
|
98,780
|
|
83,107
|
|
70,127
|
|
|||||||||
|
Depreciation and amortization
|
72,285
|
|
61,833
|
|
49,514
|
|
36,054
|
|
33,324
|
|
|||||||||
|
Loss from abandonment of software assets
|
—
|
|
—
|
|
—
|
|
—
|
|
25,262
|
|
|||||||||
|
|
911,467
|
|
842,080
|
|
810,783
|
|
775,092
|
|
784,504
|
|
|||||||||
|
Income from operations
|
44,154
|
|
52,992
|
|
58,071
|
|
53,975
|
|
64,610
|
|
|||||||||
|
Other Income (Expense):
|
|||||||||||||||||||
|
Interest income
|
79
|
|
89
|
|
207
|
|
307
|
|
109
|
|
|||||||||
|
Interest expense
|
(13,042
|
)
|
(8,786
|
)
|
(6,823
|
)
|
(6,557
|
)
|
(5,986
|
)
|
|||||||||
|
Other (expense) income, net
|
(346
|
)
|
(842
|
)
|
11
|
|
(104
|
)
|
(11
|
)
|
|||||||||
|
(13,309
|
)
|
(9,539
|
)
|
(6,605
|
)
|
(6,354
|
)
|
(5,888
|
)
|
||||||||||
|
Income from continuing operations before income tax expense
|
30,845
|
|
43,453
|
|
51,466
|
|
47,621
|
|
58,722
|
|
|||||||||
|
Income tax (expense) benefit
|
(12,938
|
)
|
(18,418
|
)
|
(21,759
|
)
|
(18,194
|
)
|
(22,095
|
)
|
|||||||||
|
Income from continuing operations
|
$
|
17,907
|
|
$
|
25,035
|
|
$
|
29,707
|
|
$
|
29,427
|
|
$
|
36,627
|
|
||||
|
Loss from discontinued operations
|
—
|
|
(1,615
|
)
|
(10,260
|
)
|
(1,626
|
)
|
—
|
|
|||||||||
|
Loss on disposal, net of taxes
|
—
|
|
(824
|
)
|
—
|
|
—
|
|
—
|
|
|||||||||
|
Discontinued operations
|
—
|
|
(2,439
|
)
|
(10,260
|
)
|
(1,626
|
)
|
—
|
|
|||||||||
|
Net Income
|
17,907
|
|
22,596
|
|
19,447
|
|
27,801
|
|
36,627
|
|
|||||||||
|
Plus: Net loss from discontinued operations attributable to noncontrolling interest
|
$
|
—
|
|
$
|
59
|
|
$
|
819
|
|
$
|
488
|
|
$
|
—
|
|
||||
|
Net income attributable to Vonage
|
$
|
17,907
|
|
$
|
22,655
|
|
$
|
20,266
|
|
$
|
28,289
|
|
$
|
36,627
|
|
||||
|
Net Income per common share - continuing operations:
|
|||||||||||||||||||
|
Basic
|
$
|
0.08
|
|
$
|
0.12
|
|
$
|
0.14
|
|
$
|
0.14
|
|
$
|
0.16
|
|
||||
|
Diluted
|
$
|
0.08
|
|
$
|
0.11
|
|
$
|
0.14
|
|
$
|
0.13
|
|
$
|
0.16
|
|
||||
|
Net Loss per common share - discontinuing operations attributable to Vonage:
|
|||||||||||||||||||
|
Basic
|
—
|
|
(0.01
|
)
|
(0.04
|
)
|
(0.01
|
)
|
—
|
|
|||||||||
|
Diluted
|
—
|
|
(0.01
|
)
|
(0.04
|
)
|
(0.01
|
)
|
—
|
|
|||||||||
|
Net Income per common share - attributable to Vonage:
|
|||||||||||||||||||
|
Basic
|
0.08
|
|
0.11
|
|
0.10
|
|
0.13
|
|
0.16
|
|
|||||||||
|
Diluted
|
0.08
|
|
0.10
|
|
0.09
|
|
0.13
|
|
0.16
|
|
|||||||||
|
Weighted-average common shares outstanding:
|
|||||||||||||||||||
|
Basic
|
215,751
|
|
213,147
|
|
209,822
|
|
211,563
|
|
224,264
|
|
|||||||||
|
Diluted
|
231,941
|
|
224,110
|
|
219,419
|
|
220,520
|
|
232,633
|
|
|||||||||
26 VONAGE ANNUAL REPORT 2016
|
|
For the years ended December 31,
|
||||||||||||||||||
|
(dollars in thousands)
|
2016 (1)
|
|
2015 (2)
|
|
2014 (3)
|
|
2013 (4)
|
|
2012
|
|
|||||||||
|
Statement of Cash Flow Data:
|
|||||||||||||||||||
|
Net cash provided by operating activities
|
$
|
87,012
|
|
$
|
129,731
|
|
$
|
92,542
|
|
$
|
88,243
|
|
$
|
119,843
|
|
||||
|
Net cash used in investing activities
|
(190,733
|
)
|
(152,696
|
)
|
(118,528
|
)
|
(120,985
|
)
|
(25,472
|
)
|
|||||||||
|
Net cash provided by (used in) financing activities
|
74,498
|
|
40,205
|
|
(14,239
|
)
|
21,891
|
|
(56,257
|
)
|
|||||||||
|
|
December 31,
|
||||||||||||||||||
|
(dollars in thousands)
|
2016 (1)
|
|
2015 (2)
|
|
2014 (3)
|
|
2013 (4)
|
|
2012
|
|
|||||||||
|
Balance Sheet Data:
|
|||||||||||||||||||
|
Cash, cash equivalents and marketable securities
|
$
|
29,679
|
|
$
|
67,634
|
|
$
|
47,959
|
|
$
|
84,663
|
|
$
|
97,110
|
|
||||
|
Property and equipment, net
|
48,415
|
|
49,483
|
|
49,630
|
|
52,243
|
|
60,533
|
|
|||||||||
|
Goodwill and intangible assets, net
|
559,619
|
|
360,305
|
|
253,376
|
|
160,477
|
|
6,681
|
|
|||||||||
|
Total deferred tax assets, including current portion, net
|
188,966
|
|
226,572
|
|
247,016
|
|
264,900
|
|
306,113
|
|
|||||||||
|
Restricted cash
|
1,851
|
|
2,587
|
|
3,405
|
|
4,405
|
|
5,656
|
|
|||||||||
|
Total assets
|
940,422
|
|
784,566
|
|
674,460
|
|
642,158
|
|
547,042
|
|
|||||||||
|
Total notes payable and indebtedness under revolving credit facility, including current portion
|
318,874
|
|
210,392
|
|
156,032
|
|
121,075
|
|
42,153
|
|
|||||||||
|
Capital lease obligations
|
3,428
|
|
7,761
|
|
10,201
|
|
13,090
|
|
15,561
|
|
|||||||||
|
Total liabilities
|
499,125
|
|
395,825
|
|
330,963
|
|
304,122
|
|
225,627
|
|
|||||||||
|
Redeemable noncontrolling interest
|
—
|
|
—
|
|
—
|
|
(38
|
)
|
—
|
|
|||||||||
|
Total stockholders’ equity
|
441,297
|
|
388,741
|
|
343,497
|
|
338,074
|
|
321,415
|
|
|||||||||
(1) The year ended December 31, 2016 includes the impacts of the acquisition of Nexmo, which was completed in the second quarter.
(2) The year ended December 31, 2015 includes the impacts of the acquisition of iCore, which was completed in the third quarter and the acquisition of Simple Signal, which was completed in the second quarter.
(3) The year ended December 31, 2014 includes the impact of the acquisition of Telesphere Networks Ltd., which was completed in the fourth quarter.
(4) The year ended December 31, 2013 includes the impact of the acquisition of Vocalocity Inc., which was completed in the fourth quarter.
(5) Excludes depreciation and amortization of
$28,489
for
2016
,
$24,868
for
2015
,
$19,405
for
2014
,
$14,892
for
2013
, and
$15,115
for
2012
.
27 VONAGE ANNUAL REPORT 2016
ITEM 7.
Management’s Discussion and Analysis of Financial Condition and Results of Operations
You should read the following discussion together with “Selected Financial Data” and our consolidated financial statements and the related notes included elsewhere in this Annual Report on Form 10-K. This discussion contains forward-looking statements, which involve risks and uncertainties. Our actual results may differ materially from those we currently anticipate as a result of many factors, including the factors we describe under “Item 1A—Risk Factors,” and elsewhere in this Annual Report on Form 10-K.
|
OVERVIEW
|
We are a leading provider of cloud communications services for businesses and consumers. Our business services transform the way people work and businesses operate through a portfolio of communications solutions that enable internal collaboration among employees, while also keeping companies closely connected with their customers, across any mode of communication, on any cloud-connected device. Vonage customers can choose among or combine two separate service delivery options to suit their specific cloud communication needs. They can buy Vonage Business as a subscription and they can buy our Vonage API Platform and consume our cloud communication as a service product as programmable modules, delivered via application program interfaces (“APIs”). We also provide a robust suite of feature-rich residential communication solutions.
Business
For our Business customers, we provide innovative, cloud-based Unified Communications as a Service, or UCaaS, solutions, comprised of integrated voice, text, video, data, collaboration, and mobile applications over our flexible, scalable Session Initiation Protocol (SIP) based Voice over Internet Protocol, or VoIP, network. Through our acquisition of Nexmo in 2016, we also offer Communications Platform as a Service, or CPaaS, solutions designed to enhance the way businesses communicate with their customers by embedding communications into apps, websites and business processes. In combination, our products and services permit our business customers to communicate with their customers and employees through any cloud-connected device, in any place, at any time without the often costly investment required with on-site equipment. We have a robust set of product families tailored to serve the full range of the business value chain, from the small and medium business, or SMB, market, through mid-market and enterprise markets. We provide customers with multiple deployment options, designed to provide the reliability and quality of service they demand. We provide customers the ability to integrate our cloud communications platform with many cloud-based productivity and CRM solutions, including Google’s G Suite, Zendesk, Salesforce’s Sales Cloud, Oracle, and Clio.
Our Business strategy is to support the full range of business customers, using two product families: Vonage Essentials, based on our proprietary call processing platform that is purpose-built for SMB and mid-market customers; and Vonage Premier, based on Broadsoft’s call processing platform in combination with other Vonage cloud based solutions, which serves larger customers, from mid-market businesses through large enterprises. We also organized our salesforce to address the full business market. We believe operating two platforms at scale enables us to deliver the right products and solutions to address the needs of diverse customers while maximizing our subscriber economics, regardless of segment served. Revenues are generated primarily through the sale of subscriptions for our UCaaS services. Our revenue generation efforts are focused on customer acquisition and retention as well as providing additional services to existing customers as they grow and scale.
Our diverse customer base spans a wide variety of industries, including manufacturing, automotive, legal, information technology, financial services, construction, real estate, engineering, healthcare, and non-profit.
Vonage Essentials.
Vonage Essentials customers subscribe to our cloud-based communication services, delivered through our proprietary platform that is purpose-built for SMB and mid-market customers. Essentials provides a cost-effective, scalable, feature-rich solution, delivered over-the-top of a customer’s broadband, typically month-to-month without a commitment. Vonage Essentials is sold primarily through our direct telesales and online channels, and is increasingly sold through our channel partners and field sales teams. We believe the strength of the Vonage brand directly contributes to a lower-cost customer acquisition model and provides attractive subscriber economics.
Vonage Premier.
Our Vonage Premier offerings are tailor-made for the large mid-market and enterprise segments. Vonage Premier is a feature-rich/fully managed solution that utilizes Broadsoft Inc.’s ("Broadsoft") enterprise-grade call processing platform, in combination with other cloud services like advanced contact center, video conferencing and speak2dial, and can be provided with high-level quality of service ("QoS"), which is generally delivered over our national MPLS network, with 21 network Points of Presence (POPs) across the country. Vonage can also provide QoS-level quality over-the-top of the customer’s broadband through our Smart-WAN router solution. Customers value our proprietary provisioning and feature-management tool, named Zeus, which enables the rapid deployment of solutions directly by Vonage while giving full visibility to our channel partners and our customers. Further differentiating Vonage is our robust service delivery team comprised of team members specializing in project management, voice and data provisioning, and line number porting. This team is intensely focused on providing an outstanding customer experience, and is rapidly becoming a competitive differentiator.
Our Vonage Premier offering is sold primarily through our channel partners, and our field and enterprise sales teams, and generally requires a three-year contract. We are a preferred provider for many of the largest master agents in the country, harnessing a network of over 20,000 sub agents selling both Vonage Premier and Vonage Essentials. We believe we have one of the largest multi-channel distribution sales platforms in our industry to serve the full range of business customers. We plan to capitalize on the growing adoption of cloud-based communications and collaboration solutions by continuing to expand our salesforce, expand into new markets, and enhance our relationships with existing customers to provide additional functionality and overall business value that can be achieved with our UCaaS platform.
Nexmo, the Vonage API Platform
. We are a global leader in the CPaaS segment of the cloud communications market, providing innovative communication APIs for text messaging and voice communications, allowing developers and enterprises to embed contextual communications into mobile apps, websites and business workflows via text, social media, chat apps and voice. With just few lines of code, developers can send and receive text messages and build programmable voice applications. Nexmo, the Vonage API Platform can scale from one API call to billions. The platform makes it easy for any of our over 200,000 developers to access communication services via software and APIs. Through Nexmo we have a global network of interconnected carriers delivering our API-based communications platform, enabling businesses to communicate with their customers reliably and with ease, no matter where in the world they are located. The addition of our Nexmo products to our Business offering allows our customers to address their full communications needs, from employee
28 VONAGE ANNUAL REPORT 2016
to employee communications through business to customer communications.
Consumer
For our Consumer customers, we enable users to access and utilize our services and features, via a single “identity,” either a number or user name, regardless of how they are connected to the Internet, including over 3G, LTE, Cable, or DSL broadband networks. This technology enables us to offer our Consumer customers attractively priced voice and messaging services and other features around the world on a variety of devices.
Our Consumer strategy is focused on the continued penetration of our core North American markets, where we will continue to provide value in international long distance and target under-served ethnic segments. The markets for international long distance allow us to leverage our VoIP network by providing customers a low-cost and feature-rich alternative to services offered by telecom, cable, and international calling card providers.
We generate revenue through the acquisition and retention of Consumer customers. We are focused on optimizing the Consumer business for profitability to improve the strong cash flows of the business. During 2016, we continued our disciplined focus on marketing efficiency by shifting customer acquisition spend to our higher performing channels, improving the quality of customers we acquire and driving lower churn, all of which drive higher customer life-time value. This focus has led to a reallocation of marketing spend to our Business segment.
The result of these initiatives has been to create a strong cash flow business which provides financial stability, as well as cost synergies and structural advantages to our Business segment.
Services outside of the United States
. We currently have UCaaS and consumer operations in the United States, United Kingdom, and Canada and believe that our low-cost Internet based communications platform enables us to cost effectively deliver voice and messaging services to other locations throughout the world. Through Nexmo, we have operations in the United States, United Kingdom, Hong Kong, and Singapore, and provide CPaaS solutions to our customers located in many countries around the world.
Trends in Our Industry
A number of trends in our industry have a significant effect on our results of operations and are important to an understanding of our financial statements.
Competitive landscape.
We face intense competition from traditional telephone companies, wireless companies, cable companies, and alternative communication providers. Most traditional wireline and wireless telephone service providers and cable companies are substantially larger and better capitalized than we are and have the advantage of a large existing customer base. In addition, because our competitors provide other services, they often choose to offer VoIP services or other voice services as part of a bundle that includes other products, such as video, high speed Internet access, and wireless telephone service, which we do not offer. In addition, such competitors may in the future require new customers or existing customers making changes to their service to purchase voice services when purchasing
high speed Internet access. Further, as wireless providers offer more minutes at lower prices, better coverage, and companion landline alternative services, their services have become more attractive to households as a replacement for wireline service. We also compete against alternative communication providers, such as magicJack, Skype, and Google Voice. Some of these service providers have chosen to sacrifice telephony revenue in order to gain market share and have offered their services at low prices or for free. As we continue to introduce applications that integrate different forms of voice and messaging services over multiple devices, we are facing competition from emerging competitors focused on similar integration, as well as from alternative voice communication providers. In addition, our competitors have partnered and may in the future partner with other competitors to offer products and services, leveraging their collective competitive positions. We also are subject to the risk of future disruptive technologies. In connection with our emphasis on the international long distance market in the United States, we face competition from low-cost international calling cards and VoIP providers in addition to traditional telephone companies, cable companies, and wireless companies, each of which may implement promotional pricing targeting international long distance callers.
Regulation.
Our business has developed in a relatively lightly regulated environment. The United States and other countries, however, are examining how VoIP services should be regulated. In particular, state telecommunications regulators continue to try to regulate VoIP service despite the FCC’s 2004 Vonage Preemption Order that preempted state regulation. For example, on July 28, 2015, the Minnesota Public Utility Commission found that it has authority to regulate Charter’s ‘fixed' interconnected VoIP service. In addition to regulatory matters that directly address VoIP, a number of other regulatory initiatives could impact our business. One such regulatory initiative is net neutrality. On February 26, 2015, the FCC adopted strong net neutrality rules. On June 14, 2016, the D.C. Circuit of Appeals denied the upheld these rules. Several parties requested rehearing en banc. These petitions are currently pending. See also the discussion under "Regulation" in Note 10 to our financial statements for a discussion of regulatory issues that impact us.
Key Operating Data
Through our acquisitions of Vocalocity, Telesphere, Simple Signal, iCore, and Nexmo, our business has substantially evolved in recent quarters, with business customers now accounting for a substantial and growing portion of overall revenues. To reflect this evolution, we have made certain changes to our key operating data and income statement presentation to provide greater visibility into the operating metrics of the business. The key changes to the income statement include the combination of sales and marketing expenses into a new sales and marketing caption, separated from selling, general, and administrative expenses. A new line item entitled engineering and development has also been created, reflecting the cost of developing new products and technologies and supporting our service platforms. The remaining selling, general and administrative expenses after the above reclassifications have been renamed general and administrative expenses. The reclassifications have been reflected in all periods presented and had no impact on net earnings previously reported.
The table below includes key operating data that our management uses to measure the growth and operating performance of the business focused portion of our business:
|
Business
|
For the Years Ended December 31,
|
||||||||||
|
2016
|
|
2015
|
|
2014
|
|
||||||
|
Revenues (1)
|
$
|
376,352
|
|
$
|
219,027
|
|
$
|
94,444
|
|
||
|
Average monthly revenues per seat (2)
|
$
|
44.94
|
|
$
|
42.79
|
|
$
|
32.44
|
|
||
|
Seats (at period end) (2)
|
638,096
|
|
541,884
|
|
311,193
|
|
|||||
|
Revenue churn (2)
|
1.4
|
%
|
1.2
|
%
|
1.2
|
%
|
|||||
|
Registered developers (3)
|
206,734
|
|
N/A
|
|
N/A
|
|
|||||
(1) Includes revenues of $58,148 from CPaaS for the year ended
December 31, 2016
.
(2) UCaaS only.
29 VONAGE ANNUAL REPORT 2016
(3) CPaaS only.
Revenues.
Business revenues includes revenues from our business customers from acquired entities and excludes revenues from our legacy business customers.
Average monthly revenues per seat.
Average monthly revenues per seat for a particular period is calculated by dividing our revenues for that period by the simple average number of seats for the period, and dividing the result by the number of months in the period. The simple average number of seats for the period is the number of seats on the first day of the period, plus the number of seats on the last day of the period, divided by two. Our average monthly revenues per seat increased from
$42.79
for
2015
to
$44.94
for
2016
due to our successful acquisitions and subsequent organic growth in the mid-market and enterprise space.
Seats.
Seats include, as of a particular date, all paid seats from which a customer can make an outbound telephone call on that date and virtual seats. Seats exclude electronic fax lines and toll free numbers, which do not allow outbound telephone calls by customers. Seats increased from
541,884
as of
December 31, 2015
to
638,096
as of
December 31, 2016
. This increase is due to continued growth in our business customers as we have increased marketing investment to attract these more profitable customers. It also includes 48,920 seats existing at Telesphere at the time of acquisition, 35,256 seats existing at Simple Signal at the time of acquisition, and 86,309 seats existing at iCore at the time of acquisition.
Revenue churn.
Revenue churn is calculated by dividing the monthly recurring revenue from customers that have terminated during
a period by the simple average of the total monthly recurring revenue from all customers in a given period. The simple average of total monthly recurring revenue from all customers during the period is the total monthly recurring revenue on the first day of the period, plus the total monthly recurring revenue on the last day of the period, divided by two. Terminations, as used in the calculation of churn statistics, do not include customers terminated during the period if termination occurred within the first month after activation. Other companies may calculate revenue churn differently, and their revenue churn data may not be directly comparable to ours. Revenue churn increased from
1.2%
for the year ended
2015
to
1.4%
for the year ended
2016
. Revenue churn was flat at
1.4%
for the three months ended
December 31, 2016
and for the three months ended
September 30, 2016
, and increased from
1.1%
for the three months ended
December 31, 2015
. Our revenue churn will fluctuate over time due to economic conditions, loss of customers who are acquired, and competitive pressures including promotional pricing. We are continuing to invest in our overall quality of service which includes customer care headcount and systems, billing systems, on-boarding processes and self-service options to ensure we scale our processes to our growth and continue to improve the overall customer experience.
Registered developers.
Our registered developers represent the cumulative number of developers that have signed up through the registration processes through the Nexmo website.
The table below includes key operating data that our management uses to measure the growth and operating performance of the consumer focused portion of our business:
|
Consumer
|
For the Years Ended December 31,
|
||||||||||
|
2016
|
|
2015
|
|
2014
|
|
||||||
|
Revenues
|
$
|
579,269
|
|
$
|
676,045
|
|
$
|
774,410
|
|
||
|
Average monthly revenues per subscriber line
|
$
|
26.43
|
|
$
|
27.58
|
|
$
|
28.64
|
|
||
|
Subscriber lines (at period end)
|
1,711,366
|
|
1,940,825
|
|
2,144,681
|
|
|||||
|
Customer churn
|
2.2
|
%
|
2.3
|
%
|
2.6
|
%
|
|||||
Revenues.
Consumer revenues represents revenue from our consumer customers including revenues from our legacy business customers using Vonage VoIP products.
Average monthly revenues per subscriber line.
Average monthly revenues per subscriber line for a particular period is calculated by dividing our revenues for that period by the simple average number of subscriber lines for the period, and dividing the result by the number of months in the period. The simple average number of subscriber lines for the period is the number of subscriber lines on the first day of the period, plus the number of subscriber lines on the last day of the period, divided by two. Our average monthly revenues per subscriber line decreased from
$27.58
for
2015
to
$26.43
for
2016
due primarily to new, lower, pricing structures implemented in 2015 and lower ILD pay-per-use revenue.
Subscriber lines.
Our subscriber lines include, as of a particular date, all paid subscriber lines from which a customer can make an outbound telephone call on that date. Our subscriber lines include fax lines, including fax lines bundled with subscriber lines in our small office home office calling plans and soft phones, but do not include our virtual phone numbers and toll free numbers, which only allow inbound telephone calls to customers. Subscriber lines decreased from
1,940,825
as of
December 31, 2015
to
1,711,366
as of
December 31, 2016
, reflecting planned actions to enhance the profitability of the assisted sales channel by eliminating lower performing locations and restructuring the pricing offers, and to shift investment to our business market. In addition, beginning October 1, 2014, the Company no longer
charges for second line mobile Extensions provided to customers, which resulted in a decrease in subscriber lines of 78,949. Future period subscriber line metrics will continue to reflect the reduction in paid subscriber lines resulting from this benefit to customers.
Customer churn.
Customer churn is calculated by dividing the number of customers that have terminated during a period by the simple average of number of customers in a given period. The simple average number of customers during the period is the number of customers on the first day of the period, plus the number of customers on the last day of the period, divided by two. Terminations, as used in the calculation of churn statistics, do not include customers terminated during the period if termination occurred within the first month after activation. Other companies may calculate customer churn differently, and their customer churn data may not be directly comparable to ours. Customer churn decreased to
2.2%
for
2016
from
2.3%
for
2015
.The decrease was due primarily to our decision to maximize customer value by focusing marketing spend on higher return channels and away from assisted selling channels which had higher early life churn. Customer churn was flat at
2.2%
for the three months ended
December 31, 2016
, for the three months ended
September 30, 2016
, and for the three months ended
December 31, 2015
. We monitor customer churn on a daily basis and use it as an indicator of the level of customer satisfaction. Customers who have been with us for a year or more tend to have a lower churn rate than customers who have not. In addition, our customers who are international callers generally churn at a lower rate than customers who are domestic callers. Our customer churn will fluctuate over time due to economic conditions, competitive pressures
30 VONAGE ANNUAL REPORT 2016
including promotional pricing targeting international long distance callers, marketplace perception of our services, and our ability to provide high quality customer care and network quality and add future innovative products and services. Customer churn differs from our previously reported average monthly customer churn in that our business customers are no longer included in this metric. See the discussion below for detail regarding churn impacting our business customers.
|
REVENUES
|
Revenues consist of services revenue and customer equipment and shipping revenue. Substantially all of our revenues are services revenue. For consumer customers in the United States, we offer domestic and international rate plans, including a variety of residential plans and mobile plans. The “Vonage World” plan, available in the United States and Canada, offers unlimited calling across the United States and Puerto Rico, unlimited international calling to over 60 countries including India, Mexico, and China, subject to certain restrictions, and free voicemail to text messages with Vonage Visual Voicemail. Each of our unlimited plans other than Vonage World offers unlimited domestic calling as well as unlimited calling to Puerto Rico, Canada, and selected European countries, subject to certain restrictions. Each of our basic plans offers a limited number of domestic calling minutes per month. We offer similar plans in Canada. Under our basic plans, we charge on a per minute basis when the number of domestic calling minutes included in the plan is exceeded for a particular month. International calls (except for calls to Puerto Rico, Canada and certain European countries under our unlimited plans and a variety of countries under international calling plans and Vonage World) are charged on a per minute basis. These per minute fees are not included in our monthly subscription fees. Through our acquisitions of Vocalocity, Telesphere, Simple Signal, and iCore, we offer SMB, mid-market, and enterprise customers several service plans with different pricing structures and contractual requirements ranging in duration from month-to-month to three years. The service plans include an array of basic and enhanced features applicable to the needs of SMB and SOHO customers. In addition, we provide managed equipment to business customers for which the customers pay a monthly fee. Customers also have the opportunity to purchase premium features for additional fees. In addition, through our acquisition of Nexmo we derive revenue from usage-based fees earned from customers using our cloud-based software products. These usage-based software products include our messaging, voice, Verify and chat APIs. Usage-based fees include number of text messages sent or received using our messaging APIs, minutes of call duration activity for our voice APIs, and number of converted authentications for our Verify API.
We derive most of our services revenue from monthly subscription fees that we charge our customers under our service plans. We also offer consumer fax service, virtual phone numbers, toll free numbers and other services, and charge an additional monthly fee for each service. We automatically charge these fees to our customers’ credit cards, debit cards, or electronic check payments (“ECP”), monthly in advance. We also automatically charge the per minute fees not included in our monthly subscription fees to our customers’ credit cards, debit cards or ECP monthly in arrears unless they exceed a certain dollar threshold, in which case they are charged immediately.
By collecting monthly subscription fees in advance and certain other charges immediately after they are incurred, we are able to reduce the amount of accounts receivable that we have outstanding, thus allowing us to have lower working capital requirements. Collecting in this manner also helps us mitigate bad debt losses, which are recorded as a reduction to revenue. If a customer’s credit card, debit card or ECP is declined, we generally suspend international calling capabilities as well as the customer’s ability to incur domestic usage charges in excess of their plan minutes. Historically, in most cases, we are able to correct the problem with the customer within the current monthly billing cycle. If the customer’s credit card, debit card or ECP could not be successfully processed during three billing cycles (i.e., the current and two subsequent monthly billing cycles), we terminate the account.
In the United States, we charge regulatory, compliance, E-911, and intellectual property-related recovery fees on a monthly basis to defray costs, and to cover taxes that we are charged by the suppliers of telecommunications services. In addition, we recognize revenue on a gross basis for contributions to the Federal Universal Service Fund (“USF”) and related fees. All other taxes are recorded on a net basis.
In addition, in certain instances, we charge disconnect fees which are recognized as revenue at the time the disconnect fees are collected from our customer.
Services revenue is offset by the cost of certain customer acquisition activities, such as rebates and promotions.
Customer equipment and shipping revenue consists of revenue from sales of customer equipment to our wholesalers or directly to customers and retailers. In addition, customer equipment and shipping revenues include revenues from the sale of VoIP telephones in order to access our small and medium business services. Customer equipment and shipping revenue also includes the fees, when collected, that we charge our customers for shipping any equipment to them.
|
OPERATING EXPENSES
|
Operating expenses consist of cost of service, cost of goods sold, sales and marketing expense, engineering and development expense, general and administrative expense, and depreciation and amortization.
Cost of services.
C
ost of services primarily consists of fees that we pay to third parties on an ongoing basis in order to provide our services. These fees include:
|
>
|
Access charges that we pay to other telephone companies to terminate domestic and international calls on the public switched telephone network, with a portion of these payments ultimately being made to incumbent telephone companies. When a Vonage subscriber calls another Vonage subscriber, we do not pay an access charge.
|
|
>
|
The cost of leasing Internet transit services from multiple Internet service providers. This Internet connectivity is used to carry VoIP session initiation signaling and packetized audio media between our subscribers and our regional data centers.
|
|
>
|
The cost of leasing from other companies the telephone numbers that we provide to our customers. We lease these telephone numbers on a monthly basis.
|
|
>
|
The cost of co-locating our regional data connection point equipment in third-party facilities owned by other companies, Internet service providers or collocation facility providers.
|
|
>
|
The cost of providing local number portability, which allows customers to move their existing telephone numbers from another provider to our service. Only regulated telecommunications providers have access to the centralized number databases that facilitate this process. Because we are not a regulated telecommunications provider, we must pay other telecommunications providers to process our local number portability requests.
|
|
>
|
The cost of complying with FCC regulations regarding VoIP emergency services, which require us to provide enhanced emergency dialing capabilities to transmit 911 calls for our customers.
|
|
>
|
Taxes that we pay on our purchase of telecommunications services from our suppliers or imposed by government agencies such as Federal USF and related fees.
|
|
>
|
License fees for use of third party intellectual property.
|
|
>
|
The personnel and related expenses of certain network operations and technical support employees and contractors.
|
Cost of goods sold.
C
ost of goods sold primarily consists of costs that we incur when a customer first subscribes to our service. These costs include:
31 VONAGE ANNUAL REPORT 2016
|
>
|
The cost of equipment sold to our customers or retailers.
|
|
>
|
The cost of shipping and handling
.
|
|
>
|
The cost of certain products including equipment or services that we give customers as promotions.
|
Sales and marketing expense.
Sales and marketing expense includes:
|
>
|
Advertising costs, which comprise a majority of our sales and marketing expense and include online, television, direct mail, alternative media, promotions, sponsorships, and inbound and outbound telemarketing.
|
|
>
|
Creative and production costs.
|
|
>
|
The costs to serve and track our online advertising.
|
|
>
|
Certain amounts we pay to retailers for activation commissions.
|
|
>
|
The cost associated with our customer referral program.
|
|
>
|
The personnel and related expenses of sales and marketing employees and contractors.
|
|
>
|
Transaction fees paid to credit card, debit card, and ECP companies and other third party billers such as iTunes, which may include a per transaction charge in addition to a percent of billings charge.
|
|
>
|
The cost of customer support and collections.
|
|
>
|
Systems and information technology support.
|
Engineering and development expense.
Engineering and development expense includes:
|
>
|
The personnel and related expenses of developers responsible for new products and software engineers maintaining and enhancing existing products.
|
General and administrative expense.
General and administrative expense includes:
|
>
|
Personnel and related costs for executive, legal, finance, and human resources employees and contractors.
|
|
>
|
Share-based expense related to share-based awards to employees, directors, and consultants.
|
|
>
|
Rent and related expenses.
|
|
>
|
Professional fees for legal, accounting, tax, public relations, lobbying, and development activities.
|
|
>
|
Acquisition related transaction and integration costs.
|
|
>
|
Litigation settlements.
|
Depreciation and amortization expenses.
Depreciation and amortization expenses include:
|
>
|
Depreciation of our network equipment, furniture and fixtures, and employee computer equipment.
|
|
>
|
Depreciation of Company-owned equipment in use at customer premises.
|
|
>
|
Amortization of leasehold improvements and purchased and developed software.
|
|
>
|
Amortization of intangible assets (developed technology, customer relationships, non-compete agreements, patents, trademarks and trade names).
|
|
>
|
Loss on disposal or impairment of property and equipment.
|
Loss from abandonment of software assets.
Loss from abandonment of software assets include:
|
>
|
Impairment of investment in software assets.
|
|
OTHER INCOME (EXPENSE)
|
Other Income (Expense) includes:
|
>
|
Interest income on cash and cash equivalents.
|
|
>
|
Interest expense on notes payable, patent litigation judgments and settlements, and capital leases.
|
|
>
|
Amortization of debt related costs.
|
|
>
|
Accretion of notes.
|
|
>
|
Realized and unrealized gains (losses) on foreign currency.
|
|
>
|
Gain (loss) on extinguishment of notes.
|
|
>
|
Realized gains (losses) on sale of marketable securities.
|
32 VONAGE ANNUAL REPORT 2016
|
RESULTS OF OPERATION
|
The following table sets forth, as a percentage of consolidated operating revenues, our consolidated statement of income for the periods indicated:
|
|
For the Years Ended December 31,
|
|||||||
|
|
2016
|
2015
|
2014
|
|||||
|
Revenues
|
100
|
%
|
100
|
%
|
100
|
%
|
||
|
Operating Expenses:
|
||||||||
|
Cost of services (excluding depreciation and amortization)
|
34
|
|
29
|
|
27
|
|
||
|
Cost of goods sold
|
3
|
|
4
|
|
4
|
|
||
|
Sales and marketing
|
35
|
|
39
|
|
43
|
|
||
|
Engineering and development
|
3
|
|
3
|
|
2
|
|
||
|
General and administrative
|
13
|
|
12
|
|
11
|
|
||
|
Depreciation and amortization
|
7
|
|
7
|
|
6
|
|
||
|
|
95
|
|
94
|
|
93
|
|
||
|
Income from operations
|
5
|
|
6
|
|
7
|
|
||
|
Other Income (Expense):
|
||||||||
|
Interest income
|
—
|
|
—
|
|
—
|
|
||
|
Interest expense
|
(2
|
)
|
(1
|
)
|
(1
|
)
|
||
|
Other expense, net
|
—
|
|
—
|
|
—
|
|
||
|
|
(2
|
)
|
(1
|
)
|
(1
|
)
|
||
|
Income from continuing operation before income tax expense
|
3
|
|
5
|
|
6
|
|
||
|
Income tax expense
|
(1
|
)
|
(2
|
)
|
(3
|
)
|
||
|
Income from continuing operations
|
2
|
|
3
|
|
3
|
|
||
|
Loss from discontinued operations
|
—
|
|
—
|
|
(1
|
)
|
||
|
Loss on disposal, net of taxes
|
—
|
|
—
|
|
—
|
|
||
|
Discontinued operations
|
—
|
|
—
|
|
(1
|
)
|
||
|
Net income
|
2
|
|
3
|
|
2
|
|
||
|
Plus: Net loss from discontinued operations attributable to noncontrolling interest
|
—
|
|
—
|
|
—
|
|
||
|
Net income attributable to Vonage
|
2
|
%
|
3
|
%
|
2
|
%
|
||
Summary of Results for the Years Ended
December 31, 2016
,
2015
, and
2014
|
Revenues, Cost of Services and Cost of Goods Sold
|
For the years ended December 31,
|
Dollar Change 2016 vs. 2015
|
|
Dollar Change 2015 vs. 2014
|
|
Percent Change 2016 vs. 2015
|
|
Percent Change
2015 vs. 2014 |
|
||||||||||||||||
|
(in thousands, except percentages)
|
2016
|
|
2015
|
|
2014
|
|
|||||||||||||||||||
|
Revenues
|
$
|
955,621
|
|
$
|
895,072
|
|
$
|
868,854
|
|
$
|
60,549
|
|
$
|
26,218
|
|
7
|
%
|
3
|
%
|
||||||
|
Cost of services (1)
|
321,373
|
|
261,768
|
|
231,383
|
|
59,605
|
|
30,385
|
|
23
|
%
|
13
|
%
|
|||||||||||
|
Cost of goods sold
|
33,777
|
|
34,210
|
|
36,500
|
|
(433
|
)
|
(2,290
|
)
|
(1
|
)%
|
(6
|
)%
|
|||||||||||
(1) Excludes depreciation and amortization of
$28,489
,
$24,868
, and
$19,405
, respectively.
Segments
Historically, we have had two operating segments that we have aggregated for reporting purposes. In 2016, as a result of the acquisition of Nexmo, we no longer meet the aggregation criteria for operating segments and now have the following
two
reportable segments:
Business
For our Business customers, we provide innovative, cloud-based Unified Communications as a Service, or UCaaS, solutions, comprised of integrated voice, text, video, data, collaboration, and mobile applications over our flexible, scalable Session Initiation Protocol
(SIP) based Voice over Internet Protocol, or VoIP, network. Through Nexmo, the Vonage API Platform, we also offer Communications Platform as a Service, or CPaaS, solutions designed to enhance the way businesses communicate with their customers embedding communications into apps, websites and business processes. Together we have a robust set of product families tailored to serve the full range of the business value chain, from the small and medium business, or SMB, market, through mid-market and enterprise markets. We provide customers with multiple deployment options, designed to provide the reliability and quality of service they demand. We provide customers the ability to integrate our cloud communications platform with many cloud-based productivity and CRM solutions, including Google’s G Suite, Zendesk, Salesforce’s Sales Cloud, Oracle, Clio, and other CRM
33 VONAGE ANNUAL REPORT 2016
solutions. In combination, our products and services permit our business customers to communicate with their customers and employees through any cloud-connected device, in any place, at any time without the often costly investment required with on-site equipment.
Consumer
For our Consumer customers, we enable users to access and utilize our UCaaS services and features, via a single “identity,” either a number or user name, regardless of how they are connected to the Internet, including over 3G, LTE, Cable, or DSL broadband networks. This technology enables us to offer our Consumer customers attractively priced voice and messaging services and other features around the world on a variety of devices.
For our segments we categorize revenues as follows:
Services revenues.
Services revenues consists primarily of revenue attributable to our communication services for Consumer and UCaaS and CPaaS services for Business,
Product revenues
. Product revenues includes equipment sold to customers, shipping and handling, professional services, and broadband access.
USF revenues.
USF revenues represent contributions to the Federal Universal Service Fund (“USF”) and related fees.
For our segments we categorize cost of revenues as follows:
Services cost of revenues.
Services cost of revenues consists of costs associated with network operations and technical support personnel, communication origination, and termination services provided by third party carriers and excludes depreciation and amortization.
Product cost of revenues
. Product cost of revenues includes equipment sold to customers, shipping and handling, professional services, cost of certain products including equipment or services that we give customers as promotions,
and broadband access.
USF cost of revenues.
USF cost of revenues represent contributions to the Federal Universal Service Fund (“USF”) and related fees.
Summary of Business Revenues, Cost of Revenues and Gross Margin for the Years Ended
December 31, 2016
,
2015
, and
2014
|
Business Revenues, Cost of Revenues and Gross Margin
|
For the years ended December 31,
|
Dollar Change 2016 vs. 2015
|
|
Dollar Change 2015 vs. 2014
|
|
Percent Change 2016 vs. 2015
|
|
Percent Change
2015 vs. 2014 |
|
||||||||||||||||
|
(in thousands, except percentages)
|
2016
|
|
2015
|
|
2014
|
|
|||||||||||||||||||
|
Revenues
|
|||||||||||||||||||||||||
|
Service revenues
|
$
|
301,877
|
|
$
|
170,489
|
|
$
|
89,198
|
|
$
|
131,388
|
|
$
|
81,291
|
|
77
|
%
|
91
|
%
|
||||||
|
Product revenues (1)
|
52,450
|
|
35,545
|
|
2,041
|
|
16,905
|
|
33,504
|
|
48
|
%
|
—
|
%
|
|||||||||||
|
Service and product revenues
|
354,327
|
|
206,034
|
|
91,239
|
|
148,293
|
|
114,795
|
|
72
|
%
|
126
|
%
|
|||||||||||
|
USF revenues
|
22,025
|
|
12,993
|
|
3,205
|
|
9,032
|
|
9,788
|
|
70
|
%
|
305
|
%
|
|||||||||||
|
Total revenues
|
376,352
|
|
219,027
|
|
94,444
|
|
157,325
|
|
124,583
|
|
72
|
%
|
132
|
%
|
|||||||||||
|
Cost of revenues
|
|||||||||||||||||||||||||
|
Service cost of revenues (2)
|
111,485
|
|
44,997
|
|
17,885
|
|
66,488
|
|
27,112
|
|
148
|
%
|
152
|
%
|
|||||||||||
|
Product cost of revenues (1)
|
51,129
|
|
31,185
|
|
6,861
|
|
19,944
|
|
24,324
|
|
64
|
%
|
355
|
%
|
|||||||||||
|
Service and product cost of revenues
|
162,614
|
|
76,182
|
|
24,746
|
|
86,432
|
|
51,436
|
|
113
|
%
|
208
|
%
|
|||||||||||
|
USF cost of revenues
|
22,036
|
|
13,022
|
|
3,248
|
|
9,014
|
|
9,774
|
|
69
|
%
|
301
|
%
|
|||||||||||
|
Total cost of revenues
|
184,650
|
|
89,204
|
|
27,994
|
|
95,446
|
|
61,210
|
|
107
|
%
|
219
|
%
|
|||||||||||
|
Gross margin
|
|||||||||||||||||||||||||
|
Service margin
|
190,392
|
|
125,492
|
|
71,313
|
|
64,900
|
|
54,179
|
|
52
|
%
|
76
|
%
|
|||||||||||
|
Gross margin ex-USF (Service and product margin)
|
191,713
|
|
129,852
|
|
66,493
|
|
61,861
|
|
63,359
|
|
48
|
%
|
95
|
%
|
|||||||||||
|
Gross margin
|
$
|
191,702
|
|
$
|
129,823
|
|
$
|
66,450
|
|
$
|
61,879
|
|
$
|
63,373
|
|
48
|
%
|
95
|
%
|
||||||
|
Gross margin %
|
|||||||||||||||||||||||||
|
Service margin %
|
63.1
|
%
|
73.6
|
%
|
79.9
|
%
|
|||||||||||||||||||
|
Gross margin ex-USF (Service and product margin) %
|
54.1
|
%
|
63.0
|
%
|
72.9
|
%
|
|||||||||||||||||||
|
Gross margin %
|
50.9
|
%
|
59.3
|
%
|
70.4
|
%
|
|||||||||||||||||||
(1) Includes customer premise equipment, access, professional services, and shipping and handling.
(2) Excludes depreciation and amortization of
$18,820
,
$15,819
, and
$6,487
, respectively.
34 VONAGE ANNUAL REPORT 2016
2016
compared to
2015
Service revenues.
Service revenues increased by
$131,388
, or
77%
, due mainly to the increase in the number of Business seats as we have shifted marketing investment to attract more profitable business customers and the impact of Simple Signal, which was acquired on April 1, 2015, the impact of iCore, which was acquired on August 31, 2015, and the impact of Nexmo, which was acquired on June 3, 2016.
Product revenues.
Product revenues increased by
$16,905
, or
48%
, due to the increase in customers' equipment and broadband access revenues as a result of higher new customer additions and higher installation revenues, as well as the acquisition of Simple Signal in April 2015, the acquisition of iCore in August 2015, and the acquisition of Nexmo in June 2016.
USF revenues.
USF revenues increased by
$9,032
, or
70%
, due to the increase in the number of Business seats, the addition of Simple Signal in April 2015, the addition of iCore in August 2015, and the addition of Nexmo in June 2016.
Service cost of revenues.
Service cost of revenues increased by
$66,488
, or
148%
, primarily driven by higher technical care costs and network operations cost in support of growth in segment including the addition of Simple Signal in April 2015, the addition of iCore in August 2015, and the addition of Nexmo in June 2016.
Product cost of revenues.
Product (including access) cost of revenues increased by
$19,944
, or
64%
, due to the increase in customers' equipment and broadband access costs as a result of higher new customer additions and higher installation costs, as well as the acquisition of Simple Signal in April 2015, the acquisition of iCore in August 2015, and the acquisition of Nexmo in June 2016.
USF cost of revenues.
USF cost of revenues increased by
$9,014
, or
69%
, due to the increase in the number of Business seats, the addition of Simple Signal in April 2015, the addition of iCore in August 2015, and the addition of Nexmo in June 2016.
2015
compared to
2014
Service revenues.
Service
r
evenues increased by
$81,291
, or
91%
, due mainly to the increase in the number of Business seats as we have shifted marketing investment to attract more profitable business customers and the impact of Telesphere, which was acquired in December 15, 2014, the impact of Simple Signal, which was acquired on April 1, 2015, and the impact of iCore, which was acquired on August 31, 2015,.
Product revenues.
Product revenues increased by
$33,504
, or
0%
, due to the increase in customers' equipment and broadband access revenues as a result of higher new customer additions and higher installation revenues, as well as the acquisition of Telesphere in December 2014, the acquisition of Simple Signal in April 2015, and the acquisition of iCore in August 2015.
USF revenues.
USF revenues increased by
$9,788
, or
305%
, due to the increase in the number of Business seats, the addition of Telesphere in December 2014, the addition of Simple Signal in April 2015, and the addition of iCore in August 2015.
Service cost of revenues.
Service cost of revenues increased by
$27,112
, or
152%
, primarily driven by higher technical care costs and network operations cost in support of growth in segment including the addition of Telesphere in December 2014, the addition of Simple Signal in April, and the addition of iCore in August 2015.
Product cost of revenues.
Product cost of revenues increased by
$24,324
, or
355%
, primarily due to the increase in customers' equipment and broadband access costs due to higher new customer additions and higher installation costs, as well as the acquisition of Telesphere in December 2014, the acquisition of Simple Signal in April 2015, and the acquisition of iCore in August 2015.
USF cost of revenues.
USF cost of revenues increased by
$9,774
, or
301%
, due to the increase in the number of Business seats, the addition of Telesphere in December 2014, the addition of Simple Signal in April 2015, and the addition of iCore in August 2015.
35 VONAGE ANNUAL REPORT 2016
Summary of Consumer Revenues, Cost of Revenues and Gross Margin for the Years Ended
December 31, 2016
,
2015
, and
2014
|
Consumer Revenues, Cost of Revenues and Gross Margin
|
For the years ended December 31,
|
Dollar Change 2016 vs. 2015
|
|
Dollar Change 2015 vs. 2014
|
|
Percent Change 2016 vs. 2015
|
|
Percent Change
2015 vs. 2014 |
|
||||||||||||||||
|
(in thousands, except percentages)
|
2016
|
|
2015
|
|
2014
|
|
|||||||||||||||||||
|
Revenues
|
|||||||||||||||||||||||||
|
Service revenues
|
$
|
522,515
|
|
$
|
612,822
|
|
$
|
705,224
|
|
$
|
(90,307
|
)
|
$
|
(92,402
|
)
|
(15
|
)%
|
(13
|
)%
|
||||||
|
Product revenues (1)
|
702
|
|
645
|
|
1,202
|
|
57
|
|
(557
|
)
|
9
|
%
|
(46
|
)%
|
|||||||||||
|
Service and product revenues
|
523,217
|
|
613,467
|
|
706,426
|
|
(90,250
|
)
|
(92,959
|
)
|
(15
|
)%
|
(13
|
)%
|
|||||||||||
|
USF revenues
|
56,052
|
|
62,578
|
|
67,984
|
|
(6,526
|
)
|
(5,406
|
)
|
(10
|
)%
|
(8
|
)%
|
|||||||||||
|
Total revenues
|
579,269
|
|
676,045
|
|
774,410
|
|
(96,776
|
)
|
(98,365
|
)
|
(14
|
)%
|
(13
|
)%
|
|||||||||||
|
Cost of revenues
|
|||||||||||||||||||||||||
|
Service cost of revenues (2)
|
100,054
|
|
123,580
|
|
142,184
|
|
(23,526
|
)
|
(18,604
|
)
|
(19
|
)%
|
(13
|
)%
|
|||||||||||
|
Product cost of revenues (1)
|
14,394
|
|
20,616
|
|
29,721
|
|
(6,222
|
)
|
(9,105
|
)
|
(30
|
)%
|
(31
|
)%
|
|||||||||||
|
Service and product cost of revenues
|
114,448
|
|
144,196
|
|
171,905
|
|
(29,748
|
)
|
(27,709
|
)
|
(21
|
)%
|
(16
|
)%
|
|||||||||||
|
USF cost of revenues
|
56,052
|
|
62,578
|
|
67,984
|
|
(6,526
|
)
|
(5,406
|
)
|
(10
|
)%
|
(8
|
)%
|
|||||||||||
|
Total cost of revenues
|
170,500
|
|
206,774
|
|
239,889
|
|
(36,274
|
)
|
(33,115
|
)
|
(18
|
)%
|
(14
|
)%
|
|||||||||||
|
Gross margin
|
|||||||||||||||||||||||||
|
Service margin
|
422,461
|
|
489,242
|
|
563,040
|
|
(66,781
|
)
|
(73,798
|
)
|
(14
|
)%
|
(13
|
)%
|
|||||||||||
|
Gross margin ex-USF (Service and product margin)
|
408,769
|
|
469,271
|
|
534,521
|
|
(60,502
|
)
|
(65,250
|
)
|
(13
|
)%
|
(12
|
)%
|
|||||||||||
|
Gross margin
|
$
|
408,769
|
|
$
|
469,271
|
|
$
|
534,521
|
|
$
|
(60,502
|
)
|
$
|
(65,250
|
)
|
(13
|
)%
|
(12
|
)%
|
||||||
|
Gross margin %
|
|||||||||||||||||||||||||
|
Service gross margin %
|
80.9
|
%
|
79.8
|
%
|
79.8
|
%
|
|||||||||||||||||||
|
Gross margin ex-USF (Service and product margin) %
|
78.1
|
%
|
76.5
|
%
|
75.7
|
%
|
|||||||||||||||||||
|
Gross margin %
|
70.6
|
%
|
69.4
|
%
|
69.0
|
%
|
|||||||||||||||||||
(1) Includes customer premise equipment, professional services, and shipping and handling.
(2) Excludes depreciation and amortization of
$9,669
,
$9,049
, and
$12,918
, respectively.
2016
compared to
2015
Service revenues
. Service revenues decreased by
$90,307
, or
15%
, due to fewer subscriber lines reflecting planned actions to enhance profitability by modulating marketing spend, restructuring pricing offers, and targeting consumers with lower subscriber acquisition cost and churn profiles.
Product revenues
. Product revenues increased by
$57
, or
9%
.
USF revenues
. USF revenues decreased by
$6,526
, or
10%
, due to lower subscriber lines.
Service cost of revenues
. Service cost of revenues decreased by
$23,526
, or
19%
due to fewer subscriber lines reflecting planned actions to enhance profitability by modulating marketing spend, restructuring pricing offers, and targeting consumers with lower subscriber acquisition cost and churn profiles.
Product cost of revenues
. Product cost of revenues decreased by
$6,222
, or
30%
, due to the decrease in customers' equipment costs due to lower new customer additions and a decrease in reserve related to inventory.
USF cost of revenues
. USF cost of revenues decreased by
$6,526
, or
10%
due to lower subscriber lines.
2015
compared to
2014
Service revenues
. Service revenues decreased by
$92,402
, or
13%
, due to fewer subscriber lines reflecting planned actions to enhance profitability by modulating marketing spend, restructuring pricing offers, and targeting consumers with lower subscriber acquisition cost and churn profiles.
Product revenues
. Product revenues decreased by
$557
, or
46%
, due to lower customer additions.
Service revenues
. Service revenues decreased by
$5,406
, or
8%
, due to lower subscriber lines.
Service cost of revenues
. Service cost of revenues decreased by
$18,604
, or
13%
due to due to fewer subscriber lines reflecting planned actions to enhance profitability by modulating marketing spend, restructuring pricing offers, and targeting consumers with lower subscriber acquisition cost and churn profiles.
Product cost of revenues
. Product (including access) cost of revenues decreased by
$9,105
, or
31%
, due to the decrease in customers' equipment costs due to lower new customer additions.
USF cost of revenues
. USF cost of revenues decreased by
$5,406
, or
8%
due to lower subscriber lines.
36 VONAGE ANNUAL REPORT 2016
|
Sales and Marketing
|
For the years ended December 31,
|
Dollar Change 2016 vs. 2015
|
|
Dollar Change 2015 vs. 2014
|
|
Percent Change 2016 vs. 2015
|
|
Percent Change
2015 vs. 2014 |
|
||||||||||||||||
|
(in thousands, except percentages)
|
2016
|
|
2015
|
|
2014
|
|
|||||||||||||||||||
|
Sales and marketing
|
$
|
330,969
|
|
$
|
347,896
|
|
$
|
373,737
|
|
$
|
(16,927
|
)
|
$
|
(25,841
|
)
|
(5
|
)%
|
(7
|
)%
|
||||||
2016
compared to
2015
Sales and marketing.
Sales and marketing expense decreased by
$16,927
, or
5%
, due to a reduction in Consumer marketing reflecting planned actions to enhance profitability by targeting consumers with lower subscriber acquisition cost and churn profiles, offset by an increase in Business marketing as we have shifted marketing investment to attract these more profitable customers and an increase from iCore which was acquired in August 2015 and Nexmo which was acquired in June 2016.
2015
compared to
2014
Sales and marketing.
Sales and marketing expense decreased by $25,841, or 7%, due to a reduction in Consumer marketing reflecting planned actions to enhance the profitability of the assisted sales channel by eliminating lower performing locations offset by an increase in Business as we have shifted marketing investment to attract these more profitable customers.
|
Engineering and Development
|
For the years ended December 31,
|
Dollar Change 2016 vs. 2015
|
|
Dollar Change 2015 vs. 2014
|
|
Percent Change 2016 vs. 2015
|
|
Percent Change
2015 vs. 2014 |
|
||||||||||||||||
|
(in thousands, except percentages)
|
2016
|
|
2015
|
|
2014
|
|
|||||||||||||||||||
|
Engineering and development
|
$
|
29,759
|
|
$
|
27,220
|
|
$
|
20,869
|
|
$
|
2,539
|
|
$
|
6,351
|
|
9
|
%
|
30
|
%
|
||||||
2016
compared to
2015
Engineering and development.
Engineering and development expense increased by
$2,539
, or
9%
, due to incremental investment in new business products and services, the acquisition of Nexmo in June 2016, the acquisition of iCore in August 2015, and the acquisition of Simple Signal in April 2015.
2015
compared to
2014
Engineering and development.
Engineering and development expense increased by $6,351, or 30%, due to incremental investment in new business products and services.
|
General and Administrative
|
For the years ended December 31,
|
Dollar Change 2016 vs. 2015
|
|
Dollar Change 2015 vs. 2014
|
|
Percent Change 2016 vs. 2015
|
|
Percent Change
2015 vs. 2014 |
|
||||||||||||||||
|
(in thousands, except percentages)
|
2016
|
|
2015
|
|
2014
|
|
|||||||||||||||||||
|
General and administrative
|
$
|
123,304
|
|
$
|
109,153
|
|
$
|
98,780
|
|
$
|
14,151
|
|
$
|
10,373
|
|
13
|
%
|
11
|
%
|
||||||
2016
compared to
2015
General and administrative.
General and administrative expense increased by
$14,151
, or
13%
, primarily due to the addition of Simple Signal, iCore and Nexmo, offset by the reduction of Nexmo contingent consideration of $11,472.
2015
compared to
2014
General and administrative.
General and administrative expense increased by $10,373, or 11%, primarily due to the addition of Telesphere, Simple Signal, and iCore and incremental stock compensation of $6,500, partially offset by the elimination of our international growth initiative to focus on our more profitable business customers of $5,000 and lower legal fees of $4,500.
|
Depreciation and Amortization
|
For the years ended December 31,
|
Dollar Change 2016 vs. 2015
|
|
Dollar Change 2015 vs. 2014
|
|
Percent Change 2016 vs. 2015
|
|
Percent Change
2015 vs. 2014 |
|
||||||||||||||||
|
(in thousands, except percentages)
|
2016
|
|
2015
|
|
2014
|
|
|||||||||||||||||||
|
Depreciation and amortization
|
$
|
72,285
|
|
$
|
61,833
|
|
$
|
49,514
|
|
$
|
10,452
|
|
$
|
12,319
|
|
17
|
%
|
25
|
%
|
||||||
2016
compared to
2015
Depreciation and amortization.
The increase in depreciation and amortization of
$10,452
, or
17%
, was primarily due to the amortization of acquisition-related intangibles from the acquisition of Simple Signal in April 2015, iCore in August 2015, and Nexmo in June 2016.
2015
compared to
2014
Depreciation and amortization.
The increase in depreciation and amortization of $12,319, or 25%, was primarily due to the amortization of acquisition-related intangibles from the acquisition of Telesphere in December 2014, Simple Signal in April 2015, and iCore in August 2015.
37 VONAGE ANNUAL REPORT 2016
|
Other Income (Expense)
|
For the years ended December 31,
|
Dollar Change 2016 vs. 2015
|
|
Dollar Change 2015 vs. 2014
|
|
Percent Change 2016 vs. 2015
|
|
Percent Change
2015 vs. 2014 |
|
||||||||||||||||
|
(in thousands, except percentages)
|
2016
|
|
2015
|
|
2014
|
|
|||||||||||||||||||
|
Interest income
|
$
|
79
|
|
$
|
89
|
|
$
|
207
|
|
$
|
(10
|
)
|
$
|
(118
|
)
|
(11
|
)%
|
(57
|
)%
|
||||||
|
Interest expense
|
(13,042
|
)
|
(8,786
|
)
|
(6,823
|
)
|
(4,256
|
)
|
(1,963
|
)
|
(48
|
)%
|
(29
|
)%
|
|||||||||||
|
Other income (expense), net
|
(346
|
)
|
(842
|
)
|
11
|
|
496
|
|
(853
|
)
|
59
|
%
|
(7,755
|
)%
|
|||||||||||
|
|
$
|
(13,309
|
)
|
$
|
(9,539
|
)
|
$
|
(6,605
|
)
|
||||||||||||||||
2016
compared to
2015
Interest income.
Interest income decreased
$10
, or
11%
.
Interest expense.
The increase in interest expense of
$4,256
, or
48%
, was due mainly to the funds we borrowed from the 2014 Credit Facility in April 2015 in connection with the acquisition of Simple Signal, the funds we borrowed from the 2015 Credit Facility in August 2015 in connection with the acquisition of iCore, and the funds we borrowed from the 2016 Credit Facility in June 2016 in connection with the acquisition of Nexmo.
Other income (expense), net.
Other income (expense), net changed by
$496
, or
59%
in
2016
compared to
2015
due mainly to currency fluctuation.
2015
compared to
2014
Interest income.
Interest income decreased $118, or 57%.
Interest expense.
The increase in interest expense of $1,963, or 29%, was due mainly to additional funds we borrowed in connection with our refinancing in August 2014, the funds we borrowed from the 2014 revolving credit facility in December 2014 in connection with the acquisition of Telesphere and in April 2015 in connection with the acquisition of Simple Signal, and the funds we borrowed from the 2015 revolving credit facility in August 2015 in connection with the acquisition of iCore.
Other income (expense), net.
Other income (expense), net changed by $853 in 2015 compared to 2014 due to currency fluctuation.
|
Income Tax Expense
|
For the years ended December 31,
|
Dollar Change 2016 vs. 2015
|
|
Dollar Change 2015 vs. 2014
|
|
Percent Change 2016 vs. 2015
|
|
Percent Change
2015 vs. 2014 |
|
||||||||||||||||
|
(in thousands, except percentages)
|
2016
|
|
2015
|
|
2014
|
|
|||||||||||||||||||
|
Income tax expense
|
$
|
(12,938
|
)
|
$
|
(18,418
|
)
|
$
|
(21,759
|
)
|
$
|
5,480
|
|
$
|
3,341
|
|
30
|
%
|
15
|
%
|
||||||
|
Effective tax rate
|
42
|
%
|
43
|
%
|
42
|
%
|
|||||||||||||||||||
We recognize income tax expense equal to pre-tax income multiplied by our effective income tax rate. In addition, adjustments are recorded for discrete period items and changes to our state effective tax rate which can cause the rate to fluctuate from quarter to quarter. In the first quarter of 2016 a discrete period tax expense of $1,220 was recorded related to expired stock options which was partially offset by $389, $661 and $77 which was recorded in the second quarter of 2016, the third quarter of 2016, and the fourth quarter of 2016, respectively. In addition, certain acquisition related expenses incurred in the second quarter of 2016 are treated as a permanent difference as the expenses are not deductible for tax purposes but are a reduction of pre-tax income. In the third quarter and fourth quarter of 2016, the reduction in the value of our contingent consideration in connection with the acquisition of Nexmo was treated as a permanent difference resulting in a decrease in the effective tax rate for the three months ended September 30, 2016. In the first quarter of 2015 a discrete period tax benefit of $1,058 was recorded in discontinued operations related to the write-off of
intercompany loans associated with the wind down of our joint venture in Brazil.
The provision also includes the federal alternative minimum tax and state and local income taxes in
2016
,
2015
, and
2014
.
The effective tax rate is calculated by dividing income tax expense by income before income tax expense.
As of
December 31, 2016
, we had net operating loss carry forwards for United States federal and state tax purposes, including the NOLs of Nexmo, iCore, Simple Signal, Telesphere, and Vocalocity as of the date of acquisition, of
$575,476
and
$158,848
, respectively, expiring at various times from years ending
2017
through
2036
. In addition, we also had net operating loss carry forwards for United Kingdom tax purposes of
$43,006
with no expiration date.
|
Discontinued Operations Attributable to Vonage
|
For the years ended December 31,
|
Dollar Change 2016 vs. 2015
|
|
Dollar Change 2015 vs. 2014
|
|
Percent Change 2016 vs. 2015
|
|
Percent Change
2015 vs. 2014 |
|
||||||||||||||||
|
2016
|
|
2015
|
|
2014
|
|
||||||||||||||||||||
|
Loss from discontinued operations
|
$
|
—
|
|
$
|
(1,615
|
)
|
$
|
(10,260
|
)
|
$
|
1,615
|
|
$
|
8,645
|
|
100
|
%
|
84
|
%
|
||||||
|
Loss on disposal, net of taxes
|
—
|
|
(824
|
)
|
—
|
|
824
|
|
(824
|
)
|
100
|
%
|
—
|
%
|
|||||||||||
|
Discontinued operations
|
—
|
|
(2,439
|
)
|
(10,260
|
)
|
2,439
|
|
7,821
|
|
100
|
%
|
76
|
%
|
|||||||||||
|
Loss from discontinued operations attributable to noncontrolling interest
|
—
|
|
59
|
|
819
|
|
(59
|
)
|
(760
|
)
|
(100
|
)%
|
(93
|
)%
|
|||||||||||
|
Loss from discontinued operations attributable to Vonage
|
—
|
|
(2,380
|
)
|
(9,441
|
)
|
2,380
|
|
7,061
|
|
100
|
%
|
75
|
%
|
|||||||||||
38 VONAGE ANNUAL REPORT 2016
2016
compared to
2015
Discontinued operations attributable to Vonage.
The 2015 loss from discontinued operations attributable to Vonage was for the operation loss from our discontinued Brazilian market.
2015
compared to
2014
Discontinued operations attributable to Vonage.
The loss from discontinued operations attributable to Vonage decreased by $7,061, or 75%. The loss from 2015 was due to $500 of costs associated with the wind down of our Brazilian operations in the first quarter of 2015 related to contract terminations and severance-related expenses, a loss on disposal of $824 related to the write-off of the noncontrolling interest of $907, foreign currency loss on intercompany loan forgiveness of $783, and residual cumulative translation of $192, partially offset by a tax benefit of $1,058 and a lower portion of loss attributable to noncontolling interest due to a reduction in ownership percentage. The loss from 2014 was for the operating loss from our discontinued Brazilian market.
39 VONAGE ANNUAL REPORT 2016
|
QUARTERLY RESULTS OF OPERATIONS
|
The following table sets forth quarterly statement of operations data. We derived this data from our unaudited consolidated financial statements, which we believe have been prepared on substantially the same basis as our audited consolidated financial statements. The operating results in any quarter are not necessarily indicative of the results that may be expected for any future period.
|
|
For the quarter ended
|
||||||||||||||||||||||||||||||
|
(dollars in thousands, except operating data)
|
Mar 31,
2015 |
|
Jun 30,
2015 (5) |
|
Sep 30,
2015 (6) |
|
Dec 31,
2015 |
|
Mar 31,
2016 |
|
Jun 30,
2016 (7) |
|
Sep 30,
2016 |
|
Dec 31,
2016 |
|
|||||||||||||||
|
Total revenues
|
$
|
219,730
|
|
$
|
221,858
|
|
$
|
223,360
|
|
$
|
230,124
|
|
$
|
226,824
|
|
$
|
233,675
|
|
$
|
248,359
|
|
$
|
246,763
|
|
|||||||
|
Operating expenses:
|
|||||||||||||||||||||||||||||||
|
Cost of services (1)
|
61,853
|
|
64,209
|
|
67,193
|
|
68,513
|
|
69,150
|
|
76,078
|
|
87,377
|
|
88,768
|
|
|||||||||||||||
|
Cost of goods sold
|
9,190
|
|
8,217
|
|
8,206
|
|
8,597
|
|
9,066
|
|
8,352
|
|
8,591
|
|
7,768
|
|
|||||||||||||||
|
Sales and marketing
|
85,564
|
|
84,385
|
|
88,028
|
|
89,919
|
|
79,601
|
|
83,344
|
|
83,731
|
|
84,293
|
|
|||||||||||||||
|
Engineering and development
|
6,605
|
|
6,864
|
|
6,830
|
|
6,921
|
|
6,834
|
|
7,243
|
|
8,075
|
|
7,607
|
|
|||||||||||||||
|
General and administrative
|
23,234
|
|
27,162
|
|
28,860
|
|
29,897
|
|
26,670
|
|
35,053
|
|
27,538
|
|
34,043
|
|
|||||||||||||||
|
Depreciation and amortization
|
13,945
|
|
14,463
|
|
15,446
|
|
17,979
|
|
16,979
|
|
18,218
|
|
18,018
|
|
19,070
|
|
|||||||||||||||
|
|
200,391
|
|
205,300
|
|
214,563
|
|
221,826
|
|
208,300
|
|
228,288
|
|
233,330
|
|
241,549
|
|
|||||||||||||||
|
Income from operations
|
19,339
|
|
16,558
|
|
8,797
|
|
8,298
|
|
18,524
|
|
5,387
|
|
15,029
|
|
5,214
|
|
|||||||||||||||
|
Other income (expense):
|
|||||||||||||||||||||||||||||||
|
Interest income
|
20
|
|
21
|
|
24
|
|
24
|
|
21
|
|
25
|
|
19
|
|
14
|
|
|||||||||||||||
|
Interest expense
|
(1,935
|
)
|
(2,088
|
)
|
(2,222
|
)
|
(2,541
|
)
|
(2,446
|
)
|
(3,057
|
)
|
(3,974
|
)
|
(3,565
|
)
|
|||||||||||||||
|
Other (expense) income, net
|
(577
|
)
|
32
|
|
(50
|
)
|
(247
|
)
|
154
|
|
104
|
|
(495
|
)
|
(109
|
)
|
|||||||||||||||
|
(2,492
|
)
|
(2,035
|
)
|
(2,248
|
)
|
(2,764
|
)
|
(2,271
|
)
|
(2,928
|
)
|
(4,450
|
)
|
(3,660
|
)
|
||||||||||||||||
|
Income from continuing operations before income tax expense
|
16,847
|
|
14,523
|
|
6,549
|
|
5,534
|
|
16,253
|
|
2,459
|
|
10,579
|
|
1,554
|
|
|||||||||||||||
|
Income tax expense
|
(6,998
|
)
|
(6,176
|
)
|
(3,116
|
)
|
(2,128
|
)
|
(8,322
|
)
|
(1,562
|
)
|
(1,501
|
)
|
(1,553
|
)
|
|||||||||||||||
|
Net income from continuing operations
|
9,849
|
|
8,347
|
|
3,433
|
|
3,406
|
|
7,931
|
|
897
|
|
9,078
|
|
1
|
|
|||||||||||||||
|
Loss from discontinued operations
|
(1,615
|
)
|
—
|
|
—
|
|
—
|
|
—
|
|
—
|
|
—
|
|
—
|
|
|||||||||||||||
|
Loss on disposal, net of taxes
|
(824
|
)
|
—
|
|
—
|
|
—
|
|
—
|
|
—
|
|
—
|
|
—
|
|
|||||||||||||||
|
Discontinued operations
|
(2,439
|
)
|
—
|
|
—
|
|
—
|
|
—
|
|
—
|
|
—
|
|
—
|
|
|||||||||||||||
|
Net income
|
7,410
|
|
8,347
|
|
3,433
|
|
3,406
|
|
7,931
|
|
897
|
|
9,078
|
|
1
|
|
|||||||||||||||
|
Plus: Net loss from discontinued operations attributable to noncontrolling interest
|
59
|
|
—
|
|
—
|
|
—
|
|
—
|
|
—
|
|
—
|
|
—
|
|
|||||||||||||||
|
Net income attributable to Vonage
|
$
|
7,469
|
|
$
|
8,347
|
|
$
|
3,433
|
|
$
|
3,406
|
|
|
$
|
7,931
|
|
$
|
897
|
|
$
|
9,078
|
|
$
|
1
|
|
||||||
|
Net Income per common share - continuing operations:
|
|
|
|
|
|
|
|||||||||||||||||||||||||
|
Basic
|
$
|
0.05
|
|
$
|
0.04
|
|
$
|
0.02
|
|
$
|
0.02
|
|
$
|
0.04
|
|
$
|
—
|
|
$
|
0.04
|
|
$
|
—
|
|
|||||||
|
Diluted
|
$
|
0.04
|
|
$
|
0.04
|
|
$
|
0.02
|
|
$
|
0.01
|
|
$
|
0.04
|
|
$
|
—
|
|
$
|
0.04
|
|
$
|
—
|
|
|||||||
|
Net Loss per common share - discontinuing operations attributable to Vonage:
|
|||||||||||||||||||||||||||||||
|
Basic
|
$
|
(0.01
|
)
|
$
|
—
|
|
$
|
—
|
|
$
|
—
|
|
$
|
—
|
|
$
|
—
|
|
$
|
—
|
|
$
|
—
|
|
|||||||
|
Diluted
|
$
|
(0.01
|
)
|
$
|
—
|
|
$
|
—
|
|
$
|
—
|
|
$
|
—
|
|
$
|
—
|
|
$
|
—
|
|
$
|
—
|
|
|||||||
|
Net Income per common share - attributable to Vonage:
|
|||||||||||||||||||||||||||||||
|
Basic
|
$
|
0.04
|
|
$
|
0.04
|
|
$
|
0.02
|
|
$
|
0.02
|
|
$
|
0.04
|
|
$
|
—
|
|
$
|
0.04
|
|
$
|
—
|
|
|||||||
|
Diluted
|
$
|
0.03
|
|
$
|
0.04
|
|
$
|
0.02
|
|
$
|
0.01
|
|
$
|
0.04
|
|
$
|
—
|
|
$
|
0.04
|
|
$
|
—
|
|
|||||||
|
Weighted-average common shares outstanding:
|
|||||||||||||||||||||||||||||||
|
Basic
|
211,844
|
|
213,582
|
|
213,291
|
|
213,864
|
|
214,039
|
|
213,558
|
|
217,000
|
|
218,375
|
|
|||||||||||||||
|
Diluted
|
220,589
|
|
222,188
|
|
225,182
|
|
227,751
|
|
224,225
|
|
222,700
|
|
234,868
|
|
237,670
|
|
|||||||||||||||
40 VONAGE ANNUAL REPORT 2016
|
|
For the quarter ended
|
||||||||||||||||||||||
|
(dollars in thousands, except operating data)
|
Mar 31,
2015 |
|
Jun 30,
2015 (5) |
|
Sep 30,
2015 (6) |
|
Dec 31,
2015 |
|
Mar 31,
2016 |
|
Jun 30,
2016 (7) |
|
Sep 30,
2016 |
|
Dec 31,
2016 |
|
|||||||
|
Operating Data:
|
|||||||||||||||||||||||
|
Business
|
|||||||||||||||||||||||
|
Revenues (2)
|
41,900
|
|
49,102
|
|
57,075
|
|
70,949
|
|
73,820
|
|
85,712
|
|
106,309
|
|
110,511
|
|
|||||||
|
Average monthly revenues per seat (3)
|
43.05
|
|
42.28
|
|
41.56
|
|
44.79
|
|
44.25
|
|
44.76
|
|
45.50
|
|
44.65
|
|
|||||||
|
Seat (at period end) (3)
|
337,649
|
|
401,256
|
|
514,184
|
|
541,884
|
|
570,358
|
|
591,707
|
|
615,728
|
|
638,096
|
|
|||||||
|
Revenue churn (3)
|
1.4
|
%
|
1.3
|
%
|
1.3
|
%
|
1.1
|
%
|
1.3
|
%
|
1.4
|
%
|
1.4
|
%
|
1.4
|
%
|
|||||||
|
Registered developers (4)
|
N/A
|
|
N/A
|
|
N/A
|
|
N/A
|
|
N/A
|
|
155,287
|
|
175,759
|
|
206,734
|
|
|||||||
|
Consumer
|
|||||||||||||||||||||||
|
Revenues
|
177,830
|
|
172,756
|
|
166,285
|
|
159,175
|
|
153,004
|
|
147,963
|
|
142,050
|
|
136,252
|
|
|||||||
|
Average monthly revenues per subscriber line
|
27.97
|
|
27.79
|
|
27.38
|
|
26.93
|
|
26.68
|
|
26.61
|
|
26.36
|
|
26.11
|
|
|||||||
|
Subscriber lines (at period end)
|
2,094,365
|
|
2,049,424
|
|
1,998,982
|
|
1,940,825
|
|
1,881,826
|
|
1,824,668
|
|
1,767,212
|
|
1,711,366
|
|
|||||||
|
Customer churn
|
2.4
|
%
|
2.2
|
%
|
2.3
|
%
|
2.2
|
%
|
2.2
|
%
|
2.1
|
%
|
2.2
|
%
|
2.2
|
%
|
|||||||
|
(1)
|
Excludes depreciation and amortization of
$5,724
,
$6,005
,
$6,415
, and
$6,724
for the quarters ended March 31, June 30, September 30 and December 31,
2015
, respectively, and
$6,833
,
$6,985
,
$7,460
, and
$7,211
for the quarters ended March 31, June 30, September 30 and December 31,
2016
, respectively.
|
|
(2)
|
Includes revenues from CPaaS of $7,698, $23,909, and $26,541 for the quarters ended June 30, 2016, September 30, 2016, and December 31, 2016, respectively.
|
|
(3)
|
UCaaS only.
|
|
(4)
|
CPaaS only.
|
|
(5)
|
The quarter ended June 30, 2015 includes the impacts of the acquisition of Simple Signal, which was completed on April 1, 2015.
|
|
(6)
|
The quarter ended September 30, 2015 includes the impacts of the acquisition of iCore, which was completed on August 31, 2015.
|
|
(7)
|
The quarter ended June 30, 2016 includes the impacts of the acquisition of Nexmo, which was completed on June 3, 2016.
|
|
LIQUIDITY AND CAPITAL RESOURCES
|
Overview
The following table sets forth a summary of our cash flows for the periods indicated:
|
|
For the years ended December 31,
|
||||||||||
|
(dollars in thousands)
|
2016
|
|
2015
|
|
2014
|
|
|||||
|
Net cash provided by operating activities
|
$
|
87,012
|
|
$
|
129,731
|
|
$
|
92,542
|
|
||
|
Net cash used in investing activities
|
(190,733
|
)
|
(152,696
|
)
|
(118,528
|
)
|
|||||
|
Net cash provided by (used in) financing activities
|
74,498
|
|
40,205
|
|
(14,239
|
)
|
|||||
For the three years ended December 31,
2016
,
2015
, and
2014
we generated income from operations. We expect to continue to balance efforts to grow our revenue while consistently achieving operating profitability. To grow our revenue, we continue to make investments in growth initiatives, marketing, application development, network quality and expansion, and customer care. Although we believe we will achieve consistent profitability in the future, we ultimately may not be successful and we may not achieve consistent profitability. We believe that cash flow from operations and cash on hand will fund our operations for at least the next twelve months.
Acquisition of Nexmo
Nexmo was acquired on June 3, 2016. Nexmo shareholders are receiving consideration of $231,122. Of the consideration, $194,684 (net of cash acquired of $16,094) was paid at close, consisting of $163,093 of cash (net of $16,094 of cash acquired) and 6,823 in shares of Vonage common stock valued at $31,591. The remaining $36,438 of the $231,122 purchase price is in the form of restricted cash, restricted stock and options held by Nexmo management and employees, subject to vesting requirements over time. In addition there was an additional earn-out opportunity of up to $20,000 contingent upon Nexmo achieving certain performance targets. Nexmo
did not achieve performance targets but the parties have agreed to a $5,000 settlement that will be paid in the first quarter of 2017. We financed the transaction with $179,000 from our 2016 Credit Facility.
Acquisition of iCore
iCore was acquired on August 31, 2015 for $92,000 cash consideration, increased by $689 of working capital excess as of the closing date, resulting in a total acquisition cost of $92,689. We financed the transaction with $10,689 of cash and $82,000 from our 2015 revolving credit facility.
Acquisition of Simple Signal
Simple Signal was acquired on April 1, 2015 for $25,250, reduced by $198 of working capital shortfall as of the closing date and increased by $526 for the increase in value of the 1,111 shares of Vonage common stock from the signing date to the closing date, resulting in a total acquisition cost of $25,578. We financed the transaction by borrowing $20,000 from our 2014 revolving credit facility.
Acquisition of Telesphere
Telesphere was acquired on December 15, 2014 for $114,000, adjusted for $676 of excess cash as of the closing date, a reduction for closing working capital of $105, and the decrease in value of the 6,825 shares of Vonage common stock from the signing date to
41 VONAGE ANNUAL REPORT 2016
the closing date of $241, resulting in a total acquisition cost of $114,330. We financed the transaction through $24,603 of cash (of which $3,610 was paid in January 2015) and $67,000 from our 2014 revolving credit facility.
2016 Financing
On June 3, 2016, we entered into Amendment No. 1 to the Amended and Restated Credit Agreement (the “2016 Credit Facility”) consisting of a
$125,000
term note and a
$325,000
revolving credit facility. The co-borrowers under the 2016 Credit Facility are the Company and Vonage America Inc., the Company’s wholly owned subsidiary. Obligations under the 2016 Credit Facility are guaranteed, fully and unconditionally, by the Company’s other United States material subsidiaries and are secured by substantially all of the assets of each borrower and each guarantor. The lenders under the 2016 Credit Facility are JPMorgan Chase Bank, N.A., Citizens Bank, N.A., Fifth Third Bank, MUFG Union Bank, N.A., Silicon Valley Bank, SunTrust Bank, Keybank National Association, Santander Bank, N.A., Capital One National Association, and First Niagara Bank, N.A. J.P. Morgan Securities LLC and Citizens Bank, N.A. acted as joint lead bookrunners, and J.P. Morgan Securities LLC, Citizens Bank, N.A., Fifth Third Bank, MUFG Union Bank, N.A., Silicon Valley Bank, and SunTrust Robinson Humphrey Inc. acted as joint lead arrangers.
Use of Proceeds
We used
$197,750
of the net available proceeds of the 2016 Credit Facility to retire all of the debt under our 2015 Credit Facility. We used
$179,000
from our 2016 Credit Facility in connection with the acquisition of Nexmo on June 3, 2016. Remaining proceeds from the term note and the undrawn revolving credit facility under the 2016 Credit Facility will be used for general corporate purposes. We also incurred fees of
$1,316
in connection with the 2016 Credit Facility, of which
$395
was allocated to the term note and
$921
was allocated to the revolving credit facility. The unamortized fees of
$2,740
in connection with the 2015 Credit Facility were allocated as follows:
$930
to the term note and
$1,810
to the revolving credit facility. In adopting ASU 2015-03, fees allocated to the term note were reported in the balance sheet as a direct deduction from the face amount of the liability and in adopting ASU 2015-15, fees allocated to the revolving credit facility were reported in the balance sheet as an asset. These fees are amortized to interest expenses over the life of the debt using the effective interest method for the term note and straight line method for the revolving credit facility.
Repayments
In
2016
, we made mandatory repayment of
$14,062
under the term note. In addition, we repaid the
$45,000
outstanding under the revolving credit facility.
2016 Credit Facility Terms
The following description summarizes the material terms of the 2016 Credit Facility:
The loans under the 2016 Credit Facility mature in June 2020. Principal amounts under the 2016 Credit Facility are repayable in quarterly installments of approximately
$4,688
for the term note. The unused portion of our revolving credit facility incurs a
0.45%
commitment fee. Such commitment fee will be reduced to
0.40%
if our consolidated leverage ratio is greater than or equal to
1.50
to 1.00 and less than
2.50
to 1.00,
0.375%
if our consolidated leverage ratio is greater than or equal to
0.75
to 1.00 and less than
1.50
to 1.00, and to
0.35%
if our consolidated leverage ratio is less than
0.75
to 1.00.
Outstanding amounts under the 2016 Credit Facility, at our option, will bear interest at:
|
>
|
LIBOR (applicable to one-, two-, three-, six-, or twelve-month periods) plus an applicable margin equal to
2.50%
if our consolidated leverage ratio is less than
0.75
to 1.00,
2.75%
if our consolidated leverage ratio is greater than or equal to
0.75
to 1.00 and less than
1.50
to 1.00,
3.00%
if our consolidated leverage ratio is greater than or equal to
1.50
to 1.00 and less than
2.5
to 1.00, and
3.25%
if our consolidated leverage ratio is greater than or equal to
2.50
to 1.00, payable
|
on the last day of each relevant interest period or, if the interest period is longer than
three
months, each day that is three months after the first day of the interest period, or
|
>
|
the base rate determined by reference to the highest of (a) the prime rate of JPMorgan Chase Bank, N.A., (b) the federal funds effective rate from time to time plus
0.50%
, and (c) the adjusted LIBO rate applicable to one month interest periods plus
1.00%
, plus an applicable margin equal to
1.50%
if our consolidated leverage ratio is less than
0.75
to 1.00,
1.75%
if our consolidated leverage ratio is greater than or equal to
0.75
to 1.00 and less than
1.50
to 1.00,
2.00%
if our consolidated leverage ratio is greater than or equal to
1.50
to 1.00 and less than
2.50
to 1.00, and
2.25%
if our consolidated leverage ratio is greater than or equal to
2.5
to 1.00, payable on the last business day of each March, June, September, and December and the maturity date of the 2016 Credit Facility.
|
The 2016 Credit Facility provides greater flexibility to us in funding acquisitions and restricted payments, such as stock buybacks, than did the 2015 Credit Facility.
We may prepay the 2016 Credit Facility at our option at any time without premium or penalty. The 2016 Credit Facility is subject to mandatory prepayments in amounts equal to:
|
>
|
100%
of the net cash proceeds from any non-ordinary course sale or other disposition of our property and assets for consideration in excess of a certain amount subject to customary reinvestment provisions and certain other exceptions and
|
|
>
|
100%
of the net cash proceeds received in connection with other non-ordinary course transactions, including insurance proceeds not otherwise applied to the relevant insurance loss.
|
Subject to certain restrictions and exceptions, the 2016 Credit Facility permits us to obtain one or more incremental term notes and/or revolving credit facilities in an aggregate principal amount of up to
$100,000
plus an amount equal to repayments of the term note upon providing documentation reasonably satisfactory to the administrative agent. The 2016 Credit Facility includes customary representations and warranties and affirmative covenants of the borrowers. In addition, the 2016 Credit Facility contains customary negative covenants, including, among other things, restrictions on the ability of us and our subsidiaries to consolidate or merge, create liens, incur additional indebtedness, dispose of assets, consummate acquisitions, make investments, and pay dividends and other distributions. We must also comply with the following financial covenants:
|
>
|
a consolidated leverage ratio of no greater than
3.25
to 1.00 as of the end of the fiscal quarter ending June 30, 2016 and for each of the three consecutive fiscal quarters ending immediately thereafter; and a consolidated leverage ratio of no less than
2.75
to 1.00 as of the end of any fiscal quarter, commencing with the fiscal quarter ending June 30, 2017, with a limited step-up to
3.25
to 1.00 for a period of four consecutive quarters, in connection with an acquisition;
|
|
>
|
a consolidated fixed coverage charge ratio of no less than
1.75
to 1.00 subject to adjustment to exclude up to
$80,000
million in specified restricted payments;
|
|
>
|
minimum cash of
$25,000
including the unused portion of the revolving credit facility; and
|
|
>
|
maximum capital expenditures not to exceed
$55,000
during any fiscal year, provided that the unused amount of any permitted capital expenditures in any fiscal year may be carried forward to the next following fiscal year.
|
In addition, annual excess cash flow increases permitted capital expenditures.
As of
December 31, 2016
, we were in compliance with all covenants, including financial covenants, for the 2016 Credit Facility.
The 2016 Credit Facility contains customary events of default that may permit acceleration of the debt. During the continuance of a payment default, interest will accrue on overdue amounts at a default
42 VONAGE ANNUAL REPORT 2016
interest rate of
2%
above the interest rate which would otherwise be applicable, in the case of loans, and at a rate equal to the rate applicable to base rate loans plus
2%
, in the case of all other amounts.
2015 Financing
On July 27, 2015, we entered into a credit agreement (the “2015 Credit Facility”) consisting of a $100,000 term note and a $250,000 revolving credit facility. The co-borrowers under the 2015 Credit Facility were the Company and Vonage America Inc., the Company’s wholly owned subsidiary. Obligations under the 2015 Credit Facility were guaranteed, fully and unconditionally, by the Company’s other United States material subsidiaries and were secured by substantially all of the assets of each borrower and each guarantor. The lenders under the 2015 Credit Facility were JPMorgan Chase Bank, N.A., Citizens Bank, N.A., Fifth Third Bank, MUFG Union Bank, N.A., Silicon Valley Bank, SunTrust Bank, Keybank National Association, Santander Bank, N.A., Capital One National Association, and First Niagara Bank, N.A. JPMorgan Chase Bank, N.A. was a party to the agreement as administrative agent, Citizens Bank, N.A. as syndication agent, and Fifth Third Bank, MUFG Union Bank, N.A., Silicon Valley Bank, SunTrust Bank as documentation agents. J.P. Morgan Securities LLC and Citizens Bank, N.A. acted as joint lead bookrunners, and J.P. Morgan Securities LLC, Citizens Bank, N.A., Fifth Third Bank, MUFG Union Bank, N.A., Silicon Valley Bank, and SunTrust Robinson Humphrey Inc. acted as joint lead arrangers.
Use of Proceeds
We used $167,000 of the net available proceeds of the 2015 Credit Facility to retire all of the debt under our 2014 Credit Facility. Remaining proceeds from the term note and the undrawn revolving credit facility under the 2015 Credit Facility was to be used for general corporate purposes. We also incurred fees of $2,007 in connection with the 2015 Credit Facility, of which $602 was allocated to the term note and $1,405 was allocated to the revolving credit facility. The unamortized fees of $1,628 in connection with the 2014 Credit Facility was allocated as follows: $733 to the term note and $895 revolving credit facility. In adopting ASU 2015-03, fees allocated to the term note were reported in the balance sheet as a direct deduction from the face amount of the liability and in adopting ASU 2015-15, fees allocated to the revolving credit facility were reported in the balance sheet as as asset. These fees are amortized to interest expenses over the life of the debt using the effective interest method for the term note and straight line method for the revolving credit facility.
2014 Financing
On August 13, 2014, we entered into a credit agreement (the “2014 Credit Facility”) consisting of a $100,000 term note and a $125,000 revolving credit facility. The co-borrowers under the 2014 Credit Facility were us and Vonage America Inc., our wholly owned subsidiary. Obligations under the 2014 Credit Facility were guaranteed, fully and unconditionally, by our other material United States subsidiaries and are secured by substantially all of the assets of each borrower and each guarantor. The lenders under the 2014 Credit Facility were JPMorgan Chase Bank, N.A., Citizens Bank, N.A., Silicon Valley Bank, SunTrust Bank, Fifth Third Bank, Keybank National Association, and MUFG Union Bank, N.A. JPMorgan Chase Bank, N.A. was a party to the agreement as administrative agent, Citizens Bank, N.A. as syndication agent, and Silicon Valley Bank and SunTrust Bank as documentation agents. J.P. Morgan Securities LLC and Citizens Bank, N.A. acted as joint lead bookrunners, and J.P. Morgan Securities LLC, Citizens Bank, N.A., Silicon Valley Bank, and SunTrust Robinson Humphrey Inc. acted as joint lead arrangers.
Use of Proceeds
We used $90,000 of the net available proceeds of the 2014 Credit Facility to retire all of the debt under our 2013 Credit Facility. Remaining proceeds from the senior secured term loan and the undrawn revolving credit facility under the 2014 Credit Facility were to be used for general corporate purposes. We also incurred $1,910 of fees in connection with
the 2014 Credit Facility, which was amortized, along
with the unamortized fees of $668 in connection with the 2013 Credit Facility, to interest expense over the life of the debt using the effective interest method.
State and Local Sales Taxes
We also have contingent liabilities for state and local sales taxes. As of
December 31, 2016
, we had a reserve of
$1,763
. If our ultimate liability exceeds this amount, it could affect our liquidity unfavorably. However, we currently do not believe that these contingent liabilities will significantly impair our liquidity.
Capital expenditures
For
2016
, capital expenditures were primarily for the implementation of software solutions and purchase of network equipment as we continue to expand our network. Our capital expenditures for the year ended
2016
were
$37,734
, of which
$11,538
was for software acquisition and development. The majority of these expenditures are comprised of investments in information technology and systems infrastructure, including an electronic data warehouse, online customer service, and customer management platforms. For
2017
, we believe our capital and software expenditures will be approximately $40,000. This amount is net of Tenant Improvement capital dollars we are investing in our Holmdel, New Jersey headquarters which are being refunded by the building owner in connection with the long-term lease renewal we executed in the fourth quarter of 2015.
Operating Activities
Cash provided by operating activities decreased to
$87,012
for the year ended
December 31, 2016
compared to
$129,731
for the year ended
December 31, 2015
, primarily due to changes in working capital.
Changes in working capital requirements include changes in accounts receivable, inventory, prepaid and other assets, accounts payable, accrued and other liabilities, and deferred revenue and costs. Cash used for working capital requirement increased by
$35,899
during the year ended
December 31, 2016
compared to the year ended
December 31, 2015
.
Cash provided by operating activities increased to $129,731 for the year ended December 31, 2015 compared to $92,542 for the year ended December 31, 2014 , primarily due to higher revenues and changes in working capital.
Changes in working capital requirements include changes in accounts receivable, inventory, prepaid and other assets, other assets, accounts payable, accrued and other liabilities, and deferred revenue and costs. Cash used for working capital decreased by $18,631 during the year ended December 31, 2015 compared to the year ended December 31, 2014.
Investing Activities
Cash used in investing activities for
2016
of
$190,733
was attributable to the acquisition of businesses of
$163,093
, the purchase capital expenditures of
$26,146
, intangible assets of
$50
, and development and software assets of
$11,538
, offset by the sales of marketable securities, net of purchase of
$9,327
and a decrease in restricted cash of
$767
.
Cash used in investing activities for 2015 of $152,696 was attributable to the acquisition of businesses of $116,927, capital expenditures of $17,323, intangible assets of $2,500, software acquisition and development of $14,183, and purchase of marketable securities, net of sales of $2,759, offset by a decrease in restricted cash of $996 due primarily to the return of part of the security deposit on our leased office property in Holmdel, New Jersey.
Cash used in investing activities for 2014 of $118,528 was attributable to the acquisition of Telesphere of $88,098, capital expenditures of $12,436, software acquisition and development of $11,819, and purchase of marketable securities of $7,170, offset by a decrease in restricted cash of $995 due primarily to the return of part of the security deposit on our leased office property in Holmdel, New Jersey.
43 VONAGE ANNUAL REPORT 2016
Financing Activities
Cash provided by financing activities for
2016
of
$74,498
was primarily attributable to
$181,250
in net proceeds received from our 2016 Credit Facility and
$8,861
in net proceeds received from the exercise stock options, offset by principal payments of
$45,000
for 2016 revolving credit facility,
$14,062
for 2016 term note,
$10,000
for 2015 revolving credit facility, and
$3,750
for 2015 term note, as well as
$8,583
in capital lease payments,
$32,902
in common stock repurchases, and
$1,316
in 2016 Credit Facility debt related costs.
Cash provided by financing activities for 2015 of $40,205 was primarily attributable to $82,000 in net proceeds received from our 2015 revolving credit facility and $20,000 in net proceeds received from our
2014 revolving credit facility, and $7,172 in net proceeds received from the exercise stock options, partially offset by principal payments of $30,000 for 2015 revolving credit facility, $7,500 for 2015 term note, and $10,000 for 2014 term note, as well as $3,549 in capital lease payments,$15,911 in common stock repurchases, and $2,007 in 2015 Credit Facility debt related costs.
Cash used in financing activities for 2014 of $14,239 was primarily attributable to $41,666 in 2014 term note, 2013 term note, and 2013 revolving credit facility principal payments, $2,889 in capital lease and other liability payments, $49,338 in common stock repurchases, and $1,910 in 2014 Credit Facility debt related costs, partially offset by $67,000 borrowed under the 2014 revolving credit facility and $10,000 in proceeds from our 2014 Credit Facility, and $4,564 in net proceeds
received from the exercise and cancellation of stock options.
|
CONTRACTUAL OBLIGATIONS AND OTHER COMMERCIAL COMMITMENTS
|
The table below summarizes our contractual obligations at
December 31, 2016
, and the effect such obligations are expected to have on our liquidity and cash flow in future periods.
|
|
Payments Due by Period
|
||||||||||||||||||
|
(dollars in thousands)
|
Total
|
|
Less
than
1 year
|
|
2-3
years
|
|
4-5
years
|
|
After 5
years
|
|
|||||||||
|
|
(unaudited)
|
||||||||||||||||||
|
Contractual Obligations:
|
|||||||||||||||||||
|
2016 term note
|
$
|
110,938
|
|
$
|
18,750
|
|
$
|
37,500
|
|
$
|
54,688
|
|
$
|
—
|
|
||||
|
2016 revolving credit facility
|
$
|
209,000
|
|
—
|
|
—
|
|
209,000
|
|
||||||||||
|
Interest related to 2016 term note
|
10,884
|
|
4,014
|
|
5,861
|
|
1,009
|
|
—
|
|
|||||||||
|
Interest related to 2016 revolving credit facility
|
28,302
|
|
8,080
|
|
16,194
|
|
4,028
|
|
|||||||||||
|
Capital lease obligations
|
3,568
|
|
3,428
|
|
140
|
|
—
|
|
—
|
|
|||||||||
|
Operating lease obligations
|
55,905
|
|
9,969
|
|
21,401
|
|
12,932
|
|
11,603
|
|
|||||||||
|
Purchase obligations
|
203,273
|
|
86,048
|
|
104,512
|
|
4,000
|
|
8,713
|
|
|||||||||
|
Total contractual obligations
|
$
|
621,870
|
|
$
|
130,289
|
|
$
|
185,608
|
|
$
|
285,657
|
|
$
|
20,316
|
|
||||
|
Other Commercial Commitments:
|
|||||||||||||||||||
|
Standby letters of credit
|
$
|
1,578
|
|
$
|
1,578
|
|
$
|
—
|
|
$
|
—
|
|
$
|
—
|
|
||||
|
Total contractual obligations and other commercial commitments
|
$
|
623,448
|
|
$
|
131,867
|
|
$
|
185,608
|
|
$
|
285,657
|
|
$
|
20,316
|
|
||||
Credit Facility.
On June 3, 2016, we entered into a credit amendment (the “2016 Credit Facility”) consisting of a
$125,000
term note and a
$325,000
revolving credit facility. See Note 6 in the notes to the consolidated financial statements.
Capital lease obligations.
At
December 31, 2016
, we had capital lease obligations of
$3,568
mainly related to our corporate headquarters in Holmdel, New Jersey.
Operating lease obligations.
At
December 31, 2016
, we had future commitments for operating leases for co-location facilities mainly in the United States that accommodate a portion of our network equipment, for office spaces leased in Holmdel, New Jersey for our headquarters, in Atlanta, Georgia, Scottsdale, Arizona, Denver, Colorado, Minneapolis, Minnesota, Murray, Utah, Oak Brook, Illinois, and Houston, Texas, McLean, Virgina, Columbia, Maryland, Chicago, Illinois, Philadelphia, Pennsylvania, New York City, New York and Dallas, Texas for field sales and administration offices, in Tel Aviv, Israel for application development, and in London United Kingdom for our UK office, and for apartment space leased in New Jersey for certain executives.
Purchase obligations.
The purchase obligations reflected above are primarily commitments to vendors who
will provide local inbound services, provide customer care services, provide efax service, provide carrier operation, provide data center with technical supports, provide networks and telephone related services, provide marketing infrastructure and services, provide customer caller ID, provide electricity to our office, license patents to us, partner with us in international operations, process LNP orders, and lease office space to us. In certain cases, we may terminate these arrangements early upon payment of specified fees.
These amounts do not represent our entire anticipated purchases in the future, but represent only those items for which we are contractually committed. We also purchase products and services as needed with no firm commitment. For this reason, the amounts presented do not provide a reliable indicator of our expected future cash outflows or changes in our expected cash position.
See also
|
SUMMARY OF CRITICAL ACCOUNTING POLICIES AND ESTIMATES
|
Our significant accounting policies are summarized in Note 1 to our consolidated financial statements. The following describes our critical accounting policies and estimates:
Principles of Consolidation
The consolidated financial statements include the accounts of Vonage and its wholly-owned subsidiaries. All intercompany balances and transactions have been eliminated in consolidation. We also
44 VONAGE ANNUAL REPORT 2016
consolidated a majority-owned entity in Brazil where we had the ability to exercise controlling influence. The ownership interest of the noncontrolling party was presented as noncontrolling interest. On March 31, 2015, the Company completed its previously announced exit from the Brazilian market for consumer telephony services and the associated wind down of its joint venture operations in the country. The results of Brazilian operations are presented as discontinued operations for all periods presented. The results of companies acquired or disposed of are included in the consolidated financial statements from the effective date of the acquisition or up to the date of disposal.
Use of Estimates
Our consolidated financial statements are prepared in conformity with accounting principles generally accepted in the United States, which require management to make estimates and assumptions that affect the amounts reported and disclosed in the consolidated financial statements and the accompanying notes. Actual results could differ materially from these estimates.
On an ongoing basis, we evaluate our estimates, including the following:
|
>
|
the useful lives of property and equipment, software costs, and intangible assets;
|
|
>
|
assumptions used for the purpose of determining share-based compensation using the Black-Scholes option pricing model and Monte Carlo simulation model (“Models”), and various other assumptions that we believe to be reasonable; the key inputs for these Models include our stock price at valuation date, exercise price, the dividend yield, risk-free interest rate, life in years, and historical volatility of our common stock;
|
|
>
|
assumptions used in determining the need for, and amount of, a valuation allowance on net deferred tax assets, and;
|
|
>
|
assumptions used in determining the contingent consideration in connection with the Nexmo acquisition.
|
We base our estimates on historical experience, available market information, appropriate valuation methodologies, and on various other assumptions that we believed to be reasonable, the results of which form the basis for making judgments about the carrying values of assets and liabilities.
Revenue Recognition
Operating revenues consist of services revenues and customer equipment (which enables our services) and shipping revenues. The point in time at which revenues are recognized is determined in accordance with Securities and Exchange Commission Staff Accounting Bulletin No. 104, Revenue Recognition, and Financial Accounting Standards Board (“FASB”) Accounting Standards Codification (“ASC”) 605, Revenue Recognition.
At the time a customer signs up for our services, there are the following deliverables:
|
>
|
Providing equipment, if any, to the customer that enables our telephony services; and
|
|
>
|
Providing services.
|
The equipment is generally provided free of charge to our customers and in most instances there are no fees collected at sign-up. We record the fees collected for shipping the equipment to the customer, if any, as shipping and handling revenue at the time of shipment.
Services Revenue
Substantially all of our revenues are services revenues, which are derived primarily from monthly subscription fees that customers are
charged under our service plans. We also derive services revenues from per minute fees for international calls if not covered under a plan, including calls made via applications for mobile devices and other stand-alone products, and for any calling minutes in excess of a customer’s monthly plan limits. Monthly subscription fees are automatically charged to customers’ credit cards, debit cards or electronic check payments ("ECP"), in advance and are recognized over the following month when services are provided. Revenues generated from international calls and from customers exceeding allocated call minutes under limited minute plans are recognized as services are provided, that is, as minutes are used, and are billed to a customer's credit cards, debit cards or ECP in arrears. As a result of multiple billing cycles each month, we estimate the amount of revenues earned from international calls and from customers exceeding allocated call minutes under limited minute plans but not billed from the end of each billing cycle to the end of each reporting period and record these amounts as accounts receivable. These estimates are based primarily upon historical minutes and have been consistent with our actual results.
We also provide rebates to customers who purchase their customer equipment from retailers and satisfy minimum service period requirements. These rebates in excess of activation fees are recorded as a reduction of revenues over the service period based upon the estimated number of customers that will ultimately earn and claim the rebates.
In the United States, we charge regulatory, compliance, E-911, and intellectual property-related fees on a monthly basis to defray costs, and to cover taxes that we are charged by the suppliers of telecommunications services. In addition, we charge customers Federal Universal Service Fund (“USF”) fees. We recognize revenue on a gross basis for USF and related fees. We record these fees as revenue when billed. All other taxes are recorded on a net basis.
Our recently acquired subsidiary, Nexmo, provides CPaaS solutions to our customers. Through Nexmo, we provide innovative communication APIs for text messaging and voice communications, allowing developers and enterprises to embed contextual communications into mobile apps, websites and business workflows via text, social media, chat apps and voice. Nexmo has a global network of interconnected carriers delivering its API-based communications platform, enabling businesses to communicate with their customers reliably and with ease, no matter where in the world they are located.
Nexmo has two types of revenue activities:
Revenue is primarily derived from supplying messaging (SMS and Voice) services to customers. Revenue is recognized in the period when messages are sent by the customer. Revenue is recognized based on the price on the website pricing page or as otherwise agreed with the customer.
Our trading customers operate within the communications industry as service providers or bulk SMS aggregators. With our trading business, we sell to trading specialists who are delivering voice or SMS messages on behalf of their customers. Typically, trade is based on single supply route and margins, which are effectively fixed at a deal level, represent the value of the transaction to us. As such, for the trading business we record revenue on a net basis as service providers deliver messages.
Customer Equipment and Shipping Revenue
Customer equipment and shipping revenues consist of revenues from sales of customer equipment to wholesalers or directly to customers for replacement devices, or for upgrading their device at the time of customer sign-up for which we charge an additional fee. In addition, customer equipment and shipping revenues include revenues from the sale of VoIP telephones in order to access our small and medium business services. Customer equipment and shipping revenues also include the fees that customers are charged for shipping their customer equipment to them. Customer equipment and shipping revenues include sales to our retailers, who subsequently resell this customer equipment to customers. Revenues are reduced for payments to retailers and rebates to customers, who purchased their customer
45 VONAGE ANNUAL REPORT 2016
equipment through these retailers, to the extent of customer equipment and shipping revenues.
Inventory
Inventory consists of the cost of customer equipment and is stated at the lower of cost or market, with cost determined using the average cost method. We provide an inventory allowance for customer equipment that has been returned by customers but may not be able to be reissued to new customers or returned to the manufacturer for credit.
Goodwill and Purchased-Intangible Assets
Goodwill acquired in the acquisition of a business is accounted for based upon the excess fair value of consideration transferred over the fair value of net assets acquired in the business combination. Goodwill is tested for impairment on an annual basis on October 1st and, when specific circumstances dictate, between annual tests. When impaired, the carrying value of goodwill is written down to fair value. The goodwill impairment test involves evaluating qualitative information to determine if it is more than
50%
likely that the fair value of a reporting unit is less than its carrying value. If such a determination is made, then the traditional two-step goodwill impairment test described below must be applied. The first step, identifying a potential impairment, compares the fair value of a reporting unit with its carrying amount, including goodwill. If the carrying value of the reporting unit exceeds its fair value, the second step would need to be conducted; otherwise, no further steps are necessary as no potential impairment exists. The second step, measuring the impairment loss, compares the implied fair value of the reporting unit goodwill with the carrying amount of that goodwill. Any excess of the reporting unit goodwill carrying value over the respective implied fair value is recognized as an impairment loss. There was no impairment of goodwill for the year ended
December 31, 2016
.
Intangible assets acquired in the settlement of litigation or by direct purchase are accounted for based upon the fair value of assets received.
Purchased-intangible assets are accounted for based upon the fair value of assets received. Purchased-intangible assets are amortized on a straight-line or accelerated basis over the periods of benefit, ranging from
two
to
ten
years. We perform a review of purchased-intangible assets whenever events or changes in circumstances indicate that the useful life is shorter than we had originally estimated or that the carrying amount of assets may not be recoverable. If such facts and circumstances exist, we assess the recoverability of purchased-intangible assets by comparing the projected undiscounted net cash flows associated with the related asset or group of assets over their remaining lives against their respective carrying amounts. Impairments, if any, are based on the excess of the carrying amount over the fair value of those assets. If the useful life of the asset is shorter than originally estimated, we accelerate the rate of amortization and amortize the remaining carrying value over the new shorter useful life. There was no impairment of purchased-intangible assets identified for the years ended December 31,
2016
,
2015
, or
2014
.
Income Taxes
We recognize deferred tax assets and liabilities at enacted income tax rates for the temporary differences between the financial reporting bases and the tax bases of our assets and liabilities. Any effects of changes in income tax rates or tax laws are included in the provision for income taxes in the period of enactment. Our net deferred tax assets primarily consist of net operating loss carry forwards (“NOLs”). We are required to record a valuation allowance against our net deferred tax assets if we conclude that it is more likely than not that taxable income generated in the future will be insufficient to utilize the future income tax benefit from our net deferred tax assets (namely, the NOLs) prior to expiration. We periodically review this conclusion, which requires significant management judgment. If we are able to conclude in a future period that a future income tax benefit from our net deferred tax assets has a greater than
50%
likelihood of being realized, we are required in that period to reduce the related valuation allowance with a corresponding decrease in income tax expense. This would result in a
non-cash benefit to our net income in the period of the determination.
We periodically review this conclusion, which requires significant management judgment. In the future, if available evidence changes our conclusion that it is more likely than not that we will utilize our net deferred tax assets prior to their expiration, we will make an adjustment to the related valuation allowance and income tax expense at that time. In subsequent periods, we would expect to recognize income tax expense equal to our pre-tax income multiplied by our effective income tax rate, an expense that was not recognized prior to the reduction of the valuation allowance.
Net Operating Loss Carryforwards
As of
December 31, 2016
, we had NOLs for United States federal and state tax purposes, including the NOLs of iCore, Simple Signal, Telesphere, and Vocalocity as of the date of acquisition, of
$575,476
and
$158,848
, respectively, expiring at various times from years ending
2017
through
2036
.
In addition, we had NOLs for United Kingdom tax purposes of
$43,006
with no expiration date.
Under Section 382 of the Internal Revenue Code, if we undergo an “ownership change” (generally defined as a greater than 50% change (by value) in our equity ownership over a three-year period), our ability to use our pre-change of control NOLs and other pre-change tax attributes against our post-change income may be limited. The Section 382 limitation is applied annually so as to limit the use of our pre-change NOLs to an amount that generally equals the value of our stock immediately before the ownership change multiplied by a designated federal long-term tax-exempt rate. At
December 31, 2016
, there were no limitations on the use of our NOLs except for the NOLs of Vocalocity as of the date of acquisition.
Business Combinations
We account for business combinations using the acquisition method of accounting. The acquisition method of accounting requires that the purchase price, including the fair value of contingent consideration, of the acquisition be allocated to the assets acquired and liabilities assumed using the fair values determined by management as of the acquisition date. Goodwill as of the acquisition date is measured as the excess of consideration transferred over the net of the acquisition date fair values of assets acquired and the liabilities assumed. While the Company uses its best estimates and assumptions as part of the purchase price allocation process to accurately value assets acquired and liabilities assumed at the acquisition date, the Company’s estimates are inherently uncertain and subject to refinement. As a result, during the measurement period, which may be up to one year from the acquisition date, the Company records adjustments to the assets acquired and liabilities assumed, with the corresponding offset to goodwill to the extent the Company identifies adjustments to the preliminary purchase price allocation. Upon the conclusion of the measurement period or final determination of the values of assets acquired or liabilities assumed, whichever comes first, any subsequent adjustments are recorded to the consolidated statements of operations. We include the results of all acquisitions in our Consolidated Financial Statements from the date of acquisition.
Acquisition related transaction costs, such as banking, legal, accounting and other costs incurred in connection with an acquisition, are expensed as incurred in general and administrative expense.
Acquisition related integration costs include costs associated with exit or disposal activities, which do not meet the criteria of discontinued operations, including costs for employee, lease, and contract terminations, facility closing or other exit activities. Additionally, these costs include expenses directly related to integrating and reorganizing acquired businesses and include items such as employee retention costs, recruiting costs, certain moving costs, certain duplicative costs during integration and asset impairments. These costs are expensed as incurred in general and administrative expense.
Acquisition related consideration accounted for as compensation expense, such as restricted cash, restricted stock and option related costs incurred in connection with an acquisition are included in general and administrative expense.
46 VONAGE ANNUAL REPORT 2016
Share-Based Compensation
We account for share-based compensation in accordance with FASB ASC 718,
“Compensation-Stock Compensation”
. Under the fair value recognition provisions of this pronouncement, share-based compensation cost is measured at the grant date based on the fair value of the award, reduced as appropriate based on estimated forfeitures, and is recognized as expense over the applicable vesting period of the stock award using the accelerated method. The excess tax benefit associated with stock compensation deductions have not been recorded in additional paid-in capital. When evaluating whether an excess tax benefit has been realized, share based compensation deductions are not considered realized until NOLs are no longer sufficient to offset taxable income. Such excess tax benefits will be recorded when realized.
Recent Accounting Pronouncements
In January 2017, Financial Accounting Standards Board ("FASB") issued Accounting Standards Update ("ASU") 2017-04. "Intangibles - Goodwill and Other. The ASU simplifies the subsequent measurement of goodwill and eliminates Step 2 from the goodwill impairment test. This ASU is effective for an annual or any interim goodwill impairment tests in fiscal years beginning after December 15, 2019 on a prospective basis. Early adoption is permitted for interim or annual goodwill impairment tests performed on testing dates after January 1, 2017. We are currently evaluating the impact of adopting ASU 2017-04 on our consolidated financial statements and related disclosures.
In December 2016, FASB issued ASU 2016-20, "Revenue from Contract with Customers - Technical Corrections and Improvements to Topic 606". In May 2016, FASB issued ASU 2016-12, "Revenue from Contract with Customers - Narrow-Scope Improvements and Practical Expedients". In April 2016, FASB issued ASU 2016-10, "Revenue from Contracts with Customers - Identifying Performance Obligations and Licensing". In March 2016, FASB issued ASU 2016-08, "Revenue from Contract with Customers - Principal versus Agent Considerations (Reporting Revenue Gross versus Net)". In August 2015, FASB issued ASU 2015-14, "Deferral of the Effective Date". In May 2014, FASB issued ASU 2014-09, "Revenue from Contracts with Customers". The core principle of these ASUs are that an entity should recognize revenue to depict the transfer of promised goods or services to customers in an amount that reflects the consideration to which the entity expects to be entitled in exchange for those goods or services. The amendments in ASU 2016-12 affect only the narrow aspects of the guidance, such as assessing the collectibility criterion and accounting for contracts that do not meet the criterion, presentation of sales and other similar taxes collected from customers, non-cash consideration, and contract modifications at transition. ASU 2016-10 clarifies two aspects of the guidance: identifying performance obligations and the licensing implementation. The intention of the ASU 2016-08 is to improve the operability and understandability of the implementation guidance on principal versus agent considerations. ASU 2015-14 defers the effective date to annual and interim periods beginning on or after December 15, 2017, and early adoption will be permitted, but not earlier than the original effective date of annual and interim periods beginning on or after December 15, 2016, for public entities. ASU 2014-09 is a comprehensive new revenue recognition model for revenue from contract with customers. We will adopt these ASUs when effective. We are in the initial stages of evaluating the effect of adopting ASU2016-20, ASU 2016-12, ASU 2016-10, ASU 2016-08, ASU 2015-14, and ASU 2014-09 on our consolidated financial statements and related disclosures and continue to evaluate all transition methods.
In November 2016, FASB issued ASU 2016-18, "Statement of Cash Flows". This ASU requires that a statement of cash flows explains the change during the period in the total of cash, cash equivalents, and amounts generally described as restricted cash or restricted cash equivalents. As a result, amounts generally described as restricted cash and restricted cash equivalents should be included with cash and cash equivalents when reconciling the beginning-of-period and end-of-period total amounts shown on the statement of cash flows. This ASU is effective for fiscal years beginning after December
15, 2017, and interim periods within those fiscal years. Early adoption is permitted, including adoption in an interim period, any adjustments should be reflected as of the beginning of the fiscal year that includes that interim period. We will adopt this ASU in the first quarter of 2017. The adoption of ASU 2016-01 will not have a material impact on our consolidated financial statements and related disclosures.
In March 2016, FASB issued ASU 2016-09, "Improvements to Employee Share-Based Payment Accounting". This ASU is issued as part of its Simplification Initiative. The areas for simplification in this ASU involve several aspects of the accounting for share-based payment transactions, including the income tax consequences, recognition of share-based expense, classification of awards as either equity or liabilities, and classification on the statement of cash flows. This ASU is effective for fiscal years beginning after December 15, 2016, including interim periods within those fiscal years. Early adoption is permitted for any entity in any interim or annual period. We will adopt this ASU in the first quarter of 2017. We will elect to account for forfeitures when they occur versus our current practice of estimating the number of awards that are expected to vest. The election of this new practice will result in a one-time adjustment to our accumulated deficit for the difference of the two practices through the end of 2016. The adoption of ASU 2016-09 will not have a material impact on our consolidated financial statements and related disclosures.
In February 2016, FASB issued ASU 2016-02, "Leases". This ASU increases transparency and comparability among organizations by recognizing lease assets and lease liabilities on the balance sheet and disclosing key information about leasing arrangements. This ASU is effective for fiscal years beginning after December 15, 2018, including interim periods within those fiscal years. Early adoption is permitted for all entities. The adoption of this ASU will increase assets and liabilities for operating leases. We are currently evaluating the impact of adopting ASU 2016-02 on our consolidated financial statements and related disclosures.
In January 2016, FASB issued ASU 2016-01, "Recognition and Measurement of Financial Assets and Financial Liabilities". This ASU provide guidance concerning certain matters involving the recognition, measurement, and disclosure of financial assets and financial liabilities. The guidance does not alter the basic framework for classifying debt instruments held as financial assets. This ASU is effective for fiscal years beginning after December 15, 2017, including interim periods within those fiscal years. Early adoption is not permitted, with some exceptions. The adoption of ASU 2016-01 will not have a material impact on our consolidated financial statements and related disclosures.
In November 2015, FASB issued ASU 2015-17, "Balance Sheet Classification of Deferred Taxes". This ASU simplifies the presentation of deferred income taxes and requires deferred tax liabilities and assets be classified as non-current in a classified statement of financial position. This ASU is effective for fiscal years beginning after December 15, 2016, including interim periods within those fiscal years. Earlier application is permitted for all entities as of the beginning of an interim or annual reporting period. Management has adopted ASU 2015-17 effective for the fourth quarter of 2016. We presented the net deferred tax assets as noncurrent, reclassified any current deferred tax assets in the consolidated balance sheet on a prospective basis, and we did not adjusted the prior periods. If the period ended December 31, 2015 was adjusted, the deferred income taxes would be a non-current deferred tax assets of
$226,572
In July 2015, FASB issued ASU 2015-11, "Simplifying the Measurement of Inventory". This ASU applies to inventory that is measured using first-in, first-out ("FIFO") or average cost. Under the updated guidance, an entity should measure inventory that is within scope at the lower of cost and net realizable value, which is the estimated selling prices in the ordinary course of business, less reasonably predicable costs of completion, disposal and transportation. Subsequent measurement is unchanged for inventory that is measured using last-in, first-out ("LIFO") or the retail inventory. This ASU is effective for annual and interim periods beginning after December 15, 2016, and should be applied prospectively with early adoption permitted at the beginning of an interim and annual reporting period. The adoption of ASU 2015-11 is not expected to have a material impact on our consolidated financial statements and related disclosures.
47 VONAGE ANNUAL REPORT 2016
|
OFF-BALANCE SHEET ARRANGEMENTS
|
We do not have any off-balance sheet arrangements.
ITEM 7A.
Quantitative and Qualitative Disclosures About Market Risk
We are exposed to financial market risks, including changes in currency exchange rates and interest rates.
Foreign Exchange Risk
We sell our products and services primarily in the United States, Canada, and the European Union. Changes in currency exchange rates affect the valuation in our financial statements of the assets and liabilities of these operations. We also have a portion of our sales denominated in Euros, the Canadian Dollar, and the British Pound, which are also affected by changes in currency exchange rates. Our financial results could be affected by changes in foreign currency exchange rates, although foreign exchange risks have not been material to our financial position or results of operations to date.
We prepared a sensitivity analysis to determine the impact of hypothetical changes foreign currency exchange rates have on our results of operations. The foreign currency rate analysis assumed a uniform movement in currencies by 10% relative to the U.S. Dollar on our results. Based upon the results of this analysis, a 10% change in currency rates would have resulted in an increase or decrease in our earnings for the year ended
December 31, 2016
of approximately $1,400.
Our exposure to market risk for changes in interest rates primarily relates to our long-term debt.
Our 2016 Credit Facility consists of a $125,000 term note and a $325,000 revolving credit facility. We are exposed to interest rate risk since amounts payable under the 2016 Credit Facility, at our option, bore interest at:
|
>
|
LIBOR (applicable to one-, two-, three-, six-, or twelve-month periods) plus an applicable margin equal to
2.50%
if our
|
consolidated leverage ratio is less than
0.75
to 1.00,
2.75%
if our consolidated leverage ratio is greater than or equal to
0.75
to 1.00 and less than
1.50
to 1.00,
3.00%
if our consolidated leverage ratio is greater than or equal to
1.50
to 1.00 and less than
2.5
to 1.00, and
3.25%
if our consolidated leverage ratio is greater than or equal to
2.50
to 1.00, payable on the last day of each relevant interest period or, if the interest period is longer than
three
months, each day that is three months after the first day of the interest period, or
|
>
|
the base rate determined by reference to the highest of (a) the prime rate of JPMorgan Chase Bank, N.A., (b) the federal funds effective rate from time to time plus
0.50%
, and (c) the adjusted LIBO rate applicable to one month interest periods plus
1.00%
, plus an applicable margin equal to
1.50%
if our consolidated leverage ratio is less than
0.75
to 1.00,
1.75%
if our consolidated leverage ratio is greater than or equal to
0.75
to 1.00 and less than
1.50
to 1.00,
2.00%
if our consolidated leverage ratio is greater than or equal to
1.50
to 1.00 and less than
2.50
to 1.00, and
2.25%
if our consolidated leverage ratio is greater than or equal to
2.5
to 1.00, payable on the last business day of each March, June, September, and December and the maturity date of the 2016 Credit Facility.
|
As of
December 31, 2016
, if the interest rate on our variable rate debt changed by 1% on our 2016 term note, our annual debt service payment would change by approximately $1,100. As of
December 31, 2016
, if the interest rate on our variable rate debt changed by 1% on our 2016 revolving credit facility, our annual debt service payment would change by approximately $2,100.
ITEM 8.
Financial Statements and Supplementary Data
The information required by this Item is contained on pages F-1 through F-47 of this Annual Report on Form 10-K and incorporated herein by reference.
ITEM 9.
Changes in and Disagreements with Accountants on Accounting and Financial Disclosure
N/A.
48 VONAGE ANNUAL REPORT 2016
ITEM 9A.
Controls and Procedures
Evaluation of Disclosure Controls and Procedures
Our management, with the participation of our Chief Executive Officer and Chief Financial Officer, evaluated the effectiveness of the design and operation of our disclosure controls and procedures as of
December 31, 2016
. The term “disclosure controls and procedures,” as defined in Rules 13a-15(e) and 15d-15(e) under the Securities Exchange Act of 1934 (the “Exchange Act”), as amended, means controls and other procedures of a company that are designed to ensure that information required to be disclosed by a company in the reports that it files or submits under the Exchange Act is recorded, processed, summarized, and reported, within the time periods specified in the Securities and Exchange Commission’s rules and forms. Disclosure controls and procedures include, without limitation, controls and procedures designed to ensure that information required to be disclosed by a company in the reports that it files or submits under the Exchange Act is accumulated and communicated to the company’s management, including its principal executive and principal financial officers, or persons performing similar functions, as appropriate, to allow timely decisions regarding required disclosure. Our management recognizes that any controls and procedures, no matter how well designed and operated, can provide only reasonable assurance of achieving their objectives, and management necessarily applies its judgment in evaluating the cost-benefit relationship of possible controls and procedures. Based on the evaluation of our disclosure controls and procedures as of
December 31, 2016
, our Chief Executive Officer and Chief Financial Officer concluded that, as of such date, our disclosure controls and procedures were not effective at the reasonable assurance level solely as a result of the material weakness in our internal control over financial reporting discussed below.
Material Weakness.
In connection with the preparation of our consolidated financial statements as of and for the year ended December 31, 2016, we identified a material weakness in our internal control over financial reporting related to our controls over the preparation of the annual tax provision, described in Management’s Report on Internal Control Over Financial Reporting. We have concluded that this material weakness does not require a change in the fourth quarter or full year 2016 consolidated financial results disclosed in our Current Report on Form 8-K filed on February 14, 2017, nor does it require a restatement of or change in our consolidated financial statements for any prior annual or interim period. We have also developed a remediation plan for this material weakness, which is also described Management’s Report on Internal Control Over Financial Reporting.
Management’s Report on Internal Control Over Financial Reporting.
February 28, 2017
To the Stockholders of Vonage Holdings Corp.:
Our management is responsible for establishing and maintaining adequate internal control over financial reporting for the company. Internal control over financial reporting is defined in Rules 13a-15(f) and 15d-15(f) promulgated under the Securities Exchange Act of 1934 as a process designed by, or under the supervision of, our principal executive and principal financial officers and effected by our board of directors, management, and other personnel, to provide reasonable assurance regarding the reliability of financial reporting and the preparation of financial statements for external purposes in accordance with generally accepted accounting principles and includes those policies and procedures that:
|
>
|
Pertain to the maintenance of records that in reasonable detail accurately and fairly reflect the transactions and dispositions of the assets of the company;
|
|
>
|
Provide reasonable assurance that transactions are recorded as necessary to permit preparation of financial statements in accordance with generally accepted accounting principles, and that receipts and expenditures of the company are being made only in accordance with authorizations of our management and directors; and
|
|
>
|
Provide reasonable assurance regarding prevention or timely detection of unauthorized acquisition, use or disposition of the company’s assets that could have a material effect on the financial statements.
|
Because of its inherent limitations, internal control over financial reporting may not prevent or detect misstatements. Projections of any evaluation of effectiveness to future periods are subject to the risk that controls may become inadequate because of changes in conditions, or that the degree of compliance with the policies or procedures may deteriorate.
Our management assessed the effectiveness of our internal control over financial reporting as of
December 31, 2016
. In making this assessment, our management used the criteria set forth by the Committee of Sponsoring Organizations of the Treadway Commission (COSO) in
Internal Control-Integrated Framework (2013)
.
We acquired Nexmo in June 2016. Our management has excluded the operations of these businesses from our evaluation of, and conclusion regarding, the effectiveness of our internal control over financial reporting as of
December 31, 2016
. This business represents
11%
and
6%
of our total assets and revenues, respectively, as of
December 31, 2016
. Our management plans to fully integrate the operations of these businesses into its assessment of the effectiveness of our internal control over financial reporting in
2017
.
Based on our assessment, our Chief Executive Officer and Chief Financial Officer concluded that, as of
December 31, 2016
, our internal control over financial reporting was not effective, solely due to the material weakness in our internal control over financial reporting discussed below.
In connection with the preparation of our consolidated financial statements as of and for the year ended December 31, 2016, we identified a material weakness in our internal control over financial reporting related to our controls over the preparation of the annual tax provision, described in Management’s Report on Internal Control Over Financial Reporting. This control deficiency resulted in a reclassification between goodwill and deferred tax assets, net in our annual financial statements as of and for the year ended December 31, 2016. While the control deficiency did not result in a misstatement of our previously issued consolidated financial statements, the deficiency constitutes a material weakness in our internal control over financial reporting due to the potential for the control deficiency to result in a material misstatement in our annual or interim consolidated financial statements that would not be prevented or detected.
Remediation Plan.
Management has begun implementing a remediation plan to address the control deficiency that led to the material weakness. The remediation plan includes (i) the implementation of additional review procedures designed to enhance our tax provision control and (ii) strengthening our tax provision control with improved documentation standards, oversight, and training.
We currently plan to have our enhanced review procedures and documentation standards in place and operating in the first quarter of 2017. Our goal is to remediate this material weakness by the end of 2017, subject to there being sufficient opportunities to conclude, through testing, that the enhanced control is operating effectively.
49 VONAGE ANNUAL REPORT 2016
Our independent registered public accounting firm has issued an attestation report on our internal control over financial reporting. This report appears on page F-3.
|
/s/ ALAN MASAREK
|
/s/ DAVID PEARSON
|
|
|
Alan Masarek
Director, Chief Executive
Officer
|
David T. Pearson
Chief Financial Officer and Treasurer (Principal Financial and Accounting Officer and Duly Authorized Officer) |
|
Report of the Independent Registered Public Accounting Firm on Internal Control Over Financial Reporting.
See Report of Independent Registered Public Accounting Firm on page F-3.
Changes in Internal Control Over Financial Reporting
There were no changes to controls during the quarter ended
December 31, 2016
that have materially affected or are reasonably likely to materially affect our internal control over financial reporting.
ITEM 9B.
Other Information
None.
50 VONAGE ANNUAL REPORT 2016
ITEM 10.
Directors, Executive Officers and Corporate Governance
The discussion under the headings “Election of Directors,” “Section 16(a) Beneficial Ownership Reporting Compliance,” “Director Nomination Process”, “Corporate Governance – Board Committees – Audit Committee”, and “Executive Officers of Vonage” in our Proxy Statement for the
2017
Annual Meeting of Stockholders is hereby incorporated by reference.
We have adopted a Vonage Code of Conduct applicable to all of our directors, officers, and employees and a Vonage Finance Code of Ethics applicable to our chief financial officer and other employees
in our finance organization. The Vonage Code of Conduct and Vonage Finance Code of Ethics are posted in the Investor Relations section of our website,
www.vonage.com.
We will provide you with print copies of our codes free of charge on written request to Vonage Investor Relations, 23 Main Street, Holmdel NJ, 07733. We intend to disclose any amendments to, or waivers from, provisions of our codes that apply to our principal executive officer, principal financial officer, principal accounting officer or controller, or any person performing in similar functions, on our website promptly following the date of such amendment or waiver.
ITEM 11.
Executive Compensation
The discussion under the headings “Compensation”, “Director Compensation”, “Corporate Governance – Compensation Committee Interlocks and Insider Participation”, and “Corporate Governance – Compensation Committee Report” in our Proxy Statement for the
2017
Annual Meeting of Stockholders is hereby incorporated by reference.
The “Compensation Committee Report” contained in our Proxy Statement shall not be deemed “soliciting material” or “filed” with
the Securities and Exchange Commission or otherwise subject to the liabilities of Section 18 of the Securities Exchange Act of 1934 (the “Exchange Act”), nor shall it be deemed incorporated by reference in any filing under the Securities Act of 1933 (the “Securities Act”) or the Exchange Act, except to the extent we specifically request that such information be treated as soliciting material or specifically incorporate such information by reference into a document filed under the Securities Act or the Exchange Act.
ITEM 12.
Security Ownership of Certain Beneficial Owners and Management and Related Stockholder Matters
The discussion under the headings “Stock Ownership Information” and “Equity Compensation Plan Information” in our Proxy
Statement for the
2017
Annual Meeting of Stockholders is hereby incorporated by reference.
ITEM 13.
Certain Relationships and Related Transactions, and Director Independence
The discussion under the headings “Election of Directors – Transactions with Related Persons”, and “Corporate Governance –
Board Determination of Independence” in our Proxy Statement for the
2017
Annual Meeting of Stockholders is hereby incorporated by reference.
ITEM 14.
Principal Accountant Fees and Services
The discussion under the heading “Ratification of Independent Registered Public Accounting Firm” in our
Proxy Statement for the
2017
Annual Meeting of Stockholders is hereby incorporated by reference.
51 VONAGE ANNUAL REPORT 2016
Report of Independent Registered Public Accounting Firm
Board of Directors and Stockholders
Vonage Holdings Corp.
Holmdel, New Jersey 07733
The audits referred to in our report dated February 28, 2017 relating to the consolidated financial statements of Vonage Holdings Corp., which is contained in Item 8 of this Form 10-K also included the audit of the financial statement schedule listed in the accompanying index. The financial statement schedule is the responsibility of the Company’s management. Our responsibility is to express an opinion on this financial statement schedule based on our audits.
In our opinion such financial statement schedule, when considered in relation to the basic consolidated financial statements taken as a whole, present fairly, in all material respects, the information set forth therein.
/s/ BDO USA, LLP
Woodbridge, New Jersey
February 28, 2017
52 VONAGE ANNUAL REPORT 2016
ITEM 15.
Exhibits, Financial Statement Schedules
(a)
(1)
Financial Statements.
The index to our financial statements is found on page F-1 of this Form 10-K.
(2)
Financial Statement Schedule.
Schedule II—Valuation and Qualifying Accounts is as follows:
|
|
Balance at
Beginning
of Period
|
|
Additions
|
|
Less
Deductions
|
|
Other
|
Balance
at End
of Period
|
|
||||||||||||
|
Revenue
|
|
Expense
|
|
|
|||||||||||||||||
|
Allowance for Doubtful Accounts:
|
|||||||||||||||||||||
|
Year ended December 31, 2016
|
$
|
1,091
|
|
$
|
(51
|
)
|
$
|
1,053
|
|
|
$
|
—
|
|
$
|
—
|
|
$
|
2,093
|
|
||
|
Year ended December 31, 2015
|
607
|
|
492
|
|
(8
|
)
|
|
—
|
|
—
|
|
1,091
|
|
||||||||
|
Year ended December 31, 2014
|
683
|
|
117
|
|
(193
|
)
|
|
—
|
|
—
|
|
607
|
|
||||||||
|
Inventory Obsolescence:
|
|||||||||||||||||||||
|
Year ended December 31, 2016
|
$
|
686
|
|
$
|
—
|
|
$
|
589
|
|
|
$
|
(1,158
|
)
|
$
|
—
|
|
$
|
117
|
|
||
|
Year ended December 31, 2015
|
181
|
|
—
|
|
1,882
|
|
|
(1,377
|
)
|
—
|
|
686
|
|
||||||||
|
Year ended December 31, 2014
|
229
|
|
—
|
|
757
|
|
|
(805
|
)
|
—
|
|
181
|
|
||||||||
|
Valuation Allowance for Deferred Taxes:
|
|||||||||||||||||||||
|
Year ended December 31, 2016
|
$
|
20,456
|
|
$
|
—
|
|
$
|
(1,910
|
)
|
(1)
|
$
|
—
|
|
$
|
—
|
|
18,546
|
|
|||
|
Year ended December 31, 2015
|
17,451
|
|
—
|
|
3,005
|
|
(1)
|
—
|
|
—
|
|
20,456
|
|
||||||||
|
Year ended December 31, 2014
|
16,922
|
|
—
|
|
4,865
|
|
(1)
|
—
|
|
(4,336
|
)
|
(2
|
)
|
17,451
|
|
||||||
|
(1)
|
Amounts charged (credited) to expense represent change in valuation allowance.
|
|
(2)
|
Represents reversal of estimated valuation allowance on Vocalocity's deferred tax assets at date of acquisition.
|
(3) Exhibits.
|
Exhibit
Number
|
Description of Exhibit
|
|
|
2.1
|
Agreement and Plan of Merger, dated October 9, 2013, by and among Vonage, Vista Merger Corp., Vocalocity and the Representative (12).
|
|
|
2.2
|
Agreement and Plan of Merger, dated November 4, 2014, by and among Vonage, Thunder Acquisition Corp., Telesphere and the Representative (23)
|
|
|
2.3
|
Agreement and Plan of Merger, dated August 19, 2015, by and among Vonage Holdings Corp., Cirrus Acquisition Corp., iCore Networks, Inc. and Stephen G. Canton, as the Representative (18)
|
|
|
2.4
|
Agreement and Plan of Merger, dated May 5, 2016, by and among Vonage Holdings Corp., Neptune Acquisition Corp., Nexmo and the Representative (32)
|
|
|
2.5
|
Amendment No. 1 to Agreement and Plan of Merger, dated June 2, 2016, by and among Vonage Holdings Corp., Neptune Acquisition Corp., Nexmo and the Representative (33)
|
|
|
3.1
|
Restated Certificate of Incorporation of Vonage Holdings Corp.(3)
|
|
|
3.2
|
Amended and Restated By-Laws of Vonage Holdings Corp., effective as of December 10, 2015 (7)
|
|
|
4.1
|
Form of Certificate of Vonage Holdings Corp. Common Stock(2)
|
|
|
4.2
|
Tax Benefits Preservation Plan, dated as of June 7, 2012, by and between Vonage Holdings Corp. and American Stock Transfer & Trust Company, LLC, as Rights Agent, including as Exhibit A the form of Certificate of Designation of the Company's Series A Participating Preferred Stock and as Exhibit B the forms of Right Certificate and of Election to Purchase (17)
|
|
|
10.1
|
Vonage Holdings Corp. 2015 Equity Incentive Plan. (27)*
|
|
|
10.2
|
Form of Nonqualified Stock Option Agreement for Employees under the 2001 Stock Incentive Plan(1)*
|
|
|
10.3
|
Form of Nonqualified Stock Option Agreement for Outside Directors under the 2001 Stock Incentive Plan(1)*
|
|
|
10.4
|
Vonage Holdings Corp. 2006 Incentive Plan (Amended and Restated through June 6, 2013)(10)*
|
|
|
10.5
|
Form of Restricted Stock Unit Agreement under the Vonage Holdings Corp. 2006 Incentive Plan(4)*
|
|
|
10.6
|
Form of Nonqualified Stock Option Agreement under the Vonage Holdings Corp. 2006 Incentive Plan(13)*
|
|
|
10.7
|
Form of Restricted Stock Agreement under the Vonage Holdings Corp. 2006 Incentive Plan(4)*
|
|
|
10.8
|
Form of Restricted Stock Agreement for Non-Executive Directors under the Vonage Holdings Corp. 2006 Incentive Plan (8)*
|
|
|
10.9
|
Form of Nonqualified Stock Option Agreement for Non-Executive Directors (Quarterly Grants) under the Vonage Holdings Corp. 2006 Incentive Plan (8)*
|
|
53 VONAGE ANNUAL REPORT 2016
|
10.10
|
Form of Nonqualified Stock Option Agreement for Non-Executive Directors (Sign-on Grant) under the Vonage Holdings Corp. 2006 Incentive Plan (8)*
|
|
|
10.11
|
Vonage Holdings Corp. 401(k) Retirement Plan(1)*
|
|
|
10.12
|
Lease Agreement, dated March 24, 2005, between 23 Main Street Holmdel Associates LLC and Vonage USA Inc.(1)
|
|
|
10.13
|
Amendment to Lease Agreement, dated November 1, 2006, between 23 Main Street Holmdel Associates LLC and Vonage USA Inc.(31)
|
|
|
10.14
|
Amendment to Lease Agreement, dated December 1, 2015, between 23 Main Street Holmdel Associates LLC and Vonage USA Inc.(31)
|
|
|
10.15
|
Amended and Restated Non-Compete Agreement dated as of October 17, 2008 by and between Vonage Holdings Corp. and Jeffrey A. Citron(9)
|
|
|
10.16
|
Form of Nonqualified Stock Option Agreement for Jeffrey A. Citron under the Vonage Holdings Corp. 2006 Incentive Plan(28)*
|
|
|
10.17
|
Letter Agreement, dated February 6, 2012, between Vonage Holdings Corp. and Graham McGonigal(16)*
|
|
|
10.18
|
Employment Agreement dated as of April 25, 2013 by and between Vonage Holdings Corp. and David T. Pearson (20)*
|
|
|
10.19
|
Letter Agreement, dated April 2, 2015, between Vonage Holdings Corp. and Edward M. Gilvar (22)*
|
|
|
10.20
|
Employment Agreement dated as of December 2, 2013 by and between Vonage Holdings Corp. and Joseph Redling (29)*
|
|
|
10.21
|
Letter Agreement dated as of June 9, 2015 by and between Vonage Holdings Corp. and Omar Javaid (15)*
|
|
|
10.22
|
Letter Agreement, dated July 15, 2009, between Vonage Holdings Corp. and Kurt Rogers(11)*
|
|
|
10.23
|
Amendment to Letter Agreement, dated December 22, 2010, between Vonage Holdings Corp. and Kurt Rogers(14)*
|
|
|
10.24
|
Second Amendment to Letter Agreement, dated March 27, 2012, between Vonage Holdings Corp. and Kurt Rogers(16)*
|
|
|
10.25
|
Amendment to Letter Agreement between Vonage Holdings Corp. and Kurt Rogers (19)*
|
|
|
10.26
|
Non-Executive Director Compensation Program (31)*
|
|
|
10.27
|
Form of Indemnification Agreement between Vonage Holdings Corp. and its directors and certain officers(5)*
|
|
|
10.28
|
Employment Agreement dated as of October 6, 2014 by and between Vonage Holdings Corp. and Alan Masarek (30)*
|
|
|
10.29
|
Letter Agreement dated as of September 18, 2014 by and between Vonage Holdings Corp. and Pablo Calamera (24)*
|
|
|
10.30
|
Letter Agreement dated as of November 4, 2014 by and between Vonage Holdings Corp. and Clark Peterson (30)*
|
|
|
10.31
|
Letter Agreement dated as of October 19, 2015 by and between Vonage Holdings Corp. and Susan Quackenbush (31)*
|
|
|
10.32
|
Settlement and Patent License Agreement, dated December 21, 2007, between Vonage Holdings Corp. and AT&T Corp.(6)
|
|
|
10.33†
|
Route Management Services Addendum (the “Addendum”), by and between Vonage America Inc., a wholly-owned subsidiary of Vonage Holdings Corp., and Tata Communications (America) Inc., effective as of July 1, 2013. (20)
|
|
|
10.34
|
First Amendment to Employment Agreement by and between Vonage Holdings Corp. and Alan Masarek (31)*
|
|
|
10.35†
|
Amendment to Route Management Services Addendum (the “Addendum”), by and between Vonage America Inc., a wholly-owned subsidiary of Vonage Holdings Corp., and Tata Communications (America) Inc., effective as of December 23, 2015. (31)
|
|
|
10.36†
|
Route Management Services Addendum (the “Addendum”), by and between Vonage America Inc., a wholly-owned subsidiary of Vonage Holdings Corp., and Tata Communications (America) Inc., effective as of July 1, 2016. (31)
|
|
|
10.37
|
Credit Agreement, dated as of July 29, 2011 among Vonage Holdings Corp. and Vonage America Inc., as borrowers, various lenders, JPMorgan Chase Bank, N.A., as Administrative Agent, and RBS Citizens, N.A., as Syndication Agent.(25)
|
|
|
10.38
|
Amendment No. 1, dated February 11, 2013, by and among Vonage America Inc. and Vonage Holdings Corp., as borrowers, various lenders, and JPMorgan Chase Bank, N.A., as Administrative Agent, under that certain Credit Agreement dated as of July 29, 2011 by and among the Borrowers, the Lenders and the Administrative Agent (19)
|
|
|
10.39
|
Amendment No. 2, dated July 26, 2013, by and among Vonage America Inc. and Vonage Holdings Corp., as borrowers, various lenders, and JPMorgan Chase Bank, N.A., as Administrative Agent, under that certain Credit Agreement dated as of July 29, 2011 by and among the Borrowers, the Lenders and the Administrative Agent (21)
|
|
|
10.40
|
Credit Agreement, dated August 13, 2014, by and among Vonage America Inc. and Vonage Holdings Corp., as borrowers, various lenders, and JPMorgan Chase Bank, N.A., as Administrative Agent, Citizens Bank, N.A., as Syndication Agent, and Silicon Valley Bank and Suntrust Bank, as Documentation Agents (24)
|
|
|
10.41
|
Amended and Restated Credit Agreement among Vonage America Inc., Vonage Holdings Corp., the Lenders from time to time party thereto, JPMorgan Chase Bank, N.A., as Administrative Agent, Citizens Bank, N.A., as Syndication Agent, and Fifth Third Bank, MUFG Union Bank, N.A., Silicon Valley Bank and SunTrust Bank, as Documentation Agents. (26)
|
|
|
10.42
|
Nexmo Inc. 2011 Stock Plan (34)
|
|
|
10.43
|
Amendment No. 1 to Amended and Restated Credit Agreement, dated June 3, 2016, by and among Vonage America Inc., a Delaware corporation, Vonage Holdings Corp., Citizens Bank, N.A., Fifth Third Bank, MUFG Union Bank, N.A., Silicon Valley Bank, SunTrust Bank, Keybank National Association, Santander Bank, N.A., Capital One National Association, First Niagara Bank, N.A., and JPMorgan Chase Bank, N.A., as Administrative Agent (35)
|
|
|
21.1
|
List of Subsidiaries of Vonage Holdings Corp.(36)
|
|
|
23.1
|
Consent of BDO USA, LLP, independent registered public accounting firm(36)
|
|
|
31.1
|
Certification of our Chief Executive Officer pursuant to Securities Exchange Act Rules 13a-14(a) and 15d-14(a), as adopted pursuant to Section 302 of the Sarbanes-Oxley Act of 2002(36)
|
|
|
31.2
|
Certification of our Chief Financial Officer pursuant to Securities Exchange Act Rules 13a-14(a) and 15d-14(a), as adopted pursuant to Section 302 of the Sarbanes-Oxley Act of 2002(36)
|
|
|
32.1
|
Certification of our Chief Executive Officer and Chief Financial Officer pursuant to 18 U.S.C. Section 1350, as adopted pursuant to Section 906 of the Sarbanes-Oxley Act of 2002(36)
|
|
54 VONAGE ANNUAL REPORT 2016
|
(1)
|
Incorporated by reference to Amendment No. 1 to Vonage Holdings Corp.’s Registration Statement on Form S-1 (File No. 333-131659) filed on April 7, 2006.
|
|
(2)
|
Incorporated by reference to Amendment No. 5 to Vonage Holdings Corp.’s Registration Statement on Form S-1 (File No. 333-131659) filed on May 8, 2006.
|
|
(3)
|
Incorporated by reference to Vonage Holdings Corp.’s Quarterly Report on Form 10-Q (File No. 001-32887) filed on August 4, 2006.
|
|
(4)
|
Incorporated by reference to Vonage Holding Corp.’s Annual Report on Form 10-K (File No. 001-32887) filed on April 17, 2007.
|
|
(5)
|
Incorporated by reference to Vonage Holding Corp.’s Quarterly Report on Form 10-Q (File No. 001-32887) filed on November 14, 2007.
|
|
(6)
|
Incorporated by reference to Vonage Holding Corp.’s Annual Report on Form 10-K (File No. 001-32887) filed on March 17, 2008.
|
|
(7)
|
Incorporated by reference to Vonage Holding Corp.’s Current Report on Form 8-K (File No. 001-32887) filed on December 11, 2015.
|
|
(8)
|
Incorporated by reference to Vonage Holding Corp.’s Quarterly Report on Form 10-Q (File No. 001-32887) filed on August 11, 2008.
|
|
(9)
|
Incorporated by reference to Vonage Holding Corp.’s Quarterly Report on Form 10-Q (File No. 001-32887) filed on November 10, 2008.
|
|
(10)
|
Incorporated by reference to Vonage Holding Corp.’s Current Report on Form 8-K (File No. 001-32887) filed on June 6, 2013.
|
|
(11)
|
Incorporated by reference to Vonage Holding Corp.’s Quarterly Report on Form 10-Q (File No. 001-32887) filed on November 6, 2009.
|
|
(12)
|
Incorporated by reference to the Current Report on Form 8-K (File No. 001-32887) filed by on October 10, 2013.
|
|
(13)
|
Incorporated by reference to Vonage Holding Corp.’s Quarterly Report on Form 10-Q (File No. 001-32887) filed on May 7, 2010.
|
|
(14)
|
Incorporated by reference to Vonage Holding Corp.’s Annual Report on Form 10-K (File No. 001-32887) filed on February 17, 2011.
|
|
(15)
|
Incorporated by reference to Vonage Holding Corp.’s Quarterly Report on Form 10-Q (File No. 001-32887) filed on November 4, 2015.
|
|
(16)
|
Incorporated by reference to Vonage Holding Corp.’s Current Report on Form 10-Q (File No. 001-32887) filed on May 3, 2012.
|
|
(17)
|
Incorporated by reference to Vonage Holding Corp.’s Current Report on Form 8-K (File No. 001-32887) filed on June 8, 2012.
|
|
(18)
|
Incorporated by reference to Vonage Holding Corp.’s Current Report on Form 8-K (File No. 001-32887) filed on August 20, 2015.
|
|
(19)
|
Incorporated by reference to Vonage Holding Corp.’s Quarterly Report on Form 10-Q (File No. 001-32887) filed on May 1, 2013.
|
|
(20)
|
Incorporated by reference to Vonage Holding Corp.’s Quarterly Report on Form 10-Q (File No. 001-32887) filed on July 31, 2013.
|
|
(21)
|
Incorporated by reference to Vonage Holding Corp.’s Quarterly Report on Form 10-Q (File No. 001-32887) filed on November 6, 2013.
|
|
(22)
|
Incorporated by reference to Vonage Holding Corp.’s Annual Report on Form 10-Q (File No. 001-32887) filed on May 7, 2015.
|
|
(23)
|
Incorporated by reference to Vonage Holding Corp.’s Current Report on Form 8-K (File No. 001-32887) filed on November 5, 2014.
|
|
(24)
|
Incorporated by reference to Vonage Holding Corp.’s Quarterly Report on Form 10-Q (File No. 001-32887) filed on November 5, 2014.
|
|
(25)
|
Incorporated by reference to Vonage Holding Corp.’s Quarterly Report on Form 10-Q (File No. 001-32887) filed on August 4, 2011.
|
|
(26)
|
Incorporated by reference to Vonage Holding Corp.’s Quarterly Report on Form 10-Q (File No. 001-32887) filed on July 30, 2015.
|
|
(27)
|
Incorporated by reference to Vonage Holding Corp.’s Current Report on Form 8-K (File No. 001-32887) filed on June 3, 2015.
|
|
(28)
|
Incorporated by reference to Vonage Holding Corp.’s Current Report on Form 8-K (File No. 001-32887) filed on August 4, 2008.
|
|
(29)
|
Incorporated by reference to Vonage Holding Corp.’s Annual Report on Form 10-K (File No. 001-32887) filed on February 13, 2014.
|
|
(30)
|
Incorporated by reference to Vonage Holding Corp.’s Annual Report on Form 10-K (File No. 001-32887) filed on February 13, 2015.
|
|
(31)
|
Incorporated by reference to Vonage Holding Corp.’s Annual Report on Form 10-K (File No. 001-32887) filed on February 12, 2016.
|
|
(32)
|
Incorporated by reference to Vonage Holdings Corp.’s Quarterly Report on Form 8-K (File No. 001-32887) filed on May 5, 2016.
|
|
(33)
|
Incorporated by reference to Vonage Holdings Corp.’s Quarterly Report on Form 8-K (File No. 001-32887) filed on June 6, 2016.
|
|
(34)
|
Incorporated by reference to Vonage Holding Corp.’s Registration Statement on Form S-8 (File No. 001-32887) filed on June 29, 2016.
|
|
(35)
|
Incorporated by reference to Vonage Holdings Corp.’s Quarterly Report on Form 8-K (File No. 001-32887) filed on June 6, 2016.
|
|
(36)
|
Filed herewith.
|
|
†
|
Portions of this Exhibit have been omitted and filed separately with the Securities and Exchange Commission as part of an order or application for confidential treatment pursuant to the Securities Act of 1933, as amended or the Securities Exchange Act of 1934, as amended.
|
|
*
|
Management contract or compensatory plan or arrangement.
|
(b) Exhibits Filed Herewith
Refer to (a)(3) above.
(c) Financial Statement Schedule
Report of Independent Registered Public Accounting Firm
Schedule II – Valuation and Qualifying Accounts.
55 VONAGE ANNUAL REPORT 2016
ITEM 16.
Form 10-K Summary
None.
SIGNATURES
Pursuant to the requirements of Section 13 or 15(d) of the Securities Exchange Act of 1934, the registrant has duly caused this Report to be signed on its behalf by the undersigned, thereunto duly authorized, in the city of Holmdel, State of New Jersey, on
February 28, 2017
.
|
VONAGE HOLDINGS CORP.
|
||||
|
Dated:
|
February 28, 2017
|
By:
|
/S/ DAVID PEARSON
|
|
|
David Pearson
|
||||
|
David T. Pearson
Chief Financial Officer and Treasurer (Principal Financial and Accounting Officer and Duly Authorized Officer) |
||||
Pursuant to the requirements of the Securities Exchange Act of 1934, this Report has been signed below by the following persons on behalf of the registrant and in the capacities and as of the dates indicated.
56 VONAGE ANNUAL REPORT 2016
|
Signature
|
Title
|
Date
|
||
|
/S/ ALAN MASAREK
|
Director, Chief Executive Officer
|
February 28, 2017
|
||
|
Alan Masarek
|
(principal executive officer)
|
|||
|
/S/ DAVID T. PEARSON
|
Chief Financial Officer
|
February 28, 2017
|
||
|
David T. Pearson
|
and Treasurer
(principal financial officer and principal
accounting officer)
|
|||
|
/S/ JEFFREY A. CITRON
|
Director, Chairman
|
February 28, 2017
|
||
|
Jeffrey A. Citron
|
||||
|
/S/ HAMID AKHAVAN
|
||||
|
Hamid Akhavan
|
Director
|
February 28, 2017
|
||
|
/S/ NAVEEN CHOPRA
|
Director
|
February 28, 2017
|
||
|
Naveen Chopra
|
||||
|
/S/ STEPHEN FISHER
|
Director
|
February 28, 2017
|
||
|
Stephen Fisher
|
||||
|
/S/ CAROLYN KATZ
|
Director
|
February 28, 2017
|
||
|
Carolyn Katz
|
||||
|
/S/ JOHN J. ROBERTS
|
Director
|
February 28, 2017
|
||
|
John J. Roberts
|
||||
|
/S/ CARL SPARKS
|
Director
|
February 28, 2017
|
||
|
Carl Sparks
|
||||
|
/S/ GARY STEELE
|
Director
|
February 28, 2017
|
||
|
Gary Steele
|
||||
57 VONAGE ANNUAL REPORT 2016
INDEX TO FINANCIAL STATEMENTS
|
|
Page
|
F-1
REPORT OF INDEPENDENT REGISTERED PUBLIC ACCOUNTING FIRM
Board of Directors and Stockholders
Vonage Holdings Corp.
Holmdel, New Jersey 07733
We have audited the accompanying consolidated balance sheets of Vonage Holdings Corp. as of December 31, 2016 and 2015, and the related consolidated statements of income, comprehensive income, stockholders’ equity (deficit) and redeemable noncontrolling interest and cash flows for each of the three years in the period ended December 31, 2016. These financial statements are the responsibility of the Company’s management. Our responsibility is to express an opinion on these financial statements based on our audits.
We conducted our audits in accordance with the standards of the Public Company Accounting Oversight Board (United States). Those standards require that we plan and perform the audit to obtain reasonable assurance about whether the financial statements are free of material misstatement. An audit also includes examining, on a test basis, evidence supporting the amounts and disclosures in the financial statements, assessing the accounting principles used and significant estimates made by management, as well as evaluating the overall financial statement presentation. We believe that our audits provide a reasonable basis for our opinion.
In our opinion, the consolidated financial statements referred to above present fairly, in all material respects, the financial position of Vonage Holdings Corp. as of December 31, 2016 and 2015, and the results of its operations and its cash flows for each of the three years in the period ended December 31, 2016, in conformity with accounting principles generally accepted in the United States of America.
As discussed in Note 1 to the consolidated financial statements, the Company changed its method for presenting the net deferred tax assets within the consolidated balance sheet in 2016 due to the adoption of ASU 2015-17, "Balance Sheet Classification of Deferred Taxes". Prior periods have not been adjusted. Our opinion is not modified with respect to this matter.
We also have audited, in accordance with the standards of the Public Company Accounting Oversight Board (United States), Vonage Holdings Corp.’s internal control over financial reporting as of December 31, 2016, based on criteria established in Internal Control - Integrated Framework (2013) issued by the Committee of Sponsoring Organizations of the Treadway Commission and our report dated February 28, 2017 expressed an adverse opinion thereon.
/s/ BDO USA, LLP
Woodbridge, New Jersey
February 28, 2017
F-2
REPORT OF INDEPENDENT REGISTERED PUBLIC ACCOUNTING FIRM
Board of Directors and Stockholders
Vonage Holdings Corp.
Holmdel, New Jersey 07733
We have audited Vonage Holdings Corp.’s (the “Company”) internal control over financial reporting as of December 31, 2016, based on criteria established in Internal Control - Integrated Framework (2013) issued by the Committee of Sponsoring Organizations of the Treadway Commission (the “COSO criteria”). The Company’s management is responsible for maintaining effective internal control over financial reporting and for its assessment of the effectiveness of internal control over financial reporting, included in the accompanying “Item 9A. Management’s Report on Internal Control Over Financial Reporting.” Our responsibility is to express an opinion on the Company’s internal control over financial reporting based on our audit.
We conducted our audit in accordance with the standards of the Public Company Accounting Oversight Board (United States). Those standards require that we plan and perform the audit to obtain reasonable assurance about whether effective internal control over financial reporting was maintained in all material respects. Our audit included obtaining an understanding of internal control over financial reporting, assessing the risk that a material weakness exists, and testing and evaluating the design and operating effectiveness of internal control based on the assessed risk. Our audit also included performing such other procedures as we considered necessary in the circumstances. We believe that our audit provides a reasonable basis for our opinion.
A company’s internal control over financial reporting is a process designed to provide reasonable assurance regarding the reliability of financial reporting and the preparation of financial statements for external purposes in accordance with generally accepted accounting principles. A company’s internal control over financial reporting includes those policies and procedures that (1) pertain to the maintenance of records that, in reasonable detail, accurately and fairly reflect the transactions and dispositions of the assets of the company; (2) provide reasonable assurance that transactions are recorded as necessary to permit preparation of financial statements in accordance with generally accepted accounting principles, and that receipts and expenditures of the company are being made only in accordance with authorizations of management and directors of the company; and (3) provide reasonable assurance regarding prevention or timely detection of unauthorized acquisition, use, or disposition of the company’s assets that could have a material effect on the financial statements.
Because of its inherent limitations, internal control over financial reporting may not prevent or detect misstatements. Also, projections of any evaluation of effectiveness to future periods are subject to the risk that controls may become inadequate because of changes in conditions, or that the degree of compliance with the policies or procedures may deteriorate.
A material weakness is a deficiency, or a combination of deficiencies, in internal control over financial reporting, such that there is a reasonable possibility that a material misstatement of the company’s annual or interim financial statements will not be prevented or detected on a timely basis. A material weakness regarding management’s failure to design and maintain controls over the preparation of the annual tax provision has been identified and described in management’s assessment. This material weakness was considered in determining the nature, timing, and extent of audit tests applied in our audit of the 2016 financial statements, and this report does not affect our report dated February 28, 2017 on those financial statements.
As indicated in the accompanying Item 9A, Management’s Report on Internal Control over Financial Reporting”, management’s assessment of and conclusion on the effectiveness of internal control over financial reporting did not include the internal controls of Nexmo Inc., which was acquired on June 3, 2016, and which is included in the consolidated balance sheets of Vonage Holdings Corp. as of December 31, 2016, and the related consolidated statements of income, comprehensive income, stockholders’ equity (deficit) and redeemable noncontrolling interest and cash flows for the year then ended. Nexmo constituted 11% of total assets as of December 31, 2016 and 6% of revenues for the year then ended. Management did not assess the effectiveness of internal control over financial reporting of Nexmo because of the timing of the acquisition. Our audit of internal control over financial reporting of Vonage Holdings Corp. also did not include an evaluation of the internal control over financial reporting of Nexmo.
In our opinion, Vonage Holdings Corp. did not maintain, in all material respects, effective internal control over financial reporting as of December 31, 2016, based on the COSO criteria.
We also have audited, in accordance with the standards of the Public Company Accounting Oversight Board (United States), the consolidated balance sheets of Vonage Holdings Corp. as of December 31, 2016 and 2015 and the related consolidated statements of income, comprehensive income, stockholders’ equity and redeemable noncontrolling interest, and cash flows for each of the three years in the period ended December 31, 2016 and our report dated February 28, 2017 expressed an unqualified opinion thereon.
/s/ BDO USA, LLP
Woodbridge, New Jersey
February 28, 2017
F-3 VONAGE ANNUAL REPORT 2016
|
|
VONAGE HOLDINGS CORP. CONSOLIDATED BALANCE SHEETS
|
(In thousands, except par value)
|
December 31, 2016
|
|
December 31, 2015
|
|
|||
|
Assets
|
|||||||
|
Current assets:
|
|||||||
|
Cash and cash equivalents
|
$
|
29,078
|
|
$
|
57,726
|
|
|
|
Marketable securities
|
601
|
|
9,908
|
|
|||
|
Accounts receivable, net of allowance of $2,093 and $1,091, respectively
|
36,688
|
|
19,913
|
|
|||
|
Inventory, net of allowance of $117 and $686, respectively
|
4,116
|
|
5,542
|
|
|||
|
Deferred customer acquisition costs, current
|
2,610
|
|
4,074
|
|
|||
|
Deferred tax assets, current
|
—
|
|
23,985
|
|
|||
|
Prepaid expenses and other current assets
|
29,188
|
|
15,659
|
|
|||
|
Total current assets
|
102,281
|
|
136,807
|
|
|||
|
Property and equipment, net
|
48,415
|
|
49,483
|
|
|||
|
Goodwill
|
360,363
|
|
222,106
|
|
|||
|
Software, net
|
21,971
|
|
20,710
|
|
|||
|
Deferred customer acquisition costs, non-current
|
526
|
|
431
|
|
|||
|
Debt related costs, net
|
2,333
|
|
2,053
|
|
|||
|
Restricted cash
|
1,851
|
|
2,587
|
|
|||
|
Intangible assets, net
|
199,256
|
|
138,199
|
|
|||
|
Deferred tax assets, non-current
|
188,966
|
|
202,587
|
|
|||
|
Other assets
|
14,460
|
|
9,603
|
|
|||
|
Total assets
|
$
|
940,422
|
|
$
|
784,566
|
|
|
|
Liabilities and Stockholders’ Equity
|
|||||||
|
Liabilities
|
|||||||
|
Current liabilities:
|
|||||||
|
Accounts payable
|
$
|
30,751
|
|
$
|
42,798
|
|
|
|
Accrued expenses
|
109,195
|
|
96,127
|
|
|||
|
Deferred revenue, current portion
|
32,442
|
|
32,605
|
|
|||
|
Current maturities of capital lease obligations
|
3,288
|
|
4,398
|
|
|||
|
Current portion of notes payable
|
18,750
|
|
15,000
|
|
|||
|
Total current liabilities
|
194,426
|
|
190,928
|
|
|||
|
Indebtedness under revolving credit facility
|
209,000
|
|
119,000
|
|
|||
|
Notes payable, net of debt related cost and current portion
|
91,124
|
|
76,392
|
|
|||
|
Deferred revenue, net of current portion
|
450
|
|
851
|
|
|||
|
Capital lease obligations, net of current maturities
|
140
|
|
3,363
|
|
|||
|
Other liabilities, net of current portion in accrued expenses
|
3,985
|
|
5,291
|
|
|||
|
Total liabilities
|
499,125
|
|
395,825
|
|
|||
|
Commitments and Contingencies
|
—
|
|
—
|
|
|||
|
Stockholders’ Equity
|
|||||||
|
Common stock, par value $0.001 per share; 596,950 shares authorized at December 31, 2016 and December 31, 2015; 282,319 and 268,947 shares issued at December 31, 2016 and December 31, 2015, respectively; 219,001 and 214,280 shares outstanding at December 31, 2016 and December 31, 2015, respectively
|
282
|
|
270
|
|
|||
|
Additional paid-in capital
|
1,310,847
|
|
1,224,947
|
|
|||
|
Accumulated deficit
|
(637,113
|
)
|
(655,020
|
)
|
|||
|
Treasury stock, at cost, 63,318 shares at December 31, 2016 and 54,667 shares at December 31, 2015
|
(219,125
|
)
|
(179,779
|
)
|
|||
|
Accumulated other comprehensive loss
|
(13,594
|
)
|
(1,677
|
)
|
|||
|
Total stockholders’ equity
|
441,297
|
|
388,741
|
|
|||
|
Total liabilities and stockholders’ equity
|
$
|
940,422
|
|
$
|
784,566
|
|
|
The accompanying notes are an integral part of these financial statements
F-4 VONAGE ANNUAL REPORT 2016
|
|
|
|
For the years ended December 31,
|
||||||||||
|
(In thousands, except per share amounts)
|
2016
|
|
2015
|
|
2014
|
|
|||||
|
Total revenues
|
$
|
955,621
|
|
$
|
895,072
|
|
$
|
868,854
|
|
||
|
Operating Expenses:
|
|||||||||||
|
Cost of services (excluding depreciation and amortization of $28,489, $24,868, and $19,405, respectively)
|
321,373
|
|
261,768
|
|
231,383
|
|
|||||
|
Cost of goods sold
|
33,777
|
|
34,210
|
|
36,500
|
|
|||||
|
Sales and marketing
|
330,969
|
|
347,896
|
|
373,737
|
|
|||||
|
Engineering and development
|
29,759
|
|
27,220
|
|
20,869
|
|
|||||
|
General and administrative
|
123,304
|
|
109,153
|
|
98,780
|
|
|||||
|
Depreciation and amortization
|
72,285
|
|
61,833
|
|
49,514
|
|
|||||
|
|
911,467
|
|
842,080
|
|
810,783
|
|
|||||
|
Income from operations
|
44,154
|
|
52,992
|
|
58,071
|
|
|||||
|
Other Income (Expense):
|
|||||||||||
|
Interest income
|
79
|
|
89
|
|
207
|
|
|||||
|
Interest expense
|
(13,042
|
)
|
(8,786
|
)
|
(6,823
|
)
|
|||||
|
Other (expense) income, net
|
(346
|
)
|
(842
|
)
|
11
|
|
|||||
|
|
(13,309
|
)
|
(9,539
|
)
|
(6,605
|
)
|
|||||
|
Income from continuing operations before income tax expense
|
30,845
|
|
43,453
|
|
51,466
|
|
|||||
|
Income tax expense
|
(12,938
|
)
|
(18,418
|
)
|
(21,759
|
)
|
|||||
|
Income from continuing operations
|
17,907
|
|
25,035
|
|
29,707
|
|
|||||
|
Loss from discontinued operations
|
—
|
|
(1,615
|
)
|
(10,260
|
)
|
|||||
|
Loss on disposal, net of taxes
|
—
|
|
(824
|
)
|
—
|
|
|||||
|
Discontinued operations
|
—
|
|
(2,439
|
)
|
(10,260
|
)
|
|||||
|
Net income
|
17,907
|
|
22,596
|
|
19,447
|
|
|||||
|
Plus: Net loss from discontinued operations attributable to noncontrolling interest
|
—
|
|
59
|
|
819
|
|
|||||
|
Net income attributable to Vonage
|
$
|
17,907
|
|
$
|
22,655
|
|
$
|
20,266
|
|
||
|
Net income per common share - continuing operations:
|
|||||||||||
|
Basic
|
$
|
0.08
|
|
$
|
0.12
|
|
$
|
0.14
|
|
||
|
Diluted
|
$
|
0.08
|
|
$
|
0.11
|
|
$
|
0.14
|
|
||
|
Net loss per common share - discontinued operations attributable to Vonage:
|
|||||||||||
|
Basic
|
$
|
—
|
|
$
|
(0.01
|
)
|
$
|
(0.04
|
)
|
||
|
Diluted
|
$
|
—
|
|
$
|
(0.01
|
)
|
$
|
(0.04
|
)
|
||
|
Net income per common share - attributable to Vonage:
|
|||||||||||
|
Basic
|
$
|
0.08
|
|
$
|
0.11
|
|
$
|
0.10
|
|
||
|
Diluted
|
$
|
0.08
|
|
$
|
0.10
|
|
$
|
0.09
|
|
||
|
Weighted-average common shares outstanding:
|
|||||||||||
|
Basic
|
215,751
|
|
213,147
|
|
209,822
|
|
|||||
|
Diluted
|
231,941
|
|
224,110
|
|
219,419
|
|
|||||
The accompanying notes are an integral part of these financial statements
F-5 VONAGE ANNUAL REPORT 2016
|
VONAGE HOLDINGS CORP. CONSOLIDATED STATEMENTS OF COMPREHENSIVE INCOME
|
|
|
For the years ended December 31,
|
||||||||||
|
(In thousands)
|
2016
|
|
2015
|
|
2014
|
|
|||||
|
Net income
|
$
|
17,907
|
|
$
|
22,596
|
|
$
|
19,447
|
|
||
|
Other comprehensive income (loss):
|
|||||||||||
|
Foreign currency translation adjustment
|
(11,937
|
)
|
493
|
|
(3,633
|
)
|
|||||
|
Discontinued operations cumulative translation adjustment
|
—
|
|
974
|
|
—
|
|
|||||
|
Unrealized loss on available-for-sale securities
|
20
|
|
(13
|
)
|
(8
|
)
|
|||||
|
Total other comprehensive (loss) income
|
(11,917
|
)
|
1,454
|
|
(3,641
|
)
|
|||||
|
Comprehensive income
|
5,990
|
|
24,050
|
|
15,806
|
|
|||||
|
Comprehensive income attributable to noncontrolling interest:
|
|||||||||||
|
Comprehensive income
|
—
|
|
59
|
|
819
|
|
|||||
|
Comprehensive loss from discontinued operations
|
—
|
|
—
|
|
(9
|
)
|
|||||
|
Total comprehensive income attributable to noncontrolling interest
|
—
|
|
59
|
|
810
|
|
|||||
|
Comprehensive income attributable to Vonage
|
$
|
5,990
|
|
$
|
24,109
|
|
$
|
16,616
|
|
||
The accompanying notes are an integral part of these financial statements
F-6 VONAGE ANNUAL REPORT 2016
|
|
|
|
For the years ended December 31,
|
||||||||||
|
(In thousands)
|
2016
|
|
2015
|
|
2014
|
|
|||||
|
Cash flows from operating activities:
|
|||||||||||
|
Net income
|
$
|
17,907
|
|
$
|
22,596
|
|
$
|
19,447
|
|
||
|
Adjustments to reconcile net income to net cash provided by operating activities:
|
|||||||||||
|
Depreciation and amortization and impairment charges
|
37,651
|
|
35,620
|
|
34,464
|
|
|||||
|
Amortization of intangibles
|
34,634
|
|
26,404
|
|
16,943
|
|
|||||
|
Deferred tax expense
|
7,302
|
|
13,949
|
|
19,128
|
|
|||||
|
Change in contingent consideration
|
(16,472
|
)
|
—
|
|
—
|
|
|||||
|
Loss on foreign currency
|
—
|
|
1,358
|
|
—
|
|
|||||
|
Allowance for doubtful accounts
|
1,053
|
|
(8
|
)
|
(193
|
)
|
|||||
|
Allowance for obsolete inventory
|
589
|
|
1,882
|
|
757
|
|
|||||
|
Amortization of debt related costs
|
1,080
|
|
997
|
|
1,072
|
|
|||||
|
Share-based expense
|
40,682
|
|
27,541
|
|
21,070
|
|
|||||
|
Noncontrolling interest
|
—
|
|
907
|
|
—
|
|
|||||
|
Changes in operating assets and liabilities, net of acquisitions:
|
|
|
|
||||||||
|
Accounts receivable
|
(9,642
|
)
|
185
|
|
4,887
|
|
|||||
|
Inventory
|
800
|
|
2,815
|
|
36
|
|
|||||
|
Prepaid expenses and other current assets
|
(10,182
|
)
|
(1,904
|
)
|
4,106
|
|
|||||
|
Deferred customer acquisition costs
|
1,357
|
|
421
|
|
230
|
|
|||||
|
Other assets
|
(4,857
|
)
|
(1,660
|
)
|
(5,790
|
)
|
|||||
|
Accounts payable
|
(13,604
|
)
|
(3,830
|
)
|
(8,454
|
)
|
|||||
|
Accrued expenses
|
(354
|
)
|
4,768
|
|
(13,042
|
)
|
|||||
|
Deferred revenue
|
(2,126
|
)
|
(3,682
|
)
|
(1,910
|
)
|
|||||
|
Other liabilities
|
1,194
|
|
1,372
|
|
(209
|
)
|
|||||
|
Net cash provided by operating activities
|
87,012
|
|
129,731
|
|
92,542
|
|
|||||
|
Cash flows from investing activities:
|
|||||||||||
|
Capital expenditures
|
(26,146
|
)
|
(17,323
|
)
|
(12,436
|
)
|
|||||
|
Purchase of intangible assets
|
(50
|
)
|
(2,500
|
)
|
—
|
|
|||||
|
Purchase of marketable securities
|
(5,664
|
)
|
(9,982
|
)
|
(7,170
|
)
|
|||||
|
Maturities and sales of marketable securities
|
14,991
|
|
7,223
|
|
—
|
|
|||||
|
Acquisition and development of software assets
|
(11,538
|
)
|
(14,183
|
)
|
(11,819
|
)
|
|||||
|
Acquisition of business, net of cash acquired
|
(163,093
|
)
|
(116,927
|
)
|
(88,098
|
)
|
|||||
|
Decrease in restricted cash
|
767
|
|
996
|
|
995
|
|
|||||
|
Net cash used in investing activities
|
(190,733
|
)
|
(152,696
|
)
|
(118,528
|
)
|
|||||
|
Cash flows from financing activities:
|
|||||||||||
|
Principal payments on capital lease obligations
|
(8,583
|
)
|
(3,549
|
)
|
(2,889
|
)
|
|||||
|
Principal payments on notes and revolving credit facility
|
(72,812
|
)
|
(47,500
|
)
|
(41,666
|
)
|
|||||
|
Proceeds received from draw down of revolving credit facility and issuance of notes payable
|
181,250
|
|
102,000
|
|
77,000
|
|
|||||
|
Debt related costs
|
(1,316
|
)
|
(2,007
|
)
|
(1,910
|
)
|
|||||
|
Common stock repurchases
|
(32,902
|
)
|
(15,911
|
)
|
(49,338
|
)
|
|||||
|
Proceeds from exercise of stock options
|
8,861
|
|
7,172
|
|
4,564
|
|
|||||
|
Net cash provided by (used in) financing activities
|
74,498
|
|
40,205
|
|
(14,239
|
)
|
|||||
|
Effect of exchange rate changes on cash
|
575
|
|
(311
|
)
|
(3,641
|
)
|
|||||
|
Net change in cash and cash equivalents
|
(28,648
|
)
|
16,929
|
|
(43,866
|
)
|
|||||
|
Cash and cash equivalents, beginning of period
|
57,726
|
|
40,797
|
|
84,663
|
|
|||||
|
Cash and cash equivalents, end of period
|
$
|
29,078
|
|
$
|
57,726
|
|
$
|
40,797
|
|
||
|
Supplemental disclosures of cash flow information:
|
|||||||||||
|
Cash paid during the periods for:
|
|||||||||||
|
Interest
|
$
|
11,621
|
|
$
|
7,834
|
|
$
|
5,252
|
|
||
|
Income taxes
|
$
|
5,335
|
|
$
|
2,516
|
|
$
|
2,491
|
|
||
|
Non-cash financing transactions during the periods for:
|
|||||||||||
|
Common stock repurchases
|
$
|
—
|
|
$
|
—
|
|
$
|
661
|
|
||
|
Issuance of common stock in connection with acquisition of business
|
$
|
31,591
|
|
$
|
5,578
|
|
$
|
22,727
|
|
||
|
Purchase of intangible assets
|
$
|
—
|
|
$
|
5,000
|
|
$
|
—
|
|
||
|
Contingent consideration in connection with acquisition of business
|
$
|
16,472
|
|
$
|
—
|
|
$
|
—
|
|
||
|
Assumption of options in connection with acquisition of business
|
$
|
4,779
|
|
$
|
—
|
|
$
|
—
|
|
||
The accompanying notes are an integral part of these financial statements
F-7 VONAGE ANNUAL REPORT 2016
|
VONAGE HOLDINGS CORP. CONSOLIDATED STATEMENTS OF STOCKHOLDERS’ EQUITY AND REDEEMABLE NONCONTROLLING INTEREST
|
|
(In thousands)
|
Common
Stock
|
|
Additional
Paid-in
Capital
|
|
Accumulated
Deficit
|
|
Treasury
Stock
|
|
Accumulated
Other
Comprehensive
Income
|
|
Non-controlling interest
|
|
Total
|
|
Redeemable non-controlling interest
|
|
Net Income
|
|
||||||||||||||||
|
Balance at December 31, 2013
|
$
|
247
|
|
$
|
1,136,289
|
|
$
|
(697,941
|
)
|
$
|
(101,040
|
)
|
$
|
519
|
|
$
|
—
|
|
$
|
338,074
|
|
$
|
(38
|
)
|
|
|||||||||
|
Stock option exercises
|
10
|
|
4,554
|
|
4,564
|
|
||||||||||||||||||||||||||||
|
Share-based expense
|
21,070
|
|
21,070
|
|
||||||||||||||||||||||||||||||
|
Share-based award activity
|
|
(9,004
|
)
|
(9,004
|
)
|
|||||||||||||||||||||||||||||
|
Common stock repurchases
|
(49,263
|
)
|
(49,263
|
)
|
||||||||||||||||||||||||||||||
|
Acquisition of business
|
7
|
|
22,749
|
|
(468
|
)
|
22,288
|
|
||||||||||||||||||||||||||
|
Foreign currency translation adjustment
|
|
|
(3,642
|
)
|
9
|
|
(3,633
|
)
|
||||||||||||||||||||||||||
|
Unrealized loss on available-for-sale securities
|
(8
|
)
|
(8
|
)
|
|
|
||||||||||||||||||||||||||||
|
Transfer of noncontrolling interest
|
|
|
(706
|
)
|
(706
|
)
|
706
|
|
||||||||||||||||||||||||||
|
Net income
|
|
|
20,266
|
|
|
|
(151
|
)
|
20,115
|
|
(668
|
)
|
19,447
|
|
||||||||||||||||||||
|
Balance at December 31, 2014
|
264
|
|
1,184,662
|
|
(677,675
|
)
|
(159,775
|
)
|
(3,131
|
)
|
(848
|
)
|
343,497
|
|
—
|
|
|
|
||||||||||||||||
|
Stock option exercises
|
5
|
|
7,167
|
|
7,172
|
|
||||||||||||||||||||||||||||
|
Share-based expense
|
27,541
|
|
27,541
|
|
||||||||||||||||||||||||||||||
|
Share-based award activity
|
(4,754
|
)
|
(4,754
|
)
|
||||||||||||||||||||||||||||||
|
Common stock repurchases
|
(15,250
|
)
|
(15,250
|
)
|
||||||||||||||||||||||||||||||
|
Acquisition of business
|
1
|
|
5,577
|
|
|
5,578
|
|
|||||||||||||||||||||||||||
|
Foreign currency translation adjustment
|
1,467
|
|
|
|
1,467
|
|
|
|
||||||||||||||||||||||||||
|
Unrealized loss on available-for-sale securities
|
(13
|
)
|
(13
|
)
|
||||||||||||||||||||||||||||||
|
Net income
|
22,655
|
|
848
|
|
23,503
|
|
|
|
|
|
||||||||||||||||||||||||
|
Balance at December 31, 2015
|
270
|
|
1,224,947
|
|
(655,020
|
)
|
(179,779
|
)
|
(1,677
|
)
|
—
|
|
388,741
|
|
|
|
|
|
||||||||||||||||
|
Stock option exercises
|
5
|
|
8,856
|
|
8,861
|
|
||||||||||||||||||||||||||||
|
Share-based expense
|
40,682
|
|
40,682
|
|
||||||||||||||||||||||||||||||
|
Share-based award activity
|
(6,444
|
)
|
(6,444
|
)
|
||||||||||||||||||||||||||||||
|
Common stock repurchases
|
(32,902
|
)
|
(32,902
|
)
|
||||||||||||||||||||||||||||||
|
Acquisition of business
|
7
|
|
36,362
|
|
36,369
|
|
||||||||||||||||||||||||||||
|
Foreign currency translation adjustment
|
(11,937
|
)
|
(11,937
|
)
|
|
|
||||||||||||||||||||||||||||
|
Unrealized loss on available-for-sale securities
|
20
|
|
20
|
|
||||||||||||||||||||||||||||||
|
Net income
|
17,907
|
|
—
|
|
17,907
|
|
||||||||||||||||||||||||||||
|
Balance at December 31, 2016
|
$
|
282
|
|
$
|
1,310,847
|
|
$
|
(637,113
|
)
|
$
|
(219,125
|
)
|
$
|
(13,594
|
)
|
$
|
—
|
|
$
|
441,297
|
|
|
|
|
|
|||||||||
The accompanying notes are an integral part of these financial statements
F-8 VONAGE ANNUAL REPORT 2016
VONAGE HOLDINGS CORP.
NOTES TO CONSOLIDATED FINANCIAL STATEMENTS
(In thousands, except per share amounts)
Note 1.
Basis of Presentation and Significant Accounting Policies
|
NATURE OF OPERATIONS
|
Vonage Holdings Corp. (“Vonage”, “Company”, “we”, “our”, “us”) is incorporated as a Delaware corporation. We are a leading provider of cloud communications services for businesses. We transform the way people work and businesses operate through a portfolio of cloud-based communications solutions that enable internal collaboration among employees, while also keeping companies closely connected with their customers, across any mode of communication, on any device.
Through our Nexmo subsidiary, we are a global leader in the Communications-Platform-as-a-Service (“CPaaS”) segment of the cloud communications market. We provide innovative communication application program interfaces (“APIs”) for text messaging and voice communications, allowing developers and enterprises to embed contextual communications into mobile apps, websites and business workflows via text, social media, chat apps and voice. Nexmo has a global network of interconnected carriers delivering its API-based communications platform, enabling businesses to communicate with their customers reliably and with ease, no matter where in the world they are located.
We also provide a robust suite of feature-rich residential communication solutions.
Customers in the United States represented
91%
of our consolidated revenues at
December 31, 2016
, with the balance in Canada, the United Kingdom, and other countries. Nexmo Inc. ("Nexmo") has operations in the United States, United Kingdom, Hong Kong, and Singapore, and provides CPaaS solutions to our customers located in many countries around the world.
|
SIGNIFICANT ACCOUNTING POLICIES
|
Principles of Consolidation
The consolidated financial statements include the accounts of Vonage and its wholly-owned subsidiaries. All intercompany balances and transactions have been eliminated in consolidation. We also consolidated a majority-owned entity in Brazil where we had the ability to exercise controlling influence. The ownership interest of the noncontrolling party was presented as noncontrolling interest. On March 31, 2015, the Company completed its previously announced exit from the Brazilian market for consumer telephony services and the associated wind down of its joint venture operations in the country. The results of Brazilian operations are presented as discontinued operations for all periods presented. The results of companies acquired or disposed of are included in the consolidated financial statements from the effective date of the acquisition or up to the date of disposal.
Use of Estimates
Our consolidated financial statements are prepared in conformity with accounting principles generally accepted in the United States, which require management to make estimates and assumptions that affect the amounts reported and disclosed in the consolidated financial statements and the accompanying notes. Actual results could differ materially from these estimates.
On an ongoing basis, we evaluate our estimates, including the following:
|
>
|
the useful lives of property and equipment, software costs, and intangible assets;
|
|
>
|
assumptions used for the purpose of determining share-based compensation using the Black-Scholes option pricing model and Monte Carlo simulation model (“Models”), and various other assumptions that we believe to be reasonable; the key inputs for these Models include our stock price at valuation date, exercise price, the dividend yield, risk-free interest rate, life in years, and historical volatility of our common stock;
|
|
>
|
assumptions used in determining the need for, and amount of, a valuation allowance on net deferred tax assets, and;
|
|
>
|
assumptions used in determining the contingent consideration in connection with the Nexmo acquisition.
|
We base our estimates on historical experience, available market information, appropriate valuation methodologies, and on various other assumptions that we believed to be reasonable, the results of which form the basis for making judgments about the carrying values of assets and liabilities.
Revenue Recognition
Operating revenues consist of services revenues and customer equipment (which enables our services) and shipping revenues. The point in time at which revenues are recognized is determined in accordance with Securities and Exchange Commission Staff Accounting Bulletin No. 104, Revenue Recognition, and Financial Accounting Standards Board (“FASB”) Accounting Standards Codification (“ASC”) 605, Revenue Recognition.
At the time a customer signs up for our services, there are the following deliverables:
|
>
|
Providing equipment, if any, to the customer that enables our telephony services; and
|
|
>
|
Providing services.
|
The equipment is generally provided free of charge to our customers and in most instances there are no fees collected at sign-up. We record the fees collected for shipping the equipment to the customer, if any, as shipping and handling revenue at the time of shipment.
Services Revenue
Substantially all of our revenues are services revenues, which are derived primarily from monthly subscription fees that customers are charged under our service plans. We also derive services revenues from per minute fees for international calls if not covered under a plan, including calls made via applications for mobile devices and other stand-alone products, and for any calling minutes in excess of a customer’s monthly plan limits. Monthly subscription fees are automatically charged to customers’ credit cards, debit cards or electronic check payments ("ECP"), in advance and are recognized over the following month when services are provided. Revenues generated from international calls and from customers exceeding allocated call minutes under limited minute plans are recognized as services are provided, that is, as minutes are used, and are billed to a customer's credit cards, debit cards or ECP in arrears. As a result of multiple billing cycles each month, we estimate the amount of revenues earned from international calls and from customers exceeding allocated call minutes under limited minute plans but not billed from the end of each billing cycle to the end of each reporting period and record these amounts as accounts receivable. These estimates are based primarily upon historical minutes and have been consistent with our actual results.
F-9 VONAGE ANNUAL REPORT 2016
VONAGE HOLDINGS CORP.
NOTES TO CONSOLIDATED FINANCIAL STATEMENTS—(Continued)
(In thousands, except per share amounts)
We also provide rebates to customers who purchase their customer equipment from retailers and satisfy minimum service period requirements. These rebates in excess of activation fees are recorded as a reduction of revenues over the service period based upon the estimated number of customers that will ultimately earn and claim the rebates.
In the United States, we charge regulatory, compliance, E-911, and intellectual property-related fees on a monthly basis to defray costs, and to cover taxes that we are charged by the suppliers of telecommunications services. In addition, we charge customers Federal Universal Service Fund (“USF”) fees. We recognize revenue on a gross basis for USF and related fees. We record these fees as revenue when billed. All other taxes are recorded on a net basis.
Our recently acquired subsidiary, Nexmo, provides CPaaS solutions to our customers. Through Nexmo, we provide innovative communication APIs for text messaging and voice communications, allowing developers and enterprises to embed contextual communications into mobile apps, websites and business workflows via text, social media, chat apps and voice. Nexmo has a global network of interconnected carriers delivering its API-based communications platform, enabling businesses to communicate with their customers reliably and with ease, no matter where in the world they are located.
Nexmo has two types of revenue activities:
Revenue is primarily derived from supplying messaging (SMS and Voice) services to customers. Revenue is recognized in the period when messages are sent by the customer. Revenue is recognized based on the price on the website pricing page or as otherwise agreed with the customer.
Our trading customers operate within the communications industry as service providers or bulk SMS aggregators. With our trading business, we sell to trading specialists who are delivering voice or SMS messages on behalf of their customers. Typically, trade is based on single supply route and margins, which are effectively fixed at a deal level, represent the value of the transaction to us. As such, for the trading business we record revenue on a net basis as service providers deliver messages.
Customer Equipment and Shipping Revenue
Customer equipment and shipping revenues consist of revenues from sales of customer equipment to wholesalers or directly to customers for replacement devices, or for upgrading their device at the time of customer sign-up for which we charge an additional fee. In addition, customer equipment and shipping revenues include revenues from the sale of VoIP telephones in order to access our small and medium business services. Customer equipment and shipping revenues also include the fees that customers are charged for shipping their customer equipment to them. Customer equipment and shipping revenues include sales to our retailers, who subsequently resell this customer equipment to customers. Revenues are reduced for payments to retailers and rebates to customers, who purchased their customer equipment through these retailers, to the extent of customer equipment and shipping revenues.
Cost of Services
Cost of service consists of costs that we pay to third parties in order to provide services. These costs include access and interconnection charges that we pay to other companies to terminate domestic and international phone calls on the public switched telephone network. In addition, these costs include the cost to lease phone numbers, to co-locate in other companies’ facilities, to provide enhanced emergency dialing capabilities to transmit 911 calls, and to provide local number portability. These costs also include taxes that we pay on telecommunications services from our suppliers or are imposed by government agencies such as federal universal service fund (“USF”) contributions and royalties for use of third parties’ intellectual property. In addition, these costs include certain personnel and related costs for
network operations and technical support that are attributable to revenue generating activities.
Cost of Goods Sold
Cost of goods sold consists primarily of costs that we incur when a customer signs up for our service. These costs include the cost of customer equipment for customers who subscribe through the direct sales channel in excess of activation fees. In addition, these costs include the amortization of deferred customer equipment, the cost of shipping and handling for customer equipment, the installation manual that accompanies the customer equipment, and the cost of certain promotions.
Sales and Marketing Expenses
Sales and marketing expenses consist primarily of personnel and related costs for employees and contractors directly associated with our sales and marketing activities, internet advertising fees, radio and billboard advertising, public relations, commissions paid to employees, resellers and other third parties, trade shows, marketing and promotional activities, customer support, credit card fees, collections, and systems and information technology support.
Engineering and Development Expenses
Engineering and development expenses primarily include personnel and related costs for developers responsible for new products, and software engineers maintaining and enhancing existing products. These costs have been reclassified from selling, general and administrative expenses. Research and development costs related to new product development included in engineering and development were
$22,447
,
$18,350
, and
$13,034
for the years ended
December 31, 2016
,
2015
, and
2014
,
respectively.
Costs for research, including predevelopment efforts prior to establishing technological feasibility of software expected to be marketed, are expensed as incurred.
Development costs are capitalized when technological feasibility has been established and anticipated future revenues support the recoverability of the capitalized amounts. Capitalization stops when the product is available for general release to customers. Due to the short time period between achieving technological feasibility and product release and the insignificant amount of costs incurred during such periods, we have not capitalized any software development, and have expensed these costs as incurred.
General and Administrative Expenses
General and administrative expenses primarily relate to our executive, finance, human resources, legal, and information technology organizations. General and administrative expenses primarily consist of personnel costs, stock compensation, board of directors' costs, professional fees for legal, accounting, tax, compliance and information systems, travel, recruiting expense and, rent and related expenses.
Advertising Expenses
Advertising costs are expensed as incurred.
Cash, Cash Equivalents and Marketable Securities
We maintain cash with several investment grade financial institutions. Highly liquid investments, which are readily convertible into cash, with original maturities of
three
months or less, are recorded as cash equivalents.
Management determines the appropriate classification of our investments in debt and marketable equity securities at the time of purchase and reevaluates such designation at each balance sheet date. Our debt and marketable equity securities have been classified and accounted for as available for sale. We may or may not hold securities with stated maturities until maturity. In response to changes in the availability of and the yield on alternative investments as well as liquidity requirements, we may sell these securities prior to their stated
F-10 VONAGE ANNUAL REPORT 2016
VONAGE HOLDINGS CORP.
NOTES TO CONSOLIDATED FINANCIAL STATEMENTS—(Continued)
(In thousands, except per share amounts)
maturities. These securities are carried at fair value, with the unrealized gains and losses reported as a component of other comprehensive income (loss). Any realized gains or losses on the sale of marketable securities are determined on a specific identification method, and such gains and losses are reflected as a component of other income or expense.
Certain Risks and Concentrations
Financial instruments that potentially subject us to concentrations of credit risk consist principally of cash equivalents, marketable securities, and accounts receivable. They are subject to fluctuations in both market value and yield based upon changes in market conditions, including interest rates, liquidity, general economic conditions, and conditions specific to the issuers.
Accounts receivable are typically unsecured and are derived from revenues earned from customers primarily located in the United States. A portion of our accounts receivable represents the timing difference between when a customer’s credit card is billed and the subsequent settlement of that transaction with our credit card processors. This timing difference is generally three days for substantially all of our credit card receivables. We have never experienced any accounts receivable write-offs due to this timing difference. In addition, we collect subscription fees in advance, minimizing our accounts receivable and bad debt exposure. If a customer’s credit card, debit card or ECP is declined, we generally suspend international calling capabilities as well as their ability to incur domestic usage charges in excess of their plan minutes. Generally, if the customer’s credit card, debit card or ECP could not be successfully processed during
three
billing cycles (i.e., the current and two subsequent monthly billing cycles), we terminate the account. In addition, we automatically charge any per minute fees to our customers’ credit card, debit card or ECP monthly in arrears. To further mitigate our bad debt exposure, a customer’s credit card, debit card or ECP will be charged in advance of their monthly billing if their international calling or overage charges exceed a certain dollar threshold.
Inventory
Inventory consists of the cost of customer equipment and is stated at the lower of cost or market, with cost determined using the average cost method. We provide an inventory allowance for customer equipment that has been returned by customers but may not be able to be reissued to new customers or returned to the manufacturer for credit.
Property and Equipment
Property and equipment includes acquired assets and those accounted for under capital leases and consist principally of network equipment and computer hardware, software, furniture, and leasehold improvements. Company-owned equipment in use at customer premises is also included in property and equipment. In addition, the lease of our corporate headquarters has been accounted for as a capital lease and is included in property and equipment. Network equipment and computer hardware and furniture are stated at cost with depreciation provided using the straight-line method over the estimated useful lives of the related assets, which range from
three
to
five
years. Leasehold improvements are amortized over their estimated useful life of the related assets or the life of the lease, whichever is shorter. The cost of renewals and substantial improvements is capitalized while the cost of maintenance and repairs is charged to operating expenses as incurred. Company-owned customer premises equipment is depreciated on a straight-line basis over
three
years.
Our network equipment and computer hardware, which consists of routers, gateways, and servers that enable our telephony services, is subject to technological risks and rapid market changes due to new products and services and changing customer demand. These changes may result in future adjustments to the estimated useful lives or the carrying value of these assets, or both.
Software Costs
We capitalize certain costs, such as purchased software and internally developed software that we use for customer acquisition and customer care automation tools, in accordance with FASB ASC 350-40, “Internal-Use Software”. Computer software is stated at cost less accumulated amortization and the estimated useful life is
two
to
five
years.
Goodwill
Goodwill acquired in the acquisition of a business is accounted for based upon the excess fair value of consideration transferred over the fair value of net assets acquired in the business combination. Goodwill is tested for impairment on an annual basis on October 1st and, when specific circumstances dictate, between annual tests. When impaired, the carrying value of goodwill is written down to fair value. The goodwill impairment test involves evaluating qualitative information to determine if it is more than
50%
likely that the fair value of a reporting unit is less than its carrying value. If such a determination is made, then the traditional two-step goodwill impairment test described below must be applied. The first step, identifying a potential impairment, compares the fair value of a reporting unit with its carrying amount, including goodwill. If the carrying value of the reporting unit exceeds its fair value, the second step would need to be conducted; otherwise, no further steps are necessary as no potential impairment exists. The second step, measuring the impairment loss, compares the implied fair value of the reporting unit goodwill with the carrying amount of that goodwill. Any excess of the reporting unit goodwill carrying value over the respective implied fair value is recognized as an impairment loss. There was no impairment of goodwill for the year ended
December 31, 2016
,
2015
, and
2014
.
Intangible Assets
Intangible assets acquired in the settlement of litigation or by direct purchase are accounted for based upon the fair value of assets received.
Purchased-intangible assets are accounted for based upon the fair value of assets received. Purchased-intangible assets are amortized on a straight-line or accelerated basis over the periods of benefit, ranging from
two
to
ten
years. We perform a review of purchased-intangible assets whenever events or changes in circumstances indicate that the useful life is shorter than we had originally estimated or that the carrying amount of assets may not be recoverable. If such facts and circumstances exist, we assess the recoverability of purchased-intangible assets by comparing the projected undiscounted net cash flows associated with the related asset or group of assets over their remaining lives against their respective carrying amounts. Impairments, if any, are based on the excess of the carrying amount over the fair value of those assets. If the useful life of the asset is shorter than originally estimated, we accelerate the rate of amortization and amortize the remaining carrying value over the new shorter useful life. There was no impairment of purchased-intangible assets identified for the years ended December 31,
2016
,
2015
, and
2014
.
Patents and Patent Licenses
Patent rights acquired in the settlement of litigation or by direct purchase are accounted for based upon the fair value of assets received.
Long-Lived Assets
We evaluate impairment losses on long-lived assets used in operations when events and changes in circumstances indicate that the assets might be impaired. If our review indicates that the carrying value of an asset will not be recoverable, based on a comparison of the carrying value of the asset to the undiscounted future cash flows, the impairment will be measured by comparing the carrying value of the asset to its fair value. Fair value will be determined based on quoted market values, discounted cash flows or appraisals. Impairments of property and equipment are recorded in the statement of income as part of depreciation expense.
F-11 VONAGE ANNUAL REPORT 2016
VONAGE HOLDINGS CORP.
NOTES TO CONSOLIDATED FINANCIAL STATEMENTS—(Continued)
(In thousands, except per share amounts)
Debt Related Costs
Costs incurred in raising debt are deferred and amortized as interest expense using the effective interest method over the life of the debt. A portion of these costs are netted against the underlying notes payable in accordance with ASU 2015-15, "Interest-Imputation of Interest".
Noncontrolling Interest and Redeemable Noncontrolling Interest
We consolidate a majority-owned entity where we have the ability to exercise controlling influence. The ownership interest of the noncontrolling party is presented as noncontrolling interest in the Consolidated Balance Sheet as Stockholders' Equity. If we are required to repurchase the noncontrolling interest at fair value, subject to adjustment, under a put option or other contractual redemption requirement, we will report the noncontrolling interest as redeemable in the Consolidated Balance Sheets between liabilities and equity. We adjust the redeemable noncontrolling interest to the redemption values on each balance sheet date with changes recognized as an adjustment to retained earnings, or in the absence of retained earnings, as an adjustment to additional paid-in capital when it becomes probable the noncontrolling interest will become redeemable.
Restricted Cash and Letters of Credit
We had a cash collateralized letter of credit for
$1,578
and
$2,498
as of
December 31, 2016
and
2015
, respectively, mainly related to lease deposits for our Holmdel office. In the aggregate, cash reserves and collateralized letters of credit of
$1,851
and
$2,587
were recorded as long-term restricted cash at
December 31, 2016
and
2015
, respectively.
Derivatives
We do not hold or issue derivative instruments for trading purposes. However, in accordance with FASB ASC 815, “Derivatives and Hedging” (“FASB ASC 815”), we review our contractual obligations to determine whether there are terms that possess the characteristics of derivative financial instruments that must be accounted for separately from the financial instrument in which they are embedded. We recognize these features as liabilities in our consolidated balance sheet at fair value each period and recognize any change in the fair value in our statement of operations in the period of change. We estimate the fair value of these liabilities using available market information and appropriate valuation methodologies.
Income Taxes
We recognize deferred tax assets and liabilities at enacted income tax rates for the temporary differences between the financial reporting bases and the tax bases of our assets and liabilities. Any effects of changes in income tax rates or tax laws are included in the provision for income taxes in the period of enactment. Our net deferred tax assets primarily consist of net operating loss carry forwards (“NOLs”). We are required to record a valuation allowance against our net deferred tax assets if we conclude that it is more likely than not that taxable income generated in the future will be insufficient to utilize the future income tax benefit from our net deferred tax assets (namely, the NOLs) prior to expiration. We periodically review this conclusion, which requires significant management judgment. If we are able to conclude in a future period that a future income tax benefit from our net deferred tax assets has a greater than
50%
likelihood of being realized, we are required in that period to reduce the related valuation allowance with a corresponding decrease in income tax expense. This would result in a non-cash benefit to our net income in the period of the determination.
We periodically review this conclusion, which requires significant management judgment. In the future, if available evidence changes our conclusion that it is more likely than not that we will utilize our net deferred tax assets prior to their expiration, we will make an adjustment to the related valuation allowance and income tax expense at that time. In subsequent periods, we would expect to recognize income tax expense equal to our pre-tax income multiplied by our effective income tax rate,
an expense that was not recognized prior to the reduction of the valuation allowance.
Our effective rate may differ from the federal statutory rate due, in part, to our foreign operations and certain discrete period items.
We file income tax returns in the U.S. on a federal basis and in U.S. state and foreign jurisdictions. Our federal tax return remains subject to examination by the Internal Revenue Service from 2013 to present, our New Jersey tax returns remain open from 2012 to present, our Canada tax return remains open from 2014 to present, and other domestic and foreign tax returns remain open for all periods to which those filings relate. Our consolidated corporate income tax return for 2013 has been selected for examination by the Internal Revenue Service. Our Canadian corporate income tax returns for 2012 and 2013 have been selected for examination by the Canada Revenue Agency. The Canada Revenue Agency concluded their audit and there were no changes. We recognize the tax benefit from an uncertain tax position only if it is more likely than not that the tax position will be sustained on examination by the taxing authorities, based on the technical merits of the position. The tax benefits recognized in the financial statements from such a position are measured based on the largest benefit that has a greater than
50%
likelihood of being realized upon ultimate resolution.
We have not had any unrecognized tax benefits. We recognize interest and penalties accrued related to unrecognized tax benefits as components of our income tax provision. We have not had any interest and penalties accrued related to unrecognized tax benefits.
Business Combinations
We account for business combinations using the acquisition method of accounting. The acquisition method of accounting requires that the purchase price, including the fair value of contingent consideration, of the acquisition be allocated to the assets acquired and liabilities assumed using the fair values determined by management as of the acquisition date. Goodwill as of the acquisition date is measured as the excess of consideration transferred over the net of the acquisition date fair values of assets acquired and the liabilities assumed. While the Company uses its best estimates and assumptions as part of the purchase price allocation process to accurately value assets acquired and liabilities assumed at the acquisition date, the Company’s estimates are inherently uncertain and subject to refinement. As a result, during the measurement period, which may be up to one year from the acquisition date, the Company records adjustments to the assets acquired and liabilities assumed, with the corresponding offset to goodwill to the extent the Company identifies adjustments to the preliminary purchase price allocation. Upon the conclusion of the measurement period or final determination of the values of assets acquired or liabilities assumed, whichever comes first, any subsequent adjustments are recorded to the consolidated statements of operations. We include the results of all acquisitions in our Consolidated Financial Statements from the date of acquisition.
Acquisition related transaction costs, such as banking, legal, accounting and other costs incurred in connection with an acquisition, are expensed as incurred in general and administrative expense.
Acquisition related integration costs include costs associated with exit or disposal activities, which do not meet the criteria of discontinued operations, including costs for employee, lease, and contract terminations, facility closing or other exit activities. Additionally, these costs include expenses directly related to integrating and reorganizing acquired businesses and include items such as employee retention costs, recruiting costs, certain moving costs, certain duplicative costs during integration and asset impairments. These costs are expensed as incurred in general and administrative expense.
Acquisition related consideration accounted for as compensation expense, such as restricted cash, restricted stock and option related costs incurred in connection with an acquisition are included in general and administrative expense.
F-12 VONAGE ANNUAL REPORT 2016
VONAGE HOLDINGS CORP.
NOTES TO CONSOLIDATED FINANCIAL STATEMENTS—(Continued)
(In thousands, except per share amounts)
Foreign Currency
Generally, the functional currency of our non-United States subsidiaries is the local currency. However, the functional currency of Nexmo's United States's subsidiary is the euro. The financial statements of these subsidiaries are translated to United States dollars using month-end rates of exchange for assets and liabilities, and average rates of exchange for revenues, costs, and expenses. Translation gains and losses are deferred and recorded in accumulated other comprehensive income as a component of stockholders’ equity.
Share-Based Compensation
We account for share-based compensation in accordance with FASB ASC 718, “Compensation-Stock Compensation”. Under the fair value recognition provisions of this pronouncement, share-based compensation cost is measured at the grant date based on the fair value of the award, reduced as appropriate based on estimated forfeitures, and is recognized as expense over the applicable vesting period of the stock award using the accelerated method. The excess tax benefit associated with stock compensation deductions have not been recorded in additional paid-in capital. When evaluating whether an excess tax benefit has been realized, share based compensation deductions are
not considered realized until NOLs are no longer sufficient to offset taxable income. Such excess tax benefits will be recorded when realized.
Earnings per Share
Net income per share has been computed according to FASB ASC 260, “Earnings per Share”, which requires a dual presentation of basic and diluted earnings per share (“EPS”). Basic EPS represents net income divided by the weighted average number of common shares outstanding during a reporting period. Diluted EPS reflects the potential dilution that could occur if securities or other contracts to issue common stock, including stock options and restricted stock units under our 2001 Stock Incentive Plan and 2006 Incentive Plan were exercised or converted into common stock. The dilutive effect of outstanding, stock options and restricted stock units is reflected in diluted earnings per share by application of the treasury stock method. In applying the treasury stock method for stock-based compensation arrangements, the assumed proceeds are computed as the sum of the amount the employee must pay upon exercise and the amounts of average unrecognized compensation cost attributed to future services.
The following table sets forth the computation for basic and diluted net income per share:
|
For the years ended December 31,
|
|||||||||||
|
2016
|
|
2015
|
|
2014
|
|
||||||
|
Numerator
|
|||||||||||
|
Income from continuing operations
|
$
|
17,907
|
|
$
|
25,035
|
|
$
|
29,707
|
|
||
|
Discontinued operations
|
—
|
|
(2,439
|
)
|
(10,260
|
)
|
|||||
|
Plus: Net loss from discontinued operations attributable to noncontrolling interest
|
—
|
|
59
|
|
819
|
|
|||||
|
Loss from discontinued operations attributable to Vonage
|
—
|
|
(2,380
|
)
|
(9,441
|
)
|
|||||
|
Net income attributable to Vonage
|
$
|
17,907
|
|
$
|
22,655
|
|
$
|
20,266
|
|
||
|
Denominator
|
|||||||||||
|
Basic weighted average common shares outstanding
|
215,751
|
|
213,147
|
|
209,822
|
|
|||||
|
Dilutive effect of stock options and restricted stock units
|
16,190
|
|
10,963
|
|
9,597
|
|
|||||
|
Diluted weighted average common shares outstanding
|
231,941
|
|
224,110
|
|
219,419
|
|
|||||
|
Basic net income per share
|
|||||||||||
|
Basic net income per share - from continuing operations
|
$
|
0.08
|
|
$
|
0.12
|
|
$
|
0.14
|
|
||
|
Basic net loss per share - from discontinued operations attributable to Vonage
|
—
|
|
(0.01
|
)
|
(0.04
|
)
|
|||||
|
Basic net income per share - attributable to Vonage
|
$
|
0.08
|
|
$
|
0.11
|
|
$
|
0.10
|
|
||
|
Diluted net income per share
|
|||||||||||
|
Diluted net income per share - from continuing operations
|
$
|
0.08
|
|
$
|
0.11
|
|
$
|
0.14
|
|
||
|
Diluted net loss per share - from discontinued operations attributable to Vonage
|
—
|
|
(0.01
|
)
|
(0.04
|
)
|
|||||
|
Diluted net income per share - attributable to Vonage
|
$
|
0.08
|
|
$
|
0.10
|
|
$
|
0.09
|
|
||
The following shares were excluded from the calculation of diluted income per share because of their anti-dilutive effects:
|
|
For the years ended December 31,
|
|||||||
|
|
2016
|
|
2015
|
|
2014
|
|
||
|
Restricted stock units
|
8,282
|
|
5,827
|
|
5,454
|
|
||
|
Employee stock options
|
9,030
|
|
13,600
|
|
18,428
|
|
||
|
17,312
|
|
19,427
|
|
23,882
|
|
|||
Comprehensive Income
Comprehensive income consists of net income (loss) and other comprehensive items. Other comprehensive items include foreign currency translation adjustments and unrealized gains (losses) on available for sale securities.
Recent Accounting Pronouncements
In January 2017, Financial Accounting Standards Board ("FASB") issued Accounting Standards Update ("ASU") 2017-04. "Intangibles - Goodwill and Other. The ASU simplifies the subsequent measurement of goodwill and eliminates Step 2 from the goodwill
F-13 VONAGE ANNUAL REPORT 2016
VONAGE HOLDINGS CORP.
NOTES TO CONSOLIDATED FINANCIAL STATEMENTS—(Continued)
(In thousands, except per share amounts)
impairment test. This ASU is effective for an annual or any interim goodwill impairment tests in fiscal years beginning after December 15, 2019 on a prospective basis. Early adoption is permitted for interim or annual goodwill impairment tests performed on testing dates after January 1, 2017. We are currently evaluating the impact of adopting ASU 2017-04 on our consolidated financial statements and related disclosures.
In December 2016, FASB issued ASU 2016-20, "Revenue from Contract with Customers - Technical Corrections and Improvements to Topic 606". In May 2016, FASB issued ASU 2016-12, "Revenue from Contract with Customers - Narrow-Scope Improvements and Practical Expedients". In April 2016, FASB issued ASU 2016-10, "Revenue from Contracts with Customers - Identifying Performance Obligations and Licensing". In March 2016, FASB issued ASU 2016-08, "Revenue from Contract with Customers - Principal versus Agent Considerations (Reporting Revenue Gross versus Net)". In August 2015, FASB issued ASU 2015-14, "Deferral of the Effective Date". In May 2014, FASB issued ASU 2014-09, "Revenue from Contracts with Customers". The core principle of these ASUs are that an entity should recognize revenue to depict the transfer of promised goods or services to customers in an amount that reflects the consideration to which the entity expects to be entitled in exchange for those goods or services. The amendments in ASU 2016-12 affect only the narrow aspects of the guidance, such as assessing the collectibility criterion and accounting for contracts that do not meet the criterion, presentation of sales and other similar taxes collected from customers, non-cash consideration, and contract modifications at transition. ASU 2016-10 clarifies two aspects of the guidance: identifying performance obligations and the licensing implementation. The intention of the ASU 2016-08 is to improve the operability and understandability of the implementation guidance on principal versus agent considerations. ASU 2015-14 defers the effective date to annual and interim periods beginning on or after December 15, 2017, and early adoption will be permitted, but not earlier than the original effective date of annual and interim periods beginning on or after December 15, 2016, for public entities. ASU 2014-09 is a comprehensive new revenue recognition model for revenue from contract with customers. We will adopt these ASUs when effective. We are in the initial stages of evaluating the effect of adopting ASU2016-20, ASU 2016-12, ASU 2016-10, ASU 2016-08, ASU 2015-14, and ASU 2014-09 on our consolidated financial statements and related disclosures and continue to evaluate all transition methods.
In November 2016, FASB issued ASU 2016-18, "Statement of Cash Flows". This ASU requires that a statement of cash flows explains the change during the period in the total of cash, cash equivalents, and amounts generally described as restricted cash or restricted cash equivalents. As a result, amounts generally described as restricted cash and restricted cash equivalents should be included with cash and cash equivalents when reconciling the beginning-of-period and end-of-period total amounts shown on the statement of cash flows. This ASU is effective for fiscal years beginning after December 15, 2017, and interim periods within those fiscal years. Early adoption is permitted, including adoption in an interim period, any adjustments should be reflected as of the beginning of the fiscal year that includes that interim period. We will adopt this ASU in the first quarter of 2017. The adoption of ASU 2016-01 will not have a material impact on our consolidated financial statements and related disclosures.
In March 2016, FASB issued ASU 2016-09, "Improvements to Employee Share-Based Payment Accounting". This ASU is issued as part of its Simplification Initiative. The areas for simplification in this ASU involve several aspects of the accounting for share-based payment transactions, including the income tax consequences, recognition of share-based expense, classification of awards as either equity or liabilities, and classification on the statement of cash flows. This ASU is effective for fiscal years beginning after December 15, 2016, including interim periods within those fiscal years. Early adoption is permitted for any entity in any interim or annual period. We will adopt this ASU in the first quarter of 2017. We will elect to account for forfeitures when they occur versus our current practice of estimating the number of awards
that are expected to vest. The election of this new practice will result in a one-time adjustment to our accumulated deficit for the difference of the two practices through the end of 2016. The adoption of ASU 2016-09 will not have a material impact on our consolidated financial statements and related disclosures.
In February 2016, FASB issued ASU 2016-02, "Leases". This ASU increases transparency and comparability among organizations by recognizing lease assets and lease liabilities on the balance sheet and disclosing key information about leasing arrangements. This ASU is effective for fiscal years beginning after December 15, 2018, including interim periods within those fiscal years. Early adoption is permitted for all entities. The adoption of this ASU will increase assets and liabilities for operating leases. We are currently evaluating the impact of adopting ASU 2016-02 on our consolidated financial statements and related disclosures.
In January 2016, FASB issued ASU 2016-01, "Recognition and Measurement of Financial Assets and Financial Liabilities". This ASU provide guidance concerning certain matters involving the recognition, measurement, and disclosure of financial assets and financial liabilities. The guidance does not alter the basic framework for classifying debt instruments held as financial assets. This ASU is effective for fiscal years beginning after December 15, 2017, including interim periods within those fiscal years. Early adoption is not permitted, with some exceptions. The adoption of ASU 2016-01 will not have a material impact on our consolidated financial statements and related disclosures.
In November 2015, FASB issued ASU 2015-17, "Balance Sheet Classification of Deferred Taxes". This ASU simplifies the presentation of deferred income taxes and requires deferred tax liabilities and assets be classified as non-current in a classified statement of financial position. This ASU is effective for fiscal years beginning after December 15, 2016, including interim periods within those fiscal years. Earlier application is permitted for all entities as of the beginning of an interim or annual reporting period. Management has adopted ASU 2015-17 effective for the fourth quarter of 2016. We presented the net deferred tax assets as noncurrent, reclassified any current deferred tax assets in the consolidated balance sheet on a prospective basis, and we did not adjusted the prior periods. If the period ended December 31, 2015 was adjusted, the deferred income taxes would be a non-current deferred tax assets of
$226,572
.
In July 2015, FASB issued ASU 2015-11, "Simplifying the Measurement of Inventory". This ASU applies to inventory that is measured using first-in, first-out ("FIFO") or average cost. Under the updated guidance, an entity should measure inventory that is within scope at the lower of cost and net realizable value, which is the estimated selling prices in the ordinary course of business, less reasonably predicable costs of completion, disposal and transportation. Subsequent measurement is unchanged for inventory that is measured using last-in, first-out ("LIFO") or the retail inventory. This ASU is effective for annual and interim periods beginning after December 15, 2016, and should be applied prospectively with early adoption permitted at the beginning of an interim and annual reporting period. The adoption of ASU 2015-11 is not expected to have a material impact on our consolidated financial statements and related disclosures.
F-14 VONAGE ANNUAL REPORT 2016
VONAGE HOLDINGS CORP.
NOTES TO CONSOLIDATED FINANCIAL STATEMENTS—(Continued)
(In thousands, except per share amounts)
Note 2.
Supplemental Balance Sheet Account Information
Prepaid expenses and other current assets
|
December 31, 2016
|
|
December 31, 2015
|
|
||||
|
Nontrade receivables
|
$
|
3,147
|
|
$
|
2,113
|
|
|
|
Services
|
10,854
|
|
8,066
|
|
|||
|
Telecommunications
|
3,239
|
|
3,138
|
|
|||
|
Insurance
|
935
|
|
939
|
|
|||
|
Marketing
|
1,307
|
|
779
|
|
|||
|
Prepaid hosting
|
8,453
|
|
59
|
|
|||
|
Other prepaids
|
1,253
|
|
565
|
|
|||
|
Prepaid expenses and other current assets
|
$
|
29,188
|
|
$
|
15,659
|
|
|
Property and equipment, net
|
December 31, 2016
|
|
December 31, 2015
|
|
||||
|
Building (under capital lease)
|
$
|
25,709
|
|
$
|
25,709
|
|
|
|
Network equipment and computer hardware
|
93,437
|
|
89,025
|
|
|||
|
Leasehold improvements
|
44,293
|
|
48,872
|
|
|||
|
Customer premise equipment
|
9,700
|
|
7,292
|
|
|||
|
Furniture
|
4,239
|
|
2,508
|
|
|||
|
Vehicles
|
203
|
|
214
|
|
|||
|
|
177,581
|
|
173,620
|
|
|||
|
Less: accumulated depreciation and amortization
|
(129,166
|
)
|
(124,137
|
)
|
|||
|
Property and equipment, net
|
$
|
48,415
|
|
$
|
49,483
|
|
|
Customer premise equipment, net
|
December 31, 2016
|
|
December 31, 2015
|
|
||||
|
Customer premise equipment
|
$
|
9,700
|
|
$
|
7,292
|
|
|
|
Less: accumulated depreciation
|
(4,248
|
)
|
(2,068
|
)
|
|||
|
Customer premise equipment, net
|
$
|
5,452
|
|
$
|
5,224
|
|
|
Software, net
|
December 31, 2016
|
|
December 31, 2015
|
|
||||
|
Purchased
|
$
|
73,509
|
|
$
|
67,248
|
|
|
|
Licensed
|
—
|
|
909
|
|
|||
|
Internally developed
|
36,088
|
|
36,088
|
|
|||
|
|
109,597
|
|
104,245
|
|
|||
|
Less: accumulated amortization
|
(87,626
|
)
|
(83,535
|
)
|
|||
|
Software, net
|
$
|
21,971
|
|
$
|
20,710
|
|
|
The total expected future annual amortization of software is as follows:
|
2017
|
$
|
9,960
|
|
|
2018
|
7,263
|
|
|
|
2019
|
3,897
|
|
|
|
2020
|
851
|
|
|
|
Total
|
$
|
21,971
|
|
Debt related costs, net
F-15 VONAGE ANNUAL REPORT 2016
VONAGE HOLDINGS CORP.
NOTES TO CONSOLIDATED FINANCIAL STATEMENTS—(Continued)
(In thousands, except per share amounts)
|
December 31, 2016
|
|
December 31, 2015
|
|
||||
|
Debt related costs related to Revolving Credit Facility
|
$
|
5,965
|
|
$
|
5,044
|
|
|
|
Less: accumulated amortization
|
(3,632
|
)
|
(2,991
|
)
|
|||
|
Debt related costs, net
|
$
|
2,333
|
|
$
|
2,053
|
|
|
Restricted cash
|
December 31, 2016
|
|
December 31, 2015
|
|
||||
|
Letter of credit-lease deposits
|
$
|
1,578
|
|
$
|
2,498
|
|
|
|
Cash reserves
|
273
|
|
89
|
|
|||
|
Restricted cash
|
$
|
1,851
|
|
$
|
2,587
|
|
|
Other assets
|
December 31, 2016
|
|
December 31, 2015
|
|
||||
|
Deposits
|
$
|
1,329
|
|
$
|
—
|
|
|
|
Tax credits
|
6,623
|
|
6,623
|
|
|||
|
Long-term prepaid hosting
|
5,244
|
|
—
|
|
|||
|
Others
|
1,264
|
|
2,980
|
|
|||
|
Other assets
|
$
|
14,460
|
|
$
|
9,603
|
|
|
Accrued expenses
|
December 31, 2016
|
|
December 31, 2015
|
|
||||
|
Compensation and related taxes and temporary labor
|
$
|
35,308
|
|
$
|
33,196
|
|
|
|
Marketing
|
11,979
|
|
24,891
|
|
|||
|
Taxes and fees
|
18,976
|
|
11,808
|
|
|||
|
Acquisition related consideration accounted for as compensation
|
6,608
|
|
—
|
|
|||
|
Telecommunications
|
14,724
|
|
9,111
|
|
|||
|
Settlement
|
5,000
|
|
—
|
|
|||
|
Other accruals
|
11,383
|
|
11,546
|
|
|||
|
Customer credits
|
2,074
|
|
1,779
|
|
|||
|
Professional fees
|
1,680
|
|
2,080
|
|
|||
|
Accrued interest
|
66
|
|
22
|
|
|||
|
Inventory
|
1,168
|
|
1,514
|
|
|||
|
Credit card fees
|
229
|
|
180
|
|
|||
|
Accrued expenses
|
$
|
109,195
|
|
$
|
96,127
|
|
|
Accumulated other comprehensive (loss) income
|
December 31, 2016
|
|
December 31, 2015
|
|
||||
|
Foreign currency translation adjustment
|
$
|
(13,593
|
)
|
$
|
(1,656
|
)
|
|
|
Unrealized loss on available-for-sale securities
|
(1
|
)
|
(21
|
)
|
|||
|
Accumulated other comprehensive (loss) income
|
$
|
(13,594
|
)
|
$
|
(1,677
|
)
|
|
F-16 VONAGE ANNUAL REPORT 2016
VONAGE HOLDINGS CORP.
NOTES TO CONSOLIDATED FINANCIAL STATEMENTS—(Continued)
(In thousands, except per share amounts)
Note 3.
Goodwill and Intangible Assets
Goodwill
The following table provides a summary of the changes in the carrying amounts of goodwill:
|
Balance at January 1, 2015
|
$
|
142,544
|
|
|
Increase in goodwill related to acquisition of Simple Signal
|
17,687
|
|
|
|
Increase in goodwill related to acquisition of iCore
|
63,294
|
|
|
|
Increase in goodwill related to acquisition of gUnify
|
660
|
|
|
|
Decrease in goodwill related to working capital and tax adjustments of Telesphere
|
(2,079
|
)
|
|
|
Balance at December 31, 2015
|
222,106
|
|
|
|
Increase in goodwill related to acquisition of Simple Signal
|
16
|
|
|
|
Increase in goodwill related to acquisition of iCore
|
2,314
|
|
|
|
Increase in goodwill related acquisition of Nexmo
|
143,073
|
|
|
|
Currency translation adjustments
|
(7,146
|
)
|
|
|
Balance at December 31, 2016
|
$
|
360,363
|
|
Goodwill
During the year ended December 31, 2016, the Company recorded an immaterial correction of an error related to the overstatement of certain deferred tax assets recorded in connection with acquisition accounting that were outside of the measurement period. The Company recognized a
$2,298
decrease in deferred tax assets, net and a
$2,298
increase to goodwill on the consolidated balance sheet as of December 31, 2016. Management
performed an evaluation under Staff Accounting Bulletin No. 108 and concluded the effect of the adjustment is immaterial to the current period’s financial statements. The correction of the error did not have an effect on our consolidated statements of operations or on our consolidated statements of cash flows for the year ended December 31, 2016.
F-17 VONAGE ANNUAL REPORT 2016
VONAGE HOLDINGS CORP.
NOTES TO CONSOLIDATED FINANCIAL STATEMENTS—(Continued)
(In thousands, except per share amounts)
Intangible assets, net
The carrying values of intangible assets were as follows:
|
December 31, 2016
|
|
December 31, 2015
|
|
||||
|
Customer relationships
|
$
|
173,187
|
|
$
|
92,609
|
|
|
|
Developed technology
|
88,609
|
|
75,694
|
|
|||
|
Patents and patent licenses
|
20,214
|
|
20,164
|
|
|||
|
Trademark
|
—
|
|
560
|
|
|||
|
Trade names
|
1,820
|
|
760
|
|
|||
|
Non-compete agreements
|
3,845
|
|
2,933
|
|
|||
|
Gross Carrying Amount
|
287,675
|
|
192,720
|
|
|||
|
Customer relationships
|
(39,413
|
)
|
(21,777
|
)
|
|||
|
Developed technology
|
(31,364
|
)
|
(18,880
|
)
|
|||
|
Patents and patent licenses
|
(14,667
|
)
|
(12,066
|
)
|
|||
|
Trademark
|
—
|
|
(543
|
)
|
|||
|
Trade names
|
(787
|
)
|
(260
|
)
|
|||
|
Non-compete agreements
|
(2,188
|
)
|
(995
|
)
|
|||
|
Accumulated Amortization
|
(88,419
|
)
|
(54,521
|
)
|
|||
|
Customer relationships
|
133,774
|
|
70,832
|
|
|||
|
Developed technology
|
57,245
|
|
56,814
|
|
|||
|
Patents and patent licenses
|
5,547
|
|
8,098
|
|
|||
|
Trademark
|
—
|
|
17
|
|
|||
|
Trade names
|
1,033
|
|
500
|
|
|||
|
Non-compete agreements
|
1,657
|
|
1,938
|
|
|||
|
Net Carrying Amount
|
$
|
199,256
|
|
$
|
138,199
|
|
|
Represents customer relationships, developed technology, trade names and non-compete agreements identified in the acquisition of businesses. In addition, includes patents and trademarks we have purchased and licensed, including in connection with the settlement of litigation.
The intangible assets are being amortized over periods which reflect the pattern in which economic benefits of the assets are expected to be realized. The customer relationships are being
amortized on an accelerated basis over an estimated useful life of
ten
to
twelve
years; developed technology is being amortized on an accelerated basis over an estimated useful life of
eight
years; patents and patent licenses are being amortized over their weighted average remaining lives; trademark is being amortized on a straight-line basis over
eight
years; trade names are being amortized on a straight-line basis over
two
to
three
years; and the non-compete agreements are being amortized on a straight-line basis over
two
to
three
years.
The total expected future annual amortization is as follows:
|
2017
|
$
|
37,255
|
|
|
2018
|
33,988
|
|
|
|
2019
|
30,670
|
|
|
|
2020
|
26,322
|
|
|
|
2021
|
20,623
|
|
|
|
Thereafter
|
50,398
|
|
|
|
Total
|
$
|
199,256
|
|
F-18 VONAGE ANNUAL REPORT 2016
VONAGE HOLDINGS CORP.
NOTES TO CONSOLIDATED FINANCIAL STATEMENTS—(Continued)
(In thousands, except per share amounts)
Note 4.
Supplemental Income Statement Account Information
Amounts included in revenues
|
For the years ended December 31,
|
|||||||||||
|
2016
|
|
2015
|
|
2014
|
|
||||||
|
USF fees
|
$
|
78,077
|
|
$
|
75,570
|
|
$
|
71,188
|
|
||
|
Disconnect fee, net of credits and bad debt
|
$
|
1,927
|
|
$
|
706
|
|
$
|
554
|
|
||
|
Initial activation fees
|
$
|
600
|
|
$
|
779
|
|
$
|
1,085
|
|
||
|
Customer equipment rental
|
$
|
4,980
|
|
$
|
3,677
|
|
$
|
—
|
|
||
|
Customer equipment fees
|
$
|
7,397
|
|
$
|
6,141
|
|
$
|
715
|
|
||
|
Equipment recovery fees
|
$
|
73
|
|
$
|
77
|
|
$
|
80
|
|
||
|
Shipping and handling fees
|
$
|
2,448
|
|
$
|
2,473
|
|
$
|
2,374
|
|
||
|
Access revenues
|
$
|
39,981
|
|
$
|
26,192
|
|
$
|
—
|
|
||
|
Professional service fees
|
$
|
3,251
|
|
$
|
1,308
|
|
$
|
105
|
|
||
Amounts included in cost of services
|
For the years ended December 31,
|
|||||||||||
|
2016
|
|
2015
|
|
2014
|
|
||||||
|
USF costs
|
$
|
78,077
|
|
$
|
75,599
|
|
$
|
71,230
|
|
||
|
Access costs
|
$
|
30,220
|
|
$
|
17,024
|
|
$
|
—
|
|
||
|
Professional service costs
|
$
|
1,525
|
|
$
|
568
|
|
$
|
83
|
|
||
Amounts included in cost of goods sold
|
For the years ended December 31,
|
|||||||||||
|
2016
|
|
2015
|
|
2014
|
|
||||||
|
Shipping and handling cost
|
$
|
5,495
|
|
$
|
5,197
|
|
$
|
6,028
|
|
||
Amounts included in sales and marketing
|
For the years ended December 31,
|
|||||||||||
|
2016
|
|
2015
|
|
2014
|
|
||||||
|
Advertising costs
|
$
|
75,587
|
|
$
|
103,320
|
|
$
|
141,138
|
|
||
Amounts included in general and administrative expense
|
For the years ended December 31,
|
|||||||||||
|
2016
|
|
2015
|
|
2014
|
|
||||||
|
Acquisition related transaction costs
|
$
|
4,863
|
|
$
|
2,585
|
|
$
|
2,466
|
|
||
|
Change in contingent consideration
|
$
|
(11,472
|
)
|
$
|
—
|
|
$
|
—
|
|
||
|
Organizational transformation
|
$
|
2,435
|
|
$
|
—
|
|
$
|
—
|
|
||
|
Loss on sublease
|
$
|
744
|
|
$
|
—
|
|
$
|
—
|
|
||
|
Acquisition related integration costs
|
$
|
—
|
|
$
|
25
|
|
$
|
100
|
|
||
|
Acquisition related consideration accounted for as compensation
|
$
|
16,780
|
|
$
|
—
|
|
$
|
—
|
|
||
F-19 VONAGE ANNUAL REPORT 2016
VONAGE HOLDINGS CORP.
NOTES TO CONSOLIDATED FINANCIAL STATEMENTS—(Continued)
(In thousands, except per share amounts)
Depreciation and amortization expense
|
For the years ended December 31,
|
|||||||||||
|
2016
|
|
2015
|
|
2014
|
|
||||||
|
Network equipment and computer hardware
|
$
|
15,269
|
|
$
|
12,571
|
|
$
|
13,449
|
|
||
|
Software
|
10,387
|
|
12,627
|
|
10,116
|
|
|||||
|
Capital leases
|
2,200
|
|
2,200
|
|
2,200
|
|
|||||
|
Other leasehold improvements
|
5,400
|
|
5,190
|
|
4,434
|
|
|||||
|
Customer premise equipment
|
2,670
|
|
2,147
|
|
75
|
|
|||||
|
Furniture
|
803
|
|
430
|
|
194
|
|
|||||
|
Vehicles
|
72
|
|
71
|
|
31
|
|
|||||
|
Patents
|
2,600
|
|
1,740
|
|
1,833
|
|
|||||
|
Trademarks
|
18
|
|
72
|
|
72
|
|
|||||
|
Customer relationships
|
17,731
|
|
11,594
|
|
8,539
|
|
|||||
|
Acquired technology
|
12,542
|
|
11,768
|
|
6,296
|
|
|||||
|
Trade names
|
541
|
|
148
|
|
100
|
|
|||||
|
Non-compete agreements
|
1,202
|
|
1,082
|
|
101
|
|
|||||
|
71,435
|
|
61,640
|
|
47,440
|
|
||||||
|
Property and equipment impairments
|
521
|
|
193
|
|
1,959
|
|
|||||
|
Software impairments
|
329
|
|
—
|
|
115
|
|
|||||
|
Depreciation and amortization expense
|
$
|
72,285
|
|
$
|
61,833
|
|
$
|
49,514
|
|
||
Amounts included in interest expense
|
For the years ended December 31,
|
|||||||||||
|
2016
|
|
2015
|
|
2014
|
|
||||||
|
Debt related costs amortization
|
$
|
1,080
|
|
$
|
997
|
|
$
|
1,072
|
|
||
Amounts included in other income (expense), net
|
For the years ended December 31,
|
|||||||||||
|
2016
|
|
2015
|
|
2014
|
|
||||||
|
Net (losses) gains resulting from foreign exchange transactions
|
$
|
(346
|
)
|
$
|
(860
|
)
|
$
|
10
|
|
||
F-20 VONAGE ANNUAL REPORT 2016
VONAGE HOLDINGS CORP.
NOTES TO CONSOLIDATED FINANCIAL STATEMENTS—(Continued)
(In thousands, except per share amounts)
Note 5.
Income Taxes
The components of income from continuing operations before income tax expense are as follows:
|
|
For the years ended December 31,
|
||||||||||
|
|
2016
|
|
2015
|
|
2014
|
|
|||||
|
United States
|
$
|
31,076
|
|
$
|
38,115
|
|
$
|
44,044
|
|
||
|
Foreign
|
(231
|
)
|
5,338
|
|
7,422
|
|
|||||
|
$
|
30,845
|
|
$
|
43,453
|
|
$
|
51,466
|
|
|||
The components of the income tax expense are as follows:
|
|
For the years ended December 31,
|
||||||||||
|
|
2016
|
|
2015
|
|
2014
|
|
|||||
|
Current:
|
|||||||||||
|
Federal
|
$
|
(621
|
)
|
$
|
(1,846
|
)
|
$
|
(1,452
|
)
|
||
|
Foreign
|
(1,064
|
)
|
(1,667
|
)
|
(376
|
)
|
|||||
|
State and local taxes
|
(3,951
|
)
|
(956
|
)
|
(803
|
)
|
|||||
|
$
|
(5,636
|
)
|
$
|
(4,469
|
)
|
$
|
(2,631
|
)
|
|||
|
Deferred:
|
|||||||||||
|
Federal
|
$
|
(7,794
|
)
|
$
|
(11,289
|
)
|
$
|
(15,239
|
)
|
||
|
Foreign
|
2
|
|
(1,088
|
)
|
(2,985
|
)
|
|||||
|
State and local taxes
|
490
|
|
(1,572
|
)
|
(904
|
)
|
|||||
|
|
(7,302
|
)
|
(13,949
|
)
|
(19,128
|
)
|
|||||
|
$
|
(12,938
|
)
|
$
|
(18,418
|
)
|
$
|
(21,759
|
)
|
|||
The following table summarizes deferred tax assets resulting from differences between financial accounting basis and tax basis of assets and liabilities.
|
December 31, 2016
|
|
December 31, 2015
|
|
||||
|
Current assets and liabilities:
|
|||||||
|
Deferred revenue
|
$
|
—
|
|
$
|
12,096
|
|
|
|
Accounts receivable and inventory allowances
|
—
|
|
640
|
|
|||
|
Accrued expenses
|
—
|
|
11,249
|
|
|||
|
Deferred tax assets, net, current
|
$
|
—
|
|
$
|
23,985
|
|
|
|
Non-current assets and liabilities:
|
|||||||
|
Accounts receivable and inventory allowances
|
$
|
816
|
|
$
|
—
|
|
|
|
Deferred rent
|
630
|
|
—
|
|
|||
|
Contingent consideration
|
6,238
|
|
—
|
|
|||
|
Acquired intangible assets and property and equipment
|
(61,486
|
)
|
(33,129
|
)
|
|||
|
Accrued expenses
|
10,145
|
|
(1,054
|
)
|
|||
|
Research and development and alternative minimum tax credit
|
8,039
|
|
6,630
|
|
|||
|
Stock option compensation
|
24,026
|
|
20,545
|
|
|||
|
Capital leases
|
(7,762
|
)
|
(6,442
|
)
|
|||
|
Deferred revenue
|
11,362
|
|
(634
|
)
|
|||
|
Net operating loss carryforwards
|
215,504
|
|
237,127
|
|
|||
|
207,512
|
|
223,043
|
|
||||
|
Valuation allowance
|
(18,546
|
)
|
(20,456
|
)
|
|||
|
Deferred tax assets, net, non-current
|
$
|
188,966
|
|
$
|
202,587
|
|
|
We recognize deferred tax assets and liabilities at enacted income tax rates for the temporary differences between the financial reporting bases and the tax bases of our assets and liabilities. Any effects of changes in income tax rates or tax laws are included in the provision for income taxes in the period of enactment. Our net deferred tax assets primarily consist of net operating loss carry forwards (“NOLs”). We are
required to record a valuation allowance against our net deferred tax assets if we conclude that it is more likely than not that taxable income generated in the future will be insufficient to utilize the future income tax benefit from our net deferred tax assets (namely, the NOLs), prior to expiration. We periodically review this conclusion, which requires significant management judgment. Until the fourth quarter of 2011, we
F-21 VONAGE ANNUAL REPORT 2016
VONAGE HOLDINGS CORP.
NOTES TO CONSOLIDATED FINANCIAL STATEMENTS—(Continued)
(In thousands, except per share amounts)
recorded a valuation allowance fully against our net deferred tax assets. In 2011, we completed our first full year of taxable income and completed our budgetary process for periods subsequent to 2011, which anticipates continued taxable income in the future. Based upon these factors and our sustained profitable operating performance over the past
three
years excluding certain losses associated with our prior convertible notes and our December 2010 debt refinancing, our evaluation determined that the benefit resulting from our net deferred tax assets (namely, the NOLs), are likely to be realized prior to their expiration. Accordingly, we released the related valuation allowance against our United States federal and Canada net deferred tax assets, and a portion of the allowance against our state net deferred tax assets as certain NOLs may expire prior to utilization due to shorter utilization periods in certain states, resulting in a one-time non-cash income tax benefit of
$325,601
and a corresponding net deferred tax asset of
$325,601
in the fourth quarter of 2011. We still maintain a full valuation allowance against our United Kingdom net deferred tax assets as we are unable to conclude that it is more likely than not that some or all of the related United Kingdom net deferred tax assets will be realized.
In connection with the acquisition of Nexmo, we recorded a deferred tax liability of
$37,507
related to the
$101,770
of identified intangible assets that will be amortized for financial reporting purposes but not for tax purposes and a deferred tax asset of
$7,686
related to NOLs.
In connection with the acquisition of iCore, we recorded a deferred tax liability of
$12,944
related to the
$38,064
of identified intangible assets that will be amortized for financial reporting purposes but not for tax purposes and a deferred tax asset of
$4,457
related to NOLs.
In connection with the acquisition of Simple Signal, we recorded a deferred tax liability of
$2,441
related to the
$6,407
of identified intangible assets that will be amortized for financial reporting purposes but not for tax purposes and a deferred tax asset of
$3,182
related to NOLs.
In connection with the acquisition of Telesphere, we recorded a deferred tax liability of
$17,050
related to the
$50,925
of identified intangible assets that will be amortized for financial reporting purposes but not for tax purposes and a deferred tax asset of
$17,101
related to NOLs.
In the future, if available evidence changes our conclusion that it is more likely than not that we will utilize our net deferred tax assets prior to their expiration, we will make an adjustment to the related valuation allowance and income tax expense at that time. In subsequent periods, we would expect to recognize income tax expense equal to our pre-tax income multiplied by our effective income tax rate, an expense that was not recognized prior to the reduction of the valuation allowance.
The reconciliation between the United States statutory federal income tax rate and the effective rate is as follows:
|
|
For the years ended December 31,
|
|||||||
|
|
2016
|
|
2015
|
|
2014
|
|
||
|
U.S. Federal statutory tax rate
|
35
|
%
|
35
|
%
|
35
|
%
|
||
|
Permanent items
|
(5
|
)%
|
3
|
%
|
3
|
%
|
||
|
State and local taxes, net of federal benefit
|
7
|
%
|
2
|
%
|
3
|
%
|
||
|
International tax (reflects effect of losses for which tax benefit not realized)
|
—
|
%
|
1
|
%
|
—
|
%
|
||
|
Valuation reserve for income taxes and other
|
5
|
%
|
2
|
%
|
1
|
%
|
||
|
Effective tax rate
|
42
|
%
|
43
|
%
|
42
|
%
|
||
F-22 VONAGE ANNUAL REPORT 2016
VONAGE HOLDINGS CORP.
NOTES TO CONSOLIDATED FINANCIAL STATEMENTS—(Continued)
(In thousands, except per share amounts)
As of
December 31, 2016
, we had NOLs for United States federal and state tax purposes of
$575,476
and
$158,848
, respectively, expiring at various times from years ending
2017
through
2036
as follows:
|
Federal
|
State
|
||||||
|
2017
|
$
|
—
|
|
$
|
22,299
|
|
|
|
2018
|
—
|
|
19,287
|
|
|||
|
2019
|
—
|
|
12,652
|
|
|||
|
2020
|
—
|
|
8,333
|
|
|||
|
2021
|
—
|
|
6,754
|
|
|||
|
2022
|
—
|
|
3,671
|
|
|||
|
2023
|
—
|
|
3,303
|
|
|||
|
2024
|
—
|
|
1,674
|
|
|||
|
2025
|
—
|
|
571
|
|
|||
|
2026
|
124,009
|
|
505
|
|
|||
|
2027
|
235,966
|
|
1,324
|
|
|||
|
2028
|
39,145
|
|
7,100
|
|
|||
|
2029
|
17,482
|
|
2,921
|
|
|||
|
2030
|
107,085
|
|
5,198
|
|
|||
|
2031
|
8,012
|
|
3,379
|
|
|||
|
2032
|
2,808
|
|
2,120
|
|
|||
|
2033
|
3,555
|
|
4,287
|
|
|||
|
2034
|
7,177
|
|
18,147
|
|
|||
|
2035
|
25,185
|
|
23,549
|
|
|||
|
2036
|
5,052
|
|
11,774
|
|
|||
|
Total
|
$
|
575,476
|
|
$
|
158,848
|
|
|
United States federal and state NOLs of
$18,923
represent excess tax benefits from the exercise of share based awards which will be recorded in additional paid-in capital when realized. We had NOLs for United Kingdom tax purposes of
$43,006
with no expiration date.
Under Section 382 of the Internal Revenue Code, if we undergo an “ownership change” (generally defined as a greater than 50% change (by value) in our equity ownership over a three-year period),
our ability to use our pre-change of control NOLs and other pre-change tax attributes against our post-change income may be limited. The Section 382 limitation is applied annually so as to limit the use of our pre-change NOLs to an amount that generally equals the value of our stock immediately before the ownership change multiplied by a designated federal long-term tax-exempt rate. At
December 31, 2016
, there were no limitations on the use of our NOLs except for certain of the NOLs of Vocalocity as of the date of acquisition.
F-23 VONAGE ANNUAL REPORT 2016
VONAGE HOLDINGS CORP.
NOTES TO CONSOLIDATED FINANCIAL STATEMENTS—(Continued)
(In thousands, except per share amounts)
Note 6.
Long-Term Debt and Revolving Credit Facility
A schedule of long-term debt at
December 31, 2016
and
2015
is as follows:
|
December 31, 2016
|
|
December 31, 2015
|
|
||||
|
2.50-3.00% Term note - due 2019, net of debt related costs
|
$
|
—
|
|
$
|
76,392
|
|
|
|
2.50-3.00% Revolving credit facility - due 2019
|
—
|
|
119,000
|
|
|||
|
2.50-3.25% Term note - due 2020, net of debt related costs
|
91,124
|
|
—
|
|
|||
|
2.50-3.25% Revolving credit facility - due 2020
|
209,000
|
|
—
|
|
|||
|
Total Long-term note and revolving credit facility
|
$
|
300,124
|
|
$
|
195,392
|
|
|
At
December 31, 2016
, future payments under long-term debt obligations over each of the next five years and thereafter are as follows:
|
|
2016 Credit Facility
|
|
|
|
2017
|
$
|
18,750
|
|
|
2018
|
18,750
|
|
|
|
2019
|
18,750
|
|
|
|
2020
|
54,688
|
|
|
|
Minimum future payments of principal
|
110,938
|
|
|
|
Less: unamortized debt related costs
|
1,064
|
|
|
|
current portion
|
18,750
|
|
|
|
Long-term portion
|
$
|
91,124
|
|
2016 Financing
On June 3, 2016, we entered into Amendment No. 1 to the Amended and Restated Credit Agreement (the “2016 Credit Facility”) consisting of a
$125,000
term note and a
$325,000
revolving credit facility. The co-borrowers under the 2016 Credit Facility are the Company and Vonage America Inc., the Company’s wholly owned subsidiary. Obligations under the 2016 Credit Facility are guaranteed, fully and unconditionally, by the Company’s other United States material subsidiaries and are secured by substantially all of the assets of each borrower and each guarantor. The lenders under the 2016 Credit Facility are JPMorgan Chase Bank, N.A., Citizens Bank, N.A., Fifth Third Bank, MUFG Union Bank, N.A., Silicon Valley Bank, SunTrust Bank, Keybank National Association, Santander Bank, N.A., Capital One National Association, and First Niagara Bank, N.A. J.P. Morgan Securities LLC and Citizens Bank, N.A. acted as joint lead bookrunners, and J.P. Morgan Securities LLC, Citizens Bank, N.A., Fifth Third Bank, MUFG Union Bank, N.A., Silicon Valley Bank, and SunTrust Robinson Humphrey Inc. acted as joint lead arrangers.
Use of Proceeds
We used
$197,750
of the net available proceeds of the 2016 Credit Facility to retire all of the debt under our 2015 Credit Facility. We used
$179,000
from our 2016 Credit Facility in connection with the acquisition of Nexmo on June 3, 2016. Remaining proceeds from the term note and the undrawn revolving credit facility under the 2016 Credit Facility will be used for general corporate purposes. We also incurred fees of
$1,316
in connection with the 2016 Credit Facility, of which
$395
was allocated to the term note and
$921
was allocated to the revolving credit facility. The unamortized fees of
$2,740
in connection with the 2015 Credit Facility were allocated as follows:
$930
to the term note and
$1,810
to the revolving credit facility. In adopting ASU 2015-03, fees allocated to the term note were reported in the balance sheet as a direct deduction from the face amount of the liability and in adopting ASU 2015-15, fees allocated to the revolving credit facility were reported in the balance sheet as an asset. These fees are amortized to interest expenses over the life of the debt using the effective interest method for the term note and straight line method for the revolving credit facility.
Repayments
In
2016
, we made mandatory repayment of
$14,062
under the term note. In addition, we repaid the
$45,000
outstanding under the revolving credit facility.
2016 Credit Facility Terms
The following description summarizes the material terms of the 2016 Credit Facility:
The loans under the 2016 Credit Facility mature in June 2020. Principal amounts under the 2016 Credit Facility are repayable in quarterly installments of approximately
$4,688
for the term note. The unused portion of our revolving credit facility incurs a
0.45%
commitment fee. Such commitment fee will be reduced to
0.40%
if our consolidated leverage ratio is greater than or equal to
1.50
to 1.00 and less than
2.50
to 1.00,
0.375%
if our consolidated leverage ratio is greater than or equal to
0.75
to 1.00 and less than
1.50
to 1.00, and to
0.35%
if our consolidated leverage ratio is less than
0.75
to 1.00.
Outstanding amounts under the 2016 Credit Facility, at our option, will bear interest at:
|
>
|
LIBOR (applicable to one-, two-, three-, six-, or twelve-month periods) plus an applicable margin equal to
2.50%
if our consolidated leverage ratio is less than
0.75
to 1.00,
2.75%
if our consolidated leverage ratio is greater than or equal to
0.75
to 1.00 and less than
1.50
to 1.00,
3.00%
if our consolidated leverage ratio is greater than or equal to
1.50
to 1.00 and less than
2.5
to 1.00, and
3.25%
if our consolidated leverage ratio is greater than or equal to
2.50
to 1.00, payable on the last day of each relevant interest period or, if the interest period is longer than
three
months, each day that is three months after the first day of the interest period, or
|
|
>
|
the base rate determined by reference to the highest of (a) the prime rate of JPMorgan Chase Bank, N.A., (b) the federal funds effective rate from time to time plus
0.50%
, and (c) the adjusted LIBO rate applicable to one month interest periods plus
1.00%
, plus an applicable margin equal to
1.50%
if our
|
F-24 VONAGE ANNUAL REPORT 2016
VONAGE HOLDINGS CORP.
NOTES TO CONSOLIDATED FINANCIAL STATEMENTS—(Continued)
(In thousands, except per share amounts)
consolidated leverage ratio is less than
0.75
to 1.00,
1.75%
if our consolidated leverage ratio is greater than or equal to
0.75
to 1.00 and less than
1.50
to 1.00,
2.00%
if our consolidated leverage ratio is greater than or equal to
1.50
to 1.00 and less than
2.50
to 1.00, and
2.25%
if our consolidated leverage ratio is greater than or equal to
2.5
to 1.00, payable on the last business day of each March, June, September, and December and the maturity date of the 2016 Credit Facility.
The 2016 Credit Facility provides greater flexibility to us in funding acquisitions and restricted payments, such as stock buybacks, than did the 2015 Credit Facility.
We may prepay the 2016 Credit Facility at our option at any time without premium or penalty. The 2016 Credit Facility is subject to mandatory prepayments in amounts equal to:
|
>
|
100%
of the net cash proceeds from any non-ordinary course sale or other disposition of our property and assets for consideration in excess of a certain amount subject to customary reinvestment provisions and certain other exceptions and
|
|
>
|
100%
of the net cash proceeds received in connection with other non-ordinary course transactions, including insurance proceeds not otherwise applied to the relevant insurance loss.
|
Subject to certain restrictions and exceptions, the 2016 Credit Facility permits us to obtain one or more incremental term notes and/or revolving credit facilities in an aggregate principal amount of up to
$100,000
plus an amount equal to repayments of the term note upon providing documentation reasonably satisfactory to the administrative agent. The 2016 Credit Facility includes customary representations and warranties and affirmative covenants of the borrowers. In addition, the 2016 Credit Facility contains customary negative covenants, including, among other things, restrictions on the ability of us and our subsidiaries to consolidate or merge, create liens, incur additional indebtedness, dispose of assets, consummate acquisitions, make investments, and pay dividends and other distributions. We must also comply with the following financial covenants:
|
>
|
a consolidated leverage ratio of no greater than
3.25
to 1.00 as of the end of the fiscal quarter of Holdings ending June 30, 2016 and for each of the three consecutive fiscal quarters ending immediately thereafter; and a consolidated leverage ratio of no less than
2.75
to 1.00 as of the end of any fiscal quarter of Holdings, commencing with the fiscal quarter ending June 30, 2017, with a limited step-up to
3.25
to 1.00 for a period of four consecutive quarters, in connection with an acquisition;
|
|
>
|
a consolidated fixed coverage charge ratio of no less than
1.75
to 1.00 subject to adjustment to exclude up to
$80,000
in specified restricted payments;
|
|
>
|
minimum cash of
$25,000
including the unused portion of the revolving credit facility; and
|
|
>
|
maximum capital expenditures not to exceed
$55,000
during any fiscal year, provided that the unused amount of any permitted capital expenditures in any fiscal year may be carried forward to the next following fiscal year.
|
In addition, annual excess cash flow increases permitted capital expenditures.
As of
December 31, 2016
, we were in compliance with all covenants, including financial covenants, for the 2016 Credit Facility.
The 2016 Credit Facility contains customary events of default that may permit acceleration of the debt. During the continuance of a payment default, interest will accrue on overdue amounts at a default interest rate of
2%
above the interest rate which would otherwise be
applicable, in the case of loans, and at a rate equal to the rate applicable to base rate loans plus
2%
, in the case of all other amounts.
2015 Financing
On July 27, 2015, we entered into a credit agreement (the “2015 Credit Facility”) consisting of a
$100,000
term note and a
$250,000
revolving credit facility. The co-borrowers under the 2015 Credit Facility were the Company and Vonage America Inc., the Company’s wholly owned subsidiary. Obligations under the 2015 Credit Facility were guaranteed, fully and unconditionally, by the Company’s other United States material subsidiaries and were secured by substantially all of the assets of each borrower and each guarantor. The lenders under the 2015 Credit Facility were JPMorgan Chase Bank, N.A., Citizens Bank, N.A., Fifth Third Bank, MUFG Union Bank, N.A., Silicon Valley Bank, SunTrust Bank, Keybank National Association, Santander Bank, N.A., Capital One National Association, and First Niagara Bank, N.A. JPMorgan Chase Bank, N.A. was a party to the agreement as administrative agent, Citizens Bank, N.A. as syndication agent, and Fifth Third Bank, MUFG Union Bank, N.A., Silicon Valley Bank, SunTrust Bank as documentation agents. J.P. Morgan Securities LLC and Citizens Bank, N.A. acted as joint lead bookrunners, and J.P. Morgan Securities LLC, Citizens Bank, N.A., Fifth Third Bank, MUFG Union Bank, N.A., Silicon Valley Bank, and SunTrust Robinson Humphrey Inc. acted as joint lead arrangers.
Use of Proceeds
We used
$167,000
of the net available proceeds of the 2015 Credit Facility to retire all of the debt under our 2014 Credit Facility. Remaining proceeds from the term note and the undrawn revolving credit facility under the 2015 Credit Facility were to be used for general corporate purposes. We also incurred fees of
$2,007
in connection with the 2015 Credit Facility, of which
$602
was allocated to the term note and
$1,405
was allocated to the revolving credit facility. The unamortized fees of
$1,628
in connection with the 2014 Credit Facility was allocated as follows:
$733
to the term note and
$895
revolving credit facility. In adopting ASU 2015-03, fees allocated to the term note were reported in the balance sheet as a direct deduction from the face amount of the liability and in adopting ASU 2015-15, fees allocated to the revolving credit facility were reported in the balance sheet as as asset. These fees are amortized to interest expenses over the life of the debt using the effective interest method for the term note and straight line method for the revolving credit facility. We used
$82,000
from our 2015 revolving credit facility in connection with the acquisition of iCore on August 31, 2015.
Repayments
We made mandatory repayments of
$3,750
under the term note in 2016 and
$7,500
under the term note in 2015. In addition, we repaid the
$10,000
outstanding under the revolving credit facility in 2016 and
$30,000
outstanding under the revolving credit facility in 2015.
2015 Credit Facility Terms
The following description summarizes the material terms of the 2015 Credit Facility:
The loans under the 2015 Credit Facility were to mature in July 2019. Principal amounts under the 2015 Credit Facility were repayable in quarterly installments of
$3,750
for the term note. The unused portion of our revolving credit facility incurred a
0.40%
commitment fee. Such commitment fee would have been reduced to
0.375%
if our consolidated leverage ratio was greater than or equal to
0.75
to 1.00 and less than
1.50
to 1.00 and to
0.35%
if our consolidated leverage ratio was less than
0.75
to 1.00.
Outstanding amounts under the 2015 Credit Facility, at our option, bore interest at:
|
>
|
LIBOR (applicable to one-, two-, three-, six-, or twelve-month periods) plus an applicable margin equal to
2.50%
if our
|
F-25 VONAGE ANNUAL REPORT 2016
VONAGE HOLDINGS CORP.
NOTES TO CONSOLIDATED FINANCIAL STATEMENTS—(Continued)
(In thousands, except per share amounts)
consolidated leverage ratio is less than
0.75
to 1.00,
2.75%
if our consolidated leverage ratio is greater than or equal to
0.75
to 1.00 and less than
1.50
to 1.00, and
3.00%
if our consolidated leverage ratio is greater than or equal to
1.50
to 1.00, payable on the last day of each relevant interest period or, if the interest period is longer than
three
months, each day that is three months after the first day of the interest period, or
|
>
|
the base rate determined by reference to the highest of (a) the prime rate of JPMorgan Chase Bank, N.A., (b) the federal funds effective rate from time to time plus
0.50%
, and (c) the adjusted LIBO rate applicable to one month interest periods plus
1.00%
, plus an applicable margin equal to
1.50%
if our consolidated leverage ratio is less than
0.75
to 1.00,
1.75%
if our consolidated leverage ratio is greater than or equal to
0.75
to 1.00 and less than
1.50
to 1.00, and
2.00%
if our consolidated leverage ratio is greater than or equal to
1.50
to 1.00, payable on the last business day of each March, June, September, and December and the maturity date of the 2015 Credit Facility.
|
The 2015 Credit Facility provided greater flexibility to us in funding acquisitions and restricted payments, such as stock buybacks, than did the 2014 Credit Facility.
We were able to prepay the 2015 Credit Facility at our option at any time without premium or penalty. The 2015 Credit Facility was subject to mandatory prepayments in amounts equal to:
|
>
|
100%
of the net cash proceeds from any non-ordinary course sale or other disposition of our property and assets for consideration in excess of a certain amount subject to customary reinvestment provisions and certain other exceptions and
|
|
>
|
100%
of the net cash proceeds received in connection with other non-ordinary course transactions, including insurance proceeds not otherwise applied to the relevant insurance loss.
|
Subject to certain restrictions and exceptions, the 2015 Credit Facility permitted us to obtain one or more incremental term loans and/or revolving credit facilities in an aggregate principal amount of up to
$90,000
plus an amount equal to repayments of the term note upon providing documentation reasonably satisfactory to the administrative agent. The 2015 Credit Facility included customary representations and warranties and affirmative covenants of the borrowers. In addition, the 2015 Credit Facility contained customary negative covenants, including, among other things, restrictions on the ability of us and our subsidiaries to consolidate or merge, create liens, incur additional indebtedness, dispose of assets, consummate acquisitions, make investments, and pay dividends and other distributions. We were also required to comply with the following financial covenants:
|
>
|
a consolidated leverage ratio of no greater than
2.25
to 1.00, with a limited step-up to
2.75
to 1.00 for a period of four consecutive quarters, in connection with an acquisition made during the first two years of the 2015 Credit Facility;
|
|
>
|
a consolidated fixed coverage charge ratio of no less than
1.75
to 1.00 subject to adjustment to exclude up to
$80,000
million in specified restricted payments;
|
|
>
|
minimum cash of
$25,000
including the unused portion of the revolving credit facility; and
|
|
>
|
maximum capital expenditures not to exceed
$55,000
during any fiscal year, provided that the unused amount of any permitted capital expenditures in any fiscal year may be carried forward to the next following fiscal year.
|
In addition, annual excess cash flow increases permitted capital expenditures.
The 2015 Credit Facility contained customary events of default that permitted acceleration of the debt. During the continuance of a payment default, interest would have accrued on overdue amounts at a default interest rate of
2%
above the interest rate which would otherwise be applicable, in the case of loans, and at a rate equal to the rate applicable to base rate loans plus
2%
, in the case of all other amounts.
2014 Financing
On August 13, 2014, we entered into a credit agreement (the “2014 Credit Facility”) consisting of a
$100,000
term note and a
$125,000
revolving credit facility. The co-borrowers under the 2014 Credit Facility were us and Vonage America Inc., our wholly owned subsidiary. Obligations under the 2014 Credit Facility are guaranteed, fully and unconditionally, by our other material United States subsidiaries and were secured by substantially all of the assets of each borrower and each guarantor. The lenders under the 2014 Credit Facility were JPMorgan Chase Bank, N.A., Citizens Bank, N.A., Silicon Valley Bank, SunTrust Bank, Fifth Third Bank, Keybank National Association, and MUFG Union Bank, N.A. JPMorgan Chase Bank, N.A. was a party to the agreement as administrative agent, Citizens Bank, N.A. as syndication agent, and Silicon Valley Bank and SunTrust Bank as documentation agents. J.P. Morgan Securities LLC and Citizens Bank, N.A. acted as joint lead bookrunners, and J.P. Morgan Securities LLC, Citizens Bank, N.A., Silicon Valley Bank, and SunTrust Robinson Humphrey Inc. acted as joint lead arrangers.
Use of Proceeds
We used
$90,000
of the net available proceeds of the 2014 Credit Facility to retire all of the debt under our 2013 Credit Facility. Remaining proceeds from the term note and the undrawn revolving credit facility under the 2014 Credit Facility were to be used for general corporate purposes. We also incurred
$1,910
of fees in connection with the 2014 Credit Facility, which were amortized, along with the unamortized fees of
$668
in connection with the 2013 Credit Facility, to interest expense over the life of the debt using the effective interest method. We used
$20,000
and
$67,000
from our 2014 revolving credit facility in connection with the acquisitions of Simple Signal on April 1, 2015 and Telesphere on December 15, 2014, respectively.
2014 Credit Facility Terms
The following description summarizes the material terms of the 2014 Credit Facility:
The loans under the 2014 Credit Facility were to mature in August 2018. Principal amounts under the 2014 Credit Facility were repayable in quarterly installments of
$5,000
per quarter for the term note. The unused portion of our revolving credit facility incurred a
0.40%
commitment fee.
Outstanding amounts under the 2014 Credit Facility, at our option, bore interest at:
|
>
|
LIBOR (applicable to one-, two-, three-, six-, or twelve-month periods) plus an applicable margin equal to
2.875%
if our consolidated leverage ratio is less than
0.75
to 1.00,
3.125%
if our consolidated leverage ratio is greater than or equal to
0.75
to 1.00 and less than
1.50
to 1.00, and
3.375%
if our consolidated leverage ratio is greater than or equal to
1.50
to 1.00, payable on the last day of each relevant interest period or, if the interest period is longer than
three
months, each day that is
three
months after the first day of the interest period, or
|
|
>
|
the base rate determined by reference to the highest of (a) the federal funds effective rate from time to time plus
0.50%
, (b) the prime rate of JPMorgan Chase Bank, N.A., and (c) the adjusted LIBO rate applicable to one month interest periods plus
1.00%
, plus an applicable margin equal to
1.875%
if our consolidated leverage ratio is less than
0.75
to 1.00,
2.125%
if our consolidated leverage ratio is greater than or equal to
|
F-26 VONAGE ANNUAL REPORT 2016
VONAGE HOLDINGS CORP.
NOTES TO CONSOLIDATED FINANCIAL STATEMENTS—(Continued)
(In thousands, except per share amounts)
0.75
to 1.00 and less than
1.50
to 1.00, and
2.375%
if our consolidated leverage ratio is greater than or equal to
1.50
to 1.00, payable on the last business day of each March, June, September, and December and the maturity date of the 2014 Credit Facility.
The 2014 Credit Facility provided greater flexibility to us in funding acquisitions and restricted payments, such as stock buybacks, than the 2013 Credit Facility.
We were able to prepay the 2014 Credit Facility at our option at any time without premium or penalty. The 2014 Credit Facility was subject to mandatory prepayments in amounts equal to:
|
>
|
100%
of the net cash proceeds from any non-ordinary course sale or other disposition of our property and assets for consideration in excess of a certain amount subject to customary reinvestment provisions and certain other exceptions, and
|
|
>
|
100%
of the net cash proceeds received in connection with other non-ordinary course transactions, including insurance proceeds not otherwise applied to the relevant insurance loss.
|
Subject to certain restrictions and exceptions, the 2014 Credit Facility permitted us to obtain one or more incremental term notes and/or revolving credit facilities in an aggregate principal amount of up to
$60,000
plus an amount equal to repayments of the term note upon providing documentation reasonably satisfactory to the administrative agent. The 2014 Credit Facility included customary representations and warranties and affirmative covenants of the borrowers. In addition, the
2014 Credit Facility contained customary negative covenants, including, among other things, restrictions on the ability of us and our subsidiaries to consolidate or merge, create liens, incur additional indebtedness, dispose of assets, consummate acquisitions, make investments, and pay dividends and other distributions. We were also required to comply with the following financial covenants:
|
>
|
a consolidated leverage ratio of no greater than
2.25
to 1.00;
|
|
>
|
a consolidated fixed coverage charge ratio of no less than
1.75
to 1.00 subject to adjustment to exclude up to
$80,000
in specified restricted payments;
|
|
>
|
minimum cash of
$25,000
including the unused portion of the revolving credit facility; and
|
|
>
|
maximum capital expenditures not to exceed
$55,000
during any fiscal year, provided that the unused amount of any permitted capital expenditures in any fiscal year may be carried forward to the next following fiscal year.
|
In addition, annual excess cash flow up to
$8,000
increased permitted capital expenditures.
The 2014 Credit Facility contained customary events of default that may permit acceleration of the debt. During the continuance of a payment default, interest would accrue at a default interest rate of
2%
above the interest rate which would otherwise be applicable, in the case of loans, and at a rate equal to the rate applicable to base rate loans plus
2%
, in the case of all other amounts.
NOTE 7.
Fair Value of Financial Instruments
Effective January 1, 2008, we adopted FASB ASC 820-10-25, “Fair Value Measurements and Disclosures”. This standard establishes a framework for measuring fair value and expands disclosure about fair value measurements. We did not elect fair value accounting for any assets and liabilities allowed by FASB ASC 825, “Financial Instruments”.
FASB ASC 820-10 defines fair value as the amount that would be received for an asset or paid to transfer a liability (i.e., an exit price) in the principal or most advantageous market for the asset or liability in an orderly transaction between market participants on the measurement date. FASB ASC 820-10 also establishes a fair value hierarchy that requires an entity to maximize the use of observable inputs and minimize the use of unobservable inputs when measuring fair value. FASB ASC 820-10 describes the following three levels of inputs that may be used:
|
>
|
Level 1: Quoted prices (unadjusted) in active markets that are accessible at the measurement date for identical assets and
|
liabilities. The fair value hierarchy gives the highest priority to Level 1 inputs.
|
>
|
Level 2: Observable prices that are based on inputs not quoted on active markets but corroborated by market data.
|
|
>
|
Level 3: Unobservable inputs when there is little or no market data available, thereby requiring an entity to develop its own assumptions. The fair value hierarchy gives the lowest priority to Level 3 inputs.
|
Although management believed its valuation methods were appropriate and consistent with other market participants, the use of different methodologies or assumptions to determine the fair value of certain financial instruments could have resulted in a different fair value measurement at the reporting date.
The following table presents the assets that are measured and recognized at fair value on a recurring basis classified under the appropriate level of the fair value hierarchy as of
December 31, 2016
and
December 31, 2015
:
|
December 31, 2016
|
|
December 31, 2015
|
|
||||
|
Level 1 Assets
|
|||||||
|
Money market fund (1)
|
$
|
300
|
|
$
|
57
|
|
|
|
Level 2 Assets
|
|||||||
|
Available-for-sale securities (2)
|
$
|
601
|
|
$
|
9,908
|
|
|
|
Level 3 Liabilities
|
|||||||
|
Contingent consideration (3)
|
$
|
—
|
|
$
|
—
|
|
|
(1) Included in cash and cash equivalents on our consolidated balance sheet.
(2) Included in marketable securities on our consolidated balance sheet.
(3) Included in accrued expenses on our consolidated balance sheet.
The following summarizes the changes in liabilities measured at fair value on a recurring basis using significant unobservable inputs (Level 3):
F-27 VONAGE ANNUAL REPORT 2016
VONAGE HOLDINGS CORP.
NOTES TO CONSOLIDATED FINANCIAL STATEMENTS—(Continued)
(In thousands, except per share amounts)
|
December 31, 2016
|
|
||
|
Beginning balance
|
$
|
—
|
|
|
Initial contingent consideration at fair value
|
16,472
|
|
|
|
Change in fair value included in net income attributable to Vonage
|
(16,472
|
)
|
|
|
Ending balance
|
$
|
—
|
|
Our contingent consideration liability is valued using a discounted cash flow valuation method encompassing significant unobservable inputs. The inputs include estimated revenue scenarios for the applicable performance periods, probability weightings assigned to revenue scenarios and the discount rate applied. Nexmo shareholders may earn a contingent consideration of up to
$20,000
, subject to the achievement of certain performance targets during the
12
month period following the closing of the transaction. The contingent consideration payable to the holders of Nexmo stock is determined based on (i) the achievement of certain revenue targets for the calendar year 2016, and (ii) Nexmo’s revenues received from its top customers following the closing. The contingent consideration may be in the form of cash, a number of shares of Vonage common stock or a combination thereof, at our sole discretion. We estimated using probability weighting that the value of the contingent consideration was
$17,840
at the acquisition date and included that amount in acquisition cost at the net present value amount of
$16,472
. As of September 30, 2016, we have adjusted our probability weighting based upon updated information and have reduced the value of the contingent consideration to
$9,866
with a net present value of
$9,110
. This reduction in the contingent consideration of
$7,362
was recorded in general and administrative expenses. As of December 31, 2016, Nexmo did not achieve performance targets but
the parties have agreed to a
$5,000
settlement that will be paid in the first quarter of 2017. As such we reduced the contingent consideration to
$0
and recorded the reduction of the remaining net present value of
$9,110
in general and administrative expenses. The
$5,000
settlement has also been reflected in accrued expenses within the consolidated balance sheets and in general and administrative expenses in the consolidated statements of income.
Fair Value of Other Financial Instruments
The carrying amounts of our financial instruments, including cash and cash equivalents, accounts receivable, and accounts payable, approximate fair value because of their short maturities. The carrying amounts of our capital leases approximate fair value of these obligations based upon management’s best estimates of interest rates that would be available for similar debt obligations at
December 31, 2016
and
2015
. We believe the fair value of our debt at
December 31, 2016
was approximately the same as its carrying amount as market conditions, including available interest rates, credit spread relative to our credit rating, and illiquidity, remain relatively unchanged from the issuance date of our debt on June 3, 2016 for a similar debt instrument.
Note 8.
Common Stock
Net Operating Loss Rights Agreement
On June 7, 2012, we entered into a Tax Benefits Preservation Plan ("Preservation Plan") designed to preserve stockholder value and tax assets. Our ability to use our tax attributes to offset tax on U.S. taxable income would be substantially limited if there were an "ownership change" as defined under Section 382 of the U.S. Internal Revenue Code. In general, an ownership change would occur if one or more "
5
-percent shareholders," as defined under Section 382, collectively increase their ownership in us by more than
50
percent over a rolling
three
-year period.
In connection with the adoption of the Preservation Plan, our board of directors declared a dividend of
one
preferred share purchase right for each outstanding share of the Company’s common stock. The preferred share purchase rights were distributed to stockholders of record as of June 18, 2012, as well as to holders of the Company's common stock issued after that date, but will only be activated if certain triggering events under the Preservation Plan occur.
Under the Preservation Plan, preferred share purchase rights will work to impose significant dilution upon any person or group which acquires beneficial ownership of
4.9%
or more of the outstanding common stock, without the approval of our board of directors, from and after June 7, 2012. Stockholders that own
4.9%
or more of the outstanding common stock as of the opening of business on June 7, 2012, will not trigger the preferred share purchase rights so long as they do not (i) acquire additional shares of common stock or (ii) fall under
4.9%
ownership of common stock and then re-acquire shares that in the aggregate equal
4.9%
or more of the common stock.
The Preservation Plan was set to expire no later than the close of business June 7, 2013, unless extended by our board of directors. On June 6, 2013, at the Vonage 2013 annual meeting of stockholders, stockholders ratified the extension of the Preservation
Plan through June 7, 2015. On April 2, 2015, after consultation with our advisors, our board of directors determined to extend the Preservation Plan through June 30, 2017, subject to ratification of the extension by stockholders at our 2015 annual meeting of stockholders. On June 3, 2015, at the Vonage 2015 annual meeting of stockholders, stockholders ratified the extension of the Preservation Plan through June 30, 2018.
Common Stock Repurchases
On July 25, 2012, our board of directors authorized a program to repurchase up to
$50,000
of Vonage common stock (the "$50,000 repurchase program") through December 31, 2013. On February 7, 2013, our board of directors discontinued the remainder of our existing
$50,000
repurchase program effective at the close of business on February 12, 2013 with
$16,682
of availability remaining, and authorized a new program to repurchase up to
$100,000
of Vonage common stock (the "2012 $100,000 repurchase program) by December 31, 2014. As of December 31, 2014, approximately
$219
remained of our 2012
$100,000
repurchase program. The repurchase program expired on December 31, 2014.
On December 9, 2014, Vonage's Board of Directors authorized a new program for the Company to repurchase up to
$100,000
of its outstanding common stock (the "2014 $100,000 repurchase program"). Repurchases under the 2014
$100,000
repurchase program program are expected to be made over a
four
-year period ending on December 31, 2018.
Under the 2014
$100,000
repurchase program, the timing and amount of repurchases will be determined by management based on its evaluation of market conditions, the trading price of the stock and will vary based on available capital resources and other financial and operational performance, market conditions, securities law limitations, and other factors. Repurchases may be made in the open market or through private transactions from time to time. The repurchases will be
F-28 VONAGE ANNUAL REPORT 2016
made using available cash balances. In any period, under each repurchase program, cash used in financing activities related to common stock repurchases may differ from the comparable change in stockholders' equity, reflecting timing differences between the
recognition of share repurchase transactions and their settlement for cash.
We repurchased the following shares of common stock with cash resources under the 2014
$100,000
repurchase program as of
December 31, 2016
and
2015
:
|
December 31, 2016
|
|
December 31, 2015
|
|
||||
|
Shares of common stock repurchased
|
7,400
|
|
3,320
|
|
|||
|
Value of common stock repurchased
|
$
|
32,762
|
|
$
|
15,195
|
|
|
As of
December 31, 2016
,
$52,043
remained of our 2014
$100,000
repurchase program. The repurchase program expires on December 31, 2018 but may be suspended or discontinued at any time without notice.
In any period under the 2014
$100,000
repurchase program, cash used in financing activities related to common stock repurchases
may differ from the comparable change in stockholders' equity, reflecting timing differences between the recognition of share repurchase transactions and their settlement for cash.
Note 9.
Employee Benefit Plans
Share-Based Compensation
Our stock option program is a long-term retention program that is intended to attract, retain and provide incentives for talented employees, officers and directors, and to align stockholder and employee interests. Currently, we grant options from our 2015 Equity Incentive Plan. Our 2006 Stock Incentive Plan was terminated by our board of directors in 2015 and our 2001 Stock Incentive Plan was terminated by our board of directors in 2008. As such, share-based awards are no longer granted under either the 2006 and the 2001 Stock
Incentive Plans. Under the 2015 Equity Incentive Plan, share-based awards can be granted to all employees, including executive officers, outside consultants, and non-employee directors. Vesting periods for share-based awards are generally
three
or
four
years for both plans. Awards granted under each plan expire in
five
or
ten
years from the effective date of grant. As of April 2010, the Company began routinely granting awards with a
ten
year expiration period.
The fair value for these options was estimated at the date of grant using a Black-Scholes option-pricing model. The assumptions used to value options are as follows:
|
2016
|
|
2015
|
|
2014
|
|
|||
|
Risk-free interest rate
|
1.17-2.12%
|
|
1.38-1.80%
|
|
1.78-2.19%
|
|
||
|
Expected stock price volatility
|
47.52-72.50%
|
|
73.55-83.14%
|
|
85.28-86.93%
|
|
||
|
Dividend yield
|
0.00
|
%
|
0.00
|
%
|
0.00
|
%
|
||
|
Expected life (in years)
|
6.25
|
|
6.25
|
|
6.25
|
|
||
Beginning January 1, 2006, we estimated the volatility of our stock using historical volatility of comparable public companies in accordance with guidance in FASB ASC 718,
“Compensation-Stock Compensation
”. Beginning in the first quarter of 2008, we used the historical volatility of our common stock to measure expected volatility for future option grants.
The risk-free interest rate assumption is based upon observed interest rates appropriate for the term of our employee stock
options. The expected term of employee stock options represents the weighted-average period that the stock options are expected to remain outstanding, which we derive based on our historical settlement experience.
Beginning in 2014, we issued restricted performance stock units with vesting that is contingent on both total shareholder return ("TSR") compared to members of our peer group and continued service.
For the market-based restricted performance stock units issued during the year ended
December 31, 2016
and
December 31, 2015
, the payouts at vesting which are linearly interpolated between the percentiles specified below are as follows:
|
Payout Schedule
|
|||
|
Percentile Ranking
|
% of Target Earned
|
||
|
80%
|
200%
|
||
|
50%
|
100%
|
||
|
30%
|
50%
|
||
|
<
|
30%
|
—%
|
|
Notwithstanding the foregoing, if our TSR is negative for the performance period, then the vesting percentage shall not exceed
100%
. In addition, we reduce the shares available for grant to cover the potential payout of
200%
.
To value these market-based restricted performance stock units, we used a Monte Carlo simulation model on the date of grant.
Compensation expense for restricted stock units with performance and market conditions is recognized over the requisite service period using the straight-line method and includes the impact of estimated forfeitures.
F-29 VONAGE ANNUAL REPORT 2016
VONAGE HOLDINGS CORP.
NOTES TO CONSOLIDATED FINANCIAL STATEMENTS—(Continued)
(In thousands, except per share amounts)
The assumptions used to value these market based restricted performance stock units are as follows:
|
2016
|
|
2015
|
|
2014
|
|
|||
|
Risk-free interest rate
|
1.12
|
%
|
0.98
|
%
|
0.69
|
%
|
||
|
Expected stock price volatility
|
42.61
|
%
|
40.21
|
%
|
48.91
|
%
|
||
|
Dividend yield
|
0.00
|
%
|
0.00
|
%
|
0.00
|
%
|
||
|
Expected life (in years)
|
2.79
|
|
2.79
|
|
2.79
|
|
||
Our stock incentive plans as of
December 31, 2016
are summarized as follows (in thousands):
|
Shares
Authorized
|
|
Shares
Available
for Grant
|
|
Stock
Options
Outstanding
|
|
Restricted
Stock and
Restricted
Stock
Units
|
|
||||
|
Options assumed from acquisition
|
—
|
|
1,750
|
|
1,750
|
|
—
|
|
|||
|
2006 Incentive Plan
|
71,669
|
|
—
|
|
15,685
|
|
5,943
|
|
|||
|
2015 Incentive Plan
|
23,919
|
|
13,841
|
|
145
|
|
6,873
|
|
|||
|
Total as of December 31, 2016
|
95,588
|
|
15,591
|
|
17,580
|
|
12,816
|
|
|||
2006 Incentive Plan
In May 2006, we adopted the 2006 Incentive Plan. The 2006 Incentive Plan permits the grant of stock options, restricted stock, restricted stock units, stock appreciation rights, performance stock, performance units, annual awards, and other awards based on, or related to, shares of our common stock. Options awarded under our 2006 Incentive Plan may be non-qualified stock options or may qualify as incentive stock options under Section 422 of the Internal Revenue Code of 1986, as amended. Our 2006 Incentive Plan contains various limits with respect to the types of awards, as follows:
|
•
|
a maximum of
20,000
shares may be issued under the plan pursuant to incentive stock options;
|
|
•
|
a maximum of
10,000
shares may be issued pursuant to options and stock appreciation rights granted to any participant in a calendar year;
|
|
•
|
a maximum of
$5,000
may be paid pursuant to annual awards granted to any participant in a calendar year; and
|
|
•
|
a maximum of
$10,000
may be paid (in the case of awards denominated in cash) and a maximum of
10,000
shares may be issued (in the case of awards denominated in shares) pursuant to awards, other than options, stock appreciation rights or annual awards, granted to any participant in a calendar year.
|
The 2006 Incentive Plan was terminated upon the adoption of our 2015 Equity Incentive Plan. No additional awards may be made pursuant to the 2006 Incentive Plan.
2015 Equity Incentive Plan
On June 3, 2015, we adopted our 2015 Equity Incentive Plan. Shares issued under the plan may be authorized and unissued shares or may be issued shares that we have reacquired. Shares covered by awards that are forfeited, canceled or otherwise expire without having been exercised or settled, or that are settled by cash or other non-share consideration, will become available for issuance pursuant to a new award. Shares that are tendered or withheld to pay the exercise price of an award or to satisfy tax withholding obligations will not be available for issuance pursuant to new awards. At
December 31, 2016
,
13,841
shares were available for future grant under the 2015 Equity Incentive Plan.
The 2015 Equity Incentive Plan permits the grant of stock options, restricted stock, restricted stock units, stock appreciation rights, performance stock, performance units, annual awards, and other awards based on, or related to, shares of our common stock. Options awarded under our 2015 Equity Incentive Plan may be non-qualified stock options or may qualify as incentive stock options under Section 422 of the Internal Revenue Code of 1986, as amended. For purposes of complying with the requirements of Section 162(m) of the Internal Revenue Code of 1986, as amended, the maximum number of shares of common stock that may be subject to stock options, stock appreciation rights, performance-based restricted stock awards, performance-based RSUs and performance-based stock awards granted to any participant other than a non-employee director during any calendar year will be limited to 10,000 shares of common stock for each such award type individually. The maximum number of shares of common stock that may be subject to stock options, stock appreciation rights, restricted stock awards, RSUs and stock awards granted to any non-employee director during any calendar year will be limited to 10,000 shares of common stock for all such award types in the aggregate. Further, the maximum amount that may become payable to any one Participant during any one calendar year under all Cash Performance Awards intended to qualify as “performance-based compensation” under Section 162(m) of the Code is limited to $5,000.
Our 2015 Equity Incentive Plan will terminate on June 3, 2025.
F-30 VONAGE ANNUAL REPORT 2016
VONAGE HOLDINGS CORP.
NOTES TO CONSOLIDATED FINANCIAL STATEMENTS—(Continued)
(In thousands, except per share amounts)
The following table summarizes the activity for all awards under both of our stock incentive plans:
|
|
Stock Options Outstanding
|
Restricted Stock and
Restricted Stock Units
Outstanding
|
|||||||||||
|
|
Number of
Shares
|
|
Weighted
Average
Exercise
Price Per
Share
|
|
Number of
Shares
|
|
Weighted
Average
Grant
Date Fair
Market
Value
Per
Share
|
|
|||||
|
|
(in thousands)
|
|
(in thousands)
|
|
|||||||||
|
Balance at December 31, 2013
|
32,837
|
|
$
|
2.73
|
|
5,182
|
|
$
|
2.92
|
|
|||
|
Stock options granted
|
6,865
|
|
3.47
|
|
|
|
|||||||
|
Stock options exercised
|
(10,504
|
)
|
1.65
|
|
|
|
|||||||
|
Stock options canceled
|
(3,547
|
)
|
3.19
|
|
|
|
|||||||
|
Restricted stocks and restricted stock units granted
|
|
|
5,240
|
|
4.71
|
|
|||||||
|
Restricted stocks and restricted stock units exercised
|
|
|
(1,734
|
)
|
2.83
|
|
|||||||
|
Restricted stocks and restricted stock units canceled
|
|
|
(860
|
)
|
3.32
|
|
|||||||
|
Balance at December 31, 2014
|
25,651
|
|
3.31
|
|
7,828
|
|
4.09
|
|
|||||
|
Stock options granted
|
505
|
|
4.41
|
|
|
|
|||||||
|
Stock options exercised
|
(3,495
|
)
|
2.82
|
|
|
|
|||||||
|
Stock options canceled
|
(2,658
|
)
|
4.41
|
|
|
|
|||||||
|
Restricted stocks and restricted stock units granted
|
|
|
6,354
|
|
5.37
|
|
|||||||
|
Restricted stocks and restricted stock units exercised
|
|
|
(2,436
|
)
|
3.63
|
|
|||||||
|
Restricted stocks and restricted stock units canceled
|
|
|
(1,359
|
)
|
4.67
|
|
|||||||
|
Balance at December 31, 2015
|
20,003
|
|
3.28
|
|
10,387
|
|
4.91
|
|
|||||
|
Stock options granted
|
79
|
|
5.91
|
|
|
|
|||||||
|
Stock options assumed from acquisition
|
2,188
|
|
1.03
|
|
|||||||||
|
Stock options exercised
|
(3,614
|
)
|
2.61
|
|
|
|
|||||||
|
Stock options canceled
|
(1,076
|
)
|
8.62
|
|
|
|
|||||||
|
Restricted stocks and restricted stock units granted
|
|
|
7,024
|
|
4.93
|
|
|||||||
|
Restricted stocks and restricted stock units exercised
|
|
|
(3,030
|
)
|
4.04
|
|
|||||||
|
Restricted stocks and restricted stock units canceled
|
|
|
(1,565
|
)
|
5.11
|
|
|||||||
|
Balance at December 31, 2016-stock options
|
17,580
|
|
$
|
2.82
|
|
||||||||
|
Balance at December 31, 2016-Restricted stock and restricted stock units
|
12,816
|
|
$
|
5.15
|
|
||||||||
|
Exercisable at December 31, 2016
|
11,633
|
|
$
|
2.76
|
|
|
|
||||||
|
Unvested shares at December 31, 2015
|
8,931
|
|
$
|
3.23
|
|
|
|
||||||
|
Unvested shares at December 31, 2016
|
5,947
|
|
$
|
2.94
|
|
|
|
||||||
The weighted average exercise price of options granted was
$5.91
,
$4.41
, and
$3.47
for the years ended
December 31, 2016
,
2015
, and
2014
, respectively. The weighted average grant date fair market value of restricted stock and restricted stock units granted was
$4.93
,
$5.37
, and
$4.71
during the year ended
December 31, 2016
,
2015
, and
2014
, respectively.
The aggregate intrinsic value of exercised stock options for the years ended
December 31, 2016
,
2015
, and
2014
was
$12,142
,
$8,040
, and
$22,962
, respectively. The aggregate intrinsic value of exercised restricted stock and restricted stock units for the years ended
December 31, 2016
,
2015
, and
2014
was
$12,248
,
$8,844
, and
$4,909
, respectively.
The weighted average grant date fair market value of stock options granted was
$3.01
,
$3.09
, and
$2.55
for the years ended
December 31, 2016
,
2015
, and
2014
.
Total share-based compensation expense recognized for the years ended
December 31, 2016
,
2015
, and
2014
was
$40,682
,
$27,541
, and
$21,070
, respectively, which were recorded to selling, general and administrative expense in the consolidated statement of income. As of
December 31, 2016
, total unamortized share-based compensation was
$32,020
, accounting for forfeitures when they occur, which is expected to be amortized over the remaining vesting period of each grant, up to the next
48
months. Compensation costs for all share-based awards are recognized using the ratable single-option approach on an accrual basis and are amortized using an accelerated amortization schedule. Our current policy is to issue new shares to settle the exercise of stock options and prospectively, the vesting of restricted stock units.
F-31 VONAGE ANNUAL REPORT 2016
VONAGE HOLDINGS CORP.
NOTES TO CONSOLIDATED FINANCIAL STATEMENTS—(Continued)
(In thousands, except per share amounts)
Information regarding the options outstanding as of
December 31, 2016
is summarized below:
|
|
Stock Options Outstanding
|
Stock Options Exercisable
|
|||||||||||||||||||||
|
Range of
Exercise Prices
|
Stock
Options
Outstanding
|
|
Weighted
Average
Remaining
Contractual
Life
|
Weighted
Average
Exercise
Price
|
|
Aggregate
Intrinsic
Value
|
|
Stock
Options
Vested and
Exercisable
|
|
Weighted
Average
Remaining
Contractual
Life
|
Weighted
Average
Exercise
Price
|
|
Aggregate
Intrinsic
Value
|
|
|||||||||
|
|
(in thousands)
|
(in years)
|
|
(in thousands)
|
(in thousands)
|
(in years)
|
|
(in thousands)
|
|||||||||||||||
|
$0.33 to $1.43
|
4,036
|
|
|
1.23
|
|
|
2,866
|
|
|
1.28
|
|
|
|||||||||||
|
$1.44 to $1.99
|
51
|
|
|
1.71
|
|
|
51
|
|
|
1.71
|
|
|
|||||||||||
|
$2.00 to $4.00
|
11,988
|
|
|
3.12
|
|
|
7,441
|
|
|
3.01
|
|
|
|||||||||||
|
$4.01 to $7.34
|
1,505
|
|
|
4.77
|
|
|
1,275
|
|
|
4.66
|
|
|
|||||||||||
|
$7.35 to $35.00
|
—
|
|
|
—
|
|
|
—
|
|
|
—
|
|
|
|||||||||||
|
17,580
|
|
5.9
|
2.82
|
|
$
|
70,829
|
|
11,633
|
|
5.1
|
2.76
|
|
$
|
47,602
|
|
||||||||
The aggregate intrinsic value of restricted stock units outstanding was
$87,789
as of
December 31, 2016
.
Retirement Plan
In March 2001, we established a 401(k) Retirement Plan (the “Retirement Plan”) available to employees who meet the plan’s eligibility requirements. Participants may elect to contribute a percentage of their
compensation to the Retirement Plan up to a statutory limit. We may make a contribution to the Retirement Plan in the form of a matching contribution. The employer matching contribution is
50%
of each employee’s contributions not to exceed
$6
in
2014
,
2015
, and
2016
. Our expense related to the Retirement Plan was
$5,015
,
$3,676
, and
$2,959
in
2016
,
2015
, and
2014
, respectively.
Note 10.
Commitments and Contingencies
Capital Leases
Assets financed under capital lease agreements are included in property and equipment in the consolidated balance sheet and related depreciation and amortization expense is included in the consolidated statements of operations.
On March 24, 2005, we entered into a lease for our headquarters in Holmdel, New Jersey. We took possession of a portion of the office space at the inception of the lease, another portion on August 1, 2005 and took over the remainder of the office space in early 2006. The overall lease term is twelve years and five months. In connection with the lease, we issued a letter of credit which requires
$7,350
of cash as collateral, which is classified as restricted cash. Part of the cash was released, leaving a balance of
$1,578
at
December 31, 2016
. The gross amount of the building recorded under capital leases totaled
$25,709
as of
December 31, 2016
and accumulated depreciation was approximately
$24,243
as of
December 31, 2016
.
In November 2015, we entered into the fourth amendment to our headquarters lease effective December 1, 2015. The amendment extend the term of the lease for a period of seventy-four months to commence September 1, 2017 and continue through October 31, 2023. Based on the terms of the lease, it is considered an operating lease when it becomes effective on September 1, 2017.
Operating Leases
We have entered into various non-cancelable operating lease agreements for certain of our existing office and telecommunications co-location space in the United States and for international subsidiaries with original lease periods expiring between 2017 and 2026. We are committed to pay a portion of the buildings’ operating expenses as determined under the agreements.
F-32 VONAGE ANNUAL REPORT 2016
VONAGE HOLDINGS CORP.
NOTES TO CONSOLIDATED FINANCIAL STATEMENTS—(Continued)
(In thousands, except per share amounts)
At
December 31, 2016
, future payments under capital leases and minimum payments under non-cancelable operating leases are as follows over each of the next five years and thereafter:
|
|
December 31, 2016
|
||||||||||||||
|
|
Capital
Leases
|
|
Operating
Leases
|
|
Committed Sub-lease Income
|
|
Net Operating Leases
|
|
|||||||
|
2017
|
$
|
3,428
|
|
$
|
10,173
|
|
$
|
(204
|
)
|
$
|
9,969
|
|
|||
|
2018
|
140
|
|
11,923
|
|
(613
|
)
|
$
|
11,310
|
|
||||||
|
2019
|
—
|
|
10,704
|
|
(613
|
)
|
$
|
10,091
|
|
||||||
|
2020
|
—
|
|
8,342
|
|
(613
|
)
|
$
|
7,729
|
|
||||||
|
2021
|
—
|
|
5,816
|
|
(613
|
)
|
$
|
5,203
|
|
||||||
|
Thereafter
|
—
|
|
12,625
|
|
(1,022
|
)
|
$
|
11,603
|
|
||||||
|
Total minimum payments required
|
3,568
|
|
$
|
59,583
|
|
$
|
(3,678
|
)
|
$
|
55,905
|
|
||||
|
Less amounts representing interest
|
(140
|
)
|
|
||||||||||||
|
Minimum future payments of principal
|
3,428
|
|
|
||||||||||||
|
Current portion
|
3,288
|
|
|
||||||||||||
|
Long-term portion
|
$
|
140
|
|
||||||||||||
Rent expense was
$7,495
for
2016
,
$6,378
for
2015
, and
$7,007
for
2014
.
Stand-by Letters of Credit
We have stand-by letters of credit totaling
$1,578
and
$2,498
, as of
December 31, 2016
and
2015
, respectively.
End-User Commitments
We are obligated to provide telephone services to our registered end-users. The costs related to the potential utilization of minutes sold are expensed as incurred. Our obligation to provide this service is dependent on the proper functioning of systems controlled by third-party service providers. We do not have a contractual service relationship with some of these providers.
Vendor Commitments
We have several commitments primarily commitments to vendors who
will provide local inbound services, provide customer care services, provide efax service, provide carrier operation, provide data center with technical supports, provide networks and telephone related services, provide marketing infrastructure and services, provide customer caller ID, provide electricity to our office, license patents to us, partner with us in international operations, process LNP orders, and lease office space to us. In certain cases, we may terminate these arrangements early upon payment of specified fees.
These commitments total
$203,273
. Of this total amount, we expect to purchase
$86,048
in
2017
,
$84,959
in
2018
,
$19,553
in
2019
,
$2,000
in 2020 and 2021, and
$8,713
thereafter, respectively.
These amounts do not represent our entire anticipated purchases in the future, but represent only those items for which we are contractually committed. We also purchase products and services as needed with no firm commitment. For this reason, the amounts presented do not provide a reliable indicator of our expected future cash outflows or changes in our expected cash position.
Litigation
From time to time, in addition to those identified below, we are subject to legal proceedings, claims, investigations, and proceedings in the ordinary course of business, including claims of alleged infringement of third-party patents and other intellectual property rights, commercial, employment, and other matters. From time to time, we also receive letters or other communications from third parties inviting us to obtain patent licenses that might be relevant to our business or alleging that our services infringe upon third party patents or other
intellectual property. In accordance with generally accepted accounting principles, we make a provision for a liability when it is both probable that a liability has been incurred and the amount of the loss or range of loss can be reasonably estimated. These provisions, if any, are reviewed at least quarterly and adjusted to reflect the impacts of negotiations, settlements, rulings, advice of legal counsel, and other information and events pertaining to a particular case. Litigation is inherently unpredictable. We believe that we have valid defenses with respect to the legal matters pending against us and are vigorously defending these matters. Given the uncertainty surrounding litigation and our inability to assess the likelihood of a favorable or unfavorable outcome in the above noted matters and our inability to reasonably estimate the amount of loss or range of loss, it is possible that the resolution of one or more of these matters could have a material adverse effect on our consolidated financial position, cash flows or results of operations.
IP Matters
Bear Creek Technologies, Inc.
On February 22, 2011, Bear Creek Technologies, Inc. (“Bear Creek”) filed a lawsuit against Vonage Holdings Corp., Vonage America Inc., Vonage Marketing LLC, and Aptela Inc. (the latter two entities being former subsidiaries of Vonage Holdings Corp. now merged into Vonage America Inc. and Vonage Business Inc., respectively) in the United States District Court for the Eastern District of Virginia alleging that Vonage’s and Aptela’s products and services are covered by United States Patent No. 7,889,722, entitled “System for Interconnecting Standard Telephony Communications Equipment to Internet Protocol Networks” (the “'722 Patent”). The suit also named numerous other defendants. On August 17, 2011, the Court dismissed Bear Creek’s case against the Vonage entities and Aptela, and all but
one
of the other defendants. Later, on August 17, 2011, Bear Creek re-filed its complaint in the United States District Court for the District of Delaware against the same Vonage entities; and re-filed its complaint in the United States District Court for the Eastern District of Virginia against Aptela. On May 2, 2012, the litigations against Vonage and Aptela were consolidated for pretrial proceedings with
twelve
other actions in the District of Delaware. Vonage filed an answer to Bear Creek’s complaint, including counterclaims of non-infringement and invalidity of the ‘722 patent. Aptela, which filed a motion to dismiss Bear Creek’s complaint on September 27, 2011, has not yet answered, as its motion remains pending. On November 5, 2012, Bear Creek filed an answer to Vonage’s counterclaims. On July 17, 2013, the Court stayed the case pending resolution of the reexamination of the ‘722 patent requested by Cisco Systems, Inc. (“Cisco”), described below. On May
F-33 VONAGE ANNUAL REPORT 2016
VONAGE HOLDINGS CORP.
NOTES TO CONSOLIDATED FINANCIAL STATEMENTS—(Continued)
(In thousands, except per share amounts)
5, 2015, the Court closed the case, with leave to reopen if further attention by the Court is required.
A request for reexamination of the validity of the ‘722 Patent was filed on September 12, 2012 by Cisco. Cisco’s request was granted on November 28, 2012. On March 24, 2014, the United States Patent and Trademark Office issued an Action Closing Prosecution, confirming its rejection of all claims of the ‘722 patent. Bear Creek’s November 14, 2014 appeal of that decision to the Patent Trial and Appeal Board was denied on December 29, 2015. Bear Creek appealed the Board’s decision to the United States Court of Appeals for the Federal Circuit. Briefing on the appeal is complete and pending oral argument before the Court on March 13, 2017.
RPost Holdings, Inc.
On August 24, 2012, RPost Holdings, Inc., RPost Communications Limited, and RMail Limited (collectively, “RPost”) filed a lawsuit against StrongMail Systems, Inc. (“StrongMail”) in the United States District Court for the Eastern District of Texas alleging that StrongMail’s products and services, including its electronic mail marketing services, are covered by United States Patent Nos. 8,224,913, 8,209,389, 8,161,104, 7,966,372, and 6,182,219. On February 11, 2013, RPost filed an amended complaint, adding
27
new defendants, including Vonage America Inc. RPost’s amended complaint alleges willful infringement of the RPost patents by Vonage and each of the other new defendants because they are customers of StrongMail. StrongMail has agreed to fully defend and indemnify Vonage in this lawsuit. Vonage answered the complaint on May 7, 2013. On September 17, 2015, the Court ordered the consolidation for pre-trial purposes of this case with other cases by RPost. The lead case has been administratively closed and stayed since January 30, 2014 due to multiple pending actions by third parties regarding ownership of the patents at issue. On December 1, 2016, the parties in the consolidated actions filed a joint notice regarding status of the co-pending actions. Plaintiffs requested that the stay be lifted, while defendants maintain that the stay should remain in place.
AIP Acquisition LLC
. On January 3, 2014, AIP Acquisition LLC (“AIP”), filed a lawsuit against Vonage Holdings Corp., Vonage America, Inc., and Vonage Marketing LLC in the U.S. District Court for the District of Delaware alleging that Vonage’s products and services are covered by United States Patent No. 7,269,247. Vonage filed an answer and counterclaims on February 25, 2014. AIP filed an amended complaint on March 18, 2014, which Vonage answered on April 4, 2014. On April 8, 2014, the Court stayed the case pending final resolution of non-party Level 3’s inter partes review request of United States Patent No. 7,724,879, which is a continuation of the ‘247 patent. On October 8, 2014, the Patent Office issued a Final Written Decision, finding all challenged claims of the ‘879 patent to be invalid. On November 10, 2015, the Federal Circuit rejected AIP’s appeal and affirmed the Patent Office’s rejection of the ‘879 patent.
Cisco petitioned for inter partes review of the ‘247 patent on November 25, 2014, which was granted on May 20, 2015. On May 18, 2016, the Patent Office issued a Final Written Decision, finding all challenged claims of the ‘247 patent to be invalid. AIP appealed to the Federal Circuit, filing its opening brief on December 15, 2016. On December 20, 2016, the Patent Office filed a notice of intervention in the appellate proceedings. Both the Patent Office’s and Cisco’s responsive briefs are due on March 13, 2017.
Commercial Litigation
Merkin & Smith, et als
. On September 27, 2013, Arthur Merkin and James Smith filed a putative class action lawsuit against Vonage America, Inc. in the Superior Court of the State of California, County of Los Angeles, alleging that Vonage violated California’s Unfair Competition Law by charging its customers fictitious 911 taxes and fees. On October 30, 2013, Vonage filed a notice removing the case to the United States District Court for the Central District of California. On November 26, 2013, Vonage filed its Answer to the Complaint. On December 4, 2013, Vonage filed a Motion to Compel Arbitration, which the Court denied on February 4, 2014. On March 5,
2014, Vonage appealed that decision to the United States Court of Appeals for the Ninth Circuit. On March 26, 2014, the district court proceedings were stayed pending the appeal. On February 29, 2016, the Ninth Circuit reversed the district court’s ruling and remanded with instructions to grant the motion to compel arbitration. On March 22, 2016, Merkin and Smith filed a petition for rehearing. On May 4, 2016, the Ninth Circuit withdrew its February 29, 2016 decision and issued a new order reversing the district court’s order and remanded with instructions to compel arbitration. The Ninth Circuit also declared as moot the petition for rehearing. On June 27, 2016, the lower court stayed the case pending arbitration. A joint status report was filed with the District Court on December 23, 2016.
Regulation
Telephony services are subject to a broad spectrum of state and federal regulations. Because of the uncertainty over whether Voice over Internet Protocol (“VoIP”) should be treated as a telecommunications or information service, we have been involved in a substantial amount of state and federal regulatory activity. Implementation and interpretation of the existing laws and regulations is ongoing and is subject to litigation by various federal and state agencies and courts. Due to the uncertainty over the regulatory classification of VoIP service, there can be no assurance that we will not be subject to new regulations or existing regulations under new interpretations, and that such change would not introduce material additional costs to our business.
Federal - Net Neutrality
Clear and enforceable net neutrality rules make it more difficult for broadband Internet service providers to block or discriminate against Vonage service. In addition, explicitly applying net neutrality rules to wireless broadband Internet service providers could create greater opportunities for VoIP applications that run on wireless broadband Internet service. In December 2010, the FCC adopted net neutrality rules that applied strong net neutrality rules to wired broadband Internet service providers and limited rules to wireless broadband Internet service providers. On January 14, 2014, the D.C. Circuit Court of Appeals vacated a significant portion of the 2010 rules. On May 15, 2014, the FCC issued a Notice of Proposed Rulemaking (NPRM) proposing new net neutrality rules. After public response to the NPRM, the FCC adopted new neutrality rules on February 26, 2015. These rules prohibit broadband Internet service providers from: (1) blocking or throttling lawful content applications, or services; (2) imposing paid prioritization arrangements; and (3) unreasonably interfering or unreasonably disadvantaging consumers or edge providers. In addition, broadband Internet service providers are required to make certain disclosures regarding their network management practices, network performance, and commercial terms. These net neutrality rules apply the same requirements to wired and wireless broadband Internet service providers. Several parties have filed appeals which are pending at the D.C. Circuit Court of Appeals. Oral arguments at the D.C. Circuit Court of Appeals were held on December 4, 2015. On June 14, 2016, the D.C. Circuit of Appeals denied the appeals. Several parties filed a petition for rehearing en banc on July 29, 2016. The petition is pending.
Federal - Lifeline Reform
On March 31, 2016, the FCC adopted an order modernizing the Lifeline program. The Lifeline program previously subsidized voice service for low-income customers and is one component of the federal universal service fund. The order refocuses the program to subsidize broadband. Increased adoption of broadband services expands the market for Vonage services. The order will also likely increase the overall size of the federal universal fund and lead to increased USF contribution levels for Vonage services subject to assessment for federal USF.
Federal - Rural Call Completion Issues
On February 7, 2013, the FCC released a Notice of Proposed Rulemaking (NPRM) on rural call completion issues. The NPRM proposed new detailed reporting requirements to gauge rural call
F-34 VONAGE ANNUAL REPORT 2016
VONAGE HOLDINGS CORP.
NOTES TO CONSOLIDATED FINANCIAL STATEMENTS—(Continued)
(In thousands, except per share amounts)
completion performance. Rural carriers have argued that VoIP provider call completion performance to rural areas is generally poor. On October 28, 2013, the FCC adopted an order on rural call completion imposing new reporting obligations and restricting certain call signaling practices. The call signaling rules went into effect on January 31, 2014. We filed for extensions of the rules, which the FCC granted, and as of April 17, 2014, we were compliant with the FCC call signaling rules. The effective date for the reporting requirements was April 1, 2015. We could be subject to an FCC enforcement action in the future in the event the FCC took the position that our rural call completion performance is inadequate or we were not compliant with the FCC’s order.
Federal - Numbering Rights
On April 18, 2013, the FCC issued a Notice of Proposed Rulemaking (NPRM) that proposed to modify FCC rules to allow VoIP providers to directly access telephone numbers. In addition, the FCC granted a waiver from its existing rules to allow Vonage to conduct a trial of direct access to telephone numbers. The trial would allow the FCC to obtain real-world data on direct access to telephone numbers by VoIP providers to inform consideration of the NPRM. Direct access to telephone numbers would facilitate IP to IP interconnection, which may allow VoIP providers to provide higher quality, lower cost services, promote the deployment of innovative new voice services, and experience reductions in the cost of telephony services. Vonage successfully completed the trial in certain markets and filed the required reports on the trial with the FCC. On January 31, 2014, the FCC Wireline Competition Bureau issued a positive report on the trial, concluding that Vonage's successful trial confirmed the technical feasibility of interconnected VoIP providers obtaining telephone numbers directly from the numbering administrators. On June 18, 2015, the FCC adopted an order that modifies its rules to allow interconnected VoIP providers to directly access telephone numbers. Part of the order required approval from the Office of Management and Budget ("OMB") prior to the rule change becoming effective. On February 4, 2016, the FCC announced that OMB had approved the order and would begin accepting applications for authorization beginning on February 18, 2016. Vonage applied for authorization, and on March 31, 2016 received authorization. On December 23, 2015, the National Association of Regulatory Utility Commissioners filed an appeal of the June 18, 2015 FCC order at the D.C. Circuit Court of Appeals. The D.C. Circuit held oral argument on this appeal on February 8, 2017.
Federal - Privacy Rules
On April 1, 2016, the FCC issued a Notice of Proposed Rulemaking (NPRM) that proposed the adoption of privacy rules for providers of broadband Internet access service and updating its rules for voice services to make them consistent with the proposed privacy rules for broadband Internet access services. In addition to regulating customer proprietary network information (CPNI), a category of information that the FCC has traditionally regulated for voice services, the FCC proposed to regulate use of customer personal information (PI), a broader set of information than CPNI, by broadband and voice service providers. Further, the NPRM would regulate voice and broadband provider privacy policies and data security practices, including imposing vicarious liability for vendors who handle PI and CPNI on behalf of a broadband or voice provider. Finally, the NPRM would impose another data breach reporting notification obligation on voice and broadband providers on top of existing state data breach notification requirements. The FCC adopted its new privacy rules at its October 27, 2016 open meeting. The rules do not provide for vicarious liability for vendors and provide an exemption from the rules in certain instances for business voice customers. Numerous parties have filed petitions for reconsideration.
State Telecommunications Regulation
In general, the focus of interconnected VoIP telecommunications regulation is at the federal level. On November 12, 2004, the FCC issued a declaratory ruling providing that our service is subject to federal regulation and preempted the Minnesota Public
Utilities Commission (“MPUC”) from imposing certain of its regulations on us. The FCC's decision was based on its conclusion that our service is interstate in nature and cannot be separated into interstate and intrastate components. On March 21, 2007, the United States Court of Appeals for the 8th Circuit affirmed the FCC's declaratory ruling preempting state regulation of our service.
While this ruling does not exempt us from all state oversight of our service, it effectively prevents state telecommunications regulators from imposing certain burdensome and inconsistent market entry requirements and certain other state utility rules and regulations on our service. State regulators continue to probe the limits of federal preemption in their attempts to apply state telecommunications regulation to interconnected VoIP service. On July 16, 2009, the Nebraska Public Service Commission and the Kansas Corporation Commission filed a petition with the FCC seeking a declaratory ruling or, alternatively, adoption of a rule declaring that state authorities may apply universal service funding requirements to nomadic VoIP providers. We participated in the FCC proceedings on the petition. On November 5, 2010, the FCC issued a declaratory ruling that allowed states to assess state USF on nomadic VoIP providers on a going forward basis provided that the states comply with certain conditions to ensure that imposing state USF does not conflict with federal law or policy. More recently on July 28, 2015, the MPUC found that it has authority to regulate Charter’s fixed, interconnected VoIP service. Charter challenged the MPUC’s order at the U.S. District Court for Minnesota. This challenge is currently pending. We expect that state public utility commissions and state legislators will continue their attempts to apply state telecommunications regulations to VoIP service.
State and Municipal Taxes
In accordance with generally accepted accounting principles, we make a provision for a liability for taxes when it is both probable that a liability has been incurred and the amount of the liability or range of liability can be reasonably estimated. These provisions are reviewed at least quarterly and adjusted to reflect the impacts of negotiations, settlements, rulings, advice of legal counsel, and other information and events pertaining to a particular case. For a period of time, we did not collect or remit state or municipal taxes (such as sales, excise, utility, use, and ad valorem taxes), fees or surcharges (“Taxes”) on the charges to our customers for our services, except that we historically complied with the New Jersey sales tax. We have received inquiries or demands from a number of state and municipal taxing and 911 agencies seeking payment of Taxes that are applied to or collected from customers of providers of traditional public switched telephone network services. Although we have consistently maintained that these Taxes do not apply to our service for a variety of reasons depending on the statute or rule that establishes such obligations, we are now collecting and remitting sales taxes in certain of those states including a number of states that have changed their statutes to expressly include VoIP. In addition, many states address how VoIP providers should contribute to support public safety agencies, and in those states we remit fees to the appropriate state agencies. We could also be contacted by state or municipal taxing and 911 agencies regarding Taxes that do explicitly apply to VoIP and these agencies could seek retroactive payment of Taxes. As such, we have a reserve of
$1,763
as of
December 31, 2016
as our best estimate of the potential tax exposure for any retroactive assessment. We believe the maximum estimated exposure for retroactive assessments is approximately
$2,600
as of
December 31, 2016
.
Employment Agreements
Our Chief Executive Officer is subject to an employment contract with a minimum salary commitment that is subject to annual review. He is also eligible for an annual performance bonus with a target based upon his then annual salary. The term of the employment contract with our Chief Executive Officer expires in 2017. In the event of the termination of our Chief Executive Officer’s employment, depending upon the circumstances, he will be entitled to severance benefits equal to (i)
twelve
months base salary plus his target bonus amount for the year in which his employment terminates, payable over the
twelve
F-35 VONAGE ANNUAL REPORT 2016
VONAGE HOLDINGS CORP.
NOTES TO CONSOLIDATED FINANCIAL STATEMENTS—(Continued)
(In thousands, except per share amounts)
months period following termination of employment, (ii) a pro rata share (based on the portion of the year elapsed) of his bonus for the year in which his employment terminates, payable when, as and if under the Company’s bonus program such bonus would otherwise be paid, but in no event later than March 15th of the year following the year to which such bonus relates, (iii) any prior year bonus amounts earned but unpaid
as of the termination date, (iv) other accrued but unpaid compensation and benefits under the Company’s benefits plans, (v) amounts to cover specified health care coverage premiums and (vi) vesting of certain equity awards pursuant to the terms of such awards.
Note 11.
Acquisition of Business
Acquisition of Nexmo
Nexmo Inc. is a global leader in the Communications-Platform-as-a-Service (“CPaaS”) segment of the cloud communications market. Nexmo provides innovative communication application program interfaces (“APIs”) for text messaging and voice communications, allowing developers and enterprises to embed contextual communications into mobile apps, websites and business workflows via text, social media, chat apps and voice.
Pursuant to the Agreement and Plan of Merger dated May 5, 2016, by and among the Company, Neptune Acquisition Corp., a Delaware corporation and newly formed indirect, wholly owned subsidiary of Vonage (“Merger Sub”), Nexmo, a Delaware corporation, and Shareholder Representative Services LLC, a Colorado limited liability company, as representative of the security holders of Nexmo, on June 3, 2016, Merger Sub, on the terms and subject to the conditions thereof, merged with and into Nexmo, and Nexmo became a wholly owned indirect subsidiary of Vonage.
On June 2, 2016, Vonage, Merger Sub, Nexmo and the Representative entered into Amendment No. 1 to the Merger Agreement (the “ Amendment”). The Amendment amended the Merger Agreement to, among other things, (1) increase the purchase price payable to the Nexmo securityholders by the amount of unrestricted cash and cash equivalents of Nexmo in lieu of the declaration of a dividend or other distribution of such unrestricted cash and cash equivalents to the Nexmo
securityholders, (2) clarify the treatment of enterprise management incentive options issued by Nexmo to certain of its employees located in the United Kingdom, and (3) add certain technical provisions with respect to deposits made to the escrow agent and the exchange agent in connection with the closing of the transactions contemplated by the Merger Agreement.
Under the agreement, Nexmo shareholders are receiving consideration of
$231,122
, with an additional earn-out opportunity (the "Variable Payout Amount") of up to
$20,000
contingent upon Nexmo achieving certain performance targets. Of the consideration,
$194,684
(net of cash acquired of
$16,094
) was paid at close, consisting of
$163,093
of cash (net of
$16,094
of cash acquired) and
6,823
in shares of Vonage common stock valued at
$31,591
. The remaining
$36,438
of the
$231,122
purchase price was in the form of restricted cash, restricted stock and options held by Nexmo management and employees (the "Employee Payout Amount"), subject to vesting requirements over time and to be amortized to compensation expense quarterly until vested. We financed the transaction with
$179,000
from our 2016 Credit Facility. The purchase price is subject to adjustments pursuant to the merger agreement for closing cash and working capital of Nexmo, reductions for indebtedness and transaction expenses of Nexmo that remained unpaid as of closing, and escrow fund deposits. The aggregate consideration will be allocated among Nexmo equityholders.
The consideration was allocated to acquisition cost as follows:
|
Cash paid at closing (inclusive of cash acquired of $16,094)
|
$
|
179,186
|
|
|
Stock paid at closing
|
31,591
|
|
|
|
Variable Payout Amount (described below)
|
16,472
|
|
|
|
Employee Payout Amount (described below)
|
4,779
|
|
|
|
Acquisition Cost
|
$
|
232,028
|
|
In addition, Nexmo shareholders were eligble to earn a Variable Payout Amount of up to
$20,000
, subject to the achievement of certain performance targets during the
12
month period following the closing of the transaction. The contingent consideration payable to the holders of Nexmo stock is determined based on (i) the achievement of certain revenue targets for the calendar year 2016, and (ii) Nexmo’s revenues received from its top customers following the closing. The contingent consideration may be in the form of cash, a number of shares of Vonage common stock or a combination thereof, at our sole discretion. We estimated using probability weighting that the value of the contingent consideration is
$17,840
at the acquisition date and included that amount in acquisition cost at the net present value amount of
$16,472
. As of September 30, 2016, we have adjusted our probability weighting based upon updated information and have reduced the value of the contingent consideration to
$9,866
with a net present value of
$9,110
. This reduction in the contingent consideration of
$7,362
was recorded in general and administrative expenses. As of December 31, 2016,
Nexmo did not achieve performance targets but the parties have agreed to a
$5,000
settlement that the parties expect to be paid in the first quarter of 2017. As such we reduced the contingent consideration to
$0
and recorded the reduction of the remaining net present value of
$9,110
in general and administrative expenses. The
$5,000
settlement has also been reflected in accrued expenses within the consolidated balance sheets and in general and administrative expenses in the consolidated statements of income.
In addition, Nexmo management and employees may earn an Employee Payout Amount of
$36,438
attributable to restricted cash, restricted stock and assumed options, of which
$4,779
is included in acquisition cost as service had been provided pre-acquisition and
$31,659
will be recorded as post-acquisition expense assuming all amounts vest, of which
$31,087
will be recorded as compensation expense and
$572
will be recorded as interest expense as continued employment is a condition of receiving consideration.
F-36 VONAGE ANNUAL REPORT 2016
VONAGE HOLDINGS CORP.
NOTES TO CONSOLIDATED FINANCIAL STATEMENTS—(Continued)
(In thousands, except per share amounts)
The post-acquisition expense will be recorded as follows:
|
Restricted Stock
|
Restricted Cash
|
Assumed Options
|
Interest Expense
|
Total
|
|||||||||||||||
|
2016
|
$
|
7,380
|
|
$
|
6,353
|
|
$
|
2,700
|
|
$
|
255
|
|
$
|
16,688
|
|
||||
|
2017
|
6,197
|
|
5,383
|
|
1,293
|
|
271
|
|
13,144
|
|
|||||||||
|
2018
|
661
|
|
620
|
|
424
|
|
46
|
|
1,751
|
|
|||||||||
|
2019
|
—
|
|
—
|
|
76
|
|
—
|
|
76
|
|
|||||||||
|
Total
|
$
|
14,238
|
|
$
|
12,356
|
|
$
|
4,493
|
|
$
|
572
|
|
$
|
31,659
|
|
||||
Pursuant to the merger agreement,
$20,372
of the cash consideration and
$5,081
of the stock consideration were placed in escrow for unknown liabilities that may have existed as of the acquisition date.
During 2016, we incurred approximately
$5,500
in acquisition related transaction costs, which were recorded in general and administrative expense in the accompanying Consolidated Statements of Income.
The acquisition was accounted for using the acquisition method of accounting under which assets and liabilities of Nexmo were recorded at their respective fair values including an amount for goodwill representing the difference between the acquisition consideration and the fair value of the identifiable net assets. We do not expect any portion of this goodwill to be deductible for tax purposes. The goodwill attributable to the acquisition has been recorded as a non-current asset and is not amortized, but is subject to an annual review for impairment.
The acquisition price was allocated to the tangible and identified intangible assets acquired and liabilities assumed as of the closing date. The fair values assigned to identifiable intangible assets assumed were based on management’s current estimates and assumptions and is considered preliminary. The estimated fair values of the identified current assets, property and equipment, software and other assets acquired and current liabilities assumed are also considered preliminary and are based on the most recent information available. We believe that the most recent information available provides a reasonable basis for assigning fair value, but we anticipate receiving additional information, and, as such, the provisional measurements of fair value set forth below are subject to change. We expect to finalize the valuation as soon as practicable, but not later than one year from the acquisition date.
The table below summarizes the Nexmo assets acquired and liabilities assumed as of June 3, 2016:
|
Estimated Fair Value
|
|||
|
Assets
|
|||
|
Current assets:
|
|||
|
Cash and cash equivalents
|
$
|
16,094
|
|
|
Accounts receivable
|
8,764
|
|
|
|
Prepaid expenses and other current assets
|
3,507
|
|
|
|
Total current assets
|
28,365
|
|
|
|
Property and equipment
|
757
|
|
|
|
Software, net
|
242
|
|
|
|
Intangible assets
|
101,770
|
|
|
|
Restricted cash
|
51
|
|
|
|
Total assets acquired
|
131,185
|
|
|
|
Liabilities
|
|||
|
Current liabilities:
|
|||
|
Accounts payable
|
1,841
|
|
|
|
Accrued expenses
|
9,299
|
|
|
|
Deferred revenue, current portion
|
1,735
|
|
|
|
Total current liabilities
|
12,875
|
|
|
|
Deferred tax liabilities, net, non-current
|
29,355
|
|
|
|
Total liabilities assumed
|
42,230
|
|
|
|
Net identifiable assets acquired
|
88,955
|
|
|
|
Goodwill
|
143,073
|
|
|
|
Total purchase price
|
$
|
232,028
|
|
F-37 VONAGE ANNUAL REPORT 2016
VONAGE HOLDINGS CORP.
NOTES TO CONSOLIDATED FINANCIAL STATEMENTS—(Continued)
(In thousands, except per share amounts)
The intangible assets as of the closing date of the acquisition included:
|
|
Amount
|
|
|
|
Customer relationships
|
$
|
85,900
|
|
|
Developed technologies
|
13,768
|
|
|
|
Non-compete agreements
|
972
|
|
|
|
Trade names
|
1,130
|
|
|
|
$
|
101,770
|
|
|
Indications of fair value of the intangible assets acquired in connection with the acquisition were determined using either the income, market or replacement cost methodologies. The intangible assets are being amortized over periods which reflect the pattern in which economic benefits of the assets are expected to be realized. The customer relationships are being amortized on an accelerated basis over an estimated useful life of
twelve
years, the developed technologies are being amortized on an accelerated basis over an estimated useful life of
eight
years, the non-compete agreements are being amortized on a straight-line basis over
three
years, and trade names are being amortized on a straight-line basis over
two
years.
In addition, we recorded a deferred tax liability of
$37,507
related to the
$101,770
of identified intangible assets that will be amortized for financial reporting purposes but not for tax purposes and a deferred tax asset of
$7,686
related to NOLs.
The excess of purchase price over the fair value amounts assigned to the assets acquired and liabilities assumed represents the amount of goodwill resulting from the acquisition. We do not expect any portion of this goodwill to be deductible for tax purposes. The goodwill attributable to the acquisition has been recorded as a non-current asset and is not amortized, but is subject to an annual review for impairment. We believe the factors that contributed to goodwill include synergies that are specific to our consolidated business, the acquisition of a talented workforce that provides us with expertise in the small and medium business market, as well as other intangible assets that do not qualify for separate recognition.
Acquisition of iCore
Pursuant to the Agreement and Plan of Merger dated August 19, 2015 by and among the Company, Cirrus Acquisition Corp., a Delaware corporation and newly formed indirect, wholly owned subsidiary of Vonage (“Merger Sub”), iCore, and Stephen G. Canton, as representative of the security holders of iCore, on August 31, 2015, Merger Sub, on the terms and subject to the conditions thereof, merged with and into iCore, and iCore became a wholly owned indirect subsidiary of Vonage.
iCore provides cloud-based unified communications and collaboration services, delivering voice, video, and mobile communications solutions to business customers. iCore is a natural complement to our rapid growing UCaaS business and strengthens our national footprint.
We acquired iCore for
$92,689
in cash consideration, subject to adjustments pursuant to the merger agreement for closing cash and working capital of iCore, reductions for indebtedness and transaction expenses of iCore that remained unpaid as of closing, and escrow fund deposits. We financed the transaction with
$10,689
of cash and
$82,000
from our 2015 revolving credit facility. The aggregate consideration was allocated among iCore equity holders.
Pursuant to the merger agreement,
$9,200
of the cash consideration was placed in escrow for unknown liabilities that may have existed as of the acquisition date.
During 2015, we incurred
$1,353
in acquisition related transaction costs, which were recorded in general and administrative expense in the accompanying Consolidated Statements of Income.
The results of operations of the iCore business and the estimated fair values of the assets acquired and liabilities assumed have been included in our consolidated financial statements since the date of the acquisition.
The acquisition was accounted for using the acquisition method of accounting under which assets and liabilities of iCore were recorded at their respective fair values including an amount for goodwill representing the difference between the acquisition consideration and the fair value of the identifiable net assets. We do not expect any portion of this goodwill to be deductible for tax purposes. The goodwill attributable to the acquisition has been recorded as a non-current asset and is not amortized, but is subject to an annual review for impairment.
F-38 VONAGE ANNUAL REPORT 2016
VONAGE HOLDINGS CORP.
NOTES TO CONSOLIDATED FINANCIAL STATEMENTS—(Continued)
(In thousands, except per share amounts)
The table below summarizes the iCore assets acquired and liabilities assumed as of August 31, 2015:
|
|
Estimated Fair Value
|
||
|
Assets
|
|
||
|
Current assets:
|
|
|
|
|
Cash and cash equivalents
|
$
|
1,014
|
|
|
Accounts receivable
|
1,492
|
|
|
|
Inventory
|
191
|
|
|
|
Prepaid expenses and other current assets
|
1,017
|
|
|
|
Total current assets
|
3,714
|
|
|
|
Property and equipment
|
4,437
|
|
|
|
Software
|
281
|
|
|
|
Intangible assets
|
38,064
|
|
|
|
Restricted cash
|
183
|
|
|
|
Other assets
|
195
|
|
|
|
Total assets acquired
|
46,874
|
|
|
|
|
|
|
|
|
Liabilities
|
|
|
|
|
Current liabilities:
|
|
|
|
|
Accounts payable
|
3,344
|
|
|
|
Accrued expenses
|
3,979
|
|
|
|
Deferred revenue, current portion
|
576
|
|
|
|
Current maturities of capital lease obligations
|
557
|
|
|
|
Total current liabilities
|
8,456
|
|
|
|
Capital lease obligations, net of current maturities
|
552
|
|
|
|
Deferred tax liabilities, net, non-current
|
8,487
|
|
|
|
Total liabilities assumed
|
17,495
|
|
|
|
Net identifiable assets acquired
|
29,379
|
|
|
|
Goodwill
|
63,310
|
|
|
|
Total purchase price
|
$
|
92,689
|
|
The intangible assets as of the closing date of the Acquisition included:
|
|
Amount
|
|
|
|
Customer relationships
|
$
|
37,720
|
|
|
Non-compete agreements
|
104
|
|
|
|
Trade names
|
240
|
|
|
|
$
|
38,064
|
|
|
Indications of fair value of the intangible assets acquired in connection with the acquisition were determined using either the income, market or replacement cost methodologies. The intangible assets are being amortized over periods which reflect the pattern in which economic benefits of the assets are expected to be realized. The customer relationships are being amortized on an accelerated basis over an estimated useful life of
ten
years; developed technology is being amortized on an accelerated basis over an estimated useful life of
eight
years; and the non-compete agreements and trade names are being amortized on a straight-line basis over
two
years.
In addition, we recorded a deferred tax liability of
$12,944
related to the
$38,064
of identified intangible assets that will be amortized for financial reporting purposes but not for tax purposes and a deferred tax asset of
$4,457
related to NOLs.
The excess of purchase price over the fair value amounts assigned to the assets acquired and liabilities assumed represents the amount of goodwill resulting from the acquisition. We do not expect any portion of this goodwill to be deductible for tax purposes. The goodwill attributable to the acquisition has been recorded as a non-current asset and is not amortized, but is subject to an annual review for impairment. We believe the factors that contributed to goodwill include synergies that are specific to our consolidated business, the acquisition of a talented workforce that provides us with expertise in the small and medium business market, as well as other intangible assets that do not qualify for separate recognition.
Acquisition of Simple Signal
Pursuant to the Agreement and Plan of Merger dated March 15, 2015, by and among Vonage Holdings Corp., a Delaware corporation, Stratus Acquisition Corp., a California corporation and an
F-39 VONAGE ANNUAL REPORT 2016
VONAGE HOLDINGS CORP.
NOTES TO CONSOLIDATED FINANCIAL STATEMENTS—(Continued)
(In thousands, except per share amounts)
indirect wholly owned subsidiary of Parent (“Merger Sub”), Simple Signal Inc., a California corporation (“Simple Signal”) and Simplerep, LLC, a Colorado limited liability company, as representative of the security holders of Simple Signal, on April 1, 2015, Merger Sub merged with and into Simple Signal, and Simple Signal became a wholly owned indirect subsidiary of Vonage.
Simple Signal provides cloud-based unified communications and collaboration services, delivering voice, video, and mobile communications solutions to business customers. Simple Signal is a natural complement to our expanding UCaaS business.
We acquired Simple Signal for
$25,578
, including
1,111
shares of Vonage common stock (which shares had an aggregate value of approximately
$5,578
based upon the closing stock price on April 1, 2015) and cash consideration of
$20,000
, subject to adjustments pursuant to the merger agreement for closing cash and working capital of Simple Signal, reductions for indebtedness and transaction expenses of Simple Signal that remained unpaid as of closing, and escrow fund deposits. We financed the transaction with
$20,000
from our 2014 revolving credit facility. The aggregate consideration will be allocated among Simple Signal equityholders.
Pursuant to the merger agreement,
$2,356
of the cash consideration and
$1,144
of the stock consideration was placed in
escrow for unknown liabilities that may have existed as of the acquisition date.
During 2015, we incurred
$470
in acquisition related transaction costs, which were recorded in general and administrative expense in the accompanying Consolidated Statements of Income.
The results of operations of the Simple Signal business and the estimated fair values of the assets acquired and liabilities assumed have been included in our consolidated financial statements since the date of the acquisition.
The acquisition was accounted for using the acquisition method of accounting under which assets and liabilities of Simple Signal were recorded at their respective fair values including an amount for goodwill representing the difference between the acquisition consideration and the fair value of the identifiable net assets. We do not expect any portion of this goodwill to be deductible for tax purposes. The goodwill attributable to the acquisition has been recorded as a non-current asset and is not amortized, but is subject to an annual review for impairment.
The table below summarizes the Simple Signal assets acquired and liabilities assumed as of April 1, 2015:
|
|
Estimated Fair Value
|
||
|
Assets
|
|
||
|
Current assets:
|
|
||
|
Cash and cash equivalents
|
$
|
53
|
|
|
Accounts receivable
|
832
|
|
|
|
Inventory
|
67
|
|
|
|
Prepaid expenses and other current assets
|
143
|
|
|
|
Total current assets
|
1,095
|
|
|
|
Property and equipment
|
979
|
|
|
|
Software
|
401
|
|
|
|
Intangible assets
|
6,407
|
|
|
|
Deferred tax assets, net, non-current
|
741
|
|
|
|
Total assets acquired
|
9,623
|
|
|
|
|
|
|
|
|
Liabilities
|
|
|
|
|
Current liabilities:
|
|
|
|
|
Accounts payable
|
785
|
|
|
|
Accrued expenses
|
593
|
|
|
|
Deferred revenue, current portion
|
370
|
|
|
|
Total current liabilities
|
1,748
|
|
|
|
Total liabilities assumed
|
1,748
|
|
|
|
Net identifiable assets acquired
|
7,875
|
|
|
|
Goodwill
|
17,703
|
|
|
|
Total purchase price
|
$
|
25,578
|
|
F-40 VONAGE ANNUAL REPORT 2016
VONAGE HOLDINGS CORP.
NOTES TO CONSOLIDATED FINANCIAL STATEMENTS—(Continued)
(In thousands, except per share amounts)
The intangible assets as of the closing date of the Acquisition included:
|
|
Amount
|
|
|
|
Customer relationships
|
$
|
5,090
|
|
|
Developed technologies
|
994
|
|
|
|
Non-compete agreements
|
303
|
|
|
|
Trade names
|
20
|
|
|
|
$
|
6,407
|
|
|
Indications of fair value of the intangible assets acquired in connection with the acquisition were determined using either the income, market or replacement cost methodologies. The intangible assets are being amortized over periods which reflect the pattern in which economic benefits of the assets are expected to be realized. The customer relationships are being amortized on an accelerated basis over an estimated useful life of
ten
years; developed technology is being amortized on an accelerated basis over an estimated useful life of
eight
years; and the non-compete agreements and trade names are being amortized on a straight-line basis over
two
years.
In addition, we recorded a deferred tax liability of
$2,441
related to the
$6,407
of identified intangible assets that will be amortized for financial reporting purposes but not for tax purposes and a deferred tax asset of
$3,182
related to NOLs.
The excess of purchase price over the fair value amounts assigned to the assets acquired and liabilities assumed represents the amount of goodwill resulting from the acquisition. We do not expect any portion of this goodwill to be deductible for tax purposes. The goodwill attributable to the acquisition has been recorded as a non-current asset and is not amortized, but is subject to an annual review for impairment. We believe the factors that contributed to goodwill include synergies that are specific to our consolidated business, the acquisition of a talented workforce that provides us with expertise in the small and medium business market, as well as other intangible assets that do not qualify for separate recognition.
Acquisition of Telesphere
Pursuant to the Agreement and Plan of Merger (the “Telesphere Merger Agreement ”), dated November 4, 2014, by and among Vonage, Thunder Acquisition Corp., a Washington corporation and newly formed wholly owned subsidiary of Vonage (“Merger Sub”), Telesphere Networks Ltd. ("Telesphere"), and each of John Chapple and Gary O’Malley, as representative of the securityholders of Telesphere (collectively, the “Representative”). On December 15, 2014, Merger Sub merged with and into Telesphere, and Telesphere became a wholly owned subsidiary of Vonage (the “Merger”).
Telesphere offers a comprehensive range of cloud voice and UCaaS services, including advanced call center solutions, collaboration, mobile office, and HD multi-point video conferencing. Facilitating its cloud services delivery, Telesphere also provides integrated MPLS services over its nationwide network enabling quality of service (QoS) management and security increasingly required by businesses utilizing extensive UCaaS features.
We acquired Telesphere for
$114,330
, including
6,825
shares of Vonage common stock (which shares had an aggregate value of approximately
$22,727
based upon the closing stock price on December 15, 2014) and cash consideration of
$91,603
(of which
$3,610
was paid in January 2015) including payment of
$676
for excess cash as of closing date, a reduction for closing working capital of
$105
, reductions for indebtedness and transaction expenses of Telesphere that remained unpaid as of closing, and deposits into the escrow funds. We financed the transaction with
$24,603
of cash and
$67,000
from our 2014 revolving credit facility. The aggregate consideration will be allocated among Telesphere equity holders.
Pursuant to the Acquisition Agreement,
$10,725
of the cash consideration and
$2,875
of the stock consideration was placed in escrow (the "Holdback") for unknown liabilities that may have existed as of the acquisition date.
$11,600
of the Holdback, which was included as part of the acquisition consideration, was paid to the former Telesphere shareholders within
18
months from the closing date of the Acquisition.
$2,000
of the Holdback, which was included as part of the acquisition consideration, will be paid for such unknown tax specific liabilities or to the former Telesphere shareholders within
36
months from the closing date of the Acquisition.
During 2015 and 2014, we incurred
$102
and
$2,446
, respectively, in acquisition related transaction costs, which were recorded in selling, general and administrative expense in the accompanying Consolidated Statements of Operations.
The results of operations of the Telesphere business and the estimated fair values of the assets acquired and liabilities assumed have been included in our consolidated financial statements since the date of the acquisition.
The acquisition was accounted for using the acquisition method of accounting under which assets and liabilities of Telesphere were recorded at their respective fair values including an amount for goodwill representing the difference between the acquisition consideration and the fair value of the identifiable net assets.
During the first quarter of 2015, the Company completed the process of allocating the acquisition price to identified intangible assets acquired as of the closing date, which had been in process as of December 31, 2014. The fair values assigned to tangible and identifiable intangible assets acquired and liabilities assumed are based on management’s estimates and assumptions.
The December 31, 2014 balance sheet has been revised to reflect the allocation of the purchase price for Telesphere based upon completion of our valuation analysis of intangible assets. The key revision was to record identified intangible assets of
$50,925
with a corresponding reduction to goodwill.
F-41 VONAGE ANNUAL REPORT 2016
VONAGE HOLDINGS CORP.
NOTES TO CONSOLIDATED FINANCIAL STATEMENTS—(Continued)
(In thousands, except per share amounts)
The table below summarizes the Telesphere assets acquired and liabilities assumed as of December 15, 2014 as follows:
|
Estimated Fair Value
|
|||
|
Assets
|
|||
|
Current assets:
|
|||
|
Cash and cash equivalents
|
$
|
70
|
|
|
Accounts receivable
|
2,925
|
|
|
|
Inventory
|
386
|
|
|
|
Prepaid expenses and other current assets
|
398
|
|
|
|
Total current assets
|
3,779
|
|
|
|
Property and equipment
|
5,731
|
|
|
|
Software
|
3
|
|
|
|
Intangible assets
|
50,925
|
|
|
|
Deferred tax assets, net, non-current
|
51
|
|
|
|
Other assets
|
76
|
|
|
|
Total assets acquired
|
60,565
|
|
|
|
Liabilities
|
|||
|
Current liabilities:
|
|||
|
Accounts payable
|
1,202
|
|
|
|
Accrued expenses
|
4,108
|
|
|
|
Deferred revenue, current portion
|
1,156
|
|
|
|
Total current liabilities
|
6,466
|
|
|
|
Total liabilities assumed
|
6,466
|
|
|
|
Net identifiable assets acquired
|
54,099
|
|
|
|
Goodwill
|
60,231
|
|
|
|
Total purchase price
|
$
|
114,330
|
|
The intangible assets as of the closing date of the acquisition included:
|
|
Amount
|
|
|
|
Customer relationships
|
$
|
10,699
|
|
|
Developed technologies
|
35,508
|
|
|
|
Non-compete agreements
|
2,526
|
|
|
|
MPLS network
|
2,192
|
|
|
|
$
|
50,925
|
|
|
Indications of fair value of the intangible assets acquired in connection with the acquisition were determined using either the income, market or replacement cost methodologies. The intangible assets are being amortized over periods which reflect the pattern in which economic benefits of the assets are expected to be realized. The customer relationships and MPLS network are being amortized on an accelerated basis over an estimated useful life of
seven years
; developed technology is being amortized on an accelerated basis over an estimated useful life of
ten years
; and the non-compete agreements are being amortized on a straight-line basis over
three years
.
In addition, we recorded a deferred tax liability of
$17,050
related to the
$50,925
of identified intangible assets that will be amortized for financial reporting purposes but not for tax purposes and a deferred tax asset of
$17,101
related to NOLs.
The excess of purchase price over the fair value amounts assigned to the assets acquired and liabilities assumed represents the amount of goodwill resulting from the acquisition. We do not expect any portion of this goodwill to be deductible for tax purposes. The goodwill attributable to the acquisition has been recorded as a non-current asset and is not amortized, but is subject to an annual review for impairment. We believe the factors that contributed to goodwill include synergies that are specific to our consolidated business, the acquisition of a talented workforce that provides us with expertise in the small and medium business market, as well as other intangible assets that do not qualify for separate recognition.
F-42 VONAGE ANNUAL REPORT 2016
VONAGE HOLDINGS CORP.
NOTES TO CONSOLIDATED FINANCIAL STATEMENTS—(Continued)
(In thousands, except per share amounts)
Pro forma financial information (unaudited)
The following unaudited supplemental pro forma information presents the combined historical results of operations of Vonage and Nexmo for the years
2016
and
2015
, as if the acquisition had been completed at January 1,
2015
.
|
|
For the years ended December 31,
|
||||||
|
|
2016
|
|
2015
|
|
|||
|
Revenue
|
$
|
989,846
|
|
$
|
958,416
|
|
|
|
Net income attributable to Vonage
|
13,159
|
|
5,679
|
|
|||
|
Net income attributable to Vonage per share - basic
|
0.06
|
|
0.03
|
|
|||
|
Net income attributable to Vonage per share - diluted
|
0.05
|
|
0.02
|
|
|||
The pro forma financial information includes certain adjustments to reflect expenses in the appropriate pro forma periods as though the companies were combined as of the beginning of
2015
. These adjustments include:
|
>
|
an increase in amortization expense of
$8,148
and
$9,121
for the year ended
2016
and
2015
, respectively, related to the identified intangible assets of Nexmo;
|
|
>
|
a decrease in income tax expense of
$3,376
and
$12,807
for the year ended
2016
and
2015
, respectively, related to pro forma adjustments and Nexmo's results prior to acquisition;
|
|
>
|
the exclusion of our transaction-related expenses of
$5,923
for the year ended
2016
;
|
|
>
|
an increase in interest expense of
$2,499
and
$6,450
for the years ended
2016
and
2015
, respectively, associated with borrowings under our revolving credit facility; and
|
|
>
|
a decrease in general and administrative expense attributable to acquisition related consideration accounted for as compensation of
$13,287
, offset by a change in the contingent consideration of
$11,472
, for the year ended
2016
and an increase in general and administrative expense attributable to acquisition related consideration accounted for as compensation of
$3,080
for the year
2015
.
|
The Company recorded revenue of
$58,148
and net loss of
$11,847
attributable to Nexmo for the year ended
December 31, 2016
.
In the third quarter of 2013, we formed a consolidated foreign subsidiary in Brazil in connection with our previously announced joint venture in Brazil, which created a redeemable noncontrolling interest. The redeemable noncontrolling interest consists of the
30.0%
interest in this subsidiary held by our joint venture partner.
In 2014, our joint venture partner did not make required capital calls and correspondingly its interest was diluted to
4%
and was no longer contingently redeemable. As such, we reclassified the redeemable noncontrolling interest previously included in the mezzanine section of our Consolidated Balance Sheets to noncontrolling interest in the Stockholders' Equity section of our Consolidated Balance Sheets.
In December 2014 we announced plans to exit the Brazilian market for consumer telephony services and wind down our joint venture operations in the country. We completed the process at the end of the first quarter of 2015.
In connection with the wind down, we incurred approximately
$111
and
$1,972
in cash and non-cash charges, respectively, in the fourth quarter of 2014 related to severance-related expenses and asset write downs. We incurred approximately
$500
in cash charges in 2015 related to contract terminations and severance-related expenses.
Note 13.
Discontinued Operations
On March 31, 2015, the Company completed its previously announced exit from the Brazilian market for consumer telephony services and the associated wind down of its joint venture operations in the country. The Company incurred a loss on disposal of
$824
. The
loss on disposal is comprised of the write-off of noncontrolling interest of
$907
, foreign currency loss on intercompany loan forgiveness of
$783
, and residual cumulative translation of
$192
, partially offset by a tax benefit of
$1,058
.
F-43 VONAGE ANNUAL REPORT 2016
VONAGE HOLDINGS CORP.
NOTES TO CONSOLIDATED FINANCIAL STATEMENTS—(Continued)
(In thousands, except per share amounts)
The results of operations of this discontinued operation are as follows:
|
|
For the years ended December 31,
|
||||||||||
|
(In thousands, except per share amounts)
|
2016
|
|
2015
|
|
2014
|
|
|||||
|
Revenues
|
$
|
—
|
|
$
|
33
|
|
$
|
99
|
|
||
|
Operating expenses
|
—
|
|
1,648
|
|
10,358
|
|
|||||
|
Loss from discontinued operations
|
—
|
|
(1,615
|
)
|
(10,259
|
)
|
|||||
|
Loss on disposal, net of taxes
|
—
|
|
(824
|
)
|
(1
|
)
|
|||||
|
Net loss from discontinued operations
|
—
|
|
(2,439
|
)
|
(10,260
|
)
|
|||||
|
Plus: Net loss from discontinued operations attributable to noncontrolling interest
|
—
|
|
59
|
|
819
|
|
|||||
|
Net loss from discontinued operations attributable to Vonage
|
$
|
—
|
|
$
|
(2,380
|
)
|
$
|
(9,441
|
)
|
||
Note 14.
Industry Segment and Geographic Information
ASC 280 "
Segment Reporting
" establishes reporting standards for an enterprise's business segments and related disclosures about its products, services, geographic areas and major customers. Under ASC 280, the method for determining what information to report is based upon the way management organizes the operating segments within the Company for making operating decisions and assessing financial performance. Our chief operating decision-makers review revenue and gross margin information for each of our reportable segments, but do not review operating expenses on a segment by segment basis. In addition, with the exception of goodwill and intangible assets, we do not identify or allocate our assets by the reportable segments.
Historically, we have had
two
operating segments that we have aggregated for reporting purposes. In 2016, as a result of the acquisition of Nexmo, we no longer meet the aggregation criteria for operating segments and now have the following
two
reportable segments:
Business
For our Business customers, we provide innovative, cloud-based Unified Communications as a Service, or UCaaS, solutions, comprised of integrated voice, text, video, data, collaboration, and mobile applications over our flexible, scalable Session Initiation Protocol (SIP) based Voice over Internet Protocol, or VoIP, network. Through Nexmo, the Vonage API Platform, we also offer Communications Platform as a Service, or CPaaS, solutions designed to enhance the way businesses communicate with their customers embedding communications into apps, websites and business processes. Together we have a robust set of product families tailored to serve the full range of the business value chain, from the small and medium business, or SMB, market, through mid-market and enterprise markets. We provide customers with multiple deployment options, designed to provide the reliability and quality of service they demand. We provide customers the ability to integrate our cloud communications platform with many cloud-based productivity and CRM solutions, including Google’s G Suite, Zendesk, Salesforce’s Sales Cloud, Oracle, Clio, and other CRM solutions. In combination, our products and services permit our business customers to communicate with their customers and employees through any cloud-connected device, in any place, at any time without the often costly investment required with on-site equipment.
Consumer
For our Consumer customers, we enable users to access and utilize our UCaaS services and features, via a single “identity,” either a number or user name, regardless of how they are connected to the Internet, including over 3G, LTE, Cable, or DSL broadband networks. This technology enables us to offer our Consumer customers attractively priced voice and messaging services and other features around the world on a variety of devices.
For our segments we categorize revenues as follows:
Services revenues.
Services revenues consists primarily of revenue attributable to our communication services for Consumer and UCaaS and CPaaS services for Business,
Product revenues
. Product revenues includes equipment sold to customers, shipping and handling, professional services, and broadband access.
USF revenues.
USF revenues represent contributions to the Federal Universal Service Fund (“USF”) and related fees.
For our segments we categorize cost of revenues as follows:
Services cost of revenues.
Services cost of revenues consists of costs associated with network operations and technical support personnel, communication origination, and termination services provided by third party carriers and excludes depreciation and amortization.
Product cost of revenues
. Product cost of revenues includes equipment sold to customers, shipping and handling, professional services, cost of certain products including equipment or services that we give customers as promotions,
and broadband access.
USF cost of revenues.
USF cost of revenues represent contributions to the Federal Universal Service Fund (“USF”) and related fees.
F-44 VONAGE ANNUAL REPORT 2016
VONAGE HOLDINGS CORP.
NOTES TO CONSOLIDATED FINANCIAL STATEMENTS—(Continued)
(In thousands, except per share amounts)
Information about our segment results for the years ended December 31,
2016
,
2015
, and
2014
were as follows:
|
Year ended December 31, 2016
|
|||||||||||
|
Business
|
Consumer
|
Total
|
|||||||||
|
Revenues
|
|||||||||||
|
Service revenues
|
$
|
301,877
|
|
$
|
522,515
|
|
$
|
824,392
|
|
||
|
Product revenues (1)
|
52,450
|
|
702
|
|
53,152
|
|
|||||
|
Service and product revenues
|
354,327
|
|
523,217
|
|
877,544
|
|
|||||
|
USF revenues
|
22,025
|
|
56,052
|
|
78,077
|
|
|||||
|
Total revenues
|
376,352
|
|
579,269
|
|
955,621
|
|
|||||
|
Cost of revenues
|
|||||||||||
|
Service cost of revenues (2)
|
111,485
|
|
100,054
|
|
211,539
|
|
|||||
|
Product cost of revenues (1)
|
51,129
|
|
14,394
|
|
65,523
|
|
|||||
|
Service and product cost of revenues
|
162,614
|
|
114,448
|
|
277,062
|
|
|||||
|
USF cost of revenues
|
22,036
|
|
56,052
|
|
78,088
|
|
|||||
|
Total cost of revenues
|
184,650
|
|
170,500
|
|
355,150
|
|
|||||
|
Gross margin
|
|||||||||||
|
Service margin
|
190,392
|
|
422,461
|
|
612,853
|
|
|||||
|
Product margin
|
1,321
|
|
(13,692
|
)
|
(12,371
|
)
|
|||||
|
Gross margin ex-USF (Service and product margin)
|
191,713
|
|
408,769
|
|
600,482
|
|
|||||
|
USF margin
|
(11
|
)
|
—
|
|
(11
|
)
|
|||||
|
Gross margin
|
$
|
191,702
|
|
$
|
408,769
|
|
$
|
600,471
|
|
||
|
Gross margin %
|
||||||||
|
Service margin %
|
63.1
|
%
|
80.9
|
%
|
74.3
|
%
|
||
|
Gross margin ex-USF (Service and product margin %)
|
54.1
|
%
|
78.1
|
%
|
68.4
|
%
|
||
|
Gross margin %
|
50.9
|
%
|
70.6
|
%
|
62.8
|
%
|
||
(1) Includes customer premise equipment, access, professional services, and shipping and handling.
(2) Excludes depreciation and amortization of
$18,820
,
$9,669
, and
$28,489
, respectively.
F-45 VONAGE ANNUAL REPORT 2016
VONAGE HOLDINGS CORP.
NOTES TO CONSOLIDATED FINANCIAL STATEMENTS—(Continued)
(In thousands, except per share amounts)
|
Year ended December 31, 2015
|
|||||||||||
|
Business
|
Consumer
|
Total
|
|||||||||
|
Revenues
|
|||||||||||
|
Service revenues
|
$
|
170,489
|
|
$
|
612,822
|
|
$
|
783,311
|
|
||
|
Product revenues (1)
|
35,545
|
|
645
|
|
36,190
|
|
|||||
|
Service and product revenues
|
206,034
|
|
613,467
|
|
819,501
|
|
|||||
|
USF revenues
|
12,993
|
|
62,578
|
|
75,571
|
|
|||||
|
Total revenues
|
219,027
|
|
676,045
|
|
895,072
|
|
|||||
|
Cost of revenues
|
|||||||||||
|
Service cost of revenues (2)
|
44,997
|
|
123,580
|
|
168,577
|
|
|||||
|
Product cost of revenues (1)
|
31,185
|
|
20,616
|
|
51,801
|
|
|||||
|
Service and product cost of revenues
|
76,182
|
|
144,196
|
|
220,378
|
|
|||||
|
USF cost of revenues
|
13,022
|
|
62,578
|
|
75,600
|
|
|||||
|
Total cost of revenues
|
89,204
|
|
206,774
|
|
295,978
|
|
|||||
|
Gross margin
|
|||||||||||
|
Service margin
|
125,492
|
|
489,242
|
|
614,734
|
|
|||||
|
Product margin
|
4,360
|
|
(19,971
|
)
|
(15,611
|
)
|
|||||
|
Gross margin ex-USF (Service and product margin)
|
129,852
|
|
469,271
|
|
599,123
|
|
|||||
|
USF gross margin
|
(29
|
)
|
—
|
|
(29
|
)
|
|||||
|
Total gross margin
|
$
|
129,823
|
|
$
|
469,271
|
|
$
|
599,094
|
|
||
|
Gross margin %
|
||||||||
|
Service margin %
|
73.6
|
%
|
79.8
|
%
|
78.5
|
%
|
||
|
Gross margin ex-USF (Service and product margin %)
|
63.0
|
%
|
76.5
|
%
|
73.1
|
%
|
||
|
Gross margin %
|
59.3
|
%
|
69.4
|
%
|
66.9
|
%
|
||
(1) Includes customer premise equipment, access, professional services, and shipping and handling.
(2) Excludes depreciation and amortization of
$15,819
,
$9,049
, and
$24,868
, respectively.
F-46 VONAGE ANNUAL REPORT 2016
VONAGE HOLDINGS CORP.
NOTES TO CONSOLIDATED FINANCIAL STATEMENTS—(Continued)
(In thousands, except per share amounts)
|
Year ended December 31, 2014
|
|||||||||||
|
Business
|
Consumer
|
Total
|
|||||||||
|
Revenues
|
|||||||||||
|
Service revenues
|
$
|
89,198
|
|
$
|
705,224
|
|
$
|
794,422
|
|
||
|
Product revenues (1)
|
2,041
|
|
1,202
|
|
3,243
|
|
|||||
|
Service and product revenues
|
91,239
|
|
706,426
|
|
797,665
|
|
|||||
|
USF revenues
|
3,205
|
|
67,984
|
|
71,189
|
|
|||||
|
Total revenues
|
94,444
|
|
774,410
|
|
868,854
|
|
|||||
|
Cost of revenues
|
|||||||||||
|
Service cost of revenues (2)
|
17,885
|
|
142,184
|
|
160,069
|
|
|||||
|
Product cost of revenues (1)
|
6,861
|
|
29,721
|
|
36,582
|
|
|||||
|
Service and product cost of revenues
|
24,746
|
|
171,905
|
|
196,651
|
|
|||||
|
USF cost of revenues
|
3,248
|
|
67,984
|
|
71,232
|
|
|||||
|
Total cost of revenues
|
27,994
|
|
239,889
|
|
267,883
|
|
|||||
|
Gross margin
|
|||||||||||
|
Service margin
|
71,313
|
|
563,040
|
|
634,353
|
|
|||||
|
Product margin
|
(4,820
|
)
|
(28,519
|
)
|
(33,339
|
)
|
|||||
|
Gross margin ex-USF (Service and product margin)
|
66,493
|
|
534,521
|
|
601,014
|
|
|||||
|
USF margin
|
(43
|
)
|
—
|
|
(43
|
)
|
|||||
|
Gross margin
|
$
|
66,450
|
|
$
|
534,521
|
|
$
|
600,971
|
|
||
(1) Includes customer premise equipment, access, professional services, and shipping and handling.
(2) Excludes depreciation and amortization of
$6,487
,
$12,918
, and
$19,405
, respectively.
|
Gross margin %
|
||||||||
|
Service margin %
|
79.9
|
%
|
79.8
|
%
|
79.9
|
%
|
||
|
Gross margin ex-USF (Service and product margin %)
|
72.9
|
%
|
75.7
|
%
|
75.3
|
%
|
||
|
Gross margin %
|
70.4
|
%
|
69.0
|
%
|
69.2
|
%
|
||
Information about our operations by geographic location is as follows:
|
|
For the years ended December 31,
|
||||||||||
|
|
2016
|
|
2015
|
|
2014
|
|
|||||
|
Revenues:
|
|||||||||||
|
United States
|
$
|
872,147
|
|
$
|
854,706
|
|
$
|
823,857
|
|
||
|
Canada
|
27,417
|
|
25,935
|
|
30,294
|
|
|||||
|
United Kingdom
|
17,365
|
|
14,431
|
|
14,703
|
|
|||||
|
Other Countries (1)
|
38,692
|
|
—
|
|
—
|
|
|||||
|
$
|
955,621
|
|
$
|
895,072
|
|
$
|
868,854
|
|
|||
(1) No individual other international country represented greater than
1%
of total revenue during the periods presented.
F-47 VONAGE ANNUAL REPORT 2016
VONAGE HOLDINGS CORP.
NOTES TO CONSOLIDATED FINANCIAL STATEMENTS—(Continued)
(In thousands, except per share amounts)
|
|
December 31, 2016
|
|
December 31, 2015
|
|
|||
|
Long-lived assets:
|
|||||||
|
United States
|
$
|
629,269
|
|
$
|
430,150
|
|
|
|
United Kingdom
|
450
|
|
270
|
|
|||
|
Israel
|
286
|
|
78
|
|
|||
|
$
|
630,005
|
|
$
|
430,498
|
|
||
Note 15.
Quarterly Financial Information (Unaudited)
The following table sets forth the reviewed consolidated quarterly financial information for
2016
and
2015
:
|
|
For the Quarter Ended
|
|
||||||||||||
|
|
March 31,
|
|
June 30, (1)
|
|
September 30,
|
|
December 31,
|
|
Total
|
|
||||
|
Year Ended 2016
|
||||||||||||||
|
Revenue
|
226,824
|
|
233,675
|
|
248,359
|
|
246,763
|
|
955,621
|
|
||||
|
Income from continuing operations
|
7,931
|
|
897
|
|
9,078
|
|
1
|
|
17,907
|
|
||||
|
Net income attributable to Vonage per common share:
|
|
|
|
|
||||||||||
|
Basic net income per share
|
||||||||||||||
|
Basic net income per share-from continuing operations
|
0.04
|
|
—
|
|
0.04
|
|
—
|
|
||||||
|
Diluted net income per share
|
||||||||||||||
|
Diluted net income per share-from continuing operations
|
0.04
|
|
—
|
|
0.04
|
|
—
|
|
||||||
|
For the Quarter Ended
|
|
|||||||||||||
|
March 31,
|
|
June 30, (2)
|
|
September 30, (3)
|
|
December 31,
|
|
Total
|
|
|||||
|
Year Ended 2015
|
||||||||||||||
|
Revenue
|
219,730
|
|
221,858
|
|
223,360
|
|
230,124
|
|
895,072
|
|
||||
|
Income from continuing operations
|
9,849
|
|
8,347
|
|
3,433
|
|
3,406
|
|
25,035
|
|
||||
|
Loss from discontinued operations attributable to Vonage
|
(2,380
|
)
|
—
|
|
—
|
|
—
|
|
(2,380
|
)
|
||||
|
Net income attributable to Vonage
|
7,469
|
|
8,347
|
|
3,433
|
|
3,406
|
|
22,655
|
|
||||
|
Net income attributable to Vonage per common share:
|
||||||||||||||
|
Basic net income per share
|
||||||||||||||
|
Basic net income per share-from continuing operations
|
0.05
|
|
0.04
|
|
0.02
|
|
0.02
|
|
||||||
|
Basic net income per share-from discontinued operations attributable to Vonage
|
(0.01
|
)
|
—
|
|
—
|
|
—
|
|
||||||
|
Basic net income per share-net income attributable to Vonage
|
0.04
|
|
0.04
|
|
0.02
|
|
0.02
|
|
||||||
|
Diluted net income per share
|
||||||||||||||
|
Diluted net income per share-from continuing operations
|
0.04
|
|
0.04
|
|
0.02
|
|
0.01
|
|
||||||
|
Diluted net income per share-from discontinued operations attributable to Vonage
|
(0.01
|
)
|
—
|
|
—
|
|
—
|
|
||||||
|
Diluted net income per share-net income attributable to Vonage
|
0.03
|
|
0.04
|
|
0.02
|
|
0.01
|
|
||||||
(1)
The quarter ended June 30, 2016 includes the impacts of the acquisition of Nexmo, which was completed on June 3, 2016.
(2)
The quarter ended June 30, 2015 includes the impacts of the acquisition of Simple Signal, which was completed on April 1, 2015.
(3)
The quarter ended September 30, 2015 includes the impacts of the acquisition of iCore, which was completed on August 31, 2015.
F-48 VONAGE ANNUAL REPORT 2016
TABLE OF CONTENTS
Part IItem 1. BusinessItem 1A. Risk FactorsItem 1B. Unresolved Staff CommentsItem 2. PropertiesItem 3. Legal ProceedingsItem 4. Mine Safety DisclosuresPart IIItem 5. Market For Registrant S Common Equity, Related Stockholder Matters and Issuer Purchases Of Equity SecuritiesItem 6. Selected Financial DataItem 7. Management S Discussion and Analysis Of Financial Condition and Results Of OperationsNote 10 To Our Consolidated Financial StatementsItem 7A. Quantitative and Qualitative Disclosures About Market RiskItem 8. Financial Statements and Supplementary DataItem 9. Changes in and Disagreements with Accountants on Accounting and Financial DisclosureItem 9A. Controls and ProceduresItem 9B. Other InformationPart IIIItem 10. Directors, Executive Officers and Corporate GovernanceItem 11. Executive CompensationItem 12. Security Ownership Of Certain Beneficial Owners and Management and Related Stockholder MattersItem 13. Certain Relationships and Related Transactions, and Director IndependenceItem 14. Principal Accountant Fees and ServicesPart IVItem 15. Exhibits, Financial Statement SchedulesItem 16. Form 10-k SummaryNote 1. Basis Of Presentation and Significant Accounting PoliciesNote 2. Supplemental Balance Sheet Account InformationNote 3. Goodwill and Intangible AssetsNote 4. Supplemental Income Statement Account InformationNote 5. Income TaxesNote 6. Long-term Debt and Revolving Credit FacilityNote 7. Fair Value Of Financial InstrumentsNote 8. Common StockNote 9. Employee Benefit PlansNote 10. Commitments and ContingenciesNote 11. Acquisition Of BusinessNote 12. Noncontrolling Interest and Redeemable Noncontrolling InterestNote 13. Discontinued OperationsNote 14. Industry Segment and Geographic InformationNote 15. Quarterly Financial Information (unaudited)