VISTA GOLD CORP
10-Ks and 10-Qs
|
|
|
|
|
|
|
|
|
|
|
|
|
|
|
|
|
|
|
|
|
|
|
|
|
|
|
|
|
|
|
|
|
|
|
|
|
|
|
|
|
|
|
|
|
|
|
|
|
|
|
|
|
|
|
|
|
|
|
|
|
|
UNITED STATES
SECURITIES AND EXCHANGE COMMISSION
Washington, D.C. 20549
FORM 10-K
|
x
|
ANNUAL REPORT PURSUANT TO SECTION 13 OR 15(d) OF THE SECURITIES EXCHANGE ACT OF 1934
|
|
|
For the fiscal year ended December 31, 2010
|
||
|
OR
|
||
|
o
|
TRANSITION REPORT PURSUANT TO SECTION 13 OR 15(d) OF THE SECURITIES EXCHANGE ACT OF 1934
|
|
For the transition period from to
Commission file number: 001-9025

VISTA GOLD CORP.
(Exact Name of Registrant as Specified in its Charter)
|
Yukon Territory
|
98-0542444
|
|
|
(State of other jurisdiction of incorporation or organization)
|
(I.R.S. Employer Identification No.)
|
|
|
Suite 5, 7961 Shaffer Parkway
|
||
|
Littleton, Colorado
|
80127
|
|
|
(Address of Principal Executive Offices)
|
(Zip Code)
|
(720) 981-1185
(Registrant’s Telephone Number, including Area Code)
SECURITIES REGISTERED PURSUANT TO SECTION 12(b) OF THE ACT:
|
Title of Each Class
|
Name of Each Exchange on Which Registered
|
|
Common Shares without par value
|
NYSE Amex
|
SECURITIES REGISTERED PURSUANT TO SECTION 12(g) OF THE ACT:
None
Indicate by check mark if the registrant is a well-known seasoned issuer, as defined in Rule 405 of the Securities Act. Yes
o
No
x
Indicate by check mark if the registrant is not required to file reports pursuant to Section 13 or Section 15(d) of the Act. Yes
o
No
x
Indicate by checkmark whether the registrant (1) filed all reports required to be filed by Section 13 or 15(d) of the Securities Exchange Act of 1934 during the preceding 12 months (or for such shorter period that the registrant was required to file such reports), and (2) has been subject to such filing requirements for the past 90 days. Yes
x
No
o
Indicate by check mark whether the Registrant has submitted electronically and posted on its corporate Web site, if any,
every Interactive Data File required to be submitted and posted pursuant to Rule 405 of Regulation S-T (§ 229.405 of this chapter) during the preceding 12 months (or for such shorter period that the registrant was required to submit and post such files). Yes
o
No
o
Indicate by checkmark if disclosure of delinquent filers pursuant to Item 405 of Regulation S-K is not contained herein, and will not be contained, to the best of the registrant’s knowledge, in definitive proxy or information statements incorporated by reference in Part II of this Form 10-K or any amendment to the Form 10-K.
o
Indicate by check mark whether the registrant is a large accelerated filer, an accelerated filer, or a non-accelerated filer. See definition of “Accelerated filer and large accelerated filer” in Rule 12b-2 of the Exchange Act (Check one):
Large Accelerated Filer
o
Accelerated Filer
x
Non-Accelerated Filer
o
Smaller Reporting Company
o
Indicate by check mark whether the registrant is a shell company (as defined in Rule 12b-2 of the Act). Yes
o
No
x
State the aggregate market value of the voting and non-voting common equity held by non-affiliates computed by reference to the price at which the common equity was last sold, or the average bid and asked price of such common equity, as of the last business day of the registrant’s most recently completed second fiscal quarter: $80,000,000
The number of shares of the Registrant’s Common Stock outstanding as of March 14, 2011 was 61,919,752.
Documents incorporated by reference: To the extent herein specifically referenced in Part III, portions of the Registrant’s Definitive Proxy Statement on Schedule 14A for the 2011 Annual General Meeting of Shareholders. See Part III.
|
Page
|
|
| 91 | |
CAUTIONARY NOTE TO U.S. INVESTORS REGARDING ESTIMATES OF MEASURED, INDICATED AND INFERRED RESOURCES AND PROVEN AND PROBABLE RESERVES
The terms “mineral reserve”, “proven mineral reserve” and “probable mineral reserve” are Canadian mining terms as defined in accordance with Canadian National Instrument 43-101—
Standards of Disclosure for Mineral Projects
(“NI 43-101”) and the Canadian Institute of Mining, Metallurgy and Petroleum (the “CIM”)—
CIM Definition Standards on Mineral Resources and Mineral Reserves
, adopted by the CIM Council, as amended (the “CIM Definition Standards”). These definitions differ from the definitions in the United States Securities and Exchange Commission (“SEC”) Industry Guide 7 (“SEC Industry Guide 7”) under the United States Securities Act of 1933, as amended (the “Securities Act”). Under SEC Industry Guide 7 standards, a “final” or “bankable” feasibility study is required to report reserves, the three-year historical average price is used in any reserve or cash flow analysis to designate reserves and the primary environmental analysis or report must be filed with the appropriate governmental authority.
In addition, the terms “mineral resource”, “measured mineral resource”, “indicated mineral resource” and “inferred mineral resource” are defined in and required to be disclosed by NI 43-101; however, these terms are not defined terms under SEC Industry Guide 7 and are normally not permitted to be used in reports and registration statements filed with the SEC. Investors are cautioned not to assume that any part or all of mineral deposits in these categories will ever be converted into reserves. “Inferred mineral resources” have a great amount of uncertainty as to their existence, and great uncertainty as to their economic and legal feasibility. It cannot be assumed that all, or any part, of an inferred mineral resource will ever be upgraded to a higher category. Under Canadian rules, estimates of inferred mineral resources may not form the basis of feasibility or pre-feasibility studies, except in rare cases. Investors are cautioned not to assume that all or any part of an inferred mineral resource exists or is economically or legally mineable. Disclosure of “contained ounces” in a resource is permitted disclosure under Canadian regulations; however, the SEC normally only permits issuers to report mineralization that does not constitute “reserves” by SEC standards as in place tonnage and grade without reference to unit measures.
Accordingly, information contained in this report and the documents incorporated by reference herein contain descriptions of our mineral deposits that may not be comparable to similar information made public by U.S. companies subject to the reporting and disclosure requirements under the United States federal securities laws and the rules and regulations thereunder.
The term “mineralized material” as used in this annual report, although permissible under SEC Industry Guide 7, does not indicate “reserves” by SEC Industry Guide 7 standards. We cannot be certain that any part of the mineralized material will ever be confirmed or converted into SEC Industry Guide 7 compliant "reserves". Investors are cautioned not to assume that all or any part of the mineralized material will ever be confirmed or converted into reserves or that mineralized material can be economically or legally extracted.
CAUTIONARY NOTE TO ALL INVESTORS CONCERNING ECONOMIC ASSESSMENTS THAT INCLUDE INFERRED RESOURCES
Mineral resources that are not mineral reserves have no demonstrated economic viability. The preliminary assessments on the Mt. Todd, Awak Mas, Yellow Pine and Long Valley gold projects are preliminary in nature and include “inferred mineral resources” that are considered too speculative geologically to have economic considerations applied to them that would enable them to be categorized as mineral reserves. There is no certainty that the preliminary assessments at the Mt. Todd, Awak Mas, Yellow Pine and Long Valley gold projects will ever be realized.
“
assay
” means to test ores or minerals by chemical or other methods for the purpose of determining the amount of valuable metals contained.
“
breccia
” means rock consisting of fragments, more or less angular, in a matrix of finer-grained material or of cementing material.
“
claim
” means a mining title giving its holder the right to prospect, explore for and exploit minerals within a defined area.
“
cut-off grade
” means the grade below which mineralized material or ore will be considered waste.
“
deposit
” means an informal term for an accumulation of mineral ores.
“
diamond drill
” means a rotary type of rock drill that cuts a core of rock and is recovered in long, cylindrical sections, two centimeters or more in diameter.
“
fault
” means a fracture in rock along which there has been displacement of the two sides parallel to the fracture.
“
heap leach
” means a gold extraction method that percolates a cyanide solution through ore heaped on an impermeable pad or base.
“
indicated mineral resource
” and “
indicated resource
” means “
indicated mineral resource
” as defined by the Canadian Institute of Mining, Metallurgy and Petroleum in the CIM Definition Standards and is that part of a mineral resource for which quantity, grade or quality, densities, shape and physical characteristics, can be estimated with a level of confidence sufficient to allow the appropriate application of technical and economic parameters, to support mine planning and evaluation of the economic viability of the deposit. The estimate is based on detailed and reliable exploration and testing information gathered through appropriate techniques from locations such as outcrops, trenches, pits, workings and drill holes that are spaced closely enough for geological and grade continuity to be reasonably assumed.
“
inferred mineral resource
” and “
inferred resource
” means “
inferred mineral resource
” as defined by the Canadian Institute of Mining, Metallurgy and Petroleum in the CIM Definition Standards and is that part of a mineral resource for which quantity and grade or quality can be estimated on the basis of geological evidence and limited sampling and reasonably assumed, but not verified, geological and grade continuity. The estimate is based on limited information and sampling gathered through appropriate techniques from locations such as outcrops, trenches, pits, workings and drill holes.
“
measured mineral resource
” and “
measured resources
” means “
measured mineral resource
” as defined by the Canadian Institute of Mining, Metallurgy and Petroleum in the CIM Definition Standards and is that part of a mineral resource for which quantity, grade or quality, densities, shape, physical characteristics are so well established that they can be estimated with confidence sufficient to allow the appropriate application of technical and economic parameters, to support production planning and evaluation of the economic viability of the deposit. The estimate is based on detailed and reliable exploration, sampling and testing information gathered through appropriate techniques from locations such as outcrops, trenches, pits, workings and drill holes that are spaced closely enough to confirm both geological and grade continuity.
“
mineralization
” means the concentration of metals within a body of rock.
“
mineralized material
” under SEC Industry Guide 7 is a mineralized body which has been delineated by appropriately spaced drilling and/or underground sampling to support a sufficient tonnage and average grade of metal(s). Such a deposit does not qualify as a reserve, until a comprehensive evaluation based upon unit cost, grade, recoveries, and other material factors conclude legal and economic feasibility. Mineralized material is equivalent to measured plus indicated mineral resources but does not include inferred mineral resources, which terms are defined by the Canadian Institute of Mining, Metallurgy and Petroleum.
“
ore
” means material containing minerals that can be economically extracted.
“
oxide
” means mineralized rock in which some of the original minerals have been oxidized (
i.e.
, combined with oxygen). Oxidation tends to make the ore more porous and permits a more complete permeation of cyanide solutions so that minute particles of gold in the interior of the minerals will be more readily dissolved.
“
preliminary feasibility study
” as defined by the Canadian Institute of Mining, Metallurgy and Petroleum and by NI 43-101 is a comprehensive study of the viability of a mineral project that has advanced to a stage where the mining method, in the case of underground mining, or the pit configuration, in the case of an open pit, has been established, and where an effective method of mineral processing has been determined. This study must include a financial analysis based on reasonable assumptions of technical, engineering, operating, economic, social and environmental factors and the evaluation of other relevant factors which are sufficient for a qualified person acting reasonably, to determine if all or part of the mineral resource may be classified as a mineral reserve.
“
probable reserves
” under SEC Industry Guide 7 means reserves for which quantity and grade and/or quality are computed from information similar to that used for proven reserves, but the sites for inspection, sampling and measurement are farther apart or are otherwise less adequately spaced. The degree of assurance, although lower than that for proven reserves, is high enough to assume continuity between points of observation.
“
probable mineral reserves
” as defined by the Canadian Institute of Mining, Metallurgy and Petroleum in the CIM Definition Standards is the economically mineable part of an indicated mineral resource and, in some circumstances, a measured mineral resource demonstrated by at least a preliminary feasibility study. This study must include adequate information on mining, processing, metallurgical, economic and other relevant factors that demonstrate, at the time of reporting, that economic extraction is justified.
“
proven reserves
” under SEC Industry Guide 7 means reserves for which (a) quantity is computed from dimensions revealed in outcrops, trenches, workings or drill holes; grade and/or quality are computed from the results of detailed sampling and (b) the sites for inspection, sampling and measurement are spaced so closely and the geologic character is so well defined that size, shape, depth, and mineral content of reserves are well-established.
“
proven mineral reserves
”, as defined by the Canadian Institute of Mining, Metallurgy and Petroleum in the CIM Definition Standards, is the economically mineable part of a measured mineral resource demonstrated by at least a preliminary feasibility study. This study must include adequate information on mining, processing, metallurgical, economic and other relevant factors that demonstrate, at the time of reporting, that economic extraction is justified.
“
qualified person
” as defined under NI 43-101 means an individual who (a) is an engineer or geoscientist with at least five years of experience in mineral exploration, mine development or operation or mineral project assessment, or any combination of these; (b) has experience relevant to the subject matter of the mineral project and the technical report; and (c) is in good standing with a professional association. Note: a professional association is a self-regulatory organization of engineers, geoscientists or both that, among other criteria, requires compliance with the professional standards of competence and ethics established by the organization and has disciplinary powers over its members.
“
recovery
” means that portion of the metal contained in the ore that is successfully extracted by processing, expressed as a percentage.
“
sampling
” means selecting a fractional, but representative, part of a mineral deposit for analysis.
“
sediment
” means solid material settled from suspension in a liquid.
“
stockwork
” means a rock mass interpenetrated by small veins of mineralization.
“
strike
”, when used as a noun, means the direction, course or bearing of a vein or rock formation measured on a level surface and, when used as a verb, means to take such direction, course or bearing.
“
strike length
” means the horizontal dimension of an orebody or zone of mineralization.
“
stripping ratio
” means the ratio of waste to ore in an open pit mine.
“
sulfide
” means a compound of sulfur and some other element.
“
tailings
” means material rejected from a mill after most of the valuable minerals have been extracted.
“
vein
” means a fissure, fault or crack in a rock filled by minerals that have traveled upwards from some deep source.
“
volcaniclastic
” means derived by ejection of volcanic material from a volcanic vent.
“
waste
” means rock lacking sufficient grade and/or other characteristics of ore.
In this annual report, unless the context otherwise requires, the terms “we”, “our”, “Vista”, “Vista Gold” and the “Corporation”, refer to Vista Gold Corp. and its subsidiaries.
Unless otherwise specified, all dollar amounts in this annual report are expressed in United States dollars.
|
To Convert Imperial Measurement Units
|
To Metric Measurement Units
|
Multiply by
|
|
Acres
|
Hectares
|
0.4047
|
|
Feet
|
Meters
|
0.3048
|
|
Miles
|
Kilometers
|
1.6093
|
|
Tons (short)
|
Tonnes
|
0.9071
|
|
Gallons
|
Liters
|
3.7850
|
|
Ounces (troy)
|
Grams
|
31.103
|
|
Ounces (troy) per ton (short)
|
Grams per tonne
|
34.286
|
This annual report, including all exhibits hereto and any documents that are incorporated by reference as set forth on the face page under “Documents incorporated by reference”, contains “forward-looking statements” within the meaning of the
Private Securities Litigation Reform Act of 1995
and forward-looking information under Canadian securities laws, that are intended to be covered by the safe harbor created by such legislation. All statements, other than statements of historical facts, included in this document, our other filings with the SEC and Canadian securities commissions and in press releases and public statements by our officers or representatives, that address activities, events or developments that we expect or anticipate will or may occur in the future are forward-looking statements and forward-looking information, including, but not limited to, such things as those listed below:
|
|
●
|
proposed use of proceeds from our private placement completed in October 2010;
|
|
|
●
|
estimates of future operating and financial performance;
|
|
|
●
|
potential funding requirements and sources of capital;
|
|
|
●
|
the timing, performance and results of feasibility studies;
|
|
|
●
|
timing, plans and anticipated effects of the proposed transfer of our equity interests in Idaho Holdco (as defined in “Part I – Item 1. Business – Subsequent Events”) in exchange for 35% of the shares of Midas Gold Corp., on a fully diluted basis, following completion of the transaction;
|
|
|
●
|
timing and receipt of required land use, environmental and other permits for the Concordia gold project and timing for completion of drilling and testing programs at the Concordia gold project;
|
|
|
●
|
results of the drilling program and other test results at the Concordia gold project;
|
|
|
●
|
timing and outcome for the amendment to our application for the Change of Forest Land Use Permit (“CUSF”) for the Concordia gold project and the anticipated re-filing of the application with the Mexican Secretariat of the Environment and Natural Resources (“SEMARNAT”);
|
|
|
●
|
our belief that SEMARNAT’s comments on our CUSF application are without legal merit or beyond the scope of SEMARNAT’s legal authority;
|
|
|
●
|
our strategy for advancement of the permitting process for the Concordia gold project including the possible court challenge to SEMARNAT’s notice;
|
|
|
●
|
plans to purchase remaining surface land or obtain rights-of-way required for the Concordia gold project;
|
|
|
●
|
capital and operating cost estimates for the Concordia gold project, and anticipated timing for the commencement of construction at the Concordia gold project;
|
|
|
●
|
plans for evaluation of the Mt. Todd gold project;
|
|
|
●
|
preliminary assessment and preliminary feasibility study results and plans for a definitive feasibility study at the Mt. Todd gold project;
|
|
|
●
|
production estimates and timing for gold production at the Concordia gold project and the Mt. Todd gold project;
|
|
|
●
|
potential for gold production at the Amayapampa gold project, timing and receipt of future payments in connection with the disposal of the Amayapampa gold project and status of legal proceedings in Bolivia;
|
|
|
●
|
future gold prices;
|
|
|
●
|
future business strategy, competitive strengths, goals and expansion and growth of our business;
|
|
|
●
|
our potential status as a producer;
|
|
|
●
|
plans and estimates concerning potential project development, including matters such as schedules, estimated completion dates and estimated capital and operating costs;
|
|
|
●
|
plans and proposed timetables for exploration programs and estimates of exploration expenditures;
|
|
|
●
|
estimates of mineral reserves and mineral resources;
|
|
|
●
|
potential joint venture and partnership strategies in relation to our properties; and
|
|
|
●
|
future share and warrant prices and valuation for the Corporation and for marketable securities held by us.
|
The words “estimate”, “plan”, “anticipate”, “expect”, “intend”, “believe”, “will”, “may” and similar expressions are intended to identify forward-looking statements and forward-looking information. These statements involve known and unknown risks, uncertainties, assumptions and other factors which may cause our actual results, performance or achievements to be materially different from any results, performance or achievements expressed or implied by such forward-looking statements and information. These factors include risks such as:
|
|
●
|
our likely status as a PFIC for U.S. federal tax purposes;
|
|
|
●
|
feasibility study results and preliminary assessment results and the estimates on which they are based;
|
|
|
●
|
economic viability of a deposit;
|
|
|
●
|
anticipated consequences of the transactions (the “Combination”) contemplated by the Combination Agreement (as defined in “Part I – Item 1. Business – Subsequent Events”);
|
|
|
●
|
our ability to complete the proposed Combination (including obtaining any shareholder or other third party approvals);
|
|
|
●
|
delays in commencement of construction on the Concordia gold project;
|
|
|
●
|
status of our required governmental permits for the Concordia gold project;
|
|
|
●
|
the amendment and re-filing of our CUSF application and the uncertainty regarding SEMARNAT’s review of our amended CUSF application;
|
|
|
●
|
uncertainty regarding potential court action against SEMARNAT in relation to the dismissal of our CUSF application and risks related to the outcome of such court action, including failure to receive approval of the CUSF application, uncertainty regarding our legal challenges to SEMARNAT’s issues with our CUSF application and SEMARNAT’s authority in reviewing our CUSF application;
|
|
|
●
|
political factors influencing the approval of our CUSF application;
|
|
|
●
|
possible impairment or write-down of the carrying value of the Concordia gold project if the CUSF is not granted;
|
|
|
●
|
increased costs that affect our financial condition;
|
|
|
●
|
a shortage of equipment and supplies;
|
|
|
●
|
whether our acquisition, exploration and development activities will be commercially successful;
|
|
|
●
|
fluctuations in the price of gold;
|
|
|
●
|
inherent hazards of mining exploration, development and operating activities;
|
|
|
●
|
calculation of mineral reserves, mineral resources and mineralized material and the fluctuations thereto based on metal prices, inherent vulnerability of the ore and recoverability of metal in the mining process;
|
|
|
●
|
environmental regulations to which our exploration and development operations are subject;
|
|
|
●
|
our receipt of future payments in connection with our disposal of the Amayapampa gold project;
|
|
|
●
|
intense competition in the mining industry;
|
|
|
●
|
our potential inability to raise additional capital on favorable terms, if at all;
|
|
|
●
|
conflicts of interest of some of our directors as a result of their involvement with other natural resource companies;
|
|
|
●
|
potential challenges to our title to our mineral properties;
|
|
|
●
|
political and economic instability in Mexico and Indonesia;
|
|
|
●
|
fluctuation in foreign currency values;
|
|
|
●
|
trading price of our securities and our ability to raise funds in new share offerings due to future sales of our Common Shares in the public or private market and our ability to raise funds from the exercise of our Warrants;
|
|
|
●
|
difficulty in bringing actions or enforcing judgments against us and certain of our directors or officers outside of the United States;
|
|
|
●
|
acquisitions and integration issues;
|
|
|
●
|
potential negative impact of the issuance of additional Common Shares on the trading price of our securities;
|
|
|
●
|
fluctuation in the price of our securities;
|
|
|
●
|
the lack of dividend payments by us;
|
|
|
●
|
future joint ventures and partnerships relating to our properties;
|
|
|
●
|
our lack of recent production and limited experience in producing;
|
|
|
●
|
reclamation liabilities, including reclamation requirements at the Mt. Todd gold project;
|
|
|
●
|
our historical losses from operations;
|
|
|
●
|
historical production not being indicative of potential future production;
|
|
|
●
|
water supply issues;
|
|
|
●
|
governmental authorizations and permits;
|
|
|
●
|
environmental lawsuits;
|
|
|
●
|
lack of adequate insurance to cover potential liabilities;
|
|
|
●
|
our ability to retain and hire key personnel;
|
|
|
●
|
recent market events and conditions; and
|
|
|
●
|
general economic conditions.
|
For a more detailed discussion of such risks and other important factors that could cause actual results to differ materially from those in such forward-looking statements and forward-looking information please see “Item 1A. Risk Factors” below in this annual report on Form 10-K. Although we have attempted to identify important factors that could cause actual results to differ materially from those described in forward-looking statements and forward-looking information, there may be other factors that cause results not to be as anticipated, estimated or intended. There can be no assurance that these statements will prove to be accurate as actual results and future events could differ materially from those anticipated in the statements. Except as required by law, we assume no obligation to publicly update any forward-looking statements and forward-looking information, whether as a result of new information, future events or otherwise.
Overview
Vista Gold is currently engaged in the evaluation, acquisition, exploration and advancement of gold exploration and potential development projects. Historically, our approach to acquisitions of gold projects has generally been to seek projects within political jurisdictions with well established mining, land ownership and tax laws, which have adequate drilling and geological data to support the completion of a third-party review of the geological data and to complete an estimate of the mineralized material (mineral resources under Canadian guidelines) and/or mineral reserves. In addition, we look for opportunities to improve the value of our gold projects including through exploration drilling and re-engineering the operating assumptions underlying previous engineering work.
Beginning in 2007, our board of directors and management decided to take on a new direction regarding our more advanced gold projects. We plan to move our more advanced projects forward through advanced and pre-feasibility studies, so production decisions can be made on those projects.
Currently, our holdings include the Concordia (formerly known as the Paredones Amarillos) gold project in Mexico; the Mt. Todd gold project in Australia; the Guadalupe de los Reyes gold project in Mexico; the Yellow Pine gold project in Idaho; the Awak Mas gold project in Indonesia; the Long Valley gold project in California; and mining claims in Utah. We also own approximately 25% of the shares of Zamora Gold Corp., a company exploring for gold in Ecuador. Additional information about these projects is available under the section heading “Item 2. Properties,” below.
We do not produce gold and do not currently generate operating earnings. Through fiscal 2010, funding to acquire and explore gold properties and to operate the Corporation has been acquired through equity and debt financings consisting of private placements of equity units consisting of Common Shares and warrants to purchase Common Shares, public offerings of our Common Shares and, in March 2008, a brokered private placement of convertible notes. We expect to continue to raise capital through additional equity and/or debt financings, and through the exercise of stock options and warrants. We anticipate raising funds for interim financing needs through various bridge loan or convertible debt alternatives.
Vista Gold Corp. was originally incorporated on November 28, 1983 under the name “Granges Exploration Ltd.”. In November 1983, Granges Exploration Ltd. acquired all the mining interests of Granges AB in Canada. On June 28, 1985, Granges Exploration Ltd. and Pecos Resources Ltd. amalgamated under the name “Granges Exploration Ltd.” and on June 9, 1989, Granges Exploration Ltd. changed its name to “Granges Inc.”. On May 1, 1995, Granges Inc. and Hycroft Resources & Development Corporation were amalgamated under the name “Granges Inc.”. Effective November 1, 1996, Granges Inc. and Da Capo Resources Ltd. amalgamated under the name “Vista Gold Corp.”. Effective December 17, 1997, Vista Gold was continued from British Columbia to the Yukon Territory, Canada under the
Business Corporations Act
(Yukon Territory). On September 22, 2006, we entered into an arrangement and merger agreement (the “Arrangement Agreement”) with Allied Nevada Gold Corp. (“Allied”), Carl Pescio and Janet Pescio (collectively, the “Pescios”), pursuant to which our Nevada-based mining properties and related assets were transferred to Allied, and the Pescios’ interests in certain Nevada-based mining properties and related assets were transferred to Allied. Completion of the transaction occurred on May 10, 2007. The current addresses, telephone and facsimile numbers of the offices of the Corporation are:
|
Executive Office
|
Registered and Records Office
|
|
Suite 5 - 7961 Shaffer Parkway
Littleton, Colorado, USA 80127
Telephone: (720) 981-1185
Facsimile: (720) 981-1186
|
200 - 204 Lambert Street
Whitehorse, Yukon Territory, Canada Y1A 3T2
Telephone: (867) 667-7600
Facsimile: (867) 667-7885
|
Employees
As of December 31, 2010, we had 31 full-time employees, ten of whom were employed at our executive office in Littleton, Colorado, 13 of whom were employed at the Concordia project and eight of whom were employed at our Mt. Todd gold project. We use consultants with specific skills to assist with various aspects of our project evaluation, due diligence, corporate governance and property management.
Segment Information
Segment information relating to the Corporation is provided in Note 19 to our Consolidated Financial Statements under the section heading “Item 8. Financial Statements and Supplementary Data” below.
Significant Developments in 2010
|
|
·
|
On December 7, 2010, we announced that we entered into a letter of intent with Midas Gold, Inc., a privately held company based in Spokane Valley, Washington (“Midas”), for the combination of the respective holdings of Vista Gold and Midas in the Yellow Pine – Stibnite Mining District located in Valley County, Idaho. See section heading “Item 2. Properties – Yellow Pine, Idaho” below.
|
|
|
·
|
On October 22, 2010, we announced that we had closed our private placement of Special Warrants. We issued an aggregate of 14,666,739 Special Warrants for gross proceeds of approximately $33.7 million. The proceeds from the financing were placed into an escrow account and, upon receipt of approval of the private placement of Special Warrants by our shareholders on December 15, 2010, were released to us.
|
|
|
·
|
In 2010, we undertook two drilling programs consisting of 15 core holes and six reverse circulation drill holes totaling 9,017 meters at the Batman deposit at our Mt. Todd gold project designed to add resources through in-fill drilling, test possible extensions and to provide core for metallurgical testing. See the section heading “Item 2. Properties – Mt. Todd, Northern Territory, Australia” below.
|
|
|
·
|
On September 8, 2010, we announced a mineral resource estimate for the Quigleys deposit at our Mt. Todd gold project. See the section heading “Item 2. Properties – Mt. Todd, Northern Territory, Australia” below.
|
|
|
·
|
On September 7, 2010, we announced that we had changed the name of our wholly-owned Paredones Amarillos gold project to the Concordia gold project (“Concordia” means “agreement” or “oneness”). We believe this will better reflect the integration of the project with the environmental, social and economic priorities of the region. See the section heading “Item 2. Properties – Concordia (formerly Paredones Amarillos) gold project, Baja California Sur, Mexico” below.
|
|
|
·
|
On August 8, 2010, we announced the positive results of a preliminary feasibility study (“PFS”) for the Batman
|
|
|
deposit at Mt. Todd. The PFS was constrained to consider tailings from mineral reserves that could be accommodated by the existing tailings storage capacity of 60 million tonnes. See the section heading “Item 2. Properties – Mt. Todd, Northern Territory, Australia” below.
|
|
|
·
|
On July 19, 2010, we announced an update on the Concordia gold project concerning the status of our CUSF application, technical programs in progress, and a general overview of the development of the project. See the section heading “Item 2. Properties – Concordia (formerly Paredones Amarillos) gold project, Baja California Sur, Mexico” below.
|
|
|
·
|
On June 29, 2010, we announced that we were testing four new exploration targets identified by us at our Mt. Todd gold project through additional soil and rock-chip sampling and testing, followed, where appropriate, by drilling. Four core holes were completed at one target prior to the onset of the wet season. See the section heading “Item 2. Properties – Mt. Todd, Northern Territory, Australia” below.
|
|
|
·
|
On May 20, 2010, we entered into a Notes Repurchase Agreement whereby we agreed to repurchase Notes in the principal amount of $5.667 million and interest payable through maturity of $0.7 million. See Item 7. Consolidated Financial Statements – Note 7.
|
|
|
·
|
On February 19, 2010, we announced that SEMARNAT had dismissed our application on administrative grounds for the CUSF at the Concordia (formerly Paredones Amarillos) gold project. We have been aggressively trying to rectify this turn of events and hope to be in a position to submit a new CUSF application. The timing for completion of these types of bureaucratic processes is uncertain and at this time it is not possible to provide an estimate of timing for the filing of the new CUSF application.. See the section heading “Item 2. Properties – Concordia (formerly Paredones Amarillos) gold project, Baja California Sur, Mexico” below.
|
Payments on Properties
Through the use of cash and equity units, consisting of our Common Shares and warrants to purchase Common Shares, as consideration, we continued our effort to build a portfolio of gold projects through a strategy that includes evaluation, acquisition and exploration of gold exploration and potential development projects with the aim of adding value to the projects. In addition, we continued our efforts to improve the value of our gold projects through exploration drilling and re-engineering the operating assumptions underlying previous engineering work. We continued with remaining scheduled payments on the Yellow Pine gold project. These payments are described under the section heading “Item 2. Properties” below. We are current with all our payment obligations.
Subsequent Events
Vista Australia Preliminary Feasibility Study
On January 4, 2011, we announced the positive results of a new PFS for the Batman deposit at our Mt. Todd gold project designed to process all economic mineralization and store tailings in the existing tailings facility and the excess in a new tailings facility. Processing would be at a significantly higher daily rate than that used in the PFS announced in August 2010. See the section heading “Item 2. Properties – Mt. Todd Northern Territory, Australia” below.
Combination Agreement with Midas Gold
On February 23, 2011, Vista Gold and Midas announced that Midas and certain of Vista’s U.S. subsidiaries had executed a combination agreement (the “Combination Agreement”) whereby each party to the Combination Agreement will contribute their respective Idaho gold assets to Midas Gold Corp., a new Canadian private company (“Midas Gold”). If the transaction is approved by the shareholders of Midas, and all other conditions to the transaction are satisfied or waived, Midas Gold will be owned, on a fully diluted basis, 65% by shareholders of Midas and 35% by Vista following the completion of the Combination.
The reorganization of the ownership of the Stibnite-Yellow Pine gold district will be effected pursuant to the Combination Agreement among Midas, Midas Gold, Vista’s wholly-owned subsidiary, Vista Gold U.S. Inc., a Delaware corporation (“Vista US”) and its wholly owned subsidiary, Idaho Gold Resources, LLC, an Idaho limited liability company (“Idaho Gold”), assuming the plan of share exchange, which forms part of the transaction, is approved by the shareholders of Midas and all of the other conditions to the closing of the Combination are satisfied or waived. Pursuant to the Combination Agreement, Midas will hold a special meeting of its shareholders (the “Special Meeting”). The purpose of the Special Meeting is to consider and approve a plan of share exchange (the “Plan of Share Exchange”) between Midas and Midas Gold pursuant to which Midas’ outstanding shares of common stock (the “Midas Shares”) and outstanding options (the “Midas Options”), other than Midas Shares held by dissenting shareholders, will be exchanged for common shares and options of Midas Gold (the “Midas Gold Shares” and “Midas Gold Options”, respectively), with the result that Midas will become a wholly-owned subsidiary of Midas Gold. Midas Shareholders holding at least 66-2/3% of the issued and outstanding Midas Shares must vote in favor of the Plan of Share Exchange at the Special Meeting and dissenters' appraisal rights shall not be exercised with respect to more than 5% of the outstanding Midas Shares.
The Plan of Share Exchange is part of a broader, integrated transaction undertaken pursuant to the terms of the Combination Agreement, pursuant to which, if the Plan of Share Exchange is approved at the Special Meeting and the other conditions to closing specified in the Combination Agreement are satisfied or waived:
|
|
·
|
Vista US will: (a) organize Idaho Gold Holding Company, as a wholly-owned Idaho corporation (“Idaho Holdco”); (b) contribute its equity interests in Idaho Gold to Idaho Holdco; and (c) at closing, contribute all of the issued and outstanding shares of common stock of Idaho Holdco to Midas Canada as a capital contribution, in exchange for that number of Midas Gold Shares equal to, on a fully diluted basis, thirty-five percent (35%) of the Midas Gold Shares that are issued and outstanding at the time the transactions specified in the Combination Agreement and the Plan of Exchange are completed;
|
|
|
·
|
The shareholders of Midas, other than any dissenting shareholders, will contribute their Midas Shares to Midas Gold in exchange for that number of Midas Gold Shares equal to, on a fully diluted basis, sixty-five percent (65%) of the Midas Gold Shares that are issued and outstanding at the time the transactions specified in the Combination Agreement and the Plan of Share Exchange are completed; and
|
|
|
·
|
The holders of Midas Options will exchange their Midas Options for Midas Gold Options of like tenor. Additionally, as a condition to closing the Combination, Vista US and each officer, director, and holder of 5% or greater of the Midas Shares (the “Midas Affiliates”) have entered into lock up agreements (the “Lock Up Agreements”) and voting support agreements (the “Voting Agreements”). Pursuant to the Lock Up Agreements, Vista US and each of the Midas Affiliates have agreed that their respective Midas Canada Shares will not be transferable except in specific circumstances and for a specific period of time. Pursuant to the Voting Agreements, Vista US has, amongst other items, agreed, for a specified period of time, to vote in favor of the nominees to the Midas Canada board of directors as designated by the nominating and corporate governance committee, or similar committee, of Midas Canada and the Midas Affiliates have, amongst other items, agreed, for a specified period of time, to vote in favor of the Combination and for the nominee to the Midas Canada board of directors as designated by Vista US.\
|
We expect the Combination to be completed following the Special Meeting on or about April 1, 2011. As part of the Combination, Idaho Holdco and Midas Gold will become wholly-owned subsidiaries of Midas Canada. The individual steps of the Combination are intended by the parties involved to constitute a single, integrated transaction which qualifies as a tax deferred roll-over for United States and Canadian shareholders.
Listing of Warrants on
the
TSX
On March 2, 2011, we announced that the 15,308,044 warrants issued on December 15, 2010 in connection with our private placement of Special Warrants, began trading March 1, 2011 on the TSX under the symbol VGZ.WT.U (subsequently changed to VGZ.WT.S on March 14, 2011).
The Warrants are freely tradable in Canada, except to, or for the account or benefit, of any U.S. person (as defined in Regulation S under the Securities Act). Neither the Warrants nor the common shares issuable upon exercise of the Warrants (the “Warrant Shares”) have been registered under the Securities Act, or any state securities laws of any state of the United States. Accordingly, the Warrants and the Warrant Shares may not be offered or sold in the United States or to, or for the account or benefit of, any U.S. person (as defined in Regulation S under the Securities Act) or any person in the United States absent registration under the Securities Act or an applicable exemption from such registration requirements and in accordance with all applicable state securities laws of any state of the United States. Purchasers of the Warrants or the Warrant Shares may not engage in hedging transactions with regard to the Warrants or the Warrant Shares unless in compliance with the Securities Act.
Repayment of Notes
On March 7, 2011, we announced that we repaid our $23,000,000 principal amount of our senior secured convertible notes (the "Notes") (plus accrued interest) which matured on March 4, 2011.
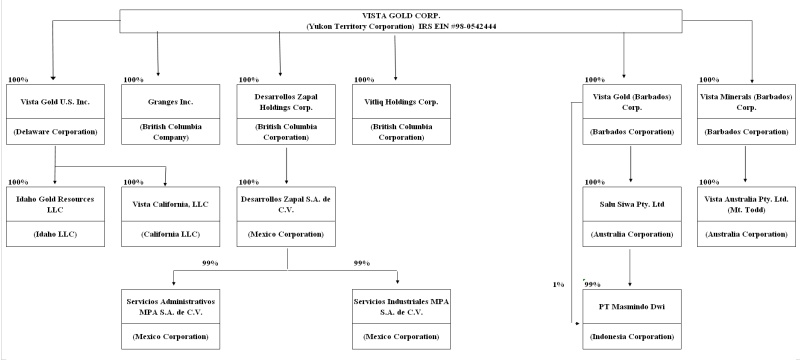
Corporate Organization Chart
The name, place of incorporation, continuance or organization, and percent of voting securities owned or controlled by Vista Gold as of March 14, 2011, for each of its subsidiaries is set out below.
Property Interests and Mining Claims
In the United States, our exploration activities are conducted in California, Idaho and Utah. Mineral interests may be owned in these states by (a) the United States, (b) the state itself, or (c) private parties. Where prospective mineral properties are owned by private parties, or by the state, some type of property acquisition agreement is necessary in order for us to explore or develop the property. Generally, these agreements take the form of long term mineral leases under which we acquire the right to explore and develop the property in exchange for periodic cash payments during the exploration and development phase and a royalty, usually expressed as a percentage of gross production or net profits derived from the leased properties if and when mines on the properties are brought into production. Other forms of acquisition agreements are exploration agreements coupled with options to purchase and joint venture agreements. Where prospective mineral properties are held by the United States, mineral rights may be acquired through the location of unpatented mineral claims upon unappropriated federal land. If the statutory requirements for the location of a mining claim are met, the locator obtains a valid possessory right to develop and produce minerals from the claim. The right can be freely transferred and, provided that the locator is able to prove the discovery of locatable minerals on the claims, is protected against appropriation by the government without just compensation. The claim locator also acquires the right to obtain a patent or fee title to his claim from the federal government upon compliance with certain additional procedures.
Mining claims are subject to the same risk of defective title that is common to all real property interests. Additionally, mining claims are self-initiated and self-maintained and therefore, possess some unique vulnerabilities not associated with other types of property interests. It is impossible to ascertain the validity of unpatented mining claims solely from an examination of the public real estate records and, therefore, it can be difficult or impossible to confirm that all of the requisite steps have been followed for location and maintenance of a claim. If the validity of a patented mining claim is challenged by the U.S. Bureau of Land Management or the U.S. Forest Service on the grounds that mineralization has not been demonstrated, the claimant has the burden of proving the present economic feasibility of mining minerals located thereon. Such a challenge might be raised when a patent application is submitted or when the government seeks to include the land in an area to be dedicated to another use.
Reclamation
We generally are required to mitigate long-term environmental impacts by stabilizing, contouring, re-sloping and revegetating various portions of a site after mining and mineral processing operations are completed. These reclamation efforts are conducted in accordance with detailed plans, which must be reviewed and approved by the appropriate regulatory agencies.
Government Regulation
Our mining operations and exploration activities are subject to various national, state, provincial and local laws and regulations in the United States, Mexico, Australia, Indonesia and other jurisdictions, which govern prospecting, development, mining, production, exports, taxes, labor standards, occupational health, waste disposal, protection of the environment, mine safety, hazardous substances and other matters. We have obtained or have pending applications for those licenses, permits or other authorizations currently required to conduct our exploration and other programs. We believe that we are in compliance in all material respects with applicable mining, health, safety and environmental statutes and the regulations passed thereunder in the United States, Mexico, Indonesia, Australia and the other jurisdictions in which we operate. There are no current orders or directions relating to us with respect to the foregoing laws and regulations. For a more detailed discussion of the various government laws and regulations applicable to our operations and potential negative affects of these laws and regulations please see the section heading “Item 1A.—Risk Factors” below.
Environmental Regulation
Our gold projects are subject to various federal, state and local laws and regulations governing protection of the environment. These laws are continually changing and, in general, are becoming more restrictive. Our policy is to conduct business in a way that safeguards public health and the environment. We believe that our operations are conducted in material compliance with applicable laws and regulations.
Changes to current local, state or federal laws and regulations in the jurisdictions where we operate could require additional capital expenditures and increased operating and/or reclamation costs. Although we are unable to predict what additional legislation, if any, might be proposed or enacted, additional regulatory requirements could impact the economics of our projects.
During 2010, there were no material environmental incidents or material non-compliance with any applicable environmental regulations. We estimate that we will not incur material capital expenditures for environmental control facilities during the current fiscal year.
Mine Safety and Health Administration Regulations
We consider health, safety and environmental stewardship to be a core value for the Corporation.
Our U.S. exploration properties are subject to regulation by the Federal Mine Safety and Health Administration (“MSHA”) under the
Federal Mine Safety and Health Act of 1977
(the “Mine Act”). Pursuant to Section 1503(a) of the recently enacted Dodd-Frank Wall Street Reform and Consumer Protection Act (The “Dodd-Frank Act”), issuers that are operators, or that have a subsidiary that is an operator, of a coal or other mine in the United States are required to disclose in their periodic reports filed with the SEC information regarding specified health and safety violations, orders and citations, related assessments and legal actions, and mining-related fatalities. During the fiscal year ended December 31, 2010, we had no such specified health and safety violations, orders or citations, related assessments or legal actions, mining-related fatalities, or similar events in relation to our United States operations requiring disclosure pursuant to Section 1503(a) of the Dodd-Frank Act.
Competition
We compete with other mining companies in connection with the acquisition, exploration, financing and development of gold properties. There is competition for the limited number of gold acquisition and exploration opportunities, some of which is with other companies having substantially greater financial resources than we have. As a result, we may have difficulty acquiring attractive gold projects at reasonable prices. We also compete with other mining companies for mining engineers, geologists and other skilled personnel in the mining industry and for exploration and development equipment.
We believe no single company has sufficient market power to affect the price or supply of gold in the world market.
Gold Price History
The price of gold is volatile and is affected by numerous factors all of which are beyond our control such as the sale or purchase of gold by various central banks and financial institutions, inflation, recession, fluctuation in the relative values of the U.S. dollar and foreign currencies, changes in global and regional gold demand, and the political and economic conditions of major gold-producing countries throughout the world.
The following table presents the high, low and average afternoon fixed prices in U.S. dollars for gold per ounce on the London Bullion Market over the past five years:
|
Year
|
High
|
Low
|
Average
|
|||||||||
|
2006
|
725 | 525 | 603 | |||||||||
|
2007
|
841 | 608 | 695 | |||||||||
|
2008
|
1,011 | 713 | 872 | |||||||||
|
2009
|
1,213 | 810 | 972 | |||||||||
|
2010
|
1,421 | 1,058 | 1,225 | |||||||||
|
2011 (to March 11)
|
1,437 | 1,319 | 1,375 | |||||||||
|
|
Data Source:
www.kitco.com
|
Seasonality
During winter, the Yellow Pine gold project is inaccessible due to snowfall. No other properties are subject to restrictions on our operations due to seasonality.
Available Information
We make available, free of charge, on or through our Internet website, at
www.vistagold.com
our annual report on Form 10-K, our quarterly reports on Form 10-Q and our current reports on Form 8-K and amendments to those reports filed or furnished pursuant to Section 13(a) or 15(d) of the U.S. Securities Exchange Act of 1934. Our Internet website and the information contained therein or connected thereto are not intended to be, and are not incorporated into this annual report on Form 10-K.
An investment in our securities involves a high degree of risk. The risks described below are not the only ones facing our company or otherwise associated with an investment in our securities. Additional risks not presently known to us or which we currently consider immaterial may also adversely affect our business. We have attempted to identify the major factors that could cause differences between actual and planned or expected results, and have attempted to include all material risk factors. If any of the following risks actually happen, our business, financial condition and operating results could be materially adversely affected.
Feasibility study results and preliminary assessment results are based on estimates that are subject to uncertainty
.
Feasibility studies are used to determine the economic viability of a deposit, as are pre-feasibility studies and preliminary assessments. Feasibility studies are the most detailed and reflect a higher level of confidence in the reported capital and operating costs. Generally accepted levels of confidence are plus or minus 15% for feasibility studies, plus or minus 25-30% for pre-feasibility studies and plus or minus 35-40% for preliminary assessments. These levels reflect the levels of confidence that exist at the time the study is completed. While these studies are based on the best information available to us for the level of study, we cannot be certain that actual costs will not significantly exceed the estimated cost. While Vista incorporates what it believes is an appropriate contingency factor in cost estimates to account for this uncertainty, there can be no assurance that the contingency factor is adequate.
The economic viability of a mineral deposit is based on many factors that are subject to uncertainty.
Many factors are involved in the determination of the economic viability of a mineral deposit, including the achievement of satisfactory mineral reserve estimates, the level of estimated metallurgical recoveries, capital and operating cost estimates and estimates of future gold prices. Resource estimates are based on the assay results of many intervals from many drill holes and the interpolation of those results between holes. There is no certainty that metallurgical recoveries obtained in bench scale or pilot plant scale tests will be achieved in commercial operations. Capital and operating cost estimates are based upon many factors, including anticipated tonnage and grades of ore to be mined and processed, the configuration of the orebody, ground and mining conditions, expected recovery rates of the gold from the ore and anticipated environmental and regulatory compliance costs. Each of these factors involves uncertainties and as a result, we cannot give any assurance that our development or exploration projects will become operating mines. Further, it may take many years from the initial phase of drilling before production is possible and, during that time, the economic feasibility of exploiting a discovery may change as the result of changing commodity and supply costs. If a mine is developed, actual operating results may differ from those anticipated in a feasibility study.
We require certain governmental authorizations and permits for our business, including our development plans and operating activities. We could incur substantial costs or disruptions to our business if we cannot obtain, renew or maintain the necessary authorizations and permits.
A major risk inherent in our business is the requirement to obtain authorizations and permits from governmental authorities. Delays in obtaining authorizations or permits, failure to obtain an authorization or permit or receipt of an authorization or permit with unreasonable conditions or costs could have a material adverse effect on our ability to develop one or more of our gold projects, including, but not limited to, the Concordia and Mt. Todd gold projects. The failure to obtain necessary permits could result in an impairment and write down of the carrying value of our projects.
We are awaiting receipt of certain permits needed before construction can begin on the Concordia gold project. We may experience delays in the commencement of construction on the Concordia gold project due to delays in receiving the required permits. There can be no assurance whether or when construction at the Concordia gold project will commence. If we are unable to acquire the required permits to mine the Concordia gold project, then we will not have mineral reserves under SEC Industry Guide 7 or NI 43-101, which could result in an impairment and write down of the carrying value of the project.
Likewise, as we proceed with development at the Mt. Todd gold project, if we fail to acquire the necessary permits, then we will not have mineral reserves under SEC Industry Guide 7 or NI 43-101, which could result in an impairment and write down of the carrying value of the project.
There may be delays in commencement of construction on the Concordia gold project.
Delays in commencement of construction could result from delays in receiving the required governmental permits including the CUSF, or other permits related to the construction of the desalination plant, pipeline, power line, or widening of the public access road, or from factors such as availability and performance of engineering and construction contractors, suppliers and consultants, availability of required equipment and receipt of required governmental approvals. Any delay in the performance of any one or more of the contractors, suppliers, consultants or other persons on which we depend, or lack of availability of required equipment, or delay or failure to receive required governmental approvals, could delay or prevent commencement of construction on the Concordia gold project. There can be no assurance whether or when construction at the Concordia gold project will commence or that the necessary personnel, equipment or supplies will be available to us if and when construction is commenced. If we are unable to acquire permits to mine the property, then we will have no reserves under U.S. Industry Guide 7 and NI 43-101, which could result in an impairment and write-down of the carrying value of the project.
There may be delays in obtaining the CUSF for the Concordia gold project
Our initial CUSF application was dismissed on administrative grounds by SEMARNAT. Specifically, SEMARNAT dismissed the CUSF application, without a review of its substantive merit, for the alleged failure by our Mexican subsidiary, Desarrollos Zapal S.A. de C.V., to provide certain information and satisfy procedural requirements. We are currently working to clarify SEMARNAT’s specific requirements. We intend to make the appropriate amendments and re-file a new CUSF application. The CUSF is required before we can commence construction of the Concordia gold project. Amending and resubmitting the CUSF application for review by SEMARNAT will cause unknown delays in the commencement of the Concordia gold project. There are many variables and uncertainties involved throughout the CUSF application approval process which could further delay the application and therefore further delay commencement of the Concordia gold project.
Failure to secure permits for the Concordia gold project could negatively impact our mineral reserves.
We have not received all of the governmental permits for the Concordia gold project. After dismissal for administrative reasons of our CUSF application, we intend to make the appropriate amendments and re-file a new CUSF application. However, there are many variables and uncertainties involved throughout the CUSF approval process and approval is not guaranteed. If we are unable to secure a CUSF, Mexican law will prohibit us from mining the Concordia gold project and, accordingly, we will have no reserves at the Concordia gold project under SEC Industry Guide 7 and NI 43-101, which could result in an impairment and write-down of the carrying value of the project.
Increased costs could affect our financial condition.
We anticipate that costs at our projects including the Concordia gold project, Mt. Todd gold project and our Awak Mas gold project as well as other properties that we may explore or develop, will frequently be subject to variation from one year to the next due to a number of factors, such as changing ore grade, metallurgy and revisions to mine plans in response to the physical shape and location of the ore body. In addition, costs are affected by the price of commodities such as fuel and electricity. Such commodities are at times subject to volatile price movements, including increases that could make production at certain operations less profitable. A material increase in costs at any significant location could have a significant effect on our profitability and could result in an impairment charge.
A shortage of equipment and supplies could adversely affect our ability to operate our business.
We are dependent on various supplies and equipment to carry out our mining exploration and development operations. The shortage of such supplies, equipment and parts could have a material adverse effect on our ability to carry out our operations and therefore limit or increase the cost of production.
We cannot be certain that our acquisition, exploration and development activities will be commercially successful.
We currently have no properties that produce gold in commercial quantities. Substantial expenditures are required to acquire existing gold properties, to establish mineral reserves through drilling and analysis, to develop metallurgical processes to extract metal from the ore and, in the case of new properties, to develop the mining and processing facilities and infrastructure at any site chosen for mining. We cannot be assured that any mineral reserves or mineralized material (mineral resources under Canadian guidelines) acquired or discovered will be in sufficient quantities to justify commercial operations or that the funds required for development can be obtained on a timely basis.
Acquisitions and integration issues may expose us to risks.
Our business strategy includes making targeted acquisitions. Any acquisition that we make may be of a significant size, may change the scale of our business and operations, and may expose us to new geographic, political, operating, financial and geological risks. Our success in our acquisition activities depends on our ability to identify suitable acquisition candidates, negotiate acceptable terms for any such acquisition and integrate the acquired operations successfully with our operations. Any acquisitions would be accompanied by risks. For example, there may be significant decreases in commodity prices after we have committed to complete the transaction and have established the purchase price or exchange ratio; a material ore body may prove to be below expectations; we may have difficulty integrating and assimilating the operations and personnel of any acquired companies, realizing anticipated synergies and maximizing the financial and strategic position of the combined enterprise and maintaining uniform standards, policies and controls across the organization; the integration of the acquired business or assets may disrupt our ongoing business and our relationships with employees, customers, suppliers and contractors; and the acquired business or assets may have unknown liabilities which may be significant. If we choose to use equity securities as consideration for such an acquisition, existing shareholders may suffer dilution. Alternatively, we may choose to finance any such acquisition with our existing resources. There can be no assurance that we would be successful in overcoming these risks or any other problems encountered in connection with such acquisitions.
The issuance of additional Common Shares may negatively impact the trading price of our securities.
We have issued equity securities in the past and may continue to issue equity securities to finance our activities in the future, including to finance future acquisitions, or as consideration for acquisitions of businesses or assets. In addition, outstanding options, restricted stock units, warrants and broker warrants to purchase Common Shares may be exercised, resulting in the issuance of additional Common Shares. The issuance by us of additional Common Shares would result in dilution to our shareholders, and even the perception that such an issuance may occur could have a negative impact on the trading price of our securities.
The price of our securities may fluctuate and may result in losses to investors.
The trading price of our Common Shares has been and may continue to be subject to large fluctuations, which may result in losses to investors. The high and low intraday sale prices of our Common Shares on the NYSE Amex Equities (“NYSE Amex”) were $5.95 and $0.77 in 2008; $3.38 and $1.16 in 2009; and $3.45 and $1.30 in 2010 and on the Toronto Stock Exchange (“TSX”) were CDN$5.99 and CDN$0.98 in 2008; CDN$3.63 and CDN$1.40 in 2009; and CDN$3.59 and CDN$1.33 in 2010. The trading price of our Warrants may be subject to large fluctuations, which may result in losses to our investors. The high and low intraday sale prices of our Warrants on the TSX were CDN$2.00 and CDN$1.30 between March 1, 2011 and March 14, 2011. The trading price of our Common Shares and our Warrants may increase or decrease in response to a number of events and factors, including:
|
|
·
|
material events in our business;
|
|
|
·
|
trends in the gold mining industry and the markets in which we operate;
|
|
|
·
|
changes in the price of gold;
|
|
|
·
|
changes in financial estimates and recommendations by securities analysts;
|
|
|
·
|
acquisitions and financings;
|
|
|
·
|
global and regional political and economic conditions and other factors;
|
|
|
·
|
general stock market conditions;
|
|
|
·
|
the operating and share performance of other companies that investors may deem comparable to us; and
|
|
|
·
|
purchase or sales of blocks of our Common Shares or Warrants.
|
This volatility may adversely impact the price of the Common Shares or Warrants regardless of our operating performance.
We have never declared dividends.
We have never declared or paid any dividends on our Common Shares. Currently, we intend to retain our earnings, if any, to finance the growth and development of the business and do not expect to pay dividends or to make any other distributions in the future, which may limit the way in which investors may realize any returns on their investment.
Joint ventures and other partnerships in relation to our properties may expose us to risks.
We may enter into joint ventures or other partnership arrangements with other parties in relation to the exploration, development and production of certain of the properties in which we have an interest. Joint ventures can often require unanimous approval of the parties to the joint venture or their representatives for certain fundamental decisions such as an increase or reduction of registered capital, merger, division, dissolution, amendments of constating documents, and the pledge of joint venture assets, which means that each joint venture party may have a veto right with respect to such decisions which could lead to a deadlock in the operations of the joint venture or partnership. Further, we may be unable to exert control over strategic decisions made in respect of such properties. Any failure of such other companies to meet their obligations to us or to third parties, or any disputes with respect to the parties’ respective rights and obligations, could have a material adverse effect on the joint ventures or their properties and therefore could have a material adverse effect on our results of operations, financial performance, cash flows and the price of our securities.
We have no history of producing metals from our current mineral properties and limited recent experience with producing mines; there can be no assurance that we will successfully establish mining operations or profitably produce precious metals.
We have no history of producing metals from our current mineral properties. We do not produce gold and do not currently generate operating earnings. While we seek to move the Concordia and Mt. Todd gold projects into production, such efforts will be subject to all of the risks associated with establishing new mining operations and business enterprises including:
|
|
·
|
the timing and cost, which are considerable, of the construction of mining and processing facilities;
|
|
|
·
|
the ability to find sufficient gold reserves to support a profitable mining operation;
|
|
|
·
|
the availability and costs of skilled labor and mining equipment;
|
|
|
·
|
compliance with environmental and other governmental approval and permit requirements;
|
|
|
·
|
the availability of funds to finance construction and development activities;
|
|
|
·
|
potential opposition from non-governmental organizations, environmental groups, local groups or local inhabitants which may delay or prevent development activities; and
|
|
|
·
|
potential increases in construction and operating costs due to changes in the cost of fuel, power, materials and supplies.
|
The costs, timing and complexities of mine construction and development may be increased by the remote location of our properties. It is common in new mining operations to experience unexpected problems and delays during construction, development and mine start-up. In addition, our management will need to be expanded. This could result in delays in the commencement of mineral production and increased costs of production. Accordingly, we cannot assure you that our activities will result in profitable mining operations or that we will successfully establish mining operations.
Our continuing historical reclamation obligations at the Mt. Todd gold project and our reclamation requirements on our other properties could require significant additional expenditures.
We could be responsible for the reclamation obligations related to previous disturbances located on all of our properties, including the Mt. Todd gold project. The Mt. Todd site was not reclaimed when the original mine closed and as a result, the dumps and heap leach pad require ongoing care and maintenance. We provide that care and maintenance, but will not be responsible for the environmental liability resulting from previous operations until we make the decision to re-open the mine and have received the appropriate permits. The reclamation obligations of the historic operations involve substantially the same areas that the Company would be required to reclaim, if it was to undertake a proposed operation on the property. The obligation therefore would not necessarily involve a substantially greater obligation than Vista would assume for its own proposed operations. The award of the permits to Vista would require an agreement by the Company to provide a bond in a form satisfactory to the NT Government that would cover the expense of the reclamation of the property. The satisfaction of any bonding requirements and continuing or future reclamation obligations on our properties will require a significant amount of capital. There is a risk that we will be unable to fund these historical and future reclamation requirements, and further, that the regulatory authorities may increase reclamation and bonding requirements to such a degree that it would not be commercially reasonable to continue exploration or development activities on such properties, including at the Mt. Todd gold project. Such events could have a material adverse effect on our results of operations, financial performance, cash flows and the price of our securities.
We have a history of losses and may incur losses in the future.
We have incurred losses since inception and may incur net losses in the future. We incurred the following losses from operations during each of the following periods:
|
|
·
|
approximately $10 million for the year ended December 31, 2010;
|
|
|
·
|
approximately $2 million for the year ended December 31, 2009; and
|
|
|
·
|
approximately $10 million for the year ended December 31, 2008.
|
We had an accumulated deficit of approximately $203 million and $193 million as at December 31, 2010 and December 31, 2009, respectively.
We expect to continue to incur losses unless and until such time as one of our properties enters into commercial production and generates sufficient revenues to fund continuing operations. We have committed and plan to continue to commit substantial capital and other resources to the ongoing development of the Concordia and Mt. Todd gold projects. The amount and timing of future expenditures will depend on a number of factors, including, but not limited to, the progress of ongoing development and operations, permitting matters, the timing of development, the costs of production, the commercial viability of production and other factors, some of which are beyond our control. We cannot assure investors that we will ever achieve profitability.
Historical production of gold at our Mt. Todd gold project may not be indicative of the potential for future development or revenue.
The Mt. Todd gold project was an operating mine in the late 1990’s. Based on a review of project files, our management believes that approximately 27.1 million short tons grading 0.031 gold ounces per ton and containing 826,000 ounces of gold were extracted between 1996 and the termination of mining in 2000. Processing was by a combination of heap-leach production from oxide ore and cyanidation of sulfide ore. The remaining mineralization consists of sulfide mineralization lying below and along strike of the existing open pit. Historical production of gold from our Mt. Todd gold project may not be indicative of the potential for future development of the property. Due to the uncertainties associated with
exploration and development, including variations in geology and structure, there is no assurance that our development efforts will be successful or that prior operating results are reflective of additional or economically developable deposits. Investors in our securities should not rely on historical operations as an indication that our mining properties will be placed into commercial production again or that such properties will produce revenues or be profitable.
We cannot assure you that we will have an adequate supply of water to complete desired exploration or development of our mining properties.
We have obtained permits and water rights that we currently use to service the activities on our various properties and we plan to obtain all required permits and water rights to serve other properties we may develop or acquire in the future.
However, the amount of water that we are entitled to use pursuant to our water rights must be determined by the appropriate regulatory authorities in the jurisdictions in which we operate. Such regulatory authorities may amend the regulations regarding such water rights, increase the cost of maintaining such water rights, or eliminate our current water rights and we may be unable to retain all or a portion of such water rights. In addition, water at the Mt. Todd gold project is expected to be provided from a raw water dam and reservoir. Drought or drought-like conditions in the area feeding the reservoir could limit or extinguish this water supply. Accordingly, there is no assurance that we will have access to the amount of water needed to explore or develop our properties or to operate a mine at our properties, which may prevent us from generating revenue, and which could materially adversely affect our financial condition, cash flows and the price of our securities.
We could be subject to environmental lawsuits.
Neighboring landowners and other third parties could file claims based on environmental statutes and common law for personal injury and property damage allegedly caused by the release of hazardous substances or other waste material into the environment on or around our properties. There can be no assurance that our defense of such claims will be successful. A successful claim against us could have a material adverse affect on our business prospects, financial condition, results of operation and the price of our securities.
We do not insure against all risks to which we may be subject in our planned operations.
We do not maintain insurance to cover all of the potential risks associated with our operations or future operations. We may also be unable to obtain insurance to cover other risks at economically feasible premiums or at all. Insurance coverage may not continue to be available, or may not be adequate to cover all liabilities. We might also become subject to liability for environmental, pollution or other hazards associated with mineral exploration and production which we may not be insured against, which may exceed the limits of our insurance coverage or which we may elect not to insure against because of premium costs or other reasons. Losses from these events may cause us to incur significant costs that could materially adversely affect our financial condition and our ability to fund activities on our properties. A significant loss or liability could force us to reduce or terminate our operations on a specific project or altogether.
If we fail to hire and retain our key personnel, it may have an adverse effect on our operations.
We depend on a number of key personnel, including Michael B. Richings, our Executive Chairman and Chief Executive Officer, Frederick H. Earnest, our President and Chief Operating Officer, and Gregory G. Marlier, our Chief Financial Officer. We rely heavily on these individuals for the conduct of our business. We believe that our success depends on the continued service of our key officers and there can be no assurance that we will be able to retain any or all of such officers. The loss of any one of these personnel could have an adverse effect on our operations. We have employment contracts with each of these key personnel. We do not have key man life insurance.
Our ability to manage growth effectively will require us to continue to implement and improve our management systems and to recruit and train new employees. Although we have done so in the past and expect to do so in the future, we cannot assure you that we will be successful in attracting and retaining skilled and experienced personnel.
The price of gold is subject to fluctuations, which could adversely affect the realizable value of our assets and potential future results of operations and cash flow.
Our principal assets are mineral reserves and mineralized material. We intend to attempt to acquire additional properties containing mineral reserves and mineralized material (mineral resources under Canadian guidelines). The price that we pay to acquire these properties will be, in large part, influenced by the price of gold at the time of the acquisition. Our
potential future revenues are expected to be, in large part, derived from the mining and sale of gold from these properties or from the outright sale or joint venture of some of these properties.
The value of these mineral reserves and mineralized material (mineral resources under Canadian guidelines), and the value of any potential gold production therefrom, will vary in proportion to variations in gold prices. The price of gold has fluctuated widely, and is affected by numerous factors beyond our control including, but not limited to, international, economic and political trends, expectations of inflation, currency exchange fluctuations, central bank activities, interest rates, global or regional consumption patterns and speculative activities. The effect of these factors on the price of gold, and therefore the economic viability of any of our projects, cannot accurately be predicted. Any drop in the price of gold would adversely affect our asset values, cash flows, potential revenues and profits.
Mining exploration, development and operating activities are inherently hazardous.
Mineral exploration involves many risks that even a combination of experience, knowledge and careful evaluation may not be able to overcome. Operations in which we have direct or indirect interests will be subject to all the hazards and risks normally incidental to exploration, development and production of gold and other metals, any of which could result in work stoppages, damage to property and possible environmental damage. The nature of these risks is such that liabilities might exceed any liability insurance policy limits. It is also possible that the liabilities and hazards might not be insurable, or, we could elect not to be insured against such liabilities due to high premium costs or other reasons, in which event, we could incur significant costs that could have a material adverse effect on our financial condition.
Calculations of mineral reserves and of mineralized material are estimates only, subject to uncertainty due to factors including metal prices, inherent variability of the ore, and recoverability of metal in the mining process.
There is a degree of uncertainty attributable to the calculation of reserves and corresponding grades dedicated to future production. Until mineral reserves are actually mined and processed, the quantity of ore and grades must be considered as an estimate only. In addition, the quantity of mineral reserves and ore may vary depending on metal prices. Estimates of mineralized material (mineral resources under Canadian guidelines) are subject to uncertainty as well. The estimating of mineral reserves and mineralized material (mineral resources under Canadian guidelines) is a subjective process and the accuracy of such estimates is a function of the quantity and quality of available data and the assumptions used and judgments made in interpreting engineering and geological information. There is significant uncertainty in any reserve or mineralized material estimate (estimate of mineral resources under Canadian guidelines), and the actual deposits encountered and the economic viability of mining a deposit may differ materially from our estimates. Estimated mineral reserves or mineralized material (mineral resources under Canadian guidelines) may have to be recalculated based on changes in metal prices, further exploration or development activity or actual production experience. This could materially and adversely affect estimates of the volume or grade of mineralization, estimated recovery rates or other important factors that influence estimates of mineral reserves or mineralized material (mineral resources under Canadian guidelines). Any material change in the quantity of mineral reserves, mineralization, grade or stripping ratio may affect the economic viability of our properties. In addition, there can be no assurance that gold recoveries or other metal recoveries in small-scale laboratory tests will be duplicated in larger scale tests under on-site conditions or during production.
Our exploration and development operations are subject to environmental regulations, which could result in us incurring additional costs and operational delays.
All phases of our operations are subject to environmental regulation. Environmental legislation is evolving in some countries or jurisdictions in a manner which will require stricter standards and enforcement, increased fines and penalties for non-compliance, more stringent environmental assessments of proposed projects and a heightened degree of responsibility for companies and their officers, directors and employees. There is no assurance that future changes in environmental regulation, if any, will not adversely affect our projects. We are currently subject to U.S. federal and state government environmental regulations with respect to our properties in Idaho and California in the United States. We are also currently subject to environmental regulations with respect to our properties in Mexico, Australia and Indonesia.
U.S. Federal Laws
The U.S. Bureau of Land Management requires that mining operations on lands subject to its regulation obtain an approved plan of operations subject to environmental impact evaluation under the
National Environmental Policy Act.
Any significant modifications to the plan of operations may require the completion of an environmental assessment or Environmental Impact Statement (“EIS)” prior to approval. Mining companies must post a bond or other surety to guarantee the cost of post-mining reclamation. These requirements could add significant additional cost and delays to any mining project we undertake.
Under the
U.S. Resource Conservation and Recovery Act
, mining companies may incur costs for generating, transporting, treating, storing, or disposing of hazardous waste, as well as for closure and post-closure maintenance once they have completed mining activities on a property. Our mining operations may produce air emissions, including fugitive dust and other air pollutants, from stationary equipment, storage facilities, and the use of mobile sources such as trucks and heavy construction equipment which are subject to review, monitoring and/or control requirements under the
Federal Clean Air Act
and state air quality laws. Permitting rules may impose limitations on our production levels or create additional capital expenditures in order to comply with the rules.
The
U.S. Comprehensive Environmental Response Compensation and Liability Act of 1980
, as amended (“CERCLA”), imposes strict, joint and several liability on parties associated with releases or threats of releases of hazardous substances. Those liable groups include, among others, the current owners and operators of facilities which release hazardous substances into the environment and past owners and operators of properties who owned such properties at the time the disposal of the hazardous substances occurred. This liability could include the cost of removal or remediation of the release and damages for injury to the surrounding property. We cannot predict the potential for future CERCLA liability with respect to our U.S. properties.
Idaho Laws
Permitting a mining operation, such as Yellow Pine, located on patented mining claims within a National Forest in Idaho would require obtaining various federal, state and local permits under the coordination of the Idaho joint review process. Mining projects require the establishment and presentation of environmental baseline conditions for air, water, vegetation, wildlife, cultural, historical, geological, geotechnical, geochemical, soil and socioeconomic parameters. An EIS would be required for any mining activities proposed on public lands. Permits would also be required for storm-water discharge; wetland disturbance (dredge and fill); surface mining; cyanide use, transport and storage; air quality; dam safety (for water storage and/or tailing storage); septic and sewage; water rights appropriation; and possibly others. In addition, compliance must be demonstrated with the
Endangered Species Act
and the
National Historical Preservation Act
consultation process. Possible county zoning and building permits and authorization may be required. Baseline environmental conditions are the basis by which direct and indirect project-related impacts are evaluated and by which potential mitigation measures are proposed. If our project is found to significantly adversely impact any of these baseline conditions, we could incur significant costs to correct the adverse impact, or might have to delay the start of production.
California Laws
A new mining operation in California, such as the Long Valley gold project which is on federal unpatented mining claims within a National Forest, requires various federal, state and local permits. Mining projects require the establishment and presentation of environmental baseline conditions for air, water, vegetation, wildlife, cultural, historical, geological, geotechnical, geochemical, soil, and socioeconomic parameters. An EIS would be required for any mining activities proposed on public lands. Also required would be a Plan of Operations/Reclamation Plan, and permits for waste-water discharge and wetland disturbance (dredge and fill); a county mining plan and reclamation plan; a county mining operations permit; special use permits from the U.S. Forest Service; and possibly others. In addition, compliance must be demonstrated with the
Endangered Species Act
and the
National Historical Preservation Act
consultation process. Possible county zoning and building permits and authorization may be required. Baseline environmental conditions are the basis by which direct and indirect project-related impacts are evaluated and by which potential mitigation measures are proposed. If our project is found to significantly adversely impact any of these baseline conditions, we could incur significant costs to correct the adverse impact, or delay the start of production. In addition, on December 12, 2002, California adopted a “backfilling law” requiring open-pit surface mining operations for metallic minerals to back-fill the mines. While we have determined that the geometry of our Long Valley gold project would lend itself to compliance with this law, future adverse changes to this law could have a corresponding adverse impact on our financial performance and results of operations, for example, by requiring changes to operating constraints, technical criteria, fees or surety requirements.
Mexico Laws
We are required under Mexican laws and regulations to acquire permits and other authorizations before the Concordia or Guadalupe de los Reyes gold projects can be developed and mined. Since the passage of Mexico’s 1988 General Law on Ecological Equilibrium and Environmental Protection, a sophisticated system for environmental regulation has evolved. In addition, the North American Free Trade Agreement requirements for regulatory standards in Mexico equivalent to those of the United States and Canada have obligated the Mexican government to continue further development of environmental regulation. Most regulatory programs are implemented by various divisions of SEMARNAT. While we
believe that we have or will be able to obtain on a timely basis the necessary permits to place the Concordia gold project into production,
there can be no assurance that we will be able to acquire updates to necessary permits or authorizations on a timely basis. See discussions of Concordia permit status under the section heading “Item 7. Management’s Discussion and Analysis of Financial Condition and Results of Operations—Subsequent Events” below. Likewise, there can be no assurance that we will be able to acquire the necessary permits or authorizations on a timely basis to place the Guadalupe de los Reyes gold project into production. Delays in acquiring any permit, authorization or updates could increase the development cost of the Concordia gold project or the Guadalupe de los Reyes gold project, or delay the start of production. The most significant environmental permitting requirements, as they relate to the Concordia and the Guadalupe de los Reyes gold projects are developing reports on environmental impacts; regulation and permitting of discharges to air, water and land; new source performance standards for specific air and water pollutant emitting sources; solid and hazardous waste management regulations; developing risk assessment reports; developing evacuation plans; and monitoring inventories of hazardous materials. If the Concordia or the Guadalupe de los Reyes gold projects are found to not be in compliance with any of these requirements, we could incur significant compliance costs, or might have to delay the start of production.
Australia Laws
Mineral projects in the Northern Territory are subject to Australian federal and Northern Territory laws and regulations regarding environmental matters and the discharge of hazardous wastes and materials. As with all mining projects, the Mt. Todd gold project would be expected to have a variety of environmental impacts should development proceed. We are required under Australian laws and regulations (federal, state and territorial) to acquire permits and other authorizations before the Mt. Todd gold project can be developed and mined. In Australia, environmental legislation plays a significant role in the mining industry. Various environmental documents such as the EIS over the Mt. Todd gold project, covering studies on,
inter alia
, air, water, pollution, hazardous and toxic wastes, reclamation of mining area, etc. must be prepared and submitted to the Mining and Petroleum Authorizations and Evaluation Division of the Department of Primary Industries, Fisheries and Mines of the Northern Territory government for approval.
The preparations of the EIS and related documents and other relevant environmental licenses would involve incurrence of time and costs and there is no assurance that those approvals/licenses can be obtained in a timely manner. The Northern Territory government also has administrative discretion not to approve the EIS documents or grant the required environmental licenses (including any renewal or extensions of such documents). We have entered into an agreement with the Northern Territory relating to environmental and rehabilitation issues. We must also comply with Aboriginal heritage legislation requirements which require heritage survey work to be undertaken prior to the commencement of mining operations. All these conditions may result in the occurrence of significant production costs and may delay the production activity of the Mt. Todd gold project.
These conditions could frustrate investors seeking certainty in their investments, and as a result we may incur costs and time to manage any issues which may arise and that could possibly affect the overall mining activity of the Mt. Todd gold project.
Indonesia Laws
We are required under Indonesian laws and regulations to acquire permits and other authorizations before our Indonesian mining project, the Awak Mas gold project, can be developed and mined. In Indonesia, environmental legislation plays a significant role in the mining industry. Various environmental documents such as the analysis of environmental impact (“AMDAL”) concerning the Awak Mas gold project, covering studies on,
inter alia
, air, water, land, pollution, hazardous and toxic wastes and reclamation of mining area, must be prepared and submitted to the Ministry of Environment for approval. In addition, we are also required to submit periodical environmental reports to the relevant environmental government agencies pursuant to the AMDAL and other required environmental licenses (
e.g
. license for tailing waste).
The preparation of AMDAL documents and other relevant environmental license documents involves incurrence of time and costs and there is no assurance that those approvals/licenses can be obtained in a timely manner. The Indonesian government also has administrative discretion not to approve AMDAL documents or grant the required environmental licenses (including any renewal or extensions of such documents). All these conditions may delay the production activity of the Awak Mas gold project.
Failure to meet all of the requirements with respect to the above environmental documents, licensing and report submissions could cause us to be subject to administrative and criminal sanctions as well as fines. In extreme cases, the administrative sanctions can also be imposed in the form of revocation of our business license and the contract of work that we have with the Indonesian government.
As well, from time to time the implementation of the regional autonomy law in Indonesia can cause uncertainty as to the existence and applicability of national and regional regulations (including in the environmental sector). Often regional regulations are in conflict with higher regulations that apply nationally. As a result we may incur cost and time to manage any issues which may arise and that could possibly affect the overall mining activity of the Awak Mas gold project.
Regulations and pending legislation governing issues involving climate change could result in increased operating costs, which could have a material adverse effect on our business.
A number of governments or governmental bodies have introduced or are contemplating regulatory changes in response to various climate change interest groups and the potential impact of climate change. Legislation and increased regulation regarding climate change could impose significant costs on us, our venture partners and our suppliers, including costs related to increased energy requirements, capital equipment, environmental monitoring and reporting and other costs to comply with such regulations. Any adopted future climate change regulations could also negatively impact our ability to compete with companies situated in areas not subject to such limitations. Given the emotion, political significance and uncertainty around the impact of climate change and how it should be dealt with, we cannot predict how legislation and regulation will affect our financial condition, operating performance and ability to compete. Furthermore, even without such regulation, increased awareness and any adverse publicity in the global marketplace about potential impacts on climate change by us or other companies in our industry could harm our reputation. The potential physical impacts of climate change on our operations are highly uncertain, and would be particular to the geographic circumstances in areas in which we operate.
Our business is subject to evolving corporate governance and public disclosure regulations that have increased both our compliance costs and the risk of noncompliance, which could have an adverse effect on the price of our securities.
We are subject to changing rules and regulations promulgated by a number of governmental and self-regulated organizations, including the SEC, the NYSE Amex, and the Financial Accounting Standards Board. These rules and regulations continue to evolve in scope and complexity and many new requirements have been created in response to laws enacted by Congress, making compliance more difficult and uncertain. For example, on July 21, 2010, Congress passed the Dodd-Frank Act. Our efforts to comply with the Dodd-Frank Act and other new regulations have resulted in, and are likely to continue to result in, increased general and administrative expenses and a diversion of management time and attention from revenue-generating activities to compliance activities.
Our receipt of future payments in connection with our disposal of the Amayapampa gold project is subject to uncertainty.
In April 2008, we announced the disposal of our wholly-owned subsidiary Vista Gold (Antigua) Corp. (“Vista Gold Antigua”) to Republic Gold Limited (“Republic”). Vista Gold Antigua indirectly held our interest in the Amayapampa gold project in Bolivia. See section heading “Item 8. Financial Statements and Supplementary Data—Note 3—Dispositions” below. Under the terms of the transaction, Republic agreed to pay us $3.0 million in three equal payments of $1.0 million. The first of these payments is due and payable upon the start of commercial production at Amayapampa followed by $1.0 million payments on each of the first and second anniversaries of the start of commercial production. In addition, Republic has agreed to pay us a net smelter return royalty on the gold produced by or on behalf of Republic from the Amayapampa gold project in varying percentages depending on the price of gold per ounce. The Amayapampa gold project is not currently in production and we cannot assure that it will ever become a producing mine or, if production is commenced at the mine, the timing and amounts for any such production. Further, having disposed of the Amayapampa gold project, we have no control over the development of the project. Depending on whether and when production commences at Amayapampa and levels of production achieved, receipt by us of the future payments contemplated by the purchase and sale agreement for the Amayapampa gold project is subject to uncertainty. Finally, a number of legal proceedings have been initiated in Bolivia with respect to the ownership interests in the mining concessions comprising the Amayapampa gold project. Although we are not a party to these proceedings, if these challenges are successful, then we may lose our royalty and payment stream described above.
We face intense competition in the mining industry.
The mining industry is intensely competitive in all of its phases. As a result of this competition, some of which is with large established mining companies with substantial capabilities and with greater financial and technical resources than ours, we may be unable to acquire additional attractive mining claims or financing on terms we consider acceptable. We also compete with other mining companies in the recruitment and retention of qualified managerial and technical employees. If we are unable to successfully compete for qualified employees, our exploration and development programs may be slowed down or suspended. We compete with other gold companies for capital. If we are unable to raise sufficient capital, our exploration and development programs may be jeopardized or we may not be able to acquire, develop or operate gold projects.
We may be unable to raise additional capital on favorable terms.
The exploration and development of our properties, specifically the construction of mining facilities and commencement of mining operations, require substantial additional financing. Significant capital investment is required to achieve commercial production from each of our properties. We will have to raise additional funds from external sources in order to maintain and advance our existing property positions and to acquire new gold projects. There can be no assurance that additional financing will be available at all or on acceptable terms and, if additional financing is not available, we may have to substantially reduce or cease our operations.
Some of our directors may have conflicts of interest as a result of their involvement with other natural resource companies.
Some of our directors are directors or officers of other natural resource or mining-related companies. Michael B. Richings is a director of Midas Gold Corp. John Clark is a director of Crown Point Ventures and MarketVision Direct Inc. C. Thomas Ogryzlo is a director of Aura Minerals Inc. and Baja Mining Corp. W. Durand Eppler is director of Augusta Resource Corporation, Golden Minerals Company and Frontier Mining Limited. Tracy Stevenson is the non-executive chairman and a director of Quaterra Resources Inc. and a director of Ivanhoe Mines Ltd. These associations may give rise to conflicts of interest from time to time. In the event that any such conflict of interest arises, a director who has such a conflict is required to disclose the conflict at a meeting of the directors of the company in question and to abstain from voting for or against approval of any matter in which such director may have a conflict. In appropriate cases, the company in question will establish a special committee of independent directors to review a matter in which any directors, or management, may have a conflict. In accordance with the laws of the Yukon Territory, the directors of all Yukon Territory companies are required to act honestly, in good faith and in the best interests of a company for which they serve as a director.
There may be challenges to our title in our mineral properties.
There may be challenges to title to the mineral properties in which we hold a material interest. If there are title defects with respect to any of our properties, we might be required to compensate other persons or perhaps reduce our interest in the affected property. Also, in any such case, the investigation and resolution of title issues would divert management’s time from ongoing exploration and development programs.
Our property interests in Mexico and Indonesia are subject to risks from political and economic instability in those countries.
We have property interests in Mexico and Indonesia which may be affected by risks associated with political or economic instability in those countries. The risks include, but are not limited to: military repression, extreme fluctuations in currency exchange rates, labor instability or militancy, mineral title irregularities and high rates of inflation. In addition, changes in mining or investment policies or shifts in political attitude in Mexico or Indonesia may adversely affect our business. We may be affected in varying degrees by government regulation with respect to restrictions on production, price controls, export controls, income taxes, expropriation of property, maintenance of claims, environmental legislation, land use, land claims of local people, water use and mine safety. The effect of these factors cannot be accurately predicted. On January 24, 2011 we issued a press release commenting on the permitting process for the Concordia gold project. The Concordia gold project had been the object of what we believed to be misleading media coverage in Baja California Sur ("BCS"). Regardless of attempts by those opposed to the project to change the laws that regulate mining (which is a federal mandate and can only be changed at the federal level), Vista is proceeding with development of the Concordia gold project in accordance with federal mining and environmental laws and continues to be in compliance with all statutory obligations and responsibilities in BCS.
Our financial position and results are subject to fluctuations in foreign currency values.
Because we have mining exploration and evaluation operations in North America and in Australia and Indonesia, we are subject to foreign currency fluctuations, which may materially affect our financial position and results. We do not engage in currency hedging to offset any risk of currency fluctuations.
We measure and report our financial results in U.S. dollars. We have mining projects in the United States, Mexico, Australia and Indonesia, and we are looking for other projects elsewhere in the world. Economic conditions and monetary policies in these countries can result in severe currency fluctuations.
Currently all our material transactions in Mexico, Australia and Indonesia are denominated in U.S. dollars. However, if we were to begin commercial operations in any of these or other countries, it is possible that material transactions incurred in the local currency, such as engagement of local contractors for major projects, will be settled at a U.S. dollar value that is different from the U.S. dollar value of the transaction at the time it was incurred. This could have the effect of undermining profits from operations in that country.
We are likely a "passive foreign investment company" which will likely have adverse U.S. federal income tax consequences for U.S. shareholders
U.S. shareholders of our Common Shares should be aware that we believe we were classified as a passive foreign investment company (“PFIC”) during the taxable year ended December 31, 2010, and based on current business plans and financial projections, we believe there is a significant likelihood that we will be a PFIC during the current taxable year. If we are a PFIC for any year during a U.S. shareholder’s holding period, then such U.S. shareholder generally will be required to treat any gain realized upon a disposition of Common Shares, or any so-called “excess distribution” received on their Common Shares, as ordinary income, and to pay an interest charge on a portion of such gain or distributions, unless the shareholder makes a timely and effective "qualified electing fund" (“QEF Election”) or a "mark-to-market" election with respect to the Common Shares. A U.S. shareholder who makes a QEF Election generally must report on a current basis its share of our net capital gain and ordinary earnings for any year in which we are a PFIC, whether or not we distribute any amounts to our shareholders. However, U.S. shareholders should be aware that there can be no assurance that we will satisfy record keeping requirements that apply to a QEF Election, or that we will supply U.S. shareholders with information that such U.S. shareholders require to report under the QEF Election rules, in event that we are a PFIC and a U.S. shareholder wishes to make a QEF Election. Thus, U.S. shareholders may not be able to make a QEF Election with respect to their Common Shares. A U.S. shareholder who makes the mark-to-market election generally must include as ordinary income each year the excess of the fair market value of the Common Shares over the taxpayer’s basis therein. This paragraph is qualified in its entirety by the discussion below under the heading “Certain U.S. Federal Income Tax Considerations.” Each U.S. shareholder should consult his or her own tax advisor regarding the U.S. federal, U.S. state and local, and foreign tax consequences of the PFIC rules and the acquisition, ownership, and disposition of our Common Shares.
It may be difficult to enforce judgments or bring actions outside the United States against us and certain of our directors and officers.
We are a Canadian corporation and certain of our directors and officers are neither citizens nor residents of the United States. A substantial part of the assets of several of these persons, and of us, are located outside the United States. As a result, it may be difficult or impossible for an investor:
|
|
·
|
to enforce in courts outside the United States judgments obtained in United States courts based upon the civil liability provisions of United States federal securities laws against these persons and us; or
|
|
|
·
|
to bring in courts outside the United States an original action to enforce liabilities based upon United States federal securities laws against these persons and us.
|
None.
Detailed information is contained herein with respect to the Concordia (formerly, Paredones Amarillos), Mt. Todd, Yellow Pine, Guadalupe de los Reyes, Long Valley and Awak Mas gold projects. The Corporation holds the Concordia and Guadalupe de los Reyes gold projects through its wholly-owned subsidiary, Desarrollos Zapal S.A. de C.V. ("DZ") (formerly Minera Paredones Amarillos S.A. de C.V.); the Mt. Todd gold project is held through its wholly-owned subsidiary, Vista Gold Australia Pty Ltd., the Awak Mas gold project is held through its indirect wholly-owned subsidiary, PT Masmindo Dwi; the Yellow Pine gold project is held through its indirect wholly-owned subsidiary, Idaho Gold Resources LLC.; and the Long Valley gold project is held through its indirect wholly-owned subsidiary Vista Gold California LLC. Pan Asia Resources Corp. has an option to earn a 60% interest in the Awak Mas project. See the section heading “Item 2. Properties—Awak Mas, Indonesia” below. Units of measurement are reported in Imperial units for properties in the U.S. and in metric units for properties outside the U.S.
Cautionary Note to U.S. Investors:
This section and other sections of this annual report on Form 10-K contain the terms “measured mineral resources,” “indicated mineral resources,” “inferred mineral resources,” “proven mineral reserves,” and “probable mineral reserves” as defined in accordance with NI 43-101. Please note the following regarding these terms:
|
|
·
|
“Measured mineral resources” and “indicated mineral resources”—
we advise U.S. investors that while these terms are recognized and required by Canadian regulations, these terms are not defined in SEC Industry Guide 7 and the SEC does not normally permit such terms to be used in reports and registration statements filed with the SEC.
U.S. investors are cautioned not to assume that any part or all of the mineral deposits in these categories will ever be converted into reserves.
|
|
|
·
|
“Inferred mineral resources”—
we advise U.S. investors that while this term is recognized by Canadian regulations, the SEC does not recognize it. “Inferred mineral resources” have a great amount of uncertainty as to their existence, and great uncertainty as to their economic and legal feasibility. It cannot be assumed that all or any part of an inferred mineral resource will ever be upgraded to a higher category. Under Canadian rules, estimates of inferred mineral resources may not form the basis of a feasibility study or prefeasibility study, except in rare cases. The SEC normally only permits an issuer to report mineralization that does not constitute “reserves” only as in-place tonnage and grade without reference to unit measures.
U.S. investors are cautioned not to assume that any part or all of an inferred mineral resource exists or is economically or legally minable.
|
|
|
·
|
“Proven mineral reserves” and “probable mineral reserves”—
The definitions of proven and probable mineral reserves used in NI 43-101 differ from the definitions for “proven reserves” and “probable reserves” as found in SEC Industry Guide 7. Accordingly, Vista Gold’s disclosure of mineral reserves herein may not be compatible to information from U.S. companies subject to reporting and disclosure requirements of the SEC.
|
Please see
“Cautionary Note to U.S. Investors regarding Estimates of Measured, Indicated and Inferred Resources and Proven and Probable Reserves”
for further discussion on the differences between terms under NI 43-101 and SEC Industry Guide 7.
Cautionary Note To All Investors Concerning Economic Assessments That Include Mineral Resources:
Mineral resources that are not mineral reserves have no demonstrated economic viability. The preliminary assessments on the Mt. Todd, Awak Mas, Yellow Pine and Long Valley gold projects are preliminary in nature and include “inferred mineral resources” that are considered too speculative geologically to have economic considerations applied to them that would enable them to be categorized as mineral reserves. There is no certainty that the preliminary assessments at the Mt. Todd, Awak Mas, Yellow Pine and Long Valley gold projects will ever be realized.
The disclosure in this annual report of a scientific or technical nature for Vista Gold’s mineral properties is based on the following technical reports prepared in accordance with NI 43-101:
|
|
(i)
|
“Feasibility Study Update, NI 43-101 Technical Report, Vista Gold Corp., Paredones Amarillos Gold Project, Baja California Sur, Mexico” dated September 1, 2009 prepared by or under the supervision of Terry Braun of SRK Consulting (US), Inc., Steven Ristorcelli and Thomas Dyer of Mine Development Associates Inc. and David Kidd of Golder Associates Inc., each an independent qualified person;
|
|
|
(ii)
|
“Mt. Todd Gold Project Updated Preliminary Economic Assessment Report, Northern Territory, Australia” dated June 11, 2009 prepared by or under the supervision of Mr. John Rozelle of Tetra Tech MM, Inc., an independent qualified person;
|
|
|
(iii)
|
“Mt. Todd Gold Project Prefeasibility Study, Northern Territory, Australia” dated October 1, 2010 prepared by or under the supervision of Mr. John Rozelle of Tetra Tech MM, Inc., and Mr. Thomas Dyer of Mine Development Associates Inc., each an independent qualified person;
|
|
|
(iv)
|
"10.65 MTPY Preliminary Feasibility Study, Mt. Todd Gold Project, Northern Territory, Australia" dated January 28, 2011 prepared by or under the supervision of Mr. John Rozelle of Tetra Tech MM, Inc., and Mr. Thomas Dyer of Mine Development Associates Inc., each and independent qualified person;
|
|
|
(v)
|
“CNI 43-101 Technical Report, Preliminary Assessment of the Yellow Pine Project, Yellow Pine, Idaho” dated December 13, 2006 prepared by or under the supervision of Mr. Richard Lambert and Mr. Barton Stone of Pincock, Allen & Holt, each an independent qualified person;
|
|
|
(vi)
|
“Technical Report for the Guadalupe de los Reyes Gold-Silver Project, Sinaloa, Mexico” dated August 12, 2009 and amended and restated on December 8, 2009 prepared by or under the supervision of Mr. Leonel Lopez of Pincock, Allen & Holt, an independent qualified person;
|
|
|
(vii)
|
“Technical Report, Preliminary Assessment, Long Valley Project, Mono County, California, USA” dated January 9, 2008 prepared by or under the supervision of Mr. Neil Prenn and Mr. Thomas Dyer of Mine Development Associates, each an independent qualified person; and
|
|
|
(viii)
|
“Preliminary Assessment, Awak Mas Gold Project, Sulawesi, Indonesia” dated January 16, 2008 prepared by or under the supervision of Mr. John Rozelle of Gustavson Associates, LLC, an independent qualified person.
|
The technical information has been updated with current information where applicable.
Concordia (formerly the Paredones Amarillos) gold project, Baja California Sur, Mexico
Project Name Change
On September 7, 2010, we announced that we had changed the name of our wholly-owned Paredones Amarillos gold project to the Concordia gold project. We believe this will better reflect the integration of the project with the environmental, social and economic priorities of the region.
The name Concordia (translated as “agreement” or “oneness”) was selected after a wide-ranging dialogue with local communities and other project stakeholders. The name change is part of a broad program intended to communicate our commitment to developing the Concordia gold project in a way that is consistent with contemporary standards for sustainable development, environmental stewardship, and the health and safety of the communities in which we operate.
We believe that the name change reflects the spirit of our collaboration and the values we share with the local communities and project stakeholders as the Concordia gold project moves forward.
Property Description and Location
The Concordia gold project is located 55 kilometers southeast of the city of La Paz (population approximately 220,000), in the Mexican state of BCS and is accessed by paved and dirt roads. The project area
covers over 3,710 hectares and is comprised of fifteen mining concessions. A map showing the location of the mining concessions and a table with a list of the mining concessions and the holding requirements follow.
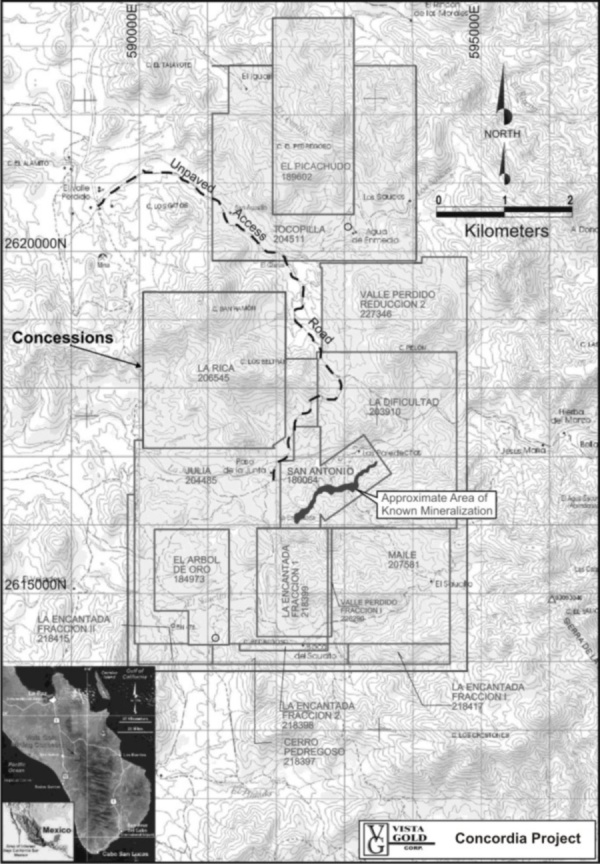
Concordia Mining Concessions Controlled by Vista Gold
|
Project is centered at approximately UTM coordinates 592500E, 2618000N (NAD27)
All concessions are located on INEGI official map number F12B23
|
|||||
|
Concession Name
|
Serial
Number
|
Surface Area
(hectares)
|
Location
Date
|
Expiration
Date
|
Annual Fees
(in Mexican Pesos, “MP”)
|
|
San Antonio
|
180064
|
151.3647
|
3/23/1987
|
3/22/2037
|
30,512
|
|
El Arbol De Oro
|
184973
|
162.0000
|
12/13/1989
|
12/12/2039
|
32,656
|
|
El Picachudo
|
189602
|
348.0000
|
12/5/1990
|
12/4/2040
|
70,150
|
|
La Dificultad
|
203910
|
454.0218
|
11/5/1996
|
11/4/2046
|
91,522
|
|
Julia
|
204485
|
469.4073
|
2/21/1997
|
2/20/2047
|
94,624
|
|
Tocopilla
|
204511
|
582.4949
|
2/28/1997
|
2/27/2047
|
117,420
|
|
La Rica
|
206545
|
481.1593
|
1/23/1998
|
1/22/2048
|
96,992
|
|
Maile
|
207581
|
296.9883
|
6/30/1998
|
6/29/2048
|
59,866
|
|
Cerro Pedregoso
|
218397
|
46.6493
|
11/5/2002
|
11/4/2052
|
1,328
|
|
La Encantada Fracc. 2
|
218398
|
12.9992
|
11/5/2002
|
11/4/2052
|
370
|
|
La Encantada Fracc. 1
|
218399
|
166.2248
|
11/5/2002
|
11/4/2052
|
4,734
|
|
La Encantada Fracc. II
|
218415
|
32.4883
|
11/5/2002
|
11/4/2052
|
926
|
|
La Encantada Fracc. I
|
218417
|
44.9991
|
11/5/2002
|
11/4/2052
|
1,282
|
|
Valle Perdido Fracc. I
|
226290
|
9.7752
|
12/6/2005
|
12/5/2055
|
134
|
|
Valle Perdido Reduccion 2
|
227346
|
451.5862
|
6/9/2006
|
11/4/2052
|
6,214
|
|
Totals
|
3,710.1584
|
608,730
|
|||
|
15 Concessions
|
Total in US$ @ an exchange rate on 3/11/2011 of = US$1.00 = MP $11.94
|
US$50,982
|
|||
Note
: Proof of Labor must be filed on all concessions annually. All concessions are Federal Mining Concessions.
We acquired 100% of the project on August 29, 2002, from Viceroy Resource Corporation (“Viceroy”). To acquire the project, we paid cash of CDN$1.0 million and issued 303,030 equity units comprised of one Common Share and one purchase warrant to purchase one Common Share to Viceroy, and on August 29, 2003, we paid Viceroy the remaining CDN $0.5 million due pursuant to the acquisition contract (see also Consolidated Financial Statements—Note 5 under the section heading “Item 8. Financial Statements and Supplementary Data” below).
Echo Bay Mines Ltd. (“Echo Bay”) holds a 2% net profits interest on certain concessions of the project, subject to a cap of $2 million. Additionally, Minera Tepmin, S.A. de C.V. (“Tepmin”), holds a 1% net smelter returns royalty (“NSR”) on two concessions which are outside the limits of the current anticipated open-pit mine.
On December 5, 2008, we completed a transaction to purchase the land needed for a desalination plant for the Concordia gold project. The purchase price of the land was 5,648,740 pesos, which was equivalent to $424,000 on the purchase date. The land is located on the Pacific Coast, approximately 26 kilometers by air southwest of the project. The 1.6 hectare parcel of land is zoned for industrial use and a Change of Land Use Permit (“CUS”) has been received from the Municipality of La Paz for the installation of the desalination plant. On December 23, 2008, we entered into an agreement to purchase approximately 500 hectares of land within the area covered by the mining concessions for the mill site and other infrastructure. The purchase price of the land was 6,000,000 pesos, which was equivalent to $456,274 on the purchase date. We paid $228,136, which was half of the total purchase price, on the date of purchase and we recorded as a long-term liability the other remaining $228,136 which is payable upon the earlier of: a) within 10 days following the start-up of commercial production at the Concordia gold project; or b) three years from the date of the purchase agreement. In October 2010, we paid the remaining $228,136.
The project holds environmental authorizations for the following purposes: project development including access road, power line, telephone communications, and infrastructure to supply water from a well field; construction and operation of a tailings dam; disposal of tailings; construction of a mill; and installation of three pumping stations. Outstanding permits are discussed under the heading “Permitting” below.
We are not aware of any environmental liabilities on the property and believe that if any exist, the Corporation will not be liable for them.
Accessibility, Climate, Local Resources, Infrastructure and Physiography
The project site is currently accessible by paved highway to within 17 kilometers of the project on the north and then by government-maintained dirt roads. There is also a government maintained dirt road from the west. The main access will
be from the north. We plan to widen and improve approximately 10 kilometers of existing roads from the north and to construct approximately 7 kilometers of new road immediately north of the project. At the present time, the project area is undeveloped with only several sheds and the drill access roads constructed during the exploration phase. We maintain an office in the city of La Paz and a small warehouse for the storage of drill samples in the town of San Antonio. Operations personnel are expected to come from villages in the general area and from La Paz. Personnel transportation options, such as busing from population centers, are being considered.
High-voltage electrical power will be available from an existing sub-station located 18 kilometers north of the project area. We intend to construct a new power line from the sub-station to the project. The power line design has been completed and the right-of-way agreements are in place. We intend to use desalinated sea water from the Pacific Coast, north of Todos Santos. The length of the pipeline to transport desalinated sea water to the project is dependent on the ultimate route chosen; however, 45 kilometers was used in the 2009 feasibility study update. Annual water consumption is estimated to be 1.4 million cubic meters.
Surface rights have been secured by the purchase of titled land from a landowner in the area, and there is sufficient space on this land for the processing plant and tailings disposal facility. On October 27, 2009, the General Direction of Mines in the Mexican Secretariat of Economy granted to us, Temporary Occupation Permits ("TOP") covering the seven mining concessions in the project area (San Antonio, El Arbol de Oro, La Dificultad, Julia, Maile, La Encantada Fracc. 1, and Valle Perdido Fracc. I). We believe that the TOP grant us the surface rights necessary for the open pit and waste rock dumps.
The climate is semi-arid and mild. Operations will be possible year-round. The topography comprises moderate to steep hills with elevations ranging from 400 to 800 meters. Overall, the drainage system is characterized by moderately steep v-shaped valleys.
History
Mining in the region dates back to the colonial times, when gold was discovered by Jesuits who were colonizing the area. The initial recorded work on the property itself commenced around 1970 when Noranda Inc. (under its subsidiary Cia Minera Gamma, S.A. de C.V.) (“Noranda”) acquired a number of Baja Sur properties in 1970. Noranda joint-ventured the property with Minera Las Cuevas, S.A. de C.V. A total of 28 core drill holes were completed on the property Mine Development Associates Inc. of Reno, Nevada (“MDA”) reports 26 core drill holes, which according to drilling dates in the current database, were completed in 1974.
An extensive geochemical program and completion of 18 diamond drill holes in 1984 and 1985 was carried out by Imperial Metals Corporation (“IMC”) who acquired the property in 1984.
In 1992, Tymar acquired 70% of the shares of IMC. Tymar then changed its name to Baja Gold Inc. (“Baja”). Baja's first program included extending the geochemical survey and 18 reverse-circulation drill holes.
Echo Bay entered into an agreement with IMC in May 1996, whereby Echo Bay could earn a 51% interest in the property by expending $4.5 million on the project prior to January 1997 and by making cash payments to IMC. Echo Bay could also earn an additional 9% interest in the project by additional expenditures and cash payments. Echo Bay spent $13.4 million on the project through January 1997 and earned a 60% interest in the project. Baja amalgamated with Loki Gold Corporation during May 1996 to form VLB Resource Corporation (“VLB”), which subsequently became a wholly owned subsidiary of Viceroy.
From 1994 to 1997, Echo Bay conducted extensive regional and local exploration over its claim block covering 150 square kilometers. Its exploration included stream sediment and soil geochemistry, ground and airborne geophysics, satellite imagery, geologic mapping, rock sampling, and drilling. In addition, its reconnaissance exploration identified two targets within the claim block but outside of the resource area: Tocopilla and Boca del Saucito.
From 1993 to 1997, Echo Bay carried out geologic mapping on about 33% of the claim block at a 1:4,000 scale. In a detailed stream-sediment sampling program across its claim block, Echo Bay collected 910 samples and analyzed those for gold, silver, copper, and arsenic. Gold correlated with arsenic and ranged up to 5.75 gold grams per tonne, averaging 0.058 gold grams per tonne. Echo Bay also sampled vegetation and stream and drill-hole water samples. Soil sampling proved to be the most productive exploration tool because of the thick vegetative cover and poorly developed outcrop. In addition to sampling over the resource area, soil grids were cut across the Boca del Saucito, Tocopilla, and Northern Perimeter areas. From 1993 through 1996, 7,024 soil samples were collected and analyzed by Echo Bay. Over 1,300 rock chip samples were collected from outcrops of cataclasite and strongly altered areas in road cuts, and were analyzed for gold, silver, arsenic, mercury, copper, lead and zinc.
Induced polarization (“IP”) surveying proved to be the most effective method for outlining disseminated sulfide mineralization at the Concordia gold project. Echo Bay conducted 40 line-kilometers of 50-meter and 100-meter spaced IP surveys over the resource and the Boca del Saucito area in 1994 and 1995. In addition, in 1994, Echo Bay flew an extensive regional suite of airborne geophysics that included electromagnetic resistivity (“EM”), aeromagnetics, radiometrics, and very low-frequency resistivity (“VLF”) surveying. There is a potassium/thorium radiometric high over the gold resource, reflecting its association with potassic alteration. Magnetics and EM do not show strong anomalies over the gold resource. There is a correlation of IP highs and gold mineralization, due to the presence of sulfides in the mineralization.
From 1994 through 1997, Echo Bay drilled 36 HQ-size core holes totaling 9,587.9 meters and 321 5.5-inch reverse circulation holes totaling 61,396.5 meters on the property (Snowden reports 339 RC holes for 62,616 meters reverse circulation). The following table shows drill-hole data contained in the database used for the resource estimate, and it is noted that most of the drill database consists of drill data attributed to Echo Bay. Echo Bay drilled HQ-size core holes that were logged by a geologist and split for assay. They drilled 5.5-inch reverse circulation holes, from which chip samples were collected on intervals between one and two meters that were logged by a geologist.
Concordia
Drillhole Database
|
Type
|
No. Holes
|
Lengths (meters)
|
|
Combined*
|
4
|
2,182
|
|
Core
|
87
|
14,280
|
|
RC
|
347
|
62,473
|
|
Grand Total
|
438
|
78,934
|
|
Company
|
No. Holes
|
Lengths (meters)
|
|
Baja
|
18
|
1,217
|
|
Echo Bay
|
369
|
73,026
|
|
IMC
|
18
|
957
|
|
Noranda
|
26
|
2,520
|
|
Vista Gold
|
7
|
1,215
|
|
Grand Total
|
438
|
78,934
|
|
Year
|
No. Holes
|
Lengths (meters)
|
|
1974
|
26
|
2,520
|
|
1984
|
9
|
655
|
|
1985
|
9
|
302
|
|
1991
|
18
|
1,217
|
|
1994
|
82
|
15,890
|
|
1995
|
119
|
26,146
|
|
1996
|
127
|
24,724
|
|
1997
|
41
|
6,266
|
|
2005
|
7
|
1,215
|
|
Grand Total
|
438
|
78,934
|
|
Used/Not Used in Database
|
No. Holes
|
Lengths (meters)
|
|
Historic (not used)
|
44
|
3,477
|
|
Outside the area (not used)
|
7
|
1,215
|
|
Database (used)
|
387
|
74,242
|
|
Grand Total
|
438
|
78,934
|
*“Combined” means the hole was drilled partly by reverse circulation (RC) and the remainder by core; some meterages are off due to rounding.
Echo Bay produced a feasibility study in late 1996. This was superseded by a February 1997 feasibility study that updated the geology and mining sections. Echo Bay then completed a favorable feasibility study in late 1997, elected to put the property into production, and purchased a used processing plant. However, when gold prices quickly fell from over $375 per gold ounce, which had been the basis of the feasibility study, to less than $300 per gold ounce, Echo Bay terminated the detailed engineering work then in progress and indefinitely suspended development of the project.
In October 1999, Viceroy acquired the remaining 60% of the project from Echo Bay in exchange for the mill that was owned by the joint venture and a 2% net profits royalty on all the concessions, except for two concessions, El Arbol de Oro and Picachudo that were already covered by a 1% NSR royalty to Tepmin. There is no record of Viceroy having done any exploration work on the site between 1999 and 2002.
We acquired the Concordia gold project from Viceroy in August 2002 by purchasing all of the assets of IMC for a total purchase price of CDN$3 million. The terms of the agreement called for payment of 50% in cash, with CDN$1 million due at closing and CDN$0.5 million due one year from closing, and 50% in Vista Gold equity units (one Common Share and one warrant to purchase one Common Share).
Geology and Mineralization
The south-southeast-trending Baja Peninsula is cut by north-trending extensional faults thought to be related to the Tertiary extensional environment of the Gulf of California and East Pacific Rise. At the southern tip of the peninsula is the La Paz crystalline complex, made up of Cretaceous intermediate to silicic intrusions that cut and metamorphosed early Mesozoic clastic and calcareous sedimentary rocks. The Concordia gold project lies on the northwest flank of the mountain range with Picacho Sierra la Laguna as its most prominent local feature. This mountain range lies within the La Paz crystalline complex. The crystalline complex is bounded on the west by the La Paz fault that transects the peninsula. While a thick sequence of Tertiary volcanic and volcaniclastic rocks crop out west of the La Paz fault, erosion has removed both the Tertiary volcanic units and the early Mesozoic metasedimentary rocks from the Concordia area.
The 20 to 30 kilometer-wide, 100 kilometer long Todos Santos mineral belt, bounded by north-trending extensional faults, includes the Valle Perdido, El Triunfo, and San Antonio mining districts, as well as Concordia. A regional north-northeast-striking fault, mapped for three kilometers north and south of Concordia, has an east-trending flexure in its central portion, which is where the Concordia resource is located.
General geology at Concordia consists of diorite roof pendants intruded by a granodiorite batholith with local low and high-angle fault zones. A north-east striking, south-east dipping low-angle silicified fault zone (“cataclasite”) is the main host of gold mineralization at Concordia. Movement along this structure has been characterized as reverse, resulting from compression. Secondary, high-angle faulting is thought to control the higher-grade mineralization at the project. The known gold mineralized material occupies an inverted U-shaped block with an approximate strike length of 1,500 meters east-west to east-northeast, a width of approximately 500 meters down-dip, and a thickness averaging about 30 meters, but reaching 80 meters. The apex of the “U” is near the center of the proposed pit with the legs forming the east and west pit lobes.
Silver occurs in the deposit, but due to the lack of quality assurance and quality control data for the silver assays, a NI 43-101 compliant resource estimate has not been prepared. Metallurgical testing indicates that silver recoveries are variable, but silver production is not included in the feasibility study (described below). It cannot be assumed that any silver will be produced from the Concordia gold project.
Exploration and Drilling
The Concordia gold project has been a significant exploration target since the 1980s. Exploration prior to Vista Gold’s involvement is discussed under the heading “History” above. Our exploration efforts to date have primarily been in the Tocopilla area, which is about 3.5 kilometers north of the resource at Concordia. In 2004, we collected and analyzed 203 soil samples and 22 rock-chip samples. In 2005, we completed six hybrid expanding dipole-dipole IP lines across the Tocopilla target, with east-west lines spaced 200 meters apart and totaling about 12 line-kilometers. Strong IP anomalies were identified on all lines with a good correlation between high IP values and high resistivities. The IP chargeability response at Tocopilla was found to be stronger and broader than that at the Concordia deposit. In addition to this work on the Tocopilla target, Vista Gold collected and analyzed nine rock samples from near the southwestern corner of the property.
In December 2004, we completed metallurgical testing on 118 kilograms of quarter core from the project.
In 2005, we drilled seven NQ-size core holes for a total of 1,215.2 meters on the Tocopilla target, which lies north of the main resource area. Four were angle holes, and three were vertical. The drilling encountered mineralization that was sub economic in value. Britton International Drilling of Hermosillo, Sonora, was the drill contractor. The core was split on site and then sent to Chemex’s Hermosillo laboratory for sample preparation.
All of the assaying was conducted for us by Chemex’s Sparks, Nevada, laboratory following sample preparation at Chemex’s Hermosillo, Sonora, laboratory. All rock chip samples and core were split with a riffle splitter with fine crushing to 70% less than 2 millimeters and the split pulverized to 85% less than 75 microns. Soil samples were screened to minus 180 microns. All assays were 30-gram fire assays with atomic absorption finish (FA-AA) for gold, accompanied by either 27-element four-acid ICP-AES for drill samples or 34-element
aqua regia
ICP-AES for soil samples. Rock chip samples were analyzed by 30-gram FA-AA for gold only; and rock chip (but not soil or core) samples with high results were assayed by 30-gram fire assay with a gravimetric finish. Based on a review of an assay certificate for 15 of the rock chip samples that showed one sample analyzed by both methods, MDA assumed that samples assaying greater than 2.0 ppm gold by FA-AA were the ones re-assayed with a gravimetric finish. The same assay certificate for the rock chip samples indicates that Chemex used standards, blanks, and duplicates for quality control, but MDA had no detailed information about the results. Based on the review of one assay certificate for drill samples from a subsequent core-drilling program, it appears that Chemex also used standards in their assay program, but MDA had no detailed information about the quality control results.
Definitive Feasibility Study and Mineral Resource and Reserve Estimate
In August 2007, we announced the start of a definitive feasibility study which was completed in early September 2008 under the direction of our independent consultant, SRK. An update of the capital and operating costs and economic analysis of the project was completed on September 1, 2009 (the “Updated Study”). The technical report outlining the results of the Updated Study entitled “Feasibility Study Update, NI 43-101 Technical Report, Vista Gold Corp., Paredones Amarillos Gold Project, Baja California Sur, Mexico” dated September 1, 2009, is available on SEDAR at
www.sedar.com
.
The technical portions of the studies contracted directly by Vista Gold and supervised by SRK were completed by MDA (resource/reserve estimates, mine planning and mining capital/operating cost estimates), Golder Associates Inc. (“Golder”) (tailings impoundment facility design/construction cost estimates), and SRK (pit slope stability evaluation, closure plan/cost estimates and economic analysis). Terry Braun, P.E., an independent qualified person as defined by NI 43-101, prepared or supervised the preparation of material on behalf of SRK. Steven Ristorcelli, P. Geo. and Thomas Dyer, P. Eng., of MDA, each of whom are independent qualified persons as defined by NI 43-101, prepared or supervised the preparation of material on behalf of MDA. David Kidd, P.E., an independent qualified person as defined by NI 43-101, of Golder, prepared or supervised the preparation of material on behalf of Golder.
In connection with the feasibility study and confirmed in the Updated Study, a mineral resource estimate (mineralized material estimate under SEC Industry Guide 7) was completed by MDA by or under the supervision of Mr. Steven Ristorcelli, P. Geo., an independent qualified person as defined by NI 43-101. The estimate was prepared using industry standard software and estimation methodologies.
There are 438 drill holes in the data base, of which four were drilled by reverse circulation methods down near mineralization followed by core drilling through the mineralized zone, 87 were core holes and 347 were reverse circulation holes. Of the 438 drill holes in the data base, 387 drill holes containing 51,622 samples were used in the mineral resource estimate (mineralized material under SEC Industry Guide 7). Drill-hole spacing in the projected open-pit area is approximately 40 meters. Mr. Ristorcelli reviewed available information necessary for the preparation of the resource estimate, including sampling, analytical, drilling and geologic.
The only information available in respect of sampling programs relates to work that was completed by Echo Bay and subsequently by Vista Gold. The sampling programs completed by Vista Gold were either completed after the resource model was prepared or were conducted outside the area of the reported resource and were not included in the preparation of the resource model. Most of the drilling at the Concordia gold project has been reverse circulation drilling, and the majority of the reverse circulation drill sampling was completed on wet samples.
Echo Bay’s reverse circulation drill samples were collected in a cyclone that contained both a vertical and a side discharge port. Samples from both ports appeared to be representative of each one-meter interval, although as observed in the field, samples from the vertical port were slightly heavier. Estimated sample weights were 5 to 10 kilograms. Samples were collected in five-gallon plastic pails to which flocculent had been added and were then put into pre-numbered cloth bags; there was no mention of spilling or overflow or pouring samples into bags. Samples were stored a safe distance away from drilling and sampling operations. Representative chip samples were collected, screened, and placed into chip trays. Echo Bay constructed a sample preparation lab on the site that included a sample splitter, roll crusher, pulverizer, and drying oven.
For Echo Bay’s core drilling program, core samples were collected at 1.5-meter intervals and then sawed or split on site using a hydraulic splitter. One-half of the core was prepared for assay, and the other half was retained as a duplicate or for engineering purposes.
All Echo Bay samples were analyzed for gold using FA-AA. If the FA-AA analysis resulted in a grade higher than 2.0 grams gold per tonne, a gravimetric finish was applied. Cone Laboratories (“Cone”) in Denver, Colorado performed the original assaying, with duplicate samples checked by Rocky Mountain Geochemical (“RMG”) of Salt Lake City, Utah.
No information is available on sample security for any of the historic drilling programs.
Four assay data bases existed which MDA audited and eventually merged into one data base. The data base with the fewest errors (less than 1% for gold, silver, copper and arsenic values) in an audit of 10% of the gold values and 5% of the other metal values was chosen as the base for merging.
Following a review of the available documentation pertaining to the sampling and assaying programs, the data was deemed sufficiently accurate to use for estimation. However, Mr. Ristorcelli noted that some of the early program’s quality assurance and quality control procedures were poorly documented and that an apparent bias may exist between some of the assay values and the check assay values of the same samples. Three other independent consulting firms have noted, and Echo Bay acknowledged, the apparent bias, but no one has been able to quantify it. MDA concluded that the potential impact to the project could be 8% (half in grade and half in tonnage). As the original samples were not preserved and cannot be re-assayed, Mr. Ristorcelli recommended a 12 to 15 hole drill program to confirm the validity of the model that relied on those assays whose check assay bias is unresolved.
In late 2009 and early 2010, we completed a 14-hole core drill program for resource and reserve confirmation and to evaluate any apparent check assay bias, under the direction of our Vice President of Exploration, Frank Fenne, P.G., who is a qualified person within the meaning of NI 43-101. Drilling was done by Major Drilling of Hermosillo, Sonora, Mexico, and core logging and sampling was done by consultants of Vista Gold. Sample preparation was by ALS Chemex of Hermosillo, who sent prepared sample pulps to ALS Chemex in Vancouver, British Columbia, Canada for assaying. Check assaying was done by Acme Labs in Vancouver. Sampling, sample custody, preparation and assaying were completed in compliance with NI 43-101 standards. However, the results of the drilling did not resolve the apparent check assay bias, and additional work is planned.
Mr. Ristorcelli undertook multiple checks including review of the geologic interpretation, an assessment of the statistical behavior of the gold grades in the context of the geologic setting, classical statistics on the entire database and by rock type, and geostatistics by domain to assess the validity of the model. He then classified the mineral resources into measured, indicated and inferred categories of NI 43-101 requirements, following the CIM Definition Standards.
Under SEC Industry Guide 7 guidelines, mineralized material (excluding mineral reserves reported separately) at a cut-off grade of 0.40 grams gold per tonne totals 32,658,000 tonnes grading 0.77 grams gold per tonne.
Under CIM Standards, excluding mineral reserves which are reported separately, and using a cutoff grade of 0.40 grams gold per tonne, measured mineral resources are estimated at 2,243,000 tonnes grading 0.89 grams gold per tonne, indicated mineral resources are estimated at 30,415,000 tonnes grading 0.76 grams gold per tonne, for combined measured and indicated mineral resources of 32,658,000 tonnes grading 0.77 grams gold per tonne. Inferred mineral resources are excluded from estimates of mineral reserves and are estimated at 7,694,000 tonnes grading 0.64 grams gold per tonne.
Cautionary Note to U.S. Investors: see the section heading “Cautionary Note to United States Investors Regarding Estimates of Measured, Indicated and Inferred Resources and Proven and Probable Reserves” above.
The mineral reserve estimate was completed by MDA, by or under the supervision of Mr. Dyer, P. Eng., at a gold price of $700 per ounce of gold and cut-off grade of 0.40 grams gold per tonne, and is summarized in the following table. The strip ratio is estimated at 3.57:1 waste to ore. The metallurgical recovery for gold is estimated to be 91.5%.
Reserves Estimated at Concordia
|
Reserve Classification
|
Tonnes (x1000)
|
Average Gold Grade (grams/tonne)
|
|
Proven
(1)
|
7,147
|
1.17
|
|
Probable
(1)
|
30,801
|
1.06
|
|
Proven & Probable
(1)
|
37,948
|
1.08
|
|
|
(1)
|
Mineral reserves are reported separately from mineral resources.
|
|
|
(2)
|
Cautionary Note to U.S. Investors
: Proven and Probable Mineral Reserves as described in this table are based on Canadian definitions under NI 43-101. See the section heading
“
Cautionary Note to United States Investors Regarding Estimates of Measured, Indicated and Inferred Resources and Proven and Probable Reserves” above.
|
|
|
(3)
|
See the section heading “Item 1A. Risk Factors” in this annual report.
|
As of January 1, 2009, the rolling three-year average gold price was $723.60, which is slightly higher than the $700 gold price used by MDA for the mineral reserves reported in the table above. The rolling three-year gold price at the-end of 2009 was $846.57. Therefore, under SEC Industry Guide 7 requirements, the qualified person believes the mineral reserve estimate listed above is conservative. However, should we not be able to obtain the required governmental permits to mine the property, then the project would not have mineral reserves under either NI 43-101 or SEC Industry Guide 7. See the section heading “Item 1A. Risk Factors” above.
The proposed pit is oriented approximately east-west and would have two distinct lobes. We plan to extract ore from the mine using conventional open-pit mining equipment and techniques. A 91-tonne truck and loader fleet has been selected and we would be the owner and operator of the fleet. The higher-grade, west lobe would be mined first and a significant portion of the waste rock from the east lobe would be used to backfill the west lobe of the pit. Concurrent reclamation of two waste dumps would be completed during the latter years of the operation.
Over the estimated 9.5 year life-of-mine, the estimated average cash production costs are projected to be $406 per ounce, with lower costs of $372 per ounce projected during the first five years of production. Updated operating costs used prices effective as of the beginning of the third quarter of 2009. Updated pre-production capital costs, including contingency, owner’s costs and working capital, are estimated to be $189.8 million or $157 per ounce of gold produced. Total capital costs including replacement, reclamation and salvage value over the life of the project and final mine closure are estimated to be $167 per ounce of gold produced. Payback of capital is estimated at 2.9 years from the start of production at the Concordia gold project
We intend to process the ore in a conventional crushing and grinding circuit consisting of a primary gyratory crusher followed by a semi-autogenous grinding mill and two ball mills with an expected mill ore throughput rate of approximately 11,000 tonnes per day. The crushing and grinding equipment was acquired from the Colomac Mine and is presently stored in Canada at Edmonton (major equipment) and Calgary (minor equipment in containers) waiting shipment to a refurbishing facility for repairs and reconditioning. The cost of this equipment was approximately $16 million. The proposed flow sheet indicates that following grinding, the slurried ore will be sized by cyclones and then leached in tanks prior to gold recovery using a Kemix carbon-in-pulp circuit. Gold will be stripped from the carbon and precipitated in an electrowinning cell prior to refining into doré bars. The tailings will be detoxified using ferrous sulfate, paste thickened and deposited in a lined tailings impoundment facility on-site.
Due to the scarcity of surface water and political sensitivities regarding the use of groundwater, we have elected to construct and operate a desalination plant on the Pacific Coast. Water would be pumped approximately 45 kilometers to the site. Annual water consumption is estimated to be approximately 1.4 million cubic meters. We expect that energy for the project will be supplied by the Comisión Federal de Electrícidad from an existing sub-station located approximately 18 kilometers north of the project. It is anticipated that diesel fuel for the project will be provided in bulk quantities by Petroleos de Mexico. Fuel prices in Mexico are subsidized and have not experienced the volatility seen in other locations.
The Concordia gold project is remotely located and is not expected to directly affect any local inhabitants. Our planned access road improvements will benefit the nearby small villages of Valle Perdido (population 19) and El Rosario (population 67). Locally, employment at the mine, economic activities and the planned access road improvements are expected to benefit both communities and regionally, the communities of San Antonio and El Triunfo, as well as the city of La Paz, are also expected to benefit from employment at the mine. We are working with the local education and health care authorities and have become a “social partner” with the elementary school in El Rosario.
The base-case economic analysis used a gold price profile with a gold price of $850 per ounce in the first three years of production, decreasing to $725 per ounce for the remainder. An alternative sensitivity analysis was completed at a constant gold price of $950 per ounce. The economic analyses were conducted on 100% equity basis with no consideration of debt or leasing. Estimated economic results, showing the internal rate of return (“IRR”) and net present value at a 5% discount rate (“NPV
5
”) and sensitivity of the base case due to changes in gold prices are presented in the following table. Mexican income taxes payable are estimated at $71.6 million over the 9.5 year life of the project. There is a 2% net-profits royalty payable to Echo Bay that affects known mineralization and is capped at $2 million. Payback of capital is estimated at 2.9 years from the start of production at the Concordia gold project.
The calculation of income tax in Mexico is based on the higher of the Mexican ordinary tax or the flat tax. The ordinary income tax rate is 28% and is applied to the calculation of net operating profit. The flat tax (referred to as the “IETU” in Mexico) was implemented on January 1, 2008 and is a minimum alternative tax that will be assessed at 17.5%. Property tax is calculated on the capital expenditures that apply to land cost and acquisition, and buildings and infrastructure. The rate that is applied to these capital items is 0.25%.
Concordia Estimated Economic Results
|
Gold Price Scenario
|
IRR
|
Pre- Tax NPV
5
($)
|
|
Base Case Gold Price Profile ($850 first three years and $725 for the remainder, production- weighted average $771)
|
24.7% pre-tax
19.6% after tax
|
$150,000,000
|
|
Fixed $950 Gold Price
|
37.8% pre-tax
31.0% after tax
|
$303,000,000
|
Schedule
We plan to utilize outside sources to provide the additional project capital and are proceeding to examine various project financing alternatives, including debt and equity components. We expect to complete financing arrangements and begin construction as soon as the remaining permits are in hand. Construction is expected to take 14 to 15 months. As noted below, we have already purchased the major mill equipment with funds raised in our March 2008 private placement of the Notes.
Equipment Purchase
The processing equipment we purchased in 2008, which includes an 11,000 tonne-per-day semi-autogenous (“SAG”) grinding mill, two ball mills, gyratory crusher and a shorthead cone crusher, along with other related components, spare parts and other process plant equipment, remains in storage in Edmonton, Alberta, Canada, until we receive our CUSF. At that time, we will arrange for reconditioning and transportation of the equipment to the project site.
Permitting Status
On February 19, 2010, we announced that SEMARNAT had dismissed our application for the CUSF. In its dismissal, SEMARNAT had questioned the validity of the Temporary Occupation Permits (“TOP”) issued by the General Direction of Mines in the Secretariat of Economy, which were required as part of the CUSF application. SEMARNAT also identified the need for additional technical studies. We provided an update on the status of our CUSF application in a press release on July 19, 2010.
The Concordia gold project is located in a special use area on the northern limit of the buffer zone of the Sierra de La Laguna Biosphere (the “Biosphere”). In the immediate Concordia gold project area, the surface land is divided between land owned directly by us and a parcel of federal land which has yet to be defined by the Mexican Secretariat of Agrarian Reform ("SRA"), although the process for doing so is underway. The TOP apply to both the privately held land and the federal land. In questioning the validity of the TOP, SEMARNAT has requested confirmation of the boundaries of the
federal land is subject to CONANP’s claim. Once this has happened, Desarrollos Zapal S.A. de C.V. (formerly Minera Paredones Amarillos S.A. de C.V.) (“DZ”) expects the SRA to grant CONANP's request to become the administrator of the applicable part of the federal land in accordance with their previous request. CONANP has indicated that it will administer the federal land which lies within the buffer zone of the Biosphere in accordance with the established management plan, which states that the exploration and extraction of mineral resources is an activity that is compatible with the special use area in which the Concordia gold project is located. We expect this process to result in the validation of the TOP and recognition of such by SEMARNAT. Following the validation of the TOP, DZ will submit a new CUSF application. The timing for completion of these types of bureaucratic processes is uncertain and at this time, it is not possible to provide an estimate of the timing for the re-filing of a new CUSF application.
We are also working to resolve the deficiencies identified in SEMARNAT’s dismissal of the CUSF application. DZ has contracted SRK, and several BCS academic institutions to review, analyze and validate some of the information submitted as part of the original CUSF application. This will include additional hydrogeologic studies, surface run-off calculations and a review of certain baseline environmental data. The results will be submitted as part of the new CUSF application. DZ has also retained the services of Herrera Ordonez Abogados, a law firm based in Mexico City, to compile and submit the new CUSF application. The principal lawyer in charge of DZ’s work is Mr. Hector Herrera who is a past chairman of the Mexican Bar Association’s Environmental Commission and has an extensive background in working with SEMARNAT.
In addition to re-filing our CUSF application, we are working with our legal counsel and political experts in Mexico on a broader strategy for the advancement of the permitting process for the Concordia gold project. We and our Mexican advisors remain confident that our right to develop the deposit at our Concordia gold project is sound and we will be granted all permits to conduct the operation. However, at the time this is being written it is not possible to provide an estimate of timing.
There
has been some opposition to the project organized by a number of environmental NGO groups who have used misinformation as part of their program. During the latter half of 2010 in a period leading up to state elections (February 2011) there was also political opposition to the development of the project in the state legislature. As a result on January 24, 2011 we issued a press release commenting on the permitting process for the Concordia gold project. The Concordia gold project has been the object of what we believed to be misleading media coverage in BCS. Regardless of attempts by those opposed to the project to change the laws that regulate mining (which is a federal mandate and can only be changed at the federal level), Vista is proceeding with development of the Concordia gold project in accordance with federal mining and environmental laws and continues to be in compliance with all statutory obligations and responsibilities in BCS. The Federal Government through the Dircctor General of Mines has continued to voice its support for the development of the project.
Preliminary Project Design, Permitting Support and Other Activities
On July 19, 2010, we announced we have contracted ICA Fluor, with offices in Mexico City, Mexico, and Dublin, California, to be the engineering, procurement and construction management contractor for the project. ICA Fluor's initial scope of work includes basic engineering in support of permitting activities. ICA Fluor is coordinating design work on the access road, main power transmission line, processing plant, tailings impoundment facility, desalination plant and water supply pipeline at the Concordia gold project.
Following the submission of the new CUSF application, we intend to present to SEMARNAT the documents to modify and extend the Concordia gold project’s environmental permits that were issued in 1997 and, unless extended by DZ, will expire in 2012. The modifications will reflect the many design changes made to improve the Concordia gold project and enhance environmental protections which are now incorporated into our proposed development.
We are in the process of finalizing the remaining rights-of-way for the power transmission line and water supply. We have filed the appropriate environmental permit application for the water supply pipeline.
VWS Mexico, S.A. de C.V. has been contracted to provide engineering and permitting support for the desalination plant. Final studies for the design of the facility have been completed and we have filed the appropriate environmental permit application.
We have established ASUDES, a civil association (similar in function to a foundation). The goals of ASUDES are to promote improved access to health care and more educational opportunities for members of the nearby local communities. A number of programs have been established in the area of health and education which have been well received by the local communities.
Mt. Todd, Northern Territory, Australia
Property Description and Location
Effective March 1, 2006, we and our subsidiary Vista Gold Australia Pty Ltd. (“Vista Gold Australia”), entered into agreements with Ferrier Hodgson, the Deed Administrators for Pegasus Gold Australia Pty Ltd. (“Pegasus”), the government of the Northern Territory of Australia and the Jawoyn Association Aboriginal Corporation (“JAAC”) and other parties named therein, subject to regulatory approvals, to purchase a 100% interest in the Mt. Todd gold mine (also known as the Yimuyn Manjerr gold mine) in the Northern Territory, Australia. Under these agreements, we are guarantor of the obligations of our subsidiary Vista Gold Australia.
As part of the agreements, we agreed to pay Pegasus, A$1.0 million ($739,600) and receive a transfer of the mineral leases and certain mine assets; and pay the Northern Territory government’s costs of management and operation of the Mt. Todd site up to a maximum of approximately A$375,000 (approximately $277,500) during the first year of the term (initial term is five years, subject to extensions), and assume site management and pay management and operation costs in following years. Additionally, we agreed to issue Common Shares with a value of CDN$1.0 million (amounting to 177,053 Common Shares) to the JAAC as consideration for the JAAC entering into the agreement and for rent for the use of the surface overlying the mineral leases until a decision is reached to begin production. Other agreement terms provide that we would undertake a technical and economic review of the mine and possibly form one or more joint ventures with the JAAC. In June 2006, the transactions contemplated under the agreements were completed and effected, with funds held in escrow released to the ultimate vendors and the Common Shares issued to the JAAC. In June 2010, we announced that we had notified the Northern Territory government that, based on our on-going positive results to date, we intend to extend our agreement with the Northern Territory government related to the Mt. Todd gold project for an additional five-year period to the end of 2015. On November 30, 2010, we, and the Northern Territory government, announced that the agreement has been renewed for an additional five-year period to 2015.
There is a royalty equal to 5% of the gross value of gold or other metals commercially extracted from certain mineral concessions which are located outside the zone of mineralization currently defined by us and previous operators generally known as the Batman deposit. The royalty is known as the Denehurst royalty. If the Mt. Todd gold project proves feasible, Vista has agreed to offer the JAAC an opportunity for joint venture participation on a 90% Vista/10% JAAC basis. For rent of the surface during production, the JAAC is entitled to an annual amount equal to 1% of the annual value of production with an annual minimum of A$50,000.
In August and September 2007, we obtained several new exploration licenses, located generally to the north of and contiguous to the Mt. Todd mining licenses. Total land holdings controlled by Vista Gold Australia are approximately 123,021 hectares. A map showing the location of the mining and exploration licenses and a table with a list of the mining and exploration licenses and the holding requirements follow
.
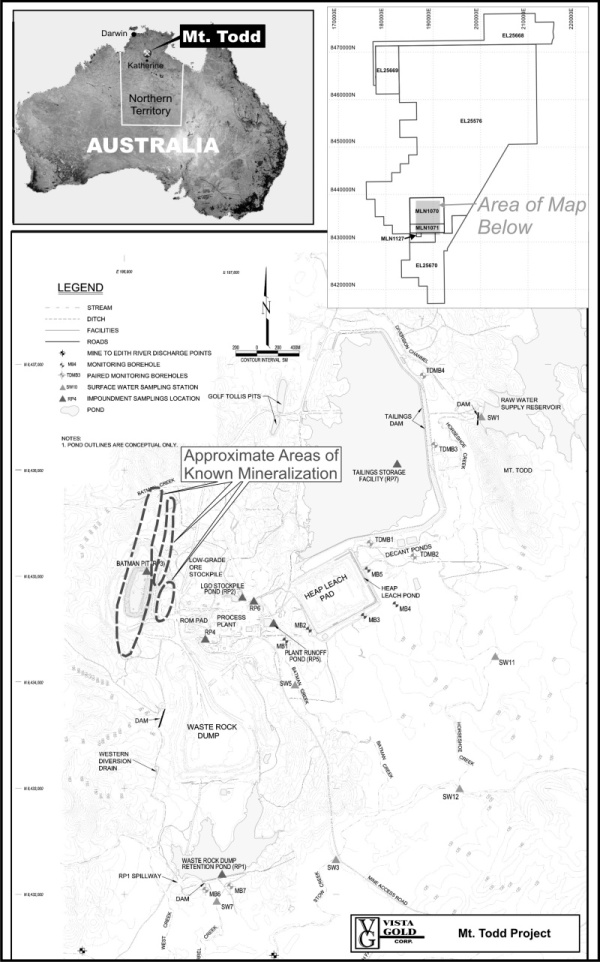
Mt. Todd Land Holdings of Vista Gold Australia
|
License
Name
|
Serial
Number
|
Federal
Claim Type
|
Surface
Area
(hectares)
|
Location
Description
(UTM)
|
Location
Date
|
Expiration
Date
|
Estimated
Holding
Requirements
Annual Rent
including
GST
(Australian
Dollars)
|
Annual
Work
Requirement
(Australian
Dollars)
|
Annual
Reports
Due
|
|
Mining Licenses:
|
|||||||||
|
MLN 1070
|
MLN 1070
|
Mining License
|
3,982
|
Mining
License Block
|
March 5, 1993
|
March 4, 2018
|
$43,802 (due March 4)
|
N/A
|
June 4
|
|
|
|||||||||
|
MLN 1071
|
MLN 1071
|
Mining License
|
1,327
|
centered at approximately
|
March 5, 1993
|
March 4, 2018
|
$14,597 (due March 4)
|
N/A
|
June 4
|
|
|
|||||||||
|
MLN 1127
|
MLN 1127
|
Mining License
|
80
|
188555E,
435665N
|
March 5, 1993
|
March 4, 2018
|
$880 (due March 4)
|
N/A
|
June 4
|
|
Subtotals
|
5,389
|
AUD$59,279
|
AUD$0
|
||||||
|
Exploration Licenses:
|
|||||||||
|
EL 25576
|
EL 25576
|
Exploration License
|
91,240
|
Centered at approximately 192557E, 8446405N
|
March 15, 2007
|
March 14, 2013
|
$6,732 (due March 14)
|
$200,000
|
April 14
|
|
EL 25668
|
EL 25668
|
Exploration License
|
11,410
|
Centered at approximately 199000E, 8463964N
|
March 17, 2007
|
March 16, 2013
|
$1,122 (due August 16)
|
30,000
|
September 16
|
|
EL 25669
|
EL 25669
|
Exploration License
|
4,972
|
Centered at approximately 178272E, 8457220N
|
March 15, 2007
|
March 14, 2013
|
$396 (due March 14)
|
20,000
|
April 14
|
|
EL 25670
|
EL 25670
|
Exploration License
|
10,010
|
Centered at approximately 185445E, 8424349N
|
March 15, 2007
|
March 15, 2013
|
$748 (due March 14)
|
20,000
|
April 14
|
|
Subtotals
|
117,632
|
AUD$8,998
|
AUD$270,000
|
||||||
|
Totals A$
|
Total = AUD$68,277
|
Total = AUD$270,000
|
|||||||
|
Totals US$
|
Total in US$ @ an exchange rate on 3/11/2011 of US$1.00 = AUD$0.99 = US$68,544
|
Total in US$ @ an exchange rate on 3/11/2011 of US$1.00 = AUD$0.99 = US$271,256
|
|||||||
|
Grand Totals
|
3 Mining Licenses, 4 Exploration Licenses
|
123,021
hectares
|
US$339,800
|
Surface use rights have been negotiated with the JAAC and are part of that agreement (see discussion above). There is sufficient space on these lands for all necessary facilities including processing plant, tailings disposal and waste dump areas.
A Mine Management Plan is developed and submitted annually that details work to be done on the property, such as drilling. Once the plan is approved, work can commence. Vista Gold Australia complies annually with this procedure and has received approval for all work done on the project to date. It is anticipated that permitting to resume mine production will be relatively straight-forward as the area has been the subject of historical mining. Any future mining will necessitate an approved closure plan and sufficient bonding to carry-out that closure. An environmental impact statement may be required for mine development. Further permitting, which is not expected to be an issue, will be required to continue exploration and development.
Accessibility, Climate, Local Resources, Infrastructure and Physiography
The project is located 56 kilometers by road northwest of Katherine, Northern Territory, Australia, and approximately 250 kilometers south of Darwin. Access is by existing paved public roads and approximately four kilometers of paved private road. We control and maintain the private paved road.
Mt. Todd was an operating mine in the late 1990s. Although most of the processing equipment and facilities were removed from the site, basic infrastructure items are still in place, including project access control point, small shop and office, mill building, and various concrete slabs and floors, as well as a fully functioning tailings impoundment that has capacity to store additional mill tailings. The Batman pit is partially filled with water that has been pumped from the containment pond downstream of the waste dumps. We will have to dewater the pit and treat the water for discharge prior to the start of operations. The Mt. Todd site was not reclaimed when the mine closed, and as a result, the dumps and heap leach pad require ongoing care and maintenance. Vista Gold Australia provides that care and maintenance, but is not responsible for the environmental liability resulting from previous operations until we take the decision to re-open the mine and have received the appropriate permits.
We completed the installation of a water treatment plant in 2009. The treated water will initially be stored in the existing tailings impoundment facility, but we expect to receive the authorization to allow discharge of a significant portion of the treated water in the future. The project has its own fresh water reservoir which is expected to supply all of the project’s water needs.
A medium voltage power line supplies the site with electrical power. The Mt. Todd gold project, when in operation, generated its own power using natural gas. The natural gas pipeline is still in place, and should be considered as a resource for future operations.
Mt. Todd is located sufficiently close to the city of Katherine to allow for an easy commute for workers. Because the area has both historic and current mining activity, the area hosts a skilled mining workforce.
The Mt. Todd area has a sub-tropical climate with a distinct wet season and dry season. The area receives most of its rainfall between the months of January and March. Temperatures are moderate, allowing for year-round mining operations. Topography is relatively flat.
Geology and Mineralization
The Mt. Todd gold project is situated within the southeastern portion of the Early Proterozoic Pine Creek Geosyncline. The Batman deposit geology consists of a sequence of hornfelsed interbedded greywackes and shales with minor thin beds of felsic tuff. Bedding consistently strikes at 325
o
, dipping 40
o
to 60
o
to the southwest. Northerly trending sheeted quartz sulfide veins and joints striking at 0
o
to 20
o
and dipping 60
o
to the east are the major controls for mineralization in the Batman deposit. The veins are 1 to 100 millimeters in thickness with an average thickness of around 8 to 10 millimeters and occur in sheets with up to 20 veins per horizontal meter. These sheeted veins are the main source of gold mineralization in the Batman deposit. In general, the Batman deposit is 1,500 to 1,550 meters in length by 365 to 450 meters in true width and 450 to 500 meters in known down-dip extension (the deposit is open along strike and at depth).
History
The Mt Todd Gold Project has a long, well-documented history as presented in the table below. In addition, it has a well-preserved and meticulously maintained database and supporting file system. The care taken and quality of the data speaks to the integrity of the resultant studies that have been completed since the deposit was discovered.
Mt. Todd Gold Project History
|
1986
October 1986 –
January 1987:
|
Conceptual Studies, Australia Gold PTY LTD (a subsidiary of BHP Billiton Limited);
Regional Screening; (Higgins), Ground Acquisition by Zapopan N.L. (“Zapopan”).
|
|
1987
February:
June-July:
October:
|
Joint Venture finalized between Zapopan and Billiton. Geological Reconnaissance, Regional
BCL, stream sediment sampling.
Follow-up BCL stream sediment sampling, rock chip sampling and geological mapping (Geonorth)
|
|
1988
Feb-March:
March-April:
May:
May-June:
July:
July-Dec:
|
Data reassessment (Truelove)
Gridding, BCL grid soil sampling, grid based rock chip sampling and geological mapping (Truelove)
Percussion drilling Batman (Truelove) - (BP1-17, 1,475m percussion)
Follow-up BCL soil and rock chip sampling (Ruxton, Mackay)
Percussion drilling Robin (Truelove, Mackay) - RP1-14, (1,584m percussion)
Batman diamond, percussion and RC drilling (Kenny, Wegmann, Fuccenecco) - BP18-70, (6,263m percussion); BD1-71, (85,62m Diamond); BP71-100, (3,065m R.C.)
|
|
1989
Feb-June:
June:
July-Dec:
|
Batman diamond and RC drilling: BD72-85 (5,060m diamond); BP101-208, (8072m RC). Penguin, Regatta, Golf, Tollis Reef Exploration Drilling: PP1-8, PD1, RGP132, GP1-8, BP108, TP1-7 (202m diamond, 3090m RC); TR1-159 (501m RAB).
Mining lease application (MLA's 1070, 1071) lodged.
Resource Estimates; mining-related studies; Batman EM-drilling: BD12, BD8690 (1,375m diamond); RC pre-collars and H/W drilling, BP209-220 (1,320m RC); Exploration EM and exploration drilling: Tollis, Quigleys, TP9, TD1, QP1-3, QD1-4 (1,141 diamond, 278m RC); Negative Exploration Tailings Dam: E1-16 (318m RC); DR1-144 (701m RAB) (Kenny, Wegmann, Fuccenecco, Gibbs).
|
|
1990
Jan-March:
|
Pre-feasibility related studies; Batman Inclined Infill RC drilling: BP222-239 (2,370m RC); Tollis RC drilling, TP10-25 (1,080m RC). (Kenny, Wegmann, Fuccenecco, Gibbs)
|
|
1993 - 1997
Pegasus Gold Australia Pty Ltd.
|
Pegasus reported investing more than US$200 million in the development of the Mt Todd mine and operated it from 1993 to 1997, when the project closed as a result of technical difficulties and low gold prices. The deed administrators were appointed in 1997 and sold the mine in March 1999 to a joint venture comprised of Multiplex Resources Pty Ltd. and General Gold Resources Ltd.
|
|
1999 - 2000
March - June
|
Operated by a joint venture comprised of Multiplex Resources Pty Ltd. and General Gold Resources Ltd. Operations ceased in July 2000, Pegasus, through the Deed Administrators, regained possession of various parts of the mine assets in order to recoup the balance of purchase price owed it. Most of the equipment was sold in June 2001 and removed from the mine. The tailings facility and raw water facilities still remain at the site.
|
|
2000 – 2006
|
The Deed Administrators, Pegasus, the government of the Northern Territory and the JAAC held the property.
|
|
2006
March
|
Vista Gold Corp. acquired concession rights from the Deed Administrators, surface use rights from the JAAC and entered into a contract with the Government of the Northern Territory of Australia.
|
While the property operated and closed due to bankruptcy, the failure of the project was not a result of a failure of the deposit or the resource estimate. The failure of the project was primarily a result of improper crushing and grinding, accompanied by poor recovery which resulted in higher than expected operating costs, and low gold prices. Had proper bulk sampling and testing been completed, a different processing plant could have been built which would have been more appropriate for the deposit conditions.
Based on a review of project files, our management believes that approximately 24.6 million tonnes grading 1.06 grams gold per ton and containing 826,000 ounces of gold were extracted between 1996 and the termination of mining in 2000. Processing was by a combination of heap-leach production from oxide ore and cyanidation of sulfide ore. The remaining mineralization consists of sulfide mineralization lying below and along strike of the existing open pit, and in hanging wall structures parallel to the main zone in the existing open pit.
Exploration
and Drilling
After acquiring the Mt. Todd gold project in early 2006, an NI 43-101 preliminary assessment on the Mt. Todd gold project was prepared for us in December 2006. Following this preliminary assessment, an infill core drilling program consisting of 25 holes totalling 9,883 meters of drilling was completed on our behalf in June 2007 by Titeline Drilling PL of Australia, and the assaying for gold was done by Northern Australian Labs (“NAL”) in Pine Creek, Northern Territory, Australia, with check assaying by ALS Chemex of Australia. ALS Chemex of Australia and NT Environmental Laboratories Pty. Ltd. of Darwin, Northern Territory, Australia performed multi-element analyses including copper. All holes were angle holes drilled to intersect mineralization at close to right angles. Sampling and assaying methods were conducted in accordance with the CIM Mineral Exploration Best Practices Guidelines. All samples taken were nominally one meter in length.
In 2008, Boart Longyear Australia Pty Ltd. completed a 14 hole 9,006 meter core drilling program on our behalf designed to test the down-dip extension of mineralization within the pit-shape evaluated in 2006, the continuity of
mineralization below that pit shape and to obtain a sample for ongoing metallurgical testing. Sample preparation was done by ALS Chemex in Adelaide, South Australia, followed by assaying for gold by ALS Chemex in Perth, Western Australia. A sample quality control/quality assurance program was implemented and check assaying was done by Genalysis Laboratory Services Pty Ltd. in Perth. Multi-element analyses, including copper, were done by ALS Chemex, also in Perth. Sampling and assaying methods were conducted in accordance with the CIM Mineral Exploration Best Practices Guidelines. All samples taken were one meter in length, except the last interval of the drill hole.
As a result of the drill program in 2007, we announced in February 2008 the results of an updated NI 43-101 estimate of mineral resources for the Batman deposit. The estimate incorporated the results of 9,460 assay intervals from 25 drill holes (all core holes) drilled by us in 2007. These results are in addition to the results of 91,225 assay intervals from 730 drill holes (225 core, 435 reverse circulation and 70 rotary drill holes) completed by prior operators.
In April 2008, we announced the results of a subsequent NI 43-101 estimate of silver and copper mineralization in the Batman deposit. This estimate was completed utilizing standard industry software and estimation methodology. The estimate incorporates the results of 9,460 assay intervals from 25 drill holes (all core holes) drilled by us in 2007 with assaying completed by an independent lab. These results are in addition to the results of 87 copper assays completed on random intervals from 730 drill holes (225 core, 435 reverse circulation and 70 rotary drill holes) completed by prior operators. From the un-mined portion of the 730 drill holes previously completed, we submitted 2,979 intervals of core for re-assay and multi-element analysis. The re-assay and multi-element analysis was incorporated into the estimate.
In late January 2009, we announced the results of an updated NI 43-101 gold resource estimate on the Batman deposit, which was published on February 27, 2009. This estimate was completed utilizing standard industry software and estimation methodology. The updated estimate of mineral resource incorporated the results of 7,367 assay intervals from 14 drill holes (all core holes) drilled by us in 2008 with sample preparation and assaying completed by a third party. These results were in addition to the results of 100,685 assay intervals from 755 drill holes (250 core, 435 reverse circulation and 70 rotary drill holes) completed previously by historical operators and us, which were used in the previous updates of the Mt. Todd resource estimate. For the purposes of the February 27, 2009 mineral resource estimate, a cut-off grade of 0.50 gold grams per tonne was used.
Sampling and Analysis
All assaying was fire assay on 50-gram charges. It is the opinion of Tetra Tech MM, Inc. (“Tetra Tech”) that quality control and quality assurance methods employed by the various companies working at Mt. Todd were standard at the time of the work, and the work, including quality control and quality assurance methods, has been audited several times by independent consultants.
As part of the 2007 exploration program, we embarked on a program to both verify the historic assay results and ensure that any future analytical work meets all current NI 43-101 standards for reporting of mineral resources. This program consisted of two components; re-assaying of a portion of the historic drill holes, and assaying of the new core drill holes.
We completed a multi-phase program to evaluate the accuracy of gold assays generated by NAL on Mt Todd core samples. The test involved three phases including, 1) cross-checking assay standards used in the program between NAL and ALS-Chemex, 2) preparing and assaying 30 one-meter intervals of remaining half-core and detailed analysis of crushing and analytical performance between the two labs, and 3) screen sieve assay analysis of 45 coarse reject samples plus the 45 comparable remaining half-core samples.
Analysis of the results from the two labs confirmed that finer material tends to be higher grade and that this fine material had been preferentially lost through the coarse-weave sample bags during storage and handling of the coarse reject samples. The test also showed good reproducibility between labs in all tests at grade ranges typical of the deposit. Greater variance, which is not unexpected, showed up in the few samples assaying in the 5 to 20 gold grams per tonne range.
We used a sampling method and approach that was similar to what has historically been used at the Mt Todd gold project. The drill core, upon removal from the core barrel, was photographed, geologically logged, geotechnically logged, and placed into metal core boxes. The metal core boxes were transported to the sample preparation building where the core was marked and sawn into halves. One-half was placed into sample bags as one-meter sample lengths, and the other half retained for future reference. The only exception to this was when a portion of the remaining core was flagged for use in the ongoing metallurgical testwork.
The bagged samples had sample tags placed both inside and on the outside of the sample bags. The individual samples were grouped into “lots” for submission to the independent lab for preparation and analytical testing. All of this work was done under the supervision of a Vista Gold geologist.
Together with Tetra Tech, we developed an assay protocol for the analyses of the 2008 exploration drill core and for validation of the historic assays.
Sample Preparation, Analyses and Security
The 2008 diamond drilling program was conducted under the supervision of the Geologic Staff which was composed of our Chief Geologist, several contract expatriate geologists, and a core handling/cutting crew. The core handling crew was casual labor recruited locally.
Facilities for the core processing included an enclosed logging shed and a covered cutting and storage area that was fenced in. Both of these facilities were considered to be limited access areas and kept secured when work was not in progress.
The diamond drill core was boxed and stacked at the rig by the drill crews. Core was then picked up daily by members of the core cutting crew and transported directly into the logging shed.
Processing of the core included photographing, geotechnical and geologic logging, and marking the core for sampling. The nominal sample interval was one meter. When this process was completed, the core was moved into the core cutting/storage area where it was laid out for sampling. The core was laid out for the following procedures:
|
|
·
|
one-meter intervals were marked out on the core by a member of the geologic staff;
|
|
|
·
|
geotechnical logging was done in accordance with the instructions received from SRK;
|
|
|
·
|
geologic logging was then done by a member of the geologic staff. Assay intervals were selected at this time and a cut line marked on the core. The standard sample interval was one meter. During the early part of the program some flexibility was allowed for portions of the core that were not expected to return significant values based on visual inspection. These portions of the core were sampled in two meter intervals. This was discontinued when numerous greater than one part per million assays were received from the two meter intervals;
|
|
|
·
|
blind sample numbers were then assigned and sample tickets prepared. Duplicate sample tickets were placed in the core tray at the appropriate locations; and
|
|
|
·
|
each core tray was photographed and restacked on pallets pending sample cutting.
|
The core was then cut using diamond saws with each interval placed in marked plastic bags. At this time, the standards and blanks were also placed in plastic bags for inclusion in the shipment. When a sequence of five samples was completed, they were placed in a shipping bag and closed with a zip tie. All of these samples were kept in the secure area until crated for shipping.
Samples were then placed in crates for shipping with 100 samples per crate (20 shipping bags). The crates were secured with padlocks and numbered globe seals as soon as they were loaded. The secured crates were stacked outside the core shed until picked up for transport.
Sample shipments were scheduled for approximately once per week. The sealed crates were picked up on site by the transport company for road transport to the preparation facility. A confirmation note was prepared and signed by both the shipping company and the geologist supervising the loading. These confirmation notes were attached to the sample inventory and filed in the geology office on site.
When the shipment left site, sample transmittals were prepared and e-mailed to ALS Chemex. When the shipment arrived at the preparation facility, the samples were laid out and a confirmation of sample receipt was e-mailed back to Vista Gold.
ALS Chemex was selected as the primary laboratory for all further preparation and analysis, and the closest ALS Chemex facility with the capability of preparing the samples to the desired specifications was its sample preparation facility located in Adelaide. A series of padlocks was purchased for the sample crates and keys to these padlocks were sent to the sample preparation facility. ALS Chemex was instructed to notify Vista Gold immediately if a crate of samples arrived without the padlocks or if the globe seals were missing or showed evidence of tampering.
After the samples were prepared, a split of the pulp was shipped directly to the ALS Chemex laboratory located in Perth for analysis. The ALS Chemex sample preparation facility also prepared splits of the designated pulps and coarse rejects for cross-laboratory checks. Genalysis was selected as the secondary laboratory to do the QA/QC checks. When a batch of samples was prepared, the selected pulps and coarse rejects were shipped via TNT to the Genalysis sample preparation facility in Adelaide for the cross-laboratory check analyses. ALS Chemex sent Vista Gold an e-mail list of samples transmitted to Genalysis when they were shipped. When this notification was received by Vista Gold, sample transmittals were prepared and e-mailed to Genalysis.
When the additional sample preparation work was completed, the Genalysis sample preparation facility in Adelaide shipped the pulps to its laboratory in Perth for the cross-laboratory check analyses.
Preliminary Economic Assessment and Updated Estimate of Gold Mineralization
In June 2009, we announced the results of a preliminary economic assessment (the “Mt. Todd PEA”) with an updated estimate of gold resources under NI 43-101 criteria for the Batman Deposit completed for us by Tetra Tech. This study was completed by or under the supervision of Mr. John Rozelle, P.G., an independent qualified person, utilizing standard industry software and estimation methodology. The technical report summarizing the results of the Mt. Todd PEA and updated mineral resource estimate entitled “Mt Todd Gold Project Updated Preliminary Economic Assessment Report, Northern Territory, Australia” dated June 11, 2009 is available on SEDAR at
www.sedar.com
.
The updated estimate of mineralized material (mineral resource estimate under CIM Definition Standards) incorporates the results of 108,052 assay intervals from and assaying completed by ALS Chemex. These results are in addition to the results of 769 drill holes (250 core, 435 reverse circulation and 70 rotary drill holes) completed previously by BHP Resources Pty Ltd., Zapopan NL, Pegasus Gold Australia Pty Ltd. and Vista Gold. The deposit has a drill hole spacing that varies from 25 meters by 25 meters to 80-100 meters by 80-100 meters and generally averages 50 meters by 50 meters.
As stated in Tetra Tech’s report, “…the Mt. Todd Project has an excellent drillhole database comprised of drill core, photographs of the drill core, assay certificates and results, and geologic logs. The meticulous preservation of the drill core and associated “hard copies” of the data are a testament to the originators of the project and the subsequent companies that have looked at the project. All data are readily available for inspection and verification. In addition, most of the subsequent companies or their consultants that have examined the project have completed checks of the data and assay results. Other than the “normal” types of errors inherent in a project this size, (i.e. mislabeled intervals, number transpositions, etc.), which were corrected prior to Tetra Tech’s resource estimation, it is Tetra Tech’s opinion that the databases and associated data are of a “high quality” in nature. Tetra Tech found no significant discrepancies with the existing drillhole geologic logs and is satisfied that the geologic logging, as provided for the development of the three-dimensional geologic models, fairly represents both the geologic and mineralogic conditions of each of the deposits that comprise the Mt. Todd Project.”
Based on the report, under SEC Industry Guide 7 guidelines, mineralized material for the Batman deposit, above a cut-off grade of 0.40 grams gold per tonne, is estimated at 190,939,000 tonnes grading 0.84 grams gold per tonne.
Under CIM Definition Standards, at the same cut-off grade of 0.40 grams gold per tonne, measured mineral resources are estimated at 52,919,000 tonnes grading 0.91 grams gold per ton, indicated mineral resources are estimated at 138,020,000 tonnes grading 0.81 grams gold per tonne and inferred mineral resources are estimated at 94,008,000 tonnes grading 0.74 grams gold per tonne. The estimate of mineral resources reported in the June 2009 Mt. Todd PEA represents an increase in estimated measured mineral resources
of 119,000 ounces of gold, an increase in indicated mineral resources of 460,000 ounces of gold and an increase in the combined estimated measured and indicated mineral resources of 579,000 ounces of gold (12.8%) from the mineral resource estimate reported in February 2009.
Cautionary Note to U.S. Investors: see the section heading “Cautionary Note to United States Investors Regarding Estimates of Measured, Indicated and Inferred Resources and Proven and Probable Reserves” above.
There are no known issues that might affect these estimates of mineralized material or mineral resources.
The Mt. Todd PEA reflects the technical studies which Vista Gold has undertaken since the issuance of the initial
preliminary economic assessment on December 29, 2006, including over 18,000 meters of diamond drilling, a two-year metallurgical test program which included crushing and grinding, flotation and leach testwork, mine design and various preliminary engineering studies and cost estimates.
The Mt. Todd PEA envisioned a 30,000-tonne per day (nominally 10.5 million tonnes per year) ore mining operation with a 15.2 year mine life in the base case. The owner-operated mine fleet would include 141 tonne trucks and 18 cubic meter shovels. Three stages of crushing followed by high-pressure grinding rolls would be used to reduce the ore. Metallurgical testing to date indicates that a gold recovery of 82% can be achieved in a whole-ore leach with a grind-circuit product of 80% passing 100 mesh. Tailings disposal would be accomplished by dry-stacking of tailings as described in the Mt. Todd PEA.
Three potential operating scenarios were evaluated using a gold price of $750 per ounce (three-year running average as of first quarter 2009), an exchange rate of US$1 = A$1.35 and first quarter 2009 costs. The results of the Mt. Todd PEA indicate that development of the base-case alternative would have an estimated cash cost of $453 per ounce and a pre-tax IRR of 21.6%. All analyses were done on a pre-tax basis in order to guide future study without introducing a taxation variable. Payback of initial capital invested would be three years from the start of production. The total gold mined over the 15.2 year mine life is estimated to be 4,526,000 ounces, with an estimated annual production of 245,500 ounces (with average production over the first three years of 296,700 ounces). The Mt. Todd PEA estimated that an economic gold cut-off grade of approximately 0.40 grams gold per tonne should be employed which results in a 12.8% increase (579,000 ounces) in measured and indicated mineral resources as compared to the 0.50 grams gold per tonne cutoff grade employed in the previous preliminary economic assessment. At a gold price of $950 per ounce the estimated pre-tax IRR is 37.7%.
Cautionary Note to U.S. Investors: see the section heading “Cautionary Note to United States Investors Regarding Estimates of Measured, Indicated and Inferred Resources and Proven and Probable Reserves” above. See the section heading “Cautionary Note to All Investors Concerning Economic Assessments that Include Mineral Resources.”
Additional information on the results of the Mt. Todd PEA can be found in our press release dated June 4, 2009, and in the study which is posted on SEDAR.
Development
In 2010, we undertook two drilling programs at the Batman deposit, and in the first program we completed 14 core and six reverse circulation drill holes (8,291 total meters drilled) in a program designed to add resources through in-fill drilling in the parallel structures to the east (hanging wall) of the core zone of the Batman deposit, to test/condemn hypothesized extensions of the deposit along strike and to the west of the core zone, and to provide core for metallurgical testing. The program concluded with the in-fill drilling of the parallel structures on the east of the Batman deposit. The drill holes were oriented to the west to intersect the core zone at right angles and were inclined at -55 to -60 degrees. Boart Longyear of Mitchell Park, South Australia, performed the drilling.
Included in the total were three core holes totaling 1,469 meters, that were located and oriented to provide core samples for metallurgical testing, representative of the Batman deposit, in the area of the pit defined by the June 2009 Mt. Todd PEA. The holes were drilled at -20 to -30 degree dips, at an acute angle to the strike of the deposit and were not assayed due to the requirements for whole core to be used in the planned metallurgical testing program.
The core was logged, photographed and sampled by employees and consultants of Vista Gold Australia under the direction of our Vice President of Exploration, Frank Fenne, P.G., who is a qualified person within the meaning of NI 43-101. Core samples to be assayed were shipped to the ALS-Chemex sample preparation lab in Alice Springs, Australia. Prepared sample pulps were shipped by ALS-Chemex to its assay lab in Perth, Australia. Check assaying was done by Genalysis of Perth, Australia. Core logging and sample custody, preparation and assaying were completed in compliance with NI 43-101 standards. Sample preparation, assaying and security protocols followed those developed in 2008 by Tetra Tech and Vista Gold, as described in the
Sample Preparation, Analyses and Security
section above.
We subsequently drilled one additional core hole in 2010 into the parallel structures in the hanging wall east of the core zone for 726 meters. Drilling was by Grid Drilling of Townsville, North Queensland. The core was logged, photographed and sampled by our employees and consultants under the direction of Vista’s Vice President of Exploration, Frank Fenne P.G., who is a qualified person under NI 43-101. Core was sawed in half by our employees and consultants and one half shipped to NAL’s, for sample preparation and assaying. Check assaying was done by Genalysis of Perth, Australia. Core logging and sample custody, sample preparation and assaying for all drill holes completed during 2010 followed those developed in 2008 by Tetra Tech and Vista Gold, as described in the Sample Preparation, Analyses and Security section above.
Preliminary Feasibility Study and Updated Estimate of Gold Mineralization, October 2010 (6.77 million tonnes ore per year)
On August 8, 2010, we announced the positive results of a PFS for the Batman deposit. The PFS was constrained to consider tailings from mineral reserves that could be accommodated by the existing tailings storage capacity of 60 million tonnes. The PFS was managed by Tetra Tech of Golden, Colorado, which also undertook the resource modeling and estimation, geotechnical, environmental and site reclamation engineering and design. Mr. John Rozelle, PG, Manager of Tetra Tech’s Mineral Resource Division and Principal Geologist, an independent qualified person as defined by NI 43-101, prepared or supervised the preparation of material on behalf of Tetra Tech. Mr. Thomas Dyer, P.E., of MDA of Reno, Nevada, an independent qualified person as defined by NI 43-101, prepared or supervised the preparation of material on behalf of MDA. Mr. Rozelle and Mr. Dyer prepared or supervised the preparation of the information that forms the basis for the scientific and technical information disclosed herein. The technical report summarizing the results of the PFS and updated mineral resource estimate entitled “Mt Todd Gold Project Prefeasibility Study, Northern Territory, Australia” dated October 1, 2010, is available on SEDAR at
www.sedar.com
.
The PFS was evaluated using the three-year trailing average gold price of $950 per ounce. Mineral reserve estimates and production highlights are tabulated below.
Production Highlights, October 2010 PFS
(1)
|
Reserves and Production Estimates at $950 per gold ounce
|
|
|
Proven and Probable Mineral Reserves (at a 0.55 grams gold per tonne cut-off)*
|
60,049,000 tonnes
at 1.05 grams gold per tonne
|
|
Life of Mine Production
|
1,662,000 gold ounces
|
|
Average Annual Production (based on 8.86 year mine life)
|
187,500 gold ounces per year
|
|
Mining Rate (ore plus waste)
|
22,900,000 tonnes per year
|
|
Mill Throughput Rate
|
18,500 tonnes per day
|
|
Stripping Ratio (waste:ore)
|
2.37
|
|
Mine Life
|
8.86 years
|
* Elevated cutoff grades were used to constrain the total estimated mineral reserve tonnes to the remaining tailings capacity while maximizing return. In most areas, a cutoff grade of 0.55 grams gold per tonne was used. Select benches in the first two phases of mining used a cutoff grade of 0.60 grams gold per tonne.
(1)
Cautionary Note to U.S. Investors
:
Proven and Probable Mineral Reserves as described in this table are based on Canadian definitions under NI 43-101. These Reserves are based on a pre-feasibility study. Reserves for SEC Industry Guide 7 purposes require definitive or “final” feasibility study.
See the section heading
“
Cautionary Note to United States Investors Regarding Estimates of Measured, Indicated and Inferred Resources and Proven and Probable Reserves” above
The PFS was completed using the three-year trailing average gold price of $950 per ounce and a foreign exchange rate of $0.85 = A$1.00 and incorporates mid-2010 costs. The following table summarizes the economic results with a comparison to the sensitivity at a gold price of $1,200 per ounce and a foreign exchange rate of $0.90 = A$1.00.
Summary of Economic Results
|
$950 per gold ounce & $0.85/A$1.00
|
$1,200 per gold ounce & $0.90/A$1.00
|
|
|
Average Cash Operating Cost ($ per gold ounce produced)
|
$476
|
$493
|
|
Average Total Cash Production Costs ($ per gold ounce produced)
|
$487
|
$507
|
|
Pre-Production Capital Cost:
|
$441,258,000
|
$459,820,000
|
|
Sustaining Capital Cost:
|
$32,981,000
|
$32,981,000
|
|
Internal Rate of Return
|
14.9% before tax
9.8% after tax
|
25.4% before tax
16.2% after tax
|
|
Cumulative Cash Flow (pre-tax)
|
$472,615,000
|
$848,724,000
|
|
Net Present Value at 5% discount (pre-tax)
|
$210,144,000
|
$487,156,000
|
Mineral Resources and Reserves Estimates for the October 2010 PFS
The October 2010 PFS is based on our updated gold mineral resource estimate for the Batman deposit as of June 11, 2009, which assumed a cutoff grade of 0.40 grams gold per tonne. Please see
Preliminary Economic Assessment and Updated Estimate of Gold Mineralization
above. In summary, based on the report, under SEC Industry Guide 7 guidelines, mineralized material for the Batman deposit net of mineral reserves, above a cut-off grade of 0.40 grams gold per tonne, is estimated at 130,889,000 tonnes grading 0.73 grams gold per tonne.
- 46 -
Also in summary, under CIM Definition Standards, net of mineral reserves and at the same cut-off grade of 0.40 grams gold per tonne, measured mineral resources are estimated at 28,461,000 tonnes grading 0.75 grams gold per tonne, indicated mineral resources are estimated at 102,428,000 tonnes grading 0.73 grams gold per tonne and inferred mineral resources are estimated at 94,008,000 tonnes grading 0.74 grams gold per tonne.
Cautionary Note to U.S. Investors: see the section heading “Cautionary Note to United States Investors Regarding Estimates of Measured, Indicated and Inferred Resources and Proven and Probable Reserves” above.
MDA used the June 2009 resource model to develop an open-pit mine design including intermediate pits plans and production schedules.
The mineral reserve estimates were prepared and reported by MDA, under the supervision of Mr. Dyer, and using the June 2009 resource model at a gold price of $950 per ounce and cut-off grade of 0.55 grams gold per tonne. Elevated cutoff grades were used to constrain the total estimated mineral reserve tonnes to the remaining tailings capacity while maximizing return. In most areas, a cutoff grade of 0.55 grams gold per tonne was used; however, select benches in the first two phases of mining used a cutoff grade of 0.60 grams gold per tonne. As mentioned previously, the PFS was evaluated using the three-year trailing average gold price of $950 per ounce (as of August 2010), and therefore, the qualified person believes the reserve estimate is the same under both SEC Industry Guide 7 and CIM Definition Standards. The reserve estimates are shown in the following table.
Reserves Estimated at Mt. Todd, October 2010 PFS
|
Reserve Classification
|
Tonnes
|
Average Gold Grade
(grams gold per tonne)
|
|
Proven
(1,2, 3)
|
24,458,000
|
1.09
|
|
Probable
(1, 2, 3)
|
35,592,000
|
1.02
|
|
Proven & Probable
(1,2 3)
|
60,050,000
|
1.05
|
|
|
(1)
|
Mineral reserves are reported separately from mineral resources.
|
|
|
(2)
|
Cautionary Note to U.S. Investors
: Proven and Probable Mineral Reserves as described in this table are based on Canadian definitions under NI 43-101. These Reserves are based on a pre-feasibility study. Reserves for SEC Industry Guide 7 purposes require definitive or “final” feasibility study. See the section heading
“
Cautionary Note to United States Investors Regarding Estimates of Measured, Indicated and Inferred Resources and Proven and Probable Reserves” above.
|
|
|
(3)
|
See the section heading “Item 1A. Risk Factors” in this annual report.
|
Capital and Operating Cost Estimate, October 2010 PFS
Estimated life-of-mine average total cash production costs are projected to be $487 per ounce, with the highest costs occurring in the first five years of the project. The latter half of the project life benefits from decreases in the required stripping. Pre-production capital costs, including contingency, owner's costs and working capital, are estimated to be $441 million and sustaining capital over the life of the mine is estimated to be $33 million. Post-operation reclamation costs are not included in the total capital costs, but are included in the cash flow analyses and return on investment calculations.
Mining, October 2010 PFS
We plan to extract ore from the mine using conventional open-pit mining equipment and techniques. A waste mining fleet consisting of 180-tonne trucks and 21-cubic meter shovels has been selected to complement the 140-tonne truck and loader ore-mining fleet. We would be the owner and operator of the mining fleets and we expect to enter into maintenance and repair contracts for the major mining equipment. Ore will be mined in three pit development phases over a period of 8.86 years. Waste rock will be placed in a single waste dump and concurrent reclamation is planned for the lower benches of the dump.
Processing, October 2010 PFS
Following an extensive review of the plant performance data from previous operators, it was clear to us that there were a number of key reasons why these operations were unsuccessful. As a result, we undertook mineralogical and metallurgical studies to fully understand the type of ore that would be treated over the life of the proposed mine. This was followed by laboratory test programs that evaluated the metallurgical process, proposed equipment and the expected performance and cost parameters. We believe the principal reasons that led to the previous operational failure were:
|
|
·
|
Ore hardness - the plant built by the previous operator was poorly designed to handle the hard ore and failed to produce a satisfactory product or achieve design capacity. We tested and determined the expected ore hardness and then evaluated various combinations of equipment. The best combination of equipment involved primary and secondary crushing, tertiary crushing employing high pressure grinding rolls (“HPGR”) followed by a large ball mill. The use of HPGR is expected to result in a product which significantly improves the efficiency of the grinding circuit. For the base case, the circuit is very simple with a large primary gyratory crusher, a secondary cone crusher, a single HPGR unit and a single ball mill.
HPGR technology is currently being successfully used by Newmont Mining Corporation, at Australia’s largest gold mine, the 20 million ounce Boddington mine in Western Australia
.
The circuit has been designed to reflect the results of leach tests which indicate that the optimum grind size should be 80% passing 100 mesh, coarser than used in previous operations.
|
|
|
·
|
Metallurgy - A number of metallurgical problems were encountered in the past, mostly related to copper minerals in the ore. Our test program focused first on understanding the form and distribution of the copper minerals in the ore body and then on the best metallurgical approach to deal with the copper. In the mineralogical review it became apparent that the form of the copper minerals changes with depth. In the upper part of the ore body, mostly mined out by previous operators, the copper existed mainly as secondary copper minerals such as chalcocite, bornite and covellite; these minerals are very soluble in cyanide which greatly increased the expense of leaching. The remaining ore contains mainly primary copper minerals like chalcopyrite which generally has a very minor effect on leaching and cyanide consumption. The tests we undertook on representative samples of the ore to be mined showed that whole-ore leaching combined with a carbon-in-pulp recovery circuit yields acceptable recoveries of 82%.
|
The proposed plant would have a design capacity of 18,500 tonnes per day and was designed to be simple, efficient and easy to maintain. The proposed flowsheet indicates that following grinding, the slurried ore will be sized by cyclones, thickened, pre-aerated, and then leached in tanks prior to recovery in a hybrid carbon-in-pulp circuit. Gold will be stripped from the carbon and precipitated in an electrowinning cell prior to refining into doré bars. The tailings will be detoxified using the SO
2
/Air process and deposited in the existing tailings impoundment facility.
Further contributing to lower costs, the proposed project will self-generate power using low-cost natural gas which can be supplied to the site via the existing natural gas pipeline. The project also includes plans to produce lime from near-by limestone deposits, thereby significantly reducing the supply cost for this reagent.
Infrastructure, October 2010 PFS
As a previously operated project, the Mt. Todd gold project site has existing infrastructure which includes a fresh water storage reservoir with sufficient capacity to sustain the proposed operation, paved access roads, concrete foundations for some of the crushing circuit, a natural gas pipeline and an electrical power line. Power will be generated on site using a gas-turbine generator which is included in the project capital. The power plant is designed to have excess capacity to meet higher loads during large equipment starting up. Excess power during operations will be sold into the grid further reducing expected costs. During the nine-year post-closure period, we intend to continue operating the natural gas turbine power generating plant. Revenues derived from selling power to the grid during this period are expected to fund all of the reclamation activities.
Environmental, October 2010 PFS
The PFS includes engineering designs for the closure of the mine site following cessation of production. The closure plan was designed to meet all requirements for long-term reclamation of the site and cost estimates include provisions for monitoring required under applicable law.
Economic Analysis, October 2010 PFS
As mentioned previously, the PFS economic analysis was completed using the three-year trailing average gold price of $950 per ounce and foreign exchange rate of $0.85 = $AUD1.00. We have also completed sensitivity analyses calculated at gold prices of $1,000, $1,100, $1,200 and $1,500 per ounce. The $1,200 and $1,500 sensitivity analyses incorporate the foreign exchange rate current in August 2010 of $0.90 = AUD$1.00. Estimated before and after tax economic results, showing the IRR and NPV
5%,
cumulative cash flow and sensitivity to changes in gold price are shown in the following tables.
Before–Tax Economic Results
|
Gold Price Scenario
|
Before Tax
IRR
|
Before Tax
NPV
5%
|
Before Tax
Cumulative Cash Flow
|
|
$950 Gold Price
|
14.9 %
|
$ 210,144,000
|
$ 472,615,000
|
|
$1000 Gold Price
|
17.5 %
|
$ 272,260,000
|
$ 554,865,000
|
|
$1,100 Gold Price
|
22.6 %
|
$ 396,494,000
|
$ 719,366,000
|
|
$1,200 Gold Price
|
25.4 %
|
$ 487,156,000
|
$ 848,724,000
|
|
$1,500 Gold Price
|
39.3 %
|
$ 859,856,000
|
$ 1,342,227,000
|
After-Tax Economic Results
|
Gold Price Scenario
|
After Tax
IRR
|
After Tax
NPV
5%
|
After Tax
Cumulative Cash Flow
|
|
$950 Gold Price
|
9.8 %
|
$ 71,127,000
|
$ 252,490,000
|
|
$,1,000 Gold Price
|
11.4 %
|
$ 100,497,000
|
$ 207,598,000
|
|
$1,100 Gold Price
|
14.5 %
|
$ 158,192,000
|
$ 359,190,000
|
|
$1,200 Gold Price
|
16.2 %
|
$ 198,827,000
|
$ 418,218,000
|
|
$1,500 Gold Price
|
23.9 %
|
$ 359,612,000
|
$ 624,317,000
|
New Preliminary Feasibility Study, January 2011 (10.65 million tonnes ore per year)
On January 4, 2011, we announced the positive results of a new PFS for the Batman deposit. The new PFS was managed by Tetra Tech, and expands upon the PFS previously completed by Tetra Tech dated October 1, 2010, and announced on August 18, 2010. Tetra Tech undertook the resource modeling and estimation, geotechnical, environmental and site reclamation engineering and design for the new PFS. Mr. John Rozelle, PG, Manager of Tetra Tech’s Mineral Resource Division and Principal Geologist, an independent qualified person as defined by NI 43-101, prepared or supervised the preparation of material on behalf of Tetra Tech. Mr. Thomas Dyer, P.E., of MDA of Reno, Nevada, an independent qualified person as defined by NI 43-101, prepared or supervised the preparation of material on behalf of MDA. Mr. Rozelle and Mr. Dyer prepared or supervised the preparation of the information that forms the basis for the scientific and technical information disclosed herein. The technical report summarizing the results of the PFS and updated mineral resource estimate entitled “10.65 MTPY Preliminary Feasibility Study, NI 43-101 Technical Report, Mt Todd Gold Project, Northern Territory, Australia” dated January 28, 2011, is available on SEDAR at
www.sedar.com
.
The new PFS evaluates the viability of a 30,000 tonne per day processing facility and the optimized extraction of the identified mineral resource. The previous PFS was constrained to treating mineralized material, the volume of which would be accommodated in the existing tailings disposal facility ( 60,000,000 tonnes). The operating rate was 18,500 tonnes per day of ore compared to the higher, and more economical rate of 30,000 tonnes per day considered in the new study. A new tailings disposal facility would be constructed to accommodate the excess tails from the increased ore reserves in the new
PFS.
Highlights of the new PFS include increased proven and probable mineral reserves, higher annual gold production, longer project life and improved economics at current and long-term estimated gold prices.
The PFS was evaluated using a gold price of $1,000 per ounce, which, as year-end 2010, is less than the three-year trailing average of $1,022 per ounce. Therefore, the qualified person believes the reserve estimate is the same under both SEC Industry Guide 7 and CIM Definition Standards. Mineral reserve estimates and production highlights are tabulated below.
Production Highlights, January 2011 PFS
|
Reserves and Production Estimates at $1,000 per ounce gold
|
|
|
Proven and Probable Mineral Reserves (at a 0.40 grams gold per tonne cut-off)
|
149.9 million tonnes
at 0.85 grams gold per tonne
|
|
Life of Mine Production
|
3,372,000 ounces
|
|
Average Annual Production
|
239,500 gold ounces per year
|
|
Mining Rate
|
29.5 million tonnes per year
|
|
Mill Throughput Rate
|
30,000 tonnes per day
|
|
Stripping Ratio (waste:ore)
|
1.8
|
|
Mine Life
|
14 years
|
|
|
(1)
|
Cautionary Note to U.S. Investors
: Proven and Probable Mineral Reserves as described in this table are based on Canadian definitions under NI 43-101. These Reserves are based on a pre-feasibility study. Reserves for SEC Industry Guide 7 purposes require definitive or “final” feasibility study. See the section heading
“
Cautionary Note to United States Investors Regarding Estimates of Measured, Indicated and Inferred Resources and Proven and Probable Reserves” above
|
By utilizing the remaining capacity in the project’s existing tailings storage facility and deferring the capital for additional tailings storage capacity until later in the project’s life, we have been able to increase the size of the proposed process facility to a more economic level of 30,000 tonnes per day and increase the projected annual production to 250,000 ounces per year over the first five years of the project. Based on these positive results, we have now commenced a feasibility study for the Mt. Todd gold project that we expect to complete in the latter part of 2011. As part of the feasibility study program, we will undertake studies to further optimize the proposed operation, evaluate opportunities to reduce estimated capital costs and enhance project returns.
The new PFS was completed using a foreign exchange rate of $0.85 = AUD$1.00 and incorporates mid-2010 costs. The following table summarizes the economic results at a gold price of $1,000 per ounce with a comparison to economic results at a gold price of $1,350 per ounce and a foreign exchange rate of $1.00 = A$1.00.
Summary of Economic Results
|
$1,000 per gold ounce & $0.85/AUD$1.00
|
$1,350 per gold ounce & $1.00/AUD$1.00
|
|
|
Average Cash Operating Cost ($ per gold ounce produced)
|
$520
|
$587
|
|
Average Total Cash Production Costs ($ per gold ounce produced)
|
$530
|
$600
|
|
Pre-Production Capital Cost:
|
$589,583,000
|
$675,957,000
|
|
Sustaining Capital Cost:
|
$260,522,000
|
$261,183,000
|
|
Internal Rate of Return
|
13.9% before tax
10.7% after tax
|
23.2% before tax
16.6% after tax
|
|
Cumulative Cash Flow (pre-tax)
|
$964,514,000
|
$1,860,112,000
|
|
Net Present Value at 5% discount (pre-tax)
|
$385,336,000
|
$944,470,000
|
Mineral Resources and Reserves Estimates, January 2011 PFS
The new PFS is based on our gold mineral resource estimate for the Batman deposit at the Mt. Todd gold project as of June 11, 2009, which assumed a cutoff grade of 0.40 grams of gold per tonne. The resource estimate is detailed in the report “Mt. Todd Gold Project - Updated Preliminary Economic Assessment Report - Northern Territory, Australia” dated June 11, 2009, and is available on SEDAR at
www.sedar.com
. Please see
Preliminary Economic Assessment and Updated Estimate of Gold Mineralization
above. In summary, based on the report, under SEC Industry Guide 7 guidelines and net of mineral reserves, mineralized material for the Batman deposit, above a cut-off grade of 0.40 grams gold per tonne, is estimated at 41,064,000 tonnes grading 0.77 grams gold per tonne.
Also in summary, under CIM Definition Standards, at the same cut-off grade of 0.40 grams gold per tonne and net of mineral reserves, measured mineral resources are estimated at 3,958,000 tonnes grading 0.88 grams gold per tonne, indicated mineral resources are estimated at 37,106,000 tonnes grading 0.76 grams gold per tonne and inferred mineral resources are estimated at 94,008,000 tonnes grading 0.74 grams gold per tonne.
Cautionary Note to U.S. Investors: see the section heading “Cautionary Note to United States Investors Regarding Estimates of Measured, Indicated and Inferred Resources and Proven and Probable Reserves” above.
MDA used the June 2009 resource model to develop an open pit mine design, including intermediate pits plans and production schedules.
The mineral reserve estimates shown in the following table were prepared and reported by MDA, under the supervision of Mr. Dyer, using the June 2009 resource model at a cut-off grade of 0.40 grams of gold per tonne with a three-year trailing gold price of $1,000 per ounce of gold, which as of year-end 2010, is less than the three-year trailing average of $1,022 per ounce. Therefore, the qualified person believes the reserve estimate is the same under both SEC Industry Guide 7 and CIM Definition Standards.
Batman Deposit Reserves Estimated at Mt. Todd, January 2011 PFS
|
Reserve Classification
|
Tonnes
|
Average Gold Grade
(grams gold per tonne)
|
|
Proven
(1,2 and 3)
|
48,961,000
|
0.91
|
|
Probable
(1, 2 and 3)
|
100,914,000
|
0.83
|
|
Proven & Probable
(1,2 and 3)
|
149,875,000
|
0.85
|
|
|
(1)
|
Mineral reserves are reported separately from mineral resources.
|
|
|
(2)
|
Cautionary Note to U.S. Investors
: Proven and Probable Mineral Reserves as described in this table are based on Canadian definitions under NI 43-101. These Reserves are based on a pre-feasibility study. Reserves for SEC Industry Guide 7 purposes require definitive or “final” feasibility study. See the section heading
“
Cautionary Note to United States Investors Regarding Estimates of Measured, Indicated and Inferred Resources and Proven and Probable Reserves” above.
|
|
|
(3)
|
See the section heading “Item 1A. Risk Factors” in this annual report.
|
Capital and Operating Cost Estimate, January 2011 PFS
Estimated life-of-mine average cash production costs are projected to be $520 per gold ounce and include the cost of concurrent reclamation. The latter half of the project life benefits from decreases in the required stripping. Pre-production capital costs including contingency, owner’s costs and working capital are estimated to be $589.6 million and sustaining capital over the life of the mine is estimated to be $260.5 million, including $150.4 million for additional tailings storage capacity to be spent starting in year five.
Mining, January 2011 PFS
The mining fleet would be the same as envisioned in the October 2010 PFS (see
Preliminary Feasibility Study and Updated Estimate of Gold Mineralization, October 2011)
, but the ore will be mined in four pit development phases over a period of 14 years. Waste rock will either be placed in a single waste dump or used for tailings embankment construction. Concurrent reclamation is planned for the lower benches of the waste dump.
Processing, January 2011 PFS
Processing incorporated in the January 2011 PFS would be the same as in the October 2010 PFS (see
Preliminary Feasibility Study and Updated Estimate of Gold Mineralization, October 2010
) but at an increased rate of 30,000 tonnes per day of ore.
Infrastructure, January 2011 PFS
Infrastructure is the same as reported in the October 2011 PFS (see
Preliminary Feasibility Study and Updated Estimate of Gold Mineralization, October
2010).
Environmental, January 2011 PFS
The PFS includes engineering designs for the closure of the mine site following cessation of production. Where practical, concurrent reclamation activities would be undertaken to reduce the time and expense involved in the closure of the site. The closure plan was designed to meet all requirements for long-term reclamation of the site and cost estimates include provisions for monitoring required under applicable law.
Economic Analysis, January 2011 PFS
The economic analysis was completed using the three-year trailing average gold price of $1,000 per ounce and a foreign exchange rate of $0.85 = $A1.00. We also completed sensitivity analyses at gold prices of $1,200, $1,350 and $1,500 per ounce. The $1,200, $1,350 and $1,500 sensitivity analyses incorporate the current foreign exchange rate of $1.00 = A$1.00. Estimated before and after tax economic results, showing the IRR and NPV
5%
, cumulative cash flow and sensitivity to changes in gold price are shown in the following tables.
Before–Tax Economic Results
|
Gold Price Scenario
|
Before Tax
IRR
|
Before Tax
NPV
5%
|
Before Tax
Cumulative Cash Flow
|
|
$1,000 Gold Price
|
13.9 %
|
$ 385,336,000
|
$ 964,514,000
|
|
$1,200 Gold Price
|
17.1 %
|
$ 610,603,000
|
$ 1,359,383,000
|
|
$1,350 Gold Price
|
23.2 %
|
$ 944,470,000
|
$ 1,860,112,000
|
|
$1,500 Gold Price
|
29.1 %
|
$ 1,278,336,000
|
$ 2,360,841,000
|
After-Tax Economic Results
|
Gold Price Scenario
|
After Tax
IRR
|
After Tax
NPV
5%
|
After Tax
Cumulative Cash Flow
|
|
$1000 Gold Price
|
10.7 %
|
$ 184,312,000
|
$ 584,562,000
|
|
$1200 Gold Price
|
12.4 %
|
$ 284,528,000
|
$ 777,849,000
|
|
$1350 Gold Price
|
16.6 %
|
$ 475,309,000
|
$ 1,059,338,000
|
|
$1500 Gold Price
|
20.6 %
|
$ 664,986,000
|
$ 1,339,945,000
|
Mineral Resource Estimate for the Quigleys Deposit at the Mt. Todd Gold Project
On September 8, 2010, we announced that Tetra Tech, had reviewed the geology and calculated a mineral resource estimate in accordance with CIM Standards. The mineral resource estimate was conducted under the direction of Mr. John Rozelle, an independent qualified person as defined by NI 43-101 using standard industry software and resource estimation methodology. The Quigleys deposit is located 3.5 km northeast of the Batman deposit at our Mt. Todd gold project. The resource estimate is included in our preliminary feasibility report on the Batman deposit entitled “Mt Todd Gold Project Prefeasibility Study, Northern Territory, Australia” dated October 1, 2010, and is available on SEDAR at www.sedar.com.
Mineralization at the Quigleys deposit is interpreted to occur within a series of mineralized shears that strike north northwest and dip 30° - 35° to the west. The main shear extends for nearly one kilometer along the strike and has been drilled to a vertical depth of 230 meters. The mineral resource estimate has been defined by 632 drill holes drilled by Pegasus and Billiton Australia Gold Pty Ltd. in the late 1980s through the mid-1990s. Tetra Tech reviewed the integrity of the drill hole database and developed a computer model to estimate and classify the estimated mineral resources. The model reflected Tetra Tech’s geological interpretation of the deposit, which constrained the mineralization to the shear zones using geological information and assays from 49,178 samples obtained from the drilling. Lower grade, erratic mineralization in the hanging wall of the shears has not been included in the mineral resource estimate.
Sampling and assaying was done under the supervision of prior operators in conjunction with evaluation of the Batman deposit and are discussed in the PFS and the PEA, as part of the overall project sampling and assaying methodology. Please see the quote from Tetra Tech in the section titled
Preliminary Economic Assessment and Updated Estimate of Gold Mineralization
above.
Based on Tetra Tech’s resource analysis, at a cut-off grade of 0.50 grams of gold per tonne, under SEC Industry Guide 7 guidelines mineralized material for the Quigleys deposit is estimated at 6,076,000 tonnes grading 0.92 grams gold per tonne.
Under CIM Definition Standards, at the same cut-off grade of 0.50 grams gold per tonne, measured mineral resources are estimated at 511,000 tonnes grading 1.04 grams gold per ton, indicated mineral resources are estimated at 5,565,000 tonnes grading 0.91 grams gold per tonne and inferred mineral resources are estimated at 9,416,000 tonnes grading 0.95 grams gold per tonne.
Cautionary Note to U.S. Investors: see the section heading “Cautionary Note to United States Investors Regarding Estimates of Measured, Indicated and Inferred Resources and Proven and Probable Reserves” above.
Exploration Potential
We control a large land package (117,632 hectares) of exploration tenements surrounding the Mt. Todd gold project. In the third quarter of 2009, during a review of Pegasus’ airborne geophysical survey data, our geologists identified five magnetic targets on our exploration tenements. The targets are referred to as the Mt. Todd Structural Target Sequence (“MSTS”), and are characterized by distinct magnetic highs located within sedimentary rocks that should have a low magnetic signature. These features are remarkably similar to those at Mt. Todd, which, as a result of the included pyrrhotite, exhibits a strong magnetic high. The MSTS targets were prioritized following review of historic work in the area and site visits.
As we announced on June 29, 2010, four of the new exploration targets are being investigated through additional soil and rock-chip sampling and testing, followed, where appropriate, by drilling. Initial soil sampling on 100-meter by 100-meter grids was completed on MSTS3 and MSTS4 late in 2009 before the onset of the wet season. In this part of Australia, mining occurs on a year-round basis as appropriate road access is installed, but exploration is difficult to impossible during the wet season (November through April) due to unimproved road conditions in the field. Both targets returned low-level anomalous gold values. MSTS4 shows a magnetic high within low-signature silts and greywackes; however, there are no historic soil or rock-chip sampling results on MSTS4 and no evidence of any mining.
At MSTS4, rock chip sampling, in an area with limited exposure, returned a 25.0 grams gold per tonne sample from a small outcrop of fault breccia. Further sampling returned 23.0 grams gold per tonne and 7.7 grams gold per tonne assays in vein and breccias located 15 meters and 50 meters, respectively, north of the original sample. Due to the sparse outcrop, the orientation and thickness of the mineralized zone is not currently known. A soil sampling program over the area was completed on a 20-meter grid. The survey returned a strong coherent gold anomaly approximately 400 meters in diameter with coincident anomalous base metals and arsenic. Sampling was done by our employees and consultants under the direction of our Vice President of Exploration, Frank Fenne P.G., who is a qualified person under NI 43-101, and shipped to NAL for sample preparation and assaying. Sampling, sample custody, preparation and assaying were completed in compliance with NI 43-101 standards.
Beginning in August 2010, after receiving approvals for drilling and before the onset of the 2010-2011 wet season, we completed four core holes on MSTS4 (now known as “Golden Eye” because of its appearance resembling two eyes on a surface sample assay map), out of six that were planned. All four Golden Eye drill holes encountered strong sulfide mineralization associated with banded iron formation with interesting concentrations of copper, lead zinc and anomalous gold mineralization, with the best intercept occurring in hole GE10-003 and consisting of 1.1 meters of 7.69 grams gold per tonne including 0.3 meters of 26.7 grams gold per tonne. Drill results were encouraging and provided useful geologic information for next season’s exploration program, and we plan to resume drilling activities as soon as the wet season ends and access can be re-established. Drilling was done by Grid Drilling of Townsville, North Queensland. The core was logged, photographed and sampled by our employees and consultants under the direction of our Vice President of Exploration, Mr. Frank Fenne P.G., who is a qualified person under NI 43-101. Core was sawed in half by our employees and consultants and one half shipped to NAL for sample preparation and assaying. Check assaying was done by Genalysis of Perth, Australia. Core logging and sample custody, sample preparation and assaying were completed in compliance with NI 43-101 standards.
Yellow Pine, Idaho
Property Description and Location
The Yellow Pine gold project is located in the Salmon River Mountains of central Idaho in an area of historical gold, antimony and tungsten mining known as the Stibnite or Yellow Pine Mining District. The district is located in Valley County about 60 miles east of McCall, Idaho, and 11 miles southeast of the small settlement of Yellow Pine, Idaho. The project consists of 17 patented mining claims covering about 300 acres and 8 unpatented lode mining claims covering about 165 acres. A map showing the location of the mining claims and a table with a list of the mining claims and the holding requirements follow.
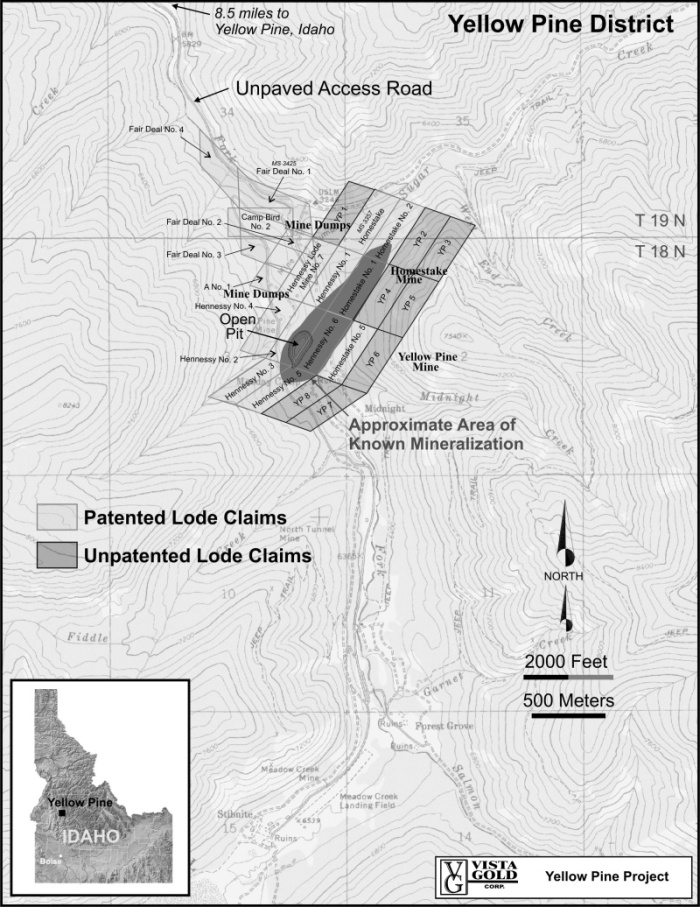
Patented Mining Claims at Yellow Pine Controlled by Vista Gold
|
Claim Name
|
Mineral Survey Number
|
Patent Number
|
Federal Claim Type
|
Surface Area (acres)
|
Location Description (Section, Township and Range)
|
Date Patent Recorded
|
Annual Holding Requirements
|
|
Fair Deal No. 1
|
3246
|
1064103
|
Patented Lode Mining Claim
|
Section 34, T19N, R9E, BM
|
6/7/1933
|
None to Vista Gold, Bradley (as defined
|
|
|
|
|||||||
|
Fair Deal No. 2
|
3246
|
1064103
|
Patented Lode Mining Claim
|
Section 34, T19N, R9E, BM
|
6/7/1933
|
below) pays County Property Taxes
|
|
|
|
|||||||
|
Fair Deal No. 3
|
3246
|
1064103
|
Patented Lode Mining Claim
|
81.174
|
Section 3, T18N, R9E, BM
|
6/7/1933
|
|
|
|
|||||||
|
Fair Deal No. 4
|
3246
|
1064103
|
Patented Lode Mining Claim
|
Section 34, T19N, R9E, BM
|
6/7/1933
|
||
|
|
|||||||
|
Camp Bird No. 2
|
3246
|
1064103
|
Patented Lode Mining Claim
|
Section 34, T19N, R9E, BM
|
6/7/1933
|
||
|
|
|||||||
|
A No. 1
|
3246
|
1064103
|
Patented Lode Mining Claim
|
Section 3, T18N, R9E, BM
|
6/7/1933
|
|
|
|
Hennessy No. 1
|
3357
|
1111588
|
Patented Lode Mining Claim
|
218.897
|
Sections 2 & 3, T18N, R9E, BM
|
7/9/1941
|
|
|
|
|||||||
|
Hennessy No. 2
|
3357
|
1111588
|
Patented Lode Mining Claim
|
Section 3, T18N, R9E, BM
|
7/9/1941
|
||
|
|
|||||||
|
Hennessy No. 3
|
3357
|
1111588
|
Patented Lode Mining Claim
|
Section 3, T18N, R9E, BM
|
7/9/1941
|
||
|
|
|||||||
|
Hennessy No. 4
|
3357
|
1111588
|
Patented Lode Mining Claim
|
Section 3, T18N, R9E, BM
|
7/9/1941
|
||
|
|
|||||||
|
Hennessy No. 5
|
3357
|
1111588
|
Patented Lode Mining Claim
|
Section 3, T18N, R9E, BM
|
7/9/1941
|
||
|
|
|||||||
|
Hennessy No. 6
|
3357
|
1111588
|
Patented Lode Mining Claim
|
Sections 2 & 3, T18N, R9E, BM
|
7/9/1941
|
||
|
|
|||||||
|
Hennessy Lode Mine No. 7
|
3357
|
1111588
|
Patented Lode Mining Claim
|
Section 3, T18N, R9E, BM
|
7/9/1941
|
|
Claim Name
|
Mineral Survey Number
|
Patent Number
|
Federal Claim Type
|
Surface Area (acres)
|
Location Description (Section, Township and Range)
|
Date Patent Recorded
|
Annual Holding Requirements
|
|
Homestake
|
3357
|
1111588
|
Patented Lode Mining Claim
|
Section 35, T19N, R9E, BM
|
7/9/1941
|
||
|
|
|||||||
|
Homestake No. 1
|
3357
|
1111588
|
Patented Lode Mining Claim
|
Sections 2 & 3, T18N, R9E, BM
|
7/9/1941
|
||
|
|
|||||||
|
Homestake No. 2
|
3357
|
1111588
|
Patented Lode Mining Claim
|
Section 35, T19N, R9E, BM
|
7/9/1941
|
||
|
|
|||||||
|
Homestake No. 5
|
3357
|
1111588
|
Patented Lode Mining Claim
|
Sections 2 & 3, T18N, R9E, BM
|
7/9/1941
|
||
|
Totals
|
17 Patented Lode Mining Claims
|
300.071
|
$0
|
Unpatented Mining Claims at Yellow Pine Controlled by Vista Gold
|
Claim Name
|
Serial Number
|
Federal Claim Type
|
Surface Area (acres)
|
Location Description (Section, Township and Range)
|
Location Date
|
Annual Holding Fee
|
|
YP 1
|
186740
|
Unpatented Lode Mining Claim
|
20.66
|
Sections 34 & 35, T19N, R9E, BM
|
10/15/2003
|
$125.00
|
|
YP 2
|
186741
|
Unpatented Lode Mining Claim
|
20.66
|
Section 2, T18N, R9E, BM
|
10/15/2003
|
$125.00
|
|
YP 3
|
186742
|
Unpatented Lode Mining Claim
|
20.66
|
Section 2, T18N, R9E, BM
|
10/15/2003
|
$125.00
|
|
YP 4
|
186743
|
Unpatented Lode Mining Claim
|
20.66
|
Section 2, T18N, R9E, BM
|
10/15/2003
|
$125.00
|
|
YP 5
|
186744
|
Unpatented Lode Mining Claim
|
20.66
|
Sections 2 & 3, T18N, R9E, BM
|
10/15/2003
|
$125.00
|
|
YP 6
|
186745
|
Unpatented Lode Mining Claim
|
20.66
|
Section 2, T18N, R9E, BM
|
10/15/2003
|
$125.00
|
|
YP 7
|
186746
|
Unpatented Lode Mining Claim
|
20.66
|
Section 2 & 3, T18N, R9E, BM
|
10/15/2003
|
$125.00
|
|
YP 8
|
186747
|
Unpatented Lode Mining Claim
|
20.66
|
Section 3, T18N, R9E, BM
|
10/15/2003
|
$125.00
|
|
Totals
|
8 Unpatented Lode Mining Claims
|
165.28
|
$1,000.00
|
Note
: all claims are Unpatented Federal Lode Mining Claims and do not expire provided annual fees are paid by August 31 of each year.
On November 7, 2003, we, through our indirect, wholly owned subsidiary, Idaho Gold Resources LLC (“Idaho Gold”), entered into an Option to Purchase Agreement with Bradley Mining Company (“BMC”) for a nine year option to purchase 100% of the patented claims at Yellow Pine for $1,000,000. Idaho Gold made an option payment of $100,000 upon execution of the agreement. The agreement calls for Idaho Gold to make nine more yearly payments of $100,000 on or before each anniversary date of the agreement, for a total option payment price of $1,000,000, and annual payments of $100,000 each were made in 2004, 2005, 2006, 2007, 2008, 2009 and 2010 (see Consolidated Financial Statements—Note 5). If Idaho Gold exercises its option to purchase the project, all option payments shall be applied as a credit against the purchase price of $1,000,000. Idaho Gold has the right to terminate the agreement at any time without penalty. Eleven of the claims are subject to an underlying 5% NSR royalty. In 2003, Vista Gold staked the unpatented lode mining claims referenced above.
Surface use rights are guaranteed under the federal laws of the U.S. Government to the holder of patented mining claims and it is our understanding that no parties, other than the U.S. Government, hold surface rights on the unpatented claims held by us. There may not be sufficient space on these lands for all necessary facilities including processing plant, tailings disposal and waste dump areas, and future studies will determine what additional lands, if any, are required for future operations.
On December 7, 2010, we announced that we entered into a letter of intent (“LOI”) with Midas Gold, Inc., a privately held company based in Spokane Valley, Washington (“Midas”), for the combination of the respective holdings of
Vista Gold and Midas in the Yellow Pine – Stibnite Mining District located in Valley County, Idaho (the “District”). The LOI is non-binding, except with respect to specified provisions, and the completion of the proposed combination will be subject to a number of conditions, including, but not limited to, the execution of definitive agreements, the completion of due diligence satisfactory to Vista Gold and Midas, and the receipt of board and other approvals.
The LOI provides for the contribution by Vista Gold and Midas of their respective mining claims, interests and other assets in the District to a newly formed U.S. corporation (“Newco”). The LOI provides that immediately following the Combination, Newco will be held 35% by Vista Gold’s and 65% by Midas’ shareholders. Additionally, the LOI provides that Vista Gold will initially have the right to appoint 25% of the directors of Newco and Midas will initially have the right to appoint 75% of the directors.
On February 23, 2011, we announced the execution of a Combination Agreement. See Section Heading “Subsequent Events” under Part 1. Item 1. Business, above. The Combination would also extinguish a 5% NSR royalty on Vista Gold's Yellow Pine gold project, which royalty is currently held by Midas.
Accessibility, Climate, Local Resources, Infrastructure and Physiography
The project is accessible by existing public gravel roads. The town of Yellow Pine, Idaho, has year-round access. From Yellow Pine, the remaining 11 miles of access to the project is by means of a gravel road that is presently not passable in the winter months.
The Yellow Pine mine operated on an irregular basis from 1938 to 1952. There is a small, abandoned open-pit mine and some old buildings in various states of disrepair. At the present time, we have no installations at or near the Yellow Pine gold project. The East Fork of the South Fork of the Salmon River runs through the old open-pit mine. When mining was conducted, a diversion ditch and tunnel diverted the river around the mine. However, this has been abandoned and the river now runs through the old, abandoned open-pit mine. Management believes that Vista Gold is not liable for these past environmental matters, but that a future mine could be possible which would permanently divert the river around the known mineralization. A closure plan would be required with sufficient bonding to correct any perceived environmental problems at the conclusion of future mining.
There is no present source of power at the Yellow Pine gold project, nor has planning advanced to the point of determining the source of power for the project. At present, it is assumed that water for the project will be available from wells, pit de-watering, and/or the East Fork of the South Fork of the Salmon River, but our planning has not advanced to the point of a definitive determination.
Mine personnel would come from Yellow Pine and the surrounding area. A nearby reclamation project was conducted by contractors in the late 1990s and they were able to secure sufficient personnel who commuted to work in their own vehicles.
The known mineralization is located on and adjacent to the valley floor of the East Fork of the South Fork of the Salmon River. Topography is steep, rising above the valley floor. Elevations in the area range from about 6,000 feet to more than 9,000 feet above sea level.
The climate is characterized by robust winters and mild summers. Most precipitation comes as snowfall, with low to moderate rainfall generally occurring as afternoon thunderstorms in the warmer months. Winter temperatures may fall to minus 40°F. Summer temperatures may reach 80°F but daily temperature ranges can be substantial. Heaviest precipitation usually falls as snow in November and December. Year-round operations are possible with adequate snow-plowing, but occasional one to several day interruptions of operations may occur due to heavy snowfall events.
History
The mining history of the region began in 1893 when gold was discovered in what is now known as the Thunder Mountain mining district, located about 10 miles east of Stibnite. Around 1900, during the gold rush to the Thunder Mountain district mercury, antimony and gold were found in the Yellow Pine district. No work of any significance was done, however, until 1917 when the demand for mercury encouraged the development of several properties. Gold and antimony were explored by underground methods at the Meadow Creek mine in 1919 and the Meadow Creek Silver Mines Company was established and carried out intermittent underground development work on the Meadow Creek deposit through the 1920s.
In 1921, Meadow Creek Silver Mines was superseded by United Mercury Mines. In 1938, the Bradley family, who had been closely associated with the district for more than a decade, formed BMC. Production of antimony and gold commenced from the Meadow Creek underground mine in the early 1930’s at a rate of about 150 tons per day.
The largest known deposit in the district, the Yellow Pine deposit, was discovered in the 1900s, but no significant mining was carried out until 1938. In 1937, a leaky water pipe caused a washout that exposed the ore zone that was to become the east side of the Yellow Pine pit. The Bradley family had also acquired the Yellow Pine deposit and in 1938 BMC started production of gold and antimony ores by open pit methods. At that time, BMC ceased production from the more costly Meadow Creek underground mine despite its higher grade. Mining of the antimony-gold ores at Yellow Pine was from two pits, the West Quarry and the East Quarry, which subsequently merged into the single pit seen today. The East Quarry was richer in gold and contained very little antimony. Production levels alternated between the two quarry areas depending on the demand for antimony.
On June 7, 1939, in anticipation of U.S. involvement in World War II, President Roosevelt signed the Strategic Materials Act. Antimony and tungsten were both designated as strategic commodities. In 1939, both the U.S. Geological Survey (“USGS”) and the U.S. Bureau of Mines (“USBM”) began projects to investigate the antimony deposits of the Yellow Pine district. Some of the work performed by the USBM included drilling some 52 holes in the West Quarry and some exploratory work that resulted in the discovery of the Homestake gold deposit on Sugar Creek to the northeast of the Yellow Pine deposit.
Initially, only antimony and gold were produced, but in 1941 scheelite was identified by the USGS. Overall production increased and during World War II the Yellow Pine mine became the largest producer of tungsten in the United States. Stibnite produced 98 percent of the antimony and 60 percent of the tungsten for the allied war effort. The tungsten ores were mined out by 1945, but large scale mining of about 2,000 tons per day of the gold-antimony ores continued through 1952 when the Yellow Pine mine closed down as a result of the collapse of the antimony prices at the end of the Korean War.
During the mining activity in the Yellow Pine district about 380,000 ounces of gold, in excess of two million ounces of silver, 50,000 tons of antimony and 1 million short ton units of tungsten (i.e., 20 lbs of WO3 per unit) were produced. Following the closure of the Yellow Pine mine in 1952, BMC completed various works relating to the processing of antimony ores and finally the smelter was closed and dismantled in 1957. The following decade had very little activity in the area. However, this was followed in the 1970s by a renewed interest resulting from the development of heap-leach technology for the processing of lower grade oxidized gold ores and the increase in the price of gold.
Ranchers Exploration and Development Corporation (“Ranchers”) leased the BMC holdings in 1970 and carried out some 16,300 feet of exploratory drilling primarily on the Yellow Pine deposit during its tenure. In 1984, Ranchers merged with Hecla Mining Company (“Hecla”) to develop the oxide gold reserves on the Homestake deposit. Hecla mined in excess of 1.5 million tons at an average grade of about 0.08 opt gold and produced about 100,000 ounces of gold by heap leaching of the oxide ores between 1988 and 1992. The ore was initially processed at Stibnite through the Pioneer Metals plant under contract on a fixed fee basis until 1989 when Hecla permitted and built its own heap-leach plant also in the Stibnite area.
In June 1992, Hecla and American Barrick Resource Corporation (“Barrick”) started an exploration program at the Yellow Pine mine targeting the extensive sulfide gold resource at the property known as the Ponderosa project. The two companies drilled 14 core and 3 reverse circulation holes totaling about 10,000 feet. Following this program, resource estimation was carried out for the Yellow Pine/Homestake areas. Upon evaluating the exploration effort, Barrick withdrew from the joint venture.
On June 24, 1996, Dakota Mining Corporation (“Dakota”), at the time controlling some of the areas within the district (Stibnite Mine) located outside of the Yellow Pine/Homestake property, and Hecla announced the signing of an agreement to unitize their respective sulfide interests in the Stibnite/Yellow Pine areas of Valley County, Idaho. However, the exhaustion of the known oxide ore reserves and the drop in gold prices caused both Dakota and Hecla to curtail mining operations and sulfide ore recovery investigations. Dakota mining filed for bankruptcy in July 1999. In November 2000, Hecla terminated the agreement and returned the patented mining claims to BMC. No activities other than the reclamation of mine dumps, leach pads, and haul roads have been performed since.
On November 7, 2003 we entered into an Option to Purchase Agreement with BMC regarding certain property holdings in the Yellow Pine Mining District held by BMC.
Geology and Mineralization
The Yellow Pine mining district is located within the Cretaceous age Idaho Batholith, near its eastern border and adjacent to the Meadow Creek fault zone. The gold deposits of the Yellow Pine district are hosted primarily in the quartz monzonites of the Idaho batholith and within the major shear and fault zones that transect the district. Ore deposits also occur in the metasediments of a large roof pendant within the granitic rocks. Historic mining of the Yellow Pine and the Homestake open pits on the Yellow Pine property has depleted the oxide gold mineralization, but significant sulfide gold mineralization remains unmined. Historically, the mine has produced about 700,000 ounces of gold from a combination of byproduct gold from tungsten and antimony mining and more recent heap-leach production from oxide ore.
Gold and antimony occur principally in veinlets, stockworks, fissure-fillings, and massive lenses. Gold appears to be associated with pyrite and arsenopyrite whereas silver is associated with antimony. The primary gold mineralization occurs within a zone of stockwork sulfide veinlets also containing stibnite, pyrite and arsenopyrite. The principal antimony mineral is stibnite. Tungsten occurs in the mineral scheelite. Deposits are characterized by argillic and sericitic alteration with some silicification.
The Meadow Creek fault and its subsidiary structures trend north and northeast across the district and are a major controlling factor on the regional mineralization. The Yellow Pine mine, the largest mineralized area, is located in the Meadow Creek fault hanging wall, where the fault strike changes from northerly to northeasterly and a zone of stockwork sulfide veining occurs. The mineralized zone is about 2,000 feet long by 700 feet wide with a vertical extent of up to about 1,000 feet. It is cone shaped with the narrower, bottom area of the cone indicating possible continuity of the mineralization at depth, both down-dip along the hanging wall of the Meadow Creek fault and to the northwest.
The Homestake area appears as a continuation to the northeast of the Yellow Pine zone. The two zones have some similarities, as well as differences. The Homestake sulfide zone is also directly associated with the Meadow Creek fault. It appears, however, to have a somewhat different structural style from the Yellow Pine area. The mineralized zone is about 1,500 feet long by 600 feet wide and up to 350 feet vertically. It has an overall tabular shape with a true width of about 100 to 200 feet. Drill-hole information indicates that the mineralization at Homestake is encountered in both the hanging wall of the Meadow Creek fault zone as well as the footwall. Gold grades tend to be quite a bit lower than at the Yellow Pine area. The Yellow Pine and Homestake sulfide zones may be interconnected.
Exploration and Drilling
Historical records are somewhat scattered but indicate that a total of more than 120,000 feet of drilling has been completed in the area of the Yellow Pine deposit. The companies and approximate drilling footages of the main drilling campaigns were as shown in the table below.
Drilling Campaigns at Yellow Pine
|
Date
|
Company
|
Number of Feet Drilled
|
Type of Drilling
|
|
BMC
|
1933-1952
|
14,500
|
Core
|
|
BMC
|
1933-1952
|
36,000
|
Churn Drill and Rotary
|
|
U.S. Bureau of Mines
|
1939-1941
|
15,800
|
Core
|
|
Ranchers
|
1970-1984
|
16,300
|
Core
|
|
Ranchers
|
1970-1984
|
5,500
|
Reverse Circulation
|
|
Hecla
|
1985-1988
|
21,300
|
Reverse Circulation
|
|
Hecla
|
1989
|
2,200
|
Shallow Reverse Circulation
|
|
Barrick
|
1992
|
11,400
|
Core
|
|
Barrick
|
1992
|
850
|
Reverse Circulation
|
Geochemical and geophysical surveys have also been conducted within the district. For example, in 1968, a reconnaissance biogeochemical survey that sampled conifer-needle humus, was conducted by the USBM that outlined several areas that contained anomalous gold and antimony. In 1991, Hecla conducted an IP geophysical survey that indicated an IP anomaly suggesting a west or northwest dip to the Homestake sulfides.
Sampling and Analysis
As indicated in previous sections, exploration of the Yellow Pine project by various companies and government institutions for almost a century consisted of geological, geochemical, geophysical studies and exploration drilling.
Five separate main exploration campaigns that utilized either diamond core or reverse circulation drilling methods or both were carried out in the Yellow Pine property. These 5 drilling campaigns were performed by BMC, USBM, Ranchers, Hecla and Barrick
BMC explored the deposit from 1933 to 1952, primarily for antimony and tungsten. The BMC drill samples used in this study were AX (1.185 inches in diameter) and BX (1.655 inch diameter) size core. Recovery of the core was reported as highly variable and averaged about 50 percent. No information on sampling or assaying techniques was available. The BMC data consists of 14,500 feet of drilling broken into sample intervals of five feet in length. BMC also used churn drill and rotary drill techniques but these assays were not included in the current database due to concerns about their accuracy.
The USBM explored the deposit with BMC from 1939 to 1941. Its primary focus was the central tungsten zone and adjacent antimony mineralization. The drilling during this phase was all core and totaled 15,800 feet. The core diameter was mainly EX (0.905 inches), but also included AX and BX size core. Core recovery was again highly variable but averaged about 50 percent. The USBM assayed both core and sludge on five feet intervals and calculated a weighted average gold value whenever the core recovery was less than 95 percent.
Ranchers explored the deposit from 1970 to 1984. They targeted the antimony and gold mineralization with both core and reverse circulation drilling. About 16,300 feet of core drilling was drilled, consisting of HQ (2.5 inch diameter) with good recovery reported. The core was split and sampled on five-foot intervals. The reverse circulation drilling totaled 5,500 feet and was also sampled and assayed in five-foot intervals.
Hecla explored the deposit from 1985 to 1989. All Hecla’s drilling was reverse circulation and focused mainly on shallow oxide gold mineralization. During 1985 and 1988, 21,300 feet of drilling was completed. Drill cuttings were sampled and assayed in five-foot intervals. During 1989, Hecla drilled 2,200 feet in 22 holes, but total gold assays were only available for 500 feet of this drilling. None of the Hecla 1989 data is included in the current database.
During 1992, Barrick and Hecla conducted the Ponderosa project, an exploration program to confirm zones of medium to high grade gold sulfide mineralization. They drilled 11,400 feet of NQ (1.875 inch diameter) size core and had excellent recovery. The drill holes were all surveyed down the hole and the core was split and assayed in five-foot intervals. During this project, 850 feet of reverse circulation drilling was also completed, sampled and assayed in five-foot intervals.
The USBM drilling campaign of 1939-1941 was all core drilling performed by contractors. The campaign employed a diamond drill sampler for each shift. The sampler’s duties were to check the work accomplished by the drill contractor and to collect and care for the core and sludge samples. Sludge samples were collected in wood or metal settling tanks, 10-inch by 10-inch by 8-feet in size; they were constructed with cross baffles to aid settling. The overflow from the settling tanks was collected in 50-gallon steel drums to permit further settling of the finer particles. Addition of lime to the returned drill water was found to aid settling by coagulating the slimes. After each run of approximately five feet, the sludge was collected from the settling tanks and drums and dried in galvanized-iron tubs over a wood fire. After drying, the samples were weighed and sacked. Drill cores were measured and weighed by the sampler and filed in conventional-type wood core boxes. Later, the core was split; one-half was assayed, and the other half was filed for future reference. According to the USBM, more effort and expense were devoted to sampling than was customary in drilling operations performed by mining companies because it was desired to determine accurately the quality and grade of ore by the drilling method alone, and the results were to be filed as official government records.
No verifiable records exist on the BMC campaigns except that the USBM - April 1948 report states that: “The surface drilling procedure of the mining company was similar to that used by the Bureau of Mines. Their sampling differed from Bureau of Mines practice in that collection of samples was entrusted to the drill helper.”
No information on sampling procedures was found for the Ranchers’ drilling campaigns. These programs included both core and reverse circulation drilling. All drill samples were assayed for total gold. Antimony and silver assays were done consistently only in the high antimony zones. Tungsten and arsenic assays were sporadic.
The Ponderosa project carried out in 1992 by Barrick and Hecla was the first known campaign that had the focus of exploring the Yellow Pine area specifically for gold sulfide mineralization. The majority of the footage was core drilling in the Yellow Pine area with just 850 feet of reverse circulation drilling in two holes in the Homestake area. Records indicate that overall core recoveries were about 95% with ranges from 30% to 100%. Holes were sampled at five-foot intervals and split lengthwise with a hydraulic core splitter. Precautions were taken to try and split perpendicular to any predominate fracture fabric. For the reverse circulation holes, all samples were collected at five-foot intervals. Slightly different procedures were used for dry or wet samples. Dry samples were composed of both chips and fines. Once water was encountered, the sample was collected in two categories, chip and fines. Samples were collected in five gallon buckets; the liquid was poured through a 15-wire-mesh strainer into plastic bags with flocculent that was allowed to settle for 48 hours before pumping the clean water out. The remaining chips or concentrated slurry in the buckets was poured into separate bags without flocculent. All samples were double bagged for shipment. Twin hole drilling (J-6 core and 92-1 reverse circulation) was also conducted and from the results, it was concluded that the weight-averaged reverse-circulation gold assay value of the entire hole matched the split core assay, and that the best correlation existed where the holes were closest together but significant mismatch may occur where the holes were as little as four feet apart.
There are a large number of long sample intervals that do not appear to follow regular accepted sampling procedures. These samples are mainly from older holes taken when the main focus was not gold but either antimony or tungsten mineralization. It is unclear in many cases if these intervals, which range anywhere from 5.2 feet to 463 feet in length, are actual sample intervals or composited data. It would appear that in most cases, the longer intervals of 40 to 50 feet or longer are actually composited data from older holes. The compositing method used is unknown. These long intervals, especially when they carry good gold grades, would certainly raise the issue of sampling and assaying integrity. However, it appears that for the most part, more modern and careful drilling and sampling for sulfide gold (e.g., Barrick’s J-holes and others), confirms the values and continuity of these somewhat questionable long assay intervals.
As a check on possible sample bias, following the Barrick drilling program, the Winters Group of Tucson, Arizona, evaluated the samples from each of the drilling campaigns separately to determine if any gold grade bias existed from one sample set to the next. Gold-grade statistics were compiled at a suite of cutoff grades, not only for the complete set of assays, but also for the assays from each of the drilling campaigns and drilling methods. Minor discrepancies in average gold grade between the reverse circulation assays and diamond core assays were noted, with a tendency of reverse circulation holes to sample less gold than core samples. Discrepancies in average gold grade and gold grade variability were noted for the various diamond core drilling campaigns. Higher average grade and variability in the most recent core samples was apparently caused by concentrating these drill holes in some of the higher grade portions of the Yellow Pine pit. A lower average grade for the USBM drill holes was likely due to the fact that these drill holes were targeted on tungsten and antimony rather than gold. Large composite gold assays generated by BMC were summarized separately. It was expected that these large composites would show much less variability than the other core sample assay data, but this was not the case. The BMC large composites showed very similar behavior to all other core assays. Overall, the study concluded that the minor discrepancies observed from one campaign to the other could be attributed to differences in exploration objectives and no systematic bias was apparent.
Pincock, Allen & Holt (“PAH”) reviewed the information available on the historical exploration data and found that little detailed information exists on the sampling preparation and analysis procedures followed especially for the older drilling programs (e.g., BMC, USBM). However, the more recent programs run by companies such as Ranchers and Barrick, appear to have conducted their sample preparation and assaying by well-known and reputable commercial labs. Original assay certificates indicate that Ranchers, which drilled the R-series holes and others such as the 83-H series holes, assayed drill-hole samples at Rocky Mountain Geochemical Labs. Spot checks against the database carried on several of these holes found no errors. It was also found that assay checks were run on every tenth sample, apparently in a consistent manner.
According to PAH, the Ponderosa drilling campaign carried out in 1992 by Barrick and Hecla, appears to have been conducted to the highest standards of the time. For example, check assays were completed on 59 pulps from drill holes J-1 through J-5. Chemex Labs (“Chemex”) in Vancouver ran the assaying and Bondar-Clegg (“Bondar”) also in Vancouver performed the check assays. The average gold content for the five holes from Chemex was 0.061 ounces per ton (“opt”), and 0.057 opt from Bondar. This represents a 6.9 percent difference from Chemex to Bondar. Due to this discrepancy, a second set of checks was sent to Rocky Mountain Geochemical (“RMG”). The second set of samples consisted of two groups: the first group represents 37 of the samples sent to Bondar from holes J-1 to J-5 that assayed more than 0.025 opt, and the second group was from holes J-6 to J-8 and contained 24 samples assaying more than 0.055 opt. The assay results from RMG showed good correlation to Chemex, with the average assay for all 61 samples being 2.6 percent higher at RMG.
PAH was not able to directly verify sampling procedures, preparation, analysis and security because all drilling
campaigns are historical. However, from the review of the literature and documentation on the project, PAH is reasonably satisfied that previous operators collected their samples according to standards and accepted practices at the time of the campaigns. In general, it is probably fair to say that the older the drilling campaign, the less reliability on its procedures especially taking into account that gold sampling and assaying was not a primary focus on the older campaigns that mainly explored for antimony and/or tungsten. For the more recent campaigns (i.e., Ranchers and especially Barrick), PAH is satisfied with the adequacy of the sample preparation and analysis. In general, the samples from the various drilling campaigns are mutually supportive in establishing the precious metal mineralization of the deposit, with any differences mainly due to laboratory analytical differences.
Recent Exploration
In 2007, we planned to drill several core holes in the known resource area to confirm results from earlier drilling and to demonstrate on-strike continuity of mineralization. However, due to severe forest fires in the area during the drilling season, this plan was put on hold. Since then, we have channelled our personnel and financial resources into advancing the Concordia and Mt. Todd gold projects towards production.
Preliminary Assessment and Mineral Resource Estimate
Following our acquisition of the Yellow Pine property in 2003, PAH, completed an NI 43-101 third-party technical study for us in November 2003 utilizing standard industry software and estimation methodology. An assay database for 538 drill holes totaling 120,922 feet of drilling was used to estimate mineral resources (mineralized material under SEC Industry Guide 7) in the Yellow Pine and Homestake sulfide zones.
In November 2006, a NI 43-101 third-party preliminary assessment (“Yellow Pine PA”) was completed by PAH on the project by or under the supervision of Richard J. Lambert, P.E. and Barton G. Stone, P.G., each an independent qualified person. A technical report summarizing the results of the preliminary assessment entitled “CNI 43-101 Technical Report, Preliminary Assessment of the Yellow Pine Project, Yellow Pine, Idaho” dated December 13, 2006 is available on SEDAR at
www.sedar.com
.
The mineral resource estimate used in the Yellow Pine PA was the same as the November 2003 mineral resource estimate. Based on the report, under SEC Industry Guide 7 guidelines, mineralized material for the Yellow Pine gold project, above a cut-off grade of 0.025 gold ounces per ton, is estimated at 33,835,000 tons grading 0.066 gold ounces per ton.
Under CIM Definition Standards, at a cut-off grade of 0.025 gold ounces per ton, measured mineral resources are estimated at 16,332,000 tons grading 0.070 gold ounces per ton, indicated mineral resources are estimated at 17,503,000 tons grading 0.061 gold ounces per ton and inferred mineral resources are estimated at 16,047,000 tons grading 0.051 gold ounces per ton.
Cautionary Note to U.S. Investors: see the section heading “Cautionary Note to United States Investors Regarding Estimates of Measured, Indicated and Inferred Resources and Proven and Probable Reserves” above.
The conceptual process flow sheet for Yellow Pine consists of the following processes. Ore would be mined in the open pit and crushed by a jaw crusher. This ore would be fed to a SAG mill at a nominal rate of 8,600 tons per day, and the mine life is estimated at about 10 years. Ore grades would average 0.073 gold ounces per ton and the strip ratio would average 1.5:1. The SAG mill would be followed by a ball mill producing a product of 80% passing minus 200 mesh. The ball mill would be followed by a flotation circuit for recovery of the sulfide minerals into a mineral concentrate. The concentrate would be thickened and filtered and would be packaged in 2,000 pound super sacks and transported by truck to a pressure oxidation mill in Nevada for further treatment and production of a salable gold product. Overall gold recovery is estimated at 87% with 1.95 million gold ounces recoverable (averaging 189,000 gold ounces per year). By treating the concentrate offsite, we believe the project should be beneficial to the environment as the existing conditions would be properly reclaimed and the East Fork of the South Fork of the Salmon River permanently diverted away from sulfide-bearing (and potentially acid-generating) rocks. At the level of this study, economics were determined on a pre-tax basis.
The total capital cost over the project life was estimated by PAH to be $170 million with preproduction capital at $150 million. According to the PAH study, at long-term gold prices over $550 per ounce, the project appears to be viable. PAH estimated that at a gold price of $630 per ounce, the Yellow Pine project demonstrates favorable economics, with a net cash flow of $266 million, a net present value of $126 million at a 5% discount rate and a pre-tax IRR of 19% over a 10 year mine life. At a gold price of $550 per ounce, payback of capital would be in eight years. The Yellow Pine PA is preliminary in nature and includes inferred mineral resources (3% inferred and 97% measured and indicated) that are considered too speculative geologically to have the economic considerations applied to them that would enable them to be categorized as
mineral reserves, and there is no certainty that the preliminary assessment will be realized.
Cautionary Note to U.S. Investors: see the section heading “Cautionary Note to United States Investors Regarding Estimates of Measured, Indicated and Inferred Resources and Proven and Probable Reserves” above. See the section heading “Cautionary Note to All Investors Concerning Economic Assessments that Include Mineral Resources” above.
Federal U.S. income taxes of approximately 35% and Idaho state income taxes of approximately 7.6% would be payable on net income. There would be possible local property and other taxes, although, at this stage of the project, this has not been considered.
Guadalupe de los Reyes, Sinaloa, Mexico
Property Description and Location
Guadalupe de los Reyes is located in the State of Sinaloa, in western México, approximately halfway between the cities of Mazatlán and Culiacán. The project area is accessed by a 30-kilometer dirt road from Cosalá, a city of approximately 17,000 inhabitants. The city of Cosalá is connected to the cities of Mazatlán and Culiacán by a 55-kilometer paved highway plus 100 kilometers of toll freeway or by small aircraft from a local airstrip to international airports of Durango,
Mazatlán and Culiacán.
The property is held through 16 federal mining concessions (plus one in the application process) totaling about 4,437 hectares. A location map and table of mining concessions controlled by Vista Gold follow.
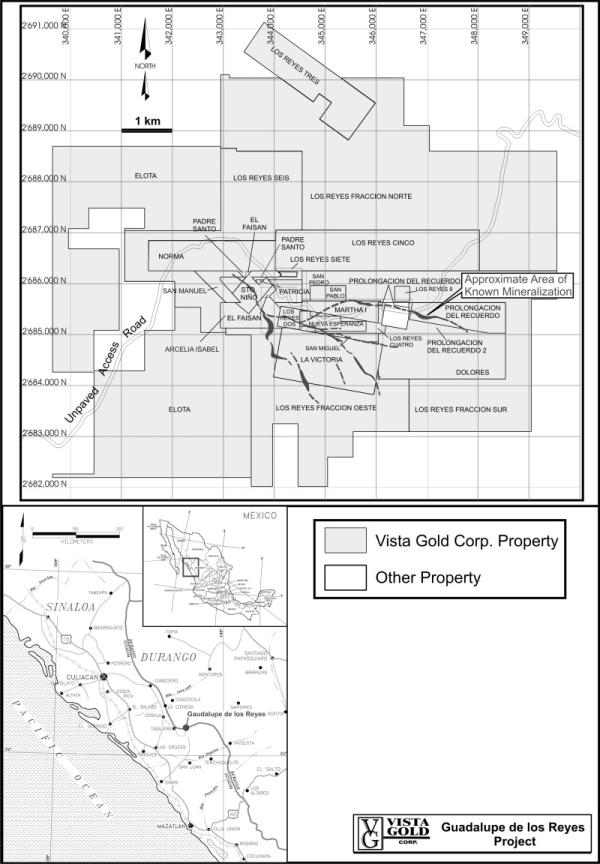
Mining Concessions at Guadalupe de los Reyes Controlled by Vista Gold
|
Concession Name
|
Serial Number
|
Surface Area (hectares)
|
Location Coordinates UTM (NAD27)
|
(INEGI Official Map No.)
|
Location Date
|
Expiration Date
|
Annual Fees (in Mexican Pesos, “MP”)
|
|
Gaitan Concessions
|
|||||||
|
|
|||||||
|
La Victoria
|
210803
|
199.8708
|
G13C75
|
11/30/1999
|
11/29/2049
|
11,448.60
|
|
|
|
|||||||
|
Prolongación del Recuerdo
|
210497
|
91.4591
|
G13C75
|
10/8/1999
|
10/7/2049
|
5,238.78
|
|
|
|
|||||||
|
Prolongación del Recuerdo Dos
|
209397
|
26.6798
|
G13C75
|
4/9/1999
|
4/8/2049
|
3,055.38
|
|
|
|
|||||||
|
Arcelia Isabel
|
193499
|
60.3723
|
G13C75
|
12/19/1991
|
12/18/2041
|
12,169.84
|
|
|
|
|||||||
|
Dolores
|
180909
|
222.0385
|
G13C75
|
8/6/1987
|
8/5/2012
|
44,758.52
|
|
|
|
|||||||
|
San Luis Concessions:
|
|||||||
|
|
|||||||
|
Los Reyes 8
|
226037
|
9.0000
|
G13C75
|
11/15/2005
|
11/14/2055
|
130
|
|
|
|
|||||||
|
Los Reyes Fracción Oeste
|
210703
|
476.9373
|
G13C75 and G13C85
|
11/18/1999
|
11/17/2049
|
56,278
|
|
|
|
|||||||
|
Los Reyes Fracción Norte
|
212757
|
1,334.4710
|
G13C75
|
11/22/2000
|
10/7/2049
|
78,762
|
|
|
|
|||||||
|
Los Reyes Fracción Sur
|
212758
|
598.0985
|
G13C75
|
11/22/2000
|
10/7/2049
|
35,302
|
|
|
|
|||||||
|
Los Reyes Dos
|
214131
|
17.3662
|
G13C75
|
8/10/2001
|
8/9/2051
|
1,024
|
|
|
|
|||||||
|
Los Reyes Tres
|
214302
|
197.0000
|
G13C75
|
6/9/2001
|
5/9/2051
|
11,628
|
|
|
|
|||||||
|
Los Reyes Cinco
|
216632
|
319.9852
|
G13C75
|
5/17/2002
|
5/16/2052
|
18,886
|
|
|
|
|||||||
|
Los Reyes Cuatro
|
217757
|
11.1640
|
Project centered
|
G13C75
|
8/13/2002
|
8/12/2052
|
328
|
|
|
|||||||
|
Los Reyes Seis
|
225122
|
427.6609
|
at approximately
|
G13C75
|
7/22/2005
|
7/21/2055
|
6,064
|
|
|
|||||||
|
Los Reyes Siete
|
225123
|
4.8206
|
345000E,
|
G13C75
|
7/22/2005
|
7/21/2055
|
70
|
|
|
|||||||
|
San Miguel Concessions:
|
2686000N
|
||||||
|
|
|||||||
|
Norma
|
177858
|
150.0000
|
G13C75
|
4/29/1986
|
4/28/2011
|
30,237
|
|
|
|
|||||||
|
San Manuel
|
188187
|
55.7681
|
G13C75
|
11/22/1990
|
11/21/2015
|
11,241.74
|
|
|
|
|||||||
|
El Padre Santo
|
196148
|
50.0000
|
G13C75
|
7/16/1993
|
7/15/2043
|
10,079
|
|
|
|
|||||||
|
Santo Niño
|
211513
|
44.0549
|
G13C75
|
5/31/2000
|
5/30/2050
|
2,523.46
|
|
|
|
|||||||
|
El Faisan
|
211471
|
2.6113
|
G13C75
|
5/31/2000
|
3/30/2050
|
149.58
|
|
|
|
|||||||
|
Patricia
|
212775
|
26.2182
|
G13C75
|
1/31/2001
|
1/30/2051
|
1,501.78
|
|
|
|
|||||||
|
Martha I
|
213234
|
46.6801
|
G13C75
|
4/10/2001
|
4/9/2051
|
2,673.84
|
|
|
|
|||||||
|
San Pedro
|
212753
|
9.0000
|
G13C75
|
11/22/2000
|
11/21/2050
|
515.52
|
|
|
|
|||||||
|
San Pablo
|
212752
|
11.1980
|
G13C75
|
11/22/2000
|
11/21/2050
|
641.42
|
|
|
|
|||||||
|
Nueva Esperanza
|
184912
|
33.0000
|
G13C75
|
12/6/1989
|
12/5/2039
|
6,652.14
|
|
|
|
|||||||
|
San Miguel
|
185761
|
11.7455
|
G13C75
|
12/14/1989
|
12/13/2014
|
2,367.66
|
|
|
|
|||||||
|
MPA Concessions:
|
|||||||
|
|
Application for title was filed in January 2008
|
||||||
|
Elota
|
To be determined when title is granted
|
To be determined when title is granted
|
|||||
|
|
353,726.26 Mexican Pesos
|
||||||
|
Totals
|
4,437.2003 hectares
|
||||||
|
|
Total in US$ @
an exchange rate on
3/11/2011 of US$1.00 = MP$11.96 = US$29,581
|
||||||
On August 1, 2003, we executed an agreement to acquire a 100% interest in the Guadalupe de los Reyes gold project and a data package associated with the project and general area, for aggregate consideration of $1.4 million and a 2% NSR royalty. During a due-diligence period prior to the signing of the purchase agreement, we made payments to the owner, Sr. Enrique Gaitan Maumejean, totaling $100,000, and upon exercising our option to complete the purchase, paid an additional $200,000. On August 4, 2004, we issued 138,428 Common Shares to Sr. Gaitan in satisfaction of the scheduled payment of $500,000, which could be made in cash or Common Shares at our discretion. An additional $500,000 in cash was to be paid in installments of $100,000 on each of the second through sixth anniversaries of the signing of the formal agreement, with the outstanding balance becoming due upon commencement of commercial production. Payments of $100,000 were made in each of 2005, 2006, 2007, 2008 and 2009, completing the purchase option. A 2% NSR royalty will be paid to Sr. Gaitan and may be acquired by us at any time prior to 2053 for $1.0 million.
On December 19, 2007, we announced that we had signed an agreement to acquire Grandcru Resource Corporation’s (“Grandcru”) interest in two gold/silver mineral properties adjacent to our Guadalupe de los Reyes gold project. The acquisition was completed on January 24, 2008. Under the terms of the agreement, we agreed to: (a) pay Grandcru $425,000 less any amounts payable in back taxes on the mining concessions ($377,000, net of back taxes on the mining concessions), and pay a private investment group known as the San Miguel Group $75,000; and (b) issue to Grandcru and the San Miguel Group, in aggregate, Common Shares of the Corporation with a value of $1,000,000 (amounting to 213,503 Common Shares) on closing. In addition, we reached agreement with San Luis and with the San Miguel Group to complete the acquisition of their respective interests in the mining concessions at the same time as the closing occurred with Grandcru. We agreed to pay a 2% NSR royalty on all minerals produced payable to the San Miguel Group on the mining concessions known as the San Miguel Concessions. We agreed to pay San Luis a 1% NSR royalty on mining concessions known as the San Luis Concessions and the San Miguel Concessions, and a 2% to 3% NSR royalty depending on the gold price on our mining concessions known as the Gaitan Concessions. At gold prices below $499.99 per ounce, the royalty payable to San Luis on the Gaitan Concessions will be 2% and at or above $500 per ounce, the royalty payable will be 3%. Certain of the San Luis Concessions are subject to a pre-existing underlying royalty of a 3% NSR royalty payable to Sanluis Corporación, S.A. de C.V. The maximum royalty payable on any of the mining concessions would be a 5% NSR royalty.
Most of the surface rights to the Guadalupe de Los Reyes Project are held by the Ejido Tasajera (“Ejido”). A few individuals hold other surface rights. Previous operators in the area have successfully negotiated surface rights agreements with the Ejido and the individual surface holders. An important consideration is the traditional use of land, which recognizes that mining is the preferred use of the land in and around old mine workings. It has been reported that prior operators had a good working relationship with people of the Ejido, since many of the inhabitants are necessarily contracted when work is carried out in exploration or mining operations. No labor or access problems have been reported by prior operators or other mining operators within the area. There is sufficient space on the mineral land controlled by us for all necessary facilities including processing plant, heap-leach pads and waste dump areas. To operate within the laws and regulations of México, we must negotiate the use of the land rights before initiating development of any considerable mining operations in the project area. We anticipate that adequate mine labor would be available from the local communities, but professional staff would need to be recruited from outside the area and would be based in Cosala and either self-transport to the mine daily or be bussed.
There are no known environmental liabilities on the project.
We have no installations at or near the project.
Accessibility, Climate, Local Resources, Infrastructure and Physiography
The project is located in the western foothills of the Sierra Madre Occidental at elevations that vary from approximately 300 meters to 1,000 meters. The topography is moderate to rugged. Climate in this area is arid to semi-arid with an average temperature of 22° to 26°C. The average rainfall of approximately 1,000 millimeters occurs mostly during the period of June to September in strong storm events that cause flooding along the river beds and frequent interruptions of the road to Cosalá. Outside of infrequent flood interruptions of the road during the rainy season, it is anticipated that mining operations can occur on a year-round basis.
Access to the Guadalupe de Los Reyes gold project area is from approximately midway (100 kilometers) on the toll road that connects the cities of Mazatlan, and Culiacan, and then to Cosala by a 55-kilometer, two-lane paved highway. A 30-kilometer dirt road connects Cosala with the project area. An airstrip for small aircraft is located near Cosala, with public and private service to the cities of Mazatlan, Culiacan and Durango. Electrical power is available in the village of Guadalupe de los Reyes, but there may not be sufficient capacity to support a mining operation. A trade-off study between on-site power generation and power capacity upgrades will be part of a future feasibility study. It is anticipated that ground-water wells
would supply water for any future mine development and that the source of mine personnel would be from nearby villages. Operations personnel would be secured from surrounding villages. Transportation of personnel will be addressed in future feasibility studies.
Sporadic underground mining of veins in the district occurred from the 1770s until the 1950s. Old, underground mine workings and relatively small mine-waste dumps exist in the area, but no tailings ponds are present.
History
The Guadalupe de Los Reyes mining district was discovered, according to local residents, on December 12, 1772, (virgin of Guadalupe’s day) and claimed on January 6, 1773, (Wise men’s day, “Día de los Reyes Magos”); hence, the current name is Guadalupe de Los Reyes (previously Guadalupe Los Reyes). Several areas were developed within the district throughout its production history, mainly the Guadalupe mine, El Zapote, San Miguel, Mariposa, La Chiripa, Tahonitas, Noche Buena, Candelaria, Tatemas, Las Primas, and Fresnillo, along three principal vein systems. These veins include the 2.5-kilometer long East-West system of the Guadalupe mine; 4.0-kilometer long NW-trending systems of San Miguel–Chiripa–Noche Buena, and Mariposa–Zapote-Tahonitas, and other secondary systems. Intermittent production of gold/silver ores from the different mines within the district was reported until the 1950s. Access to the district was on horseback until the early 1960s when the dirt road access from Cosalá was built.
Historical production for the Guadalupe district was estimated in February 1936, by Mr. C. W. Vaupell as approximately 600,000 ounces of gold and over 40 million ounces of silver (1.5 million tonnes of ore averaging 12 grams per tonne gold and 900 grams per tonne silver). A more comprehensive report, based on National Registry records, by Minas de San Luis, S.A. de C.V. summarized the production as 319,000 gold ounces and 15 million silver ounces from 1771 to February 1989.
From the middle of the 1950s to the 1980s there was limited activity within the Guadalupe district that included exploration reconnaissance studies and mining concessions promotions, until Northern Crown Mines Ltd took important steps to test the geologic potential with drilling and considerable investment in the early 1990s.
Operating companies in the district included Negociación Minera de Guadalupe de los Reyes, S.A.; Compañía La Chiripa y Anexas; Compañía Candelaria Canoas, S.A., and in recent times Mr. Enrique Gaitán Enríquez representing various companies such as Compañía Minera Campanillas, S.A. de C.V., Minera Tatema, S.A. de C.V., Minera Sierra Pacífico, S.A. de C.V., and Minera Mariposa, S.A. de C.V. (“Mariposa”); and most recently exploration companies as Minas de San Luis, S.A. de C.V. (“Luismin”) (later acquired by Goldcorp, Inc. – “Goldcorp”).; Minera Silverado, S.A. de C.V.; Northern Crown Mines Ltd. (“NCM”); Meridian Gold Company (“Meridian”); Grupo San Miguel (“San Miguel Group”), Grandcru, and Vista Gold.
Intermittent production occurred over a period of 150 years, from 1772 to the 1950s, resulting in a reported accumulated extraction of approximately 1.1 million tonnes with an average grade of 9.20 gold grams per tonne gold and 430 silver grams per tonne from the various deposits located within the mining district. Most of this production was exported to Germany as doré bars.
Subsequently, private investors leased some of the concessions from a group of claimholders from the city of Culiacán and carried out exploration and development operations in the Mariposa mine, resulting in extraction of approximately 1,000 tonnes of gold ore with an average grade of 5.2 gold grams per tonne. Between October 1988 and February 1989, Enrique Gaitán and Associates mined 31,500 tonnes with a reported grade of 5.8 gold grams per tonne from an open cut in the El Zapote South area and recovered, according to Mr. Gaitán, approximately 93 kilograms of gold from a small cyanide vat-leach facility. Minera Sierra Pacífico, S.A. de C.V., a wholly-owned subsidiary of NCM, began conducting exploration activities in the El Zapote area in 1992, when modern methods of exploration were first applied in the project area with a program that included geochemical soil and rock chip sampling, geophysical studies including VLF-EM and magnetic surveys, drilling, sample and assay checks, partial underground development and computer modeling to estimate mineral resources. Preliminary metallurgical testwork was carried out on bulk samples and drill chips from the El Zapote deposit. Environmental permits for exploration were obtained by NCM and Meridian.
NCM, under an option to purchase the mining claims that covered the Guadalupe de Los Reyes District, developed a full program of exploration. The exploration program included drilling five zones within the Guadalupe district as follows: El Zapote deposit, 197 reverse circulation holes, 15,728 meters; Guadalupe deposit, 78 reverse circulation holes, 10,547 meters; San Miguel deposit, 33 reverse circulation holes, 3,674 meters; Noche Buena deposit, 37 reverse circulation holes, 4,071 meters; and Tahonitas deposit, 389 reverse circulation holes, 2,258 meters.
In December 2001, Meridian optioned the project from NCM and carried out a due-diligence investigation including sample checks and drilling of 23 additional confirmatory holes in four areas as follows: El Zapote deposit, 5 reverse circulation holes, 829.3 meters; La Chiripa deposit, 9 reverse circulation holes, 829.2 meters; San Miguel deposit, 6 reverse circulation holes, 698.2 meters; and Orito deposit, 3 reverse circulation holes, 375.0 meters.
Meridian subsequently dropped the option with NCM in 2002. In December 2002, NCM returned all mineral rights to the original concessionaires, including Mr. Enrique Gaitán, Luismin, Mariposa and a group of concessionaires from the city of Culiacán. Luismin has carried out prospecting studies within the concessions that cover the northern portion of the district, including the El Orito zone, including surface and geochemical sampling along known mineralized structures. These mineralized zones were discovered by prospectors developing small pits and surface workings along fault and altered zones.
In August 2003, we entered an agreement to acquire 100 percent of the mineral rights held by Mr. Gaitán, which cover approximately seven percent of the Guadalupe de Los Reyes mining district area. These concessions enclose most of the main identified exploration targets within the Guadalupe de Los Reyes district area, including approximately 73 percent of the El Zapote deposit gold resources, all of the Guadalupe-Laija deposit, 2.6 percent of the Guadalupe-West deposit, 25 percent of the Chiripa-San Miguel deposits, all of the Noche Buena deposit, and 99 percent of the Tahonitas deposit.
In 2004, Grandcru entered into agreements with Luismin and the San Miguel Group (holders of the Mariposa concessions) to acquire concessions that cover approximately 62 percent of the mining district .
By agreement dated January 24, 2008, with Grandcru and simultaneously with Goldcorp and the San Miguel Group, we acquired the mineral rights that cover the Guadalupe mining district, except for two small claims located within the area. This agreement consolidated Vista Gold’s ownership of the known mineralization within the Guadalupe district.
Geology and Mineralization
Guadalupe de los Reyes occurs in a late Cretaceous-to-Tertiary-age volcanic sequence of rocks. Gold and silver mineralization has been found along a series of northwesterly and west-northwesterly trending structural zones. Mineralization in the project area covers an area of approximately five by two kilometers (1,000 hectares), but has been extended by geologic interpretations to an area of over 8,600 hectares. Mineralization in these zones is typical of low-sulfidation epithermal systems. Eight main target areas have been identified along three major structural zones. Several of these targets have bulk tonnage potential which may be amenable to open-pit mining, including the El Zapote, San Miguel, Guadalupe Mine, Tahonitas, and Noche Buena zones. The El Zapote target occurs in the Mariposa-El Zapote-Tahonitas structural zone on the western side of the project area and has been mapped for a distance of three kilometers. The El Zapote deposit is one of three deposits found along this structural zone, with the inactive underground Mariposa Mine one kilometer to the northwest and the Tahonitas prospect 0.5 kilometers to the southeast. The Guadalupe zone occurs as the northwest extension of the mineralized structures that were developed by underground mining along approximately 1,000 meters of the veins and to some 400 meters deep. The Guadalupe zone is found in the northeast portion of the area and has produced the majority of precious metals within the district. The San Miguel and Noche Buena zones are enclosed by the same northwestern trending structure in between the El Zapote-Mariposa and the Guadalupe structures.
Exploration and Drilling
Vista Gold has not conducted any physical work, such as drilling, on this property since its acquisition. Instead, we have focused on consolidating the land position and assembling, collating and interpreting the large amount of data that exists on this property. While we believe in the property’s merits, our work has focused on higher priority projects such as the Concordia and Mt. Todd gold projects. We may seek a joint-venture partner to assist us in advancing this project.
In August 2009, a third-party NI 43-101 technical study was complete for us by PAH, by or under the supervision of Leonel Lopez, C.P.G., an independent qualified person, utilizing standard industry software and estimation methodology, to basically consolidate the mineralization in the district that we purchased from Grandcru with that already held by us. The technical report outlining the results of the study entitled “Technical Report for the Guadalupe de Los Reyes Gold-Silver Project, Sinaloa, Mexico” dated August 12, 2009 (and amended and restated on December 8, 2009, to address concerns the British Columbia Securities Commission raised regarding disclaimers and related portions of the document, and the length of time since a site visit occurred. There were no concerns regarding technical data.) is available on SEDAR at www.sedar.com.
Based on the report, under SEC Industry Guide 7 guidelines, mineralized material for the Guadalupe de los Reyes gold project, above a cut-off grade of 0.50 gold grams per tonne, is estimated at 10,048,000 tonnes grading 1.50 gold grams per tonne and 25.74 silver grams per tonne. Under CIM Definition Standards, at the same cut-off grade, indicated mineral resources are estimated at 10,048,000 tonnes grading 1.50 gold grams per tonne and 25.74 silver grams per tonne and inferred mineral resources are estimated at 4,888,000 tonnes grading 2.02 gold grams per tonne and 59.98 silver grams per tonne.
Cautionary Note to U.S. Inventors: see the section heading “Cautionary Note to United States Investors Regarding Estimates of Measured, Indicated and Inferred Resources and Proven and Probable Reserves” above.
Sampling and Analysis
PAH carried out a review of the check assay program for the technical report, including correlation analysis of results for duplicate checks, and the conclusion was that the results from check assaying were reasonable. NCM personnel applied the same procedure to all sampling and data registration of all the investigated mineralized zones within the project area. PAH believes that an adequate amount of checking has been conducted and that the results are representative of the mineralization in the deposit.
PAH conducted a thorough review of the NCM sampling procedures and lab processing for the prefeasibility study of January 1998. Most of the project analytical samples were delivered to Bondar-Clegg de Mexico, S.A. de C.V. (“Bondar-Clegg de Mexico”) in Hermosillo, México, for sample preparation. PAH noted, however, that during one period (drill holes ZA-016 to ZA-053 or approximately 20 percent of the data) analyses were conducted by SGS-XRAL laboratories in Hermosillo, México. At Bondar-Clegg de Mexico, the entire sample was crushed to 75 percent passing 10 mesh using jaw and cone crushers. Representative 250-gram splits of the crushed sample were obtained using a Jones riffle splitter. These splits were then pulverized to -150 mesh using a ring and puck pulverizer. The resultant samples were sent to Bondar-Clegg de Mexico’s assay laboratory in Vancouver, British Columbia, for gold and silver analysis. For gold, a one-assay-ton fire assay was conducted with an AA finish, and if the AA value exceeded 10 gold grams per tonne, then it was reassayed with a gravimetric finish. PAH noted that this is a typical analytical protocol and that Bondar-Clegg and Bondar-Clegg de Mexico are internationally recognized laboratory.
Silver analyses of earlier drill-hole samples were conducted by fire assay with an atomic absorption finish, if silver was analyzed at all. Later drill-hole samples in which silver was routinely analyzed were largely done by aqua regia digestion followed by atomic absorption. The acid digestion/atomic absorption silver values have been found to consistently be lower than the fire assay values because of a less complete extraction of the silver from the samples. This is not expected to be a problem as long as the basis for the silver analyses is stated when applying metallurgical recoveries. Silver analyses by acid digestion/AA were used for the resource calculations.
NCM had approximately 10 percent of the sample intervals in the mineralized zone sent for duplicate analysis by a second laboratory to evaluate the quality of the sample analyses. Overall, PAH found that the results from the check assaying are reasonable. It is PAH’s opinion that the sampling methods and analyses representing the Guadalupe de Los Reyes Project deposits were generated by using procedures in accordance to accepted industry standards and practices.
Exploration and Development
Because of higher priorities (the Concordia and Mt. Todd gold projects), we have not formulated a plan to advance the Guadalupe de los Reyes project at this time. We have spent time and hired consultants to help us compile and assemble data on the project from which we can develop a plan to drill and progress this project. We may seek a joint-venture partner in the future to assist us in bringing Guadalupe de los Reyes towards and into production. Once we are in a position to advance the project, we will need to obtain the necessary permits for the work.
Long Valley
Property Description and Location
The Long Valley gold project is located in the Inyo National Forest, about 7 miles east of the town of Mammoth Lakes, in Mono County, California. The property consists of 95 contiguous, unpatented mining claims that cover an area of approximately 1,963 acres. A location map and table describing the claims held by Vista Gold follow.

Unpatented Mining Claims at Long Valley Controlled by Vista Gold
|
Claim Name
|
Serial Number
|
Federal Claim Type
|
Surface Area (acres)
|
Location Description (Section, Township and Range)
|
Location Date
|
Annual Holding Fee
|
|
Long Valley 1
|
231947
|
Unpatented Lode Mining Claim
|
20.66
|
Section 23, T3S, R28E, MDM
|
9/25/1989
|
$125
|
|
Long Valley 2
|
231948
|
Unpatented Lode Mining Claim
|
20.66
|
Section 23, T3S, R28E, MDM
|
9/25/1989
|
$125
|
|
Long Valley 3
|
231949
|
Unpatented Lode Mining Claim
|
20.66
|
Section 23, T3S, R28E, MDM
|
9/25/1989
|
$125
|
|
Long Valley 4
|
231950
|
Unpatented Lode Mining Claim
|
20.66
|
Section 23, T3S, R28E, MDM
|
9/25/1989
|
$125
|
|
Long Valley 5
|
231951
|
Unpatented Lode Mining Claim
|
20.66
|
Section 23, T3S, R28E, MDM
|
9/25/1989
|
$125
|
|
Long Valley 6
|
231952
|
Unpatented Lode Mining Claim
|
20.66
|
Section 23, T3S, R28E, MDM
|
9/25/1989
|
$125
|
|
Long Valley 7
|
231953
|
Unpatented Lode Mining Claim
|
20.66
|
Section 23, T3S, R28E, MDM
|
9/25/1989
|
$125
|
|
Long Valley 8
|
231954
|
Unpatented Lode Mining Claim
|
20.66
|
Section 23, T3S, R28E, MDM
|
9/25/1989
|
$125
|
|
Long Valley 9
|
231955
|
Unpatented Lode Mining Claim
|
20.66
|
Section 23, T3S, R28E, MDM
|
11/13/1989
|
$125
|
|
Long Valley 10
|
231956
|
Unpatented Lode Mining Claim
|
20.66
|
Section 23, T3S, R28E, MDM
|
11/13/1989
|
$125
|
|
Long Valley 11
|
231957
|
Unpatented Lode Mining Claim
|
20.66
|
Section 23, T3S, R28E, MDM
|
11/13/1989
|
$125
|
|
Long Valley 12
|
237721
|
Unpatented Lode Mining Claim
|
20.66
|
Section 23, T3S, R28E, MDM
|
7/6/1990
|
$125
|
|
Long Valley 13
|
237722
|
Unpatented Lode Mining Claim
|
20.66
|
Section 24, T3S, R28E, MDM
|
7/7/1990
|
$125
|
|
Long Valley 14
|
237723
|
Unpatented Lode Mining Claim
|
20.66
|
Sections 23 & 26, T3S, R28E, MDM
|
7/6/1990
|
$125
|
|
Long Valley 15
|
237724
|
Unpatented Lode Mining Claim
|
20.66
|
Sections 23 & 26, T3S, R28E, MDM
|
7/6/1990
|
$125
|
|
Long Valley 16
|
237725
|
Unpatented Lode Mining Claim
|
20.66
|
Sections 23 & 26, T3S, R28E, MDM
|
7/6/1990
|
$125
|
|
Claim Name
|
Serial Number
|
Federal Claim Type
|
Surface Area (acres)
|
Location Description (Section, Township and Range)
|
Location Date
|
Annual Holding Fee
|
|
Long Valley 17
|
237726
|
Unpatented Lode Mining Claim
|
20.66
|
Sections 23 & 26, T3S, R28E, MDM
|
7/6/1990
|
$125
|
|
Long Valley 18
|
237727
|
Unpatented Lode Mining Claim
|
20.66
|
Section 24, T3S, R28E, MDM
|
7/7/1990
|
$125
|
|
Long Valley 19
|
237728
|
Unpatented Lode Mining Claim
|
20.66
|
Section 24, T3S, R28E, MDM
|
7/7/1990
|
$125
|
|
Long Valley 20
|
237729
|
Unpatented Lode Mining Claim
|
20.66
|
Section 23, T3S, R28E, MDM
|
7/7/1990
|
$125
|
|
Long Valley 21
|
237730
|
Unpatented Lode Mining Claim
|
20.66
|
Sections 14 & 23, T3S, R28E, MDM
|
7/8/1990
|
$125
|
|
Long Valley 22
|
237731
|
Unpatented Lode Mining Claim
|
20.66
|
Sections 14 & 23, T3S, R28E, MDM
|
7/8/1990
|
$125
|
|
Long Valley 23
|
237732
|
Unpatented Lode Mining Claim
|
20.66
|
Sections 14 & 23, T3S, R28E, MDM
|
7/8/1990
|
$125
|
|
Long Valley 24
|
237733
|
Unpatented Lode Mining Claim
|
20.66
|
Sections 14 & 23, T3S, R28E, MDM
|
7/8/1990
|
$125
|
|
Long Valley 25
|
237734
|
Unpatented Lode Mining Claim
|
20.66
|
Sections 14 & 23, T3S, R28E, MDM
|
7/8/1990
|
$125
|
|
Long Valley 26
|
237735
|
Unpatented Lode Mining Claim
|
20.66
|
Sections 14 & 23, T3S, R28E, MDM
|
7/7/1990
|
$125
|
|
Long Valley 27
|
237736
|
Unpatented Lode Mining Claim
|
20.66
|
Sections 14, 15, 22 & 23, T3S, R28E, MDM
|
7/7/1990
|
$125
|
|
Long Valley 28
|
237737
|
Unpatented Lode Mining Claim
|
20.66
|
Sections 15 and 22, T3S, R28E, MDM
|
7/7/1990
|
$125
|
|
Long Valley 29
|
237738
|
Unpatented Lode Mining Claim
|
20.66
|
Sections 15 and 22, T3S, R28E, MDM
|
7/7/1990
|
$125
|
|
Long Valley 30
|
237739
|
Unpatented Lode Mining Claim
|
20.66
|
Sections 15 and 22, T3S, R28E, MDM
|
7/7/1990
|
$125
|
|
Long Valley 31
|
237740
|
Unpatented Lode Mining Claim
|
20.66
|
Section 15, T3S, R28E, MDM
|
7/7/1990
|
$125
|
|
Long Valley 32
|
237741
|
Unpatented Lode Mining Claim
|
20.66
|
Section 15, T3S, R28E, MDM
|
7/7/1990
|
$125
|
|
Long Valley 33
|
237742
|
Unpatented Lode Mining Claim
|
20.66
|
Section 15, T3S, R28E, MDM
|
7/7/1990
|
$125
|
|
Claim Name
|
Serial Number
|
Federal Claim Type
|
Surface Area (acres)
|
Location Description (Section, Township and Range)
|
Location Date
|
Annual Holding Fee
|
|
Long Valley 34
|
237743
|
Unpatented Lode Mining Claim
|
20.66
|
Sections 14, 15, 22, & 23 T3S, R28E, MDM
|
7/7/1990
|
$125
|
|
Long Valley 35
|
237744
|
Unpatented Lode Mining Claim
|
20.66
|
Section 14, T3S, R28E, MDM
|
7/7/1990
|
$125
|
|
Long Valley 36
|
237745
|
Unpatented Lode Mining Claim
|
20.66
|
Section 14, T3S, R28E, MDM
|
7/8/1990
|
$125
|
|
Long Valley 37
|
237746
|
Unpatented Lode Mining Claim
|
20.66
|
Section 14, T3S, R28E, MDM
|
7/8/1990
|
$125
|
|
Long Valley 38
|
237747
|
Unpatented Lode Mining Claim
|
20.66
|
Section 14, T3S, R28E, MDM
|
7/8/1990
|
$125
|
|
LVR 45
|
275118
|
Unpatented Lode Mining Claim
|
20.66
|
Section 25, T3S, R28E, MDM
|
11/18/1998
|
$125
|
|
LVR 46
|
275119
|
Unpatented Lode Mining Claim
|
20.66
|
Section 25, T3S, R28E, MDM
|
11/19/1998
|
$125
|
|
LVR 47
|
275120
|
Unpatented Lode Mining Claim
|
20.66
|
Section 25, T3S, R28E, MDM
|
11/20/1998
|
$125
|
|
LVR 48
|
275121
|
Unpatented Lode Mining Claim
|
20.66
|
Section 25, T3S, R28E, MDM
|
11/21/1998
|
$125
|
|
LVR 49
|
275122
|
Unpatented Lode Mining Claim
|
20.66
|
Section 25, T3S, R28E, MDM
|
11/22/1998
|
$125
|
|
LVR 50
|
275123
|
Unpatented Lode Mining Claim
|
20.66
|
Section 25, T3S, R28E, MDM
|
11/23/1998
|
$125
|
|
LVR 51
|
275124
|
Unpatented Lode Mining Claim
|
20.66
|
Section 25, T3S, R28E, MDM
|
11/24/1998
|
$125
|
|
LVR 52
|
275125
|
Unpatented Lode Mining Claim
|
20.66
|
Section 25, T3S, R28E, MDM
|
11/25/1998
|
$125
|
|
LV 57
|
270604
|
Unpatented Lode Mining Claim
|
20.66
|
Section 26, T3S, R28E, MDM
|
11/7/1996
|
$125
|
|
LV 59
|
270605
|
Unpatented Lode Mining Claim
|
20.66
|
Section 26, T3S, R28E, MDM
|
11/7/1996
|
$125
|
|
LV 63
|
242259
|
Unpatented Lode Mining Claim
|
20.66
|
Section 22, T3S, R28E, MDM
|
12/5/1990
|
$125
|
|
Claim Name
|
Serial Number
|
Federal Claim Type
|
Surface Area (acres)
|
Location Description (Section, Township and Range)
|
Location Date
|
Annual Holding Fee
|
|
LV 64
|
242260
|
Unpatented Lode Mining Claim
|
20.66
|
Section 22, T3S, R28E, MDM
|
12/5/1990
|
$125
|
|
LV 65
|
242261
|
Unpatented Lode Mining Claim
|
20.66
|
Section 22, T3S, R28E, MDM
|
12/5/1990
|
$125
|
|
LV 66
|
242262
|
Unpatented Lode Mining Claim
|
20.66
|
Sections 22 & 23, T3S, R28E, MDM
|
12/5/1990
|
$125
|
|
LV 67
|
242263
|
Unpatented Lode Mining Claim
|
20.66
|
Sections 23, T3S, R28E, MDM
|
12/6/1990
|
$125
|
|
LV 68
|
242264
|
Unpatented Lode Mining Claim
|
20.66
|
Sections 23, T3S, R28E, MDM
|
12/6/1990
|
$125
|
|
LV 69
|
242265
|
Unpatented Lode Mining Claim
|
20.66
|
Sections 23 & 26, T3S, R28E, MDM
|
12/6/1990
|
$125
|
|
LV 70
|
242266
|
Unpatented Lode Mining Claim
|
20.66
|
Section 26, T3S, R28E, MDM
|
12/6/1990
|
$125
|
|
LV 71
|
242267
|
Unpatented Lode Mining Claim
|
20.66
|
Sections 23 & 26, T3S, R28E, MDM
|
12/6/1990
|
$125
|
|
LV 72
|
242268
|
Unpatented Lode Mining Claim
|
20.66
|
Section 26, T3S, R28E, MDM
|
12/6/1990
|
$125
|
|
LV 73
|
242269
|
Unpatented Lode Mining Claim
|
20.66
|
Sections 23 & 26, T3S, R28E, MDM
|
12/6/1990
|
$125
|
|
LV 74
|
242270
|
Unpatented Lode Mining Claim
|
20.66
|
Section 26, T3S, R28E, MDM
|
12/6/1990
|
$125
|
|
LV 75
|
242271
|
Unpatented Lode Mining Claim
|
20.66
|
Sections 23 & 26, T3S, R28E, MDM
|
12/6/1990
|
$125
|
|
LV 76
|
242272
|
Unpatented Lode Mining Claim
|
20.66
|
Section 26, T3S, R28E, MDM
|
12/6/1990
|
$125
|
|
LV 77
|
242273
|
Unpatented Lode Mining Claim
|
20.66
|
Section 26, T3S, R28E, MDM
|
12/6/1990
|
$125
|
|
LV 78
|
242274
|
Unpatented Lode Mining Claim
|
20.66
|
Section 26, T3S, R28E, MDM
|
12/6/1990
|
$125
|
|
LV 79
|
242275
|
Unpatented Lode Mining Claim
|
20.66
|
Section 26, T3S, R28E, MDM
|
12/6/1990
|
$125
|
|
Claim Name
|
Serial Number
|
Federal Claim Type
|
Surface Area (acres)
|
Location Description (Section, Township and Range)
|
Location Date
|
Annual Holding Fee
|
|
LV 80
|
242276
|
Unpatented Lode Mining Claim
|
20.66
|
Section 26, T3S, R28E, MDM
|
12/6/1990
|
$125
|
|
LV 81
|
242277
|
Unpatented Lode Mining Claim
|
20.66
|
Section 26, T3S, R28E, MDM
|
12/7/1990
|
$125
|
|
LV 82
|
242278
|
Unpatented Lode Mining Claim
|
20.66
|
Section 26, T3S, R28E, MDM
|
12/7/1990
|
$125
|
|
LV 83
|
242279
|
Unpatented Lode Mining Claim
|
20.66
|
Section 26, T3S, R28E, MDM
|
12/7/1990
|
$125
|
|
LV 84
|
242280
|
Unpatented Lode Mining Claim
|
20.66
|
Section 26, T3S, R28E, MDM
|
12/7/1990
|
$125
|
|
LV 85
|
242281
|
Unpatented Lode Mining Claim
|
20.66
|
Section 26, T3S, R28E, MDM
|
12/7/1990
|
$125
|
|
LV 86
|
242282
|
Unpatented Lode Mining Claim
|
20.66
|
Section 26, T3S, R28E, MDM
|
12/7/1990
|
$125
|
|
LV 87
|
242283
|
Unpatented Lode Mining Claim
|
20.66
|
Section 26, T3S, R28E, MDM
|
12/7/1990
|
$125
|
|
LV 88
|
242284
|
Unpatented Lode Mining Claim
|
20.66
|
Section 26, T3S, R28E, MDM
|
12/7/1990
|
$125
|
|
LV 89
|
242285
|
Unpatented Lode Mining Claim
|
20.66
|
Section 26, T3S, R28E, MDM
|
12/7/1990
|
$125
|
|
LV 90
|
242286
|
Unpatented Lode Mining Claim
|
20.66
|
Section 26, T3S, R28E, MDM
|
12/7/1990
|
$125
|
|
LV 91
|
242287
|
Unpatented Lode Mining Claim
|
20.66
|
Section 26, T3S, R28E, MDM
|
12/7/1990
|
$125
|
|
LV 92
|
242288
|
Unpatented Lode Mining Claim
|
20.66
|
Section 26, T3S, R28E, MDM
|
12/7/1990
|
$125
|
|
LV 93
|
242289
|
Unpatented Lode Mining Claim
|
20.66
|
Section 26, T3S, R28E, MDM
|
12/7/1990
|
$125
|
|
LV 94
|
242290
|
Unpatented Lode Mining Claim
|
20.66
|
Section 26, T3S, R28E, MDM
|
12/7/1990
|
$125
|
|
LV 95
|
242291
|
Unpatented Lode Mining Claim
|
20.66
|
Section 26, T3S, R28E, MDM
|
12/7/1990
|
$125
|
|
Claim Name
|
Serial Number
|
Federal Claim Type
|
Surface Area (acres)
|
Location Description (Section, Township and Range)
|
Location Date
|
Annual Holding Fee
|
|
LV 96
|
242292
|
Unpatented Lode Mining Claim
|
20.66
|
Section 26, T3S, R28E, MDM
|
12/7/1990
|
$125
|
|
LV 98
|
242294
|
Unpatented Lode Mining Claim
|
20.66
|
Section 14, T3S, R28E, MDM
|
12/8/1990
|
$125
|
|
LV 111
|
242307
|
Unpatented Lode Mining Claim
|
20.66
|
Sections 14 & 23, T3S, R28E, MDM
|
12/9/1990
|
$125
|
|
LV 112
|
242308
|
Unpatented Lode Mining Claim
|
20.66
|
Section 23, T3S, R28E, MDM
|
12/9/1990
|
$125
|
|
LV 113
|
242309
|
Unpatented Lode Mining Claim
|
20.66
|
Sections 14 & 23, T3S, R28E, MDM
|
12/9/1990
|
$125
|
|
LV 114
|
242310
|
Unpatented Lode Mining Claim
|
20.66
|
Sections 23 & 24, T3S, R28E, MDM
|
12/9/1990
|
$125
|
|
LV 115
|
242311
|
Unpatented Lode Mining Claim
|
20.66
|
Sections 13, 14, 23 & 24, T3S, R28E, MDM
|
12/9/1990
|
$125
|
|
LV 116
|
242312
|
Unpatented Lode Mining Claim
|
20.66
|
Section 24, T3S, R28E, MDM
|
12/9/1990
|
$125
|
|
LV 117
|
242313
|
Unpatented Lode Mining Claim
|
20.66
|
Sections 13 & 24, T3S, R28E, MDM
|
12/9/1990
|
$125
|
|
LV 118
|
270618
|
Unpatented Lode Mining Claim
|
20.66
|
Section 25, T3S, R28E, MDM
|
11/7/1996
|
$125
|
|
LV 119
|
270619
|
Unpatented Lode Mining Claim
|
20.66
|
Section 25, T3S, R28E, MDM
|
11/7/1996
|
$125
|
|
LV 120
|
242316
|
Unpatented Lode Mining Claim
|
20.66
|
Section 24, T3S, R28E, MDM
|
12/9/1990
|
$125
|
|
LV 121
|
270620
|
Unpatented Lode Mining Claim
|
20.66
|
Section 26, T3S, R28E, MDM
|
11/71996
|
$125
|
|
LV 122
|
242318
|
Unpatented Lode Mining Claim
|
20.66
|
Section 24, T3S, R28E, MDM
|
12/10/1990
|
$125
|
|
Totals
|
95 Unpatented Lode Mining Claims
|
1,962.70
|
$11,875
|
Note
: all claims are Unpatented Federal Lode Mining Claims and do not expire provided annual fees are paid by August 31 of each year.
The surface rights covering the area of the claims are owned by the U.S. government, with the area being subject to a surface grazing lease. There is sufficient space on the mineral land controlled by Vista Gold for all necessary facilities including processing plant, heap-leach pads and waste dump areas.
On January 22, 2003, we executed an option agreement to acquire 100% of the Long Valley gold project from Standard Industrial Minerals, Inc. (“Standard”). Under the terms of the option agreement, we agreed to pay Standard $750,000 over five years, with annual payments to be due as follows: $100,000 due on each of January 15, 2003, 2004, and 2005; $200,000 due on January 15, 2006, and $250,000 due on January 15, 2007. We made these payments (see Consolidated Financial Statements—Note 5), and in January 2007, exercised our option to purchase the property, which is held through our indirect, wholly-owned subsidiary, Vista Gold California LLC. Royal Gold, Inc. (“Royal Gold”) holds a 1% NSR royalty on the property which we granted to Royal Gold in exchange for related data from Royal Gold.
There are no known environmental liabilities on the project.
We have no installations at or near the project.
Accessibility, Climate, Local Resources, Infrastructure and Physiography
The Long Valley property is located about 7 miles to the east of the town of Mammoth Lakes and about 45 miles north of the town of Bishop, California. Both towns are connected by U.S. Highway 395, which passes a few miles west of the property. Access to the property from the highway is via a series of graded gravel roads. The property is in an undisturbed condition.
Groundwater has been encountered in many exploration drill holes at depths of 200 to 300 feet and should be available in sufficient quantities for processing. It is believed that adequate power is available in the area with no more than a few miles of additional power line required to reach the property.
Operations personnel should be available from Mammoth Lakes and Bishop, with employees commuting to work in private vehicles.
The climate is semi-arid and moderate, with high temperatures in the summer generally in the 80°F range and winter highs generally in the 30-40°F range. Winter temperatures can be below 0°F. Precipitation at the property probably totals about 20 to 25 inches per year, divided between winter snows and summer thunderstorms. Snow depths in winter are generally less than two feet on the property, and the overall climate should permit operations year-round.
The property is located a few miles to the east of the Sierra Nevada Mountains, at an elevation of about 7,200 feet, in an area of gently rolling terrain.
History
Freeport McMoran Copper and Gold, Inc. (“Freeport”), Standard; Battle Mountain Gold Company (“BMGC” or “Battle Mountain”), Royal Gold, and Amax Minerals Company (“Amax”) completed most of the drilling on the property. Most of the drilling prior to 1994 was vertical, and most of the drilling after 1993 was angled.
Gold mineralization was first recognized on the property by Standard in the early 1980s as being present in small amounts in and around its kaolinite clay mining operations. Standard optioned the property to Freeport in 1983, who prospected the area and defined several distinct mineralized zones, referred to as the North, Middle and South. Freeport drilled about 80 shallow reverse circulation holes in mostly the North and South zones during 1983-1984. Freeport dropped the property, but additional drilling was performed by Standard in 1986, with 24 shallow rotary holes drilled mostly in the South zone.
Royal Gold acquired the property from Standard under a lease/purchase option agreement in 1988 and shortly thereafter drilled 52 air track holes in the South zone. Royal Gold also had performed various metallurgical and engineering studies and submitted permitting documents in support of constructing a small operation based on gold resources in the South zone. However, in 1990, BMGC and Royal Gold formed a joint venture to further explore and perhaps develop the property. During 1990 and 1991 BMGC, as the operator, completed geologic mapping, geochemical sampling, and geophysical surveying of the area and also drilled 59 reverse circulation holes. These holes were mostly in the South zone, but also resulted in the discovery of two new zones contiguous with the South zone, the Hilton Creek zone and the Southeast zone.
BMGC dropped out of the joint venture in 1993, but work continued by Royal Gold. During the period 1994 through 1997, Royal Gold aggressively explored the property drilling some 625 holes mostly in the Hilton Creek and Southeast zones. Only 10 core holes were drilled, with the balance being reverse circulation holes. During this time, Royal Gold also undertook extensive studies related to metallurgical investigations, preliminary engineering studies, including resource estimations, and initiated baseline-type environmental studies of the biological, water, and archeological resources of the area.
In mid-1997, Amax performed extensive due-diligence investigations in consideration of forming a joint venture with Royal Gold to place the property into production. Its work included drilling 46 reverse circulation holes and 10 core holes, as well as extensive re-assay and check assay work and the re-logging of older holes. Many of the holes were intended as “twins” to earlier Royal Gold holes. Amax elected not to proceed with the formation of the joint venture because of the continued deterioration of the gold price and its pending merger with Kinross Gold Corporation. The following table summarizes the drilling completed on the property.
History of Drilling on Long Valley Property, California
|
Year
|
Company
|
Number of Holes
|
Footage
|
|
1983-1984
|
Freeport
|
80
|
18,615
|
|
1985
|
Standard
|
24
|
2,055
|
|
1988
|
Royal Gold
|
52
|
4,770
|
|
1991-1992
|
Battle Mountain
|
59
|
18,685
|
|
1994-1997
|
Royal Gold
|
625
|
207,901
|
|
1997
|
Amax Gold
|
56
|
16,249
|
|
Totals
|
896
|
268,275
|
Following Amax’s departure, Royal Gold continued with some of the environmental studies, reclaimed the drill
roads and sites, performed some additional geochemical sampling, re-estimated mineral resources, and initiated a community public relations campaign. Due to the continued decline in the gold price and the decision by Royal Gold to become a royalty holding company, Royal Gold turned the property back to Standard, effective August, 2000. In January 2003, Vista Gold acquired the property from Standard. We acquired all related data from Royal Gold in exchange for a 1% NSR royalty to Royal Gold. Since 2000, the only work done on the property has been that necessary to maintain the claims in good standing.
The database contains 896 drill holes, totaling 268,275 feet. The majority of holes were drilled using reverse circulation methods. Gold was primarily analyzed by fire assay, with grade determinations by atomic absorption.
Geology and Mineralization
The Long Valley gold project claims are contained entirely within the early Pleistocene-age Long Valley Caldera, which has been dated at about 760,000 years old. The caldera is an elongated east-west oval depression measuring some 10 miles by 20 miles and is related to eruption of the Bishop Tuff, which is covered by younger rocks within the caldera.
The Long Valley gold mineralization is located near the center of the caldera and is underlain by lithologic units related to the caldera formation and its subsequent resurgence. Associated with resurgent doming is a sequence of interbedded volcaniclastic sedimentary rocks which were deposited in a lacustrine setting within the caldera. These rocks consist of sediment (siltstones through conglomerates) and debris-flow deposits, with local deposits of intercalated silica sinter and rhyolite flows and dikes. All of these lithologies have been altered and/or mineralized to variable degrees. Intruding the generally flat-lying lake sediments are several rhyolite domes that have been dated from 200,000 to 300,000 years in age.
The north-south trending Hilton Creek fault zone appears to define the eastern limit of the resurgent dome within the central part of the Long Valley Caldera and extends outside the caldera to the south. Offset along this fault appears to be variable and suggests that fault activity along this zone may be episodic in nature.
Gold and silver mineralization at Long Valley appears to fall under the general classification of an epithermal, low sulfidation-type deposit. Several areas, termed the North, Central, South, Southeast and Hilton Creek zones, on the Long Valley property are mineralized with low grades of gold and silver. The mineralized zones are generally north-south trending, up to 8,000 feet in length with widths ranging from 500 feet to 1,500 feet. The tabular bodies are generally flat-lying or have a shallow easterly dip. Mineralization is typically from 50 to 200 feet thick and, in the South and Southeast zones, is exposed at or very near the surface. The top of the Hilton Creek zone is covered by 20 to 50 feet of alluvium. The majority of the mineralization discovered to date is located in the Hilton Creek zone.
Gold and silver mineralization is quite continuous throughout the zones and is well-defined above a cut-off grade of 0.010 gold ounces per ton. Within the continuous zones of low-grade gold mineralization (above 0.010 gold ounces per ton) are numerous zones of higher grade mineralization above 0.050 gold ounces per ton, particularly in the Hilton Creek zone, which may relate to zones of enhanced structural preparation. Mineralized zones typically correlate with zones of more intense clay alteration or argillization and/or silicification.
Exploration, Drilling and Resource Estimate
As mentioned above, no physical work such as drilling has been done on the property since Royal Gold turned the property back to Standard in 2000.
The database contains 896 drill holes totaling 268,275 ft of drilling, of which, 800 drill holes totaling 257,545 feet are reverse circulation, 20 drill holes totaling 3,905 feet are core holes and the rest are rotary and air-track holes.
In February 2003, MDA, completed an NI 43-101 third-party mineral resource estimate for Vista Gold on the Long Valley gold project. In January 2008, a NI 43-101 third-party preliminary assessment was completed by MDA for us on the Long Valley gold project (the “Long Valley PA”), by or under the supervision of Neil Prenn and Thomas Dyer of MDA, each independent qualified persons within the meaning of NI 43-101, utilizing standard industry software and estimation methodology. Both studies were done under the supervision of Neil Prenn, a qualified person. The results of the Long Valley PA, which included an updated mineral resource estimate, are summarized in the technical report entitled “Technical Report, Preliminary Assessment, Long Valley Project, Mono County, California, USA” dated January 9, 2008 and the report is available on SEDAR at
www.sedar.com
.
Based on the report, under SEC Industry Guide 7 guidelines, mineralized material for the Long Valley gold project, above a cut-off grade of 0.010 gold ounces per ton, is estimated at 68,275,700 tons grading 0.018 gold ounces per ton.
Under the CIM Definition Standards, at the same cut-off grade, measured mineral resources are estimated at 26,596,900 tons grading 0.017 gold ounces per ton, indicated mineral resources are estimated at 41,678,800 tons grading 0.018 gold ounces per ton and inferred mineral resources are estimated at 32,913,300 tons grading 0.017 gold ounces per ton
See the section heading “Cautionary Note to All Investors Concerning Economic Assessments That Include Mineral Resources” above. Cautionary Note to U.S. Inventors: see the section heading “Cautionary Note to United States Investors Regarding Estimates of Measured, Indicated and Inferred Resources and Proven and Probable Reserves” above.
There are no known issues that might affect these estimates of mineralized material or mineral resources.
Sampling and Analysis
Most of the drill-hole samples obtained from the property were from generally dry reverse circulation drilling although, when drilling below the water table, significant flows were encountered. Water was added when drilling dry to improve recovery. A total of 896 drill holes were completed on the property, including 20 core holes.
Little is known of the sampling methods employed prior to 1994; however, sampling methods after 1994 are well documented. After 1994, the samples were collected and bagged at the drill site. The assay lab picked up the samples at the drill site, dried the samples, crushed, split, pulverized, and blended to obtain assay pulps. Most of the assays were completed by fire assay methods with an AA finish. Freeport completed aqua regia dissolution, followed by AA analysis of the samples.
Freeport’s samples were analyzed by Monitor Labs, who used acid digestion as the assay method. Battle Mountain used Barringer Laboratories and Bondar-Clegg Laboratories for sample preparation and fire assaying (AA finish) of one-assay-ton pulps. Sampling after 1994 was documented by Royal Gold. The Royal Gold samples were collected by taking a 5-10 pound split of each sample from the drill holes. Sample bags were sealed by the drill crew and not opened until they reached American Assay Labs. A similar procedure was used by Amax, but its samples were analyzed by Chemex Labs.
The first two Royal Gold core samples were collected at the drill site and placed in core boxes for transport to the American Assay Lab’s sample preparation facility where they were sawed in half and followed the same procedure as the reverse circulation samples. Samples were either grouped by rock type within five-foot intervals or prepared in five-foot intervals. The remaining Royal Gold core holes were six-inch diameter holes used for metallurgical testing, with the whole core blended together into a single composite. Amax prepared the core for assay by crushing the whole core after logging.
According to MDA, “The Long Valley project has had a considerable amount of check assaying and, as such, MDA concluded that collecting duplicate samples for verification purposes was not warranted.”
Sample Security
Samples were sealed in bags at the site and collected by commercial laboratory personnel.
Preliminary Assessment
As described above, in January 2008, the Long Valley PA was completed for us by MDA.
MDA considered the economic and technical parameters associated with development of the mineral resources within the restraints imposed by the state of California’s mining regulations that include a provision that all mined materials not removed from the property be replaced within the perimeter of the excavation. The preliminary assessment evaluated the potential economics of the project assuming that the mineral resources were mined using open-pit mining methods and processed using heap-leach technology. The preliminary assessment contemplates mining activities conducted by the owner using purchased equipment. The study included a process flowsheet based on metallurgical testing conducted over the past ten years under the supervision of previous owners and consisting of cyanide shake leach assays on pulps, bottle roll tests on drill cuttings from numerous reverse-circulation holes and long-term column tests on bulk samples from surface samples and core samples. The metallurgical test work and flowsheet were reviewed and approved for this study by RDi. The flowsheet proposes a lined heap-leach pad to be loaded at a rate of 4,000,000 tons per year of material in 30-foot-high lifts. The material would be crushed to a nominal three-inch size and agglomerated with lime and cement prior to placing on the heap-leach pad. Following application of cyanide leach solutions, the gold would be recovered in carbon columns from which it would be
stripped and a gold dore would be produced by electrowinning. After the pit material has been mined, the remaining waste materials would be backfilled into the pit along with the detoxified heap material.
MDA estimated startup capital at $58.8 million and total project capital at $61.8 million. Operating costs including mine closure and heap detoxification are estimated per ton of material mined and processed on a heap leach as follows: mining, $3.54 per ton; processing, $1.96 per ton; cyanide destruction, $0.25 per ton; and general and administrative costs and royalties, $0.89 per ton. Total operating costs are estimated at $6.64 per ton of heap-leach material mined and processed which equates to $415 per ounce of gold recovered. An estimated 535,300 ounces of gold would be produced over an eight-year mine life.
At the base-case gold price of $550 per ounce used in the study, the pre-tax IRR was 12.3%. The mine life is estimated at 8 years and the payback of capital, at the base case gold price of $550, was estimated at just over four years. At a gold price of $800 per ounce, the IRR was 63.2%.
The Long Valley PA includes inferred mineral resources (7% inferred and 93% measured and indicated) that are considered too speculative geologically to have the economic considerations applied to them that would enable them to be categorized as mineral reserves, and there is no certainty that the Long Valley PA will be realized. Mineral resources that are not mineral reserves do not have demonstrated economic viability.
Cautionary Note to U.S. Investors: see the section heading “Cautionary Note to United States Investors Regarding Estimates of Measured, Indicated and Inferred Resources and Proven and Probable Reserves” above. See the section heading “Cautionary Note to All Investors Concerning Economic Assessments that Include Mineral Resources” above.
Federal U.S. income taxes of approximately 35% would be payable on net income. California state income tax is 8.84% on net income and there are probably local property and other taxes; although, at this stage of the project, this has not been considered.
Exploration and Development
Because of other priorities (the Concordia and Mt. Todd gold projects), we have no immediate plans for developing Long Valley, but we may seek a joint-venture partner in the future to assist us in moving this project forward.
Awak Mas, Sulawesi, Indonesia
Property Description and Location
In April, 2005, we completed our acquisition of the Awak Mas gold deposit in Sulawesi, Indonesia, for a purchase price of $1.5 million. The acquisition of the Awak Mas gold project involved the purchase, through our wholly-owned subsidiary Vista Barbados of all of the outstanding shares of Salu Siwa Pty Ltd, an Australian company (“Salu Siwa”) from the two owners of Salu Siwa: Weston Investments Pty Ltd., an Australian company (“Weston”), and Organic Resource Technology Limited, an Australian company (“ORT”). Weston and ORT respectively owned 66% and 34% of the outstanding Salu Siwa shares. Salu Siwa in turn owns 99% of the outstanding shares of PT Masmindo Dwi, an Indonesian company (“PT Masmindo”), which is the direct holder of the Awak Mas gold project. The remaining 1% of the outstanding PT Masmindo shares is held by Vista Barbados. This project is held by us through a contract of work (“CoW”) with the Indonesian government.
On December 28, 2009, we announced that our wholly-owned subsidiary Vista Barbados had signed a joint venture agreement with Pan Asia Resources Corporation (“Pan Asia”) with respect to the development of the Awak Mas gold project.
The joint venture agreement provides Pan Asia, a privately held resource development company, with the opportunity to earn a 60% interest in the Awak Mas project by: (i) expending $3 million on the project within the next 30 months; (ii) completing an environmental impact assessment and feasibility study (in compliance with
NI 43-101, each of which is required by the CoW granted by the Indonesian Government under which the Awak Mas project is held; and (iii) issuing to Vista Gold two million shares of Pan Asia and the right to purchase up to an additional two million shares of Pan Asia in the event of an initial public offering of Pan Asia shares (on the same terms as offered under such initial public offering). Under the terms of the joint venture agreement, we will retain our controlling interest in the Awak Mas project until Pan Asia completes the earn-in conditions described above.
CoW
Under the Indonesian Constitution of 1945, the Government of Indonesia has sovereignty over all natural resources. Mining Law No. 11, instituted by the Indonesian Government in 1967, provide that the exploitation of minerals, other than coal, is to be regulated by mining authorities known as Kuasa Pertambangan ("KP") and by a CoW. A KP may be issued only to Indonesian citizens, wholly owned Indonesian companies or partnerships. They have a timeframe and status similar in scope to CoW's.
Where direct foreign equity is required, a CoW and a CoW holding company must be established. The basic idea underlying the CoW is that the CoW company will be responsible for conducting all stages of operations from prospecting to the marketing of refined minerals as a contractor for and on behalf of the Indonesian Government and bears all risks of exploration. A CoW is project specific and is formerly granted by the President of Indonesia after due process, including negotiation with various government departments on matters such as taxation. The CoW system has evolved through several generations, with the seventh generation now current. Most of the generations changed only in detail rather than in substance (changes to tax regimes, permissible application sizes, etc). Every CoW must be held by a specific Indonesian domiciled PMA company (Penanaman Model Asing). Previously, to establish such a PMA company, usually a maximum of 90% foreign equity was permitted. The foreign investor was further obliged to provide a genuine opportunity for further Indonesian capital participation once commercial production had commenced, with a majority Indonesian shareholding within 15 years of commencement of commercial production. Under the terms of the seventh generation CoW's, 100% foreign ownership is permissable and no divestment to local interests is necessary. The PMA company, which can hold only one CoW, has full control and management of its activities under the CoW and will have full responsibility and assume all risks of the operation. The company is required to employ Indonesian personnel to the maximum extent possible and undertake their training and to endeavor to utilize Indonesian goods and services wherever possible.
Obtaining a CoW is a three step process and is usually very time consuming and expensive. The first step is to file the application. At this stage, the applicant is not entitled to do any work on the property. Work can proceed only on those parts of the property covered by KP's, assuming that the KP owner has an equity interest in the CoW. The second step happens when the CoW is initialed by the Department of Mines. An initialed CoW application is deemed to have precedence over any following CoW lodged over the same area and is generally regarded as having been "Approved in Principle" by the Government of Indonesia and therefore a secure title interest. At this juncture, the foreign company will apply for a SIPP (Surat Izin Penyelidikan Pendahuluan or Permit for Preliminary Survey.) This SIPP provides the foreign company with exploration rights over the CoW application area while the terms of the CoW are being finalized with the Indonesian Government. The SIPP period is usually one year but could be renewed if required. A refundable interest-bearing bond of a minimum of $100,000 must be lodged with the Department of Mines upon granting of the SIPP. A SIPP is not a mining authorization and is not transferable. It can be granted to an Indonesian individual, or an Indonesian company for a foreign company if that party has obtained in principle the approval from the Department of Mines for a Contract of Work for mining in the relevant area. A SIPP, once granted, creates a priority to the holder for the grant of mining authorizations in respect of that area and the area is thereby closed to application from other parties. The holder of a SIPP must pay "deadrent", calculated on the area covered by the SIPP, as well as a security deposit. A SIPP cannot be renewed; however, an application to renew a SIPP in respect of the same area can be granted if the CoW for that area has not been executed. The balance of the SIPP period if not used can be rolled into the first survey period once the CoW is signed.
The third step is the actual granting of the CoW. This occurs when the CoW document is signed by the President. At this point, a refundable and interest bearing performance bond of a variable amount, established by a formula that takes into account the location of the CoW and its size, must be lodged with the Department of Mines. The SIPP bond may be used as all or part of the cash component of the bond, this being a minimum of $100,000. Typically, a bond would be put up in the form of 30% cash and 70% bank guarantee. As an example, a bond of $500,000 would be in the form of $350,000 bank guarantee and $150,000 cash, with the latter incorporating the SIPP bond. A performance bond of $5 per hectare is required, which also incorporates the SIPP bond. The CoW has a specific timetable as follows:
|
|
·
|
A SIPP period, usually one year.
|
|
|
·
|
A general survey period, usually one year.
|
|
|
·
|
An exploration period, usually three years.
|
|
|
·
|
A feasibility period, usually one year.
|
|
|
·
|
A construction period, usually three years.
|
|
|
·
|
An operating period, usually 10 to 30 years.
|
There is a set formula for the gradual relinquishment of areas, down to 25% of the original area. There have been two reductions in area: the first by our predecessors and the second by us that we received in March 2009. There are also expenditure requirements based on a minimum amount per square kilometer. Typically, in a fourth generation CoW, these would amount to $450 per square kilometer, higher for subsequent generation CoWs. By negotiation with the Department of Mines, the exploration and feasibility periods may be renewable for up to two periods of one year, providing expenditure is maintained to the satisfaction of the government agencies.
We completed the exploration phase of the CoW in January 2008 and entered the feasibility phase in February. The feasibility phase usually lasts one year, but may be negotiated for up to 2 one-year extensions. Following the feasibility phase, with government approvals, there would be a construction phase lasting usually three years. The operating period follows the construction phase, lasting usually 10 to 30 years. In late 2008, we applied for a suspension of the feasibility period for one year. Before this application was ruled upon, we announced our joint venture agreement with Pan Asia, which may have delayed the process.
In April 2010, draft Terms of Reference for an Environmental Impact Study leading to a new Environmental Management Plan (“AMDAL”) were presented to the environmental department in Luwu Regency by Pan Asia’s (operating through our subsidiary, PT Masmindo) AMDAL consultant. Because of a delay due to a question by the Indonesian government about the project boundary lines, which has since been resolved in our favor, we agreed to extend Pan Asia’s time commitments that are in our agreement by that amount of time (approximately nine months). At year end, Pan Asia submitted its Terms of Reference for completion of the Environmental Impact Study to the Provincial Government and is awaiting Provincial Government approval to finalize the AMDAL process during 2011.
Under the CoW issued by the Indonesian Government, a royalty is applicable based on gold production from Awak Mas as follows: less than 2,000 kilograms (approximately 64,000 ounces) of gold production per annum: $225 per kilogram of gold. Greater than 2,000 kilograms (approximately 64,000 ounces) of gold production per annum: $235 per kilogram. This royalty, assuming hypothetical production exceeds 64,000 ounces per annum, equates to $7.31 per gold ounce. The Lone Star purchase of a 45% interest in the Awak Mas project from Gasgoyne Gold Mines (“Gasgoyne”) includes a royalty of $10.00 per ounce, payable to Gasgoyne for any production from the project in excess of two million gold ounces.
We applied for a reduction in area, as required, to eliminate the areas where we believe there is low potential to discover economic mineralization. This was the second reduction in area, the previous one done by our predecessors and approval for the area now held under the CoW was received in early 2009 and is shown on the map accompanying this section. With this second reduction in area, we have met the requirements of the CoW pertaining to reduction in area.
A map showing the location of the CoW and a table describing the land holding and holding requirements follow.
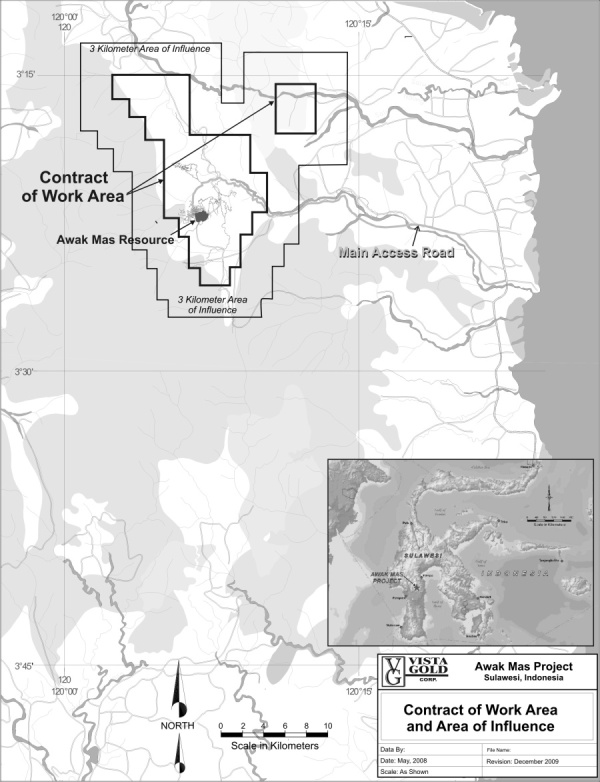
Awak Mas Land Holdings of Vista Gold
|
License
Name
|
Serial Number
|
Federal Claim Type
|
Surface Area
(hectares)
|
Location Description
|
Location Date
|
Expiration Date
|
Estimated Annual Holding Costs (US$)
|
Work Requirements
|
Other
|
|
7
th
Generation Contract of Work
|
Notarial Deed No. 10 dated February 16, 1998, Decree of Minister of Justice No.C2-919, HT.01.01.TH.98 dated February 16, 1998
|
Contract of Work
|
14,390
|
Project centered at 12005’ E. Longitude, 3020’ S Latitude
|
1/19/1998
|
See description of COW above
|
Dead Rent US $0.50/Ha and Land Tax US $0.50/Ha
|
None
|
Gradual reduction of area to 25% of original.
|
|
Totals
|
14,390
|
$14,390.00
|
Accessibility, Climate, Local Resources, Infrastructure and Physiography
The Awak Mas project area is mountainous, with steep razorback ridges and slope gradients generally ranging from 18° to 27°. The project is moderately to extremely rugged in the western portion, becoming more subdued in the east, with elevations ranging from near sea level to 3,440 meters above mean sea level. Primary rainforest predominates in the more rugged and inaccessible western portion of the project area, giving way to partially logged and cleared re-growth in lower lying and more accessible portions. Sulawesi is located within a seismically active area and a number of seismic events associated with the Palu and Mantano faults, located within 90 kilometers of the project, have been recorded.
The Awak Mas project lies only 200 kilometers south of the equator and is characterized by a typical tropical maritime monsoonal climate, with hot wet summers (rainy season) and marginally milder and dryer winters. The annual average rainfall is 3,200 millimeters, with the dryer period extending from July through October. Temperatures during the rainy season generally range between 18 and 27 degrees Celsius
The project is accessible by existing secondary paved and gravel public roads. The access roads will require improvements in order to support the loads associated with the construction of the project. At the present time, the project area is undeveloped with only a small office/camp complex and several sheds used for drill sample storage and the drill access roads constructed during the exploration phase.
Electrical power is presently supplied by diesel generator. Project power requirements may be supplied by diesel generated power or with commercial power from Palopa. If the latter is chosen, approximately 40 kilometers of new power line construction will be required. The project is located at the headwaters of a significant river system. We believe that a small water reservoir can be constructed to provide water for the project.
There are many small villages and settlements nearby from which we plan to obtain personnel to operate the mine during development and production. Professionals will be recruited from outside the area and will be housed in a camp onsite.
There are no known environmental liabilities for which we are responsible. There are no known environmental concerns at the Awak Mas project site that are expected to be an impediment to permitting and development. No known threatened and endangered plant or animal species and/or no unmanageable social issues are present. Permits to go forward with project development will be assessed and obtained once a work program is developed and approved by the joint-venture partners and the government. Required closure and reclamation plans will be developed at various levels as the project progresses through feasibility studies, permitting, detailed design and engineering.
History
The original partners in the Awak Mas Joint Venture were New Hope Consolidated Industries Pty Ltd (“New Hope”) and PT Asminco Bara Utama (“Asminco”) . In September 1991, BMGC concluded a farm-in agreement with New Hope and subsequently earned a 60% equity in the project. In 1994, Lone Star Exploration NL (“LSE”) negotiated the right to acquire the equity of both BMGC and New Hope. Subsequent to this negotiation, Gasgoyne Gold Mines NIL (“GGM”) and JCI Limited (“JCI”) structured an agreement to combine the various equities (45% LSE, 45% GGM, and 10% JCI) in the project under the single corporate entity of Masmindo Mining Corporation Limited (“MMC”). In January 1998, LSE purchased GGM’s 45% interest in the project. Placer Dome Inc. (“Placer”) entered into a joint venture agreement with MMC in September 1998 to acquire a 51% interest in the project by spending $10 million. Placer spent $1 million before concluding that the project provided only limited opportunity to host a resource that would satisfy the company's internal objectives, and elected to withdraw from the joint venture in June 1999. In October 1999, MMC signed an agreement with
JCI effectively amounting to a debt for equity swap, whereby the current debt of approximately A$8 million that MMC owed JCI was exchanged for a 66.6% interest in the Awak Mas project. Subsequent to this transaction, MMC purchased JCI's interest in the project, once again assuming a full interest in the Awak Mas project, until an option to purchase agreement was executed with us in November 2004 and the transaction was completed in April 2005.
A final feasibility study was completed by independent consultants in 1997 for LSE supporting a mining scenario of three million tonnes per year of ore. Independent valuations of the project were completed in 2000 and 2003 as well.
Over $43 million was spent on the project by previous operators.
Geology and Mineralization
The Awak Mas property is situated on the southern side of the Central Sulawesi Metamorphic Belt within a 50-kilometer-long, north-northeast trending fault-bounded block of basement metamorphic rocks and younger sediments. The western margin of this block is represented by an easterly dipping thrust, whereas the eastern margin is defined by a major basement structure. Imbricate faulting has complicated the internal morphology of the block. The property is dominated by the late Cretaceous Latimojong Formation, consisting of phyllites, slates, basic to intermediate volcanics, limestone and schist representing a platform and/or fore arc trough flysch sequence. The Latimojong Formation overlies basement metamorphic rocks dominated by phyllites and slates. Both sequences have been intruded by late-stage plugs and stocks of diorite, monzonite and syenite. To the east of the metamorphic block, basic intermediate intrusives, pyroclastics and volcanogenic sediments comprising the Mesozoic Lamasi Ophiolite Complex appear to have been obducted into a position effectively overlying the younger flyschoid sequence and basement metamorphics during continental accretion.
Gold mineralization is distinctly mesothermal in character, atypical of the more ubiquitous low temperature or epithermal precious metal mineralization within many island arc environments in Indonesia. Gold is associated with sulphur-poor, sodic-rich fluids introduced at a relatively late stage in the tectonic history. Albite-pyrite-silica-carbonate alteration, which accompanies gold deposition, clearly overprints the ductile fabric associated with deformation and metamorphism in the older basement lithologies.
The majority of gold mineralization on the property, including the Awak Mas deposit, is predominantly hosted within the flysch sequence, which typically dips at between 15
o
and 50
o
, generally towards the north. The majority of gold mineralization is associated with abundant quartz veining and silica—albite-pyrite alteration; however, the association of gold and quartz is not ubiquitous, with some vein zones appearing to be locally barren of mineralization.
Two main styles of mineralization are present. The first represents broad shallow dipping zones of sheeted and stockwork quartz veining and associated alteration that conform to the shear fabric, especially within the dark, graphitic mudstones. The other style consists of steeper dipping zones of quartz veining and breccias associated with high angle faults cutting both the flyschoid cover sequence and basement metamorphic rocks.
Late-stage, north-northeast trending normal faults locally disrupt or offset mineralization. A surface layer of consolidated scree and colluvium averaging three to four meters (maximum 15 meters) in thickness veneers the deposit. The base of weak oxidation within the mineralized sequence typically is within 20 meters of surface.
Exploration and Drilling
New Hope and Asminco commenced initial exploration under a SIPP permit in force from May to October 1987, which pre-dated execution of the initial CoW. Following an initial reconnaissance visit in July 1987, the Bajo River (site of intermittent artisanal alluvial mining activity) and the Ulusalu area were recommended for further assessment. During August and September 1987, reconnaissance sampling was completed in the Ulusalu/Tibusan/Ranteballa area, together with an initial appraisal of the alluvial gold potential in the Bajo River at Bonelemo. During the initial two-year exploration period associated with the CoW, extending from October 1988 to October 1990 (including a one year extension), exploration included regional stream sediment geochemistry, photogeological mapping, airborne geophysical survey, GIS database development, follow-up mapping and stream sediment surveys, regional soil geochemistry, scout drilling programs, detailed structural and geological mapping and establishment of survey control.
Stream sediment sampling culminated in the identification of six discrete anomalies within the flysch sequence lying immediately west of the major north-northwest trending suture. Three of these targets, including Awak Mas, were subsequently followed up with further rock chip, float and stream sediment sampling and geological mapping during 1991.
At the Awak Mas prospect, extensive excavations were noted to be backfilled with sand from mechanical crushing, indicating the existence of earlier artisanal mining activity. Soil sampling of the C horizon (7,000 samples in total), employing portable Wacca drills was completed on lines 100, 200 and 400 meters apart, with sample intervals of 20 meters. This technique proved effective in delineating broad geochemical anomalies in new areas and defining the extent of anomalies in areas of known mineralization. BMGC completed a farm-in agreement in September 1991 and earned its equity in 1993. BMGC completed a 77-hole diamond drilling program, principally directed at the Awak Mas target, which confirmed the existence of significant mineralization. Photogeological mapping, an airborne geophysical survey and subsequent interpretation substantially assisted in defining the gross geological and structural framework, and identified several possible intrusive centers, some of which were later confirmed as diorite plugs. Detailed structural and geological mapping of individual prospect areas was undertaken to aid interpretation of structure, and provide greater confidence in the orientation and continuity of gold mineralization. Extensive survey work provided grid control for the various sampling and drilling programs, and in conjunction with photogrammetry, permitted the establishment of a topographic (digital terrain) model with a 5-meter contour interval in the vicinity of the Awak Mas deposit. The feasibility study period commenced in October 1991 and, with a series of extensions of term, continued until April 1996. Aside from the drilling completed by BMGC prior to its withdrawal from the project in 1993, MMC completed numerous additional programs between 1993 and 1997.
A total of 791 holes aggregating 94,810 meters have been completed at Awak Mas, of which approximately 83% represent diamond or precollared diamond drillholes, the remainder comprising reverse circulation drilling.
Between 1991 and 1996, over 150 individual technical studies were completed by external consultants. These studies culminated in a definitive feasibility study, undertaken by Minproc Engineers Limited in 1996. The feasibility study was approved by the Director General of the Department of Mines and Energy in August 1996. In October of that year, the AMDAL was submitted in support of the feasibility study, and official government questions were issued in January 1997. The revised AMDAL was re-submitted in February 1997, along with an updated feasibility study.
In late 1997, MMC requested an extension of the construction period due to a significant fall in the gold price from $400 per ounce to $300 per ounce. An extension until April 1998 was subsequently approved to provide MMC the opportunity to identify additional, higher-grade resources and submit a revised feasibility study and environmental management strategy. Extensive additional regional exploration was carried out in 1998 with the objective of identifying additional resources, preferably of higher grade, in an effort to achieve project viability against a deteriorating gold price.
Placer entered into a joint venture agreement with MMC in September 1998 to continue regional exploration with the objective of identifying additional resources. The Salu Bulo prospect was selected as the highest priority target for further assessment. Additional exploration was also completed in the Tarra North West and Sewatu areas, comprising traverse mapping, trenching, channel sampling, mapping and diamond drilling (43 holes; 4,517.9 meters).
Placer elected to withdraw from the joint venture in June 1999. JCI acquired a two-thirds interest in the Awak Mas project in October 1999, assumed management of the CoW and completed a comprehensive review of the GIS database compiled by MMC, particularly the results of previous exploration within a five-kilometer radius of the Awak Mas deposit. This review generated several targets worthy of further assessment, including the Rutuk, Salu Kanan and Lelating areas. The Rutuk area lies approximately 700 meters southwest of Awak Mas, and is considered to represent a possible extension of the same mineralized system. JCI completed 15.2 line-kilometers of grid mapping, further rock chip sampling, 1,319 meters of trenching and collected 528 two-meter channel samples. The results of this work defined a broad area of alteration and mineralization over an area measuring 600 meters by 300 meters. Mineralization is confined to two principal areas, Loi Rutuk and Alo Rutuk, which are hosted within the "cover" and "basement" sequence respectively.
Exploration completed by JCI in the Salu Kanan area, situated 800 meters north-northeast of the Awak Mas deposit, included 7 kilometers of grid mapping and six rock chip samples. Initial mapping and rock chip sampling results were disappointing, however, and no further work was undertaken. In the Lelating area, located 1.3 kilometers southeast of the Awak Mas deposit, JCI completed 1.4 kilometers of grid mapping and a further 81 Wacca drillholes (244 meters), defining a 200-meter extension to the original soil anomaly. A solitary trench (16 meters) was excavated across the anomaly extension, and subsequent channel sampling generated a mineralized interval of 12 meters at 4.61 gold grams per tonne.
Core drilling was generally completed by contract drilling companies, although little detail is documented, apart from the drill rig used. It is understood that a limited number of early drill holes were completed by man-portable (Jackro) rigs, while the vast majority of drilling was completed using either multipurpose RC/DDH or dedicated track/skid/truck mounted drill rigs, such as Longyear 38s and 44s. A range of core sizes was drilled at Awak Mas, including BQZ, NQ2, HQ2, HQ3, PQZ and PQ3. The vast majority of the diamond core at Awak Mas is HQ.
Where appropriate, an orientation
spear was used to enable the determination of structural orientations. At the completion of each drill run, the core was removed from the barrel, placed in core trays, clearly labeled with the hole number, tray number and interval. A driller's block was annotated with the depth and placed at the end of each run. The core trays were carefully stacked and transported to a dedicated core yard.
The drilling was generally undertaken on a nominal 50-meter by 50-meter pattern, with local infill to 25 meters by 25 meters in two limited regions. The holes were generally vertical or inclined at approximately 60° to 70° to grid west or southwest. The Rante region is generally drilled with holes oriented at minus 60° towards 215°.
The reverse circulation drilling completed at Awak Mas was undertaken by a contractor. The majority of drilling was completed using a 5.25" face sampling hammer, although a limited number of drill holes were completed using a 4.75" hammer. Little detail is documented on the air capacities and pressures of the drill rigs used to complete the RC programs. One-meter samples were collected via a cyclone into plastic bags with the cyclone manually cleaned at the completion of each six-meter rod and more thoroughly cleaned at the completion of each hole.
During 2005, we initiated an exploration program designed to identify drill targets in outlying surface indications of gold mineralization. The program involved soil and rock geochemistry, drilling shallow test holes to obtain bedrock samples, geologic mapping and interpretation of results. In 2006, we completed a 13 hole diamond drill program totaling 2,576 meters that was designed to upgrade shows of mineralization into reportable amounts
Sampling and Analyses
Gustavson Associates, LLC (“Gustavson”) of Boulder, Colorado, was hired to review data and complete third-party technical studies at Awak Mas for us. Gustavson did not complete an independent data verification program because previous companies had completed both internal and third party external data verification programs on the Awak Mas database and supporting data. Gustavson reviewed these verification programs and is satisfied that they have been both comprehensive and rigorous. In addition, it is Gustavson’s opinion that they have produced a database that meets all of the current standards for reliability and accuracy.
It is Gustavson’s opinion that Vista Gold has developed excellent sample handling and security procedures. They are well documented and audited on a regular basis. Gustavson’s only concern was the returned pulps, which Gustavson saw in open containers in the core sheds. Gustavson recommends that the pulp containers be resealed and placed in a ‘tamper-proof” location within the core sheds. Core is delivered to the Awak Mas core shack by Masmindo employees. The shack is kept under lock and key when Masmindo employees are not present. All core to be sampled is sawn into one-half splits, with half being retained for future reference and the other half being sent for analysis. The core cutting is completed by a technician under the supervision of a Masmindo geologist. In addition, the supervising geologist is responsible for inclusion of the appropriate blanks, duplicates, and standards. The sawn core is placed into clean plastic sample bags that contain two, preprinted sample labels. One of the labels stays with the pulp bag and the other with the reject bag. A third sample label is stapled to the core tray along with the meterage represented by the sample. The fourth and final label remains in the sample tag book with the drill-hole number and meterage filled in. The bagged samples are double sealed with two zip-strips. The first zip-strip is merely to close the bag and is unlabelled. The second zip-strip is labeled with Masmindo’s name and the matching sample number. Sealed sample bags are placed into rice bags for transport to the assay laboratory in Jakarta. The samples are transported by a contractor to the RPX cargo facility in Makassar. RPX cargo then sends the samples directly to the assay laboratory in Jakarta. The assay laboratory in Jakarta is required to notify Masmindo if the samples do not arrive with all of the seals intact. In addition, the assay laboratory also retains the seals of the samples that are analyzed as further proof of the chain of custody. The core shack on site retains all of the duplicate splits as core and the returned pulps.
Various analytical labs including Indo Assay Laboratory, Analabs, Jakarta and Intertek Caleb Brett Lab of Jakarta have been involved in assaying drill samples from Awak Mas. It is Gustavson’s opinion that the reports by the various companies and consultants have fairly represented the sampling and assaying history at the site and that the procedures implemented by the operators have resulted in an assay database that fairly represents the tenor of the mineralization at the Awak Mas gold project.
Preliminary Assessment and Mineral Resource Estimate
The current geologic model contains a total of 803 drill holes for some 97,426 meters of drilling, predominately on nominal 50 meters by 50 meters spacing, with infill to a nominal 25 meters by 25 meters spacing being restricted to two limited areas of the deposit, namely the Mapacing and Rante regions. There are an additional 13 drill holes (KAD001 to KAD 013) that are located outside the Awak Mas area and, therefore, were not included in the resource estimation.
Gustavson completed a mineral resource estimate for us in June 2007. Gustavson was subsequently commissioned in June 2007 to complete a preliminary assessment (the “Awak Mas PA”) for us of the project under NI 43-101 standards. The study was completed on January 16, 2008, by or under the supervision of John Rozelle, an independent qualified person. The report entitled “Preliminary Assessment, Awak Mas Gold Project, Sulawesi, Indonesia” dated January 16, 2008, is available on SEDAR at
www.sedar.com
. In this study, Gustavson confirmed the mineral resource estimate completed for us in 2007. Based on the report, under SEC Industry Guide 7 guidelines, mineralized material for the deposit, above a cut-off grade of 0.50 grams gold per tonne, is estimated at 41,693,000 tonnes grading 1.24 grams gold per tonne.
Under CIM Definition Standards, at the same cut-off grade, measured mineral resources are estimated at 7,084,000 tonnes grading 1.30 grams gold per tonne, indicated mineral resources are estimated at 34,609,000 tonnes grading 1.22 grams gold per tonne and inferred mineral resources are estimated at 20,425,000 tons grading 0.82 grams gold per tonne.
Cautionary Note to U.S. Inventors: see the section heading “Cautionary Note to United States Investors Regarding Estimates of Measured, Indicated and Inferred Resources and Proven and Probable Reserves” above.
In undertaking the Awak Mas PA, Gustavson considered the economic and technical parameters associated with development of the mineralized material (mineral resources under Canadian guidelines) by open-pit mining. The study included a process flowsheet based on three stages of laboratory and pilot plant test programs from 1994 to 1997. The flowsheet was developed by Minproc Engineers Ltd. in 1997, and reviewed and approved by RDi. The flowsheet includes a flotation circuit to recover gold associated with sulfide minerals following which the concentrate would be treated in a carbon-in-leach circuit to recover the gold. The benign tailings from the flotation circuit would flow by gravity into a tailings impoundment and the sulfide tailings would be detoxified, filtered and conveyed to a small “dry-stack” sulfide tailings storage facility. A third party consultant prepared the tailings disposal sites layout and closure plans, and assessed permitting requirements.
The potential development included four different scenarios that would produce an estimated 0.6 to 1.0 million ounces of gold over a project life of 7 to 15 years. Gustavson estimated the preproduction capital to be $124 million to $178 million, depending on the scenario, and the total capital cost over the project life to be $148 million to $218 million. The cost estimates used in the preparation of a preliminary economic assessment are generally accepted as being within plus or minus 35 to 40% of what might be incurred in actual construction and operations. The costs in the Awak Mas PA are within this level of confidence. However, the Awak Mas PA uses mineral resources (mineralized material under SEC Industry Guide 7) and not mineral reserves, but also includes inferred mineral resources (not acceptable as mineralized material under SEC Industry Guide 7, but allowable in a preliminary assessment under certain circumstances in NI 43-101). Mineral resources (mineralized material under SEC Industry Guide 7) that are not mineral reserves do not have demonstrated economic viability. A determination of mineral reserves would be necessary to demonstrate economic viability of the Awak Mas gold project
. Cautionary Note to U.S. Investors: see the section heading “Cautionary Note to United States Investors Regarding Estimates of Measured, Indicated and Inferred Resources and Proven and Probable Reserves” above. See the section heading “Cautionary Note to All Investors Concerning Economic Assessments that Include Mineral Resources” above.
At a $625 gold price, the project appears to be uneconomic. However, this is believed to be as much a function of infrastructure costs as any other aspect of the project. If the estimated power costs and access road construction costs are reduced to more manageable levels, the project shows positive economics. It is possible that the government will participate to some degree in helping to provide upgraded infrastructure for the benefit of the surrounding communities. Higher gold prices and engineering studies could result in improved economic returns. Indonesian corporate tax rates are payable at the rate of 30% of net income. Local taxes may also apply, but at this level of study, this has not been considered.
Exploration and Development
Pan Asia commenced it activities at Awak Mas in January 2010 with the hiring of an experienced project manager and during the second quarter, a senior mining engineer to aid its resource assessment work. Pan Asia’s initial focus was on the mineral resource previously defined at the project and some months were spent on re-evaluating the geological database and producing an in house resource model. During the first quarter of 2011, an independent evaluation of its resource model will be undertaken by its independent consultants, Tetra Tech.
Pan Asia reports that it has assembled a team of highly qualified consultants to undertake a preliminary economic assessment or scoping study for the Awak Mas project. The team includes Amec-Minproc for plant and process design, Australian Mine Design & Development for mine planning and ore reserve definition, Golder Associates for geotechnical investigations and environmental consulting, Resindo Resources for infrastructure and local costs and Tetra-Tech for mineral
resource evaluation.
Initial site visits by Pan Asia’s consulting team was undertaken during the fourth quarter 2010 and further site visits are planned in January 2011. The preliminary economic assessment or scoping study is scheduled to be completed by April 30, 2011.
A program of infill drilling is scheduled to commence during the first quarter 2011. This program is designed to upgrade inferred resources to indicated status so they can be included in the definitive feasibility study that is scheduled to be undertaken in the second half of 2011, and also provide core samples for additional metallurgical testing in Australia to aid the process design work being undertaken by Amec-Minproc.
During 2010 a number of local community initiatives were undertaken, and in 2011, Pan Asia plans to hire a community relations officer as the project proceeds into the definitive feasibility study phase.
We are not aware of any material pending or threatened litigation or of any proceedings known to be contemplated by governmental authorities which are, or would be, likely to have a material adverse effect upon us or our operations, taken as a whole. There are no material proceedings pursuant to which any of our directors, officers or affiliates or any owner of record or beneficial owner of more than 5% of our securities or any associate of any such director, officer or security holder is a party adverse to us or has a material interest adverse to us.
As of December 31, 2010, we had three executive officers, namely Michael B. Richings, Executive Chairman and Chief Executive Officer, Gregory G. Marlier, Chief Financial Officer and Frederick H. Earnest, President and Chief Operating Officer. Information follows as to Mr. Richings, Mr. Marlier and Mr. Earnest.
|
Name, Position and Age
|
Held Office Since
|
Business Experience During Past Five Years
|
|
Michael B. Richings
Executive Chairman,
Chief Executive Officer and Director
Age—66
|
November 6, 2007 (Executive Chairman)
May 25, 2004
(Chief Executive Officer)
|
Executive Chairman and Chief Executive Officer of Vista Gold Corp. from November 2007 to present; Chief Executive Officer of Vista Gold from August 2007 to November 2007; President and Chief Executive Officer of Vista Gold from May 2004 until August 2007; and formerly, President and Chief Executive Officer of Vista Gold from June 1995 to September 2000; retired from Vista Gold September 2000 to May 2004 (continued as a director of Vista Gold and served as consultant to mining industry during that period).
|
|
Gregory G. Marlier
Chief Financial Officer
Age—61
|
June 1, 2004
|
Chief Financial Officer of Vista Gold Corp. from June 2004 to present; Chief Financial Officer of Pacific Western Technologies, Ltd. from 2000 to 2004.
|
|
Frederick H. Earnest
President, Chief Operating Officer and Director
Age—49
|
August 1, 2007
|
President and Chief Operating Officer of Vista Gold Corp. from August 2007 to present; Senior Vice President, Project Development of Vista Gold from September 2006 to August 2007; President of Pacific Rim Salvador, S.A. de C.V. from June 2004 to September 2006 and General Manager and Legal Representative of Compania Minera Dayton from April 1998 to June 2004.
|
Arrangements between Officers and Directors
To our knowledge, there is no arrangement or understanding between any of our officers and any other person, including directors, pursuant to which the officer was selected to serve as an officer.
Family Relationships
None of our executive officers are related by blood, marriage, or adoption to any other director, executive officer, or other key employees.
Legal Proceedings
We are not aware of any material legal proceedings to which any of our officers or any associate of any of our officers is a party adverse to us or any of our subsidiaries or has a material interest adverse to us or any of our subsidiaries.
We are not aware of any of our officers being involved in any legal proceedings in the past ten years relating to any matters in bankruptcy, insolvency, criminal proceedings (other than traffic and other minor offenses) or being subject to any of the items set forth under Item 401 of Regulation S-K.
Price Range of Common Shares
The Common Shares of Vista Gold are listed on the NYSE Amex and the TSX under the symbol VGZ. The following table sets out the reported high and low sale prices on the NYSE Amex and on the TSX for the periods indicated as reported by the exchanges.
|
NYSE Amex (US$)
|
TSX
(CDN$)
|
||||
|
High
|
Low
|
High
|
Low
|
||
|
2009
|
1st quarter
|
2.92
|
1.16
|
3.63
|
1.40
|
|
2nd quarter
|
2.74
|
1.45
|
3.03
|
1.70
|
|
|
3rd quarter
|
2.82
|
1.51
|
2.95
|
1.74
|
|
|
4th quarter
|
3.38
|
2.12
|
3.59
|
2.38
|
|
|
2010
|
1st quarter
|
1.92
|
2.84
|
3.16
|
1.98
|
|
2nd quarter
|
2.54
|
1.60
|
2.69
|
1.69
|
|
|
3rd quarter
|
2.59
|
1.30
|
2.70
|
1.33
|
|
|
4th quarter
|
3.45
|
2.25
|
3.59
|
2.30
|
|
On March 11, 2011, the last reported sale price of the Common Shares of Vista Gold on the NYSE Amex was $3.46 and on the TSX was CDN $3.33. As at March 11, 2011, there were 61,919,752 Common Shares issued and outstanding, and we had approximately 469 registered shareholders of record.
Dividends
We have never paid dividends. While any future dividends will be determined by our directors after consideration of our earnings, financial condition and other relevant factors, it is currently expected that available cash resources will be utilized in connection with the ongoing acquisition, exploration and evaluation programs of Vista Gold.
Securities Authorized for Issuance under Equity Compensation Plans
See “Item 11. Executive Compensation” for information relating to our equity compensation plan.
Stock Performance Graph
The following graph compares the yearly percentage change in the Corporation's cumulative total shareholder return on its Common Shares with the cumulative total return of the S&P/TSX Composite Index and the S&P/TSX Global Gold Index, assuming the reinvestment of dividends, for the last five financial years. This performance chart assumes that $100 was invested on December 31, 2005, in (i) the Corporation’s Common Shares at the closing price of the Common Shares on such date of $5.08, as quoted on the NYSE Amex, (ii) the S&P/TSX Composite Index, and (iii) the S&P/TSX Global Gold Index. Canadian dollar closing price quotes on the TSX are converted to US dollars using the noon exchange rate as quoted
by the Bank Of Canada for the date of the closing price quote.
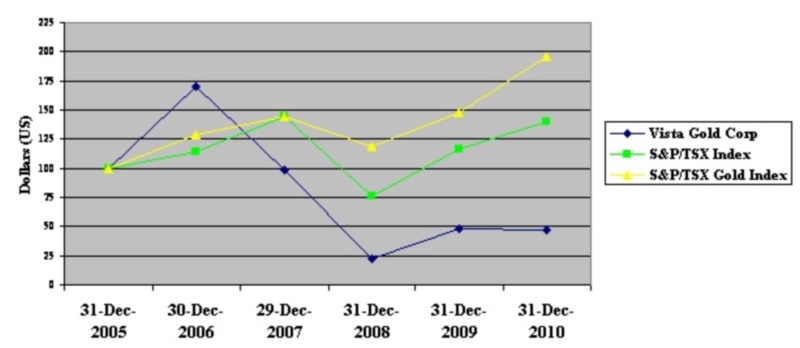
|
DATA TABLE
|
|
12/31/05
|
12/30/06
|
12/29/07
|
12/31/08
|
12/31/09
|
12/31/10
|
|
|
Vista Gold Corp.
|
$100
|
$169.92
|
$98.84
(1)
|
$22.05
|
$48.24
|
$47.06
|
|
S&P/TSX Composite Index
|
$100
|
$114.45
|
$144.33
|
$75.98
|
$115.97
|
$139.99
|
|
S&P/TSX Global Gold Index
|
$100
|
$129.26
|
$144.92
|
$118.32
|
$148.10
|
$196.23
|
(1) On May 10, 2007, Vista completed an arrangement involving its wholly-owned subsidiary, Allied Nevada Gold Corp. ("Allied"). Pursuant to the arrangement, each shareholder of Vista received for each share of Vista held on May 10, 2007: (a) a new shares of Vista, (b) .794 shares of Allied subject to applicable withholding taxes and (c) any payment they were entitled to receive in lieu of a fractional share of Allied. A shareholder that invested $100 in Vista on December 31, 2005 would have received shares of Allied valued at $91.47 dollars on May 10, 2007, $97.22 on December 31, 2007, $79.08 on December 31, 2008, $235.70 on December 31, 2009, and $411.85 on December 31, 2010.
Exchange Controls
There are no governmental laws, decrees or regulations in Canada that restrict the export or import of capital, including foreign exchange controls, or that affect the remittance of dividends, interest or other payments to non-resident holders of the securities of Vista Gold, other than Canadian withholding tax. See “—Certain Canadian Federal Income Tax Considerations for U.S. Residents,” below.
Certain Canadian Federal Income Tax Considerations for U.S. Residents
The following summarizes certain Canadian federal income tax consequences generally applicable under the
Income Tax Act
(Canada) and the regulations enacted thereunder (collectively, the “Canadian Tax Act”) and the
Canada-United States Income Tax Convention (1980)
(the “Convention”) to the holding and disposition of Common Shares.
Comment is restricted to holders of Common Shares each of whom, at all material times for the purposes of the Canadian Tax Act and the Convention, (i) is resident solely in the United States, (ii) is entitled to the benefits of the Convention, (iii) holds all Common Shares solely as capital property, (iv) deals at arm’s length with and is not affiliated with Vista Gold, (v) does not and is not deemed to use or hold any Common Shares in a business carried on in Canada, and (vi) does not hold Common Shares which constitute “taxable Canadian property” as defined in the Canadian Tax Act (each such holder, a “U.S. Resident”).
Certain entities that are fiscally transparent for United States federal income tax purposes (including limited liability companies) may not in all circumstances be regarded by the Canada Revenue Agency (the “CRA”) as entitled to the benefits of the Convention. Members or holders of an interest in such an entity that holds Common Shares should consult their own tax advisors regarding the extent, if any, to which the CRA will extend the benefits of the Convention to the entity in respect of its Common Shares.
Generally, a U.S. Resident will be considered to hold a Common Share as capital property provided that the U.S. Resident acquired the Common Share as a long-term investment, is not a trader or dealer in securities, did not acquire, hold or dispose of the Common Share in one or more transactions considered to be an adventure or concern in the nature of trade (i.e. speculation), and does not hold the Common Share as inventory in the course of carrying on a business. Special rules, which are not discussed below, may apply to a U.S. Resident who is an insurer that carries on business in Canada and elsewhere.
Generally, a Common Share held by a U.S. Resident will only constitute “taxable Canadian property” at a particular time if all of the following conditions are met:
|
|
(i)
|
the Common Share is listed on a “designated stock exchange” (which currently includes the TSX) at that time;
|
|
|
(ii)
|
the U.S. Resident or any one or more persons with whom the U.S. Resident does not deal at arm’s length, owned, alone or in any combination, 25% or more of the issued shares of any class of the capital stock of Vista Gold at any time in the 60 months preceding the particular time; and
|
|
|
(iii)
|
more than 50% of the fair market value of the Common Share was derived directly or indirectly from, or from any combination of, real or immovable property situated in Canada, “Canadian resource properties” (as defined in the Canadian Tax Act), “timber resource properties” (as so defined), or options or interests therein, at any time in the 60 months preceding the particular time.
|
This summary is based on the current provisions of the Canadian Tax Act and the Convention in effect on the date hereof, all specific proposals to amend the Canadian Tax Act and Convention publicly announced by or on behalf of the Minister of Finance (Canada) on or before the date hereof (the “Tax Proposals”), and the current published administrative and assessing policies of the CRA. It is assumed that all such amendments will be enacted as currently proposed, and that there will be no other material change to any applicable law or administrative practice, although no assurance can be given in these respects. Except as otherwise expressly provided, this summary does not take into account any provincial, territorial or foreign tax considerations.
This summary is of a general nature only, is not exhaustive of all possible Canadian federal income tax considerations, and is not intended to be and should not be construed as legal or tax advice to any U.S. Resident. U.S. Residents are urged to consult their own tax advisors for advice with respect to their particular circumstances. The discussion below is qualified accordingly.
This summary does not address any Canadian federal income tax consequences in respect of the transactions pursuant to the Arrangement Agreement by which shareholders of Vista Gold exchanged their old common shares and received, subject to applicable withholding taxes, (i) new Common Shares of Vista and (ii) common shares of Allied. Holders of Common Shares should refer to the Management Information and Proxy Circular of Vista dated October 11, 2006 for a summary of the tax consequences related to these transactions.
Disposition of Common Shares
A U.S. Resident who disposes or is deemed to dispose of a Common Share should not thereby incur any liability for Canadian federal income tax in respect of any capital gain thereby arising.
Taxation of Dividends on Common Shares
A U.S. Resident on whose Common Share Vista Gold pays or credits, or is deemed to pay or credit, a dividend generally will be subject to Canadian withholding tax at the rate of 15% or, if the U.S. Resident is a company that beneficially owns at least 10% of the voting stock of Vista Gold, 5% of the gross amount of the dividend. Vista Gold will be required to withhold the requisite amount of tax from the dividend and remit it to the CRA for the U.S. Resident’s account. A U.S. Resident that is a qualifying religious, scientific, literary, educational or charitable tax exempt organization or a qualifying trust, company, organization or arrangement operated exclusively to administer or provide pension, retirement or employee benefits, and is exempt from tax in the United States, may be exempt under the Convention from Canadian withholding tax provided that the U.S. Resident complies with specific administrative procedures.
CERTAIN UNITED STATES FEDERAL INCOME TAX CONSIDERATIONS
The following is a general summary of certain material U.S. federal income tax considerations applicable to a U.S. Holder (as defined below) arising from and relating to the acquisition, ownership, and disposition of Common Shares.
This summary is for general information purposes only and does not purport to be a complete analysis or listing of all potential U.S. federal income tax considerations that may apply to a U.S. Holder arising from and relating to the acquisition, ownership, and disposition of Common Shares. In addition, this summary does not take into account the individual facts and circumstances of any particular U.S. Holder that may affect the U.S. federal income tax consequences to such U.S. Holder, including specific tax consequences to a U.S. Holder under an applicable tax treaty. Accordingly, this summary is not intended to be, and should not be construed as, legal or U.S. federal income tax advice with respect to any U.S. Holder. Each U.S. Holder should consult its own tax advisor regarding the U.S. federal, U.S. federal alternative minimum, U.S. federal estate and gift, U.S. state and local tax, and foreign tax consequences relating to the acquisition, ownership and disposition of Common Shares.
No legal opinion from U.S. legal counsel or ruling from the Internal Revenue Service (the “IRS”) has been requested, or will be obtained, regarding the U.S. federal income tax consequences of the acquisition, ownership, and disposition of Common Shares. This summary is not binding on the IRS, and the IRS is not precluded from taking a position that is different from, and contrary to, the positions taken in this summary. In addition, because the authorities on which this summary is based are subject to various interpretations, the IRS and the U.S. courts could disagree with one or more of the positions taken in this summary.
Scope of this Summary
Authorities
This summary is based on the Internal Revenue Code of 1986, as amended (the “Code”), Treasury Regulations (whether final, temporary, or proposed), published rulings of the IRS, published administrative positions of the IRS, the Convention Between Canada and the United States of America with Respect to Taxes on Income and on Capital, signed September 26, 1980, as amended (the “Canada-U.S. Tax Convention”), and U.S. court decisions that are applicable and, in each case, as in effect and available, as of the date of this document. Any of the authorities on which this summary is based could be changed in a material and adverse manner at any time, and any such change could be applied on a retroactive or prospective basis which could affect the U.S. federal income tax considerations described in this summary. This summary does not discuss the potential effects, whether adverse or beneficial, of any proposed legislation that, if enacted, could be applied on a retroactive or prospective basis.
U.S. Holders
For purposes of this summary, the term "U.S. Holder" means a beneficial owner of Common Shares that is for U.S. federal income tax purposes:
|
|
·
|
an individual who is a citizen or resident of the U.S.;
|
|
|
·
|
a corporation (or other entity taxable as a corporation for U.S. federal income tax purposes) organized under the laws of the U.S., any state thereof or the District of Columbia;
|
|
|
·
|
an estate whose income is subject to U.S. federal income taxation regardless of its source; or
|
|
|
·
|
a trust that (1) is subject to the primary supervision of a court within the U.S. and the control of one or more U.S. persons for all substantial decisions or (2) has a valid election in effect under applicable Treasury regulations to be treated as a U.S. person.
|
Non-U.S. Holders
For purposes of this summary, a “non-U.S. Holder” is a beneficial owner of Common Shares that is not a U.S. Holder. This summary does not address the U.S. federal income tax consequences to non-U.S. Holders arising from and relating to the acquisition, ownership, and disposition of Common Shares. Accordingly, a non-U.S. Holder should consult its own tax advisor regarding the U.S. federal, U.S. federal alternative minimum, U.S. federal estate and gift, U.S. state and local tax, and foreign tax consequences (including the potential application of and operation of any income tax treaties) relating to the acquisition, ownership, and disposition of Common Shares.
U.S. Holders Subject to Special U.S. Federal Income Tax Rules Not Addressed
This summary does not address the U.S. federal income tax considerations applicable to U.S. Holders that are subject to special provisions under the Code, including the following U.S. Holders:
(a) U.S. Holders that are tax-exempt organizations, qualified retirement plans, individual retirement accounts, or other tax-deferred accounts; (b) U.S. Holders that are financial institutions, underwriters, insurance companies, real estate investment trusts, or regulated investment companies; (c) U.S. Holders that are dealers in securities or currencies or U.S. Holders that are traders in securities that elect to apply a mark-to-market accounting method; (d) U.S. Holders that have a “functional currency” other than the U.S. dollar; (e) U.S. Holders that own Common Shares as part of a straddle, hedging transaction, conversion transaction, constructive sale, or other arrangement involving more than one position; (f) U.S. Holders that acquired Common Shares in connection with the exercise of employee stock options or otherwise as compensation for services; (g) U.S. Holders that hold Common Shares other than as a capital asset within the meaning of Section 1221 of the Code (generally, property held for investment purposes); (h) partnerships and other pass-through entities (and investors in such partnerships and entities); or (j) U.S. Holders that own or have owned (directly, indirectly, or by attribution) 10% or more of the total combined voting power of the outstanding shares of the Corporation. This summary also does not address the U.S. federal income tax considerations applicable to U.S. Holders who are (a) U.S. expatriates or former long-term residents of the U.S. subject to Section 877 of the Code, (b) persons that have been, are, or will be a resident or deemed to be a resident in Canada for purposes of the Canadian Tax Act; (c) persons that use or hold, will use or hold, or that are or will be deemed to use or hold Common Shares in connection with carrying on a business in Canada; (d) persons whose Common Shares constitute “taxable Canadian property” under the Canadian Tax Act; or (e) persons that have a permanent establishment in Canada for the purposes of the Canada-U.S. Tax Convention. U.S. Holders that are subject to special provisions under the Code, including U.S. Holders described immediately above, should consult their own tax advisor regarding the U.S. federal, U.S. federal alternative minimum, U.S. federal estate and gift, U.S. state and local tax, and foreign tax consequences relating to the acquisition, ownership and disposition of Common Shares.
If an entity that is classified as a partnership for U.S. federal income tax purposes holds Common Shares, the U.S. federal income tax consequences to such partnership and the partners of such partnership generally will depend on the activities of the partnership and the status of such partners. Partners of entities that are classified as partnerships for U.S. federal income tax purposes should consult their own tax advisor regarding the U.S. federal income tax consequences arising from and relating to the acquisition, ownership, and disposition of Common Shares.
Tax Consequences Not Addressed
This summary does not address the U.S. state and local, U.S. federal estate and gift, U.S. federal alternative minimum tax or foreign tax consequences to U.S. Holders of the acquisition, ownership, and disposition of Common Shares. Each U.S. Holder should consult its own tax advisor regarding the U.S. state and local, U.S. federal estate and gift, U.S. federal alternative minimum tax and foreign tax consequences of the acquisition, ownership, and disposition of Common Shares.
Passive Foreign Investment Company Rules
If the Corporation is considered a “passive foreign investment company” under the meaning of Section 1297 of the Code (a “PFIC”) at any time during a U.S. Holder’s holding period, the following sections will generally describe the U.S. federal income tax consequences to the U.S. Holder of the acquisition, ownership, and disposition of Common Shares.
PFIC Status of the Corporation
The Corporation generally will be a PFIC if, for a tax year, (a) 75% or more of the gross income of the Corporation for such tax year is passive income (the “income test”) or (b) 50% or more of the value of the Corporation’s assets either produce passive income or are held for the production of passive income, based on the quarterly average of the fair market value of such assets (the “assets test”). “Gross income” generally means all sales revenues less the cost of goods sold, and “passive income” generally includes, for example, dividends, interest, certain rents and royalties, certain gains from the sale of stock and securities, and certain gains from commodities transactions.
Active business gains arising from the sale of commodities generally are excluded from passive income if substantially all of a foreign corporation’s commodities are (a) stock in trade of such foreign corporation or other property of a kind which would properly be included in inventory of such foreign corporation, or property held by such foreign corporation primarily for sale to customers in the ordinary course of business, (b) property used in the trade or business of such foreign corporation that would be subject to the allowance for depreciation under Section 167 of the Code, or (c) supplies of a type regularly used or consumed by such foreign corporation in the ordinary course of its trade or business.
For purposes of the PFIC income test and asset test described above, if the Corporation owns, directly or indirectly, 25% or more of the total value of the outstanding shares of another corporation, the Corporation will be treated as if it (a) held a proportionate share of the assets of such other corporation and (b) received directly a proportionate share of the income of such other corporation. In addition, for purposes of the PFIC income test and asset test described above, “passive income” does not include any interest, dividends, rents, or royalties that are received or accrued by the Corporation from a “related person” (as defined in Section 954(d)(3) of the Code), to the extent such items are properly allocable to the income of such related person that is not passive income.
In addition, under certain attribution rules, if the Corporation is a PFIC, U.S. Holders will be deemed to own their proportionate share of any subsidiary of the Corporation which is also a PFIC (a ‘‘Subsidiary PFIC’’), and will be subject to U.S. federal income tax on their proportionate share of (i) a distribution on the shares of a Subsidiary PFIC and (ii) a disposition or deemed disposition of shares of a Subsidiary PFIC, both as if such U.S. Holders directly held the shares of such Subsidiary PFIC.
The Corporation believes it was classified as a PFIC during the taxable year ended December 31, 2010, and based on current business plans and financial projections, the Corporation believes there is a significant likelihood that it will be a PFIC during the current taxable year. The determination of whether a corporation was, or will be, a PFIC for a tax year depends, in part, on the application of complex U.S. federal income tax rules, which are subject to differing interpretations. In addition, whether a corporation will be a PFIC for any tax year depends on the assets and income of such corporation over the course of each such tax year and, as a result, cannot be predicted with certainty as of the date of this document. Accordingly, there can be no assurance that the IRS will not challenge any determination made by the Corporation (or a Subsidiary PFIC) concerning its PFIC status. Each U.S. Holder should consult its own tax advisor regarding the PFIC status of the Corporation and each Subsidiary PFIC.
Default PFIC Rules Under Section 1291 of the Code
If the Corporation is a PFIC, the U.S. federal income tax consequences to a U.S. Holder of the acquisition, ownership, and disposition of Common Shares will depend on whether such U.S. Holder makes an election to treat the Corporation and each Subsidiary PFIC, if any, as a “qualified electing fund” or “QEF” under Section 1295 of the Code (a “QEF Election”) or a mark-to-market election under Section 1296 of the Code (a “Mark-to-Market Election”). A U.S. Holder that does not make either a QEF Election or a Mark-to-Market Election will be referred to in this summary as a “Non-Electing U.S. Holder.”
A Non-Electing U.S. Holder will be subject to the rules of Section 1291 of the Code with respect to (a) any gain recognized on the sale or other taxable disposition of Common Shares and (b) any excess distribution received on the Common Shares. A distribution generally will be an “excess distribution” to the extent that such distribution (together with all other distributions received in the current tax year) exceeds 125% of the average distributions received during the three preceding tax years (or during a U.S. Holder’s holding period for the Common Shares, if shorter).
Under Section 1291 of the Code, any gain recognized on the sale or other taxable disposition of Common Shares, and any “excess distribution” received on Common Shares, must be ratably allocated to each day in a Non-Electing U.S. Holder’s holding period for the respective Common Shares. The amount of any such gain or excess distribution allocated to the tax year of disposition or distribution of the excess distribution and to years before the entity became a PFIC, if any, would be taxed as ordinary income. The amounts allocated to any other tax year would be subject to U.S. federal income tax at the highest tax rate applicable to ordinary income in each such year, and an interest charge would be imposed on the tax liability for each such year, calculated as if such tax liability had been due in each such year. A Non-Electing U.S. Holder that is not a corporation must treat any such interest paid as “personal interest,” which is not deductible.
If the Corporation is a PFIC for any tax year during which a Non-Electing U.S. Holder holds Common Shares, the Corporation will continue to be treated as a PFIC with respect to such Non-Electing U.S. Holder, regardless of whether the Corporation ceases to be a PFIC in one or more subsequent tax years. A Non-Electing U.S. Holder may terminate this deemed PFIC status by electing to recognize gain (which will be taxed under the rules of Section 1291 of the Code discussed above) as if such Common Shares were sold on the last day of the last tax year for which the Corporation was a PFIC.
QEF Election
A U.S. Holder that makes a timely and effective QEF Election for the first tax year in which its holding period of its Common Shares begins, generally, will not be subject to the rules of Section 1291 of the Code discussed above with respect to its Common Shares. However, a U.S. Holder that makes a QEF Election will be subject to U.S. federal income tax on such U.S. Holder’s pro rata share of (a) the net capital gain of the Corporation, which will be taxed as long-term capital gain to such U.S. Holder, and (b) and the ordinary earnings of the Corporation, which will be taxed as ordinary income to such U.S. Holder. Generally, “net capital gain” is the excess of (a) net long-term capital gain over (b) net short-term capital loss, and “ordinary earnings” are the excess of (a) “earnings and profits” over (b) net capital gain. A U.S. Holder that makes a QEF Election will be subject to U.S. federal income tax on such amounts for each tax year in which the Corporation is a PFIC, regardless of whether such amounts are actually distributed to such U.S. Holder by the Corporation. However, for any tax year in which the Corporation is a PFIC and has no net income or gain, U.S. Holders that have made a QEF Election would not have any income inclusions as a result of the QEF Election. If a U.S. Holder that made a QEF Election has an income inclusion, such a U.S. Holder may, subject to certain limitations, elect to defer payment of current U.S. federal income tax on such amounts, subject to an interest charge. If such U.S. Holder is not a corporation, any such interest paid will be treated as “personal interest,” which is not deductible.
A U.S. Holder that makes a QEF Election generally (a) may receive a tax-free distribution from the Corporation to the extent that such distribution represents “earnings and profits” of the Corporation that were previously included in income by the U.S. Holder because of such QEF Election and (b) will adjust such U.S. Holder’s tax basis in the Common Shares to reflect the amount included in income or allowed as a tax-free distribution because of such QEF Election. In addition, a U.S. Holder that makes a QEF Election generally will recognize capital gain or loss on the sale or other taxable disposition of Common Shares.
The procedure for making a QEF Election, and the U.S. federal income tax consequences of making a QEF Election, will depend on whether such QEF Election is timely. A QEF Election will be treated as “timely” if such QEF Election is made for the first year in the U.S. Holder’s holding period for the Common Shares in which the Corporation was a PFIC. A U.S. Holder may make a timely QEF Election by filing the appropriate QEF Election documents at the time such U.S. Holder files a U.S. federal income tax return for such year.
A QEF Election will apply to the tax year for which such QEF Election is made and to all subsequent tax years, unless such QEF Election is invalidated or terminated or the IRS consents to revocation of such QEF Election. If a U.S. Holder makes a QEF Election and, in a subsequent tax year, the Corporation ceases to be a PFIC, the QEF Election will remain in effect (although it will not be applicable) during those tax years in which the Corporation is not a PFIC. Accordingly, if the Corporation becomes a PFIC in another subsequent tax year, the QEF Election will be effective and the U.S. Holder will be subject to the QEF rules described above during any subsequent tax year in which the Corporation qualifies as a PFIC.
U.S. Holders should be aware that there can be no assurances that we will satisfy record keeping requirements that apply to a QEF, or that we will supply U.S. Holders with information that such U.S. Holders require to report under the QEF rules, in event that we are a PFIC and a U.S. Holder wishes to make a QEF Election. Thus, U.S. Holders may not be able to make a QEF Election with respect to their Common Shares. Each U.S. Holder should consult its own tax advisor, regarding the availability of, and procedure for making, a QEF Election. .
Mark-to-Market Election
A U.S. Holder may make a Mark-to-Market Election only if the Common Shares are marketable stock. The Common Shares generally will be “marketable stock” if the Common Shares are regularly traded on (a) a national securities exchange that is registered with the Securities and Exchange Commission, (b) the national market system established pursuant to section 11A of the Securities and Exchange Act of 1934, or (c) a foreign securities exchange that is regulated or supervised by a governmental authority of the country in which the market is located, provided that (i) such foreign exchange has trading volume, listing, financial disclosure, and meets other requirements and the laws of the country in which such foreign exchange is located, together with the rules of such foreign exchange, ensure that such requirements are actually enforced and (ii) the rules of such foreign exchange ensure active trading of listed stocks. If such stock is traded on such a qualified exchange or other market, such stock generally will be “regularly traded” for any calendar year during which such stock is traded, other than in de minimis quantities, on at least 15 days during each calendar quarter.
A U.S. Holder that makes a Mark-to-Market Election with respect to its Common Shares generally will not be subject to the rules of Section 1291 of the Code discussed above with respect to such Common Shares. However, if a U.S. Holder does not make a Mark-to-Market Election beginning in the first tax year of such U.S. Holder’s holding period for the Common Shares or such U.S. Holder has not made a timely QEF Election, the rules of Section 1291 of the Code discussed above will apply to certain dispositions of, and distributions on, the Common Shares.
A U.S. Holder that makes a Mark-to-Market Election will include in ordinary income, for each tax year in which the Corporation is a PFIC, an amount equal to the excess, if any, of (a) the fair market value of the Common Shares, as of the close of such tax year over (b) such U.S. Holder’s tax basis in such Common Shares. A U.S. Holder that makes a Mark-to-Market Election will be allowed a deduction in an amount equal to the excess, if any, of (i) such U.S. Holder’s adjusted tax basis in the Common Shares, over (ii) the fair market value of such Common Shares (but only to the extent of the net amount of previously included income as a result of the Mark-to-Market Election for prior tax years).
A U.S. Holder that makes a Mark-to-Market Election generally also will adjust such U.S. Holder’s tax basis in the Common Shares to reflect the amount included in gross income or allowed as a deduction because of such Mark-to-Market Election. In addition, upon a sale or other taxable disposition of Common Shares, a U.S. Holder that makes a Mark-to-Market Election will recognize ordinary income or ordinary loss (not to exceed the excess, if any, of (a) the amount included in ordinary income because of such Mark-to-Market Election for prior tax years over (b) the amount allowed as a deduction because of such Mark-to-Market Election for prior tax years).
A Mark-to-Market Election applies to the tax year in which such Mark-to-Market Election is made and to each subsequent tax year, unless the Common Shares cease to be “marketable stock” or the IRS consents to revocation of such election. Each U.S. Holder should consult its own tax advisor regarding the availability of, and procedure for making, a Mark-to-Market Election.
Although a U.S. Holder may be eligible to make a Mark-to-Market Election with respect to the Common Shares, no such election may be made with respect to the stock of any Subsidiary PFIC that a U.S. Holder is treated as owning, because such stock is not marketable. Hence, the Mark-to-Market Election will not be effective to eliminate the interest charge described above with respect to deemed dispositions of Subsidiary PFIC stock or distributions from a Subsidiary PFIC.
Other PFIC Rules
Under Section 1291(f) of the Code, the IRS has issued proposed Treasury Regulations that, subject to certain exceptions, would cause a U.S. Holder that had not made a timely QEF Election to recognize gain (but not loss) upon certain transfers of Common Shares that would otherwise be tax-deferred (e.g., gifts and exchanges pursuant to corporate reorganizations). However, the specific U.S. federal income tax consequences to a U.S. Holder may vary based on the manner in which Common Shares are transferred.
Certain additional adverse rules will apply with respect to a U.S. Holder if the Corporation is a PFIC, regardless of whether such U.S. Holder makes a QEF Election. For example under Section 1298(b)(6) of the Code, a U.S. Holder that uses Common Shares as security for a loan will, except as may be provided in Treasury Regulations, be treated as having made a taxable disposition of such Common Shares.
Special rules also apply to the amount of foreign tax credit that a U.S. Holder may claim on a distribution from a PFIC.
Subject to such special rules, foreign taxes paid with respect to any distribution in respect of stock in a PFIC are generally eligible for the foreign tax credit. The rules relating to distributions by a PFIC and their eligibility for the foreign tax credit are complicated, and a U.S. Holder should consult with their own tax advisor regarding the availability of the foreign tax credit with respect to distributions by a PFIC.
In addition, a U.S. Holder who acquires Common Shares from a decedent will not receive a “step up” in tax basis of such Common Shares to fair market value.
The PFIC rules are complex, and each U.S. Holder should consult its own tax advisor regarding the PFIC rules and how the PFIC rules may affect the U.S. federal income tax consequences of the acquisition, ownership, and disposition of Common Shares.
U.S. Federal Income Tax Consequences of the Acquisition, Ownership, and Disposition of Common Shares
The following discussion is subject to the rules described above under the heading “Passive Foreign Investment Company Rules.” .
General Taxation of Distributions
Subject to the PFIC rules discussed above, a U.S. Holder that receives a distribution, including a constructive distribution, with respect to a Common Share will be required to include the amount of such distribution in gross income as a dividend (without reduction for any Canadian income tax withheld from such distribution) to the extent of the current or accumulated “earnings and profits” of the Corporation, as computed for U.S. federal income tax purposes. A dividend generally will be taxed to a U.S. Holder at ordinary income tax rates. To the extent that a distribution exceeds the current and accumulated “earnings and profits” of the Corporation, such distribution will be treated first as a tax-free return of capital to the extent of a U.S. Holder's tax basis in the Common Shares and thereafter as gain from the sale or exchange of such Common Shares. (See “ Sale or Other Taxable Disposition of Common Shares” below). However, the Corporation may not maintain the calculations of earnings and profits in accordance with U.S. federal income tax principles, and each U.S. Holder should therefore assume that any distribution by the Corporation with respect to the Common Shares will constitute ordinary dividend income. Dividends received on Common Shares generally will not be eligible for the “dividends received deduction”. In addition, the Corporation does not anticipate that its distributions will be eligible for the preferential tax rates applicable to long-term capital gains. The dividend rules are complex, and each U.S. Holder should consult its own tax advisor regarding the application of such rules.
Sale or Other Taxable Disposition of Common Shares
Subject to the PFIC rules discussed above, upon the sale or other taxable disposition of Common Shares, a U.S. Holder generally will recognize capital gain or loss in an amount equal to the difference between the amount of cash plus the fair market value of any property received and such U.S. Holder's tax basis in such Common Shares sold or otherwise disposed of. Subject to the PFIC rules discussed above, gain or loss recognized on such sale or other disposition generally will be long-term capital gain or loss if, at the time of the sale or other disposition, the Common Shares have been held for more than one year.
Preferential tax rates apply to long-term capital gain of a U.S. Holder that is an individual, estate, or trust. There are currently no preferential tax rates for long-term capital gain of a U.S. Holder that is a corporation. Deductions for capital losses are subject to significant limitations under the Code.
Receipt of Foreign Currency
The amount of any distribution paid to a U.S. Holder in foreign currency, or on the sale, exchange or other taxable disposition of Common Shares, generally will be equal to the U.S. dollar value of such foreign currency based on the exchange rate applicable on the date of receipt (regardless of whether such foreign currency is converted into U.S. dollars at that time). If the foreign currency received is not converted into U.S. dollars on the date of receipt, a U.S. Holder will have a basis in the foreign currency equal to its U.S. dollar value on the date of receipt. Any U.S. Holder who receives payment in foreign currency and engages in a subsequent conversion or other disposition of the foreign currency may have a foreign currency exchange gain or loss that would be treated as ordinary income or loss, and generally will be U.S. source income or loss for foreign tax credit purposes. Each U.S. Holder should consult its own U.S. tax advisor regarding the U.S. federal income tax consequences of receiving, owning, and disposing of foreign currency.
Foreign Tax Credit
Subject to the PFIC rules discussed above, a U.S. Holder that pays (whether directly or through withholding) Canadian income tax with respect to dividends paid on the Common Shares generally will be entitled, at the election of such U.S. Holder, to receive either a deduction or a credit for such Canadian income tax paid. Generally, a credit will reduce a U.S. Holder’s U.S. federal income tax liability on a dollar-for-dollar basis, whereas a deduction will reduce a U.S. Holder’s income subject to U.S. federal income tax. This election is made on a year-by-year basis and applies to all foreign taxes paid (whether directly or through withholding) by a U.S. Holder during a year.
Complex limitations apply to the foreign tax credit, including the general limitation that the credit cannot exceed the proportionate share of a U.S. Holder’s U.S. federal income tax liability that such U.S. Holder’s “foreign source” taxable income bears to such U.S. Holder’s worldwide taxable income. In applying this limitation, a U.S. Holder’s various items of income and deduction must be classified, under complex rules, as either “foreign source” or “U.S. source.”
- 98 -
Generally, dividends paid by a foreign corporation should be treated as foreign source for this purpose, and gains recognized on the sale of stock of a foreign corporation by a U.S. Holder should be treated as U.S. source for this purpose, except as otherwise provided in an applicable income tax treaty, and if an election is properly made under the Code. However, the amount of a distribution
with respect to the common shares that is treated as a “dividend” may be lower for U.S. federal income tax purposes than it is for Canadian federal income tax purposes, resulting in a reduced foreign tax credit allowance to a U.S. Holder. In addition, this limitation is calculated separately with respect to specific categories of income. The foreign tax credit rules are complex, and each U.S. Holder should consult its own tax advisor regarding the foreign tax credit rules.
Backup Withholding and Information Reporting
Under U.S. federal income tax law and Treasury regulations, certain categories of U.S. Holders must file information returns with respect to their investment in, or involvement in, a foreign corporation. For example, recently enacted legislation generally imposes new U.S. return disclosure obligations (and related penalties) on individuals who are U.S. Holders that hold certain specified foreign financial assets in excess of $50,000. The definition of specified foreign financial assets includes not only financial accounts maintained in foreign financial institutions, but also, unless held in accounts maintained by a financial institution, any stock or security issued by a non-U.S. person, any financial instrument or contract held for investment that has an issuer or counterparty other than a U.S. person and any interest in a foreign entity. U.S. Holders may be subject to these reporting requirements unless their common shares and warrants are held in an account at a domestic financial institution. Penalties for failure to file certain of these information returns are substantial. U.S. Holders should consult with their own tax advisors regarding the requirements of filing information returns, and, if applicable Mark-to-Market and QEF Elections.
Payments made within the U.S. or by a U.S. payor or U.S. middleman, of dividends on, and proceeds arising from the sale or other taxable disposition of, Common Shares generally may be subject to information reporting and backup withholding tax, at the rate of 28% (and increasing to 31% for payments made after December 31, 2012), if a U.S. Holder (a) fails to furnish such U.S. Holder’s correct U.S. taxpayer identification number (generally on Form W-9), (b) furnishes an incorrect U.S. taxpayer identification number, (c) is notified by the IRS that such U.S. Holder has previously failed to properly report items subject to backup withholding tax, or (d) fails to certify, under penalty of perjury, that such U.S. Holder has furnished its correct U.S. taxpayer identification number and that the IRS has not notified such U.S. Holder that it is subject to backup withholding tax. However, certain exempt persons, such as corporations, generally are excluded from these information reporting and backup withholding rules. Any amounts withheld under the U.S. backup withholding tax rules will be allowed as a credit against a U.S. Holder’s U.S. federal income tax liability, if any, or will be refunded, if such U.S. Holder furnishes required information to the IRS in a timely manner. Each U.S. Holder should consult its own tax advisor regarding the information reporting and backup withholding rules.
Unregistered Sales of Equity Securities
None.
Repurchase of Securities
During 2010, neither Vista Gold nor any affiliate of Vista Gold repurchased Common Shares of Vista Gold registered under Section 12 of the Exchange Act.
The selected financial data in the table below have been selected in part, from our consolidated financial statements, which have been prepared in accordance with accounting principles generally accepted in Canada. The selected financial data should be read in conjunction with those financial statements and the notes thereto.
|
Years ended December 31
|
||||||||||||||||||||
|
2010
|
2009
|
2008
|
2007
|
2006
|
||||||||||||||||
|
(U.S. $000’s, except loss per share)
|
||||||||||||||||||||
|
Results of operations
|
||||||||||||||||||||
|
Net loss
|
9,614 | 1,942 | 9,973 | 13,150 | 4,171 | |||||||||||||||
|
Basic and diluted loss per share
|
0.20 | 0.05 | 0.29 | 0.41 | 0.16 | |||||||||||||||
|
Financial position
|
||||||||||||||||||||
|
Working capital
|
$ | 18,490 | $ | 29,391 | $ | 21,209 | $ | 27,254 | $ | 49,693 | ||||||||||
|
Total assets
|
120,442 | 92,573 | 75,765 | 51,346 | 92,731 | |||||||||||||||
|
Long-term debt and non-current liabilities
|
— | 25,167 | 23,724 | — | 4,877 | |||||||||||||||
|
Shareholders’ equity
|
96,307 | 66,480 | 51,238 | 50,652 | 87,127 | |||||||||||||||
Had our consolidated financial statements been prepared in accordance with accounting principles generally accepted in the United States, certain selected financial data would have been reported as follows (see also Note 20 of the Consolidated Financial Statements).
|
Years ended December 31
|
||||||||||||||||||||
|
2010
|
2009
|
2008
|
2007
|
2006
|
||||||||||||||||
|
(U.S. $000’s, except loss per share)
|
||||||||||||||||||||
|
Results of operations
|
||||||||||||||||||||
|
Net loss
|
20,020 | 5,952 | 15,320 | 15,067 | 6,810 | |||||||||||||||
|
Basic and diluted loss per share
|
0.42 | 0.17 | 0.45 | 0.47 | 0.26 | |||||||||||||||
|
Financial position
|
||||||||||||||||||||
|
Working capital
|
$ | 18,098 | $ | 29,391 | $ | 21,209 | $ | 27,254 | $ | 50,234 | ||||||||||
|
Total assets
|
80,766 | 66,453 | 55,332 | 37,883 | 79,367 | |||||||||||||||
|
Long-term debt and non-current liabilities
|
— | 28,895 | 28,719 | — | 4,877 | |||||||||||||||
|
Shareholders’ equity
|
56,136 | 36,632 | 25,810 | 37,189 | 73,763 | |||||||||||||||
The following discussion and analysis should be read in conjunction with our consolidated financial statements for the three years ended December 31, 2010, and the related notes thereto, which have been prepared in accordance with generally accepted accounting principles (“GAAP”) in Canada. Reference to Note 20 to the consolidated financial statements should be made for a discussion of differences between Canadian and United States GAAP and their effect on the financial statements. This discussion and analysis contains forward-looking statements that involve risks, uncertainties and assumptions. Our actual results may differ materially from those anticipated in these forward-looking statements as a result of many factors, including, but not limited to, those set forth under the section heading “Item 1A. Risk Factors” above and elsewhere in this annual report. See section heading “Note Regarding Forward-Looking Statements.” above.
All amounts stated herein are in U.S. dollars in thousands, except per share amounts, per warrant amounts, per ounce amounts, gold price per ounce amounts, exchange rates, number of Common Shares, number of warrants, number of stock options and the amounts listed in the tables and text within the "Project Updates" section below, unless specified otherwise.
Overview
We are engaged in the evaluation, acquisition, exploration and advancement of gold exploration and potential development projects with the aim of adding value to the projects. Our approach to acquisitions of gold projects has generally been to seek projects within political jurisdictions with well-established mining, land ownership and tax laws, which have adequate drilling and geological data to support the completion of a third-party review of the geological data and to complete an estimate of the mineralized material (mineral resources under Canadian guidelines) and mineral reserves. In addition, we look for opportunities to improve the value of our gold projects through exploration drilling and re-engineering the operating assumptions underlying previous engineering work. In 2007, the board of directors and management reevaluated the corporate strategy regarding the development of the Corporation’s more advanced projects. As a result of this reevaluation, the Corporation has begun moving its more advanced projects toward production by undertaking advanced engineering studies, including feasibility studies as appropriate.
Our holdings include the Concordia and Guadalupe de los Reyes gold projects in Mexico; the Mt. Todd gold project in Australia; the Yellow Pine gold project in Idaho; the Long Valley gold project in California; the Awak Mas gold project in Indonesia; and claims located in Utah.
Outlook
At the end of 2010, we owned or controlled six properties containing mineralized material. In the early part of 2007, we decided with the higher gold prices, to bring the more advanced projects, such as Concordia and Mt. Todd gold projects, to production decisions. The emphasis in late 2007 was to start a bankable feasibility study on Concordia with a major mining consultant being contracted to manage this study, which was completed in September 2008. In addition, we believe that additional value can be added to the remaining projects through exploration drilling and engineering studies, thus advancing them closer to a production decision.
We do not currently generate operating cash flows. Subject to sustained gold prices and the risk factors disclosed under the section heading “Item 1A. Risk Factors” above, we hope to generate revenues and cash flows in the future. We may generate revenues and cash flows from our portfolio of gold projects by several means, including but not limited to options or leases to third parties, joint venture arrangements with other gold producers, outright sales for cash and/or royalties, or project development and operation.
With respect to our current property holdings, aggregate expenditures for purchase installments, to maintain options, conduct exploration activities and feasibility studies are currently anticipated to be approximately $20,360 in 2011 and $4,000 in 2012. As at December 31, 2010, we had working capital of $18,490 and cash on hand of $39,838. At present, we believe that the current cash balances as of December 31, 2010 of $39,838 and marketable securities of $1,703 will cover these activities as well as general and administrative expenses and our repayment of $23,504 principal amount, including interest, of our senior secured convertible notes (the “Notes”) due on March 4, 2011. Additional capital will be necessary to advance the projects to positive production decisions; and to conduct additional exploration drilling and engineering studies on our properties. Additional capital may be raised via revenues, if earned, or equity and/or debt financings. However, there can be no assurance that we will be successful in efforts to raise additional capital.
Summary
Our 2010 consolidated net loss was $9,614 or $0.20 per share compared to our 2009 consolidated net loss of $1,942 or $0.05 per share for a net increase of $7,672. The increase of $7,672 in 2010 was largely due to a decrease in the gain on disposal of marketable securities of $6,548. The gain during 2009 was mostly the result of the sale of our Allied Nevada Gold Corp. (“Allied”) shares which we retained in connection with the transaction that resulted in the formation of Allied and the transfer of Vista’s Nevada properties to Allied. Also contributing to the increase in net loss for 2010 was an increase in the loss on extinguishment of convertible debt of $2,518. On May 20, 2010, we entered into a Note repurchase agreement whereby we repurchased $5,667 of outstanding principal Notes in exchange for cash and Common Shares and on July 14, 2009, we entered into a Note repurchase agreement whereby we repurchased $1,333 of outstanding principal Notes in exchange for cash of $877 (see Consolidated Financial Statements – Note 7). Offsetting these increases was a decrease in interest expense of $632 and an increase in the future tax benefit of $743.
Our 2009 consolidated net loss was $1,942 or $0.05 per share compared to our 2008 consolidated net loss of $9,973 or $0.29 per share for a net decrease of $8,031. The decrease of $8,031 in 2009 was largely due to an increase in the gain on disposal of marketable securities of $6,927 in 2009. The gain was mostly the result of the sale of our Allied shares which we retained in connection with the transaction that resulted in the formation of Allied and the transfer of Vista’s Nevada properties to Allied. Also contributing to the decrease in net loss for 2009 was a gain of $537 on the repurchase of Notes. On July 14, 2009, we repurchased $1.333 million of the Notes for $866, which resulted in a gain. Other contributing factors include a decrease in interest income of $405, a decrease in corporate administration and investor relations of $881 and a decrease in the write-down of marketable securities of $460, which was offset by an increase in the gain on currency translation of $469, an increase in exploration, property evaluation and holding costs of $444 and an increase in interest expense of $316
Exploration, property evaluation and holding costs
Exploration, property evaluation and holding costs increased to $2,098 during the year ended December 31, 2010 compared with $1,487 for the same period in 2009. The increase of $611 was primarily due to an increase in holding costs at the Concordia gold project of $700 which reflects increasing administrative and legal costs for activities related to permitting and community relations, which was offset by a decrease in holding costs at the PT Masmindo gold project of $61.
Exploration, property evaluation and holding costs increased to $1,487 during the year ended December 31, 2009 compared with $1,043 for the same period in 2008. The increase of $444 was primarily due to an increase in holding costs at the Concordia gold project of $491 which reflects increasing administrative and legal costs for activities related to permitting and community relations, which was offset by a decrease in holding costs at the Mt. Todd gold project of $49.
Corporate administration and investor relations
Corporate administration and investor relations costs decreased to $4,283 during the year ended December 31, 2010, compared with $4,595 in 2009. This decrease of $312 from the prior period was primarily due to a decrease in stock-based compensation expense of $389. The decrease in stock-based compensation expense was primarily the result of our issuance of 165,000 stock options and 175,500 restricted stock units during the 2010 period as compared to the issuance of 860,000 stock options during the 2009 period. Restricted stock units vest over a period of one year and the intrinsic value is expensed equally over the vesting period as compared to stock options that had a vesting period of 2 years, of which 50% vest immediately and accordingly 50% of the value is expensed immediately upon issuance and the remaining 50% expensed over the vesting period. The result is a much greater expense up front upon issuance of stock options.
Corporate administration and investor relations costs decreased to $4,595 during the year ended December 31, 2009, compared with $5,476 in 2008. This decrease of $881 from the prior period was primarily due to a decrease in our audit, tax and Sarbanes-Oxley compliance fees of $168 as we work with our auditors and outside consultants to reduce these fees. Also contributing to the decrease is a decrease in non-cash stock based compensation expense of $787, which is due to the following:
|
|
·
|
a decrease in the fair value of options granted and immediately vesting of $201. This was due to an increase in the amount of stock-based compensation expense being allocated to capitalized mineral property as well as declining stock prices, volatility rates and risk-free interest rates used to calculate fair-value;
|
|
|
·
|
a decrease in expense recorded for those options granted in prior years and vesting over time of $667. This was also due to an increase in the allocation of stock-based compensation expense being allocated to capitalized mineral property as well as a decrease in the number of options granted in a prior period subject to vesting over time; and
|
|
|
·
|
these amounts were offset by a decrease of $81 for awards forfeited prior to vesting. Option expense recorded during the vesting period is reversed if the options are forfeited.
|
Depreciation and amortization
Depreciation and amortization expense increased to $288 during the year ended December 31, 2010, compared with $262 in 2009. The slight increase of $26 from the prior period was mostly due to capital expenditures at the Mt. Todd gold mine during 2010.
Depreciation and amortization expense increased to $262 during the year ended December 31, 2009, compared with $170 in 2008. The increase of $92 from the prior period was mostly due to capital expenditures at the Mt. Todd gold mine and at the corporate level during 2009.
Interest expense
Interest expense was $1,688 during the year ended December 31, 2010, compared with $2,320 in 2009. The decrease of $632 from the prior period was mostly due to the repurchase of $5,667 of the Notes in May 2010 as compared to the repurchase of $1,333 of the Notes in July 2009. For the year ended December 31, 2010, $811 was attributable to the accretion of the debt discount and $877 was attributable to interest expense. These amounts are approximately 24% of the full interest expense associated with the issuance of the Notes. We capitalized the remaining 76% as additions to mineral properties in accordance with ASC 835-20 “Capitalization of Interest” and our accounting policy.
Interest expense was $2,320 during the year ended December 31, 2009, compared with $2,004 in 2008. The increase of $316 was because the Notes were issued on March 4, 2008 and accordingly a full year of interest expense was not charged for the 2008 period. For the year ended December 31, 2009, $1,069 was attributable to the accretion of the debt discount and $1,251 was attributable to interest expense. These amounts are approximately 43% of the full interest expense associated with the issuance of the Notes. We capitalized the remaining 57% as additions to mineral properties in accordance with ASC 835-20 Capitalization of Interest and our accounting policy.
Other Income and Expenses
Gain/(loss) on disposal of marketable securities
For the year ended December 31, 2010, we realized a gain of $281 on the disposal of marketable securities, compared with $6,829 for the same period in 2009. The gain of $6,829 in 2009 was mostly the result of our sale on April 3, 2009, of all 1,529,848 common shares of Allied for $9,016. These shares had a book value of $2,194. The gain for the 2010 period resulted from the sale of securities that had a book value of $32.
For the year ended December 31, 2009, we realized a gain of $6,829 on the disposal of marketable securities, compared with a loss on the disposal of marketable securities of $98 for the same period in 2008. The gain of $6,829 was mostly the result of the sale of the Allied shares as discussed above. These shares had a book value of $2,194.
At December 31, 2010, we held marketable securities available for sale with a quoted market value of $1,703. We purchased the securities for investing purposes with the intent to hold the securities until such time as it would be advantageous to sell the securities at a gain. Although there can be no reasonable assurance that a gain will be realized from the sale of the securities, we monitor the market status of the securities consistently in order to mitigate the risk of loss on the investment.
Gain/(loss) on extinguishment of convertible notes
On July 14, 2009, we entered into Note repurchase agreements (the “Whitebox Repurchase Agreements”) with Whitebox Combined Partners, LP (“Whitebox Combined Partners”), Whitebox Convertible Arbitrage Partners, LP (“Whitebox Convertible Arbitrage”) and Whitebox Special Opportunities Fund Series B Partners, LP (“Whitebox Special Opportunities”) whereby we agreed to repurchase their respective Notes.
Pursuant to the Whitebox Repurchase Agreements, we agreed to repurchase Notes: (i) in the principal amount of $504 from Whitebox Combined Partners for an aggregate purchase price, including interest, of $332; (ii) in the principal amount of $510 from Whitebox Convertible Arbitrage for an aggregate purchase price, including interest, of $336; and (iii) in the principal amount of $319 from Whitebox Special Opportunities for an aggregate purchase price, including interest, of $210, based on a settlement date of July 14, 2009. We allocated the consideration paid on the repurchase of the convertible notes to the liability and equity elements of the security based on their relative fair values at the date of the transaction. A gain of $537 was recorded in our Consolidated Statement of Loss as a result of the Notes repurchase.
On May 20, 2010, we entered into a Notes repurchase agreement (the “Agreement”) with Whitebox Advisors LLC (“Whitebox”) whereby we agreed to repurchase their remaining Notes.
Pursuant to the Agreement, we agreed to repurchase Notes in the principal amount of $5,667 and interest payable through maturity on the Notes of $691. We agreed to pay Whitebox $2,233 in cash and to issue 1,902,684 in Common Shares to Whitebox as consideration for the principal amount of the Notes and interest payable of $6,358, in aggregate. The Common Shares issued were based on a share price of $2.15. We allocated the consideration paid on the repurchase of the Notes to the liability and equity elements of the security based on their relative fair values at the date of the transaction as is required under EIC 96, “Accounting for the Early Extinguishment of Convertible Securities Through (1) Early Redemption or Repurchase and (2) Induced Early Conversion”. A loss of $1,981 was recorded in our Consolidated Statement of Loss as a result of the Notes repurchase.
The Agreement and the Whitebox Repurchase Agreements were initiated by Whitebox and were not the result of any solicitation by us or on our behalf. We have not initiated any broader effort to repurchase or restructure any of our remaining Notes and did not act upon the basis of material non-public information in determining to enter into the any of the agreements above.
Interest income
Interest income was $131 during the year ended December 31, 2010, compared with $104 in 2009. The slight increase of $27 for the 2010 period was mostly the result of increased cash sent to Australia to fund our Mt. Todd gold project programs and as a result we were able to take advantage of higher interest rates in the Australian market.
Interest income was $104 during the year ended December 31, 2009, compared with $509 in 2008. The decrease of $405 was due to falling interest rates in the market.
Future income tax benefit/(expense)
The future income tax benefit was $32 during the year ended December 31, 2010, compared with a future income tax expense of $711 for the same period in 2009. The increase of $743 in the future tax benefit for the 2010 was mostly the result of the sale by Vista of its 1,529,848 shares in Allied on April 3, 2009, as discussed below.
The future income tax expense was $711 for the year ended December 31, 2009, compared with $320 in 2008. The increase of $391 in expense was mostly the result of the sale of the Allied shares on April 3, 2009. In previous periods a future income tax benefit was recorded in respect of previously unrecognized tax loss carry forwards as these losses were expected to cover any taxable gains that would arise as a result of the increase in value of the marketable securities. When these securities were disposed of, the unrealized gains were transferred from other comprehensive income/(loss) to net earnings. Since no taxable gain arose on this disposal, an income tax expense was recorded in the current period to reverse
the benefit recorded in prior periods. The net impact is such that no tax is payable on this disposal and accordingly the cumulative tax expense recorded in the Consolidated Statement of Earnings and (Loss) reflects the tax benefit associated with Vista’s remaining marketable securities.
Write-down of marketable securities
There were no write-downs of marketable securities for the period ended December 31, 2010.
The write-down of marketable securities was $123 for the year ended December 31, 2009, compared with $583 in 2008. The decrease of $460 was mostly due to increasing stock prices throughout 2009. At December 31, 2010, December 31, 2009 and December 31, 2008, we evaluated the market value of our available-for-sale securities and found that certain securities had become impaired. These securities were written down to their fair market value as of December 31, 2009 and December 31, 2008, respectively.
Operating Activities
Net cash used in operating activities in 2010 was $8,671 compared with $7,883 in 2009. The increase of $788 in 2010 was mostly the result of an increase in the net loss of $7,672 for the 2010 period, which was offset by an increase in non-cash items of $6,844. Also contributing to the increase was an increase in cash used for other current assets of $615 and an increase in cash used for other long-term liabilities of $228. These amounts have been partially offset by a decrease in interest paid on our convertible notes of $644 and an increase in cash provided by accounts payable, accrued liabilities and other of $239.
Net cash used in operating activities in 2009 was $7,883, compared with $7,638 in 2008. The increase of $245 in 2009 was mostly the result of an increase in interest payments made on June 15, 2009, July 14, 2009 (in conjunction with the repurchase of the Notes) and December 15, 2009 of $602. This increase was due to additional interest paid on June 15, 2009 as compared to the prior year as a result of the Notes issuance on March 4, 2008 and accordingly less accrued interest on June 15, 2008 as compared to June 15, 2009. Offsetting this increase, was a decrease in cash used in accounts payable, accrued liabilities and other of $248 and a decrease in cash used for other current assets of $287.
Investing Activities
Net cash used in investing activities in 2010 was $11,008, compared with net cash provided by investing activities of $3,268 in 2009. The increase of $14,276 in cash used by investing activities in 2010 was mostly the result of the following:
|
|
●
|
a decrease in the proceeds from the sale of marketable securities of $8,742. On April 3, 2009, we sold all 1,529,848 common shares of Allied that we held for $9,016;
|
|
|
●
|
an increase in cash used for additions to mineral properties of $5,713. During the 2010 period we undertook a drilling program at the Mt. Todd gold mine. There were no similar programs during the 2009 period; and
|
|
|
●
|
a decrease in the proceeds received upon the disposal of mineral property. In June 2009, we sold most of the remaining patented mining claims in Colorado for $188. There were no similar transactions during the 2010 period.
|
Net cash received from investing activities in 2009 was $3,268, compared with cash used from investing activities of $26,913 in 2008. This increase of $30,181 in cash received from investing activities was due to the following:
|
|
·
|
a decrease in additions to plant and equipment of $17,495. In April 2008 the purchase of the gold processing equipment to be used at our Concordia gold project was finalized. There were no similar equipment purchases during the 2009 period;
|
|
|
·
|
an increase in proceeds received from the sale of marketable securities of $8,950. This increase was primarily due to the sale of all 1,529,848 common shares of Allied we held for proceeds of $9,016;
|
|
|
·
|
a decrease in additions to mineral properties of $3,293. During the 2008 period, we undertook a drilling
|
|
|
program at the Mt. Todd gold mine and were in the process of completing a feasibility study for the Concordia gold project. These programs were completed during 2008;
|
|
|
·
|
a decrease in the acquisition of mineral properties of $452. On January 24, 2008, we completed the acquisition of interests in various mineral properties adjacent to our Guadalupe de los Reyes project in Mexico. The consideration paid by Vista for the acquisition of these interests included cash payments totaling $452. There was no similar purchase during the year ended December 31, 2009;
|
|
|
·
|
an increase in the proceeds received upon the disposal of mineral property. In June 2009, we sold most of the remaining patented mining claims in Colorado for $188. There were no similar transactions during the 2008 period; and
|
|
|
·
|
an increase in cash used for short-term investments. At December 31, 2009, we had one $250 certificate of deposit that had a maturity date of more than 90 days.
|
Financing Activities
Net cash provided by financing activities was $31,109 for the year ended December 31, 2010, compared with $19,757 in 2009. The increase of $11,352 was primarily the result of the completion of the private placement of special warrants on October 22, 2010, in which we offered and sold 14,666,739 special warrants for net proceeds after legal and other fees of $33,299, as compared to the completion of a public offering on September 21, 2009 and the completion of the over-allotment on September 25, 2009 in which we offered and sold an aggregate 10.12 million Common Shares, for net proceeds after commissions, legal and other fees of $20,378. (See Consolidated Financial Statements—Notes 8 and 9 in the section heading “Item 8. Financial Statements and Supplementary Data” below.) Offsetting this amount was an increase of $1,376 in the cash consideration used to extinguish certain of our Notes. On May 20, 2010, we repurchased $5,667 of Notes for cash consideration of $2,242 and 1,581,488 Common Shares and in July 2009 we repurchased $1,333 of Notes for cash consideration of $866. See Consolidated Financial Statements – Note 7 in the section heading “Item 8. Financial Statements and Supplementary Data” below
Net cash provided by financing activities was $19,757 for the year ended December 31, 2009, compared with $31,425 in 2008. The decrease of $11,668 was primarily the result of the completion of a public offering on September 21, 2009 and the completion of the over-allotment on September 25, 2009 in which we offered and sold an aggregate 10.12 million Common Shares, for net proceeds after commissions, legal and other fees of $20,378, as compared to the completion of a brokered private placement on March 4, 2008 in which we offered and sold $30,000 in aggregate principal amount of Notes (see Consolidated Financial Statements – Note 7 in the section heading “Item 8. Financial Statements and Supplementary Data” below). Net proceeds to Vista upon completion of the sale of the Notes were $28,345.
There were no warrant exercises during the years ended December 31, 2010 and December 31, 2009, respectively. Warrants exercised during 2008 produced cash proceeds of $2,941. During 2008, the entire $2,941 in cash proceeds was from exercises of warrants issued as part of our February 2006 private placement. (See Consolidated Financial Statements—Notes 8 and 9 in the section heading “Item 8. Financial Statements and Supplementary Data” below).
The exercise of stock options produced cash of $52 during 2010, compared to $245 during 2009 and $139 during 2008. (See Consolidated Financial Statements—Note 10 in the section heading “Item 8. Financial Statements and Supplementary Data” below).
Liquidity and Capital Resources
At December 31, 2010, our total assets were $120,442, compared to $92,573 and $75,765 as of December 31, 2009 and 2008, respectively. There were no long-term liabilities at December 31, 2010. Long-term liabilities totaled $25,167 at December 31, 2009, compared to $23,724 at December 31, 2008. At December 31, 2010, we had working capital of $18,489, compared to $29,391 in 2009 and $21,209 in 2008.
Our working capital of $18,490 as of December 31, 2010, decreased from 2009 by $10,902 which was increased from 2008 by $8,182. The principal component of working capital for both 2010 and 2009 is cash and cash equivalents of $39,838 and $28,408, respectively. Other components include marketable securities (2010—$1,703; 2009—$1,150), short-term investments (2010—$–; 2009—$250) and other current assets (2010—$1,084; 2009—$509). The decrease of $10,902 in working capital from 2010 to 2009 related primarily to a reclassification of the Notes to a short-term debt obligation of
$22,505 as of December 31, 2010 as compared to a long-term debt obligation of $24,939 as of December 31, 2009. The Notes come due on March 4, 2011. Offsetting this reclassification was an increase in cash balances of $11,430 that related to our completion of a private placement offering which received shareholder approval on December 15, 2010.
As a result of the delay in the issuance of the Change of Forest Land Use Permit (“CUSF”) at the Concordia gold project and the current uncertainty in the resource and financial markets, management has adopted a revised plan and budget for the year 2011. The plan continues those programs necessary to expedite the development of the Concordia gold project, while minimizing expenditures in other areas. The budget estimates that in the event that financing for the Concordia gold project is not available on acceptable terms in 2011, we have sufficient working capital to fund our planned operations at least through the end of 2011, without additional financing. We will continue to examine potential funding alternatives for the project, which may include project financing, debt financing or equity financing.
On October 22, 2010, we announced that we had closed our private placement of special warrants. We issued an aggregate of 14,666,739 special warrants, for gross proceeds of $33,734. We plan to use the proceeds for the following purposes: (i) to repurchase the $23,000 principal amount of outstanding Notes due March 4, 2011; (ii) to advance the Mt. Todd gold project; and (iii) for general corporate purposes.
Upon receipt of our shareholders’ approval of the private placement (“Shareholders’ Approval”) on December 15, 2010, the special warrants were automatically exercised, for no additional consideration, for one Common Share of Vista and one Common Share purchase warrant (a “Warrant”.) Each Warrant is exercisable over a five-year period from the closing of the private placement, to purchase one Common Share (a “Warrant Share”) at a purchase price of $3.50 during the first year, $4.00 during the second year, $4.50 during the third year and $5.00 thereafter until the expiry of the Warrant. If the closing price of the Common Shares on the NYSE Amex is at least 35% above the current exercise price of the Warrants for a period of 15 consecutive trading days, then we will have the option to request that the Warrants be exercised. If the Warrants are not exercised within 25 business days following this request, they will be cancelled.
In addition, we issued a total of 641,305 special warrants and 630,436 compensation warrants (each compensation warrant being exercisable for two years from the closing of the private placement, to acquire one Common Share at a price of $2.30) to the agents and finders that provided services in connection with the financing. Vista recognized non-cash expense related to these special warrants and compensation warrants of $704 and $612, respectively, which was allocated pro rata between the Common Share and warrant components of the units. The special warrants and compensation warrants were subject to the Shareholders’ Approval. Cash proceeds to Vista from the private placement, net of cash expenses of $660, were $33,074.
We agreed to pay fees in respect of subscriptions from investors introduced to us by a finder in the United States and an agent and finder in Canada. The fees were payable in that number of special warrants equal to 5% of the number of special warrants purchased by investors introduced by that finder or agent. In addition, the finders and the agents were issued the number of compensation warrants equal to 5% of the special warrants sold to purchasers introduced by that finder or agent pursuant to the private placement, with each compensation warrant being exercisable for two years from the closing of the private placement, to acquire one Common Share at a price of $2.30 per Common Share.
We have agreed to use our commercially best efforts to have a registration statement, with respect to the resale of the Common Shares, Warrants and Warrant Shares issuable under the private placement, declared effective by the U.S. Securities and Exchange Commission within four months of the receipt of the Shareholders’ Approval.
Off-Balance Sheet Arrangements
We have no off-balance sheet arrangements required to be disclosed in this annual report on Form 10-K.
Contractual Obligations
|
Payments due by period (in thousands)
|
||||||||||||||||||||
|
Contractual Obligations
|
Total
|
Less than 1 year
|
1 to 3 years
|
3 to 5 years
|
More than 5 years
|
|||||||||||||||
|
Short-term debt obligations
(1)
|
$ | 23,498 | $ | 23,498 | $ | — | $ | — | $ | — | ||||||||||
|
Operating lease obligations
|
$ | 84 | $ | 84 | $ | — | $ | — | $ | — | ||||||||||
|
Purchase obligations
(2)
|
$ | 200 | $ | 100 | $ | 100 | $ | — | $ | — | ||||||||||
|
Total
|
$ | 23,782 | $ | 23,682 | $ | 100 | $ | — | $ | — | ||||||||||
|
|
(1)
|
Short-term debt obligations including interest payments related to our issuance of the Notes, are discussed in “Item 8. — Financial Statements and Supplementary Data — Consolidated Financial Statements — Note 7.”
|
|
|
(2)
|
Purchase obligations include option payments totaling $200 for the Yellow Pine gold project. We still have outstanding $100, of which is to be paid in less than a year and $100, of which is to be paid in 1 to 3 years.
|
As of December 31, 2010, Vista Gold has sufficient finances to meet its contractual obligations through December 31, 2011.
Summary of Quarterly Results and 4
th
Quarter Review
(U.S. dollars in thousands, except per share data)
|
2010
|
4th Quarter
|
3rd Quarter
|
2nd Quarter
|
1st Quarter
|
||||||||||||
|
Revenue
|
$ | — | $ | — | $ | — | $ | — | ||||||||
|
Net loss
|
$ | (2,419 | ) | $ | (1,344 | ) | $ | (4,152 | ) | $ | (1,699 | ) | ||||
|
Basic and diluted loss per share
|
(0.04 | ) | (0.03 | ) | (0.09 | ) | (0.04 | ) | ||||||||
|
2009
|
4th Quarter
|
3rd Quarter
|
2nd Quarter
|
1st Quarter
|
||||||||||||
|
Revenue
|
$ | — | $ | — | $ | — | $ | — | ||||||||
|
Net earnings/(loss)
|
$ | (2,235 | ) | $ | (1,717 | ) | $ | 3,890 | $ | (1,880 | ) | |||||
|
Basic and diluted earnings/(loss) per share
|
(0.06 | ) | (0.05 | ) | 0.11 | (0.05 | ) | |||||||||
Transactions with Related Parties
Agreement with Sierra Partners LLC
On April 1, 2009, we entered into an agreement with Sierra Partners LLC (“Sierra”) pursuant to which Sierra agreed to provide us with investor relations and corporate finance consulting services. W. Durand Eppler, the founder and partner of Sierra, is also one of our directors. Under the terms of the agreement, Sierra will provide us with consulting services commencing April 1, 2009 and ending on March 31, 2010, with the agreement continuing thereafter on a month-to-month basis. Sierra will assist us with our efforts to maintain an investor relations program and provide support and analysis of our general corporate finance and strategy efforts. As compensation for these services, we agreed to pay to Sierra a monthly retainer fee of $10 during the term of the agreement and issue to Sierra 60,000 of our stock options. As of December 31, 2010, we had made payments to Sierra under the agreement totaling $210; of which $120 had been paid during the period ended December 31, 2010, and had issued the 60,000 stock options to Sierra with a recorded expense of $54. On December 15, 2010, we issued an additional 30,000 of our stock options to Sierra, which had a recorded value of $21 as of December 31, 2010.
Director participation in private placement financing
The following directors of Vista participated in the special warrant private placement: (a) W. Durand Eppler, 70,000 special warrants, (b) Michael B. Richings – 25,000 special warrants, (c) Frederick H. Earnest – 20,000 special warrants and (d) John M. Clark – 10,869 special warrants. The Corporate Governance Committee approved the issuance of the foregoing special warrants to the directors.
Project updates
Amounts and numbers contained within the tables and the text in this “Project updates” section are not stated in thousands of U.S. dollars.
Concordia Gold Project (formerly, the Paredones Amarillos gold project)
Project Name Change
On September 7, 2010, we announced that we had changed the name of our wholly-owned Paredones Amarillos gold project to the Concordia gold project. We believe this will better reflect the integration of the project with the environmental, social and economic priorities of the region.
The name Concordia (translated as “agreement” or “oneness”) was selected after a wide-ranging dialogue with local communities and other project stakeholders. The name change is part of a broad program intended to communicate our commitment to developing the Concordia gold project in a way that is consistent with contemporary standards for sustainable development, environmental stewardship, and the health and safety of the communities in which we operate.
We believe that the name change reflects the spirit of our collaboration and the values we share with the local communities and project stakeholders as the Concordia gold project moves forward.
Change of Forest Land Use Permit-Application Status
On February 19, 2010, we announced that the Mexican Secretariat of the Environment and Natural Resources (“SEMARNAT”) had dismissed our application for the CUSF. In its dismissal, SEMARNAT had questioned the validity of the Temporary Occupation Permits (“TOP”) issued by the General Direction of Mines in the Secretariat of Economy, which were required as part of the CUSF application. SEMARNAT also identified the need for additional technical studies. On July 19, 2010, we announced an update on the status of our CUSF permit application, technical programs in progress, and a general overview of the development of the project.
The Concordia gold project is located in a special use area on the northern limit of the buffer zone of the Sierra de La Laguna Biosphere (the “Biosphere”). In the immediate Concordia gold project area, the surface land is divided between land owned directly by us and a parcel of federal land which has yet to be defined by the Mexican Secretariat of Agrarian Reform ("SRA") although the process for doing so is underway. The TOP apply to both the privately held land and the federal land. In questioning the validity of the TOP, SEMARNAT has requested confirmation of the boundaries of the federal land, and is seeking to determine if some or part of the federal land is subject to a prior request by the Mexican National Commission for Natural Protected Areas (“CONANP”) to be the administrator of the federal land. We expect that the SRA will release the survey results and clarify what part of the federal land is subject to CONANP’s claim. Subsequently, Desarrollos Zapal S.A. de C.V. (formerly, Minera Paredones Amarillos S.A. de C.V.) (“DZ”) expects the SRA to grant CONANP's request to become the administrator of the applicable part of the federal land in accordance with their previous request. CONANP has indicated that it will administer the federal land which lies within the buffer zone of the Biosphere in accordance with the established management plan, which states that the exploration and extraction of mineral resources is an activity that is compatible with the special use area in which the Concordia gold project is located. We expect this process to result in the validation of the TOP and recognition of such by SEMARNAT. Following the validation of the TOP, DZ will submit a new CUSF application. The timing for completion of these types of bureaucratic processes is uncertain and at this time, it is not possible to provide an estimate of the timing for the re-filing of a new CUSF application.
We are also working to resolve the deficiencies identified in SEMARNAT’s dismissal of the CUSF application. DZ has contracted SRK Consulting (U.S.), Inc. of Denver, Colorado, and several Baja California Sur academic institutions to review, analyze and validate some of the information submitted as part of the amended CUSF application. This will include additional hydrogeologic studies, surface run-off calculations and a review of certain baseline environmental data. The results will be submitted as part of the amended CUSF application. DZ has retained the services of Herrera Ordonez Abogados, a law firm based in Mexico City, to compile and submit the new CUSF application. The principal lawyer in charge of DZ’s work is Mr. Hector Herrera who is a past chairman of the Mexican Bar Association’s Environmental Commission and has an extensive background in working with SEMARNAT.
Preliminary Project Design, Permitting Support and Other Activities
We have contracted ICA Fluor, who has offices in Mexico City, Mexico, and Dublin, California, to be the engineering, procurement and construction management contractor for the project. ICA Fluor's initial scope of work includes basic engineering in support of permitting activities. ICA Fluor is coordinating design work on the access road, main power transmission line, processing plant, tailings impoundment facility, desalination plant and water supply pipeline.
Following the submission of the new CUSF application, we intend to present to SEMARNAT the documents to modify and extend the Concordia gold project’s environmental permits that were issued in 1997 and, unless extended by MPA, will expire in 2012. The modifications will reflect the many design changes made to improve the Concordia gold project and enhance environmental protections which are now incorporated into our proposed development.
We are in the process of finalizing the remaining rights-of-way for the power transmission line and water supply. We have filed the appropriate environmental permit application for the water supply pipeline.
VWS Mexico, S.A. de C.V. has been contracted to provide engineering and permitting support for the desalination plant. Final studies for the design of the facility have been completed and we have filed the appropriate environmental permit application.
We have established ASUDES, a civil association (similar in function to a foundation). The goals of ASUDES are to promote improved access to health care and more educational opportunities for members of the Concordia gold project’s
community. A number of programs have been established in the area of health and education which have been well received by the local communities.
As previously reported, on September 2, 2009, we announced the results of a feasibility study update (the “Updated Study”) completed by SRK Consulting (U.S.), Inc. (“SRK”) of Lakewood, Colorado, on our Concordia gold project.
During the four months preceding this announcement, we undertook a detailed review of our Concordia gold project. The Roberts & Schaefer Company, a large engineering firm based in Salt Lake City, Utah, reviewed the process facility design to optimize the process area layout, confirmed the proposed production parameters and constructability, and re-estimated the capital and operating costs for the process area. The re-estimated capital and operating costs were incorporated in the Updated Study of the project, which supersedes the economic evaluation reported in our September 8, 2008 press release, in connection with the feasibility study of the Concordia gold project (the “Feasibility Study”). A new technical report summarizing the results of the Updated Study entitled "Feasibility Study Update, NI 43-101 Technical Report, Vista Gold Corp., Paredones Amarillos Gold Project, Baja California Sur, Mexico" dated September 1, 2009 prepared by SRK is available under our SEDAR profile at
www.sedar.com
.
Other cost estimates for the proposed project were reviewed and updated by SRK and incorporated into the Updated Study to reflect current estimated capital and operating cost inputs and commodity prices. The Updated Study estimates a decrease in capital and operating costs and improved project economics. The mineral resources, mineral reserves, mine life and stripping ratios reported in the Feasibility Study remain unchanged. The highlights from the Updated Study compared to the Feasibility Study results are shown in the following table:
|
Selected Operating, Cost and Return Estimates
|
|||
|
Life-of-Mine Gold Production
|
1,203,000 ounces
|
||
|
Average Annual Gold Production
|
127,400 ounces per year
(142,900 ounces per year for the first five years)
|
||
|
Feasibility Study
|
Updated Study
|
||
|
Pre-Production Capital Costs
|
|||
|
Total
|
$197.2 million
|
$189.8 million
|
|
|
$ per ounce gold produced
|
$165
|
$155
|
|
|
Cash Operating Costs
($ per ounce gold produced)
|
|||
|
Life-of-Mine Average
|
$419
|
$406
|
|
|
Average for First Five Years
|
$380
|
$372
|
|
|
Financial Analysis
|
|||
|
Average Gold Price
|
$771 per oz.
1
|
$771 per oz.
1
|
$950 per oz.
2
|
|
Payback Period
|
3.4 years
|
2.9 years
|
2.3 years
|
|
NPV at 5% Discount Rate (pre-tax)
|
$128.9 million
|
$150.0 million
|
$303.9 million
|
|
Internal Rate of Return
|
21.0 % pre-tax
16.6 % after-tax
|
24.7 % pre-tax
19.6 % after-tax
|
37.8 % pre-tax
31.0 % after-tax
|
|
1)
Feasibility Study Base Case Gold Price Profile ($850 for 1
st
3 years, $725 thereafter)
2)
$950 gold price demonstrates upside at current gold prices
|
|||
Terry Braun, P.E. of SRK, an independent qualified person as defined by Canadian National Instrument 43-101 (“NI 43-101”) supervised the preparation of the scientific and technical information regarding the Updated Study included in this Form 10-K
In late 2009 and early 2010, we completed a 14-hole core drill program for resource and reserve confirmation and to evaluate any apparent check assay bias, under the direction of our Vice President of Exploration, Frank Fenne, P.G., who is a qualified person within the meaning of NI 43-101. Drilling was done by Major Drilling of Hermosillo, Sonora, Mexico, and
core logging and sampling was done by consultants of Vista Gold. Sample preparation was by ALS Chemex of Hermosillo, who sent prepared sample pulps to ALS Chemex in Vancouver, British Columbia, Canada for assaying. Check assaying was done by Acme Labs in Vancouver. Sampling, sample custody, preparation and assaying were completed in compliance with NI 43-101 standards. However, the results of the drilling did not resolve any apparent check assay bias, and additional work is planned.
Mt. Todd Agreement Extension and Results of Preliminary Feasibility Studies
In June 2010, we announced that we had notified the Northern Territory government in Australia that, based on our on-going positive results to date, we intend to extend our agreement with the Northern Territory government related to the Mt. Todd gold project for an additional five-year period to the end of 2015. On November 30, 2010, we, and the Northern Territory government, announced that the agreement has been renewed for an additional five-year period.
Development
In 2010, we undertook two drilling programs at the Batman deposit, and in the first program we completed 14 core and six reverse circulation drill holes (8,291 total meters drilled) in a program designed to add resources through in-fill drilling in the parallel structures to the east (hanging wall) of the core zone of the Batman deposit, to test/condemn hypothesized extensions of the deposit along strike and to the west of the core zone, and to provide core for metallurgical testing. The program concluded with the in-fill drilling of the parallel structures on the east of the Batman deposit. The drill holes were oriented to the west to intersect the core zone at right angles and were inclined at -55 to -60 degrees. Boart Longyear of Mitchell Park, South Australia, performed the drilling.
Included in the total were three core holes totaling 1,469 meters, that were located and oriented to provide core samples for metallurgical testing, representative of the Batman deposit, in the area of the pit defined by the June 2009 Mt. Todd preliminary economic assessment. The holes were drilled at -20 to -30 degree dips, at an acute angle to the strike of the deposit and were not assayed due to the requirements for whole core to be used in the planned metallurgical testing program.
The core was logged, photographed and sampled by employees and consultants of Vista Gold Australia under the direction of our Vice President of Exploration, Frank Fenne, P.G., who is a qualified person within the meaning of NI 43-101. Core samples to be assayed were shipped to the ALS-Chemex sample preparation lab in Alice Springs, Australia. Prepared sample pulps were shipped by ALS-Chemex to its assay lab in Perth, Australia. Check assaying was done by Genalysis of Perth, Australia. Core logging and sample custody, preparation and assaying were completed in compliance with NI 43-101 standards. Sample preparation, assaying and security protocols followed those developed in 2008 by Tetra Tech MM, Inc. (“Tetra Tech”) and Vista Gold, as described in the
Sample Preparation, Analyses and Security
section above.
We subsequently drilled one additional core hole in 2010 into the parallel structures in the hanging wall east of the core zone for 726 meters. Drilling was by Grid Drilling of Townsville, North Queensland. The core was logged, photographed and sampled by our employees and consultants under the direction of Vista’s Vice President of Exploration, Frank Fenne P.G., who is a qualified person under NI 43-101. Core was sawed in half by our employees and consultants and one half shipped to Northern Australian Laboratories in Pine Creek, Northern Territory, for sample preparation and assaying. Check assaying was done by Genalysis of Perth, Australia. Core logging and sample custody, sample preparation and assaying for all drill holes completed during 2010 followed those developed in 2008 by Tetra Tech and Vista Gold, as described in the Sample Preparation, Analyses and Security section above and were completed in compliance with NI 43-101 standards.
Preliminary Feasibility Study and Updated Estimate of Gold Mineralization, October 2010
On August 8, 2010, we announced the positive results of a preliminary feasibility study (“PFS”) for the Batman deposit. The PFS was constrained to consider tailings from mineral reserves that could be accommodated by the existing tailings storage capacity of 60 million tonnes. The PFS was managed by Tetra Tech, who also undertook the resource modeling and estimation, geotechnical, environmental and site reclamation engineering and design. Mr. John Rozelle, PG, Manager of Tetra Tech’s Mineral Resource Division and Principal Geologist, an independent qualified person as defined by NI 43-101, prepared or supervised the preparation of material on behalf of Tetra Tech. Mr. Thomas Dyer, P.E., of MDA of Reno, Nevada, an independent qualified person as defined by NI 43-101, prepared or supervised the preparation of material on behalf of MDA. Mr. Rozelle and Mr. Dyer prepared or supervised the preparation of the information that forms the basis for the scientific and technical information disclosed herein. The technical report summarizing the results of the PFS and updated mineral resource estimate entitled “Mt Todd Gold Project Prefeasibility Study, Northern Territory, Australia” dated
October 1, 2010, is available on SEDAR at
www.sedar.com
.
The PFS was evaluated using the three-year trailing average gold price of $950 per ounce (as of August 2010). Mineral reserve estimates and production highlights are tabulated below.
Production Highlights, October 2010 PFS
|
Reserves and Production Estimates at $950 per gold ounce
|
|
|
Proven and Probable Mineral Reserves (at a 0.55 grams gold per tonne cut-off)*
|
60,049,000 tonnes
at 1.05 grams gold per tonne
|
|
Life of Mine Production
|
1,662,000 gold ounces
|
|
Average Annual Production (based on 8.86 year mine life)
|
187,500 gold ounces per year
|
|
Mining Rate
|
22,900,000 tonnes per year
|
|
Mill Throughput Rate
|
18,500 tonnes per day
|
|
Stripping Ratio (waste:ore)
|
2.37
|
|
Mine Life
|
8.86 years
|
* Elevated cutoff grades were used to constrain the total estimated mineral reserve tonnes to the remaining tailings capacity while maximizing return. In most areas, a cutoff grade of 0.55 grams gold per tonne was used. Select benches in the first two phases of mining used a cutoff grade of 0.60 grams gold per tonne.
The PFS was completed using the three-year trailing average gold price of $950 per ounce (as of August 2010) and a foreign exchange rate of $0.85 = AUD$1.00 and incorporates mid-2010 costs. The following table summarizes the economic results with a comparison to the sensitivity at a gold price of $1,200 per ounce and a foreign exchange rate of $0.90 = AUD$1.00.
Summary of Economic Results
|
$950 per gold ounce & $0.85/AUD$1.00
|
$1,200 per gold ounce & $0.90/AUD$1.00
|
|
|
Average Cash Operating Cost ($ per gold ounce produced)
|
$476
|
$493
|
|
Average Total Cash Production Costs ($ per gold ounce produced)
|
$487
|
$507
|
|
Pre-Production Capital Cost:
|
$441,258,000
|
$459,820,000
|
|
Sustaining Capital Cost:
|
$32,981,000
|
$32,981,000
|
|
Internal Rate of Return
|
14.9% before tax
9.8% after tax
|
25.4% before tax
16.2% after tax
|
|
Cumulative Cash Flow (pre-tax)
|
$472,615,000
|
$848,724,000
|
|
Net Present Value at 5% discount (pre-tax)
|
$210,144,000
|
$487,156,000
|
Mineral Resources and Reserves Estimates for the October 2010 PFS
The October 2010 PFS is based on our updated gold mineral resource estimate for the Batman deposit as of June 11, 2009, which assumed a cutoff grade of 0.40 grams gold per tonne. Please see
Preliminary Economic Assessment and Updated Estimate of Gold Mineralization
above. In summary, based on the report, under SEC Industry Guide 7 guidelines, mineralized material for the Batman deposit net of mineral reserves, above a cut-off grade of 0.40 grams gold per tonne, is estimated at 130,889,000 tonnes grading 0.73 grams gold per tonne.
Also in summary, under CIM Definition Standards, net of mineral reserves and at the same cut-off grade of 0.40 grams gold per tonne, measured mineral resources are estimated at 28,461,000 tonnes grading 0.75 grams gold per tonne, indicated mineral resources are estimated at 102,428,000 tonnes grading 0.73 grams gold per tonne and inferred mineral resources are estimated at 94,008,000 tonnes grading 0.74 grams gold per tonne.
Cautionary Note to U.S. Investors: see the section heading “Cautionary Note to United States Investors Regarding Estimates of Measured, Indicated and Inferred Resources and Proven and Probable Reserves” above.
MDA used the June 2009 resource model to develop an open-pit mine design including intermediate pits, plans and production schedules.
The mineral reserve estimates were prepared and reported by MDA, under the supervision of Mr. Dyer, and using the June 2009 resource model at a gold price of $950 per ounce and cut-off grade of 0.55 grams gold per tonne. Elevated cutoff grades were used to constrain the total estimated mineral reserve tonnes to the remaining tailings capacity while maximizing return. In most areas, a cutoff grade of 0.55 grams gold per tonne was used; however, select benches in the first two phases of mining used a cutoff grade of 0.60 grams gold per tonne. As mentioned previously, the PFS was evaluated using the three-year trailing average gold price of $950 per ounce (as of August 2010), and therefore, the qualified person believes the reserve estimate is the same under both SEC Industry Guide 7 and CIM Definition Standards. The reserve estimates are shown in the following table.
Reserves Estimated at Mt. Todd, October 2010 PFS
|
Reserve Classification
|
Tonnes
|
Average Gold Grade
(grams gold per tonne)
|
|
Proven
(1)
|
24,458,000
|
1.09
|
|
Probable
(1)
|
35,519,000
|
1.02
|
|
Proven & Probable
(1)
|
60,049,000
|
1.05
|
|
|
(1)
|
Mineral reserves are reported separately from mineral resources.
|
Cautionary Note to U.S. Investors: see the section heading “Cautionary Note to United States Investors Regarding Estimates of Measured, Indicated and Inferred Resources and Proven and Probable Reserves” above.
Capital and Operating Cost Estimate, October 2010 PFS
Estimated life-of-mine average total cash production costs are projected to be $487 per ounce, with the highest costs occurring in the first five years of the project. The latter half of the project life benefits from decreases in the required stripping. Pre-production capital costs, including contingency, owner's costs and working capital, are estimated to be $441 million and sustaining capital over the life of the mine is estimated to be $33 million. Post-operation reclamation costs are not included in the total capital costs, but are included in the cash flow analyses and return on investment calculations.
Mining, October 2010 PFS
We plan to extract ore from the mine using conventional open-pit mining equipment and techniques. A waste mining fleet consisting of 180-tonne trucks and 211 cubic meter shovels has been selected to complement the 140-tonne truck and loader ore-mining fleet. We would be the owner and operator of the mining fleets and we expect to enter into maintenance and repair contracts for the major mining equipment. Ore will be mined in three pit development phases over a period of 8.86 years. Waste rock will be placed in a single waste dump and concurrent reclamation is planned for the lower benches of the dump.
Processing, October 2010 PFS
Following an extensive review of the plant performance data from previous operators, it was clear to us that there were a number of key reasons why these operations were unsuccessful. As a result, we undertook mineralogical and metallurgical studies to fully understand the type of ore that would be treated over the life of the proposed mine. This was followed by laboratory test programs that evaluated the metallurgical process, proposed equipment and the expected performance and cost parameters. We believe the principal reasons that led to the previous operational failure were:
|
|
·
|
Ore hardness - the plant built by the previous operator was poorly designed to handle the hard ore and failed to produce a satisfactory product or achieve design capacity. We tested and determined the expected ore hardness
|
|
|
and then evaluated various combinations of equipment. The best combination of equipment involved primary and secondary crushing, tertiary crushing employing high pressure grinding rolls (“HPGR”) followed by a large ball mill. The use of HPGR is expected to result in a product which significantly improves the efficiency of the grinding circuit. For the base case, the circuit is very simple with a large primary gyratory crusher, a secondary cone crusher, a single HPGR unit and a single ball mill.
HPGR technology is currently being successfully used by Newmont Mining Corporation, at Australia’s largest gold mine, the 20 million ounce Boddington mine in Western Australia
.
The circuit has been designed to reflect the results of leach tests which indicate that the optimum grind size should be 80% passing 100 mesh, coarser than used in previous operations.
|
|
|
·
|
Metallurgy - A number of metallurgical problems were encountered in the past, mostly related to copper minerals in the ore. Our test program focused first on understanding the form and distribution of the copper minerals in the ore body and then on the best metallurgical approach to deal with the copper. In the mineralogical review it became apparent that the form of the copper minerals changes with depth. In the upper part of the ore body, mostly mined out by previous operators, the copper existed mainly as secondary copper minerals such as chalcocite, bornite and covellite; these minerals are very soluble in cyanide which greatly increased the expense of leaching. The remaining ore contains mainly primary copper minerals like chalcopyrite which generally has a very minor effect on leaching and cyanide consumption. The tests we undertook on representative samples of the ore to be mined showed that whole-ore leaching combined with a carbon-in-pulp recovery circuit yields acceptable recoveries of 82%.
|
The proposed plant would have a design capacity of 18,500 tonnes per day and was designed to be simple, efficient and easy to maintain. The proposed flowsheet indicates that following grinding, the slurried ore will be sized by cyclones, thickened, pre-aerated, and then leached in tanks prior to recovery in a hybrid carbon-in-pulp circuit. Gold will be stripped from the carbon and precipitated in an electrowinning cell prior to refining into doré bars. The tailings will be detoxified using the SO
2
/Air process and deposited in the existing tailings impoundment facility.
Further contributing to lower costs, the proposed project will self-generate power using low-cost natural gas which can be supplied to the site via the existing natural gas pipeline. The project also includes plans to produce lime from near-by limestone deposits, thereby significantly reducing the supply cost for this reagent.
Infrastructure, October 2010 PFS
As a previously operated project, the Mt. Todd gold project site has existing infrastructure which includes a fresh water storage reservoir with sufficient capacity to sustain the proposed operation, paved access roads, concrete foundations for some of the crushing circuit, a natural gas pipeline and an electrical power line. Power will be generated on site using a gas-turbine generator which is included in the project capital. The power plant is designed to have excess capacity to meet higher loads during large equipment starting up. Excess power during operations will be sold into the grid further reducing expected costs. During the nine-year post-closure period, we intend to continue operating the natural gas turbine power generating plant. Revenues derived from selling power to the grid during this period are expected to fund all of the reclamation activities.
Environmental, October 2010 PFS
The PFS includes engineering designs for the closure of the mine site following cessation of production. The closure plan was designed to meet all requirements for long-term reclamation of the site and cost estimates include provisions for monitoring required under applicable law.
Economic Analysis, October 2010 PFS
As mentioned previously, the PFS economic analysis was completed using the three-year trailing average gold price of $950 per ounce (as of August 2010) and foreign exchange rate of $0.85 = $AUD1.00. We have also completed sensitivity analyses calculated at gold prices of $1,000, $1,100, $1,200 and $1,500 per ounce. The $1,200 and $1,500 sensitivity analyses incorporate the foreign exchange rate current in August 2010 of $0.90 = A$1.00. Estimated before and after tax economic results, showing the IRR and NPV
5%,
cumulative cash flow and sensitivity to changes in gold price are shown in the following tables.
Before–Tax Economic Results
|
Gold Price Scenario
|
Before Tax
IRR
|
Before Tax
NPV
5%
|
Before Tax
Cumulative Cash Flow
|
|
$950 Gold Price
|
14.9 %
|
$210,144,000
|
$472,615,000
|
|
$1000 Gold Price
|
17.5 %
|
$272,260,000
|
$554,865,000
|
|
$1,100 Gold Price
|
22.6 %
|
$396,494,000
|
$719,366,000
|
|
$1,200 Gold Price
|
25.4 %
|
$487,156,000
|
$848,724,000
|
|
$1,500 Gold Price
|
39.3 %
|
$859,856,000
|
$1,342,227,000
|
After-Tax Economic Results
|
Gold Price Scenario
|
After Tax
IRR
|
After Tax
NPV
5%
|
After Tax
Cumulative Cash Flow
|
|
$950 Gold Price
|
9.8 %
|
$71,127,000
|
$252,490,000
|
|
$,1,000 Gold Price
|
11.4 %
|
$100,497,000
|
$207,598,000
|
|
$1,100 Gold Price
|
14.5 %
|
$158,192,000
|
$359,190,000
|
|
$1,200 Gold Price
|
16.2 %
|
$198,827,000
|
$418,218,000
|
|
$1,500 Gold Price
|
23.9 %
|
$359,612,000
|
$624,317,000
|
New Preliminary Feasibility Study, January 2011
On January 4, 2011, we announced the positive results of a new PFS for the Batman deposit. The new PFS was managed by Tetra Tech, and expands upon the PFS previously completed by Tetra Tech and announced on August 18, 2010. Tetra Tech undertook the resource modeling and estimation, geotechnical, environmental and site reclamation engineering and design in the new PFS. Mr. John Rozelle, PG, Manager of Tetra Tech’s Mineral Resource Division and Principal Geologist, an independent qualified person as defined by NI 43-101, prepared or supervised the preparation of material on behalf of Tetra Tech. Mr. Thomas Dyer, P.E., of MDA of Reno, Nevada, an independent qualified person as defined by NI 43-101, prepared or supervised the preparation of material on behalf of MDA. Mr. Rozelle and Mr. Dyer prepared or supervised the preparation of the information that forms the basis for the scientific and technical information disclosed herein. The technical report summarizing the results of the PFS and updated mineral resource estimate entitled “10.65 MTPY Preliminary Feasibility Study, NI 43-101 Technical Report, Mt Todd Gold Project, Northern Territory, Australia” dated January 28, 2011 is available on SEDAR at
www.sedar.com
.
The new PFS evaluates the viability of a 30,000 tonne per day processing facility and the optimized extraction of the identified mineral resource. The previous PFS was constrained to treating mineralized material, the volume of which would be accommodated in the existing tailings disposal facility (60,000,000 tonnes), and the operating rate was 18,500 tonnes per day of ore compared to the higher, and more economical rate of 30,000 tonnes per day considered in the new PFS. A new tailings disposal facility would be constructed to accommodate the excess tails from the increased ore reserves.
Highlights of the new PFS include increased proven and probable mineral reserves, higher annual gold production, longer project life and improved economics at current and long-term estimated gold prices.
The new PFS was evaluated using a gold price of $1,000 per ounce, which, as year-end 2010, is less than the three-year trailing average of $1,022 per ounce. Therefore, the qualified person believes the reserve estimate is the same under both SEC Industry Guide 7 and CIM Definition Standards. Mineral reserve estimates and production highlights are tabulated below.
Production Highlights, January 2011 PFS
|
Reserves and Production Estimates at $1,000 per ounce gold
|
|
|
Proven and Probable Mineral Reserves (at a 0.40 grams gold per tonne cut-off)
(1)
|
149.9 million tonnes
at 0.85 grams gold per tonne
|
|
Life of Mine Production
|
3,372,000 ounces
|
|
Average Annual Production
|
239,500 gold ounces per year
|
|
Mining Rate
|
29.5 million tonnes per year
|
|
Mill Throughput Rate
|
30,000 tonnes per day
|
|
Stripping Ratio (waste:ore)
|
1.8
|
|
Mine Life
|
14 years
|
(1)
Cautionary Note to U.S. Investors
:
Proven and Probable Mineral Reserves as described in this table are based on Canadian definitions under NI 43-101. These Reserves are based on a pre-feasibility study. Reserves for SEC Industry Guide 7 purposes require definitive or “final” feasibility study.
See the section heading
“
Cautionary Note to United States Investors Regarding Estimates of Measured, Indicated and Inferred Resources and Proven and Probable Reserves” above
By utilizing the remaining capacity in the project’s existing tailings storage facility and deferring the capital for additional tailings storage capacity until later in the project’s life, we have been able to increase the size of the proposed process facility to a more economic level of 30,000 tonnes per day and increase the projected annual production to 250,000 ounces per year over the first five years of the project. Based on these positive results, we have now commenced a feasibility study for the Mt. Todd gold project that we expect to complete in the latter part of 2011. As part of the feasibility study program, we will undertake studies to further optimize the proposed operation, evaluate opportunities to reduce estimated capital costs and enhance project returns.
The new PFS was completed using a foreign exchange rate of $0.85 = AUD$1.00 and incorporates mid-2010 costs. The following table summarizes the economic results at a gold price of $1,000 per ounce with a comparison to economic results at a gold price of $1,350 per ounce and a foreign exchange rate of $1.00 = AUD$1.00.
Summary of Economic Results
|
$1,000 per gold ounce & $0.85/AUD$1.00
|
$1,350 per gold ounce & $1.00/AUD$1.00
|
|
|
Average Cash Operating Cost ($ per gold ounce produced)
|
$520
|
$587
|
|
Average Total Cash Production Costs ($ per gold ounce produced)
|
$530
|
$600
|
|
Pre-Production Capital Cost:
|
$589,583,000
|
$675,957,000
|
|
Sustaining Capital Cost:
|
$260,522,000
|
$261,183,000
|
|
Internal Rate of Return
|
13.9% before tax
10.7% after tax
|
23.2% before tax
16.6% after tax
|
|
Cumulative Cash Flow (pre-tax)
|
$964,514,000
|
$1,860,112,000
|
|
Net Present Value at 5% discount (pre-tax)
|
$385,336,000
|
$944,470,000
|
Mineral Resources and Reserves Estimates, January 2011 PFS
The new PFS is based on our gold mineral resource estimate for the Batman deposit as of June 11, 2009, which assumed a cutoff grade of 0.40 grams of gold per tonne. The resource estimate is detailed in the report “Mt. Todd Gold Project - Updated Preliminary Economic Assessment Report - Northern Territory, Australia” dated June 11, 2009, and is available on SEDAR at
www.sedar.com
. Please see
Preliminary Economic Assessment and Updated Estimate of Gold Mineralization
above. In summary, based on the report, under SEC Industry Guide 7 guidelines and net of mineral reserves, mineralized material for the Batman deposit, above a cut-off grade of 0.40 grams gold per tonne, is estimated at 41,064,000 tonnes grading 0.77 grams gold per tonne.
Also in summary, under CIM Definition Standards, at the same cut-off grade of 0.40 grams gold per tonne and net of mineral reserves, measured mineral resources are estimated at 3,958,000 tonnes grading 0..88 grams gold per tonne, indicated mineral resources are estimated at 37,106,000 tonnes grading 0.76 grams gold per tonne and inferred mineral resources are estimated at 94,008,000 tonnes grading 0.74 grams gold per tonne.
Cautionary Note to U.S. Investors: see the section heading “Cautionary Note to United States Investors Regarding Estimates of Measured, Indicated and Inferred Resources and Proven and Probable Reserves” above.
MDA used the June 2009 resource model to develop an open pit mine design, including intermediate pits, plans and production schedules.
The mineral reserve estimates shown in the following table were prepared and reported by MDA, under the supervision of Mr. Dyer, using the June 2009 resource model at a cut-off grade of 0.40 grams of gold per tonne with a three-year trailing gold price of $1,000 per ounce of gold, which as of year-end 2010, is less than the three-year trailing average of $1,022 per ounce. Therefore, the qualified person believes the reserve estimate is the same under both SEC Industry Guide 7 and CIM Definition Standards.
Batman Deposit Reserves Estimated at Mt. Todd, January 2011 PFS
|
Reserve Classification
|
Tonnes
|
Average Gold Grade
(grams gold per tonne)
|
|
Proven
(1)
|
48,961,000
|
0.91
|
|
Probable
(1)
|
100,914,000
|
0.83
|
|
Proven & Probable
(1)
|
149,875,000
|
0.85
|
|
|
(1)
|
Mineral reserves are reported separately from mineral resources.
|
Cautionary Note to U.S. Investors: see the section heading “Cautionary Note to United States Investors Regarding Estimates of Measured, Indicated and Inferred Resources and Proven and Probable Reserves” above.
Capital and Operating Cost Estimate, January 2011 PFS
Estimated life-of-mine average cash production costs are projected to be $520 per gold ounce and include the cost of concurrent reclamation. The latter half of the project life benefits from decreases in the required stripping. Pre-production capital costs including contingency, owner’s costs and working capital are estimated to be $589.6 million and sustaining capital over the life of the mine is estimated to be $260.5 million, including $150.4 million for additional tailings storage capacity to be spent starting in year five.
Mining, January 2011 PFS
The mining fleet would be the same as envisioned in the October 2010 PFS (see
Preliminary Feasibility Study and Updated Estimate of Gold Mineralization, October 2011)
, but the ore will be mined in four pit development phases over a period of 14 years. Waste rock will either be placed in a single waste dump or used for tailings embankment construction. Concurrent reclamation is planned for the lower benches of the waste dump.
Processing, January 2011 PFS
Processing incorporated in the January 2011 PFS would be the same as in the October 2010 PFS (see
Preliminary Feasibility Study and Updated Estimate of Gold Mineralization, October 2010
) but at an increased rate of 30,000 tonnes per day of ore.
Infrastructure, January 2011 PFS
Infrastructure is the same as reported in the October 2011 PFS (see
Preliminary Feasibility Study and Updated Estimate of Gold Mineralization, October
2010).
Environmental, January 2011 PFS
The PFS includes engineering designs for the closure of the mine site following cessation of production. Where practical, concurrent reclamation activities would be undertaken to reduce the time and expense involved in the closure of the site. The closure plan was designed to meet all requirements for long-term reclamation of the site and cost estimates include provisions for monitoring required under applicable law.
Economic Analysis, January 2011 PFS
The economic analysis was completed using the three-year trailing average gold price of $1,000 per ounce and a
foreign exchange rate of $0.85 = $AUD1.00. We also completed sensitivity analyses at gold prices of $1,200, $1,350 and $1,500 per ounce. The $1,200, $1,350 and $1,500 sensitivity analyses incorporate the current foreign exchange rate of $1.00 = AUD$1.00. Estimated before and after tax economic results, showing the IRR and NPV
5%
, cumulative cash flow and sensitivity to changes in gold price are shown in the following tables.
Before–Tax Economic Results
|
Gold Price Scenario
|
Before Tax
IRR
|
Before Tax
NPV
5%
|
Before Tax
Cumulative Cash Flow
|
|
$1,000 Gold Price
|
13.9 %
|
$ 385,336,000
|
$ 964,514,000
|
|
$1,200 Gold Price
|
17.1 %
|
$ 610,603,000
|
$ 1,359,383,000
|
|
$1,350 Gold Price
|
23.2 %
|
$ 944,470,000
|
$ 1,860,112,000
|
|
$1,500 Gold Price
|
29.1 %
|
$ 1,278,336,000
|
$ 2,360,841,000
|
After-Tax Economic Results
|
Gold Price Scenario
|
After Tax
IRR
|
After Tax
NPV
5%
|
After Tax
Cumulative Cash Flow
|
|
$1000 Gold Price
|
10.7 %
|
$ 184,312,000
|
$ 584,562,000
|
|
$1200 Gold Price
|
12.4 %
|
$ 284,528,000
|
$ 777,849,000
|
|
$1350 Gold Price
|
16.6 %
|
$ 475,309,000
|
$ 1,059,338,000
|
|
$1500 Gold Price
|
20.6 %
|
$ 664,986,000
|
$ 1,339,945,000
|
Mineral Resource Estimate for the Quigleys Deposit at the Mt. Todd Gold Project
On September 8, 2010, we announced that Tetra Tech, had reviewed the geology and calculated a mineral resource estimate in accordance with CIM Standards. The mineral resource estimate was conducted under the direction of Mr. John Rozelle, an independent Qualified Person as defined by NI 43-101 using standard industry software and resource estimation methodology. The Quigleys deposit is located 3.5 km northeast of the Batman deposit at our Mt. Todd gold project. The resource estimate is included in our preliminary feasibility report on the Batman deposit entitled “Mt Todd Gold Project Prefeasibility Study, Northern Territory, Australia” dated October 1, 2010, and is available on SEDAR at
www.sedar.com
.
Mineralization at the Quigleys deposit is interpreted to occur within a series of mineralized shears that strike north northwest and dip 30° - 35° to the west. The main shear extends for nearly one kilometer along the strike and has been drilled to a vertical depth of 230 meters. The mineral resource estimate has been defined by 632 drill holes drilled by Pegasus Gold Australia Pty Ltd. (“Pegasus”) and Billiton Australia Gold Pty Ltd. in the late 1980s through the mid-1990s. Tetra Tech reviewed the integrity of the drill hole database and developed a computer model to estimate and classify the estimated mineral resources. The model reflected Tetra Tech’s geological interpretation of the deposit, which constrained the mineralization to the shear zones using geological information and assays from 49,178 samples obtained from the drilling. Lower grade, erratic mineralization in the hanging wall of the shears has not been included in the mineral resource estimate.
Sampling and assaying was done under the supervision of prior operators in conjunction with evaluation of the Batman deposit and are discussed in the PFS and the PEA, as part of the overall project sampling and assaying methodology. Please see the quote from Tetra Tech in the section titled
Preliminary Economic Assessment and Updated Estimate of Gold Mineralization
above.
Based on Tetra Tech’s resource analysis, at a cut-off grade of 0.50 grams of gold per tonne, under SEC Industry Guide 7 guidelines mineralized material for the Quigleys deposit is estimated at 6,076,000 tonnes grading 0.92 grams gold per tonne.
Under CIM Definition Standards, at the same cut-off grade of 0.50 grams gold per tonne, measured mineral resources are estimated at 511,000 tonnes grading 1.04 grams gold per ton, indicated mineral resources are estimated at 5,565,000 tonnes grading 0.91 grams gold per tonne and inferred mineral resources are estimated at 9,416,000 tonnes grading
0.95 grams gold per tonne.
Cautionary Note to U.S. Investors: see the section heading “Cautionary Note to United States Investors Regarding Estimates of Measured, Indicated and Inferred Resources and Proven and Probable Reserves” above.
Exploration Potential
We control a large land package (117,632 hectares) of exploration tenements surrounding the Mt. Todd gold project. In the third quarter of 2009, during a review of Pegasus’ airborne geophysical survey data, our geologists identified five magnetic targets on our exploration tenements. The targets are referred to as the Mt. Todd Structural Target Sequence (“MSTS”), and are characterized by distinct magnetic highs located within sedimentary rocks that should have a low magnetic signature. These features are remarkably similar to those at Mt. Todd, which, as a result of the included pyrrhotite, exhibits a strong magnetic high. The MSTS targets were prioritized following review of historic work in the area and site visits.
As we announced on June 29, 2010, four of the new exploration targets are being investigated through additional soil and rock-chip sampling and testing, followed, where appropriate, by drilling.
Initial soil sampling on 100-meter by 100-meter grids was completed on MSTS3 and MSTS4 late in 2009 before the onset of the wet season. In this part of Australia, mining occurs on a year-round basis as appropriate road access is installed, but exploration is difficult to impossible during the wet season (November through April) due to unimproved road conditions in the field. Both targets returned low-level anomalous gold values.
MSTS4 shows a magnetic high within low-signature silts and greywackes; however, there are no historic soil or rock-chip sampling results on MSTS4 and no evidence of any mining.
At MSTS4, rock chip sampling, in an area with limited exposure, returned a 25.0 grams gold per tonne sample from a small outcrop of fault breccia. Further sampling returned 23.0 grams gold per tonne and 7.7 grams gold per tonne assays in vein and breccias located 15 meters and 50 meters, respectively, north of the original sample. Due to the sparse outcrop, the orientation and thickness of the mineralized zone is not currently known. A soil sampling program over the area was completed on a 20-meter grid. The survey returned a strong coherent gold anomaly approximately 400 meters in diameter with coincident anomalous base metals and arsenic. Sampling was done by our employees and consultants under the direction of our Vice President of Exploration, Frank Fenne P.G., who is a qualified person under NI 43-101, and shipped to Northern Australian Laboratories in Pine Creek, Northern Territory for sample preparation and assaying. Sampling, sample custody, preparation and assaying were completed in compliance with NI 43-101 standards.
Beginning in August 2010, after receiving approvals for drilling and before the onset of the 2010-2011 wet season, we completed four core holes on MSTS4 (now known as “Golden Eye” because of its appearance resembling two eyes on a surface sample assay map) out of six that were planned. All four Golden Eye drill holes encountered strong sulfide mineralization associated with banded iron formation with interesting concentrations of copper, lead zinc and anomalous gold mineralization, with the best intercept occurring in hole GE10-003 and consisting of 1.1 meters of 7.69 grams gold per tonne including 0.3 meters of 26.7 grams gold per tonne. Drill results were encouraging and provided useful geologic information for next season’s exploration program, and we plan to resume drilling activities as soon as the wet season ends and access can be re-established. Drilling was done by Grid Drilling of Townsville, North Queensland. The core was logged, photographed and sampled by our employees and consultants under the direction of our Vice President of Exploration, Mr. Frank Fenne P.G., who is a qualified person under NI 43-101. Core was sawed in half by our employees and consultants and one half shipped to Northern Australian Laboratories in Pine Creek, Northern Territory for sample preparation and assaying. Check assaying was done by Genalysis of Perth, Australia. Core logging and sample custody, sample preparation and assaying were completed in compliance with NI 43-101 standards.
Yellow Pine Gold Project Letter of Intent
On December 7, 2010, we announced that we entered into a letter of intent (“LOI”) with Midas Gold, Inc. (“Midas”), a privately held company based in Spokane Valley, Washington, for the combination of the respective holdings of Vista Gold and Midas in the Yellow Pine – Stibnite Mining District located in Valley County, Idaho (the “District”). The LOI is non-binding, except with respect to specified provisions, and the completion of the proposed combination is subject to a number of conditions, including, but not limited to, the execution of definitive agreements, the completion of due diligence satisfactory to Vista Gold and Midas, and the receipt of board and other approvals.
The LOI provides for the contribution by Vista Gold and Midas of their respective mining claims, interests and other assets in the District to a newly formed U.S. corporation (“Newco”). The LOI provides that immediately following the combination, Newco will be held 35% by Vista Gold’s and 65% by Midas’ shareholders. Additionally, the LOI provides that Vista Gold will initially have the right to appoint 25% of the directors of Newco and Midas will initially have the right to appoint 75% of the directors.
On February 23, 2011, we announced the execution of a combination agreement between Midas and certain of Vista’s U.S. subsidiaries. See Section Heading “Subsequent Events,” below. The combination would, if completed, also extinguish a 5.0% net smelter return royalty on Vista Gold's Yellow Pine gold project, which royalty is currently held by Midas.
Awak Mas Gold Project
On December 28, 2009, we announced that our wholly-owned subsidiary Vista Barbados had signed a joint venture agreement with Pan Asia Resources Corporation (“Pan Asia”) with respect to the development of the Awak Mas gold project.
The joint venture agreement provides Pan Asia, a privately held resource development company, with the opportunity to earn a 60% interest in the Awak Mas project by: (i) expending $3 million on the project within the next 30 months; (ii) completing an environmental impact assessment and feasibility study (in compliance with
NI 43-101), each of which is required by the contract of work (“CoW”) granted by the Indonesian Government under which the Awak Mas project is held; and (iii) issuing to Vista Gold two million shares of Pan Asia and the right to purchase up to an additional two million shares of Pan Asia in the event of an initial public offering of Pan Asia shares (on the same terms as offered under such initial public offering). Under the terms of the joint venture agreement, we will retain our controlling interest in the Awak Mas project until Pan Asia completes the earn-in conditions described above.
We completed the exploration phase of the CoW in January 2008 and entered the feasibility phase in February 2008. The feasibility phase usually lasts one year, but may be negotiated for up to 2 one-year extensions. Following the feasibility phase, with government approvals, there would be a construction phase lasting usually three years. The operating period follows the construction phase, lasting usually 10 to 30 years. In late 2008, we applied for a suspension of the feasibility period for one year. Before this application was ruled upon, we announced our joint venture agreement with Pan Asia, which may have delayed the process.
In April 2010, draft Terms of Reference for an Environmental Impact Study leading to a new Environmental Management Plan (“AMDAL”) were presented to the environmental department in Luwu Regency by Pan Asia’s (operating through our subsidiary, PT Masmindo) AMDAL consultant. Because of a delay due to a question by the Indonesian government about the project boundary lines, which has since been resolved in our favor, we agreed to extend Pan Asia’s time commitments that are in our agreement by that amount of time (approximately nine months). At year end, Pan Asia submitted its Terms of Reference for completion of the Environmental Impact Study to the Provincial Government and is awaiting Provincial Government approval to finalize the AMDAL process during 2011.
Pan Asia commenced its activities at Awak Mas in January 2010 with the hiring of an experienced project manager and during the second quarter, a senior mining engineer to aid its resource assessment work. Pan Asia’s initial focus was on the mineral resource previously defined at the project and some months were spent on re-evaluating the geological database and producing an in-house resource model. During the first quarter 2011, an independent evaluation of its resource model will be undertaken by its independent consultants, Tetra Tech.
Pan Asia reports that it has assembled a team of highly qualified consultants to undertake a preliminary economic assessment or scoping study for the Awak Mas project. The team includes Amec-Minproc Limited for plant and process design, Australian Mine Design & Development Pty Ltd. for mine planning and ore reserve definition, Golder Associates for geotechnical investigations and environmental consulting, Resindo Resources for infrastructure and local costs and Tetra-Tech for mineral resource evaluation.
Initial site visits by Pan Asia’s consulting team was undertaken during the fourth quarter 2010 and further site visits are planned in January 2011. The preliminary economic assessment or scoping study is scheduled to be completed by April 30, 2011.
A program of infill drilling is scheduled to commence during the first quarter 2011. This program is designed to upgrade inferred resources to indicated status so they can be included in the definitive feasibility study that is scheduled to be undertaken in the second half of 2011, and also provide core samples for additional metallurgical testing in Australia to aid the process design work being undertaken by Amec-Minproc.
During 2010 a number of local community initiatives were undertaken, and in 2011, Pan Asia plans to hire a community relations officer as the project proceeds into the definitive feasibility study phase.
Subsequent Events
Mt. Todd Prefeasibility Study
On January 4, 2011, we announced the positive results of a new PFS for the Batman deposit. For a discussion related to the new PFS and the results, please see “
Preliminary Feasibility Study and Updated Estimate of Gold Mineralization, January 2011
,” above.
Combination Agreement with Midas Gold
On February 23, 2011, Vista Gold and Midas announced that Midas, Midas Gold Corp. (“Midas Gold”) and certain of Vista’s US subsidiaries had executed a combination agreement (the “Combination Agreement”) whereby they will contribute their respective Idaho gold assets to Midas Gold (the "Combination"). If the Plan of Share Exchange, as defined below, is approved by the shareholders of Midas, and all other conditions to the transaction are satisfied or waived, Midas Gold will be owned, on a fully diluted basis, 65% by shareholders Midas and 35% by Vista following the completion of the Combination.
The reorganization of the ownership of the Stibnite-Yellow Pine gold district will be effected pursuant to the Combination Agreement among Midas, Midas Gold, Vista’s wholly-owned subsidiary, Vista Gold U.S. Inc., a Delaware corporation (“Vista US”) and its wholly owned subsidiary, Idaho Gold Resources, LLC, an Idaho limited liability company (“Idaho Gold”), assuming the Plan of Share Exchange is approved by the shareholders of Midas and all of the other conditions to the closing of the Combination are satisfied or waived. Following the execution of the Combination Agreement, Midas will hold a special meeting of its shareholders (the “Special Meeting”). The purpose of the Special Meeting is to consider and approve a plan of share exchange (the “Plan of Share Exchange”) between Midas and Midas Gold pursuant to which Midas’ outstanding shares of common stock (the “Midas Shares”) and outstanding options (the “Midas Options”), other than Midas Shares held by dissenting shareholders, will be exchanged for common shares and options of Midas Gold (the “Midas Gold Shares” and “Midas Gold Options”, respectively), with the result that Midas will become a wholly-owned subsidiary of Midas Gold. Midas Shareholders holding at least 66-2/3% of the issued and outstanding Midas Shares must vote in favor of the Plan of Share Exchange at the Special Meeting and dissenters' appraisal rights shall not be exercised with respect to more than 5% of the outstanding Midas Shares.
The Plan of Share Exchange is part of a broader, integrated transaction undertaken pursuant to the terms of the Combination Agreement, pursuant to which, if the Plan of Share Exchange is approved at the Special Meeting and the other conditions to closing specified in the Combination Agreement are satisfied or waived:
|
|
·
|
Vista US will: (a) organize Idaho Gold Holding Company, as a wholly-owned Idaho corporation (“Idaho Holdco”); (b) contribute its equity interests in Idaho Gold to Idaho Holdco; and (c) at closing, contribute all of the issued and outstanding shares of common stock of Idaho Holdco to Midas Canada as a capital contribution, in exchange for that number of Midas Gold Shares equal to, on a fully diluted basis, thirty-five percent (35%) of the Midas Gold Shares that are issued and outstanding at the time the transactions specified in the Combination Agreement and the Plan of Exchange are completed;
|
|
|
·
|
The shareholders of Midas, other than any dissenting shareholders, will contribute their Midas Shares to Midas Gold in exchange for that number of Midas Gold Shares equal to, on a fully diluted basis, sixty-five percent (65%) of the Midas Gold Shares that are issued and outstanding at the time the transactions specified in the Combination Agreement and the Plan of Exchange are completed; and
|
|
|
·
|
The holders of Midas Option will exchange their Midas Options for Midas Gold Options of like tenor.
|
Additionally, as a condition to closing the Combination, Vista US and each officer, director, and holder of 5% or greater of the Midas Shares (the “Midas Affiliates”) have entered into lock up agreements (the “Lock Up Agreements”) and voting support agreements (the “Voting Agreements”). Pursuant to the Lock Up Agreements, Vista US and each of the Midas Affiliates have agreed that their respective Midas Canada Shares will not be transferable except in specific circumstances and for a specific period of time. Pursuant to the Voting Agreements, Vista US has, amongst other items, agreed, for a specified period of time, to vote in favor of the nominees to the Midas Canada board of directors as designated by the nominating and corporate governance committee, or similar committee, of Midas Canada and the Midas Affiliates have, amongst other items, agreed, for a specified period of time, to vote in favor of the Combination and for the nominee to the Midas Canada board of
directors as designated by Vista US.
Listing of Warrants on the TSX
On March 2, 2011, we announced that the 15,308,044 warrants issued on December 15, 2010 in connection with our private placement of Special Warrants, began trading March 1, 2011 on the TSX under the symbol VGZ.WT.U (subsequently changed to VGZ.WT.S on March 14, 2011).
The Warrants are freely tradable in Canada, except to, or for the account or benefit, of any U.S. person (as defined in Regulation S under the United States Securities Act of 1933, as amended (the “Securities Act”). Neither the Warrants nor the common shares issuable upon exercise of the Warrants (the “Warrant Shares”) have been registered under the Securities Act, or any state securities laws of any state of the United States. Accordingly, the Warrants and the Warrant Shares may not be offered or sold in the United States or to, or for the account or benefit of, any U.S. person (as defined in Regulation S under the Securities Act) or any person in the United States absent registration under the Securities Act or an applicable exemption from such registration requirements and in accordance with all applicable state securities laws of any state of the United States. Purchasers of the Warrants or the Warrant Shares may not engage in hedging transactions with regard to the Warrants or the Warrant Shares unless in compliance with the Securities Act.
Repayment of Notes
On March 7, 2011, we announced that we repaid our $23,000 principal amount of Notes (plus accrued interest) which matured on March 4, 2011.
S
ignificant Accounting Policies, Changes in Accounting Policies and Recent Accounting Pronouncements
Significant accounting policies
Use of estimates
The preparation of consolidated financial statements in accordance with generally accepted accounting principles in Canada requires management to make estimates and assumptions that affect the reported amounts of assets and liabilities and disclosure of contingent liabilities at the date of the consolidated financial statements and the reported amount of revenues and expenses during the reporting period. Significant areas requiring the use of estimates include useful lives for asset depreciation purposes, impairment of mineral properties and stock-based compensation. Actual results could differ from these estimates.
Mineral properties
Mineral property acquisition costs and exploration costs are recorded at cost and are deferred until the viability of the property is determined. General overhead, administrative and holding costs to maintain a property on a care and maintenance basis are expensed in the period they are incurred. If a project is in production, capitalized costs would be depleted on the unit of production basis.
Option payments and reimbursements received are treated as a recovery of mineral property costs. Option payments are at the discretion of the optionee and accordingly are accounted for on a cash basis or when receipt is reasonably assured.
Our management regularly reviews the net carrying value of each mineral property. Where information and conditions suggest impairment, estimated future cash flows are calculated using estimated future prices, proven and probable reserves, weighted probable outcomes and operating capital and reclamation costs on an undiscounted basis. If it is determined that the future cash flows are less than the carrying value, a write-down to the estimated fair value is made with a charge to loss for the period. Where estimates of future net cash flows are not available and where other conditions suggest impairment, management assesses if carrying values can be recovered.
Stock-based compensation and other stock-based payments
We record compensation expense on the granting of all stock-based compensation awards, including stock option grants to employees, calculated using the fair-value method. The Corporation uses the Hull-White Trinomial method of determining the fair value of the option on the date of the grant. When an employee or non-employee is granted stock options, the fair value of the immediately vested portion is expensed and included within the stock options balance within equity. As to the options vesting, the fair-value is amortized using the straight-line method over the vesting period and expensed on a monthly basis. When an employee or non-employee exercises stock options, then the fair-value of the options on the date of the grant is transferred to common stock. When options are cancelled, the vested fair-value balance of the stock options is transferred to contributed surplus. When stock options are forfeited prior to becoming fully vested, any expense and fair-value previously recorded are reversed out accordingly. When options expire, the related fair-value is transferred to contributed surplus.
Changes in accounting policies during 2010
Recent accounting pronouncements
United States Generally Accepted Accounting Principles (“U.S. GAAP”)
We have, since inception, reported to security regulators in both Canada and the United States, financial statements prepared in accordance with Canadian GAAP with reconciliation to U.S. GAAP. In 2006, the Canadian Accounting Standards Boards (“AcSB”) published a new strategic plan that outlines the convergence of Canadian GAAP with International Financial Reporting Standards (“IFRS”) over an expected five year transitional period. In February 2008, the AcSB announced that 2011 is the changeover date for publicly-listed companies to use IFRS, replacing Canadian GAAP. However, due to a change in the Securities and Exchange Commission’s (“SEC”) position in late 2009, and because we are considered to be a domestic filer under SEC rules for reporting purposes, we will be unable to adopt IFRS and instead will be required to report under U.S. GAAP beginning with fiscal year 2011, with our financial statements and selected financial data recast into U.S. GAAP for all periods presented in the financial statements.
We are engaged in the acquisition of gold projects and related activities including exploration, engineering, permitting and the preparation of feasibility studies. The value of our properties is related to gold price and changes in the price of gold could affect our ability to generate revenue from our portfolio of gold projects.
Gold prices may fluctuate widely from time to time and are affected by numerous factors, including the following: expectations with respect to the rate of inflation, exchange rates, interest rates, global and regional political and economic circumstances and governmental policies, including those with respect to gold holdings by central banks. The demand for, and supply of gold affect gold prices, but not necessarily in the same manner as demand and supply affect the prices of other commodities. The supply of gold consists of a combination of new mine production and existing stocks of bullion and fabricated gold held by governments, public and private financial institutions, industrial organizations and private individuals. The demand for gold primarily consists of jewelry and investments. Additionally, hedging activities by producers, consumers, financial institutions and individuals can affect gold supply and demand. While gold can be readily sold on numerous markets throughout the world, its future market value cannot be predicted for any particular time.
We are subject to foreign currency fluctuations because we have exploration operations in North America, Australia and Asia. We do not engage in currency hedging to offset any risk of currency fluctuations as insignificant monetary amounts are held for immaterial land holding costs related to the properties owned.
On March 7, 2008, we announced the closing of a private placement in which we offered and sold $30 million in aggregate principal amount of Notes. The Notes bear interest at a rate of 10% per annum (calculated and payable semi-annually in arrears) and will mature on March 4, 2011. We do not consider our interest rate risk exposure to be significant at this time. See section heading “Item 8. — Financial Statements and Supplementary Data—Note 7 – Brokered Private Placement of Convertible Notes” below.
Supplementary Data
For the required supplementary data, please see the section heading “Item 7. Management’s Discussion and Analysis of Financial Condition and Results of Operations – Summary of Quarterly Results and 4
th
Quarter Review” above.
Management’s Responsibility for Financial Information
To the Shareholders of Vista Gold Corp.
The consolidated financial statements are the responsibility of the Board of Directors and management. The accompanying consolidated financial statements of the Corporation have been prepared by management based on information available through March 16, 2011; these consolidated financial statements are in accordance with Canadian generally accepted accounting principles, and have been reconciled to United States generally accepted accounting principles as presented in Note 20.
A system of internal accounting and administrative controls is maintained by management in order to provide reasonable assurance that financial information is accurate and reliable, and that the Corporation’s assets are safeguarded. Limitations exist in all cost-effective systems of internal controls. The Corporation’s systems have been designed to provide reasonable but not absolute assurance that financial records are adequate to allow for the completion of reliable financial information and the safeguarding of its assets. The Corporation believes that the systems are adequate to achieve the stated objectives.
The Audit Committee of the Board of Directors is comprised of three outside directors, that meets regularly with management to ensure that management is maintaining adequate internal controls and systems and meets regularly with the independent auditors prior to recommending to the Board of Directors approval of the annual and quarterly consolidated financial statements of the Corporation.
The consolidated financial statements have been audited by PricewaterhouseCoopers LLP, Chartered Accountants, who were appointed by the shareholders. The auditors’ report outlines the scope of their examination and their opinion on the consolidated financial statements.
|
/s/
Michael B. Richings
|
/s/
Gregory G. Marlier
|
|
Michael B. Richings
|
Gregory G. Marlier
|
|
Executive Chairman and
Chief Executive Officer
|
Chief Financial Officer
|
|
March 14, 2011
|
March 14, 2011
|
Independent Auditor’s Report
To the Shareholders of Vista Gold Corp.
We have completed integrated audits of Vista Gold Corp.’s December 31, 2010, 2009 and 2008 consolidated financial statements and an audit of the effectiveness of the Company’s internal control over financial reporting as at December 31, 2010. Our opinions, based on our audits, are presented below.
Report on the consolidated financial statements
We have audited the accompanying consolidated financial statements of Vista Gold Corp. which comprise the consolidated balance sheets as at December 31, 2010 and 2009 and the consolidated statements of loss and comprehensive loss, deficit and cash flows, for each of the three years in the period ended December 31, 2010, and the related notes including a summary of significant accounting policies.
Management’s
responsibility
for
the
consolidated
financial statements
Management is responsible for the preparation and fair presentation of these consolidated financial statements in accordance with Canadian generally accepted accounting principles and for such internal control as management determines is necessary to enable the preparation of consolidated financial statements that are free from material misstatement, whether due to fraud or error.
Auditor’s responsibility
Our responsibility is to express an opinion on these consolidated financial statements based on our audits. We conducted our audits in accordance with Canadian generally accepted auditing standards and the standards of the Public Company Accounting Oversight Board (United States). Those standards require that we plan and perform an audit to obtain reasonable assurance about whether the consolidated financial statements are free from material misstatement. Canadian generally accepted auditing standards require that we comply with ethical requirements.
An audit involves performing procedures to obtain audit evidence, on a test basis, about the amounts and disclosures in the consolidated financial statements. The procedures selected depend on the auditor’s judgment, including the assessment of the risks of material misstatement of the consolidated financial statements, whether due to fraud or error. In making those risk assessments, the auditor considers internal control relevant to the company’s preparation and fair presentation of the consolidated financial statements in order to design audit procedures that are appropriate in the circumstances. An audit also includes evaluating the appropriateness of accounting principles and policies used and the reasonableness of accounting estimates made by management, as well as evaluating the overall presentation of the consolidated financial statements.
We believe that the audit evidence we have obtained in our audits is sufficient and appropriate to provide a basis for our audit opinion on the consolidated financial statements.
Opinion
In our opinion, the consolidated financial statements present fairly, in all material respects, the financial position of Vista Gold Corp. as at December 31, 2010 and 2009 and the results of its operations and cash flows for each of the three years in the period ended December 31, 2010 in accordance with Canadian generally accepted accounting standards.
Report on internal control over financial reporting
We have also audited Vista Gold Corp.’s internal control over financial reporting as at December 31, 2010, based on criteria established in Internal Control- Integrated Framework, issued by the Committee of Sponsoring Organizations of the Treadway Commission (“COSO”).
Management’s responsibility for internal control over financial reporting
Management is responsible for maintaining effective internal control over financial reporting and for its assessment of the effectiveness of internal control over financial reporting included in Management’s Annual Report on Internal Control over Financial Reporting.
Auditor’s responsibility
Our responsibility is to express an opinion on the company’s internal control over financial reporting based on our audit.
We conducted our audit of internal control over financial reporting in accordance with the standards of the Public Company Accounting Oversight Board (United States). Those standards require that we plan and perform the audit to obtain reasonable assurance about whether effective internal control over financial reporting was maintained in all material respects.
An audit of internal control over financial reporting includes obtaining an understanding of internal control over financial reporting, assessing the risk that a material weakness exists, testing and evaluating the design and operating effectiveness of internal control, based on the assessed risk, and performing such other procedures as we consider necessary in the circumstances.
We believe that our audit provides a reasonable basis for our audit opinion
on the company’s internal control over financial reporting.
Definition of internal control over financial reporting
A company’s internal control over financial reporting is a process designed to provide reasonable assurance regarding the reliability of financial reporting and the preparation of financial statements for external purposes in accordance with generally accepted accounting principles. A company’s internal control over financial reporting includes those policies and procedures that (i) pertain to the maintenance of records that, in reasonable detail, accurately and fairly reflect the transactions and dispositions of the assets of the company; (ii) provide reasonable assurance that transactions are recorded as necessary to permit preparation of financial statements in accordance with generally accepted accounting principles, and that receipts and expenditures of the company are being made only in accordance with authorizations of management and directors of the company; and (iii) provide reasonable assurance regarding prevention or timely detection of unauthorized acquisition, use, or disposition of the company’s assets that could have a material effect on the financial statements.
Inherent limitations
Because of its inherent limitations, internal control over financial reporting may not prevent or detect misstatements. Also, projections of any evaluation of effectiveness to future periods are subject to the risk that controls may become
inadequate because of changes in conditions or that the degree of compliance with the policies or procedures may deteriorate.
Opinion
In our opinion, Vista Gold Corp. maintained, in all material respects, effective internal control over financial reporting as at December 31, 2010 based on criteria established in Internal Control - Integrated Framework issued by COSO.
(Signed) “PricewaterhouseCoopers
LLP
”
Chartered Accountants
March 14, 2011
Vancouver, British Columbia
VISTA GOLD CORP. (An Exploration Stage Enterprise)
|
As at December 31,
|
||||||||
|
(U.S. dollars in thousands, except share data)
|
2010
|
2009
|
||||||
|
Assets:
|
||||||||
|
Cash and cash equivalents
|
$ | 39,838 | $ | 28,408 | ||||
|
Marketable securities - Note 4
|
1,703 | 1,150 | ||||||
|
Short-term investments
|
- | 250 | ||||||
|
Other current assets
|
1,084 | 509 | ||||||
|
Current assets
|
42,625 | 30,317 | ||||||
|
Mineral properties - Note 5
|
54,195 | 38,696 | ||||||
|
Amayapampa disposal consideration - Note 3
|
4,813 | 4,813 | ||||||
|
Plant and equipment - Note 6
|
18,809 | 18,747 | ||||||
| 77,817 | 62,256 | |||||||
|
Total assets
|
$ | 120,442 | $ | 92,573 | ||||
|
Liabilities and Shareholders' Equity:
|
||||||||
|
Convertible Notes - Note 7
|
$ | 22,505 | $ | - | ||||
|
Accounts payable
|
147 | 63 | ||||||
|
Accrued liabilities and other
|
1,483 | 863 | ||||||
|
Current liabilities
|
24,135 | 926 | ||||||
|
Convertible Notes - Note 7
|
- | 24,939 | ||||||
|
Other long-term liabilities
|
- | 228 | ||||||
|
Total liabilities
|
24,135 | 26,093 | ||||||
|
Capital stock, no par value: - Note 8
|
||||||||
|
Preferred - unlimited shares authorized; no shares outstanding
|
||||||||
|
Common - unlimited shares authorized; shares outstanding:
|
||||||||
|
2010 - 61,919,752 and 2009 - 44,679,024
|
274,829 | 245,964 | ||||||
|
Warrants - Note 9
|
10,721 | 336 | ||||||
|
Stock-based compensation - Note 10
|
4,580 | 4,818 | ||||||
|
Contributed surplus - Note 11
|
3,333 | 1,848 | ||||||
|
Equity component of convertible notes - Note 7
|
4,721 | 5,998 | ||||||
|
Accumulated other comprehensive income - Note 12
|
796 | 575 | ||||||
|
Deficit
|
(202,673 | ) | (193,059 | ) | ||||
|
Total shareholders' equity
|
96,307 | 66,480 | ||||||
|
Total liabilities and shareholders' equity
|
$ | 120,442 | $ | 92,573 | ||||
Commitments and Contingencies – Note 15
Subsequent events – Note 22
Approved by the Board of Directors
|
/s/
John M. Clark
John M. Clark
Director
|
/s/
C. Thomas Ogryzlo
C. Thomas Ogryzlo
Director
|
The accompanying notes are an integral part of these consolidated financial statements.
VISTA GOLD CORP. (An Exploration Stage Enterprise)
|
Years ended December 31,
|
Cumulative during Exploration
|
|||||||||||||||
|
(U.S. dollars in thousands, except share data)
|
2010
|
2009
|
2008
|
Stage
|
||||||||||||
|
Income:
|
||||||||||||||||
|
Gain/(loss) on disposal of marketable securities
|
$ | 281 | $ | 6,829 | $ | (98 | ) | $ | 7,343 | |||||||
|
Interest income
|
131 | 104 | 509 | 2,763 | ||||||||||||
|
Gain/(loss) on currency translation
|
112 | 118 | (351 | ) | (163 | ) | ||||||||||
|
Total other income
|
524 | 7,051 | 60 | 9,943 | ||||||||||||
|
Costs and expenses:
|
||||||||||||||||
|
Exploration, property evaluation and holding costs
|
(2,098 | ) | (1,487 | ) | (1,043 | ) | (6,423 | ) | ||||||||
|
Corporate administration and investor relations
|
(4,283 | ) | (4,595 | ) | (5,476 | ) | (28,823 | ) | ||||||||
|
Depreciation and amortization
|
(288 | ) | (262 | ) | (170 | ) | (920 | ) | ||||||||
|
Interest expense
|
(1,688 | ) | (2,320 | ) | (2,004 | ) | (6,012 | ) | ||||||||
|
Write-down of marketable securities
|
- | (123 | ) | (583 | ) | (849 | ) | |||||||||
|
Gain/(loss) on extinguishment of convertible debt
|
(1,981 | ) | 537 | - | (1,444 | ) | ||||||||||
|
Loss on sale of mineral property
|
- | (131 | ) | (132 | ) | (263 | ) | |||||||||
|
Other income/(expense)
|
168 | 99 | (11 | ) | (2,260 | ) | ||||||||||
|
Total costs and expenses
|
(10,170 | ) | (8,282 | ) | (9,419 | ) | (46,994 | ) | ||||||||
|
Loss from continuing operations before income taxes
|
(9,646 | ) | (1,231 | ) | (9,359 | ) | (37,051 | ) | ||||||||
|
Future income tax benefit/(expense)
|
32 | (711 | ) | (320 | ) | 133 | ||||||||||
|
Loss from continuing operations after income taxes
|
(9,614 | ) | (1,942 | ) | (9,679 | ) | (36,918 | ) | ||||||||
|
Loss from discontinued operations
|
- | - | (294 | ) | (16,879 | ) | ||||||||||
|
Net loss
|
$ | (9,614 | ) | $ | (1,942 | ) | $ | (9,973 | ) | $ | (53,797 | ) | ||||
|
Other comprehensive loss, net of future income tax benefit/(expense):
|
||||||||||||||||
|
Unrealized fair-value increase/(decrease) on available-for-sale securities
|
467 | 1,778 | (1,897 | ) | ||||||||||||
|
Realized (gain)/loss on available-for-sale securities
|
(246 | ) | (5,806 | ) | 83 | |||||||||||
| 221 | (4,028 | ) | (1,814 | ) | ||||||||||||
|
Comprehensive loss
|
$ | (9,393 | ) | $ | (5,970 | ) | $ | (11,787 | ) | |||||||
|
Weighted average number of shares outstanding
|
47,335,571 | 37,268,400 | 34,338,352 | |||||||||||||
|
Basic and diluted loss per share from continuing operations
|
$ | (0.20 | ) | $ | (0.05 | ) | $ | (0.28 | ) | |||||||
|
Basic and diluted loss per share
|
$ | (0.20 | ) | $ | (0.05 | ) | $ | (0.29 | ) | |||||||
The accompanying notes are an integral part of these consolidated financial statements.
VISTA GOLD CORP. (An Exploration Stage Enterprise)
CONSOLIDATED STATEMENTS OF DEFICIT
|
Years ended December 31,
|
||||||||||||
|
(U.S. dollars in thousands)
|
2010
|
2009
|
2008
|
|||||||||
|
Deficit, beginning of period
|
$ | (193,059 | ) | $ | (191,117 | ) | $ | (181,144 | ) | |||
|
Net loss
|
(9,614 | ) | (1,942 | ) | (9,973 | ) | ||||||
|
Deficit, end of period
|
$ | (202,673 | ) | $ | (193,059 | ) | $ | (191,117 | ) | |||
The accompanying notes are an integral part of these consolidated financial statements.
VISTA GOLD CORP. (An Exploration Stage Enterprise)
|
Years ended December 31,
|
Cumulative during Exploration
|
|||||||||||||||
|
(U.S. dollars in thousands)
|
2010
|
2009
|
2008
|
Stage
|
||||||||||||
|
Cash flows from operating activities:
|
||||||||||||||||
|
Loss from continuing operations after income taxes
|
$ | (9,614 | ) | $ | (1,942 | ) | $ | (9,679 | ) | $ | (36,918 | ) | ||||
|
Adjustments to reconcile loss for the period to cash provided by / (used in) operations:
|
||||||||||||||||
|
Depreciation and amortization
|
288 | 262 | 170 | 943 | ||||||||||||
|
Stock-based compensation
|
349 | 739 | 1,526 | 6,907 | ||||||||||||
|
(Gain)/loss on disposal of marketable securities
|
(281 | ) | (6,829 | ) | 98 | (7,605 | ) | |||||||||
|
Gain/(loss) on extinguishment of convertible notes
|
1,981 | (537 | ) | - | 1,444 | |||||||||||
|
Future income tax (benefit)/expense
|
(32 | ) | 711 | 320 | (133 | ) | ||||||||||
|
Accretion of convertible notes
|
811 | 1,069 | 838 | 2,718 | ||||||||||||
|
Accrued interest
|
681 | 1,251 | 1,168 | 3,100 | ||||||||||||
|
Loss on disposal of mineral property
|
- | 131 | 132 | 263 | ||||||||||||
|
Write-down of PP&E
|
5 | - | - | 5 | ||||||||||||
|
Prepaid transaction costs
|
- | - | - | 1,841 | ||||||||||||
|
Write-down of marketable securities
|
- | 123 | 583 | 849 | ||||||||||||
|
Other non-cash items
|
(38 | ) | - | - | (351 | ) | ||||||||||
| - | ||||||||||||||||
|
Change in operating assets and liabilities:
|
- | |||||||||||||||
|
Interest paid
|
(2,300 | ) | (2,944 | ) | (2,342 | ) | (7,586 | ) | ||||||||
|
Other long-term liabilities
|
(228 | ) | - | - | (228 | ) | ||||||||||
|
Other current assets
|
(575 | ) | 40 | (247 | ) | (1,346 | ) | |||||||||
|
Accounts payable, accrued liabilities and other
|
282 | 43 | (205 | ) | (556 | ) | ||||||||||
|
Net cash used in operating activities
|
(8,671 | ) | (7,883 | ) | (7,638 | ) | (36,653 | ) | ||||||||
|
Cash flows from investing activities:
|
||||||||||||||||
|
Acquisition of marketable securities
|
(294 | ) | (39 | ) | (92 | ) | (1,359 | ) | ||||||||
|
Proceeds from sale of marketable securities
|
313 | 9,055 | 105 | 10,457 | ||||||||||||
|
Additions to mineral properties, net of cost recoveries
|
(10,923 | ) | (5,210 | ) | (8,503 | ) | (36,523 | ) | ||||||||
|
Acquisition of mineral property
|
- | - | (452 | ) | (3,332 | ) | ||||||||||
|
Additions to plant and equipment
|
(354 | ) | (476 | ) | (17,971 | ) | (19,472 | ) | ||||||||
|
Proceeds on disposal of mineral property - Note 5
|
- | 188 | - | 188 | ||||||||||||
|
Proceeds on disposal of plant and equipment
|
- | - | - | 52 | ||||||||||||
|
Acquisition of short-term investments
|
250 | (250 | ) | - | - | |||||||||||
|
Cash transferred to Allied Nevada Gold Corp., net of receivable
|
- | - | - | (24,517 | ) | |||||||||||
|
Net cash provided by/(used in) investing activities
|
(11,008 | ) | 3,268 | (26,913 | ) | (74,506 | ) | |||||||||
|
Cash flows from financing activities:
|
||||||||||||||||
|
Net proceeds from equity financings - Note 8
|
33,299 | 20,378 | - | 108,086 | ||||||||||||
|
Extinguishment of convertible notes
|
(2,242 | ) | (866 | ) | - | (3,108 | ) | |||||||||
|
Proceeds from exercise of warrants
|
- | - | 2,941 | 39,020 | ||||||||||||
|
Proceeds from exercise of stock options
|
52 | 245 | 139 | 3,091 | ||||||||||||
|
Issuance of convertible notes, net of issuance costs
|
- | - | 28,345 | 28,345 | ||||||||||||
|
Prepaid transaction costs
|
- | - | - | (1,841 | ) | |||||||||||
|
Net cash provided by financing activities
|
31,109 | 19,757 | 31,425 | 173,593 | ||||||||||||
|
Increase/(decrease) in cash and cash equivalents - continuing operations
|
11,430 | 15,142 | (3,126 | ) | 62,434 | |||||||||||
|
Decrease in cash and cash equivalents - discontinued operations (Note 3)
|
- | - | (294 | ) | (23,270 | ) | ||||||||||
|
Net increase/(decrease) in cash and cash equivalents
|
11,430 | 15,142 | (3,420 | ) | 39,164 | |||||||||||
|
Cash and cash equivalents, beginning of period - continuing operations
|
28,408 | 13,266 | 16,686 | 674 | ||||||||||||
|
Cash and cash equivalents, end of period
|
$ | 39,838 | $ | 28,408 | $ | 13,266 | $ | 39,838 | ||||||||
Supplemental cash flow information – Note 16
The accompanying notes are an integral part of these consolidated financial statements.
- 130 -
VISTA GOLD CORP. (AN EXPLORATION STAGE ENTERPRISE)
NOTES TO CONSOLIDATED FINANCIAL STATEMENTS
(All amounts in tables are in thousands of US Dollars, except per share amounts and number of shares, unless noted otherwise)
1.
Nature of operations
We evaluate, acquire and explore gold exploration and potential development projects. As such, we are considered an Exploration Stage Enterprise. Our approach to acquisitions of gold projects has generally been to seek projects within political jurisdictions with well-established mining, land ownership and tax laws, which have adequate drilling and geological data to support the completion of a third-party review of the geological data and to complete an estimate of the gold mineralization. In addition, we look for opportunities to improve the value of our gold projects through exploration drilling, and/or reengineering the operating assumptions underlying previous engineering work.
We are continuing to move our more advanced projects through advanced and pre-feasibility studies in preparation for mine development so that production decisions can be made on those projects
2.
Significant accounting policies and
United States Generally Accepted Accounting Principles (“U.S. GAAP”)
United States Generally Accepted Accounting Principles (“U.S. GAAP”)
We have, since our inception, reported to security regulators in both Canada and the U.S. using Canadian GAAP financial statements with a reconciliation to U.S. GAAP. However, a change in SEC position in late 2009 required Canadian companies such as Vista Gold that do not qualify as foreign private issuers, to file their financial statements in the U.S. using U.S. GAAP after December 31, 2010. We therefore have adopted U.S. GAAP as of January 1, 2011 for all subsequent U.S. and Canadian filings. Canadian securities regulators have announced that they will continue to accept U.S. GAAP financial statements.
Significant accounting policies
|
(a)
|
Generally accepted accounting principles
|
The consolidated financial statements of Vista Gold and its subsidiaries have been prepared in accordance with accounting principles generally accepted in Canada. For the purposes of these financial statements, these principles conform, in all material respects, with generally accepted accounting principles in the United States, except as described in Note 20.
|
(b)
|
Principles of consolidation
|
The consolidated financial statements include the accounts of Vista Gold and its subsidiaries. All intercompany transactions and balances have been eliminated. Our subsidiaries and percentage ownership in these entities as of December 31, 2010 are:
|
Ownership
|
|
|
Vista Gold U.S., Inc. and its wholly-owned subsidiaries
|
100%
|
|
Vista California, LLC
|
|
|
Idaho Gold Resources LLC
|
|
|
Granges Inc. (previously called Granges (Canada) Inc.)
|
100%
|
|
Minera Paredones Amarillos Holding Corp. and its wholly-owned subsidiaries
|
100%
|
|
Servicios Administrativos MPA S.A. de C.V.
|
|
|
Servicios Industriales MPA S.A. de C.V.
|
|
|
Desarrollos Zapal S.A. de C.V. (formerly Minera Paredones Amarillos S.A. de C.V.)
|
|
|
Vista Gold (Barbados) Corp. and its wholly-owned subsidiary
|
100%
|
|
Salu Siwa Pty. Ltd and its wholly-owned subsidiary
|
|
|
PT Masmindo Dwi
|
|
|
Vista Minerals (Barbados) Corp. and its wholly-owned subsidiary
|
100%
|
|
Vista Australia Pty Ltd.
|
On February 11, 2011, we changed the name of the subsidiary Minera Paredones Amarillos Holdings Corp. to Desarrollos Zapal Holdings Corp. Also, on that same date, we formed a new subsidiary which has been named Vitliq Holdings Corp. which is wholly-owned by Vista Gold.
- 131 -
VISTA GOLD CORP. (AN EXPLORATION STAGE ENTERPRISE)
NOTES TO CONSOLIDATED FINANCIAL STATEMENTS
(All amounts in tables are in thousands of US Dollars, except per share amounts and number of shares, unless noted otherwise)
|
(c)
|
Use of estimates
|
The preparation of consolidated financial statements in accordance with generally accepted accounting principles requires management to make estimates and assumptions that affect the reported amounts of assets and liabilities and disclosure of contingent liabilities at the date of the consolidated financial statements and the reported amount of revenues and expenses during the reporting period. Significant areas requiring the use of estimates include mine closure and reclamation obligations, useful lives for asset depreciation purposes, impairment of mineral properties, the calculation of stock-based compensation, the calculation of the equity component of our Notes and the calculation of the value of warrants issued. Actual results could differ from these estimates.
|
(d)
|
Foreign currency translation
|
All of our foreign subsidiaries are considered to be integrated foreign operations. The accounts of our integrated foreign operations are translated using the temporal method. Under this method, monetary assets and liabilities are translated at the year-end rate of exchange, non-monetary assets and liabilities are translated at the rates prevailing at the respective transaction dates, and revenue and expenses, except for depreciation, are translated at the average rate of exchange during the year. Translation gains and losses are reflected in the loss for the year.
|
(e)
|
Cash and cash equivalents
|
Cash and cash equivalents include cash on hand, demand balances held with banks, and certificates of deposit all with maturities of three months or less when purchased.
|
(f)
|
Allowance for Accounts Receivable
|
We evaluate the collectability of our accounts receivables based on a combination of factors. In circumstances where we are aware of an entity’s inability to meet its financial obligations to us, we record a specific allowance for bad debts against amounts due to reduce the net recognized receivable to the amount we reasonably believe will be collected.
|
(g)
|
Marketable securities
|
All available-for-sale securities are measured at fair-value. Gains and losses associated with these available-for-sale securities are separately recorded as unrealized within other comprehensive income until such time the security is disposed of or becomes impaired, at which time any gains or losses will then be realized and reclassified to the statement of loss. All regular-way purchases of financial assets are accounted for at trade date. Transaction costs on available-for-sale financial assets are treated as part of the investment cost.
Effective September 30, 2008, we adopted the Emerging Issues Committee Abstract 172 (“EIC 172”), “Income Statement Presentation of a Tax Loss Carryforward Recognized Following an Unrealized Gain in Other Comprehensive Income.” EIC 172 provides guidance on whether the tax benefit from the recognition of previously unrecognized tax loss carryforwards consequent to the recording of unrealized gains in other comprehensive income, such as unrealized gains on available-for-sale financial assets, should be recognized in net income or in other comprehensive income. EIC 172 should be applied retrospectively, with restatement of prior periods from January 1, 2007, the date of adoption of CICA (as defined below) Section 3855, “Financial Instruments—Recognition and Measurement.”
|
(h)
|
Mineral properties
|
Mineral property acquisition costs and exploration expenditures are recorded at cost and are deferred until the viability of the property is determined. No properties have reached the development stage at this time. General overhead, administrative and holding costs to maintain a property on a care and maintenance basis are expensed in the period they are incurred. If a project is put into production, capitalized costs are depleted on the unit of production basis.
Option payments and reimbursements received are treated as a recovery of mineral property costs. Option payments are at the discretion of the optionee and accordingly are accounted for on a cash basis or when receipt is reasonably assured.
Our management regularly reviews the net carrying value of each mineral property. Where information and conditions suggest impairment, estimated future net cash flows from each property are calculated using estimated future
- 132 -
VISTA GOLD CORP. (AN EXPLORATION STAGE ENTERPRISE)
NOTES TO CONSOLIDATED FINANCIAL STATEMENTS
(All amounts in tables are in thousands of US Dollars, except per share amounts and number of shares, unless noted otherwise)
prices, proven and probable reserves and value beyond proven and probable reserves, and operating, capital and reclamation costs on an undiscounted basis. If it is determined that the future undiscounted cash flows are less than the carrying value, a write-down to the estimated fair value is made with a charge to loss for the period. Where estimates of future net cash flows are not available and where other conditions suggest impairment, management assesses if the carrying value can be recovered.
Management’s estimates of gold prices, recoverable proven and probable reserves, probable outcomes, operating capital and reclamation costs are subject to risks and uncertainties that may affect the recoverability of mineral property costs. Although management has made their best estimate of these factors based on current conditions, it is possible that changes could occur in the near term that could adversely affect management’s estimate of net cash flows expected to be generated and the need for possible asset impairment write-downs.
Although we have taken steps to verify title to mineral properties in which we have an interest, these procedures do not guarantee our title. Such properties may be subject to prior undetected agreements or transfers and title may be affected by such defects.
|
(i)
|
Property, plant and equipment
|
Property, plant and equipment are recorded at cost. Depreciation is computed using the straight-line method over the estimated useful lives of the assets, ranging primarily from three to ten years. Significant expenditures, which increase the life of an asset, are capitalized and depreciated over the remaining estimated useful life of the asset. Upon sale or retirement of assets, the costs and related accumulated depreciation or amortization are eliminated from the respective accounts and any resulting gains or losses are reflected in operations.
|
(j)
|
Asset retirement obligation and closure costs
|
The fair value of a liability for our legal obligations associated with the retirement of long-lived assets is recognized in the period in which it is incurred. The associated asset retirement costs are capitalized as part of the carrying amount of the long-lived asset unless the asset has been previously written off, in which case the amount is expensed.
The liability will be adjusted for changes in the expected amounts and timing of cash flows required to discharge the liability and accreted to the full value over time through periodic charges to income.
|
(k)
|
Loss per share
|
Loss per share is calculated by dividing the loss for the year by the weighted average number of Common Shares outstanding during the year. The effect of potential issuances of common share equivalents under options and warrants would be anti-dilutive and therefore, basic and diluted losses per share are the same.
|
(l)
|
Stock-based compensation
|
We record compensation expense on the granting of all stock-based compensation awards, including stock options grants, restricted stock units grants and restricted stock awards grants, calculated using the fair-value method. We use the Hull-White Trinomial method of determining the fair value of the stock option on the date of the grant. When an employee or non-employee is granted stock options, the fair value of the immediately vested portion is expensed and included within the stock options balance within equity. As to the options vesting, the fair-value is amortized using the straight-line method over the vesting period and expensed on a monthly basis. When an employee or non-employee exercises stock options, then the fair-value of the options on the date of the grant is transferred to common stock. When options are cancelled, the vested fair-value balance of the stock options is transferred to contributed surplus. When stock options are forfeited prior to becoming fully vested, any expense previously recorded is reversed through income. When options expire, the related fair-value is transferred to contributed surplus.
We use the intrinsic method of determining the fair value of restricted stock units and restricted stock awards on the date of grant. The fair value is amortized using the straight-line method over the vesting period and expensed on a monthly basis. On the date of vesting, the fair value of the restricted stock units or restricted stock awards on the date of grant is transferred to common stock. When restricted stock units or restricted stock awards are forfeited prior to vesting, any expense previously recorded is reversed through income.
- 133 -
VISTA GOLD CORP. (AN EXPLORATION STAGE ENTERPRISE)
NOTES TO CONSOLIDATED FINANCIAL STATEMENTS
(All amounts in tables are in thousands of US Dollars, except per share amounts and number of shares, unless noted otherwise)
|
(m)
|
Warrants
|
Warrants issued are recorded at fair value.
3.
Dispositions
Sale of Colorado Claims
On June 2, 2009, we sold most of our remaining patented mining claims in Colorado for cash proceeds of $188,000. These claims had a book value of $321,000 and upon disposition we recognized a loss of $131,000.
Disposal of Amayapampa gold project
On April 7, 2008, we announced an agreement to dispose of our wholly-owned subsidiary Vista Gold (Antigua) Corp. (“Vista Gold Antigua”) to Republic Gold Limited (“Republic”). Vista Gold Antigua indirectly held our interest in the Amayapampa gold project in Bolivia. Under the terms of the transaction, Republic agreed to pay to us, $3,000,000 in three payments of $1,000,000. The first of these payments is due and payable upon the start of Commercial Production (as defined in the purchase and sale agreement) at the Amayapampa gold project followed by $1,000,000 payments on each of the first and second anniversaries of the start of Commercial Production. In addition, Republic has agreed to pay to us a net smelter return royalty (“NSR”) on the gold produced by or on behalf of Republic from the Amayapampa gold project in varying percentages depending on the price of gold per ounce. When gold is between $500.01 and $650.00 per ounce, a 2% NSR is payable, when the price of gold is between $650.01 and $750.00 per ounce, a 3% NSR is payable, and when the price of gold is $750.01 per ounce and above, an NSR of 3.5% is payable. The NSR is capped at 720,000 gold equivalent ounces and no NSR payments are due to us if the gold price is below $500 per ounce. We retain a first right of refusal in the event Republic decides to sell the property and we also retain a right to re-acquire the property if Republic or Vista Gold Antigua have not moved to close a financing under a project financing facility within five years of the sale of Vista Gold Antigua to Republic. Under the terms of the transaction, we agreed to lend $350,000 to Republic for ongoing expenses on the Amayapampa gold project. The loan was completed on April 7, 2008. Interest on the loan accrued and was payable at the rate of 10% per annum, payable monthly. On September 30, 2008, we received $367,276 from Republic, which included the $350,000 principal amount owed and $17,276 in accrued interest.
The fair value of the consideration received on disposal of the Amayapampa gold project has been estimated at $4,813,371 and was reviewed as of December 31, 2010 using probability weighted cash flow scenarios and assumptions including future gold prices, estimated gold production and the timing of commencement of Commercial Production. These inputs in the “income approach” valuation model we used are considered to be level three unobservable inputs as defined by CICA 3862 “Financial Instruments – Disclosures”. These are our own assumptions based on our management’s best estimates and the best information available at the time.
On June 17, 2008, we issued 37,318 Common Shares with a fair value of $131,733 as a finder’s fee in respect of this transaction.
Since the Amayapampa gold project has been disposed of, the losses associated with the project have been classified as discontinued operations on the Consolidated Statement of Loss and Consolidated Statement of Cash Flows. Losses and cash flows from the Amayapampa gold project, included in discontinued operations are as follows:
|
Year Ended
December 31, 2008
|
||||
|
Costs and expenses:
|
||||
|
Exploration, property evaluation and holding costs
|
$ | (294 | ) | |
|
Impairment of mineral property
|
— | |||
|
Corporate administration, investor relations and other
|
— | |||
|
Net loss from discontinued operations
|
$ | (294 | ) | |
|
Operating activities
|
$ | (294 | ) | |
|
Financing activities
|
— | |||
|
Net decrease in cash and cash equivalents
|
$ | (294 | ) | |
- 134 -
VISTA GOLD CORP. (AN EXPLORATION STAGE ENTERPRISE)
NOTES TO CONSOLIDATED FINANCIAL STATEMENTS
(All amounts in tables are in thousands of US Dollars, except per share amounts and number of shares, unless noted otherwise)
4.
Marketable securities
|
At December 31, 2010
|
At December 31, 2009
|
|||||||||||||||||||||||
|
Cost
|
Unrealized gain/(loss)
|
Fair value
|
Cost
|
Unrealized gain/(loss)
|
Fair value
|
|||||||||||||||||||
|
Esperanza Silver Corp.
|
10 | 203 | 213 | 10 | 101 | 111 | ||||||||||||||||||
|
Black Isle Resources
|
50 | 13 | 63 | 12 | 16 | 28 | ||||||||||||||||||
|
Nevgold Resources Corp.
|
87 | 205 | 292 | 87 | 69 | 156 | ||||||||||||||||||
|
Other
|
628 | 507 | 1,135 | 365 | 490 | 855 | ||||||||||||||||||
| $ | 775 | $ | 928 | $ | 1,703 | $ | 474 | $ | 676 | $ | 1,150 | |||||||||||||
In April 2009, we sold all of our 1,529,848 shares of Allied for $9,016,088. These shares had an original cost of $2,194,397 and when sold, resulted in a realized gain of $6,821,691.
During the year ended December 31, 2009, we determined that certain of our securities had become impaired. The write-down of $123,385, less a tax benefit of $16,864, has been included in our Statement of Consolidated Earnings and Loss.
During the year ended December 31, 2008, we determined that certain of our securities had been impaired. The write-down of $583,458, less a tax benefit of $87,519, has been included in our Consolidated Statement of Loss.
5.
Mineral properties
|
2009
|
2010
|
|||||||||||||||||||||||||||||||
|
December 31, net balance
|
Acquisition costs
|
Option payments
|
Exploration & land costs
|
Capitalized interest
|
Capitalized stock based compensation
|
Year to date activity
|
December 31, ending balance
|
|||||||||||||||||||||||||
|
Long Valley, United States (a)
|
978 | - | - | 17 | - | - | 17 | 995 | ||||||||||||||||||||||||
|
Yellow Pine, United States (b)
|
984 | - | 100 | 391 | - | - | 491 | 1,475 | ||||||||||||||||||||||||
|
Concordia, Mexico (c)
|
14,650 | - | - | 3,985 | 4,000 | 97 | 8,082 | 22,732 | ||||||||||||||||||||||||
|
Guadalupe de los Reyes, Mexico (d)
|
3,275 | - | - | 4 | - | - | 4 | 3,279 | ||||||||||||||||||||||||
|
Awak Mas, Indonesia(e)
|
3,975 | - | - | 2 | - | - | 2 | 3,977 | ||||||||||||||||||||||||
|
Mt. Todd, Australia (f)
|
14,616 | - | - | 6,777 | - | 59 | 6,836 | 21,452 | ||||||||||||||||||||||||
|
Other
|
218 | - | 50 | 17 | - | - | 67 | 285 | ||||||||||||||||||||||||
| $ | 38,696 | $ | - | $ | 150 | $ | 11,193 | $ | 4,000 | $ | 156 | $ | 15,499 | $ | 54,195 | |||||||||||||||||
|
(a)
|
Long Valley
|
We entered into an option agreement on January 22, 2003, with Standard Industrial Minerals, Inc. (“Standard”), to acquire Standard’s 100% interest in the Long Valley gold project in east central California, for an aggregate purchase price of $750,000 which was paid over a five-year period, with annual payments paid as follows: $100,000 paid on each of January 15, 2003, 2004, and 2005; $200,000 paid on January 23, 2006, and $250,000 paid on January 10, 2007. Accordingly as of January 2007, we acquired 100% of the Long Valley project, which is held through our indirect wholly-owned subsidiary, Vista Gold California, LLC. Royal Gold, Inc. has a 1% net smelter returns royalty on the project.
|
(b)
|
Yellow Pine
|
On November 7, 2003, Idaho Gold Resources LLC (“Idaho Gold”), an indirect, wholly-owned subsidiary of Vista Gold entered into an Option to Purchase Agreement for a nine year option to purchase 100% of the Yellow Pine gold project for $1,000,000. Idaho Gold made an option payment of $100,000 upon execution of the agreement, an option payment of $100,000 on each of the first, second, third, fourth, fifth, sixth and seventh anniversary dates of the agreement. The agreement calls for Idaho Gold to make two more yearly payments of $100,000 on or before the anniversary date of the agreement, for a total option payment price of $1,000,000. If Idaho Gold exercises its option to purchase the project, all option payments shall be applied as a credit against the purchase price of $1,000,000. Idaho Gold has the right to terminate the agreement at any time without penalty. Eleven of the seventeen claims are subject to an underlying 5% net smelter returns royalty.
- 135 -
VISTA GOLD CORP. (AN EXPLORATION STAGE ENTERPRISE)
NOTES TO CONSOLIDATED FINANCIAL STATEMENTS
(All amounts in tables are in thousands of US Dollars, except per share amounts and number of shares, unless noted otherwise)
On December 7, 2010, we announced that we entered into a letter of intent ("LOI") with Midas Gold, Inc., a privately held company based in Spokane Valley, Washington ("Midas"), for the combination of the respective holdings of Vista Gold and Midas in the Yellow Pine – Stibnite Mining District located in Valley County, Idaho (the "District"). On February 23, 2011, we announced the execution of a combination agreement. See Section Heading “Subsequent Events,” below. The combination would also extinguish a 5.0% net smelter return royalty on Vista’s Yellow Pine gold project, which royalty is currently held by Midas.
|
(c)
|
Concordia
|
On September 7, 2010, we announced that we had changed the name of our wholly-owned Paredones Amarillos gold project to the Concordia gold project.
We acquired 100% of the Concordia gold project in Mexico from Viceroy Resource Corporation on August 29, 2002. The total acquisition cost of this project included cash payments of $786,000 for acquisition and related costs, the issuance of 303,030 equity units with a fair value of $1,212,000 and a cash payment of $320,000 on August 29, 2003.
Certain concessions on the Concordia gold project are subject to a 2% net profits interest retained by a former owner.
On February 19, 2010,
we announced that SEMARNAT had dismissed our application for the CUSF. In its dismissal, SEMARNAT had questioned the validity of the TOP issued by the General Direction of Mines in the Secretariat of Economy, which were required as part of the CUSF application. SEMARNAT also identified the need for additional technical studies. We are working to resolve deficiencies identified in SEMARNAT's dismissal of the CUSF application, and have contracted SRK Consulting (U.S.), Inc of Denver, Colorado and several Baja California Sur Academic institutions to review, analyze and validate some of the information submitted as part of the new CUSF application. This will include additional hydrogeologic studies, surface run-off calculations and a review of certain baseline environmental data. The results will be submitted as part of the amended CUSF application. Should we be unable to resolve the permitting issues, there would be significant uncertainty surrounding our ability to recover the carrying value of the Concordia gold project.
|
(d)
|
Guadalupe de los Reyes
|
On August 1, 2003, we executed an agreement to acquire a 100% interest in the Guadalupe de los Reyes gold project in Sinaloa State, Mexico and a data package associated with the project and general area, for aggregate consideration of $1.400,000 and a 2% net smelter returns royalty. During a due diligence period prior to the signing of the purchase agreement, we made payments to the owner totaling $100,000, and upon exercising its option to complete the purchase, paid an additional $200,000. On August 4, 2004, we issued 138,428 Common Shares valued at $500,000. An additional $500,000 in cash was to be paid in installments of $100,000 on each of the second through sixth anniversaries of the signing of the formal agreement, with the outstanding balance becoming due upon commencement of commercial production. Payments of $100,000 were made in each of 2005, 2006, 2007, 2008 and 2009, completing the purchase option. A 2% net smelter returns royalty is held by the previous owner and may be acquired by us at any time for $1,000,000.
On January 24, 2008, we completed the acquisition of interests in various mineral properties adjacent to our Guadalupe de los Reyes project in Mexico. Under the terms of the agreement, we; (a) paid Grandcru Resource Corporation (“Grandcru”) $377,000, net of back taxes ($365,321 after paying back taxes) on the mining concessions, and paid a private investment group known as the San Miguel Group $75,000, for total cash consideration of $452,000; and (b) issued to Grandcru and the San Miguel Group, in aggregate, our Common Shares with a value of $1,000,000 (amounting to 213,503 Common Shares) on closing. In addition, we reached an agreement with Goldcorp Inc. and its Mexican subsidiary, Desarrollos Mineros San Luis, S.A. de C.V. (together, “San Luis”), and with the San Miguel Group to complete the acquisition of their respective interests in the mining concessions at the same time as the closing occurs with Grandcru. We agreed to pay a 2% net smelter returns royalty on all minerals produced payable to the San Miguel Group on the mining concessions known as the San Miguel Concessions. We agreed to pay San Luis a 1% net smelter returns royalty on mining concessions known as the San Luis Concessions and the San Miguel Concessions, and 2% to 3% net smelter returns royalty depending on the gold price on our mining concessions known as the Gaitán Concessions. Certain of the San Luis Concessions are subject to a pre-existing underlying royalty of 3% net smelter returns royalty payable to Sanluis Corporación, S.A. de C.V.
|
(e)
|
Awak Mas
|
On April 21, 2005, we completed our acquisition of the Awak Mas gold project in Sulawesi, Indonesia, pursuant to the exercise of our option to purchase the deposit for a purchase price of $1,500,000. Under the terms of the option agreement, we had a six-month option period in which to conduct due diligence while paying the owners $15,000 per month. The monthly option payments, as well as costs of up to $150,000 expended to correct any deficiencies in asset standing, were to be credited towards the purchase price. On May 12, 2005, we transferred $1,200,000 to an escrow account. These funds were released to the ultimate vendors of the Awak Mas gold project, Weston Investments Pty Ltd (“Weston”) and Organic Resource Technology Limited (“ORT”), upon completion of the final transaction documents. The amount of $1,200,000
- 136 -
VISTA GOLD CORP. (AN EXPLORATION STAGE ENTERPRISE)
NOTES TO CONSOLIDATED FINANCIAL STATEMENTS
(All amounts in tables are in thousands of US Dollars, except per share amounts and number of shares, unless noted otherwise)
represented the $1,500,000 million purchase price less: the $150,000 deposit that we previously paid (which included $75,000 in aggregate option payments); and $150,000 we expended to correct deficiencies in asset standing.
On December 28, 2009, we announced that our wholly-owned subsidiary, Vista Gold (Barbados) Corp., signed a Joint Venture Agreement with Pan Asia Resources Corporation (“Pan Asia”) with respect to the development of the Awak Mas gold project in Indonesia.
The Joint Venture Agreement provides Pan Asia, a privately held resource development company, with the opportunity to earn a 60% interest in the Awak Mas project by: (i) expending $3 million on the project within the next 30 months (b
ecause of a delay due to a question by the Indonesian government about the project boundary lines, which has since been resolved in our favor, we agreed to extend Pan Asia’s time commitments that are in our agreement by that amount of time by approximately nine months)
; (ii) completing an environmental impact assessment and feasibility study (in compliance with National Instrument 43-101 – Standards of Disclosure for Mineral Projects), each of which is required by the Contract of Work granted by the Indonesian Government under which the Awak Mas project is held, and (iii) issuing to Vista two million shares of Pan Asia and the right to purchase up to an additional two million shares of Pan Asia in the event of an initial public offering of Pan Asia shares (on the same terms as offered under such initial public offering). Under the terms of the Joint Venture Agreement, we will retain its controlling interest in the Awak Mas gold project until Pan Asia completes the earn-in conditions described above.
|
(f)
|
Mt. Todd
|
Effective March 1, 2006, Vista Gold and its subsidiary Vista Gold Australia Pty Ltd. (“Vista Australia”) entered into agreements with Ferrier Hodgson, the Deed Administrators for Pegasus Gold Australia Pty Ltd. (“Pegasus”), the government of the Northern Territory of Australia and the Jawoyn Association Aboriginal Corporation (“JAAC”) and other parties named therein, subject to regulatory approvals, to purchase a 100% interest in the Mt. Todd gold mine (also known as the Yimuyn Manjerr gold mine) in the Northern Territory, Australia. Under these agreements, we are guarantor of the obligations of our subsidiary Vista Australia.
As part of the agreements, we agreed to pay Pegasus, AU$1,000,000 ($739,600) and receive a transfer of the mineral leases and certain mine assets; and pay the Northern Territory’s costs of management and operation of the Mt. Todd site up to a maximum of approximately AU$375,000 (approximately $277,500) during the first year of the term (initial term is five years, subject to extensions), and assume site management and pay management and operation costs in following years. Additionally, we issued Common Shares with a value of CDN$1,000,000 (amounting to 177,053 Common Shares) to the JAAC as consideration for the JAAC entering into the agreement and for rent for the use of the surface overlying the mineral leases until a decision is reached to begin production. Other agreement terms provide that we will undertake a technical and economic review of the mine and possibly form one or more joint ventures with the JAAC. In June 2006, the transactions contemplated under the agreements were completed and effective, with funds held in escrow released to the ultimate vendors and the Common Shares issued to the JAAC.
On November 30, 2010, we, and the Northern Territory government, announced that the agreement has been renewed for an additional five-year period to 2015.
6.
Property, plant and equipment
|
December 31, 2010
|
December 31, 2009
|
|||||||||||||||||||||||
|
Cost
|
Accumulated Depreciation and Write-downs
|
Net
|
Cost
|
Accumulated Depreciation and Write-downs
|
Net
|
|||||||||||||||||||
|
Concordia, Mexico
|
18,185 | 63 | 18,122 | 18,173 | 35 | 18,138 | ||||||||||||||||||
|
Awak Mas, Indonesia
|
119 | 91 | 28 | 118 | 89 | 29 | ||||||||||||||||||
|
Mt. Todd, Australia
|
1,110 | 494 | 616 | 833 | 321 | 512 | ||||||||||||||||||
|
Corporate, United States
|
355 | 312 | 43 | 311 | 243 | 68 | ||||||||||||||||||
| $ | 19,769 | $ | 960 | $ | 18,809 | $ | 19,435 | $ | 688 | $ | 18,747 | |||||||||||||
On January 7, 2008, we entered into an agreement with A.M. King Industries, Inc. (“A.M. King”) and Del Norte Company Ltd., a wholly-owned subsidiary of A.M. King, to purchase gold processing equipment to be used at our Concordia gold project. The aggregate purchase price was approximately $16,000,000. The purchase price includes the cost of relocating the equipment to Edmonton, Alberta, Canada. We are responsible for the reconditioning and transportation of the equipment from Edmonton to the Concordia gold project. The equipment includes a 10,000 tonne per day semi-autogenous grinding mill, two ball mills, gyratory crusher and a shorthead cone crusher, along with other related components, spare parts and other process plant equipment. On April 17, 2008, we announced that we had finalized the purchase of the gold
- 137 -
VISTA GOLD CORP. (AN EXPLORATION STAGE ENTERPRISE)
NOTES TO CONSOLIDATED FINANCIAL STATEMENTS
(All amounts in tables are in thousands of US Dollars, except per share amounts and number of shares, unless noted otherwise)
processing equipment, with the conclusion on that date of the transportation of the major equipment items to our lay-down yard in Edmonton. Currently, the equipment is being stored in Edmonton and Calgary, Canada.
On December 10, 2008, we completed a transaction to purchase the land needed for a desalination plant for the Concordia gold project. The purchase price of the land was 5,648,740 pesos, which was equivalent to $422,878 on the purchase date and was paid in full in cash on the purchase date. On December 23, 2008, we entered into an agreement to purchase approximately 1,236 acres of land for the mill site and other infrastructure. The purchase price of the land was 6,000,000 pesos, which was equivalent to $456,274 on the purchase date. We paid $228,136, which was half of the total purchase price, on the date of purchase and we paid the remaining $228,136 on October 18, 2010.
7.
Brokered private placement of convertible notes
On March 4, 2008, we completed a private placement in which we issued and sold $30,000,000 in aggregate principal amount of senior secured convertible notes (the “Notes”). The Notes were issued on March 4, 2008 and mature at face value on March 4, 2011 (the “Maturity Date”). The Notes pay interest of 10% per annum. Interest is payable each year in two installments on June 15 and December 15, and the principal is payable on the Maturity Date.
The Notes are convertible at the holder’s or issuer’s discretion in accordance with the terms of the Notes. The holder can convert all or part of the debt underlying the Notes at any time prior to the Maturity Date or the business day immediately preceding the Redemption Date (as defined below) at a price of $6.00 per Common Share (subsequently adjusted to $4.80 per Common Share, as discussed below), subject to adjustment in certain circumstances. The “Redemption Date” represents the date that the Notes will be redeemed in the event that we redeem the Notes.
Pursuant to the terms of the Notes, on March 4, 2009, the conversion price of the Notes was automatically adjusted from $6.00 per Common Share to $4.80 per Common Share. As of December 31, 2010, our Common Share price was below the $4.80 conversion price.
Simultaneously with the issuance of the Notes, we issued to Casimir Capital LP 200,000 Common Share purchase warrants with an exercise price of $6.00 per warrant and an expiration date of March 4, 2011, as partial consideration for acting as agent for the transaction. We also paid to Casimir Capital LP a cash fee of $1,200,000, being 4% of the gross proceeds of the offering of the Notes. The warrants provide for cashless exercise if the market price of our Common Shares is above the exercise price of the warrants. In addition, the exercise price is subject to standard anti-dilution adjustment provisions.
The Notes have been accounted for in accordance with Emerging Issues Committee Abstract No. (“EIC”) 164, “Convertible and other Debt Instruments with Embedded Derivatives”. Under EIC 164, the fair value of the conversion feature is recorded as equity. The issuance date fair value of the conversion feature was estimated to be $6,755,000 and was classified as the equity component of convertible notes with the residual balance of $23,245,000 being recorded as the fair value of our obligation to make principal and interest payments and has been classified as long-term debt. The total fees of $1,988,444 related to the issuance of the Notes were allocated pro-rata between debt issuance costs of $1,531,102 and equity issuance costs of $457,342.
On July 14, 2009, we entered into Note Repurchase Agreements (the “Whitebox Repurchase Agreements”) with each of Whitebox Combined Partners, LP (“Whitebox Combined Partners”), Whitebox Convertible Arbitrage Partners, LP (“Whitebox Convertible Arbitrage”) and Whitebox Special Opportunities Fund Series B Partners, LP (“Whitebox Special Opportunities”) whereby we agreed to repurchase their respective Notes.
Pursuant to the Whitebox Repurchase Agreements, we agreed to repurchase $1,333,000 (carrying value of $1,102,932) Notes (i) in the principal amount of $504,000 from Whitebox Combined Partners for an aggregate purchase price, including interest, of $331,800; (ii) in the principal amount of $510,000 from Whitebox Convertible Arbitrage for an aggregate purchase price, including interest, of $335,750; and (iii) in the principal amount of $319,000 from Whitebox Special Opportunities for an aggregate purchase price, including interest, of $210,008, based on a settlement date of July 14, 2009. We allocated the consideration paid on the repurchase of the Notes to the liability and equity elements of the security based on their relative fair values at the date of the transaction as is required under EIC 96, “Accounting for the Early Extinguishment of Convertible Securities Through (1) Early Redemption or Repurchase and (2) Induced Early Conversion,” ("EIC 96"). A gain of $536,629 was recorded in our Consolidated Statement of Earnings and (Loss) as a result of the Notes repurchase.
- 138 -
VISTA GOLD CORP. (AN EXPLORATION STAGE ENTERPRISE)
NOTES TO CONSOLIDATED FINANCIAL STATEMENTS
(All amounts in tables are in thousands of US Dollars, except per share amounts and number of shares, unless noted otherwise)
On May 20, 2010, we entered into a Notes Repurchase Agreement (the “Agreement”) with Whitebox Advisors LLC (“Whitebox”) whereby we agreed to repurchase Whitebox’s remaining Notes.
Pursuant to the Agreement, we agreed to repurchase Notes in the principal amount of $5,667,000 (carrying value of $5,155,989) and to settle interest payable through maturity on the Notes of $690,572. We agreed to pay Whitebox $2,232,798 in cash and to issue 1,902,684 Common Shares to Whitebox as consideration for the Notes and interest payable of $6,357,572, in aggregate. We allocated the consideration paid on the repurchase of the Notes to the liability and equity elements of the security based on their relative fair values at the date of the transaction as is required under EIC 96. A loss of $1,981,103 was recorded in our Consolidated Statement of Loss as a result of the Notes repurchase. As a result of the completion of the Agreement, 4.791,667 Common Shares are issuable upon conversion of the remaining Notes.
We capitalize interest and accretion based on expenditures on qualifying assets. As of December 31, 2010, we had qualifying expenditures of approximately $17,476,582 related to the equipment purchase and drilling expenditures for the Concordia gold project. As of December 31, 2009, we had utilized all the cash received for the Concordia gold project. A reconciliation of the carrying value of the long-term liability portion of the Notes is as follows:
|
Principal amount of the Notes
|
$ | 30,000 | ||
|
Issuance costs allocated to long-term liabilities
|
(1,531 | ) | ||
|
Conversion feature allocated to equity before issuance costs
|
(6,755 | ) | ||
|
Carrying value of the Notes upon issuance
|
21,714 | |||
|
Repurchase of $1.3 million of convertible notes
|
(1,103 | ) | ||
|
Repurchase of $5.7 million of convertible notes
|
(5,156 | ) | ||
|
Accretion expense
|
7,050 | |||
|
Carrying value of the Notes at December 31, 2010
|
$ | 22,505 |
On March 4, 2011, the Notes reached maturity. See Section Heading “Subsequent Events,” below.
- 139 -
VISTA GOLD CORP. (AN EXPLORATION STAGE ENTERPRISE)
NOTES TO CONSOLIDATED FINANCIAL STATEMENTS
(All amounts in tables are in thousands of US Dollars, except per share amounts and number of shares, unless noted otherwise)
8.
Capital stock
Common Shares issued and outstanding
|
Number of shares issued
|
Capital stock
|
|||||||
|
As of December 31, 2007
|
33,257,906 | $ | 220,772 | |||||
|
Warrants exercised from February 2006 private placement (c)
|
928,390 | 2,941 | ||||||
|
Shares issued for acquisition of gold properties (a)
|
213,503 | 1,000 | ||||||
|
Shares issued for services (b)
|
37,318 | 132 | ||||||
|
Exercise of stock options, cash - Note 9
|
38,712 | 139 | ||||||
|
Exercise of stock options, fair value - Note 9
|
- | 114 | ||||||
|
Issued during 2008
|
1,217,923 | 4,326 | ||||||
|
As of December 31, 2008
|
34,475,829 | $ | 225,098 | |||||
|
Public offering (d)
|
8,800,000 | 17,639 | ||||||
|
Over-allotment (d)
|
1,320,000 | 2,739 | ||||||
|
Exercise of stock options, cash - Note 9
|
83,195 | 245 | ||||||
|
Exercise of stock options, fair value - Note 9
|
- | 243 | ||||||
|
Issued during 2009
|
10,203,195 | 20,866 | ||||||
|
As of December 31, 2009
|
44,679,024 | $ | 245,964 | |||||
|
Early extinguishment of convertible notes - Note 7
|
1,581,488 | 5,491 | ||||||
|
Interest payment on extinguished convertible notes - Note 7
|
321,196 | 604 | ||||||
|
Private placement October 2010, net (e)
|
15,308,044 | 22,689 | ||||||
|
Exercise of stock options, cash - Note 9
|
30,000 | 52 | ||||||
|
Exercise of stock options, fair value - Note 9
|
- | 29 | ||||||
|
Issued during 2010
|
17,240,728 | 28,865 | ||||||
|
As of December 31, 2010
|
61,919,752 | $ | 274,829 | |||||
- 140 -
VISTA GOLD CORP. (AN EXPLORATION STAGE ENTERPRISE)
NOTES TO CONSOLIDATED FINANCIAL STATEMENTS
(All amounts in tables are in thousands of US Dollars, except per share amounts and number of shares, unless noted otherwise)
|
(a)
|
Common Shares issued for acquisition of gold properties, net
|
On January 24, 2008, we issued 213,503 Common Shares with a value of $1,000,000 to Grandcru Resources Corporation and a private investor group known as the San Miguel Group, as partial consideration for our acquisition of Grandcru’s interest in two gold/silver mineral properties adjacent to our Guadalupe de los Reyes property (note 5(d)).
|
(b)
|
Common Shares issued for services, net
|
In compensation for the advisory services provided by Prime Corporate Finance (“PCF”) in connection with the disposal of the Amayapampa project, we agreed to pay PCF a success fee of 5% of the face value of any completed transaction. On April 8, 2008, PCF and Vista Gold agreed that the success fee would be payable in our Common Shares. Based on the market price of our Common Shares at the close of business on April 7, 2008 of Cdn. $4.47 per Common Share, 37,318 Common Shares were issuable to PCF. Completion of the issuance of the 37,318 Common Shares occurred on June 17, 2008, at which time the Common Shares had a fair value of $131,733.
|
(c)
|
Warrants exercised from February 2006 private placement
|
On February 2, 2006, we completed a non-brokered private placement financing in which we sold and issued a total of 649,684 units (the “Units”), at a price of $5.05 per Unit for aggregate gross proceeds of $3,280,904. We received net cash proceeds after costs of $66,112 for subsequent registration for resale under the Securities Act of the Common Shares issued in the private placement and the Common Shares issuable upon exercise of the warrants, and legal expenses of $30,719, were $3,184,073. Each Unit consisted of one Common Share and one Common Share purchase warrant entitling the holder to acquire an additional Common Share of Vista Gold at an exercise price of $6.00 for a period of two years from the date of issue. Upon completion of the Arrangement Agreement, the number of shares to be issued in connection with the outstanding warrants was adjusted so that each warrant entitled the holder thereof upon exercise to receive 1.894 Common Shares per warrant (see Note 9).
During the year ended December 31, 2008, 928,390 Common Shares were issued upon exercise of the February 2006 private placement warrants for gross proceeds of $2,941,000.
|
(d)
|
Public Offering and Over Allotment, September 2009
|
On September 21, 2009, we completed a public offering of Common Shares pursuant to a shelf registration statement previously filed with the United States Securities and Exchange Commission (the “SEC”) and a shelf prospectus previously filed with certain Canadian securities regulatory authorities. We offered and sold 8,800,000 Common Shares to Dahlman Rose & Company and Wellington West Capital Markets, as underwriters, at a price of $2.25 per Common Share. We granted the underwriters a 30-day option to purchase up to 1,320,000 additional Common Shares to cover over-allotments, if any. We received proceeds from the public offering, net of commissions, fees and expenses, of $17,630,313.
On September 25, 2009, we completed the closing of the sale of 1,320,000 Common Shares, pursuant to the underwriters' exercise of the over-allotment option. Consistent with the public offering of Common Shares that closed on September 21, 2009, the 1,320,000 Common Shares were sold to Dahlman Rose & Company and Wellington West Capital Markets, as underwriters, at the public offering price of $2.25 per Common Share. The over-allotment was made pursuant to our shelf registration statement filed with the SEC and a shelf prospectus filed with certain Canadian securities regulatory authorities. With the sale of the additional 1,320,000 Common Shares to the underwriters, 10,120,000 Common Shares in total were sold in connection with the offering. We received proceeds from the over-allotment, net of commissions, of $2,738,753.
|
(e)
|
Private Placement October 2010
|
On October 22, 2010 we closed our private placement of Special Warrants. We issued an aggregate of 14,666,739 Special Warrants at $2.30 per Special Warrant, for gross proceeds of $33,733,500. The proceeds from the financing were placed into an escrow account with a Canadian financial institution and upon receipt of Shareholders’ Approval (as defined below), the proceeds were released to us.
Upon receipt of our shareholders’ approval of the private placement (“Shareholders’ Approval”) on December 15,
2010,
- 141 -
VISTA GOLD CORP. (AN EXPLORATION STAGE ENTERPRISE)
NOTES TO CONSOLIDATED FINANCIAL STATEMENTS
(All amounts in tables are in thousands of US Dollars, except per share amounts and number of shares, unless noted otherwise)
the Special Warrants were automatically exercised, for no additional consideration, for one Common Share of Vista and one Common Share purchase warrant (a “Warrant”.) Each Warrant is exercisable over a five-year period from the closing of the private placement, to purchase one Common Share (a “Warrant Share”) at a purchase price of $3.50 during the first year, $4.00 during the second year, $4.50 during the third year and $5.00 thereafter until the expiry of the Warrant. If the closing price of the Common Shares on the NYSE Amex Equities Stock Exchange is at least 35% above the current Exercise Price of the Warrants for a period of 15 consecutive trading days, then we will have the option to request that the Warrants be exercised. If the Warrants are not exercised within 25 business days following this request, they will be cancelled.
Cash proceeds to Vista from the private placement, net of cash expenses of $659,229, were $33,074,271 and were allocated to the Common Shares and warrants, pro rata, using the market value of the shares and the fair value of the warrants (see Note 9). As a result, Common Shares increased by $23,116,992. We agreed to pay fees in respect of subscriptions from investors introduced to us by a finder in the United States and an agent and finder in Canada. The fees were payable in that number of Special Warrants equal to 5% of the number of Special Warrants purchased by investors introduced by that finder or agent. In addition, the finders and the agents were issued the number of compensation warrants equal to 5% of the Special Warrants sold to purchasers introduced by that finder or agent pursuant to the private placement with each compensation warrant being exercisable for two years from the closing of the private placement, to acquire one Common Share at a price of $2.30 per Common Share. As a result, Vista issued 641,305 Special Warrants and 630,436 compensation warrants to the agents and finders. Vista recognized non-cash expense related to these Special Warrants and compensation warrants of $1,475,002 and $611,726, respectively, which was allocated pro rata between the Common Share and warrant components of the units.
Upon Shareholder Approval, the Special Warrants issued to the finders and agents were automatically exercised and each Special Warrant holder received one warrant and one Common Share per Special Warrant.
The value of the Common Shares that was recorded was $1,030,940. The amount allocated as cost of equity related to the Special Warrants and compensation warrants issued to agents and finders was $1,458,501. See Note 9 below.
- 142 -
VISTA GOLD CORP. (AN EXPLORATION STAGE ENTERPRISE)
NOTES TO CONSOLIDATED FINANCIAL STATEMENTS
(All amounts in tables are in thousands of US Dollars, except per share amounts and number of shares, unless noted otherwise)
9.
Warrants
Further to Note 8, warrants granted and outstanding are summarized in the following table:
|
Warrants granted
|
Valuation
|
Warrants exercised
|
Warrants expired
|
Warrants outstanding
|
Weighted average exercise prices
|
Expiry date
|
Weighted average remaining life (yrs)
|
||||||||||||||||||||||
|
As of December 31, 2007
|
12,208,917 | 531 | (11,193,666 | ) | (337,163 | ) | 678,089 | 6.68 | |||||||||||||||||||||
|
Private placement February 2006
(1)
|
- | - | (490,175 | ) | (4,509 | ) | (494,684 | ) | 6.00 |
Feb-08
|
- | ||||||||||||||||||
|
Convertible notes broker warrants
(2)
|
200,000 | 336 | - | - | 200,000 | 6.00 |
Mar-11
|
0.2 | |||||||||||||||||||||
|
Public offering broker warrants November 2006
|
(531 | ) | - | (183,405 | ) | (183,405 | ) | 8.50 |
Nov-08
|
- | |||||||||||||||||||
|
As of December 31, 2008
|
12,408,917 | 336 | (11,683,841 | ) | (525,077 | ) | 200,000 | 6.00 | |||||||||||||||||||||
|
As of December 31, 2009
|
12,408,917 | 336 | (11,683,841 | ) | (525,077 | ) | 200,000 | 6.00 | |||||||||||||||||||||
|
Private placement October 2010
(2)
|
14,666,739 | 9,329 | - | - | 14,666,739 | 3.50 |
Oct-15
|
4.8 | |||||||||||||||||||||
|
Finders' and agents' Special Warrants October 2010
(2)
|
641,305 | 444 | - | - | 641,305 | 3.50 |
Oct-15
|
4.8 | |||||||||||||||||||||
|
Finders' and agents' compensation warrants October 2010
(2)
|
630,436 | 612 | - | - | 630,436 | 2.30 |
Oct-12
|
1.8 | |||||||||||||||||||||
|
As of December 31, 2010
|
28,347,397 | 10,721 | (11,683,841 | ) | (525,077 | ) | 16,138,480 | 3.48 | |||||||||||||||||||||
|
(1)
|
Each warrant entitled the holder to purchase Common Shares as adjusted in accordance with the warrant terms pursuant to the previously announced Arrangement transaction involving the Corporation, Allied and Carl and Janet Pescio that closed on May 10, 2007.
|
|
(2)
|
Each warrant entitles the holder to purchase one Common Share. See Note 8.
|
- 143 -
VISTA GOLD CORP. (AN EXPLORATION STAGE ENTERPRISE)
NOTES TO CONSOLIDATED FINANCIAL STATEMENTS
(All amounts in tables are in thousands of US Dollars, except per share amounts and number of shares, unless noted otherwise)
As discussed in Note 8, above, we completed a private placement financing in October 2010 in which we issued 14,666,739 Special Warrants. Upon receipt of shareholder approval of the private placement, each Special Warrant was automatically exercised for one Common Share and on Common Share purchase warrant. The net cash proceeds of $33,074,271 from the private placement were allocated to Common Shares and warrants, pro rata, using the market value of the Common Shares and the fair value of the warrants. As a result warrants increased by $9,957,279.
The fair value of the warrants was determined using the Black-Scholes model with the following weighted-average assumptions:
|
Expected volatility
|
65 | % | ||
|
Risk-free interest rate
|
2.11 | % | ||
|
Expected lives (years)
|
5 | |||
|
Dividend yield
|
N/A |
As discussed in Note 8, above, we agreed to pay fees in respect of subscriptions from investors introduced to us by a finder in the United States and an agent and finder in Canada. The fair value of the Special Warrants issued to the finders and agents and the fair value of the compensation warrants issued to the finders and agents was allocated pro rata to the Common Share and warrant components of the units. As such, warrants were reduced by $628,226.
The fair value of the Special Warrants issued to the agents and finders was determined using the Black-Scholes model above. The fair value of the compensation warrants issued to the finders and agents was determined using the Black Scholes model with the following weighted-average assumptions:
|
Expected volatility
|
65 | % | ||
|
Risk-free interest rate
|
0.68 | % | ||
|
Expected lives (years)
|
2 | |||
|
Dividend yield
|
N/A |
Upon completion of the Arrangement Agreement with Allied Nevada Gold Corp., the number of Common Shares to be issued in connection with the outstanding warrants was adjusted so that each warrant entitles the holder thereof upon exercise to receive 1.894 Common Shares per warrant for the February 2006 private placement warrants.
VISTA GOLD CORP. (AN EXPLORATION STAGE ENTERPRISE)
NOTES TO CONSOLIDATED FINANCIAL STATEMENTS
(All amounts in tables are in thousands of US Dollars, except per share amounts and number of shares, unless noted otherwise)
10.
Stock-based compensation
A summary of the fair value of all awards issued under Vista’s stock compensation plans included within Shareholders’ Equity is as follows:
|
December 31,
|
December 31,
|
December 31,
|
||||||||||
|
2010
|
2009
|
2008
|
||||||||||
|
Stock options
|
4,455 | 4,818 | 4,634 | |||||||||
|
Restricted stock units
|
125 | - | - | |||||||||
| $ | 4,580 | $ | 4,818 | $ | 4,634 | |||||||
Stock Option Plan
Under our Stock Option Plan (the “Plan”), we may grant options to our directors, officers, employees and consultants of our subsidiaries. The maximum number of our Common Shares that may be reserved for issuance under the Plan, together with those reserved for issuance under the LTIP (as discussed below), is a variable number equal to 10% of the issued and outstanding Common Shares on a non-diluted basis. Under the Plan, the exercise price of each option shall not be less than the market price of our Common Shares on the date preceding the date of grant, and an option’s maximum term is 10 years or such other shorter term as stipulated in a stock option agreement between us and the optionee. Options under the Plan are granted from time to time at the discretion of the Board of Directors, with vesting periods and other terms as determined by the Board.
The fair value of stock options granted to employees, directors and consultants was estimated at the grant date using the Hull-White trinomial lattice option pricing model, using the following weighted average assumptions:
|
Years Ended December 31,
|
||||||||||||
|
2010
|
2009
|
2008
|
||||||||||
|
Expected volatility
|
81.86 - 82.88 | % | 76.42 - 78.80 | % | 53.97% - 55.19 | % | ||||||
|
Risk-free interest rate
|
1.51% - 2.88 | % | 1.80 - 2.58 | % | 3.09% - 3.25 | % | ||||||
|
Expected lives (years)
|
5 | 5 | 5 | |||||||||
|
Dividend yield
|
N/A | N/A | N/A | |||||||||
Option pricing models require the input of highly subjective assumptions including the expected price volatility. Expected price volatility is based on the historical volatility of our Common Shares. Changes in the subjective input assumptions can materially affect the fair value estimate. The expected term of the options granted is derived from the output of the option pricing model and represents the period of time that the options granted are expected to be outstanding. The risk-free rate for the periods within the contractual term of the option is based on the U.S. Treasury yield curve in effect at the date of grant.
- 145 -
VISTA GOLD CORP. (AN EXPLORATION STAGE ENTERPRISE)
NOTES TO CONSOLIDATED FINANCIAL STATEMENTS
(All amounts in tables are in thousands of US Dollars, except per share amounts and number of shares, unless noted otherwise)
A summary of option activity under the Stock Option Plan as of December 31, 2010, and changes during the period then ended is set forth in the following table:
|
Number of Shares
|
Weighted-Average Exercise Price
|
Weighted-Average Remaining Contractual Term
|
Aggregate Intrinsic Value
|
|||||||||||||
|
Outstanding - December 31, 2007
|
1,630,213 | $ | 4.99 | 3.71 | $ | 1,112 | ||||||||||
|
Granted
|
830,000 | 3.26 | ||||||||||||||
|
Exercised
|
(38,712 | ) | 3.58 | |||||||||||||
|
Forfeited
|
(40,000 | ) | 5.66 | |||||||||||||
|
Cancelled
|
(111,393 | ) | 4.36 | |||||||||||||
|
Expired
|
(85,361 | ) | 3.32 | |||||||||||||
|
Outstanding - December 31, 2008
|
2,184,747 | $ | 4.39 | 3.55 | $ | - | ||||||||||
|
Granted
|
860,000 | 1.84 | ||||||||||||||
|
Exercised
|
(83,195 | ) | 2.95 | |||||||||||||
|
Forfeited
|
(2,500 | ) | 3.22 | |||||||||||||
|
Cancelled
|
(7,500 | ) | 4.13 | |||||||||||||
|
Expired
|
(163,407 | ) | 2.79 | |||||||||||||
|
Outstanding - December 31 2009
|
2,788,145 | $ | 3.75 | 3.43 | $ | 534 | ||||||||||
|
Granted
|
165,000 | 2.59 | ||||||||||||||
|
Exercised
|
(30,000 | ) | 1.77 | |||||||||||||
|
Cancelled
|
(325,000 | ) | 5.07 | |||||||||||||
|
Expired
|
(9,484 | ) | 2.15 | |||||||||||||
|
Outstanding - December 31 2010
|
2,588,661 | $ | 3.55 | 2.90 | $ | 463 | ||||||||||
|
Exercisable - December 31, 2010
|
2,506,161 | $ | 3.58 | 2.83 | $ | 458 | ||||||||||
- 146 -
VISTA GOLD CORP. (AN EXPLORATION STAGE ENTERPRISE)
NOTES TO CONSOLIDATED FINANCIAL STATEMENTS
(All amounts in tables are in thousands of US Dollars, except per share amounts and number of shares, unless noted otherwise)
A summary of the movements included in stock-based compensation related to stock options within Shareholders’ Equity as of December 31, 2010, and during the periods then ended is set forth in the following table:
|
Fair Value
|
||||
|
As of December 31, 2007
|
$ | 3,824 | ||
|
Granted
|
544 | |||
|
Exercised
|
(114 | ) | ||
|
Forfeited
|
(83 | ) | ||
|
Cancelled
|
(341 | ) | ||
|
Expired
|
(261 | ) | ||
|
Expensed
|
1,065 | |||
|
As of December 31, 2008
|
$ | 4,634 | ||
|
Granted
|
343 | |||
|
Capitalized as mineral property
|
149 | |||
|
Exercised
|
(243 | ) | ||
|
Forfeited
|
(2 | ) | ||
|
Cancelled
|
(14 | ) | ||
|
Expired
|
(447 | ) | ||
|
Expensed
|
398 | |||
|
As of December 31, 2009
|
$ | 4,818 | ||
|
Granted
|
77 | |||
|
Capitalized as mineral property
|
114 | |||
|
Exercised
|
(27 | ) | ||
|
Cancelled
|
(699 | ) | ||
|
Expired
|
(20 | ) | ||
|
Expensed
|
192 | |||
|
As of December 31, 2010
|
$ | 4,455 | ||
The total number of options outstanding at December 31, 2010 is 2,588,661 with exercise prices ranging from approximately $1.77 to $7.74 and remaining lives of 0.43 to 5.21 years. The total number of options outstanding represents 4.2% of issued capital.
Compensation expense with a fair value of $270,340 was recognized during the year ended December 31, 2010, for options previously granted and vesting over time. During the years ended December 31, 2009 and 2008, compensation expense with fair values of $398,295 and $1,064,930, respectively, was recognized for options previously granted and vesting over time.
Under the Plan, 165,000 stock options, which will vest over a period of two years (82,500 in each year), were granted to our employees and consultants during the year ended December 31, 2010. The 82,500 immediately vested options had a fair value of $111,760, which was split between a non-cash compensation expense of $76,785 and capitalized mineral property costs of $34,975. The weighted-average grant date fair value of the 165,000 options granted during the year ended December 31, 2010 was $1.36.
Under the Plan, 860,000 stock options, which will vest over a period of two years (430,000 in each year), were granted to our employees, directors and consultants during the year ended December 31, 2009. The 430,000 immediately vested options had a fair value of $397,754, which was split between a non-cash compensation expense of $342,507 and capitalized mineral property costs of $55,247. The weighted-average grant date fair value of the 860,000 options granted during the year ended December 31, 2009 was $0.93.
- 147 -
VISTA GOLD CORP. (AN EXPLORATION STAGE ENTERPRISE)
NOTES TO CONSOLIDATED FINANCIAL STATEMENTS
(All amounts in tables are in thousands of US Dollars, except per share amounts and number of shares, unless noted otherwise)
Under the Plan, 830,000 stock options, which will vest over a period of two years (415,000 in each year), were granted to our employees, directors and consultants during the year ended December 31, 2008. The fair value of the 415,000 options immediately vested has been recorded as a non-cash compensation expense of $544,365. The weighted-average grant date fair value of the 830,000 options granted during the year ended December 31, 2008 was $1.32.
During the year ended December 31, 2010, 30,000 options were exercised. These options had an aggregate intrinsic value as of December 31, 2010 of $18,600. During the respective years ended December 31, 2009 and 2008, 83,195 and 38,712 options, respectively, were exercised. There was no intrinsic value associated with the options exercised in the 2009 and 2008 periods.
A summary of the status of our unvested stock options as of December 31, 2010, and changes during the period then ended, is set forth below:
|
Number of Shares
|
Weighted-Average Grant Date Fair Value
|
|||||||
|
Unvested - December 31, 2007
|
513,972 | $ | 2.64 | |||||
|
Granted
|
415,000 | 1.32 | ||||||
|
Vested
|
(478,972 | ) | 2.49 | |||||
|
Forfeited
|
(35,000 | ) | 2.69 | |||||
|
Unvested - December 31, 2008
|
415,000 | $ | 1.32 | |||||
|
Granted
|
430,000 | 0.92 | ||||||
|
Vested
|
(412,500 | ) | 1.32 | |||||
|
Forfeited
|
(2,500 | ) | 1.30 | |||||
|
Unvested - December 31, 2009
|
430,000 | $ | 0.92 | |||||
|
Granted
|
82,500 | $ | 1.36 | |||||
|
Vested
|
(430,000 | ) | $ | 0.92 | ||||
|
Unvested - December 31, 2010
|
82,500 | $ | 1.36 | |||||
As of December 31, 2010, there was $81,289 of unrecognized compensation expense related to the unvested portion of options outstanding. This expense is expected to be recognized over a weighted-average period of 0.81 years.
Long-term equity incentive plan
In May 2010, our shareholders approved the Long Term Equity Incentive Plan (the “LTIP”), effective March 8, 2010 (“Effective Date”). Under the LTIP we may grant Restricted Stock Units (“RSU awards”) or Restricted Stock Awards (“RSA awards”) to the directors, officers, employees and consultants of Vista Gold and our subsidiaries. The maximum number of our Common Shares that may be reserved for issuance under the LTIP, together with those reserved for issuance under the Plan (as discussed above), is a variable number equal to 10% of the issued and outstanding Common Shares on a non-diluted basis. The total number of Common Shares issuable to our insiders at any time and issued to our insiders within any one year period under the LTIP, together with any stock options issued under the Plan, shall not exceed 10% of the issued and outstanding Common Shares on a non-diluted basis. The total number of Common Shares issuable to a director under the LTIP shall not exceed the lesser of: (i) 1% of the issued and outstanding Common Shares; and (ii) an annual award value of $100,000 per director.
The LTIP is administered by the Board of Directors, which can delegate the administration to the Compensation
- 148 -
VISTA GOLD CORP. (AN EXPLORATION STAGE ENTERPRISE)
NOTES TO CONSOLIDATED FINANCIAL STATEMENTS
(All amounts in tables are in thousands of US Dollars, except per share amounts and number of shares, unless noted otherwise)
Committee or to such other officers and employees of Vista Gold as designated by the Board of Directors. The Board of Directors will determine the persons to whom awards are made, set the size, type, terms and conditions of the awards, fix the prices (if any) to be paid for the award, interpret the LTIP, adopt, amend and rescind and take all other actions it believes are necessary or advisable for the implementation and administration of the LTIP.
Restricted stock units
The estimated fair value of each of our RSU awards was determined on the date of grant based on the closing market price of our Common Shares on the date of grant.
A summary of the RSU activity under the LTIP as of December 31, 2010, and changes during the period then ended is set forth in the following table:
|
Number of Units
|
Weighted-Average Grant Date Fair Value
|
|||||||
|
Unvested - December 31, 2009
|
- | $ | - | |||||
|
Granted
|
175,500 | 2.37 | ||||||
|
Unvested - December 31, 2010
|
175,500 | $ | 2.37 | |||||
On September 13, 2010, we granted 175,500 RSU awards to employees, directors and consultants of Vista. The market price on the date of grant was $2.37. All of the RSU awards granted vest on the one-year anniversary of the grant date and upon vesting, a holder of an RSU award will receive one Common Share, for no additional consideration, for each RSU award held.
A summary of the fair-value changes included in stock compensation within Shareholders’ Equity as of December 31, 2010 is set forth in the following table:
|
Fair Value
|
||||
|
As of December 31, 2009
|
$ | - | ||
|
Expensed
|
80 | |||
|
Capitalized as mineral properties
|
45 | |||
|
As of December 31, 2010
|
$ | 125 | ||
As of December 31, 2010, there was $290,585 of unrecognized compensation expense related to the unvested RSU awards outstanding. This expense is expected to be recognized over a weighted-average period of 0.70 years
- 149 -
VISTA GOLD CORP. (AN EXPLORATION STAGE ENTERPRISE)
NOTES TO CONSOLIDATED FINANCIAL STATEMENTS
(All amounts in tables are in thousands of US Dollars, except per share amounts and number of shares, unless noted otherwise)
11.
Contributed surplus
|
For the years ended December 31,
|
||||||||||||
|
2010
|
2009
|
2008
|
||||||||||
|
Balance, beginning of year
|
$ | 1,848 | $ | 1,387 | $ | 253 | ||||||
|
Cancelled options—Note 10
|
699 | 14 | 341 | |||||||||
|
Expired options—Note 10
|
20 | 447 | 262 | |||||||||
|
Early extinguishment of convertible notes
|
766 | - | - | |||||||||
|
Expired warrants — Note 9
|
- | - | 531 | |||||||||
|
Balance, end of year
|
$ | 3,333 | $ | 1,848 | $ | 1,387 | ||||||
On May 20, 2010, we completed the Agreement to repurchase Notes in the principal amount of $5,667,000 and interest payable through maturity of $690,572 (see Note 8). Upon completion of the Agreement, the carrying value of the equity portion of the extinguished Notes exceeded the fair value of the equity portion by $766,380 resulting in an increase to our contributed surplus account
12.
Accumulated other comprehensive income
A reconciliation of the amounts contained in accumulated other comprehensive income is as follows:
|
Accumulated other comprehensive income, before tax
|
Accumulated other comprehensive income, net of tax
|
|||||||
|
As of December 31, 2007
|
$ | 7,547 | $ | 6,416 | ||||
|
Decreases to fair market value during period
|
(2,232 | ) | (1,897 | ) | ||||
|
Increases due to realization of loss
|
98 | 83 | ||||||
|
As of December 31, 2008
|
$ | 5,413 | $ | 4,602 | ||||
|
Increases to fair market value during period
|
2,092 | 1,778 | ||||||
|
Decreases due to realization of a gain
|
(6,829 | ) | (5,806 | ) | ||||
|
As of December 31, 2009
|
$ | 676 | $ | 575 | ||||
|
Increases to fair market value during period
|
534 | 467 | ||||||
|
Decreases due to realization of a gain
|
(281 | ) | (246 | ) | ||||
|
As of December 31, 2010
|
$ | 929 | $ | 796 | ||||
Effective September 30, 2008, we adopted the Emerging Issues Committee Abstract 172 (“EIC 172”), “Income Statement Presentation of a Tax Loss Carryforward Recognized Following an Unrealized Gain in Other Comprehensive Income.” EIC 172 provides guidance on whether the tax benefit from the recognition of previously unrecognized tax loss carryforwards consequent to the recording of unrealized gains in other comprehensive income, such as unrealized gains on available-for-sale financial assets, should be recognized in net income or in other comprehensive income. EIC 172 should be applied retrospectively, with restatement of prior periods from January 1, 2007, the date of adoption of CICA 3855.
The adoption of EIC 172 resulted in a reclassification of $1,131,998 of income tax recovery from the accumulated other comprehensive income balance to the accumulated deficit as of December 31, 2007. It also resulted in a reclassification
- 150 -
VISTA GOLD CORP. (AN EXPLORATION STAGE ENTERPRISE)
NOTES TO CONSOLIDATED FINANCIAL STATEMENTS
(All amounts in tables are in thousands of US Dollars, except per share amounts and number of shares, unless noted otherwise)
of $319,962 of income tax expense from the accumulated other comprehensive income balance to the Consolidated Statement of Loss under the heading “Income tax benefit/(expense)” for the year ended December 31, 2008.
13.
Commitments and contingencies
Refer to Note 5 for commitments in connection with acquisitions of mineral properties and Note 6 for commitments in connection with acquisitions of property, plant and equipment.
14.
Financial instruments
Our financial assets and financial liabilities are classified into one of four categories: available-for-sale, held-for-trading, loans and receivables and other financial liabilities.
All financial instruments classified as available-for-sale or held-for-trading are subsequently measured at fair value. Changes in the fair value of financial instruments designated as held-for-trading are charged or credited to the statement of loss for the relevant period, while changes in the fair value of financial instruments designated as available-for-sale, excluding impairments, are charged or credited to other comprehensive income until the instrument is realized. For a discussion related to the fair value of the Amayapampa disposal consideration, please see Note 3 – Dispositions, above. All other financial assets and liabilities are accounted for at cost or at amortized cost depending upon the nature of the instrument. After their initial fair value measurement, they are measured at amortized cost using the effective interest rate method.
Financial Assets
The carrying amounts and fair values of financial assets are as follows:
|
December 31, 2010
|
December 31, 2009
|
||||||||||||||||
|
Category
|
Estimated Fair Value
|
Carrying Value
|
Estimated Fair Value
|
Carrying Value
|
|||||||||||||
|
Cash and cash equivalents
|
Loans and receivables
|
$ | 39,838 | $ | 39,838 | $ | 28,408 | $ | 28,408 | ||||||||
|
Accounts receivable (1)
|
Loans and receivables
|
799 | 799 | 24 | 24 | ||||||||||||
|
Amayapampa disposal consideration
|
Held-for-trading
|
4,813 | 4,813 | 4,813 | 4,813 | ||||||||||||
|
Marketable securities (2)
|
Available-for-sale
|
1,703 | 1,703 | 1,150 | 1,150 | ||||||||||||
|
Total financial assets
|
$ | 47,153 | $ | 47,153 | $ | 34,395 | $ | 34,395 | |||||||||
|
(1)
|
Carrying amount is a reasonable approximation of fair value.
|
|
(2)
|
The fair value represents quoted market prices in an active market.
|
Financial liabilities
The carrying amounts and fair values of financial liabilities are as follows:
|
December 31, 2010
|
December 31, 2009
|
||||||||||||||||
|
Category
|
Estimated
Fair Value
|
Carrying
Value
|
Estimated
Fair Value
|
Carrying
Value
|
|||||||||||||
|
Accounts payable and accrued liabilities (1)
|
Other financial liabilities
|
$ | 1,630 | $ | 1,630 | $ | 926 | $ | 926 | ||||||||
|
Other long-term liabilities (1)
|
Other financial liabilities
|
— | — | 228 | 228 | ||||||||||||
|
Convertible notes (2)
|
Other financial liabilities
|
22,686 | 22,505 | 26,678 | 24,939 | ||||||||||||
|
Total financial liabilities
|
$ | 24,316 | $ | 24,135 | $ | 27,832 | $ | 26,093 | |||||||||
|
(1)
|
Carrying amount is a reasonable approximation of fair value.
|
|
(2)
|
The carrying value of the convertible notes is being accreted to their maturity value over their expected life using the effective interest rate method.
|
- 151 -
VISTA GOLD CORP. (AN EXPLORATION STAGE ENTERPRISE)
NOTES TO CONSOLIDATED FINANCIAL STATEMENTS
(All amounts in tables are in thousands of US Dollars, except per share amounts and number of shares, unless noted otherwise)
Financial instrument risk exposure and risk management
We are exposed in varying degrees to a variety of financial instrument related risks. Management approves and monitors the risk management processes. The types of risk exposure and the way in which such exposure is managed is provided as follows:
Credit risk
Our credit risk is primarily attributable to our cash and cash equivalents. We monitors our cash and cash equivalents in order to limit our exposure to credit risk. We do not have any financial assets that are invested in asset-backed commercial paper.
Liquidity risk
We ensure that there is sufficient capital in order to meet short term business requirements, after taking into account our holdings of cash and cash equivalents and cash flows from financing activities. We believe that these sources will be sufficient to cover the likely short and long term cash requirements. Our cash and cash equivalents are held in interest bearing liquid savings accounts.
Market risk
The significant market risk exposure to which we are exposed is interest rate risk. Our policy is to invest cash at floating rates of interest in short-term highly liquid cash savings accounts in order to maintain liquidity. Fluctuations in interest therefore have little impact on the value of cash equivalents and short term investments. With respect to financial liabilities, the convertible notes are not subject to interest rate risk because they bear interest at a fixed rate and are not subject to fluctuations in interest.
15.
Capital disclosures
Our objectives when managing capital are to safeguard our access to sufficient funding as needed to continue our development of mineral properties and to maintain a flexible capital structure which optimizes the costs of capital at an acceptable level of risk.
In the management of capital, we include the components of shareholders’ equity and debt. We manage the capital structure and make adjustments in light of changes in economic conditions and the risk characteristics of the underlying assets. To maintain or adjust the capital structure, we may issue new shares, issue new debt, acquire or dispose of assets or adjust the amount of investments. We have no restrictions or covenants on our capital structure as of the end of 2010.
In order to facilitate the management of our capital requirements, we prepare annual expenditure budgets which project expected cash and debt positions over several years and which are updated as necessary depending on various factors, including successful capital deployment and general industry conditions. The annual and updated budgets are approved by the Board of Directors.
In order to maximize cash available for development efforts, we do not pay dividends. Our cash investment policy is to invest our cash in highly liquid short-term interest-bearing investments with maturities of three months or less when acquired, selected with regards to the expected timing of expenditures from operations.
16.
Supplemental cash flow information and material non-cash transactions
As of December 31, 2010, 2009 and 2008 all of our cash was held in liquid bank deposits.
|
Non-cash consideration given/(received) during 2010
|
||||
|
Material non-cash transactions
|
Equity units
|
|||
|
Investing and financing activities:
|
||||
|
Extinguishment of convertible notes, including interest – Note 7
|
$ | 6,095 | ||
|
Black Isle Resources
(1)
|
(38 | ) | ||
|
Finders’ fee December 15, 2010 private placement – Note 10
|
1,056 | |||
VISTA GOLD CORP. (AN EXPLORATION STAGE ENTERPRISE)
NOTES TO CONSOLIDATED FINANCIAL STATEMENTS
(All amounts in tables are in thousands of US Dollars, except per share amounts and number of shares, unless noted otherwise)
|
Non-cash consideration given/(received) during 2009
|
||||
|
Material non-cash transactions ($000’s)
|
Equity units
|
|||
|
Investing and financing activities:
|
||||
|
McBride
(2)
|
$ | (44 | ) | |
|
Non-cash consideration given/(received) during 2008
|
||||
|
Material non-cash transactions ($000’s)
|
Equity units
|
|||
|
Investing and financing activities:
|
||||
|
Prime Corporate Finance—Note 3
|
$ | 132 | ||
|
Grandcru and San Miguel Group—Note 5(d)
|
1,000 | |||
|
McBride
(2)
|
(100 | ) | ||
|
(1)
|
During the year ended December 31, 2010, we received 800,000 common shares in the capital of Black Isle Resources Corp. for the repayment of an outstanding $662,000 loan that was previously written off as an uncollectable receivable. These common shares were valued at $38,400 when received and accordingly have been recorded as a gain in the Consolidated Statements of Loss.
|
|
(2)
|
On July 20, 2006, the Corporation and Nevgold Resources Corp. (“Nevgold”) entered into a letter of intent pursuant to which Nevgold would aquire three of the Corporation’s mineral exploration properties located in Manitoba and Ontario, Canada, for consideration of 1,000,000 Nevgold common shares, of which 100,000 shares were immediately issued to the Corporation. Pursuant to the agreement with Nevgold, the remaining 900,000 shares are held in escrow and 15% of the remaining balance will be issued every six months over a three-year period. As of December 31, 2009, the Corporation has received all 1,000,000 shares from Nevgold.
|
17.
Income taxes
(a) A reconciliation of the combined Canadian income taxes at statutory rates and the Corporation’s effective income tax expense/(benefit) is as follows:
|
Years ended December 31,
|
||||||||||||
|
2010
|
2009
|
2008
|
||||||||||
|
Income tax benefit at statutory rates
|
$ | (2,701 | ) | $ | (357 | ) | $ | (2,761 | ) | |||
|
Increase (decrease) in taxes from:
|
||||||||||||
|
Permanent differences
|
325 | (989 | ) | 1,351 | ||||||||
|
Differences in foreign tax rates
|
(115 | ) | (183 | ) | (72 | ) | ||||||
|
Effect of foreign exchange
|
(688 | ) | (1,635 | ) | 2,491 | |||||||
|
Change in effective tax rate
|
56 | (48 | ) | 1,482 | ||||||||
|
Benefit of losses not recognized
|
— | — | — | |||||||||
|
Prior Year provision to actual adjustments
|
949 | (3,927 | ) | 200 | ||||||||
|
Capital loss on sale of Amayapampa
|
— | — | (3,107 | ) | ||||||||
|
Benefit of tax deductions recorded in equity
|
— | (837 | ) | — | ||||||||
|
Change in valuation allowance
|
2,142 | 8,687 | 736 | |||||||||
|
Income tax (benefit)/expense
|
$ | (32 | ) | $ | 711 | $ | 320 | |||||
|
|
||||||||||||
(b) Future income taxes reflect the net effects of temporary differences between the carrying amounts of assets and liabilities for financial reporting purposes and the amounts used for income tax purposes. The significant components of the company’s future tax assets as at December 31 are as follows:
VISTA GOLD CORP. (AN EXPLORATION STAGE ENTERPRISE)
NOTES TO CONSOLIDATED FINANCIAL STATEMENTS
(All amounts in tables are in thousands of US Dollars, except per share amounts and number of shares, unless noted otherwise)
|
December 31,
|
||||||||
|
Future income tax assets
|
2010
|
2009
|
||||||
|
Excess tax basis over book basis of property, plant and equipment
|
$ | 6,130 | $ | 6,003 | ||||
|
Operating loss carryforwards
|
15,480 | 11,858 | ||||||
|
Capital loss carryforwards
|
2,773 | 3,394 | ||||||
|
Other
|
1,407 | 1,551 | ||||||
|
Unrealized foreign exchange on loans
|
864 | 915 | ||||||
|
Total future tax assets
|
26,654 | 23,721 | ||||||
|
Valuation allowance for future tax assets
|
(26,056 | ) | (23,155 | ) | ||||
| 598 | 566 | |||||||
|
Future income tax liabilities
|
||||||||
|
Amayapampa disposal consideration
|
482 | 481 | ||||||
|
Marketable securities
|
116 | 85 | ||||||
|
Total
|
$ | — | $ | — | ||||
(c) The Corporation has available income tax losses of approximately $68.3 million, which may be carried forward and applied against future taxable income when earned.
The losses expire as follows:
|
Canada
|
United States
|
Mexico
|
Total
|
|||||||||||||
|
2011
|
— | — | 185 | 185 | ||||||||||||
|
2012
|
— | — | 183 | 183 | ||||||||||||
|
2013
|
— | — | 277 | 277 | ||||||||||||
|
2014
|
725 | — | 122 | 847 | ||||||||||||
|
2015
|
889 | — | 317 | 1,206 | ||||||||||||
|
2016
|
— | — | 123 | 123 | ||||||||||||
|
2017
|
— | — | 524 | 524 | ||||||||||||
|
2018
|
— | — | 6,126 | 6,126 | ||||||||||||
|
2019
|
— | 519 | 950 | 1,469 | ||||||||||||
|
2020
|
— | 783 | 1,873 | 2,656 | ||||||||||||
|
2021
|
— | 779 | — | 779 | ||||||||||||
|
2022
|
— | 748 | — | 748 | ||||||||||||
|
2023
|
— | 691 | — | 691 | ||||||||||||
|
2024
|
— | 2,082 | — | 2,082 | ||||||||||||
|
2025
|
— | 2,362 | — | 2,362 | ||||||||||||
|
2026
|
1,027 | 1,213 | — | 2,240 | ||||||||||||
|
2027
|
19,759 | 1,700 | — | 21,459 | ||||||||||||
|
2028
|
7,092 | 1,719 | — | 8,811 | ||||||||||||
|
2029
|
3,578 | 2,309 | — | 5,887 | ||||||||||||
|
2030
|
7,697 | 1,990 | — | 9,687 | ||||||||||||
| $ | 40,767 | $ | 16,895 | $ | 10,680 | $ | 68,342 | |||||||||
18. Retirement plan
We sponsor a qualified tax-deferred savings plan in accordance with the provisions of Section 401(k) of the U.S. Internal Revenue Code, which is available to permanent U.S. employees. We make contributions of up to 4% of eligible employees’ salaries. Our contributions were as follows: 2010—$59,200; 2009—$52,832, and 2008—$40,618.
19.
Segment information
We evaluate, acquire and explore gold exploration and potential development projects. These activities are focused principally in North America, Australia and Indonesia. We reported no revenues in 2010, 2009 and 2008. Geographic segmentation of mineral properties and plant and equipment is provided in Notes 5 and 6.
- 154 -
VISTA GOLD CORP. (AN EXPLORATION STAGE ENTERPRISE)
NOTES TO CONSOLIDATED FINANCIAL STATEMENTS
(All amounts in tables are in thousands of US Dollars, except per share amounts and number of shares, unless noted otherwise)
20.
Differences between Canadian and United States generally accepted accounting principles
The significant measurement differences between generally accepted accounting principles (“GAAP”) in Canada and in the United States, as they relate to these financial statements are as follows:
|
|
(a)
|
In accordance with U.S. GAAP, exploration, mineral property evaluation and holding costs are expensed as incurred. When proven and probable reserves are determined for a property and a bankable feasibility study is completed, then subsequent development costs on the property would be capitalized. Total capitalized cost of such properties is measured periodically for recoverability of carrying value under ASC 360 Property, Plant and Equipment. Under Canadian GAAP, all such costs are permitted to be capitalized.
|
|
|
(b)
|
Under Canadian corporate law, we underwent a capital reduction in connection with the amalgamation of Granges, Inc. (“Granges”) and Hycroft Resources & Development, Inc. whereby share capital and contributed surplus were reduced to eliminate the consolidated accumulated deficit of Granges as of December 31, 1994, after giving effect to the estimated costs of amalgamation. Under U.S. corporate law, no such transaction is available and accordingly is not allowed under U.S. GAAP.
|
|
|
(c)
|
In accordance with U.S. GAAP (ASC 718 Compensation Stock Expense), the fair value of all options granted after January 1, 2006 is calculated at the date of grant and expensed over the expected vesting period. On transition to this new standard, the unvested portion of options granted to employees before January 1, 2006 is expensed over the remaining vesting period using the fair value on the date of grant. Prior to January 1, 2006, we did not record any compensation cost on the granting of stock options to employees and directors as the exercise price was equal to or greater than the market price at the date of grants for U.S. GAAP purposes under APB Opinion No. 25. ASC 718 Compensation Stock Expense essentially aligns U.S. GAAP with Canadian GAAP for accounting for stock-based compensation.
|
|
|
(d)
|
In accordance with U.S. GAAP, the entire amount of convertible debt is classified as a liability and recorded at fair value on the date of issuance and issuance costs are classified as a deferred asset and amortized over the life of the convertible debt. Under Canadian GAAP, the fair value of the conversion feature of the convertible debt is classified as equity and the residual balance is classified as a liability. Under Canadian GAAP, issuance costs are netted against the debt and equity portions pro rata. The liability portion is accreted each period in amounts which will increase the liability to its full face amount of the convertible instrument as of the maturity date.
|
|
|
(e)
|
In accordance with U.S. GAAP (ASC 740 Income Taxes), the reversal of a valuation allowance which is directly related to the gain or loss of available-for-sale securities, when a corporation has no expectations of taxable income in future periods, is recorded in other comprehensive income/(loss). Under Canadian GAAP, we adopted EIC 172, effective September 30, 2008. This standard requires the recognition of the tax benefit or loss of previously unrecognized tax loss carryforwards associated with the unrealized holding gains and losses of available-for-sale securities to be recognized in net income or net loss. This abstract required retrospective restatement of all prior periods beginning with January 1, 2007. The adoption of EIC 172 resulted in a future income tax expense being recorded as part of our Net Loss, whereas under ASC 740 Income Taxes the future income tax expense would be recorded as part of our Comprehensive Loss.
|
|
|
(f)
|
In 2000, the carrying values of certain long-lived assets exceeded their respective undiscounted cash flows. Following Canadian GAAP at that time, the carrying values were written down using the undiscounted cash flow method. Under U.S. GAAP, the carrying values were written down to their fair values using the discounted cash flow method, giving rise to a difference in the amounts written down. During 2007, the carrying values of certain long-lived assets exceeded their respective discounted cash flows. Under Canadian GAAP, the carrying values were written down using the discounted cash flow method. Under U.S. GAAP, a write-down was not required as the carrying value of the asset was already written down to the fair-value using the discounted cash flows during 2000.
|
|
|
(g)
|
Special warrants issued to the agent as compensation for its services in connection with the March 2002 Debenture Offering are valued and included as a financing cost of the related debentures. The conversion feature of the Debenture Offering (the Beneficial Conversion Feature) was in the money at the date of issue. The debentures were fully converted on September 19, 2002; accordingly the fair value of the Beneficial Conversion Feature is recognized as a charge to net loss and as an addition to contributed surplus.
|
- 155 -
VISTA GOLD CORP. (AN EXPLORATION STAGE ENTERPRISE)
NOTES TO CONSOLIDATED FINANCIAL STATEMENTS
(All amounts in tables are in thousands of US Dollars, except per share amounts and number of shares, unless noted otherwise)
The significant measurement differences in the consolidated statements of loss relative to U.S. GAAP were:
Consolidated Statements of Loss
|
Years ended December 31,
|
||||||||||||||||
|
2010
|
2009
|
2008
|
Cumulative during Exploration Stage
|
|||||||||||||
|
Net earnings/(loss) – Canadian GAAP
|
$ | (9,614 | ) | $ | (1,942 | ) | $ | (9,973 | ) | $ | (53,797 | ) | ||||
|
Exploration, property evaluation and holding costs - continuing operations
(e)
|
(11,349 | ) | (5,396 | ) | (8,403 | ) | (29,928 | ) | ||||||||
|
Exploration, property evaluation and holding costs - discontinued operations
(e)
|
- | - | - | 4,016 | ||||||||||||
|
Gain on sale of Amayapampa
(f)
|
- | - | 2,124 | 2,124 | ||||||||||||
|
(Gain)/loss on early extinguishment of convertible notes
(d)
|
348 | (122 | ) | - | 226 | |||||||||||
|
Interest accretion on convertible notes
(d)
|
811 | 1,069 | 837 | 2,717 | ||||||||||||
|
Amortization of deferred issuance costs
(d)
|
(184 | ) | (272 | ) | (225 | ) | (681 | ) | ||||||||
|
Future income tax benefit/(expense)
(e)
|
(32 | ) | 711 | 320 | (133 | ) | ||||||||||
|
Financing costs
|
- | - | - | (222 | ) | |||||||||||
|
Stock-based compensation expense
(c)
|
- | - | - | 2,251 | ||||||||||||
|
Beneficial conversion feature
|
- | - | - | (2,774 | ) | |||||||||||
|
Net loss – U.S. GAAP
|
(20,020 | ) | (5,952 | ) | (15,320 | ) | (76,201 | ) | ||||||||
|
Unrealized gain on marketable securities
|
252 | (4,737 | ) | (2,134 | ) | (6,657 | ) | |||||||||
|
Comprehensive loss – U.S. GAAP
|
$ | (19,768 | ) | $ | (10,689 | ) | $ | (17,454 | ) | $ | (82,858 | ) | ||||
|
Basic and diluted loss per share – U.S. GAAP
|
$ | (0.42 | ) | $ | (0.17 | ) | $ | (0.45 | ) | |||||||
- 156 -
VISTA GOLD CORP. (AN EXPLORATION STAGE ENTERPRISE)
NOTES TO CONSOLIDATED FINANCIAL STATEMENTS
(All amounts in tables are in thousands of US Dollars, except per share amounts and number of shares, unless noted otherwise)
The significant measurement differences in the consolidated balance sheets as at December 31, 2010 and 2009 relative to U.S. GAAP were:
Consolidated Balance Sheets
|
December 31, 2010
|
December 31, 2009
|
|||||||||||||||||||||||
|
Per Cdn. GAAP
|
Cdn./U.S. Adj.
|
Per U.S. GAAP
|
Per Cdn. GAAP
|
Cdn./U.S. Adj.
|
Per U.S. GAAP
|
|||||||||||||||||||
|
Current assets
|
$ | 42,625 | - | $ | 42,625 | $ | 30,317 | $ | - | $ | 30,317 | |||||||||||||
|
Property, plant and equipment
(a)
|
73,004 | (39,779 | ) | 33,225 | 57,443 | (26,944 | ) | 30,499 | ||||||||||||||||
|
Deferred financing costs
|
- | 103 | 103 | - | 824 | 824 | ||||||||||||||||||
|
Other assets
|
4,813 | - | 4,813 | 4,813 | - | 4,813 | ||||||||||||||||||
|
Total assets
|
$ | 120,442 | $ | (39,676 | ) | $ | 80,766 | $ | 92,573 | $ | (26,120 | ) | $ | 66,453 | ||||||||||
|
Current liabilities
|
1,630 | - | 1,630 | 926 | - | 926 | ||||||||||||||||||
|
Convertible notes
(d)
|
22,505 | 495 | 23,000 | 24,939 | 3,728 | 28,667 | ||||||||||||||||||
|
Other long-term liabilities
|
- | - | - | 228 | - | 228 | ||||||||||||||||||
|
Total liabilities
|
24,135 | 495 | 24,630 | 26,093 | 3,728 | 29,821 | ||||||||||||||||||
|
Capital stock
(b,c)
|
274,829 | 74,580 | 349,409 | 245,964 | 75,039 | 321,003 | ||||||||||||||||||
|
Special warrants
|
- | 222 | 222 | - | 222 | 222 | ||||||||||||||||||
|
Warrants and options
(c)
|
15,301 | 406 | 15,707 | 5,154 | 386 | 5,540 | ||||||||||||||||||
|
Contributed surplus
(b,c,g)
|
3,333 | 4,032 | 7,365 | 1,848 | 4,818 | 6,666 | ||||||||||||||||||
|
Equity component of convertible notes
(d)
|
4,721 | (4,721 | ) | - | 5,998 | (5,998 | ) | - | ||||||||||||||||
|
Other comprehensive income
(e)
|
796 | 222 | 1,018 | 575 | 191 | 766 | ||||||||||||||||||
|
Deficit
(a,b,c,e,g)
|
(202,673 | ) | (114,912 | ) | (317,585 | ) | (193,059 | ) | (104,506 | ) | (297,565 | ) | ||||||||||||
|
Total shareholders' equity
|
96,307 | (40,171 | ) | 56,136 | 66,480 | (29,848 | ) | 36,632 | ||||||||||||||||
|
Total liabilities & shareholders' equity
|
$ | 120,442 | $ | (39,676 | ) | $ | 80,766 | $ | 92,573 | $ | (26,120 | ) | $ | 66,453 | ||||||||||
- 157 -
VISTA GOLD CORP. (AN EXPLORATION STAGE ENTERPRISE)
NOTES TO CONSOLIDATED FINANCIAL STATEMENTS
(All amounts in tables are in thousands of US Dollars, except per share amounts and number of shares, unless noted otherwise)
The significant measurement differences in the consolidated statements of cash flows relative to U.S. GAAP were:
Consolidated Statements of Cash Flows
|
Years ended December 31,
|
Cumulative during Exploration
|
|||||||||||||||
|
2010
|
2009
|
2008
|
Stage
|
|||||||||||||
|
Cash flows from operating activities, Canadian GAAP
|
$ | (8,671 | ) | $ | (7,883 | ) | $ | (7,638 | ) | $ | (36,653 | ) | ||||
|
Additions to mineral properties, net
(a)
|
(10,931 | ) | (5,292 | ) | (8,263 | ) | (30,999 | ) | ||||||||
|
Cash flows from operating activities, U.S. GAAP
|
(19,602 | ) | (13,175 | ) | (15,901 | ) | (67,652 | ) | ||||||||
|
Cash flows from investing activities, Canadian GAAP
|
(11,008 | ) | 3,268 | (26,913 | ) | (74,506 | ) | |||||||||
|
Additions to mineral properties, net
(a)
|
10,931 | 5,292 | 8,263 | 30,999 | ||||||||||||
|
Cash flows from investing activities, U.S. GAAP
|
(77 | ) | 8,560 | (18,650 | ) | (43,507 | ) | |||||||||
|
Cash flows from financing activities, Canadian GAAP
|
31,109 | 19,757 | 31,425 | 173,593 | ||||||||||||
|
Cash flows from financing activities, U.S. GAAP
|
31,109 | 19,757 | 31,425 | 173,593 | ||||||||||||
|
Net increase/(decrease) in cash and cash equivalents - continuing operations
|
11,430 | 15,142 | (3,126 | ) | 62,434 | |||||||||||
|
Net increase/(decrease) in cash and cash equivalents - discontinued operations
|
- | - | (294 | ) | (23,270 | ) | ||||||||||
|
Net increase/(decrease) in cash and cash equivalents
|
11,430 | 15,142 | (3,420 | ) | 39,164 | |||||||||||
|
Cash and cash equivalents, beginning of period
|
28,408 | 13,266 | 16,686 | 674 | ||||||||||||
|
Cash and cash equivalents, end of period
|
$ | 39,838 | $ | 28,408 | $ | 13,266 | $ | 39,838 | ||||||||
- 158 -
VISTA GOLD CORP. (AN EXPLORATION STAGE ENTERPRISE)
NOTES TO CONSOLIDATED FINANCIAL STATEMENTS
(All amounts in tables are in thousands of US Dollars, except per share amounts and number of shares, unless noted otherwise)
Statement of Changes in Shareholders’ Equity under U.S. GAAP
|
Capital stock
|
Special warrants
|
Warrants and options
|
Contributed surplus
|
Deficit
|
Other comprehensive income (loss)
|
Total shareholders' equity
|
||||||||||||||||||||||
|
Balance as December 31, 2007
|
296,136 | 222 | 3,708 | 5,779 | (276,293 | ) | 7,637 | 37,189 | ||||||||||||||||||||
|
Issued during the year (Note 8)
|
4,244 | - | - | - | 4,244 | |||||||||||||||||||||||
|
Warrants and options
|
- | - | 958 | - | 958 | |||||||||||||||||||||||
|
Contributed surplus
|
- | - | 873 | - | 873 | |||||||||||||||||||||||
|
Other comprehensive loss
|
- | - | - | (2,134 | ) | (2,134 | ) | |||||||||||||||||||||
|
Net loss
|
- | - | (15,320 | ) | (15,320 | ) | ||||||||||||||||||||||
|
Balance at December 31, 2008
|
300,380 | 222 | 4,666 | 6,652 | (291,613 | ) | 5,503 | 25,810 | ||||||||||||||||||||
|
Issued during the year
|
20,623 | - | - | - | - | - | 20,623 | |||||||||||||||||||||
|
Warrants and options
|
- | - | 874 | - | - | - | 874 | |||||||||||||||||||||
|
Contributed surplus
|
- | - | - | 14 | - | - | 14 | |||||||||||||||||||||
|
Other comprehensive loss
|
- | - | - | - | - | (4,737 | ) | (4,737 | ) | |||||||||||||||||||
|
Net loss
|
- | - | - | - | (5,952 | ) | - | (5,952 | ) | |||||||||||||||||||
|
Balance at December 31, 2009
|
321,003 | 222 | 5,540 | 6,666 | (297,565 | ) | 766 | 36,632 | ||||||||||||||||||||
|
Issued during the year
|
28,406 | - | - | - | - | - | 28,406 | |||||||||||||||||||||
|
Warrants and options
|
- | - | 10,042 | - | - | - | 10,042 | |||||||||||||||||||||
|
Restricted Stock Units
|
125 | 125 | ||||||||||||||||||||||||||
|
Contributed surplus
|
- | - | - | 699 | - | - | 699 | |||||||||||||||||||||
|
Other comprehensive loss
|
- | - | - | - | - | 252 | 252 | |||||||||||||||||||||
|
Net loss
|
- | - | - | - | (20,020 | ) | - | (20,020 | ) | |||||||||||||||||||
|
Balance at December 31, 2010
|
349,409 | 222 | 15,707 | 7,365 | (317,585 | ) | 1,018 | 56,136 | ||||||||||||||||||||
Recently adopted standards
In June 2009, the Financial Accounting Standards Board (the “FASB”) issued amended standards for determining whether to consolidate a variable interest entity. These new standards amend the evaluation criteria to identify the primary beneficiary of a variable interest entity and require ongoing reassessment of whether an enterprise is the primary beneficiary of the variable interest entity. The provisions of the new standards are effective for annual reporting periods beginning after November 15, 2009 and interim periods within those fiscal years. These standards became effective for us in the first quarter of fiscal 2010. The adoption of the new standards will not have an impact on our consolidated financial position, results of operations and cash flows.
In January 2010, the FASB issued Accounting Standards Update No. 2010-06, “Fair Value Measurements Disclosures,” which amends Subtopic 820-10 of the FASB Accounting Standards Codification to require new disclosures for fair value measurements and provides clarification for existing disclosure requirements. More specifically, this update will require (a) an entity to disclose separately the amounts of significant transfers in and out of Levels 1 and 2 fair value measurements and to describe the reasons for the transfers; and (b) information about purchases, sales, issuances and settlements to be presented separately (i.e. present the activity on a gross basis rather than net) in the reconciliation for fair value measurements using significant, unobservable inputs (Level 3 inputs). This update clarifies existing disclosure requirements for the level of disaggregation used for classes of assets and liabilities measured at fair value, and requires disclosure about the valuation techniques and inputs used to measure fair value for both recurring and nonrecurring fair value measurements using Level 2 and Level 3 inputs. We do not anticipate that the adoption of this standard will materially expand our consolidated financial statement footnote disclosures.
- 159 -
VISTA GOLD CORP. (AN EXPLORATION STAGE ENTERPRISE)
NOTES TO CONSOLIDATED FINANCIAL STATEMENTS
(All amounts in tables are in thousands of US Dollars, except per share amounts and number of shares, unless noted otherwise)
The three levels of the fair value hierarchy are:
|
|
●
|
Level 1 – Unadjusted quoted prices in active markets for identical assets or liabilities;
|
|
|
●
|
Level 2 – Inputs other than quoted prices that are observable for the asset or liability either directly or indirectly; and
|
|
|
●
|
Level 3 – Inputs that are not based on observable market data.
|
In February 2010, the FASB issued Accounting Standards Update No. 2010-09, “Subsequent Events,” which amends ASC 855 to address certain implementation issues, including: (1) eliminating the requirement for a filer with the United States Securities and Exchange Commission (the “SEC”) to disclose the date through which it has evaluated subsequent events; and (2) refining the scope of the disclosure requirements for reissued financial statements. The provisions of the update will be effective upon issuance. The adoption of the update will not have an impact on our consolidated financial position, results of operations and cash flows.
21.
Related Party Transactions
On April 1, 2009, we entered into an agreement with Sierra Partners LLC (“Sierra”) pursuant to which Sierra agreed to provide us with investor relations and corporate finance consulting services. The founder and partner of Sierra is also one of our directors. Under the terms of the agreement, Sierra will provide us with consulting services commencing April 1, 2009 and ending on March 31, 2010, with the agreement continuing thereafter on a month-to-month basis. Sierra will assist us with our efforts to maintain an investor relations program and provide support and analysis of our general corporate finance and strategy efforts. As compensation for these services, we agreed to pay to Sierra a monthly retainer fee of $10,000 during the term of the agreement and issue to Sierra 60,000 of our stock options. As of December 31, 2010, we had made payments to Sierra under the agreement totaling $210,000; of which $120,000 had been paid during the period ended December 31, 2010, and had issued the 60,000 stock options to Sierra with a recorded expense of $53,540. On December 15, 2010, we issued an additional 30,000 of our stock options to Sierra, which had a recorded value of $20,978 as of December 31, 2010.
22.
Subsequent Events
Combination Agreement with Midas Gold
On February 23, 2011, Vista Gold and Midas announced that Midas, Midas Gold Corp. (“Midas Gold”) and certain of Vista’s US subsidiaries had executed a combination agreement (the “Combination Agreement”) whereby they will contribute their respective Idaho gold assets through a contribution to Midas Gold (the "Combination").. If the Plan of Share Exchange, as defined below, is approved by the shareholders of Midas, and all other conditions to the transaction are satisfied or waived, Midas Gold will be owned, on a fully diluted basis, 65% by shareholders of Midas and 35% by Vista following the completion of the Combination.
The reorganization of the ownership of the Stibnite-Yellow Pine gold district will be effected pursuant to the Combination Agreement among Midas, Midas Gold, Vista’s wholly-owned subsidiary, Vista Gold U.S. Inc., a Delaware corporation (“Vista US”) and its wholly owned subsidiary, Idaho Gold Resources, LLC, an Idaho limited liability company (“Idaho Gold”), assuming the plan of share exchange is approved by the shareholders of Midas and all of the other conditions to the closing of the Combination are satisfied or waived. Following the execution of the Combination Agreement, Midas will hold a special meeting of its shareholders (the “Special Meeting”). The purpose of the Special Meeting is to consider and approve a plan of share exchange (the “Plan of Share Exchange”) between Midas and Midas Gold pursuant to which Midas’ outstanding shares of common stock (the “Midas Shares”) and outstanding options (the “Midas Options”), other than Midas Shares held by dissenting shareholders, will be exchanged for common shares and options of Midas Gold (the “Midas Gold Shares” and “Midas Gold Options”, respectively), with the result that Midas will become a wholly-owned subsidiary of Midas Gold. Midas Shareholders holding at least 66-2/3% of the issued and outstanding Midas Shares must vote in favor of the Plan of Share Exchange at the Special Meeting and dissenters' appraisal rights shall not be exercised with respect to more than 5% of the outstanding Midas Shares.
- 160 -
VISTA GOLD CORP. (AN EXPLORATION STAGE ENTERPRISE)
NOTES TO CONSOLIDATED FINANCIAL STATEMENTS
(All amounts in tables are in thousands of US Dollars, except per share amounts and number of shares, unless noted otherwise)
The Plan of Share Exchange is part of a broader, integrated transaction undertaken pursuant to the terms of the Combination Agreement, pursuant to which, if the Plan of Share Exchange is approved at the Special Meeting and the other conditions to closing specified in the Combination Agreement are satisfied or waived:
|
|
·
|
Vista US will: (a) organize Idaho Gold Holding Company, as a wholly-owned Idaho corporation (“Idaho Holdco”); (b) contribute its equity interests in Idaho Gold to Idaho Holdco; and (c) at closing, contribute all of the issued and outstanding shares of common stock of Idaho Holdco to Midas Canada as a capital contribution, in exchange for that number of Midas Gold Shares equal to, on a fully diluted basis, thirty-five percent (35%) of the Midas Gold Shares that are issued and outstanding at the time the transactions specified in the Combination Agreement and the Plan of Exchange are completed;
|
|
|
·
|
The shareholders of Midas, other than any dissenting shareholders, will contribute their Midas Shares to Midas Gold in exchange for that number of Midas Gold Shares equal to, on a fully diluted basis, sixty-five percent (65%) of the Midas Gold Shares that are issued and outstanding at the time the transactions specified in the Combination Agreement and the Plan of Exchange are completed; and
|
|
|
·
|
The holders of Midas Option will exchange their Midas Options for Midas Gold Options of like tenor.
|
Additionally, as a condition to closing the Combination, Vista US and each officer, director, and holder of 5% or greater of the Midas Shares (the “Midas Affiliates”) have entered into lock up agreements (the “Lock Up Agreements”) and voting support agreements (the “Voting Agreements”). Pursuant to the Lock Up Agreements, Vista US and each of the Midas Affiliates have agreed that their respective Midas Canada Shares will not be transferable except in specific circumstances and for a specific period of time. Pursuant to the Voting Agreements, Vista US has, amongst other items, agreed, for a specified period of time, to vote in favor of the nominees to the Midas Canada board of directors as designated by the nominating and corporate governance committee, or similar committee, of Midas Canada and the Midas Affiliates have, amongst other items, agreed, for a specified period of time, to vote in favor of the Combination and for the nominee to the Midas Canada board of
directors as designated by Vista US.
Listing of Warrants on the TSX
On March 2, 2011, we announced that the 15,308,044 warrants issued on December 15, 2010 in connection with our private placement of Special Warrants, began trading March 1, 2011 on the TSX under the symbol VGZ.WT.U (subsequently changed to VGZ.WT.S on March 14, 2011).
The Warrants are freely tradable in Canada, except to, or for the account or benefit, of any U.S. person (as defined in Regulation S under the United States Securities Act of 1933, as amended (the “Securities Act”). Neither the Warrants nor the common shares issuable upon exercise of the Warrants (the “Warrant Shares”) have been registered under the Securities Act, or any state securities laws of any state of the United States. Accordingly, the Warrants and the Warrant Shares may not be offered or sold in the United States or to, or for the account or benefit of, any U.S. person (as defined in Regulation S under the Securities Act) or any person in the United States absent registration under the Securities Act or an applicable exemption from such registration requirements and in accordance with all applicable state securities laws of any state of the United States. Purchasers of the Warrants or the Warrant Shares may not engage in hedging transactions with regard to the Warrants or the Warrant Shares unless in compliance with the Securities Act.
Repayment of Notes
On March 7, 2011, we announced that we repaid our $23,000,000 principal amount of Notes (plus accrued interest) which matured on March 4, 2011.
None.
Disclosure Controls and Procedures.
At the end of the period covered by this annual report of Form 10-K for the fiscal year ended December 31, 2010, an evaluation was carried out under the supervision of and with the participation of our management, including the Chief Executive Officer (“CEO”) and Chief Financial Officer (“CFO”), of the effectiveness of the design and operations of our disclosure controls and procedures (as defined in Rule 13a-15(e) and Rule 15d-15(e) under the Exchange Act). Based on that evaluation the CEO and the CFO have concluded that as of the end of the period covered by this annual report, our disclosure controls and procedures were effective in ensuring that: (i) information required to be disclosed by us in reports that we file or submit to the SEC under the Exchange Act is recorded, processed, summarized and reported within the time periods specified in applicable rules and forms and (ii) material information required to be disclosed in our reports filed under the Exchange Act is accumulated and communicated to our management, including our CEO and CFO, as appropriate, to allow for accurate and timely decisions regarding required disclosure.
Internal Control over Financial Reporting.
Management’s Annual Report on Internal Control over Financial Reporting.
Our management is responsible for establishing and maintaining adequate internal control over financial reporting. Internal control over financial reporting is defined in Rule 13a-15(f) and Rule 15d-15(f) promulgated under the Exchange Act as a process designed by, or under the supervision of, our principal executive and principal financial officers and effected by our Board of Directors, management and other personnel, to provide reasonable assurance regarding the reliability of financial reporting and the preparation of financial statements for external purposes in accordance with generally accepted accounting principles. Our internal control over financial reporting includes those policies and procedures that:
|
|
·
|
pertain to the maintenance of records that, in reasonable detail, accurately and fairly reflect the transactions and dispositions of our assets;
|
|
|
·
|
provide reasonable assurance that transactions are recorded as necessary to permit preparation of financial statements in accordance with generally accepted accounting principles, and that our receipts and expenditures are being made only in accordance with authorizations of our management and directors; and
|
|
|
·
|
provide reasonable assurance regarding prevention or timely detections of unauthorized acquisition, use or disposition of our assets that could have a material effect on the financial statements.
|
Our management assessed the effectiveness of our internal control over financial reporting as of December 31, 2010. In making this assessment, our management used the criteria set forth in the Internal Control—Integrated Framework issued by the Committee of Sponsoring Organizations of the Treadway Commission (COSO). Based on our assessment, we have concluded that, as of December 31, 2010, our internal controls over financial reporting were effective based on those criteria.
The effectiveness of internal control over financial reporting as of December 31, 2010 has been audited by PricewaterhouseCoopers LLP, the independent registered public accounting firm that audited our Financial Statements included in this annual report.
Attestation Report of the Registered Public Accounting Firm.
PricewaterhouseCoopers LLP’s attestation report on our internal control over financial reporting is included as part of Item 8. Financial Statements and Supplementary Data herein.
Changes in Internal Controls
.
There has been no change in our internal control over financial reporting during the year ended December 31, 2010 that has materially affected, or is reasonably likely to materially affect, our internal control over financial reporting.
None.
Information concerning our directors will be contained in our definitive Proxy Statement to be filed pursuant to Regulation 14A promulgated under the Exchange Act for the 2011 Annual General Meeting of Shareholders (the “Proxy Statement”) under the caption “Particulars of Matters to be Acted Upon—Election of Directors” and is incorporated herein by reference.
Information concerning our audit committee, including designation of the “Audit Committee Financial Expert” under applicable SEC rules, will be contained in the Proxy Statement under the captions “Corporate Governance—Committees of the Board of Directors and Meetings” and “—Audit Committee Report” and is incorporated herein by reference.
Information concerning certain filing obligations under the federal securities laws applicable to our directors and executive officers, and holders of more than 10% of our Common Shares, will be contained in the Proxy Statement under the caption “Ownership of the Corporation’s Common Shares” and is incorporated herein by reference.
We have adopted a code of ethics that applies to all our directors, officers and employees. This code is publicly available on our website at
www.vistagold.com
and on SEDAR at
www.sedar.com.
Amendments to the code of ethics and any grant of a waiver from a provision of the code requiring disclosure under applicable SEC rules will be disclosed on our website.
NYSE Amex Corporate Governance
Our Common Shares are listed on NYSE Amex. Section 110 of the NYSE Amex Company Guide permits NYSE Amex to consider the laws, customs and practices of foreign issuers in relaxing certain NYSE Amex listing criteria, and to grant exemptions from NYSE Amex listing criteria based on these considerations. A company seeking relief under these provisions is required to provide written certification from independent local counsel that the non-complying practice is not prohibited by home country law. A description of the significant ways in which our governance practices differ from those followed by domestic companies pursuant to NYSE Amex standards is available on our website at www.vistagold.com.
Information concerning this item will be contained in the Proxy Statement under the caption “Compensation Committee Report on Executive Compensation” and is incorporated herein by reference.
Information relating to security ownership of certain beneficial owners of our Common Shares and information relating to the security ownership of our management will be contained in the Proxy Statement under the caption “Ownership of the Corporation’s Common Shares” and is incorporated herein by reference.
Information relating to our equity compensation plans will be contained in the Proxy Statement under the captions “Compensation Committee Report on Executive Compensation—Stock Option Plan” and “Securities Reserved for Issuance under Equity Compensation Plans” and is incorporated herein by reference.
Information concerning this item will be contained in the Proxy Statement under the captions “Interest of Certain Persons in Material Transactions and Matters to be Acted Upon” and “Indebtedness of Directors and Senior Officers” and is incorporated herein by reference.
Information concerning this item will be contained in the Proxy Statement under the caption “Particulars of Matters to be Acted Upon—Appointment of Auditors” and “—Fees Paid to Auditors and their Independence from the Corporation” and is incorporated herein by reference.
Documents Filed as Part of Report
Financial Statements
The following Consolidated Financial Statements of the Corporation are filed as part of this report:
|
|
1.
|
Report of Independent Accountants dated March 14, 2011.
|
|
|
2.
|
Consolidated Balance Sheets—At December 31, 2010 and 2009.
|
|
|
3.
|
Consolidated Statements of Loss and Comprehensive Loss—Years ended December 31, 2010, 2009, and 2008.
|
|
|
4.
|
Consolidated Statements of Deficit—Years ended December 31, 2010, 2009 and 2008.
|
|
|
5.
|
Consolidated Statements of Cash Flows—Years ended December 31, 2010, 2009, and 2008.
|
|
|
6.
|
Notes to Consolidated Financial Statements.
|
See “Item 8. Consolidated Financial Statements and Supplementary Data”.
Financial Statement Schedules
No financial statement schedules are filed as part of this report because such schedules are not applicable or the required information is shown in the Consolidated Financial Statements or notes thereto. See “Item 8. Financial Statements and Supplementary Data”.
Exhibits
The following exhibits are filed as part of this report:
|
Exhibit
Number
|
Description
|
|
3.01
|
Articles of Continuation filed as Exhibit 2.01 to the Form 20-F for the period ended December 31, 1997 and incorporated herein by reference (File No. 1-9025)
|
|
3.02
|
By-Law No. 1 of Vista Gold filed as Schedule B to the Management Information and Proxy Circular as filed on Form 6-K as filed with the SEC on April 9, 1998 and incorporated herein by reference (File No. 1-9025)
|
|
3.03
|
Amended By-Law No. 1 of Vista Gold filed as Schedule D to the Management Information and Proxy Circular as filed with the SEC on April 7, 1999 and incorporated herein by reference (File No. 1-9025)
|
|
3.04
|
Articles of Arrangement of Vista Gold Corp., dated May 10, 2007 filed as Exhibit 3 to the Corporation’s Current Report on Form 8-K, dated May 10, 2007 and incorporated herein by reference (File No. 1-9025)
|
|
4.01
|
Note Indenture, dated March 4, 2008, among Vista Gold Corp., Minera Paredones Amarillos S.A. de C.V., as guarantor, HSBC Bank USA, N.A., as trustee and HSBC México, S.A. De C.V., Institución de Banca Múltiple, Grupo Financiero HSBC, División Fiduciaria, as collateral agent filed as Exhibit 4.1 to the Corporation’s Current Report on Form 8-K dated March 3, 2008 and incorporated herein by reference (File No. 1-9025)
|
|
4.02
|
Special Warrant Indenture, dated October 22, 2010 filed as Exhibit 4.1 to the Corporation’s Current Report on Form 8-K dated December 15, 2010 and incorporated herein by reference (File No. 1-9025)
|
|
4.03
|
Warrant Indenture, dated October 22, 2010 filed as Exhibit 4.2 to the Corporation’s Current Report on Form 8-K dated December 15, 2010 and incorporated herein by reference (File No. 1-9025)
|
|
10.01
|
Stock Option dated July 1, 1985, between Henry C. Crofoot, trustee, and incorporated herein by reference (File No. 1-9025)
|
|
10.02
|
Data Purchase, Production Payment Grant and Option to Purchase Production Payment Agreement dated August 1, 2003 between Vista Gold and Enrique Gaitan Maumejean filed as Exhibit 10.20 to the Corporation’s Annual Report on Form 10-K for the year ended December 31, 2003 and incorporated herein by reference (File No. 1-9025)
|
|
10.03
|
Amendment Agreement dated January 14, 1988, among Henry C. Crofoot et al and Enrique Gaitan Maumejean filed as Exhibit 10.21 to Granges’ Annual Report on Form 10-K for the year ended December 31, 2003 and incorporated herein by reference (File No. 1-9025)
|
|
10.04
|
Lewis Hycroft Agreement dated January 10, 1989, among Frank W. Lewis, Hycroft Lewis and Hycroft Resources—Development Inc. filed as Exhibit 10.16 to Granges’ Annual Report on Form 10-K for the year ended December 31, 2004 and incorporated herein by reference (File No. 1-9025)
|
|
10.05
|
Employment Agreement dated June 1, 2004 between Vista Gold and Gregory G. Marlier filed as Exhibit 10.25 to the Form 10-K for the year ended December 31, 2004 and incorporated herein by reference (File No. 1-9025)
|
|
10.06
|
Employment Agreement effective as of January 1, 2005 between Vista Gold and Michael B. Richings filed as Exhibit 10.27 to the Form 10-K for the year ended December 31, 2005 and incorporated herein by reference (File No. 1-9025)
|
|
10.07
|
Third Amendment Agreement dated January 19, 2005, between Vista Gold Corp. and Luzon Minerals Ltd. filed as Exhibit 10.23 to the Form 10-K for the year ended December 31, 2005 and incorporated herein by reference (File No. 1-9025)
|
|
10.08
|
Stock Option Plan of Vista Gold dated November 1996 as amended in November 1998, May 2003, May 2005 and May 2006 filed as Schedule C to the Corporation’s Annual Report on April 3, 2006 and incorporated herein by reference (File No. 1-9025)
|
|
10.09
|
Share Purchase Agreement dated August 29, 2002 between Vista Gold and Viceroy Minerals Corporation filed as Exhibit 10.25 to the Corporation’s Annual Report on Form 10-K for the year ended December 31, 2005 and incorporated herein by reference (File No. 1-9025)
|
|
10.10
|
Purchase Agreement dated October 7, 2002 between Vista Gold and Newmont Mining Corporation filed as Exhibit 10.26 to the Corporation’s Annual Report on Form 10-K for the year ended December 31, 2005 and incorporated herein by reference (File No. 1-9025)
|
|
10.11
|
Venture Assignment Agreement dated May 9, 2005 between Vista Gold Corp. filed as Exhibit 10.27 to the Corporation’s Annual Report on Form 10-K for the year ended December 31, 2005 and incorporated herein by reference (File No. 1-9025)
|
|
10.12
|
Assignment Agreement, dated May 9, 2005, between Continental Goldfields Limited and Vista Gold Corp. filed as Exhibit 10.28 to the Corporation’s Annual Report on Form 10-K for the year ended December 31, 2005 and incorporated herein by reference (File No. 1-9025)
|
|
10.13
|
Assignment of Rights dated May 9, 2005, between ORT Limited and Vista Gold Corp. filed as Exhibit 10.29 to the Corporation’s Annual Report on Form 10-K for the year ended December 31, 2005 and incorporated herein by reference (File No. 1-9025)
|
|
10.14
|
Option to Purchase Agreement dated July 18, 2005 between Vista Gold and Monex Exploration filed as Exhibit 10.1 to the Corporation’s Annual Report on Form 8-K, dated July 18, 2005 and incorporated herein by reference (File No. 1-9025)
|
|
10.15
|
Purchase Agreement dated November 7, 2005 between Vista Gold Corp. and Luzon Minerals Ltd. filed as Exhibit 10.1 to the Corporation’s Annual Report on Form 8-K, dated November 7, 2005 and incorporated herein by reference (File No. 1-9025)
|
|
10.16
|
Finder’s Fee Agreement and each Purchaser as defined therein filed as Exhibit 10.1 to the Corporation’s Current Report on Form 8-K, dated February 2, 2006 and incorporated herein by reference (File No. 1-9025)
|
|
10.17
|
Form of Subscription Agreement dated September 29, 2004, between Vista Gold and each Purchaser as defined therein filed as Exhibit 10.1 to the Corporation’s Form 10-Q for the quarter ended September 30, 2004 and incorporated herein by reference (File No. 1-9025)
|
|
10.18
|
Agreement, dated March 1, 2006, among the Northern Territory of Australia, Vista Gold Australia Pty Ltd. and Vista Gold Corp. filed as Exhibit 10.24 to the Corporation’s Annual Report on Form 8-K, dated February 28, 2006 and incorporated herein by reference (File No. 1-9025)
|
|
10.19
|
Employment Agreement dated June 1, 2004 between Vista Gold and Gregory G. Marlier filed as Exhibit 10.3 to the Corporation’s Annual Report on Form 8-K, dated February 28, 2006 and incorporated herein by reference (File No. 1-9025)
|
|
10.20
|
Letter Agreement, dated April 12, 2005, between Prime Corporate Finance Pty Limited and Vista Gold Corp. filed as Exhibit 10.43 to the Corporation’s Annual Report on Form 10-K for the year ended December 31, 2005 and incorporated herein by reference (File No. 1-9025)
|
|
10.21
|
Employment Agreement effective as of January 1, 2005 between Vista Gold and Michael B. Richings filed as Exhibit 10.1 to the Corporation’s Annual Report on Form 8-K, dated July 6, 2006 and incorporated herein by reference (File No. 1-9025)
|
|
10.22
|
Amendment to Purchase Agreement, dated January 19, 2005, between Vista Gold Corp. filed as Exhibit 10.23 to the Corporation’s Annual Report on Form 8-K for the SEC on August 16, 2006) and incorporated herein by reference (File No. 1-9025)
|
|
10.23
|
Deed of Option, dated October 28, 2004, between Weston Investments, Organic Resources, Vista Gold Corp., Salu Siwa and JCI Limited filed as Exhibit 10.24 to the Corporation’s Annual Report on Form 8-K for the SEC on August 25, 2006) and incorporated herein by reference (File No. 1-9025)
|
|
10.24
|
Arrangement and Merger Agreement dated as of September 22, 2006, between Vista Gold Corp., Allied Nevada Gold Corp., Carl Pescio and JCI Limited filed as Exhibit 10.25 to the Corporation’s Annual Report on Form 8-K for the year ended December 31, 2005 and incorporated herein by reference (File No. 1-9025)
|
|
10.25
|
Employment Agreement, dated as of September 22, 2006, between Vista Gold Corp., and JCI Limited filed as Exhibit 10.26 to the Corporation’s Annual Report on Form 8-K for the year ended December 31, 2005 and incorporated herein by reference (File No. 1-9025)
|
|
10.26
|
Assignment Agency Agreement, dated as of October 30, 2006, among Vista Gold Corp., filed as Exhibit 10.27 to the Corporation’s Annual Report on Form 8-K dated October 30, 2006 and incorporated herein by reference (File No. 1-9025)
|
|
10.27
|
Assignment Loan Agreement dated May 9, 2005, between Vista Gold Corp. filed as Exhibit 10.28 to the Corporation’s Annual Report on Form 8-K dated December 22, 2006 and incorporated herein by reference (File No. 1-9025)
|
|
10.28
|
Assignment Agreement, dated May 9, 2005, between ORT Limited and Vista Gold Corp. filed as Exhibit 10.2 to the Corporation’s Annual Report on Form 8-K dated December 22, 2006 and incorporated herein by reference (File No. 1-9025)
|
|
10.29
|
Purchase Letter Agreement dated July 18, 2005, between Vista Gold Corp. and Luzon Minerals Ltd. filed as Exhibit 10.1 to the Corporation’s Current Report on Form 8-K dated July 18, 2005 and incorporated herein by reference (File No. 1-9025)
|
|
10.30
|
Fee Letter Agreement dated March 13, 2007, between Vista Gold Corp. and Luzon Minerals Ltd. filed as Exhibit 10.53 to the Corporation’s Annual Report on Form 10-K for the year ended December 31, 2006 and incorporated herein by reference (File No. 1-9025)
|
|
10.31
|
Amendment to Arrangement and Merger Agreement by and among Vista Gold Corp., Allied Nevada Gold Corp., Carl Pescio and Janet Pescio, dated May 8, 2007 filed as Exhibit 10.1 to the Corporation’s Current Report on Form 8-K, dated May 10, 2007 and incorporated herein by reference (File No. 1-9025)
|
|
10.32
|
Letter Agreement dated November 20, 2007, between Vista Gold Corp. and Luzon Minerals Ltd. filed as Exhibit 10.1 to the Corporation’s Current Report on Form 8-K, dated November 20, 2007 and incorporated herein by reference (File No. 1-9025)
|
|
10.33
|
Agreement dated December 19, 2007, between Grandcru Resource Corporation and Vista Gold Corp. filed as Exhibit (use corresponding Exhibit #) to the Corporation’s Annual Report on Form 10-K for the year ended December 31, 2007 and incorporated herein by reference (File No. 1-9025)
|
|
10.34
|
Purchase and Termination Agreement dated December 19, 2007, among (i) Klaus Genssler, Genssler Investment Partnership, LLP, Douglas D. Foote and Synergex Group Limited Partnership, (ii) Grandcru Resources Corporation, (iii) Minera Paredones Amarillos, S.A. de C.V. and (iv) Vista Gold Corp. filed as Exhibit (use corresponding Exhibit #) to the Corporation’s Annual Report on Form 10-K for the year ended December 31, 2007 and incorporated herein by reference (File No. 1-9025)
|
|
10.35
|
Termination and Purchase Agreement dated December 21, 2007, among (i) Goldcorp Inc., Luismin S.A. de C.V. and Desarrollos Mineros San Luis, S.A. de C.V., (ii) Grandcru Resources Corporation, (iii) Minera Paredones Amarillos, S.A. de C.V. and (iv) Vista Gold Corp. filed as Exhibit (use corresponding Exhibit #) to the Corporation’s Annual Report on Form 10-K for the year ended December 31, 2007 and incorporated herein by reference (File No. 1-9025)
|
|
10.36
|
Asset Sale Agreement dated January 4, 2008, among Vista Gold Corp., Minera Paredones Amarillos, S.A. de C.V., Del Norte Company, Ltd. and A.M. King Industries, Inc. filed as Exhibit 10.1 to the Corporation’s Current Report on Form 8-K, dated January 2, 2008, and incorporated herein by reference (File No. 1-9025)
|
|
10.37
|
Agency Agreement, dated March 4, 2008, between Vista Gold Corp. and Casimir Capital L.P. filed as Exhibit 10.1 to the Corporation’s Current Report on Form 8-K dated March 3, 2008 and incorporated herein by reference (File No. 1-9025)
|
|
10.38
|
Form of Subscription Agreement dated March 4, 2008, between Vista Gold Corp. and each Subscriber as defined therein filed as Exhibit 10.2 to the Corporation’s Current Report on Form 8-K dated March 3, 2008 and incorporated herein by reference (File No. 1-9025)
|
|
10.39
|
Purchase and Sale Agreement dated March 4, 2008, among Vista Gold Corp., Vista Gold (Antigua) Corp. and Republic Gold Limited ACN 106399311, filed as Exhibit 10.1 to the Corporation’s Current Report on Form 8-K dated April 4, 2008 and incorporated herein by reference (File No. 1-9025)
|
|
10.40
|
Note Repurchase Agreement, dated July 14, 2009, by and between the Corporation and Whitebox Combined Partners, LP filed as Exhibit 10.1 to the Corporation’s Current Report on Form 8-K dated July 20, 2009 and incorporated herein by reference (File No. 1-9025)
|
|
10.41
|
Note Repurchase Agreement, dated July 14, 2009, by and between the Corporation and Whitebox Convertible Arbitrage Partners, LP filed as Exhibit 10.2 to the Corporation’s Current Report on Form 8-K dated dated July 20, 2009 and incorporated herein by reference (File No. 1-9025)
|
|
10.42
|
Note Repurchase Agreement, dated July 14, 2009, by and between the Company and Whitebox Special Opportunities Fund Series B Partners, LP filed as Exhibit 10.3 to the Corporation’s Current Report on Form 8-K dated dated July 20, 2009 and incorporated herein by reference (File No. 1-9025)
|
|
10.43
|
Joint Venture Agreement dated December 23, 2009 between Vista Gold (Barbados) Corp. and Pan Asia Resources Corporation filed as Exhibit 10.43 to the Corporation’s Annual Report on Form 10-K dated March 16, 2010 and incorporated herein by reference (File No. 1-9025)
|
|
10.44
|
Note Repurchase Agreement dated May 13, 2010, by and between the Corporation and the Noteholder filed as Exhibit 10.1 to the Corporation’s Quarterly Report on Form 10-Q dated August 6, 2010 and incorporated herein by reference (File No. 1-9025)
|
|
10.45
|
Canadian Agent Agreement dated September 29, 2010, filed as Exhibit 10.1 to the Corporation’s Quarterly Report on Form 10-Q dated November 9, 2010 and incorporated herein by reference (File No. 1-9025)
|
|
10.46
|
Canadian Amended and Restated Agent Agreement, dated October 22, 2010, filed as Exhibit 10.2 to the Corporation’s Quarterly Report on Form 10-Q dated August 6, 2010 and incorporated herein by reference (File No. 1-9025)
|
|
10.47
|
United States Finder’s Agreement dated September 30, 2010, filed as Exhibit 10.3 to the Corporation’s Quarterly Report on Form 10-Q dated August 6, 2010 and incorporated herein by reference (File No. 1-9025)
|
|
10.48
|
Canadian Finder’s Agreement dated October 22, 2010, filed as Exhibit 10.4 to the Corporation’s Quarterly Report on Form 10-Q dated August 6, 2010 and incorporated herein by reference (File No. 1-9025)
|
SIGNATURES
Pursuant to the requirements of Section 13 or 15(d) of the
Securities Exchange Act of 1934
, the registrant has duly caused this report to be signed on its behalf by the undersigned, thereunto duly authorized.
|
VISTA GOLD CORP.
(Registrant)
|
|
|
Dated: March 14, 2011
|
By: /s/
Michael B. Richings
|
|
Michael B. Richings,
|
|
|
Executive Chairman and Chief Executive Officer
|
|
|
Dated: March 14, 2011
|
By: /s/
Gregory G. Marlier
|
|
Gregory G. Marlier
|
|
|
Chief Financial Officer
|
Pursuant to the requirements of the Securities Exchange Act of 1934, this report has been signed below by the following persons on behalf of the registrant and in the capacities and on the dates indicated:
|
Dated: March 14, 2011
|
By: /s/
Michael B. Richings
|
|
Michael B. Richings,
|
|
|
Executive Chairman and Chief Executive Officer
|
|
|
(Principal Executive Officer)
|
|
|
Dated: March 14, 2011
|
By: /s/
Gregory G. Marlier
|
|
Gregory G. Marlier
|
|
|
Chief Financial Officer
|
|
|
(Principal Financial and Accounting Officer)
|
Pursuant to the requirements of the Securities Exchange Act of 1934, this report has been signed below by the following persons on behalf of the registrant and in the capacities and on the dates indicated:
|
Signature
|
Capacity
|
Date
|
|
/s/
Michael B. Richings
Michael B. Richings
|
Director
|
March 14, 2011
|
|
*
John M. Clark
|
Director
|
March 14, 2011
|
|
*
C. Thomas Ogryzlo
|
Director
|
March 14, 2011
|
|
*
Tracy Stevenson
|
Director
|
March 14, 2011
|
|
*
W. Durand Eppler
|
Director
|
March 14, 2011
|
|
*
Frederick H. Earnest
|
Director
|
March 14, 2011
|
|
* By: /s/ Michael B. Richings
|
||
|
|
||
|
Michael B. Richings
Attorney-in-Fact
|
Pursuant to Power of Attorney filed as
Exhibit 24
herewith.
TABLE OF CONTENTS
Part IItem 1. BusinessItem 1A. Risk FactorsItem 1B. Unresolved Staff CommentsItem 2. PropertiesItem 3. Legal ProceedingsItem 4. [removed and Reserved]Part IIItem 5. Market For Registrant S Common Equity, Related Stockholder Matters and Issuer Purchases Of Equity SecuritiesItem 6. Selected Financial DataItem 7. Management S Discussion and Analysis Of Financial Condition and Results Of OperationsItem 7A Quantitative and Qualitative Disclosures About Market RiskItem 8 Financial Statements and Supplementary DataItem 9. Changes in and Disagreements with Accountants on Accounting and Financial DisclosureItem 9A. Controls and ProceduresItem 9B. Other InformationPart II IItem 10. Directors, Executive Officers and Corporate GovernanceItem 11. Executive CompensationItem 12. Security Ownership Of Certain Beneficial Owners and Management and Related Stockholder MattersItem 13. Certain Relationships and Related TransactionsItem 14. Principal Accountant Fees and ServicesPart IVItem 15. Exhibits and Financial Statement Schedules