UNITED STATES
SECURITIES AND EXCHANGE COMMISSION
Washington, D.C. 20549
FORM 10-K
|
(Mark One)
|
|
|
x
|
ANNUAL REPORT PURSUANT TO SECTION 13 OR 15(d) OF THE SECURITIES EXCHANGE ACT OF 1934
|
For the Fiscal Year Ended December 31, 2017
or
|
o
|
TRANSITION REPORT PURSUANT TO SECTION 13 OR 15(d) OF THE SECURITIES EXCHANGE ACT OF 1934
|
For the Transition Period From ________ to _________
Commission file number: 000-55791
________________________________________________
VICI PROPERTIES INC.
(Exact name of registrant as specified in its charter)
________________________________________________
|
Maryland
|
81-4177147
|
|
|
(State or other jurisdiction of incorporation or organization)
|
(I.R.S. Employer Identification No.)
|
|
8329 W. Sunset Road, Suite 210 Las Vegas, Nevada 89113
(Address of Principal Executive Offices) (Zip Code)
Registrant’s telephone number, including area code: (702) 820-3800
SECURITIES REGISTERED PURSUANT TO SECTION 12(b) OF THE ACT:
|
Title of each class
|
Name of each exchange on which registered
|
|
|
Common stock, $0.01 par value
|
New York Stock Exchange
|
|
SECURITIES REGISTERED PURSUANT TO SECTION 12(g) OF THE ACT:
None
Indicate by check mark if the registrant is a well-known seasoned issuer, as defined in Rule 405 of the Securities Act. Yes
o
No
x
Indicate by check mark if the registrant is not required to file reports pursuant to Section 13 or Section 15(d) of the Act. Yes
o
No
x
Indicate by check mark whether the registrant (1) has filed all reports required to be filed by Section 13 or 15(d) of the Securities Exchange Act of 1934 during the preceding 12 months (or for such shorter period that the registrant was required to file such reports), and (2) has been subject to such filing requirements for the past 90 days. Yes
x
No
o
Indicate by check mark whether the registrant has submitted electronically and posted on its corporate Web site, if any, every Interactive Data File required to be submitted and posted pursuant to Rule 405 of Regulation S-T (§232.405 of this chapter) during the preceding 12 months (or for such shorter period that the registrant was required to submit and post such files). Yes
x
No
o
Indicate by check mark if disclosure of delinquent filers pursuant to Item 405 of Regulation S-K (§229.405) is not contained herein, and will not be contained, to the best of registrant’s knowledge, in definitive proxy or information statements incorporated by reference in Part III of this Form 10-K or any amendment to this Form 10-K.
x
Indicate by check mark whether the registrant is a large accelerated filer, an accelerated filer, a non-accelerated filer, smaller reporting company, or an emerging growth company. See the definitions of “large accelerated filer,” “accelerated filer,” “smaller reporting company,” and “emerging growth company” in Rule 12b-2 of the Exchange Act.
|
Large accelerated filer
|
o
|
Accelerated filer
|
o
|
|
Non-accelerated filer
|
x
(Do not check if a smaller reporting company)
|
Smaller reporting company
|
o
|
|
Emerging growth company
|
o
|
||
If an emerging growth company, indicate by check mark if the registrant has elected not to use the extended transition period for complying with any new or revised financial accounting standards provided pursuant to Section 13(a) of the Exchange Act.
o
Indicate by check mark whether the registrant is a shell company (as defined in Rule 12b-2 of the Act). Yes
o
No
x
As of June 30, 2017 (the last day of the registrant’s most recently completed second fiscal quarter), the registrant’s common stock was not listed on any exchange or over-the-counter market. The registrant’s common stock was first publicly traded on the OTC Markets Group, Inc.’s “Grey Market” on October 18, 2017 and began trading on the New York Stock Exchange on February 1, 2018. As of February 28, 2018, the aggregate market value of the common stock held by non-affiliates of the registrant was approximately $7.23 billion.
As of February 28, 2018, the registrant had 370,128,832 shares of common stock outstanding.
DOCUMENTS INCORPORATED BY REFERENCE
Portions of the registrant’s definitive proxy statement for its 2018 annual meeting of stockholders are incorporated by reference into Part III of this Annual Report on Form 10-K. Such proxy statement, or an amendment to this Annual Report on Form 10-K, will be filed with the U.S. Securities and Exchange Commission within 120 days after the end of the calendar year to which this report relates.
|
|
TABLE OF CONTENTS
|
Page
|
In this Annual Report on Form 10-K, the words “VICI,” “VICI REIT,” “Company,” “we,” “our,” and “us” refer to VICI Properties Inc., unless otherwise stated or the context requires otherwise.
We refer to (i) our Consolidated Financial Statements as our “Financial Statements,” (ii) our Consolidated Statement of Operations as our “Statement of Operations,” and (iii) our Consolidated Balance Sheets as our “Balance Sheet.” References to numbered “Notes” refer to Notes to our Consolidated Financial Statements included in Item 8.
“CEOC” refers to Caesars Entertainment Operating Company, Inc., a Delaware corporation, and its subsidiaries, prior to the October 6, 2017 (the “Formation Date”), and following the Formation Date, CEOC, LLC, a Delaware limited liability company and its subsidiaries. CEOC is a subsidiary of Caesars.
“Caesars” or “CEC” refers to Caesars Entertainment Corporation and its subsidiaries. “CRC” refers to Caesars Resort Collection, LLC, a Delaware limited liability company which is a subsidiary of Caesars.
“VICI PropCo” refers to VICI Properties 1 LLC, a Delaware limited liability company, which through its subsidiaries owns the real estate assets transferred by CEOC to VICI on the Formation Date and “CPLV” refers to the Caesars Palace Las Vegas facility located on the Las Vegas Strip, which was owned by CEOC prior to the Formation Date and whose related real estate assets were transferred by CEOC to us on the Formation Date.
“HLV” refers to the real estate of Harrah’s Las Vegas Hotel & Casino facility located on the Las Vegas Strip which we purchased from a subsidiary of CRC on December 22, 2017.
“HLV Lease Agreement” refers to the lease agreement for the Harrah’s Las Vegas facilities. “CPLV Lease Agreement” refers to
the lease agreement for Caesars Palace Las Vegas; “Joliet Lease Agreement” refers to the lease agreement for the facilities in Joliet, Illinois; and the“Non-CPLV Lease Agreement” refers to the lease agreement for regional properties other than the facilities in Joliet, Illinois (together, the “Formation Lease Agreements”). “Lease Agreements” refers collectively to the CPLV Lease Agreement, the Non-CPLV Lease Agreement, the Joliet Lease Agreement and the HLV Lease Agreement, unless the context otherwise requires.
|
ITEM 1.
|
Business
|
Overview of the Company
We are an owner and acquirer of experiential real estate assets across leading gaming, hospitality, entertainment and leisure destinations. Our national, geographically diverse portfolio consists of 20 market-leading properties, including Caesars Palace Las Vegas and Harrah’s Las Vegas, two of the most iconic entertainment facilities on the Las Vegas Strip. Our entertainment facilities are leased to leading brands that seek to drive consumer loyalty and value with guests through superior services, experiences, products and continuous innovation. Across more than 36 million square feet, our well-maintained properties are located in nine states, contain nearly 14,500 hotel rooms and feature over 150 restaurants, bars and nightclubs. Our portfolio also includes approximately 34 acres of undeveloped land adjacent to the Las Vegas Strip that is leased to Caesars, which we may look to monetize as appropriate. We also own and operate four championship golf courses located near certain of our properties, two of which are in close proximity to the Las Vegas Strip. As a growth focused public real estate company, we expect our relationship with our partners will position us for the acquisition of additional properties across leisure and hospitality.
In December 2017, we acquired from an affiliate of Caesars and then leased back the real estate assets of Harrah’s Las Vegas for approximately $1.14 billion, and we simultaneously sold to Caesars approximately 18.4 acres of undeveloped land located behind the LINQ Hotel & Casino and Harrah’s Las Vegas for $73.6 million (the “Eastside Property”). Simultaneous with this transaction, VICI PropCo entered into a new credit facility (the “VICI PropCo Credit Facility”), comprised of a $2.2 billion senior secured term loan B facility (the “Term Loan B Facility”) and a $400.0 million senior secured revolving credit facility (the “Revolving Credit Facility”), and we used the proceeds from the Term Loan B Facility and drawings under the Revolving Credit Facility to refinance a portion of our outstanding long-term debt.
Our portfolio is competitively positioned and well-maintained. Pursuant to the terms of the Lease Agreements, which require Caesars to invest in our properties, and in line with its commitment to build guest loyalty, we anticipate Caesars will continue to make strategic value-enhancing investments in our properties over time, helping to maintain their competitive position. In addition,
1
given our scale and deep industry knowledge, we believe we are well-positioned to execute highly complementary single-asset and portfolio acquisitions to augment growth.
We intend to elect and qualify to be taxed as a REIT for U.S. Federal income tax purposes commencing with our taxable year ended December 31, 2017. We believe our election of REIT status combined with the income generation from the Lease Agreements will enhance our ability to make distributions to our stockholders, providing investors with current income as well as long-term growth.
Recent Developments
On February 5, 2018, the Company completed an initial public offering of 69,575,000 shares of common stock (which included 9,075,000 shares of common stock related to the overallotment option exercised by the underwriters in full) at an offering price of $20.00 per share for gross proceeds of $1,391.5 million, resulting in net proceeds of approximately $1,307.0 million after commissions and expenses. The Company utilized a portion of the net proceeds from the stock offering to: (a) pay down $300.0 million of indebtedness outstanding under the Revolving Credit Facility; (b) redeem $268.4 million in aggregate principal amount of the Second Lien Notes at a redemption price of 108% plus accrued and unpaid interest to the date of the redemption; and (c) repay $100.0 million of the Term Loan B Facility.
Our Competitive Strengths
We believe the following strengths effectively position us to execute our business and growth strategies:
Leading portfolio of high-quality experiential gaming, hospitality, entertainment and leisure assets.
Our portfolio features Caesars Palace Las Vegas and Harrah’s Las Vegas and market-leading regional properties with significant scale. Our properties are well-maintained and leased to leading brands, such as Caesars, Horseshoe, Harrah’s and Bally’s. These brands seek to drive loyalty and value with guests through superior service and products and continuous innovation. Our portfolio benefits from its strong mix of demand generators, including casinos, guest rooms, restaurants, entertainment facilities, bars and nightclubs and convention space. We believe our properties are well-insulated from incremental competition as a result of high replacement costs, as well as regulatory restrictions and long-lead times for new development. The high quality of our properties appeals to a broad base of customers, stimulating traffic and visitation.
Our portfolio is anchored by our Las Vegas properties, Caesars Palace Las Vegas and Harrah’s Las Vegas, which are located at the center of the Strip. We believe Las Vegas is one of the most attractive travel destinations in the United States, with a record 42.9 million visitors in 2016, according to the Las Vegas Convention and Visitors Authority. We believe Las Vegas is a market characterized by steady economic growth and high consumer and business demand with limited new supply. Our Las Vegas properties, which are two of the most iconic entertainment facilities in Las Vegas, feature gaming entertainment, large-scale hotels, extensive food and beverage options, state-of-the-art convention facilities, retail outlets and entertainment showrooms. Our Las Vegas properties continue to benefit from positive macroeconomic trends, including, according to Caesars’ publicly available information, record visitation levels in 2016 and strong convention attendance, hotel occupancy and average daily rates, among other key indicators.
Our portfolio also includes market-leading regional resorts that we believe are benefiting from significant invested capital over recent years. The regional properties we own include award-winning land-based and dockside casinos, hotels and entertainment facilities that are market leaders within their respective regions. The properties operate primarily under the Caesars, Harrah’s, Horseshoe and Bally’s trademark and brand names, which, in many instances, have market-leading brand recognition.
Under the terms of the Lease Agreements, the tenants are required to continue to invest in the properties, which we believe will enhance the value of our properties.
Our properties feature diversified sources of revenue on both a business and geographic basis.
Our portfolio includes 20 geographically diverse casino resorts that serve numerous Metropolitan Statistical Areas (“MSAs”) nationally. This diversity reduces our exposure to adverse events that may affect any single market. This also allows our tenants to derive revenue from an economically diverse set of customers who work in a variety of industries. Additionally, although the Lease Agreements are with subsidiaries of Caesars, Caesars generates revenue from a diverse set of services that it offers its customers. These include gaming, food and beverage, entertainment, hospitality and other sources of revenue. We believe that this
2
geographic diversity and the diversity of revenue sources that our tenants derive from our leased properties improves the stability of rental revenue.
Our long-term Lease Agreements provide a highly predictable base level of rent with embedded growth potential.
Our properties are 100% occupied pursuant to our long-term triple-net Lease Agreements with subsidiaries of Caesars, providing us with a predictable level of rental revenue to support future cash distributions to our stockholders. In October 2017, we entered into the Formation Lease Agreements and in December 2017, we entered into the HLV Lease Agreement.
Caesars is generally not permitted to remove individual properties from the Non-CPLV Lease Agreement and has the right, following certain casualty events or condemnations, to terminate the respective Lease Agreement with respect to affected properties. All of our casino resort properties are established assets with extensive operating histories. Based on historical performance of the properties, we expect that the properties will generate sufficient revenues for Caesars’ subsidiaries to pay to us all rent due under the Lease Agreements.
We believe our relationship with Caesars, including our contractual agreements with it and its applicable subsidiaries, will continue to drive significant benefits and mutual alignment of strategic interests in the future.
Caesars or CRC guarantees the payment obligations of our tenants under the Lease Agreements.
All of our existing properties are leased to subsidiaries of Caesars. Caesars guarantees the payment obligations of our tenants under the Formation Lease Agreements and CRC, a subsidiary of Caesars, guarantees the payment obligations of our tenant under the HLV Lease Agreement. In addition to the properties leased from us, Caesars operates numerous other casino resorts, collectively comprising a nationally-recognized portfolio of brands, including Caesars, Harrah’s, Horseshoe and Bally’s, and operates its portfolio of properties (including the properties that are leased from us) using the Total Rewards® customer loyalty program. Core to Caesars’ cross market strategy, the Total Rewards® program is designed to encourage Caesars’ customers to direct a larger share of their entertainment spending to Caesars.
Experienced management team and independent board of directors with robust corporate governance
We have an experienced management team that has been actively engaged in the leadership, acquisition and investment aspects of the hospitality, gaming, entertainment and real estate industries throughout their careers. Our Chief Executive Officer, Edward Pitoniak, and President and Chief Operating Officer, John Payne, are industry veterans with an average of 30 years of experience in the REIT industry and experiential real estate companies, during which time they were able to drive controlled growth and diversification of significant real estate and gaming portfolios. Mr. Pitoniak’s service as an independent board member of public companies provides him with a unique and meaningful management perspective and will enable him to work as a trusted steward with our independent board of directors as a trusted steward of our extensive portfolio. Our independent board of directors, which is made of highly skilled and seasoned real estate, gaming and corporate professionals, was established to ensure that there was no overlap between our tenants and the companies with which our directors are affiliated. In addition, our board of directors is not staggered, with each of our directors subject to re-election annually. Robust corporate governance in the best interests of our stockholders is of central importance to the management of our company, as we have a separate Chairman of the Board and Chief Executive Officer and all members of our audit and finance committee qualify as an “audit committee financial expert” as defined by the SEC. Directors are elected in uncontested elections by the affirmative vote of a majority of the votes cast, and stockholder approval is required prior to, or in certain circumstances within twelve months following, the adoption by our board of a stockholder rights plan.
Tenants
As of December 31, 2017, all of our properties with the exception of the TRS golf courses were leased to Caesars.
Caesars is a leading owner and operator of gaming, entertainment and leisure properties. Caesars maintains a diverse brand portfolio with a wide range of options that appeal to a variety of gaming, travel and entertainment consumers. As of December 31, 2017, Caesars operates 48 properties, consisting of 20 owned and operated properties, eight properties that it manages on behalf of third parties and 20 properties that it leases from us. Caesars or CRC guarantee the lease payment obligations of the properties leased from us.
The historical audited and unaudited financial statements of Caesars (which are not included or incorporated by reference in this Annual Report on Form 10-K), as the parent and guarantor of CEOC, our significant lessee, have been filed with the Securities
3
and Exchange Commission (“SEC”). Caesars files annual, quarterly and current reports and other information with the SEC. Please call the SEC at 1-800-SEC-0330 for further information on the public reference rooms. Caesars’ SEC filings are also available to the public from the SEC’s web site at
www.sec.gov
. We make no representation as to the accuracy or completeness of the information regarding Caesars that is available through the SEC’s website or otherwise made available by Caesars or any third party, and none of such information is incorporated by reference in this Annual Report on Form 10-K.
Our Relationship with Caesars
We are independent from Caesars. Although we currently lease all our gaming facilities to subsidiaries of Caesars, we anticipate diversifying our portfolio over time.
We believe we have a mutually beneficial relationship with Caesars, a leading owner and operator of gaming, entertainment and leisure properties. Our long-term triple-net Lease Agreements with subsidiaries of Caesars provide us with a highly predictable revenue stream with embedded growth potential. We believe our geographic diversification limits the effect of changes in any one market on our overall performance. We are focused on driving long-term total returns through managing assets and allocating capital diligently, maintaining a highly productive tenant base, capitalizing on strategic development and redevelopment opportunities, and optimizing our capital structure to support opportunistic growth.
To govern the ongoing relationship between us and Caesars and our respective subsidiaries, we entered into various agreements with Caesars and/or its subsidiaries as described herein. The summaries presented below are not complete and are qualified in their entirety by reference to the full text of the applicable agreements, which are included as exhibits to this Annual Report on Form 10-K.
Overview of our Lease Agreements
We derive substantially all of our revenues from rental revenue from the leases of our properties to certain subsidiaries of Caesars pursuant to the Lease Agreements, each of which are “triple-net” leases, pursuant to which the tenant bears responsibility for all property costs and expenses associated with ongoing maintenance and operation, including utilities, property taxes and insurance.
Our leases provide for an initial term of 15 years, followed by four 5-year renewal options exercisable by the tenants, provided that for certain facilities the aggregate lease term, including renewals, may be cut back to the extent it would otherwise exceed 80% of the remaining useful life of the applicable leased property, solely at the option of the tenants. Caesars does not have any purchase option under the Lease Agreements, except with respect to the HLV Lease Agreement if we engage in certain transactions with entities deemed to be competitors, or the landlord under the lease otherwise becomes a competitor of Caesars.
Under the CPLV Lease Agreement entered into on October 6, 2017, rent is $165.0 million for the first seven years, subject to an annual escalator commencing in the second year of the lease term. Beginning in the eighth year, a portion of the rent amount will be designated as variable rent and will be adjusted periodically, with the balance of the rent amount designated as base rent and continuing to be subject to the annual escalator. At each renewal term, the base rent amount will be set at fair market value for the rent but will not be less than the amount of base rent due from the tenant in the immediately preceding year nor will the base rent increase by more than 10% compared to the immediately preceding year.
Under each of the Non-CPLV Lease Agreement and Joliet Lease Agreement entered into on October 6, 2017, rent is $433.3 million and $39.6 million, respectively, for the first seven years, subject to an annual escalator commencing in the sixth year of the lease term. With respect to the Joliet Lease Agreement, we are entitled to receive 80% of the rent thereunder pursuant to the operating agreement of our joint venture, Harrah’s Joliet Landco LLC. Beginning in the eighth year, a portion of each rent amount will be designated as variable rent and will be adjusted periodically, with the balance of the rent amount designated as base rent and continuing to be subject to the annual escalator. At each renewal term, each base rent amount will be set at fair market value for the rent but will not be less than the amount of base rent due from the applicable tenant in the immediately preceding year nor will such base rent increase by more than 10% compared to the immediately preceding year.
Under the HLV Lease Agreement entered into on December 22, 2017, rent is $87.4 million for each of the first seven years of the lease term, subject to an annual escalator commencing in the second year of the lease term (subject to satisfaction of an EBITDAR to rent ratio commencing in the sixth year of the lease term). Beginning in the eighth year, a portion of the rent amount will be designated as variable rent and will be adjusted periodically. At each renewal term, the base rent amount will be set at fair market value for the rent but will not be less than the amount of base rent due from the tenant in the immediately preceding year nor will
4
the base rent increase by more than 10% compared to the immediately preceding year. The payment obligations under the HLV Lease Agreement are guaranteed by CRC under the Guaranty of the Lease.
The Lease Agreements provide for portions of the rent to be designated as variable rent with periodic variable rent resets following the seventh year and tenth year of the leases and at the commencement of each renewal term based on the tenant’s net revenue from the facilities at such time.
In each calendar year, CEOC must satisfy both of the following requirements (A) under the Non-CPLV Lease Agreement and Joliet Lease Agreement, expend a minimum of $100.0 million in capital expenditures (which may include certain expenditures incurred by a certain CEOC affiliate or with respect to certain other CEOC assets), which amount may be decreased under certain circumstances, such as removal of property from a Formation Lease Agreement due to casualty or condemnation or disposition of a material property, by an amount in proportion to the EBITDAR of the property being removed or disposed of, and (B) for each of the properties covered by the Formation Lease Agreements, expend an amount equal to at least 1% of actual net revenue (from the prior year) generated by the properties, as applicable, on capital expenditures that constitute installation or restoration and repair or other improvements of items with respect to the leased properties.
In addition, every rolling period of three years, CEOC must satisfy both of the following requirements: (A) under the Non-CPLV Lease Agreement and Joliet Lease Agreement, expend a minimum of $495.0 million in capital expenditures (which may include certain expenditures incurred by a certain CEOC affiliate or with respect to certain other CEOC assets), and (B) expend a minimum of $350.0 million in capital expenditures excluding capital expenditures for any services entity, foreign subsidiaries and unrestricted subsidiaries of CEOC, gaming equipment, corporate shared services and properties not included in the Formation Lease Agreements. These amounts, in each case, may be decreased under the same circumstances with respect to the annual requirement. Further, with respect to the requirement to expend a minimum of $350.0 million in capital expenditures, such capital expenditures will be allocated as follows: (i) $84.0 million to the facilities covered by the CPLV Lease Agreement; (ii) $255.0 million to the facilities covered by the Non-CPLV Lease Agreement and the Joliet Lease Agreement; and (iii) the balance to facilities covered by any Formation Lease Agreement in such proportion as CEOC may elect.
The HLV Lease Agreement requires the tenant thereunder to spend (x) $171 million in capital expenditures for the period commencing January 1, 2017 and ending December 31, 2021, and, (y) commencing in 2022, annually, 1% of the actual net revenue generated during the immediately prior year from such property on capital expenditures that constitute installation, restoration, repair, maintenance or replacement of physical improvements or other physical items with respect to the leased property under the HLV Lease Agreement.
In addition to customary default remedies, if CEOC does not spend the full amount of the minimum capital expenditures as required under the applicable Formation Lease Agreement, we have the right to seek the remedy of specific performance to require CEOC to spend any such unspent amount or deposit such amounts in a reserve account. CEOC’s obligations to spend the minimum capital expenditures will constitute monetary obligations included in Caesars’ obligations as guarantor with respect to these Formation Lease Agreements.
Caesars Guaranty
Pursuant to the Management and Lease Support Agreements, Caesars guarantees the payment and performance of all monetary obligations of CEOC and/or its subsidiaries under the Formation Lease Agreements and of the “User” under the Golf Course Use Agreement, subject to the following terms: (i) Caesars will be liable for the full amounts of the monetary obligations owed by our tenants and/or its subsidiaries in respect of the Formation Lease Agreements and of the “User” under the Golf Course Use Agreement (not merely for any deficiency amount), unless and until irrevocably paid in full; (ii) Caesars will have no obligation to make a payment with respect to the leases unless an event of default is continuing under the applicable Formation Lease Agreement; (iii) if an event of default under a Formation Lease Agreement occurs, Caesars will have no obligation to make a payment (other than payments in respect of such damages to which we are entitled due to a termination pursuant to the Formation Lease Agreements and enforcement costs), unless Caesars was given notice of the applicable default (or event or circumstance that is or would become a default) of our tenant and/or its subsidiaries under the CPLV Lease Agreement, the Non-CPLV Lease Agreement or Joliet Lease Agreement, as applicable, and, with respect to monetary defaults, did not cure such default within the period set forth in the agreements; (iv) Caesars’ and the Managers’ obligations with respect to each Management and Lease Support Agreement (including, without limitation, Caesars’ guaranty obligations with respect to a Formation Lease Agreement) will terminate in the event the applicable Formation Lease Agreement is terminated by us expressly in writing (or with our express written consent), except to the extent of any accrued and unpaid guaranty obligations through the date of such termination and such damages to which we are entitled due to such termination pursuant to the Formation Lease Agreements; and (v) Caesars’ obligations with respect to each
5
Management and Lease Support Agreement (including, without limitation, Caesars’ guaranty obligations with respect to a Formation Lease Agreement) will also terminate in the event (x) the Management and Lease Support Agreement is terminated by us, CEOC and/or its subsidiaries, the Manager and Caesars expressly in writing (or the parties’ express written consent), (y) a replacement Lease Agreement and Management and Lease Support Agreement are entered into by us, Caesars and/or its affiliates upon certain bankruptcy-related events (or if we elect in writing not to enter into such replacement agreements or such replacement agreements are not entered into as a direct and proximate result of our acts or failure to act in accordance with the Management and Lease Support Agreement provisions in respect of replacing such agreements) or (z) we terminate a Manager for cause (as defined in the Management and Lease Support Agreements) and an arbitrator appointed in accordance with the Management and Lease Support Agreements determines that cause did not exist. Notwithstanding the foregoing, Caesars’ guaranty obligations will continue (i) to the extent of any accrued and unpaid guaranty obligations through the date of termination of the guaranty and such damages to which we are entitled due to such termination pursuant to the Formation Lease Agreements and enforcement costs, (ii) during a two-year post-termination transition period during which the applicable Manager continues to act as manager and (iii) in all respects if the Managers are terminated for cause (as defined in the Management and Lease Support Agreements). Except as provided above, Caesars’ guaranty obligations under the Management and Lease Support Agreements will not terminate for any reason.
Collateral
Caesars’ guaranty of the Formation Leases is not currently collateralized. However, in the event that CEOC’s first lien debt is (i) guaranteed by Caesars and such guaranty is secured by Caesars’ or certain of its subsidiaries’ assets, or (ii) secured by Caesars’ or certain of its subsidiaries’ assets, then, unless the collateral is limited to the equity interests in CEOC, the collateral securing any such first lien debt of CEOC shall also serve as collateral for Caesars’ guaranty obligations pursuant to the Management and Lease Support Agreements on a
pari passu
basis with such CEOC first lien debt under the security agreement and any other related instruments securing CEOC’s first lien debt or the Caesars guaranty in respect of CEOC’s first lien debt (or any Caesars guaranty in respect of any refinancing thereof) in order to provide a security interest in all collateral thereunder to secure Caesars’ obligations under the Management and Lease Support Agreements. Such security interest will automatically be released upon the earlier to occur of (i) the termination of the security interest granted by Caesars or its subsidiaries securing CEOC’s first lien debt (or Caesars’ guaranty thereof) and (ii) (x) the date on which Caesars’ guaranty obligations under the Management and Lease Support Agreements have been irrevocably paid or (y) to the extent Caesars’ guaranty obligation under the Management and Lease Support Agreement is terminated by the express terms of the Management and Lease Support Agreements, twelve months after such termination. Such security interest would be a “silent” security interest that provides us with a secured claim against Caesars while any such Caesars debt guaranty or pledge of assets remains in effect, but we will have no voting, enforcement or default related rights with respect to such debt guaranty or collateral, unless and until the earlier of (x) the occurrence of a default in respect of any of Caesars’ guaranty obligations with respect to the Lease Agreements, or (y) the occurrence of an event of default that would cause the holders of CEOC’s first lien debt to take enforcement action in respect of the security interest in Caesars’ or its subsidiaries’ assets, in which case we would have all rights afforded to a secured creditor with respect such assets of Caesars and its subsidiary, including all rights available to holders of CEOC’s first lien debt. We would be a party to such security agreement and all related instruments that provide for such rights. The collateral that secures Caesars’ guaranty obligations will be the same collateral that secures any such Caesars debt guaranty obligations at any time, and Caesars’ guaranty obligations will be secured by such collateral on a
pari passu
basis with such Caesars debt guaranty obligations for so long as and at any time that such debt guaranty obligations are secured. Caesars will cause the parties benefitting from any security interest in Caesars’ or certain of its subsidiaries’ assets to enter into an intercreditor agreement containing, among other things, provisions governing the
pari passu
coverage of such collateral provisions and the “waterfall” by which any proceeds of, or collections on, the collateral will be distributed as between CEOC’s first lien debt and the lease guaranty obligations.
Caesars Covenants
The Management and Lease Support Agreements contain customary terms and waivers of all suretyship and other defenses by Caesars and include a covenant by Caesars requiring that (a) a sale of certain material assets by Caesars be for fair market value consideration, on arm’s-length terms in certain cases, with the approval of Caesars’ board of directors, and (b) non-cash dividends by Caesars are permitted only to the extent such dividends would not reasonably be expected to result in Caesars’ inability to perform its guaranty obligations under the Management and Lease Support Agreements
In addition, until October 6, 2023, or, if earlier, (x) on the date on which Caesars’ guaranty obligations under the Management and Lease Support Agreements have been irrevocably paid or (y) to the extent Caesars’ guaranty obligation under the Management and Lease Support Agreements are terminated by the express terms of the Management and Lease Support Agreements, twelve months after such termination, Caesars may not directly or indirectly (i) declare or pay, or cause to be declared or paid, any dividend,
6
distribution, any other direct or indirect payment or transfer (in each case, in cash, stock, other property, a combination thereof or otherwise) with respect to any of Caesars’ capital stock or other equity interests, (ii) purchase or otherwise acquire or retire for value any of Caesars’ capital stock or other equity interests, or (iii) engage in any other transaction with any direct or indirect holder of Caesars’ capital stock or other equity interests, which is similar in purpose or effect to those described above. However, Caesars will be permitted to execute such transactions if (a) Caesars’ equity market capitalization after giving effect to such dividend, distribution, or other transaction is at least $5.5 billion, (b) the amount of such dividend, distribution, or other transaction (together with any and all other such dividends and distributions and other transactions made under this clause (b) but excluding, any dividends, distributions or other transactions to be made under clause (c) or (d) below in such fiscal year), does not exceed, in the aggregate, (x) 25% of the net proceeds, up to a cap of $25 million in any fiscal year, from the disposition of assets by Caesars and its subsidiaries and (y) $100 million from other sources in any fiscal year, (c) Caesars’ equity market capitalization after giving effect to such dividend, distribution, or other transaction is at least $4.5 billion and such dividend, distribution or other transaction made under this clause (c) (excluding, any dividends, distributions or other transactions made under clause (b) above or clause (d) below in such fiscal year) is less than or equal to $125 million per annum and is funded solely by asset sale proceeds or (d) solely with respect to a transaction described in clause (a) above, the aggregate amount of such transactions (excluding transactions made under clause (b) or (c) above) is not more than $199.5 million. Similarly, until October 6, 2023, or earlier, (x) the date on which Caesars’ guaranty obligations under the Management and Lease Support Agreements have been irrevocably paid or (y) to the extent Caesars’ guaranty obligation under the Management and Lease Support Agreements are terminated by the express terms of the Management and Lease Support Agreements, twelve months after such termination, except in the case of the exceptions set forth under clauses (a) and (c) above, any net proceeds from the disposition of assets by Caesars or its subsidiaries in excess of $25 million that are directly or indirectly distributed to, or otherwise received by, Caesars in any fiscal year will not be used to fund any restricted payment of Caesars described above in clauses (i) through (iii) above.
Amended and Restated Right of First Refusal Agreement
We entered into an amended and restated right of first refusal agreement with Caesars (the “Amended and Restated Right of First Refusal Agreement”), which contains a right of first refusal in our favor, pursuant to which we have the right to own (and cause to be leased to, and managed by, Caesars (or its affiliate or affiliates)) any domestic gaming facility located outside of Greater Las Vegas, proposed to be acquired or developed by Caesars (and/or its subsidiaries) that is not (i) then subject to a pre-existing lease, management agreement or other contractual restriction that was not entered into in contemplation of such acquisition or development and which (x) was entered into on arms’-length terms and (y) would not be terminated upon or prior to such transaction, (ii) a transaction for which the opco/propco structure would be prohibited by applicable laws, rules or regulations or which would require governmental consent, approval, license or authorization (unless already received), (iii) any transaction that does not consist of owning or acquiring a fee or leasehold interest in real property, (iv) a transaction in which Caesars and/or its subsidiaries will not own at least 50% of, or control, the entity that will own the gaming facility, (v) a transaction in which one or more third parties will own or acquire, in the aggregate, a beneficial economic interest of at least 30% in the applicable gaming facility, and such third parties are unable, or make a bona fide, good faith refusal, to enter into the opco/propco structure, (vi) a transaction in which Caesars or its subsidiaries proposes to acquire a then-existing gaming facility from Caesars or its subsidiaries, and (vii) a transaction with respect to any asset remaining in CEOC after the formation transactions. The Amended and Restated Right of First Refusal further provides us, subject to certain exclusions, the right to acquire (and lease to Caesars) any of the properties that Caesars has recently agreed to acquire from Centaur Holdings, LLC, should Caesars determine to sell any such properties. If we decline to exercise our right of first refusal, the Non-CPLV and Joliet Lease Agreements will provide for the establishment of a variable rent floor applicable to any non-CPLV facility with respect to which the new facility is located within a 30-mile radius of such facility leased thereunder and outside of Greater Las Vegas. If we exercise such right, we and Caesars (or its designee) will structure such transaction in a manner that allows the subject property to be owned by us and leased to Caesars (or its designee). In such event, Caesars (or its designee) will enter into a lease with respect to the subject property whereby (i) rent thereunder will be established based on formulas consistent with the EBITDAR coverage ratio (determined based on the prior 12 month period) with respect to the Lease Agreement then in effect and (ii) such other terms as are agreed by the parties.
The Amended and Restated Right of First Refusal Agreement also contains a right of first refusal in favor of Caesars, pursuant to which Caesars will have the right to lease and manage any domestic gaming facility located outside of Greater Las Vegas, proposed to be acquired by us that is not: (i) any asset that is then subject to a pre-existing lease, management agreement or other contractual restriction that was not entered into in contemplation of such acquisition and which (x) was entered into on arms’ length terms and (y) would not be terminated upon or prior to closing of such transaction, (ii) any transaction for which the opco/propco structure would be prohibited by applicable laws, rules or regulations or which would require governmental consent, approval, license or authorization (unless already received), (iii) any transaction structured by the seller as a sale-leaseback, (iv) any transaction in which we and/or our affiliates will not own at least 50% of, or control, the entity that will own the gaming facility, and (v) any
7
transaction in which we or our affiliates propose to acquire a then-existing gaming facility from ourselves or our affiliates. If Caesars (or its designee) exercises such right, we and Caesars (or its designee) will structure such transaction in a manner that allows the subject property to be owned by us and leased to Caesars (or its designee). In such event, Caesars (or its designee) will enter into a lease with respect to the additional property whereby (i) rent thereunder will be established based on formulas consistent with the adjusted EBITDA coverage ratio (as set forth in the Amended and Restated Right of First Refusal Agreement) with respect to the lease then in effect and (ii) such other terms as are agreed by the parties.
In the event that the foregoing rights are not exercised by us or Caesars and CEOC, as applicable, each party will have the right to consummate the subject transaction without the other’s involvement, provided the same is on terms no more favorable to the counterparty than those presented to us or Caesars and CEOC, as applicable, for consummating such transaction.
The rights of first refusal will not apply if (A) the Management and Lease Support Agreements have been terminated or have expired by their terms or with our consent, (B) Caesars (or a subsidiary thereof) is no longer managing the facilities, or (C) a change of control occurs with respect to either Caesars or us.
Call Right Agreements
We entered into certain call right agreements (the “Call Right Agreements”), which provide our Operating Partnership with the opportunity to acquire Harrah’s Atlantic City, Harrah’s New Orleans and Harrah’s Laughlin (“Option Properties”) from Caesars, as applicable. Our Operating Partnership can exercise the call rights within five years from the Formation Date by delivering a request to the applicable owner of the property containing evidence of our ability to finance the call right. The purchase price for each property will be 10 multiplied by the initial property lease rent for the respective property, with the initial property lease rent for each property being the amount that causes the ratio of (x) EBITDAR of the property for the most recently ended four quarter period for which financial statements are available to (y) the initial property lease rent to equal 1.67.
Upon such election, if the owner of the property determines that (i) the sale of the property would not be permitted under a debt agreement under which at least $100.0 million of indebtedness (individually or in the aggregate) is outstanding, (ii) the consummation of the call right would not be approved by the applicable gaming authorities or (iii) the property is not for any other reason deliverable to our Operating Partnership, the owner may propose one or more replacement properties and the material terms of the purchase and if such proposal is at least as economically beneficial to us as the exercise of the call right, the parties must proceed with the sale of that property and any dispute with respect to the same (including whether such proposal was a qualifying proposal) will be submitted to arbitration.
If the exercise of the call right is not permissible because a debt agreement does not permit the sale and such limitation is not resolved within one year from exercise of the right and the owner has not made an alternative proposal, or has made an alternative proposal that is not at least as economically beneficial to us as the exercise of the call right, the owner must pay us an amount equal to the value of our loss, which, as of the Formation Date, was equal to $114.0 million, $84.0 million and $62.0 million for Harrah’s Atlantic City, Harrah’s New Orleans and Harrah’s Laughlin, respectively. These amounts will increase at a rate of 8.5% per annum, with annual compounding for the period from the date of each agreement until the date on which payment of the value loss amount is made.
If the exercise of the call right is not permissible due to a reason other than because of a debt limitation (including that the sale was not approved by the gaming authorities or the failure to obtain the consent of a landlord) and the owner has not made an alternative proposal, or has made an alternative proposal that is not at least as economically beneficial to us as the exercise of the call right, then the parties must use commercially reasonable efforts to resolve the issue until the earlier of (A) one year from the date of the exercise of the call right or (B) the date on which the parties determine that there is no reasonable chance that the issue will be resolved. If the applicable issue making the transaction impermissible is not resolved by the foregoing described deadline, the owner must use commercially reasonable efforts to sell the property to an alternative purchaser for the fair market value of the property. Upon the closing of any such alternative transaction, the net cash proceeds of the sale of the property will be allocated (i) first, to owner in an amount not to exceed the purchase price that would otherwise be determined in accordance with the applicable Call Right Agreement and (ii) any excess of such amount, to us (subject to any necessary approvals from applicable gaming authorities required for owner to pay, and us to receive, such funds).
If the exercise of the call right is permissible, the parties will use good faith, commercially reasonable efforts, for a period of ninety days following the delivery of the election notice to negotiate and enter into a sale agreement and conveyance and ancillary documents with respect to the applicable property together with a leaseback agreement.
8
Put-Call Agreement
HLV Owner and certain subsidiaries of Caesars entered into a put-call agreement (the “Put-Call Agreement”) which provides for (i) a put right in favor of Caesars, which, if exercised, would result in the sale by Caesars to HLV Owner and simultaneous leaseback by HLV Owner to Caesars of a convention center (the “Eastside Convention Center Property”) that Caesars may construct on the Eastside Property (the “Put Right”), (ii) if Caesars exercises the put right and, among other things, the sale of the Eastside Convention Center Property to HLV Owner does not close for certain reasons more particularly described in the agreement, then a repurchase right in favor of Caesars, which, if exercised, would result in the sale by HLV Owner to Caesars of HLV (the “HLV Repurchase Right”) and (iii) a call right in favor of HLV Owner, which, if exercised, would result in the sale by Caesars to HLV Owner and simultaneous leaseback by HLV Owner to Caesars of the Eastside Convention Center Property (the “Call Right”). The Put Right may be exercised by Caesars during the period of time commencing on January 1, 2024 and ending on December 31, 2024. If applicable, the HLV Repurchase Right may be exercised by Caesars during a one year period commencing on the date upon which the closing under the Put Right transaction does not occur and ending on the day immediately preceding the first anniversary thereof. The purchase price for HLV would be an amount equal to 13 times the rent due under the HLV Lease Agreement for the most recently ended four consecutive fiscal quarter period for which financial statements are available as of the date of Caesars’ election to execute the HLV Repurchase Right. If applicable, the Call Right may be exercised by HLV Owner during the period of time commencing on January 1, 2027 and ending on December 31, 2027. The purchase price for the Eastside Convention Center Property is equal to thirteen times the rent due in connection with the leaseback thereof which will be determined pursuant to the formulas set forth in the Put-Call Agreement. The Put-Call Agreement also provides that the closing of the applicable transaction(s) would occur approximately 180 days after the entering into of the purchase and sale agreement. Simultaneously with the execution of the Put-Call Agreement: (x) CRC entered into a Guaranty, whereby CRC guaranteed Caesars’ obligations to pay certain liquidated damages amounts and perform certain obligations in connection with the construction of the convention center, and (y) VICI Properties 1 LLC, a Delaware limited liability company (“VICI 1”), entered into a Guaranty, whereby VICI 1 guaranteed HLV Owner’s obligations to pay certain liquidated damages amounts.
Golf Course Use Agreement
Pursuant to the Golf Course Use Agreement, VICI Golf granted to CEOC and CES (collectively, the “users”) certain priority rights and privileges with respect to access and use of the following golf course properties: Rio Secco (Henderson, Nevada), Cascata (Boulder City, Nevada), Chariot Run (Laconia, Indiana) and Grand Bear (Saucier, Mississippi). Pursuant to the Golf Course Use Agreement, the users are granted specific rights and privileges to the golf courses, including (i) preferred access to tee times for guests of users’ casinos and/or hotels located within the same markets as the golf courses, (ii) preferred rates for guests of users’ casinos and/or hotels located within the same markets as the golf courses, and (iii) availability for golf tournaments and events at preferred rates and discounts. In addition, VICI Golf is required to reserve a certain number of tee times for users’ guests on any and all dates as well as make commercially reasonable efforts to place users’ guests once the aforementioned reserved tee times have been utilized and at all other times when tee time inventory is limited. Pursuant to the Golf Course Use Agreement, the users are required to use commercially reasonable efforts to refer to VICI Golf a minimum number of complimentary golf rounds per month at each of the golf courses. Payments under the Golf Course Use Agreement are comprised of a
$10.0 million
annual membership fee,
$3.0 million
of use fees and approximately
$1.1 million
of minimum rounds fees. The membership fee is subject to increase or decrease, as applicable, whenever rent under the Non-CPLV Lease Agreement is adjusted in accordance with the terms of the Non-CPLV Lease Agreement. The adjusted membership fee will be calculated based on the proportionate increase or decrease, as applicable, in rent under the Non-CPLV Lease Agreement. The use fees and minimum round fees are subject to an annual escalator equal to the greater of 2% and the increase in the Consumer Price Index from the prior year beginning at the times provided under the Golf Course Use Agreement.
Tax Matters Agreement
We have entered into a tax matters agreement (the “Tax Matters Agreement”), which addresses matters relating to the payment of taxes and entitlement to tax refunds by Caesars, CEOC, the Operating Partnership and us, and allocates certain liabilities, including providing for certain covenants and indemnities, relating to the payment of such taxes, receipt of such refunds, and preparation of tax returns relating thereto. In general, the Tax Matters Agreement provides for the preparation and filing by Caesars of tax returns relating to CEOC and for the preparation and filing by us of tax returns relating to us and our operations. To the extent that any matters contained in any tax return prepared by Caesars relate to our taxes, we have the right to review and comment on such items and, similarly, to the extent that any matters contained in any tax return prepared by us relate to CEOC’s taxes, Caesars has the right to review and comment on such items. Under the Tax Matters Agreement, Caesars has agreed to indemnify us for any taxes allocated to CEOC which we are required to pay pursuant to our tax returns and we have agreed to indemnify Caesars for any
9
taxes allocated to us which Caesars or CEOC is required to pay pursuant to a Caesars or CEOC tax return. We have the right to participate in the contest of any matters relating to any Caesars or CEOC tax return that relate to matters for which we have indemnification responsibilities, and Caesars will have the right to participate in the contest of any matters relating to any of our tax returns that relate to matters for which Caesars has indemnification responsibilities.
The Tax Matters Agreement sets forth the parties’ intent that certain transactions entered into as part of the Plan of Reorganization qualify as tax-free under the Code. The Tax Matters Agreement provides that Caesars, CEOC and we will not take certain actions which may be inconsistent with certain facts presented and representations made relating to the foregoing intended tax treatment without obtaining a supplemental ruling from the IRS or, if mutually agreed, an opinion of a nationally recognized law or accounting firm that such actions will not affect the foregoing intended tax treatment. The parties agreed generally not to file tax returns or take any other action (or refrain from taking action) in a manner inconsistent with the foregoing intended tax treatment. Under the Tax Matters Agreement, Caesars has agreed to indemnify us for taxes attributable to acts or omissions taken by Caesars and we have agreed to indemnify Caesars for taxes attributable to our acts or omissions, in each case that cause a failure of the transactions entered into as part of the Plan of Reorganization to qualify for the intended tax treatment described above.
Our Properties

10
The following table summarizes the properties that we own as of December 31, 2017. Our properties are diversified across a range of primary uses, including gaming, hotel, convention, dining, entertainment, retail, golf course and other resort amenities and activities.
|
MSA / Property
|
Location
|
Approx. Structure Sq Ft (000’s)
|
Hotel Rooms
|
||||
|
Las Vegas—Destination Gaming
|
|
|
|||||
|
Caesars Palace Las Vegas
|
|
Las Vegas, NV
|
|
8,579
|
|
3,980
|
|
|
Harrah’s Las Vegas
|
Las Vegas, NV
|
4,100
|
2,530
|
||||
|
Cascata Golf Course
|
|
Boulder City, NV
|
|
37
|
|
N/A
|
|
|
Rio Secco Golf Course
|
|
Henderson, NV
|
|
30
|
|
N/A
|
|
|
San Francisco / Sacramento
|
|
|
|||||
|
Harvey’s Lake Tahoe
|
|
Lake Tahoe, NV
|
|
1,670
|
|
740
|
|
|
Harrah’s Reno
|
|
Reno, NV
|
|
1,371
|
|
930
|
|
|
Harrah’s Lake Tahoe
|
|
Stateline, NV
|
|
1,057
|
|
510
|
|
|
Philadelphia
|
|
|
|||||
|
Caesars Atlantic City
|
|
Atlantic City, NJ
|
|
3,632
|
|
1,140
|
|
|
Bally’s Atlantic City
|
|
Atlantic City, NJ
|
|
2,547
|
|
1,250
|
|
|
Chicago
|
|
|
|||||
|
Horseshoe Hammond
|
|
Hammond, IN
|
|
1,716
|
|
N/A
|
|
|
Harrahs Joliet
(1)
|
|
Joliet, IL
|
|
1,011
|
|
200
|
|
|
Dallas
|
|
|
|||||
|
Horseshoe Bossier City
|
|
Bossier City, LA
|
|
1,419
|
|
600
|
|
|
Harrah’s Louisiana Downs
|
|
Bossier City, LA
|
|
1,118
|
|
N/A
|
|
|
Kansas City
|
|
|
|||||
|
Harrah’s North Kansas City
|
|
North Kansas City, MO
|
|
1,435
|
|
390
|
|
|
Memphis
|
|
|
|||||
|
Horseshoe Tunica
|
|
Robinsonville, MS
|
|
1,008
|
|
510
|
|
|
Tunica Roadhouse
|
|
Tunica Resorts, MS
|
|
225
|
|
130
|
|
|
Omaha
|
|
|
|||||
|
Harrah’s Council Bluffs
|
|
Council Bluffs, IA
|
|
790
|
|
250
|
|
|
Horseshoe Council Bluffs
|
|
Council Bluffs, IA
|
|
632
|
|
N/A
|
|
|
Nashville
|
|
|
|||||
|
Harrah’s Metropolis
|
|
Metropolis, IL
|
|
474
|
|
260
|
|
|
New Orleans
|
|
|
|||||
|
Harrah’s Gulf Coast
|
|
Biloxi, MS
|
|
1,031
|
|
500
|
|
|
Grand Bear Golf Course
|
|
Saucier, MS
|
|
5
|
|
N/A
|
|
|
Louisville, KY
|
|
|
|||||
|
Horseshoe Southern Indiana
|
|
Elizabeth, IN
|
|
2,510
|
|
500
|
|
|
Bluegrass Downs
|
|
Paducah, KY
|
|
184
|
|
N/A
|
|
|
Chariot Run Golf Course
|
|
Laconia, IN
|
|
5
|
|
N/A
|
|
|
Total
|
|
24
|
|
36,586
|
|
14,420
|
|
|
|
|
|
|
||||
|
(1)
Owned by Harrah’s Joliet LandCo LLC, a joint venture of which VICI PropCo is the 80% owner and the managing member.
|
|||||||
11
Las Vegas
Caesars Palace Las Vegas
Caesars Palace is a hotel and casino resort located in Las Vegas, Nevada. It was opened in 1966 and features six hotel towers uniquely designed to address the varied demands of our diverse customer base, 124,181 square feet of casino space including over 1,400 slot and table gaming units, a 14,187 square foot high limit casino area, a 4,557 square foot high limit slots area and a 24-hour poker room, approximately 300,000 square feet of meeting, convention and ballroom facilities, the 4,300-seat Colosseum entertainment venue, the 81,300 square foot OMNIA Nightclub, over 20 restaurants, lounges and bars, approximately 702,000 square feet of retail space, approximately 40,450 square feet of spa facilities and five swimming pools spanning eight acres.
Harrah’s Las Vegas
Harrah’s Las Vegas is a hotel and casino resort located in Las Vegas, Nevada. It was constructed in 1973 and features 90,600 square feet of casino space, 1,210 slot machines and 90 gaming tables. The property has 2,530 rooms and suites, 1,600 of which have been renovated over the past two years, 16 restaurants and bars, retail shopping, spa services and 24,000 square feet of meeting space.
San Francisco/Sacramento
Harrah’s Lake Tahoe
Harrah’s Lake Tahoe is a hotel and casino resort located on Lake Tahoe in Stateline, Nevada. It consists of a 45,136 square foot casino with nearly 900 slot and table-gaming units, a 510 room hotel and 18,000 square feet of meeting and event space. The property features eleven restaurants, shopping and nightlife venues and amenities, such as a spa and salon.
Harvey’s Lake Tahoe
Harvey’s Lake Tahoe is a hotel and casino resort located on Lake Tahoe in Stateline, Nevada. It consists of a 44,200 square foot casino, including over 800 slot and table-gaming units, a 740 room hotel and 19,000 square feet of meeting and event space. The property features nine restaurants, nightlife venues and amenities, such as an outdoor pool.
Harrah’s Reno
Harrah’s Reno is a hotel and casino resort located in Reno, Nevada. It consists of a 40,200 square foot casino, including over 650 slot and table-gaming units, a 930 room hotel and 21,765 square feet of meeting and event space. The property features six restaurants, nightlife venues and amenities, such as a spa and salon and an outdoor pool.
Philadelphia
Bally’s Atlantic City
Bally’s Atlantic City is a hotel and casino resort located along the Boardwalk in Atlantic City, New Jersey. It was opened in 1979 and consists of a 121,624 square foot casino, including over 1,900 slot and table-gaming units, a 1,251 room hotel, 63,589 square feet of convention center space, eight restaurants, four lounges and bars, shopping venues and a spa with indoor pool.
Caesars Atlantic City
Caesars Atlantic City is a hotel and casino resort located in Atlantic City, New Jersey. It was opened in 1979 and consists of an 115,225 square foot casino, including over 1,900 slot and table-gaming units, a 1,141 room hotel, 28,590 square feet of convention center space, a 1,100 seat concert venue, a 10,000 square foot multi-level nightclub, over 15 lounges and bars, a spa and an indoor/outdoor rooftop pool. The property also features 15 restaurants and shopping and entertainment venues and amenities.
Chicago
Harrah’s Joliet
Harrah’s Joliet is a hotel and casino resort located in the Chicagoland area of Illinois owned by a joint venture of which VICI PropCo is the 80% owner and managing member. It consists of a 39,000 square foot casino, including over 1,000 slots and table-
12
gaming units, a 200 room hotel, four restaurants and 6,110 square feet of meeting and event space. The property also features nightlife offerings.
Horseshoe Hammond
Horseshoe Hammond is a casino resort located in Hammond, Indiana. It consists of a 121,479 square foot casino, including over 2,600 slot and table-gaming units and a 2,500 seat concert venue. The property features seven restaurants as well as nightlife offerings.
Dallas
Harrah’s Louisiana Downs
Louisiana Downs is a “racino” located in Bossier City, Louisiana. It consists of a 12,000 square foot casino, including over 800 slot units and a race track. The property features five casual restaurants and three bars onsite.
Horseshoe Bossier City
Horseshoe Bossier City is a hotel and casino resort located in Bossier City, Louisiana. It consists of a 28,100 square foot casino, including over 1,400 slot and table-gaming units, a 604 room hotel and 21,594 square feet of meeting and event space. The property features seven restaurants, nightlife venues and amenities, such as a spa and an outdoor pool, and is adjacent to the Louisiana Boardwalk outlets.
Kansas City
Harrah’s North Kansas City
Harrah’s North Kansas City is a hotel and casino resort located in North Kansas City, Missouri. It consists of a 60,100 square foot casino, including over 1,300 slot and table-gaming units, a 390 room hotel and 12,800 square feet of meeting and event space. The property features four restaurants as well as nightlife venues.
Memphis
Horseshoe Tunica
Horseshoe Tunica is a hotel and casino resort located in Robinsonville, Mississippi. It consists of a 63,000 square foot casino, including nearly 1,200 slot and table-gaming units, a 505 room hotel and 2,079 square feet of meeting and event space. The property features six restaurants and entertainment venues and amenities, such as a spa and outdoor pool.
Tunica Roadhouse
Tunica Roadhouse is a hotel and casino resort located in Tunica Resorts, Mississippi. It consists of a 33,000 square foot casino, including over 700 slot and table-gaming units, a 130 room hotel and 10,200 square feet of meeting and event space. The property features entertainment venues and amenities, such as a spa and outdoor pool.
Omaha
Harrah’s Council Bluffs
Harrah’s Council Bluffs is a hotel and casino resort located in Council Bluffs, Iowa, across the Missouri River from Omaha, Nebraska. It consists of a 25,000 square foot casino, including over 500 slot and table gaming units, a 250 room hotel, three restaurants and 5,731 square feet of meeting and event space. The property also features nightlife offerings.
Horseshoe Council Bluffs
Horseshoe Council Bluffs is a casino resort located in Council Bluffs, Iowa. It consists of a 78,800 square foot casino, including over 1,400 slot and table-gaming units. The property features three restaurants as well as nightlife offerings.
13
Nashville
Harrah’s Metropolis
Harrah’s Metropolis is a hotel and casino resort located in Metropolis, Illinois. It consists of a 23,669 square foot casino, including over 850 slot and table-gaming units and a 260 room hotel. The property features three restaurants as well as nightlife offerings.
New Orleans
Harrah’s Gulf Coast
Harrah’s Gulf Coast is a hotel and casino resort located in Biloxi, Mississippi, which replaced the former Grand Casino Biloxi which was destroyed by Hurricane Katrina. It was opened in 2006 and consists of a 31,300 square foot casino, including over 500 slot and table-gaming units and a 500 room hotel. The property features five restaurants, a 16,000 square foot spa and salon and an outdoor pool. The Great Lawn, a festival-style green space, features a 10.5 acre outdoor concert space along the waterfront. The resort also has access via the Golf Course Use Agreement, to the Grand Bear Golf Course described below.
Louisville
Bluegrass Downs
Bluegrass Downs is a live harness horse racing track located in Paducah, Kentucky.
Horseshoe Southern Indiana
Horseshoe Southern Indiana is a hotel and casino resort located in Elizabeth, Indiana. It consists of an 86,600 square foot casino, including over 1,700 slot and table-gaming units, a 503 room hotel and 24,000 square feet of convention center space. The property features eight restaurants and entertainment venues and amenities, such as a spa and local golf course.
Golf Courses
We own and operate four golf courses, located near some of our properties, two of which are close to Caesars Palace and Harrah’s Las Vegas. Cascata was built in 2000 by golf course architect Rees Jones. It is located southeast of Las Vegas, in Boulder City, Nevada, approximately 25 miles from the Strip, and includes a clubhouse with a restaurant, golf shop, and event space. Rio Secco, designed by Rees Jones, opened in 1997 and is located in the south Las Vegas foothills, in Henderson, Nevada, approximately 14 miles from the Strip. The course operates the Butch Harmon School of Golf and includes a clubhouse with a restaurant, golf shop and event space.
Chariot Run is a Bill Bergin-designed, equestrian-themed, bent-grass course. It opened in 2002 and is located 12 miles from the Horseshoe Southern Indiana Casino. The course includes a clubhouse with a dining room, pro shop and event space. Grand Bear is an 18-hole course set over 650 acres of rolling land in the piney woods of the DeSoto National Forest. The course, designed by Jack Nicklaus, is considered one of the top courses in the Southern United States and is a short drive from the Harrah’s Gulf Coast casino. The course includes a clubhouse with a restaurant and golf shop.
Segment Information
Please see the accompanying consolidated financial statements and notes thereto included elsewhere in this Annual Report on Form 10-K for financial information about the Company's reportable segments.
Competition
We compete for real property investments with other REITs, gaming companies, investment companies, private equity and hedge fund investors, sovereign funds, lenders and other investors. In addition, revenues from our properties are dependent on the ability of our tenants, currently subsidiaries of Caesars, and operators to compete with other gaming operators. The operators of our properties compete on a local and regional basis for customers. The gaming industry is characterized by a high degree of competition among a large number of participants, including riverboat casinos, dockside casinos, land-based casinos, video lottery, sweepstakes and poker machines not located in casinos, Native American gaming, emerging varieties of Internet gaming and other forms of gaming in the United States.
14
As a landlord, we compete in the real estate market with numerous developers and owners of properties. Some of our competitors are significantly larger, have greater financial resources and lower costs of capital than we have, have greater economies of scale and have greater name recognition than we do. Increased competition will make it more challenging to identify and successfully capitalize on acquisition opportunities that meet our investment objectives. Our ability to compete is also impacted by national and local economic trends, availability of investment alternatives, availability and cost of capital, construction and renovation costs, existing laws and regulations, new legislation and population trends.
Employees
Approximately 140 employees were employed by us at December 31, 2017. These employees are employed either at our Operating Partnership or at our taxable REIT subsidiary, VICI Golf LLC (“VICI Golf”) or their respective subsidiaries.
Governmental Regulation and Licensing
The ownership, operation and management of gaming and racing facilities are subject to pervasive regulation. Each of our gaming and racing facilities is subject to regulation under the laws, rules, and regulations of the jurisdiction in which it is located. Gaming laws and regulations generally require gaming industry participants to:
|
•
|
ensure that unsuitable individuals and organizations have no role in gaming operations;
|
|
•
|
establish and maintain responsible accounting practices and procedures;
|
|
•
|
maintain effective controls over their financial practices, including establishment of minimum procedures for internal fiscal affairs and the safeguarding of assets and revenues;
|
|
•
|
maintain systems for reliable record keeping;
|
|
•
|
file periodic reports with gaming regulators; and
|
|
•
|
ensure that contracts and financial transactions are commercially reasonable, reflect fair market value and are arms-length transactions.
|
Gaming laws and regulations impact our business in two respects: (1) our ownership of land and buildings in which gaming activities are operated by subsidiaries of Caesars (or other tenants) pursuant to the Lease Agreements (or other lease agreements); and (2) the operations of subsidiaries of Caesars (or other tenants). Further, many gaming and racing regulatory agencies in the jurisdictions in which our tenants operate require us and our affiliates to apply for and maintain a license as a key business entity or supplier because of our status as landlord.
Our businesses and the business of Caesars (or other tenants) are also subject to various Federal, state and local laws and regulations in addition to gaming regulations. These laws and regulations include, but are not limited to, restrictions and conditions concerning alcoholic beverages, environmental matters, employees, health care, currency transactions, taxation, zoning and building codes and marketing and advertising. Such laws and regulations could change or could be interpreted differently in the future, or new laws and regulations could be enacted. Material changes, new laws or regulations, or material differences in interpretations by courts or governmental authorities could adversely affect our operating results.
Violations of Gaming Laws
If we, our subsidiaries or the tenants of our properties violate applicable gaming laws, our gaming licenses could be limited, conditioned, suspended or revoked by gaming authorities, and we and any other persons involved could be subject to substantial fines. Further, a supervisor or conservator can be appointed by gaming authorities to operate our gaming properties, or in some jurisdictions, take title to our gaming assets in the jurisdiction, and under certain circumstances, earnings generated during such appointment could be forfeited to the applicable jurisdictions. Violations of laws in one jurisdiction could result in disciplinary action in other jurisdictions. Finally, the loss of our gaming licenses could result in an event of default under our certain of our indebtedness, and cross-default provisions in our debt agreements could cause an event of default under one debt agreement to trigger an event of default under our other debt agreements. As a result, violations by us of applicable gaming laws could have a material adverse effect on us.
15
Review and Approval of Transactions
Substantially all material loans, leases, sales of securities and similar financing transactions by us and our subsidiaries must be reported to and in some cases approved by gaming authorities. Neither we nor any of our subsidiaries may make a public offering of securities without the prior approval of certain gaming authorities. Changes in control through merger, consolidation, stock or asset acquisitions, management or consulting agreements, or otherwise are subject to receipt of prior approval of gaming authorities. Entities seeking to acquire control of us or one of our subsidiaries must satisfy gaming authorities with respect to a variety of stringent standards prior to assuming control.
Insurance
The Lease Agreements require the tenants to maintain, with financially sound and reputable insurance companies (and in certain cases subject to the right of the tenants to self-insure), insurance (subject to customary deductibles and retentions) in such amounts and against such risks as are customarily maintained by similarly situated companies engaged in the same or similar businesses operating in the same or similar locations. The Lease Agreements provide that the amount and type of insurance that the tenants have in effect as of the commencement of the leases will satisfy for all purposes the requirements to insure the properties. However, such insurance coverage may not be sufficient to fully cover our losses.
Environmental Matters
Our properties are subject to environmental laws regulating, among other things, air emissions, wastewater discharges and the handling and disposal of wastes, including medical wastes. Certain of the properties we own utilize above or underground storage tanks to store heating oil for use at the properties. Other properties were built during the time that asbestos-containing building materials were routinely installed in residential and commercial structures. The Lease Agreements generally obligate our tenants to comply with applicable environmental laws and to indemnify us if its noncompliance results in losses or claims against us, and we expect that any future leases will include the same provisions for other operators. A tenant’s failure to comply could result in fines and penalties or the requirement to undertake corrective actions which may result in significant costs to the operator and thus adversely affect their ability to meet their obligations to us.
Pursuant to U.S. Federal, state and local environmental laws and regulations, a current or previous owner or operator of real property may be required to investigate, remove and/or remediate a release of hazardous substances or other regulated materials at, or emanating from, such property. Further, under certain circumstances, such owners or operators of real property may be held liable for property damage, personal injury and/or natural resource damage resulting from or arising in connection with such releases. Certain of these laws have been interpreted to be joint and several unless the harm is divisible and there is a reasonable basis for allocation of responsibility. We also may be liable under certain of these laws for damage that occurred prior to our ownership of a property or at a site where we sent wastes for disposal. The failure to properly remediate a property may also adversely affect our ability to lease, sell or rent the property or to borrow funds using the property as collateral.
In connection with the ownership of our current properties and any properties that we may acquire in the future, we could be legally responsible for environmental liabilities or costs relating to a release of hazardous substances or other regulated materials at or emanating from such property. We are not aware of any environmental issues that are expected to have a material impact on the operations of any of our properties
Intellectual Property
Most of the properties within our portfolio are currently operated and promoted under trademarks and brand names not owned by us, including Caesars Palace, Horseshoe, Harrah’s and Bally’s. In addition, properties that we may acquire in the future may be operated and promoted under these same trademarks and brand names, or under different trademarks and brand names we do not, or will not, own. During the term that our properties are managed by Caesars, we are reliant on Caesars to maintain and protect the trademarks, brand names and other licensed intellectual property used in the operation or promotion of the leased properties. Operation of the leased properties, as well as our business and financial condition, could be adversely impacted by infringement, invalidation, unauthorized use or litigation affecting any such intellectual property. In addition, if any of our properties are rebranded or management, it could have a material adverse effect on us, as we may not enjoy comparable recognition or status under a new brand.
16
Investment Policies
Investment in Real Estate or Interests in Real Estate
Our investment objectives are to increase cash flow from operations, achieve sustainable long-term growth and maximize stockholder value to allow for stable dividends and stock appreciation. We have not established a specific policy regarding the relative priority of these investment objectives.
Our business is focused primarily on gaming and leisure sector properties and activities directly related thereto. We own 20 market-leading properties and own and operate four golf courses. We believe there are potential opportunities to acquire additional gaming, hospitality and entertainment destinations. Our future investment activities will not be limited to any geographic area or to a specific percentage of our assets. We intend to engage in such future investment activities in a manner that is consistent with our qualification as a REIT for U.S. Federal income tax purposes. We do not have a specific policy to acquire assets primarily for capital gain or primarily for income. In addition, we may purchase or lease income-producing commercial and other types of properties for long-term investment, expand and improve the properties we presently own or other acquired properties, or sell such properties, in whole or in part, when circumstances warrant.
We may participate with third parties in property ownership, through joint ventures or other types of co-ownership, and we may engage in such activities in the future if we determine that doing so would be the most effective means of owning or acquiring properties. We do not expect, however, to enter into a joint venture or other partnership arrangement to make an investment that would not otherwise meet our investment policies. We also may acquire real estate or interests in real estate in exchange for the issuance of common stock, preferred stock or options to purchase stock or interests in our subsidiaries, including our Operating Partnership.
Equity investments in acquired properties may be subject to existing mortgage financing and other indebtedness or to new indebtedness which may be incurred in connection with acquiring or refinancing these investments. Principal and interest on our debt will have a priority over any dividends with respect to our common stock. Investments are also subject to our policy not to be required to register as an investment company under the Investment Company Act of 1940, as amended.
Investments in Real Estate Mortgages
Although we do not presently intend to invest in mortgages or deeds of trust, other than in a manner that is ancillary to an equity investment, we may elect, in our discretion, to invest in mortgages and other types of real estate interests, including, without limitation, participating or convertible mortgages; provided, in each case, that such investment is consistent with our qualification as a REIT. Investments in real estate mortgages run the risk that one or more borrowers may default under certain mortgages and that the collateral securing certain mortgages may not be sufficient to enable us to recoup our full investment.
Securities of or Interests in Persons Primarily Engaged in Real Estate Activities and Other Issuers
Subject to the asset tests and gross income tests necessary for REIT qualification, we may invest in securities of other REITs, other entities engaged in real estate activities or securities of other issuers, including for the purpose of exercising control over such entities. We do not currently have any policy limiting the types of entities in which we may invest or the proportion of assets to be so invested, whether through acquisition of an entity’s common stock, limited liability or partnership interests, interests in another REIT or entry into a joint venture. We have no current plans to make additional investments in entities that are not engaged in real estate activities. Our investment objectives are to maximize the cash flow of our investments, acquire investments with growth potential and provide cash distributions and long-term capital appreciation to our stockholders through increases in the value of our company. We have not established a specific policy regarding the relative priority of these investment objectives.
Investment in Other Securities
Other than as described above, we do not intend to invest in any additional securities of third parties, such as bonds, preferred stocks or common stock.
Financing Policies
We expect to employ leverage in our capital structure in amounts that we determine appropriate from time to time. Our board of directors has not adopted a policy which limits the total amount of indebtedness that we may incur, but will consider a number of factors in evaluating our level of indebtedness from time to time, as well as the amount of such indebtedness that will be either
17
fixed or variable rate. We are, however, and expect to continue to be subject to certain indebtedness limitations pursuant to the restrictive covenants of our outstanding indebtedness. We may from time to time modify our debt policy in light of then-current economic conditions, relative availability and costs of debt and equity capital, market values of our properties, general market conditions for debt and equity securities, fluctuations in the market price of our shares of common stock, growth and acquisition opportunities and other factors. If these limits are relaxed, we could become more highly leveraged, resulting in an increased risk of default on our obligations and a related increase in debt service requirements that could adversely affect our financial condition, liquidity and results of operations and our ability to make distributions to our stockholders. To the extent that our board of directors or management determines that it is necessary to raise additional capital, we may, without stockholder approval, borrow money under the VICI PropCo Credit Facility, issue debt or equity securities, including securities senior to our shares, retain earnings (subject to the REIT distribution requirements for U.S. Federal income tax purposes), assume indebtedness, obtain mortgage financing on a portion of our owned properties, engage in a joint venture, or employ a combination of these methods.
Corporate Information
We were initially organized as a limited liability company in the State of Delaware on July 5, 2016 as a wholly owned subsidiary of CEOC. On May 5, 2017, we subsequently converted to a corporation under the laws of the State of Maryland and issued shares of common stock to CEOC as part of our formation transactions, which shares were subsequently transferred by CEOC to its creditors as part of the Third Amended Joint Plan of Reorganization of Caesars Entertainment Operating Company, Inc. et. al. (the “Plan of Reorganization”) confirmed by the United States Bankruptcy Court for the Northern District of Illinois (Chicago) (the “Bankruptcy Court”) on January 17, 2017. See Note 1—Business Formation and Basis of Presentation for more information regarding the formation transactions.
Our principal executive offices are located at 8329 W. Sunset Road, Suite 210, Las Vegas, NV 89113 and our main telephone number at that location is (702) 820-3800. Our website address is www.viciproperties.com. None of the information on, or accessible through, our website or any other website identified herein is incorporated in, or constitutes a part of, this Annual Report on Form 10-K. Our electronic filings with the SEC (including annual reports on Form 10-K, quarterly reports on Form 10-Q, and current reports on Form 8-K, and any amendments to these reports), including the exhibits, are available free of charge through our website as soon as reasonably practicable after we electronically file them with or furnish them to the SEC.
CAUTIONARY NOTE REGARDING FORWARD-LOOKING STATEMENTS
Certain statements in this Annual Report on Form 10-K, including statements such as “anticipate,” “believe,” “estimate,” “expect,” “intend,” “plan,” “project,” “target,” “can,” “could,” “may,” “should,” “will,” “would” or similar expressions, constitute “forward-looking statements” within the meaning of the Private Securities Litigation Reform Act of 1995. Forward-looking statements are based on our current plans, expectations and projections about future events. We caution you therefore against relying on any of these forward-looking statements. They give our expectations about the future and are not guarantees. These statements involve known and unknown risks, uncertainties and other factors that may cause our actual results, performance and achievements to materially differ from any future results, performance and achievements expressed in or implied by such forward-looking statements.
The forward-looking statements included herein are based upon our current expectations, plans, estimates, assumptions and beliefs that involve numerous risks and uncertainties. Assumptions relating to the foregoing involve judgments with respect to, among other things, future economic, competitive and market conditions and future business decisions, all of which are difficult or impossible to predict accurately and many of which are beyond our control. Although we believe that the expectations reflected in such forward-looking statements are based on reasonable assumptions, our actual results, performance and achievements could differ materially from those set forth in the forward-looking statements and may be affected by a variety of risks and other factors, including, among others:
|
•
|
our dependence on subsidiaries of Caesars as tenant of all of our properties and Caesars or its subsidiaries as guarantor of the lease payments and the consequences any material adverse effect on their business could have on us;
|
|
•
|
our dependence on the gaming industry;
|
|
•
|
our ability to pursue our business and growth strategies may be limited by our substantial debt service requirements and by the requirement that we distribute 90% of our REIT taxable income in order to qualify for taxation as a REIT and that we distribute 100% of our REIT taxable income in order to avoid current entity level U.S. Federal income taxes;
|
18
|
•
|
the impact of extensive regulation from gaming and other regulatory authorities;
|
|
•
|
the ability of our tenants to obtain and maintain regulatory approvals in connection with the operation of our properties;
|
|
•
|
the possibility that the tenants may choose not to renew the Lease Agreements following the initial or subsequent terms of the leases;
|
|
•
|
restrictions on our ability to sell our properties subject to the Lease Agreements;
|
|
•
|
our substantial amount of indebtedness and ability to service and refinance such indebtedness;
|
|
•
|
our historical financial information may not be reliable indicators of our future results of operations and financial condition;
|
|
•
|
our inability to achieve the expected benefits from operating as a company independent of Caesars;
|
|
•
|
limits on our operational and financial flexibility imposed by our debt agreements;
|
|
•
|
the possibility our separation from Caesars fails to qualify as a tax-free spin-off, which could subject us to significant tax liabilities;
|
|
•
|
the impact of changes to the U.S. Federal income tax laws;
|
|
•
|
the possibility of foreclosure on our properties if we are unable to meet required debt service payments;
|
|
•
|
the impact of a rise in interest rates on us;
|
|
•
|
our inability to successfully pursue investments in, and acquisitions of, additional properties;
|
|
•
|
the impact of natural disasters or terrorism on our properties;
|
|
•
|
the loss of the services of key personnel;
|
|
•
|
the inability to attract, retain and motivate employees;
|
|
•
|
the costs and liabilities associated with environmental compliance;
|
|
•
|
failure to establish and maintain an effective system of integrated internal controls;
|
|
•
|
the costs of operating as a public company;
|
|
•
|
our inability to operate as a stand-alone company;
|
|
•
|
our inability to qualify or maintain our qualification for taxation as a REIT;
|
|
•
|
our reliance on distributions received from the Operating Partnership to make distributions to our stockholders due to our being a holding company;
|
|
•
|
our management team’s limited experience operating as a company that intends to qualify for taxation as a REIT;
|
|
•
|
competition for acquisition opportunities from other REITs and gaming companies that may have greater resources and access to capital and a lower cost of capital than us; and
|
|
•
|
additional factors discussed herein under “Risk Factors” and listed from time to time in our filings with the Securities and Exchange Commission (the “SEC”), including without limitation, in our subsequent reports on Form 10-K, Form 10-Q and Form 8-K.
|
Any of the assumptions underlying forward-looking statements could be inaccurate. You are cautioned not to place undue reliance on any forward-looking statements. All forward-looking statements are made as of the date of this Annual Report on Form 10-K and the risk that actual results, performance and achievements will differ materially from the expectations expressed herein will increase with the passage of time. Except as otherwise required by the Federal securities laws, we undertake no obligation to publicly update or revise any forward-looking statements, whether as a result of new information, future events, changed circumstances or any other reason. In light of the significant uncertainties inherent in forward-looking statements, the inclusion of such forward-looking statements should not be regarded as a representation by us.
19
|
Item 1A.
|
Risk Factors
|
You should
be aware that the occurrence of any of the events described in this section and elsewhere in this report or in any other of our filings with the SEC could have a material adverse effect on our business, financial position, results of operations and cash flows. In evaluating us, you should consider carefully, among other things, the risks described below.
The risks and uncertainties described below are not the only ones we face, but do represent those risks and uncertainties that we believe are material to us. Additional risks and uncertainties not presently known to us or that, as of the date of this Annual Report on Form 10-K, we deem immaterial may also harm our business. Some statements included in this Annual Report on Form 10-K, including statements in the following risk factors, constitute forward-looking statements. Please refer to the section entitled “Cautionary Note Regarding Forward-Looking Statements.”
Risks Related to Our Business and Operations
We are dependent on Caesars for the foreseeable future, and an event that has a material adverse effect on Caesars’ business, financial condition, liquidity, results of operations or prospects would have a material adverse effect on our business, financial condition, liquidity, results of operations and prospects.
Subsidiaries of Caesars are the lessees of all of our properties pursuant to the Lease Agreements and Caesars or CRC guarantees the obligations of the applicable tenants under the Lease Agreements. The Lease Agreements account for a significant majority of all of our revenues. Additionally, because the Lease Agreements are triple-net leases, we depend on the tenants to pay all insurance, taxes, utilities, and maintenance and repair expenses in connection with these leased properties and to indemnify, defend, and hold us harmless from and against various claims, litigation, and liabilities arising in connection with our businesses. See “Business.” There can be no assurance that the tenants will have sufficient assets, income, and access to financing to enable them to satisfy their payment obligations on account of the Lease Agreements, or that Caesars or its CRC will be able to satisfy its guarantee of the applicable tenant’s obligations under the Lease Agreements. The tenants and the applicable guarantor rely on the properties they or their subsidiaries own and/or operate for income to satisfy their obligations, including their debt service requirements and lease payments due to us under the Lease Agreements and the guarantees. If income from these properties were to decline for any reason, if any tenant’s or the applicable guarantor or their subsidiaries’ debt service requirements were to increase (whether due to an increase in interest rates or otherwise), or if Caesars’ subsidiaries were prevented from making distributions to Caesars or CRC (whether due to restrictions in their financing arrangements or otherwise), a tenant may become unable or unwilling to satisfy its payment obligations under the Lease Agreements and the applicable guarantor may become unable or unwilling to make payments under its guarantee of the Lease Agreements.
The inability or unwillingness of a tenant or the applicable guarantor to meet their rent and other obligations to us under the Lease Agreements and the related guarantee would materially and adversely affect our business, financial condition, liquidity, results of operations and prospects, including our ability to make distributions to our stockholders as required to maintain our status as a REIT. For these reasons, if any tenant and/or the applicable guarantor were to experience a material adverse effect on its business, financial condition, liquidity, results of operations or prospects, we would also be materially and adversely affected.
In addition, due to our dependence on rental payments from Caesars as a primary source of revenues, we may be limited in our ability to enforce our rights under the Lease Agreements or to terminate the applicable lease with respect to a particular property. Failure by the tenants to comply with the terms of the Lease Agreements or to comply with the gaming regulations to which the leased properties are subject could require us to find another lessee for such leased property, to the extent possible, and there could be a decrease or cessation of rental payments by the tenants. In such event, we may be unable to locate a suitable, credit-worthy lessee at similar rental rates or at all, which could have a material and adverse effect on us.
Because a concentrated portion of our revenues are generated from the Strip, we are subject to greater risks than a company that is more geographically diversified.
Our properties on the Las Vegas Strip generated approximately 27.8% of our lease revenue for the period from October 6, 2017 to December 31, 2017. Therefore, our business may be significantly affected by risks common to the Las Vegas tourism industry. For example, the cost and availability of air services and the impact of any events that disrupt air travel to and from Las Vegas can adversely affect the business of our tenants. We cannot control the number or frequency of flights to or from Las Vegas, but the tenants rely on air traffic for a significant portion of their visitors. Reductions in flights by major airlines as a result of higher fuel prices or lower demand can impact the number of visitors to our properties. Additionally, there is one principal interstate highway between Las Vegas and Southern California, where a large number of the customers that frequent our properties reside. Capacity constraints of that highway or any other traffic disruptions may also affect the number of customers who visit our facilities. Moreover, due to the importance of our two properties on the Strip, we may be disproportionately affected by general risks such
20
as acts of terrorism, natural disasters, including major fires, floods and earthquakes, and severe or inclement weather, should such developments occur in or nearby Las Vegas.
Caesars and its subsidiaries are party to certain leasing and financial commitments with us, which may have a negative impact on Caesars’ business and operating condition.
Caesars and/or its subsidiaries entered into certain leasing and financial commitments, evidenced by agreements, with us. See “Business—Our Relationship with Caesars” for additional information regarding such agreements.
Caesars is obligated to pay us in the aggregate approximately $735.3 million in fixed annual rents and golf course membership fees for each of the first seven years, subject to certain escalators and adjustments. If Caesars’ businesses and properties fail to generate sufficient earnings, the applicable tenants, Caesars and/or CRC may be unable to satisfy their respective obligations under the Lease Agreements or the related guarantees, respectively. Additionally, these obligations may limit their ability to make investments to maintain and grow their portfolio of businesses and properties, which may adversely affect their competitiveness and ability to satisfy their obligations to us. See “—We are dependent on Caesars for the foreseeable future, and an event that has a material adverse effect on Caesars’ business, financial condition, liquidity results of operations or prospects would have a material adverse effect on our business, financial condition, liquidity, results of operations and prospects” above.
Subsidiaries of Caesars are required to pay a significant portion of their cash flow from operations to us pursuant to, and subject to the terms and conditions of, the Lease Agreements, which could adversely affect Caesars’ ability to fund their operations or development projects, raise capital, make acquisitions, and otherwise respond to competitive and economic changes and its ability to satisfy its payment obligations to us under the Lease Agreements and the related guarantees.
Subsidiaries of Caesars are required to pay a significant portion of their cash flow from operations to us pursuant to, and subject to the terms and conditions of, the Lease Agreements. See “Business—Our Relationship with Caesars.” As a result of this commitment, Caesars’ ability to fund its operations or development projects, raise capital, make acquisitions and otherwise respond to competitive and economic changes may be adversely affected, which could adversely affect the ability of the applicable tenants to satisfy their obligations to us under the Lease Agreements and the ability of Caesars and/or CRC to satisfy their respective obligations to us under the related guarantees.
In addition, the annual rent escalations under the Lease Agreements will continue to apply regardless of the amount of cash flows generated by the properties that are subject to the Lease Agreements. Accordingly, if the cash flows generated by such properties decrease, or do not increase at the same rate as the rent escalations, the rents payable under the Lease Agreements will comprise a higher percentage of the cash flows generated by the subsidiaries of Caesars, which could make it more difficult for the applicable subsidiaries to make their payment obligations to us under the Lease Agreements and ultimately could adversely affect Caesars’ and/or CRC’s ability to satisfy their respective obligations to us under the related guarantees.
Caesars’ substantial indebtedness and the fact that a significant portion of its cash flow is used to make interest payments could adversely affect its ability to satisfy its obligations under the Lease Agreements.
As disclosed in its Annual Report on Form 10-K for the year ended December 31, 2017, Caesars’ consolidated estimated debt service (including principal and interest) for 2018 will be $504 million and $11.8 billion thereafter to maturity. On October 16, 2017, two wholly-owned subsidiaries of Caesars issued $1.7 billion aggregate principal amount of 5.25% senior notes due 2025; on or about December 22, 2017, the proceeds of the senior notes were released from escrow, and CRC assumed the obligations of one of the original issuer entities pursuant to a supplement to the original indenture governing the senior notes. On December 22, 2017, CRC entered into new $5.7 billion senior secured credit facilities, comprised of a $1 billion revolving credit facility maturing in 2022 and a $4.7 billion first lien term loan facility maturing in 2024, which amortizes at 0.25% per quarter. As a result, a significant portion of Caesars’ liquidity needs are for debt service, including significant interest payments. Such substantial indebtedness and the restrictive covenants under the agreements governing such indebtedness could limit the ability of the applicable tenants to satisfy their obligations to us under the Lease Agreements and the ability of Caesars’ and/or CRC to satisfy their respective obligations under the related guarantees.
We are dependent on the gaming industry and may be susceptible to the risks associated with it, which could materially and adversely affect our business, financial condition, liquidity, results of operations and prospects.
As the landlord of gaming facilities, we are impacted by the risks associated with the gaming industry. Therefore, so long as our investments are concentrated in gaming-related assets, our success is dependent on the gaming industry, which could be adversely affected by economic conditions in general, changes in consumer trends and preferences and other factors over which we and our tenants have no control. As we are subject to risks inherent in substantial investments in a single industry, a decrease in the gaming business would likely have a greater adverse effect on us than if we owned a more diversified real estate portfolio, particularly
21
because a component of the rent under the Lease Agreements will be based, over time, on the performance of the gaming facilities operated by Caesars on our properties and such effect could be material and adverse to our business, financial condition, liquidity, results of operations and prospects.
The gaming industry is characterized by a high degree of competition among a large number of participants, including riverboat casinos, dockside casinos, land-based casinos, video lottery, sweepstakes and poker machines not located in casinos, Native American gaming, internet lotteries and other internet wagering gaming services and, in a broader sense, gaming operators face competition from all manner of leisure and entertainment activities. Gaming competition is intense in most of the markets where our facilities are located. Recently, there has been additional significant competition in the gaming industry as a result of the upgrading or expansion of facilities by existing market participants, the entrance of new gaming participants into a market or legislative changes. As competing properties and new markets are opened, we may be negatively impacted. Additionally, decreases in discretionary consumer spending brought about by weakened general economic conditions such as, but not limited to, lackluster recoveries from recessions, high unemployment levels, higher income taxes, low levels of consumer confidence, weakness in the housing market, cultural and demographic changes and increased stock market volatility may negatively impact our revenues and operating cash flows.
We face extensive regulation from gaming and other regulatory authorities, and our charter provides that any of our shares held by investors who are found to be unsuitable by state gaming regulatory authorities are subject to redemption.
The ownership, operation, and management of gaming and racing facilities are subject to pervasive regulation. These gaming and racing regulations impact our gaming and racing tenants and persons associated with our gaming and racing facilities, which in many jurisdictions include us as the landlord and owner of the real estate. Certain gaming authorities in the jurisdictions in which we hold properties may require us and/or our affiliates to maintain a license as a key business entity or supplier because of our status as landlord. Gaming authorities also retain great discretion to require us to be found suitable as a landlord, and certain of our stockholders, officers and directors may be required to be found suitable as well.
In many jurisdictions, gaming laws can require certain of our stockholders to file an application, be investigated, and qualify or have his, her or its suitability determined by gaming authorities. Gaming authorities have very broad discretion in determining whether an applicant should be deemed suitable. Subject to certain administrative proceeding requirements, the gaming regulators have the authority to deny any application or limit, condition, restrict, revoke or suspend any license, registration, finding of suitability or approval, or fine any person licensed, registered or found suitable or approved, for any cause deemed reasonable by the gaming authorities.
Gaming authorities may conduct investigations into the conduct or associations of our directors, officers, key employees or investors to ensure compliance with applicable standards. If we are required to be found suitable and are found suitable as a landlord, we will be registered as a public company with the gaming authorities and will be subject to disciplinary action if, after we receive notice that a person is unsuitable to be a stockholder or to have any other relationship with us, we:
|
•
|
pay that person any distribution or interest upon any of our voting securities;
|
|
•
|
allow that person to exercise, directly or indirectly, any voting right conferred through securities held by that person;
|
|
•
|
pay remuneration in any form to that person for services rendered or otherwise; or
|
|
•
|
fail to pursue all lawful efforts to require such unsuitable person to relinquish his or her voting securities, including, if necessary, the immediate purchase of the voting securities for cash at fair market value.
|
Many jurisdictions also require any person who acquires beneficial ownership of more than a certain percentage of voting securities of a gaming company and, in some jurisdictions, non-voting securities, typically 5% of a publicly-traded company, to report the acquisition to gaming authorities, and gaming authorities may require such holders to apply for qualification, licensure or a finding of suitability, subject to limited exceptions for “institutional investors” that hold a company’s voting securities for passive investment purposes only. Our outstanding shares of capital stock are held subject to applicable gaming laws. Any person owning or controlling at least 5% of the outstanding shares of any class of our capital stock is required to promptly notify us of such person’s identity. Some jurisdictions may also limit the number of gaming licenses in which a person may hold an ownership or a controlling interest.
Further, our directors, officers, key employees and investors in our shares must meet approval standards of certain gaming regulatory authorities. If such gaming regulatory authorities were to find such a person or investor unsuitable, we may be required to sever our relationship with that person or the investor may be required to dispose of his, her or its interest in us. Our charter provides that all of our shares held by investors who are found to be unsuitable by regulatory authorities are subject to redemption upon our receipt of notice of such finding.
22
Additionally, the loss of our gaming licenses could result in an event of default under our certain of our indebtedness, and cross-default provisions in our debt agreements could cause an event of default under one debt agreement to trigger an event of default under our other debt agreements.
Finally, substantially all material loans, significant acquisitions, leases, sales of securities and similar financing transactions by us and our subsidiaries must be reported to, and in some cases approved by, gaming authorities in advance of the transaction. Neither we nor any of our subsidiaries may make a public offering of securities without the prior approval of certain gaming authorities. Changes in control through merger, consolidation, stock or asset acquisitions, management or consulting agreements, or otherwise may be subject to receipt of prior approval of certain gaming authorities. Entities seeking to acquire control of us or one of our subsidiaries (and certain of our affiliates) must satisfy gaming authorities with respect to a variety of stringent standards prior to assuming control. Failure to satisfy the stringent licensing standards may preclude entities from acquiring control of us or one of our subsidiaries (and certain of our affiliates) and/or require the entities to divest such control.
Required regulatory approvals can delay or prohibit transfers of our gaming properties, which could result in periods in which we are unable to receive rent for such properties and have a material adverse effect on our business, financial condition, liquidity, results of operations and prospects.
Our tenants are (and any future tenants of our gaming properties will be) required to be licensed under applicable law in order to operate any of our properties as gaming facilities. If the Lease Agreements, or any future lease agreements we will enter into, are terminated (which could be required by a regulatory agency) or expire, any new tenant must be licensed and receive other regulatory approvals to operate our properties as gaming facilities. Any delay in, or inability of, the new tenant to receive required licenses and other regulatory approvals from the applicable state and county government agencies may prolong the period during which we are unable to collect the applicable rent. Further, in the event that the Lease Agreements or future lease agreements are terminated or expire and a new tenant is not licensed or fails to receive other regulatory approvals, the properties may not be operated as gaming facilities and we will not be able to collect the applicable rent. Moreover, we may be unable to transfer or sell the affected properties as gaming facilities, which could materially and adversely affect our business, financial condition, liquidity, results of operations and prospects.
Tenants may choose not to renew the Lease Agreements.
The Lease Agreements each have an initial lease term of 15
years with the potential to extend the term for up to four additional five-year terms thereafter, provided that for certain facilities the aggregate lease term, including renewals, is cutback to the extent it would otherwise exceed 80% of the remaining useful life of the applicable leased property, solely at the option of the tenants. At the expiration of the initial lease term or of any additional renewal term thereafter, a tenant may choose not to renew the Lease Agreements. If the Lease Agreements expire without renewal and we are not able to find suitable, credit-worthy tenants to replace a tenant on the same or more attractive terms, our business, financial condition, liquidity, results of operations and prospects may be materially and adversely affected, including our ability to make distributions to our stockholders at the then current level, or at all. This risk would be exacerbated if Caesars determined not to renew, or was prohibited from renewing due to the remaining useful life of the leased property, all Lease Agreements at any one time.
Net leases may not result in fair market lease rates over time, which could negatively impact our results of operations and cash flows and reduce the amount of funds available to make distributions to stockholders.
All of our rental revenue is generated from the Lease Agreements, which are triple-net leases, and provide greater flexibility to the respective tenants related to the use of the applicable leased property than would be the case with ordinary property leases, such as the right to freely sublease portions of each leased property, to make alterations in the leased premises and to terminate the lease prior to its expiration under specified circumstances. Furthermore, net leases typically have longer lease terms and, thus, there is an increased risk that contractual rental increases in future years will fail to result in fair market rental rates during those years. As a result, our results of operations and cash flows and distributions to our stockholders could be lower than they would otherwise be if we did not enter into a net lease.
The Lease Agreements may restrict our ability to sell the properties.
Our ability to sell or dispose of our properties may be hindered by the fact that such properties are subject to the Lease Agreements, as the terms of the Lease Agreements require that a purchaser assume the Lease Agreements or enter into a severance lease with the tenants for the sold property on substantially the same terms as contained in the applicable Lease Agreement, which may make our properties less attractive to a potential buyer than alternative properties that may be for sale.
23
Properties within our portfolio are, and properties that we may acquire in the future are likely to be, operated and promoted under certain trademarks and brand names that we do not own.
Most of the properties within our portfolio are currently operated and promoted under trademarks and brand names not owned by us, including Caesars Palace, Horseshoe, Harrah’s and Bally’s. In addition, properties that we may acquire in the future may be operated and promoted under these same trademarks and brand names, or under different trademarks and brand names we do not, or will not, own. During the term that our properties are managed by Caesars, we will be reliant on Caesars to maintain and protect the trademarks, brand names and other licensed intellectual property used in the operation or promotion of the leased properties. Operation of the leased properties, as well as our business and financial condition, could be adversely impacted by infringement, invalidation, unauthorized use or litigation affecting any such intellectual property. Moreover, if any of our properties are rebranded unsuccessfully, it could have a material adverse effect on our business, financial condition, liquidity, results of operations and prospects, as we may not enjoy comparable recognition or status under a new brand. A transition of management away from a Caesars entity could also have a material adverse effect on our business, financial condition, liquidity, results of operations and prospects.
A substantial portion of our cash is used to satisfy our debt service obligations and our distribution obligations to maintain our status as a REIT and avoid or otherwise minimize current entity level U.S. Federal income taxes, which may expose us to interest rate fluctuation risk, expose us to the risk of default under our debt obligations and limit our ability to pursue our business and growth strategies.
We have substantial debt service obligations. As of December 31, 2017, we had approximately $4.817 billion of outstanding indebtedness under our Term B Loan Facility, Revolving Credit Facility, CPLV CMBS Debt, and Second Lien Notes requiring us to make annual debt service payments of approximately $249.3 million in 2018.
Our indebtedness is collateralized by substantially all of our properties. Payments of principal and interest under this indebtedness, or any other instruments governing debt we may incur in the future, may leave us with insufficient cash resources to pursue our business and growth strategies or to pay the distributions currently contemplated or necessary to qualify or maintain qualification as a REIT. Our substantial outstanding indebtedness or future indebtedness, and the limitations imposed on us by our debt agreements, could have other significant adverse consequences, including the following:
|
•
|
our cash flow may be insufficient to meet our required principal and interest payments;
|
|
•
|
we may be unable to borrow additional funds as needed or on favorable terms, which could, among other things, adversely affect our ability to capitalize upon emerging acquisition opportunities, including exercising our rights of first refusal and call rights described herein, or meet operational needs;
|
|
•
|
we may be unable to refinance our indebtedness at maturity or the refinancing terms may be less favorable than the terms of our original indebtedness;
|
|
•
|
we may be forced to dispose of one or more of our properties if permitted under the Lease Agreements, possibly on disadvantageous terms at a loss;
|
|
•
|
we may fail to comply with the payment and restrictive covenants in our loan documents, which would entitle the lenders to accelerate payment of outstanding loans and foreclose on any properties servicing such loans; and
|
|
•
|
we may be unable to hedge floating rate debt, counterparties may fail to honor their obligations under our hedge agreements and these agreements may not effectively hedge interest rate fluctuation risk.
|
If any one of these events were to occur, our financial condition, results of operations, cash flows, the market price of our common stock and our ability to satisfy our debt service obligations and to pay distributions to our stockholders could be materially and adversely affected. In addition, the foreclosure on our properties could create taxable income without accompanying cash proceeds, which could result in entity level taxes to us or could adversely affect our ability to meet the distribution requirements necessary to qualify or maintain qualification as a REIT.
In addition, the Code generally requires that a REIT distribute annually to its stockholders at least 90% of its REIT taxable income (with certain adjustments), determined without regard to the deduction for dividends paid and excluding net capital gains, and that it pay tax at regular corporate rates to the extent that it distributes annually less than 100% of its REIT taxable income, including capital gains. VICI Golf is also subject to U.S. Federal income tax at regular corporate rates on any of its taxable income. In order to maintain our status as a REIT and avoid or otherwise minimize current entity-level U.S. Federal income taxes, a substantial portion of our cash flow after operating expenses and debt service will be required to be distributed to our stockholders.
24
Because of the limitations on the amount of cash available to us after satisfying our debt service obligations and our distribution obligations to maintain our status as a REIT and avoid or otherwise minimize current entity- level U.S. Federal income taxes, our ability to pursue our business and growth strategies will be limited.
Any mechanic’s liens or similar liens incurred by the tenants under the Lease Agreements may attach to, and constitute liens on, our interests in the properties.
To the extent the tenants under the Lease Agreements make any improvements, these improvements could cause mechanic’s liens or similar liens to attach to, and constitute liens on, our interests in the properties. To the extent that mechanic’s liens or similar liens are recorded against any of the properties or any properties we may acquire in the future, the holders of such mechanic’s liens or similar liens may enforce them by court action and courts may cause the applicable properties or future properties to be sold to satisfy such liens, which could negatively impact our revenues, results of operations, cash flows and distributions to our stockholders. Further, holders of such liens could have priority over our stockholders in the event of bankruptcy or liquidation, and as a result, a trustee in bankruptcy may have difficulty realizing or foreclosing on such properties in any such bankruptcy or liquidation, and the amount of distributions our stockholders could receive in such bankruptcy or liquidation could be reduced.
Adverse changes in our credit rating may affect our borrowing capacity and borrowing terms.
Our outstanding debt is periodically rated by nationally recognized credit rating agencies. The credit ratings are based upon our operating performance, liquidity and leverage ratios, overall financial condition, and other factors viewed by the credit rating agencies as relevant to both our industry and the economic outlook. Our credit rating may affect the amount of capital we can access, as well as the terms of any financing we obtain. Because we rely in part on debt financing to fund growth, the absence of an investment grade credit rating or any credit rating downgrade or negative outlook may have a negative effect on our future growth.
We will have future capital needs and may not be able to obtain additional financing on acceptable terms.
We may incur additional indebtedness in the future to refinance our existing indebtedness or to finance newly acquired properties or for general corporate or other purposes. Any significant additional indebtedness could require a substantial portion of our cash flow to make interest and principal payments due on our indebtedness. Greater demands on our cash resources may reduce funds available to us to pay distributions, make capital expenditures and acquisitions, or carry out other aspects of our business and growth strategies. Increased indebtedness can also limit our ability to adjust rapidly to changing market conditions, make us more vulnerable to general adverse economic and industry conditions and create competitive disadvantages for us compared to other companies with relatively lower debt levels. Increased future debt service obligations may limit our operational and financial flexibility. Further, to the extent we were required to incur indebtedness, our future interest costs would increase, thereby reducing our earnings and cash flows from what they otherwise would have been.
Moreover, our ability to obtain additional financing and satisfy our financial obligations under indebtedness outstanding from time to time will depend upon our future operating performance, which is subject to then prevailing general economic and credit market conditions, including interest rate levels and the availability of credit generally, and financial, business and other factors, many of which are beyond our control. The prolonged continuation or worsening of current credit market conditions would have a material adverse effect on our ability to obtain financing on favorable terms, if at all.
We may be unable to obtain additional financing or financing on favorable terms or our operating cash flow may be insufficient to satisfy our financial obligations under indebtedness outstanding from time to time (if any). Among other things, the absence of an investment grade credit rating or any credit rating downgrade or negative outlook could increase our financing costs and could limit our access to financing sources. If financing is not available when needed, or is available on unfavorable terms, we may be unable to pursue our business and growth strategies or otherwise take advantage of new business opportunities or respond to competitive pressures, any of which could have a material adverse effect on our business, financial condition, liquidity, results of operations and prospects. We may raise additional funds in the future through the issuance of equity securities and, as a result, our stockholders may experience significant dilution, which may adversely affect the market price of our common stock and make it more difficult for our stockholders to sell our shares at a time and price that they deem appropriate and could impair our future ability to raise capital through an offering of our equity securities.
Our ability to refinance our indebtedness as it becomes due depends on many factors, some of which are beyond our control.
Our ability to refinance our existing indebtedness and any future indebtedness will depend, in part, on our current and projected financial condition, liquidity and results of operations and economic, financial, competitive, legislative, regulatory and other factors. Many of these factors are beyond our control. We cannot assure you that we will be able to refinance any of our indebtedness as it becomes due, on commercially reasonable terms or at all. If we are not able to refinance our indebtedness as it becomes due,
25
we will be obligated to pay such indebtedness with cash from our operations and we may not have sufficient cash to do so, which would have a material and adverse effect on us.
Covenants in our debt agreements limit our operational flexibility, and a covenant breach or default could materially and adversely affect our business, financial condition, liquidity, results of operations and prospects.
The agreements governing our indebtedness contain customary covenants, including restrictions on our ability to grant liens on our assets, incur indebtedness, sell assets, make investments, engage in acquisitions, mergers or consolidations and pay certain dividends and other restricted payments. These covenants could impair our ability to pursue our business and growth strategies, take advantage of new business opportunities or successfully compete. A breach of any of these covenants or covenants under any other agreements governing our indebtedness could result in an event of default. Cross-default provisions in our debt agreements could cause an event of default under one debt agreement to trigger an event of default under our other debt agreements. Upon the occurrence of an event of default under any of our debt agreements, the lenders could elect to declare all outstanding debt under such agreements to be immediately due and payable. If we were unable to repay or refinance the accelerated debt, the lenders could proceed against any assets pledged to secure that debt, including foreclosing on or requiring the sale of our properties, and our assets may not be sufficient to repay such debt in full. Covenants that limit our operational flexibility as well as defaults under our debt instruments could have a material adverse effect on our business, financial condition, liquidity, results of operations and prospects.
A rise in interest rates may increase our overall interest rate expense and could adversely affect our stock price.
Our Revolving Credit Facility and Term Loan B Facility are subject to variable interest rates. A rise in interest rates may increase our overall interest rate expense and have an adverse impact on our ability to pay distributions to our stockholders. The risk presented by holding variable rate indebtedness can be managed or mitigated by utilizing interest rate protection products. However, there is no assurance that we will utilize any of these products or that such products will be available to us. In addition, in the event of a rise in interest rates, new debt, whether fixed or variable, is likely to be more expensive and we may be unable to replace maturing debt with new debt at equal or better interest rates.
Further, the dividend yield on our common stock, as a percentage of the price of such common stock, will influence the market price of such common stock. Thus, an increase in market interest rates may lead prospective purchasers of our common stock to expect a higher dividend yield, which would adversely affect the market price of our common stock.
We may not be able to purchase the properties subject to the Call Right Agreements, the Amended and Restated Right of First Refusal Agreement or the Put-Call Agreement if we are unable to obtain additional financing. In addition, we may be forced to dispose of Harrah’s Las Vegas to Caesars, possibly on disadvantageous terms.
The Call Right Agreements provide for our right for up to five years after the Formation Date to enter into binding agreements to purchase the real property interest and all improvements associated with the Option Properties from Caesars. The Put Call Agreement that we entered into with Caesars, among other things, provides us with the opportunity or the obligation to acquire the Eastside Convention Center Property and lease it back to Caesars. The Amended and Restated Right of First Refusal Agreement provides us the right, subject to certain exclusions, to (i) acquire (and lease to Caesars) any domestic gaming facilities located outside of the Gaming Enterprise District of Clark County, Nevada, proposed to be acquired or developed by Caesars, and (ii) acquire (and lease to Caesars) any of the properties that Caesars has recently agreed to acquire from Centaur Holdings, LLC, in each case, should Caesars determine to sell any such properties. In order to exercise these rights, we would likely be required to secure additional financing and our substantial level of indebtedness following the Formation Date or other factors could limit our ability to do so on attractive terms or at all. If we are unable to obtain financing on terms acceptable to us, we may not be able to exercise these rights and acquire these properties. Even if financing with acceptable terms is available to us, there can be no assurance that we will exercise any of these rights.
The Put-Call Agreement, among other things, grants Caesars the right to sell to (and simultaneously lease back from) us the Eastside Convention Center Property. If Caesars exercises the right to sell to (and lease from) us the Eastside Convention Center Property and the transactions do not close for reasons other than a default by Caesars or a failure to obtain any required regulatory approvals, Caesars will have the right to acquire Harrah’s Las Vegas from us, all on and subject to the terms and conditions set forth in the Put-Call Agreement. In addition, the HLV Lease Agreement grants Caesars the right to purchase Harrah’s Las Vegas from us if we engage in certain transactions with entities deemed to be competitors of Caesars or if the landlord under the lease otherwise becomes a competitor of Caesars. The disposition of Harrah’s Las Vegas to Caesars pursuant to the Put-Call Agreement or the HLV Lease Agreement may be at disadvantageous terms and could have a material adverse effect on our business, financial condition, liquidity, results of operations and prospects.
26
The bankruptcy or insolvency of any tenant or guarantor could result in the termination of the Lease Agreements and the related guarantees and material losses to us.
Although the tenants’ performance and payments under the Lease Agreements are guaranteed by Caesars or CRC, as the case may be, a default by the applicable tenant under the Lease Agreement, or by Caesars or CRC with regard to its guarantee, may cause a default under certain circumstances with regard to the entire portfolio covered by the Lease Agreements. In event of a bankruptcy, there can be no assurances that the tenants, Caesars or CRC would assume the Lease Agreements or the related guarantees, and if the Lease Agreements or guarantees were rejected, the tenant, Caesars or CRC, as applicable, may not have sufficient funds to pay the damages that would be owed to us a result of the rejection and we might not be able to find a replacement tenant on the same or better terms. Similarly, in the event of a bankruptcy of Caesars or CRC, any claim for damages under the guarantee may not be paid in full. For these and other reasons, the bankruptcy of one or more tenants, Caesars or CRC would have a material adverse effect on our business, financial condition, liquidity, results of operations and prospects.
Our pursuit of investments in, and acquisitions of, additional properties may be unsuccessful or fail to meet our expectations.
We intend to pursue acquisitions of additional properties and seek acquisitions and other strategic opportunities. Accordingly, we may often be engaged in evaluating potential transactions and other strategic alternatives. In addition, from time to time, we may engage in discussions that may result in one or more transactions. Although there is uncertainty that any of these discussions will result in definitive agreements or the completion of any transaction, we may devote a significant amount of our management resources to such a transaction, which could negatively impact our operations. We may incur significant costs in connection with seeking acquisitions or other strategic opportunities regardless of whether the transaction is completed and in combining our operations if such a transaction is completed.
We operate in a highly competitive industry and face competition from other REITs, investment companies, private equity and hedge fund investors, sovereign funds, lenders, gaming companies and other investors, some of whom are significantly larger and have greater resources, access to capital and lower costs of capital. Increased competition will make it more challenging to identify and successfully capitalize on acquisition opportunities that meet our investment objectives. If we cannot identify and purchase a sufficient quantity of gaming properties and other properties at favorable prices or if we are unable to finance acquisitions on commercially favorable terms, our business, financial condition, liquidity, results of operations and prospects could be materially and adversely affected. Additionally, the fact that we must distribute 90% of our REIT taxable income in order to maintain our qualification as a REIT may limit our ability to rely upon rental payments from our leased properties or subsequently acquired properties in order to finance acquisitions. As a result, if debt or equity financing is not available on acceptable terms, further acquisitions might be limited or curtailed.
Investments in and acquisitions of gaming properties and other properties we might seek to acquire entail risks associated with real estate investments generally, including that the investment’s performance will fail to meet expectations, that the cost estimates for necessary property improvements will prove inaccurate or the operator or manager will underperform. Real estate development projects present other risks, including construction delays or cost overruns that increase expenses, the inability to obtain required zoning, occupancy and other governmental approvals and permits on a timely basis, and the incurrence of significant development costs prior to completion of the project.
Further, even if we were able to acquire additional properties in the future, there is no guarantee that such properties would be able to maintain their historical performance. In addition, our financing of these acquisitions could negatively impact our cash flows and liquidity, require us to incur substantial debt or involve the issuance of substantial new equity, which would be dilutive to existing stockholders. We have a substantial amount of indebtedness outstanding, which may affect our ability to pay distributions, may expose us to interest rate fluctuation risk and may expose us to the risk of default under our debt obligations. In addition, we cannot assure you that we will be successful in implementing our business and growth strategies or that any expansion will improve operating results. The failure to identify and acquire new properties effectively, or the failure of any acquired properties to perform as expected, could have a material adverse effect on our business, financial condition, liquidity, results of operations and prospects and our ability to make distributions to our stockholders.
We may sell or divest different properties or assets after an evaluation of our portfolio of businesses. Such sales or divestitures would affect our costs, revenues, results of operations, financial condition and liquidity.
From time to time, we may evaluate our properties and may, as a result, sell or attempt to sell, divest, or spin-off different properties or assets, subject to the terms of the Lease Agreements. These sales or divestitures would affect our costs, revenues, results of operations, financial condition, liquidity and our ability to comply with financial covenants. Divestitures have inherent risks, including possible delays in closing transactions (including potential difficulties in obtaining regulatory approvals), the risk of lower-than-expected sales proceeds for the divested businesses, and potential post-closing claims for indemnification. In addition,
27
current economic conditions and relatively illiquid real estate markets may result in fewer potential bidders and unsuccessful sales efforts.
Our properties are subject to risks from natural disasters such as earthquakes, hurricanes, severe weather and terrorism.
Our properties are located in areas that may be subject to natural disasters, such as earthquakes, and extreme weather conditions, including, but not limited to, hurricanes. Such natural disasters or extreme weather conditions may interrupt operations at the casinos, damage our properties, and reduce the number of customers who visit our facilities in such areas. A severe earthquake could damage or destroy our properties. In addition, our operations could be adversely impacted by a drought or other cause of water shortage. A severe drought of extensive duration experienced in Las Vegas or in the other regions in which we operate could adversely affect the business and financial results at our properties. Although the tenants are required to maintain both property and business interruption insurance coverage, such coverage is subject to deductibles and limits on maximum benefits, including limitation on the coverage period for business interruption, and we cannot assure you that we or the tenants will be able to fully insure such losses or fully collect, if at all, on claims resulting from such natural disasters. While the Lease Agreements require, and new lease agreements are expected to require, that comprehensive insurance and hazard insurance be maintained by the tenants, there are certain types of losses, generally of a catastrophic nature, such as earthquakes, hurricanes and floods, that may be uninsurable or not economically insurable. Insurance coverage may not be sufficient to pay the full current market value or current replacement cost of a loss. Inflation, changes in building codes and ordinances, environmental considerations, and other factors also might make it infeasible to use insurance proceeds to replace the property after such property has been damaged or destroyed. Under such circumstances, the insurance proceeds received might not be adequate to restore the economic position with respect to such property. If we experience a loss that is uninsured or that exceeds our policy coverage limits, we could lose the capital invested in the damaged properties as well as the anticipated future cash flows from those properties.
Terrorist attacks or other acts of violence may result in declining economic activity, which could harm the demand for goods and services offered by our tenants and the value of our properties and might adversely affect the value of an investment in our common stock. Such a resulting decrease in retail demand could make it difficult for us to renew or re-lease our properties to suitable, credit-worthy tenants at lease rates equal to or above historical rates. Terrorist activities or violence also could directly affect the value of our properties through damage, destruction or loss, and the availability of insurance for such acts, or of insurance generally, might be lower or cost more, which could increase our operating expenses and adversely affect our results of operations and cash flows. To the extent that any of our tenants is affected by future terrorist attacks or violence, its business similarly could be adversely affected, including the ability of our tenants to continue to meet their obligations to us. These events might erode business and consumer confidence and spending and might result in increased volatility in national and international financial markets and economies. Any one of these events might decrease demand for real estate, decrease or delay the occupancy of our new or redeveloped properties, and limit our access to capital or increase our cost of raising capital.
In addition, the Lease Agreements, as applicable, allow the tenants to remove a property from the Non-CPLV Lease Agreement and to terminate the CPLV Lease Agreement, the Joliet Lease Agreement or the HLV Lease Agreement, as the case may be, during the final two years of the lease terms if the cost to rebuild or restore a property in connection with a casualty event exceeds 25% of total property fair market value. Similarly, if a condemnation event occurs that renders a facility unsuitable for its primary intended use, the applicable tenants may remove the property from the Non-CPLV Lease Agreement and may terminate the CPLV Lease Agreement, the Joliet Lease Agreement or the HLV Lease Agreement, as the case may be. If a property is removed from the Non-CPLV Lease Agreement or if the CPLV Lease Agreement, the Joliet Lease Agreement or the HLV Lease Agreement, as the case may be, is terminated, we will lose the rent associated with the related facility, which would have a negative impact on our financial results. In this event, following termination of the lease of a property, even if we are able to restore the affected property, we could be limited to selling or leasing such property to a new tenant in order to obtain an alternate source of revenue, which may not happen on comparable terms or at all.
Changes in building and/or zoning laws may require us to update a property in the event of recapture or prevent us from fully restoring a property in the event of a substantial casualty loss and/or require us to meet additional or more stringent construction requirements.
Due to changes, among other things, in applicable building and zoning laws, ordinances and codes that may affect certain of our properties that have come into effect after the initial construction of the properties, certain properties may not comply fully with current building and/or zoning laws, including electrical, fire, health and safety codes and regulations, use, lot coverage, parking and setback requirements, but may qualify as permitted non-conforming uses. Although the Lease Agreements require our tenants to pay for and ensure continued compliance with applicable law, there is no assurance that future leases will be negotiated on the same basis or that our tenants will make any changes required by the terms of the Lease Agreements and/or any future leases we may enter into. In addition, such changes may limit a tenant’s ability to restore the premises of a property to its previous condition in the event of a substantial casualty loss with respect to the property or the ability to refurbish, expand or renovate such property to remain compliant, or increase the cost of construction in order to comply with changes in building or zoning codes and regulations.
28
If a tenant is unable to restore a property to its prior use after a substantial casualty loss or is required to comply with more stringent building or zoning codes and regulations, we may be unable to re-lease the space at a comparable effective rent or sell the property at an acceptable price, which may materially and adversely affect our business, financial condition, liquidity, results of operations and prospects.
Certain properties are subject to restrictions pursuant to reciprocal easement agreements, operating agreements or similar agreements.
Many of the properties that we own are, and properties that we may acquire in the future may be, subject to use restrictions and/or operational requirements imposed pursuant to ground leases, restrictive covenants or conditions, reciprocal easement agreements or operating agreements or other instruments (collectively, “Property Restrictions”) that could, among other things, adversely affect our ability to lease space to third parties. Such Property Restrictions could include: limitations on alterations, changes, expansions, or reconfiguration of properties; limitations on use of properties; limitations affecting parking requirements; or restrictions on exterior or interior signage or facades. In certain cases, consent of the other party or parties to such agreements may be required when altering, reconfiguring, expanding or redeveloping. Failure to secure such consents when necessary may harm our ability to execute leasing strategies, which could adversely affect us.
The loss of the services of key personnel could have a material adverse effect on our business.
Our success and ability to grow depends, in large part, upon the leadership and performance of our executive management team, particularly our chief executive officer, our president and chief operating officer, and our chief financial officer. Any unforeseen loss of our executive officers’ services, or any negative market or industry perception with respect to them or arising from their loss, could have a material adverse effect on our business. We do not have key man or similar life insurance policies covering members of our senior management. We have employment agreements with our executive officers, but these agreements do not guarantee that any given executive will remain with us, and there can be no assurance that any such officers will remain with us. The appointment of certain key members of our executive management team will be subject to regulatory approvals based upon suitability determinations by gaming regulatory authorities in the jurisdictions where our properties are located. If any of our executive officers is found unsuitable by any such gaming regulatory authorities, or if we otherwise lose their services, we would have to find alternative candidates and may not be able to successfully manage our business or achieve our business objectives.
If we cannot attract, retain and motivate employees, we may be unable to compete effectively and lose the ability to improve and expand our businesses.
Our success and ability to grow depend, in part, on our ability to hire, retain and motivate sufficient numbers of talented people with the increasingly diverse skills needed to serve clients and expand our business. We face intense competition for highly qualified, specialized technical, managerial, and consulting personnel. Recruiting, training, retention and benefit costs place significant demands on our resources. Additionally, CEOC’s bankruptcy proceedings and our recent formation may make recruiting executives to our business more difficult. The inability to attract qualified employees in sufficient numbers to meet particular demands or the loss of a significant number of our employees could have an adverse effect on us.
We may become involved in legal proceedings that, if adversely adjudicated or settled, could have a material adverse effect on our business, financial condition, liquidity, results of operations and prospects.
The nature of our business subjects us to the risk of lawsuits related to matters incidental to our business filed by our tenants, customers, employees, competitors, business partners and others. As with all legal proceedings, no assurance can be provided as to the outcome of these matters and, in general, legal proceedings can be expensive and time consuming. We may not be successful in the defense or prosecution of these lawsuits, which could result in settlements or damages that could have a material adverse effect on us.
Environmental compliance costs and liabilities associated with real estate properties owned by us may materially impair the value of those investments.
As an owner of real property, we are subject to various Federal, state and local environmental and health and safety laws and regulations. Although we do not operate or manage most of our properties, we may be held primarily or jointly and severally liable for costs relating to the investigation and clean-up of any property from which there has been a release or threatened release of a regulated material as well as other affected properties, regardless of whether we knew of or caused the release, and to preserve claims for damages. Further, some environmental laws create a lien on a contaminated site in favor of the government for damages and the costs the government incurs in connection with such contamination.
Although under the Lease Agreements the tenants are required to indemnify us for certain environmental liabilities, including environmental liabilities it causes, the amount of such liabilities could exceed the financial ability of the applicable tenants to
29
indemnify us. In addition, the presence of contamination or the failure to remediate contamination may adversely affect our ability to sell or lease our properties or to borrow using our properties as collateral.
We may be required to contribute insurance proceeds with respect to casualty events at our properties to the lenders under our debt financing agreements.
In the event that we were to receive insurance proceeds with respect to a casualty event at any of our properties, we may be required under the terms of our debt financing agreements to contribute all or a portion of those proceeds to the repayment of such debt, which may prevent us from restoring such properties to their prior state. If the remainder of the proceeds (after any such required repayment) were insufficient to make the repairs necessary to restore the damaged properties to a condition substantially equivalent to its state immediately prior to the casualty, we may not have sufficient liquidity to otherwise fund these repairs and may be required to obtain additional financing, which could materially and adversely affect our business, financial condition, liquidity, results of operations and prospects.
If we fail to establish and maintain an effective system of integrated internal controls, we may not be able to report our financial results accurately, which could have a material adverse effect on us.
As a reporting company, we are required to develop and implement substantial control systems, policies and procedures in order to qualify and maintain our qualification as a REIT and satisfy our periodic SEC reporting requirements. We cannot assure you that we will be able to successfully develop and implement these systems, policies and procedures and to operate our company or that any such development and implementation will be effective. Failure to do so could jeopardize our status as a REIT or as a reporting company, and the loss of such statuses would materially and adversely affect us. If we fail to develop, implement or maintain proper overall business controls, including as required to support our growth, our operating and financial results could be harmed or we could fail to meet our reporting obligations. In addition, the existence of a material weakness or significant deficiency could result in errors in our Financial Statements that could require a restatement, cause us to fail to meet our SEC reporting obligations and cause investors to lose confidence in our reported financial information, which could have a material adverse effect on us and on the market price of our common stock.
Risk Factors Relating to the Formation Transactions
We may be unable to make, on a timely or cost-effective basis, the changes necessary to operate as a stand-alone company primarily focused on owning a portfolio of gaming properties.
We have limited historical operations as an independent company. As a stand-alone entity, we are subject to, and responsible for, regulatory compliance, including periodic public filings with the SEC, compliance with the listing requirements of the New York Stock Exchange (the “NYSE”), and with applicable state gaming rules and regulations, as well as compliance with generally applicable tax and accounting rules. Because our business did not operate as a stand-alone company until the Formation Date, we cannot ensure that we will be able to successfully implement the infrastructure or retain the personnel necessary to operate as a stand-alone company or that we will not incur costs in excess of anticipated costs to establish such infrastructure and retain such personnel.
The historical financial information included in this Annual Report on Form 10-K may not be a reliable indicator of future results.
We are a newly organized company with limited operating history and did not operate as a REIT or otherwise as a stand-alone business prior to the Formation Date. Therefore, our growth prospects must be considered in light of the risks, expenses and difficulties frequently encountered when any new business is formed. We cannot assure you that we will be able to successfully operate our business profitably or implement our operating policies and business and growth strategies as described in this Annual Report on Form 10-K.
The Financial Statements and other financial information included herein may not reflect what our business, financial condition, cash flows or results of operations will be in the future now that we are a separate public company. The properties acquired by our Operating Partnership from subsidiaries of Caesars were historically operated by subsidiaries of Caesars as part of its larger corporate organization and not as a stand-alone business or independent company. Significant changes have occurred in our cost structure, financing and business operations as a result of our operation as a stand-alone company and the entry into transactions with Caesars that have not existed historically, including the Lease Agreements and the related guarantees.
For additional information about the basis of presentation of the financial information included in this Annual Report on Form 10-K, see “Selected Financial Data,” “Management’s Discussion and Analysis of Financial Condition and Results of Operation” and the historical combined Financial Statements of Caesars Entertainment Outdoor, our TRS prior to the Formation Date, included elsewhere in this Annual Report on Form 10-K.
30
Our actual financial results may vary significantly from the financial projections filed with the Bankruptcy Court.
In connection with the Plan of Reorganization, the Debtors were required to file projected financial information with the Bankruptcy Court to demonstrate the feasibility of the Plan of Reorganization and the ability of the Debtors to continue operations upon emergence from bankruptcy. These projections were prepared for the specific purpose of satisfying statutory requirements in connection with confirmation of the Plan of Reorganization and are neither included nor incorporated by reference in this Annual Report on Form 10-K. At the time they were filed, the projections reflected numerous assumptions concerning anticipated future performance and market and economic conditions that were and remain beyond our and the Debtors’ control and that may not materialize. Projections are inherently subject to uncertainties and to a wide variety of significant business, economic and competitive risks. Our actual results will vary from those contemplated by the projections and
the variations may be material.
We may be unable to achieve the expected benefits from operating as a company independent of Caesars.
We believe that as a company independent from Caesars, we will have the ability, subject to the Amended and Restated Right of First Refusal Agreement and the Lease Agreements, to pursue transactions with other gaming operators, to fund acquisitions with equity on significantly more favorable terms than those that would be available to Caesars, to diversify into different businesses in which Caesars, as a practical matter, could not diversify, and to pursue certain transactions that Caesars otherwise would be disadvantaged by or precluded from pursuing due to regulatory constraints. However, we may not be able to achieve some or all of the benefits from operating as a company independent from Caesars in a timely manner, if at all
.
Some members of our management team may have limited experience operating as part of a REIT structure.
The requirements for qualifying as a REIT are highly technical and complex. We did not operate as a REIT prior to the Formation Date, and some members of our management team may have limited experience in complying with the income, asset, and other limitations imposed by the real estate investment provisions of the Code. Any failure to comply with those provisions in a timely manner could prevent us from qualifying as a REIT or could force us to pay unexpected taxes and penalties, which could materially harm our business, financial condition, liquidity, results of operations and prospects. In addition, there is no assurance that any past experience
with the acquisition and disposition of gaming facilities will be sufficient to enable us to successfully manage our portfolio of properties as required by our business plan or the REIT provisions of the Code.
We cannot be certain that the bankruptcy proceedings will not adversely affect our operations going forward.
Our properties operated in bankruptcy for over two years and we cannot assure you that having been subject to bankruptcy will not adversely affect our operations going forward. For example, we may be subject to claims that were not discharged in the bankruptcy proceedings. Substantially all, if not all, of the material claims against the Debtors that arose prior to the date of the bankruptcy filing were addressed during the bankruptcy proceedings. In addition, the Bankruptcy Code provides that the confirmation of a plan of reorganization discharges a debtor from substantially all debts arising prior to confirmation and certain debts arising afterwards. Circumstances in which claims and other obligations that arose prior to the bankruptcy filing were not discharged primarily relate to certain actions by governmental units under police power authority, where CEOC agreed to preserve a claimant’s claims, as well as, potentially, instances where a claimant had inadequate notice of the bankruptcy filing. If any such claims remain and can be asserted against us, the ultimate resolution of such claims and other obligations may have a material adverse effect on our results of operations and profitability.
Our separation from subsidiaries of Caesars could give rise to disputes or other unfavorable effects, which could have a material adverse effect on our business, financial condition, liquidity, results of operations and prospects.
Disputes with third parties could arise out of our separation from subsidiaries of Caesars, and we could experience unfavorable reactions to the separation from employees, ratings agencies, regulators, or other interested parties. For example, The City Of Hammond, Indiana, The City of Hammond Department of Redevelopment, Department of Waterworks of The City of Hammond, and Hammond Port (collectively, the “Hammond Entities”) filed an objection with the Bankruptcy Court in November 2017 to the assignment of the respective leases, licenses and contracts to which they are counterparties relating to Horseshoe Hammond property. The Objection alleges that given the prohibition terms of the various leases, licenses, contracts and the Hammond agreements, the Debtors had no authority or power to make the assignments to VICI and, at the present, the Hammond Entities do not consent and do object to the property assignments. These disputes and reactions of third parties could have a material adverse effect on our business, financial condition, liquidity results of operations and prospects. In addition, disputes between us and Caesars could arise in connection with any of the Lease Agreements, the Management and Lease Support Agreements, the Amended and Restated Right of First Refusal Agreement, the Call Right Agreements, the Put-Call Agreement, the Tax Matters Agreement or other agreements.
31
If our separation from CEOC, together with certain related transactions, does not qualify as a transaction that is generally tax-free for U.S. Federal income tax purposes, CEOC could be subject to significant tax liabilities and, in certain circumstances, we could be required to indemnify CEOC for material taxes pursuant to indemnification obligations under the Tax Matters Agreement.
The IRS issued a private letter ruling with respect to certain issues relevant to our separation from CEOC, including relating to the separation and certain related transactions as tax-free for U.S. Federal income tax purposes under certain provisions of the Code. The IRS ruling does not address certain requirements for tax-free treatment of the separation. CEOC received from its tax advisors a tax opinion substantially to the effect that, with respect to such requirements on which the IRS did not rule, such requirements should be satisfied. The IRS ruling and the tax opinion that CEOC received, relied on (among other things) certain representations, assumptions and undertakings, including those relating to the past and future conduct of our business, and the IRS ruling and the opinion would not be valid if such representations, assumptions and undertakings were incorrect in any material respect.
Notwithstanding the IRS ruling and the tax opinion, the IRS could determine the separation should be treated as a taxable transaction for U.S. Federal income tax purposes if it determines any of the representations, assumptions or undertakings that were included in the request for the IRS ruling are false or have been violated or if it disagrees with the conclusions in the opinion that are not covered by the IRS ruling.
If the reorganization fails to qualify for tax-free treatment, in general, CEOC would be subject to tax as if it had sold our assets to us in a taxable sale for their fair market value, and CEOC’s creditors who received shares of our common stock pursuant to the Plan of Reorganization would be subject to tax as if they had received a taxable distribution in respect of their claims equal to the fair market value of such shares.
Under the Tax Matters Agreement that we entered into with Caesars, we generally are required to indemnify Caesars against any tax resulting from the separation to the extent that such tax resulted from certain of our representations or undertakings being incorrect or violated. Our indemnification obligations to Caesars are not limited by any maximum amount. As a result, if we are required to indemnify Caesars or such other persons under the circumstances set forth in the Tax Matters Agreement, we may be subject to substantial liabilities.
We may not be able to engage in desirable strategic or capital-raising transactions following the spin-off. In addition, we could be liable for adverse tax consequences resulting from engaging in significant strategic or capital-raising transactions.
To preserve the tax-free treatment to CEOC of the spin-off, for the two-year period following the spin-off, we may be prohibited, except in specific circumstances, from: (1) entering into any transaction pursuant to which all or a portion of our stock would be acquired, whether by merger or otherwise, (2) issuing equity securities beyond certain thresholds, (3) repurchasing our common stock, (4) ceasing to actively conduct the business of operating VICI Golf, or (5) taking or failing to take any other action that prevents the spin-off and related transactions from being tax-free. These restrictions may limit our ability to pursue strategic transactions or engage in new business or other transactions that may maximize the value of our business.
Risks Related to our Status as a REIT
We may not qualify or maintain our qualification as a REIT.
We intend to elect and qualify to be taxed as a REIT for U.S. Federal income tax purposes commencing with our taxable year ended December 31, 2017 and expect to operate in a manner that will allow us to continue to be classified as such. Once an entity is qualified as a REIT, the Code generally requires that such entity distribute annually to its stockholders at least 90% of its REIT taxable income (with certain adjustments), determined without regard to the deduction for dividends paid and excluding net capital gains, and that it pay tax at regular corporate rates to the extent that it distributes annually less than 100% of its REIT taxable income, including capital gains. In addition, a REIT is required to pay a 4% nondeductible excise tax on the amount, if any, by which the distributions it makes in a calendar year are less than the sum of 85% of its ordinary income, 95% of its capital gain net income and 100% of its undistributed income from prior years. As a result, in order to avoid current entity level U.S. Federal income taxes, a substantial portion of our cash flow after operating expenses and debt service will be required to be distributed to our stockholders.
If we were to fail to qualify as a REIT in any taxable year, we would be subject to U.S. Federal income tax on our taxable income at regular corporate rates, and dividends paid to our stockholders would not be deductible by us in computing our REIT taxable income. Any resulting corporate tax liability could be substantial and would reduce the amount of cash available for distribution to our stockholders, which in turn could have an adverse impact on the market price of our common stock. Unless we were entitled to relief under certain Code provisions, we also would be disqualified from re-electing to be taxed as a REIT for the four taxable
32
years following the year in which we failed to qualify as a REIT. As a result, the amount available for distribution to holders of equity securities that would otherwise receive dividends would be reduced for the year or years involved. Furthermore, the U.S. Federal income tax consequences of distributions and sales of our shares to certain of our stockholders could be adversely impacted if we were to fail to qualify as a REIT.
Qualification to be taxed as a REIT involves highly technical and complex provision of the Code, and violations of these provisions could jeopardize our REIT qualification.
Qualification as a REIT involves the application of highly technical and complex Code provisions for which only limited judicial and administrative authorities exist. Even a technical or inadvertent violation could jeopardize our REIT qualification. Our qualification as a REIT depends on our satisfaction of certain asset, income, organizational, distribution, stockholder ownership and other requirements on a continuing basis. In addition, our ability to satisfy the requirements to qualify as a REIT may depend in part on the actions of third parties over which we have no control or only limited influence, including in cases where we own an equity interest in an entity that is classified as a partnership for U.S. Federal income tax purposes.
The opinion we expect to receive regarding our status as a REIT does not guarantee our ability to qualify as a REIT.
We intend to operate in a manner that will allow us to qualify to be taxed as a REIT for U.S. Federal income tax purposes. We expect that we will receive an opinion of Kramer Levin Naftalis & Frankel LLP (“REIT Tax Counsel”) that, commencing with our taxable year ending December 31, 2017, we are organized in conformity with the requirements for qualification and taxation as a REIT under the U.S. Federal income tax laws and our proposed method of operations will enable us to satisfy the requirements for qualification and taxation as a REIT under the U.S. Federal income tax laws for our taxable year ending December 31, 2017 and subsequent taxable years. Investors should be aware, however, that opinions of counsel are not binding on the IRS or any court. The opinion of REIT Tax Counsel represents only the view of REIT Tax Counsel, based on its review and analysis of existing law and on certain representations as to factual matters and covenants made by us, including representations relating to the values of our assets and the sources of our income. The opinion is expressed as of the date of this offering. REIT Tax Counsel will have no obligation to advise us or the holders of shares of our common stock of any subsequent change in the matters stated, represented or assumed or of any subsequent change in applicable law. Furthermore, both the validity of the opinion of REIT Tax Counsel and our qualification to be taxed as a REIT will depend on our satisfaction of certain asset, income, organizational, distribution, stockholder ownership and other requirements on a continuing basis, the results of which will not be monitored by REIT Tax Counsel. Our ability to satisfy the asset tests depends upon our analysis of the characterization and fair market values of our assets, some of which are not susceptible to a precise determination, and for which we will not obtain independent appraisals. Any failure to qualify to be taxed as a REIT, or failure to remain to be qualified to be taxed as a REIT, would have a material and adverse effect on us.
We may in the future choose to pay dividends in the form of our own common stock, in which case stockholders may be required to pay income taxes in excess of the cash dividends they receive.
We
may seek in the future to distribute taxable dividends that are payable in cash or our common stock. Taxable stockholders receiving such dividends will be required to include the full amount of the dividend as ordinary income to the extent of our current and accumulated earnings and profits for U.S. Federal income tax purposes as to which non-corporate stockholders will generally be eligible for a deduction equal to 20% of such distributions. As a result, stockholders receiving dividends in the form of common stock may be required to pay income taxes with respect to such dividends in excess of the cash dividends received, if any. If a U.S. stockholder sells the common stock that it receives as
a dividend in order to pay this tax, the sales proceeds may be less than the amount included in income with respect to the dividend, depending on the market price of our common stock at the time of the sale. In addition, in such case, a
U.S. stockholder could have a capital loss with respect to the common stock sold that could not be used to offset such dividend income. Moreover, with respect to certain non-U.S. stockholders, we may be required to withhold U.S. Federal income tax with respect to such dividends, including in respect of all or a portion of such dividend that is payable in common stock. Furthermore, such a taxable share dividend could be viewed as equivalent to a reduction in our cash distributions, and that factor, as well as the possibility that a significant number of our stockholders determine to sell our common stock in order to pay taxes owed on dividends, may put downward pressure on the market price of our common stock.
Changes to the U.S. Federal income tax laws, including the recent enactment of certain tax reform measures, could have a material and adverse effect on us.
U.S. federal income tax laws governing REITs and other corporations and the administrative interpretations of those laws may be amended at any time, potentially with retroactive effect. We cannot predict whether, when or to what extent new U.S. federal tax laws, regulations, interpretations or rulings will be issued. Prospective investors are urged to consult their tax advisors regarding the effect of potential changes to the U.S. Federal tax laws on an investment in our common stock.
33
Recently enacted changes to the U.S. federal income tax laws could have a material and adverse effect on us. For example, certain changes in law pursuant to the Tax Cuts and Jobs Act could reduce the relative competitive advantage of operating as a REIT as compared with operating as a C corporation, including by:
|
•
|
reducing the rate of tax applicable to individuals and C corporations, which could reduce the relative attractiveness of the generally single level of taxation on REIT distributions;
|
|
•
|
permitting immediate expensing of capital expenditures, which could likewise reduce the relative attractiveness of the REIT taxation regime; and
|
|
•
|
limiting the deductibility of interest expense, which could increase the distribution requirement of REITs (though such limitations should not affect REITs).
|
We could fail to qualify to be taxed as a REIT if income we receive from Caesars or its subsidiaries is not treated as qualifying income.
Under applicable provisions of the Code, we will not be treated as a REIT unless we satisfy various requirements, including requirements relating to the sources of our gross income. Rents received or accrued by us from Caesars or its subsidiaries will not be treated as qualifying rent for purposes of these requirements if the leases are not respected as true leases for U.S. federal income tax purposes and instead are treated as service contracts, joint ventures or some other type of arrangement. If some or all of our leases are not respected as true leases for U.S. Federal income tax purposes, we may fail to qualify to be taxed as a REIT. Furthermore, our qualification as a REIT will depend on our satisfaction of certain asset, income, organizational, distribution, stockholder ownership and other requirements on a continuing basis. Our ability to satisfy the asset tests depends upon our analysis of the characterization and fair market values of our assets, some of which are not susceptible to a precise determination, and for which we may not obtain independent appraisals.
In addition, subject to certain exceptions, rents received or accrued by us from Caesars or its subsidiaries will not be treated as qualifying rent for purposes of these requirements if we or an actual or constructive owner of 10% or more of our stock actually or constructively owns 10% or more of the total combined voting power of all classes of Caesars stock entitled to vote or 10% or more of the total value of all classes of Caesars stock. Our charter provides for restrictions on ownership and transfer of our shares of stock, including restrictions on such ownership or transfer that would cause the rents received or accrued by us from Caesars or its subsidiaries to be treated as non-qualifying rent for purposes of the REIT gross income requirements. Nevertheless, there can be no assurance that such restrictions will be effective in ensuring that rents received or accrued by us from Caesars or its subsidiaries will not be treated as qualifying rent for purposes of REIT qualification requirements.
REIT distribution requirements could adversely affect our ability to execute our business plan.
We generally must distribute annually to our stockholders at least 90% of our REIT taxable income (with certain adjustments), determined without regard to the dividends paid deduction and excluding any net capital gains, in order for us to qualify as a REIT so that U.S. Federal corporate income tax does not apply to earnings that we distribute. To the extent that we satisfy this distribution requirement and qualify for taxation as a REIT but distribute less than 100% of our REIT taxable income, determined without regard to the dividends paid deduction and including any net capital gains, we will be subject to U.S. Federal corporate income tax on any undistributed portion of such taxable income. In addition, we will be subject to a 4% nondeductible excise tax if the actual amount that we distribute to our stockholders in a calendar year is less than a minimum amount specified under U.S. Federal tax laws. We intend to make distributions to our stockholders to comply with the REIT requirements of the Code and to avoid or otherwise minimize paying entity level Federal or excise tax (other than at any TRS of ours). We may generate taxable income greater than our income for financial reporting purposes prepared in accordance with GAAP. In particular, during the first several years of the leases, under the terms of the Lease Agreements, rental income will be allocated for tax purposes generally in an amount greater than cash rents. Further, we may generate taxable income greater than our cash flow from operations after operating expenses and debt service as a result of differences in timing between the recognition of taxable income and the actual receipt of cash or the effect of nondeductible capital expenditures, the creation of reserves or required debt or amortization payments. In order to avoid or otherwise minimize current entity level U.S. Federal income taxes, we will generally be required to distribute sufficient cash flow after operating expenses and debt service payments to satisfy the REIT distribution requirements. While we intend to make distributions to our stockholders to comply with the REIT requirements of the Code, we may not have sufficient liquidity to meet the REIT distribution requirements. If our cash flow is insufficient to satisfy the REIT distribution requirements, we could be required to raise capital on unfavorable terms, sell assets at disadvantageous prices, distribute amounts that would otherwise be invested in future acquisitions or issue dividends in the form of shares of our common stock to make distributions sufficient to enable us to pay out enough of our REIT taxable income to satisfy the REIT distribution requirement and to avoid corporate income tax and the 4% excise tax in a particular year. These alternatives could increase our costs or change the value of our equity. Thus, compliance with the REIT requirements may hinder our ability to grow, which could adversely affect the market price of our common stock.
34
Even if we qualify as a REIT, we may face other tax liabilities that reduce our cash flow.
Even if we qualify for taxation as a REIT, we may be subject to certain U.S. Federal, state and local taxes on our income and assets, including taxes on any undistributed income and state or local income, property and transfer taxes. For example, in order to meet the REIT qualification requirements, we currently hold and expect in the future to hold some of our assets and conduct certain of our activities through one or more taxable REIT subsidiaries or other subsidiary corporations that will be subject to Federal, state, and local corporate-level income taxes as regular C corporations (i.e., corporations generally subject to corporate-level income tax under Subchapter C of Chapter 1 the Code). In addition, we may incur a 100% excise tax on transactions with a taxable REIT subsidiary if they are not conducted on an arm’s length basis. Any of these taxes would decrease cash available for distribution to our stockholders.
Complying with REIT requirements may cause us to liquidate or forgo otherwise attractive opportunities.
To qualify as a REIT, we must ensure that, at the end of each calendar quarter, at least 75% of the value of our assets consists of cash, cash items, government securities and “real estate assets” (as defined in the Code), including certain mortgage loans and securities. The remainder of our investments (other than government securities, qualified real estate assets and securities issued by a taxable REIT subsidiary) generally cannot include more than 10% of the outstanding voting securities of any one issuer or more than 10% of the total value of the outstanding securities of any one issuer. In addition, in general, no more than 5% of the value of our total assets (other than government securities, qualified real estate assets and securities issued by a taxable REIT subsidiary) can consist of the securities of any one issuer, and no more than 25% of the value of our total assets can be represented by securities of one or more taxable REIT subsidiaries (20% for taxable years beginning after December 31, 2017). If we fail to comply with these requirements at the end of any calendar quarter, we must correct the failure within 30 days after the end of the calendar quarter or qualify for certain statutory relief provisions to avoid losing our REIT qualification and suffering adverse tax consequences. As a result, we may be required to liquidate or forgo otherwise attractive investments. These actions could have the effect of reducing our income and amounts available for distribution to our stockholders. In addition to the asset tests set forth above, to qualify as a REIT we must continually satisfy tests concerning, among other things, the sources of our income, the amounts we distribute to our stockholders and the ownership of our stock. We may be unable to pursue investments that would be otherwise advantageous to us in order to satisfy the source-of-income or asset-diversification requirements for qualifying as a REIT. Thus, compliance with the REIT requirements may hinder our ability to make certain attractive investments.
We may be subject to built-in gains tax on the disposition of certain of our properties.
If we
acquire certain properties in tax-deferred transactions, which properties were held by one or more C corporations before they were held by us, we may be subject to a built-in gain tax on future disposition of such properties. This is the case with respect to all or substantially all of the properties acquired from CEOC pursuant to the formation transactions. If we dispose of any such properties during the five-year period following acquisition of the properties from the respective C corporation (i.e., during the five-year period following ownership of such properties by a REIT), we will be subject to U.S. Federal income tax (and applicable state and local taxes) at the highest corporate tax rates on any gain recognized from the disposition of such properties to the extent of the excess of the fair market value of the properties on the date that they were contributed to or acquired by us in a tax-deferred transaction over the adjusted tax basis of such properties on such date, which are referred to as built-in gains. Similarly, if we recognize certain other income considered to be built-in income during the five-year period following the property acquisitions described above, we could be subject to U.S. Federal tax under the built-in gains tax rules. We would be subject to this corporate-level tax liability (without the benefit of the deduction for dividends paid) even if we qualify and maintain our status as a REIT. Any recognized built-in gain will retain its character as ordinary income or capital gain and will be taken into account in determining REIT taxable income and the REIT distribution requirements. Any tax on the recognized built-in gain will reduce REIT taxable income. We may choose to forego otherwise attractive opportunities to sell assets in a taxable transaction during the five-year built-in gain recognition period in order to avoid this built-in gain tax. However, there can be no assurance that such a taxable transaction will not occur. The amount of any such built-in gain tax could be material and the resulting tax liability could have a negative effect on our cash flow and limit our ability to pay distributions required to qualify and maintain our status as a REIT.
Complying with REIT requirements may limit our ability to hedge effectively and may cause us to incur tax liabilities.
The REIT provisions of the Code substantially limit our ability to hedge our assets and liabilities. Income from certain hedging transactions that we may enter into to manage risk of interest rate changes with respect to borrowings made or to be made to acquire or carry real estate assets or from transactions to manage risk of currency fluctuations with respect to any item of income or gain that satisfy the REIT gross income tests (including gain from the termination of such a transaction) does not constitute “gross income” for purposes of the 75% or 95% gross income tests that apply to REITs, provided that certain identification requirements are met. To the extent that we enter into other types of hedging transactions or fail to properly identify such transaction as a hedge, the income is likely to be treated as non-qualifying income for purposes of both of the gross income tests. As a result of these rules, we may be required to limit our use of advantageous hedging techniques or implement those hedges through a taxable REIT
35
subsidiary. This could increase the cost of our hedging activities because the taxable REIT subsidiary may be subject to tax on gains or expose us to greater risks associated with changes in interest rates that we would otherwise want to bear. In addition, losses in the taxable REIT subsidiary will generally not provide any tax benefit, except that such losses could theoretically be carried back or forward against past or future taxable income of the taxable REIT subsidiary.
We may pay a purging distribution, if any, in common stock and cash.
In order to qualify as a REIT, we must distribute any “earnings and profits,” as defined in the Code, that are allocated from CEOC to us in connection with the formation transactions by the end of the first taxable year in which we elect REIT status. Based on analysis of CEOC’s earnings and profits, we currently do not believe that any earnings and profits were allocated to us in connection with the formation transactions and therefore do not currently expect to be required to make a purging distribution. If notwithstanding this expectation we are required to make a purging distribution, we may pay the purging distribution to our stockholders in a combination of cash and shares of our common stock. Each of our stockholders will be permitted to elect to receive the stockholder’s entire entitlement under the purging distribution in either cash or shares of our common stock, subject to a cash limitation. If our stockholders elect to receive a portion of cash in excess of the cash limitation, each such electing stockholder will receive a pro rata portion of cash corresponding to the stockholder’s respective entitlement under the purging distribution declaration. The IRS issued a private letter ruling with respect to certain issues relevant to the separation from Caesars providing generally that, subject to the terms and conditions contained therein, the amount of any shares of our common stock received by any of our stockholders as part of a purging distribution, if any, will be considered to equal the amount of cash that could have been received instead. Although we may generally rely upon the ruling, no assurance can be given that the IRS will not challenge our qualification as a REIT on the basis of other issues or facts outside the scope of the ruling. Furthermore, the IRS has issued a revenue procedure that provides that, so long as a REIT complied with certain provisions therein, certain distributions that are paid partly in cash and partly in stock will be treated as taxable dividends that would satisfy the REIT distribution requirements and qualify for the dividends paid deduction for U.S. Federal income tax purposes. In a purging distribution, if any, a stockholder of our common stock will be required to report dividend income equal to the amount of cash and common stock received as a result of the purging distribution even though we may distribute no cash or only nominal amounts of cash to such stockholder.
Risks Related to Our Organizational Structure
Our rights and the rights of our stockholders to take action against our directors and officers are limited.
The Maryland General Corporation Law (the “MGCL”) provides that a director has no liability in any action based on an act of the director if he or she has acted in good faith, in a manner he or she reasonably believes to be in the corporation’s best interests and with the care that an ordinarily prudent person in a like position would use under similar circumstances. As permitted by the MGCL, our charter limits the liability of our directors and officers to our company and our stockholders for money damages, to the maximum extent permitted by Maryland law. Under Maryland law, our present directors and officers will not have any liability to us or our stockholders for money damages other than liability resulting from:
|
•
|
actual receipt of an improper benefit or profit in money, property or services; or
|
|
•
|
a final judgment based upon a finding that his or her action or failure to act was the result of active and deliberate dishonesty by the director or officer and was material to the cause of action adjudicated.
|
Our charter provides that we have the power to obligate ourselves, and our amended and restated bylaws obligate us, to indemnify our directors and officers for actions taken by them in those capacities and to pay or reimburse their reasonable expenses in advance of final disposition of a proceeding to the maximum extent permitted by Maryland law. In addition, we have entered into indemnification agreements with our directors and executive
officers that provide for indemnification and advance expenses to the maximum extent permitted by Maryland law. As a result, we and our stockholders may have more limited rights against our directors and officers than might otherwise exist under common law.
Our board of directors may change our major corporate policies without stockholder approval and those changes may materially and adversely affect us.
Our board of directors will determine and may eliminate or otherwise change our major corporate policies, including our acquisition, investment, financing, growth, operations and distribution policies. While our stockholders have the power to elect or remove directors, changes in our major corporate policies may be made by our board of directors without stockholder approval and those changes could adversely affect our business, financial condition, liquidity, results of operations and prospects, the market price of our common stock and our ability to make distributions to our stockholders and to satisfy our debt service requirements.
36
The ability of our board of directors to revoke or otherwise terminate our REIT qualification, with stockholder approval, may cause adverse consequences to our stockholders.
Our charter provides that our board of directors may revoke or otherwise terminate our REIT election, only with the affirmative vote of stockholders entitled to cast a majority of all votes entitled to be cast on the matter, if the board determines that it is no longer in our best interests to continue to qualify as a REIT. If we cease to be a REIT, we would become subject to Federal income tax on our taxable income and would no longer be required to distribute most of our taxable income to our stockholders, which may have adverse consequences on the total return to our stockholders.
Our charter and bylaws contain provisions that may delay, defer or prevent an acquisition of our common stock or a change in control.
Our charter and bylaws contain provisions, the exercise or existence of which could delay, defer or prevent a transaction or a change in control that might involve a premium price for our stockholders or otherwise be in their best interests, including the following:
Our charter contains restrictions on the ownership and transfer of our stock.
In order for us to qualify as a REIT, no more than 50% of the value of outstanding shares of our stock may be owned, beneficially or constructively, by five or fewer individuals (or certain other persons) at any time during the last half of each taxable year (“closely held”). Subject to certain exceptions, our charter prohibits any stockholder from owning beneficially or constructively, with respect to any class or series of our capital stock, more than 9.8% (in value or by number of shares, whichever is more restrictive) of the aggregate of the outstanding shares of such class or series of our capital stock.
The constructive ownership rules under the Code are complex and may cause the outstanding stock owned by a group of related individuals or entities to be deemed to be constructively owned by one individual or entity. As a result, the acquisition of 9.8% or less of the outstanding shares of a class or series of our stock by an individual or entity could cause that individual or entity or another individual or entity to own constructively in excess of the relevant ownership limits.
Among other restrictions on ownership and transfer of shares, our charter also prohibits any person from owning shares of our stock that would result in our being “closely held” under Section 856(h) of the Code or otherwise cause us to fail to qualify as a REIT. Any attempt to own or transfer shares of our common stock or of any of our other capital stock in violation of these restrictions may result in the shares being automatically transferred to a charitable trust or may be void.
Our charter provides that our board may grant exceptions to the 9.8% ownership limit, subject in each case to certain initial and ongoing conditions designed to protect our status as a REIT. These ownership limits may prevent a third-party from acquiring control of us if our board of directors does not grant an exemption from the ownership limits, even if our stockholders believe the change in control is in their best interests. An exemption from the 9.8% ownership limit was granted to certain stockholders, and our board may in the future provide exceptions to the ownership limit for other stockholders, subject to certain initial and ongoing conditions designed to protect our status as a REIT.
Our board of directors has the power to cause us to issue and authorize additional shares of our capital stock without stockholder approval.
Our charter authorizes us to issue authorized but unissued shares of common or preferred stock in addition to the shares of common stock issued and outstanding. In addition, our board of directors may, without stockholder approval, amend our charter to increase the aggregate number of our shares of stock or the number of shares of stock of any class or series that we have authority to issue and classify or reclassify any unissued shares of common or preferred stock and set the preferences, rights and other terms of the classified or reclassified shares. As a result, our board of directors may establish a class or series of shares of common or preferred stock that could delay or prevent a transaction or a change in control that might involve a premium price for our shares of common stock or otherwise be in the best interests of our stockholders.
Certain provisions of Maryland law may limit the ability of a third party to acquire control of us.
Certain provisions of the MGCL may have the effect of inhibiting a third party from acquiring us or of impeding a change of control under circumstances that otherwise could provide our common stockholders with the opportunity to realize a premium over the then prevailing market price of such shares, including:
|
•
|
“business combination” provisions that, subject to limitations, (a) prohibit certain business combinations between an “interested stockholder” (defined generally as any person who beneficially owns 10% or more of the voting power of our outstanding shares of voting stock or an affiliate or associate of ours who, at any time within the two-year period
|
37
immediately prior to the date in question, was the beneficial owner of 10% or more of the voting power of our then outstanding shares of our common stock) or an affiliate of any interested stockholder and us for five years after the most recent date on which the stockholder becomes an interested stockholder, and (b) thereafter impose two super-majority stockholder voting requirements on these combinations; and
|
•
|
“control share” provisions that provide that holders of “control shares” of our company (defined as voting shares of stock that, if aggregated with all other shares of stock owned or controlled by the acquirer (except solely by virtue of a revocable proxy), would entitle the acquirer to exercise one of three increasing ranges of voting power in electing directors) acquired in a “control share acquisition” (defined as the direct or indirect acquisition of ownership or control of “control shares”) have no voting rights with respect to “control shares” except to the extent approved by our stockholders by the affirmative vote of at least two-thirds of all of the votes entitled to be cast on the matter, excluding all votes entitled to be cast by the acquirer of control shares, and by any of our officers and employees who are also our directors.
|
Our charter provides that, notwithstanding any other provision of our charter or our bylaws, the Maryland Business Combination Act (Title 3, Subtitle 6 of the MGCL) does not apply to any business combination between us and any interested stockholder or any affiliate of any interested stockholder of ours and that we expressly elect not to be governed by the provisions of Section 3-602 of the MGCL in whole or in part. Any amendment to such provision of our charter must be approved by the affirmative vote of stockholders entitled to cast a majority of all votes entitled to be cast on the matter. Pursuant to the MGCL, our bylaws contain a provision exempting from the Maryland Control Share Acquisition Act any and all acquisitions by any person of shares of our stock. This provision of our bylaws may not be altered, amended or repealed except by our stockholders by the affirmative vote of at least two-thirds of all the votes entitled to be cast on the matter. There can be no assurance that this exemption contained in our bylaws will not be amended or eliminated at any time in the future.
Additionally, provisions of Title 3, Subtitle 8 of the MGCL permit a Maryland corporation such as the Company, by action of its board of directors and without stockholder approval and regardless of what is provided in the charter or bylaws, to elect to avail itself of certain takeover defenses, such as a classified board, unless the charter or a resolution adopted by the board of directors prohibits such election. Our charter provides that we are prohibited from making any such election unless first approved by our stockholders by the affirmative vote of a majority of all votes entitled to be cast on the matter.
A small number of our stockholders could significantly influence our business and affairs.
A few stockholders own substantial amounts of our outstanding voting stock. Large holders may be able to affect matters requiring approval by our stockholders, including the election of directors and the approval of mergers or other business combination transactions.
Risks Related to Our Common Stock
The cash available for distribution to stockholders may not be sufficient to pay dividends at expected levels, nor can we assure you of our ability to make distributions in the future. We may use borrowed funds to make distributions
If cash available for distribution is less than the amount necessary to make cash distributions, our inability to make the expected distributions could result in a decrease in the market price of our common stock. All distributions will be made at the discretion of our board of directors and will depend upon various factors, including, but not limited to: our historical and projected financial condition, cash flows, results of operations and REIT taxable income, limitations contained in financing instruments, debt service requirements, operating cash inflows and outflows, including capital expenditures and acquisitions, limitations on our ability to use cash generated in one or more taxable REIT subsidiaries, if any, to fund distributions and applicable law. We may not be able to make distributions in the future. In addition, some of our distributions may include a return of capital. To the extent that we decide to make distributions in excess of our current and accumulated earnings and profits in the future, such distributions would generally be considered a return of capital for Federal income tax purposes to the extent of the holder’s adjusted tax basis in their shares. A return of capital is not taxable, but it has the effect of reducing the holder’s adjusted tax basis in our common stock. To the extent that such distributions exceed the adjusted tax basis of a holder’s shares, they will be treated as gain from the sale or exchange of such stock. If we borrow to fund distributions, our future interest costs would increase, thereby reducing our earnings and cash available for distribution from what they otherwise would have been.
For purposes of satisfying the minimum distribution requirement to qualify for and maintain REIT status, our REIT taxable income will be calculated without reference to our cash flow. Consequently, under certain circumstances, we may not have available cash to make our required distributions, and we may need to raise additional equity or debt in order to fund our intended distributions, or we may distribute a portion of our distributions in the form of our common stock or debt instruments, which could result in significant stockholder dilution or higher leverage. While the IRS has issued a revenue procedure indicating that certain distributions that are made partly in cash and partly in stock will be treated as taxable dividends that would satisfy that REIT annual distribution
38
requirement and qualify for the dividends paid deduction for U.S. Federal income tax purposes, no assurance can be provided that we will be able to satisfy the requirements of the revenue procedure. Therefore it is unclear whether and to what extent we will be able to make taxable dividends payable in-kind. In addition, to the extent we were to make distributions that include our common stock or debt instruments, a stockholder of ours will be required to report dividend income as a result of such distributions even though we distributed no cash or only nominal amounts of cash to such stockholder.
VICI REIT is a holding company with no direct operations and will rely on distributions received from the Operating Partnership to make distributions to its stockholders.
VICI REIT is a holding company and conducts its operations through subsidiaries, including the Operating Partnership and VICI Golf. VICI REIT does not have, apart from the units that it owns in the Operating Partnership and VICI Golf, any independent operations. As a result, VICI REIT relies on distributions from its Operating Partnership to make any distributions to its stockholders it might declare on its common stock and to meet any of its obligations, including any tax liability on taxable income allocated to it from the Operating Partnership (which might not be able to make distributions to VICI REIT equal to the tax on such allocated taxable income). In turn, the ability of subsidiaries of the Operating Partnership to make distributions to the Operating Partnership, and therefore, the ability of the Operating Partnership to make distributions to VICI REIT, depends on the operating results of these subsidiaries and the Operating Partnership and on the terms of any financing arrangements they have entered into. In addition, because VICI REIT is a holding company, claims of common stockholders of VICI REIT are structurally subordinated to all existing and future liabilities and other obligations (whether or not for borrowed money) and any preferred equity of the Operating Partnership and its subsidiaries. Therefore, in the event of our bankruptcy, liquidation or reorganization, VICI REIT’s assets and those of the Operating Partnership and its subsidiaries will be available to satisfy the claims of VICI REIT common stockholders only after all of VICI REIT’s, the Operating Partnership’s and its subsidiaries’ liabilities and other obligations and any preferred equity of any of them have been paid in full.
The Operating Partnership may, in connection with its acquisition of additional properties or otherwise, issue additional common units or preferred units to third parties. Such issuances would reduce VICI REIT’s ownership in the Operating Partnership. Because stockholders of VICI REIT do not directly own common units or preferred units of the Operating Partnership, they do not have any voting rights with respect to any such issuances or other partnership level activities of the Operating Partnership.
Conflicts of interest could arise between the interests of our stockholders and the interests of holders of Operating Partnership units which may impede business decisions that could benefit our stockholders.
Conflicts of interest could arise as a result of the relationships between us, on the one hand, and our Operating Partnership or any limited partner thereof, if any, on the other. Our directors and officers have duties to us under applicable Maryland law. At the same time, we, as general partner of our Operating Partnership, have fiduciary duties and obligations to our Operating Partnership and its limited partners under Delaware law and the partnership agreement of our Operating Partnership in connection with the management of our Operating Partnership. Our duties as general partner to our Operating Partnership and its limited partners may come into conflict with the duties of our directors and officers to VICI REIT. These conflicts may be resolved in a manner that is not in the best interests of our stockholders.
The market price and trading volume of shares of our common stock may be volatile.
The market price of our common stock may be volatile. In addition, the trading volume in our common stock may fluctuate and cause significant price variations to occur. We cannot assure you that the market price of our common stock will not fluctuate or decline significantly in the future.
Some of the factors, many of which are beyond our control, that could negatively affect the market price of our common stock or result in fluctuations in the price or trading volume of our common stock include:
|
•
|
actual or anticipated variations in our quarterly results of operations or distributions;
|
|
•
|
changes in our earnings, Funds From Operations (“FFO”), Adjusted Funds From Operations (“AFFO ”) or Adjusted EBITDA estimates;
|
|
•
|
publication of research reports about us, Caesars or the real estate or gaming industries;
|
|
•
|
adverse developments involving Caesars;
|
|
•
|
changes in market interest rates that may cause purchasers of our shares to demand a different yield;
|
|
•
|
changes in market valuations of similar companies;
|
39
|
•
|
market reaction to any additional capital we raise in the future;
|
|
•
|
additions or departures of key personnel;
|
|
•
|
actions by institutional stockholders;
|
|
•
|
speculation in the press or investment community about our company or industry or the economy in general;
|
|
•
|
the occurrence of any of the other risk factors presented in this Annual Report on Form 10-K or our other SEC filings; and
|
|
•
|
general market and economic conditions.
|
Future offerings of debt and/or preferred equity securities, which may be senior to our shares for purposes of distributions or upon liquidation, could adversely affect the market price of our common stock.
In the future, we may attempt to increase our capital resources by making additional offerings of debt or preferred equity securities, including medium-term notes, trust preferred securities, senior or subordinated notes and preferred shares. If a liquidation event were to occur, holders of our debt securities and preferred shares and lenders with respect to other borrowings will receive distributions of our available assets prior to the holders of our shares. Additional equity offerings may dilute the holdings of our existing stockholders or reduce the market price of our common stock, or both. Holders of shares of our common stock are not entitled to preemptive rights or other protections against dilution. Our preferred shares, if issued, could have a preference on liquidating distributions or a preference on distribution payments that could limit our ability to make a distribution to the holders of shares of our common stock. Since our decision to issue securities in any future offering will depend on market conditions and other factors beyond our control, we cannot predict or estimate the amount, timing or nature of our future offerings. Thus, our stockholders bear the risk of our future offerings reducing the market price of shares of our common stock and diluting their shareholdings in us.
Our earnings and cash distributions could affect the market price of shares of our common stock.
Our common stock may trade at prices that are higher or lower than the net asset value per share. To the extent that we retain operating cash flow for investment purposes, working capital reserves or other purposes rather than distributing the cash flows to stockholders, these retained funds, while increasing the value of our underlying assets, may negatively impact the market price of shares of our common stock. Our failure to meet market expectations with regard to future earnings and cash distributions could adversely affect the market price of shares of our common stock.
|
ITEM 1B.
|
Unresolved Staff Comments
|
None.
|
ITEM 2.
|
Properties
|
Our geographically diverse portfolio consists of 20 market-leading properties that are leased to Caesars, including Caesars Palace Las Vegas and Harrah’s Las Vegas, two of the most iconic entertainment facilities on the Las Vegas Strip, approximately 34 acres of undeveloped land adjacent to the Las Vegas Strip that is leased to Caesars and four championship golf courses located near certain of our properties, two of which are in close proximity to the Las Vegas Strip.
Our properties secure our long-term debt. See
Note 9
—
Debt
to our Consolidated Financial Statements included in Item 8 for additional information.
See Item 1 for further information pertaining to our properties.
|
ITEM 3.
|
Legal Proceedings
|
In the ordinary course of business, from time to time, the Company may be subject to legal claims and administrative proceedings, none of which are currently outstanding, which the Company believes could have, individually or in the aggregate, a material adverse effect on its business, financial condition or results of operations, liquidity or cash flows.
|
ITEM 4.
|
Mine Safety Disclosures
|
Not applicable.
40
Market Information
On February 1, 2018, in connection with our initial registered public offering, our common stock began trading on the New York Stock Exchange (“NYSE”) under the symbol “VICI.” Prior to this, our common stock was quoted on the OTC Markets Group, Inc.’s “Grey Market” under the symbol “VICI.” The following table sets forth the high and low bid quotations per share of our common stock as reported on the OTC Market for the period presented. The OTC Market quotations reflect inter-dealer prices, without retail mark-up, mark-down or commission and may not necessarily represent actual transactions.
|
Share Price
|
||||
|
|
|
High
|
Low
|
|
|
Fourth Quarter ended December 31, 2017
(1)
|
|
$21.00
|
$18.00
|
|
_______________________________
(1)
Represents the period from October 18, 2017, the first date on which our shares of common stock were publicly traded, until December 31, 2017.
Holders
As of February 28, 2018, there were 370,128,832 shares of common stock issued and outstanding that were held by approximately 225 stockholders of record, not including beneficial owners of shares registered in nominee or street name.
Distribution Policy
We intend to make regular quarterly distributions to holders of shares of our common stock. We cannot assure you that our estimated distributions will be made or sustained or that our board of directors will not change our distribution policy in the future. Any distributions will be at the sole discretion of our board of directors, and their form, timing and amount, if any, will depend upon a number of factors, including our actual and projected results of operations, FFO, liquidity, cash flows and financial condition, the revenue we actually receive from our properties, our operating expenses, our debt service requirements, our capital expenditures, prohibitions and other limitations under our financing arrangements, our REIT taxable income, the annual REIT distribution requirements, applicable law and such other factors as our board of directors deems relevant. For more information regarding risk factors that could materially and adversely affect us and our ability to make cash distributions, see “Risk Factors.” If our operations do not generate sufficient cash flow to enable us to pay our intended or required distributions, we may be required either to fund distributions from working capital, borrow or raise equity or to reduce such distributions. In addition, our charter allows us to issue preferred stock that could have a preference on distributions and could limit our ability to make distributions to our stockholders. Additionally, under certain circumstances, agreements relating to our indebtedness could limit our ability to make distributions to our stockholders.
Federal income tax law requires that a REIT distribute annually at least 90% of its REIT taxable income (with certain adjustments), determined without regard to the dividends paid deduction and excluding any net capital gains, and that it pay tax at regular corporate rates to the extent that it annually distributes less than 100% of its REIT taxable income, determined without regard to the dividends paid deduction and including any net capital gains. In addition, a REIT will be required to pay a 4% nondeductible excise tax on the amount, if any, by which the distributions it makes in a calendar year are less than the sum of 85% of its ordinary income, 95% of its capital gain net income and 100% of its undistributed income from prior years.
We intend to make distributions to our stockholders to comply with the REIT requirements of the Code and to avoid or otherwise minimize paying entity level Federal or excise tax (other than at any TRS of ours). We may generate taxable income greater than our income for financial reporting purposes prepared in accordance with GAAP. In particular, during the first several years of the leases, under the terms of the Lease Agreements, rental income will be allocated for tax purposes generally in an amount greater than cash rents. Further, we may generate REIT taxable income greater than our cash flow from operations after operating expenses and debt service as a result of differences in timing between the recognition of REIT taxable income and the actual
41
receipt of cash or the effect of nondeductible capital expenditures, the creation of reserves or required debt or amortization payments.
To date, we have not made any cash distributions.
Recent Sales of Unregistered Securities
We did not sell any equity securities which were not registered under the Securities Act of 1933, as amended (the “Securities Act”) during the year ended December 31, 2017 that were not otherwise disclosed in our Quarterly Reports on Form 10-Q or our Current Reports on Form 8-K.
Issuer Repurchases of Equity Securities
We did not repurchase any shares of our common stock during the three months ended December 31, 2017.
Registered Offering of Securities - Use of Proceeds
On January 31, 2018, our Registration Statement on Form S-11, as amended (Commission File No. 333-221997) and our Registration Statement on Form S-11MEF (Commission File No. 333-222806) were declared effective by the SEC, pursuant to which we sold a total of 69,575,000 shares of our common stock at a price per share of $20.00, for an aggregate offering price of $1.3915 billion (the “Offering”) before fees, expenses and commissions. Morgan Stanley & Co. LLC, Goldman Sachs & Co. LLC and Merrill Lynch, Pierce, Fenner & Smith Incorporated acted as principal representatives of the underwriters in the Offering. The Offering was completed on February 5, 2018, after sales of all 69,575,000 shares of common stock (inclusive of the full exercise by the underwriters of their overallotment option to purchase 9,075,000 additional shares of common stock). None of the proceeds from the Offering were used during the reporting period covered by this Annual Report on Form 10-K.
42
Stock Performance Graph
The graph below matches VICI Properties’ cumulative two-month total shareholder return on common stock with the cumulative total returns of the S&P 500 index and the FTSE NAREIT Equity REITs index. The graph tracks the performance of a $100 investment in our common stock and in each index (with the reinvestment of all dividends as required by the SEC) from October 18, 2017 the first date on which our shares of common stock were publicly traded, until December 31, 2017. The return shown on the graph is not necessarily indicative of future performance.
The following performance graph shall not be deemed to be "filed" for purposes of Section 18 of the Exchange Act, nor shall this information be incorporated by reference into any future filing under the Securities Act or the Exchange Act, except to the extent that we specifically incorporate it by reference into a filing.
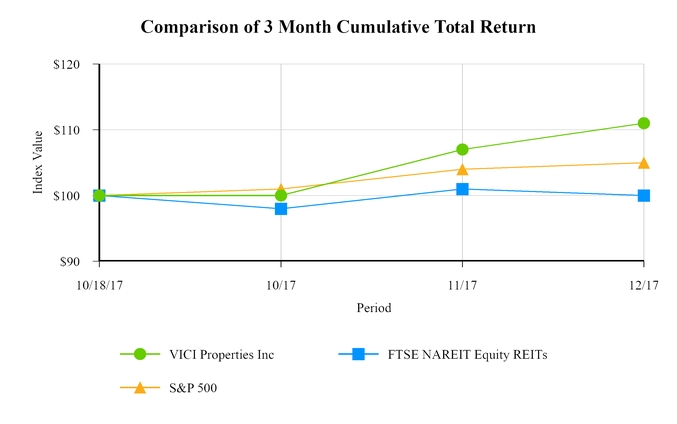
|
Company / Index
|
10/18/2017
|
|
10/17
|
|
11/17
|
|
12/17
|
|
||||||||
|
VICI Properties Inc
|
$
|
100.0
|
|
$
|
100.0
|
|
$
|
107.0
|
|
$
|
111.0
|
|
||||
|
FTSE NAREIT Equity REITs
|
$
|
100.0
|
|
$
|
98.0
|
|
$
|
101.0
|
|
$
|
100.0
|
|
||||
|
S&P 500
|
$
|
100.0
|
|
$
|
101.0
|
|
$
|
104.0
|
|
$
|
105.0
|
|
||||
43
The following selected financial data is derived from our Financial Statements. It should be read in conjunction with the Financial Statements and Item 7, “Management’s Discussion and Analysis of Financial Condition and Results of Operations,” in this Annual Report on Form 10-K.
|
(In thousands, except share data)
|
Period from October 6, 2017 to December 31, 2017*
|
|||
|
Statement of Operations:
|
||||
|
Net revenues
|
$
|
187,609
|
|
|
|
Total operating expenses
|
43,413
|
|
||
|
Income from operations
|
144,196
|
|
||
|
Interest expense
|
(63,354
|
)
|
||
|
Loss from extinguishment of debt
|
(38,488
|
)
|
||
|
Income before income taxes
|
42,636
|
|
||
|
Provision for income taxes
|
1,901
|
|
||
|
Net income
|
44,537
|
|
||
|
Net income attributable to common stockholders
|
42,662
|
|
||
|
Per share data:
|
||||
|
Basic earnings per common share
|
$
|
0.19
|
|
|
|
Diluted earnings per common share
|
$
|
0.19
|
|
|
|
Weighted shares outstanding
—
Basic
|
227,828,844
|
|
||
|
Weighted shares outstanding
—
Diluted
|
227,985,455
|
|
||
|
Other Data:
|
||||
|
Net cash provided by operating activities
|
$
|
129,440
|
|
|
|
Net cash used in investing activities
|
(1,136,251
|
)
|
||
|
Net cash provided by financing activities
|
1,148,446
|
|
||
|
Financial Position Data:
|
As of December 31, 2017
|
|||
|
Cash and cash equivalents
|
$
|
183,646
|
|
|
|
Restricted cash
|
13,760
|
|
||
|
Total assets
|
9,739,712
|
|
||
|
Debt
|
4,785,756
|
|
||
|
Non-controlling interests
|
84,875
|
|
||
|
Shareholders’ equity
|
4,776,364
|
|
||
_____________________________
*
Represents the period from October 6, 2017, the date of the Company’s Formation, through December 31, 2017
44
You should read the following discussion and analysis of our financial condition and results of operations in conjunction with the audited consolidated Financial Statements and notes thereto of VICI Properties Inc., the combined Financial Statements and notes thereto of Caesars Entertainment Outdoor and other financial information included elsewhere in this Annual Report on Form 10-K. Some of the information contained in this discussion and analysis or set forth elsewhere in this Annual Report on Form 10-K, including information with respect to our business and growth strategies, statements regarding the industry outlook and our expectations regarding the future performance of our business contained herein are forward-looking statements. See “Cautionary Note Regarding Forward-Looking Statements.” You should also review the “Risk Factors” section of this Annual Report on Form 10-K for a discussion of important factors that could cause actual results to differ materially from the results described in or implied by such forward-looking statements
.
BACKGROUND AND FORMATION
VICI is a Maryland corporation that was created to hold certain real estate assets owned by Caesars Entertainment Operating Company (“CEOC”), upon CEOC’s emergence from bankruptcy. Pursuant to CEOC’s Plan of Reorganization, on
October 6, 2017
(the “
Formation Date
”), the historical business of CEOC was separated by means of a spin-off transaction whereby the real property assets (“Formation Properties”) of CEOC and certain of its subsidiaries, including
four
golf course businesses, were transferred through a series of transactions to VICI. Following the
Formation Date
, VICI is a stand-alone entity that was initially owned by certain former creditors of CEOC. VICI is primarily engaged in the business of owning and acquiring gaming, hospitality and entertainment destinations. VICI leases the Formation Properties and Harrah’s Las Vegas, which was acquired on
December 22, 2017
, to subsidiaries of Caesars. VICI conducts its real property business through an operating partnership and its golf course business through a taxable REIT subsidiary (“TRS”), VICI Golf LLC.
The financial information included in this Annual Report on Form 10-K are the consolidated results of VICI (including the real property business and the golf course business) from
October 6, 2017
through December 31, 2017. Other financial information included in Part IV, Item 15 of this Annual Report on Form 10-K are the historical combined Financial Statements of Caesars Entertainment Outdoor, the golf course business owned by CEOC until
Formation Date
. The financial information included for Caesars Entertainment Outdoor includes the period January 1, 2017 through October 5, 2017.
We intend to elect on our U.S. federal income tax return for our taxable year ended December 31, 2017 to be treated as a REIT and we have elected for VICI Golf LLC to be treated as a “taxable REIT subsidiary.”
SUMMARY OF 2017 EVENTS
Formation
In connection with our formation, on
October 6, 2017
, we issued
177,160,494
shares of common stock and
12,000,000
shares of Series A preferred stock with an aggregate liquidation preference of
$300.0 million
(
$25
per share) to CEOC and certain of its subsidiaries in exchange for the Formation Properties, Caesars Entertainment Outdoor and approximately
$56 million
of cash and other assets, which shares were transferred by CEOC to its creditors as part of the Plan of Reorganization. These assets had an aggregate fair value of approximately
$8.4 billion
.
On October 6, 2017, in connection with our formation, we entered into the Formation Lease Agreements, pursuant to which we lease the Formation Properties to Caesars. Additionally, on October 6, 2017, we entered into the Golf Course Use Agreement.
In addition, on
October 6, 2017
, the Company entered into
$4,917.0 million
aggregate principal amount of debt consisting of senior secured credit facilities of
$1,638.4 million
(“Prior Term Loan”), first lien notes of
$311.7 million
(“Prior First Lien Notes”), second lien notes of
$766.9 million
(“Second Lien Notes”),
$1,550.0 million
in asset-level real estate mortgage financing of CPLV (“CPLV CMBS Debt”) and
$650.0 million
in CPLV mezzanine debt.
Mandatory Conversions
On
November 6, 2017
, all of the Series A preferred stock automatically converted into
51,433,692
shares of the Company’s common stock (the “Mandatory Preferred Conversion”). No additional consideration was payable in connection with the Mandatory Preferred Conversion.
45
On
November 6, 2017
, the junior tranche of CPLV mezzanine debt of
$250.0 million
issued to institutional accredited investors at formation, automatically converted into an aggregate of
17,630,700
shares of our common stock.
Acquisition of Harrah’s Las Vegas and Sale of Eastside Property
Purchase of Harrah’s Las Vegas Real Estate
On
December 22, 2017
, we acquired all of the land and real property improvements associated with Harrah’s Las Vegas Hotel & Casino (“HLV”) from a subsidiary of Caesars, for a purchase price of approximately
$1,136.2 million
. On the closing date, we entered into the HLV Lease Agreement with a subsidiary of Caesars, as tenant, pursuant to which we lease back HLV to Caesars, and Caesars Resorts Collection (“CRC”) guarantees the tenant’s payment obligations under the lease.
Sale of Eastside Property
On
December 22, 2017
, we sold approximately
18.4
acres of certain parcels located in Las Vegas, Nevada, east of HLV, to a subsidiary of Caesars, for a sales price of approximately
$73.6 million
.
At the closing, we entered into a Put-Call Agreement with certain subsidiaries of Caesars, which provides Caesars and us with certain rights and obligations in connection with (i) the sale by subsidiaries of Caesars to us and simultaneous leaseback by us to subsidiaries of Caesars of the Eastside Convention Center Property; and (ii) in the event the transactions described in item (i) are triggered by Caesars and such transactions do not close for reasons other than a default by Caesars or failure to obtain any required regulatory approvals (among other things), and Caesars so elects, the sale by us to Caesars of HLV, all on and subject to the terms and conditions set forth in the Put-Call Agreement. After the closing, subsidiaries of Caesars are the owners of certain parcels of real property located adjacent to HLV (including the Eastside Property) (collectively, the “Designated Property”), all or a portion of which Designated Property may in the future be improved by a convention center (in such case, the “Eastside Convention Center”).
Due to the Put-Call Agreement on the land parcels, it was determined that the transaction does not meet the requirements of a completed sale for accounting purposes. As a result, we reclassified $
73.6 million
from Real estate investments accounted for using the operating method to Land. Additionally, the Company recorded a
$73.6 million
Deferred financing liability in its Balance Sheet.
Amended and Restated Right of First Refusal Agreement
On
December 22, 2017
, VICI and Caesars entered into an Amended and Restated Right of First Refusal Agreement pursuant to which we also have a right of first refusal on any sale-leaseback by Caesars of the gaming facilities of Centaur Holdings, LLC, which are proposed to be acquired by Caesars, and certain income-producing improvements if built by Caesars in lieu of a large-scale convention center on the Eastside Property, subject to certain exclusions.
$2.6 Billion Senior Secured VICI PropCo Credit Facility and Debt Refinancing
On
December 22, 2017
, we entered into a new $2.6 billion senior secured VICI PropCo Credit Facility, comprised of a
$2.2 billion
senior secured term loan facility (the “Term B Loan Facility”) and a
$400.0 million
senior secured revolving credit facility (the “Revolving Credit Facility”). The proceeds of the Term B Loan Facility, together with
$300.0 million
of borrowings under the Revolving Credit Facility, provided a portion of the proceeds used to purchase the Harrah’s Las Vegas property, to repay in full the Prior Term Loans, to repurchase in full the then outstanding Prior CPLV Mezzanine Debt and to discharge in full our obligations under the Prior First Lien Notes.
Private Equity Placement
On
December 22, 2017
, we sold, contemporaneously with the consummation of the acquisition of the Harrah’s Las Vegas property,
54,054,052
shares of our common stock at a price of $18.50 per share in a private placement transaction, for net proceeds of approximately
$963.8 million
. The net proceeds from the transaction were used to partially fund the purchase price for the Harrah’s Las Vegas property and for working capital and general corporate purposes.
46
KEY TRENDS THAT MAY AFFECT OUR BUSINESS
Subsidiaries of Caesars are the lessees of all of our properties pursuant to the Lease Agreements, and Caesars or CRC guarantees the obligations of the tenants under the Lease Agreements. The Lease Agreements account for substantially all of our revenues. Additionally, we expect to experience organic growth in rental revenue through annual rent escalators in our Lease Agreements. Accordingly, we are dependent on Caesars, the gaming industry and the health of the economies in the areas where our properties are located for the foreseeable future, and an event that has a material adverse effect on Caesars’ business, financial condition, liquidity, results of operations or prospects would have a material adverse effect on our business, financial condition, liquidity, results of operations and prospects. See “Risk Factors—Risks Related to Our Business and Operations.”
Additionally, we expect to grow our portfolio through acquisitions by pursuing opportunities to execute sale leaseback transactions with Caesars, pursuant to: (i) the Call Right Agreements, relating to three properties; (ii) rights of first refusal relating to certain domestic gaming facilities proposed to be acquired or developed by Caesars located outside the Gaming Enterprise District of Clark County, Nevada and the properties that Caesars recently agreed to acquire from Centaur Holdings, LLC; and (iii) the Put-Call Agreement, which includes rights relating to the Eastside Convention Center Property in Las Vegas. Additionally, we will actively seek to grow our portfolio through acquisitions of experiential real estate in dynamic markets spanning hospitality, entertainment, leisure and gaming properties. Finally, we believe the approximately 34 acres (after giving effect to the sale of approximately 18.4 acres to Caesars in December 2017) of undeveloped land adjacent to the Las Vegas Strip that we own will provide attractive opportunities for potential future expansion and development. In pursuing external growth initiatives, we will generally seek to acquire properties that can generate stable rental revenue through long-term, triple-net leases with tenants with
established operating histories, and we will consider various factors when evaluating acquisitions, including the ability to diversify our tenant base, by potentially leasing properties to parties unaffiliated with Caesars, and increasing our geographic diversification.
Our operating and financial performance in the future will be significantly influenced by the success of our acquisition strategy, and the timing and the availability and terms of financing of any acquisitions that we may complete. We can provide no assurance that we will exercise any of our contractual rights to purchase one or more properties from Caesars or otherwise be successful in acquiring any properties. Additionally, our ability to successfully implement our acquisition strategy will depend upon the availability and terms of financing, including debt and equity capital. Further, the pricing of any acquisitions we may consummate and the terms of any leases that we may enter into will significantly impact our future results. Competition to execute sale leaseback transactions with attractive properties and desirable tenants is intense, and we can provide no assurance that any future acquisitions or leases will be on terms as favorable to us as those relating to recent transactions. Should we exercise an option to purchase a property under a Call Right Agreement, the purchase price will be equal to ten times the property’s annual rent, which, in turn, will equal approximately 60% of the trailing property EBITDAR at the time of exercise. Accordingly, the purchase price and rent for any property we may acquire under a Call Right Agreement and lease to Caesars will depend upon the property’s EBITDAR at the time of exercise. We anticipate that we would seek to finance these acquisitions with a majority of equity, although no assurance can be given that we would be able to issue equity in such amounts on favorable terms, or at all, or that we would not determine to incur more debt on a relative basis at the relevant time due market conditions or otherwise. In addition to rent, our tenants are required to pay the following: (1) all facility maintenance; (2) all insurance required in connection with the leased properties and the business conducted on the leased properties; (3) taxes levied on or with respect to the leased properties (other than taxes on our income); and (4) all utilities and other services necessary or appropriate for the leased properties and the business conducted on the leased properties. Accordingly, due to the “triple-net” structure of our leases, we do not expect to incur significant property-level expenses.
DISCUSSION OF OPERATING RESULTS
Revenue
For the period from October 6, 2017, the date of our formation, to December 31, 2017 our revenue was
$187.5 million
and was comprised of
$181.2 million
from our real property business and
$6.4 million
from our golf course business.
Real Property Business Revenue
Real property business revenue of
$181.2 million
was generated from rent and reimbursements of property taxes, pursuant to the Formation Lease Agreements, which became effective on October 6, 2017, and the HLV Lease, which became effective on December 22, 2017, and was comprised of $
150.1 million
of earned income from direct financing leases,
$11.5 million
of rental income from operating leases and
$19.6 million
of property taxes paid by our tenants on the leased properties.
47
For the period from October 6, 2017 to December 31, 2017, cash received under our Lease Agreements was
$213.7 million
, including
$60.4 million
received for January 2018 rent.
Golf Course Business Revenue
For the period from October 6, 2017 to December 31, 2017, Golf Course related revenue was
$6.4 million
. Revenue for the golf courses included
$2.4 million
earned pursuant to the Caesars membership fee;
$0.7 million
from the Caesars use fee;
$0.3 million
from Caesars minimum rounds fees;
$2.1 million
from other golf activities;
$0.4 million
from food and beverage; and
$0.5 million
from merchandise sales and other.
For the period from January 1, 2017 to October 5, 2017, Golf Course related revenue was
$14.1 million
and were comprised of golf revenues of
$11.4 million
, food and beverage revenues of
$1.3 million
and retail and other revenues of
$1.4 million
. Golf Course related revenue was
$18.8 million
and
$18.1 million
for the years ended December 31, 2016 and 2015, respectively. Revenues for the year ended December 31, 2016 were comprised of golf revenues of
$14.6 million
, food and beverage revenues of
$2.1 million
and other revenues of
$2.1 million
. Revenues for the year ended December 2015 were comprised of golf revenues of
$14.1 million
, food and beverage revenues of
$2.1 million
and other revenues of
$1.9 million
.
Operating Expenses
General and Administrative Expenses
For the period from October 6, 2017 to December 31, 2017, general and administrative expenses were
$9.9 million
, comprised primarily of
$5.0 million
of compensation costs;
$3.4 million
of legal and professional fees and
$1.1 million
of franchise and other taxes.
Transaction and Acquisition Costs
For the period from October 6, 2017 to December 31, 2017, transaction and acquisition costs totaled
$9.0 million
and were comprised of expenses related to the acquisition of Harrah’s Las Vegas and the sale of the Eastside Property.
We recognized a loss on extinguishment of debt of
$38.5 million
during the period from October 6, 2017 to December 31, 2017, resulting from the buy down of
$400.0 million
aggregate principal amount of Prior CPLV Mezzanine Debt.
Property Taxes
Property taxes paid or reimbursed by our tenants were
$19.6 million
for the period from October 6, 2017 to December 31, 2017.
Golf-related Expenses
Golf-related expenses totaled
$4.1 million
for the period from October 6, 2017 to December 31, 2017 and were primarily comprised of property-related costs consisting of land rent, grounds maintenance, taxes, insurance and utilities directly related to the golf course of
$1.7 million
; compensation costs of
$1.1 million
; and food, beverage and retail-related cost of goods sold of
$0.4 million
.
In addition,
$0.8 million
of depreciation expense was incurred by the golf business during the period from October 6, 2017 to December 31, 2017.
Golf-related expenses totaled
$14.1 million
for the period from January 1, 2017 to October 5, 2017. Golf-related expenses totaled
$18.8 million
and
$18.1 million
for the years ended December 31, 2016 and 2015, respectively.
48
Interest Expense
During the period from October 6, 2017 to December 31, 2017, we incurred
$63.4 million
of interest expense from our borrowing obligations based upon a weighted average interest rate of
5.19%
. We paid cash interest costs of $36.8 million during the 2017 period. See “Liquidity and Capital Resources” below for more information.
Net Income, Funds From Operations (“FFO”), Available Funds From Operations (“AFFO”) and Adjusted EBITDA
Net income, FFO, AFFO and Adjusted EBITDA were
$42.7 million
,
$42.7 million
,
$84.1 million
and
$145.1 million
for the period from October 6, 2017 to December 31, 2017. See “Reconciliation of Non-GAAP Measures” below for a reconciliation of net income to FFO, AFFO and Adjusted EBITDA.
RECONCILIATION OF NON-GAAP MEASURES
We present Funds From Operations (“FFO”), Adjusted Funds From Operations (“AFFO”) and Adjusted EBITDA, which are not required by, or presented in accordance with, generally accepted accounting principles in the United States (“GAAP”). These are non-GAAP financial measures and should not be construed as alternatives to net income or as an indicator of operating performance (as determined in accordance with GAAP). We believe FFO, AFFO and Adjusted EBITDA provide a meaningful perspective of the underlying operating performance of our business.
FFO is a non-GAAP financial measure that is considered a supplemental measure for the real estate industry and a supplement to GAAP measures. Consistent with the definition used by The National Association of Real Estate Investment Trusts (“NAREIT”), we define FFO as net income (or loss) (computed in accordance with GAAP) excluding gains (or losses) from sales of property plus real estate depreciation. AFFO is a non-GAAP measure that is used as a supplemental operating measure specifically for comparing year over year ability to fund dividend distribution from operating activities. AFFO is used by us as a basis to address our ability to fund our dividend payments. We calculate AFFO by adding or subtracting from FFO direct financing lease adjustments, transaction costs incurred in connection with the acquisition of real estate investments, non-cash stock-based compensation expense, amortization of debt issuance costs and original issue discount, non-cash interest expense, non-real estate depreciation (which is comprised of the depreciation related to our golf course operations), impairment charges on non-real estate assets, amortization of capitalized leasing costs and debt extinguishment gains and losses. We define Adjusted EBITDA as net income as adjusted for gains (or losses) from sales of property, real estate depreciation, direct financing lease adjustments, transaction costs incurred in connection with the acquisition of real estate investments, non-cash stock-based compensation expense, amortization of debt issuance costs and original issue discount, other non-cash interest expense, non-real estate depreciation (which is comprised of the depreciation related to our golf course operations), impairment charges on non-real estate assets, amortization of capitalized leasing costs, debt extinguishment gains and losses, provision for income taxes and interest expense, net.
Because not all companies calculate FFO, AFFO and Adjusted EBITDA in the same way we do and other companies may not perform such calculations, those measures as used by other companies may not be consistent with the way we calculate such measures and should not be considered as alternative measures of operating income or net income. Our presentation of these measures does not replace the presentation of our financial results in accordance with GAAP.
49
Reconciliation of FFO, AFFO and Adjusted EBITDA
|
(In thousands)
|
For the period October 6, 2017 to December 31, 2017
|
|||
|
Net income attributable to common shareholders
|
$
|
42,662
|
|
|
|
Real estate depreciation
|
—
|
|
||
|
FFO
|
42,662
|
|
||
|
Direct financing lease adjustments attributable to common shareholders
|
(8,362
|
)
|
||
|
Loss on extinguishment of debt
|
38,488
|
|
||
|
Acquisition and transaction costs
|
9,039
|
|
||
|
Non-cash stock compensation
|
1,385
|
|
||
|
Amortization of debt issuance costs and original issue discount
|
156
|
|
||
|
Other depreciation
|
751
|
|
||
|
AFFO
|
84,119
|
|
||
|
Interest expense, net
|
62,916
|
|
||
|
Income tax benefit
|
(1,901
|
)
|
||
|
Adjusted EBITDA
|
$
|
145,134
|
|
|
LIQUIDITY AND CAPITAL RESOURCES
General
VICI’s intends to use funds for payment of operating expenses, cash distributions, principal and interest on our outstanding indebtedness and other investments. We expect to meet our liquidity and capital resource requirements primarily through currently available cash and cash equivalents, restricted cash, cash received under our Lease Agreements, borrowings from banks, including undrawn capacity under our Revolving Credit Facility, and proceeds from the issuance of debt and equity securities. As of December 31, 2017, our cash balance was
$183.9 million
, our restricted cash balance was
$13.8 million
and we had $300.0 million outstanding and $100.0 million was available for future borrowings under our Revolving Credit Facility.
Cash Flow Analysis
The table below summarizes our cash flows for the period from October 6, 2017 to December 31, 2017:
|
(In thousands)
|
Period from October 6 to December 31, 2017
|
||||
|
Cash, cash equivalents and restricted cash
|
|||||
|
Provided by operating activities
|
$
|
129,440
|
|
||
|
Used in investing activities
|
(1,136,251
|
)
|
|||
|
Provided by financing activities
|
1,148,446
|
|
|||
|
Net increase in cash, cash equivalents and restricted cash
|
141,635
|
|
|||
|
Balance at October 6, 2017
|
55,771
|
|
|||
|
Balance at December 31, 2017
|
$
|
197,406
|
|
||
Cash Flows from Operating Activities
Net cash provided by operating activities totaled
$129.4 million
for the period from October 6, 2017 to December 31, 2017 with the primary source being from cash rent collected by our leasing operations of $
213.7
million and the primary use being cash paid for interest on our debt obligations of
$36.8 million
.
50
Cash Flows from Investing Activities
Net cash used in investing activities totaled
$1,136.3 million
for the period from October 6, 2017 to December 31, 2017. The acquisition of Harrah’s Las Vegas for
$1,136.2 million
was the primary use of cash from investing activities. The sale of approximately
18.4
acres of undeveloped land located behind the LINQ Hotel & Casino and Harrah’s Las Vegas to Caesars for
$73.6 million
was the primary source of cash from investing activities.
Cash Flows from Financing Activities
Net cash provided by financing activities totaled
$1,148.4 million
million for the period from October 6, 2017 to December 31, 2017.
The primary sources of cash from financing activities include:
|
•
|
Proceeds from the issuance of $2,200.0 million of Term Loan B Facility;
|
|
•
|
Proceeds from the $300.0 million draw from our Revolving Credit Facility;
|
|
•
|
Proceeds from the private placement issuance of $1,000.0 million of our common stock; and
|
The primary uses of cash from financing activities include:
|
•
|
Repayment of our $1,638.4 million senior secured first lien Prior Term Loan;
|
|
•
|
Repayment of our $311.7 million first-priority senior secured Prior First Lien Notes;
|
|
•
|
The purchase by VICI PropCo of the entirety of the outstanding CPLV mezzanine debt in the aggregate principal amount of $400.0 million;
|
|
•
|
Costs of $36.2 million related to our common stock private placement and premium and fees related to the purchase of the mezzanine debt of $38.4 million; and
|
|
•
|
Debt issuance costs of $31.5 million related to our Term Loan B Facility and Revolving Credit Facility.
|
Debt
On the Formation Date, VICI issued $1,638.4 million of Prior Term Loans; $311.7 million aggregate principal amount of Prior First Lien Notes; $766.9 million aggregate principal amount of Second Lien Notes; $1,550.0 million of CPLV CMBS Debt and $650.0 million of CPLV mezzanine debt for a total aggregate face value of debt of $4,917.0 million. The weighted average interest rate on the outstanding debt at formation was 5.36% and had a first year debt service requirements of $272.0 million.
As a result of a mandatory conversion of the $250.0 million junior tranche of the CPLV mezzanine debt in November 2017 and certain refinancing transactions in December 2017, VICI has $4,816.9 million of aggregate face value of debt outstanding at December 31, 2017. Included in our year-end debt balances are: a new $2,200.0 million Term B Loan Facility; $300.0 million drawn on a new $400.0 million senior secured Revolving Credit Facility; $1,550.0 million of CPLV CMBS Debt; and $766.9 million of our Second Lien Notes. The weighted average interest rate on all outstanding debt at December 31, 2017 was 4.64%
and has a 2018 debt service requirements of $249.3 million. In addition, we were in compliance with all debt-related covenants at December 31, 2017.
Impact of Initial Public Offering
On February 5, 2018, the Company completed an initial public offering of 69,575,000 shares of common stock (which included 9,075,000 shares of common stock related to the overallotment option exercised by the underwriters in full) at an offering price of $20.00 per share for gross proceeds of $1,391.5 million, resulting in net proceeds of $1,307.0 million after commissions and expenses. The Company utilized a portion of the net proceeds from the stock offering to: (a) pay down $300.0 million of indebtedness outstanding under the Revolving Credit Facility; (b) redeem $268.4 million in aggregate principal amount of the Second Lien Notes at a redemption price of 108% plus accrued and unpaid interest to the date of the redemption; and (c) repay $100.0 million of the Term Loan B Facility.
51
The impact of these subsequent payments of debt decreased our weighted average interest rate on outstanding debt from 4.64% at December 31, 2017 to 4.39% at February 28, 2018 and decreased our 2018 debt service requirements to $210.8 million.
VICI PropCo Credit Facility
On December 22, 2017, VICI PropCo entered into the VICI PropCo Credit Facility, comprised of the $2,200.0 million senior secured Term Loan B Facility and a $400.0 million senior secured Revolving Credit Facility. The Revolving Credit Facility and Term Loan B Facility initially bear interest at LIBOR plus 2.25%, with an adjustment to LIBOR plus 2.00% upon an Initial Public Offering with proceeds greater than $500.0 million. The Revolving Credit Facility will mature on December 22, 2022 and the Term Loan B Facility will mature on December 22, 2024 or the date that is three months prior to the maturity date of the Second Lien Notes, whichever is earlier (or if the maturity is extended pursuant to the terms of the agreement, such extended maturity date as determined pursuant thereto). As of December 31, 2017, $300.0 million was drawn on the Revolving Credit Facility. If more than 30% of the Revolving Credit Facility is utilized at any quarter-end, VICI PropCo is required to maintain a maximum total net debt to adjusted total assets ratio.
The VICI PropCo Credit Facility contains customary covenants that, among other things, limit the ability of VICI PropCo and its restricted subsidiaries to: (i) incur additional indebtedness; (ii) merge with a third party or engage in other fundamental changes; (iii) make restricted payments; (iv) enter into, create, incur or assume any liens; (v) make certain sales and other dispositions of assets; (vi) enter into certain transactions with affiliates; (vii) make certain payments on certain other indebtedness; (viii) make certain investments; and (ix) incur restrictions on the ability of restricted subsidiaries to make certain distributions, loans or transfers of assets to the VICI PropCo or any restricted-subsidiary. These covenants are subject to a number of important exceptions and qualifications, including, with respect to the restricted payments covenant, the ability to make unlimited restricted payments to maintain the REIT status of VICI.
CPLV CMBS Debt
On the Formation Date, CPLV Property Owner LLC, the special purpose entity that is the fee owner of CPLV (subject to the CPLV Lease Agreement) and that is indirectly owned by VICI PropCo (the “CPLV Mortgage Borrower”) borrowed the CPLV CMBS Debt, which matures in October 2022 and consists of asset-level real estate mortgage financing from various third-party financial institutions.
The CPLV CMBS Debt has an interest rate of 4.36% per annum and is secured by, among other things, all of the assets of CPLV Mortgage Borrower, including, but not limited to, CPLV Mortgage Borrower’s (1) fee interest (except as provided in (2)) in and to CPLV, (2) leasehold interest with respect to Octavius Tower, and (3) interest in the CPLV Lease Agreement and all related agreements. The CPLV CMBS Debt is a first priority lien, subject only to permitted encumbrances (which are set forth in the loan documentation), and an obligation to repay a specified sum with interest. The CPLV CMBS Debt was evidenced by certain promissory notes and secured by a deed of trust that created a mortgage lien on the fee and/or leasehold interest of the CPLV Mortgage Borrower.
The loan documents governing the CPLV CMBS Debt contain covenants limiting CPLV Mortgage Borrower’s ability to, among other things: (i) incur additional debt; (ii) enter into certain transactions with its affiliates; (iii) consolidate, merge, sell or otherwise dispose of its assets; and (iv) allow transfers of its direct or indirect equity interests.
Second Lien Notes
On the Formation Date, VICI Properties 1 LLC and VICI FC Inc. (together, “the co-issuers”), issued $766.9 million in aggregate principal amount of Second Lien Notes to certain creditors pursuant to the terms of the Plan of Reorganization. The Second Lien Notes are due in 2023. The notes co-issuers pay interest semi-annually on the Second Lien Notes at a rate per annum of 8.0%. The Second Lien Notes are senior secured obligations of the notes co-issuers and rank equally and ratably in right of payment with all existing and future senior obligations and senior to all future subordinated indebtedness.
The Second Lien Notes are guaranteed on a senior secured basis by each of the VICI PropCo existing and subsequently acquired direct and indirect wholly owned material domestic restricted subsidiaries, and secured by a second priority lien and security interest on substantially all of VICI PropCo and each such restricted subsidiaries’ material assets, including pledges of equity interests in their respective restricted subsidiaries and mortgages on their respective real estate (which mortgages are to be entered into within a certain period of time following the issuance of the Second Lien Notes), subject in each case to customary exceptions. Such guarantees are required to be provided by the same subsidiary guarantors that guarantee the indebtedness under the VICI PropCo Credit Facility or Prior First Lien Notes and such liens and security interests are required to be in the same collateral that
52
secures the indebtedness under the VICI PropCo Credit Facility or Prior First Lien Notes. Neither VICI REIT or our Operating Partnership or certain subsidiaries of VICI PropCo, including CPLV and its subsidiaries, are subject to the covenants of the indenture governing the Second Lien Notes or are guarantors of the Second Lien Notes.
The indenture governing the Second Lien Notes contains covenants that limit the notes co-issuers’ and their restricted subsidiaries’ ability to, among other things: (i) incur additional debt; (ii) pay dividends on or make other distributions in respect of their capital stock or make other restricted payments; (iii) make certain investments; (iv) sell certain assets; (v) create or permit to exist dividend and/or payment restrictions affecting their restricted subsidiaries; (vi) create liens on certain assets to secure debt; (vii) consolidate, merge, sell or otherwise dispose of all or substantially all of their assets; (viii) enter into certain transactions with their affiliates; and (ix) designate their subsidiaries as unrestricted subsidiaries. The Second Lien Notes are redeemable at VICI PropCo’s option, in whole or in part, at any time, from time to time, at a price equal to 100% of the principal amount of the Second Lien Notes so redeemed and, (1) prior to the third anniversary of the issuance of such Notes, a “make-whole” premium and (2) thereafter, a prepayment premium equal to (y) 4% of the amount redeemed on and after the third anniversary of such issuance, and (z) 0% on and after the fourth anniversary of such issuance plus accrued and unpaid interest to the redemption date. In addition, prior to the third anniversary of such issuance, up to 35% of the original aggregate principal amount of the Second Lien Notes may be redeemed at VICI PropCo’s option with the net cash proceeds of certain issuances of common or preferred equity by VICI PropCo, VICI REIT or any parent entity of VICI PropCo, at a price equal to 108% of the principal amount of the Second Lien Notes redeemed plus accrued and unpaid interest to the redemption date; provided, however, that at least 50% of the original aggregate principal amount of the Second Lien Notes must remain outstanding after any such redemption.
Covenants
At December 31, 2017, the Company was in compliance with all required debt-related financial covenants.
Capital Expenditures
As described in our leases, capital expenditures for properties under the Formation Lease Agreements and the HLV Lease are the responsibility of the tenants. Minimum capital expenditure spending requirements of the tenants are described in
“Overview of our Lease Agreements
” of Item 1 - Business.
Inflation
Our leases provide for certain increases in rent as a result of a fixed annual rent escalator or changes in the Consumer Price Index as further described in
“Overview of our Lease Agreements
” of Item 1 - Business. Inflation may cause the rent provisions to result in rent increases over time. However, we could be negatively affected if increases in rent are not sufficient to cover increases in our operating expenses due to inflation. In addition, inflation and increased cost may have an adverse impact on our tenants if increases in their operating expenses exceed increases in revenue due to inflation.
Off-Balance Sheet Arrangements
As of December 31, 2017 and as of the date this report was filed, we do not have any off-balance sheet arrangements.
CRITICAL ACCOUNTING POLICIES AND ESTIMATES
Our Financial Statements are prepared in accordance with GAAP. We have identified certain accounting policies that we believe are the most critical to the presentation of our financial information over a period of time. These accounting policies may require our management to take decisions on subjective and/or complex matters relating to reported amounts of assets, liabilities, revenue, costs, expenses and related disclosures. These would further lead us to estimate the effect of matters that may inherently be uncertain.
Estimates are required in order to prepare the Financial Statements in conformity with U.S. GAAP.
Significant estimates, judgments, and assumptions are required in a number of areas, including, but not limited to, the application of fresh start reporting, determining the useful lives of real estate properties, and evaluating the impairment of long-lived assets, and allocation of costs and deferred income taxes. The judgment on such estimates and underlying assumptions is based on our historical experience that we believe is reasonable under the circumstances. These form the basis of our judgment on matters that may not be apparent from other available sources of information. In many instances changes in the accounting estimates are likely to occur from period to period. Actual results may differ from the estimates. We believe the current assumptions and other considerations used to estimate amounts reflected in our Financial Statements are appropriate. However, if actual experience differs
53
from the assumptions and other considerations used in estimating amounts reflected in our Financial Statements, the resulting changes could have a material adverse effect on our consolidated results of operations and, in certain situations, could have a material adverse effect on our financial condition.
Revenue Recognition
Leases
As a REIT, the majority of our revenues are derived from rent received from our tenants under long-term triple-net leases. The accounting guidance under Financial Accounting Standards Board (“FASB”) Accounting Standards Codification (“ASC”) 840, “Leases” (“ASC 840”) is complex and requires the use of judgments and assumptions by management to determine the proper accounting treatment of a lease. We perform a lease classification upon lease inception, to determine if we will account for the lease as a capital or operating lease. Under ASC 840, for leases of both building and land, if the fair value of the land is 25 percent or more of the total fair value of the leased property at lease inception we consider the land and building separately for lease classification. In these cases, if the building element of the lease meets the criteria to be classified as a capital lease, then we account for the building element as a capital lease and the land separately as an operating lease. If the building element does not meet the criteria to be classified as a capital lease, then we account for the building and land elements as a single operating lease. To determine
if the building portion of a lease triggers capital lease treatment we conduct the four lease tests in ASC 840 outlined below. If a lease meets any of the four criteria below, it is accounted for as a capital lease.
(1)
Transfer of ownership
. The lease transfers ownership of the property to the lessee by the end of the lease term. This criterion is met in situations in which the lease agreement provides for the transfer of title at or shortly after the end of the lease term in exchange for the payment of a nominal fee, for example, the minimum required by statutory regulation to transfer title.
(2)
Bargain purchase option
. The lease contains a bargain purchase option, which is a provision allowing the lessee, at its option, to purchase the leased property for a price which is sufficiently lower than the expected fair value of the property at the date the option becomes exercisable. In addition, the exercise of the option must be reasonably assured at lease inception.
(3)
Lease term
. The lease term is equal to 75% or more of the estimated economic life of the leased property. However, if the beginning of the lease term falls within the last 25 percent of the total estimated economic life of the leased property, including earlier years of use, this criterion shall not be used for purposes of classifying the lease. This test is conducted on a property by property basis.
(4)
Minimum lease payments
. The present value of the minimum lease payments at the beginning of the lease term, excluding that portion of the payments representing executory costs such as insurance, maintenance, and taxes to be paid by the lessor, including any profit thereon, equals or exceeds 90% of the fair value of the leased property to the lessor at lease inception less any related investment tax credit retained by the lessor and expected to be realized by the lessor. If the beginning of the lease term falls within the last 25% of the total estimated economic life of the leased property, including earlier years of use, this criterion shall not be used for purposes of classifying the lease.
The tests outlined above, as well as the resulting calculations, require subjective judgments, such as determining, at lease inception, the fair value of the assets, the residual value of the assets at the end of the lease term, the likelihood a tenant will exercise all renewal options (in order to determine the lease term), the estimated remaining economic life of the leased assets, the incremental borrowing rate of the lessee and the interest rate implicit in the lease. A change in estimate or judgment can result in a materially different financial statement presentation.
The revenue recognition model is different under capital leases and operating leases.
Under the operating lease model, as the lessor, at lease inception the land is recorded as Real Estate Investments accounted for using the operating method in our Balance Sheet and we record rental income from operating leases on a straight-line basis over the lease term. The amount of annual minimum lease payments attributable to the land element after deducting executory costs, including any profit thereon, is determined by applying our incremental borrowing rate to the value of the land. We record this lease income as Rental Income from Operating Leases in our Statement of Operations.
Under the direct financing lease model, as lessor, at lease inception we record the lease receivable as Investment in direct financing leases, net in our Balance Sheet. Under the direct financing lease method, we recognize fixed amounts due on an effective interest basis at a constant rate of return over the lease term. As a result, the cash payments accounted for under direct financing leases
54
will not equal the earned income from direct financing leases as a portion of the cash rent we receive is recorded as Earned income from direct financing leases in our Statement of Operations and a portion is recorded as a reduction to Investment in direct financing leases, net.
Investment in direct financing leases, net and Real Estate Investments
For real estate investments accounted for using the operating method, we continually monitor events and circumstances that could indicate that the carrying amount of our real estate investments may not be recoverable or realized. When events or changes in circumstances indicate that a potential impairment has occurred or that the carrying value of a real estate investment may not be recoverable, we use an estimate of the undiscounted value of expected future operating cash flows to determine whether the real estate investment is impaired. If the undiscounted cash flows plus net proceeds expected from the disposition of the asset is less than the carrying value of the assets, we recognize an impairment charge equivalent to the amount required to reduce the carrying
value of the asset to its estimated fair value. We group our real estate investments together by property, the lowest level for which identifiable cash flows are available, in evaluating impairment. In assessing the recoverability of the carrying value, we must make assumptions regarding future cash flows and other factors. Factors considered in performing this assessment include current operating results, market and other applicable trends and residual values, as well as the effect of obsolescence, demand, competition and other factors. If these estimates or the related assumptions change in the future, we may be required to record an impairment loss.
Our investment in direct financing leases, net, is evaluated for impairment as necessary, if indicators of impairment are present, to determine if there has been an-other-than-temporary decline in the residual value of the property or a change in the lessee’s credit worthiness.
Income Taxes—REIT Qualification
We intend to elect to be taxed and qualify as a REIT for U.S. Federal income tax purposes commencing with our taxable year ended December 31, 2017, and we intend to continue to be organized and to operate in a manner that will permit us to qualify as a REIT beyond that taxable year end. To qualify as a REIT, we must meet certain organizational and operational requirements, including a requirement to distribute at least 90% of our annual REIT taxable income to stockholders (with certain adjustments), determined without regard to the dividends paid deduction and excluding any net capital gains. As a REIT, we generally will not be subject to Federal income tax on income that we pay as distributions to our stockholders. If we fail to qualify as a REIT in any taxable year, we will be subject to U.S. Federal income tax on our taxable income at regular corporate income tax rates, and distributions paid to our stockholders would not be deductible by us in computing taxable income. Additionally, any resulting corporate liability created if we fail to qualify as a REIT could be substantial and could materially and adversely affect our net income and net cash available for distribution to stockholders. Unless we were entitled to relief under certain Code provisions, we also would be disqualified from re-electing to be taxed as a REIT for the four taxable years following the year in which we failed to qualify to be taxed as a REIT.
55
CONTRACTUAL OBLIGATIONS AND COMMITMENTS
Information concerning our obligations and commitments to make future payments under contracts such as our indebtedness and future minimum lease commitments under operating leases is included in the following table as of December 31, 2017.
|
Payments Due By Period
|
|||||||||||||||||||||
|
(In thousands)
|
Total
|
Within 1 Year
|
1-3 Years
|
4-5 Years
|
After 5 Years
|
||||||||||||||||
|
Long-term debt
|
|||||||||||||||||||||
|
Term Loan B Facility
(1)
|
$
|
2,200,000
|
|
$
|
21,918
|
|
$
|
43,182
|
|
$
|
42,326
|
|
$
|
2,092,574
|
|
||||||
|
CPLV CMBS Debt, principal
(2)
|
1,550,000
|
|
—
|
|
—
|
|
1,550,000
|
|
|||||||||||||
|
Second Lien Notes, principal
(3)
|
766,892
|
|
—
|
|
—
|
|
—
|
|
766,892
|
|
|||||||||||
|
Revolving Credit Facility, principal
(4)
|
300,000
|
|
—
|
|
—
|
|
300,000
|
|
—
|
|
|||||||||||
|
Estimated interest payments
(5)
|
1,313,336
|
|
227,372
|
|
443,709
|
|
428,567
|
|
213,688
|
|
|||||||||||
|
Total debt contractual obligations
|
6,130,228
|
|
249,290
|
|
486,891
|
|
2,320,893
|
|
3,073,154
|
|
|||||||||||
|
Leases and contracts
|
|||||||||||||||||||||
|
Operating lease for Cascata Golf Course Land
|
22,509
|
|
873
|
|
1,799
|
|
1,871
|
|
17,966
|
|
|||||||||||
|
Golf maintenance contract for Rio Secco and Cascata Golf Course
|
3,194
|
|
2,969
|
|
225
|
|
—
|
|
—
|
|
|||||||||||
|
Office leases
|
258
|
|
200
|
|
58
|
|
—
|
|
—
|
|
|||||||||||
|
Total leases and contract obligations
|
25,961
|
|
4,042
|
|
2,082
|
|
1,871
|
|
17,966
|
|
|||||||||||
|
Total Contractual Commitments
|
$
|
6,156,189
|
|
$
|
253,332
|
|
$
|
488,973
|
|
$
|
2,322,764
|
|
$
|
3,091,120
|
|
||||||
________________________________________
(1)
The Term Loan B Facility requires scheduled quarterly payments in amounts equal to 0.25% of the original aggregate principal amount, with the balance due at maturity. The Term Loan B Facility will mature on December 22, 2024 or the date that is three months prior to the maturity of the Second Lien Notes, whichever is earlier (or if the maturity is extended pursuant to the terms of the agreement, such extended maturity date as determined pursuant thereto).
(2)
The CPLV CMBS Debt will mature on October 10, 2022.
(3)
The Second Lien Notes will mature on October 15, 2023.
(4)
The Revolving Credit Facility will mature on December 22, 2022.
(5)
Estimated interest on variable interest loans are based on a LIBOR rate of 1.50%.
As discussed in Note 17
—
Subsequent Events, the Company utilized a portion of the proceeds from its initial public offering in February 2018 to: (a) pay down
$300.0 million
of indebtedness outstanding under the Revolving Credit Facility; (b) redeem
$268.4 million
in aggregate principal amount of the Second Lien Notes at a redemption price of
108%
plus accrued and unpaid interest to the date of the redemption; and (c) repay
$100.0 million
of the Term Loan B Facility.
We face market risk exposure in the form of interest rate risk. This market risk arises from our debt obligations. Our primary market risk exposure is interest rate risk with respect to our indebtedness.
At December 31, 2017, we had $4,816.9 million aggregate principal amount of outstanding indebtedness. Approximately $2,500.0 million of our indebtedness has variable interest rates. A one percent increase or decrease in the annual interest rate on our variable rate borrowings of $2,500.0 million would increase or decrease our annual cash interest expense by approximately $25.0 million.
We may manage, or hedge, interest rate risks related to our borrowings by means of interest rate swap agreements. We also expect to manage our exposure to interest rate risk by maintaining a mix of fixed and variable rates for our indebtedness. However, the REIT provisions of the Code substantially limit our ability to hedge our assets and liabilities.
56
|
ITEM 8.
|
Financial Statements and Supplementary Data
|
REPORT OF INDEPENDENT REGISTERED PUBLIC ACCOUNTING FIRM
To the shareholders and the Board of Directors of VICI Properties Inc.
Opinion on the Financial Statements
We have audited the accompanying consolidated balance sheet of VICI Properties Inc. and subsidiaries (the "Company") as of December 31, 2017, the related consolidated statements of operations, shareholders’ equity, and cash flows, for the period from October 6, 2017 (Formation Date) to December 31, 2017, and the related notes and the schedules listed in the Index at Item 15 (collectively referred to as the "financial statements"). In our opinion, the financial statements present fairly, in all material respects, the financial position of the Company as of December 31, 2017, and the results of its operations and its cash flows for the period from October 6, 2017 to December 31, 2017, in conformity with accounting principles generally accepted in the United States of America.
Basis for Opinion
These financial statements are the responsibility of the Company's management. Our responsibility is to express an opinion on the Company's financial statements based on our audit. We are a public accounting firm registered with the Public Company Accounting Oversight Board (United States) (PCAOB) and are required to be independent with respect to the Company in accordance with the U.S. federal securities laws and the applicable rules and regulations of the Securities and Exchange Commission and the PCAOB.
We conducted our audit in accordance with the standards of the PCAOB. Those standards require that we plan and perform the audit to obtain reasonable assurance about whether the financial statements are free of material misstatement, whether due to error or fraud. The Company is not required to have, nor were we engaged to perform, an audit of its internal control over financial reporting. As part of our audit, we are required to obtain an understanding of internal control over financial reporting but not for the purpose of expressing an opinion on the effectiveness of the Company’s internal control over financial reporting. Accordingly, we express no such opinion.
Our audit included performing procedures to assess the risks of material misstatement of the financial statements, whether due to error or fraud, and performing procedures that respond to those risks. Such procedures included examining, on a test basis, evidence regarding the amounts and disclosures in the financial statements. Our audit also included evaluating the accounting principles used and significant estimates made by management, as well as evaluating the overall presentation of the financial statements. We believe that our audit provides a reasonable basis for our opinion.
/s/ Deloitte & Touche LLP
Las Vegas, Nevada
March 28, 2018
We have served as the Company's auditor since 2016.
57
VICI PROPERTIES INC.
(AMOUNTS IN THOUSANDS, EXCEPT SHARE DATA)
|
December 31, 2017
|
|||
|
Assets
|
|||
|
Investment in direct financing leases, net
|
$
|
8,268,643
|
|
|
Real Estate Investments:
|
|||
|
Accounted for using the operating method
|
1,110,400
|
|
|
|
Land
|
73,600
|
|
|
|
Property and equipment used in operations, net
|
74,300
|
|
|
|
Cash and cash equivalents
|
183,646
|
|
|
|
Restricted cash
|
13,760
|
|
|
|
Other assets
|
15,363
|
|
|
|
Total assets
|
$
|
9,739,712
|
|
|
Liabilities
|
|||
|
Debt, net
|
$
|
4,785,756
|
|
|
Accrued interest
|
21,595
|
|
|
|
Deferred financing liability
|
73,600
|
|
|
|
Deferred revenue
|
68,117
|
|
|
|
Accounts payable and accrued expenses
|
10,562
|
|
|
|
Deferred income taxes
|
3,718
|
|
|
|
Total liabilities
|
4,963,348
|
|
|
|
Commitments and Contingencies (Note 11)
|
|
|
|
|
Shareholders’ equity
|
|||
|
Common stock, $0.01 par value, 700,000,000 shares authorized and 300,278,938 shares issued and outstanding at December 31, 2017
|
3,003
|
|
|
|
Preferred stock, $0.01 par value, 50,000,000 shares authorized, 12,000,000 shares issued and no shares outstanding at December 31, 2017
|
—
|
|
|
|
Additional paid in capital
|
4,645,824
|
|
|
|
Retained earnings
|
42,662
|
|
|
|
Total VICI shareholders’ equity
|
4,691,489
|
|
|
|
Non-controlling interests
|
84,875
|
|
|
|
Total shareholders’ equity
|
4,776,364
|
|
|
|
Total liabilities and shareholders’ equity
|
$
|
9,739,712
|
|
See accompanying Notes to Consolidated Financial Statements.
58
VICI PROPERTIES INC.
(AMOUNTS IN THOUSANDS, EXCEPT SHARE DATA)
|
Period from October 6 to December 31, 2017
|
|||
|
Revenues
|
|||
|
Earned income from direct financing leases
|
$
|
150,171
|
|
|
Rental income from operating leases
|
11,529
|
|
|
|
Tenant reimbursement of property taxes
|
19,558
|
|
|
|
Golf-related
|
6,351
|
|
|
|
Net revenues
|
187,609
|
|
|
|
Operating expenses
|
|||
|
General and administrative
|
9,939
|
|
|
|
Depreciation
|
751
|
|
|
|
Property taxes
|
19,558
|
|
|
|
Golf-related
|
4,126
|
|
|
|
Acquisition and transaction expenses
|
9,039
|
|
|
|
Total operating expenses
|
43,413
|
|
|
|
Operating income
|
144,196
|
|
|
|
Interest expense
|
(63,354
|
)
|
|
|
Interest income
|
282
|
|
|
|
Loss from extinguishment of debt
|
(38,488
|
)
|
|
|
Income before income taxes
|
42,636
|
|
|
|
Income tax benefit
|
1,901
|
|
|
|
Net income
|
44,537
|
|
|
|
Less: Net income attributable to noncontrolling interests
|
1,875
|
|
|
|
Net income attributable to common shareholders
|
$
|
42,662
|
|
|
Weighted average number of common shares outstanding
|
|||
|
Basic
|
227,828,844
|
|
|
|
Diluted
|
227,985,455
|
|
|
|
Common per share data
|
|||
|
Basic earnings per common share
|
$
|
0.19
|
|
|
Diluted earnings per common share
|
$
|
0.19
|
|
See accompanying Notes to Consolidated Financial Statements.
59
VICI PROPERTIES INC.
CONSOLIDATED STATEMENT OF SHAREHOLDERS’ EQUITY
(AMOUNTS IN THOUSANDS)
|
Common Stock
|
Preferred Stock
|
Additional paid-in capital
|
Retained Earnings
|
Total VICI Shareholders’ Equity
|
Non-controlling interests
|
Total Shareholders’ Equity
|
|||||||||||||||||||||
|
Balance at October 6, 2017
|
$
|
1,772
|
|
$
|
120
|
|
$
|
3,431,781
|
|
$
|
—
|
|
$
|
3,433,673
|
|
$
|
83,000
|
|
$
|
3,516,673
|
|
||||||
|
Net income
|
—
|
|
—
|
|
—
|
|
42,662
|
|
42,662
|
|
1,875
|
|
44,537
|
|
|||||||||||||
|
Issuance of common stock:
|
|||||||||||||||||||||||||||
|
Preferred stock conversion
|
514
|
|
(120
|
)
|
(394
|
)
|
—
|
|
—
|
|
—
|
|
—
|
|
|||||||||||||
|
Mandatory debt conversion
|
176
|
|
—
|
|
249,811
|
|
—
|
|
249,987
|
|
—
|
|
249,987
|
|
|||||||||||||
|
Private equity placement
|
541
|
|
—
|
|
963,241
|
|
—
|
|
963,782
|
|
—
|
|
963,782
|
|
|||||||||||||
|
Non-cash stock compensation
|
—
|
|
—
|
|
1,385
|
|
—
|
|
1,385
|
|
—
|
|
1,385
|
|
|||||||||||||
|
Balance at December 31, 2017
|
$
|
3,003
|
|
$
|
—
|
|
$
|
4,645,824
|
|
$
|
42,662
|
|
$
|
4,691,489
|
|
$
|
84,875
|
|
$
|
4,776,364
|
|
||||||
See accompanying Notes to Consolidated Financial Statements.
60
VICI PROPERTIES INC.
(AMOUNTS IN THOUSANDS)
|
Period from October 6 to December 31, 2017
|
|||
|
Cash flows from operating activities
|
|||
|
Net income
|
$
|
44,537
|
|
|
Adjustments to reconcile net income to cash flows provided by operating activities:
|
|||
|
Share-based compensation
|
1,385
|
|
|
|
Depreciation
|
751
|
|
|
|
Amortization of debt issuance costs and original issue discount
|
156
|
|
|
|
Deferred income taxes
|
(1,912
|
)
|
|
|
Change in operating assets and liabilities:
|
|||
|
Investment in direct financing leases, net
|
(8,443
|
)
|
|
|
Other assets
|
(7,159
|
)
|
|
|
Accrued interest
|
21,595
|
|
|
|
Deferred revenue
|
68,081
|
|
|
|
Accounts payable and accrued expenses
|
10,449
|
|
|
|
Net cash provided by operating activities
|
129,440
|
|
|
|
Cash flows from investing activities
|
|||
|
Acquisition of investment in direct financing leases
|
(1,136,200
|
)
|
|
|
Acquisition of property and equipment, net of change in related payables
|
(51
|
)
|
|
|
Net cash used in investing activities
|
(1,136,251
|
)
|
|
|
Cash flows from financing activities
|
|||
|
Proceeds from private placement of common stock
|
963,782
|
|
|
|
Proceeds from issuance of Term B Loan Facility, net
|
2,194,686
|
|
|
|
Proceeds from issuance of Revolving Credit Facility, net
|
298,000
|
|
|
|
Payment of Prior Term Loan
|
(1,638,387
|
)
|
|
|
Payment of Prior First Lien Notes
|
(311,721
|
)
|
|
|
Payment of Mezzanine Debt
|
(400,000
|
)
|
|
|
Debt issuance costs
|
(31,501
|
)
|
|
|
Proceeds from unrecognized sale of real estate
|
73,600
|
|
|
|
Mandatory debt conversion costs
|
(13
|
)
|
|
|
Net cash provided by financing activities
|
1,148,446
|
|
|
|
Net increase in cash and cash equivalents
|
141,635
|
|
|
|
Cash, cash equivalents and restricted cash, beginning of period
|
55,771
|
|
|
|
Cash, cash equivalents and restricted cash, end of period
|
$
|
197,406
|
|
|
Supplemental Cash Flow Information:
|
|||
|
Cash paid for interest
|
$
|
36,779
|
|
|
Cash paid for income taxes
|
—
|
|
|
See accompanying Notes to Consolidated Financial Statements.
61
VICI PROPERTIES INC.
NOTES TO CONSOLIDATED FINANCIAL STATEMENTS
In these notes, the words “VICI REIT,””VICI,” “Company,” “we,” “our,” and “us” refer to VICI Properties Inc., unless otherwise stated or the context requires otherwise.
“CEOC” refers to Caesars Entertainment Operating Company, Inc., a Delaware corporation, prior to the October 6, 2017 (the “Formation Date”), and following the Formation Date, CEOC, LLC, a Delaware limited liability company. “Caesars” or “CEC” refers to Caesars Entertainment Corporation.
“VICI PropCo” refers to VICI Properties 1 LLC, a Delaware limited liability company, which through its subsidiaries own the real estate assets transferred by CEOC to VICI on the Formation Date and “CPLV” refers to the Caesars Palace Las Vegas facility located in the Las Vegas Strip, which was owned by CEOC prior to the Formation Date and whose related real estate assets were transferred by CEOC to us on the Formation Date.
Note 1
—
Business Formation and Basis of Presentation
Business Formation
VICI is a Maryland corporation that was created to hold certain real estate assets owned by Caesars Entertainment Operating Company (“CEOC”), upon CEOC’s emergence from bankruptcy. Pursuant to CEOC’s Plan of Reorganization, on
October 6, 2017
(the “
Formation Date
”), the historical business of CEOC was separated by means of a spin-off transaction whereby the real property assets (“Formation Properties”) of CEOC and certain of its subsidiaries, including
four
golf course businesses, were transferred through a series of transactions to VICI. Following the Formation Date, VICI is a stand-alone entity that was initially owned by certain former creditors of CEOC. VICI is primarily engaged in the business of owning and acquiring gaming, hospitality and entertainment destinations. VICI leases the Formation Properties and Harrah’s Las Vegas, which was acquired on
December 22, 2017
, to subsidiaries of Caesars. VICI conducts its real property business through an operating partnership and its golf course business through a taxable REIT subsidiary (“TRS”), VICI Golf LLC.
VICI intends to make an election on its Federal income tax return for its taxable year ended December 31, 2017 to be treated as a real estate investment trust (“REIT”).
Basis of Presentation
The accompanying consolidated Financial Statements have been prepared in accordance with accounting principles generally accepted in the United States of America (“US GAAP”) and with the applicable rules and regulations of the Securities and Exchange Commission. The consolidated statements of operations, shareholders’ equity and cash flows are presented for the period beginning with the date that the Company initiated its operations,
October 6, 2017
, through the end of 2017.
On the Formation Date, the Company adopted fresh-start reporting in accordance with provisions of ASC 852, “Reorganizations” (“ASC 852”). In the application of fresh start accounting, VICI allocated the enterprise value to the fair value of assets and liabilities in conformity with the guidance for the acquisition method of accounting for business combinations under ASC 805, “Business Combinations” (“ASC 805”).
Use of Estimates
The preparation of financial statements in conformity with US GAAP requires management to make estimates and assumptions. These estimates and assumptions affect the reported amounts of assets and liabilities and the disclosure of contingent assets and liabilities at the date of the Financial Statements and the reported amounts of revenues and expenses during the reporting periods. The Company’s most significant assumptions and estimates relate to the establishment of the fair value of investment in direct financing leases and real estate investments under ASC 852 at the date of emergence and the computation of lease revenue under ASC 840, “Leases” (“ASC 840”). These estimates are based on assumptions which management believes are reasonable under the circumstances. Management evaluates its estimates on an ongoing basis and makes revisions to these estimates and related disclosures as experience develops or new information becomes known. Actual results could differ from these estimates.
Principles of Consolidation and Non-controlling Interest
The accompanying consolidated Financial Statements include the accounts of VICI, its wholly owned subsidiaries and a single variable interest entity (VIE) where VICI is the primary beneficiary. All significant intercompany accounts and transactions have been eliminated in consolidation.
62
VICI PROPERTIES INC.
NOTES TO CONSOLIDATED FINANCIAL STATEMENTS (Continued)
We consolidate all subsidiaries in which we have a controlling financial interest and VIEs for which we or one of our consolidated subsidiaries is the primary beneficiary.
We identify entities for which control is achieved through means other than voting rights and to determine which business enterprise is the primary beneficiary of VIE. A VIE is an entity in which either (i) the equity investors as a group, if any, lack the power through voting or similar rights to direct the activities of such entity that most significantly impact such entity’s economic performance or (ii) the equity investment at risk is insufficient to finance that entity’s activities without additional subordinated financial support. We identify the primary beneficiary of a VIE as the enterprise that has both of the following characteristics: (i) the power to direct the activities of the VIE that most significantly impact the entity’s economic performance; and (ii) the obligation to absorb losses or receive benefits of the VIE that could potentially be significant to the entity. We consolidate our investment in a VIE when we determine that we are the primary beneficiary. We may change our original assessment of a VIE upon subsequent events such as the modification of contractual arrangements that affect the characteristics or adequacy of the entity’s equity investments at risk and the disposition of all or a portion of an interest held by the primary beneficiary. We perform this analysis on an ongoing basis. The consolidated financial statements of VICI include the accounts of our Operating Partnership, a VIE of which we are the primary beneficiary, as well as its wholly owned and majority-owned subsidiaries. VICI’s maximum exposure to loss is the carrying value of the assets and liabilities of the Operating Partnership, which represents the substantial majority of VICI’s assets and liabilities. As VICI holds what is deemed a majority voting interest in the Operating Partnership through its ownership of the Operating Partnership’s sole general partner, it qualifies for the exemption from providing certain of the required disclosures associated with investments in VIEs.
VICI presents non-controlling interest and classifies such interest as a component of consolidated shareholders’ equity, separate from VICI shareholders equity. Non-controlling interest in VICI represents a
20%
third party ownership of Harrah’s Joliet LandCo LLC, the entity that owns the Harrah’s Joliet facility and the related Joliet Lease Agreement.
Reportable Segments
Our real property business and our golf course business represent
two
reportable segments. The real property business segment consists of leased real property and represents the substantial majority of our business. The golf course business segment consists of
four
golf courses, each of which is an operating segments and is aggregated into
one
reportable segment.
Corporate and overhead costs are allocated to reportable segments based upon revenue or headcount. Management believes that the assumptions and methodologies used in the allocation of such expenses are reasonable.
Note 2
—
Summary of Significant Accounting Policies
Cash, Cash Equivalents, and Restricted Cash
Cash consists of cash-on-hand and cash-in-bank. Any short-term investments with an original maturity of three months or less from the date of purchase are considered cash equivalents and are stated at the lower of cost or market value.
Restricted cash is comprised of funds paid monthly by Caesars for the CPLV rent that are held in a restricted cash management account for the purpose of funding debt service or impositions related to CPLV debt issued by us. Once all debt service and impositions are paid out of restricted cash, the remaining funds are returned to the Company’s unrestricted operating account.
The following table provides a reconciliation of cash, cash equivalents and restricted cash reported with the Balance Sheet to the total of the same such amounts presented in the Statement of Cash Flows.
|
(In thousands)
|
December 31, 2017
|
|||
|
Cash and cash equivalents
|
$
|
183,646
|
|
|
|
Restricted cash
|
13,760
|
|
||
|
Total cash, cash equivalents and restricted cash shown in the Statement of Cash Flows
|
$
|
197,406
|
|
|
Concentrations of Credit Risk
Following the formation transactions in October 2017, all of the real estate holdings of VICI (other than VICI Golf LLC) is leased by VICI to CEOC or other affiliates of Caesars, and most of VICI’s revenues are derived from the Master Leases that VICI has with affiliates of Caesars. Other than VICI having a single tenant from which it will derive most of its revenue, management does not believe there are any other significant concentrations of credit risk.
63
VICI PROPERTIES INC.
NOTES TO CONSOLIDATED FINANCIAL STATEMENTS (Continued)
Investment in direct financing leases, net and Real Estate Investments
Under guidance in ASC 840, the initial Lease Agreements are bifurcated between operating leases and direct financing leases. The fair value assigned to certain portions of the land qualify for operating lease treatment while the fair value assigned to the buildings is classified as a direct financing lease, and the portion of the land which was not bifurcated is also classified as part of direct financing lease.
Land accounted for under the operating method has an indefinite useful life and is not depreciated.
As described in
Note 5
—
Property Transactions, the Company sold certain land parcels to Caesars for
$73.6 million
. Due to a put/call option on the land parcels, it was determined that the transaction does not meet the requirements of a completed sale for accounting purposes. As a result, we reclassified $
73.6 million
from Real estate investments accounted for using the operating method to Land. Additionally, the Company recorded a
$73.6 million
Deferred financing liability in its Balance Sheet.
For real estate investments accounted for using the operating method, we continually monitor events and circumstances that could indicate that the carrying amount of our real estate investments may not be recoverable or realized. When events or changes in circumstances indicate that a potential impairment has occurred or that the carrying value of a real estate investment may not be recoverable, we use an estimate of the undiscounted value of expected future operating cash flows to determine whether the real estate investment is impaired. If the undiscounted cash flows plus net proceeds expected from the disposition of the asset is less than the carrying value of the assets, we recognize an impairment charge equivalent to the amount required to reduce the carrying value of the asset to its estimated fair value. We group our real estate investments together by property, the lowest level for which identifiable cash flows are available, in evaluating impairment. In assessing the recoverability of the carrying value, we must make assumptions regarding future cash flows and other factors. Factors considered in performing this assessment include current operating results, market and other applicable trends and residual values, as well as the effect of obsolescence, demand, competition and other factors. If these estimates or the related assumptions change in the future, we may be required to record an impairment loss.
If and when an investment in direct financing leases is identified for impairment evaluation, the Company will apply the guidance in both ASC 310 "Receivables" ("ASC 310") and ASC 360 "Property, Plant and Equipment" ("ASC 360"). Under ASC 310, the lease receivable portion of the net investment in direct financing lease is identified for impairment when it becomes probable to the Company, as the lessor, will be unable to collect all rental payments associated with our investment in direct financing leases. Under ASC 360, the residual value portion of the net investment in direct financing leases is monitored for impairment under the same method the Company applies to real estate investments.
There were no impairments identified on our real estate investments or our investment in direct financing leases, net in 2017.
Property and Equipment Used in Operations
Property and equipment used in operations represents assets for VICI Golf LLC, our golf operations, and were recorded at fair value of
$75.0 million
at the Formation Date. Judgments are made in determining their estimated useful lives and salvage values and if or when an asset (or asset group) has been impaired. The accuracy of these estimates affects the amount of depreciation expense recognized in our financial results and whether we have a gain or loss on the disposal of an asset. We assign lives to our assets based on our standard policy, which is established by management as representative of the useful life of each category of asset.
We review the carrying value of our assets whenever events and circumstances indicate that the carrying value of an asset may not be recoverable from the estimated future cash flows expected to result from its use and eventual disposition. Other factors considered by management in performing this assessment may include current operating results, trends, prospects, and third-party appraisals, as well as the effect of demand, competition, and other economic, legal, and regulatory factors. In estimated expected future cash flows for determining whether an asset is impaired, assets are grouped at the lowest level of identifiable cash flows, which is the aggregate of the
four
golf courses. We typically estimate the fair value of assets starting with a “Replacement Cost New” approach and then deduct appropriate amounts for both functional and economic obsolescence to arrive at the fair value estimates. These analyses are sensitive to management assumptions and the estimates of the obsolescence factors. Changes in these assumptions and estimates could have a material impact on the analyses and the Financial Statements. In
2017
, no impairment on assets was recorded.
Additions to property used in operations are stated at cost. We capitalize the costs of improvements that extend the life of the asset. We expense maintenance and repair costs as incurred. Gains or losses on the dispositions of property and equipment are recognized
64
VICI PROPERTIES INC.
NOTES TO CONSOLIDATED FINANCIAL STATEMENTS (Continued)
in the period of disposal. With respect to golf course improvements (included in land improvements), only costs associated with original construction, complete replacements of items such as tee boxes and putting greens, or the addition of new trees, sand traps, fairways or putting greens are capitalized. All other related costs are expensed as incurred. For building improvements, only costs that extend the useful life of the building are capitalized.
Certain land improvements include site preparations that prepare land for its intended use as a golf course. Like the land itself, these improvements are inexhaustible and therefore not depreciated. Examples include excavation, filling, grading and preparation of fairways and roughs. Depreciable land improvements are defined as improvements made to land that have determinable estimated useful lives and deteriorate with use or passage of time. These improvements were built or installed to enhance or facilitate the use of land for a particular purpose. Depreciable land improvements associated with the golf courses include greens, bunkers, tee boxes, cart paths, fences and gates, landscaping and sprinkler systems.
Depreciation is calculated using the straight-line method over the shorter of the estimated useful life of the asset or the related lease as follows:
|
Depreciable land improvements
|
2-50 years
|
|
Building and improvements
|
5-25 years
|
|
Furniture and equipment
|
2-5 years
|
Revenue Recognition
Lease Revenue
As a REIT, the majority of our revenues are derived from rent received from our tenants under long-term triple-net leases. The accounting guidance under ASC 840 is complex and requires the use of judgments and assumptions by management to determine the proper accounting treatment of a lease. We perform a lease classification upon lease inception to determine if we will account for the lease as a capital or operating lease.
Under ASC 840, for leases of both building and land, if the fair value of the land is
25%
or more of the total fair value of the leased property at lease inception, we consider the land and building separately for lease classification. In these cases, if the building element of the lease meets the criteria to be classified as a capital lease, then we account for the building element as a capital lease and the land separately as an operating lease. If the building element does not meet the criteria to be classified as a capital lease, then we account for the building and land elements as a single operating lease.
To determine if the building portion of a lease triggers capital lease treatment, we conduct the four lease tests in ASC 840 outlined below. If a lease meets any of the four criteria below, it is accounted for as a capital lease.
|
•
|
Transfer of ownership. The lease transfers ownership of the property to the lessee by the end of the lease term. This criterion is met in situations in which the lease agreement provides for the transfer of title at or shortly after the end of the lease term in exchange for the payment of a nominal fee, for example, the minimum required by statutory regulation to transfer title.
|
|
•
|
Bargain purchase option. The lease contains a bargain purchase option, which is a provision allowing the lessee, at its option, to purchase the leased property for a price which is sufficiently lower than the expected fair value of the property at the date the option becomes exercisable. In addition, the exercise of the option must be reasonably assured at lease inception.
|
|
•
|
Lease term. The lease term is equal to
75%
or more of the estimated economic life of the leased property. However, if the beginning of the lease term falls within the last
25%
of the total estimated economic life of the leased property, including earlier years of use, this criterion shall not be used for purposes of classifying the lease. This test is conducted on a property by property basis.
|
|
•
|
Minimum lease payments. The present value of the minimum lease payments at the beginning of the lease term, excluding that portion of the payments representing executory costs such as insurance, maintenance and taxes to be paid by the lessor, including any profit thereon, equals or exceeds
90%
of the fair value of the leased property to the lessor at lease inception less any related investment tax credit retained by the lessor and expected to be realized by the lessor. If the
|
65
VICI PROPERTIES INC.
NOTES TO CONSOLIDATED FINANCIAL STATEMENTS (Continued)
beginning of the lease term falls within the last
25%
of the total estimated economic life of the leased property, including earlier years of use, this criterion shall not be used for purposes of classifying the lease.
The tests outlined above, as well as the resulting calculations, require subjective judgments, such as determining, at lease inception, the fair value of the assets, the residual value of the assets at the end of the lease term, the likelihood a tenant will exercise all renewal options (in order to determine the lease term), the estimated remaining economic life of the leased assets, the incremental borrowing rate of the lessee and the interest rate implicit in the lease. A change in estimate or judgment can result in a materially different financial statement presentation.
The revenue recognition model is different under capital leases and operating leases.
Under the operating lease model, as the lessor, at lease inception the land is recorded as Real estate investments accounted for using the operating method in our Balance Sheet and we record rental income from operating leases on a straight-line basis over the lease term. The amount of annual minimum lease payments attributable to the land element after deducting executory costs, including any profit thereon, is determined by applying our incremental borrowing rate to the value of the land. We record this lease income as Rental income from operating leases in our Statement of Operations.
Under the direct financing lease model, as lessor, at lease inception we record the lease receivable as Investment in direct financing leases, net in our Balance Sheet. Under the direct financing lease method, we recognize fixed amounts due on an effective interest basis at a constant rate of return over the lease term. As a result, the cash payments accounted for under direct financing leases will not equal the earned income from direct financing leases. A portion of the cash rent we receive is recorded as Earned income from direct financing leases in our Statement of Operations and a portion is recorded as a change to the Investment in direct financing leases, net.
Additionally, in accordance with ASC 605, “Revenue Recognition”, the Company records revenue for real estate taxes paid by its tenants on the leased properties with an offsetting expense in real estate taxes with the Statement of Operations as the Company has concluded it is the primary obligor.
Golf-related Revenue
On the Formation Date, subsidiaries of VICI Golf LLC, a subsidiary of the VICI REIT, entered into a golf course use agreement (the “Golf Course Use Agreement”) with New CEOC and Caesars Enterprise Services, LLC (“CES”) (collectively, the “users”), whereby the users were granted certain priority rights and privileges with respect to access and use of certain golf course properties. Payments under the Golf Course Use Agreement are comprised of a
$10.0 million
annual membership fee,
$3.0 million
of use fees and approximately
$1.1 million
of minimum rounds fees. The annual membership fee, use fees and minimum round fees are subject to an annual escalator beginning at the times provided under the Golf Course Use Agreement. Revenue from the Golf Course Use Agreement is recognized in accordance with ASC 606, “Revenue From Contracts With Customers.”
Additional revenues from golf course operations, food and beverage and merchandise sales are recognized at the time of sale or when the service is provided and are reported net of sales tax. Golf memberships sold to individuals are not refundable and are deferred and recognized within golf revenue in the Statements of Operations over the expected life of an active membership, which is typically one year or less.
Income Taxes-REIT Qualification
We intend to elect to be taxed and qualify as a REIT for U.S. federal income tax purposes commencing with our taxable year ended December 31, 2017, and we intend to continue to be organized and to operate in a manner that will permit us to qualify as a REIT beyond that taxable year end. To qualify as a REIT, we must meet certain organizational and operational requirements, including a requirement to distribute at least
90%
of our annual REIT taxable income to shareholders, determined without regard to the dividends paid deduction and excluding any net capital gains. As a REIT, we generally will not be subject to federal income tax on income that we pay as distributions to our shareholders. If we fail to qualify as a REIT in any taxable year, we will be subject to U.S. federal income tax on our taxable income at regular corporate income tax rates, and distributions paid to our shareholders would not be deductible by us in computing taxable income. Additionally, any resulting corporate liability created if we fail to qualify as a REIT could be substantial and could materially and adversely affect our net income and net cash available for distribution to shareholders. Unless we were entitled to relief under certain Code provisions, we also would be disqualified from re-electing to be taxed as a REIT for the four taxable years following the year in which we failed to qualify to be taxed as a REIT.
66
VICI PROPERTIES INC.
NOTES TO CONSOLIDATED FINANCIAL STATEMENTS (Continued)
The TRS operations (represented by the
four
golf course businesses) are able to engage in activities resulting in income that would not be qualifying income for a REIT. As a result, certain activities of the Company which occur within its TRS operations are subject to federal and state income taxes.
Debt Issuance Costs
Debt issuance costs that are incurred by the Company in connection with the issuance of debt are deferred and amortized to interest expense over the contractual term of the underlying indebtedness. In accordance with ASC 835, “Interest,” the Company records debt net of unamortized debt issuance costs on its Balance Sheet. At December 31, 2017, the Company has
$31.1 million
of unamortized debt issuance costs associated with the
$2,200.0 million
Term B Loan Facility.
In addition, the Company has
$7.5 million
of unamortized debt issuance costs at December 31, 2017, associated with obtaining the
$400.0 million
Revolving Credit Facility commitment recorded as Other assets.
Other Comprehensive Income
There are no other comprehensive income items for the period from October 6, 2017 through December 31, 2017 and, as such, the Company's comprehensive income is equal to net income for 2017.
Share-Based Compensation
The VICI Properties Inc. 2017 Stock Incentive Plan (the “2017 Stock Incentive Plan”) provides for the Company to issue awards to certain key persons (employees and non-employee directors). Awards under the 2017 Stock Incentive Plan may include incentive stock options; non-qualified stock options; stock appreciation rights; dividend equivalent rights; restricted stock; restricted stock units and unrestricted stock.
The Company accounts for stock compensation under ASC 718, Compensation - Stock Compensation (“ASC 718”), which requires the Company to expense the cost of employee services received in exchange for an award of equity instruments based on the grant-date fair value of the award. This expense is recognized ratably over the requisite service period following the date of grant. The method for calculating the fair value of the Company’s time-based restricted stock awards is determined by the Compensation Committee of the Board of Directors and is typically equivalent to the
10
-day volume weighted average price using the
10
trading days ending on the grant date. The fair value of certain awards granted in connection with our Formation were determined based on an independent appraisal of the value of the Company’s common stock as of our Formation Date.
The unrecognized compensation relating to awards under the Plan will be amortized to expense over the awards’ remaining vesting periods. Vesting periods for award of equity instruments range from
zero
to
four
years.
See
Note 14
—
Share-Based Compensation
for further information related to the share-based compensation.
Earnings Per Share
Earnings per share (”EPS”) is calculated in accordance with ASC 260, “Earnings Per Share.” Basic EPS is computed by dividing net income applicable to common stock by the weighted-average number of common shares outstanding during the period. Diluted EPS reflects the additional dilution for all potentially-dilutive securities including those from the 2017 Stock Incentive Plan.
See
Note 13
—
Earnings Per Share
for the detailed 2017 EPS calculation.
Note 3
—
Recently Issued Accounting Pronouncements
Derivatives and Hedging - August 2017:
The amendments refine and expand hedge accounting for both financial (e.g., interest rate) and commodity risks. Its provisions create more transparency around how economic results are presented, both on the face of the financial statements and in the footnotes. It also makes certain targeted improvements to simplify the application of hedge accounting guidance. The transition guidance provides the option of early adoption using a modified retrospective transition method in any interim period after issuance of the update, or alternatively requires adoption for fiscal years beginning after December 15, 2018. We do not believe the effect of adopting this standard would have a material impact on our current Financial Statements. However, we will continue to assess the impact that this guidance might have on the accounting and disclosure of potential hedge transactions that we may enter into in the future.
Compensation - Stock Compensation - May 2017
:
Amendments in this update provide guidance regarding which changes to the terms or conditions of a share-based payment award require an entity to apply modification accounting. An entity should account
67
VICI PROPERTIES INC.
NOTES TO CONSOLIDATED FINANCIAL STATEMENTS (Continued)
for the effects of a modification unless all of the following are met: (i) the modification does not affect any of the inputs to the valuation technique that the entity uses to value the award; (ii) the vesting conditions of the modified award are the same as the vesting conditions of the original award; and (iii) the classification of the modified award as an equity instrument or a liability instrument is the same as before the original award was modified. Amendments in this update are effective for all periods, and interim periods within those annual periods, beginning after December 15, 2017. Early adoption is permitted. Application of amended guidance should be applied prospectively to an award modified on or after the adoption date. We believe that the adoption of this standard will not have a material impact on our Financial Statements.
Business Combinations - January 2017:
Updated amendments intend to clarify the definition of a business with the objective of adding guidance to assist entities with evaluating whether transactions should be accounted for acquisitions (or disposals) of assets or businesses. Amendments in this update provide a more robust framework to use in determining when a set of assets and activities is a business and to provide more consistency in applying the guidance, reduce the costs of application, and make the definition of a business more operable. Specifically, the new guidance provides a screen to determine when an integrated set of assets and activities is not a business. Under the new guidance, when substantially all of the fair value of the gross assets acquired (or disposed of) is concentrated in a single identifiable asset or group of similar identifiable assets, the assets do not represent a business. Amendments should be applied on a prospective basis on or after the effective date. No disclosures are required at transition. The amendments are effective to annual periods beginning after December 15, 2017, including interim periods within those periods. Early adoption is allowed as follows: (1) transactions for which the acquisition date occurs before the issuance date or effective date of the amendments, only when the transaction has not been reported in Financial Statements that have been issued or made available for issuance and (2) transactions in which a subsidiary is deconsolidated or a group of assets is derecognized that occur before the issuance date or effective date of the amendments, only when the transaction has not been reported in Financial Statements that have been issued or made available for issuance. The adoption of this standard could have a material impact on our Financial Statements should we have future acquisitions.
Leases - February 2016 (amended January 2017):
The amended guidance requires most lease obligations to be recognized as a right-of-use asset with a corresponding liability on the balance sheet. The guidance also requires additional qualitative and quantitative disclosures to assess the amount, timing, and uncertainty of cash flows arising from leases. This guidance is effective for fiscal years, and interim periods within those fiscal years, beginning after December 15, 2018. The guidance should be implemented for the earliest period presented using a modified retrospective approach, which includes optional practical expedients primarily focused on leases that commence before the effective date. We are evaluating the impact of adopting this new standard on our Financial Statements but do not expect the adoption of the new guidance to have a material impact on the accounting treatment of our triple-net tenant leases, which are the primary source of our revenues.
Revenue from Contracts with Customers - May 2014 (amended January 2017)
:
The new guidance is intended to clarify the principles for recognizing revenue and to develop a common revenue standard for GAAP applicable to revenue transactions. Existing industry guidance will be eliminated. The FASB has recently issued several amendments to the standard, including clarification on accounting for and identifying performance obligations. This guidance is effective for annual reporting periods beginning after December 15, 2017, including interim periods within those reporting periods. The guidance should be applied using the full retrospective method or retrospectively with the cumulative effect initially applying the guidance recognized at the date of initial application. We are adopting this standard effective January 1, 2018, retrospectively. We have completed our evaluation of the impact of adopting this new guidance and determined that there will not be a material impact to our Financial Statements. The majority of our revenue recognition policies will not be impacted by the new standard, as leases, which represent the substantial majority of our revenues, are excluded from the new guidance. The adoption of this guidance does not change the timing or process in which we recognize golf revenue.
Income Taxes - October 2016
:
Amended guidance addresses intra-entity transfers of assets other than inventory, which requires the recognition of any related income tax consequences when such transfers occur. The amendments should be applied on a modified retrospective basis through a cumulative-effect adjustment directly to retained earnings as of the beginning of the period of adoption. Amendments are effective for fiscal years beginning after December 15, 2017, and interim reporting periods within those years. Early adoption is permitted. We do not expect this standard will have a material impact on our Financial Statements.
Statement of Cash Flows - August 2016
:
Amended guidance addresses eight specific cash flow issues with the objective of reducing diversity in how certain cash receipts and cash payments are presented and classified in the statement of cash flows. The amendments should be applied retrospectively to each period presented. The amendments are effective for fiscal years beginning after December 15, 2017, and interim periods within those fiscal years. Early adoption is permitted. We have adopted this standard for our December 31, 2017 Statement of Cash Flows.
68
VICI PROPERTIES INC.
NOTES TO CONSOLIDATED FINANCIAL STATEMENTS (Continued)
Statement of Cash Flows - November 2016
:
Amended guidance requiring that a statement of cash flows explain the change during the period in the total cash, cash equivalents and restricted cash. Previous guidance does not provide specific guidance on the cash flow classification and presentation of changes in restricted cash other than limited guidance for not-for-profit entities. This guidance is required to be adopted for fiscal years beginning after December 15, 2017, and interim reporting periods within those years. Early adoption is permitted. We have adopted this standard for our December 31, 2017 Statement of Cash Flows.
Note 4
—
Fresh-Start Reporting
On the
Formation Date
, the Company adopted fresh-start reporting in accordance with provisions of ASC 852. In the application of fresh start accounting, VICI allocated the enterprise value to the fair value of assets and liabilities in conformity with the guidance for the acquisition method of accounting for business combinations under ASC 805. The amount remaining after allocation of the enterprise value to the fair value of identified tangible and intangible assets and liabilities, if any, would be reflected as goodwill and subject to periodic evaluation for impairment. In addition to fresh start accounting, VICI’s Financial Statements reflect all effects of the transactions contemplated by the Plan of Reorganization. Accordingly, VICI’s Balance Sheet at
December 31, 2017
is not comparable to any balance sheet for periods prior to the adoption of fresh start accounting and prior to accounting for the effects of the Plan.
Under ASC 852, fresh-start reporting is required upon emergence from Chapter 11 if (i) the value of the assets of the emerging entity immediately before the date of confirmation is less than the total of all post-petition liabilities and allowed claims; and (ii) holders of existing voting shares immediately before confirmation receive less than
50%
of the voting shares of the emerging entity. Accordingly, VICI qualified for and adopted fresh-start reporting as of
October 6, 2017
. Adopting fresh-start reporting results in a new reporting entity with no beginning retained earnings or deficits. It also includes the issuance of new shares of the reorganized entity caused by change of control under ASC 852.
The net book value of the real estate assets contributed to VICI by CEOC under the Plan of Reorganization was
$4,831.0 million
.
Based upon the analysis completed by the Company with the assistance of outside third-party valuation experts, it concluded the fair value of these assets were
$8,300.0 million
, net of non-controlling interests related to the Joliet facilities of
$83.0 million
.
Real estate assets are valued using an income approach and, more specifically, the discounted cash flow (“DCF”) technique. Future lease payments for the properties are modeled according to the terms contained in the initial Lease Agreements. Although management believes the length of the leases with CEOC will extend to the full
thirty-five
years lease term (assuming the exercise of tenant renewal options) per the initial Lease Agreements, the real property valuation analysis contemplates typical market participant oriented
nine
- and
fourteen
-year hold periods as a best methodology to estimate the value of the cash flow during the full term of the lease. Appropriate expenses are estimated and deducted from the future contract rent to derive expected future cash flows. Terminal or reversion values are calculated for both hold period scenarios based on estimated market terminal capitalization rates. The DCF technique estimates value by discounting back to present value the anticipated future cash flows for the interim periods in the DCF model plus the present value of the terminal values using an appropriate discount rate. The discount rate was derived based upon a weighted average cost of capital (“WACC”). The WACC was estimated based upon observations of a peer group of guideline companies whose stock was publicly traded on recognized exchanges as such guideline companies were considered comparable to VICI REIT. Factors considered in deriving a WACC included general market rates of return at the valuation date, business risks associated with the industry in which VICI REIT operates, and other specific risk factors deemed appropriate. An estimated discount rate of
9.0%
was selected as a base rate for all properties. Individual property discount rates were then adjusted based on the specific additional aforementioned risk factors and, once adjusted, ranged from
7.5%
to
17.5%
.
The following fresh-start balance sheet illustrates the financial effects on the Company of the implementation of the Plan and the adoption of fresh-start reporting. It reflects the effect of the completion of the transactions included in the Plan, including the issuance of equity and the contribution of properties.
69
VICI PROPERTIES INC.
NOTES TO CONSOLIDATED FINANCIAL STATEMENTS (Continued)
|
(In thousands)
|
Fair Value as of Formation Date (October 6, 2017)
|
||
|
Assets
|
|||
|
Investment in direct financing leases
|
$
|
7,124,000
|
|
|
Real Estate Investments:
|
|||
|
Accounted for using the operating method
|
1,184,000
|
|
|
|
Property and equipment used in operations, net
|
75,000
|
|
|
|
Cash and cash equivalents
|
55,771
|
|
|
|
Other assets
|
681
|
|
|
|
Total assets
|
$
|
8,439,452
|
|
|
Liabilities
|
|||
|
Debt
|
$
|
4,917,000
|
|
|
Deferred income taxes
|
5,631
|
|
|
|
Accounts payable and accrued expenses
|
149
|
|
|
|
Total liabilities
|
4,922,780
|
|
|
|
Redeemable preferred stock
|
759,000
|
|
|
|
Shareholders’ Equity
|
|||
|
Common stock
|
1,772
|
|
|
|
Additional paid-in capital
|
2,672,900
|
|
|
|
Total VICI shareholders’ equity
|
2,674,672
|
|
|
|
Non-controlling interests
|
83,000
|
|
|
|
Total shareholders’ equity
|
2,757,672
|
|
|
|
Total liabilities and shareholders’ equity
|
$
|
8,439,452
|
|
Note 5
— Property Transactions
Purchase of Harrah’s Las Vegas Real Estate
On
November 29, 2017
, an indirect wholly owned subsidiary of VICI (the “HLV Purchaser”), and Harrah’s Las Vegas, LLC (the “HLV Seller”), a subsidiary of Caesars, entered into an agreement, pursuant to which the HLV Purchaser agreed to acquire from the HLV Seller all of the land and real property improvements associated with the property commonly known as Harrah’s Las Vegas Hotel & Casino (“Harrah’s Las Vegas”) for a purchase price of
$1,136.2 million
. HLV Purchaser acquired the equity in a new entity (“HLV Owner”), which at the time of closing of the transaction on
December 22, 2017
(“Closing Date”), became the owner of Harrah’s Las Vegas.
On the Closing Date, HLV Owner, as landlord, entered into an amended and restated lease with the HLV Seller, as tenant, whereby the HLV Seller leased back Harrah’s Las Vegas from HLV Owner. Under the terms of the HLV Lease Agreement, the HLV Seller is responsible for ongoing costs relating to the property, including property taxes, insurance, and maintenance and repair costs that arise from the use of the property and the HLV Seller is required to continue to invest in the property and related equipment (
$171.0 million
for the period commencing
January 1, 2017
and ending
December 31, 2021
with additional amounts stipulated thereafter).
The HLV Lease Agreement has an initial
15
year term with
four
five
-year renewal terms exercisable at the option of the HLV Seller (subject to certain conditions) and provides for a fixed base rent for each of the first seven years of the lease term equal to
$87.4 million
annually. In the eighth year of the lease, rent is split into an
80%
fixed base rent component and
20%
variable rent component, which is adjusted periodically from time to time. In addition, the HLV Lease Agreement contains an annual rent escalator on the fixed base rent equal to (i)
1%
commencing in the second year of the lease and (ii) the greater of
2%
or the increase in the Consumer Price Index commencing in the sixth year of the lease (subject to certain conditions).
70
VICI PROPERTIES INC.
NOTES TO CONSOLIDATED FINANCIAL STATEMENTS (Continued)
In conjunction with the closing, HLV Owner and a subsidiary of Caesars entered into a Guaranty of Lease whereby, a subsidiary of Caesars guarantees the HLV Seller’s payment obligation under the HLV Lease Agreement.
We recorded this purchase using the Direct Financing Method in our Balance Sheet.
Sale of Eastside Property
On
November 29, 2017
, Vegas Development LLC, an indirect wholly owned subsidiary of VICI (the “Land Seller”), and a subsidiary of Caesars (the “Land Purchaser”), entered into an agreement, pursuant to which the Land Purchaser agreed to acquire from the Land Seller an entity owning approximately
18.4
acres of certain parcels located in Las Vegas, Nevada, east of Harrah’s Las Vegas (“Eastside Property”). The sales price for the membership interests in the owner of the Eastside Property was
$73.6 million
.
Pursuant to this agreement, Land Purchaser is responsible for the remediation of the flood plain mechanism on the Eastside Property. The costs of the remediation work will be borne fifty percent (
50%
) by Land Seller and fifty percent (
50%
) by Land Purchaser,
pari passu
, until such time as the total cost incurred in connection with the remediation work is equal to
$12.0 million
. Any costs in excess of
$12.0 million
incurred in connection with the remediation work shall be the sole responsibility of Land Purchaser.
On
November 29, 2017
, VICI delivered a Guaranty (the “Guaranty”), in which VICI 1 guaranteed to the HLV Seller the payment in full of any Seller Liquidated Damages Amount (as defined in the Purchase Agreement) and to the Land Purchaser the payment of losses resulting from the breach by Land Seller of certain warranties under the Eastside Property Sales Agreement.
The Eastside Property sales transaction also closed on
December 22, 2017
. Due to the put/call option on the land parcels, as described below, it was determined that the transaction does not meet the requirements of a completed sale for accounting purposes. As a result, we reclassified $
73.6 million
from Real estate investments accounted for using the operating method to Land. Additionally, the Company recorded a
$73.6 million
Deferred financing liability in its Balance Sheet.
The Company incurred transaction-related costs in conjunction with the purchase of Harrah’s Las Vegas and the sale of the Eastside property comprised primarily of valuation and legal expenses of approximately
$9.0 million
. The Company recorded this as Transaction and acquisition costs in its Statement of Operations.
Put-Call Agreement
On the Closing Date, the HLV Purchaser and certain subsidiaries of Caesars (collectively, “Owner”), the owners of certain parcels of real property located adjacent to the Harrah’s Las Vegas (including the Eastside Property) (collectively, the “Designated Property”), all or a portion of which Designated Property may in the future be improved by a convention center (in such case, the “Eastside Convention Center Property”), entered into a put-call right agreement (the “Put-Call Agreement”), which provides HLV Purchaser and Owner with certain rights and obligations in connection with: (i) a put right in favor of Owner, which, if exercised, would result in the sale by Owner to the HLV Purchaser and simultaneous leaseback by the HLV Purchaser to Owner of the Convention Center Property (the “Put Right”); (ii) if Owner exercises the Put Right and, among other things, the sale of the Eastside Convention Center Property to HLV Owner does not close for certain reasons more particularly described in the Put-Call Agreement, then a repurchase right in favor of Owner, which, if exercised, would result in the sale by HLV Purchaser to Owner of Harrah’s Las Vegas; and (iii) a call right in favor of HLV Purchaser, which, if exercised, would result in the sale by Owner to HLV Purchaser and simultaneous leaseback by HLV Purchaser to Owner of the Eastside Convention Center Property.
Amended and Restated Right of First Refusal Agreement
On the Closing Date, VICI Properties L.P., a wholly-owned subsidiary of the Company (“VICI LP”), and Caesars entered into an Amended and Restated Right of First Refusal Agreement pursuant to which VICI LP will have a right, subject to certain exclusions, (i) to acquire (and lease to Caesars) any of the gaming facilities of Centaur Holdings, LLC, which are proposed to be acquired by Caesars, (ii) to acquire (and lease to Caesars) any domestic gaming facilities located outside of the Gaming Enterprise District of Clark County, Nevada, proposed to be acquired or developed by Caesars, and (iii) to acquire certain income-producing improvements if built by Land Purchaser in lieu of a large-scale convention center on the Eastside Property, subject to certain exclusions.
Note 6
—
Investment in Direct Financing Leases, Net and Real Estate Investments
Amounts were recorded at fair value for real estate assets under lease through the initial Lease Agreements and the reclassification of such real estate assets to Investments in direct financing leases, net and Real estate investments accounted for using the operating
71
VICI PROPERTIES INC.
NOTES TO CONSOLIDATED FINANCIAL STATEMENTS (Continued)
method. The fair value assigned to the buildings is classified as an Investment in direct financing leases, while the fair value assigned to certain portions of land is recorded as Real Estate Investments accounted for using the operating method.
The weighted average remaining lease term for both operating and direct financing leases at
December 31, 2017
was
34.9
years.
VICI’s investment in direct financing leases, net consisted of the following as of
December 31, 2017
|
(In thousands)
|
December 31, 2017
|
||
|
Minimum lease payments receivable
(1)
|
$
|
29,302,166
|
|
|
Estimated residual values of leased property (unguaranteed)
|
1,987,651
|
|
|
|
Gross investment in direct financing leases
|
31,289,817
|
|
|
|
Unamortized initial direct costs
|
—
|
|
|
|
Less: Unearned income
|
(23,021,174
|
)
|
|
|
Net investment in direct financing leases, net
|
$
|
8,268,643
|
|
____________________
|
(1)
|
Minimum lease payments do not include contingent rent that may be received under the Lease Agreements. There was no contingent rent for the period ended
December 31, 2017
.
|
At
December 31, 2017
, minimum lease payments owed to VICI for each of the five succeeding years are as follows:
|
(In thousands)
|
Minimum Lease Payments
|
||
|
2018
|
$
|
725,875
|
|
|
2019
|
730,060
|
|
|
|
2020
|
734,320
|
|
|
|
2021
|
738,656
|
|
|
|
2022
|
744,647
|
|
|
Due to the put/call option on the Eastside Property, it was determined that the transaction does not meet the requirements of a completed sale for accounting purposes. As a result, we reclassified $
73.6 million
from Real estate investments accounted for using the operating method to Land. Additionally, the Company recorded a
$73.6 million
Deferred financing liability in its Balance Sheet.
Note 7
—
Property and Equipment Used in Operations, Net
Property and Equipment Used in Operations is primarily attributable to golf-related land, building and improvements and consists of the following:
|
(In thousands)
|
December 31, 2017
|
||
|
Land and land improvements
|
$
|
57,901
|
|
|
Buildings and improvements
|
14,572
|
|
|
|
Furniture and equipment
|
2,578
|
|
|
|
Total property and equipment
|
75,051
|
|
|
|
Less: accumulated depreciation
|
(751
|
)
|
|
|
Total property and equipment, net
|
$
|
74,300
|
|
|
(In thousands)
|
Period from October 6 to December 31, 2017
|
||
|
Depreciation expense
|
$
|
751
|
|
72
VICI PROPERTIES INC.
NOTES TO CONSOLIDATED FINANCIAL STATEMENTS (Continued)
Note 8
—
Accounts Payable and Accrued Expenses
|
(In thousands)
|
December 31, 2017
|
||
|
Accounts payable
|
5,207
|
|
|
|
Accrued payroll and other compensation
|
2,559
|
|
|
|
Other accrued expenses
|
2,796
|
|
|
|
Total accrued expenses
|
$
|
10,562
|
|
Note 9
—
Debt
Outstanding Indebtedness on December 31, 2017:
|
(Dollars in thousands)
|
December 31, 2017
|
|||||||||||
|
Description of Debt
|
Final
Maturity
|
Rate(s)
(1)
|
Face Value
|
Book Value
|
||||||||
|
VICI PropCo Senior Secured Credit Facilities
|
||||||||||||
|
Senior Secured Revolving Credit Facility (“Revolving Credit Facility”)
(3)
|
2022
|
Variable
|
$
|
300,000
|
|
$
|
300,000
|
|
||||
|
First Lien Senior Secured Term Loan (“Term B Loan Facility”)
(2)(3)(4)
|
2024
|
Variable
|
2,200,000
|
|
2,168,864
|
|
||||||
|
Second Priority Senior Secured Notes (“Second Lien Notes”)
(5)
|
2023
|
8.00%
|
766,892
|
|
766,892
|
|
||||||
|
CPLV Debt
|
||||||||||||
|
CPLV CMBS Debt
(6)
|
2022
|
4.36%
|
1,550,000
|
|
1,550,000
|
|
||||||
|
Total Debt
|
$
|
4,816,892
|
|
$
|
4,785,756
|
|
||||||
____________________
|
(1)
|
Interest rate is fixed, except where noted.
|
|
(2)
|
Book value is net of unamortized original issue discount and unamortized debt issuance costs incurred in conjunction with debt.
|
|
(3)
|
Interest is payable quarterly at a rate per annum and equal to LIBOR plus
2.25%
.
|
|
(4)
|
Final maturity is 2024 or three months prior to the maturity date of the Second Lien Notes, whichever is earlier.
|
|
(5)
|
Interest is payable semi-annually.
|
|
(6)
|
Interest is payable monthly.
|
The following is a schedule of future minimum repayments of long-term debt as of December 31, 2017:
|
(Dollars in thousands)
|
|||
|
2018
|
$
|
21,918
|
|
|
2019
|
21,699
|
|
|
|
2020
|
21,483
|
|
|
|
2021
|
21,269
|
|
|
|
2022
|
1,871,057
|
|
|
|
Thereafter
|
2,859,466
|
|
|
|
Total minimum repayments
|
$
|
4,816,892
|
|
Senior Secured Credit Facilities
On
December 22, 2017
, VICI PropCo entered into a credit agreement with Goldman Sachs Bank USA, as administrative agent, and other parties thereto (the “Credit Agreement”) comprised of a
$2,200.0 million
Term B Loan Facility and a
$400.0 million
Revolving Credit Facility,
$300.0 million
of which was borrowed (the Term B Loan Facility and the Revolving Credit Facility together, the “Senior Secured Credit Facilities”). The Senior Secured Credit Facilities initially bear interest at LIBOR plus
2.25%
; provided that following an underwritten public offering of the equity interests of any parent entity of VICI PropCo which results in such equity interests being listed on a national securities exchange and generates gross cash proceeds of at least
$500.0 million
, such interest rate will be reduced by
25
basis points. The Term B Loan Facility was funded with an original issue discount of
73
VICI PROPERTIES INC.
NOTES TO CONSOLIDATED FINANCIAL STATEMENTS (Continued)
0.25%
. The Revolving Credit Facility will mature in
2022
, and the Term B Loan Facility will mature in
2024
or the date that is three months prior to the maturity date of the Second Lien Notes, whichever is earlier. The Term B Loan Facility is subject to amortization of
1.0%
of principal per annum payable in equal quarterly installments.
VICI PropCo used the net proceeds of the Term B Loan Facility and the Revolving Credit Facility drawn on the closing date of the Credit Agreement, together with the proceeds from the equity issuance by the Company on
December 22, 2017
(See
Note 12
,
Shareholders' Equity
), to complete (i) the consummation of the acquisition of the Harrah’s Las Vegas Property (See
Note 5
,
Property Transactions
), (ii) the refinancing of the existing credit agreement of VICI PropCo, dated as of
October 6, 2017
including the Prior Term Loan of
$1,638.4 million
, (iii) the redemption of the Prior First Lien Notes due 2022, issued on
October 6, 2017
, with an outstanding principal amount of
$311.7 million
plus accrued interest, (iv) the repurchase of (A)
$200.0 million
aggregate principal amount of CPLV existing indebtedness outstanding pursuant to that certain Mezzanine A (Senior tranche) Loan Agreement and (B)
$200.0 million
aggregate principal amount of CPLV existing indebtedness outstanding pursuant to that certain Mezzanine B (Intermediate tranche) Loan Agreement and (v) the payment of certain fees and expenses incurred in connection with the foregoing.
The Senior Secured Credit Facilities are guaranteed by each of VICI PropCo’s existing and subsequently acquired wholly-owned material domestic restricted subsidiaries, and secured by a first priority lien on substantially all of the VICI PropCo’s and such restricted subsidiaries’ material assets, including mortgages on their respective real estate, subject to customary exclusions. None of VICI, certain subsidiaries of VICI PropCo, including CPLV and its subsidiaries, are subject to the covenants of the Credit Agreement or are guarantors of the Senior Secured Credit Facilities.
The Credit Agreement provides for customary events of default, including, without limitation, (i) payment defaults, (ii) inaccuracies of representations and warranties, (iii) covenant defaults, (iv) cross-defaults to certain other indebtedness in excess of specified amounts, (v) certain events of bankruptcy and insolvency, (vi) judgment defaults in excess of specified amounts, (vii) actual or asserted invalidity or impairment of any loan documentation, (viii) the security documents cease to create a valid and perfected first priority lien on any material portion of the collateral, (ix) ERISA defaults, (x) termination of CEOC LLC’s initial master lease, dated as of
October 6, 2017
and (xi) change of control.
The Credit Agreement also contains customary covenants that, among other things, limit the ability of VICI PropCo and its restricted subsidiaries to: (i) incur additional indebtedness; (ii) merge with a third party or engage in other fundamental changes; (iii) make restricted payments; (iv) enter into, create, incur or assume any liens; (v) make certain sales and other dispositions of assets; (vi) enter into certain transactions with affiliates; (vii) make certain payments on certain other indebtedness; (viii) make certain investments; and (ix) incur restrictions on the ability of restricted subsidiaries to make certain distributions, loans or transfers of assets to VICI PropCo or any restricted subsidiary. These covenants are subject to a number of important exceptions and qualifications, including, with respect to the restricted payments covenant, the ability to make unlimited restricted payments to maintain the REIT status of the Company. Commencing with the first full fiscal quarter ending after the Closing Date, if there is
30%
utilization of the Revolving Credit Facility, VICI PropCo will be required to maintain a maximum total net debt to adjusted asset ratio.
The Senior Secured Credit Facilities may be voluntarily prepaid at VICI PropCo’s option, in whole or in part, at any time, and are subject to mandatory prepayment in the event of receipt by VICI PropCo or any of its restricted subsidiaries of the proceeds from the occurrence of certain events, including asset sales, casualty events and issuance of certain indebtedness.
Second Lien Notes
The Second Lien Notes were issued on October 6, 2017, pursuant to an indenture (the “Indenture”) by and among VICI Properties 1 LLC and VICI FC Inc., a wholly owned subsidiary of VICI PropCo, as issuers (together, the “Issuers”), the subsidiary guarantors party thereto, and UMB Bank National Association, as trustee. The Second Lien Notes are guaranteed by each of the Issuers’ existing and subsequently acquired wholly owned material domestic restricted subsidiaries, and secured by a second priority lien on substantially all of the Issuers’ and such restricted subsidiaries’ material assets, including mortgages on their respective real estate, subject to customary exclusions. None of VICI or certain subsidiaries of VICI PropCo, including CPLV and its subsidiaries, are subject to the covenants of the Indenture or are guarantors of the Second Lien Notes.
The Indenture contains covenants that limit the Issuers’ and their restricted subsidiaries’ ability to, among other things: (i) incur additional debt; (ii) pay dividends on or make other distributions in respect of their capital stock or make other restricted payments; (iii) make certain investments; (iv) sell certain assets; (v) create or permit to exist dividend and/or payment restrictions affecting their restricted subsidiaries; (vi) create liens on certain assets to secure debt; (vii) consolidate, merge, sell or otherwise dispose of
74
VICI PROPERTIES INC.
NOTES TO CONSOLIDATED FINANCIAL STATEMENTS (Continued)
all or substantially all of their assets; (viii) enter into certain transactions with their affiliates; and (ix) designate their subsidiaries as unrestricted subsidiaries.
The Second Lien Notes are redeemable at the option of the Issuers, in whole or in part, at any time, from time to time, at a price set forth in the Indenture with the option to redeem up to
35%
of the original aggregate principal amount thereof with the net cash proceeds of certain issuances of common or preferred equity by VICI PropCo or VICI REIT, at a price equal to
108%
of such principal amount of the Second Lien Notes redeemed plus accrued and unpaid interest to the redemption date.
CPLV CMBS Debt
The CPLV CMBS Debt is secured by all of the assets of CPLV Borrower, including, but not limited to, the CPLV Borrower’s (1) fee interest (except as provided in (2)) in and to CPLV, (2) leasehold interest with respect to Octavius Tower, and (3) interest in the CPLV Lease Agreements and all related agreements, including the Lease Agreements. The CPLV CMBS Debt will be a first priority lien, subject only to permitted encumbrances (which are as set forth in the loan documentation), and an obligation to repay a specified sum with interest at
4.36%
per annum. The CPLV CMBS Debt will be evidenced by one or more promissory notes and secured by, among other things, a mortgage, deed of trust or other similar security instrument that creates a mortgage lien on the fee and/or leasehold interest of the CPLV Borrower.
The loan documents governing the CPLV CMBS Debt contain covenants limiting CPLV Borrower’s ability to, among other things: (i) incur additional debt; (ii) enter into certain transactions with its affiliates; (iii) consolidate, merge, sell or otherwise dispose of its assets; and (iv) allow transfers of its direct or indirect equity interests.
Debt-related transactions since Formation Date:
|
Face Value
(In thousands)
|
||||||||||||||||
|
Description of Debt
|
Debt At Formation
|
Mandatory Conversion
|
Refinancing Transactions
|
Debt at December 31, 2017
|
||||||||||||
|
VICI PropCo Senior Secured Credit Facilities
|
||||||||||||||||
|
Senior Secured Revolving Credit Facility (“Revolving Credit Facility”)
(3)
|
$
|
—
|
|
$
|
—
|
|
$
|
300,000
|
|
$
|
300,000
|
|
||||
|
First Lien Senior Secured Term Loan (“Term B Loan Facility”)
|
2,200,000
|
|
2,200,000
|
|
||||||||||||
|
First Lien Term Loan (“Prior Term Loan”)
|
1,638,387
|
|
—
|
|
(1,638,387
|
)
|
—
|
|
||||||||
|
First Priority Senior Secured Notes (“Prior First Lien Notes”)
|
311,721
|
|
—
|
|
(311,721
|
)
|
—
|
|
||||||||
|
Second Priority Senior Secured Notes (“Second Lien Notes”)
|
766,892
|
|
—
|
|
—
|
|
766,892
|
|
||||||||
|
CPLV Debt
|
||||||||||||||||
|
CPLV CMBS Debt
|
1,550,000
|
|
—
|
|
—
|
|
1,550,000
|
|
||||||||
|
CPLV Mezzanine Debt
|
||||||||||||||||
|
Senior tranche
|
200,000
|
|
—
|
|
(200,000
|
)
|
—
|
|
||||||||
|
Intermediate tranche
|
200,000
|
|
—
|
|
(200,000
|
)
|
—
|
|
||||||||
|
Junior tranche
|
250,000
|
|
(250,000
|
)
|
—
|
|
—
|
|
||||||||
|
Total Debt
|
$
|
4,917,000
|
|
$
|
(250,000
|
)
|
$
|
149,892
|
|
$
|
4,816,892
|
|
||||
Mandatory Conversion
The CPLV mezzanine debt junior tranche of
$250.0 million
was automatically exchanged for
17,630,700
shares of the Company’s common stock on
November 6, 2017
.
75
VICI PROPERTIES INC.
NOTES TO CONSOLIDATED FINANCIAL STATEMENTS (Continued)
Additional Redemptions and Prepayments
On February 5, 2018, the Company completed an initial public offering of
69,575,000
shares of common stock at an offering price of
$20.00
per share for an aggregate offering value of
$1,391.5 million
, resulting in net proceeds of
$1,307.0 million
after commissions and expenses. The Company utilized a portion of the proceeds from the stock offering to: (a) pay down
$300.0 million
of indebtedness outstanding under the Revolving Credit Facility; (b) redeem
$268.4 million
in aggregate principal amount of the Second Lien Notes at a redemption price of
108%
plus accrued and unpaid interest to the date of the redemption; and (c) repay
$100.0 million
of the Term Loan B Facility.
Note 10
—
Fair Value
The following methods and assumptions are used to estimate the fair value of each class of financial instruments for which it is practicable to estimate:
Cash, Cash Equivalents, and Restricted Cash
The fair value of the Company’s cash, cash equivalents and restricted cash approximate their carrying value due to the short maturity of these instruments.
Debt
The fair value of notes under the Senior Secured Credit Facilities and the CPLV CMBS debt is estimated based on quoted prices in active markets and as such is a Level 1 measurement as defined under ASC 820.
The estimated fair values of the Company’s financial instruments at
December 31, 2017
are as follows:
|
December 31, 2017
|
|||||||
|
(In thousands)
|
Carrying Amount
|
Fair Value
|
|||||
|
Financial assets:
|
|||||||
|
Cash and cash equivalents
|
$
|
183,646
|
|
$
|
183,646
|
|
|
|
Restricted cash
|
13,760
|
|
13,760
|
|
|||
|
Financial liabilities:
|
|||||||
|
VICI PropCo Senior Secured Credit Facilities
|
|||||||
|
Senior Secured Revolving Credit Facility (“Revolving Credit Facility”)
|
$
|
300,000
|
|
$
|
300,000
|
|
|
|
First Priority Senior Secured Notes (“Term B Loan Facility”)
|
2,168,864
|
|
2,200,000
|
|
|||
|
Second Priority Senior Secured Notes (“Second Lien Notes”)
|
766,892
|
|
853,167
|
|
|||
|
CPLV Debt
|
|||||||
|
CPLV CMBS Debt
|
1,550,000
|
|
1,559,486
|
|
|||
Note 11
—
Commitments and Contingent Liabilities
Litigation
In the ordinary course of business, from time to time, the Company may be subject to legal claims and administrative proceedings, none of which are currently outstanding, which the Company believes could have, individually or in the aggregate, a material adverse effect on its business, financial condition or results of operations, liquidity or cash flows.
Operating Lease Commitments
The Company is liable under various operating leases for: (i) land at the Cascata golf course, which expires in
2039
and (ii) offices in Las Vegas, Nevada and New Orleans, Louisiana, which expire in 2018 and 2019, respectively. Total rental expense under these agreements, included in golf-related and general and administrative expenses in our Statement of Operations, was approximately
$0.3 million
for the period from
October 6, 2017
through
December 31, 2017
.
76
VICI PROPERTIES INC.
NOTES TO CONSOLIDATED FINANCIAL STATEMENTS (Continued)
The future minimum lease commitments relating to the base lease rent portion of noncancelable operating leases at
December 31, 2017
are as follows:
|
(In thousands)
|
Lease Commitments
|
|||
|
2018
|
$
|
1,073
|
|
|
|
2019
|
948
|
|
||
|
2020
|
908
|
|
||
|
2021
|
926
|
|
||
|
2022
|
945
|
|
||
|
2023 and thereafter
|
17,966
|
|
||
|
Total minimum rental commitments
|
$
|
22,766
|
|
|
Other golf-related commitments
The TRS utilizes a third-party golf maintenance company for its Rio Secco and Cascata golf courses. The agreements are for
five
years and expire in
February 2019
and include all labor and equipment necessary to maintain both golf course grounds. Total expense under these agreements included as golf-related expenses in our Statement of Operations was approximately
$0.7 million
for the period from
October 6, 2017
through
December 31, 2017
.
Total commitments relating to golf-related maintenance agreements at
December 31, 2017
are as follows:
|
(In thousands)
|
Golf-related maintenance agreements
|
|||
|
2018
|
$
|
2,969
|
|
|
|
2019
|
225
|
|
||
|
Total golf-related maintenance agreement commitments
|
$
|
3,194
|
|
|
Note 12
—
Shareholders' Equity
Pre-Formation
In conjunction with VICI’s conversion to a corporation under the laws of the State of Maryland, the Company authorized
100,000,000
shares of common stock with a par value of
$0.01
per share. On May 5, 2017, VICI REIT issued
1,000
shares of common stock to CEOC.
Formation
Effective on the Formation Date, the Company had authority to issue
750,000,000
shares of stock, consisting of
700,000,000
shares of Common Stock,
$0.01
par value per share and
50,000,000
shares of Preferred Stock,
$0.01
par value per share (“Preferred Stock”), of which
12,000,000
shares has been classified as Series A Convertible Preferred Stock,
$0.01
par value per share (“Series A Preferred Stock”).
On the Formation Date, the Company issued
177,160,494
shares of common stock and
12,000,000
shares of Series A preferred stock with an aggregate liquidation preference of
$300.0 million
(
$25
per share) to CEOC and certain of its subsidiaries in exchange for the Properties and Caesars Entertainment Outdoor. CEOC distributed such shares to certain of its creditors and to certain backstop parties.
Pursuant to the Plan and a Backstop Commitment Agreement dated
September 12, 2017
, the backstop purchasers agreed, or otherwise had the right, to purchase a specified number of the shares of the Series A preferred stock for cash, with the cash proceeds of such purchases being paid to certain creditors of CEOC. An aggregate of
6,002,907
shares of Series A preferred stock were purchased by the backstop purchasers on the Formation Date (the “Backstop Shares”) at a price of
$20.83
per share and an aggregate of
5,997,093
shares of Series A preferred stock were issued to certain creditors of CEOC as a portion of the recovery on account of their claims.
77
VICI PROPERTIES INC.
NOTES TO CONSOLIDATED FINANCIAL STATEMENTS (Continued)
Post-Formation
Mandatory Conversions
On
November 6, 2017
, all of the Series A preferred stock automatically converted into
51,433,692
shares of the Company’s common stock (the “Mandatory Preferred Conversion”). No additional consideration was payable in connection with the Mandatory Preferred Conversion.
In addition, on the Formation Date, CPLV Mezz 3 LLC, a special-purpose parent entity of CPLV Mezz 2 LLC (which itself is the special-purpose parent entity of CPLV Mezz 1 LLC, the special-purpose parent entity of CPLV Property Owner LLC (the mortgage borrower under the CPLV CMBS Debt and the owner of CPLV)), issued a junior tranche of CPLV mezzanine debt in an amount of
$250.0 million
to institutional accredited investors, which debt automatically converted into an aggregate of
17,630,700
shares of the Company’s common stock on
November 6, 2017
(the “Mandatory Mezzanine Conversion”). No additional consideration was payable in connection with the Mandatory Mezzanine Conversion.
Private Equity Placement
In
November 2017
, we entered into a common stock purchase agreement with certain of our existing investors, which certain additional investors joined in December 2017, pursuant to which we agreed to sell, contemporaneously with the consummation of the acquisition of the Harrah’s Las Vegas property, an aggregate of
54,054,052
shares of our common stock at a price of
$18.50
per share in a private placement transaction, for gross proceeds of approximately
$1.0 billion
. The net proceeds from the transaction of approximately
$963.8 million
was used to partially fund the purchase price for the Harrah’s Las Vegas property and for working capital and general corporate purposes. At the closing of the private placement, on
December 22, 2017
, we made a cash payment equal to
2%
of the committed amount, or
$17.0 million
in the aggregate, to the investors who entered into the purchase agreement with us in
November 2017
. In addition, at the private placement closing, we entered into a registration rights agreement with the investors, which provides, among other things, for us to file a shelf registration statement for the benefit of the investors within
75
days following the closing.
As a result of the Formation and Post-Formation equity transactions, the Company has
300,278,938
shares of Common Stock issued and outstanding and
no
shares of Preferred Stock outstanding at
December 31, 2017
.
Initial Public Offering
On February 5, 2018, the Company completed an initial public offering of
69,575,000
shares of common stock at an offering price of
$20.00
per share for an aggregate offering value of
$1,391.5 million
, resulting in net proceeds of
$1,307.0 million
after commissions and expenses. After giving effect to the offering, the Company has
369,853,938
shares of Common Stock issued and outstanding.
Note 13
—
Earnings Per Share
Basic earnings per share is computed by dividing net income attributable to common shareholders by the weighted-average number of common shares outstanding during the period, excluding net income attributable to participating securities (unvested restricted stock awards). Diluted earnings per share reflects the additional dilution for all potentially-dilutive securities such as stock options, unvested restricted shares and unvested performance-based restricted shares. The following table reconciles the weighted-average common shares outstanding used in the calculation of basic earnings per share to the weighted-average common shares outstanding used in the calculation of diluted earnings per share for the period ended
December 31, 2017
:
|
(In thousands)
|
Period from October 6 to December 31, 2017
|
|
|
Determination of shares:
|
|
|
|
Weighted-average common shares outstanding
|
227,829
|
|
|
Assumed conversion of restricted stock
|
156
|
|
|
Diluted weighted-average common shares outstanding
|
227,985
|
|
78
VICI PROPERTIES INC.
NOTES TO CONSOLIDATED FINANCIAL STATEMENTS (Continued)
|
Basic and Diluted Earnings Per Share
|
|||
|
(In thousands, except per share data)
|
Period from October 6 to December 31, 2017
|
||
|
Basic:
|
|||
|
Net income attributable to common shareholders
|
$
|
42,662
|
|
|
Weighted-average common shares outstanding
|
227,829
|
|
|
|
Basic EPS
|
$
|
0.19
|
|
|
|
|||
|
Diluted:
|
|||
|
Net income attributable to common shareholders
|
$
|
42,662
|
|
|
Diluted weighted-average common shares outstanding
|
227,985
|
|
|
|
Diluted EPS
|
$
|
0.19
|
|
Note 14
—
Share-Based Compensation
The 2017 Stock Incentive Plan is designed to provide long-term equity based compensation to directors and employees of the Company and its subsidiaries. The 2017 Stock Incentive Plan was adopted by the Board of Directors upon Formation and is administered by the Compensation Committee of the Board of Directors.
Awards under the 2017 Stock Incentive Plan may be granted with respect to an aggregate of
12,750,000
shares of common stock and may be issued in the form of: (a) incentive stock options, (b) non-qualified stock options, (c) stock appreciation rights, (d) dividend equivalent rights, (e) restricted stock, (f) restricted stock units or (g) unrestricted stock.
The 2017 Stock Incentive Plan limits the total number of shares of common stock with respect to which awards may be granted to any employee or director during any one calendar year.
During 2017, we granted a total of
174,572
restricted stock awards,
145,062
of which were valued based on an independent appraisal of the value of the Company’s common stock as of the Formation Date and
29,510
of which were valued based on the
10
-day volume weighted average price using the
10
trading days ending on the grant date.
Total shared-based compensation expense recorded as General and administrative expense in the Statement of Operations totaled
$1.4 million
for the period from October 6, 2017 to December 31, 2017. Compensation expense is recognized on a straight-line basis for awards with only service conditions.
|
Restricted Stock Activity
|
||||||
|
|
Units
|
Wtd Avg Fair Value
|
||||
|
Outstanding as of Formation Date
|
—
|
|
$
|
—
|
|
|
|
Granted
|
174,572
|
|
15.41
|
|
||
|
Vested
|
(50,962
|
)
|
14.90
|
|
||
|
Forfeited
|
—
|
|
—
|
|
||
|
Canceled
|
—
|
|
—
|
|
||
|
Outstanding as of December 31, 2017
|
123,610
|
|
$
|
15.61
|
|
|
Restricted shares that vested in 2017 were issued as common stock in February 2018.
As of December 31, 2017, there was
$1.8 million
of unrecognized compensation cost related to non-vested share-based compensation arrangements under the 2017 Stock Incentive Plan. This cost is expected to be recognized over a weighted average period of 3.6 years.
79
VICI PROPERTIES INC.
NOTES TO CONSOLIDATED FINANCIAL STATEMENTS (Continued)
Note 15
—
Income Taxes
We intend to elect to be taxed and qualify as a REIT for U.S. federal income tax purposes commencing with our taxable year ended December 31, 2017. U.S. federal income tax law generally requires that a REIT distribute annually at least
90%
of its REIT taxable income, without regard to the deduction for dividends paid and excluding net capital gains, and that it pays taxes at regular corporate income tax rates to the extent that it annually distributes less than
100%
of its taxable income. The Company intends to meet those requirements and as a result, we generally will not be subject to federal income tax except for the TRS operations.
The TRS operations (represented by the
four
golf course businesses) are able to engage in activities resulting in income that would not be qualifying income for a REIT. As a result, certain activities of the Company which occur within its TRS operations are subject to federal and state income taxes. Accordingly, the Company's tax provision and deferred tax analysis are primarily from the results of TRS activities.
New tax legislation, commonly referred to as the Tax Cuts and Jobs Act (“Tax Reform Act”), was enacted on December 22, 2017, which significantly changes U.S. tax law by, among other things, a permanent reduction of the U.S. corporate income tax rate from 35% to 21%, effective January 1, 2018. ASC 740, Accounting for Income Taxes, requires companies to recognize the effect of tax law changes in the period of enactment. Accordingly, we have recorded a reduction to our net deferred tax liability of
$2.4 million
, and a corresponding increase to income tax benefit during the period.
The composition of our income tax expense (benefit) for the period from October 6, 2017 to December 31, 2017 was as follows:
|
(In thousands)
|
Current
|
Deferred
|
Total
|
||||||||
|
Federal
|
$
|
—
|
|
$
|
(1,909
|
)
|
$
|
(1,909
|
)
|
||
|
State
|
11
|
|
(3
|
)
|
8
|
|
|||||
|
Income tax expense (benefit)
|
$
|
11
|
|
$
|
(1,912
|
)
|
$
|
(1,901
|
)
|
||
At December 31, 2017, the net effects of temporary differences that gave rise to significant portions of the deferred tax assets and deferred tax liabilities were:
|
(In thousands)
|
December 31, 2017
|
||
|
Deferred tax assets:
|
|||
|
Federal net operating loss
|
$
|
55
|
|
|
Accruals, reserves and other
|
24
|
|
|
|
Total deferred tax assets
|
79
|
|
|
|
Deferred tax liabilities:
|
|||
|
Land, buildings and equipment, net
|
(3,797
|
)
|
|
|
Total deferred tax liabilities
|
(3,797
|
)
|
|
|
Net deferred tax liability
|
$
|
(3,718
|
)
|
The following table reconciles our effective income tax rate to the historical federal statutory rate of
35%
.
|
(Amounts in thousands)
|
Amount
|
Percent
|
||||
|
Federal income tax expense at statutory rate
|
$
|
15,414
|
|
35.0
|
%
|
|
|
REIT income not subject to federal income tax
|
(14,897
|
)
|
(33.8
|
)
|
||
|
State income taxes, net of federal benefits
|
5
|
|
—
|
|
||
|
Impact of Tax Reform on deferred tax liability
|
(2,423
|
)
|
(5.5
|
)
|
||
|
Income tax expense (benefit)
|
$
|
(1,901
|
)
|
(4.3
|
)%
|
|
80
VICI PROPERTIES INC.
NOTES TO CONSOLIDATED FINANCIAL STATEMENTS (Continued)
Note 16
—
Segment Information
The following tables present certain information with respect to the Company’s segments.
Our real property business and our golf course business represent
two
reportable segments. The real property business segment consists of leased real property and represents the substantial majority of our business. The golf course business segment consists of
four
golf courses, with each being operating segments that are aggregated into one reportable segment.
The results of each reportable segment presented below are consistent with the way VICI management assesses these results and allocates resources, which is a consolidated view that adjusts for the impact of certain transactions between reportable segments within VICI, as described below. Accordingly, the results of certain reportable segments presented in this footnote differ from the financial statement information presented in their standalone reports.
|
Period Ended December 31, 2017
|
||||||||||||
|
(In thousands)
|
Real Property Business
|
Golf Course Business
|
VICI Consolidated
|
|||||||||
|
Net revenues
|
$
|
181,258
|
|
$
|
6,351
|
|
$
|
187,609
|
|
|||
|
Operating income
|
142,722
|
|
1,474
|
|
144,196
|
|
||||||
|
Interest expense
|
(63,354
|
)
|
—
|
|
(63,354
|
)
|
||||||
|
Loss on extinguishment of debt
|
(38,488
|
)
|
—
|
|
(38,488
|
)
|
||||||
|
Income before income taxes
|
41,162
|
|
1,474
|
|
42,636
|
|
||||||
|
Provision for income taxes
|
—
|
|
1,901
|
|
1,901
|
|
||||||
|
Net income
|
41,162
|
|
3,375
|
|
44,537
|
|
||||||
|
Depreciation
|
—
|
|
751
|
|
751
|
|
||||||
|
Total assets
|
$
|
9,660,244
|
|
$
|
79,468
|
|
$
|
9,739,712
|
|
|||
All of our real estate holdings (other than those related to the Golf Course Business) are leased to Caesars and certain of its subsidiaries, and substantially all of our revenues are derived from the Lease Agreements, which represents a concentration of credit risk due to the single tenant nature of our leases. Management does not believe there are any other significant concentrations of credit risk.
Note 17
—
Subsequent Events
On February 5, 2018, the Company completed an initial public offering of
69,575,000
shares of common stock at an offering price of
$20.00
per share for an aggregate offering value of
$1,391.5 million
, resulting in net proceeds of
$1,307.0 million
after commissions and expenses. The Company utilized a portion of the proceeds from the stock offering to: (a) pay down
$300.0 million
of indebtedness outstanding under the Revolving Credit Facility; (b) redeem
$268.4 million
in aggregate principal amount of the Second Lien Notes at a redemption price of
108%
plus accrued and unpaid interest to the date of the redemption; and (c) repay
$100.0 million
of the Term Loan B Facility.
After giving effect to the offering, the Company has
369,853,938
shares of Common Stock issued and outstanding as of the date of this Annual Report on Form 10-K.
Note 18
—
Quarterly Results of Operations (Unaudited)
As VICI began operations on October 6, 2017, our first quarter of operations is represented in our Consolidated Statement of Operations.
81
REPORT OF INDEPENDENT REGISTERED PUBLIC ACCOUNTING FIRM
To the shareholders and the Board of Directors of VICI Properties Inc.
Opinion on the Financial Statements
We have audited the accompanying combined balance sheets of Caesars Entertainment Outdoor (the "Business") as of October 5, 2017 and December 31, 2016, the related combined statements of operations, equity, and cash flows for the period from January 1, 2017 to October 5, 2017 and for each of the two years in the period ended December 31, 2016, and the related notes to the combined financial statements (collectively referred to as the "Financial Statements"). In our opinion, the financial statements present fairly, in all material respects, the financial position of the Business as of October 5, 2017 and December 31, 2016, and the results of its operations and its cash flows for the period from January 1, 2017 to October 5, 2017 and for each of the two years in the period ended December 31, 2016, in conformity with accounting principles generally accepted in the United States of America.
Basis for Opinion
These financial statements are the responsibility of the Business’ management. Our responsibility is to express an opinion on the Business’ financial statements based on our audits. We are a public accounting firm registered with the Public Company Accounting Oversight Board (United States) (PCAOB) and are required to be independent with respect to the Business in accordance with the U.S. federal securities laws and the applicable rules and regulations of the Securities and Exchange Commission and the PCAOB.
We conducted our audits in accordance with the standards of the PCAOB. Those standards require that we plan and perform the audit to obtain reasonable assurance about whether the financial statements are free of material misstatement, whether due to error or fraud. The Business is not required to have, nor were we engaged to perform, an audit of its internal control over financial reporting. As part of our audits, we are required to obtain an understanding of internal control over financial reporting but not for the purpose of expressing an opinion on the effectiveness of the Business’ internal control over financial reporting. Accordingly, we express no such opinion.
Our audits included performing procedures to assess the risks of material misstatement of the financial statements, whether due to error or fraud, and performing procedures that respond to those risks. Such procedures included examining, on a test basis, evidence regarding the amounts and disclosures in the financial statements. Our audits also included evaluating the accounting principles used and significant estimates made by management, as well as evaluating the overall presentation of the financial statements. We believe that our audits provide a reasonable basis for our opinion.
/s/ Deloitte & Touche LLP
Las Vegas, Nevada
March 28, 2018
We have served as the Business’ auditor since 2016.
82
CAESARS ENTERTAINMENT OUTDOOR
(DEBTOR-IN-POSSESSION)
COMBINED BALANCE SHEETS
(AMOUNTS IN THOUSANDS)
|
October 5, 2017
|
December 31, 2016
|
||||||
|
Assets
|
|||||||
|
Current assets
|
|||||||
|
Cash
|
$
|
111
|
|
$
|
920
|
|
|
|
Receivables, net
|
269
|
|
77
|
|
|||
|
Inventories
|
480
|
|
371
|
|
|||
|
Prepayments
|
84
|
|
276
|
|
|||
|
Total current assets
|
944
|
|
1,644
|
|
|||
|
Property and equipment, net
|
88,309
|
|
88,831
|
|
|||
|
Total assets
|
$
|
89,253
|
|
$
|
90,475
|
|
|
|
Liabilities and Equity
|
|||||||
|
Current liabilities
|
|||||||
|
Accounts payable
|
$
|
272
|
|
$
|
305
|
|
|
|
Accrued expenses
|
647
|
|
705
|
|
|||
|
Current portion of long-term debt
|
—
|
|
14
|
|
|||
|
Total current liabilities
|
919
|
|
1,024
|
|
|||
|
Deferred income taxes
|
4,944
|
|
5,043
|
|
|||
|
Liabilities subject to compromise
|
249
|
|
265
|
|
|||
|
Total liabilities
|
6,112
|
|
6,332
|
|
|||
|
Commitments and contingencies (Note 9)
|
|
|
|
|
|||
|
Equity
|
|||||||
|
Net investment
|
83,091
|
|
84,091
|
|
|||
|
Retained earnings
|
50
|
|
52
|
|
|||
|
Total equity
|
83,141
|
|
84,143
|
|
|||
|
Total liabilities and equity
|
$
|
89,253
|
|
$
|
90,475
|
|
|
See accompanying Notes to Combined Financial Statements
83
CAESARS ENTERTAINMENT OUTDOOR
(DEBTOR-IN-POSSESSION)
COMBINED STATEMENTS OF OPERATIONS
(AMOUNTS IN THOUSANDS)
|
Period from January 1, 2017 to October 5, 2017
|
Year Ended December 31, 2016
|
Year Ended December 31, 2015
|
|||||||||
|
Revenues
|
|||||||||||
|
Golf
($5,685, $6,353 and $5,146 attributable to related parties)
|
$
|
11,412
|
|
$
|
14,558
|
|
$
|
14,071
|
|
||
|
Food and beverage
|
1,361
|
|
2,150
|
|
2,150
|
|
|||||
|
Retail and other
|
1,363
|
|
2,077
|
|
1,856
|
|
|||||
|
Net revenues
|
14,136
|
|
18,785
|
|
18,077
|
|
|||||
|
Operating expenses
|
|||||||||||
|
Direct
|
|||||||||||
|
Golf
|
5,204
|
|
7,082
|
|
6,767
|
|
|||||
|
Food and beverage
|
1,144
|
|
1,828
|
|
1,936
|
|
|||||
|
Retail and other
|
1,066
|
|
1,691
|
|
1,581
|
|
|||||
|
Property costs
|
2,895
|
|
3,138
|
|
3,133
|
|
|||||
|
Depreciation
|
2,445
|
|
3,030
|
|
2,882
|
|
|||||
|
Administrative and other
|
1,382
|
|
2,009
|
|
1,760
|
|
|||||
|
Total operating expenses
|
14,136
|
|
18,778
|
|
18,059
|
|
|||||
|
Income from operations
|
—
|
|
7
|
|
18
|
|
|||||
|
Interest expense
|
—
|
|
(7
|
)
|
(18
|
)
|
|||||
|
Income before taxes
|
—
|
|
—
|
|
—
|
|
|||||
|
Income tax (expense) benefit
|
(2
|
)
|
—
|
|
3
|
|
|||||
|
Net income (loss)
|
$
|
(2
|
)
|
$
|
—
|
|
$
|
3
|
|
||
See accompanying Notes to Combined Financial Statements
84
CAESARS ENTERTAINMENT OUTDOOR
(DEBTOR-IN-POSSESSION)
COMBINED STATEMENTS OF EQUITY
(AMOUNTS IN THOUSANDS)
|
Net Investment
|
Retained Earnings
|
Total Equity
|
|||||||||
|
Balance at January 1, 2015
|
$
|
87,304
|
|
$
|
49
|
|
$
|
87,353
|
|
||
|
Net income
|
—
|
|
3
|
|
3
|
|
|||||
|
Transactions with parent, net
|
(1,981
|
)
|
—
|
|
(1,981
|
)
|
|||||
|
Balance at December 31, 2015
|
$
|
85,323
|
|
$
|
52
|
|
$
|
85,375
|
|
||
|
Net income
|
—
|
|
—
|
|
—
|
|
|||||
|
Transactions with parent, net
|
(1,232
|
)
|
—
|
|
(1,232
|
)
|
|||||
|
Balance at December 31, 2016
|
$
|
84,091
|
|
$
|
52
|
|
$
|
84,143
|
|
||
|
Net income (loss)
|
—
|
|
(2
|
)
|
(2
|
)
|
|||||
|
Transactions with parent, net
|
(1,000
|
)
|
—
|
|
(1,000
|
)
|
|||||
|
Balance at October 5, 2017
|
$
|
83,091
|
|
$
|
50
|
|
$
|
83,141
|
|
||
See accompanying Notes to Combined Financial Statements
85
CAESARS ENTERTAINMENT OUTDOOR
(DEBTOR-IN-POSSESSION)
COMBINED STATEMENTS OF CASH FLOWS
(AMOUNTS IN THOUSANDS)
|
Period from January 1, 2017 to October 5, 2017
|
Year Ended December 31, 2016
|
Year Ended December 31, 2015
|
|||||||||
|
Cash flows from operating activities
|
|||||||||||
|
Net income (loss)
|
$
|
(2
|
)
|
$
|
—
|
|
$
|
3
|
|
||
|
Adjustments to reconcile net income to cash flows provided by operating activities:
|
|||||||||||
|
Depreciation
|
2,445
|
|
3,030
|
|
2,882
|
|
|||||
|
Net gain on asset sales
|
—
|
|
—
|
|
(38
|
)
|
|||||
|
Deferred income taxes
|
(99
|
)
|
(111
|
)
|
(101
|
)
|
|||||
|
Provisions for (recoveries of) bad debt
|
12
|
|
(10
|
)
|
31
|
|
|||||
|
Change in current assets and liabilities:
|
|||||||||||
|
Receivables
|
(203
|
)
|
116
|
|
(137
|
)
|
|||||
|
Other current assets
|
—
|
|
12
|
|
69
|
|
|||||
|
Inventories
|
(109
|
)
|
71
|
|
(5
|
)
|
|||||
|
Prepayments
|
192
|
|
(223
|
)
|
6
|
|
|||||
|
Accounts payable
|
(49
|
)
|
(39
|
)
|
52
|
|
|||||
|
Accrued expenses
|
(58
|
)
|
(125
|
)
|
126
|
|
|||||
|
Cash flows provided by operating activities
|
2,129
|
|
2,721
|
|
2,888
|
|
|||||
|
Cash flows from investing activities
|
|||||||||||
|
Acquisitions of property and equipment, net of change in related payables
|
(1,924
|
)
|
(869
|
)
|
(798
|
)
|
|||||
|
Proceeds from sale of assets
|
—
|
|
—
|
|
66
|
|
|||||
|
Cash flows used in investing activities
|
(1,924
|
)
|
(869
|
)
|
(732
|
)
|
|||||
|
Cash flows from financing activities
|
|||||||||||
|
Repayments for capital leases
|
(14
|
)
|
(51
|
)
|
(45
|
)
|
|||||
|
Transactions with parent, net
|
(1,000
|
)
|
(1,232
|
)
|
(1,981
|
)
|
|||||
|
Cash flows used in financing activities
|
(1,014
|
)
|
(1,283
|
)
|
(2,026
|
)
|
|||||
|
Net increase (decrease) in cash and cash equivalents
|
(809
|
)
|
569
|
|
130
|
|
|||||
|
Cash and cash equivalents, beginning of period
|
920
|
|
351
|
|
221
|
|
|||||
|
Cash and cash equivalents, end of period
|
$
|
111
|
|
$
|
920
|
|
$
|
351
|
|
||
|
Supplemental Cash Flow Information:
|
Period from January 1, 2017 to October 5, 2017
|
Year Ended December 31, 2016
|
Year Ended December 31, 2015
|
||||||||
|
Cash paid for interest
|
$
|
—
|
|
$
|
7
|
|
$
|
18
|
|
||
See accompanying Notes to Combined Financial Statements
86
CAESARS ENTERTAINMENT OUTDOOR
(DEBTOR-IN-POSSESSION)
NOTES TO COMBINED FINANCIAL STATEMENTS
In these notes, the words “Caesars Entertainment Outdoor,” “Business,” “Outdoor Business,” “we,” “our,” and “us” refer to the business and operation of the golf courses listed in Note 1 that were wholly-owned by Caesars Entertainment Operating Company, Inc. through
October 5, 2017
.
“CEOC” refers to the Caesars Entertainment Operating Company, Inc. “CEC”, “Caesars” and “Caesars Entertainment” refer to Caesars Entertainment Corporation. On
October 6, 2017
(the “Formation Date”), CEOC merged with and into CEOC LLC, a Delaware limited liability company (“New CEOC”) with New CEOC surviving the merger.
We
also refer to (i) our Combined Financial Statements as our “Financial Statements,” (ii) our Combined Statements of Operations as our “Statements of Operations,” and (iii) our Combined Balance Sheets as our “Balance Sheets.”
Organization
Prior to the Formation Date, the Outdoor Business was a wholly-owned business of CEOC, and included the operations of the Cascata golf course in Boulder City, Nevada, the Rio Secco golf course in Henderson, Nevada, the Grand Bear golf course in Biloxi, Mississippi, and the Chariot Run golf course in Elizabeth, Indiana. Caesars Entertainment Golf, Inc., Rio Development Company, Inc., Grand Casinos of Biloxi, LLC, and Riverboat Casino, LLC, directly owned these golf courses, respectively, and were debtor-in-possession subsidiaries of CEOC.
The golf courses generate revenue through fees charged for general golf course usage (including green fees, golf club rentals, and cart charges), annual or corporate memberships (at Rio Secco, Grand Bear and Chariot Run), a school of golf (at Rio Secco), and food, beverage, and merchandise sales.
Bankruptcy
On
January 15, 2015
, CEOC and certain of its subsidiaries (the “Caesars Debtors”) voluntarily filed for relief under Chapter 11 of the United States Bankruptcy Code (the “Bankruptcy Code”) with the United States Bankruptcy Court for the Northern District of Illinois (the “Bankruptcy Court”). As a result of this filing, CEOC operated as a debtor-in-possession under the Bankruptcy Code. Because each of the
four
golf courses were owned by Caesars Debtor entities, the Outdoor Business was also considered a debtor-in-possession prior to the Formation Date. CEOC’s plan of reorganization (the “Plan”) was confirmed by the Bankruptcy Court on
January 17, 2017.
Transfer of Operations and Assets to VICI
On the Formation Date, pursuant to the Bankruptcy Plan, subsidiaries of CEOC contributed the ownership of the Business to VICI Properties Inc. (“VICI”). Following the Formation, the assets, liabilities and operations of the Business are now included in VICI Golf LLC (“VICI Golf”), a Delaware limited-liability company. VICI Golf is a wholly-owned subsidiary of VICI. VICI is a separate entity initially owned by certain former creditors of CEOC.
In addition, on the Formation Date, subsidiaries of VICI Golf, entered into a golf course use agreement (the “Golf Course Use Agreement”) with New CEOC and Caesars Enterprise Services, LLC (“CES”) (collectively, the “users”), whereby the users were granted certain priority rights and privileges with respect to access and use of certain golf course properties. Payments under the Golf Course Use Agreement are comprised of a
$10.0 million
annual membership fee,
$3.0 million
in annual use fees and minimum rounds fees of at least
$1.1 million
. The annual membership fee, use fees and minimum round fees are subject to an annual escalator beginning at the times provided under the Golf Course Use Agreement.
Basis of Presentation
The Business’ Financial Statements were prepared in accordance with accounting principles generally accepted in the United States (“GAAP”) and with the applicable rules and regulations of the Securities and Exchange Commission (“SEC”).
The Financial Statements were derived from the financial statements of CEOC, prepared on a “carve-out” basis, to present the financial position and results of operations of the Outdoor Business on a stand-alone basis. The legal entities that own the Grand Bear and the Chariot Run golf courses also include non-golf course operations that are excluded from these carve-out financial statements.
87
CAESARS ENTERTAINMENT OUTDOOR
(DEBTOR-IN-POSSESSION)
NOTES TO COMBINED FINANCIAL STATEMENTS (continued)
The Financial Statements include allocations of certain revenue amounts and general corporate expenses among affiliated entities. Such allocated revenue and expenses may not reflect the results we would have incurred if we had operated as a stand-alone company nor are they necessarily indicative of our future results. Management believes the assumptions and methodologies used in the allocation of these revenues and expenses are reasonable. Actual amounts could differ from those estimates.
Golf revenue from CEOC and Caesars' affiliates includes reimbursement for below market-rate golf tee times and free play for certain casino guests. Variable golf fees provided by CEOC and Caesars affiliates are based on revenue shortfalls necessary to cover the cost of maintaining the courses in appropriate playing conditions for casino guests. The variable fee is dependent upon the number of rounds played, the types of rounds played (market-rate or discounted rate), and costs incurred to allow the golf course to continue to offer golf as an amenity to its gaming customers. These reimbursements and adjustments are included in golf revenue in the Statements of Operations.
Each of the golf courses represents a separate operating segment and we aggregate all such operations into
one
reportable segment.
The Business’ Financial Statements reflect the application of ASC 852. This guidance requires that transactions and events directly associated with the reorganization be distinguished from the ongoing operations of the business. In addition, the guidance provides for changes in the accounting and presentation of liabilities.
Note 2 — Summary of Significant Accounting Policies
Cash
Cash consists of cash-on-hand and cash-in-bank.
Receivables
Accounts receivable are non-interest bearing and are initially recorded at cost. They include amounts for sponsorship and other golf tournament fees, amounts due for hosted private events, and amounts due from credit card clearing activities. The allowance for doubtful accounts is established and maintained based on our best estimate of accounts receivable collectibility. Management estimates collectibility by specifically analyzing accounts receivable aging, known troubled accounts and other historical factors that affect collections. Accounts are written off when management deems the account to be uncollectible. Recoveries of accounts previously written off are recorded into income when received. Trade receivables are due within one year or less and approximates fair value.
Allowance for Doubtful Accounts
|
(In thousands)
|
|||||||||||
|
2017
|
2016
|
2015
|
|||||||||
|
Balance as of January 1,
|
$
|
7
|
|
$
|
19
|
|
$
|
1
|
|
||
|
Charges (credits) to income
|
12
|
|
(10
|
)
|
31
|
|
|||||
|
Write-offs less recoveries
|
(11
|
)
|
(2
|
)
|
(13
|
)
|
|||||
|
Balance as of October 5, 2017; December 31, 2016; and December 31, 2015, respectively
|
$
|
8
|
|
$
|
7
|
|
$
|
19
|
|
||
Inventory
Inventory, which consists primarily of food and beverages and merchandise held for resale, is stated at the lower of cost or market. Losses on obsolete or excess inventory are not material.
Long-Lived Assets
The Business has significant capital invested in long-lived assets and judgments are made in determining their estimated useful lives and salvage values and if or when an asset (or asset group) has been impaired. The accuracy of these estimates affects the amount of depreciation and amortization expense recognized in the financial results and whether a gain or loss should be recognized on the disposal of an asset. Lives assigned to the assets are based on standard policy, established by management as representative of the useful life of each category of asset.
88
CAESARS ENTERTAINMENT OUTDOOR
(DEBTOR-IN-POSSESSION)
NOTES TO COMBINED FINANCIAL STATEMENTS (continued)
The carrying value of our long-lived assets is reviewed whenever events and circumstances indicate the carrying value of an asset may not be recoverable from the estimated future cash flows expected to result from its use and eventual disposition. The factors considered by management in performing this assessment may include current operating results, trends, prospects, as well as the effect of demand, competition, and other economic, legal, and regulatory factors. In estimating expected future cash flows for determining whether an asset is impaired, assets are grouped at the lowest level of identifiable cash flows, which in this case, is the four golf courses combined together as an asset group. These analyses are sensitive to management assumptions and the estimates of the obsolescence factors. Changes in these assumptions and estimates could have a material impact on the analyses and the Financial Statements. For the period from
January 1, 2017 to October 5, 2017
and the
years ended December 31, 2016 and 2015
, no impairment on long-lived assets was recorded.
Additions to property and equipment are stated at cost. Costs of improvements that extend the life of the asset are capitalized. Maintenance and repair costs are expensed as incurred. Gains or losses on the dispositions of property and equipment are recognized in the period of disposal. With respect to golf course improvements (included in land improvements), only costs associated with original construction, complete replacements of items such as tee boxes and putting greens, or the addition of new trees, sand traps, fairways or putting greens are capitalized. All other related costs are expensed as incurred. For building improvements, only costs that extend the useful life of the building are capitalized.
Certain land improvements include site preparations that prepare land for its intended use as a golf course. Like the land itself, these improvements are inexhaustible and therefore not depreciated. Examples include excavation, filling, grading and preparation of fairways and roughs. Depreciable land improvements are defined as improvements made to land that have determinable estimated useful lives and deteriorate with use or passage of time. These improvements were built or installed to enhance or facilitate the use of the land for a particular purpose. Depreciable land improvements associated with the golf courses include greens, bunkers, tee boxes, cart paths, fences and gates, landscaping and sprinkler systems.
Depreciation is calculated using the straight-line method over the shorter of the estimated useful life of the asset or the related lease, as follows:
|
Useful Lives
|
|
|
Land improvements
|
12-60 years
|
|
Buildings and leasehold improvements
|
40 years
|
|
Building improvements
|
5-15 years
|
|
Furniture, fixtures, and equipment
|
2-10 years
|
Leasehold improvements are amortized over the shorter of the term of the respective lease or their useful life using the straight-line method.
Liabilities Subject to Compromise
Under bankruptcy law, actions by creditors to collect amounts owed prior to the Petition Date are stayed and certain other prepetition contractual obligations may not be enforced against the companies that own the Business. Substantially all liabilities of the Debtors as of the Petition Date, except those paid under certain first day motions filed with the Bankruptcy Court, have been classified as liabilities subject to compromise in the Balance Sheets. Liabilities subject to compromise, including claims that became known after the bankruptcy petition was filed, are reported using our best estimates of the expected amount of the total allowed claim.
Revenue Recognition
Revenues from golf course operations, food and beverage and merchandise sales are recognized at the time of sale or when the service is provided and are reported net of sales tax. Golf memberships sold are typically to individuals and are not refundable and are deferred and recognized within golf revenue in the Statements of Operations over the expected life of an active membership, which is typically one year or less.
Included in golf revenue are market-rate fees received from public customers as well as discounted fees received from CEOC and Caesars-affiliated customers or associates. In addition, certain VIP casino guests play the golf courses for free. In these cases, the golf course receives amounts paid by CEOC and Caesars’ affiliates at an agreed upon rate for the free play provided to their VIP guests. The reimbursement for free play was approximately
$611,000
for the period
January 1, 2017 to October 5, 2017
, and
$620,000
and
$708,000
for the
years ended December 31, 2016 and 2015
, respectively.
89
CAESARS ENTERTAINMENT OUTDOOR
(DEBTOR-IN-POSSESSION)
NOTES TO COMBINED FINANCIAL STATEMENTS (continued)
There are additional variable golf fees provided by CEOC and Caesars’ affiliates based on revenue shortfalls necessary to cover the cost of operating the courses at a high level appropriate for casino guests. The variable fee is dependent upon the number of rounds played, the types of rounds played (market-rate or discounted rate), and costs incurred to allow the golf course to continue to offer golf as an amenity to its gaming customers. Variable golf fees included in golf revenue were approximately
$4,692,000
for the period
January 1, 2017 to October 5, 2017
and
$4,862,000
and
$3,669,000
for the
years ended December 31, 2016 and 2015
, respectively.
Advertising Expense
The golf courses are marketed through advertising and other promotional activities. Advertising expense is charged to income during the period incurred. Advertising expense totaled approximately
$63,000
for the period
January 1, 2017 to October 5, 2017
, and
$118,000
and
$74,000
for the
years ended December 31, 2016 and 2015
, respectively, and is included in Administrative and other in the Statements of Operations.
Property Costs
Property costs are charged to income during the period incurred and include land rent, utilities and general repairs and maintenance.
Income Taxes
Historically, the Outdoor Business has been included in the consolidated federal income tax return of Caesars, as well as certain state tax returns where Caesars or one of its subsidiaries files a state tax return. The provisions of ASC 740, “Income Taxes,” was applied and the provision for income taxes was computed on a separate return basis. The separate return method applies the accounting guidance for income taxes to the stand-alone combined Financial Statements as if the Business was a separate taxpayer and a stand-alone enterprise for the periods presented. As discussed in Note 7, these Financial Statements include certain allocations of income and expense amongst affiliated entities. The tax provision was calculated assuming such allocations were appropriate for income tax reporting purposes and do not include any transfer pricing adjustments with respect to such allocations. The calculation of income taxes on a separate return basis requires a considerable amount of judgment and use of both estimates and allocations. Management believes that the assumptions and estimates used to compute these tax amounts are reasonable. However, the Financial Statements may not necessarily reflect our income tax expense or tax payments in the future, or what tax amounts would have been if the Business had been a stand-alone enterprise during the periods presented.
Federal and state income taxes currently payable are settled though our net investment equity account. Certain taxes provided for are deferred because of temporary differences between reporting income and expenses for financial statement purposes versus tax purposes. Federal income tax credits are recorded as a reduction of income taxes. Deferred tax assets and liabilities are recognized for the future tax consequences attributable to differences between the financial statement carrying amounts of existing assets and liabilities and their respective tax bases. Deferred tax assets and liabilities are measured using enacted tax rates expected to apply to taxable income in the years in which those temporary differences are expected to be recovered or settled. The effect on deferred tax assets and liabilities of a change in tax rates is recognized in earnings in the period that includes the enactment date. Accruals for tax uncertainties are classified within other liabilities in our combined balance sheets. Amounts accrued relate to any potential income tax liabilities resulting from uncertain tax positions, as well as potential interest or penalties associated with those liabilities.
The Financial Accounting Standards Board (the “FASB”) issued the following authoritative guidance amending the FASB Accounting Standards Codification.
Business Combinations - January 2017
:
Updated amendments intend to clarify the definition of a business with the objective of adding guidance to assist entities with evaluating whether transactions should be accounted for as acquisition (or disposals) of assets or businesses. Amendments in this update provide a more robust framework to use in determining when a set of assets and activities is a business and to provide more consistency in applying the guidance, reduce the costs of application, and make the definition of a business more operable. The amendments are effective to annual periods beginning after December 15, 2017, including interim periods within those periods. Early adoption is allowed as follows: (1) Transactions for which acquisition date occurs before the issuance date or effective date of the amendments, only when the transaction has not been reported in Financial Statements that have been issued or made available for issuance and (2) transactions in which a subsidiary is deconsolidated or a group of assets is derecognized that occur before the issuance date or effective date of the amendments, only when the transaction
90
CAESARS ENTERTAINMENT OUTDOOR
(DEBTOR-IN-POSSESSION)
NOTES TO COMBINED FINANCIAL STATEMENTS (continued)
has not been reported in Financial Statements that have been issued or made available for issuance. The adoption of this standard could have a material impact on our Financial Statements should we have a future acquisition of a business.
Leases - February 2016 (amended January 2017)
:
The amended guidance requires most lease obligations to be recognized as a right-of-use asset with a corresponding liability on the balance sheet. The guidance also requires additional qualitative and quantitative disclosures to assess the amount, timing, and uncertainty of cash flows arising from leases. This guidance is effective for fiscal years, and interim periods within those fiscal years, beginning after December 15, 2018. The guidance should be implemented for the earliest period presented using a modified retrospective approach, which includes optional practical expedients primarily focused on leases that commence before the effective date. The qualitative and quantitative effects of adoption are still being analyzed. We are in the process of evaluating the full impact the new guidance will have on our Financial Statements.
Revenue from Contracts with Customers - May 2014 (amended January 2017)
:
The new guidance is intended to clarify the principles for recognizing revenue and to develop a common revenue standard for GAAP applicable to revenue transactions. Existing industry guidance will be eliminated. The FASB has recently issued several amendments to the standard, including clarification on accounting for and identifying performance obligations. This guidance is effective for annual reporting periods beginning after December 15, 2017, including interim periods within those reporting periods. The guidance should be applied using the full retrospective method or retrospectively with the cumulative effect initially applying the guidance recognized at the date of initial application. We are adopting this standard effective January 1, 2018, retrospectively, and determined that there will not be a material impact to our Financial Statements. The adoption of this guidance does not change the timing or process in which we recognize golf revenue.
Income Taxes - October 2016
:
Amended guidance that addresses intra-entity transfers of assets other than inventory, which requires the recognition of any related income tax consequences when such transfers occur. The amendments should be applied on a modified retrospective basis through a cumulative-effect adjustment directly to retained earnings as of the beginning of the period of adoption. Amendments are effective for fiscal years beginning after December 15, 2017, and interim reporting periods within those years. Early adoption is permitted. We do not expect this standard will have a material impact on our Financial Statements.
Statement of Cash Flows - August 2016
:
Amended guidance addresses eight specific cash flow issues with the objective of reducing diversity in how certain cash receipts and cash payments are presented and classified in the statement of cash flows. The amendments should be applied retrospectively to each period presented. The amendments are effective for fiscal years beginning after December 15, 2017, and interim periods within those fiscal years. Early adoption is permitted. We have adopted this standard for our October 5, 2017 Statement of Cash Flows.
|
(In thousands)
|
|||||||
|
October 5, 2017
|
December 31, 2016
|
||||||
|
Land and non-depreciable land improvements
|
$
|
35,525
|
|
$
|
35,525
|
|
|
|
Depreciable land improvements
|
40,183
|
|
40,174
|
|
|||
|
Buildings and improvements
|
35,153
|
|
35,133
|
|
|||
|
Furniture and equipment (including capital leases)
|
4,833
|
|
5,445
|
|
|||
|
Construction in progress
|
1,831
|
|
—
|
|
|||
|
Total property and equipment
|
117,525
|
|
116,277
|
|
|||
|
Less: accumulated depreciation
|
(29,216
|
)
|
(27,446
|
)
|
|||
|
Total property and equipment, net
|
$
|
88,309
|
|
$
|
88,831
|
|
|
|
(In thousands)
|
|||||||||||
|
Period from January 1, 2017 to October 5, 2017
|
Year Ended December 31, 2016
|
Year Ended December 31, 2015
|
|||||||||
|
Depreciation expense (including capital lease amortization)
|
$
|
2,445
|
|
$
|
3,030
|
|
$
|
2,882
|
|
||
91
CAESARS ENTERTAINMENT OUTDOOR
(DEBTOR-IN-POSSESSION)
NOTES TO COMBINED FINANCIAL STATEMENTS (continued)
|
(In thousands)
|
|||||||
|
October 5, 2017
|
December 31, 2016
|
||||||
|
Accrued utilities
|
$
|
269
|
|
$
|
87
|
|
|
|
Accrued real estate taxes and other taxes
|
166
|
|
130
|
|
|||
|
Advance deposits
|
102
|
|
112
|
|
|||
|
Deferred revenue
|
49
|
|
125
|
|
|||
|
Accrued legal and professional fees
|
41
|
|
23
|
|
|||
|
Payroll and other compensation
|
12
|
|
228
|
|
|||
|
Other accruals
|
8
|
|
—
|
|
|||
|
Total accrued expenses
|
$
|
647
|
|
$
|
705
|
|
|
In March 2015, the Bankruptcy Court entered an order establishing May 26, 2015 as the bar date for potential general creditors to file proofs of claims and established the required procedures with respect to filing such claims. A bar date is the deadline by which creditors must file a proof of claim against the Debtors for the claim to be allowed. In addition, a bar date of July 14, 2015 was established as a deadline for claims from governmental units.
As of
October 5, 2017
, the Business had received
55
proofs of claim, a portion of which assert, in part or in whole, unliquidated claims. These proofs of claims include
9
claims that were carved out of the legal entities that own the Business and that have additional claims, which do not correspond to the Business. In addition, the Business has been assigned by the court an additional
13
claims. In the aggregate, total asserted liquidated proofs of claim for approximately
$122.2 million
had been filed against or assigned to the Business. Based on reasonable current estimates, the Business expects to ask the Bankruptcy Court to disallow
19
claims representing approximately
$116.3 million
of such claims. These claims are classified by the Business as amended and replaced, duplicate, redundant or non-Caesars Debtor claims.
As of
October 5, 2017
and
December 31, 2016
, liabilities subject to compromise was approximately
$249,000
and
$265,000
, respectively, and consisted of accounts payable-related liabilities.
On
October 6, 2017
, the Business settled claims included in liabilities subject to compromise for
$125,000
recognizing a reorganization gain of
$124,000
. In addition, approximately
$5.1 million
of claims are still disputed and unresolved and have been transferred to New CEOC for final resolution.
|
Income Tax (Provision)/Benefit
|
|||||||||||
|
(In thousands)
|
|||||||||||
|
Period from January 1, 2017 to October 5, 2017
|
Year Ended December 31, 2016
|
Year Ended December 31, 2015
|
|||||||||
|
Current:
|
|||||||||||
|
Federal
|
$
|
(100
|
)
|
$
|
(111
|
)
|
$
|
(98
|
)
|
||
|
State
|
—
|
|
—
|
|
—
|
|
|||||
|
Deferred
|
98
|
|
111
|
|
101
|
|
|||||
|
Income Tax Benefit
|
$
|
(2
|
)
|
$
|
—
|
|
$
|
3
|
|
||
Since the Outdoor Business does not have a formal tax sharing agreement in place with Caesars Entertainment for federal income tax purposes, Caesars Entertainment pays all of the Outdoor Business’ federal income taxes. The Outdoor Business’ portion was approximately
$100,000
for the period
January 1, 2017 to October 5, 2017
and
$111,000
and
$98,000
for the years ended
December 31, 2016
and
2015
, respectively.
92
CAESARS ENTERTAINMENT OUTDOOR
(DEBTOR-IN-POSSESSION)
NOTES TO COMBINED FINANCIAL STATEMENTS (continued)
|
Income Tax Expense Reconciliation
|
|||||||||||
|
(In thousands)
|
|||||||||||
|
Period from January 1, 2017 to October 5, 2017
|
Year Ended December 31, 2016
|
Year Ended December 31, 2015
|
|||||||||
|
Expected federal tax at the statutory tax rate
|
$
|
—
|
|
$
|
—
|
|
$
|
—
|
|
||
|
Increases/(decreases) in tax resulting from:
|
|||||||||||
|
State taxes, net of federal tax benefit
|
—
|
|
—
|
|
—
|
|
|||||
|
Federal tax credits
|
—
|
|
—
|
|
3
|
|
|||||
|
Other
|
(2
|
)
|
—
|
|
—
|
|
|||||
|
Income tax (expense)/benefit
|
$
|
(2
|
)
|
$
|
—
|
|
$
|
3
|
|
||
|
Temporary Differences Resulting in Deferred Tax Assets and Liabilities
|
|||||||
|
(In thousands)
|
|||||||
|
As of October 5, 2017
|
As of December 31, 2016
|
||||||
|
Deferred tax assets:
|
|||||||
|
Federal net operating loss
|
$
|
5,561
|
|
$
|
5,847
|
|
|
|
State net operating loss
|
378
|
|
392
|
|
|||
|
Federal tax credits
|
82
|
|
82
|
|
|||
|
Other
|
8
|
|
9
|
|
|||
|
Subtotal
|
6,029
|
|
6,330
|
|
|||
|
Less: valuation allowance
|
1,930
|
|
1,930
|
|
|||
|
Total deferred tax assets
|
4,099
|
|
4,400
|
|
|||
|
Deferred tax liabilities:
|
|||||||
|
Depreciation and other property related items
|
(9,006
|
)
|
(9,423
|
)
|
|||
|
Accrued expenses
|
(37
|
)
|
(20
|
)
|
|||
|
Total deferred tax liabilities
|
(9,043
|
)
|
(9,443
|
)
|
|||
|
Net deferred tax liability
|
$
|
(4,944
|
)
|
$
|
(5,043
|
)
|
|
Deferred income taxes reflect the net tax effects of temporary differences between the carrying amounts of assets and liabilities for financial reporting purposes and the amounts used for income tax purposes.
As of
October 5, 2017
and
December 31, 2016
, we had federal NOL carryforwards of
$19.2 million
and
$20.1 million
, respectively. These NOL carryforwards will begin to expire in
2032
. In addition, we have federal general business tax credit carryforwards of approximately
$82 thousand
which will begin to expire in
2032
. As of
October 5, 2017
and
December 31, 2016
, we had state NOL carryforwards of
$15.1 million
and
$15.5 million
, respectively. These NOL carryforwards will begin to expire in
2032
.
|
Reconciliation of Unrecognized Tax Benefit
|
|||||||||||
|
(In thousands)
|
|||||||||||
|
Period from January 1, 2017 to October 5, 2017
|
Year Ended December 31, 2016
|
Year Ended December 31, 2015
|
|||||||||
|
Balance at beginning of period
|
$
|
1,309
|
|
$
|
1,309
|
|
$
|
1,309
|
|
||
|
Additions based on tax positions related to the current period
|
—
|
|
—
|
|
—
|
|
|||||
|
Balance at end of period
|
$
|
1,309
|
|
$
|
1,309
|
|
$
|
1,309
|
|
||
We classify reserves for tax uncertainties within accrued expenses and deferred credits and other in our balance sheets, separate from any related income tax payable or deferred income taxes. Reserve amounts related to potential income tax liabilities resulting from uncertain tax positions as well as potential interest or penalties associated with those liabilities.
93
CAESARS ENTERTAINMENT OUTDOOR
(DEBTOR-IN-POSSESSION)
NOTES TO COMBINED FINANCIAL STATEMENTS (continued)
We accrue interest and penalties related to unrecognized tax benefits in income tax expense. There were no adjustments to our accrual for the period ending
October 5, 2017
and the years ending
December 31, 2016
and
2015
, respectively, for accrued interest or penalties. There are no unrecognized tax benefits included in the balances of unrecognized tax benefits as of
October 5, 2017
,
December 31, 2016
and
2015
that, if recognized, would impact the effective tax rate.
We had transactions with CEOC resulting in net distributions of approximately
$1.0 million
for the period
January 1, 2017 to October 5, 2017
and
$1.2 million
and
$2.0 million
for the years ending
December 31, 2016
and
2015
, respectively. The net distributions are the result of cash generated by the operations of the Business and proceeds from the sale of assets, partially offset by amounts contributed by CEOC to fund capital improvements and capital lease obligations. These transactions are included as transactions with parent, net in our Combined Statements of Equity.
Related Party Fees and Expenses
The following amounts are recorded with respect to the related-party transactions described in this section:
|
(In thousands)
|
||||||||||||||
|
Transaction type
|
Recorded as:
|
Period from January 1, 2017 to October 5, 2017
|
Year Ended December 31, 2016
|
Year Ended December 31, 2015
|
||||||||||
|
Insurance expense
|
Administrative and other
|
$
|
37
|
|
$
|
45
|
|
$
|
55
|
|
||||
|
Allocation of indirect expenses from CEOC and Caesars’ affiliates
(1)
|
Administrative and other
|
214
|
|
330
|
|
318
|
|
|||||||
|
Golf revenue from CEOC and Caesars’ affiliates
(2)
|
Golf revenue
|
5,304
|
|
5,482
|
|
4,377
|
|
|||||||
|
Pass-through revenue with CEOC and Caesars’ affiliates
(3)
|
Golf revenue
|
382
|
|
871
|
|
769
|
|
|||||||
|
Food and beverage revenue
|
107
|
|
83
|
|
66
|
|
||||||||
|
Retail and other revenue
|
116
|
|
143
|
|
102
|
|
||||||||
_____________
|
(1)
|
The Statements of Operations include allocated overhead costs for certain functions historically performed by CEOC and Caesars’ affiliates, including allocations of direct and indirect operating and maintenance costs and expenses for procurement, logistics and general and administrative costs and expenses related to executive oversight, marketing, information technology, accounting, treasury, tax, and legal. These costs were allocated on the basis of either revenue or payroll costs.
|
|
(2)
|
See Summary of Significant Accounting Policies - Revenue Recognition.
|
|
(3)
|
Primarily includes transactions where CEOC and Caesars affiliates’ customers charge their golf, food and beverage and retail purchases directly to their hotel bill. Amounts collected from the customer by the hotel are remitted to the golf course.
|
Savings and Retirement Plans
CEOC maintains a defined contribution savings and retirement plan that allows certain employees of the Business to make pre-tax and after-tax contributions. Under the plan, participating employees may elect to contribute up to
50%
of their eligible earnings, subject to IRS rules and regulations, and are eligible to receive a company match of up to
$600
. Participating employees become vested in matching contributions on a pro-rata basis over five years of credited service. Our contribution expense, included in direct operating expenses and administrative and other expense, was approximately
$27,000
for the period
January 1, 2017 to October 5, 2017
and
$34,000
and
$39,000
for the years ended
December 31, 2016
and
2015
, respectively.
Litigation
The Business and its operations may be subject to litigation involving employment matters, personal injuries, and other matters that arise in the normal course of business. We do not expect the outcome of such ordinary and routine litigation to have a material effect on our combined financial position, results of operations, or cash flows.
94
CAESARS ENTERTAINMENT OUTDOOR
(DEBTOR-IN-POSSESSION)
NOTES TO COMBINED FINANCIAL STATEMENTS (continued)
Contingent Liabilities
In January 2015, a majority of the Trustees of the National Retirement Fund (“NRF”), a multi-employer defined benefit pension plan, voted to expel Caesars and certain of its affiliates from the plan. The NRF has advised Caesars and Caesars Entertainment Resort Properties, LLC (“CERP”) that this expulsion triggered a withdrawal liability with a present value of approximately
$360 million
, payable in
80
quarterly payments of about
$6 million
. The NRF filed a similar claim against each Caesars Debtor in CEOC’s bankruptcy. Although the Business’ employees did not participate in this plan, because the entities that own the Business are a member of the Caesars Group (as defined below), such entities are jointly and severally liable with Caesars and CEOC for any liability under the NRF’s claims.
On March 13, 2017, CEOC, CEC, CERP, the Caesars employers that contribute to the NRF, and the NRF and certain of its related parties entered into a settlement agreement resolving all issues related to the disputes with the NRF. Under the terms of the settlement, CEC, or a person on CEC’s behalf, was required to pay a total of
$45 million
to the NRF on the Formation
Date
.
Under the Caesars Debtors’ Plan, the NRF is barred from asserting any claims against the Company and its subsidiaries to the extent such claims arose prior to the Formation Date.
Operating Lease Commitments
The Business is liable under operating leases for land at the Cascata golf course, equipment and other miscellaneous assets, which expire at various dates through
2039
. Total rental expense under these agreements included in direct golf operating expenses and property costs in our Statements of Operations were approximately
$0.7 million
for the period
January 1, 2017 to October 5, 2017
and approximately
$1.0 million
for each of the years ended
December 31, 2016
and
2015
, respectively.
The future minimum lease commitments relating to the base lease rent portion of noncancelable operating leases at
October 5, 2017
are as follows:
|
(In thousands)
|
|||
|
Operating Leases
|
|||
|
2017
|
$
|
214
|
|
|
2018
|
873
|
|
|
|
2019
|
891
|
|
|
|
2020
|
908
|
|
|
|
2021
|
926
|
|
|
|
2022 and thereafter
|
18,911
|
|
|
|
Total minimum rental commitments
|
$
|
22,723
|
|
Other Commitments
The Business utilizes a third-party golf maintenance company for its Rio Secco and Cascata golf courses. The agreements are for five years and expire in
February 2019
and include all labor and equipment necessary to maintain both golf course grounds. Total expense under these agreements included in direct golf operating expenses in the Statements of Operations were approximately
$2.1 million
for the period
January 1, 2017 to October 5, 2017
and
$2.9 million
and
$2.8 million
for the years ended
December 31, 2016
and
2015
, respectively.
The future commitments relating to these agreements at
October 5, 2017
are as follows:
|
(In thousands)
|
|||
|
Maintenance Agreements
|
|||
|
2017
|
$
|
775
|
|
|
2018
|
2,969
|
|
|
|
2019
|
225
|
|
|
|
Total maintenance agreement commitments
|
$
|
3,969
|
|
95
COMBINED STATEMENT OF INVESTMENTS OF REAL ESTATE ASSETS TO BE CONTRIBUTED TO VICI PROPERTIES INC.
REPORT OF INDEPENDENT REGISTERED PUBLIC ACCOUNTING FIRM
To the Board of Directors
Caesars Entertainment Operating Company, Inc.
We have audited the accompanying combined statement of investments (the “combined statement”) of real estate assets to be contributed to VICI Properties Inc. as of December 31, 2016. Our audit also included the financial statement schedule listed in the Index to the financial statements. This combined statement and financial statement schedule are the responsibility of Caesars Entertainment Operating Company, Inc.’s (the “Company”) management. Our responsibility is to express an opinion on this combined statement and financial statement schedule based on our audit.
We conducted our audit in accordance with the standards of the Public Company Accounting Oversight Board (United States) and in accordance with auditing standards generally accepted in the United States of America. Those standards require that we plan and perform the audit to obtain reasonable assurance about whether the combined statement is free of material misstatement. The Company is not required to have, nor were we engaged to perform, an audit of its internal control over financial reporting. Our audit included consideration of internal control over financial reporting as a basis for designing audit procedures that are appropriate in the circumstances, but not for the purpose of expressing an opinion on the effectiveness of the Company’s internal control over financial reporting. Accordingly, we express no such opinion. An audit also includes examining, on a test basis, evidence supporting the amounts and disclosures in the combined statement, assessing the accounting principles used and significant estimates made by management, as well as evaluating the overall combined statement presentation. We believe that our audit provides a reasonable basis for our opinion.
In our opinion, such combined statement presents fairly, in all material respects, real estate assets to be contributed to VICI Properties Inc. as of December 31, 2016, in conformity with accounting principles generally accepted in the United States of America. Also, in our opinion, such financial statement schedule, when considered in relation to the basic combined statement taken as a whole, present fairly, in all material respects, the information set forth therein.
/s/ Deloitte & Touche, LLP
Las Vegas, Nevada
May 12, 2017
96
COMBINED STATEMENT OF INVESTMENTS OF REAL ESTATE ASSETS TO BE CONTRIBUTED TO VICI PROPERTIES INC.
|
(In millions)
|
December 31, 2016
|
|||
|
Assets
|
||||
|
Property, net
|
$
|
4,856.6
|
|
|
|
Total assets
|
$
|
4,856.6
|
|
|
See accompanying Notes to Combined Statement of Investments of Real Estate Assets to be Contributed to VICI Properties, Inc.
97
NOTES TO COMBINED STATEMENT OF INVESTMENTS OF REAL ESTATE ASSETS
TO BE CONTRIBUTED TO VICI PROPERTIES INC.
In these notes, we refer to the Combined Statement of Investments of Real Estate Assets to be Contributed to VICI Properties Inc. as the “Combined Statement of Investments of Real Estate Assets.”
Business Formation
Caesars Entertainment Operating Company, Inc. (“CEOC”) owns, operates and manages gaming and resort properties. On January 15, 2015, CEOC and certain of its subsidiaries (the “Debtors”) voluntarily filed for reorganization under Chapter 11 of the United States Bankruptcy Code (the “Bankruptcy Code”) with the United States Bankruptcy Court for the Northern District of Illinois (the “Bankruptcy Court”). As a result of this filing, CEOC operates as a debtor-in-possession under the Bankruptcy Code. CEOC’s plan of reorganization (the “Plan”) was confirmed by the Bankruptcy Court on January 17,
2017.
VICI Properties Inc. (“VICI REIT”) was organized as a limited liability company in Delaware on July 5, 2016 and was subsequently converted to a corporation under the laws of the State of Maryland. VICI REIT intends to elect to be treated as a “real estate investment trust” (“REIT”) for federal income tax purposes. CEOC intends to engage in a series of transactions in connection with its emergence from bankruptcy in which subsidiaries of CEOC will transfer certain real estate assets (the “Properties”) and the assets and operations comprising CEOC’s historical golf course business (the “Caesars Entertainment Outdoor”) to VICI REIT (the “Transactions”). Following effectiveness of the Plan, VICI REIT will be an owner, acquirer and developer of gaming, hospitality and entertainment destinations.
The accompanying Combined Statement of Investments of Real Estate Assets reflects certain owned real estate gaming and related facilities that will be transferred from CEOC to VICI REIT upon effectiveness of the Plan.
Basis of Presentation
The accompanying Combined Statement of Investments of Real Estate Assets reflects the assets directly attributable to CEOC’s real estate holdings to be owned by VICI REIT, with the exception of the four golf course businesses. The Combined Statement of Investments of Real Estate Assets is combined on the basis of common control and is prepared in conformity with accounting principles generally accepted in the United States of America (“GAAP”). Management believes the assumptions underlying the Combined Statement of Investments of Real Estate Assets are reasonable; however, the Combined Statement of Investments of Real Estate Assets may not necessarily reflect VICI REIT’s financial position in the future or what their financial position would have been had VICI REIT operated as a stand-alone company.
The Properties
|
Bally’s Atlantic City
|
|
Harrah’s Reno
|
|
Bluegrass Downs
|
|
Harvey’s Lake Tahoe
|
|
Caesars Atlantic City
|
|
Horseshoe Bossier City
|
|
Caesars Palace Las Vegas
|
|
Horseshoe Council Bluffs
|
|
Harrah’s Gulf Coast
|
|
Horseshoe Hammond
|
|
Harrah’s Council Bluffs
|
|
Horseshoe Southern Indiana
|
|
Harrah’s Joliet
|
|
Horseshoe Tunica
|
|
Harrah’s Lake Tahoe
|
|
Louisiana Downs
|
|
Harrah’s Metropolis
|
|
Tunica Roadhouse
|
|
Harrah’s North Kansas City
|
|
Other property
(1)
|
___________________________
(1)
Consists primarily of miscellaneous vacant land holdings.
98
NOTES TO COMBINED STATEMENT OF INVESTMENTS OF REAL ESTATE ASSETS
TO BE CONTRIBUTED TO VICI PROPERTIES INC. (CONTINUED)
Going Concern
The Combined Statement of Investments of Real Estate Assets has been prepared on a going concern basis. The following information reflects the results of management’s assessment of VICI REIT’s ability to continue as a going concern.
Although the Plan was confirmed by order of the Bankruptcy Court on January 17, 2017, several issues must be resolved before CEOC successfully emerges from bankruptcy. VICI REIT’s ability to continue as a going concern is dependent upon CEOC’s ability to restructure its indebtedness and emerge from bankruptcy. The Debtors’ emergence from bankruptcy is still subject to numerous conditions and third party approvals, including a favorable resolution to the continued ability to use cash collateral. These uncertainties raise substantial doubt about VICI REIT’s ability to continue as a going concern. The Combined Statement of Investments of Real Estate Assets does not include any adjustments that might result from the outcome of uncertainties. There can be no assurance that the restructuring of the Debtors will be completed as contemplated in the Plan.
Long-Lived Assets
We have significant capital invested in our long-lived assets, and judgments are made in determining their estimated useful lives and salvage values and if or when an asset (or asset group) has been impaired. The accuracy of these estimates affects the amount of depreciation and amortization expense recognized in our financial results and whether we have a gain or loss on the disposal of an asset. We assign lives to our assets based on our standard policy, which is established by management as representative of the useful life of each category of asset.
We review the carrying value of our long-lived assets whenever events and circumstances indicate that the carrying value of an asset may not be recoverable from the estimated future cash flows expected to result from its use and eventual disposition. Other factors considered by management in performing this assessment may include current operating results, trends, prospects, and third-party appraisals, as well as the effect of demand, competition, and other economic, legal, and regulatory factors. In estimating expected future cash flows for determining whether an asset is impaired, assets are grouped at the lowest level of identifiable cash flows, which, for most of our assets, is the individual property. We typically estimate the fair value of assets starting with a “Replacement Cost New” approach and then deduct appropriate amounts for both functional and economic obsolescence to arrive at the fair value estimates. These analyses are sensitive to management assumptions and the estimates of the obsolescence factors. Changes in these assumptions and estimates could have a material impact on the analyses and the Combined Statement of Investments of Real Estate Assets.
Land is recorded at cost and buildings are recorded at cost, less accumulated depreciation. Additions to property and equipment are stated at cost. We capitalize the costs of improvements that extend the life of the asset. We expense maintenance and repair costs as incurred. Gains or losses on the dispositions of property and equipment are recognized in the period of disposal.
Depreciation is calculated using the straight-line method over the shorter of the estimated useful life of the asset or the related lease as follows:
|
Land improvements
|
12 years
|
|
Building and improvements
|
5 to 40 years
|
|
(In millions)
|
December 31, 2016
|
|||
|
Land and improvements
|
$
|
2,492.6
|
|
|
|
Building and improvements
|
3,571.7
|
|
||
|
Total property
|
6,064.3
|
|
||
|
Less: accumulated depreciation
|
(1,207.7
|
)
|
||
|
Total property, net
|
$
|
4,856.6
|
|
|
99
Following the Transactions, all of the real estate holdings of VICI REIT (other than Caesars Entertainment Outdoor) will be leased to CEOC, and substantially all of VICI REIT’s revenues will be derived from the leases with CEOC. Other than VICI REIT having a single tenant from which it will derive substantially all of its revenue, management does not believe there are any other significant concentrations of credit risk.
Events subsequent to December 31, 2016 were evaluated through May 12, 2017, the date this audited Combined Statement of Investments of Real Estate Assets was available to be issued, and no events were identified requiring further disclosure.
100
None.
Disclosure Controls and Procedures
We maintain disclosure controls and procedures designed to provide reasonable assurance that information required to be disclosed in reports filed under the Securities Exchange Act of 1934, as amended (the “Exchange Act”), is recorded, processed, summarized and reported within the specified time periods and accumulated and communicated to our management, including our principal executive officer and principal financial officer, as appropriate, to allow timely decisions regarding required disclosure. Our management, with the participation of our principal executive officer and principal financial officer, evaluated the effectiveness of our disclosure controls and procedures (as defined in Rules 13a-15(e) or 15d-15(e) promulgated under the Exchange Act) at December 31, 2017. Based on this evaluation required by paragraph (b) of Rules 13a-15 or 15d-15, our principal executive officer and principal financial officer concluded that our disclosure controls and procedures were effective as of December 31, 2017.
Based on this evaluation, our principal executive officer and principal financial officer concluded that the Company's disclosure controls and procedures were effective as of December 31, 2017 to ensure that information required to be disclosed by the Company in the reports that we file or submit under the Exchange Act is (i) recorded, processed, summarized and reported within the time periods specified in the SEC’s rules and forms and (ii) accumulated and communicated to the Company's management, including the Company's principal executive officer and principal financial officer, as appropriate to allow timely decisions regarding required disclosures.
Management's Report on Internal Control over Financial Reporting
This Annual Report on Form 10-K does not include a report of management's assessment regarding internal control over financial reporting or an attestation report of our company's registered public accounting firm due to a transition period established by the rules of the Securities and Exchange Commission for newly public companies.
Changes in Internal Control Over Financial Reporting
The Company’s internal control over financial reporting was established in conjunction with the Formation of the Company in October 2017. There has been no change in our internal control over financial reporting during the quarter ended December 31, 2017 that has materially affected, or is reasonably likely to materially affect, our internal control over financial reporting.
None.
We have adopted a Code of Business Conduct that applies to our principal executive officer, principal financial officer and principal accounting officer, and have posted the Code on our website at www.viciproperties.com. In the event that we have any amendments to or waivers from any provision of the Code applicable to our principal executive officer, principal financial officer or principal accounting officer, we intend to satisfy the disclosure requirement under Item 5.05 of Form 8-K by posting such information on our website.
The information required by this item is incorporated herein by reference to the Company's definitive proxy statement for its 2018 Annual Meeting of Shareholders (the "2018 Proxy Statement"), which we expect will be filed with the SEC within 120 days after December 31, 2017 pursuant to Regulation 14A under the Securities Act. If such proxy statement is not filed within 120 days after
101
December 31, 2017, the information called for by this item will be filed as part of an amendment to this Annual Report on Form 10-K on or before such date.
The information required by this item is incorporated herein by reference to our 2018 Proxy Statement, which we expect will be filed with the SEC within 120 days after December 31, 2017. If such proxy statement is not filed within 120 days after December 31, 2017, the information called for by this item will be filed as part of an amendment to this Annual Report on Form 10-K on or before such date.
The information required by this item is incorporated herein by reference to our 2018 Proxy Statement, which we expect will be filed with the SEC within 120 days after December 31, 2017. If such proxy statement is not filed within 120 days after December 31, 2017, the information called for by this item will be filed as part of an amendment to this Annual Report on Form 10-K on or before such date.
Equity Compensation Plan Information
The following table summarizes information as of December 31, 2017, relating to equity compensation plans of the Company pursuant to which shares of our common stock are authorized for issuance:
|
Plan Category
|
Number of securities to be issued upon exercise of outstanding options, warrants and rights
|
Weighted average exercise price of outstanding options, warrants and rights
|
Number of securities available for future issuance under equity compensation plans
|
|||||||||
|
Equity compensation plans approved by shareholders
|
||||||||||||
|
Restricted stock
|
174,572
|
|
$
|
—
|
|
N/A
|
|
|||||
|
Equity compensation plans not approved by shareholders
|
—
|
|
—
|
|
—
|
|
||||||
|
Total
|
174,572
|
|
$
|
—
|
|
12,575,428
|
|
(1)
|
||||
(1)
A combined total of 12,750,000 shares of common stock may be issued under the Company’s 2017 Stock Incentive Plan.
The information required by this item is incorporated herein by reference to our 2018 Proxy Statement, which we expect will be filed with the SEC within 120 days after December 31, 2017. If such proxy statement is not filed within 120 days after December 31, 2017, the information called for by this item will be filed as part of an amendment to this Annual Report on Form 10-K on or before such date.
The information required by this item is incorporated herein by reference to our 2018 Proxy Statement, which we expect will be filed with the SEC within 120 days after December 31, 2017. If such proxy statement is not filed within 120 days after December 31, 2017, the information called for by this item will be filed as part of an amendment to this Annual Report on Form 10-K on or before such date.
102
(a)(1).
Financial Statements.
Included in Part II of this Report:
|
VICI Properties Inc.:
|
|||
|
Period from October 6 to December 31, 2017
|
|||
|
Caesars Entertainment Outdoor:
|
|||
|
Period from January 1 to October 5, 2017 and Years Ended December 31, 2016 and 2015
|
|||
|
Combined Statement of Investments of Real Estate Assets to be Contributed to VICI Properties Inc.:
|
|||
(a)(2).
Financial Statement Schedules.
(a)(3).
Exhibits.
|
Incorporated by Reference
|
||||||||||
|
Exhibit
Number |
Exhibit Description
|
Filed Herewith
|
Form
|
Exhibit
|
Filing Date
|
|||||
|
2.1
|
T-3/A of VICI Properties 1 LLC
|
T3E-2
|
8/11/2017
|
|||||||
|
2.2
|
8-K
|
2.1
|
10/11/2017
|
|||||||
|
3.1
|
8-K
|
3.1
|
10/11/2017
|
|||||||
103
|
3.2
|
8-K
|
3.2
|
10/11/2017
|
|||||||
|
4.1
|
8-K
|
4.1
|
10/11/2017
|
|||||||
|
4.2
|
8-K
|
4.2
|
10/11/2017
|
|||||||
|
4.3
|
8-K
|
4.3
|
10/11/2017
|
|||||||
|
4.4
|
S-11/A
|
4.5
|
1/17/2018
|
|||||||
|
10.1
|
8-K
|
10.1
|
10/11/2017
|
|||||||
|
10.2
|
8-K
|
10.2
|
10/11/2017
|
|||||||
|
10.3
|
8-K
|
10.3
|
10/11/2017
|
|||||||
|
10.4
|
8-K
|
10.4
|
10/11/2017
|
|||||||
|
10.5
|
8-K
|
10.5
|
10/11/2017
|
|||||||
|
10.6
|
8-K
|
10.6
|
10/11/2017
|
|||||||
|
10.7
|
8-K
|
10.7
|
10/11/2017
|
|||||||
|
10.8
|
8-K
|
10.9
|
10/11/2017
|
|||||||
104
|
10.9
|
8-K
|
10.10
|
10/11/2017
|
|||||||
|
10.10
|
8-K
|
10.11
|
10/11/2017
|
|||||||
|
10.11
|
8-K
|
10.12
|
10/11/2017
|
|||||||
|
10.12
|
8-K
|
10.13
|
10/11/2017
|
|||||||
|
10.13
|
8-K
|
10.14
|
10/11/2017
|
|||||||
|
10.14
|
8-K
|
10.15
|
10/11/2017
|
|||||||
|
10.15
|
8-K
|
10.16
|
10/11/2017
|
|||||||
|
10.16
|
8-K
|
10.17
|
10/11/2017
|
|||||||
|
10.17
|
8-K
|
10.18
|
10/11/2017
|
|||||||
|
10.18
|
|
8-K
|
10.19
|
10/11/2017
|
||||||
|
10.19
|
8-K
|
10.20
|
10/11/2017
|
|||||||
|
10.20
|
|
8-K
|
10.21
|
10/11/2017
|
||||||
105
|
10.21
|
8-K
|
10.22
|
10/11/2017
|
|||||||
|
10.22
|
8-K
|
10.23
|
10/11/2017
|
|||||||
|
10.23
|
|
10
|
10.20
|
9/28/2017
|
||||||
|
10.24†
|
8-K
|
10.25
|
10/11/2017
|
|||||||
|
10.25†
|
8-K
|
10.26
|
10/11/2017
|
|||||||
|
10.26†
|
8-K
|
10.27
|
10/11/2017
|
|||||||
|
10.27†
|
8-K
|
10.28
|
10/11/2017
|
|||||||
|
10.28
|
8-K
|
10.1
|
11/30/2017
|
|||||||
|
10.29
|
8-K
|
10.2
|
11/30/2017
|
|||||||
|
10.30
|
8-K
|
10.3
|
11/30/2017
|
|||||||
|
10.31
|
8-K
|
10.4
|
11/30/2017
|
|||||||
|
10.32
|
8-K
|
10.1
|
12/26/2017
|
|||||||
|
10.33
|
8-K
|
10.2
|
12/26/2017
|
|||||||
|
10.34†
|
S-11/A
|
10.32
|
1/17/2018
|
|||||||
|
10.35†
|
S-11/A
|
10.33
|
1/17/2018
|
|||||||
|
10.36
|
S-11/A
|
10.36
|
1/17/2018
|
|||||||
|
10.37
|
S-11/A
|
10.37
|
1/17/2018
|
|||||||
|
10.38
|
S-11/A
|
10.38
|
1/17/2018
|
|||||||
|
10.39†
|
X
|
|||||||||
106
|
21.1
|
X
|
|||||||||
|
23.1
|
X
|
|||||||||
|
23.2
|
X
|
|||||||||
|
23.3
|
X
|
|||||||||
|
24.1
|
X
|
|||||||||
|
31.1
|
X
|
|||||||||
|
31.2
|
X
|
|||||||||
|
32.1
|
*
|
|||||||||
|
32.2
|
*
|
|||||||||
|
101.INS
|
XBRL Instance Document
|
X
|
||||||||
|
101.SCH
|
XBRL Taxonomy Extension Schema Document
|
X
|
||||||||
|
101.CAL
|
XBRL Taxonomy Extension Calculation Linkbase Document
|
X
|
||||||||
|
101.DEF
|
XBRL Taxonomy Extension Definition Linkbase Document
|
X
|
||||||||
|
101.LAB
|
XBRL Taxonomy Extension Label Linkbase Document
|
X
|
||||||||
|
101.PRE
|
XBRL Taxonomy Extension Presentation Linkbase Document
|
X
|
||||||||
* Furnished herewith.
† Management contracts and compensation plans and arrangements.
107
Schedule I
CONDENSED FINANCIAL INFORMATION OF REGISTRANT PARENT COMPANY ONLY
VICI PROPERTIES INC.
CONDENSED BALANCE SHEET
(AMOUNTS IN THOUSANDS)
|
December 31, 2017
|
|||
|
Assets
|
|||
|
Cash and cash equivalents
|
$
|
119,117
|
|
|
Due from affiliates
|
57,573
|
|
|
|
Investment in subsidiaries
|
9,545,013
|
|
|
|
Total assets
|
$
|
9,721,703
|
|
|
Liabilities
|
|||
|
Due to affiliates
|
155,001
|
|
|
|
Total liabilities
|
155,001
|
|
|
|
Shareholders’ equity
|
|||
|
Common stock, $0.01 par value, 700,000,000 shares authorized and 300,278,939 shares issued and outstanding at December 31, 2017
|
3,003
|
|
|
|
Preferred stock, $0.01 par value, 50,000,000 shares authorized, 12,000,000 shares issued and no shares outstanding at December 31, 2017
|
—
|
|
|
|
Additional paid in capital
|
9,563,417
|
|
|
|
Retained earnings
|
282
|
|
|
|
Total shareholders' equity
|
9,566,702
|
|
|
|
Total liabilities and shareholders’ equity
|
$
|
9,721,703
|
|
See accompanying Notes to Condensed Financial Information
108
Schedule I
CONDENSED FINANCIAL INFORMATION OF REGISTRANT PARENT COMPANY ONLY
VICI PROPERTIES INC.
CONDENSED STATEMENT OF OPERATIONS
(AMOUNTS IN THOUSANDS)
|
Period from October 6 to December 31, 2017
|
|||
|
Interest income
|
$
|
282
|
|
|
Income before income taxes
|
282
|
|
|
|
Income taxes
|
—
|
|
|
|
Net income
|
$
|
282
|
|
See accompanying Notes to Condensed Financial Information
109
Schedule I
CONDENSED FINANCIAL INFORMATION OF REGISTRANT PARENT COMPANY ONLY
VICI PROPERTIES INC.
CONDENSED STATEMENT OF CASH FLOWS
(AMOUNTS IN THOUSANDS)
|
Period from October 6 to December 31, 2017
|
||||
|
Cash flows from operating activities
|
||||
|
Net income
|
$
|
282
|
|
|
|
Change in operating assets and liabilities:
|
||||
|
Change in intercompany balances, net
|
98,813
|
|
||
|
Cash flows from operating activities
|
99,095
|
|
||
|
Cash flows from investing activities
|
||||
|
Investment in subsidiary
|
(1,000,000
|
)
|
||
|
Cash flows used in investing activities
|
(1,000,000
|
)
|
||
|
Cash flows from financing activities
|
||||
|
Proceeds from private placement of common stock
|
964,376
|
|
||
|
Mandatory debt conversion costs
|
(13
|
)
|
||
|
Cash flows provided by financing activities
|
964,363
|
|
||
|
Net increase in cash and cash equivalents
|
63,458
|
|
||
|
Cash, cash equivalents and restricted cash, beginning of period
|
55,659
|
|
||
|
Cash, cash equivalents and restricted cash, end of period
|
$
|
119,117
|
|
|
See accompanying Notes to Condensed Financial Information
110
Schedule I
CONDENSED FINANCIAL INFORMATION OF REGISTRANT PARENT COMPANY ONLY
VICI PROPERTIES INC.
NOTES TO CONDENSED FINANCIAL INFORMATION
|
1.
|
Background and Basis of Presentation
|
The condensed parent company financial information have been prepared in accordance with Rule 12-04, Schedule 1 of Regulation S-X, as the restricted net assets of VICI Properties Inc. and its subsidiaries exceed 25% of the consolidated net assets of VICI Properties Inc. and its subsidiaries (the “Company”). This information should be read in conjunction with the Company’s consolidated financial statements included elsewhere in this filing.
|
2.
|
Restricted net assets of subsidiaries
|
Certain of the Company’s subsidiaries have restrictions on their ability to pay dividends or make intercompany loans and advances pursuant to financing arrangements and regulatory restrictions. The amount of restricted net assets the Company’s consolidated subsidiaries held as of December 31, 2017 was approximately
$1.5 billion
.
|
3.
|
Commitments, contingencies, and long-term obligations
|
For a discussion of the Company’s commitments, contingencies, and long-term obligations under its senior secured credit facilities, see Note 11 of the Company’s consolidated financial statements.
111
SCHEDULE III
REAL ESTATE ASSETS AND ACCUMULATED DEPRECIATION
December 31, 2017
(in thousands)
|
Acquisition Costs
|
Costs Capitalized Subsequent to Acquisition
|
Gross Amount at Which Carried at Close of Period
|
||||||||||||||||||||||||||||||||||||||
|
Description
|
Location
|
Encumbrances
|
Land and Improvements
|
Building and Improvements
|
Land and Improvements
|
Building and Improvements
|
Land and Improvements
|
Building and Improvements
|
Total (a)
|
Accumulated Depreciation
|
Date Acquired
|
Useful Life
|
||||||||||||||||||||||||||||
|
Caesars Palace Land
|
Las Vegas, Nevada
|
(b) (c)
|
$
|
1,000,000
|
|
$
|
—
|
|
$
|
—
|
|
$
|
—
|
|
$
|
1,000,000
|
|
$
|
—
|
|
$
|
1,000,000
|
|
$
|
—
|
|
10/6/2017
|
N/A
|
||||||||||||
|
Vacant Land Parcels
|
Various
|
(d)
|
110,400
|
|
—
|
|
—
|
|
—
|
|
110,400
|
|
—
|
|
110,400
|
|
—
|
|
10/6/2017
|
N/A
|
||||||||||||||||||||
|
Eastside Property (c)
|
Las Vegas, Nevada
|
73,600
|
|
—
|
|
—
|
|
—
|
|
73,600
|
|
—
|
|
73,600
|
|
—
|
|
10/6/2017
|
N/A
|
|||||||||||||||||||||
|
$
|
1,184,000
|
|
$
|
—
|
|
$
|
—
|
|
$
|
—
|
|
$
|
1,184,000
|
|
$
|
—
|
|
$
|
1,184,000
|
|
$
|
—
|
|
|||||||||||||||||
|
(a) As discussed further in Note 2
—
Summary of Significant Accounting Policies, the Lease Agreements are bifurcated between operating leases and direct financing leases, resulting in land that is subject to operating lease treatment being recorded as a Real Estate Investments accounted for using the operating method on the Company's Balance Sheet and included in this Schedule III. Building assets that triggered direct financing lease treatment are recorded Investment in direct financing leases, net on the Company's Balance Sheet and are not included in this Schedule III.
|
||||||||||||||||||||||||||||||||||||||||
|
(b) Pledged to secure obligations under the CPLV CMBS Debt
|
||||||||||||||||||||||||||||||||||||||||
|
(c) Pledged to secure obligations under the Senior Secured Credit Facilities
|
||||||||||||||||||||||||||||||||||||||||
|
(d) The transaction to sell the Eastside Property to a subsidiary of Caesars closed on December 22, 2017. Due to a put/call option on the land parcels, it was determined that the transaction does not meet the requirements of a completed sale for accounting purposes. As a result, we reclassified $73.6 million from Real estate investments accounted for using the operating method to Land.
|
||||||||||||||||||||||||||||||||||||||||
A summary of activity for real estate assets and accumulated depreciation for the period October 6, 2017 through December 31, 2017 is as follows:
|
Real Estate
|
Accumulated Depreciation
|
||||||||
|
Balance as of October 6, 2017
|
$
|
1,184,000
|
|
$
|
—
|
|
|||
|
Additions
|
—
|
|
—
|
|
|||||
|
Disposals
|
—
|
|
—
|
|
|||||
|
Depreciation expense
|
—
|
|
—
|
|
|||||
|
Balance as of December 31, 2017
|
$
|
1,184,000
|
|
$
|
—
|
|
|||
112
None.
113
SIGNATURES
Pursuant to the requirements of Section 13 or 15(d) of the Securities Exchange Act of 1934, the registrant has duly caused this report to be signed on its behalf by the undersigned, thereunto duly authorized.
|
VICI PROPERTIES INC.
|
||
|
March 28, 2018
|
By:
|
/S/ EDWARD BALTAZAR PITONIAK
|
|
Edward Baltazar Pitoniak
|
||
|
Chief Executive Officer and Director
|
||
POWER OF ATTORNEY
Each of the officers and directors of VICI Properties Inc., whose signature appears below, in so signing, also makes, constitutes and appoints each of Edward Pitoniak, David Kieske and Kenneth Kuick, and each of them, his or her true and lawful attorneys-in-fact, with full power and substitution, for him or her in any and all capacities, to execute and cause to be filed with the SEC any and all amendments to this Annual Report on Form 10-K, with exhibits thereto and all other documents connected therewith and to perform any acts necessary to be done in order to file such documents, and hereby ratifies and confirms all that said attorneys-in-fact or their substitute or substitutes may do or cause to done by virtue hereof.
Pursuant to the requirements of the Securities Exchange Act of 1934, this report has been signed below by the following persons on behalf of the registrant and in the capacities and on the dates indicated.
|
Signature
|
Title
|
Date
|
||
|
/S/ EDWARD BALTAZAR PITONIAK
|
Chief Executive Officer and Director
|
March 28, 2018
|
||
|
Edward Baltazar Pitoniak
|
(Principal Executive Officer)
|
|||
|
/S/ DAVID KIESKE
|
Chief Financial Officer
|
March 28, 2018
|
||
|
David Kieske
|
(Principal Financial Officer)
|
|||
|
/S/ KENNETH J. KUICK
|
Chief Accounting Officer
|
March 28, 2018
|
||
|
Kenneth J. Kuick
|
(Principal Accounting Officer)
|
|||
|
/S/ JAMES ROBERT ABRAHAMSON
|
Chair of the Board of Directors
|
March 28, 2018
|
||
|
James Robert Abrahamson
|
||||
|
/S/ EUGENE IRWIN DAVIS
|
Director
|
March 28, 2018
|
||
|
Eugene Irwin Davis
|
||||
|
/S/ ERIC LITTMANN HAUSLER
|
Director
|
March 28, 2018
|
||
|
Eric Littmann Hausler
|
||||
|
/S/ ELIZABETH I. HOLLAND
|
Director
|
March 28, 2018
|
||
|
Elizabeth I. Holland
|
||||
|
/S/ CRAIG MACNAB
|
Director
|
March 28, 2018
|
||
|
Craig Macnab
|
||||
|
/S/ MICHAEL DAVID RUMBOLZ
|
Director
|
March 28, 2018
|
||
|
Michael David Rumbolz
|
||||
114
TABLE OF CONTENTS
Part IItem 1. BusinessItem 1A. Risk FactorsItem 1B. Unresolved Staff CommentsItem 2. PropertiesItem 3. Legal ProceedingsItem 4. Mine Safety DisclosuresPart IIItem 5. Market For The Company S Common Equity, Related Shareholder Matters and Issuer Purchases Of Equity SecuritiesItem 6. Selected Financial DataItem 7. Management S Discussion and Analysis Of Financial Condition and Results Of OperationsItem 7A. Quantitative and Qualitative Disclosures About Market RiskItem 8. Financial Statements and Supplementary DataNote 1 Business Formation and Basis Of PresentationNote 2 Summary Of Significant Accounting PoliciesNote 3 Recently Issued Accounting PronouncementsNote 4 Fresh-start ReportingNote 5 Property TransactionsNote 6 Investment in Direct Financing Leases, Net and Real Estate InvestmentsNote 7 Property and Equipment Used in Operations, NetNote 8 Accounts Payable and Accrued ExpensesNote 9 DebtNote 10 Fair ValueNote 11 Commitments and Contingent LiabilitiesNote 12 Shareholders' EquityNote 13 Earnings Per ShareNote 14 Share-based CompensationNote 15 Income TaxesNote 16 Segment InformationNote 17 Subsequent EventsNote 18 Quarterly Results Of Operations (unaudited)Note 1 Business and Basis Of PresentationNote 4 Property and Equipment, NetNote 5 Accrued ExpensesNote 6 Liabilities Subject To CompromiseNote 7 Income TaxesNote 8 Related Party TransactionsNote 9 Litigation, Contractual Commitments and Contingent LiabilitiesNote 3 Property, NetNote 4 Concentration Of Credit RisksNote 5 Subsequent EventsItem 9. Changes in and Disagreements with Accountants on Accounting and Financial DisclosureItem 9A. Controls and ProceduresItem 9B. Other InformationPart IIIItem 10. Directors, Executive Officers and Corporate GovernanceItem 11. Executive CompensationItem 12. Security Ownership Of Certain Beneficial Owners and Management and Related Stockholder MattersItem 13. Certain Relationships and Related Transactions and Director IndependenceItem 14. Principal Accounting Fees and ServicesPart IVItem 15. Exhibits and Financial Statement SchedulesItem 16. Form 10-k Summary