|
|
|
|
|
|
|
|
|
|
|
|
|
|
|
|
|
|
|
|
|
|
|
|
|
|
|
|
|
|
|
|
|
|
|
|
|
|
|
|
|
|
|
|
|
|
|
|
|
|
|
|
|
Table of Contents
|
New Jersey
|
20-8579133 | |
|
(State or other jurisdiction of incorporation or organization)
|
(I.R.S. Employer Identification No.) |
| Title of each class | Name of each exchange on which registered | |
|
Common Stock, $1 par value
|
New York Stock Exchange |
|
Large accelerated filer X
|
Accelerated filer | |
|
Non-accelerated filer
|
Smaller reporting company |
|
Aggregate market value of voting stock held by non-affiliates as
of June 30, 2010:
|
$5,602,210,475 | |
|
Number of shares of common stock, $1.00 par value,
outstanding as of February 21, 2011:
|
129,057,358 |
FISCAL YEAR ENDED DECEMBER 31, 2010
| PART | ITEM | PAGE | ||||||
|
I
|
1 | 2 | ||||||
| 1A | 14 | |||||||
| 1B | 18 | |||||||
| 2 | 18 | |||||||
| 3 | 21 | |||||||
| 4 | 22 | |||||||
|
II
|
5 | 23 | ||||||
| 6 | 24 | |||||||
| 7 | 25 | |||||||
| 7A | 50 | |||||||
| 8 | 51 | |||||||
| 9 | 104 | |||||||
| 9A | 104 | |||||||
| 9B | 106 | |||||||
|
III
|
10 | 107 | ||||||
| 11 | 107 | |||||||
| 12 | 107 | |||||||
| 13 | 107 | |||||||
| 14 | 107 | |||||||
|
IV
|
15 | 108 | ||||||
| — | 110 | |||||||
| EX-21 | ||||||||
| EX-23 | ||||||||
| EX-24 | ||||||||
| EX-31.A | ||||||||
| EX-31.B | ||||||||
| EX-32.A | ||||||||
| EX-32.B | ||||||||
| EX-99 | ||||||||
| EX-101 INSTANCE DOCUMENT | ||||||||
| EX-101 SCHEMA DOCUMENT | ||||||||
| EX-101 CALCULATION LINKBASE DOCUMENT | ||||||||
| EX-101 LABELS LINKBASE DOCUMENT | ||||||||
| EX-101 PRESENTATION LINKBASE DOCUMENT | ||||||||
| EX-101 DEFINITION LINKBASE DOCUMENT | ||||||||
| Table of Contents | i |
Table of Contents
| § | general economic and business conditions; |
| § | the timing and amount of federal, state and local funding for infrastructure; |
| § | the lack of a multi-year federal highway funding bill with an automatic funding mechanism; |
| § | the reluctance of state departments of transportation to undertake federal highway projects without a reliable method of federal funding; |
| § | the impact of the global economic recession on our business and financial condition and access to capital markets; |
| § | changes in the level of spending for residential and private nonresidential construction; |
| § | the highly competitive nature of the construction materials industry; |
| § | the impact of future regulatory or legislative actions; |
| § | the outcome of pending legal proceedings; |
| § | pricing of our products; |
| § | weather and other natural phenomena; |
| § | energy costs; |
| § | costs of hydrocarbon-based raw materials; |
| § | healthcare costs; |
| § | the amount of long-term debt and interest expense we incur; |
| § | changes in interest rates; |
| § | the negative watch on our debt rating and our increased cost of capital in the event that our debt rating is lowered below investment grade; |
| § | volatility in pension plan asset values which may require cash contributions to our pension plans; |
| § | the impact of environmental clean-up costs and other liabilities relating to previously divested businesses; |
| § | our ability to secure and permit aggregates reserves in strategically located areas; |
| § | our ability to manage and successfully integrate acquisitions; |
| § | the potential impact of future legislation or regulations relating to climate change, greenhouse gas emissions or the definition of minerals; |
| § | the risks set forth in Item 1A “Risk Factors,” Item 3 “Legal Proceedings,” Item 7 “Management’s Discussion and Analysis of Financial Condition and Results of Operations,” and Note 12 “Other Commitments and Contingencies” to the consolidated financial statements in Item 8 “Financial Statements and Supplementary Data ,” all as set forth in this report; and |
| Part I | 1 |
Table of Contents
| § | other assumptions, risks and uncertainties detailed from time to time in our filings made with the Securities and Exchange Commission. |
| § | Our reserves are strategically located throughout the United States in high growth areas that will require large amounts of aggregates to meet construction demand. Vulcan-served states are estimated to have 78% of the total growth in the U.S. population and 75% of the growth in U.S. household formations to 2020. Our top ten revenue producing states in 2010 were California, Virginia, Florida, Texas, Tennessee, Georgia, Illinois, North Carolina, Alabama and South Carolina. |
| Population | Households | Employment | |||||||||||||
|
Share of
|
Share of
|
Share of
|
|||||||||||||
|
Rank
|
State
|
Growth |
State
|
Growth |
State
|
Growth | |||||||||
|
1
|
Texas | 15% | Florida | 13% | Texas | 14% | |||||||||
|
2
|
California | 14% | Texas | 13% | Florida | 11% | |||||||||
|
3
|
Florida | 13% | California | 12% | California | 9% | |||||||||
|
4
|
Georgia | 7% | Arizona | 6% | New York | 5% | |||||||||
|
5
|
Arizona | 6% | Georgia | 6% | Georgia | 5% | |||||||||
|
6
|
North Carolina | 6% | North Carolina | 5% | North Carolina | 4% | |||||||||
|
7
|
Nevada | 3% | Washington | 3% | Arizona | 4% | |||||||||
|
8
|
Virginia | 3% | Virginia | 3% | Virginia | 3% | |||||||||
|
9
|
Washington | 2% | Colorado | 2% | Pennsylvania | 3% | |||||||||
|
10
|
Colorado | 2% | Nevada | 2% | Washington | 3% | |||||||||
|
Top 10 Subtotal
|
71% | 65% | 61% | ||||||||||||
|
Vulcan-served States
|
78% | 75% | 69% | ||||||||||||
| § | We have pursued a strategy of increasing our presence in metropolitan areas that are expected to grow most rapidly. |
| Part I | 2 |
Table of Contents
| § | We typically operate in locations close to our local markets because the cost of trucking materials long distances is prohibitive. Approximately 80% of our total aggregates shipments are delivered exclusively by truck, and another 13% are delivered by truck after reaching a sales yard by rail or water. |
| DATE | ACQUISITION | MATERIALS | STATES | |||
|
1999
|
CalMat Co. |
Aggregates
Asphalt Mix Ready-mixed concrete |
Arizona
California New Mexico |
|||
|
2000
|
Tarmac
Companies |
Aggregates |
Maryland
North Carolina Pennsylvania South Carolina Virginia |
|||
|
2007
|
Florida Rock
Industries, Inc. |
Aggregates
Ready-mixed concrete Cement |
Alabama
Florida Georgia Maryland Virginia Washington, DC |
|||
| § | Since becoming a public company in 1956, Vulcan has principally grown by mergers and acquisitions. In the last 20 years we have acquired over 276 aggregates operations, including many small bolt-on operations and several large acquisitions. |
| § | Cemex S.A.B. de C.V. |
| § | CRH, plc |
| § | Heidelberg Cement AG |
| § | Holcim, Ltd. |
| § | Lafarge SA |
| § | Martin Marietta Materials, Inc. |
| § | MDU Resources Group, Inc. |
| Part I | 3 |
Table of Contents

| § | BUILD AND HOLD SUBSTANTIAL RESERVES : The location of our reserves is critical to our long-term success because of barriers to entry created in some markets by zoning and permitting regulations and high transportation costs. Our reserves are strategically located throughout the United States in high-growth areas that will require large amounts of aggregates to meet future construction demand. Aggregates operations have flexible production capabilities and require no raw material other than our owned or leased aggregates reserves. Our downstream businesses (asphalt mix and concrete) predominantly use Vulcan-produced aggregates. |
| § | TAKE ADVANTAGE OF BEING THE LARGEST PRODUCER : Each aggregates operation is unique because of its location within a local market with particular geological characteristics. Every operation, however, uses a similar group of assets to produce saleable aggregates and provide customer service. Vulcan is the largest aggregates company in the U.S., whether measured by production or by revenues. Our 319 aggregates facilities provide opportunities to standardize and procure equipment (fixed and mobile), parts, supplies and services in the most efficient and cost-effective manner possible both regionally and nationally. Additionally, we are able to share best practices across the organization and leverage our size for administrative support, customer service, accounts receivable and accounts payable, technical support and engineering. |
| § | GENERATE STRONG CASH EARNINGS PER TON, EVEN IN A RECESSION : Our knowledgeable and experienced workforce and our flexible production capabilities have allowed us to manage costs aggressively during the current recession. As a result, our cash earnings for each ton of aggregates sold in 2010 was 26% higher than at the peak of demand in 2005. |
| Part I | 4 |
Table of Contents

| § | STRATEGIC ACQUISITIONS: Since becoming a public company in 1956, Vulcan has principally grown by mergers and acquisitions. For example, in 1999 we acquired CalMat Co., thereby expanding our aggregates operations into California, Arizona, and New Mexico and making us one of the nation’s leading producers of asphalt mix and ready-mixed concrete. |
| § | expanded our aggregates business in Florida and other southeastern and mid-Atlantic states | |
| § | added an extensive ready-mixed concrete business in Florida, Maryland, Virginia and Washington D.C. | |
| § | added cement manufacturing and distribution facilities in Florida |
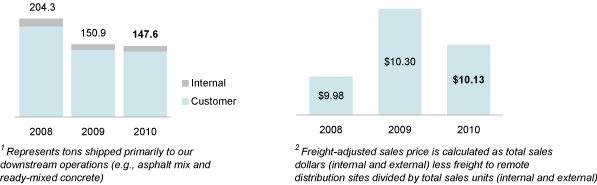
| § | TIGHTLY MANAGED COSTS: In a business where our aggregates sell, on average, for $10.13 per ton, we are accustomed to rigorous cost management throughout economic cycles. Small savings per ton add up to significant cost reductions. We are able to reduce or expand production and adjust employment levels to meet changing market demands without jeopardizing our ability to take advantage of future increased demand. |
| § | REINVESTMENT OPPORTUNITIES WITH HIGH RETURNS: In the next decade, Moody’s Analytics projects that 78% of the U.S. population growth will occur in Vulcan-served states. The close proximity of our production facilities and our aggregates reserves to this projected population growth creates many opportunities to invest capital in high-return projects — projects that will add reserves, increase production capacity and improve costs. |
| Part I | 5 |
Table of Contents
| § | aggregates |
| § | concrete |
| § | asphalt mix |
| § | cement |

| § | LOCAL MARKETS: Aggregates have a high weight-to-value ratio and, in most cases, must be produced near where they are used; if not, transportation can cost more than the materials. Exceptions to this typical market structure include areas along the U.S. Gulf Coast and the Eastern Seaboard where there are limited supplies of locally available high quality aggregates. We serve these markets from inland quarries — shipping by barge and rail — and from our quarry on Mexico’s Yucatan Peninsula. We transport aggregates from Mexico to the U.S. principally on our three Panamax-class, self-unloading ships. |
| § | DIVERSE MARKETS: Large quantities of aggregates are used in virtually all types of public- and private-sector construction projects such as highways, airports, water and sewer systems, industrial manufacturing facilities, residential and nonresidential buildings. Aggregates also are used widely as railroad track ballast. |
| § | LOCATION AND QUALITY OF RESERVES: Vulcan currently has 14.7 billion tons of permitted and proven or probable aggregates reserves. The bulk of these reserves are located in areas where we expect greater than average rates of growth in population, jobs and households, which require new infrastructure, housing, offices, schools and other development. Such growth requires aggregates for construction. Zoning and permitting regulations in some markets have made it increasingly difficult for the aggregates industry to expand existing quarries or to develop new quarries. These restrictions could curtail expansion in certain areas, but they also could increase the value of our reserves at existing locations. |
| Part I | 6 |
Table of Contents
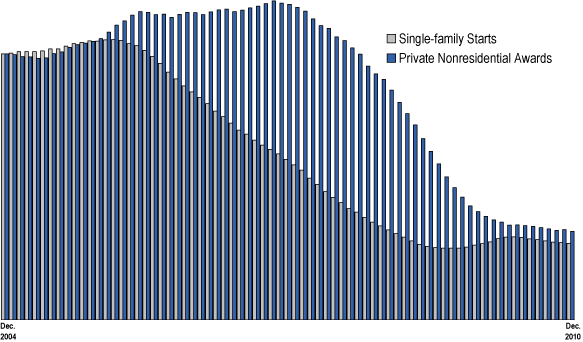
| § | DEMAND CYCLES: Long-term growth in demand for aggregates is largely driven by growth in population, jobs and households. While short- and medium-term demand for aggregates fluctuates with economic cycles, declines have historically been followed by strong recoveries, with each peak establishing a new historical high. In comparison to all other recent demand cycles, the current downturn has been unusually steep and long, making it difficult to predict the timing or strength of future recovery. |

| § | HIGHLY FRAGMENTED INDUSTRY: The U.S. aggregates industry is composed of approximately 5,000 companies that manage more than 9,000 operations. This fragmented structure provides many opportunities for consolidation. Companies in the industry commonly enter new markets or expand positions in existing markets through the acquisition of existing facilities. |
| § | RELATIVELY STABLE DEMAND FROM THE PUBLIC SECTOR: Publicly funded construction activity has historically been more stable than privately funded construction. Public construction also has been less cyclical than private construction and requires more aggregates per dollar of construction spending. Private construction (primarily residential and nonresidential buildings) is typically more affected by general economic cycles than public construction. Publicly funded projects (particularly highways, roads and bridges) tend to receive more consistent levels of funding throughout economic cycles. |
| § | LIMITED PRODUCT SUBSTITUTION: With few exceptions, there are no practical substitutes for quality aggregates. In urban locations, recycled concrete has limited applications as a lower-cost alternative to virgin aggregates. However, many types of construction projects cannot be served by recycled concrete but require the use of virgin aggregates to meet specifications and performance-based criteria for durability, strength and other qualities. |
| Part I | 7 |
Table of Contents
| § | WIDELY USED IN DOWNSTREAM PRODUCTS: In the production process, aggregates are processed for specific applications or uses. Two products that use aggregates are asphalt mix and ready-mixed concrete. By weight, aggregates comprise approximately 95% of asphalt mix and 78% of ready-mixed concrete. |
| § | FLEXIBLE PRODUCTION CAPABILITIES: The production of aggregates is a mechanical process in which stone is crushed and, through a series of screens, separated into various sizes depending on how it will be used. Aggregates plants do not require high start-up costs and typically have lower fixed costs than continuous process manufacturing operations. Production capacity can be flexible by adjusting operating hours to meet changing market demand. For example, we reduced production during 2009 and 2010 in response to the economic downturn but retain the capacity to quickly increase production as economic conditions and demand improve. |
| § | NO RAW MATERIAL INPUTS: Unlike typical industrial manufacturing industries, the aggregates industry does not require the input of raw material beyond owned or leased aggregates reserves. Stone, sand and gravel are naturally occurring resources. However, production does require the use of explosives, hydrocarbon fuels and electric power. |
| Part I | 8 |
Table of Contents
| Part I | 9 |
Table of Contents
| Part I | 10 |
Table of Contents
| Part I | 11 |
Table of Contents
| Part I | 12 |
Table of Contents
| Part I | 13 |
Table of Contents
| § | Annual Report on Form 10-K |
| § | Quarterly Reports on Form 10-Q |
| § | Current Reports on Form 8-K |
| § | Business Conduct Policy applicable to all employees and directors |
| § | Code of Ethics for the CEO and Senior Financial Officers |
| § | Corporate Governance Guidelines |
| § | Charters for its Audit, Compensation and Governance Committees |
| Part I | 14 |
Table of Contents
| § | goodwill and goodwill impairment |
| § | impairment of long-lived assets excluding goodwill |
| § | reclamation costs |
| § | pension and other postretirement benefits |
| § | environmental compliance |
| § | claims and litigation including self-insurance |
| § | income taxes |
| Part I | 15 |
Table of Contents
| Part I | 16 |
Table of Contents
| Part I | 17 |
Table of Contents

| Part I | 18 |
Table of Contents
|
Reserves
|
Number of Aggregates Operating Facilities 1 | |||||||||||||||||||
| (billions of tons) | Stone | Sand and Gravel | Sales Yards | |||||||||||||||||
|
By Division:
|
||||||||||||||||||||
|
Florida Rock
|
0.5 | 5 | 11 | 8 | ||||||||||||||||
|
Mideast
|
3.8 | 36 | 2 | 23 | ||||||||||||||||
|
Midsouth
|
2.1 | 41 | 1 | 0 | ||||||||||||||||
|
Midwest
|
2.0 | 17 | 4 | 4 | ||||||||||||||||
|
Southeast
|
2.6 | 34 | 0 | 3 | ||||||||||||||||
|
Southern and Gulf Coast
|
2.0 | 23 | 1 | 27 | ||||||||||||||||
|
Southwest
|
0.8 | 13 | 1 | 12 | ||||||||||||||||
|
Western
|
0.9 | 3 | 23 | 4 | ||||||||||||||||
|
Total
|
14.7 | 172 | 43 | 81 | ||||||||||||||||
| 1 | In addition to the facilities included in the table above, we operate 23 recrushed concrete plants which are not dependent on reserves. |
| Part I | 19 |
Table of Contents
|
Location
|
Reserves
|
|||
| (nearest major metropolitan area) | (millions of tons) | |||
|
Playa del Carmen (Cancun), Mexico
|
657.5 | |||
|
Hanover (Harrisburg), Pennsylvania
|
561.2 | |||
|
McCook (Chicago), Illinois
|
442.3 | |||
|
Dekalb (Chicago), Illinois
|
366.3 | |||
|
Gold Hill (Charlotte), North Carolina
|
294.2 | |||
|
Macon, Georgia
|
257.5 | |||
|
Rockingham (Charlotte), North Carolina
|
257.4 | |||
|
Cabarrus (Charlotte), North Carolina
|
217.7 | |||
|
1604 Stone (San Antonio), Texas
|
211.8 | |||
|
Grand Rivers (Paducah), Kentucky
|
175.3 | |||
|
Asphalt mix
|
Concrete
|
Cement
|
||||||||||
| Division | Facilities | Facilities 1 | Facilities 2 | |||||||||
|
Florida Rock
|
0 | 71 | 4 | |||||||||
|
Northern Concrete
|
0 | 34 | 0 | |||||||||
|
Southeast
|
0 | 6 | 0 | |||||||||
|
Southwest
|
11 | 4 | 0 | |||||||||
|
Western
|
26 | 16 | 0 | |||||||||
| 1 | Includes ready-mixed concrete, concrete block and other concrete products facilities. |
| 2 | Includes one cement manufacturing facility, two cement import terminals and a calcium plant. |
|
Reserves
|
||||
| Location | (millions of tons) | |||
|
Newberry
|
192.7 | |||
|
Brooksville
|
6.3 | |||
| Part I | 20 |
Table of Contents
| Part I | 21 |
Table of Contents
| Name | Position | Age | |||
|
Donald M. James
|
Chairman and Chief Executive Officer | 62 | |||
|
Daniel F. Sansone
|
Executive Vice President and Chief Financial Officer | 58 | |||
|
Danny R. Shepherd
|
Executive Vice President, Construction Materials | 59 | |||
|
Robert A. Wason IV
|
Senior Vice President and General Counsel | 59 | |||
|
Ejaz A. Khan
|
Vice President, Controller and Chief Information Officer | 53 | |||
|
|
22 |
Table of Contents
AND ISSUER PURCHASES OF EQUITY SECURITIES
|
Common Stock
|
||||||||||||
| Prices |
Dividends
|
|||||||||||
| High | Low | Declared | ||||||||||
|
2010
|
||||||||||||
|
First quarter
|
$ | 54.36 | $ | 41.80 | $ | 0.25 | ||||||
|
Second quarter
|
59.90 | 43.60 | 0.25 | |||||||||
|
Third quarter
|
48.04 | 35.61 | 0.25 | |||||||||
|
Fourth quarter
|
48.26 | 35.40 | 0.25 | |||||||||
|
2009
|
||||||||||||
|
First quarter
|
$ | 71.26 | $ | 34.30 | $ | 0.49 | ||||||
|
Second quarter
|
53.94 | 39.65 | 0.49 | |||||||||
|
Third quarter
|
62.00 | 39.14 | 0.25 | |||||||||
|
Fourth quarter
|
54.37 | 44.70 | 0.25 | |||||||||
| Part II | 23 |
Table of Contents
|
Amounts in millions, except per share data
|
||||||||||||||||||||
| As of and for the years ended December 31 | 2010 | 2009 | 2008 | 2007 | 2006 | |||||||||||||||
|
Net sales
|
$2,405.9 | $2,543.7 | $3,453.1 | $3,090.1 | $3,041.1 | |||||||||||||||
|
Gross profit
|
$300.7 | $446.0 | $749.7 | $950.9 | $931.9 | |||||||||||||||
|
Earnings (loss) from continuing
operations
1
|
($102.5 | ) | $18.6 | $3.4 | $463.1 | $480.2 | ||||||||||||||
|
Earnings (loss) on discontinued operations, net of tax
2
|
$6.0 | $11.7 | ($2.4 | ) | ($12.2 | ) | ($10.0 | ) | ||||||||||||
|
Net earnings (loss)
|
($96.5 | ) | $30.3 | $0.9 | $450.9 | $470.2 | ||||||||||||||
|
Basic earnings (loss) per share
|
||||||||||||||||||||
|
Earnings from continuing operations
|
($0.80 | ) | $0.16 | $0.03 | $4.77 | $4.92 | ||||||||||||||
|
Discontinued operations
|
0.05 | 0.09 | (0.02 | ) | (0.12 | ) | (0.10 | ) | ||||||||||||
|
Basic net earnings (loss) per share
|
($0.75 | ) | $0.25 | $0.01 | $4.65 | $4.82 | ||||||||||||||
|
Diluted earnings (loss) per share
|
||||||||||||||||||||
|
Earnings from continuing operations
|
($0.80 | ) | $0.16 | $0.03 | $4.66 | $4.81 | ||||||||||||||
|
Discontinued operations
|
0.05 | 0.09 | (0.02 | ) | (0.12 | ) | (0.10 | ) | ||||||||||||
|
Diluted net earnings (loss) per share
|
($0.75 | ) | $0.25 | $0.01 | $4.54 | $4.71 | ||||||||||||||
|
Total assets
|
$8,337.9 | $8,524.9 | $8,916.6 | $8,936.4 | $3,427.8 | |||||||||||||||
|
Long-term debt
|
$2,427.5 | $2,116.1 | $2,153.6 | $1,529.8 | $322.1 | |||||||||||||||
|
Shareholders’ equity
|
$3,965.0 | $4,037.2 | $3,553.8 | $3,785.6 | $2,036.9 | |||||||||||||||
|
Cash dividends declared per share
|
$1.00 | $1.48 | $1.96 | $1.84 | $1.48 | |||||||||||||||
| 1 | Earnings from continuing operations during 2008 includes an after tax goodwill impairment charge of $227.6 million, or $2.05 per diluted share, for our Cement segment. |
| 2 | Discontinued operations include the results from operations attributable to our former Chemicals business. |
| Part II | 24 |
Table of Contents

| * | Source: Moody’s Analytics |
| § | Net earnings were a loss of $96.5 million or ($0.75) per diluted share |
| § | EBITDA was $370.6 million compared to $548.4 million in 2009 |
| § | Pretax charges of $43.0 million related to the settlement of a lawsuit in Illinois and a $39.5 million pretax gain associated with the sale of non-strategic assets in rural Virginia |
| § | Unit cost for diesel fuel and liquid asphalt increased 30% and 20%, respectively, reducing pretax earnings $51.3 million |
| § | Freight-adjusted selling prices for aggregates declined 2% due principally to weakness in Florida and California |
| § | Aggregates shipments declined 2% reflecting varied market demand conditions across our footprint |
| § | Full year capital spending was $86.3 million compared with $109.7 million in 2009 |
| Part II | 25 |
Table of Contents
| § | preserved reasonably stable aggregates pricing during the worst year of demand |
| § | maintained productivity levels despite slightly lower sales volumes |
| § | controlled selling, administrative and general expenses |
| Part II | 26 |
Table of Contents
| in millions | 2010 | 2009 | 2008 | |||||||||
|
Net cash provided by operating activities
|
$202.7 | $453.0 | $435.2 | |||||||||
|
Purchases of property, plant & equipment
|
(86.3 | ) | (109.7 | ) | (353.2 | ) | ||||||
|
Free cash flow
|
$116.4 | $343.3 | $82.0 | |||||||||
| in millions | 2010 | 2009 | 2008 | |||||||||
|
Net cash provided by operating activities
|
$202.7 | $453.0 | $ | 435.2 | ||||||||
|
Changes in operating assets and liabilities before initial
effects of business acquisitions and dispositions |
(20.0 | ) | (90.3 | ) | 85.2 | |||||||
|
Other net operating items (providing) using cash
|
102.9 | 62.2 | (130.4 | ) | ||||||||
|
(Earnings) loss on discontinued operations, net of taxes
|
(6.0 | ) | (11.7 | ) | 2.4 | |||||||
|
Provision (benefit) for income taxes
|
(89.7 | ) | (37.8 | ) | 71.7 | |||||||
|
Interest expense, net
|
180.7 | 173.0 | 169.7 | |||||||||
|
EBITDA
|
$370.6 | $548.4 | $ | 633.8 | ||||||||
|
Goodwill impairment
|
0.0 | 0.0 | 252.7 | |||||||||
|
Adjusted EBITDA
|
$370.6 | $548.4 | $ | 886.5 | ||||||||
| in millions | 2010 | 2009 | 2008 | |||||||||
|
Net earnings (loss)
|
($96.5 | ) | $30.3 | $0.9 | ||||||||
|
Provision (benefit) for income taxes
|
(89.7 | ) | (37.8 | ) | 71.7 | |||||||
|
Interest expense, net
|
180.7 | 173.0 | 169.7 | |||||||||
|
(Earnings) loss on discontinued operations, net of taxes
|
(6.0 | ) | (11.7 | ) | 2.4 | |||||||
|
Depreciation, depletion, accretion and amortization
|
382.1 | 394.6 | 389.1 | |||||||||
|
EBITDA
|
$370.6 | $548.4 | $633.8 | |||||||||
|
Goodwill impairment
|
0.0 | 0.0 | 252.7 | |||||||||
|
Adjusted EBITDA
|
$370.6 | $548.4 | $886.5 | |||||||||
| Part II | 27 |
Table of Contents
|
Amounts in millions, except per share data
|
||||||||||||
| For the years ended December 31 | 2010 | 2009 | 2008 | |||||||||
|
Net sales
|
$2,405.9 | $2,543.7 | $3,453.1 | |||||||||
|
Cost of goods sold
|
2,105.2 | 2,097.7 | 2,703.4 | |||||||||
|
Gross profit
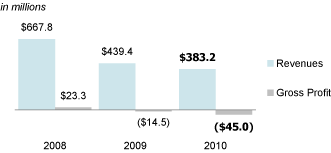
|
$300.7 | $446.0 | $749.7 | |||||||||
|
Operating earnings (loss)
|
($14.5 | ) | $148.5 | $249.1 | ||||||||
|
Earnings (loss) from continuing operations
before income taxes |
($192.2 | ) | ($19.2 | ) | $75.1 | |||||||
|
Earnings (loss) from continuing operations
|
($102.5 | ) | $18.6 | $3.4 | ||||||||
|
Earnings (loss) on discontinued operations,
net of income taxes |
6.0 | 11.7 | (2.5 | ) | ||||||||
|
Net earnings (loss)
|
($96.5 | ) | $30.3 | $0.9 | ||||||||
|
Basic earnings (loss) per share
|
||||||||||||
|
Continuing operations
|
($0.80 | ) | $0.16 | $0.03 | ||||||||
|
Discontinued operations
|
0.05 | 0.09 | (0.02 | ) | ||||||||
|
Basic net earnings (loss) per share
|
($0.75 | ) | $0.25 | $0.01 | ||||||||
|
Diluted earnings (loss) per share
|
||||||||||||
|
Continuing operations
|
($0.80 | ) | $0.16 | $0.03 | ||||||||
|
Discontinued operations
|
0.05 | 0.09 | (0.02 | ) | ||||||||
|
Diluted net earnings (loss) per share
|
($0.75 | ) | $0.25 | $0.01 | ||||||||
|
EBITDA (adjusted EBITDA in 2008)
|
$370.6 | $548.4 | $886.5 | |||||||||
| Part II | 28 |
Table of Contents
| in millions | ||||
|
2008 earnings from continuing operations before income taxes
|
$75.1 | |||
|
Lower aggregates earnings due to
|
||||
|
Lower volumes
|
(333.7 | ) | ||
|
Higher selling prices
|
48.3 | |||
|
Lower costs
|
21.1 | |||
|
Lower concrete earnings
|
(37.8 | ) | ||
|
Higher asphalt mix earnings
|
17.9 | |||
|
Lower cement earnings
|
(19.5 | ) | ||
|
Lower selling, administrative and general
expenses
1
|
21.0 | |||
|
2008 goodwill impairment — cement
|
252.7 | |||
|
Lower gain on sale of property, plant & equipment and
businesses
|
(67.1 | ) | ||
|
All other
|
2.8 | |||
|
2009 earnings from continuing operations before income taxes
|
($19.2 | ) | ||
|
Lower aggregates earnings due to
|
||||
|
Lower volumes
|
(20.6 | ) | ||
|
Lower selling prices
|
(25.1 | ) | ||
|
Higher costs
|
(27.4 | ) | ||
|
Lower concrete earnings
|
(30.5 | ) | ||
|
Lower asphalt mix earnings
|
(39.7 | ) | ||
|
Lower cement earnings
|
(2.0 | ) | ||
|
Higher selling, administrative and general
expenses
1,
2
|
(2.9 | ) | ||
|
Higher gain on sale of property, plant & equipment and
businesses
|
32.2 | |||
|
IDOT settlement, including related legal fees
|
(43.0 | ) | ||
|
Higher interest expense
|
(6.3 | ) | ||
|
All other
|
(7.7 | ) | ||
|
2010 earnings from continuing operations before income
taxes
|
($192.2 | ) | ||
| 1 |
Includes expenses for property
donations recorded at fair value for each comparative
year, as follows: $9.2 million in 2010, $8.5 million in 2009 and $10.5 million in 2008. |
|
| 2 |
Excludes $3.0 million of
2010 legal expenses charged to selling, administrative
and general expenses which is noted in this table within the IDOT settlement line. |
| Part II | 29 |
Table of Contents
| 1. | AGGREGATES |
| § | 2% in 2010 |
| § | 26% in 2009 |
| § | 12% in 2008 |
| § | declined 2% in 2010 |
| § | improved 3% in 2009 |
| § | improved 7% in 2008 |

| AGGREGATES UNIT SHIPMENTS | AGGREGATES SELLING PRICE | |
|
Customer and
internal
1
tons, in millions
|
Freight-adjusted average sales price per ton 2 | |
|
||
| Part II | 30 |
Table of Contents
| 2. | CONCRETE |
| § | declined 5% in 2010 |
| § | declined 32% in 2009 |
| § | increased 150% in 2008 |
| 3. | ASPHALT MIX |
| § | 3% in 2010 |
| § | 22% in 2009 |
| § | 9% in 2008 |
| Part II | 31 |
Table of Contents

| 4. | CEMENT |

GENERAL EXPENSES

| Part II | 32 |
Table of Contents
| § | 4% in 2010 |
| § | 11% in 2009 |
| § | 14% in 2008 |
EQUIPMENT AND BUSINESSES, NET
| Part II | 33 |
Table of Contents
| dollars in millions | 2010 | 2009 | 2008 | |||||||||
|
Earnings (loss) from continuing
operations before income taxes |
($192.2 | ) | ($19.2 | ) | $75.1 | |||||||
|
Provision (benefit) for income taxes
|
(89.7 | ) | (37.9 | ) | 71.7 | |||||||
|
Effective tax rate
|
46.6% | 197.0% | 95.5% | |||||||||
| § | $10.0 million in 2010 |
| § | $19.5 million in 2009 |
| § | ($4.1) million in 2008 |
| Part II | 34 |
Table of Contents
| § | debt service obligations |
| § | cash contractual obligations |
| § | capital expenditures |
| § | dividend payments |
| § | potential future acquisitions |
SHORT-TERM BORROWINGS
|
2011
|
||||
| in millions | Maturities | |||
|
First quarter
|
$ | 0.0 | ||
|
Second quarter
|
0.0 | |||
|
Third quarter
|
0.0 | |||
|
Fourth quarter
|
5.0 | |||
| Part II | 35 |
Table of Contents
| dollars in millions | 2010 | 2009 | ||
|
Short-term Borrowings
|
||||
|
Bank borrowings
|
$285.5 | $0.0 | ||
|
Commercial paper
|
0.0 | 236.5 | ||
|
Total short-term borrowings
|
$285.5 | $236.5 | ||
|
Bank Borrowings
|
||||
|
Maturity
|
3 - 74 days | n/a | ||
|
Weighted-average interest rate
|
0.59% | n/a | ||
|
Commercial Paper
|
||||
|
Maturity
|
n/a | 42 days | ||
|
Weighted-average interest rate
|
n/a | 0.39% | ||
| § | $285.5 million was drawn from the $1.5 billion line of credit |
| § | $61.9 million was used to provide backup for outstanding letters of credit |
| § | Standard and Poor’s — A-3/credit watch - negative (rating placed on credit watch - negative effective December 2010) |
| § | Moody’s — P-3/under review (rating placed under review for downgrade December 2010) |
| in millions | 2010 | 2009 | ||||||
|
Working Capital
|
||||||||
|
Current assets
|
$772.1 | $732.9 | ||||||
|
Current liabilities
|
(565.7 | ) | (856.7 | ) | ||||
|
Total working capital
|
$206.4 | ($123.8 | ) | |||||
| Part II | 36 |
Table of Contents
| in millions | 2010 | 2009 | 2008 | |||||||||
|
Net earnings (loss)
|
($96.5 | ) | $30.3 | $0.9 | ||||||||
|
Depreciation, depletion, accretion
and amortization |
382.1 | 394.6 | 389.1 | |||||||||
|
Goodwill impairment
|
0.0 | 0.0 | 252.7 | |||||||||
|
Other operating cash flows, net
|
(82.9 | ) | 28.1 | (207.5 | ) | |||||||
|
Net cash provided by operating activities
|
$202.7 | $453.0 | $435.2 | |||||||||
| Part II | 37 |
Table of Contents
| § | maintaining a debt to total capital ratio within what we believe to be a prudent and generally acceptable range of 35% to 40% |
| § | paying out a reasonable share of net cash provided by operating activities as dividends |
| § | maintaining credit ratings that allow access to the credit markets on favorable terms |
| § | pension plan contribution — 1,190,000 shares for $53.9 million |
| § | 401(k) plan contribution — 882,132 shares for $41.7 million |
| § | incentive compensation plans — 585,732 shares for $18.0 million |
| dollars in millions | 2010 | 2009 | ||||||
|
Debt
|
||||||||
|
Current maturities of long-term debt
|
$5.2 | $385.4 | ||||||
|
Short-term borrowings
|
285.5 | 236.5 | ||||||
|
Long-term debt
|
2,427.5 | 2,116.1 | ||||||
|
Total debt
|
$2,718.2 | $2,738.0 | ||||||
|
Capital
|
||||||||
|
Total debt
|
$2,718.2 | $2,738.0 | ||||||
|
Shareholders’ equity
|
3,965.0 | 4,037.2 | ||||||
|
Total capital
|
$6,683.2 | $6,775.2 | ||||||
|
Total Debt as a Percentage of Total Capital
|
40.7% | 40.4% | ||||||
|
Long-term Debt — Weighted-Average Stated
Interest Rate |
7.02% | 7.69% | ||||||
| Part II | 38 |
Table of Contents
| § | Standard and Poor’s — BBB-/credit watch - negative (rating placed on credit watch - negative effective December 2010) |
| § | Moody’s — Baa3/under review (rating placed under review for downgrade December 2010) |
| in thousands | 2010 | 2009 | 2008 | |||||||||
|
Common stock shares at January 1, issued and outstanding
|
125,912 | 110,270 | 108,234 | |||||||||
|
Common Stock Issuances
|
||||||||||||
|
Public offering
|
0 | 13,225 | 0 | |||||||||
|
Acquisitions
|
0 | 789 | 1,152 | |||||||||
|
401(k) savings and retirement plan
|
882 | 1,135 | 0 | |||||||||
|
Pension plan contribution
|
1,190 | 0 | 0 | |||||||||
|
Share-based compensation plans
|
586 | 493 | 884 | |||||||||
|
Common stock shares at December 31, issued and outstanding
|
128,570 | 125,912 | 110,270 | |||||||||
| § | 2009 — 0.8 million shares |
| § | 2008 — 1.2 million shares |
| § | 2010 - issued 0.9 million shares for cash proceeds of $41.7 million |
| § | 2009 - issued 1.1 million shares for cash proceeds of $52.7 million |
| Part II | 39 |
Table of Contents
| § | results of operations |
| § | financial position |
| § | liquidity |
| § | capital expenditures |
| § | capital resources |
| Part II | 40 |
Table of Contents
| Payments Due by Year | |||||||||||||||||||||||
|
Note
|
|||||||||||||||||||||||
| in millions | Reference | 2011 | 2012-2013 | 2014-2015 | Thereafter | Total | |||||||||||||||||
|
Cash Contractual Obligations
|
|||||||||||||||||||||||
|
Short-term borrowings
|
|||||||||||||||||||||||
|
Lines of
credit
1
|
Note 6 | $285.5 | $0.0 | $0.0 | $0.0 | $285.5 | |||||||||||||||||
|
Interest payments
|
0.0 | 0.0 | 0.0 | 0.0 | 0.0 | ||||||||||||||||||
|
Long-term debt
|
|||||||||||||||||||||||
|
Principal payments
|
Note 6 | 5.2 | 590.4 | 570.3 | 1,270.5 | 2,436.4 | |||||||||||||||||
|
Interest payments
|
Note 6 | 156.4 | 296.7 | 251.1 | 589.1 | 1,293.3 | |||||||||||||||||
|
Operating leases
|
Note 7 | 26.6 | 37.4 | 13.6 | 25.9 | 103.5 | |||||||||||||||||
|
Mineral royalties
|
Note 12 | 19.3 | 37.0 | 32.1 | 138.8 | 227.2 | |||||||||||||||||
|
Unconditional purchase obligations
|
|||||||||||||||||||||||
|
Capital
|
Note 12 | 9.8 | 0.0 | 0.0 | 0.0 | 9.8 | |||||||||||||||||
|
Noncapital
2
|
Note 12 | 21.2 | 23.6 | 10.5 | 13.0 | 68.3 | |||||||||||||||||
|
Benefit
plans
3
|
Note 10 | 47.8 | 101.5 | 123.9 | 336.4 | 609.6 | |||||||||||||||||
|
Total cash contractual
obligations
4,5
|
$571.8 | $1,086.6 | $1,001.5 | $2,373.7 | $5,033.6 | ||||||||||||||||||
| 1 | Lines of credit represent borrowings under our five-year credit facility which expires November 16, 2012. |
| 2 | Noncapital unconditional purchase obligations relate primarily to transportation and electrical contracts. |
| 3 | Payments in “Thereafter” column for benefit plans are for the years 2016-2020. |
| 4 | The above table excludes discounted asset retirement obligations in the amount of $162.7 million at December 31, 2010, the majority of which have an estimated settlement date beyond 2015 (see Note 17 “Asset Retirement Obligations” in Item 8 “Financial Statements and Supplementary Data”). |
| 5 | The above table excludes unrecognized tax benefits in the amount of $28.1 million at December 31, 2010, as we cannot make a reasonably reliable estimate of the amount and period of related future payment of these uncertain tax positions (for more details, see Note 9 “Income Taxes” in Item 8 “Financial Statements and Supplementary Data.”) |
| Part II | 41 |
Table of Contents
GOODWILL IMPAIRMENT
| § | if the fair value exceeds its carrying value, the goodwill of the reporting unit is not considered impaired |
| § | if the carrying value of a reporting unit exceeds its fair value, we go to step two to measure the amount of impairment loss, if any |
| Part II | 42 |
Table of Contents
| § | if the carrying value of the reporting unit goodwill exceeds the implied fair value of that goodwill, an impairment loss is recognized in an amount equal to that excess |
| § | November 1, 2010 indicated that the fair values of all reporting units with goodwill substantially exceeded their carrying values |
| § | November 1, 2009 indicated that the fair values of all reporting units with goodwill substantially exceeded their carrying values |
| § | January 1, 2009 indicated that the carrying value of our Cement reporting unit exceeded its fair value. Based on the results of the second step of the impairment test, we concluded that the entire amount of goodwill at this reporting unit was impaired, and recorded a $252.7 million pretax goodwill impairment charge for the year ended December 31, 2008. The fair value of all other reporting units with goodwill substantially exceeded their carrying values |
EXCLUDING GOODWILL
| Part II | 43 |
Table of Contents
| 3. | RECLAMATION COSTS |
POSTRETIREMENT BENEFITS
| § | DISCOUNT RATE — The discount rate is used in calculating the present value of benefits, which is based on projections of benefit payments to be made in the future |
| § | EXPECTED RETURN ON PLAN ASSETS — We project the future return on plan assets based principally on prior performance and our expectations for future returns for the types of investments held by the plan as well as the expected long-term asset allocation of the plan. These projected returns reduce the recorded net benefit costs |
| § | RATE OF COMPENSATION INCREASE — For salary-related plans only, we project employees’ annual pay increases, which are used to project employees’ pension benefits at retirement |
| § | RATE OF INCREASE IN THE PER CAPITA COST OF COVERED HEALTHCARE BENEFITS — We project the expected increases in the cost of covered healthcare benefits |
| Part II | 44 |
Table of Contents
| (Favorable) Unfavorable | ||||||||||||||||
| 0.5 Percentage Point Increase | 0.5 Percentage Point Decrease | |||||||||||||||
|
Inc (Dec) in
|
Inc (Dec) in
|
Inc (Dec) in
|
Inc (Dec) in
|
|||||||||||||
| in millions | Benefit Obligation | Benefit Cost | Benefit Obligation | Benefit Cost | ||||||||||||
|
Actuarial Assumptions
|
||||||||||||||||
|
Discount rate
|
||||||||||||||||
|
Pension
|
($44.8 | ) | ($3.1 | ) | $49.7 | $4.8 | ||||||||||
|
Other postretirement benefits
|
(5.2 | ) | (0.1 | ) | 5.6 | 0.3 | ||||||||||
|
Expected return on plan assets
|
not applicable | (3.0 | ) | not applicable | 3.0 | |||||||||||
|
Rate of compensation increase
(for salary-related plans) |
9.2 | 1.7 | (8.4 | ) | (1.6 | ) | ||||||||||
|
Rate of increase in the per capita cost of covered healthcare
benefits
|
6.1 | 0.9 | (5.4 | ) | (0.7 | ) | ||||||||||
| Part II | 45 |
Table of Contents
| 5. | ENVIRONMENTAL COMPLIANCE |
| § | expense or capitalize environmental expenditures for current operations or for future revenues consistent with our capitalization policy |
| § | expense expenditures for an existing condition caused by past operations that do not contribute to future revenues |
| § | accrue costs for environmental assessment and remediation efforts when we determine that a liability is probable and we can reasonably estimate the cost |
INCLUDING SELF-INSURANCE
| Part II | 46 |
Table of Contents
| 7. | INCOME TAXES |
| § | prior earnings history |
| § | expected future taxable income |
| § | mix of taxable income in the jurisdictions in which we operate |
| § | carryback and carryforward periods |
| § | tax strategies that could potentially enhance the likelihood of realizing a deferred tax asset |
| Part II | 47 |
Table of Contents
| Part II | 48 |
Table of Contents
| Part II | 49 |
Table of Contents
| Part II | 50 |
Table of Contents
PUBLIC ACCOUNTING FIRM
| Part II | 51 |
Table of Contents
COMPREHENSIVE INCOME
|
For the years ended December 31
|
||||||||||||
| in thousands, except per share data |
2010
|
2009
|
2008
|
|||||||||
|
Net sales
|
$2,405,916 | $2,543,707 | $3,453,081 | |||||||||
|
Delivery revenues
|
152,946 | 146,783 | 198,357 | |||||||||
|
Total revenues
|
2,558,862 | 2,690,490 | 3,651,438 | |||||||||
|
Cost of goods sold
|
2,105,190 | 2,097,745 | 2,703,369 | |||||||||
|
Delivery costs
|
152,946 | 146,783 | 198,357 | |||||||||
|
Cost of revenues
|
2,258,136 | 2,244,528 | 2,901,726 | |||||||||
|
Gross profit
|
300,726 | 445,962 | 749,712 | |||||||||
|
Selling, administrative and general expenses
|
327,537 | 321,608 | 342,584 | |||||||||
|
Gain on sale of property, plant & equipment and
businesses, net
|
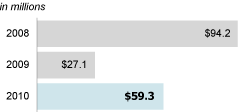
59,302 | 27,104 | 94,227 | |||||||||
|
Goodwill impairment
|
0 | 0 | 252,664 | |||||||||
|
Charge for legal settlement
|
40,000 | 0 | 0 | |||||||||
|
Other operating income (expense), net
|
(7,031 | ) | (3,006 | ) | 411 | |||||||
|
Operating earnings (loss)
|
(14,540 | ) | 148,452 | 249,102 | ||||||||
|
Other income (expense), net
|
3,074 | 5,307 | (4,357 | ) | ||||||||
|
Interest income
|
863 | 2,282 | 3,126 | |||||||||
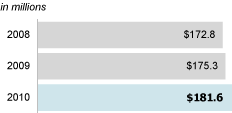
|
Interest expense
|
181,603 | 175,262 | 172,813 | |||||||||
|
Earnings (loss) from continuing operations before income taxes
|
(192,206 | ) | (19,221 | ) | 75,058 | |||||||
|
Provision (benefit) for income taxes
|
||||||||||||
|
Current
|
(37,805 | ) | 6,106 | 92,346 | ||||||||
|
Deferred
|
(51,858 | ) | (43,975 | ) | (20,655 | ) | ||||||
|
Total provision (benefit) for income taxes
|
(89,663 | ) | (37,869 | ) | 71,691 | |||||||
|
Earnings (loss) from continuing operations
|
(102,543 | ) | 18,648 | 3,367 | ||||||||
|
Earnings (loss) on discontinued operations, net of income taxes
(Note 2)
|
6,053 | 11,666 | (2,449 | ) | ||||||||
|
Net earnings (loss)
|
($96,490 | ) | $30,314 | $918 | ||||||||
|
Other comprehensive income (loss), net of tax
|
||||||||||||
|
Fair value adjustments to cash flow hedge
|
(481 | ) | (2,748 | ) | (2,640 | ) | ||||||
|
Reclassification adjustment for cash flow hedges included in net
earnings (loss)
|
10,709 | 9,902 | 1,968 | |||||||||
|
Adjustment for funded status of pension and postretirement
benefit plans |
3,201 | (17,367 | ) | (154,099 | ) | |||||||
|
Amortization of pension and postretirement plan actuarial loss
and prior service cost
|
3,590 | 1,138 | 724 | |||||||||
|
Other comprehensive income (loss)
|
17,019 | (9,075 | ) | (154,047 | ) | |||||||
|
Comprehensive income (loss)
|
($79,471 | ) | $21,239 | ($153,129 | ) | |||||||
|
Basic earnings (loss) per share
|
||||||||||||
|
Continuing operations
|
($0.80 | ) | $0.16 | $0.03 | ||||||||
|
Discontinued operations
|
$0.05 | $0.09 | ($0.02 | ) | ||||||||
|
Net earnings (loss) per share
|
($0.75 | ) | $0.25 | $0.01 | ||||||||
|
Diluted earnings (loss) per share
|
||||||||||||
|
Continuing operations
|
($0.80 | ) | $0.16 | $0.03 | ||||||||
|
Discontinued operations
|
$0.05 | $0.09 | ($0.02 | ) | ||||||||
|
Net earnings (loss) per share
|
($0.75 | ) | $0.25 | $0.01 | ||||||||
|
Dividends declared per share
|
$1.00 | $1.48 | $1.96 | |||||||||
|
Weighted-average common shares outstanding
|
128,050 | 118,891 | 109,774 | |||||||||
|
Weighted-average common shares outstanding, assuming dilution
|
128,050 | 119,430 | 110,954 | |||||||||
| Part II | 52 |
Table of Contents
|
2009
|
||||||||
|
As of December 31
|
(As Restated,
|
|||||||
| in thousands, except per share data |
2010
|
See Note 20) | ||||||
|
Assets
|
||||||||
|
Cash and cash equivalents
|
$47,541 | $22,265 | ||||||
|
Restricted cash
|
547 | 0 | ||||||
|
Medium-term investments
|
0 | 4,111 | ||||||
|
Accounts and notes receivable
|
||||||||
|
Customers, less allowance for doubtful accounts
|
||||||||
|
2010 — $7,505; 2009 — $8,722
|
260,814 | 254,753 | ||||||
|
Other
|
56,984 | 13,271 | ||||||
|
Inventories
|
319,845 | 325,033 | ||||||
|
Deferred income taxes
|
53,794 | 56,017 | ||||||
|
Prepaid expenses
|
19,374 | 42,367 | ||||||
|
Assets held for sale
|
13,207 | 15,072 | ||||||
|
Total current assets
|
772,106 | 732,889 | ||||||
|
Investments and long-term receivables
|
37,386 | 33,283 | ||||||
|
Property, plant & equipment, net
|
3,632,914 | 3,874,671 | ||||||
|
Goodwill
|
3,097,016 | 3,096,300 | ||||||
|
Other intangible assets, net
|
691,693 | 682,643 | ||||||
|
Other noncurrent assets
|
106,776 | 105,085 | ||||||
|
Total assets
|
$8,337,891 | $8,524,871 | ||||||
|
Liabilities
|
||||||||
|
Current maturities of long-term debt
|
$5,246 | $385,381 | ||||||
|
Short-term borrowings
|
285,500 | 236,512 | ||||||
|
Trade payables and accruals
|
102,315 | 121,324 | ||||||
|
Accrued salaries, wages and management incentives
|
48,841 | 38,148 | ||||||
|
Accrued interest
|
11,246 | 9,458 | ||||||
|
Other accrued liabilities
|
112,408 | 65,503 | ||||||
|
Liabilities of assets held for sale
|
116 | 369 | ||||||
|
Total current liabilities
|
565,672 | 856,695 | ||||||
|
Long-term debt
|
2,427,516 | 2,116,120 | ||||||
|
Deferred income taxes
|
849,448 | 893,974 | ||||||
|
Deferred management incentive and other compensation
|
32,393 | 33,327 | ||||||
|
Pension benefits
|
127,136 | 212,033 | ||||||
|
Other postretirement benefits
|
124,617 | 109,990 | ||||||
|
Asset retirement obligations
|
162,730 | 167,757 | ||||||
|
Other noncurrent liabilities
|
83,399 | 97,738 | ||||||
|
Total liabilities
|
4,372,911 | 4,487,634 | ||||||
|
Other commitments and contingencies (Note 12)
|
||||||||
|
Shareholders’ equity
|
||||||||
|
Common stock, $1 par value — 128,570 shares
issued as of 2010 and 125,912 shares issued as of 2009
|
128,570 | 125,912 | ||||||
|
Capital in excess of par value
|
2,500,886 | 2,368,228 | ||||||
|
Retained earnings
|
1,512,863 | 1,737,455 | ||||||
|
Accumulated other comprehensive loss
|
(177,339 | ) | (194,358 | ) | ||||
|
Total shareholders’ equity
|
3,964,980 | 4,037,237 | ||||||
|
Total liabilities and shareholders’ equity
|
$8,337,891 | $8,524,871 | ||||||
| Part II | 53 |
Table of Contents
|
For the years ended December 31
|
||||||||||||
| in thousands |
2010
|
2009
|
2008
|
|||||||||
|
Operating Activities
|
||||||||||||
|
Net earnings (loss)
|
($96,490 | ) | $30,314 | $918 | ||||||||
|
Adjustments to reconcile net earnings to net cash provided by
operating activities
|
||||||||||||
|
Depreciation, depletion, accretion and
amortization
|
382,093 | 394,612 | 389,060 | |||||||||
|
Net gain on sale of property, plant & equipment and
businesses
|
(68,095 | ) | (27,916 | ) | (94,227 | ) | ||||||
|
Goodwill impairment
|
0 | 0 | 252,664 | |||||||||
|
Contributions to pension plans
|
(24,496 | ) | (27,616 | ) | (3,127 | ) | ||||||
|
Share-based compensation
|
20,637 | 23,120 | 19,096 | |||||||||
|
Excess tax benefits from share-based compensation
|
(808 | ) | (2,072 | ) | (11,209 | ) | ||||||
|
Deferred tax provision
|
(51,684 | ) | (43,773 | ) | (19,756 | ) | ||||||
|
(Increase) decrease in assets before initial effects of business
acquisitions and dispositions
|
||||||||||||
|
Accounts and notes receivable
|
(49,656 | ) | 79,930 | 61,352 | ||||||||
|
Inventories
|
6,708 | 39,289 | (7,630 | ) | ||||||||
|
Prepaid expenses
|
22,945 | 4,127 | (23,425 | ) | ||||||||
|
Other assets
|
(58,243 | ) | (27,670 | ) | (13,568 | ) | ||||||
|
Increase (decrease) in liabilities before initial effects of
business acquisitions and dispositions
|
||||||||||||
|
Accrued interest and income taxes
|
12,661 | (2,854 | ) | 8,139 | ||||||||
|
Trade payables and other accruals
|
44,573 | (30,810 | ) | (125,167 | ) | |||||||
|
Other noncurrent liabilities
|
40,950 | 28,263 | 15,128 | |||||||||
|
Other, net
|
21,611 | 16,091 | (13,063 | ) | ||||||||
|
Net cash provided by operating activities
|
202,706 | 453,035 | 435,185 | |||||||||
|
Investing Activities
|
||||||||||||
|
Purchases of property, plant & equipment
|
(86,324 | ) | (109,729 | ) | (353,196 | ) | ||||||
|
Proceeds from sale of property, plant & equipment
|
13,602 | 17,750 | 25,542 | |||||||||
|
Proceeds from sale of businesses, net of transaction costs
|
50,954 | 16,075 | 225,783 | |||||||||
|
Payment for businesses acquired, net of acquired cash
|
(70,534 | ) | (36,980 | ) | (84,057 | ) | ||||||
|
Reclassification of cash equivalents (to) from medium-term
investments
|
3,630 | 0 | (36,734 | ) | ||||||||
|
Redemption of medium-term investments
|
23 | 33,282 | 0 | |||||||||
|
Proceeds from loan on life insurance policies
|
0 | 0 | 28,646 | |||||||||
|
Other, net
|
273 | (400 | ) | 4,976 | ||||||||
|
Net cash used for investing activities
|
(88,376 | ) | (80,002 | ) | (189,040 | ) | ||||||
|
Financing Activities
|
||||||||||||
|
Net short-term borrowings (payments)
|
48,988 | (847,963 | ) | (1,009,000 | ) | |||||||
|
Payment of current maturities and long-term debt
|
(519,204 | ) | (361,724 | ) | (48,794 | ) | ||||||
|
Proceeds from issuance of long-term debt, net of discounts
|
450,000 | 397,660 | 949,078 | |||||||||
|
Debt issuance costs
|
(3,058 | ) | (3,033 | ) | (5,633 | ) | ||||||
|
Settlements of forward starting interest rate swap agreements
|
0 | 0 | (32,474 | ) | ||||||||
|
Proceeds from issuance of common stock
|
41,734 | 606,546 | 55,072 | |||||||||
|
Dividends paid
|
(127,792 | ) | (171,468 | ) | (214,783 | ) | ||||||
|
Proceeds from exercise of stock options
|
20,502 | 17,327 | 24,602 | |||||||||
|
Excess tax benefits from share-based compensation
|
808 | 2,072 | 11,209 | |||||||||
|
Other, net
|
(1,032 | ) | (379 | ) | (116 | ) | ||||||
|
Net cash used for financing activities
|
(89,054 | ) | (360,962 | ) | (270,839 | ) | ||||||
|
Net increase (decrease) in cash and cash equivalents
|
25,276 | 12,071 | (24,694 | ) | ||||||||
|
Cash and cash equivalents at beginning of year
|
22,265 | 10,194 | 34,888 | |||||||||
|
Cash and cash equivalents at end of year
|
$47,541 | $22,265 | $10,194 | |||||||||
| Part II | 54 |
Table of Contents
|
Accumulated
|
||||||||||||||||||||||||
|
Capital in
|
Other
|
|||||||||||||||||||||||
| Common Stock 1 |
Excess of
|
Retained
|
Comprehensive
|
|||||||||||||||||||||
| in thousands, except per share data | Shares | Amount | Par Value | Earnings | Income (Loss) | Total | ||||||||||||||||||
|
Balances at December 31, 2007 (As Restated, See
Note 20)
|
108,234 | $108,234 | $1,607,865 | $2,094,916 | ($40,217 | ) | $3,770,798 | |||||||||||||||||
|
Accounting Change (Note 1, New Accounting Standards,
2008 — Retirement Benefits Measurement Date)
|
0 | 0 | 0 | (1,312 | ) | 8,981 | 7,669 | |||||||||||||||||
|
Balances at January 1, 2008 adjusted for accounting change
|
108,234 | $108,234 | $1,607,865 | $2,093,604 | ($31,236 | ) | $3,778,467 | |||||||||||||||||
|
Net earnings
|
0 | 0 | 0 | 918 | 0 | 918 | ||||||||||||||||||
|
Common stock issued
|
||||||||||||||||||||||||
|
Acquisitions
|
1,152 | 1,152 | 78,948 | 0 | 0 | 80,100 | ||||||||||||||||||
|
Share-based compensation plans
|
884 | 884 | 17,130 | 0 | 0 | 18,014 | ||||||||||||||||||
|
Share-based compensation expense
|
0 | 0 | 19,096 | 0 | 0 | 19,096 | ||||||||||||||||||
|
Excess tax benefits from share-based compensation
|
0 | 0 | 11,209 | 0 | 0 | 11,209 | ||||||||||||||||||
|
Accrued dividends on share-based compensation awards
|
0 | 0 | 593 | (593 | ) | 0 | 0 | |||||||||||||||||
|
Cash dividends on common stock
|
0 | 0 | 0 | (214,783 | ) | 0 | (214,783 | ) | ||||||||||||||||
|
Other comprehensive income
|
0 | 0 | 0 | 0 | (154,047 | ) | (154,047 | ) | ||||||||||||||||
|
Other
|
0 | 0 | (6 | ) | (2 | ) | 1 | (7 | ) | |||||||||||||||
|
Balances at December 31, 2008 (As Restated, See
Note 20)
|
110,270 | $110,270 | $1,734,835 | $1,879,144 | ($185,282 | ) | $3,538,967 | |||||||||||||||||
|
Net earnings
|
0 | 0 | 0 | 30,314 | 0 | 30,314 | ||||||||||||||||||
|
Common stock issued
|
||||||||||||||||||||||||
|
Public offering
|
13,225 | 13,225 | 506,768 | 0 | 0 | 519,993 | ||||||||||||||||||
|
Acquisitions
|
789 | 789 | 33,073 | 0 | 0 | 33,862 | ||||||||||||||||||
|
401(k) Trustee (Note 13)
|
1,135 | 1,135 | 51,556 | 0 | 0 | 52,691 | ||||||||||||||||||
|
Share-based compensation plans
|
493 | 493 | 16,279 | 0 | 0 | 16,772 | ||||||||||||||||||
|
Share-based compensation expense
|
0 | 0 | 23,120 | 0 | 0 | 23,120 | ||||||||||||||||||
|
Excess tax benefits from share-based compensation
|
0 | 0 | 2,072 | 0 | 0 | 2,072 | ||||||||||||||||||
|
Accrued dividends on share-based compensation awards
|
0 | 0 | 521 | (521 | ) | 0 | 0 | |||||||||||||||||
|
Cash dividends on common stock
|
0 | 0 | 0 | (171,468 | ) | 0 | (171,468 | ) | ||||||||||||||||
|
Other comprehensive income
|
0 | 0 | 0 | 0 | (9,075 | ) | (9,075 | ) | ||||||||||||||||
|
Other
|
0 | 0 | 4 | (14 | ) | (1 | ) | (11 | ) | |||||||||||||||
|
Balances at December 31, 2009 (As Restated, See
Note 20)
|
125,912 | $125,912 | $2,368,228 | $1,737,455 | ($194,358 | ) | $4,037,237 | |||||||||||||||||
|
Net loss
|
0 | 0 | 0 | (96,490 | ) | 0 | (96,490 | ) | ||||||||||||||||
|
Common stock issued
|
||||||||||||||||||||||||
|
401(k) Trustee (Note 13)
|
882 | 882 | 40,852 | 0 | 0 | 41,734 | ||||||||||||||||||
|
Pension plan contribution
|
1,190 | 1,190 | 52,674 | 0 | 0 | 53,864 | ||||||||||||||||||
|
Share-based compensation plans
|
586 | 586 | 17,382 | 0 | 0 | 17,968 | ||||||||||||||||||
|
Share-based compensation expense
|
0 | 0 | 20,637 | 0 | 0 | 20,637 | ||||||||||||||||||
|
Excess tax benefits from share-based compensation
|
0 | 0 | 808 | 0 | 0 | 808 | ||||||||||||||||||
|
Accrued dividends on share-based compensation awards
|
0 | 0 | 308 | (308 | ) | 0 | 0 | |||||||||||||||||
|
Cash dividends on common stock
|
0 | 0 | 0 | (127,792 | ) | 0 | (127,792 | ) | ||||||||||||||||
|
Other comprehensive income
|
0 | 0 | 0 | 0 | 17,019 | 17,019 | ||||||||||||||||||
|
Other
|
0 | 0 | (3 | ) | (2 | ) | 0 | (5 | ) | |||||||||||||||
|
Balances at December 31, 2010
|
128,570 | $128,570 | $2,500,886 | $1,512,863 | ($177,339 | ) | $3,964,980 | |||||||||||||||||
| 1 | Common stock, $1 par value, 480 million shares authorized in 2010, 2009 and 2008 |
| Part II | 55 |
Table of Contents
| NOTE 1: | SUMMARY OF SIGNIFICANT |
| ACCOUNTING POLICIES | |
| Part II | 56 |
Table of Contents
| Part II | 57 |
Table of Contents
| in thousands | 2010 | 2009 | 2008 | |||||||||
|
Depreciation, Depletion, Accretion and Amortization
|
||||||||||||
|
Depreciation
|
$349,460 | $361,530 | $365,177 | |||||||||
|
Depletion
|
10,337 | 10,143 | 7,896 | |||||||||
|
Accretion
|
8,641 | 8,802 | 7,082 | |||||||||
|
Amortization of leaseholds and
capitalized leases |
195 | 180 | 178 | |||||||||
|
Amortization of intangibles
|
13,460 | 13,957 | 8,727 | |||||||||
|
Total
|
$382,093 | $394,612 | $389,060 | |||||||||
| Level 1 | ||||||||
| in thousands | 2010 | 2009 | ||||||
|
Fair Value Recurring
|
||||||||
|
Rabbi Trust
|
||||||||
|
Mutual funds
|
$13,960 | $10,490 | ||||||
|
Equities
|
9,336 | 8,472 | ||||||
|
Net asset
|
$23,296 | $18,962 | ||||||
| Level 2 | ||||||||
| in thousands | 2010 | 2009 | ||||||
|
Fair Value Recurring
|
||||||||
|
Medium-term investments
|
$0 | $4,111 | ||||||
|
Interest rate derivative
|
0 | (11,193 | ) | |||||
|
Rabbi Trust
Common/collective trust funds |
2,431 | 4,084 | ||||||
|
Net asset (liability)
|
$2,431 | ($2,998 | ) | |||||
| Part II | 58 |
Table of Contents
| 2010 | ||||||||
|
Impairment
|
||||||||
| in thousands | Level 3 | Charges | ||||||
|
Fair Value Nonrecurring
|
||||||||
|
Property, plant & equipment
|
$1,536 | $2,500 | ||||||
|
Assets held for sale
|
9,625 | 1,436 | ||||||
|
Totals
|
$11,161 | $3,936 | ||||||
| Part II | 59 |
Table of Contents
| Part II | 60 |
Table of Contents
| in thousands | 2010 | 2009 | ||||||
|
Company Owned Life Insurance
|
||||||||
|
Cash surrender value
|
$35,421 | $32,720 | ||||||
|
Loans outstanding
|
35,410 | 32,710 | ||||||
|
Net value included in noncurrent assets
|
$11 | $10 | ||||||
| Part II | 61 |
Table of Contents
|
Unrecognized
|
Expected
|
|||||||
|
Compensation
|
Weighted-average
|
|||||||
| dollars in thousands | Expense | Recognition (Years) | ||||||
|
Share-based Compensation
|
||||||||
|
Stock options/SOSARs
|
$7,165 | 1.2 | ||||||
|
Performance shares
|
7,127 | 1.7 | ||||||
|
Deferred stock units
|
1,220 | 1.0 | ||||||
|
Total/weighted-average
|
$15,512 | 1.4 | ||||||
| in thousands | 2010 | 2009 | 2008 | |||||||||
|
Employee Share-based Compensation Awards
|
||||||||||||
|
Pretax compensation expense
|
$19,746 | $21,861 | $17,800 | |||||||||
|
Income tax benefits
|
7,968 | 8,915 | 7,038 | |||||||||
| Part II | 62 |
Table of Contents
| § | DISCOUNT RATE — The discount rate is used in calculating the present value of benefits, which is based on projections of benefit payments to be made in the future. |
| § | EXPECTED RETURN ON PLAN ASSETS — We project the future return on plan assets based principally on prior performance and our expectations for future returns for the types of investments held by the plan as well as the expected long-term asset allocation of the plan. These projected returns reduce the recorded net benefit costs. |
| § | RATE OF COMPENSATION INCREASE — For salary-related plans only, we project employees’ annual pay increases, which are used to project employees’ pension benefits at retirement. |
| § | RATE OF INCREASE IN THE PER CAPITA COST OF COVERED HEALTHCARE BENEFITS — We project the expected increases in the cost of covered healthcare benefits. |
| Part II | 63 |
Table of Contents
| dollars in thousands | 2010 | 2009 | ||||||
|
Self-insurance Program
|
||||||||
|
Liabilities (undiscounted)
|
$70,174 | $60,072 | ||||||
|
Discount rate
|
1.01% | 1.77% | ||||||
|
Amounts Recognized in Consolidated
Balance Sheets |
||||||||
|
Other accrued liabilities
|
$36,699 | $17,610 | ||||||
|
Other noncurrent liabilities
|
31,990 | 39,388 | ||||||
|
Accrued liabilities (discounted)
|
$68,689 | $56,998 | ||||||
| in thousands | ||||
|
Estimated Payments under Self-insurance Program
|
||||
|
2011
|
$37,728 | |||
|
2012
|
8,534 | |||
|
2013
|
6,046 | |||
|
2014
|
4,320 | |||
|
2015
|
2,919 | |||
| § | prior earnings history |
| § | expected future taxable income |
| § | mix of taxable income in the jurisdictions in which we operate |
| § | carryback and carryforward periods |
| Part II | 64 |
Table of Contents
| § | tax strategies that could potentially enhance the likelihood of realization of a deferred tax asset |
| Part II | 65 |
Table of Contents
| in thousands | 2010 | 2009 | 2008 | |||||||||
|
Weighted-average common shares outstanding
|
128,050 | 118,891 | 109,774 | |||||||||
|
Dilutive effect of
Stock options/SOSARs |
0 | 269 | 905 | |||||||||
|
Other stock compensation plans
|
0 | 270 | 275 | |||||||||
|
Weighted-average common shares outstanding, assuming dilution
|
128,050 | 119,430 | 110,954 | |||||||||
| in thousands | 2010 | 2009 | 2008 | |||||||||
|
Antidilutive common stock equivalents
|
5,827 | 3,661 | 2,130 | |||||||||
| Part II | 66 |
Table of Contents
| NOTE 2: | DISCONTINUED OPERATIONS |
| Part II | 67 |
Table of Contents
| in thousands | 2010 | 2009 | 2008 | |||||||||
|
Discontinued Operations
|
||||||||||||
|
Pretax earnings (loss) from results
|
$2,103 | $18,872 | ($4,059 | ) | ||||||||
|
Gain on disposal, net of transaction bonus
|
7,912 | 584 | 0 | |||||||||
|
Income tax (provision) benefit
|
(3,962 | ) | (7,790 | ) | 1,610 | |||||||
|
Earnings (loss) on discontinued operations,
net of income taxes |
$6,053 | $11,666 | ($2,449 | ) | ||||||||
| NOTE 3: | INVENTORIES |
| in thousands | 2010 | 2009 | ||||||
|
Inventories
|
||||||||
|
Finished products
|
$254,840 | $261,752 | ||||||
|
Raw materials
|
22,222 | 21,807 | ||||||
|
Products in process
|
6,036 | 3,907 | ||||||
|
Operating supplies and other
|
36,747 | 37,567 | ||||||
|
Total
|
$319,845 | $325,033 | ||||||
| Part II | 68 |
Table of Contents
| NOTE 4: | PROPERTY, PLANT & EQUIPMENT |
| in thousands | 2010 | 2009 | ||||||
|
Property, Plant & Equipment
|
||||||||
|
Land and land improvements
|
$2,096,046 | $2,080,457 | ||||||
|
Buildings
|
159,458 | 152,615 | ||||||
|
Machinery and equipment
|
4,222,242 | 4,091,209 | ||||||
|
Leaseholds
|
7,458 | 7,231 | ||||||
|
Deferred asset retirement costs
|
142,441 | 147,992 | ||||||
|
Construction in progress
|
65,169 | 173,757 | ||||||
|
Total, gross
|
$6,692,814 | $6,653,261 | ||||||
|
Less allowances for depreciation, depletion
and amortization |
3,059,900 | 2,778,590 | ||||||
|
Total, net
|
$3,632,914 | $3,874,671 | ||||||
| in thousands | 2010 | 2009 | 2008 | |||||||||
|
Capitalized interest cost
|
$3,637 | $10,721 | $14,243 | |||||||||
|
Total interest cost incurred before recognition
of the capitalized amount |
185,240 | 185,983 | 187,056 | |||||||||
| Part II | 69 |
Table of Contents
| NOTE 5: | DERIVATIVE INSTRUMENTS |
| Fair Value 1 | ||||||||||
| in thousands | Balance Sheet Location | 2010 | 2009 | |||||||
|
Liability Derivatives
|
||||||||||
|
Interest rate derivatives
|
Other accrued liabilities | $0 | $11,193 | |||||||
|
Total
|
$0 | $11,193 | ||||||||
| 1 | See Note 1 (caption Fair Value Measurements) for further discussion of the fair value determination. |
| in thousands | Location on Statement | 2010 | 2009 | 2008 | ||||||||||
|
Interest Rate Derivatives
|
||||||||||||||
|
Loss recognized in OCI (effective portion)
|
Note 14 | ($882 | ) | ($4,633 | ) | ($12,439 | ) | |||||||
|
Loss reclassified from accumulated OCI (effective portion)
|
Interest expense | (19,619 | ) | (16,776 | ) | (9,142 | ) | |||||||
|
Gain recognized in earnings
(ineffective portion and amounts excluded from effectiveness test) |
Other income
(expense), net |
0 | 0 | 2,169 | ||||||||||
| Part II | 70 |
Table of Contents
BORROWINGS AND LONG-TERM DEBT
| dollars in thousands | 2010 | 2009 | ||||||
|
Short-term Borrowings
|
||||||||
|
Bank borrowings
|
$285,500 | $0 | ||||||
|
Commercial paper
|
0 | 236,512 | ||||||
|
Total
|
$285,500 | $236,512 | ||||||
|
Bank Borrowings
|
||||||||
|
Maturity
|
3-74 days | n/a | ||||||
|
Weighted-average interest rate
|
0.59% | n/a | ||||||
|
Commercial Paper
|
||||||||
|
Maturity
|
n/a | 42 days | ||||||
|
Weighted-average interest rate
|
n/a | 0.39% | ||||||
| Part II | 71 |
Table of Contents
| in thousands | 2010 | 2009 | ||||||
|
Long-term Debt
|
||||||||
|
5-year
floating term loan issued 2010
|
$450,000 | $0 | ||||||
|
10.125% 2015 notes issued
2009
1
|
149,597 | 149,538 | ||||||
|
10.375% 2018 notes issued
2009
2
|
248,391 | 248,270 | ||||||
|
3-year
floating term loan issued 2008
|
0 | 175,000 | ||||||
|
6.30%
5-year
notes issued
2008
3
|
249,729 | 249,632 | ||||||
|
7.00%
10-year
notes issued
2008
4
|
399,658 | 399,625 | ||||||
|
3-year
floating notes issued 2007
|
0 | 325,000 | ||||||
|
5.60%
5-year
notes issued
2007
5
|
299,773 | 299,666 | ||||||
|
6.40%
10-year
notes issued
2007
6
|
349,852 | 349,837 | ||||||
|
7.15%
30-year
notes issued
2007
7
|
249,324 | 249,317 | ||||||
|
Private placement notes
|
0 | 15,243 | ||||||
|
Medium-term notes
|
21,000 | 21,000 | ||||||
|
Industrial revenue bonds
|
14,000 | 17,550 | ||||||
|
Other notes
|
1,438 | 1,823 | ||||||
|
Total debt excluding short-term borrowings
|
$2,432,762 | $2,501,501 | ||||||
|
Less current maturities of long-term debt
|
5,246 | 385,381 | ||||||
|
Total long-term debt
|
$2,427,516 | $2,116,120 | ||||||
|
Estimated fair value of long-term debt
|
$2,559,059 | $2,300,522 | ||||||
| 1 | Includes decreases for unamortized discounts, as follows: December 31, 2010 — $403 thousand and December 31, 2009 — $462 thousand. The effective interest rate for these 2015 notes is 10.31%. | |
| 2 | Includes decreases for unamortized discounts, as follows: December 31, 2010 — $1,609 thousand and December 31, 2009 — $1,730 thousand. The effective interest rate for these 2018 notes is 10.58%. | |
| 3 | Includes decreases for unamortized discounts, as follows: December 31, 2010 — $271 thousand and December 31, 2009 — $368 thousand. The effective interest rate for these 5-year notes is 7.47%. | |
| 4 | Includes decreases for unamortized discounts, as follows: December 31, 2010 — $342 thousand and December 31, 2009 — $375 thousand. The effective interest rate for these 10-year notes is 7.86%. | |
| 5 | Includes decreases for unamortized discounts, as follows: December 31, 2010 — $227 thousand and December 31, 2009 — $334 thousand. The effective interest rate for these 5-year notes is 6.58%. | |
| 6 | Includes decreases for unamortized discounts, as follows: December 31, 2010 — $148 thousand and December 31, 2009 — $163 thousand. The effective interest rate for these 10-year notes is 7.39%. | |
| 7 | Includes decreases for unamortized discounts, as follows: December 31, 2010 — $676 thousand and December 31, 2009 — $683 thousand. The effective interest rate for these 30-year notes is 8.04%. |
| Part II | 72 |
Table of Contents
| Part II | 73 |
Table of Contents
| in thousands | Total | Principal | Interest | |||||||||
|
Payments of Long-term Debt
|
||||||||||||
|
2011
|
$161,622 | $5,246 | $156,376 | |||||||||
|
2012
|
459,551 | 300,202 | 159,349 | |||||||||
|
2013
|
427,529 | 290,166 | 137,363 | |||||||||
|
2014
|
170,904 | 40,177 | 130,727 | |||||||||
|
2015
|
650,558 | 530,145 | 120,413 | |||||||||
| NOTE 7: | OPERATING LEASES |
| in thousands | 2010 | 2009 | 2008 | |||||||||
|
Operating Leases
|
||||||||||||
|
Minimum rentals
|
$33,573 | $36,976 | $34,263 | |||||||||
|
Contingent rentals (based principally on usage)
|
27,418 | 25,846 | 39,169 | |||||||||
|
Total
|
$60,991 | $62,822 | $73,432 | |||||||||
| in thousands | ||||
|
Future Minimum Operating Lease Payments
|
||||
|
2011
|
$26,564 | |||
|
2012
|
21,426 | |||
|
2013
|
16,014 | |||
|
2014
|
8,115 | |||
|
2015
|
5,466 | |||
|
Thereafter
|
25,921 | |||
|
Total
|
$103,506 | |||
| Part II | 74 |
Table of Contents
REMEDIATION COSTS
| in thousands | 2010 | 2009 | ||||||
|
Accrued Environmental Remediation Costs
|
||||||||
|
Continuing operations
|
$6,138 | $7,830 | ||||||
|
Retained from former Chemicals business
|
4,645 | 5,001 | ||||||
|
Total
|
$10,783 | $12,831 | ||||||
| NOTE 9: | INCOME TAXES |
| in thousands | 2010 | 2009 | 2008 | |||||||||
|
Earnings (Loss) from Continuing
Operations before Income Taxes |
||||||||||||
|
Domestic
|
($213,598 | ) | ($43,180 | ) | $45,445 | |||||||
|
Foreign
|
21,392 | 23,959 | 29,613 | |||||||||
|
Total
|
($192,206 | ) | ($19,221 | ) | $75,058 | |||||||
| in thousands | 2010 | 2009 | 2008 | |||||||||
|
Provision (Benefit) for Income Taxes
for Continuing Operations |
||||||||||||
|
Current
|
||||||||||||
|
Federal
|
($46,671 | ) | ($3,965 | ) | $64,428 | |||||||
|
State and local
|
3,909 | 7,034 | 20,883 | |||||||||
|
Foreign
|
4,957 | 3,037 | 7,035 | |||||||||
|
Total
|
(37,805 | ) | 6,106 | 92,346 | ||||||||
|
Deferred
|
||||||||||||
|
Federal
|
(52,344 | ) | (37,790 | ) | (18,978 | ) | ||||||
|
State and local
|
1,422 | (5,794 | ) | (1,724 | ) | |||||||
|
Foreign
|
(936 | ) | (391 | ) | 47 | |||||||
|
Total
|
(51,858 | ) | (43,975 | ) | (20,655 | ) | ||||||
|
Total provision (benefit)
|
($89,663 | ) | ($37,869 | ) | $71,691 | |||||||
| Part II | 75 |
Table of Contents
| dollars in thousands | 2010 | 2009 | 2008 | |||||||||||||||||||||
|
Income tax provision (benefit) at the federal statutory tax rate
of 35%
|
($67,272 | ) | 35.0% | ($6,727 | ) | 35.0% | $26,272 | 35.0% | ||||||||||||||||
|
Increase (Decrease) in Income Tax Provision (Benefit)
Resulting from
|
||||||||||||||||||||||||
|
Statutory depletion
|
(20,301 | ) | 10.6% | (19,464 | ) | 101.3% | (28,063 | ) | -37.4% | |||||||||||||||
|
State and local income taxes, net of federal income tax benefit
|
3,465 | -1.8% | 1,457 | -7.6% | 11,127 | 14.8% | ||||||||||||||||||
|
Nondeductible expense
|
1,583 | -0.8% | 1,694 | -8.8% | 1,619 | 2.2% | ||||||||||||||||||
|
Goodwill impairment
|
0 | 0.0% | 0 | 0.0% | 65,031 | 86.6% | ||||||||||||||||||
|
ESOP dividend deduction
|
(1,665 | ) | 0.9% | (2,408 | ) | 12.5% | (3,017 | ) | -4.0% | |||||||||||||||
|
U.S. Production Activities deduction
|
0 | 0.0% | 0 | 0.0% | (2,203 | ) | -2.9% | |||||||||||||||||
|
Recapture U.S. Production Activities deduction (2007 and 2008)
|
2,993 | -1.6% | 0 | 0.0% | 0 | 0.0% | ||||||||||||||||||
|
Fair market value over tax basis of contributions
|
(3,223 | ) | 1.7% | (2,931 | ) | 15.3% | (3,814 | ) | -5.1% | |||||||||||||||
|
Foreign tax rate differential
|
(3,331 | ) | 1.7% | (4,461 | ) | 23.2% | (4,955 | ) | -6.6% | |||||||||||||||
|
Tax loss on sale of stock — divestiture
|
0 | 0.0% | (4,143 | ) | 21.6% | 0 | 0.0% | |||||||||||||||||
|
Reversal cash surrender value — COLI plans
|
(448 | ) | 0.2% | (412 | ) | 2.1% | (486 | ) | -0.6% | |||||||||||||||
|
Prior year true up adjustments
|
(1,095 | ) | 0.6% | 375 | -2.0% | 1,932 | 2.5% | |||||||||||||||||
|
Provision (benefit) for uncertain tax positions
|
1,017 | -0.5% | (451 | ) | 2.3% | 1,516 | 2.0% | |||||||||||||||||
|
Gain on sale of goodwill on divested assets
|
0 | 0.0% | 0 | 0.0% | 6,937 | 9.3% | ||||||||||||||||||
|
Other
|
(1,386 | ) | 0.6% | (398 | ) | 2.1% | (205 | ) | -0.3% | |||||||||||||||
|
Total income tax provision (benefit)
|
($89,663 | ) | 46.6% | ($37,869 | ) | 197.0% | $71,691 | 95.5% | ||||||||||||||||
| Part II | 76 |
Table of Contents
| in thousands | 2010 | 2009 | ||||||
| (As Restated See Note 20) | ||||||||
|
Deferred Tax Assets Related to
|
||||||||
|
Pensions
|
$21,630 | $63,881 | ||||||
|
Other postretirement benefits
|
52,366 | 46,718 | ||||||
|
Accruals for asset retirement obligations and environmental
accruals
|
28,605 | 23,128 | ||||||
|
Accounts receivable, principally allowance for doubtful accounts
|
2,770 | 3,165 | ||||||
|
Deferred compensation, vacation pay and incentives
|
77,793 | 65,308 | ||||||
|
Interest rate swaps
|
27,022 | 34,468 | ||||||
|
Self-insurance reserves
|
31,445 | 19,022 | ||||||
|
Federal net operating loss carryforward
|
25,629 | 0 | ||||||
|
State net operating loss carryforwards
|
26,663 | 12,459 | ||||||
|
Valuation allowance on state net operating loss carryforwards
|
(20,721 | ) | (10,768 | ) | ||||
|
Other
|
35,740 | 24,070 | ||||||
|
Total deferred tax assets
|
308,942 | 281,451 | ||||||
|
Deferred Tax Liabilities Related to
|
||||||||
|
Inventory
|
1,768 | 6,134 | ||||||
|
Fixed assets
|
820,627 | 850,799 | ||||||
|
Intangible assets
|
269,207 | 250,189 | ||||||
|
Other
|
12,994 | 12,286 | ||||||
|
Total deferred tax liabilities
|
1,104,596 | 1,119,408 | ||||||
|
Net deferred tax liability
|
$795,654 | $837,957 | ||||||
| in thousands | 2010 | 2009 | ||||||
| (As Restated See Note 20) | ||||||||
|
Deferred Income Taxes
|
||||||||
|
Current assets
|
($53,794 | ) | ($56,017 | ) | ||||
|
Deferred liabilities
|
849,448 | 893,974 | ||||||
|
Net deferred tax liability
|
$795,654 | $837,957 | ||||||
| Part II | 77 |
Table of Contents
| in thousands | 2010 | 2009 | 2008 | |||||||||
|
Unrecognized income tax benefits
as of January 1 |
$20,974 | $18,131 | $7,480 | |||||||||
|
Increases for tax positions related to
|
||||||||||||
|
Prior years
|
14,685 | 1,108 | 482 | |||||||||
|
Current year
|
1,447 | 5,667 | 6,189 | |||||||||
|
Acquisitions
|
0 | 0 | 5,250 | |||||||||
|
Decreases for tax positions related to
|
||||||||||||
|
Prior years
|
(8,028 | ) | (9 | ) | (1,009 | ) | ||||||
|
Current year
|
0 | 0 | 0 | |||||||||
|
Settlements with taxing authorities
|
0 | (482 | ) | (261 | ) | |||||||
|
Expiration of applicable statute of limitations
|
(1,003 | ) | (3,441 | ) | 0 | |||||||
|
Unrecognized income tax benefits
as of December 31 |
$28,075 | $20,974 | $18,131 | |||||||||
| Part II | 78 |
Table of Contents
| NOTE 10: | BENEFIT PLANS |
| in thousands | 2010 | 2009 | ||||||
|
Change in Benefit Obligation
|
||||||||
|
Projected benefit obligation at beginning of year
|
$709,783 | $620,845 | ||||||
|
Service cost
|
19,217 | 18,638 | ||||||
|
Interest cost
|
41,621 | 41,941 | ||||||
|
Actuarial loss
|
27,094 | 61,019 | ||||||
|
Benefits paid
|
(36,331 | ) | (32,660 | ) | ||||
|
Projected benefit obligation at end of year
|
$761,384 | $709,783 | ||||||
|
Change in Plan Assets
|
||||||||
|
Fair value of assets at beginning of year
|
$493,646 | $418,977 | ||||||
|
Actual return on plan assets
|
94,629 | 79,713 | ||||||
|
Employer contribution
|
78,359 | 27,616 | ||||||
|
Benefits paid
|
(36,331 | ) | (32,660 | ) | ||||
|
Fair value of assets at end of year
|
$630,303 | $493,646 | ||||||
|
Funded status
|
($131,081 | ) | ($216,137 | ) | ||||
|
Net amount recognized
|
($131,081 | ) | ($216,137 | ) | ||||
|
Amounts Recognized in the Consolidated
Balance Sheets |
||||||||
|
Noncurrent assets
|
$1,083 | $0 | ||||||
|
Current liabilities
|
(5,028 | ) | (4,104 | ) | ||||
|
Noncurrent liabilities
|
(127,136 | ) | (212,033 | ) | ||||
|
Net amount recognized
|
($131,081 | ) | ($216,137 | ) | ||||
|
Amounts Recognized in Accumulated
Other Comprehensive Income |
||||||||
|
Net actuarial loss
|
$202,135 | $225,301 | ||||||
|
Prior service cost
|
938 | 1,398 | ||||||
|
Total amount recognized
|
$203,073 | $226,699 | ||||||
| Part II | 79 |
Table of Contents
| dollars in thousands | 2010 | 2009 | 2008 | ||||||||||
|
Components of Net Periodic Pension
Benefit Cost |
|||||||||||||
|
Service cost
|
$19,217 | $18,638 | $19,166 | ||||||||||
|
Interest cost
|
41,621 | 41,941 | 39,903 | ||||||||||
|
Expected return on plan assets
|
(50,122 | ) | (46,505 | ) | (51,916 | ) | |||||||
|
Amortization of prior service cost
|
460 | 460 | 460 | ||||||||||
|
Amortization of actuarial loss
|
5,752 | 1,651 | 560 | ||||||||||
|
Net periodic pension benefit cost
|
$16,928 | $16,185 | $8,173 | ||||||||||
|
Changes in Plan Assets and Benefit
Obligations Recognized in Other Comprehensive Income |
|||||||||||||
|
Net actuarial loss (gain)
|
($17,413 | ) | $27,811 | $259,308 | |||||||||
|
Prior service credit
|
0 | 0 | 0 | ||||||||||
|
Reclassification of actuarial loss to net
periodic pension benefit cost |
(5,752 | ) | (1,651 | ) | (560 | ) | |||||||
|
Reclassification of prior service cost to net
periodic pension benefit cost |
(460 | ) | (460 | ) | (460 | ) | |||||||
|
Amount recognized in other comprehensive income
|
($23,625 | ) | $25,700 | $258,288 | |||||||||
|
Amount recognized in net periodic pension
benefit cost and other comprehensive income |
($6,697 | ) | $41,885 | $266,461 | |||||||||
|
Assumptions
|
|||||||||||||
|
Weighted-average assumptions used to
determine net periodic benefit cost for years ended December 31 |
|||||||||||||
|
Discount rate
|
5.92% | 6.60% | 6.45% | ||||||||||
|
Expected return on plan assets
|
8.25% | 8.25% | 8.25% | ||||||||||
|
Rate of compensation increase
(for salary-related plans) |
3.40% | 4.75% | 4.75% | ||||||||||
|
Weighted-average assumptions used to
determine benefit obligation at December 31 |
|||||||||||||
|
Discount rate
|
5.49% | 5.92% | |||||||||||
|
Rate of compensation increase
(for salary-related plans) |
3.50% | 3.40% | |||||||||||
| Part II | 80 |
Table of Contents
| in thousands | Total | Level 1 1 | Level 2 1 | Level 3 1 | ||||||||||||
|
Asset Category
|
||||||||||||||||
|
Debt securities
|
$127,501 | $0 | $127,193 | $308 | ||||||||||||
|
Investment funds
|
||||||||||||||||
|
Bond funds
|
0 | 0 | 0 | 0 | ||||||||||||
|
Commodity funds
|
29,270 | 0 | 29,270 | 0 | ||||||||||||
|
Equity funds
|
361,318 | 128 | 361,190 | 0 | ||||||||||||
|
Short-term funds
|
15,967 | 2 | 15,965 | 0 | ||||||||||||
|
Venture capital and partnerships
|
96,244 | 0 | 0 | 96,244 | ||||||||||||
|
Other
|
3 | 0 | 3 | 0 | ||||||||||||
|
Total pension plan assets
|
$630,303 | $130 | $533,621 | $96,552 | ||||||||||||
| 1 | See Note 1 under the caption Fair Value Measurements for a description of the fair value hierarchy. |
| in thousands | Total | Level 1 1 | Level 2 1 | Level 3 1 | ||||||||||||
|
Asset Category
|
||||||||||||||||
|
Debt securities
|
$163,967 | $0 | $163,647 | $320 | ||||||||||||
|
Investment funds
|
||||||||||||||||
|
Bond funds
|
4,650 | 4,647 | 3 | 0 | ||||||||||||
|
Commodity funds
|
23,093 | 0 | 23,093 | 0 | ||||||||||||
|
Equity funds
|
166,005 | 0 | 166,005 | 0 | ||||||||||||
|
Short-term funds
|
37,308 | 0 | 37,308 | 0 | ||||||||||||
|
Venture capital and partnerships
|
93,262 | 0 | 0 | 93,262 | ||||||||||||
|
Other
|
5,361 | 1,995 | 3,366 | 0 | ||||||||||||
|
Total pension plan assets
|
$493,646 | $6,642 | $393,422 | $93,582 | ||||||||||||
| 1 | See Note 1 under the caption Fair Value Measurements for a description of the fair value hierarchy. |
| Part II | 81 |
Table of Contents
| Part II | 82 |
Table of Contents
USING SIGNIFICANT UNOBSERVABLE INPUTS (LEVEL 3)
|
Venture
|
||||||||||||
|
Debt
|
Capital and
|
|||||||||||
| in thousands | Securities | Partnerships | Total | |||||||||
|
Balance at December 31, 2008
|
$342 | $94,744 | $95,086 | |||||||||
|
Actual return on plan assets
|
||||||||||||
|
Relating to assets still held at December 31, 2009
|
2 | (7,793 | ) | (7,791 | ) | |||||||
|
Relating to assets sold during the year ended December 31,
2009
|
0 | 0 | 0 | |||||||||
|
Purchases, sales and settlements
|
(24 | ) | 6,311 | 6,287 | ||||||||
|
Transfers in (out) of Level 3
|
0 | 0 | 0 | |||||||||
|
Balance at December 31, 2009
|
$320 | $93,262 | $93,582 | |||||||||
|
Actual return on plan assets
|
||||||||||||
|
Relating to assets still held at December 31, 2010
|
1 | 4,727 | 4,728 | |||||||||
|
Relating to assets sold during the year ended December 31,
2010
|
0 | 0 | 0 | |||||||||
|
Purchases, sales and settlements
|
(13 | ) | (1,745 | ) | (1,758 | ) | ||||||
|
Transfers in (out) of Level 3
|
0 | 0 | 0 | |||||||||
|
Balance at December 31, 2010
|
$308 | $96,244 | $96,552 | |||||||||
| in thousands | Pension | |||
|
Employer Contributions
|
||||
|
2008
|
$3,127 | |||
|
2009
|
27,616 | |||
|
2010
|
78,359 | |||
|
2011 (estimated)
|
5,028 | |||
| in thousands | Pension | |||
|
Estimated Future Benefit Payments
|
||||
|
2011
|
$38,653 | |||
|
2012
|
40,755 | |||
|
2013
|
41,184 | |||
|
2014
|
51,901 | |||
|
2015
|
49,700 | |||
|
2016-2020
|
273,109 | |||
| Part II | 83 |
Table of Contents
| in thousands | 2010 | 2009 | ||||||
|
Change in Benefit Obligation
|
||||||||
|
Projected benefit obligation at beginning of year
|
$118,313 | $112,837 | ||||||
|
Service cost
|
4,265 | 3,912 | ||||||
|
Interest cost
|
6,651 | 7,045 | ||||||
|
Actuarial loss
|
11,730 | 974 | ||||||
|
Benefits paid
|
(7,242 | ) | (6,455 | ) | ||||
|
Projected benefit obligation at end of year
|
$133,717 | $118,313 | ||||||
|
Change in Plan Assets
|
||||||||
|
Fair value of assets at beginning of year
|
$0 | $0 | ||||||
|
Actual return on plan assets
|
0 | 0 | ||||||
|
Fair value of assets at end of year
|
$0 | $0 | ||||||
|
Funded status
|
($133,717 | ) | ($118,313 | ) | ||||
|
Net amount recognized
|
($133,717 | ) | ($118,313 | ) | ||||
|
Amounts Recognized in the Consolidated Balance Sheets
|
||||||||
|
Current liabilities
|
($9,100 | ) | ($8,323 | ) | ||||
|
Noncurrent liabilities
|
(124,617 | ) | (109,990 | ) | ||||
|
Net amount recognized
|
($133,717 | ) | ($118,313 | ) | ||||
|
Amounts Recognized in Accumulated Other Comprehensive
Income
|
||||||||
|
Net actuarial loss
|
$30,008 | $19,165 | ||||||
|
Prior service credit
|
(4,815 | ) | (5,543 | ) | ||||
|
Total amount recognized
|
$25,193 | $13,622 | ||||||
| Part II | 84 |
Table of Contents
| dollars in thousands | 2010 | 2009 | 2008 | |||||||||
|
Components of Net Periodic Postretirement Benefit Cost
|
||||||||||||
|
Service cost
|
$4,265 | $3,912 | $5,224 | |||||||||
|
Interest cost
|
6,651 | 7,045 | 6,910 | |||||||||
|
Expected return on plan assets
|
0 | 0 | 0 | |||||||||
|
Amortization of prior service credit
|
(728 | ) | (823 | ) | (839 | ) | ||||||
|
Amortization of actuarial loss
|
887 | 598 | 1,020 | |||||||||
|
Net periodic postretirement benefit cost
|
$11,075 | $10,732 | $12,315 | |||||||||
|
Changes in Plan Assets and Benefit Obligations Recognized in
Other Comprehensive Income
|
||||||||||||
|
Net actuarial loss (gain)
|
$11,730 | $974 | ($3,792 | ) | ||||||||
|
Prior service cost
|
0 | 0 | 100 | |||||||||
|
Reclassification of actuarial loss to net periodic
postretirement benefit cost
|
(887 | ) | (598 | ) | (1,020 | ) | ||||||
|
Reclassification of prior service credit to net periodic
postretirement benefit cost
|
728 | 823 | 839 | |||||||||
|
Amount recognized in other comprehensive income
|
$11,571 | $1,199 | ($3,873 | ) | ||||||||
|
Amount recognized in net periodic postretirement benefit cost
and other comprehensive income
|
$22,646 | $11,931 | $8,442 | |||||||||
|
Assumptions
|
||||||||||||
|
Assumed Healthcare Cost Trend Rates at December 31
|
||||||||||||
|
Healthcare cost trend rate assumed for next year
|
8.00% | 8.50% | 9.00% | |||||||||
|
Rate to which the cost trend rate gradually declines
|
5.00% | 5.00% | 5.00% | |||||||||
|
Year that the rate reaches the rate it is assumed to maintain
|
2017 | 2017 | 2017 | |||||||||
|
Weighted-average assumptions used to determine net periodic
benefit cost for years ended December 31
|
||||||||||||
|
Discount rate
|
5.45% | 6.65% | 6.10% | |||||||||
|
Weighted-average assumptions used to determine benefit
obligation at December 31
|
||||||||||||
|
Discount rate
|
4.95% | 5.45% | 6.65% | |||||||||
| Part II | 85 |
Table of Contents
|
One-percentage-point
|
One-percentage-point
|
|||||||
| in thousands | Increase | Decrease | ||||||
|
Effect on total of service and interest cost
|
$1,137 | ($992 | ) | |||||
|
Effect on postretirement benefit obligation
|
12,144 | (10,745 | ) | |||||
| in thousands | Postretirement | |||
|
Employer Contributions
|
||||
|
2008
|
$6,389 | |||
|
2009
|
6,455 | |||
|
2010
|
7,242 | |||
|
2011 (estimated)
|
9,100 | |||
| in thousands | Postretirement | |||
|
Estimated Future Benefit Payments
|
||||
|
2011
|
$9,100 | |||
|
2012
|
9,609 | |||
|
2013
|
9,966 | |||
|
2014
|
11,187 | |||
|
2015
|
11,085 | |||
|
2016–2020
|
63,356 | |||
| in thousands | Postretirement | |||
|
Participants Contributions
|
||||
|
2008
|
$1,460 | |||
|
2009
|
1,673 | |||
|
2010
|
1,829 | |||
| Part II | 86 |
Table of Contents
|
Weighted-average
|
|||||||||
|
Number
|
Grant Date
|
||||||||
| of Shares | Fair Value | ||||||||
|
Deferred Stock Units
|
|||||||||
|
Nonvested at January 1, 2010
|
173,502 | $43.19 | |||||||
|
Granted
|
0 | $0.00 | |||||||
|
Dividend equivalents accrued
|
5,686 | $44.77 | |||||||
|
Vested
|
(58,808 | ) | $40.54 | ||||||
|
Canceled/forfeited
|
(143 | ) | $39.49 | ||||||
|
Nonvested at December 31, 2010
|
120,237 | $44.45 | |||||||
| Part II | 87 |
Table of Contents
|
Target
|
Weighted-average
|
||||||||
|
Number
|
Grant Date
|
||||||||
| of Shares | Fair Value | ||||||||
|
Performance Shares
|
|||||||||
|
Nonvested at January 1, 2010
|
373,558 | $54.34 | |||||||
|
Granted
|
237,940 | $40.34 | |||||||
|
Vested
|
(138,697 | ) | $68.41 | ||||||
|
Canceled/forfeited
|
(15,230 | ) | $48.06 | ||||||
|
Nonvested at December 31, 2010
|
457,571 | $42.99 | |||||||
| 2010 | 2009 | 2008 | |||||||||||
|
Stock Options/SOSARs
|
|||||||||||||
|
Fair value
|
$12.05 | $14.74 | $19.76 | ||||||||||
|
Risk-free interest rate
|
3.15% | 2.14% | 3.21% | ||||||||||
|
Dividend yield
|
2.00% | 2.22% | 2.07% | ||||||||||
|
Volatility
|
27.58% | 35.04% | 28.15% | ||||||||||
|
Expected term
|
7.50 years | 7.50 years | 7.25 years | ||||||||||
| Part II | 88 |
Table of Contents
|
Weighted-average
|
||||||||||||||||
|
Remaining
|
Aggregate
|
|||||||||||||||
|
Number
|
Weighted-average
|
Contractual
|
Intrinsic Value
|
|||||||||||||
| of Shares | Exercise Price | Life (Years) | (in thousands) | |||||||||||||
|
Stock Options/SOSARs
|
||||||||||||||||
|
Outstanding at January 1, 2010
|
6,432,576 | $56.17 | ||||||||||||||
|
Granted
|
602,920 | $43.05 | ||||||||||||||
|
Exercised
|
(474,080 | ) | $43.40 | |||||||||||||
|
Forfeited or expired
|
(82,120 | ) | $49.76 | |||||||||||||
|
Outstanding at December 31, 2010
|
6,479,296 | $55.97 | 4.86 | $6,885 | ||||||||||||
|
Vested and expected to vest
|
6,468,206 | $55.99 | 4.85 | $6,872 | ||||||||||||
|
Exercisable at December 31, 2010
|
5,085,701 | $58.23 | 3.88 | $6,017 | ||||||||||||
| in thousands | 2010 | 2009 | 2008 | |||||||||
|
Aggregate intrinsic value of options exercised
|
$1,830 | $4,903 | $23,714 | |||||||||
| in thousands | 2010 | 2009 | 2008 | |||||||||
|
Stock Options/SOSARs
|
||||||||||||
|
Cash and stock consideration received from exercises
|
$20,502 | $22,719 | $29,278 | |||||||||
|
Tax benefit from exercises
|
733 | 1,965 | 9,502 | |||||||||
|
Compensation cost
|
11,288 | 15,195 | 10,367 | |||||||||
| Part II | 89 |
Table of Contents
CONTINGENCIES
|
Unconditional
|
||||
|
Purchase
|
||||
| in thousands | Obligations | |||
|
Property, Plant & Equipment
|
||||
|
2011
|
$9,812 | |||
|
Thereafter
|
0 | |||
|
Total
|
$9,812 | |||
|
Noncapital
|
||||
|
2011
|
$21,208 | |||
|
2012–2013
|
23,620 | |||
|
2014–2015
|
10,519 | |||
|
Thereafter
|
12,950 | |||
|
Total
|
$68,297 | |||
|
Mineral
|
||||
| in thousands | Leases | |||
|
Mineral Royalties
|
||||
|
2011
|
$19,270 | |||
|
2012–2013
|
37,010 | |||
|
2014–2015
|
32,144 | |||
|
Thereafter
|
138,749 | |||
|
Total
|
$227,173 | |||
| in thousands | ||||
|
Standby Letters of Credit
|
||||
|
Risk management requirement for insurance claims
|
$40,412 | |||
|
Payment surety required by utilities
|
133 | |||
|
Contractual reclamation/restoration requirements
|
10,111 | |||
|
Financing requirement for industrial revenue bond
|
14,230 | |||
|
Total standby letters of credit
|
$64,886 | |||
| Part II | 90 |
Table of Contents
| Part II | 91 |
Table of Contents
| § | CALIFORNIA WATER SERVICE COMPANY — On June 6, 2008, we were served in an action styled California Water Service Company v. Dow, et al. , now pending in the San Mateo County Superior Court, California. According to the complaint, California Water Service Company “owns and/or operates public drinking water systems, and supplies drinking water to hundreds of thousands of residents and businesses throughout California.” The complaint alleges that water systems in a number of communities have been contaminated with perc. The plaintiff is seeking compensatory damages and punitive damages. Discovery is ongoing. |
| § | CITY OF SUNNYVALE CALIFORNIA — On January 6, 2009, we were served in an action styled City of Sunnyvale v. Legacy Vulcan Corporation, f/k/a Vulcan Materials Company , filed in the San Mateo County Superior Court, California. The plaintiffs are seeking cost recovery and other damages for alleged environmental contamination from perc and its breakdown products at the Sunnyvale Town Center Redevelopment Project. Discovery is ongoing. A trial date of January 9, 2012 has been set. |
| § | SUFFOLK COUNTY WATER AUTHORITY — On May 4, 2010, we were served in an action styled Suffolk County Water Authority v. The Dow Chemical Company, et al ., in the United States District Court for the Eastern District of New York. This case was subsequently dismissed and refiled in the Supreme Court for Suffolk County, State of New York. The complaint alleges that the plaintiff “owns and/or operates drinking water systems and supplies drinking water to thousands of residents and businesses, in Suffolk County, New York.” The complaint alleges that perc and its degradation products “have been and are contaminating and damaging Plaintiff’s drinking water supply wells.” The plaintiff is seeking compensatory and punitive damages. Discovery is ongoing. |
| § | UNITED STATES VIRGIN ISLANDS |
| § | ADDAIR — This is a purported class action case for medical monitoring and personal injury damages styled Addair et al. v. Processing Company, LLC, et al ., pending in the Circuit Court of Wyoming County, West Virginia. The plaintiffs allege |
| Part II | 92 |
Table of Contents
| various personal injuries from exposure to perc used in coal sink labs. The perc manufacturing defendants, including Vulcan, have filed a motion for summary judgment. The Court has yet to rule on the motion but in the interim has stayed the litigation. As such, there has been no activity on this matter pending the Court’s ruling. | |
| § | WEST VIRGINIA COAL SINK LAB LITIGATION — This is a mass tort action consisting of over 100 cases filed in 17 different counties in West Virginia from September 1 to October 13, 2010, for medical monitoring and personal injury damages for exposure to perc used in coal sink labs. The West Virginia Supreme Court of Appeals, in an order entered January 19, 2011, transferred all of these cases (referred to as Jeffrey Blount v. Arkema, Inc., et al. ) to the West Virginia Mass Litigation Panel. No discovery has been conducted in this matter. |
| § | SANTARSIERO — This is a case styled Robert Santarsiero v. R.V. Davies, et al ., pending in Supreme Court, New York County, New York. The plaintiff alleges personal injury (kidney cancer) from exposure to perc. We were brought in as a third-party defendant by original defendant R.V. Davies. Discovery is ongoing. |
| § | R.R. STREET INDEMNITY — Street, a former distributor of perc manufactured by us, alleges that we owe Street, and its insurer (National Union), a defense and indemnity in several of these litigation matters, as well as some prior litigation which we have now settled. National Union alleges that we are obligated to contribute to National Union’s share of defense fees, costs and any indemnity payments made on Street’s behalf. We are having ongoing discussions with Street about the nature and extent of indemnity obligations, if any, and to date there has been no resolution of these issues. |
| Part II | 93 |
Table of Contents
| NOTE 14: | OTHER |
|
Before-tax
|
Tax (Expense)
|
Net-of-tax
|
||||
| in thousands | Amount | Benefit | Amount | |||
|
Other Comprehensive Income (Loss)
|
||||||
|
December 31, 2010
|
||||||
|
Fair value adjustment to cash flow hedges
|
($882) | $401 | ($481) | |||
|
Reclassification adjustment for cash flow
hedge amounts included in net earnings |
19,619 | (8,910) | 10,709 | |||
|
Adjustment for funded status of pension
and postretirement benefit plans |
5,683 | (2,482) | 3,201 | |||
|
Amortization of pension and postretirement
plan actuarial loss and prior service cost |
6,371 | (2,781) | 3,590 | |||
|
Total other comprehensive income (loss)
|
$30,791 | ($13,772) | $17,019 | |||
|
December 31, 2009
|
||||||
|
Fair value adjustment to cash flow hedges
|
($4,643) | $1,895 | ($2,748) | |||
|
Reclassification adjustment for cash flow
hedge amounts included in net earnings |
16,728 | (6,826) | 9,902 | |||
|
Adjustment for funded status of pension
and postretirement benefit plans |
(28,784) | 11,417 | (17,367) | |||
|
Amortization of pension and postretirement
plan actuarial loss and prior service cost |
1,886 | (748) | 1,138 | |||
|
Total other comprehensive income (loss)
|
($14,813) | $5,738 | ($9,075) | |||
|
December 31, 2008
|
||||||
|
Fair value adjustment to cash flow hedges
|
($12,190) | $9,550 | ($2,640) | |||
|
Reclassification adjustment for cash flow
hedge amounts included in net earnings |
9,088 | (7,120) | 1,968 | |||
|
Adjustment for funded status of pension
and postretirement benefit plans |
(255,616) | 101,517 | (154,099) | |||
|
Amortization of pension and postretirement
plan actuarial loss and prior service cost |
1,201 | (477) | 724 | |||
|
Total other comprehensive income (loss)
|
($257,517) | $103,470 | ($154,047) | |||
| Part II | 94 |
Table of Contents
| in thousands | 2010 | 2009 | 2008 | |||||||||
|
Accumulated Other Comprehensive Loss
|
||||||||||||
|
Cash flow hedges
|
($39,137 | ) | ($49,365 | ) | ($56,519 | ) | ||||||
|
Pension and postretirement plans
|
(138,202 | ) | (144,993 | ) | (128,763 | ) | ||||||
|
Total
|
($177,339 | ) | ($194,358 | ) | ($185,282 | ) | ||||||
| Part II | 95 |
Table of Contents
| in millions | 2010 | 2009 | 2008 | |||||||||||||
|
Total Revenues
|
||||||||||||||||
|
Aggregates
|
||||||||||||||||
|
Segment revenues
|
$1,766.9 | $1,838.6 | $2,406.8 | |||||||||||||
|
Intersegment sales
|
(154.1 | ) | (165.2 | ) | (206.2 | ) | ||||||||||
|
Net sales
|
$1,612.8 | $1,673.4 | $2,200.6 | |||||||||||||
|
Concrete
|
||||||||||||||||
|
Segment revenues
|
$383.2 | $439.4 | $667.8 | |||||||||||||
|
Intersegment sales
|
0.0 | (0.1 | ) | (0.6 | ) | |||||||||||
|
Net sales
|
$383.2 | $439.3 | $667.2 | |||||||||||||
|
Asphalt mix
|
||||||||||||||||
|
Segment revenues
|
$369.9 | $393.7 | $533.4 | |||||||||||||
|
Intersegment sales
|
0.0 | 0.0 | 0.0 | |||||||||||||
|
Net sales
|
$369.9 | $393.7 | $533.4 | |||||||||||||
|
Cement
|
||||||||||||||||
|
Segment revenues
|
$80.2 | $72.5 | $106.5 | |||||||||||||
|
Intersegment sales
|
(40.2 | ) | (35.2 | ) | (54.6 | ) | ||||||||||
|
Net sales
|
$40.0 | $37.3 | $51.9 | |||||||||||||
|
Totals
|
||||||||||||||||
|
Net sales
|
$2,405.9 | $2,543.7 | $3,453.1 | |||||||||||||
|
Delivery revenues
|
153.0 | 146.8 | 198.3 | |||||||||||||
|
Total revenues
|
$2,558.9 | $2,690.5 | $3,651.4 | |||||||||||||
|
Gross Profit
|
||||||||||||||||
|
Aggregates
|
$320.2 | $393.3 | $657.6 | |||||||||||||
|
Concrete
|
(45.0 | ) | (14.5 | ) | 23.3 | |||||||||||
|
Asphalt mix
|
29.3 | 69.0 | 51.1 | |||||||||||||
|
Cement
|
(3.8 | ) | (1.8 | ) | 17.7 | |||||||||||
|
Total
|
$300.7 | $446.0 | $749.7 | |||||||||||||
|
Depreciation, Depletion, Accretion and Amortization
|
||||||||||||||||
|
Aggregates
|
$293.0 | $312.2 | $310.8 | |||||||||||||
|
Concrete
|
53.6 | 52.6 | 52.5 | |||||||||||||
|
Asphalt mix
|
8.7 | 8.6 | 8.5 | |||||||||||||
|
Cement
|
20.9 | 16.3 | 14.6 | |||||||||||||
|
Corporate and other unallocated
|
5.9 | 4.9 | 2.7 | |||||||||||||
|
Total
|
$382.1 | $394.6 | $389.1 | |||||||||||||
|
Capital Expenditures
|
||||||||||||||||
|
Aggregates
|
$60.6 | $74.6 | $267.7 | |||||||||||||
|
Concrete
|
3.7 | 0.2 | 9.9 | |||||||||||||
|
Asphalt mix
|
4.5 | 5.1 | 3.7 | |||||||||||||
|
Cement
|
7.3 | 22.4 | 60.2 | |||||||||||||
|
Corporate
|
3.3 | 4.2 | 12.7 | |||||||||||||
|
Total
|
$79.4 | $106.5 | $354.2 | |||||||||||||
|
Identifiable Assets
|
||||||||||||||||
|
Aggregates
|
$6,984.5 | $7,208.4 | $7,530.6 | |||||||||||||
|
Concrete
|
483.2 | 448.9 | 536.4 | |||||||||||||
|
Asphalt mix
|
211.5 | 220.6 | 231.2 | |||||||||||||
|
Cement
|
435.0 | 446.9 | 435.2 | |||||||||||||
|
Total identifiable assets
|
8,114.2 | 8,324.8 | 8,733.4 | |||||||||||||
|
General corporate assets
|
176.2 | 185.9 | 173.0 | |||||||||||||
|
Cash items
|
47.5 | 22.3 | 10.2 | |||||||||||||
|
Total assets
|
$8,337.9 | $8,533.0 | $8,916.6 | |||||||||||||
| Part II | 96 |
Table of Contents
| NOTE 16: | SUPPLEMENTAL CASH FLOW |
| in thousands | 2010 | 2009 | 2008 | |||||||||
|
Cash Payments (Refunds)
|
||||||||||||
|
Interest (exclusive of amount capitalized)
|
$172,653 | $181,352 | $179,880 | |||||||||
|
Income taxes
|
(15,745 | ) | (25,184 | ) | 91,544 | |||||||
|
Noncash Investing and Financing Activities
|
||||||||||||
|
Accrued liabilities for purchases of property, plant &
equipment
|
$8,200 | $13,459 | $22,974 | |||||||||
|
Note received from sale of business
|
0 | 1,450 | 0 | |||||||||
|
Carrying value of noncash assets and liabilities exchanged
|
0 | 0 | 42,974 | |||||||||
|
Debt issued for purchases of property,
plant & equipment
|
0 | 1,987 | 389 | |||||||||
|
Proceeds receivable from exercise of stock options
|
0 | 0 | 325 | |||||||||
|
Stock issued for pension contribution (Note 13)
|
53,864 | 0 | 0 | |||||||||
|
Amounts referable to business acquisitions
|
||||||||||||
|
Liabilities assumed
|
150 | 0 | 2,024 | |||||||||
|
Fair value of stock issued
|
0 | 0 | 25,023 | |||||||||
| NOTE 17: | ASSET RETIREMENT |
| in thousands | 2010 | 2009 | 2008 | |||||||||||||
|
ARO Operating Costs
|
||||||||||||||||
|
Accretion
|
$8,641 | $8,802 | $7,082 | |||||||||||||
|
Depreciation
|
11,516 | 13,732 | 15,504 | |||||||||||||
|
Total
|
$20,157 | $22,534 | $22,586 | |||||||||||||
| Part II | 97 |
Table of Contents
| in thousands | 2010 | 2009 | ||||||
|
Asset Retirement Obligations
|
||||||||
|
Balance at beginning of year
|
$167,757 | $173,435 | ||||||
|
Liabilities incurred
|
2,501 | 539 | ||||||
|
Liabilities settled
|
(11,354 | ) | (10,610 | ) | ||||
|
Accretion expense
|
8,641 | 8,802 | ||||||
|
Revisions down, net
|
(4,815 | ) | (4,409 | ) | ||||
|
Balance at end of year
|
$162,730 | $167,757 | ||||||
INTANGIBLE ASSETS
| Part II | 98 |
Table of Contents
| in thousands | Aggregates | Concrete | Asphalt mix | Cement | Total | |||||||||||||||
|
Gross Carrying Amount
|
||||||||||||||||||||
|
Total as of December 31, 2008
|
$2,993,835 | $0 | $91,633 | $252,664 | $3,338,132 | |||||||||||||||
|
Goodwill of acquired businesses
|
9,558 | 0 | 0 | 0 | 9,558 | |||||||||||||||
|
Correction per Note 20
|
2,321 | 0 | 0 | 0 | 2,321 | |||||||||||||||
|
Purchase price allocation adjustments
|
(1,047 | ) | 0 | 0 | 0 | (1,047 | ) | |||||||||||||
|
Total as of December 31, 2009
|
$3,004,667 | $0 | $91,633 | $252,664 | $3,348,964 | |||||||||||||||
|
Goodwill of acquired
businesses
1
|
716 | 0 | 0 | 0 | 716 | |||||||||||||||
|
Total as of December 31, 2010
|
$3,005,383 | $0 | $91,633 | $252,664 | $3,349,680 | |||||||||||||||
|
Accumulated Impairment Losses
|
||||||||||||||||||||
|
Total as of December 31, 2008
|
$0 | $0 | $0 | ($252,664 | ) | ($252,664 | ) | |||||||||||||
|
Goodwill impairment loss
|
0 | 0 | 0 | 0 | 0 | |||||||||||||||
|
Total as of December 31, 2009
|
$0 | $0 | $0 | ($252,664 | ) | ($252,664 | ) | |||||||||||||
|
Goodwill impairment loss
|
0 | 0 | 0 | 0 | 0 | |||||||||||||||
|
Total as of December 31, 2010
|
$0 | $0 | $0 | ($252,664 | ) | ($252,664 | ) | |||||||||||||
|
Goodwill, net of Accumulated Impairment Losses
|
||||||||||||||||||||
|
Total as of December 31, 2008
|
$2,993,835 | $0 | $91,633 | $0 | $3,085,468 | |||||||||||||||
|
Total as of December 31, 2009
|
$3,004,667 | $0 | $91,633 | $0 | $3,096,300 | |||||||||||||||
|
Total as of December 31, 2010
|
$3,005,383 | $0 | $91,633 | $0 | $3,097,016 | |||||||||||||||
| 1 | The goodwill of acquired businesses for 2010 relates to the 2010 acquisitions listed in Note 19. We are currently evaluating the final purchase price allocation for most of these acquisitions; therefore, the goodwill amount is subject to change. All of the goodwill from the 2010 acquisitions is expected to be fully deductible for income tax purposes. |
| Part II | 99 |
Table of Contents
| in thousands | 2010 | 2009 | ||||||
|
Gross Carrying Amount
|
||||||||
|
Contractual rights in place
|
$628,707 | $617,278 | ||||||
|
Noncompetition agreements
|
2,200 | 2,490 | ||||||
|
Favorable lease agreements
|
16,677 | 16,773 | ||||||
|
Permitting, permitting compliance and zoning rights
|
69,631 | 58,547 | ||||||
|
Customer relationships
|
14,393 | 14,393 | ||||||
|
Tradenames and trademarks
|
5,006 | 5,006 | ||||||
|
Other
|
3,200 | 3,911 | ||||||
|
Total gross carrying amount
|
$739,814 | $718,398 | ||||||
|
Accumulated Amortization
|
||||||||
|
Contractual rights in place
|
($29,100 | ) | ($20,522 | ) | ||||
|
Noncompetition agreements
|
(1,308 | ) | (1,618 | ) | ||||
|
Favorable lease agreements
|
(1,531 | ) | (1,132 | ) | ||||
|
Permitting, permitting compliance and zoning rights
|
(11,083 | ) | (9,592 | ) | ||||
|
Customer relationships
|
(2,940 | ) | (1,500 | ) | ||||
|
Tradenames and trademarks
|
(1,043 | ) | (567 | ) | ||||
|
Other
|
(1,116 | ) | (824 | ) | ||||
|
Total accumulated amortization
|
($48,121 | ) | ($35,755 | ) | ||||
|
Total Intangible Assets Subject to Amortization, net
|
$691,693 | $682,643 | ||||||
|
Intangible Assets with Indefinite Lives
|
0 | 0 | ||||||
|
Total Intangible Assets, net
|
$691,693 | $682,643 | ||||||
|
Aggregate Amortization Expense for the Year
|
$13,617 | $13,777 | ||||||
| in thousands | ||||
|
Estimated Amortization Expense for Five Subsequent Years
|
||||
|
2011
|
$13,653 | |||
|
2012
|
12,214 | |||
|
2013
|
12,039 | |||
|
2014
|
12,207 | |||
|
2015
|
12,249 | |||
| Part II | 100 |
Table of Contents
DIVESTITURES
| § | twelve ready-mixed concrete facilities located in Georgia |
| § | one aggregates facility located in Tennessee |
| § | one aggregates facility located in California |
| § | three aggregates facilities located in rural Virginia |
| in thousands | 2010 | 2009 | ||||||
|
Held for Sale
|
||||||||
|
Current assets
|
$3,460 | $3,799 | ||||||
|
Property, plant & equipment, net
|
9,625 | 11,117 | ||||||
|
Other assets
|
122 | 156 | ||||||
|
Total assets held for sale
|
$13,207 | $15,072 | ||||||
|
Current liabilities
|
$116 | $369 | ||||||
|
Total liabilities of assets held for sale
|
$116 | $369 | ||||||
| § | leasehold interest in a rail-served aggregates distribution yard |
| § | two aggregates production facilities |
| § | dock and transloading facility |
| § | interest in an aggregates production facility |
| Part II | 101 |
Table of Contents
PERIOD FINANCIAL STATEMENT
| As of December 31, 2009 | ||||||||||||
|
As
|
As
|
|||||||||||
| in thousands | Reported | Correction | Restated | |||||||||
|
Balance Sheet
|
||||||||||||
|
Assets
|
||||||||||||
|
Deferred income taxes
|
$57,967 | ($1,950 | ) | $56,017 | ||||||||
|
Prepaid expense
|
50,817 | (8,450 | ) | 42,367 | ||||||||
|
Total current assets
|
743,289 | (10,400 | ) | 732,889 | ||||||||
|
Goodwill
|
3,093,979 | 2,321 | 3,096,300 | |||||||||
|
Total assets
|
$8,532,950 | ($8,079 | ) | $8,524,871 | ||||||||
|
Liabilities
|
||||||||||||
|
Deferred income taxes
|
$887,268 | $6,706 | $893,974 | |||||||||
|
Total liabilities
|
4,480,928 | 6,706 | 4,487,634 | |||||||||
|
Shareholders’ Equity
|
||||||||||||
|
Retained earnings
|
1,752,240 | (14,785 | ) | 1,737,455 | ||||||||
|
Total shareholders’ equity
|
4,052,022 | (14,785 | ) | 4,037,237 | ||||||||
|
Total liabilities and shareholders’ equity
|
$8,532,950 | ($8,079 | ) | $8,524,871 | ||||||||
| Part II | 102 |
Table of Contents
SUPPLEMENTARY DATA
| 2010 | ||||||||||||||||
| Three Months Ended | ||||||||||||||||
| in thousands, except per share data | March 31 | June 30 | Sept 30 | Dec 31 | ||||||||||||
|
Net sales
|
$464,534 | $692,758 | $699,792 | $548,832 | ||||||||||||
|
Total revenues
|
493,264 | 736,152 | 743,204 | 586,242 | ||||||||||||
|
Gross profit
|
894 | 122,335 | 126,747 | 50,750 | ||||||||||||
|
Operating earnings (loss)
|
(36,770 | ) | 1,210 | 50,432 | (29,412 | ) | ||||||||||
|
Earnings (loss) from continuing operations
|
(44,474 | ) | (22,515 | ) | 10,591 | (46,145 | ) | |||||||||
|
Net earnings (loss)
|
(38,747 | ) | (23,992 | ) | 13,246 | (46,997 | ) | |||||||||
|
Basic earnings (loss) per share from continuing operations
|
($0.35 | ) | ($0.18 | ) | $0.08 | ($0.36 | ) | |||||||||
|
Diluted earnings (loss) per share from continuing operations
|
(0.35 | ) | (0.18 | ) | 0.08 | (0.36 | ) | |||||||||
|
Basic net earnings (loss) per share
|
($0.31 | ) | ($0.19 | ) | $0.10 | ($0.37 | ) | |||||||||
|
Diluted net earnings (loss) per share
|
(0.31 | ) | (0.19 | ) | 0.10 | (0.37 | ) | |||||||||
| 2009 | ||||||||||||||||
| Three Months Ended | ||||||||||||||||
| in thousands, except per share data | March 31 | June 30 | Sept 30 | Dec 31 | ||||||||||||
|
Net sales
|
$567,895 | $681,380 | $738,664 | $555,768 | ||||||||||||
|
Total revenues
|
600,294 | 721,859 | 778,192 | 590,145 | ||||||||||||
|
Gross profit
|
77,607 | 145,834 | 154,480 | 68,041 | ||||||||||||
|
Operating earnings (loss)
|
(1,326 | ) | 65,684 | 82,704 | 1,390 | |||||||||||
|
Earnings (loss) from continuing operations
|
(32,255 | ) | 15,561 | 47,924 | (12,582 | ) | ||||||||||
|
Net earnings (loss)
|
(32,780 | ) | 22,212 | 54,232 | (13,350 | ) | ||||||||||
|
Basic earnings (loss) per share from continuing operations
|
($0.29 | ) | $0.14 | $0.38 | ($0.10 | ) | ||||||||||
|
Diluted earnings (loss) per share from continuing operations
|
(0.29 | ) | 0.14 | 0.38 | (0.10 | ) | ||||||||||
|
Basic net earnings (loss) per share
|
($0.30 | ) | $0.20 | $0.43 | ($0.11 | ) | ||||||||||
|
Diluted net earnings (loss) per share
|
(0.30 | ) | 0.20 | 0.43 | (0.11 | ) | ||||||||||
| Part II | 103 |
Table of Contents
ON ACCOUNTING AND FINANCIAL DISCLOSURE
AND PROCEDURES
CONTROL OVER FINANCIAL REPORTING
| Part II | 104 |
Table of Contents
INTERNAL CONTROL OVER FINANCIAL REPORTING
| Part II | 105 |
Table of Contents
Table of Contents
|
|
107 |
Table of Contents
| Page in Report | ||||
|
Report of Independent Registered Public Accounting Firm
|
51 | |||
|
Consolidated Statements of Earnings and Comprehensive Income
|
52 | |||
|
Consolidated Balance Sheets
|
53 | |||
|
Consolidated Statements of Cash Flows
|
54 | |||
|
Consolidated Statements of Shareholders’ Equity
|
55 | |||
|
Notes to Consolidated Financial Statements
|
56-103 | |||
| (a) | (2) Financial statement schedules |
|
Schedule II
|
Valuation and Qualifying Accounts and Reserves | 109 |
| Part IV | 108 |
Table of Contents
|
For the Years Ended December 31, 2010, 2009 and 2008
|
||||||||||||||||||||||
| in thousands | ||||||||||||||||||||||
| Column A | Column B | Column C | Column D | Column E | Column F | |||||||||||||||||
|
|
||||||||||||||||||||||
|
Balance at
|
Additions Charged To |
Balance at
|
||||||||||||||||||||
|
Beginning
|
Costs and
|
Other
|
End
|
|||||||||||||||||||
| Description | Of Period | Expenses | Accounts | Deductions | Of Period | |||||||||||||||||
|
2010
|
||||||||||||||||||||||
|
Accrued Environmental Costs
|
$12,831 | $255 | $0 | $2,303 | 1 | $10,783 | ||||||||||||||||
|
Asset Retirement Obligations
|
167,757 | 8,641 | (2,314) | 2 | 11,354 | 3 | 162,730 | |||||||||||||||
|
Doubtful Receivables
|
8,722 | 3,100 | 0 | 4,317 | 4 | 7,505 | ||||||||||||||||
|
Self-Insurance Reserves
|
55,266 | 82,308 | 0 | 68,885 | 5 | 68,689 | ||||||||||||||||
|
All Other
6
|
777 | 2,974 | 0 | 3,087 | 664 | |||||||||||||||||
|
2009
|
||||||||||||||||||||||
|
Accrued Environmental Costs
|
$13,708 | $1,093 | $0 | $1,970 | 1 | $12,831 | ||||||||||||||||
|
Asset Retirement Obligations
|
173,435 | 8,802 | (3,870) | 2 | 10,610 | 3 | 167,757 | |||||||||||||||
|
Doubtful Receivables
|
8,711 | 4,173 | 0 | 4,162 | 4 | 8,722 | ||||||||||||||||
|
Self-Insurance Reserves
|
56,912 | 15,503 | 0 | 17,149 | 5 | 55,266 | ||||||||||||||||
|
All Other
6
|
901 | 3,517 | 0 | 3,641 | 777 | |||||||||||||||||
|
2008
|
||||||||||||||||||||||
|
Accrued Environmental Costs
|
$9,756 | $451 | $4,698 | 7 | $1,197 | 1 | $13,708 | |||||||||||||||
|
Asset Retirement Obligations
|
131,383 | 7,082 | 52,603 | 2 | 17,633 | 3 | 173,435 | |||||||||||||||
|
Doubtful Receivables
|
6,015 | 5,393 | 0 | 2,697 | 4 | 8,711 | ||||||||||||||||
|
Self-Insurance Reserves
|
61,298 | 23,191 | 0 | 27,577 | 5 | 56,912 | ||||||||||||||||
|
All Other
6
|
1,244 | 5,120 | 0 | 5,463 | 901 | |||||||||||||||||
| 1 | Expenditures on environmental remediation projects. | |
| 2 | Net up/down revisions to asset retirement obligations. | |
| 3 | Expenditures related to settlements of asset retirement obligations. | |
| 4 | Write-offs of uncollected accounts and worthless notes, less recoveries. | |
| 5 | Expenditures on self-insurance reserves. | |
| 6 | Valuation and qualifying accounts and reserves for which additions, deductions and balances are individually insignificant. | |
| 7 | Include additions related to the acquisition of Florida Rock. |
|
|
109 |
Table of Contents
| By |

|
| Signature | Title | Date | ||||
|
|
Chairman, Chief Executive Officer
and Director (Principal Executive Officer) |
February 28, 2011 | ||||

|
Executive Vice President
and Chief Financial Officer (Principal Financial Officer) |
February 28, 2011 | ||||

|
Vice President, Controller
and Chief Information Officer (Principal Accounting Officer) |
February 28, 2011 | ||||
| The following directors: | ||||||
| Philip J. Carroll, Jr. | Director | |||||
| Phillip W. Farmer | Director | |||||
| H. Allen Franklin | Director | |||||
| Ann McLaughlin Korologos | Director | |||||
| Douglas J. McGregor | Director | |||||
| James V. Napier | Director | |||||
| Richard T. O’Brien | Director | |||||
| James T. Prokopanko | Director | |||||
| Donald B. Rice | Director | |||||
| Vincent J. Trosino | Director | |||||
| Kathleen Wilson-Thompson | Director | |||||
By

Robert A. Wason IV Attorney-in-Fact |
February 28, 2011 |
|||||
| Signatures | 110 |
Table of Contents
|
Exhibit 3(a)
|
Certificate of Incorporation (Restated 2007) of Vulcan Materials Company (formerly known as Virginia Holdco, Inc.), filed as Exhibit 3.1 to the Company’s Current Report on Form 8-K on November 16, 2007. 1 | |
|
Exhibit 3(b)
|
Amended and Restated By-Laws of Vulcan Materials Company effective as of December 11, 2009 filed as Exhibit 3.1 to the Company’s Current Report on Form 8-K on December 11, 2009. 1 | |
|
Exhibit 4(a)
|
Supplemental Indenture No. 1 dated as of November 16, 2007, among Vulcan Materials Company, Legacy Vulcan Corp. and The Bank of New York, as Trustee filed as Exhibit 4.1 to the Company’s Current Report on Form 8-K on November 21, 2007. 1 | |
|
Exhibit 4(b)
|
Senior Debt Indenture, dated as of December 11, 2007, between Vulcan Materials Company and Wilmington Trust Company, as Trustee, filed as Exhibit 4.1 to the Company’s Current Report on Form 8-K on December 11, 2007. 1 | |
|
Exhibit 4(c)
|
First Supplemental Indenture, dated as of December 11, 2007, between Vulcan Materials Company and Wilmington Trust Company, as Trustee, to that certain Senior Debt Indenture, dated as of December 11, 2007, between Vulcan Materials Company and Wilmington Trust Company, as Trustee, filed as Exhibit 4.2 to the Company’s Current Report on Form 8-K on December 11, 2007. 1 | |
|
Exhibit 4(d)
|
Second Supplemental Indenture dated June 20, 2008 between the Company and Wilmington Trust Company, as Trustee, to that certain Senior Debt Indenture dated as of December 11, 2007, filed as Exhibit 4.1 to the Company’s Current Report on Form 8-K filed June 20, 2008. 1 | |
|
Exhibit 4(e)
|
Indenture dated as of May 1, 1991, by and between Legacy Vulcan Corp. (formerly Vulcan Materials Company) and First Trust of New York (as successor trustee to Morgan Guaranty Trust Company of New York) filed as Exhibit 4 to the Form S-3 on May 2, 1991 (Registration No. 33-40284). 1 | |
|
Exhibit 10(a)
|
Underwriting Agreement, dated June 11, 2009, among the Company and Goldman Sachs & Co., Merrill Lynch, Pierce Fenner & Smith Incorporated, J.P. Morgan Securities, Inc. and Wachovia Capital Markets, LLC, as representatives of the several underwriters named therein filed as Exhibit 1.1 to the Company’s Report on Form 8-K filed June 17, 2009. 1 | |
|
Exhibit 10(b)
|
Underwriting Agreement, dated June 17, 2008, among the Company and Banc of America Securities, LLC, Goldman, Sachs & Co., JP Morgan Securities, Inc. and Wachovia Capital Markets, LLC as Representatives of several underwriters named therein filed as Exhibit 1.1 to the Company’s Current Report on Form 8-K filed June 20, 2008. 1 | |
|
Exhibit 10(c)
|
Five-Year Credit Agreement dated as of November 16, 2007, among the Company, certain lenders party thereto and Bank of America, N.A., as administrative agent filed as Exhibit 10.3 to the Company’s Current Report on Form 8-K filed November 21, 2007. 1 | |
|
Exhibit 10(d)
|
Term Loan Credit Agreement dated July 7, 2010, among the Company, Suntrust Bank, as administrative agent, and certain other Lenders filed as Exhibit 1.1 to the Company’s Current Report on Form 8-K filed July 12, 2010. 1 | |
|
Exhibit 10(e)
|
Purchase Agreement dated January 23, 2009, between the Company and Goldman, Sachs & Co. filed as Exhibit 1.1 to the Company’s Current Report on Form 8-K on January 29, 2009. 1 | |
|
Exhibit 10(f)
|
Third Supplemental Indenture dated February 3, 2009, between the Company and Wilmington Trust Company, as Trustee, to that certain Senior Debt Indenture dated as of December 11, 2007 filed as Exhibit 10(f) to the Company’s Annual Report on Form 10-K filed on March 2, 2009. 1 | |
|
Exhibit 10(g)
|
Exchange and Registration Rights Agreement dated February 3, 2009, between the Company and Goldman, Sachs & Co. filed as Exhibit 10(g) to the Company’s Annual Report on Form 10-K filed on March 2, 2009. 1 | |
|
Exhibit 10(h)
|
The Unfunded Supplemental Benefit Plan for Salaried Employees, as amended, filed as Exhibit 10.4 to the Company’s Current Report on Form 8-K filed on December 17, 2008. 1,2 | |
|
Exhibit 10(i)
|
Amendment to the Unfunded Supplemental Benefit Plan for Salaried Employees filed as Exhibit 10(c) to Legacy Vulcan Corp.’s Annual Report on Form 10-K for the year ended December 31, 2001 filed on March 27, 2002. 1,2 |
Table of Contents
|
Exhibit 10(j)
|
The Deferred Compensation Plan for Directors Who Are Not Employees of the Company, as amended, filed as Exhibit 10.5 to the Company’s Current Report on Form 8-K filed on December 17, 2008. 1,2 | |
|
Exhibit 10(k)
|
The 2006 Omnibus Long-Term Incentive Plan of the Company filed as Appendix C to Legacy Vulcan Corp.’s 2006 Proxy Statement on Schedule 14A filed on April 13, 2006. 1,2 | |
|
Exhibit 10(l)
|
The Deferred Stock Plan for Nonemployee Directors of the Company filed as Exhibit 10(f) to Legacy Vulcan Corp.’s Annual Report on Form 10-K for the year ended December 31, 2001 filed on March 27, 2002. 1,2 | |
|
Exhibit 10(m)
|
The Restricted Stock Plan for Nonemployee Directors of the Company, as amended, filed as Exhibit 10.6 to the Company’s Current Report on Form 8-K filed December 17, 2008. 1,2 | |
|
Exhibit 10(n)
|
Executive Deferred Compensation Plan, as amended, filed as Exhibit 10.1 to the Company’s Current Report on Form 8-K filed on December 17, 2008. 1,2 | |
|
Exhibit 10(o)
|
Change of Control Employment Agreement Form (Double Trigger) filed as Exhibit 10.1 to the Company’s Current Report on Form 8-K filed on October 2, 2008. 1,2 | |
|
Exhibit 10(p)
|
Change of Control Employment Agreement Form (Modified Double Trigger) filed as Exhibit 10.2 to the Company’s Current Report on Form 8-K filed on October 2, 2008. 1,2 | |
|
Exhibit 10(q)
|
Executive Incentive Plan of the Company, as amended, filed as Exhibit 10.2 to the Company’s Current Report on Form 8-K filed on December 17, 2008. 1,2 | |
|
Exhibit 10(r)
|
Supplemental Executive Retirement Agreement filed as Exhibit 10 to Legacy Vulcan Corp.’s Quarterly Report on Form 10-Q for the quarter ended September 30, 2001 filed on November 2, 2001. 1,2 | |
|
Exhibit 10(s)
|
Form Stock Option Award Agreement filed as Exhibit 10(o) to Legacy Vulcan Corp.’s Report on Form 8-K filed December 20, 2005. 1,2 | |
|
Exhibit 10(t)
|
Form Director Deferred Stock Unit Award Agreement filed as Exhibit 10.9 to the Company’s Current Report on Form 8-K filed December 17, 2008. 1,2 | |
|
Exhibit 10(u)
|
Form Performance Share Unit Award Agreement filed as Exhibit 10.1 to the Company’s Current Report on Form 8-K filed March 11, 2010. 1,2 | |
|
Exhibit 10(v)
|
Form Stock Only Stock Appreciation Rights Agreement filed as Exhibit 10(p) to Legacy Vulcan Corp.’s Report on Form 10-K filed February 26, 2007. 1,2 | |
|
Exhibit 10(w)
|
Form Employee Deferred Stock Unit Award Amended Agreement filed as Exhibit 10.7 to the Company’s Current Report on Form 8-K filed December 17, 2008. 1,2 | |
|
Exhibit 10(x)
|
2011 Compensation Arrangements filed in the Company’s Current Reports on Form 8-K filed on February 18, 2011 and February 22, 2011. 1,2 | |
|
Exhibit 21
|
List of the Company’s subsidiaries as of December 31, 2010. | |
|
Exhibit 23
|
Consent of Deloitte & Touche LLP, Independent Registered Public Accounting Firm. | |
|
Exhibit 24
|
Powers of Attorney. |
Table of Contents
|
Exhibit 31(a)
|
Certification of Chief Executive Officer pursuant to Section 302 of the Sarbanes-Oxley Act. | |
|
Exhibit 31(b)
|
Certification of Chief Financial Officer pursuant to Section 302 of the Sarbanes-Oxley Act. | |
|
Exhibit 32(a)
|
Certificate of Chief Executive Officer pursuant to Section 906 of the Sarbanes-Oxley Act. | |
|
Exhibit 32(b)
|
Certificate of Chief Financial Officer pursuant to Section 906 of the Sarbanes-Oxley Act. | |
|
Exhibit 99
|
MSHA Citations and Litigation. | |
|
Exhibit 101.INS
|
XBRL Instance Document | |
|
Exhibit 101.SCH
|
XBRL Taxonomy Extension Schema Document | |
|
Exhibit 101.CAL
|
XBRL Taxonomy Extension Calculation Linkbase Document | |
|
Exhibit 101.LAB
|
XBRL Taxonomy Extension Label Linkbase Document | |
|
Exhibit 101.PRE
|
XBRL Taxonomy Extension Presentation Linkbase Document | |
|
Exhibit 101.DEF
|
XBRL Taxonomy Extension Definition Linkbase Document |
| 1 | Incorporated by reference. |
| 2 | Management contract or compensatory plan. |