VALMONT INDUSTRIES INC
10-Ks and 10-Qs
|
|
|
|
|
|
|
|
|
|
|
|
|
|
|
|
|
|
|
|
|
|
|
|
|
|
|
|
|
|
|
|
|
|
|
|
|
|
|
|
|
|
|
|
|
|
|
|
|
|
|
|
|
|
|
|
UNITED STATES
SECURITIES AND EXCHANGE COMMISSION
Washington, D.C. 20549
___________________________________
Form 10-K
(Mark One)
x
ANNUAL REPORT PURSUANT TO SECTION 13 OR 15(d) OF THE SECURITIES
EXCHANGE ACT OF 1934
For the fiscal year ended
December 30, 2017
or
o
TRANSITION REPORT PURSUANT TO SECTION 13 OR 15(d) OF THE SECURITIES
EXCHANGE ACT OF 1934
For the transition period from
____________
to
Commission file number 1-31429
_____________________________________
Valmont Industries, Inc.
(Exact name of registrant as specified in its charter)
|
Delaware
(State or Other Jurisdiction of Incorporation or Organization) |
47-0351813
(I.R.S. Employer Identification No.) |
|
One Valmont Plaza,
Omaha, Nebraska (Address of Principal Executive Offices) |
68154-5215 (Zip Code) |
(
402) 963-1000
(Registrant’s telephone number, including area code)
Securities registered pursuant to Section 12(b) of the Act:
|
Title of each class
|
Name of exchange on which registered
|
|
|
Common Stock $1.00 par value
|
New York Stock Exchange
|
|
Securities registered pursuant to Section 12(g) of the Act:
None
Indicate by check mark whether the registrant is a well-known seasoned issuer, as defined in Rule 405 of the Securities Act. Yes
x
No
o
Indicate by check mark whether the registrant is not required to file reports pursuant to Section 13 or 15(d) of the Exchange Act. Yes
o
No
x
Indicate by check mark whether the registrant (1) has filed all reports required to be filed by Sections 13 or 15(d) of the Securities Exchange Act of 1934 during the preceding 12 months (or for such shorter period that the registrant was required to file such reports), and (2) has been subject to such filing requirements for the past 90 days. Yes
x
No
o
Indicate by check mark whether the registrant has submitted electronically and posted on its corporate Web site, if any, every Interactive Data File required to be submitted and posted pursuant to Rule 405 of Regulation S-T (§232.405 of this chapter) during the preceding 12 months (or for such shorter period that the registrant was required to submit and post such files). Yes
x
No
o
Indicate by check mark if disclosure of delinquent filers pursuant to Item 405 of Regulation S-K is not contained herein, and will not be contained, to the best of registrant’s knowledge, in definitive proxy or information statements incorporated by reference in Part III of this Form 10-K or any amendment to this Form 10-K.
o
Indicate by check mark whether the registrant is a large accelerated filer, an accelerated filer, a non-accelerated filer, or a smaller reporting company. See definitions of “large accelerated filer,” “accelerated filer,” and “smaller reporting company” in Rule 12b-2 of the Exchange Act. (Check one):
|
Large accelerated filer
x
|
Accelerated filer
o
|
Non‑accelerated filer
o
|
Smaller reporting company
o
|
|
Emerging growth company
o
|
(Do not check if a
smaller reporting company) |
||
If an emerging growth company, indicate by check mark if the registrant has elected not to use the extended transition period for complying with any new or revised financial accounting standards provided pursuant to Section 13(a) of the Exchange Act.
o
Indicate by check mark whether the registrant is a shell company (as defined in Rule 12b-2 of the Exchange Act). Yes
o
No
x
At February 20, 2018 there were 22,693,416 of the Company’s common shares outstanding. The aggregate market value of the voting stock held by non-affiliates of the Company based on the closing sale price the common shares as reported on the New York Stock Exchange on July 1, 2017 was $3,296,971,119.
DOCUMENTS INCORPORATED BY REFERENCE
Portions of the Company’s proxy statement for its annual meeting of shareholders to be held on April 24, 2018 (the “Proxy Statement”), to be filed within 120 days of the fiscal year ended
December 30, 2017
, are incorporated by reference in Part III.
This Introduction of the 10-K provides information concerning Valmont Industries, Inc. It does not contain all of the information you should consider. Please read the entire 10-K carefully before voting or making an investment decision. In particular please refer to the following sections:
Note, this introduction does not contain Part III information as most of the information will be incorporated by reference from our proxy statement to be filed for the annual shareholders meeting on April 24, 2018.

1 Net earnings attributable to Valmont Industries, Inc.
2 Fiscal 2016 GAAP operating income included restructuring expense of $12.4 million (pre-tax). On an adjusted basis, operating income was $255.9 million. Fiscal 2015 GAAP operating income included intangible asset impairments of $42.0 million (pre-tax), restructuring expense of $39.9 million (pre-tax), and other non-recurring expenses of $24.0 million pre-tax on an adjusted basis, operating income was $237.5 million.
3 See
Item 6
, Selected Financial Data, in this Form 10-K for calculation of invested capital and return on invested capital.
4 Fiscal 2016 included deferred income tax benefit of $30.6 million ($1.35 per share) resulting primarily from the re-measurement of the deferred tax asset for the Company's U.K. defined benefit pension plan. In addition, fiscal 2016 included $9.9 million ($0.44 per share) recorded as a valuation allowance against a tax credit asset. Finally, fiscal 2016 included the reversal of a contingent liability that was recognized as part of the Delta purchase accounting of $16.6 million ($0.73 per share) which is not taxable.
5 Fiscal 2015 included intangible asset impairment of $40.1 million after tax ($1.72 per share), restructuring expense of $28.2 million after tax ($1.20 per share), other non-recurring expenses of $16.3 million after tax ($0.69 per share) and deferred tax expense of $7.1 million ($0.31 per share) due to a change in the U.K. tax rate. Fiscal 2014 included costs associated with refinancing of our long-term debt of $24.2 million after tax ($0.93 per share), and mark-to-market loss of $3.8 million after tax on shares of Delta Pty. Ltd. ($0.15 per share).
6. Fiscal 2017 included $42.0 million ($1.85 per share) of tax expense attributed to the
Tax Cuts and Jobs Act of 2017 (the “2017 Tax Act”) enacted in December 2017.
For more information on the footnotes above and the reasons why we believe the non-GAAP measures are useful, please see
Item 6
,
Item 7
and
Item 8
.

VALMONT INDUSTRIES, INC.
Annual Report Pursuant to Section 13 or 15(d)
of the Securities Exchange Act of 1934
For the fiscal year ended
December 30, 2017
TABLE OF CONTENTS
|
Page No.
|
||
|
PART I
|
||
|
Business
|
||
|
Item 1A
|
Risk Factors
|
|
|
Item 1B
|
Unresolved Staff Comments
|
|
|
Item 2
|
Properties
|
|
|
Item 3
|
Legal Proceedings
|
|
|
Item 4
|
Mine Safety Disclosures
|
|
|
PART II
|
||
|
Item 5
|
Market for Registrant's Common Equity, Related Stockholder Matters, and Issuer Purchases of Equity Securities
|
|
|
Item 6
|
Selected Financial Data
|
|
|
Item 7
|
Management's Discussion and Analysis of Financial Condition and Results of Operation
|
|
|
Item 7A
|
Quantitative and Qualitative Disclosures About Market Risk
|
|
|
Item 8
|
Financial Statements and Supplementary Data
|
|
|
Item 9
|
Changes in and Disagreements with Accountants on Accounting and Financial Disclosure
|
|
|
Item 9A
|
Controls and Procedures
|
|
|
Item 9B
|
Other Information
|
|
|
Part III
|
||
|
Item 10
|
Directors, Executive Officers and Corporate Governance
|
|
|
Item 11
|
Executive Compensation
|
|
|
Item 12
|
Security Ownership of Certain Beneficial Owners and Management and Related Stockholder Matters
|
|
|
Item 13
|
Certain Relationships and Related Transactions, and Director Independence
|
|
|
Item 14
|
Principle Accountant Fees and Services
|
|
|
Part IV
|
||
|
Item 15
|
Exhibits and Financial Statement Schedules
|
|
1
|
(a)
|
General Description of Business
|
General
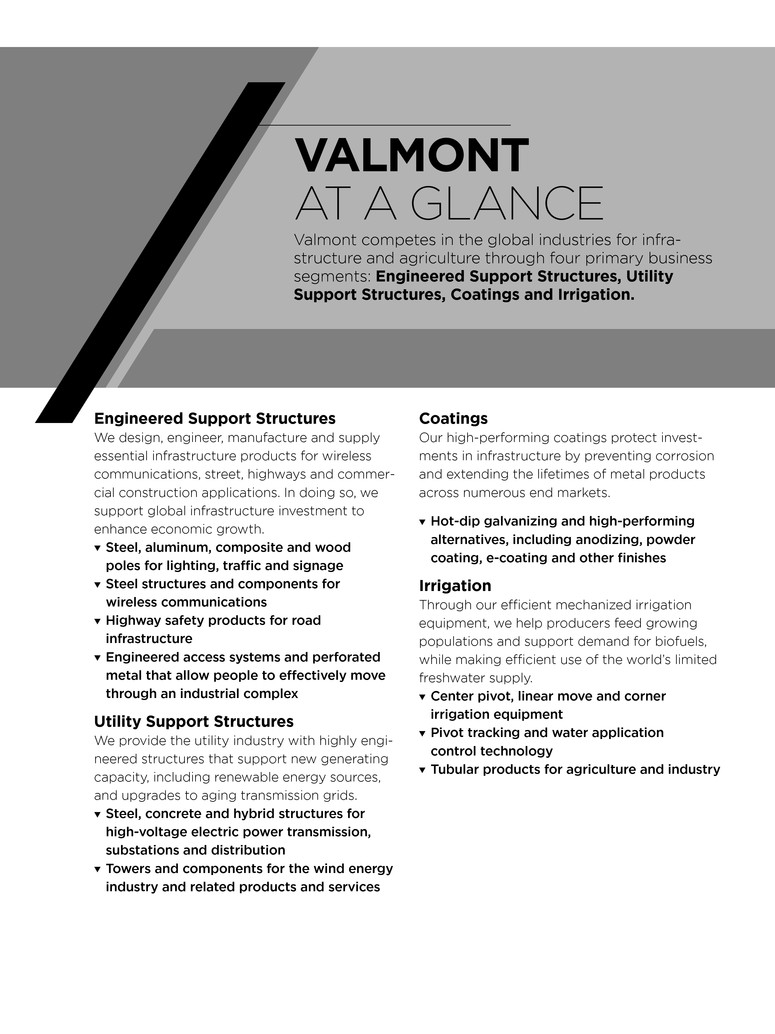
We are a diversified global producer of highly-engineered fabricated metal products. In our Engineered Support Structures (ESS) segment, we are a leading producer of steel, aluminum and composite poles, towers, industrial and architectural access systems and other structures. Our Utilities Support Structures (Utility) segment manufactures steel and concrete pole structures for transmission and distribution primarily within the United States. Outside of the United States, we manufacture complex steel structures used in electrical energy generation and distribution. Our Irrigation segment is a global producer of mechanized irrigation systems and provider of water management solutions for large-scale production agriculture. Our Coatings segment provides metal coating services, including galvanizing for steel and other applied coatings.
Our ESS segment sells the following products: outdoor lighting, traffic control, and roadway safety structures, wireless communication structures and components, and access systems. Our Utility segment sells pole structures to support electrical transmission and distribution lines and related power distribution equipment. Our Irrigation segment produces mechanized irrigation equipment and related services that deliver water, chemical fertilizers and pesticides to agricultural crops. Our Coatings segment provides coatings services for Valmont and other industrial customers. Customers and end-users of our products include municipalities and government entities globally, manufacturers of commercial lighting fixtures (OEM), contractors, telecommunications and utility companies, and large farms as well as the general manufacturing sector. In 2017, approximately 36% of our total sales were either sold in markets or produced by our manufacturing plants outside of North America. We were founded in 1946, went public in 1968 and our shares trade on the New York Stock Exchange (ticker: VMI).
Business Strategy
Our strategy is to pursue growth opportunities that leverage our existing product portfolio, knowledge of our principal end-markets and customers and engineering capability to increase our sales, earnings and cash flow, including:
Increasing the Market Penetration of our Existing Products.
Our strategy is to increase our market penetration by differentiating our products from our competitors’ products through superior customer service, technological innovation and consistent high quality. For example, our ESS segment increased its sales in 2015 through our engineering capability and strong customer service to meet our customers’ requirements on a complex project for specialty decorative street lighting structures on the road leading to the Doha international airport in Qatar.
Bringing our Existing Products to New Markets.
Our strategy is to expand the sales of our existing products into geographic areas where we do not currently serve and where end-users do not currently purchase our type of product. For example, we have also expanded our geographic presence in Europe, Middle East, and North Africa for lighting structures. We have been successful introducing our monopole products to utility and wireless communication customers that traditionally purchased lattice tower products. This strategy led to us building manufacturing presences in China and India to expand our offering of pole structures for lighting, utility and wireless communication to these markets. Our Irrigation segment has a long history of developing new emerging markets for mechanized irrigation around the world. In recent years, these markets include Eastern Europe and Middle East countries.
Developing New Products for Markets that We Currently Serve.
Our strategy is to grow by developing new products for markets using our comprehensive understanding of end-user requirements and leveraging longstanding relationships with key distributors and end-users. For example, in recent years we developed and sold structures for tramway applications in Europe. The customers for this product line include many of the state and local governments that purchase our lighting structures. Another example is the development and expansion of decorative lighting poles that have been introduced to our existing customer base. Our 2014 acquisition of the majority ownership in AgSense allows us to offer expanded remote monitoring services over irrigation equipment and other aspects of a farming operation.
2
Developing New Products for New Markets or Leveraging Core Competencies to Further Diversify our Business is a path to increase sales.
For example, the establishment and growth of our Coatings segment was based on using our expertise in galvanizing to develop what is now a global business segment. The decorative lighting market has different requirements and preferences than our traditional transportation and commercial markets. For example, our joint venture with Tehomet provided expertise in the decorative wood pole market. The acquisition of Delta in 2010 gave us a presence in highway safety systems and industrial access systems, products that we believe are complementary to our existing products and provide us with future growth opportunities.
Acquisitions
We have grown internally and by acquisition. Our significant business expansions during the past five years include the following (including the segment where the business reports):
2013
|
•
|
Acquisition of a manufacturer of perforated, expanded metal for the non-residential market, industrial flooring and handrails for the access systems market, and screening media for applications in the industrial and mining sectors in Australia and Asia (ESS)
|
|
•
|
Acquisition of the remaining 40% not previously owned of Valley Irrigation South Africa Pty. Ltd (Irrigation)
|
|
•
|
Acquisition of a distributor holding proprietary intellectual property for products serving the highway safety market located in New Zealand (ESS)
|
2014
|
•
|
Acquisition of 90% of a manufacturer of heavy complex steel structures (Valmont SM) with two manufacturing locations in Denmark (Utility)
|
|
•
|
Acquisition of a 51% ownership stake in AgSense, which provides farmers with remote monitoring equipment for their pivots and entire farming operation (Irrigation)
|
|
•
|
Acquisition of a manufacturer of fiberglass composite support structures with two manufacturing locations in South Carolina (ESS)
|
2015
|
•
|
Acquisition of a galvanizing business located in Hammonton, New Jersey (Coatings)
|
2016
|
•
|
Acquisition of the remaining 30% not previously owned of IGC Galvanizing Industries (M) Sdn Bhd (Coatings)
|
|
•
|
Acquisition of 5.2% of the remaining 10% not previously owned of Valmont SM (Utility)
|
2017
|
•
|
Acquisition of a highway safety business (Aircon) that manufactures guardrails, structural metal products, and solar structural products in India (ESS)
|
There have been no significant divestitures of businesses in the past five years.
(b) Segments
The Company has four reportable segments based on our management structure. Each segment is global in nature with a manager responsible for segment operational performance and allocation of capital within the segment.
Our reportable segments are as follows:
Engineered Support Structures:
This segment consists of the manufacture and distribution of engineered metal, and composite structures and components for lighting and traffic, access systems, wireless communication, and roadway safety applications;
Utility Support Structures:
This segment consists of the manufacture of engineered steel and concrete structures for the utility industry, including on and offshore wind energy, gas and oil exploration structures;
3
Coatings:
This segment consists of galvanizing, anodizing and powder coating services; and
Irrigation:
This segment consists of the manufacture of agricultural irrigation equipment and related parts and services for the agricultural industry as well as tubular products for a variety of industrial customers.
Other:
In addition to these four reportable segments, we have other operations and activities which are not more than 10% of consolidated sales, operating income or assets. These activities include the manufacture of forged steel grinding media.
Amounts of sales, operating income and total assets attributable to each segment for each of the last three years is set forth in Note 19 of our consolidated financial statements. In the fourth quarter of 2017, our management and related segment reporting structure was changed; a reflection of where we expect future growth of certain product lines and to take into consideration the expected divestiture of the grinding media business, subject to regulatory approval, which historically was reported in the Energy and Mining segment. The access systems applications product line is now part of the Engineered Support Structures ("ESS") segment and the offshore and other complex structures product line is now part of the Utility segment. In 2017, the Company also changed its reportable segment operating income to separate out the LIFO expense (benefit). Certain inventories are accounted for using the LIFO basis in the consolidated financial statements.
Our segment discussions and segment financial information have been accordingly reclassified in this report to reflect this change, for all periods presented.
|
(c)
|
Narrative Description of Business
|
Information concerning the principal products produced and services rendered, markets, competition and distribution methods for each of our four reportable segments is set forth below.
Engineered Support Structures Segment (ESS)
Products Produced
—We engineer and manufacture steel, aluminum, and composite poles and structures to which lighting and traffic control fixtures are attached for a wide range of outdoor lighting applications, such as streets, highways, parking lots, sports stadiums and commercial and residential developments. The demand for these products is driven by infrastructure, commercial and residential construction and by consumers’ desire for well-lit streets, highways, parking lots and common areas to help make these areas safer at night and to support trends toward more active lifestyles and 24-hour convenience. In addition to safety, customers want products that are visually appealing. In Europe, we are a leader in decorative lighting poles, which are attractive as well as functional. We are leveraging this expertise to expand our decorative product sales in North America, China, and the Middle East. Traffic poles are structures to which traffic signals are attached and aid the orderly flow of automobile traffic. While standard designs are available, poles are often engineered to customer specifications to ensure the proper function and safety of the structure. Product engineering takes into account factors such as weather (e.g. wind, ice) and the products loaded on the structure (e.g. lighting fixtures, traffic signals, overhead signs) to determine the design of the pole. This product line also includes roadway safety systems, including guard rail barrier systems, wire rope safety barriers, crash attenuation barriers and other products. Highway safety systems are also designed and engineered to enhance roadway safety.
We also engineer, manufacture, and distribute a broad range of structures (poles and towers) and components serving the wireless communication market. A wireless communication cell site mainly consists of a steel pole or tower, shelter (enclosure where the radio equipment is located), antennas (devices that receive and transmit data and voice information to and from wireless communication devices) and components (items that are used to mount antennas to the structure and to connect cabling and other parts from the antennas to the shelter). Structures are engineered and designed to customer specifications, which include factors such as the number of antennas on the structure and wind and soil conditions. Due to the size of these structures, design is important to ensure each structure meets performance and safety specifications. We do not provide any significant installation services on the structures we sell or manufacture. We produce and distribute access systems that allow people to move safely and effectively in an industrial, infrastructure or commercial facility, Products offered in this product line are usually engineered to specific customer requirements and include floor gratings, handrails, barriers and sunscreens. We also produce a line of products which are used in architectural applications. Examples of these products are perforated metal sun screens and facades that can be used on building structures to improve shading and aesthetics.
4
Markets
—The key markets for our lighting, traffic and roadway safety products are the transportation and commercial lighting markets and public roadway construction and upgrades. The transportation market includes street and highway lighting and traffic control, much of which is driven by government spending programs. For example, the U.S. government funds highway and road improvement through the federal highway program. This program provides funding to improve the nation’s roadway system, which includes roadway lighting and traffic control enhancements. Matching funding from the various states may be required as a condition of federal funding. Some states are supplementing infrastructure funding with revenue sources. Public and private partnerships have recently emerged as an additional funding source. The current federal highway program was renewed and extended in late 2015. The current administration has recommended increases to spending on roadway infrastructure. In the United States, there are approximately 4 million miles of public roadways, with approximately 24% carrying over 80% of the traffic. Accordingly, the need to improve traffic flow through traffic controls and lighting is a priority for many communities. Transportation markets in other areas of the world are also heavily funded by local and national governments.
The commercial lighting market is mostly funded privately and includes lighting for applications such as parking lots, shopping centers, sports stadiums and business parks. The commercial lighting market is driven by macro-economic factors such as general economic growth rates, interest rates and the commercial construction economy. Valmont has many long-standing relationships with OEM’s who serve this market. Markets for access systems are typically driven by infrastructure, industrial and commercial construction spending. Customers include construction firms or installers who participate in these markets, or, natural gas and mineral exploration companies, and resellers such as steel service centers, and end users. These markets can be cyclical depending on economic conditions.
The market for our communication products is driven by increased demand for wireless communication and data. Customers are wireless network providers and organizations that own cell sites and attach antennas from multiple carriers to the pole or tower structure (build to suit companies). We also sell products to state and federal governments for two-way radio communication, radar, broadcasting and security applications. We believe long-term growth should mainly be driven by increased usage, technologies such as 5G (including applications for data). Improved emergency response systems, as part of the U.S. Homeland Security initiatives, creates additional demand.
All of the products that we manufacture in this segment are parts of customer investments in basic infrastructure. The total cost of these investments can be substantial, so access to capital is often important to fund infrastructure needs. Demand can be cyclical in these markets due to overall economic conditions. Additionally, projects can sometimes be delayed due to funding or other issues.
Competition
—Our competitive strategy in all of the markets we serve is to provide high value to the customer at a reasonable price. We compete on the basis of product quality, high levels of customer service, timely, complete, and accurate delivery of the product and design capability to provide the best solutions to our customers. There are numerous competitors in our markets, most of which are relatively small companies. Companies compete on the basis of price, product quality, reliable delivery, engineering design, and unique product features. Pricing can be very competitive, especially when demand is weak or when strong local currencies result in increased competition from imported products.
Distribution Methods
—Sales and distribution activities are handled through a combination of a direct sales force and commissioned agents. Lighting agents represent Valmont as well as lighting fixture companies and sell other related products. Sales are typically to electrical distributors, who provide the pole, fixtures and other equipment to the end user as a complete package. Commercial lighting, access systems and highway safety sales are normally made through Valmont sales employees, who work on a salary plus incentive, although some sales are made through independent, commissioned sales agents.
Utility Support Structures Segment (Utility)
Products Produced
—We engineer and manufacture tapered steel, pre-stressed concrete and hybrid structures (concrete base section and steel upper sections). These products are used to support the lines that carry power for electrical transmission, substation and distribution applications. Transmission refers to moving power from where it is produced to where it is used. Substations transfer high voltage electricity to low voltage transmission. Electrical distribution carries electricity from the substation to the end-user.
Utility structures can be very large, so product design engineering is important to the function and safety of the structure. Our engineering process takes into account weather and loading conditions, such as wind speeds, ice loads and the
5
power lines attached to the structure, in order to arrive at the final design. Outside the U.S., we produce utility structures for offshore and onshore wind energy. We also manufacture complex steel structures such as rotor houses for wind turbines, crown-mounted compensators, winches and cranes for oil and gas exploration, and material handling equipment for manufacturing.
Markets
—Our sales in this segment are mainly in North America, where the key drivers in the utility business are significant upgrades in the electrical grid to support enhanced reliability standards, policy changes encouraging more generation from renewable energy sources, interconnection of regional grids to share more efficient generation to the benefit of the consumer and increased electrical consumption which has outpaced the transmission investment in the past decades. According to the Edison Electric Institute, the electrical transmission grid in the U.S. requires significant investment in the coming years to respond to the compelling industry drivers and lack of investment prior to 2008. In international markets, electrical consumption is expected to increase. This will require substantial investment in new electricity generation capacity and growth in transmission grid development. We expect these factors to result in increased demand for electrical utility structures to transport electricity from source to user, as is used in the U.S. markets today. Sales of complex steel structures, wind turbine towers and rotor houses, material handling systems, utility transmission structures, and structures for oil & gas exploration mainly occur within Europe.
Competition
—Our competitive strategy in this segment is to provide high value solutions to the customer at a reasonable price. We compete on the basis of product quality, engineering expertise, high levels of customer service and reliable, timely delivery of the product. There are many competitors. Companies compete on the basis of price, quality and service. Utility sales are often made through a competitive bid process, whereby the lowest bidder is awarded the contract, provided the competitor meets all other qualifying criteria. In weak markets, price is a more important criteria in the bid process. We also sell on a preferred-provider basis to certain large utility customers. These contractual arrangements often last between 3 and 5 years and are frequently renewed. For offshore and complex steel structures, we compete based on our ability to co-engineer and design solutions with customers. We are one of a limited number of competitors that can execute advanced order production of complex steel constructions that entail electronics, hydraulics, and highly automated series production for very customized products.
Distribution Methods
—Products are normally sold directly to electrical utilities or energy providers with some sales sold through commissioned sales agents.
Coatings Segment (Coatings)
Services Rendered
—We add finishes to metals that inhibit corrosion, extend service lives and enhance physical attractiveness of a wide range of materials and products. Among the services provided include:
|
•
|
Hot-dip Galvanizing
|
|
•
|
Anodizing
|
|
•
|
Powder Coating
|
|
•
|
E-Coating
|
In our Coatings segment, we take unfinished products from our customers and return them with a galvanized, anodized or painted finish. Galvanizing is a process that protects steel with a zinc coating that is bonded to the product surface to inhibit rust and corrosion. Anodizing is a process applied to aluminum that oxidizes the surface of the aluminum in a controlled manner, which protects the aluminum from corrosion and allows the material to be dyed a variety of colors. We also paint products using powder coating and e-coating technology (where paint is applied through an electrical charge) for a number of industries and markets.
Markets
—Markets for our products are varied and our profitability is not substantially dependent on any one industry or external customer. However, a meaningful percentage of demand is internal, driven by Valmont's other segments. Demand for coatings services generally follows the local industrial economies. Galvanizing is used in a wide variety of industrial applications where corrosion protection of steel is desired. While markets are varied, our markets for anodized or painted products are more directly dependent on consumer markets than industrial markets.
6
Competition
—The Coatings markets traditionally have been very fragmented, with a large number of competitors. Most of these competitors are relatively small, privately held companies who compete on the basis of price and personal relationships with their customers. As a result of ongoing industry consolidation, there are also several (public and private) multi-facility competitors. Our strategy is to compete on the basis of quality of the coating finish and timely delivery of the coated product to the customer. We also use the production capacity at our network of plants to ensure that the customer receives quality, timely service.
Distribution Methods
—Due to freight costs, a galvanizing location has an effective service area of an approximate 300 to 500 mile radius. While we believe that we are globally one of the largest custom galvanizers, our sales are a small percentage of the total market. Sales and customer service are provided directly to the user by a direct sales force, generally assigned to each specific location.
Irrigation Segment (Irrigation)
Products Produced
—We manufacture and distribute mechanical irrigation equipment and related service parts under the “Valley” brand name. A Valley irrigation machine usually is powered by electricity and propels itself over a farm field and applies water and chemicals to crops. Water and, in some instances, chemicals are applied through sprinklers attached to a pipeline that is supported by a series of towers, each of which is propelled via a drive train and tires. A standard mechanized irrigation machine (also known as a “center pivot”) rotates in a circle, although we also manufacture and distribute center pivot extensions that can irrigate corners of square and rectangular farm fields as well as conform to irregular field boundaries (referred to as a “corner” machine). Our irrigation machines can also irrigate fields by moving up and down the field as opposed to rotating in a circle (referred to as a “linear” machine). Irrigation machines can be configured to irrigate fields in size from 4 acres to over 500 acres, with a standard size in the U.S. configured for a 160-acre tract of ground. One of the key components of our irrigation machine is the control system. This is the part of the machine that allows the machine to be operated in the manner preferred by the grower, offering control of such factors as on/off timing, individual field sector control, rate and depth of water and chemical application. We also offer growers options to control multiple irrigation machines through centralized computer control or mobile remote control. A newly-formed water management group is providing product and service sales related to the delivery of water through mechanized irrigation equipment. The irrigation machine used in international markets is substantially the same as the one produced for the North American market.
Other Types of Irrigation
— There are other forms of irrigation available to farmers, two of the most prevalent being flood irrigation and drip irrigation. In flood irrigation, water is applied through a pipe or canal at the top of the field and allowed to run down the field by gravity. Drip irrigation involves plastic pipe or tape resting on the surface of the field or buried a few inches below ground level, with water being applied gradually. We estimate that center pivot and linear irrigation comprises 50% of the irrigated acreage in North America. International markets use predominantly flood irrigation.
The Company through its majority ownership in AgSense LLC, develops and markets remote monitoring technology for pivot irrigation systems that is sold on a subscription basis. AgSense technology allows growers to remotely monitor and operate irrigation equipment and other farm implements. Data management and control is achieved using applications running on either a desktop Internet browser or various mobile devices connected to the Internet. We also manufacture tubular products for industrial customers primarily in the agriculture industry as well as in the transportation and other industries.
Markets
—Market drivers in North America and international markets are essentially the same. Since the purchase of an irrigation machine is a capital expenditure, the purchase decision is based on the expected return on investment. The benefits a grower may realize through investment in mechanical irrigation include improved yields through better irrigation, cost savings through reduced labor and lower water and energy usage. The purchase decision is also affected by current and expected net farm income, commodity prices, interest rates, the status of government support programs and water regulations in local areas. In many international markets, the relative strength or weakness of local currencies as compared with the U.S. dollar may affect net farm income, since export markets are generally denominated in U.S. dollars. In addition, governments are sponsoring irrigation projects for self-sufficiency in food production.
The demand for mechanized irrigation comes from the following sources:
|
•
|
conversion from flood irrigation
|
|
•
|
replacement of existing mechanized irrigation machines
|
|
•
|
converting land that is not irrigated to mechanized irrigation
|
7
One of the key drivers in our Irrigation segment worldwide is that the usable water supply is limited. We estimate that:
|
•
|
only 2.5% of total worldwide water supply is freshwater
|
|
•
|
of that 2.5%, only 30% of freshwater is available to humans
|
|
•
|
the largest user of that freshwater is agriculture
|
We believe these factors, along with the trend of a growing worldwide population and improving diets, reflect the need to use water more efficiently while increasing food production to feed this growing population. We believe that mechanized irrigation can improve water application efficiency by 40-90% compared with traditional irrigation methods by applying water uniformly near the root zone and reducing water runoff. Furthermore, reduced water runoff improves water quality in nearby rivers, aquifers and streams, thereby providing environmental benefits in addition to conservation of water.
Competition
—In North America, there are a number of entities that provide irrigation products and services to agricultural customers. We believe we are the leader of the four main participants in the mechanized irrigation business. Participants compete for sales on the basis of price, product innovation and features, product durability and reliability, quality and service capabilities of the local dealer. Pricing can become very competitive, especially in periods when market demand is low. In international markets, our competitors are a combination of our major U.S. competitors and privately‑owned local companies. Competitive factors are similar to those in North America, although pricing tends to be a more prevalent competitive strategy in international markets. Since competition in international markets is local, we believe local manufacturing capability is important to competing effectively in international markets and we have that capability in key regions.
Distribution Methods
—We market our irrigation machines and service parts through independent dealers. There are approximately 268 dealer locations in North America, with another approximately 226 dealers serving international markets. The dealer determines the grower’s requirements, designs the configuration of the machine, installs the machine (including providing ancillary products that deliver water and electrical power to the machine) and provides after‑sales service. Our dealer network is supported and trained by our technical and sales teams. Our international dealers are supported through our regional headquarters in South America, South Africa, Western Europe, Australia, China and the United Arab Emirates as well as the home office in Valley, Nebraska.
General
Certain information generally applicable to each of our four reportable segments is set forth below.
Suppliers and Availability of Raw Materials.
Hot rolled steel coil and plate, zinc and other carbon steel products are the primary raw materials utilized in the manufacture of finished products for all segments. We purchase these essential items from steel mills, steel service centers, and zinc producers and these materials are usually readily available. While we may experience increased lead times to acquire materials and volatility in our purchase costs, we do not believe that key raw materials would be unavailable for extended periods. We have not experienced extended or wide-spread shortages of steel during this time, due to what we believe are strong relationships with some of the major steel producers. In the past several years, we experienced volatility in zinc and natural gas prices, but we did not experience any disruptions to our operations due to availability.
Patents, Licenses, Franchises and Concessions.
We have a number of patents for our manufacturing machinery, poles and irrigation designs. We also have a number of registered trademarks. We do not believe the loss of any individual patent or trademark would have a material adverse effect on our financial condition, results of operations or liquidity.
Seasonal Factors in Business.
Sales can be somewhat seasonal based upon the agricultural growing season and the infrastructure construction season. Sales of mechanized irrigation equipment to farmers are traditionally higher during the spring and fall and lower in the summer. Sales of infrastructure products are traditionally higher summer and fall and lower in the winter.
8
Customers.
We are not dependent for a material part of any segment’s business upon a single customer or upon very few customers. The loss of any one customer would not have a material adverse effect on our financial condition, results of operations or liquidity.
Backlog.
The backlog of orders for the principal products manufactured and marketed was $670.0 million at the end of the 2017 fiscal year and $602.9 million at the end of the 2016 fiscal year. An order is reported in our backlog upon receipt of a purchase order from the customer or execution of a sales order contract. We anticipate that most of the 2017 backlog of orders will be filled during fiscal year 2018. At year-end, the segments with backlog were as follows (dollar amounts in millions):
|
12/30/2017
|
12/31/2016
|
||||||
|
Engineered Support Structures
|
$
|
204.1
|
|
$
|
189.8
|
|
|
|
Utility Support Structures
|
359.1
|
|
336.1
|
|
|||
|
Irrigation
|
100.1
|
|
64.1
|
|
|||
|
Coatings
|
0.1
|
|
0.4
|
|
|||
|
Other
|
6.6
|
|
12.5
|
|
|||
|
$
|
670.0
|
|
$
|
602.9
|
|
||
Research Activities.
The information called for by this item is included in Note 1 of our consolidated financial statements.
Environmental Disclosure.
We are subject to various federal, state and local laws and regulations pertaining to environmental protection and the discharge of materials into the environment. Although we continually incur expenses and make capital expenditures related to environmental protection, we do not anticipate that future expenditures should materially impact our financial condition, results of operations, or liquidity.
Number of Employees.
At
December 30, 2017
, we had 10,690 employees.
|
(d)
|
Financial Information About Geographic Areas
|
Our international sales activities encompass over 100 foreign countries. The information called for by this item is included in Note 19 of our consolidated financial statements. Australia accounted for approximately 13% of our net sales in 2017; no other foreign country accounted for more than 5% of our net sales. Net sales for purposes of Note 19 and elsewhere exclude intersegment sales.
|
(e)
|
Available Information
|
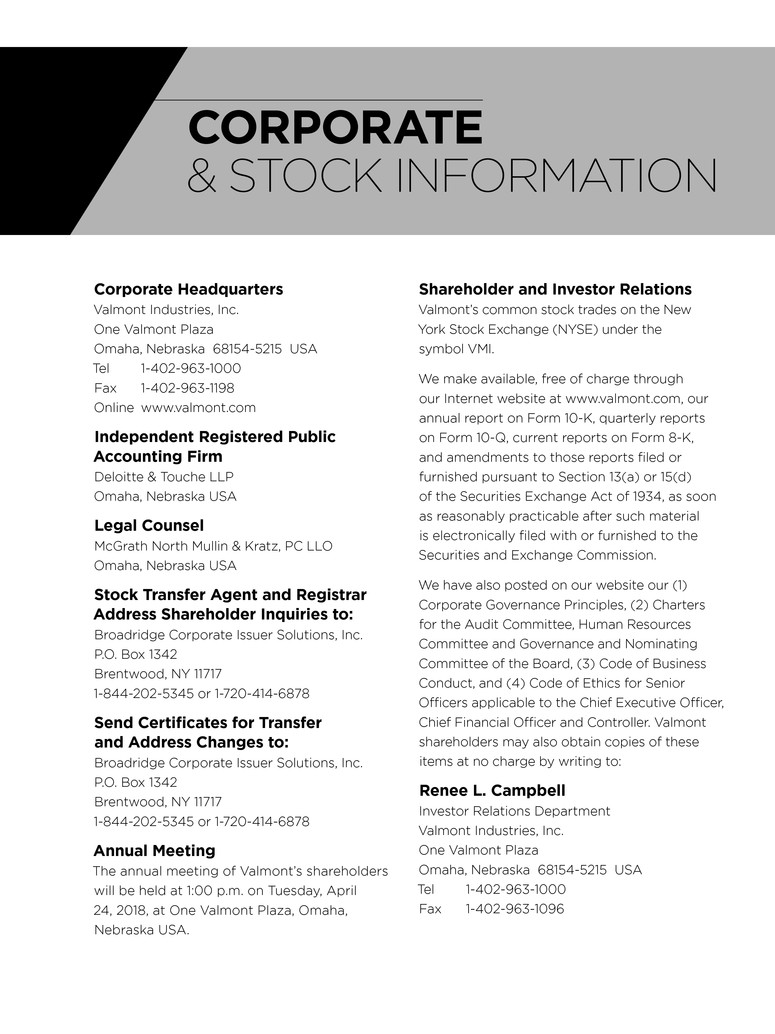
We make available, free of charge through our Internet web site at
http://www.valmont.com
, our annual report on Form 10-K, quarterly reports on Form 10-Q, current reports on Form 8-K, and amendments to those reports filed or furnished pursuant to Section 13(a) or 15(d) of the Securities Exchange Act of 1934, as soon as reasonably practicable after such material is electronically filed with or furnished to the Securities and Exchange Commission.
9
The following risk factors describe various risks that may affect our business, financial condition and operations.
The ultimate consumers of our products operate in cyclical industries that have been subject to significant downturns which have adversely impacted our sales in the past and may again in the future.
Our sales are sensitive to the market conditions present in the industries in which the ultimate consumers of our products operate, which in some cases have been highly cyclical and subject to substantial downturns. For example, a significant portion of our sales of support structures is to the electric utility industry. Our sales to the U.S. electric utility industry were over $600 million in 2017 and 2016. Purchases of our products are deferrable to the extent that utilities may reduce capital expenditures for reasons such as unfavorable regulatory environments, a slow U.S. economy or financing constraints. In the event of weakness in the demand for utility structures due to reduced or delayed spending for electrical generation and transmission projects, our sales and operating income likely will decrease.
The end users of our mechanized irrigation equipment are farmers. Accordingly, economic changes within the agriculture industry, particularly the level of farm income, may affect sales of these products. From time to time, lower levels of farm income resulted in reduced demand for our mechanized irrigation and tubing products. Farm income decreases when commodity prices, acreage planted, crop yields, government subsidies and export levels decrease. In addition, weather conditions, such as extreme drought may result in reduced availability of water for irrigation, and can affect farmers’ buying decisions. Farm income can also decrease as farmers’ operating costs increase. Increases in oil and natural gas prices result in higher costs of energy and nitrogen‑based fertilizer (which uses natural gas as a major ingredient). Furthermore, uncertainty as to future government agricultural policies may cause indecision on the part of farmers. The status and trend of government farm supports, financing aids and policies regarding the ability to use water for agricultural irrigation can affect the demand for our irrigation equipment. In the United States, certain parts of the country are considering policies that would restrict usage of water for irrigation. All of these factors may cause farmers to delay capital expenditures for farm equipment. Consequently, downturns in the agricultural industry will likely result in a slower, and possibly a negative, rate of growth in irrigation equipment and tubing sales. As of February 2018, the U.S. Department of Agriculture (the “USDA”) estimated U.S. 2017 net farm income to be $63.8 billion, up 3.7 percent from the USDA’s final U.S. 2016 net farm income of $61.5 billion. If the USDA's estimate proves accurate, 2017 would be the first increase in net farm income following three years of significant declines.
We have also experienced cyclical demand for those of our products that we sell to the wireless communications industry. Sales of wireless structures and components to wireless carriers and build-to-suit companies that serve the wireless communications industry have historically been cyclical. These customers may elect to curtail spending on new capacity to focus on cash flow and capital management. Weak market conditions have led to competitive pricing in recent years, putting pressure on our profit margins on sales to this industry. Changes in the competitive structure of the wireless industry, due to industry consolidation or reorganization, may interrupt capital plans of the wireless carriers as they assess their networks.
The access systems and grinding media product lines are partially dependent on investment spending by our customers in the oil, natural gas, and other mined mineral exploration industries, most specifically in the Asia Pacific region. During periods of continued low oil and natural gas prices, these customers may elect to curtail spending on new exploration sites which will cause us to experience lower demand for these specific product lines.
Due to the cyclical nature of these markets, we have experienced, and in the future we may experience, significant fluctuations in our sales and operating income with respect to a substantial portion of our total product offering, and such fluctuations could be material and adverse to our overall financial condition, results of operations and liquidity.
Changes in prices and reduced availability of key commodities such as steel, aluminum, zinc, natural gas and fuel may increase our operating costs and likely reduce our net sales and profitability.
Hot rolled steel coil and other carbon steel products have historically constituted approximately one-third of the cost of manufacturing our products. We also use large quantities of aluminum for lighting structures and zinc for the galvanization of most of our steel products. Our facilities use large quantities of natural gas for heating and processing tanks in our galvanizing operations. We use gasoline and diesel fuel to transport raw materials to our locations and to deliver finished goods to our customers. The markets for these commodities can be volatile. The following factors increase the cost and reduce the availability of these commodities:
10
|
•
|
increased demand, which occurs when we and other industries require greater quantities of these commodities, which can result in higher prices and lengthen the time it takes to receive these commodities from suppliers;
|
|
•
|
lower production levels of these commodities, due to reduced production capacities or shortages of materials needed to produce these commodities (such as coke and scrap steel for the production of steel) which could result in reduced supplies of these commodities, higher costs for us and increased lead times;
|
|
•
|
increased cost of major inputs, such as scrap steel, coke, iron ore and energy;
|
|
•
|
fluctuations in foreign exchange rates can impact the relative cost of these commodities, which may affect the cost effectiveness of imported materials and limit our options in acquiring these commodities; and
|
|
•
|
international trade disputes, import duties and quotas, since we import some steel for our domestic and foreign manufacturing facilities.
|
Increases in the selling prices of our products may not fully recover higher commodity costs and generally lag increases in our costs of these commodities. Consequently, an increase in these commodities will increase our operating costs and likely reduce our profitability. Rising steel prices in 2017, and more modest increases in 2016, put pressure on gross profit margins, especially in our Engineered Support Structures segment. The elapsed time between the quotation of a sales order and the manufacturing of the product ordered can be several months. As some of the sales in the Engineered Support Structures and Utility Support Structures segments are fixed price contracts, rapid increases in steel costs likely will result in lower operating income.
Steel prices for both hot rolled coil and plate decreased substantially in North America in 2015 as compared to 2014. Decreases in our product sales pricing and volumes offset the increase in gross profit realized from the lower steel prices. Steel is most significant for our Utility Support Structures segment where the cost of steel has been approximately 50% of the net sales, on average. Assuming a similar sales mix, a hypothetical 20% change in the price of steel would have affected our net sales from our utility support structures segment by approximately $66 million for the year ended December 30, 2017.
We believe the volatility over the past several years was due to significant increases in global steel production and rapid changes in consumption (especially in rapidly growing economies, such as China and India). The speed with which steel suppliers impose price increases on us may prevent us from fully recovering these price increases particularly in our lighting and traffic and utility businesses. In the same respect, rapid decreases in the price of steel can also result in reduced operating margins in our utility businesses due to the long production lead times.
Demand for our infrastructure products and coating services is highly dependent upon the overall level of infrastructure spending.
We manufacture and distribute engineered infrastructure products for lighting and traffic, utility and other specialty applications. Our Coatings segments serve many construction‑related industries. Because these products are used primarily in infrastructure construction, sales in these businesses are highly correlated with the level of construction activity, which historically has been cyclical. Construction activity by our private and government customers is affected by and can decline because of, a number of factors, including (but not limited to):
|
•
|
weakness in the general economy, which may negatively affect tax revenues, resulting in reduced funds available for construction;
|
|
•
|
interest rate increases, which increase the cost of construction financing; and
|
|
•
|
adverse weather conditions which slow construction activity.
|
The current economic uncertainty in the United States and Europe will have some negative effect on our business. In our North American lighting product line, some of our lighting structure sales are for new residential and commercial areas. As residential and commercial construction remains weak, we have experienced some negative impact on our light pole sales to these markets. In a broader sense, in the event of an overall downturn in the economies in Europe, Australia or China, we may experience decreased demand if our customers in these countries have difficulty securing credit for their purchases from us.
11
In addition, sales in our Engineered Support Structures segment, particularly our lighting, traffic and highway safety products, are highly dependent upon federal, state, local and foreign government spending on infrastructure development projects, such as the U.S. federal highway funding. The level of spending on such projects may decline for a number of reasons beyond our control, including, among other things, budgetary constraints affecting government spending generally or transportation agencies in particular, decreases in tax revenues and changes in the political climate, including legislative delays, with respect to infrastructure appropriations. For instance, the lack of long-term U.S. federal highway spending legislation for a significant period of time prior to the 2015 U.S. federal highway bill had a negative impact on our sales in this market. A substantial reduction in the level of government appropriations for infrastructure projects could have a material adverse effect on our results of operations or liquidity.
Certain of the Company’s foreign subsidiaries in India, New Zealand, and Australia manufacture highway safety products, primarily for sale in non-U.S. markets, and license certain design patents related to guardrails to third parties. There are currently domestic U.S. product liability lawsuits against some companies that manufacture and install certain guardrail products. Such lawsuits, some of which have at times involved a foreign subsidiary based on its design patent, could lead to a decline in demand for such products or approval for use of such products by government purchasers both domestically and internationally, and potentially raise litigation risk for foreign subsidiaries and negatively impact their sales and license fees.
We may lose some of our foreign investment or our foreign sales and profits may reduce because of risks of doing business in foreign markets.
We are an international manufacturing company with operations around the world. At December 30, 2017, we operated over 80 manufacturing plants, located on six continents, and sold our products in more than 100 countries. In 2017, approximately 36% of our total sales were either sold in markets or produced by our manufacturing plants outside of North America. We have operations in geographic markets that have recently experienced political instability, such as the Middle East, and economic uncertainty, such as Western Europe. Our geographic diversity also requires that we hire, train and retain competent management for the various local markets. We also have a significant manufacturing presence in Australia, Europe and China. We expect that international sales will continue to account for a significant percentage of our net sales in the future. Accordingly, our foreign business operations and our foreign sales and profits are subject to the following potential risks:
|
•
|
political and economic instability where we have foreign business operations, resulting in the reduction of the value of, or the loss of, our investment;
|
|
•
|
recessions in economies of countries in which we have business operations, decreasing our international sales;
|
|
•
|
difficulties and costs of staffing and managing our foreign operations, increasing our foreign operating costs and decreasing profits;
|
|
•
|
potential violation of local laws or unsanctioned management actions that could affect our profitability or ability to compete in certain markets;
|
|
•
|
difficulties in enforcing our rights outside the United States for patents on our manufacturing machinery, poles and irrigation designs;
|
|
•
|
increases in tariffs, export controls, taxes and other trade barriers reducing our international sales and our profit on these sales; and
|
|
•
|
acts of war or terrorism.
|
As a result, we may lose some of our foreign investment or our foreign sales and profits may be materially reduced because of risks of doing business in foreign markets.
12
Failure to comply with any applicable anti-corruption legislation could result in fines, criminal penalties and an adverse effect on our business.
We must comply with all applicable laws, which include the U.S. Foreign Corrupt Practices Act (FCPA), the UK Bribery Act or other anti-corruption laws. These anti-corruption laws generally prohibit companies and their intermediaries from making improper payments or providing anything of value to improperly influence government officials or private individuals for the purpose of obtaining or retaining a business advantage regardless of whether those practices are legal or culturally expected in a particular jurisdiction. Recently, there has been a substantial increase in the global enforcement of anti-corruption laws. Although we have a compliance program in place designed to reduce the likelihood of potential violations of such laws, violations of these laws could result in criminal or civil sanctions and an adverse effect on the company’s reputation, business and results of operations and financial condition.
We are subject to currency fluctuations from our international sales, which can negatively impact our reported earnings.
We sell our products in many countries around the world. Approximately 38% of our fiscal 2017 sales were in markets outside the United States and are often made in foreign currencies, mainly the Australian dollar, euro, Brazilian real, Canadian dollar, Chinese renminbi and South African rand. Because our financial statements are denominated in U.S. dollars, fluctuations in currency exchange rates between the U.S. dollar and other currencies have had and will continue to have an impact on our reported earnings. For example, the U.S. dollar appreciated significantly against most currencies in fiscal 2015. The most significant impact involved our Australian sales measured in U.S. dollar terms that decreased by approximately $68 million due to exchange rate translation effects in fiscal 2015. If the U.S. dollar weakens or strengthens versus the foreign currencies mentioned above, the result will be an increase or decrease in our reported sales and earnings, respectively. Currency fluctuations have affected our financial performance in the past and may affect our financial performance in any given period. In 2015, we realized a $17.3 million decrease in operating profit, as compared to 2014, from currency translation effects. In cases where local currencies are strong, the relative cost of goods imported from outside our country of operation becomes lower and affects our ability to compete profitably in our home markets.
We also face risks arising from the imposition of foreign exchange controls and currency devaluations. Exchange controls may limit our ability to convert foreign currencies into U.S. dollars or to remit dividends and other payments by our foreign subsidiaries or businesses located in or conducted within a country imposing controls. Currency devaluations result in a diminished value of funds denominated in the currency of the country instituting the devaluation. Actions of this nature could have a material adverse effect on our results of operations and financial condition in any given period.
Our businesses require skilled labor and management talent and we may be unable to attract and retain qualified employees.
Our businesses require skilled factory workers and management in order to meet our customer’s needs, grow our sales and maintain competitive advantages. Skills such as welding, equipment maintenance and operating complex manufacturing machinery may be in short supply in certain geographic areas, leading to shortages of skilled labor and/or increased labor costs. Management talent is critical as well, to help grow our businesses and effectively plan for succession of key employees upon retirement. In some geographic areas, skilled management talent for certain positions may be difficult to find. To the extent we have difficulty in finding and retaining these skills in the workforce, there may be an adverse effect on our ability to grow profitably in the future.
We may incur significant warranty or contract management costs.
In our Utility Support Structures segment, we manufacture large structures for electrical transmission. These products may be highly engineered for very large, complex contracts and subject to terms and conditions that penalize us for late delivery and result in consequential and compensatory damages. From time to time, we may have a product quality issue on a large utility structures order and the costs of curing that issue may be significant. For example, we recorded a $17.0 million reserve in the fourth quarter of 2015 for a commercial settlement with a large customer that requires ongoing quality monitoring. Our products in the Engineered Support Structures segment include structures for a wide range of outdoor lighting and wireless communication applications.
Our Irrigation products carry warranty provisions, some of which may span several years. In the event we have wide-spread product reliability issues with certain components, we may be required to incur significant costs to remedy the situation.
13
We face strong competition in our markets.
We face competitive pressures from a variety of companies in each of the markets we serve. Our competitors include companies who provide the technologies that we provide as well as companies who provide competing technologies, such as drip irrigation. Our competitors include international, national, and local manufacturers, some of whom may have greater financial, manufacturing, marketing and technical resources than we do, or greater penetration in or familiarity with a particular geographic market than we have.
In addition, certain of our competitors, particularly with respect to our utility and wireless communication product lines, have sought bankruptcy protection in recent years, and may emerge with reduced debt service obligations, which could allow them to operate at pricing levels that put pressures on our margins. Some of our customers have moved manufacturing operations or product sourcing overseas, which can negatively impact our sales of galvanizing and anodizing services.
To remain competitive, we will need to invest continuously in manufacturing, product development and customer service, and we may need to reduce our prices, particularly with respect to customers in industries that are experiencing downturns. We cannot provide assurance that we will be able to maintain our competitive position in each of the markets that we serve.
We could incur substantial costs as the result of violations of, or liabilities under, environmental laws.
Our facilities and operations are subject to U.S. and foreign laws and regulations relating to the protection of the environment, including those governing the discharge of pollutants into the air and water, the management and disposal of hazardous substances and wastes, and the cleanup of contamination. Failure to comply with these laws and regulations, or with the permits required for our operations, could result in fines or civil or criminal sanctions, third party claims for property damage or personal injury, and investigation and cleanup costs. Potentially significant expenditures could be required in order to comply with environmental laws that regulators may adopt or impose in the future.
Certain of our facilities have been in operation for many years and, over time, we and other predecessor operators of these facilities have generated, used, handled and disposed of hazardous and other regulated wastes. We detected contaminants at some of our present and former sites, principally in connection with historical operations. In addition, from time to time we have been named as a potentially responsible party under Superfund or similar state laws. While we are not aware of any contaminated sites that are not provided for in our financial statements, including third‑party sites, at which we may have material obligations, the discovery of additional contaminants or the imposition of additional cleanup obligations at these sites could result in significant liability beyond amounts provided for in our financial statements.
We may not realize the improved operating results that we anticipate from acquisitions we may make in the future, and we may experience difficulties in integrating the acquired businesses or may inherit significant liabilities related to such businesses.
We explore opportunities to acquire businesses that we believe are related to our core competencies from time to time, some of which may be material to us. We expect such acquisitions will produce operating results better than those historically experienced or presently expected to be experienced in the future by us in the absence of the acquisition. We cannot provide assurance that this assumption will prove correct with respect to any acquisition.
Any future acquisitions may present significant challenges for our management due to the time and resources required to properly integrate management, employees, information systems, accounting controls, personnel and administrative functions of the acquired business with those of Valmont and to manage the combined company on a going forward basis. We may not be able to completely integrate and streamline overlapping functions or, if such activities are successfully accomplished, such integration may be more costly to accomplish than presently contemplated. We may also have difficulty in successfully integrating the product offerings of Valmont and acquired businesses to improve our collective product offering. Our efforts to integrate acquired businesses could be affected by a number of factors beyond our control, including general economic conditions. In addition, the process of integrating acquired businesses could cause the interruption of, or loss of momentum in, the activities of our existing business. The diversion of management’s attention and any delays or difficulties encountered in connection with the integration acquired businesses could adversely impact our business, results of operations and liquidity, and the benefits we anticipate may never materialize. These factors are relevant to any acquisition we undertake.
14
In addition, although we conduct reviews of businesses we acquire, we may be subject to unexpected claims or liabilities, including environmental cleanup costs, as a result of these acquisitions. Such claims or liabilities could be costly to defend or resolve and be material in amount, and thus could materially and adversely affect our business and results of operations and liquidity.
We have, from time to time, maintained a substantial amount of outstanding indebtedness, which could impair our ability to operate our business and react to changes in our business, remain in compliance with debt covenants and make payments on our debt.
As of December 30, 2017, we had $755.0 million of total indebtedness outstanding. We had $585.2 million of capacity to borrow under our revolving credit facility at December 30, 2017. We normally borrow money to make business acquisitions and major capital expenditures. From time to time, our borrowings have been significant. Our level of indebtedness could have important consequences, including:
|
•
|
our ability to satisfy our obligations under our debt agreements could be affected and any failure to comply with the requirements, including significant financial and other restrictive covenants, of any of our debt agreements and could result in an event of default under the agreements governing our indebtedness;
|
|
•
|
a substantial portion of our cash flow from operations will be required to make interest and principal payments and will not be available for operations, working capital, capital expenditures, expansion, or general corporate and other purposes, including possible future acquisitions that we believe would be beneficial to our business;
|
|
•
|
our ability to obtain additional financing in the future may be impaired;
|
|
•
|
we may be more highly leveraged than our competitors, which may place us at a competitive disadvantage;
|
|
•
|
our flexibility in planning for, or reacting to, changes in our business and industry may be limited; and
|
|
•
|
our degree of leverage may make us more vulnerable in the event of a downturn in our business, our industry or the economy in general.
|
We had $492.8 million of cash at December 30, 2017, which mitigates a portion of the risk associated with our debt.
However, approximately 82% of our consolidated cash balances are outside the United States and most of our interest‑bearing debt is borrowed by U.S. entities. In the event that we would have to repatriate cash from international operations to meet cash needs in the U.S., we may be subject to legal, contractual or other restrictions. In addition, as we use cash for acquisitions and other purposes, any of these factors could have a material adverse effect on our business, financial condition, results of operations, cash flows and business prospects.
The restrictions and covenants in our debt agreements could limit our ability to obtain future financings, make needed capital expenditures, withstand a future downturn in our business, or the economy in general, or otherwise conduct necessary corporate activities. These covenants may prevent us from taking advantage of business opportunities that arise.
A breach of any of these covenants would result in a default under the applicable debt agreement. A default, if not waived, could result in acceleration of the debt outstanding under the agreement and in a default with respect to, and acceleration of, the debt outstanding under our other debt agreements. The accelerated debt would become immediately due and payable. If that should occur, we may not be able to pay all such debt or to borrow sufficient funds to refinance it. Even if new financing were then available, it may not be on terms that are favorable to us.
We assumed an underfunded pension liability as part of the 2010 Delta acquisition and the combined company may be required to increase funding of the plan and/or be subject to restrictions on the use of excess cash.
Delta is the sponsor of a United Kingdom defined benefit pension plan that, as of December 30, 2017, covered approximately 6,500 inactive or retired former Delta employees. At December 30, 2017, this plan was, for accounting purposes, underfunded by approximately £140.5 million ($189.6 million). The current agreement with the trustees of the pension plan for annual funding is approximately £10.0 million ($13.5 million) in respect of the funding shortfall and approximately £1.1 million ($1.5 million) in respect of administrative expenses. Although this funding obligation was considered in the acquisition price for the Delta shares, the underfunded position may adversely affect the combined company as follows:
15
|
•
|
Laws and regulations in the United Kingdom normally require the plan trustees and us to agree on a new funding plan every three years. The next funding plan will be developed in 2019. Changes in actuarial assumptions, including future discount, inflation and interest rates, investment returns and mortality rates, may increase the underfunded position of the pension plan and cause the combined company to increase its funding levels in the pension plan to cover underfunded liabilities.
|
|
•
|
The United Kingdom regulates the pension plan and the trustees represent the interests of covered workers. Laws and regulations, under certain circumstances, could create an immediate funding obligation to the pension plan which could be significantly greater than the £140.5 million ($189.6 million) assumed for accounting purposes as of December 30, 2017. Such immediate funding is calculated by reference to the cost of buying out liabilities on the insurance market, and could affect our ability to fund the Company’s future growth of the business or finance other obligations.
|
Our ability to operate could be adversely affected if our information technology systems are compromised or otherwise subjected to cyber crimes.
Cyber crime continually increases in sophistication and may pose a significant risk to the security of our information technology systems and networks, which if breached could materially adversely affect the confidentiality, availability and integrity of our data. We protect our sensitive information and confidential and personal data, our facilities and information technology systems, but we may be vulnerable to security breaches. This could lead to negative publicity, theft, modification or destruction of proprietary information or key information, manufacture of defective products, production downtimes and operational disruptions, which could adversely affect our reputation, competitiveness and results of operations.
None.
Our corporate headquarters are located in a leased facility in Omaha, Nebraska, under a lease expiring in 2021. The headquarters of the Company’s reportable segments are located in Valley, Nebraska. We also maintain a management headquarters in Sydney, Australia. Most of our significant manufacturing locations are owned or are subject to long-term renewable leases. Our principal manufacturing locations are in Valley, Nebraska, McCook, Nebraska, Tulsa, Oklahoma, Brenham, Texas, Charmeil, France and Shanghai, China. All of these facilities are owned by us. We believe that our manufacturing capabilities and capacities are adequate for us to effectively serve our customers. Our capital spending programs consist of investment for replacement, achieving operational efficiencies and expand capacities where needed. Our principal operating locations by reportable segment are listed below.
Engineered Support Structures segment North America manufacturing locations are in Nebraska, Texas, Indiana, Minnesota, Oregon, South Carolina, Washington and Canada. The largest of these operations are in Valley, Nebraska and Brenham, Texas, both of which are owned facilities. We have communication components distribution locations in New York, California, Florida, Georgia, and Texas. International locations are in France, the Netherlands, Finland, Estonia, England, Germany, Poland, Morocco, Australia, Indonesia, the Philippines, Thailand, Malaysia, India and China. The largest of these operations are in Charmeil, France and Shanghai, China, both of which are owned facilities.
Utility Support Structures segment North America manufacturing locations are in Alabama, Georgia, Florida, California, Texas, Oklahoma, Pennsylvania, Tennessee, Kansas, Nebraska and Mexico. The largest of these operations are in Tulsa, Oklahoma, Monterrey, Mexico and Hazleton, Pennsylvania. The Tulsa and Monterrey facilities are owned and the Hazleton facility is located on both owned and leased property. The largest principal international manufacturing location is Denmark and there are also manufacturing locations in China and France.
Coatings segment North America operations include U.S. operations located in Nebraska, California, Minnesota, Iowa, Indiana, Illinois, Kansas, New Jersey, Oregon, Utah, Oklahoma, Texas, Virginia, Alabama, Florida and South Carolina and two locations near Toronto, Canada. International operations are located in Australia, Malaysia, the Philippines and India.
16
Irrigation segment North America manufacturing operations are located in Valley and McCook, Nebraska. Our principal manufacturing operations serving international markets are located in Uberaba, Brazil, Nigel, South Africa, Jebel Ali, United Arab Emirates, and Shandong, China. All facilities are owned except for China, which is leased.
Our operations in the "other" category are located in Australia.
We are not a party to, nor are any of our properties subject to, any material legal proceedings. We are, from time to time, engaged in routine litigation incidental to our businesses.
Not Applicable.
Executive Officers of the Company
Our executive officers at February 28, 2018, their ages, positions held, and the business experience of each during the past five years are, as follows:
Mogens C. Bay, age 69, Executive Chairman of the Board of Directors since December 31, 2017, previously Chief Executive Officer since August 1993.
Stephen G. Kaniewski, age 46, President and Chief Executive Officer since December 31, 2017, previously President and Chief Operating Officer since October 2016. Joined Valmont in August 2010 as Vice President-Information Technology, and later in January 2014 moved into the Vice President-Global Operations role for the Irrigation segment. In January 2015, he transferred to the Utility Support Structures segment as Senior Vice President and Managing Director and in August 2015 became Group President of Utility Support Structures segment.
Mark C. Jaksich, age 60, Executive Vice President and Chief Financial Officer since February 2014. Vice President and Controller, February 2000 to February 2014.
Vanessa K. Brown, age 65, Senior Vice President-Human Resources since July 2011. Director of Human Resources of North America Engineered Support Structures division from 1997 until 2011.
Timothy P. Francis, age 41, Vice President and Controller since June 2014. Chief Financial Officer of Burlington Capital Group LLC (“BCG”) and America First Multifamily Investors, L.P. (“ATAX”), a NASDAQ listed Limited Partnership in which BCG serves as the General Partner, from January 2012 to May 2014.
John A. Kehoe, age 48, Senior Vice President of Information Technology since June 2014. Senior information technology executive at Rockwell Collins, an aerospace and defense contractor and manufacturer, from 2004 - 2014.
17
MATTERS, AND ISSUER PURCHASES OF EQUITY SECURITIES.
Our common stock is traded on the New York Stock Exchange under the symbol “VMI”. We had approximately 24,801 shareholders of common stock at
December 30, 2017
. Other stock information required by this item is included in Note 21 “Quarterly Financial Data (unaudited)” to the consolidated financial statements and incorporated herein by reference.
Issuer Purchases of Equity Securities
|
Period
|
(a)
Total Number of Shares Purchased |
(b)
Average Price paid per share |
(c)
Total Number of Shares Purchased as Part of Publicly Announced Plans or Programs |
(d)
Approximate Dollar Value of Maximum Number of Shares that May Yet Be Purchased Under the Plans or Programs |
||||||||||
|
October 1, 2017 to October 28, 2017
|
—
|
|
$
|
—
|
|
—
|
|
$
|
132,172,000
|
|
||||
|
October 29, 2017 to December 2, 2017
|
—
|
|
—
|
|
—
|
|
132,172,000
|
|
||||||
|
December 3, 2017 to December 30, 2017
|
—
|
|
—
|
|
—
|
|
132,172,000
|
|
||||||
|
Total
|
—
|
|
$
|
—
|
|
—
|
|
$
|
132,172,000
|
|
||||
On May 13, 2014, we announced a capital allocation philosophy which covered both the quarterly dividend rate as well as a share repurchase program. Specifically, the Board of Directors authorized the purchase of up to $500 million of the Company's outstanding common stock from time to time over twelve months at prevailing market prices, through open market or privately-negotiated transactions. On February 24, 2015, the Board of Directors authorized additional purchases of up to $250 million of the Company's outstanding common stock with no stated expiration date. As of
December 30, 2017
, we have acquired 4,588,131 shares for approximately $617.8 million under this share repurchase program.
18
SELECTED FIVE-YEAR FINANCIAL DATA
|
(Dollars in thousands, except per share amounts)
|
2017
|
2016
|
2015
|
2014
|
2013
|
|||||||||||||||
|
Operating Data
|
(3
|
)
|
||||||||||||||||||
|
Net sales
|
$
|
2,745,967
|
|
$
|
2,521,676
|
|
$
|
2,618,924
|
|
$
|
3,123,143
|
|
$
|
3,304,211
|
|
|||||
|
Operating income (1)
|
266,432
|
|
243,504
|
|
131,695
|
|
357,716
|
|
473,069
|
|
||||||||||
|
Net earnings attributable to Valmont Industries, Inc. (2)
|
116,240
|
|
173,232
|
|
40,117
|
|
183,976
|
|
278,489
|
|
||||||||||
|
Depreciation and amortization
|
84,957
|
|
82,417
|
|
91,144
|
|
89,328
|
|
77,436
|
|
||||||||||
|
Capital expenditures
|
55,266
|
|
57,920
|
|
45,468
|
|
73,023
|
|
106,753
|
|
||||||||||
|
Per Share Data
|
||||||||||||||||||||
|
Earnings:
|
||||||||||||||||||||
|
Basic (2)
|
$
|
5.16
|
|
$
|
7.68
|
|
$
|
1.72
|
|
$
|
7.15
|
|
$
|
10.45
|
|
|||||
|
Diluted (2)
|
5.11
|
|
7.63
|
|
1.71
|
|
7.09
|
|
10.35
|
|
||||||||||
|
Cash dividends declared
|
1.500
|
|
1.500
|
|
1.500
|
|
1.375
|
|
0.975
|
|
||||||||||
|
Financial Position
|
||||||||||||||||||||
|
Working capital
|
$
|
1,069,567
|
|
$
|
903,368
|
|
$
|
860,298
|
|
$
|
995,727
|
|
$
|
1,161,260
|
|
|||||
|
Property, plant and equipment, net
|
518,928
|
|
518,335
|
|
532,489
|
|
606,453
|
|
534,210
|
|
||||||||||
|
Total assets
|
2,602,250
|
|
2,391,731
|
|
2,392,382
|
|
2,721,955
|
|
2,773,046
|
|
||||||||||
|
Long-term debt, including current installments
|
754,854
|
|
755,646
|
|
757,995
|
|
760,122
|
|
467,661
|
|
||||||||||
|
Total Valmont Industries, Inc. shareholders’ equity.
|
1,112,836
|
|
943,482
|
|
918,441
|
|
1,201,833
|
|
1,522,025
|
|
||||||||||
|
Cash flow data:
|
||||||||||||||||||||
|
Net cash flows from operating activities
|
$
|
145,716
|
|
$
|
219,168
|
|
$
|
272,267
|
|
$
|
174,096
|
|
$
|
396,442
|
|
|||||
|
Net cash flows from investing activities
|
(49,615
|
)
|
(53,049
|
)
|
(48,171
|
)
|
(256,863
|
)
|
(131,721
|
)
|
||||||||||
|
Net cash flows from financing activities
|
(32,010
|
)
|
(95,158
|
)
|
(220,005
|
)
|
(139,756
|
)
|
(37,380
|
)
|
||||||||||
|
Financial Measures
|
||||||||||||||||||||
|
Invested capital(a)
|
$
|
1,941,716
|
|
$
|
1,774,781
|
|
$
|
1,759,851
|
|
$
|
2,096,276
|
|
$
|
2,110,455
|
|
|||||
|
Return on invested capital(a)
|
10.3
|
%
|
9.5
|
%
|
4.6
|
%
|
11.3
|
%
|
15.0
|
%
|
||||||||||
|
Adjusted EBITDA(b)
|
$
|
351,987
|
|
$
|
326,629
|
|
$
|
285,115
|
|
$
|
413,684
|
|
$
|
546,208
|
|
|||||
|
Return on beginning shareholders’ equity(c)
|
12.3
|
%
|
18.9
|
%
|
3.3
|
%
|
12.1
|
%
|
20.6
|
%
|
||||||||||
|
Leverage ratio (d)
|
2.15
|
|
2.32
|
|
2.66
|
|
1.87
|
|
0.89
|
|
||||||||||
|
Year End Data
|
||||||||||||||||||||
|
Shares outstanding (000)
|
22,694
|
|
22,521
|
|
22,857
|
|
24,229
|
|
26,825
|
|
||||||||||
|
Approximate number of shareholders
|
24,801
|
|
26,057
|
|
27,010
|
|
28,225
|
|
28,507
|
|
||||||||||
|
Number of employees
|
10,690
|
|
10,552
|
|
10,697
|
|
11,321
|
|
10,769
|
|
||||||||||
(1) Fiscal 2015 operating income included impairments of goodwill and intangible assets of $41,970 and restructuring expenses of $39,852.
(2) Fiscal 2017 included $41,935 of tax expense ($1.85 per share) associated with recording the impact of the 2017 Tax Act. Fiscal 2016 included deferred income tax benefit of $30,590 ($1.35 per share) resulting primarily from the re-measurement of the deferred tax asset for the Company's U.K. defined benefit pension plan. In addition, fiscal 2016 included $9,888 ($0.44 per share) recorded as a valuation allowance against a tax credit asset. Fiscal 2016 also included the reversal of a contingent liability that was recognized as part of the Delta purchase accounting of $16,591 ($0.73 per share) which is not taxable. Fiscal 2015 included impairments of goodwill and intangible assets of $40,140 after-tax ($1.72 per share), restructuring expenses of $28,167 after-tax ($1.20 per share), and deferred income tax expense of $7,120 ($0.31 per share) for a change in U.K. tax rates.
Fiscal 2014 included costs associated with refinancing of our long-term debt of $24,171 after tax ($0.93 per share). Fiscal 2013 included $4,569 ($0.17 per share) in after-tax fixed asset impairment losses at Delta EMD Pty. Ltd. (EMD) and $12,011 ($0.45 per share) in losses associated with the deconsolidation of EMD.
(3) Fiscal 2016 was a 53 week fiscal year.
19
|
a)
|
Return on Invested Capital is calculated as Operating Income (after-tax) divided by the average of beginning and ending Invested Capital. Invested Capital represents total assets minus total liabilities (excluding interest-bearing debt). Return on Invested Capital is one of our key operating ratios, as it allows investors to analyze our operating performance in light of the amount of investment required to generate our operating profit. Return on Invested Capital is also a measurement used to determine management incentives. Return on Invested Capital is a non-GAAP measure. Accordingly, Invested Capital and Return on Invested Capital should not be considered in isolation or as a substitute for net earnings, cash flows from operations or other income or cash flow data prepared in accordance with GAAP or as a measure of our operating performance or liquidity. The table below shows how Invested Capital and Return on Invested Capital are calculated from our income statement and balance sheet.
|
|
2017
|
2016
|
2015
|
2014
|
2013
|
|||||||||||||||
|
Operating income
|
$
|
266,432
|
|
$
|
243,504
|
|
$
|
131,695
|
|
$
|
357,716
|
|
$
|
473,069
|
|
||||
|
Adjusted effective tax rate (1)
|
28.1
|
%
|
30.8
|
%
|
32.0
|
%
|
33.4
|
%
|
35.1
|
%
|
|||||||||
|
Tax effect on operating income
|
(74,867
|
)
|
(74,999
|
)
|
(42,142
|
)
|
(119,477
|
)
|
(166,047
|
)
|
|||||||||
|
After-tax operating income
|
191,565
|
|
168,505
|
|
89,553
|
|
238,239
|
|
307,022
|
|
|||||||||
|
Average invested capital
|
1,858,249
|
|
1,767,316
|
|
1,928,064
|
|
2,103,366
|
|
2,043,983
|
|
|||||||||
|
Return on invested capital
|
10.3
|
%
|
9.5
|
%
|
4.6
|
%
|
11.3
|
%
|
15.0
|
%
|
|||||||||
|
Total assets
|
2,602,250
|
|
2,391,731
|
|
2,392,382
|
|
2,721,955
|
|
2,773,046
|
|
|||||||||
|
Less: Accounts and income taxes payable
|
(227,906
|
)
|
(177,488
|
)
|
(179,983
|
)
|
(196,565
|
)
|
(216,121
|
)
|
|||||||||
|
Less: Accrued expenses
|
(165,455
|
)
|
(162,318
|
)
|
(175,947
|
)
|
(176,430
|
)
|
(194,527
|
)
|
|||||||||
|
Less: Defined benefit pension liability
|
(189,552
|
)
|
(209,470
|
)
|
(179,323
|
)
|
(150,124
|
)
|
(154,397
|
)
|
|||||||||
|
Less: Deferred compensation
|
(48,526
|
)
|
(44,319
|
)
|
(48,417
|
)
|
(47,932
|
)
|
(39,109
|
)
|
|||||||||
|
Less: Other noncurrent liabilities
|
(20,585
|
)
|
(14,910
|
)
|
(40,290
|
)
|
(45,542
|
)
|
(51,731
|
)
|
|||||||||
|
Less: Dividends payable
|
(8,510
|
)
|
(8,445
|
)
|
(8,571
|
)
|
(9,086
|
)
|
(6,706
|
)
|
|||||||||
|
Total Invested capital
|
$
|
1,941,716
|
|
$
|
1,774,781
|
|
$
|
1,759,851
|
|
$
|
2,096,276
|
|
$
|
2,110,455
|
|
||||
|
Beginning of year invested capital
|
$
|
1,774,781
|
|
$
|
1,759,851
|
|
$
|
2,096,276
|
|
$
|
2,110,455
|
|
$
|
1,977,511
|
|
||||
|
Average invested capital
|
$
|
1,858,249
|
|
$
|
1,767,316
|
|
$
|
1,928,064
|
|
$
|
2,103,366
|
|
$
|
2,043,983
|
|
||||
(1) The adjusted effective tax rate for 2017 excludes the $41,935 of tax expense associated with recording the impact of the 2017 Tax Act. The effective tax rate in 2017 including these items is 46.5%. The adjusted effective tax rate for 2016 excludes deferred income tax benefit of $30,590 resulting primarily from the re-measurement of the deferred tax asset for the Company's U.K. defined benefit pension plan. In addition, fiscal 2016 excludes $9,888 recorded as a valuation allowance against a tax credit asset. Fiscal 2016 also excludes the reversal of a contingent liability that was recognized as part of the Delta purchase accounting of $16,591, which is not taxable. The effective tax rate in 2016 including these items is 19.1%. The adjusted effective tax rate in 2015 excludes the effects of the goodwill impairments which are not deductible for income tax purposes and the $7,120 million deferred income tax expense recognized as a result of the U.K. corporate tax rate decreasing from 20% to 18%. The effective tax rate in 2015 including these items is 51.0%.
Return on invested capital, as presented, may not be comparable to similarly titled measures of other companies.
|
(b)
|
Earnings before Interest, Taxes, Depreciation and Amortization (Adjusted EBITDA) is one of our key financial ratios in that it is the basis for determining our maximum borrowing capacity at any one time. Our bank credit agreements contain a financial covenant that our total interest‑bearing debt not exceed 3.50x Adjusted EBITDA (or 3.75x Adjusted EBITDA after certain material acquisitions) for the most recent four quarters. These bank credit agreements allow us to add estimated EBITDA from acquired businesses for periods we did not own the acquired businesses. The bank credit agreements also provide for an adjustment to EBITDA, subject to certain specified limitations, for non-cash charges or gains that are non-recurring in nature. If this financial covenant is violated, we may incur additional financing costs or be required to pay the debt before its maturity date. Adjusted EBITDA is non-GAAP measure and, accordingly, should not be considered in isolation or as a substitute for net earnings, cash flows from operations or other income or cash flow data prepared in accordance with GAAP or as a measure of our operating performance or liquidity. The calculation of Adjusted EBITDA is as follows:
|
20
|
2017
|
2016
|
2015
|
2014
|
2013
|
|||||||||||||||
|
Net cash flows from operations
|
$
|
145,716
|
|
$
|
219,168
|
|
$
|
272,267
|
|
$
|
174,096
|
|
$
|
396,442
|
|
||||
|
Interest expense
|
44,645
|
|
44,409
|
|
44,621
|
|
36,790
|
|
32,502
|
|
|||||||||
|
Income tax expense
|
106,145
|
|
42,063
|
|
47,427
|
|
94,894
|
|
157,781
|
|
|||||||||
|
Loss on investment
|
(237
|
)
|
(586
|
)
|
(4,555
|
)
|
(3,795
|
)
|
—
|
|
|||||||||
|
Non-cash debt refinancing costs
|
—
|
|
—
|
|
—
|
|
2,478
|
|
—
|
|
|||||||||
|
Change in fair value of contingent consideration
|
—
|
|
3,242
|
|
—
|
|
4,300
|
|
—
|
|
|||||||||
|
Deconsolidation of subsidiary
|
—
|
|
—
|
|
—
|
|
—
|
|
(12,011
|
)
|
|||||||||
|
Impairment of goodwill and intangible assets
|
—
|
|
—
|
|
(41,970
|
)
|
—
|
|
—
|
|
|||||||||
|
Impairment of property, plant and equipment
|
—
|
|
(1,099
|
)
|
(19,836
|
)
|
—
|
|
(12,161
|
)
|
|||||||||
|
Deferred income tax (expense) benefit
|
(39,755
|
)
|
23,685
|
|
(4,858
|
)
|
(5,251
|
)
|
10,141
|
|
|||||||||
|
Noncontrolling interest
|
(6,079
|
)
|
(5,159
|
)
|
(5,216
|
)
|
(5,342
|
)
|
(1,971
|
)
|
|||||||||
|
Equity in earnings of nonconsolidated subsidiaries
|
—
|
|
—
|
|
(247
|
)
|
29
|
|
835
|
|
|||||||||
|
Stock-based compensation
|
(10,706
|
)
|
(9,931
|
)
|
(7,244
|
)
|
(6,730
|
)
|
(6,513
|
)
|
|||||||||
|
Pension plan expense
|
(648
|
)
|
(1,870
|
)
|
610
|
|
(2,638
|
)
|
(6,569
|
)
|
|||||||||
|
Contribution to pension plan
|
40,245
|
|
1,488
|
|
16,500
|
|
18,173
|
|
17,619
|
|
|||||||||
|
Change in restricted cash - pension plan trust
|
(12,568
|
)
|
13,652
|
|
—
|
|
—
|
|
—
|
|
|||||||||
|
Changes in assets and liabilities, net of acquisitions
|
81,305
|
|
13,690
|
|
(71,863
|
)
|
98,376
|
|
(34,205
|
)
|
|||||||||
|
Other
|
3,924
|
|
(631
|
)
|
(2,327
|
)
|
(392
|
)
|
4,318
|
|
|||||||||
|
EBITDA
|
351,987
|
|
342,121
|
|
223,309
|
|
404,988
|
|
546,208
|
|
|||||||||
|
Reversal of contingent liability
|
—
|
|
(16,591
|
)
|
—
|
|
—
|
|
—
|
|
|||||||||
|
Impairment of goodwill and intangible assets
|
—
|
|
—
|
|
41,970
|
|
—
|
|
—
|
|
|||||||||
|
Impairment of property, plant and equipment
|
—
|
|
1,099
|
|
19,836
|
|
—
|
|
—
|
|
|||||||||
|
EBITDA from acquisitions (months in 2014 not owned by Company)
|
—
|
|
—
|
|
—
|
|
8,696
|
|
—
|
|
|||||||||
|
Adjusted EBITDA
|
$
|
351,987
|
|
$
|
326,629
|
|
$
|
285,115
|
|
$
|
413,684
|
|
$
|
546,208
|
|
||||
|
2017
|
2016
|
2015
|
2014
|
2013
|
|||||||||||||||
|
Net earnings attributable to Valmont Industries, Inc.
|
$
|
116,240
|
|
$
|
173,232
|
|
$
|
40,117
|
|
$
|
183,976
|
|
$
|
278,489
|
|
||||
|
Interest expense
|
44,645
|
|
44,409
|
|
44,621
|
|
36,790
|
|
32,502
|
|
|||||||||
|
Income tax expense
|
106,145
|
|
42,063
|
|
47,427
|
|
94,894
|
|
157,781
|
|
|||||||||
|
Depreciation and amortization expense
|
84,957
|
|
82,417
|
|
91,144
|
|
89,328
|
|
77,436
|
|
|||||||||
|
EBITDA
|
351,987
|
|
342,121
|
|
223,309
|
|
404,988
|
|
546,208
|
|
|||||||||
|
Reversal of contingent liability
|
—
|
|
(16,591
|
)
|
—
|
|
—
|
|
—
|
|
|||||||||
|
Impairment of goodwill and intangible assets
|
—
|
|
—
|
|
41,970
|
|
—
|
|
—
|
|
|||||||||
|
Impairment of property, plant and equipment
|
—
|
|
1,099
|
|
19,836
|
|
—
|
|
—
|
|
|||||||||
|
EBITDA from acquisitions (months in 2014 not owned by Company)
|
—
|
|
—
|
|
—
|
|
8,696
|
|
—
|
|
|||||||||
|
Adjusted EBITDA
|
$
|
351,987
|
|
$
|
326,629
|
|
$
|
285,115
|
|
$
|
413,684
|
|
$
|
546,208
|
|
||||
Adjusted EBITDA, as presented, may not be comparable to similarly titled measures of other companies. During 2014, we incurred $38,705 of costs associated with refinancing of debt. This category of expense is not in the definition of EBITDA for debt covenant calculation purposes per our debt agreements. As such, it was not added back in the Adjusted EBITDA reconciliation to cash flows from operations or net earnings for the year ended December 27, 2014.
|
(c)
|
Return on beginning shareholders’ equity is calculated by dividing Net earnings attributable to Valmont Industries, Inc. by the prior year’s ending Total Valmont Industries, Inc. shareholders’ equity.
|
|
(d)
|
Leverage ratio is calculated as the sum of current portion of long-term debt, notes payable to bank, and long-term debt divided by Adjusted EBITDA. The leverage ratio is one of the key financial ratios in the covenants under our major debt agreements and the ratio cannot exceed 3.5 (or 3.75x after certain material acquisitions) for any reporting period (four quarters). If those covenants are violated, we may incur additional financing costs or be required to pay the debt before its maturity date. Leverage ratio is a non-GAAP measure and, accordingly, should not be considered in isolation or as a substitute for net earnings, cash flows from operations or other income or cash flow data prepared in accordance with GAAP or as a measure of our operating performance or liquidity. The calculation of this ratio is as follows:
|
21
|
2017
|
2016
|
2015
|
2014
|
2013
|
|||||||||||||||
|
Current portion of long-term debt
|
$
|
966
|
|
$
|
851
|
|
$
|
1,077
|
|
$
|
1,181
|
|
$
|
202
|
|
||||
|
Notes payable to bank
|
161
|
|
746
|
|
976
|
|
13,952
|
|
19,024
|
|
|||||||||
|
Long-term debt
|
753,888
|
|
754,795
|
|
756,918
|
|
758,941
|
|
467,459
|
|
|||||||||
|
Total interest bearing debt
|
755,015
|
|
756,392
|
|
758,971
|
|
774,074
|
|
486,685
|
|
|||||||||
|
Adjusted EBITDA
|
351,987
|
|
326,629
|
|
285,115
|
|
413,684
|
|
546,208
|
|
|||||||||
|
Leverage Ratio
|
2.15
|
|
2.32
|
|
2.66
|
|
1.87
|
|
0.89
|
|
|||||||||
Leverage ratio, as presented, may not be comparable to similarly titled measures of other companies.
MANAGEMENT’S DISCUSSION AND ANALYSIS
Forward‑Looking Statements
Management’s discussion and analysis, and other sections of this annual report, contain forward‑looking statements within the meaning of the Private Securities Litigation Reform Act of 1995. These forward‑looking statements are based on assumptions that management has made in light of experience in the industries in which the Company operates, as well as management’s perceptions of historical trends, current conditions, expected future developments and other factors believed to be appropriate under the circumstances. These statements are not guarantees of performance or results. They involve risks, uncertainties (some of which are beyond the Company’s control) and assumptions. Management believes that these forward‑looking statements are based on reasonable assumptions. Many factors could affect the Company’s actual financial results and cause them to differ materially from those anticipated in the forward‑looking statements. These factors include, among other things, risk factors described from time to time in the Company’s reports to the Securities and Exchange Commission, as well as future economic and market circumstances, industry conditions, company performance and financial results, operating efficiencies, availability and price of raw materials, availability and market acceptance of new products, product pricing, domestic and international competitive environments, and actions and policy changes of domestic and foreign governments.
The following discussion and analysis provides information which management believes is relevant to an assessment and understanding of our consolidated results of operations and financial position. This discussion should be read in conjunction with the Consolidated Financial Statements and related Notes.
22
General
|
2017
|
2016
|
Change
2017 - 2016 |
2015
|
Change
2016 - 2015 |
|||||||||||||
|
Dollars in millions, except per share amounts
|
|||||||||||||||||
|
Consolidated
|
|||||||||||||||||
|
Net sales
|
$
|
2,746.0
|
|
$
|
2,521.7
|
|
8.9
|
%
|
$
|
2,618.9
|
|
(3.7
|
)%
|
||||
|
Gross profit
|
681.8
|
|
656.2
|
|
3.9
|
%
|
621.0
|
|
5.7
|
%
|
|||||||
|
as a percent of sales
|
24.8
|
%
|
26.0
|
%
|
23.7
|
%
|
|||||||||||
|
SG&A expense
|
415.4
|
|
412.7
|
|
0.7
|
%
|
489.3
|
|
(15.7
|
)%
|
|||||||
|
as a percent of sales
|
15.1
|
%
|
16.4
|
%
|
18.7
|
%
|
|||||||||||
|
Operating income
|
266.4
|
|
243.5
|
|
9.4
|
%
|
131.7
|
|
84.9
|
%
|
|||||||
|
as a percent of sales
|
9.7
|
%
|
9.7
|
%
|
5.0
|
%
|
|||||||||||
|
Net interest expense
|
39.9
|
|
41.3
|
|
(3.4
|
)%
|
41.3
|
|
—
|
%
|
|||||||
|
Effective tax rate
|
46.5
|
%
|
19.1
|
%
|
|
51.0
|
%
|
|
|||||||||
|
Net earnings attributable to Valmont Industries, Inc
|
116.2
|
|
173.2
|
|
(32.9
|
)%
|
40.1
|
|
331.9
|
%
|
|||||||
|
Diluted earnings per share
|
$
|
5.11
|
|
$
|
7.63
|
|
(33.0
|
)%
|
$
|
1.71
|
|
346.2
|
%
|
||||
|
Engineered Support Structures Segment
|
|||||||||||||||||
|
Net sales
|
$
|
912.2
|
|
$
|
891.1
|
|
2.4
|
%
|
$
|
880.8
|
|
1.2
|
%
|
||||
|
Gross profit
|
225.9
|
|
240.0
|
|
(5.9
|
)%
|
214.0
|
|
12.1
|
%
|
|||||||
|
SG&A expense
|
162.9
|
|
167.7
|
|
(2.9
|
)%
|
185.2
|
|
(9.4
|
)%
|
|||||||
|
Operating income
|
63.0
|
|
72.3
|
|
(12.9
|
)%
|
28.8
|
|
151.0
|
%
|
|||||||
|
Utility Support Structures Segment
|
|||||||||||||||||
|
Net sales
|
$
|
856.3
|
|
$
|
735.6
|
|
16.4
|
%
|
$
|
777.7
|
|
(5.4
|
)%
|
||||
|
Gross profit
|
178.4
|
|
147.3
|
|
21.1
|
%
|
130.0
|
|
13.3
|
%
|
|||||||
|
SG&A expense
|
80.6
|
|
76.1
|
|
5.9
|
%
|
91.7
|
|
(17.0
|
)%
|
|||||||
|
Operating income
|
97.8
|
|
71.2
|
|
37.4
|
%
|
38.3
|
|
85.9
|
%
|
|||||||
|
Coatings Segment
|
|||||||||||||||||
|
Net sales
|
$
|
256.8
|
|
$
|
243.9
|
|
5.3
|
%
|
$
|
255.5
|
|
(4.5
|
)%
|
||||
|
Gross profit
|
78.4
|
|
77.8
|
|
0.8
|
%
|
79.8
|
|
(2.5
|
)%
|
|||||||
|
SG&A expense
|
28.2
|
|
31.2
|
|
(9.6
|
)%
|
52.4
|
|
(40.5
|
)%
|
|||||||
|
Operating income
|
50.2
|
|
46.6
|
|
7.7
|
%
|
27.4
|
|
70.1
|
%
|
|||||||
|
Irrigation Segment
|
|||||||||||||||||
|
Net sales
|
$
|
644.4
|
|
$
|
568.0
|
|
13.5
|
%
|
$
|
605.8
|
|
(6.2
|
)%
|
||||
|
Gross profit
|
197.3
|
|
178.9
|
|
10.3
|
%
|
177.2
|
|
1.0
|
%
|
|||||||
|
SG&A expense
|
95.8
|
|
88.0
|
|
8.9
|
%
|
99.0
|
|
(11.1
|
)%
|
|||||||
|
Operating income
|
101.5
|
|
90.9
|
|
11.7
|
%
|
78.2
|
|
16.2
|
%
|
|||||||
|
Other
|
|||||||||||||||||
|
Net sales
|
$
|
76.3
|
|
$
|
83.1
|
|
(8.2
|
)%
|
$
|
99.1
|
|
(16.1
|
)%
|
||||
|
Gross profit
|
7.4
|
|
14.1
|
|
(47.5
|
)%
|
7.3
|
|
93.2
|
%
|
|||||||
|
SG&A expense
|
5.3
|
|
5.4
|
|
(1.9
|
)%
|
12.1
|
|
(55.4
|
)%
|
|||||||
|
Operating income
|
2.1
|
|
8.7
|
|
(75.9
|
)%
|
(4.8
|
)
|
(281.3
|
)%
|
|||||||
|
Adjustment to LIFO inventory valuation method
|
|||||||||||||||||
|
Gross profit
|
(5.7
|
)
|
(3.0
|
)
|
90.0
|
%
|
12.1
|
|
(124.8
|
)%
|
|||||||
|
Operating income
|
(5.7
|
)
|
(3.0
|
)
|
90.0
|
%
|
12.1
|
|
(124.8
|
)%
|
|||||||
|
Net corporate expense
|
|||||||||||||||||
|
Gross profit
|
$
|
0.1
|
|
$
|
1.1
|
|
90.9
|
%
|
$
|
0.6
|
|
83.3
|
%
|
||||
|
SG&A expense
|
42.6
|
|
44.3
|
|
(3.8
|
)%
|
48.9
|
|
(9.4
|
)%
|
|||||||
|
Operating loss
|
(42.5
|
)
|
(43.2
|
)
|
(1.6
|
)%
|
(48.3
|
)
|
(10.6
|
)%
|
|||||||
RESULTS OF OPERATIONS
FISCAL 2017 COMPARED WITH FISCAL 2016
Overview
In the fourth quarter of 2017, our management and reporting structure changed to reflect management's expectations of future growth of certain product lines and to take into consideration the expected divestiture of the grinding media business, which historically was reported in the Energy and Mining segment. The access systems applications product line is now part of the Engineered Support Structures ("ESS") segment and the offshore and other complex structures product line is now part of the Utility segment. Grinding media will be reported in "Other" pending the completion of its divestiture. In the first quarter of 2017, we also changed our reportable segment operating income to separate out the LIFO expense (benefit). Certain inventories are accounted for using the LIFO method in the consolidated financial statements. Our segment discussions and segment financial information have been accordingly reclassified in this report to reflect this change, for all periods presented.
On a consolidated basis, the increase in net sales in 2017, as compared with 2016, reflected higher sales in all reportable segments. The changes in net sales in 2017, as compared with 2016, were as follows:
|
Total
|
ESS
|
Utility
|
Coatings
|
Irrigation
|
Other
|
|||||||||||||
|
Sales - 2016
|
$
|
2,521.7
|
|
$
|
891.1
|
|
$
|
735.6
|
|
$
|
243.9
|
|
$
|
568.0
|
|
$
|
83.1
|
|
|
Volume
|
97.4
|
|
10.4
|
|
49.5
|
|
(9.6
|
)
|
61.5
|
|
(14.4
|
)
|
||||||
|
Pricing/mix
|
102.4
|
|
1.6
|
|
68.2
|
|
21.2
|
|
6.3
|
|
5.1
|
|
||||||
|
Acquisitions
|
4.8
|
|
4.8
|
|
—
|
|
—
|
|
—
|
|
—
|
|
||||||
|
Currency translation
|
19.7
|
|
4.3
|
|
3.0
|
|
1.3
|
|
8.6
|
|
2.5
|
|
||||||
|
Sales - 2017
|
$
|
2,746.0
|
|
$
|
912.2
|
|
$
|
856.3
|
|
$
|
256.8
|
|
$
|
644.4
|
|
$
|
76.3
|
|
Volume effects are estimated based on a physical production or sales measure. Since products we sell are not uniform in nature, pricing and mix relate to a combination of changes in sales prices and the attributes of the product sold. Accordingly, pricing and mix changes do not necessarily directly result in operating income changes.
Average steel index prices for both hot rolled coil and plate were higher in North America and China in 2017, as compared to 2016, resulting in higher average cost of material. We expect that average selling prices will increase over time to offset the decrease in gross profit realized from the higher cost of steel for the Company. The Company acquired a highway business in India ("Aircon") in the third quarter of 2017 that is included in the ESS segment.
Restructuring Plan
In 2016, we executed a restructuring plan in Australia/New Zealand focused primarily on closing and consolidating locations within the ESS and Coatings segments (the "2016 Plan"). We incurred $7.8 million of restructuring expense consisting of $5.0 million in cost of goods sold and $2.8 million in selling, general, and administrative (SG&A) expense in 2016. The Plan was substantially completed in fiscal 2016.
In 2015, we executed a broad restructuring plan (the "2015 Plan") to respond to the market environment in certain of our businesses. During 2016, we incurred approximately
$4.6
million of restructuring expense to complete the 2015 Plan consisting of $4.1 million in SG&A expense with the remainder recorded in cost of goods sold.
Currency Translation
In 2017, we realized a benefit to operating profit, as compared with fiscal 2016, due to currency translation effects. The U.S. dollar primarily weakened against the Brazilian real and South African rand, resulting in more operating profit in U.S. dollar terms. The breakdown of this effect by segment was as follows:
23
|
Total
|
ESS
|
Utility
|
Coatings
|
Irrigation
|
Other
|
Corporate
|
|||||||||||||||
|
Full year
|
$
|
1.5
|
|
$
|
0.1
|
|
$
|
—
|
|
$
|
(0.1
|
)
|
$
|
1.2
|
|
$
|
0.4
|
|
$
|
(0.1
|
)
|
Gross Profit, SG&A, and Operating Income
At a consolidated level, the reduction in gross margin (gross profit as a percent of sales) in 2017, as compared with 2016, was primarily due to higher cost of raw materials across most of our businesses. The Utility segment realized an increase in gross margin in 2017, while ESS, Irrigation, and Coatings realized a decrease in gross profit primarily due to sales pricing that did not fully recover higher raw material costs and unfavorable sales mix. Lower volumes for Coatings and Other also contributed to the reduction in gross margin through deleverage of fixed costs.
The Company saw an increase within SG&A expense in 2017, as compared to 2016, due to the following:
|
•
|
higher employee incentives of $5.0 million due to improved business operations;
|
|
•
|
reversal of $3.2 million of a contingent consideration liability in 2016 to the former owners of an acquired business;
|
|
•
|
increased project and promotional expenses of $3.2 million, primarily in the irrigation segment;
|
|
•
|
higher deferred compensation expenses of $2.7 million, which was offset by a decrease of the same amount of other expense; and
|
|
•
|
currency translation effects of $1.9 million (higher SG&A) due to the strengthening of the Australian dollar, Brazilian real, and South African rand against the U.S. dollar.
|
The above increases were partially offset by the following decreases in SG&A expense in 2017 as compared to 2016:
|
•
|
restructuring expenses incurred in 2016 totaling $6.8 million; and
|
|
•
|
reversal of an environmental remediation liability of $2.6 million related to land of a former galvanizing operation in Australia that was sold in 2017.
|
In 2017, as compared to 2016, operating income for all operating segments were higher except for the ESS segment and Other. The increase in operating income in 2017, as compared to 2016, is primarily attributable to increased sales volumes in the Utility and Irrigation segments, along with restructuring expenses incurred in 2016 and the associated benefits of the restructuring activities.
Net Interest Expense and Debt
Net interest expense in 2017, as compared to 2016, was lower as interest income increased due to more cash on hand to invest. Long-term and short-term borrowings were consistent year-over-year.
Other Income/Expense
The decrease in other income in 2017, as compared to 2016, is primarily due to the reversal of a contingent liability provision of approximately $16.6 million in 2016, out of "Other noncurrent liabilities."
Income Tax Expense
Our effective income tax rate in 2017 and 2016 was 46.5% and 19.1%, respectively. The Tax Cuts and Jobs Act of 2017 (the "2017 Tax Act" or “Act”) includes a number of changes to the U.S. Internal Revenue Code that impact corporations beginning in 2018; including a reduction in the statutory federal corporate income tax rate from 35% to 21%, limiting or eliminating certain tax deductions, and changing the taxation of unremitted foreign earnings. Accordingly, the Company recorded a one-time charge of approximately $42 million for the fourth quarter of 2017 related to the transition effects of the Act. Excluding this charge, our effective tax rate would have been 28.1% for 2017. The $42 million charge is comprised of (a) approximately $9.9 million of expense related to the taxation of unremitted foreign earnings, the federal portion of which is payable over eight (8) years beginning in 2018, (b) approximately $20.4 million of expense related to the remeasurement of U.S. deferred tax balances to reflect the new U.S. corporate income tax rate, using a federal and state tax rate of 25.0%, and (c) approximately $11.7 million of deferred expenses related to foreign withholding taxes and U.S. state income taxes.
24
These amounts are provisional and our estimates and overall impact of the Act may change for various reasons including, but not limited to, changes in our interpretation and assumptions, additional guidance that may be issued by governing authorities, and tax planning actions we may undertake. We continue to gather additional information to fully account for the Act. Any updates and changes in the estimates will be communicated in future quarterly financial statements.
Tax expense in 2016 included $30.6 million of deferred income tax benefit attributable to the remeasurement of the deferred tax asset related to the Company's U.K. defined benefit pension plan. In addition, we recorded a $9.9 million valuation allowance against a tax credit for which we believe we are not likely to receive the benefit in 2016. Excluding these items as well as the impact of the reversal of the contingent liability of $16.6 million that is not taxable, our adjusted effective tax rate was 30.8% for 2016 versus the GAAP reported effective tax rate of 19.1%.
Earnings attributable to noncontrolling interests was higher in 2017, as compared to 2016, due to improved earnings for our majority-owned irrigation businesses.
Cash Flows from Operations
Our cash flows provided by operations was $145.7 million in 2017, as compared with $219.2 million provided by operations in 2016. The decrease in operating cash flow was due to less favorable working capital changes driven by higher receivables and inventory and higher contributions to the Delta Pension Plan in 2017.
Engineered Support Structures (ESS) segment
The increase in sales in 2017, as compared with 2016, was due to improved roadway product sales volumes and communication product line sales volumes. Global lighting and traffic, and roadway product sales in 2017 were higher compared to the same periods in fiscal 2016, primarily due to increased sales volumes in roadway product sales, which is a product line outside of North America. In 2017, as compared to 2016, sales volumes in the U.S. were lower across commercial and transportation markets. The 2015 long-term U.S. highway bill has not yet provided a meaningful uplift for our North America structures business. Sales in Europe were lower in 2017 as the domestic markets in general remain subdued. The increase in sales for global lighting and traffic, and roadway product is also attributed to currency translation effects and the acquisition of Aircon in the third quarter of 2017.
Communication product line sales were higher in 2017, as compared with 2016. In North America and Asia-Pacific, communication structure and component sales increased due to higher demand from the continued network expansion by providers.
Access systems product line net sales in 2017 were higher than in 2016, due to higher average sales prices and favorable currency translation effects.
Gross profit, as a percentage of sales, and operating income for the segment were lower in 2017, as compared with 2016, due to margin contraction from higher raw material costs that the business was not able to fully recover through higher sales pricing. SG&A spending was lower in 2017, as compared to 2016, due primarily to lower commissions owed on communication product line sales, reduced incentives due to decreased operating performance, and restructuring costs and activities undertaken in 2016 to reduce the cost structure primarily in the access systems business in Australia.
Utility Support Structures (Utility) segment
In the Utility segment, sales increased in 2017, as compared with 2016, due to improved volumes and higher sales prices due to steel cost increases and a favorable sales mix. A number of our sales contracts contain provisions that tie the sales price to published steel index pricing at the time our customer issues their purchase order. Improved sales demand in North America resulted in increased sales volumes in tons for both steel and concrete utility structures that also contributed to the increase in sales. International utility structures sales decreased in 2017 due to lower volumes.
Offshore and other complex structures sales decreased in 2017, as compared to 2016, due to lower volumes that were partially offset by favorable currency translation effects.
Gross profit as a percentage of sales increased in 2017, as compared to 2016, due to improved pricing and sales mix and higher sales volumes in North America and improved factory performance for the offshore and other complex structures business. SG&A expense was higher in 2017, as compared with 2016, due to higher incentive expense due to improved
25
operations and commission expense attributed to the increased sales volumes. Operating income increased in 2017, as compared with 2016, due to the increased sales volumes and improved pricing and sales mix in North America.
Coatings segment
Coatings segment sales increased in 2017, as compared to 2016, due primarily to increased sales prices to recover higher zinc costs globally. External sales volumes decreased while intercompany volumes increased in North America during 2017. In the Asia-Pacific region, improved demand/volume in Australia along with currency transaction effects led to an increase in sales in 2017 as compared to 2016.
SG&A expense was lower in 2017, as compared to 2016, due to lower compensation costs and no restructuring expense in 2017. Both 2017 and 2016 had non-recurring transactions recognized as reductions in SG&A. A former galvanizing operation in Australia was sold in 2017 allowing for a reversal of an environmental remediation liability of $2.6 million. In 2016, a contingent consideration liability to the former owners of an acquired business was reduced $3.2 million due to changes in estimated earnings over the earn-out period. Operating income was higher in 2017, as compared with 2016, due to lower SG&A expenses.
Irrigation segment
The increase in Irrigation segment net sales in 2017, as compared to 2016, was primarily due to sales volume increases for both domestic and international irrigation and currency translation effects. In North America, when comparing 2017 to 2016, sales volumes increased driven by markets outside the traditional corn-belt. In addition, higher equipment running times due to weather conditions resulted in higher service parts sales. International sales increased in 2017, as compared to 2016, due primarily to volume increases in the Middle East and South America and favorable foreign currency translation effects for Brazil and South Africa.
SG&A was higher in 2017, as compared with 2016. The increase can be attributed to higher incentive and commission costs due to improved business results, increased product development and promotional expenses, and currency translation effects related to the international irrigation business. Gross profit and operating income for the segment increased in 2017 over 2016, primarily due to North America and international irrigation sales volume increases and favorable foreign currency translation effects.
Other
Grinding media sales decreased from lower volumes. A decrease in sales volumes was partially offset by higher sales pricing and favorable currency translation effects. Gross profit and operating income were lower in 2017, as compared to 2016, due to lower volumes.
LIFO expense
Steel index prices for both hot rolled coil, plate, and zinc in the U.S. increased at a higher rate in 2017, as compared to 2016, which drove higher LIFO expense.
Net corporate expense
Net corporate expense is similar when comparing 2017 to 2016. Approximately $4 million of increased incentive expense was offset by lower pension expense and better performance of the Company's U.S. medical plan as compared to 2016.
26
FISCAL 2016 COMPARED WITH FISCAL 2015
Overview
The Company's reported net earnings for the year ended December 31, 2016 was impacted by a decrease in net sales ($97.2 million) and restructuring expenses (pre-tax $12.4 million). Reported net earnings for the year ended December 26, 2015 included restructuring expenses (pre-tax $39.9 million) and impairments of goodwill and intangible assets (pre-tax $42.0 million).
On a consolidated basis, the decrease in net sales in 2016, as compared with 2015, reflected lower sales in all reportable segments except for the ESS segment. In fiscal 2016, the Company had 53 weeks of operations while fiscal 2015 and 2014 had 52 weeks of operations. The estimated impact on the company's results of operations due to the extra week in fiscal 2016 was additional net sales of approximately $50 million and additional net earnings of approximately $3 million.
The changes in net sales in 2016, as compared with 2015, was due to the following factors:
|
Total
|
ESS
|
Utility
|
Coatings
|
Irrigation
|
Other
|
|||||||||||||
|
Sales - 2015
|
$
|
2,618.9
|
|
$
|
880.8
|
|
$
|
777.7
|
|
$
|
255.5
|
|
$
|
605.8
|
|
$
|
99.1
|
|
|
Volume
|
(13.5
|
)
|
38.2
|
|
2.5
|
|
(10.0
|
)
|
(29.5
|
)
|
(14.7
|
)
|
||||||
|
Pricing/mix
|
(60.6
|
)
|
(13.3
|
)
|
(44.4
|
)
|
(4.5
|
)
|
1.2
|
|
0.4
|
|
||||||
|
Acquisitions
|
5.9
|
|
—
|
|
—
|
|
5.9
|
|
—
|
|
—
|
|
||||||
|
Currency translation
|
(29.0
|
)
|
(14.6
|
)
|
(0.2
|
)
|
(3.0
|
)
|
(9.5
|
)
|
(1.7
|
)
|
||||||
|
Sales - 2016
|
$
|
2,521.7
|
|
$
|
891.1
|
|
$
|
735.6
|
|
$
|
243.9
|
|
$
|
568.0
|
|
$
|
83.1
|
|
Volume effects are estimated based on a physical production or sales measure. Since products we sell are not uniform in nature, pricing and mix relate to a combination of changes in sales prices and the attributes of the product sold. Accordingly, pricing and mix changes do not necessarily directly result in operating income changes.
Restructuring Plan
In 2016, we executed a restructuring plan in Australia/New Zealand focused primarily on closing and consolidating locations within the ESS and Coatings segments (the "2016 Plan"). We incurred approximately $7.8 million of restructuring expense consisting of $5.0 million in cost of goods sold and $2.8 million in selling, general, and administrative (SG&A) expense in 2016. The Plan was substantially completed in fiscal 2016.
In April 2015, our Board of Directors authorized a broad restructuring plan (the "2015 Plan") to respond to the market environment in certain of our businesses. During 2016, we incurred approximately
$4.6
million of restructuring expense to complete the 2015 Plan consisting of $4.1 million in SG&A expense with the remainder recorded in cost of goods sold.
Inclusive of both the 2016 and 2015 Plans, operating income in 2016 was reduced due to restructuring expense by segment as follows:
|
Total
|
ESS
|
Utility
|
Coatings
|
Irrigation
|
Other
|
Corporate
|
|||||||||||||||
|
|
|
|
|||||||||||||||||||
|
Full year
|
$
|
(12.4
|
)
|
$
|
(8.3
|
)
|
$
|
(0.5
|
)
|
$
|
(0.9
|
)
|
$
|
(0.5
|
)
|
$
|
—
|
|
$
|
(2.2
|
)
|
Goodwill and Trade Name Impairment
The Company recognized a $16.2 million impairment of goodwill on the APAC Coatings reporting unit during fiscal 2015, which represented all of the remaining goodwill on this reporting unit. The goodwill impairment was the result of difficulties in the Australian market over the last couple of years, including a general slowdown in manufacturing. In
27
addition, the Company also recorded a $1.1 million impairment of the Industrial Galvanizing trade name (in the Coatings segment) and a $5.8 million impairment of the Webforge trade name (in the ESS segment) during 2015. The Company also recognized an $18.8 million goodwill impairment of its Access Systems reporting unit due to continued downward pressure on oil and natural gas prices which in turn reduces the prospects for new oil and gas exploration primarily in Australia and Southeast Asia.
Currency Translation
In 2016, we realized a decrease in operating profit of $1.6 million, as compared with 2015, due to currency translation effects. On average, the U.S. dollar strengthened against most currencies and in particular against the Australian dollar, Brazilian Real, Euro, and South African Rand, resulting in less operating profit in U.S. dollar terms. The breakdown of this effect by segment was as follows:
|
Total
|
ESS
|
Utility
|
Coatings
|
Irrigation
|
Other
|
Corporate
|
|||||||||||||||
|
|
|
|
|||||||||||||||||||
|
Full year
|
$
|
(1.6
|
)
|
$
|
(1.1
|
)
|
$
|
—
|
|
$
|
(0.2
|
)
|
$
|
(0.3
|
)
|
$
|
—
|
|
$
|
—
|
|
Gross Profit, SG&A, and Operating Income
At a consolidated level, the improvement in gross margin (gross profit as a percent of sales) in 2016, as compared with 2015, was due to restructuring activities undertaken in 2015 and the $17 million Utility segment commercial settlement recognized in 2015. Gross profit increased in 2016, as compared to 2015, for all operating segments except for Coatings and Irrigation. Gross profit decreased for Coatings and Irrigation primarily due to lower volumes and unfavorable currency translation effects. Reduced average selling prices also resulted in a decline in gross profit for the Coatings segment.
The Company incurred $6.8 million of restructuring expense in 2016 within SG&A expense, compared to $18.2 million in 2015. Excluding restructuring expense, the Company saw a decrease in SG&A in 2016 of $65.2 million, as compared with 2015, mainly due to the following factors:
|
•
|
$42.0 million of goodwill and intangible impairments recorded in 2015 which did not recur in 2016;
|
|
•
|
reduced doubtful account provisions of $11.1 million, principally in the Irrigation segment;
|
|
•
|
currency translation effects of $4.7 million (lower SG&A) due to the strengthening of the U.S. dollar primarily against the Australian dollar, Brazilian real, and South African rand;
|
|
•
|
reversal of $3.2 million of a contingent consideration liability to the former owners of Pure Metal Galvanizing in 2016; and
|
|
•
|
reductions due to exiting a business development activity, lower project expenses, reduced discretionary spending, and benefits from restructuring activities undertaken in 2015.
|
The above reductions were partially offset by the following increases in SG&A expense in 2016 as compared with 2015:
|
•
|
increased incentive expenses due to improved operating performance of $13.6 million;
|
|
•
|
higher deferred compensation expenses of $1.5 million, which was offset by a decrease of the same amount of other expense; and
|
|
•
|
increased pension expenses of $2.5 million.
|
In 2016 as compared to 2015, operating income improved for all operating segments. The increase in operating income is primarily attributable to reduced expenses for restructuring activities and the associated benefits of the restructuring activities, no goodwill or intangible asset impairments in 2016, lower doubtful account provisions, and reduced overall SG&A spending.
Net Interest Expense and Debt
Net interest expense in 2016, as compared to 2015, was consistent due to minimal changes in short and long-term borrowings.
28
Other Expense
The increase in other income in 2016 is a result of the reversal of a contingent liability provision, approximately $16.6 million, out of "Other noncurrent liabilities." This liability was originally recorded as part of the Delta purchase accounting in 2010 to address a certain contingent liability. The statutes of limitation have expired and we now determine this matter to be remote.
Income Tax Expense
Our effective income tax rates were 19.1% and 51.0% in 2016 and 2015. Fiscal 2016 includes $30.6 million of deferred income tax benefit attributable to the re-measurement of the deferred tax asset related to the Company's U.K. defined benefit pension plan. In addition, in fiscal 2016 we recorded a $9.9 million valuation allowance against a tax credit for which we believe we are not likely to receive the benefit. Excluding these items as well as the impact of the reversal of the contingent liability of $16.6 million that is not taxable, our adjusted effective tax rate was 30.8% for 2016. The fiscal 2015 rate is unusually high primarily due to the APAC Coatings and Access Systems goodwill impairments recorded that are not deductible for tax purposes. In addition, U.K. corporate tax rates were collectively reduced from 20% to 18% in 2015. Accordingly, we reduced the value of our deferred tax assets associated with net operating loss carryforwards and certain timing differences by $7.1 million, with a corresponding increase in deferred income tax expense. Excluding these items, our adjusted effective tax rate was 32.0% in fiscal 2015.
Noncontrolling Interests
Earnings attributable to noncontrolling interest was flat in 2016 as compared to 2015.
Cash Flows from Operations
Cash flows provided by operations were $219.2 million in 2016, as compared with $272.3 million provided by operations in 2015. The decrease in operating cash flow in 2016, as compared with 2015, was the result of higher net working capital and a reduction in noncurrent liabilities that was partially offset by improved net earnings.
Engineered Support Structures (ESS) segment
The increase in sales in 2016 as compared with 2015 was primarily due to improved volumes in our Asia-Pacific Structures businesses. The volume increase was partially offset by unfavorable currency translation effects and lower average selling prices mostly attributed to average lower cost of steel.
Global lighting and traffic, and roadway product sales in 2016 were higher compared to the same periods in fiscal 2015. Sales volumes in the U.S. were higher in the commercial and OEM markets (steel and aluminum), and modestly lower in the transportation markets. We expect the 2015 long-term U.S. highway bill to provide an uplift to the transportation market demand sometime in 2017. Sales in Canada decreased in 2016 as compared to 2015, from lower volumes due to less large projects and unfavorable currency translation. Sales in Europe were lower in 2016 compared to 2015, due to unfavorable currency translation effects and lower volumes primarily related to a large project in the Middle East in 2015. The domestic markets in general remain subdued in Europe, as economic conditions have curtailed infrastructure investment. In the Asia-Pacific ("APAC") region, sales were higher in 2016, as compared to 2015, due primarily to improved investment activity in Australia and overall market growth in India. Roadway product sales decreased in 2016 due to lower volumes and unfavorable currency translation effects.
Communication product line sales were lower in 2016, as compared with 2015. North America communication structure and component sales decreased, due to lower market demand. In China, sales of wireless communication structures in 2016 increased over the same period in 2015 as the investment levels by the major wireless carriers have remained strong and we have increased our market share through better sales coverage. In Australia, sales for wireless communication structures improved in 2016 due to higher demand from the national broadband network build out.
Access systems product line sales in 2016 were lower when compared to 2015. The sales decrease was primarily due to the negative impact of currency translation effects and lower sales prices in Asia. The decrease in sales price is primarily related to fewer oil and gas related construction projects in the APAC region.
29
Operating income was higher for the segment in 2016, as compared to 2015, primarily due to goodwill and trade name impairment charges in 2015 associated with the Access Systems reporting unit totaling $24.6 million. Gross profit, as a percentage of sales, for the segment were higher in 2016, as compared with 2015, due to margin expansion from lower average raw material costs, growth in the Asia-Pacific telecommunication business, and lower costs resulting from the 2015 restructuring activities. These increases were partially offset by unfavorable currency translation effects and lower sales volumes in Europe and the North American wireless communication businesses. Favorable LIFO inventory valuation reserve adjustments were approximately $4 million lower in 2016 as compared to 2015. SG&A spending in 2016 decreased over the same period in 2015 due primarily to goodwill and trade name impairment charges in 2015 associated with the Access Systems reporting unit, partially offset by increased commissions owed on the higher telecommunication sales in the Asia-Pacific region and higher compensation costs.
Utility Support Structures (Utility) segment
In the Utility segment, sales decreased in 2016 as compared with 2015, due mainly to decreased average selling prices tied to the lower cost of steel and lower international sales volumes. Declining cost of steel during the second half of 2015 and first quarter of 2016 contributed to lower average selling prices for the first three quarters of 2016. A number of our sales contracts contain provisions that tie the sales price to published steel index pricing at the time our customer issues their purchase order.
In North America, sales volumes in tons for steel utility structures were higher in 2016, as compared with 2015, while concrete sales volumes in tons decreased during 2016. International utility structures sales volumes were lower in 2016 as compared to 2015.
Offshore and other complex structures sales increased in 2016 as compared to 2015. The increase can be attributed to volume improvements primarily in the wind tower product line. Oil and gas product activity continues to be slow due to low oil prices that caused some previously planned projects to be postponed.
Gross profit as a percentage of sales improved in 2016, as compared to 2015, due to a number of actions taken in 2015 to improve our cost structure and operational efficiency in this segment, including certain restructuring activities involving facility closures. In addition, the segment recorded a $17.0 million reserve in the fourth quarter of 2015 for a commercial settlement with a large customer that requires ongoing quality monitoring. SG&A expense was lower in 2016, as compared with 2015, primarily due to the benefits realized from the 2015 restructuring activities. Operating income increased in 2016, as compared with 2015, primarily due to lower restructuring costs and the related improved cost structure realized in 2016 and the commercial settlement recorded in 2015.
Coatings segment
Coatings segment sales in North America decreased in 2016, as compared with 2015, due to lower volumes and less favorable sales pricing mostly due to mix. The decrease was partially offset by the acquisition of American Galvanizing that accounted for $5.9 million of sales. Coatings sales in the Asia-Pacific region were lower in 2016 due to reduced volumes, lower pricing and sales mix, and unfavorable currency translation effects primarily related to the strengthening of the U.S. dollar against the Australian dollar and Malaysian Ringgit.
SG&A expense was lower in 2016, as compared to 2015, due to $17.3 million of goodwill and trade name impairment charges recorded in 2015 associated with the APAC Coatings reporting unit. In addition, the contingent consideration liability to the former owners of Pure Metal Galvanizing (PMG), payable in calendar 2018, was reduced in 2016 by $3.2 million, due to changes in the estimated earnings over the earn out period. The decrease was partially offset by the SG&A of American Galvanizing, acquired in the fourth quarter of 2015. Operating income was higher in 2016, as compared with 2015, due primarily to the impairment charges in 2015 not recurring in 2016, the reduction in the PMG contingent consideration liability in 2016, and income from the American Galvanizing acquisition. These increases were partially offset by reduced volumes in North America and Asia Pacific and less favorable sales mix.
Irrigation segment
The decrease in Irrigation segment net sales in 2016, as compared with 2015, was mainly due to sales volume decreases in North America for both the irrigation and tubing businesses and unfavorable currency translation effects for our international irrigation business. Volume increases for international irrigation partially offset the decrease. In fiscal 2016, net farm income in the United States is expected to decrease 17.2% from the levels of 2015, due in part to lower market prices for corn and soybeans. The 2016 estimate represents the third consecutive year of a decrease in estimated net farm income. We believe this reduction contributed to lower demand for irrigation machines in North America in 2016 as compared with
30
2015. In international markets, sales volumes increased in 2016 over 2015 due to volume improvements in all regions except for Australia and China. The volume improvements were partially offset by unfavorable currency translation effects of $9.5 million primarily related to the South African rand and Brazilian real.
SG&A was lower in 2016 as compared with 2015, and is primarily attributed to approximately $10.5 million of lower provisions for uncollected international receivables. In 2015, the Company recorded a provision of approximately $8.0 million primarily related to delinquent receivables with a Chinese municipal entity. In addition, currency translation and lower overall discretionary spending contributed to lower SG&A. The decreases were partially offset by increased compensation and incentive expenses due primarily to improved international irrigation operations. Operating income for the segment improved in 2016 over 2015, due to lower provisions for uncollected international receivables and lower discretionary spending, partially offset by lower volumes and a higher LIFO inventory reserve due to higher steel prices in 2016.
Other
Grinding media sales were down in 2016 as compared to 2015, primarily due to lower volumes and unfavorable currency translation effects. The volume decreases are primarily related to the continued slowdown in the Australia mining sector. Gross profit and operating income improved primarily due to an improved sales mix.
LIFO expense
Steel index prices for both hot rolled coil and plate in the U.S. increased in 2016 whereas they declined significantly in 2015. As a result, the Company had LIFO benefit in 2015 but LIFO expense recognized in 2016.
Net corporate expense
Net corporate expense in 2016 decreased compared to 2015. The decrease was mainly due to the following:
|
•
|
lower restructuring expenses of $4.5 million;
|
|
•
|
lower compensation expenses of $3.8 million due primarily to lower employment levels; and
|
|
•
|
reduced discretionary spending.
|
The above decreases were partially offset by approximately $7.7 million of higher incentive costs in 2016 due to improved operations, $2.5 million of higher pension expense for the Delta Pension Plan, and increased deferred compensation expenses of $1.5 million, which was offset by the same amount of other expense.
LIQUIDITY AND CAPITAL RESOURCES
Cash Flows
Working Capital and Operating Cash Flows
-Net working capital was $1,069.6 million at
December 30, 2017
, as compared with $903.4 million at
December 31, 2016
. The increase in net working capital in 2017 mainly resulted from higher cash balances, along with higher receivables and inventory due to improved sales, higher costs of materials, and additional inventory on-hand to support sales growth and higher year-end backlogs. Operating cash flow was $145.7 million in
2017
, as compared with $219.2 million in
2016
and $272.3 million in 2015. The decrease in operating cash flow in 2017, as compared to 2016, was due to less favorable working capital changes driven by higher receivables and inventory and higher contributions to the Delta Pension Plan in 2017. The decrease in operating cash flow in 2016, as compared to 2015, was due to less favorable working capital changes including receivables, accrued expenses primarily due to a reduced warranty accrual, and other noncurrent liabilities due to the reversal of a contingent liability related to the Delta acquisition. The decreases were partially offset by higher net earnings and a lower pension contribution in 2016 as compared to 2015.
Investing Cash Flows
-Capital spending in fiscal
2017
was $55.3 million, as compared with $57.9 million in fiscal
2016
and $45.5 million in fiscal 2015. Capital spending projects in 2017 included investments in machinery and equipment across all businesses. We expect our capital spending for the 2018 fiscal year to be approximately $70 million. Investing cash flows included $5.4 million paid for Aircon in 2017 and $12.8 million paid for American Galvanizing in 2015.
31
Financing Cash Flows
-Our total interest‑bearing debt decreased to $755.0 million at
December 30, 2017
, from $756.4 million at
December 31, 2016
. During 2016 and 2015, we acquired approximately 0.4 million shares and 1.4 million shares for approximately $53.8 million and $169.0 million, respectively, under the share repurchase program. No shares were repurchased in 2017.
Capital Allocation Philosophy
We have historically funded our growth, capital spending and acquisitions through a combination of operating cash flows and debt financing. On May 13, 2014, our Board of Directors approved and publicly announced a capital allocation philosophy with the following priorities for cash generated:
•
working capital and capital expenditure investments necessary for future sales growth;
•
dividends on common stock in the range of 15% of the prior year's fully diluted net earnings;
•
acquisitions; and
•
return of capital to shareholders through share repurchases.
We also announced our intention to manage our capital structure to maintain our investment grade debt rating. Our most recent ratings were Baa3 by Moody's Investors Services, Inc. and BBB+ by Standard and Poor's Rating Services. We would be willing to allow our debt rating to fall to Baa3 or BBB- to finance a special acquisition or other opportunity. We expect to maintain a ratio of debt to invested capital which will support our current investment grade debt rating.
The Board of Directors in May 2014 authorized the purchase of up to $500 million of the Company's outstanding common stock from time to time over twelve months at prevailing market prices, through open market or privately-negotiated transactions. In February 2015, the Board of Directors authorized an additional $250 million of share purchases, without an expiration date. The purchases will be funded from available working capital and short-term borrowings and will be made subject to market and economic conditions. We are not obligated to make any repurchases and may discontinue the program at any time. As of December 30, 2017, we have acquired approximately 4.6 million shares for approximately $617.8 million under these share repurchase programs.
Sources of Financing
Our debt financing at
December 30, 2017
consisted primarily of long‑term debt. During 2014, the Company issued $500 million of new notes and repurchased by partial tender $199.8 million in aggregate principal amount of the 2020 notes. Our long‑term debt as of December 30, 2017, principally consists of:
|
•
|
$250.2 million face value ($252.7 million carrying value) of senior unsecured notes that bear interest at 6.625% per annum and are due in April 2020.
|
|
•
|
$250 million face value ($248.9 million carrying value) of senior unsecured notes that bear interest at 5.00% per annum and are due in October 2044.
|
|
•
|
$250 million face value ($246.8 million carrying value) of senior unsecured notes that bear interest at 5.25% per annum and are due in October 2054.
|
|
•
|
We are allowed to repurchase the notes subject to the payment of a make-whole premium. All three tranches of these notes are guaranteed by certain of our subsidiaries.
|
On October 18, 2017, we amended and restated our revolving credit facility with JP Morgan Chase Bank, N.A., as Administrative Agent, and the other lenders party thereto. The credit facility provides for $600 million of committed unsecured revolving credit loans. We may increase the credit facility by up to an additional $200 million at any time, subject to lenders increasing the amount of their commitments. Our wholly-owned subsidiaries Valmont Industries Holland B.V. and Valmont Group Pty. Ltd., along with the Company, are borrowers under the credit facility. The obligations arising under the credit facility are guaranteed by the Company and its wholly-owned subsidiaries PiRod, Inc., Valmont Coatings, Inc., Valmont Newmark, Inc. and Valmont Queensland Pty. Ltd.
32
The material amendments to the credit facility, which are set forth in the amended and restated credit agreement, include:
|
•
|
an extension of the maturity date of the credit facility from October 17, 2019 to October 18, 2022;
|
|
•
|
an increase in the available borrowings in foreign currencies from $200 million to $400 million;
|
|
•
|
a modification of the definition of "EBITDA" to add-back non-recurring cash and non-cash restructuring costs in an amount that does not exceed $75 million in any trailing twelve month period;
|
|
•
|
a modification of the leverage ratio permitting it to increase from 3.5X to 3.75X for the four consecutive fiscal quarters after certain material acquisitions; and
|
|
•
|
updating the credit facility with certain market provisions.
|
The interest rate on our borrowings will be, at our option, either:
|
(a)
|
LIBOR (based on a 1, 2, 3 or 6 month interest period, as selected by us) plus 100 to 162.5 basis points, depending on the credit rating of our senior debt published by Standard & Poor's Rating Services and Moody's Investors Service, Inc.; or
|
(b) the higher of
|
•
|
the prime lending rate,
|
|
•
|
the Federal Funds rate plus 50 basis points, and
|
|
•
|
LIBOR (based on a 1 month interest period) plus 100 basis points (inclusive of facility fees),
|
plus, in each case, 0 to 62.5 basis points, depending on the credit rating of our senior debt published by Standard & Poor's Rating Services and Moody's Investors Service, Inc.
A commitment fee is also required under the revolving credit facility which accrues at 10 to 25 basis points, depending on the credit rating of our senior debt published by Standard and Poor's Rating Services and Moody's Investor Services, Inc., on the average daily unused portion of the commitment under the revolving credit facility.
At
December 30, 2017
, we had no outstanding borrowings under the revolving credit facility. The revolving credit facility has a maturity date of October 18, 2022 and contains certain financial covenants that may limit our additional borrowing capability under the agreement. At
December 30, 2017
, we had the ability to borrow $585.2 million under this facility, after consideration of standby letters of credit of $14.8 million associated with certain insurance obligations. We also maintain certain short‑term bank lines of credit totaling $113.4 million; $113.3 million of which was unused at December 30, 2017.
Our senior unsecured notes and revolving credit agreement each contain cross-default provisions which permit the acceleration of our indebtedness to them if we default on other indebtedness that results in, or permits, the acceleration of such other indebtedness.
These debt agreements contain covenants that require us to maintain certain coverage ratios and may limit us with respect to certain business activities, including capital expenditures. These debt agreements allow us to add estimated EBITDA from acquired businesses for periods we did not own the acquired businesses. The debt agreements also provide for an adjustment to EBITDA, subject to certain specified limitations, for non-cash charges or gains that are non-recurring in nature. For 2017, our covenant calculations do not include any estimated EBITDA from acquired businesses.
Our key debt covenants are as follows:
|
•
|
Leverage ratio
- Interest-bearing debt is not to exceed 3.50x Adjusted EBITDA (or 3.75x Adjusted EBITDA after certain material acquisitions) of the prior four quarters; and
|
|
•
|
Interest earned ratio
- Adjusted EBITDA over the prior four quarters must be at least 2.50x our interest expense over the same period.
|
33
At
December 30, 2017
, we were in compliance with all covenants related to these debt agreements. The key covenant calculations at
December 30, 2017
were as follows:
|
Interest-bearing debt
|
$
|
755,015
|
|
|
Adjusted EBITDA-last four quarters
|
351,987
|
|
|
|
Leverage ratio
|
2.15
|
|
|
|
Adjusted EBITDA-last four quarters
|
351,987
|
|
|
|
Interest expense-last four quarters
|
44,645
|
|
|
|
Interest earned ratio
|
7.88
|
|
|
The calculation of Adjusted EBITDA-last four quarters is presented under the column for fiscal
2017
in footnote (b) to the table "Selected Five-Year Financial Data" in Item 6 - Selected Financial Data.
Our businesses are cyclical, but we have diversity in our markets, from a product, customer and a geographical standpoint. We have demonstrated the ability to effectively manage through business cycles and maintain liquidity. We have consistently generated operating cash flows in excess of our capital expenditures. Based on our available credit facilities, recent issuance of senior unsecured notes and our history of positive operational cash flows, we believe that we have adequate liquidity to meet our needs for fiscal 2018 and beyond.
We previously considered the earnings in our non-U.S. subsidiaries to be indefinitely reinvested and, accordingly, recorded no related deferred income taxes. Prior to the 2017 Tax Act, we had an excess of the amount for financial reporting over the tax basis in our foreign subsidiaries, including unremitted foreign earnings of approximately $400 million. While the tax on these foreign earnings imposed by the 2017 Tax Act (“Transition Tax”) resulted in the reduction of the excess of the amount for financial reporting over the tax basis in our foreign subsidiaries, an actual repatriation from our non-U.S. subsidiaries may still be subject to foreign withholding taxes and U.S. state income taxes.
As a result of the 2017 Tax Act, we have reassessed our position with respect to the approximately $400 million of unremitted foreign earnings in our non-U.S. subsidiaries. We have taken the position that our previously deferred earnings in our non-U.S. subsidiaries that were subject to the Transition Tax are not indefinitely reinvested. Of our cash balances of $492.8 million at December 29, 2017, approximately $405.0 million is held in our non-U.S. subsidiaries. Consequently, with the change in our position on unremitted foreign earnings, if we distributed our foreign cash balances certain taxes would be applicable. Therefore, we have recorded deferred income taxes for foreign withholding taxes and U.S. state income taxes of $10.4 million and $1.3 million respectively. Our estimates and the overall impact of the Act may change for various reasons including, but not limited to, changes in our interpretation and assumptions, additional guidance that may be issued by governing authorities, and tax planning actions we may undertake. We continue to gather additional information to fully account for the Act. Any updates and changes in the estimates will be communicated in future quarterly financial statements.
FINANCIAL OBLIGATIONS AND FINANCIAL COMMITMENTS
We have future financial obligations related to (1) payment of principal and interest on interest‑bearing debt, (2) Delta pension plan contributions, (3) operating leases and (4) purchase obligations. These obligations at
December 30, 2017
were as follows (in millions of dollars):
|
Contractual Obligations
|
Total
|
2018
|
2019-2020
|
2021-2022
|
After 2022
|
|||||||||||||||
|
Long‑term debt
|
$
|
762.8
|
|
$
|
1.0
|
|
$
|
251.7
|
|
$
|
1.4
|
|
$
|
508.7
|
|
|||||
|
Interest
|
856.7
|
|
42.4
|
|
73.7
|
|
51.6
|
|
689.0
|
|
||||||||||
|
Delta pension plan contributions
|
136.4
|
|
1.5
|
|
30.0
|
|
30.0
|
|
74.9
|
|
||||||||||
|
Operating leases
|
99.9
|
|
21.6
|
|
31.5
|
|
19.5
|
|
27.3
|
|
||||||||||
|
Unconditional purchase commitments
|
62.4
|
|
62.4
|
|
—
|
|
—
|
|
—
|
|
||||||||||
|
Total contractual cash obligations
|
$
|
1,918.2
|
|
$
|
128.9
|
|
$
|
386.9
|
|
$
|
102.5
|
|
$
|
1,299.9
|
|
|||||
34
Long‑term debt mainly consisted of $750.2 million principal amount of senior unsecured notes. At
December 30, 2017
, we had no outstanding borrowings under our bank revolving credit agreement. Obligations under these agreements may be accelerated in event of non‑compliance with debt covenants. The Delta pension plan contributions are related to the current cash funding commitments to the plan with the plan's trustees. The Company prepaid its 2018 contribution to the Delta pension plan in December 2017. Operating leases relate mainly to various production and office facilities and are in the normal course of business.
Unconditional purchase commitments relate to purchase orders for zinc, aluminum and steel, all of which we plan to use in 2018, and certain capital investments planned for 2018. We believe the quantities under contract are reasonable in light of normal fluctuations in business levels and we expect to use the commodities under contract during the contract period.
At
December 30, 2017
, we had approximately $23.5 million of various long‑term liabilities related to certain income tax, environmental, and other matters. These items are not scheduled above because we are unable to make a reasonably reliable estimate as to the timing of any potential payments.
OFF BALANCE SHEET ARRANGEMENTS
We have operating lease obligations to unaffiliated parties on leases of certain production and office facilities and equipment. These leases are in the normal course of business and generally contain no substantial obligations for us at the end of the lease contracts. We also maintain standby letters of credit for contract performance on certain sales contracts.
MARKET RISK
Changes in Prices
Certain key materials we use are commodities traded in worldwide markets and are subject to fluctuations in price. The most significant materials are steel, aluminum, zinc and natural gas. Over the last several years, prices for these commodities have been volatile. The volatility in these prices was due to such factors as fluctuations in supply and demand conditions, government tariffs and the costs of steel‑making inputs. Steel is most significant for our utility support structures segment where the cost of steel has been approximately 50% of the net sales, on average. Assuming a similar sales mix, a hypothetical 20% change in the price of steel would have affected our net sales from our utility support structures segment by approximately $66 million for the year ended December 30, 2017.
We have also experienced volatility in natural gas prices in the past several years. Our main strategies in managing these risks are a combination of fixed price purchase contracts with our vendors to reduce the volatility in our purchase prices and sales price increases where possible. We use natural gas swap contracts on a limited basis to mitigate the impact of rising gas prices on our operating income.
Risk Management
Market Risk—The principal market risks affecting us are exposure to interest rates, foreign currency exchange rates and natural gas. We normally do not use derivative financial instruments to hedge these exposures (except as described below), nor do we use derivatives for trading purposes.
Interest Rates—Our interest‑bearing debt at
December 30, 2017
was mostly fixed rate debt. Our notes payable and a small portion of our long-term debt accrue interest at a variable rate. Assuming average interest rates and borrowings on variable rate debt, a hypothetical 10% change in interest rates would have affected our interest expense in 2017 and 2016 by approximately $0.1 million. Likewise, we have excess cash balances on deposit in interest‑bearing accounts in financial institutions. An increase or decrease in interest rates of ten basis points would have impacted our annual interest earnings in 2017 and 2016 by approximately $0.4 million and $0.3 million, respectively.
Foreign Exchange—Exposures to transactions denominated in a currency other than the entity’s functional currency are not material, and therefore the potential exchange losses in future earnings, fair value and cash flows from these transactions are not material. From time to time, as market conditions indicate, we will enter into foreign currency contracts to manage the risks associated with anticipated future transactions and current balance sheet positions that are in currencies other than the functional currencies of our operations. At
December 30, 2017
, the Company had two open foreign currency
35
forward contracts that both qualified as net investment hedges. The purpose of the net investment hedges is to mitigate foreign currency risk on a portion of our foreign subsidiary investments in the grinding media business that are denominated in British pounds and Australian dollars. The divestiture of our grinding media business is currently pending Australia regulatory approval. The forward contracts have a maturity date of January 2018 and a notional amount to sell British pounds and Australian dollars and receive $24.1 million and $21.2 million, respectively. The unrealized loss recorded at December 30, 2017 is $0.8 million and is included in Accounts Payable and Accumulated Other Comprehensive Income (Loss) on the Consolidated Balance Sheets.
At December 31, 2016, the Company had certain open foreign currency forward contracts, the most significant of which was a one-year foreign currency forward contract which qualified as a net investment hedge, in order to mitigate foreign currency risk on a portion of our foreign subsidiary investments denominated in British pounds. The notional amount of this forward contract to sell British pounds was $44.0 million and the contract was settled in May 2017. At December 26, 2015, the Company had a number of open foreign currency forward contracts, including one related to the interest payments on an intercompany note between two entities with two different functional currencies. The notional amount of this forward contract to sell Australian dollars was $36.6 million and the contract was settled in January 2016. Much of our cash in non-U.S. entities is denominated in foreign currencies, where fluctuations in exchange rates will impact our cash balances in U.S. dollar terms. A hypothetical 10% change in the value of the U.S. dollar would impact our reported cash balance by approximately $37.2 million in 2017 and $28.7 million in 2016.
We manage our investment risk in foreign operations by borrowing in the functional currencies of the foreign entities where appropriate. The following table indicates the change in the recorded value of our most significant investments at year-end assuming a hypothetical 10% change in the value of the U.S. Dollar.
|
2017
|
2016
|
||||||
|
(in millions)
|
|||||||
|
Australian dollar
|
$
|
25.5
|
|
$
|
20.4
|
|
|
|
Chinese renminbi
|
14.0
|
|
12.3
|
|
|||
|
Danish krone
|
9.2
|
|
10.9
|
|
|||
|
U.K. pound
|
9.5
|
|
9.6
|
|
|||
|
Euro
|
10.7
|
|
5.4
|
|
|||
|
Canadian dollar
|
5.7
|
|
5.9
|
|
|||
|
Brazilian real
|
3.1
|
|
3.4
|
|
|||
Commodity risk—Natural gas is a significant commodity used in our factories, especially in our Coatings segment galvanizing operations, where natural gas is used to heat tanks that enable the hot-dipped galvanizing process. Natural gas prices are volatile and we mitigate some of this volatility through the use of derivative commodity instruments. Our current policy is to manage this commodity price risk for 0-50% of our U.S. natural gas requirements for the upcoming 6-12 months through the purchase of natural gas swaps based on NYMEX futures prices for delivery in the month being hedged. The objective of this policy is to mitigate the impact on our earnings of sudden, significant increases in the price of natural gas. At
December 30, 2017
, we have open natural gas swaps for 80,000 MMBtu.
CRITICAL ACCOUNTING POLICIES
The following accounting policies involve judgments and estimates used in preparation of the consolidated financial statements. There is a substantial amount of management judgment used in preparing financial statements. We must make estimates on a number of items, such as provisions for bad debts, warranties, contingencies, impairments of long-lived assets, and inventory obsolescence. We base our estimates on our experience and on other assumptions that we believe are reasonable under the circumstances. Further, we re-evaluate our estimates from time to time and as circumstances change. Actual results may differ under different assumptions or conditions. The selection and application of our critical accounting policies are discussed annually with our audit committee.
Allowance for Doubtful Accounts
In determining an allowance for accounts receivable that will not ultimately be collected in full, we consider:
36
|
•
|
age of the accounts receivable
|
|
•
|
customer credit history
|
|
•
|
customer financial information
|
|
•
|
reasons for non-payment (product, service or billing issues).
|
If our customer's financial condition was to deteriorate, resulting in an impaired ability to make payment, additional allowances may be required. As the Company’s international Irrigation business has grown, the exposure to potential losses in international markets has also increased. These exposures can be difficult to estimate, particularly in areas of political instability, or with governments with which the Company has limited experience, or where there is a lack of transparency as to the current credit condition of governmental units. Receivables that are not reasonably expected to be realized in cash within the next twelve months are classified as long-term receivables within other assets. The Company’s allowance for doubtful accounts related to both current and long-term accounts receivables is $9.8 million at
December 30, 2017
.
Warranties
All of our businesses must meet certain product quality and performance criteria. We rely on historical product claims data to estimate the cost of product warranties at the time revenue is recognized. In determining the accrual for the estimated cost of warranty claims, we consider our experience with:
|
•
|
costs to correct the product problem in the field, including labor costs
|
|
•
|
costs for replacement parts
|
|
•
|
other direct costs associated with warranty claims
|
|
•
|
the number of product units subject to warranty claims
|
In addition to known claims or warranty issues, we estimate future claims on recent sales. The key assumptions in our estimates are the rates we apply to those recent sales (which is based on historical claims experience) and our expected future warranty costs for products that are covered under warranty for an extended period of time. Our provision for various product warranties was approximately $20.1 million at
December 30, 2017
. If our estimate changed by 50%, the impact on operating income would be approximately $10.1 million. If our cost to repair a product or the number of products subject to warranty claims is greater than we estimated, then we would have to increase our accrued cost for warranty claims.
Inventories
We use the last-in first-out (LIFO) method to determine the value of approximately
37%
of our inventory. The remaining 63% of our inventory is valued on a first-in first-out (FIFO) basis. In periods of rising costs to produce inventory, the LIFO method will result in lower profits than FIFO, because higher more recent costs are recorded to cost of goods sold than under the FIFO method. Conversely, in periods of falling costs to produce inventory, the LIFO method will result in higher profits than the FIFO method.
In 2017 and 2016, we experienced higher average costs to produce inventory than in the prior year, due mainly to higher cost for steel and steel-related products. This resulted in higher costs of goods sold of approximately $5.7 million in 2017 and $3.0 million in 2016, than if our entire inventory had been valued on the FIFO method. In 2015, we experienced lower costs to produce inventory than in the prior year, due mainly to lower cost for steel and steel‑related products. This resulted in lower cost of goods sold (and higher operating income) of approximately $12.0 million in 2015, than had our entire inventory been valued on the FIFO method.
We write down slow-moving and obsolete inventory by the difference between the value of the inventory and our estimate of the reduced value based on potential future uses, the likelihood that overstocked inventory will be sold and the expected selling prices of the inventory. If our ability to realize value on slow-moving or obsolete inventory is less favorable than assumed, additional inventory write downs may be required.
37
Depreciation, Amortization and Impairment of Long-Lived Assets
Our long-lived assets consist primarily of property, plant and equipment, goodwill and intangible assets acquired in business acquisitions. We have assigned useful lives to our property, plant and equipment and certain intangible assets ranging from 3 to 40 years. In 2015, we determined that our galvanizing operation in Melbourne Australia would not generate sufficient cash flows on an undiscounted cash flow basis to recover its carrying value. We had the fixed assets valued by an appraisal firm and recognized an impairment of approximately $4.1 million. Other impairment losses were recorded in 2015 as facilities were closed and future plans for certain fixed assets changed in connection with our restructuring plans.
We identified thirteen reporting units for purposes of evaluating goodwill and we annually evaluate our reporting units for goodwill impairment during the third fiscal quarter, which usually coincides with our strategic planning process. We assess the value of our reporting units using after-tax cash flows from operations (less capital expenses) discounted to present value and as a multiple of earnings before interest, taxes, depreciation and amortization (EBITDA). The key assumptions in the discounted cash flow analysis are the discount rate and the projected cash flows. We also use sensitivity analysis to determine the impact of changes in discount rates and cash flow forecasts on the valuation of the reporting units. As allowed for under current accounting standards, we rely on our previous valuations for the annual impairment testing provided that the following criteria for each reporting unit are met: (1) the assets and liabilities that make up the reporting unit have not changed significantly since the most recent fair value determination and (2) the most recent fair value determination resulted in an amount that exceeded the carrying amount of the reporting unit by a substantial margin.
Our most recent impairment test during the third quarter of 2017 showed that the estimated fair value of all of our reporting units exceeded their respective carrying value, so no goodwill was impaired. Our offshore and other complex steel structures reporting unit with $14.8 million of goodwill, is the reporting unit that did not have a substantial excess of estimated fair value over its carrying value. The 2017 model assumes continued expansion into other highly engineered steel product offerings, such as utility support structures, where the reporting unit completed profitable projects in the past. We will continue to monitor the outlook for wind energy in Europe which would affect the sales demand assumptions in the five year model for this reporting unit. If demand for off and onshore structures for wind energy declines significantly and oil and natural gas prices do not increase to a level to drive new extraction investment, we will be required to perform an interim impairment test for goodwill. A hypothetical 1% change in the discount rate would increase/decrease the fair value of this reporting unit by approximately $10 million, which approximates the cushion between the estimated fair value and carrying value of this reporting unit.
If our assumptions on discount rates and future cash flows change as a result of events or circumstances, and we believe these assets may have declined in value, then we may record impairment charges, resulting in lower profits
.
Our reporting units are all cyclical and their sales and profitability may fluctuate from year to year. The Company continues to monitor changes in the global economy that could impact future operating results of its reporting units. If such conditions arise, the Company will test a given reporting unit for impairment prior to the annual test. In the evaluation of our reporting units, we look at the long-term prospects for the reporting unit and recognize that current performance may not be the best indicator of future prospects or value, which requires management judgment.
In fiscal 2015, we recognized a $16.2 million impairment charge which represented all of the goodwill on the APAC Coatings reporting unit. The forecast for lower prices for oil and natural gas required an interim step 2 test for our Access Systems reporting unit during the fourth quarter of 2015. We recognized an $18.7 million impairment of goodwill as a result of that test.
Our indefinite‑lived intangible assets consist of trade names. We assess the values of these assets apart from goodwill as part of the annual impairment testing. We use the relief-from-royalty method to evaluate our trade names, under which the value of a trade name is determined based on a royalty that could be charged to a third party for using the trade name in question. The royalty, which is based on a reasonable rate applied against estimated future sales, is tax-effected and discounted to present value. The most significant assumptions in this evaluation include estimated future sales, the royalty rate and the after-tax discount rate. For our evaluation purposes, the royalty rates used vary between 0.5% and 1.5% of sales and the after-tax discount rate of 13.0% to 16.0%, which we estimate to be the after-tax cost of capital for such assets.
Our trade names were tested for impairment in the third quarter of 2017 where we determined no trade names were impaired. In fiscal 2015, two of our trade names, Webforge (in the ESS segment) and Industrial Galvanizing (in the Coatings segment), were estimated to have a fair value lower than carrying value during the impairment tests. As such, we recognized a $5.8 million impairment of the Webforge trade name and a $1.1 million impairment of the Industrial Galvanizing trade name.
38
Income Taxes
We record valuation allowances to reduce our deferred tax assets to amounts that are more likely than not to be realized. We consider future taxable income expectations and tax-planning strategies in assessing the need for the valuation allowance. If we estimate a deferred tax asset is not likely to be fully realized in the future, a valuation allowance to decrease the amount of the deferred tax asset would decrease net earnings in the period the determination was made. Likewise, if we subsequently determine that we are able to realize all or part of a net deferred tax asset in the future, an adjustment reducing the valuation allowance would increase net earnings in the period such determination was made.
At
December 30, 2017
, we had approximately $54.5 million in deferred tax assets relating to tax credits and loss carryforwards, with a valuation allowance of $27.9 million, including $2.4 million in valuation allowances remaining in the Delta entities related to capital loss carryforwards, which are unlikely ever to be realized. If circumstances related to our deferred tax assets change in the future, we may be required to increase or decrease the valuation allowance on these assets, resulting in an increase or decrease in income tax expense and a reduction or increase in net income. For example, we recorded a full $9.9 million valuation allowance against a tax credit asset in fiscal 2016 as we determined it is not more likely than not these credits will be utilized before they expire.
We previously considered the earnings in our non-U.S. subsidiaries to be indefinitely reinvested and, accordingly, recorded no related deferred income tax liabilities. The 2017 Tax Act, enacted in December 2017, subjected our unremitted foreign earnings of approximately $400 million to tax at certain specified rates. We made a reasonable estimate of the Transition Tax and recorded a provisional transition tax obligation of $9.9 million. However, we are continuing to gather additional information to more precisely compute the amount of the transition tax. In addition, deferred taxes of $11.7 million related to these unremitted foreign earnings were recorded in the fourth quarter of 2017 for future taxes that will be incurred when cash is repatriated. This amount is provisional and our estimate and overall impact of the Act may change for various reasons including, but not limited to, changes in our interpretation and assumptions, additional guidance that may be issued by governing authorities, and tax planning actions we may undertake. We continue to gather additional information to fully account for the 2017 Tax Act and to determine our position with respect to future earnings. Any updates to our position will be communicated in future quarterly financial statements and may result in the recording of additional income tax expense.
We are subject to examination by taxing authorities in the various countries in which we operate. The tax years subject to examination vary by jurisdiction. We regularly consider the likelihood of additional income tax assessments in each of these taxing jurisdictions based on our experiences related to prior audits and our understanding of the facts and circumstances of the related tax issues. We include in current income tax expense any changes to accruals for potential tax deficiencies. If our judgments related to tax deficiencies differ from our actual experience, our income tax expense could increase or decrease in a given fiscal period.
Pension Benefits
Delta Ltd. maintains a defined benefit pension plan for qualifying employees in the United Kingdom. There are no active employees as members in the plan. Independent actuaries assist in properly measuring the liabilities and expenses associated with accounting for pension benefits to eligible employees. In order to use actuarial methods to value the liabilities and expenses, we must make several assumptions. The critical assumptions used to measure pension obligations and expenses are the discount rate and expected rate of return on pension assets.
We evaluate our critical assumptions at least annually. Key assumptions are based on the following factors:
|
•
|
Discount rate is based on the yields available on AA-rated corporate bonds with durational periods similar to that of the pension liabilities.
|
|
•
|
Expected return on plan assets is based on our asset allocation mix and our historical return, taking into consideration current and expected market conditions. Most of the assets in the pension plan are invested in corporate bonds, the expected return of which are estimated based on the yield available on AA rated corporate bonds. The long-term expected returns on equities are based on historic performance over the long-term.
|
39
|
•
|
Inflation is based on the estimated change in the consumer price index (“CPI”) or the retail price index (“RPI”), depending on the relevant plan provisions.
|
We modified the method used to estimate the interest cost components of the net periodic pension expense in 2017. The new method uses the full yield curve approach to estimate the interest cost by applying the specific spot rates along the yield curve used to determine the present value of the benefit plan obligations to relevant projected cash outflows for the corresponding year. Prior to 2017, the interest cost components were determined using a single weighted-average discount rate. The change does not affect the measurement of the total benefit plan obligation at year-end as the change in interest cost will be offset by an equivalent but opposite change in the actuarial gains and losses recorded in other comprehensive income (loss).
The discount rate used to measure the defined benefit obligation was 2.55% at December 30, 2017. The following tables present the key assumptions used to measure pension expense for
2018
and the estimated impact on
2018
pension expense relative to a change in those assumptions:
|
Assumptions
|
Pension
|
|
|
Discount rate
|
2.55
|
%
|
|
Expected return on plan assets
|
4.29
|
%
|
|
Inflation - CPI
|
2.20
|
%
|
|
Inflation - RPI
|
3.15
|
%
|
|
Assumptions
In Millions of Dollars
|
Increase
in Pension Expense |
||
|
0.25% decrease in discount rate
|
$
|
—
|
|
|
0.25% decrease in expected return on plan assets
|
$
|
1.5
|
|
|
0.25% increase in inflation
|
$
|
1.2
|
|
The information required is included under the captioned paragraph, “MARKET RISK” on page 36 of this report.
40
The following consolidated financial statements of the Company and its subsidiaries are included herein as listed below:
|
Page
|
|
|
Consolidated Financial Statements
|
|
|
Consolidated Statements of Earnings—Three-Year Period Ended December 30, 2017
|
|
|
Consolidated Statements of Comprehensive Income—Three-Year Period Ended December 30, 2017
|
|
|
Consolidated Balance Sheets—December 30, 2017 and December 31, 2016
|
|
|
Consolidated Statements of Cash Flows—Three-Year Period Ended December 30, 2017
|
|
|
Consolidated Statements of Shareholders’ Equity—Three-Year Period Ended December 30, 2017
|
|
|
Notes to Consolidated Financial Statements—Three-Year Period Ended December 30, 2017
|
|
41
REPORT OF INDEPENDENT REGISTERED PUBLIC ACCOUNTING FIRM
To the Shareholders and the Board of Directors of Valmont Industries, Inc.
Opinion on the Financial Statements
We have audited the accompanying consolidated balance sheets of Valmont Industries, Inc. and subsidiaries (the “Company”) as of
December 30, 2017
and
December 31, 2016
, the related consolidated statements of earnings, comprehensive income, cash flows, and shareholders’ equity for each of the three fiscal years in the period ended
December 30, 2017
, and the related notes and the schedule listed in the Index at Item 15 (collectively referred to as the "financial statements"). In our opinion, the consolidated financial statements present fairly, in all material respects, the financial position of the Company as of
December 30, 2017
and
December 31, 2016
, and the results of its operations and its cash flows for each of the three fiscal years in the period ended
December 30, 2017
, in conformity with the accounting principles generally accepted in the United States of America.
We have also audited, in accordance with the standards of the Public Company Accounting Oversight Board (United States), the Company’s internal control over financial reporting as of
December 30, 2017
, based on the criteria established in
Internal Control—Integrated Framework (2013)
issued by the Committee of Sponsoring Organizations of the Treadway Commission and our report dated
February 28, 2018
expressed an unqualified opinion on the Company’s internal control over financial reporting.
Basis for Opinion
These financial statements are the responsibility of the Company's management. Our responsibility is to express an opinion on the Company's financial statements based on our audits. We are a public accounting firm registered with the PCAOB and are required to be independent with respect to the Company in accordance with the U.S. federal securities laws and the applicable rules and regulations of the Securities and Exchange Commission and the PCAOB.
We conducted our audits in accordance with the standards of the PCAOB. Those standards require that we plan and perform the audit to obtain reasonable assurance about whether the financial statements are free of material misstatement, whether due to error or fraud. Our audits included performing procedures to assess the risks of material misstatement of the financial statements, whether due to error or fraud, and performing procedures that respond to those risks. Such procedures included examining, on a test basis, evidence regarding the amounts and disclosures in the financial statements. Our audits also included evaluating the accounting principles used and significant estimates made by management, as well as evaluating the overall presentation of the financial statements. We believe that our audits provide a reasonable basis for our opinion.
/s/ DELOITTE & TOUCHE LLP
Omaha, Nebraska
February 28, 2018
We have served as the Company's auditor since 1996.
42
Valmont Industries, Inc. and Subsidiaries
CONSOLIDATED STATEMENTS OF EARNINGS
Three-year period ended
December 30, 2017
(Dollars in thousands, except per share amounts)
|
2017
|
2016
|
2015
|
|||||||||
|
Product sales
|
$
|
2,447,219
|
|
$
|
2,255,860
|
|
$
|
2,338,132
|
|
||
|
Services sales
|
298,748
|
|
265,816
|
|
280,792
|
|
|||||
|
Net sales
|
2,745,967
|
|
2,521,676
|
|
2,618,924
|
|
|||||
|
Product cost of sales
|
1,860,087
|
|
1,682,355
|
|
1,804,055
|
|
|||||
|
Services cost of sales
|
204,112
|
|
183,078
|
|
193,836
|
|
|||||
|
Total cost of sales
|
2,064,199
|
|
1,865,433
|
|
1,997,891
|
|
|||||
|
Gross profit
|
681,768
|
|
656,243
|
|
621,033
|
|
|||||
|
Selling, general and administrative expenses
|
415,336
|
|
412,739
|
|
447,368
|
|
|||||
|
Impairment of goodwill and intangible assets
|
—
|
|
—
|
|
41,970
|
|
|||||
|
Operating income
|
266,432
|
|
|
243,504
|
|
|
131,695
|
|
|||
|
Other income (expenses):
|
|||||||||||
|
Interest expense
|
(44,645
|
)
|
(44,409
|
)
|
(44,621
|
)
|
|||||
|
Interest income
|
4,737
|
|
3,105
|
|
3,296
|
|
|||||
|
Other
|
1,940
|
|
18,254
|
|
2,637
|
|
|||||
|
(37,968
|
)
|
(23,050
|
)
|
(38,688
|
)
|
||||||
|
Earnings before income taxes and equity in earnings of nonconsolidated subsidiaries
|
228,464
|
|
220,454
|
|
93,007
|
|
|||||
|
Income tax expense (benefit):
|
|||||||||||
|
Current
|
66,390
|
|
65,748
|
|
42,569
|
|
|||||
|
Deferred
|
39,755
|
|
(23,685
|
)
|
4,858
|
|
|||||
|
106,145
|
|
42,063
|
|
47,427
|
|
||||||
|
Earnings before equity in earnings of nonconsolidated subsidiaries
|
122,319
|
|
178,391
|
|
45,580
|
|
|||||
|
Equity in earnings of nonconsolidated subsidiaries
|
—
|
|
—
|
|
(247
|
)
|
|||||
|
Net earnings
|
122,319
|
|
178,391
|
|
45,333
|
|
|||||
|
Less: Earnings attributable to noncontrolling interests
|
(6,079
|
)
|
(5,159
|
)
|
(5,216
|
)
|
|||||
|
Net earnings attributable to Valmont Industries, Inc.
|
$
|
116,240
|
|
$
|
173,232
|
|
$
|
40,117
|
|
||
|
Earnings per share:
|
|
|
|||||||||
|
Basic
|
$
|
5.16
|
|
$
|
7.68
|
|
$
|
1.72
|
|
||
|
Diluted
|
$
|
5.11
|
|
$
|
7.63
|
|
$
|
1.71
|
|
||
|
Cash dividends declared per share
|
$
|
1.500
|
|
$
|
1.500
|
|
$
|
1.500
|
|
||
See accompanying notes to consolidated financial statements.
43
Valmont Industries, Inc. and Subsidiaries
Three-year period ended
December 30, 2017
(Dollars in thousands)
|
2017
|
2016
|
2015
|
|||||||||
|
Net earnings
|
$
|
122,319
|
|
$
|
178,391
|
|
$
|
45,333
|
|
||
|
Other comprehensive income (loss), net of tax:
|
|||||||||||
|
Foreign currency translation adjustments:
|
|||||||||||
|
Unrealized translation gains (losses)
|
79,279
|
|
(58,315
|
)
|
(96,694
|
)
|
|||||
|
Gain/(loss) on hedging activities:
|
|||||||||||
|
Unrealized gain (loss) on net investment hedge, net of tax expense (benefit) of ($880) in 2017 and $2,646 in 2016
|
(1,695
|
)
|
4,226
|
|
—
|
|
|||||
|
Amortization cost included in interest expense
|
74
|
|
74
|
|
74
|
|
|||||
|
Realized (gain) loss included in net earnings
|
—
|
|
—
|
|
(3,130
|
)
|
|||||
|
Unrealized gain (loss) on cash flow hedges
|
—
|
|
—
|
|
2,855
|
|
|||||
|
(1,621
|
)
|
4,300
|
|
(201
|
)
|
||||||
|
Actuarial (loss) on defined benefit pension plan, net of tax expense (benefit) of ($501) in 2017, ($25,778) in 2016, and ($10,732) in 2015
|
(10,871
|
)
|
(24,141
|
)
|
(40,274
|
)
|
|||||
|
Other comprehensive income (loss)
|
66,787
|
|
(78,156
|
)
|
(137,169
|
)
|
|||||
|
Comprehensive income (loss)
|
189,106
|
|
100,235
|
|
(91,836
|
)
|
|||||
|
Comprehensive loss (income) attributable to noncontrolling interests
|
(5,529
|
)
|
(6,144
|
)
|
(832
|
)
|
|||||
|
Comprehensive income (loss) attributable to Valmont Industries, Inc.
|
$
|
183,577
|
|
$
|
94,091
|
|
$
|
(92,668
|
)
|
||
See accompanying notes to consolidated financial statements.
44
Valmont Industries, Inc. and Subsidiaries
December 30, 2017
and
December 31, 2016
(Dollars in thousands, except shares and per share amounts)
|
2017
|
2016
|
||||||
|
ASSETS
|
|||||||
|
Current assets:
|
|||||||
|
Cash and cash equivalents
|
$
|
492,805
|
|
$
|
399,948
|
|
|
|
Receivables, less allowance of $9,396 in 2017 and $10,250 in 2016
|
503,677
|
|
439,342
|
|
|||
|
Inventories
|
420,948
|
|
350,028
|
|
|||
|
Prepaid expenses, restricted cash, and other assets
|
43,643
|
|
57,297
|
|
|||
|
Refundable income taxes
|
11,492
|
|
6,601
|
|
|||
|
Total current assets
|
1,472,565
|
|
1,253,216
|
|
|||
|
Property, plant and equipment, at cost
|
1,165,687
|
|
1,105,736
|
|
|||
|
Less accumulated depreciation and amortization
|
646,759
|
|
587,401
|
|
|||
|
Net property, plant and equipment
|
518,928
|
|
518,335
|
|
|||
|
Goodwill
|
337,720
|
|
321,110
|
|
|||
|
Other intangible assets, net
|
138,599
|
|
144,378
|
|
|||
|
Other assets, less allowance for doubtful receivables of $417 in 2017 and $8,741 in 2016
|
134,438
|
|
154,692
|
|
|||
|
Total assets
|
$
|
2,602,250
|
|
$
|
2,391,731
|
|
|
|
LIABILITIES AND SHAREHOLDERS’ EQUITY
|
|||||||
|
Current liabilities:
|
|||||||
|
Current installments of long-term debt
|
$
|
966
|
|
$
|
851
|
|
|
|
Notes payable to banks
|
161
|
|
746
|
|
|||
|
Accounts payable
|
227,906
|
|
177,488
|
|
|||
|
Accrued employee compensation and benefits
|
84,426
|
|
72,404
|
|
|||
|
Accrued expenses
|
81,029
|
|
89,914
|
|
|||
|
Dividends payable
|
8,510
|
|
8,445
|
|
|||
|
Total current liabilities
|
402,998
|
|
349,848
|
|
|||
|
Deferred income taxes
|
34,906
|
|
35,803
|
|
|||
|
Long-term debt, excluding current installments
|
753,888
|
|
754,795
|
|
|||
|
Defined benefit pension liability
|
189,552
|
|
209,470
|
|
|||
|
Deferred compensation
|
48,526
|
|
44,319
|
|
|||
|
Other noncurrent liabilities
|
20,585
|
|
14,910
|
|
|||
|
Shareholders’ equity:
|
|||||||
|
Preferred stock of $1 par value -
|
|
|
|
|
|||
|
Authorized 500,000 shares; none issued
|
—
|
|
—
|
|
|||
|
Common stock of $1 par value -
|
|
|
|
|
|||
|
Authorized 75,000,000 shares; 27,900,000 issued
|
27,900
|
|
27,900
|
|
|||
|
Additional paid-in capital
|
—
|
|
—
|
|
|||
|
Retained earnings
|
1,954,344
|
|
1,874,722
|
|
|||
|
Accumulated other comprehensive income (loss)
|
(279,022
|
)
|
(346,359
|
)
|
|||
|
Cost of treasury stock, common shares of 5,206,474 in 2017 and 5,379,106 in 2016
|
(590,386
|
)
|
(612,781
|
)
|
|||
|
Total Valmont Industries, Inc. shareholders’ equity
|
1,112,836
|
|
943,482
|
|
|||
|
Noncontrolling interest in consolidated subsidiaries
|
38,959
|
|
39,104
|
|
|||
|
Total shareholders’ equity
|
1,151,795
|
|
982,586
|
|
|||
|
Total liabilities and shareholders’ equity
|
$
|
2,602,250
|
|
$
|
2,391,731
|
|
|
See accompanying notes to consolidated financial statements.
45
Valmont Industries, Inc. and Subsidiaries
Three-year period ended
December 30, 2017
(Dollars in thousands)
|
2017
|
2016
|
2015
|
|||||||||
|
Cash flows from operating activities:
|
|||||||||||
|
Net earnings
|
$
|
122,319
|
|
$
|
178,391
|
|
$
|
45,333
|
|
||
|
Adjustments to reconcile net earnings to net cash flows from operations:
|
|||||||||||
|
Depreciation and amortization
|
84,957
|
|
82,417
|
|
91,144
|
|
|||||
|
Noncash loss on trading securities
|
237
|
|
586
|
|
4,555
|
|
|||||
|
Contribution to defined benefit pension plan
|
(40,245
|
)
|
(1,488
|
)
|
(16,500
|
)
|
|||||
|
(Increase) decrease in restricted cash - pension plan trust
|
12,568
|
|
(13,652
|
)
|
—
|
|
|||||
|
Impairment of property, plant and equipment
|
—
|
|
1,099
|
|
19,836
|
|
|||||
|
Impairment of goodwill & intangible assets
|
—
|
|
—
|
|
41,970
|
|
|||||
|
Stock-based compensation
|
10,706
|
|
9,931
|
|
7,244
|
|
|||||
|
Change in fair value of contingent consideration
|
—
|
|
(3,242
|
)
|
—
|
|
|||||
|
Defined benefit pension plan expense (benefit)
|
648
|
|
1,870
|
|
(610
|
)
|
|||||
|
(Gain) loss on sale of property, plant and equipment
|
(3,924
|
)
|
631
|
|
2,327
|
|
|||||
|
Equity in earnings in nonconsolidated subsidiaries
|
—
|
|
—
|
|
247
|
|
|||||
|
Deferred income taxes
|
39,755
|
|
(23,685
|
)
|
4,858
|
|
|||||
|
Changes in assets and liabilities (net of acquisitions):
|
|||||||||||
|
Receivables
|
(49,112
|
)
|
24,622
|
|
50,267
|
|
|||||
|
Inventories
|
(57,442
|
)
|
(11,461
|
)
|
3,296
|
|
|||||
|
Prepaid expenses
|
(6,038
|
)
|
1,138
|
|
10,844
|
|
|||||
|
Accounts payable
|
39,405
|
|
104
|
|
(6,805
|
)
|
|||||
|
Accrued expenses
|
(1,998
|
)
|
(12,207
|
)
|
8,918
|
|
|||||
|
Other noncurrent liabilities
|
(7,228
|
)
|
(23,880
|
)
|
(1,764
|
)
|
|||||
|
Income taxes payable (refundable)
|
1,108
|
|
7,994
|
|
7,107
|
|
|||||
|
Net cash flows from operating activities
|
145,716
|
|
219,168
|
|
272,267
|
|
|||||
|
Cash flows from investing activities:
|
|||||||||||
|
Purchase of property, plant and equipment
|
(55,266
|
)
|
(57,920
|
)
|
(45,468
|
)
|
|||||
|
Proceeds from sale of assets
|
8,185
|
|
5,126
|
|
3,249
|
|
|||||
|
Acquisitions, net of cash acquired
|
(5,362
|
)
|
—
|
|
(12,778
|
)
|
|||||
|
Proceeds from settlement of net investment hedge
|
5,123
|
|
—
|
|
—
|
|
|||||
|
Other, net
|
(2,295
|
)
|
(255
|
)
|
6,826
|
|
|||||
|
Net cash flows used in investing activities
|
(49,615
|
)
|
(53,049
|
)
|
(48,171
|
)
|
|||||
|
Cash flows from financing activities:
|
|||||||||||
|
Payments under short-term agreements
|
(585
|
)
|
(200
|
)
|
(12,853
|
)
|
|||||
|
Proceeds from long-term borrowings
|
—
|
|
—
|
|
68,000
|
|
|||||
|
Principal payments on long-term borrowings
|
(887
|
)
|
(2,006
|
)
|
(69,098
|
)
|
|||||
|
Dividends paid
|
(33,862
|
)
|
(34,053
|
)
|
(35,357
|
)
|
|||||
|
Dividends to noncontrolling interest
|
(5,674
|
)
|
(2,938
|
)
|
(2,634
|
)
|
|||||
|
Purchase of noncontrolling interest
|
—
|
|
(11,009
|
)
|
—
|
|
|||||
|
Proceeds from exercises under stock plans
|
35,159
|
|
11,153
|
|
13,075
|
|
|||||
|
Excess tax benefits from stock option exercises
|
—
|
|
—
|
|
1,699
|
|
|||||
|
Purchase of treasury shares
|
—
|
|
(53,800
|
)
|
(168,983
|
)
|
|||||
|
Purchase of common treasury shares—stock plan exercises
|
(26,161
|
)
|
(2,305
|
)
|
(13,854
|
)
|
|||||
|
Net cash flows used in financing activities
|
(32,010
|
)
|
(95,158
|
)
|
(220,005
|
)
|
|||||
|
Effect of exchange rate changes on cash and cash equivalents
|
28,766
|
|
(20,087
|
)
|
(26,596
|
)
|
|||||
|
Net change in cash and cash equivalents
|
92,857
|
|
50,874
|
|
(22,505
|
)
|
|||||
|
Cash and cash equivalents—beginning of year
|
399,948
|
|
349,074
|
|
371,579
|
|
|||||
|
Cash and cash equivalents—end of period
|
$
|
492,805
|
|
$
|
399,948
|
|
$
|
349,074
|
|
||
See accompanying notes to consolidated financial statements.
46
Valmont Industries, Inc. and Subsidiaries
CONSOLIDATED STATEMENTS OF SHAREHOLDERS’ EQUITY
Three-year period ended
December 30, 2017
(Dollars in thousands, except shares and per share amounts)
|
Common
stock |
Additional
paid-in capital |
Retained
earnings |
Accumulated
other comprehensive income (loss) |
Treasury
stock |
Noncontrolling
interest in consolidated subsidiaries |
Total
shareholders’ equity |
|||||||||||||||||||||
|
Balance at December 27, 2014
|
$
|
27,900
|
|
$
|
—
|
|
$
|
1,718,662
|
|
$
|
(134,433
|
)
|
$
|
(410,296
|
)
|
$
|
48,572
|
|
$
|
1,250,405
|
|
||||||
|
Net earnings
|
—
|
|
—
|
|
40,117
|
|
—
|
|
—
|
|
5,216
|
|
45,333
|
|
|||||||||||||
|
Other comprehensive loss
|
—
|
|
—
|
|
—
|
|
(132,785
|
)
|
—
|
|
(4,384
|
)
|
(137,169
|
)
|
|||||||||||||
|
Cash dividends declared ($1.50 per share)
|
—
|
|
—
|
|
(34,816
|
)
|
—
|
|
—
|
|
—
|
|
(34,816
|
)
|
|||||||||||||
|
Dividends to noncontrolling interests
|
—
|
|
—
|
|
—
|
|
—
|
|
—
|
|
(2,634
|
)
|
(2,634
|
)
|
|||||||||||||
|
Purchase of treasury shares; 1,435,488 shares acquired
|
—
|
|
—
|
|
—
|
|
—
|
|
(168,983
|
)
|
—
|
|
(168,983
|
)
|
|||||||||||||
|
Stock plan exercises; 112,995 shares acquired
|
—
|
|
—
|
|
—
|
|
—
|
|
(13,854
|
)
|
—
|
|
(13,854
|
)
|
|||||||||||||
|
Stock options exercised; 169,493 shares issued
|
—
|
|
(12,895
|
)
|
5,716
|
|
—
|
|
20,254
|
|
—
|
|
13,075
|
|
|||||||||||||
|
Tax benefit from stock option exercises
|
—
|
|
1,699
|
|
—
|
|
—
|
|
—
|
|
—
|
|
1,699
|
|
|||||||||||||
|
Stock option expense
|
—
|
|
5,137
|
|
—
|
|
—
|
|
—
|
|
—
|
|
5,137
|
|
|||||||||||||
|
Stock awards; 10,329 shares issued
|
—
|
|
6,059
|
|
—
|
|
—
|
|
959
|
|
—
|
|
7,018
|
|
|||||||||||||
|
Balance at December 26, 2015
|
27,900
|
|
—
|
|
1,729,679
|
|
(267,218
|
)
|
(571,920
|
)
|
46,770
|
|
965,211
|
|
|||||||||||||
|
Net earnings
|
—
|
|
—
|
|
173,232
|
|
—
|
|
—
|
|
5,159
|
|
178,391
|
|
|||||||||||||
|
Other comprehensive income (loss)
|
—
|
|
—
|
|
—
|
|
(79,141
|
)
|
—
|
|
985
|
|
(78,156
|
)
|
|||||||||||||
|
Cash dividends declared ($1.50 per share)
|
—
|
|
—
|
|
(33,921
|
)
|
—
|
|
—
|
|
—
|
|
(33,921
|
)
|
|||||||||||||
|
Dividends to noncontrolling interests
|
—
|
|
—
|
|
—
|
|
—
|
|
—
|
|
(2,938
|
)
|
(2,938
|
)
|
|||||||||||||
|
Purchase of noncontrolling interest
|
—
|
|
(137
|
)
|
—
|
|
—
|
|
—
|
|
(10,872
|
)
|
(11,009
|
)
|
|||||||||||||
|
Purchase of treasury shares; 441,494 shares acquired
|
—
|
|
—
|
|
—
|
|
—
|
|
(53,800
|
)
|
—
|
|
(53,800
|
)
|
|||||||||||||
|
Stock plan exercises; 16,777 shares acquired
|
—
|
|
—
|
|
—
|
|
—
|
|
(2,305
|
)
|
—
|
|
(2,305
|
)
|
|||||||||||||
|
Stock options exercised; 109,893 shares issued
|
—
|
|
(7,614
|
)
|
5,732
|
|
—
|
|
13,035
|
|
—
|
|
11,153
|
|
|||||||||||||
|
Tax benefit from stock option exercises
|
—
|
|
—
|
|
—
|
|
—
|
|
—
|
|
—
|
|
—
|
|
|||||||||||||
|
Stock option expense
|
—
|
|
5,782
|
|
—
|
|
—
|
|
—
|
|
—
|
|
5,782
|
|
|||||||||||||
|
Stock awards; 15,700 shares issued
|
—
|
|
1,969
|
|
—
|
|
—
|
|
2,209
|
|
—
|
|
4,178
|
|
|||||||||||||
|
Balance at December 31, 2016
|
27,900
|
|
—
|
|
1,874,722
|
|
(346,359
|
)
|
(612,781
|
)
|
39,104
|
|
982,586
|
|
|||||||||||||
|
Net earnings
|
—
|
|
—
|
|
116,240
|
|
—
|
|
—
|
|
6,079
|
|
122,319
|
|
|||||||||||||
|
Other comprehensive income (loss)
|
—
|
|
—
|
|
—
|
|
67,337
|
|
—
|
|
(550
|
)
|
66,787
|
|
|||||||||||||
|
Cash dividends declared ($1.50 per share)
|
—
|
|
—
|
|
(33,927
|
)
|
—
|
|
—
|
|
—
|
|
(33,927
|
)
|
|||||||||||||
|
Dividends to noncontrolling interests
|
—
|
|
—
|
|
—
|
|
—
|
|
—
|
|
(5,674
|
)
|
(5,674
|
)
|
|||||||||||||
|
Stock plan exercises; 154,437 shares acquired
|
—
|
|
—
|
|
—
|
|
—
|
|
(26,161
|
)
|
—
|
|
(26,161
|
)
|
|||||||||||||
|
Stock options exercised; 284,574 shares issued
|
—
|
|
(4,666
|
)
|
(2,691
|
)
|
—
|
|
42,516
|
|
—
|
|
35,159
|
|
|||||||||||||
|
Stock option expense
|
—
|
|
5,137
|
|
—
|
|
—
|
|
—
|
|
—
|
|
5,137
|
|
|||||||||||||
|
Stock awards; 42,846 shares issued
|
—
|
|
(471
|
)
|
—
|
|
—
|
|
6,040
|
|
—
|
|
5,569
|
|
|||||||||||||
|
Balance at December 30, 2017
|
$
|
27,900
|
|
$
|
—
|
|
$
|
1,954,344
|
|
$
|
(279,022
|
)
|
$
|
(590,386
|
)
|
$
|
38,959
|
|
|
$
|
1,151,795
|
|
|||||
See accompanying notes to consolidated financial statements.
47
VALMONT INDUSTRIES, INC. AND SUBSIDIARIES
NOTES TO CONSOLIDATED FINANCIAL STATEMENTS (Continued)
Three-year period ended December 30, 2017
(Dollars in thousands, except per share amounts)
(1) SUMMARY OF SIGNIFICANT ACCOUNTING POLICIES
Principles of Consolidation
The consolidated financial statements include the accounts of Valmont Industries, Inc. and its wholly and majority‑owned subsidiaries (the Company). The investment in Delta EMD Pty. Ltd ("EMD") is recorded at fair value subsequent to its deconsolidation in 2013. Investments in other
20%
to
50%
owned affiliates and joint ventures are accounted for by the equity method. Investments in less than
20%
owned affiliates are accounted for by the cost method. All intercompany items have been eliminated.
Cash overdrafts
Cash book overdrafts totaling
$21,537
and
$18,734
were classified as accounts payable at
December 30, 2017
and
December 31, 2016
, respectively. The Company’s policy is to report the change in book overdrafts as an operating activity in the Consolidated Statements of Cash Flows.
Segments
The Company has
four
reportable segments based on its management structure. Each segment is global in nature with a manager responsible for segment operational performance and allocation of capital within the segment. Reportable segments are as follows:
ENGINEERED SUPPORT STRUCTURES: This segment consists of the manufacture and distribution of engineered metal, and composite structures and components for lighting and traffic, access systems, wireless communication, and roadway safety;
UTILITY SUPPORT STRUCTURES: This segment consists of the manufacture of engineered steel and concrete structures for the utility industry, including on and offshore and other complex steel structures used in the energy generation or distribution industry outside the United States;
COATINGS: This segment consists of galvanizing, anodizing and powder coating services; and
IRRIGATION: This segment consists of the manufacture of agricultural irrigation equipment and related parts and services for the agricultural industry as well as tubular products for a variety of industrial customers.
In addition to these
four
reportable segments, there are other businesses and activities that individually are not more than
10%
of consolidated sales, operating income or assets. This includes the manufacture of forged steel grinding media for the mining industry and is reported in the "Other" category.
Fiscal Year
The Company operates on a
52
or
53
week fiscal year with each year ending on the last Saturday in December. Accordingly, the Company’s fiscal year ended
December 30, 2017
consisted of 52 weeks. The Company's fiscal year ended
December 31, 2016
consisted of 53 weeks and fiscal year ended
December 26, 2015
consisted of
52
weeks. The estimated impact on the company's results of operations due to the extra week in fiscal 2016 was additional net sales of approximately
$50,000
and additional net earnings of approximately
$3,000
.
48
VALMONT INDUSTRIES, INC. AND SUBSIDIARIES
NOTES TO CONSOLIDATED FINANCIAL STATEMENTS (Continued)
Three-year period ended December 30, 2017
(Dollars in thousands, except per share amounts)
(1) SUMMARY OF SIGNIFICANT ACCOUNTING POLICIES (Continued)
Accounts Receivable
Accounts receivable are reported on the balance sheet net of any allowance for doubtful accounts. Allowances are maintained in amounts considered to be appropriate in relation to the outstanding receivables based on age of the receivable,
economic conditions and customer credit quality. As the Company’s international Irrigation business has grown, the exposure to potential losses in international markets has also increased. These exposures can be difficult to estimate, particularly in areas of political instability, or with governments with which the Company has limited experience, or where there is a lack of transparency as to the current credit condition of governmental units. The Company’s allowance for doubtful accounts related to both current and long-term accounts receivables was
$9,813
at
December 30, 2017
.
Inventories
Approximately
37%
and
38%
of inventory is valued at the lower of cost, determined on the last-in, first-out (LIFO) method, or market as of
December 30, 2017
and
December 31, 2016
, respectively. All other inventory is valued at the lower of cost, determined on the first-in, first-out (FIFO) method or market. Finished goods and manufactured goods inventories include the costs of acquired raw materials and related factory labor and overhead charges required to convert raw materials to manufactured and finished goods. The excess of replacement cost of inventories over the LIFO value is approximately
$43,727
and
$38,047
at
December 30, 2017
and
December 31, 2016
, respectively.
Long-Lived Assets
Property, plant and equipment are recorded at historical cost. The Company generally uses the straight-line method in computing depreciation and amortization for financial reporting purposes and accelerated methods for income tax
purposes. The annual provisions for depreciation and amortization have been computed principally in accordance with the following ranges of asset lives: buildings and improvements
15
to
40
years, machinery and equipment
3
to
12
years, transportation equipment
3
to
24
years, office furniture and equipment
3
to
7
years and intangible assets
5
to
20
years. Depreciation expense in fiscal
2017
,
2016
and
2015
was
$69,046
,
$66,482
and
$72,805
, respectively.
An impairment loss is recognized if the carrying amount of an asset may not be recoverable and exceeds estimated future undiscounted cash flows of the asset. A recognized impairment loss reduces the carrying amount of the asset to its estimated fair value. The Company recognized a
$4,151
impairment of the Melbourne galvanizing site's equipment in 2015 as the Company determined that our galvanizing operation in Melbourne, Australia would not generate sufficient cash flows on an undiscounted cash flow basis to recover its carrying value. Other impairment losses were recorded in 2016 and 2015 as facilities were closed and future plans for certain fixed assets changed in connection with the Company's restructuring plans.
The Company evaluates its reporting units for impairment of goodwill during the third fiscal quarter of each year, or when events or changes in circumstances indicate the carrying value may not be recoverable. Reporting units are evaluated using after-tax operating cash flows (less capital expenditures) discounted to present value. Indefinite‑lived intangible assets are assessed separately from goodwill as part of the annual impairment testing, using a relief-from-royalty method. If the underlying assumptions related to the valuation of a reporting unit’s goodwill or an indefinite‑lived intangible asset change materially before or after the annual impairment testing, the reporting unit or asset is evaluated for potential impairment. In these evaluations, management considers recent operating performance, expected future performance, industry conditions and other indicators of potential impairment. Please see footnote 7 for details of impairments recognized during 2015.
Income Taxes
The Company uses the asset and liability method to calculate deferred income taxes. Deferred tax assets and liabilities are recognized on temporary differences between financial statement and tax bases of assets and liabilities using enacted tax rates. The effect of tax rate changes on deferred tax assets and liabilities is recognized in income during the period that includes the enactment date.
49
VALMONT INDUSTRIES, INC. AND SUBSIDIARIES
NOTES TO CONSOLIDATED FINANCIAL STATEMENTS (Continued)
Three-year period ended December 30, 2017
(Dollars in thousands, except per share amounts)
(1) SUMMARY OF SIGNIFICANT ACCOUNTING POLICIES (Continued)
Warranties
The Company's provision for product warranty reflects management's best estimate of probable liability under its product warranties. Estimated future warranty costs are recorded at the time a sale is recognized. Future warranty liability is determined based on applying historical claim rate experience to units sold that are still within the warranty period. In addition, the Company records provisions for known warranty claims.
Pension Benefits
Certain expenses are incurred in connection with a defined benefit pension plan. In order to measure expense and the related benefit obligation, various assumptions are made including discount rates used to value the obligation, expected return on plan assets used to fund these expenses and estimated future inflation rates. These assumptions are based on historical experience as well as current facts and circumstances. An actuarial analysis is used to measure the expense and liability associated with pension benefits.
Derivative Instrument
The Company may enter into derivative financial instruments to manage risk associated with fluctuation in interest rates, foreign currency rates or commodities. Where applicable, the Company may elect to account for such derivatives as either a cash flow, fair value, or net investment hedge.
Comprehensive Income (Loss)
Comprehensive income (loss) includes net income, currency translation adjustments, certain derivative-related activity and changes in net actuarial gains/losses from a pension plan. Results of operations for foreign subsidiaries are translated using the average exchange rates during the period. Assets and liabilities are translated at the exchange rates in effect on the balance sheet dates. The components of accumulated other comprehensive income (loss) consisted of the following:
|
Foreign Currency Translation Adjustments
|
Gain on Hedging Activities
|
Defined Benefit Pension Plan
|
Accumulated Other Comprehensive Income (Loss)
|
||||||||||||
|
Balance at December 31, 2016
|
$
|
(251,228
|
)
|
$
|
7,978
|
|
$
|
(103,109
|
)
|
$
|
(346,359
|
)
|
|||
|
Current-period comprehensive income (loss)
|
79,829
|
|
(1,621
|
)
|
(10,871
|
)
|
67,337
|
|
|||||||
|
Balance at December 30, 2017
|
$
|
(171,399
|
)
|
$
|
6,357
|
|
$
|
(113,980
|
)
|
$
|
(279,022
|
)
|
|||
50
VALMONT INDUSTRIES, INC. AND SUBSIDIARIES
NOTES TO CONSOLIDATED FINANCIAL STATEMENTS (Continued)
Three-year period ended December 30, 2017
(Dollars in thousands, except per share amounts)
(1) SUMMARY OF SIGNIFICANT ACCOUNTING POLICIES (Continued)
Revenue Recognition
Revenue is recognized upon shipment of the product or delivery of the service to the customer, which coincides with passage of title and risk of loss to the customer. Customer acceptance provisions exist only in the design stage of our products. Acceptance of the design by the customer is required before the product is manufactured and delivered to the customer. The Company is not entitled to any compensation solely based on design of the product and does not recognize any revenue associated with the design stage. No general rights of return exist for customers once the product has been delivered. Shipping and handling costs associated with sales are recorded as cost of goods sold. Sales discounts and rebates are estimated based on past experience and are recorded as a reduction of net sales in the period in which the sale is recognized. Service revenues predominantly consist of coatings services provided by our Coatings segment to its customers. Revenue from the offshore and other complex steel structures products is recognized using the percentage-of-completion method, based primarily on contract cost incurred to date compared to total estimated contract cost.
Use of Estimates
Management of the Company has made a number of estimates and assumptions relating to the reporting of assets and liabilities, the reported amounts of revenue and expenses and the disclosure of contingent assets and liabilities to prepare these financial statements in conformity with generally accepted accounting principles. Actual results could differ from those estimates.
Equity Method Investments
The Company has equity method investments in non-consolidated subsidiaries which are recorded within "Other assets" on the Consolidated Balance Sheet.
Treasury Stock
Repurchased shares are recorded as “Treasury Stock” and result in a reduction of “Shareholders’ Equity.” When treasury shares are reissued, the Company uses the last-in, first-out method, and the difference between the repurchase cost and re-issuance price is charged or credited to “Additional Paid-In Capital.”
In May 2014, the Company announced a capital allocation philosophy which covered a share repurchase program. Specifically, the Board of Directors authorized the purchase of up to
$500,000
of the Company's outstanding common stock from time to time over
twelve months
at prevailing market prices, through open market or privately-negotiated transactions. In February 2015, the Board of Directors authorized an additional purchase of up to
$250,000
of the Company's outstanding common stock with no stated expiration date. As of
December 30, 2017
, the Company has acquired
4,588,131
shares for approximately
$617,800
under this share repurchase program.
Research and Development
Research and development costs are charged to operations in the year incurred. These costs are a component of “Selling, general and administrative expenses” on the Consolidated Statements of Earnings. Research and development expenses were approximately
$11,600
in
2017
,
$8,300
in
2016
, and
$11,600
in
2015
.
51
VALMONT INDUSTRIES, INC. AND SUBSIDIARIES
NOTES TO CONSOLIDATED FINANCIAL STATEMENTS (Continued)
Three-year period ended December 30, 2017
(Dollars in thousands, except per share amounts)
(1) SUMMARY OF SIGNIFICANT ACCOUNTING POLICIES (Continued)
Recently Issued Accounting Pronouncements
In May 2014, the Financial Accounting Standards Board ("FASB") issued Accounting Standards Update ("ASU") 2014-09,
Revenue from Contracts with Customers (Topic 606)
, which supersedes the revenue recognition requirements in Accounting Standards Codification ("ASC") 605, Revenue Recognition. The new revenue recognition standard requires entities to recognize the amount of revenue to which it expects to be entitled for the transfer of promised goods or services to customers. This standard is effective for interim and annual reporting periods beginning after December 15, 2017, and can be adopted either retrospectively or as a cumulative effect adjustment as of the date of adoption. Early adoption is permitted for interim and annual periods beginning after December 15, 2016.
During 2017, the Company performed an evaluation of the effect from adopting this new accounting guidance will have on its consolidated results of operations and financial position. When the terms and conditions allow the Company to bill a customer for full compensation on a canceled order for the performance completed to date, and the inventory is custom engineered to a single customer's specifications, revenue will be recognized over the production period and not the historical practice which is upon shipment or time of delivery to the customer. The Company has certain product lines with customer engineering specifications resulting in limited ability for the asset to be used for another customer; this resides in the Utility segment and a small product line of the Engineered Support Structures segment. The Company estimates that approximately
$52,000
of sales and
$13,100
of pre-tax operating income would have been recognized prior to December 30, 2017 if the Company followed the new accounting guidance instead of the previously applied revenue recognition guidance.
The Company will adopt the new standard using the modified retrospective approach effective the first day of fiscal 2018, resulting in a credit to retained earnings being recognized for approximately $
9,800
. From a balance sheet perspective, a contract asset will be recorded for the amount of revenue recognized over the production period in excess of billings to that customer. A large portion of the increase to total assets from the recognition of a contract asset will be offset by lower reported inventory; the effect on the balance sheet will not be material. Although there were no significant changes to the Company's accounting systems or controls upon adoption of Topic 606, certain existing controls were modified to incorporate the revisions made to our accounting policies and practices.
In February 2016, the FASB issued ASU 2016-02,
Leases
, which provides revised guidance on leases requiring lessees to recognize a right-of-use asset and a lease liability for virtually all of their leases (other than leases that meet the definition of a short-term lease). ASU 2016-02 is effective for interim and annual reporting periods beginning after December 15, 2018, with early adoption permitted. The Company is currently evaluating the effect of adopting this new accounting guidance but expects the adoption will result in a significant increase in total assets and liabilities.
In December 2016, the FASB issued ASU 2016-18,
Statement of Cash Flows (Topic 230): Restricted Cash
, which requires amounts generally described as restricted cash and restricted cash equivalents to be included within cash and cash equivalents when reconciling the beginning-of-period and end-of-period total amounts shown in the statement of cash flows. ASU 2016-18 is effective for interim periods and fiscal years beginning after December 15, 2017, with early adoption permitted. The Company will adopt in the first quarter of 2018, recasting the beginning-of-period and end-of-period total cash and cash equivalent amounts on the statement of cash flows to include the £
10,000
restricted cash account for the pension plan at December 31, 2016, thus changing cash flows from operations for fiscal years 2017 and 2016.
In January 2017, the FASB issued ASU 2017-04,
Simplifying the Test for Goodwill Impairment
, which eliminates Step 2 from the goodwill impairment test. ASU 2017-04 is effective for periods and fiscal years beginning after December 15, 2019. Early adoption is permitted for interim or annual goodwill impairment tests performed on testing dates after January 1, 2017. The Company adopted this standard in the third quarter of 2017 which is the same period as it performs the annual goodwill impairment testing.
52
VALMONT INDUSTRIES, INC. AND SUBSIDIARIES
NOTES TO CONSOLIDATED FINANCIAL STATEMENTS (Continued)
Three-year period ended December 30, 2017
(Dollars in thousands, except per share amounts)
(1) SUMMARY OF SIGNIFICANT ACCOUNTING POLICIES (Continued)
In March 2017, the FASB issued ASU 2017-07,
Presentation of Net Periodic Benefit Cost Related to Defined Benefit Plans
, which amends the income statement presentation requirements for the components of net periodic benefit cost for an entity's defined benefit pension and post-retirement plans. ASU 2017-07 is effective for periods and fiscal years beginning after December 15, 2017. Early adoption is permitted as of the beginning of any annual period for which an entity's financial statements have not been issued. The Company does not believe this ASU will have a material impact on the consolidated financial statements and plans to adopt this ASU in the first quarter of 2018.
In August 2017, the FASB issued ASU 2017-12,
Targeted Improvements to Accounting for Hedging Activities,
which improves the financial reporting of hedging relationships through changes to both the designation and measurement guidance for qualifying hedging relationships and the presentation of hedge results. ASU 2017-12 is effective for periods and fiscal years beginning after December 15, 2018. Early adoption is permitted for any interim period post issuance. The Company does not believe the adoption of this ASU will have a material impact on the consolidated financial statements.
On December 22, 2017 the SEC staff issued Staff Accounting Bulletin118 (SAB 118), which provides guidance on accounting for the tax effects of the 2017 Tax Act. SAB 118 provides a measurement period that should not extend beyond one year from the enactment date for companies to complete the accounting under Accounting Standards Codification (ASC) 740,
Income Taxes
. In accordance with SAB 118, a company must reflect the income tax effects of those aspects of 2017 Tax Act for which the accounting under ASC 740 is complete. To the extent that a company’s accounting for certain income tax effects of the 2017 Tax Act is incomplete but for which they are able to determine a reasonable estimate, it must record a provisional amount in the financial statements. Provisional treatment is proper in light of anticipated additional guidance from various taxing authorities, the SEC, the FASB, and even the Joint Committee on Taxation.
(2) ACQUISITIONS
Acquisitions of Businesses
On July 31, 2017, the Company purchased Aircon Guardrails Private Limited ("Aircon") for
$5,362
in cash, net of cash acquired, plus assumed liabilities. Aircon produces highway safety systems including guardrails, structural metal products, and solar structural products in India with annual sales of approximately
$10,000
. In the purchase price allocation, goodwill of
$3,327
and
$2,109
of customer relationships and other intangible assets were recorded. Goodwill is not deductible for tax purposes. This business is included in the Engineered Support Structures segment and was acquired to expand the Company's geographic presence in the Asia-Pacific region. The purchase price allocation was finalized in the fourth quarter of 2017. Proforma disclosures were omitted as this business does not have a significant impact on the Company's financial results.
On September 30, 2015, the Company purchased American Galvanizing for
$12,778
in cash, net of cash acquired, plus assumed liabilities. American Galvanizing operates a custom galvanizing operation in New Jersey with annual sales of approximately
$8,000
. In the purchase price allocation, goodwill of
$3,019
and
$2,178
of customer relationships, trade name and other intangible assets were recorded. Goodwill is not deductible for tax purposes. This business is included in the Coatings segment and was acquired to expand the Company's geographic presence in the Northeast United States. The purchase price allocation was finalized in the first quarter of 2016. Proforma disclosures were omitted as this business did not have a significant impact on the Company's 2015 or 2016 financial results.
Acquisitions of Noncontrolling Interests
In April 2016, the Company acquired the remaining
30%
of IGC Galvanizing Industries (M) Sdn Bhd that it did not own for
$5,841
. In June 2016, the Company acquired
5.2%
of the remaining
10%
of Valmont SM that it did not own for
$5,168
. As these transactions were for acquisitions of part or all of the remaining shares of consolidated subsidiaries with no change in control, they were recorded within shareholders' equity and as a financing cash flow in the Consolidated Statements of Cash Flows.
53
VALMONT INDUSTRIES, INC. AND SUBSIDIARIES
NOTES TO CONSOLIDATED FINANCIAL STATEMENTS (Continued)
Three-year period ended December 30, 2017
(Dollars in thousands, except per share amounts)
(3) RESTRUCTURING ACTIVITIES
2016 Plan
In July 2016, the Company identified a restructuring plan (the "2016 Plan") in Australia/New Zealand focused primarily on closing and consolidating locations within the ESS and Coatings segments. In the fourth quarter of 2016, the Company decided to close a structures facility in Canada. The 2016 Plan was mostly completed by the end of fiscal 2016. During the last six months of fiscal 2016, the Company recorded the following pre-tax expenses from the 2016 Plan:
|
Coatings
|
ESS
|
Other/ Corporate
|
TOTAL
|
|||||||||||||
|
Severance
|
$
|
69
|
|
$
|
1,620
|
|
$
|
—
|
|
$
|
1,689
|
|
||||
|
Other cash restructuring expenses
|
—
|
|
2,257
|
|
—
|
|
2,257
|
|
||||||||
|
Asset impairments/net loss on disposals
|
—
|
|
1,099
|
|
—
|
|
1,099
|
|
||||||||
|
Total cost of sales
|
69
|
|
4,976
|
|
—
|
|
5,045
|
|
||||||||
|
Severance
|
236
|
|
349
|
|
—
|
|
585
|
|
||||||||
|
Other cash restructuring expenses
|
—
|
|
1,961
|
|
234
|
|
2,195
|
|
||||||||
|
Total selling, general and administrative expenses
|
236
|
|
2,310
|
|
234
|
|
2,780
|
|
||||||||
|
Consolidated total
|
$
|
305
|
|
$
|
7,286
|
|
$
|
234
|
|
$
|
7,825
|
|
||||
2015 Plan
In April 2015, the Company's Board of Directors authorized a broad restructuring plan (the "2015 Plan"). The following pre-tax expenses were recognized in 2015:
|
ESS
|
Utility
|
Coatings
|
Irrigation
|
Other/ Corporate
|
TOTAL
|
|||||||||||||||||||
|
Severance
|
$
|
4,417
|
|
$
|
1,555
|
|
$
|
508
|
|
$
|
724
|
|
$
|
—
|
|
$
|
7,204
|
|
||||||
|
Other cash restructuring expenses
|
2,349
|
|
1,853
|
|
175
|
|
—
|
|
—
|
|
4,377
|
|
||||||||||||
|
Asset impairments/net loss on disposals
|
3,694
|
|
1,142
|
|
5,291
|
|
—
|
|
—
|
|
10,127
|
|
||||||||||||
|
Total cost of sales
|
10,460
|
|
4,550
|
|
5,974
|
|
724
|
|
—
|
|
21,708
|
|
||||||||||||
|
Severance
|
3,665
|
|
404
|
|
270
|
|
423
|
|
1,957
|
|
6,719
|
|
||||||||||||
|
Other cash restructuring expenses
|
—
|
|
238
|
|
336
|
|
—
|
|
1,142
|
|
1,716
|
|
||||||||||||
|
Asset impairments/net loss on disposals
|
2,223
|
|
—
|
|
—
|
|
130
|
|
7,356
|
|
9,709
|
|
||||||||||||
|
Total selling, general and administrative expenses
|
5,888
|
|
642
|
|
606
|
|
553
|
|
10,455
|
|
18,144
|
|
||||||||||||
|
Consolidated total
|
$
|
16,348
|
|
$
|
5,192
|
|
$
|
6,580
|
|
$
|
1,277
|
|
$
|
10,455
|
|
$
|
39,852
|
|
||||||
54
VALMONT INDUSTRIES, INC. AND SUBSIDIARIES
NOTES TO CONSOLIDATED FINANCIAL STATEMENTS (Continued)
Three-year period ended December 30, 2017
(Dollars in thousands, except per share amounts)
(3) RESTRUCTURING ACTIVITIES (Continued)
During fiscal 2016, the Company recognized the following pre-tax restructuring expense (all cash) of
$4,581
related to the 2015 Plan:
|
•
|
Utility segment recognized
$528
(cost of sales)
|
|
•
|
ESS segment recognized
$1,040
(SG&A)
|
|
•
|
Coatings segment recognized
$602
(SG&A)
|
|
•
|
Irrigation segment recognized
$468
(SG&A)
|
|
•
|
Corporate recorded
$1,943
(SG&A)
|
Change in the liabilities recorded for the restructuring plans were as follows:
|
Balance at December 31, 2016
|
Recognized Restructuring Expense
|
Costs Paid or Otherwise Settled
|
Balance at December 30, 2017
|
|||||||||||||
|
Severance
|
$
|
1,597
|
|
$
|
—
|
|
$
|
(1,597
|
)
|
$
|
—
|
|
||||
|
Other cash restructuring expenses
|
4,581
|
|
—
|
|
(3,365
|
)
|
1,216
|
|
||||||||
|
Total
|
$
|
6,178
|
|
$
|
—
|
|
$
|
(4,962
|
)
|
$
|
1,216
|
|
||||
A significant change in market conditions in any of the Company's segments may affect the Company's assessment of the restructuring activities.
(4) CASH FLOW SUPPLEMENTARY INFORMATION
The Company considers all highly liquid temporary cash investments purchased with an original maturity of three months or less at the time of purchase to be cash equivalents. Cash payments for interest and income taxes (net of refunds) for the fifty-two weeks ended
December 30, 2017
, the fifty-three weeks ended
December 31, 2016
, and the fifty-two weeks ended
December 26, 2015
were as follows:
|
2017
|
2016
|
2015
|
||||||||
|
Interest
|
$
|
44,528
|
|
$
|
45,683
|
|
$
|
44,974
|
|
|
|
Income taxes
|
63,791
|
|
48,203
|
|
33,046
|
|
||||
55
VALMONT INDUSTRIES, INC. AND SUBSIDIARIES
NOTES TO CONSOLIDATED FINANCIAL STATEMENTS (Continued)
Three-year period ended December 30, 2017
(Dollars in thousands, except per share amounts)
(5) INVENTORIES
Inventories consisted of the following at
December 30, 2017
and
December 31, 2016
:
|
2017
|
2016
|
||||||
|
Raw materials and purchased parts
|
$
|
183,029
|
|
$
|
143,659
|
|
|
|
Work-in-process
|
30,671
|
|
27,291
|
|
|||
|
Finished goods and manufactured goods
|
250,975
|
|
217,125
|
|
|||
|
Subtotal
|
464,675
|
|
388,075
|
|
|||
|
Less: LIFO reserve
|
43,727
|
|
38,047
|
|
|||
|
$
|
420,948
|
|
$
|
350,028
|
|
||
(6) PROPERTY, PLANT AND EQUIPMENT
Property, plant and equipment, at cost, consist of the following:
|
2017
|
2016
|
||||||
|
Land and improvements
|
$
|
93,258
|
|
$
|
85,724
|
|
|
|
Buildings and improvements
|
350,937
|
|
325,813
|
|
|||
|
Machinery and equipment
|
588,439
|
|
564,171
|
|
|||
|
Transportation equipment
|
23,682
|
|
22,423
|
|
|||
|
Office furniture and equipment
|
82,025
|
|
77,453
|
|
|||
|
Construction in progress
|
27,346
|
|
30,152
|
|
|||
|
$
|
1,165,687
|
|
$
|
1,105,736
|
|
||
The Company leases certain facilities, machinery, computer equipment and transportation equipment under operating leases with unexpired terms ranging from one to fifteen years. Rental expense for operating leases amounted to
$25,612
,
$24,756
, and
$25,546
for fiscal
2017
,
2016
, and
2015
, respectively.
Minimum lease payments under operating leases expiring subsequent to
December 30, 2017
are:
|
Fiscal year ending
|
|||
|
2018
|
$
|
21,562
|
|
|
2019
|
15,839
|
|
|
|
2020
|
15,639
|
|
|
|
2021
|
12,227
|
|
|
|
2022
|
7,325
|
|
|
|
Subsequent
|
27,325
|
|
|
|
Total minimum lease payments
|
$
|
99,917
|
|
56
VALMONT INDUSTRIES, INC. AND SUBSIDIARIES
NOTES TO CONSOLIDATED FINANCIAL STATEMENTS (Continued)
Three-year period ended December 30, 2017
(Dollars in thousands, except per share amounts)
(7) GOODWILL AND INTANGIBLE ASSETS
Amortized Intangible Assets
The components of amortized intangible assets at
December 30, 2017
and
December 31, 2016
were as follows:
|
December 30, 2017
|
|||||||||
|
Gross
Carrying Amount |
Accumulated
Amortization |
Weighted
Average Life |
|||||||
|
Customer Relationships
|
$
|
200,810
|
|
$
|
131,062
|
|
13 years
|
||
|
Proprietary Software & Database
|
3,671
|
|
3,107
|
|
8 years
|
||||
|
Patents & Proprietary Technology
|
6,693
|
|
3,999
|
|
11 years
|
||||
|
Other
|
4,861
|
|
4,121
|
|
3 years
|
||||
|
$
|
216,035
|
|
$
|
142,289
|
|
||||
|
December 31, 2016
|
|||||||||
|
Gross
Carrying Amount |
Accumulated
Amortization |
Weighted
Average Life |
|||||||
|
Customer Relationships
|
$
|
191,316
|
|
$
|
111,342
|
|
13 years
|
||
|
Proprietary Software & Database
|
3,616
|
|
3,056
|
|
8 years
|
||||
|
Patents & Proprietary Technology
|
6,434
|
|
3,420
|
|
11 years
|
||||
|
Other
|
3,713
|
|
3,668
|
|
3 years
|
||||
|
$
|
205,079
|
|
$
|
121,486
|
|
||||
Amortization expense for intangible assets was $
15,911
, $
15,935
and $
18,339
for the fiscal years ended
December 30, 2017
,
December 31, 2016
and
December 26, 2015
, respectively.
Estimated annual amortization expense related to finite‑lived intangible assets is as follows:
|
Estimated
Amortization Expense |
|||
|
2018
|
$
|
14,537
|
|
|
2019
|
13,761
|
|
|
|
2020
|
12,647
|
|
|
|
2021
|
10,525
|
|
|
|
2022
|
7,550
|
|
|
The useful lives assigned to finite‑lived intangible assets included consideration of factors such as the Company’s past and expected experience related to customer retention rates, the remaining legal or contractual life of the underlying arrangement that resulted in the recognition of the intangible asset and the Company’s expected use of the intangible asset.
Non-amortized intangible assets
Intangible assets with indefinite lives are not amortized. The carrying values of trade names at
December 30, 2017
and
December 31, 2016
were as follows:
57
VALMONT INDUSTRIES, INC. AND SUBSIDIARIES
NOTES TO CONSOLIDATED FINANCIAL STATEMENTS (Continued)
Three-year period ended December 30, 2017
(Dollars in thousands, except per share amounts)
(7) GOODWILL AND INTANGIBLE ASSETS (Continued)
|
December 30,
2017 |
December 31,
2016 |
Year Acquired
|
|||||||
|
Webforge
|
$
|
9,432
|
|
$
|
8,624
|
|
2010
|
||
|
Valmont SM
|
9,973
|
|
8,765
|
|
2014
|
||||
|
Newmark
|
11,111
|
|
11,111
|
|
2004
|
||||
|
Ingal EPS/Ingal Civil Products
|
7,690
|
|
7,032
|
|
2010
|
||||
|
Donhad
|
5,801
|
|
5,305
|
|
2010
|
||||
|
Shakespeare
|
4,000
|
|
4,000
|
|
2014
|
||||
|
Other
|
16,846
|
|
15,948
|
|
|||||
|
$
|
64,853
|
|
$
|
60,785
|
|
||||
In its determination of these intangible assets as indefinite‑lived, the Company considered such factors as its expected future use of the intangible asset, legal, regulatory, technological and competitive factors that may impact the useful life or value of the intangible asset and the expected costs to maintain the value of the intangible asset. The Company expects that these intangible assets will maintain their value indefinitely. Accordingly, these assets are not amortized.
The Company's trade names were tested for impairment separately from goodwill in the third quarter of 2017. The values of the trade names were determined using the relief-from-royalty method. The Company determined that the value of its trade names were not impaired.
The increase in certain trade names in 2017 was due to currency translation effects.
In 2015, the Company recorded a $
5,830
impairment of the Webforge trade name (in ESS segment) and a $
1,100
impairment of the Industrial Galvanizing trade name (in Coatings segment).
Goodwill
The carrying amount of goodwill by segment as of
December 30, 2017
and
December 31, 2016
was as follows:
|
Engineered
Support Structures Segment |
Utility
Support Structures Segment |
Coatings
Segment |
Irrigation
Segment |
Other
|
Total
|
||||||||||||||||||
|
Gross Balance at December 31, 2016
|
$
|
157,689
|
|
$
|
88,680
|
|
$
|
75,791
|
|
$
|
19,359
|
|
$
|
17,487
|
|
$
|
356,002
|
|
|||||
|
Accumulated impairment losses
|
(18,670
|
)
|
—
|
|
(16,222
|
)
|
—
|
|
—
|
|
(34,892
|
)
|
|||||||||||
|
Balance at December 31, 2016
|
$
|
139,019
|
|
$
|
88,451
|
|
$
|
59,569
|
|
$
|
19,611
|
|
$
|
14,460
|
|
$
|
321,110
|
|
|||||
|
Acquisitions
|
3,449
|
|
—
|
|
—
|
|
—
|
|
—
|
|
3,449
|
|
|||||||||||
|
Foreign currency translation
|
8,938
|
|
1,797
|
|
905
|
|
167
|
|
1,354
|
|
13,161
|
|
|||||||||||
|
Balance at December 30, 2017
|
$
|
151,406
|
|
$
|
90,248
|
|
$
|
60,474
|
|
$
|
19,778
|
|
$
|
15,814
|
|
$
|
337,720
|
|
|||||
58
VALMONT INDUSTRIES, INC. AND SUBSIDIARIES
NOTES TO CONSOLIDATED FINANCIAL STATEMENTS (Continued)
Three-year period ended December 30, 2017
(Dollars in thousands, except per share amounts)
(7) GOODWILL AND INTANGIBLE ASSETS (Continued)
|
Engineered
Support Structures Segment |
Utility
Support Structures Segment |
Coatings
Segment |
Irrigation
Segment |
Other
|
Total
|
||||||||||||||||||
|
Gross Balance at December 26, 2015
|
$
|
170,341
|
|
$
|
88,680
|
|
$
|
75,941
|
|
$
|
19,359
|
|
$
|
17,487
|
|
$
|
371,808
|
|
|||||
|
Accumulated impairment losses
|
(18,670
|
)
|
—
|
|
(16,222
|
)
|
—
|
|
—
|
|
(34,892
|
)
|
|||||||||||
|
Balance at December 26, 2015
|
151,671
|
|
88,680
|
|
59,719
|
|
19,359
|
|
17,487
|
|
336,916
|
|
|||||||||||
|
Foreign currency translation
|
(12,652
|
)
|
(229
|
)
|
(150
|
)
|
252
|
|
(3,027
|
)
|
(15,806
|
)
|
|||||||||||
|
Balance at December 31, 2016
|
$
|
139,019
|
|
$
|
88,451
|
|
$
|
59,569
|
|
$
|
19,611
|
|
$
|
14,460
|
|
$
|
321,110
|
|
|||||
The Company’s annual impairment test of goodwill was performed during the third quarter of 2017 and it was determined that the goodwill on the consolidated balance sheet was not impaired.
In fiscal 2015, the Company recognized a
$16,222
impairment charge which represented all of the goodwill on the APAC Coatings reporting unit. The forecast for lower prices for oil and natural gas required an interim step 2 test for our Access Systems reporting unit during the fourth quarter of 2015. Accordingly, the Company recorded a
$18,670
impairment of Access System's goodwill.
(8) BANK CREDIT ARRANGEMENTS
The Company maintains various lines of credit for short-term borrowings totaling
$113,437
at
December 30, 2017
. As of
December 30, 2017
and December 31, 2016,
$161
and
$0
was outstanding, respectively. The interest rates charged on these lines of credit vary in relation to the banks’ costs of funds. The unused and available borrowings under the lines of credit were
$113,276
at
December 30, 2017
. The lines of credit can be modified at any time at the option of the banks. The Company pays no fees in connection with these lines of credit. In addition to the lines of credit, the Company also maintains other short-term bank loans. The weighted average interest rate on short-term borrowings was
5.00%
at December 30, 2017. Other notes payable of
$161
and
$746
were outstanding at
December 30, 2017
and
December 31, 2016
, respectively.
(9) INCOME TAXES
Earnings before income taxes and equity in earnings of nonconsolidated subsidiaries are as follows:
|
2017
|
2016
|
2015
|
|||||||||
|
United States
|
$
|
152,372
|
|
$
|
136,682
|
|
$
|
99,175
|
|
||
|
Foreign
|
76,092
|
|
83,772
|
|
(6,168
|
)
|
|||||
|
$
|
228,464
|
|
$
|
220,454
|
|
$
|
93,007
|
|
|||
The 2017 Tax Act was enacted in December 2017 which comprised a number of changes to the U.S. Internal Revenue Code that impact corporations beginning in 2018; 1) a reduction in the statutory federal corporate income tax rate from 35% to 21%, 2) limiting or eliminating certain tax deductions, and 3) changing the taxation of unremitted foreign earnings. The Company estimated and recognized approximately $
41,935
of tax expense for the 2017 Tax Act. The SEC staff issued SAB 118, which provides guidance on accounting for the tax effects of the 2017 Tax Act (see footnote 1).
The Company's accounting for the following element of the 2017 Tax Act is complete:
Reduction of U.S. federal corporate tax rate
: The 2017 Tax Act reduces the corporate tax rate to 21 percent, effective January 1, 2018. Consequently, we have recorded a decrease related to deferred taxes of
$20,372
, with a corresponding net adjustment to deferred income tax expense for the year ended December 30, 2017.
59
VALMONT INDUSTRIES, INC. AND SUBSIDIARIES
NOTES TO CONSOLIDATED FINANCIAL STATEMENTS (Continued)
Three-year period ended December 30, 2017
(Dollars in thousands, except per share amounts)
(9) INCOME TAXES (Continued)
The Company's accounting for the following elements of the 2017 Tax Act is provisional. However, reasonable estimates of certain effects were made and, therefore, the Company recorded the following:
Deemed Repatriation transition tax
: The Deemed Repatriation transition tax (“Transition Tax”) is a tax on previously untaxed accumulated and current earnings and profits (“E&P”) of certain of our foreign subsidiaries, which subjected the Company's unremitted foreign earnings of approximately
$400,000
to tax at certain specified rates less associated foreign tax credits. To determine the amount of the Transition Tax, the Company determined, in addition to other factors, the amount of post-1986 E&P of the relevant subsidiaries, as well as the amount of non-U.S. income taxes paid on such earnings. The Company was able to make a reasonable estimate of the Transition Tax and recorded a provisional Transition Tax obligation of
$9,890
. The federal portion of this is payable over eight (8) years. However, the Company may adjust this amount in 2018 to more precisely compute the amount of the Transition Tax after assessing additional implementation guidance from the IRS, state tax authorities, the SEC, the FASB, or the Joint Committee on Taxation. The Company previously considered the earnings in our non-U.S. subsidiaries to be indefinitely reinvested and, accordingly, recorded no related deferred income taxes.
Indefinite reinvestment assertion:
The Company reassessed its position with respect to previously untaxed accumulated foreign earnings in its non-U.S. subsidiaries. The Company has taken the position that earnings subject to the Transition Tax are not indefinitely reinvested. The Company was able to make a reasonable estimate and recorded a provisional amount of the deferred income taxes for foreign withholding taxes and U.S. state income taxes of
$10,373
and
$1,300
, respectively. However, the Company may adjust this amount in 2018 to more precisely compute the amount of the Transition Tax after assessing additional implementation guidance. The Company also continues to gather additional information to determine its permanently reinvested position with respect to future foreign earnings.
Income tax expense (benefit) consists of:
|
2017
|
2016
|
2015
|
|||||||||
|
Current:
|
|||||||||||
|
Federal
|
$
|
49,324
|
|
$
|
41,539
|
|
$
|
23,130
|
|
||
|
State
|
4,415
|
|
5,467
|
|
4,431
|
|
|||||
|
Foreign
|
12,880
|
|
19,123
|
|
15,077
|
|
|||||
|
66,619
|
|
66,129
|
|
42,638
|
|
||||||
|
Non-current:
|
(229
|
)
|
(381
|
)
|
(69
|
)
|
|||||
|
Deferred:
|
|||||||||||
|
Federal
|
(9,626
|
)
|
8,504
|
|
3,382
|
|
|||||
|
State
|
(385
|
)
|
202
|
|
(333
|
)
|
|||||
|
Foreign
|
49,766
|
|
(32,391
|
)
|
1,809
|
|
|||||
|
39,755
|
|
(23,685
|
)
|
4,858
|
|
||||||
|
$
|
106,145
|
|
$
|
42,063
|
|
$
|
47,427
|
|
|||
60
VALMONT INDUSTRIES, INC. AND SUBSIDIARIES
NOTES TO CONSOLIDATED FINANCIAL STATEMENTS (Continued)
Three-year period ended December 30, 2017
(Dollars in thousands, except per share amounts)
(9) INCOME TAXES (Continued)
The reconciliations of the statutory federal income tax rate and the effective tax rate follows:
|
2017
|
2016
|
2015
|
||||||
|
Statutory federal income tax rate
|
35.0
|
%
|
35.0
|
%
|
35.0
|
%
|
||
|
State income taxes, net of federal benefit
|
1.4
|
|
1.7
|
|
3.1
|
|
||
|
Carryforwards, credits and changes in valuation allowances
|
(1.4
|
)
|
2.9
|
|
(0.1
|
)
|
||
|
Foreign tax rate differences
|
(4.1
|
)
|
(4.8
|
)
|
(5.7
|
)
|
||
|
Changes in unrecognized tax benefits
|
(0.1
|
)
|
(0.2
|
)
|
(0.1
|
)
|
||
|
Domestic production activities deduction
|
(2.1
|
)
|
(2.0
|
)
|
(3.8
|
)
|
||
|
Goodwill impairment
|
—
|
|
—
|
|
11.3
|
|
||
|
UK tax rate reduction
|
—
|
|
1.0
|
|
7.7
|
|
||
|
Reversal of contingent liability
|
—
|
|
(2.2
|
)
|
—
|
|
||
|
UK defined benefit pension plan
|
—
|
|
(14.6
|
)
|
—
|
|
||
|
Effects of 2017 Tax Act
|
18.4
|
|
—
|
|
—
|
|
||
|
Other
|
(0.6
|
)
|
2.3
|
|
3.6
|
|
||
|
46.5
|
%
|
19.1
|
%
|
51.0
|
%
|
|||
Fiscal 2016 includes
$32,450
of deferred income tax benefit attributable to the re-measurement of the deferred tax asset related to the Company's U.K. defined benefit pension plan. This item arose from a 2016 international legal reorganization executed to better reflect the Company's operational business strategies. The Company considered many factors in effecting this realignment, including streamlining treasury functions, creating a platform for future growth, and capital allocation considerations. In addition, in fiscal 2016 the Company recorded a
$9,888
valuation allowance against a tax credit which is not more likely than not to be realized. The reversal of a
$16,591
contingent non-current liability in 2016 was not taxable.
Deferred income taxes reflect the net tax effects of (a) temporary differences between the carrying amounts of assets and liabilities for financial reporting purposes and the amounts used for income tax purposes, and (b) operating loss and tax credit carryforwards. The tax effects of significant items comprising the Company’s net deferred income tax liabilities are as follows:
61
VALMONT INDUSTRIES, INC. AND SUBSIDIARIES
NOTES TO CONSOLIDATED FINANCIAL STATEMENTS (Continued)
Three-year period ended December 30, 2017
(Dollars in thousands, except per share amounts)
(9) INCOME TAXES (Continued)
|
2017
|
2016
|
||||||
|
Deferred income tax assets:
|
|||||||
|
Accrued expenses and allowances
|
$
|
13,373
|
|
$
|
16,549
|
|
|
|
Accrued insurance
|
818
|
|
1,071
|
|
|||
|
Tax credits and loss carryforwards
|
54,521
|
|
104,439
|
|
|||
|
Defined benefit pension liability
|
47,459
|
|
80,425
|
|
|||
|
Inventory allowances
|
3,433
|
|
1,385
|
|
|||
|
Accrued warranty
|
4,602
|
|
9,436
|
|
|||
|
Deferred compensation
|
29,421
|
|
37,988
|
|
|||
|
Gross deferred income tax assets
|
153,627
|
|
251,293
|
|
|||
|
Valuation allowance
|
(27,864
|
)
|
(81,923
|
)
|
|||
|
Net deferred income tax assets
|
125,763
|
|
169,370
|
|
|||
|
Deferred income tax liabilities:
|
|||||||
|
Work in progress
|
1,805
|
|
2,161
|
|
|||
|
Property, plant and equipment
|
26,826
|
|
37,961
|
|
|||
|
Intangible assets
|
39,613
|
|
50,405
|
|
|||
|
Withholding taxes
|
11,673
|
|
—
|
|
|||
|
Other liabilities
|
1,819
|
|
6,164
|
|
|||
|
Total deferred income tax liabilities
|
81,736
|
|
96,691
|
|
|||
|
Net deferred income tax asset
|
$
|
44,027
|
|
$
|
72,679
|
|
|
Deferred income tax assets (liabilities) are presented as follows on the Consolidated Balance Sheets:
|
Balance Sheet Caption
|
2017
|
2016
|
|||||
|
Other assets
|
$
|
78,933
|
|
$
|
108,482
|
|
|
|
Deferred income taxes
|
(34,906
|
)
|
(35,803
|
)
|
|||
|
Net deferred income tax asset
|
$
|
44,027
|
|
$
|
72,679
|
|
|
Management of the Company has reviewed recent operating results and projected future operating results. The Company's belief that realization of its net deferred tax assets is more likely than not is based on, among other factors, changes in operations that have occurred in recent years and available tax planning strategies. At
December 30, 2017
and
December 31, 2016
respectively, there were
$54,521
and
$104,439
relating to tax credits and loss carryforwards. During 2017, several dormant UK legal entities were placed in liquidation resulting in a reduction of the capital loss carryforward of $
60,691
. This reduction was fully offset by a reduction in the related valuation allowance.
Valuation allowances have been established for certain losses that reduce deferred tax assets to an amount that will, more likely than not, be realized. The deferred tax assets at
December 30, 2017
that are associated with tax loss and tax credit carryforwards not reduced by valuation allowances expire in periods starting 2018.
Uncertain tax positions included in other non-current liabilities are evaluated in a two-step process, whereby (1) the Company determines whether it is more likely than not that the tax positions will be sustained based on the technical merits of the position and (2) for those tax positions that meet the more likely than not recognition threshold, the Company would recognize the largest amount of tax benefit that is greater than fifty percent likely to be realized upon ultimate settlement with the related tax authority.
62
VALMONT INDUSTRIES, INC. AND SUBSIDIARIES
NOTES TO CONSOLIDATED FINANCIAL STATEMENTS (Continued)
Three-year period ended December 30, 2017
(Dollars in thousands, except per share amounts)
(9) INCOME TAXES (Continued)
The following summarizes the activity related to our unrecognized tax benefits in
2017
and
2016
, in thousands:
|
2017
|
2016
|
||||||
|
Gross unrecognized tax benefits—beginning of year
|
$
|
3,400
|
|
$
|
3,876
|
|
|
|
Gross increases—tax positions in prior period
|
5
|
|
99
|
|
|||
|
Gross increases—current‑period tax positions
|
1,044
|
|
695
|
|
|||
|
Settlements with taxing authorities
|
(65
|
)
|
(105
|
)
|
|||
|
Lapse of statute of limitations
|
(1,188
|
)
|
(1,165
|
)
|
|||
|
Gross unrecognized tax benefits—end of year
|
$
|
3,196
|
|
$
|
3,400
|
|
|
There are approximately
$777
of uncertain tax positions for which reversal is reasonably possible during the next 12 months due to the closing of the statute of limitations. The nature of these uncertain tax positions is generally the computation of a tax deduction or tax credit. During 2017, the Company recorded a reduction of its gross unrecognized tax benefit of
$1,188
with
$772
recorded as a reduction of income tax expense, due to the expiration of statutes of limitation in the United States. During 2016, the Company recorded a reduction of its gross unrecognized tax benefit of
$1,165
, with
$810
recorded as a reduction of its income tax expense, due to the expiration of statutes of limitation in the United States. In addition to these amounts, there was an aggregate of
$187
and
$192
of interest and penalties at
December 30, 2017
and
December 31, 2016
, respectively. The Company’s policy is to record interest and penalties directly related to income taxes as income tax expense in the Consolidated Statements of Earnings.
The Company files income tax returns in the U.S. and various states as well as foreign jurisdictions. Tax years 2014 and forward remain open under U.S. statutes of limitation. The total amount of unrecognized tax benefits that, if recognized, would affect the effective tax rate was
$3,059
and
$3,328
at
December 30, 2017
and
December 31, 2016
, respectively.
Long-term debt is as follows:
|
December 30,
2017 |
December 31,
2016 |
||||||
|
5.00% senior unsecured notes due 2044(a)
|
$
|
250,000
|
|
$
|
250,000
|
|
|
|
5.25% senior unsecured notes due 2054(b)
|
250,000
|
|
250,000
|
|
|||
|
Unamortized discount on 5.00% and 5.25% senior unsecured notes (a)(b)
|
(4,312
|
)
|
(4,360
|
)
|
|||
|
6.625% senior unsecured notes due 2020(c)
|
250,200
|
|
250,200
|
|
|||
|
Unamortized premium on 6.625% senior unsecured notes(c)
|
2,545
|
|
3,557
|
|
|||
|
Revolving credit agreement (d)
|
—
|
|
—
|
|
|||
|
IDR Bonds(e)
|
8,500
|
|
8,500
|
|
|||
|
Other notes
|
4,033
|
|
4,395
|
|
|||
|
Debt issuance costs
|
(6,112
|
)
|
(6,646
|
)
|
|||
|
Long-term debt
|
754,854
|
|
755,646
|
|
|||
|
Less current installments of long-term debt
|
966
|
|
851
|
|
|||
|
Long-term debt, excluding current installments
|
$
|
753,888
|
|
$
|
754,795
|
|
|
63
VALMONT INDUSTRIES, INC. AND SUBSIDIARIES
NOTES TO CONSOLIDATED FINANCIAL STATEMENTS (Continued)
Three-year period ended December 30, 2017
(Dollars in thousands, except per share amounts)
(10) LONG-TERM DEBT (Continued)
|
(a)
|
The
5.00%
senior unsecured notes due 2044 include an aggregate principal amount of
$250,000
on which interest is paid and an unamortized discount balance of
$1,102
at December 30, 2017. The notes bear interest at
5.000%
per annum and are due on October 1, 2044. The discount will be amortized and recognized as interest expense as interest payments are made over the term of the notes. The notes may be repurchased prior to maturity in whole, or in part, at any time at
100%
of their principal amount plus a make-whole premium and accrued and unpaid interest. These notes are guaranteed by certain subsidiaries of the Company.
|
|
(b)
|
The
5.25%
senior unsecured notes due 2054 include an aggregate principal amount of
$250,000
on which interest is paid and an unamortized discount balance of
$3,210
at December 30, 2017. The notes bear interest at
5.250%
per annum and are due on October 1, 2054. The discount will be amortized and recognized as interest expense as interest payments are made over the term of the notes. The notes may be repurchased prior to maturity in whole, or in part, at any time at
100%
of their principal amount plus a make-whole premium and accrued and unpaid interest. These notes are guaranteed by certain subsidiaries of the Company.
|
|
(c)
|
The
6.625%
senior unsecured notes due 2020, following a partial tender offer in September 2014, include a remaining aggregate principal amount of
$250,200
on which interest is paid and an unamortized premium balance of $
2,545
at December 30, 2017. The notes bear interest at
6.625%
per annum and are due on April 1, 2020. The remaining premium will be amortized against interest expense as interest payments are made over the term of the notes. The notes may be repurchased prior to maturity in whole, or in part, at any time at
100%
of their principal amount plus a make-whole premium accrued and unpaid interest. These notes are guaranteed by certain subsidiaries of the Company.
|
|
(d)
|
On October 18, 2017, the Company amended and restated its revolving credit facility with JP Morgan Chase Bank, N.A., as Administrative Agent, and the other lenders party thereto. The credit facility provides for
$600,000
of committed unsecured revolving credit loans. The Company may increase the credit facility by up to an additional
$200,000
at any time, subject to lenders increasing the amount of their commitments. This amendment extends the maturity date of the credit facility from October 17, 2019 to October 18, 2022 and increases the available borrowings in foreign currencies from
$200 million
to
$400 million
. The interest rate on the borrowings will be, at the Company's option, either:
|
|
(i)
|
LIBOR (based on a 1, 2, 3 or 6 month interest period, as selected by the Company)
plus
100
to
162.5
basis points, depending on the credit rating of the Company's senior debt published by Standard & Poor's Rating Services and Moody's Investors Service, Inc., or;
|
|
(ii)
|
the higher of
|
|
•
|
the
prime lending rate
,
|
|
•
|
the
Federal Funds rate
plus
50
basis points, and
|
|
•
|
LIBOR (based on a
1 month
interest period) plus
100
basis points,
|
plus, in each case,
0
to
62.5
basis points, depending on the credit rating of the Company's senior debt published by Standard & Poor's Rating Services and Mood's Investors Service, Inc.
64
VALMONT INDUSTRIES, INC. AND SUBSIDIARIES
NOTES TO CONSOLIDATED FINANCIAL STATEMENTS (Continued)
Three-year period ended December 30, 2017
(Dollars in thousands, except per share amounts)
(10) LONG-TERM DEBT (Continued)
At December 30, 2017, the Company had
no
outstanding borrowings under the revolving credit facility. The revolving credit facility has a maturity date of October 18, 2022 and contains certain financial covenants that may limit additional borrowing capability under the agreement. At December 30, 2017, the Company had the ability to borrow
$585,238
under this facility, after consideration of standby letters of credit of
$14,762
associated with certain insurance obligations. We also maintain certain short-term bank lines of credit totaling
$113,437
,
$113,276
of which was unused at December 30, 2017.
|
(e)
|
The Industrial Development Revenue Bonds were issued to finance the construction of a manufacturing facility in Jasper, Tennessee. Variable interest is payable until final maturity on June 1, 2025. The effective interest rates at
December 30, 2017
and
December 31, 2016
were
2.00%
and
1.48%
respectively.
|
The lending agreements include certain maintenance covenants, including financial leverage and interest coverage. The Company was in compliance with all financial debt covenants at
December 30, 2017
. The minimum aggregate maturities of long-term debt for each of the five years following
2017
are:
$966
,
$765
,
$250,969
,
$773
and
$582
.
The obligations arising under the
5.00%
senior unsecured notes due 2044, the
5.25%
senior unsecured notes due 2054, the
6.625%
senior unsecured notes due 2020, and the revolving credit facility are guaranteed by the Company and its wholly-owned subsidiaries PiRod, Inc., Valmont Coatings, Inc., Valmont Newmark, Inc., and Valmont Queensland Pty. Ltd.
(11) STOCK-BASED COMPENSATION
The Company maintains stock‑based compensation plans approved by the shareholders, which provide that the Human Resource Committee of the Board of Directors may grant incentive stock options, nonqualified stock options, stock appreciation rights, restricted stock awards, restricted stock units, and bonuses of common stock. At
December 30, 2017
,
529,356
shares of common stock remained available for issuance under the plans. Shares and options issued and available are subject to changes in capitalization. The Company’s policy is to issue shares upon exercise of stock options from treasury shares held by the Company.
Under the stock option plans, the exercise price of each option equals the market price at the time of the grant. Options vest beginning on the first anniversary of the grant in equal amounts over
three
years or on the fifth anniversary of the grant. Expiration of grants is seven years from the date of grant. The Company recorded
$5,137
,
$5,782
and
$5,137
of compensation expense (included in selling, general and administrative expenses) in the
2017
,
2016
and
2015
fiscal years, respectively. The associated tax benefits recorded in the
2017
,
2016
and
2015
fiscal years was
$1,952
,
$2,197
and
$1,952
, respectively.
At
December 30, 2017
, the amount of unrecognized stock option compensation expense, to be recognized over a weighted average period of
2.03
years, was approximately
$7,588
.
The Company uses a binomial option pricing model to value its stock options. The fair value of each option grant made in
2017
,
2016
and
2015
was estimated using the following assumptions:
|
2017
|
2016
|
2015
|
||||||
|
Expected volatility
|
33.76
|
%
|
33.88
|
%
|
34.13
|
%
|
||
|
Risk-free interest rate
|
2.12
|
%
|
1.83
|
%
|
1.58
|
%
|
||
|
Expected life from vesting date
|
3.0 yrs
|
|
3.0 yrs
|
|
3.0 yrs
|
|
||
|
Dividend yield
|
1.17
|
%
|
1.13
|
%
|
0.94
|
%
|
||
65
VALMONT INDUSTRIES, INC. AND SUBSIDIARIES
NOTES TO CONSOLIDATED FINANCIAL STATEMENTS (Continued)
Three-year period ended December 30, 2017
(Dollars in thousands, except per share amounts)
(11) STOCK-BASED COMPENSATION (Continued)
Following is a summary of the activity of the stock plans during
2015
,
2016
and
2017
:
|
Number of
Shares |
Weighted
Average Exercise Price |
Weighted
Average Remaining Contractual Term |
Aggregate
Intrinsic Value |
|||||||||
|
Outstanding at December 27, 2014
|
768,595
|
|
$
|
113.72
|
|
|||||||
|
Granted
|
291,708
|
|
104.89
|
|
||||||||
|
Exercised
|
(169,493
|
)
|
74.37
|
|
||||||||
|
Forfeited
|
(41,201
|
)
|
137.02
|
|
||||||||
|
Outstanding at December 26, 2015
|
849,609
|
|
$
|
117.42
|
|
5.18
|
$
|
4,536
|
|
|||
|
Options vested or expected to vest at December 26, 2015
|
818,300
|
|
$
|
117.61
|
|
5.13
|
4,456
|
|
||||
|
Options exercisable at December 26, 2015
|
409,068
|
|
$
|
119.43
|
|
3.74
|
3,376
|
|
||||
The weighted average per share fair value of options granted during
2015
was $
27.91
.
|
Number of
Shares |
Weighted
Average Exercise Price |
Weighted
Average Remaining Contractual Term |
Aggregate
Intrinsic Value |
|||||||||
|
Outstanding at December 26, 2015
|
849,609
|
|
$
|
117.42
|
|
|||||||
|
Granted
|
85,092
|
|
151.37
|
|
||||||||
|
Exercised
|
(109,893
|
)
|
101.69
|
|
||||||||
|
Forfeited
|
(31,635
|
)
|
129.36
|
|
||||||||
|
Outstanding at December 31, 2016
|
793,173
|
|
$
|
122.77
|
|
4.78
|
$
|
16,640
|
|
|||
|
Options vested or expected to vest at December 31, 2016
|
774,139
|
|
$
|
124.18
|
|
4.75
|
16,200
|
|
||||
|
Options exercisable at December 31, 2016
|
469,844
|
|
$
|
123.75
|
|
3.96
|
9,056
|
|
||||
The weighted average per share fair value of options granted during
2016
was $
40.00
.
|
Number of
Shares |
Weighted
Average Exercise Price |
Weighted
Average Remaining Contractual Term |
Aggregate
Intrinsic Value |
|||||||||
|
Outstanding at December 31, 2016
|
793,173
|
|
$
|
122.77
|
|
|||||||
|
Granted
|
67,965
|
|
164.35
|
|
||||||||
|
Exercised
|
(284,574
|
)
|
121.92
|
|
||||||||
|
Forfeited
|
(5,942
|
)
|
104.26
|
|
||||||||
|
Outstanding at December 30, 2017
|
570,622
|
|
$
|
128.34
|
|
4.66
|
$
|
21,806
|
|
|||
|
Options vested or expected to vest at December 30, 2017
|
558,114
|
|
$
|
128.00
|
|
4.63
|
21,517
|
|
||||
|
Options exercisable at December 30, 2017
|
351,794
|
|
$
|
123.90
|
|
3.94
|
15,005
|
|
||||
The weighted average per share fair value of options granted during
2017
was $
43.68
.
66
VALMONT INDUSTRIES, INC. AND SUBSIDIARIES
NOTES TO CONSOLIDATED FINANCIAL STATEMENTS (Continued)
Three-year period ended December 30, 2017
(Dollars in thousands, except per share amounts)
(11) STOCK-BASED COMPENSATION (Continued)
Following is a summary of the status of stock options outstanding at
December 30, 2017
:
|
Outstanding and Exercisable By Price Range
|
||||||||||||||||
|
Options Outstanding
|
Options Exercisable
|
|||||||||||||||
|
Exercise Price
Range |
Number
|
Weighted
Average Remaining Contractual Life |
Weighted
Average Exercise Price |
Number
|
Weighted
Average Exercise Price |
|||||||||||
|
$83.94 - 114.11
|
239,480
|
|
4.71 years
|
$
|
103.23
|
|
147,216
|
|
$
|
102.42
|
|
|||||
|
$120.91 - 136.42
|
127,901
|
|
3.22 years
|
133.88
|
|
125,459
|
|
134.07
|
|
|||||||
|
$142.67 - 164.35
|
203,241
|
|
5.53 years
|
154.42
|
|
79,119
|
|
147.73
|
|
|||||||
|
570,622
|
|
351,794
|
|
|||||||||||||
In accordance with shareholder-approved plans, the Human Resource Committee of the Board of Directors may grant stock under various stock‑based compensation arrangements, including restricted stock awards, restricted stock units, and stock issued in lieu of cash bonuses. Under such arrangements, stock is issued without direct cost to the employee. The restricted stock units are settled in Company stock when the restriction period ends. During fiscal
2017
,
2016
and
2015
, the Company granted restricted stock units to directors and certain management employees as follows (which are not included in the above stock plan activity tables):
|
2017
|
2016
|
2015
|
|||||||||
|
Shares issued
|
62,160
|
|
58,961
|
|
47,038
|
|
|||||
|
Weighted‑average per share price on grant date
|
$
|
163.18
|
|
$
|
150.48
|
|
$
|
108.97
|
|
||
|
Recognized compensation expense
|
$
|
5,569
|
|
$
|
4,069
|
|
$
|
4,511
|
|
||
At
December 30, 2017
the amount of deferred stock‑based compensation granted, to be recognized over a weighted‑average period of
2.03
years, was approximately
$15,971
.
67
VALMONT INDUSTRIES, INC. AND SUBSIDIARIES
NOTES TO CONSOLIDATED FINANCIAL STATEMENTS (Continued)
Three-year period ended December 30, 2017
(Dollars in thousands, except per share amounts)
(12) EARNINGS PER SHARE
The following table provides a reconciliation between Basic and Diluted earnings per share (EPS):
|
Basic EPS
|
Dilutive
Effect of Stock Options |
Diluted EPS
|
|||||||||
|
2017:
|
|||||||||||
|
Net earnings attributable to Valmont Industries, Inc.
|
$
|
116,240
|
|
$
|
—
|
|
$
|
116,240
|
|
||
|
Weighted average shares outstanding (000's)
|
22,520
|
|
218
|
|
22,738
|
|
|||||
|
Per share amount
|
$
|
5.16
|
|
$
|
0.05
|
|
$
|
5.11
|
|
||
|
2016:
|
|||||||||||
|
Net earnings attributable to Valmont Industries, Inc.
|
$
|
173,232
|
|
$
|
—
|
|
$
|
173,232
|
|
||
|
Weighted average shares outstanding (000's)
|
22,562
|
|
147
|
|
22,709
|
|
|||||
|
Per share amount
|
$
|
7.68
|
|
$
|
0.05
|
|
$
|
7.63
|
|
||
|
2015:
|
|||||||||||
|
Net earnings attributable to Valmont Industries, Inc.
|
$
|
40,117
|
|
$
|
—
|
|
$
|
40,117
|
|
||
|
Weighted average shares outstanding (000's)
|
23,288
|
|
117
|
|
23,405
|
|
|||||
|
Per share amount
|
$
|
1.72
|
|
$
|
0.01
|
|
$
|
1.71
|
|
||
Basic and diluted net earnings and earnings per share in fiscal 2017 were impacted by the 2017 Tax Act enacted on December 22, 2017 by the U.S. government. We remeasured our U.S. deferred income tax assets using a blended rate of
25.0%
recognizing deferred income tax expense of approximately
$20,372
(
$0.90
per share). We also recorded a provision charge of approximately
$9,890
(
$0.44
per share) of income tax expense for the deemed repatriation transition tax and
$11,673
(
$0.51
per share) of deferred expenses related to foreign withholding taxes and U.S. state income taxes.
Basic and diluted net earnings and earnings per share in fiscal 2016 included a deferred income tax benefit of
$30,590
(
$1.35
per share) primarily attributable to the re-measurement of the deferred tax asset related to the Company's U.K. defined benefit pension plan. In addition, fiscal 2016 included
$9,888
(
$0.44
per share) recorded as a valuation allowance against a tax credit asset. Finally, fiscal 2016 included the reversal of a contingent liability that was recognized as part of the Delta purchase accounting of
$16,591
(
$0.73
per share) which was not taxable. Fiscal 2015 included impairments of goodwill and intangible assets of
$40,140
after-tax (
$1.72
per share), asset impairments arising from restructuring activities of
$14,545
after-tax (
$0.62
per share), and
$13,622
of cash restructuring expenses (
$0.58
per share).
Earnings per share are computed independently for each of the quarters. Therefore, the sum of the quarterly earnings per share may not equal the total for the year.
At the end of fiscal years
2017
,
2016
, and
2015
there were
0
,
197,303
, and
426,388
outstanding stock options, respectively, with exercise prices exceeding the market price of common stock that were excluded from the computation of diluted earnings per share, respectively.
68
VALMONT INDUSTRIES, INC. AND SUBSIDIARIES
NOTES TO CONSOLIDATED FINANCIAL STATEMENTS (Continued)
Three-year period ended December 30, 2017
(Dollars in thousands, except per share amounts)
(13) EMPLOYEE RETIREMENT SAVINGS PLAN
Established under Internal Revenue Code Section 401(k), the Valmont Employee Retirement Savings Plan (“VERSP”) is a defined contribution plan available to all eligible employees. Participants can elect to contribute up to
50%
of annual pay, on a pretax and/or after-tax basis. The Company also makes contributions to the Plan and a non-qualified deferred compensation plan for certain Company executives. The
2017
,
2016
and
2015
Company contributions to these plans amounted to approximately
$11,800
,
$10,900
and
$11,700
respectively.
The Company sponsors a fully‑funded, non-qualified deferred compensation plan for certain Company executives who otherwise would be limited in receiving company contributions into VERSP under Internal Revenue Service regulations. The invested assets and related liabilities of these participants were approximately
$39,091
and
$35,784
at
December 30, 2017
and
December 31, 2016
, respectively. Such amounts are included in “Other assets” and “Deferred compensation” on the Consolidated Balance Sheets. Amounts distributed from the Company’s non-qualified deferred compensation plan to participants under the transition rules of section 409A of the Internal Revenue Code were approximately
$2,672
and
$5,317
at
December 30, 2017
and
December 31, 2016
, respectively. All distributions were made in cash.
(14) DISCLOSURES ABOUT THE FAIR VALUE OF FINANCIAL INSTRUMENTS
The carrying amount of cash and cash equivalents, receivables, accounts payable, notes payable to banks and accrued expenses approximate fair value because of the short maturity of these instruments. The fair values of each of the Company’s long-term debt instruments are based on the amount of future cash flows associated with each instrument discounted using the Company’s current borrowing rate for similar debt instruments of comparable maturity (Level 2). The fair value estimates are made at a specific point in time and the underlying assumptions are subject to change based on market conditions. At
December 30, 2017
, the carrying amount of the Company’s long-term debt was
$754,854
with an estimated fair value of approximately
$799,258
. At
December 31, 2016
, the carrying amount of the Company’s long-term debt was
$755,646
with an estimated fair value of approximately
$731,633
.
For financial reporting purposes, a three‑level hierarchy for fair value measurements based upon the transparency of inputs to the valuation of an asset or liability as of the measurement date is used. Inputs refers broadly to the assumptions that market participants would use in pricing the asset or liability, including assumptions about risk. Financial assets and liabilities carried at fair value will be classified and disclosed in one of the following three categories:
|
•
|
Level 1: Quoted market prices in active markets for identical assets or liabilities.
|
|
•
|
Level 2: Observable market based inputs or unobservable inputs that are corroborated by market data.
|
|
•
|
Level 3: Unobservable inputs that are not corroborated by market data.
|
The categorization within the valuation hierarchy is based upon the lowest level of input that is significant to the fair value measurement. Following is a description of the valuation methodologies used for assets and liabilities measured at fair value.
Trading Securities: The assets and liabilities recorded for the investments held in the Valmont Deferred Compensation Plan of
$39,091
(
$35,784
in
2016
) represent mutual funds, invested in debt and equity securities, classified as trading securities, considering the employee’s ability to change investment allocation of their deferred compensation at any time. The Company's remaining ownership in Delta EMD Pty. Ltd. (JSE:DTA) of
$1,951
(
$2,016
in
2016
) is recorded at fair value at
December 30, 2017
. Quoted market prices are available for these securities in an active market and therefore categorized as a Level 1 input. These securities are included in Other Assets on the Consolidated Balance Sheets.
69
VALMONT INDUSTRIES, INC. AND SUBSIDIARIES
NOTES TO CONSOLIDATED FINANCIAL STATEMENTS (Continued)
Three-year period ended December 30, 2017
(Dollars in thousands, except per share amounts)
(14) DISCLOSURES ABOUT THE FAIR VALUE OF FINANCIAL INSTRUMENTS (Continued)
|
Fair Value Measurement Using:
|
|||||||||||||||
|
Carrying Value
December 30, 2017 |
Quoted Prices in
Active Markets for Identical Assets (Level 1) |
Significant Other
Observable Inputs (Level 2) |
Significant
Unobservable Inputs (Level 3) |
||||||||||||
|
Assets:
|
|||||||||||||||
|
Trading Securities
|
$
|
41,042
|
|
$
|
41,042
|
|
$
|
—
|
|
$
|
—
|
|
|||
|
Fair Value Measurement Using:
|
|||||||||||||||
|
Carrying Value
December 31, 2016 |
Quoted Prices in
Active Markets for Identical Assets (Level 1) |
Significant Other
Observable Inputs (Level 2) |
Significant
Unobservable Inputs (Level 3) |
||||||||||||
|
Assets:
|
|||||||||||||||
|
Trading Securities
|
$
|
37,800
|
|
$
|
37,800
|
|
$
|
—
|
|
$
|
—
|
|
|||
(15) DERIVATIVE FINANCIAL INSTRUMENTS
The Company manages risk from foreign currency rate risk related to foreign currency denominated transactions and from natural gas supply pricing. From time to time, the Company manages these risks using derivative financial instruments. Some of these derivative financial instruments are marked to market and recorded in the Company’s consolidated statements of earnings, while others may be accounted for as a fair value, cash flow, or net investment hedge. Derivative financial instruments have credit risk and market risk. To manage credit risk, the Company only enters into derivative transactions with counterparties who are recognized, stable multinational banks.
Natural Gas Prices:
Natural gas supplies to meet production requirements of production facilities are purchased at market prices. Natural gas market prices are volatile and the Company effectively fixes prices for a portion of its natural gas usage requirements of certain of its U.S. facilities through the use of swaps. These contracts reference physical natural gas prices or appropriate NYMEX futures contract prices. While there is a strong correlation between the NYMEX futures contract prices and the Company’s delivered cost of natural gas, the use of financial derivatives may not exactly offset the change in the price of physical gas. The contracts are traded in months forward and settlement dates are scheduled to coincide with gas purchases during that future period. The financial effects of these derivatives in 2017 and 2016 were minimal.
Interest Rate Fluctuations:
In prior years, the Company executed contracts to lock in the treasury rate related to the issuance of each of their unsecured notes due in 2020, 2044, and 2054. These contracts were executed to hedge the risk of potential fluctuations in the treasury rates which would change the amount of net proceeds received from the debt offering. As the benchmark rate component of the fixed rate debt issuance and the cash flow hedged risk is based on that same benchmark, each was deemed an effective hedge at inception. The settlement with each of the counterparties was recorded in accumulated other comprehensive income (loss) and at December 30, 2017, the Company has a
$2,545
deferred loss and a
$4,312
deferred gain related to the past settlement of these forward contracts. The amount is amortized as a reduction of interest expense (for the deferred gain) or an increase in interest expense (for the deferred loss) over the term of the debt.
Foreign Currency Fluctuations:
The Company operates in a number of different foreign countries and may enter into business transactions that are in currencies that are different from a given operation’s functional currency. In certain cases, the Company may enter into foreign currency exchange contracts to manage a portion of the foreign exchange risk associated with a receivable or payable denominated in a foreign currency, a forecasted transaction or a series of forecasted transactions denominated in a foreign currency, or an investment in foreign operations with a different functional currency.
70
VALMONT INDUSTRIES, INC. AND SUBSIDIARIES
NOTES TO CONSOLIDATED FINANCIAL STATEMENTS (Continued)
Three-year period ended December 30, 2017
(Dollars in thousands, except per share amounts)
(15) DERIVATIVE FINANCIAL INSTRUMENTS (Continued)
In July 2017, the Company
entered into two six-month foreign currency forward contracts which qualified as net investment hedges, in order to mitigate foreign currency risk on our grinding media business that is denominated in both Australian dollars and British pounds. The Company announced its intention to divest of this business in August 2017 and regulatory approval in Australia is currently pending. The forward contracts have a maturity date of January 2018 and a notional amount to sell British pounds and Australian dollars and receive
$24,059
and
$21,222
, respectively. The unrealized loss recorded at December 30, 2017 is
$826
(
$619
after tax) and is included in Accounts Payable on the Consolidated Balance Sheets. No ineffectiveness has resulted from the hedge and the balance is recorded in the Consolidated Statement of Other Comprehensive Income within gain/(loss) on hedging activities. When the forward contracts mature, the realized gain (loss) will be deferred in other comprehensive income (loss) where it will remain until the grinding media business is divested.
In 2016, the Company entered into a one-year foreign currency forward contract which qualified as a net investment hedge, in order to mitigate foreign currency risk on a portion of our investments denominated in British pounds. The forward contract had a notional amount to sell British pounds and receive
$44,000
, and matured in May 2017. The realized gain of
$5,123
(
$3,150
after tax)
has been deferred in other comprehensive income (loss) where it will remain until the Company's net investments in its British subsidiaries are divested. No ineffectiveness resulted from the hedge prior to its maturity.
(16) GUARANTEES
The Company’s product warranty accrual reflects management’s best estimate of probable liability under its product warranties. Historical product claims data is used to estimate the cost of product warranties at the time revenue is recognized.
Changes in the product warranty accrual, which is recorded in “Accrued expenses”, for the years ended
December 30, 2017
and
December 31, 2016
, were as follows:
|
2017
|
2016
|
||||||
|
Balance, beginning of period
|
$
|
26,538
|
|
$
|
36,653
|
|
|
|
Payments made
|
(26,097
|
)
|
(20,355
|
)
|
|||
|
Change in liability for warranties issued during the period
|
9,787
|
|
9,565
|
|
|||
|
Change in liability for pre-existing warranties
|
9,881
|
|
675
|
|
|||
|
Balance, end of period
|
$
|
20,109
|
|
$
|
26,538
|
|
|
(17) COMMITMENTS & CONTINGENCIES
Various claims and lawsuits are pending against Company and certain of its subsidiaries. The Company cannot fully determine the effect of all asserted and unasserted claims on its consolidated results of operations, financial condition, or liquidity. Where asserted and unasserted claims are considered probable and reasonably estimable, a liability has been recorded. We do not expect that any known lawsuits, claims, environmental costs, commitments, or contingent liabilities will have a material adverse effect on our consolidated results of operations, financial condition, or liquidity.
The Company established a provision in 2010 to address a pre-acquisition contingency which arose from the Delta acquisition and was recognized as part of the purchase accounting. The applicable statutes of limitations expired and the Company determined this contingent liability is remote. Therefore in 2016, the Company reduced "Other noncurrent liabilities" by
$16,591
, the amount of the provision, and recognized “Other" income.
71
VALMONT INDUSTRIES, INC. AND SUBSIDIARIES
NOTES TO CONSOLIDATED FINANCIAL STATEMENTS (Continued)
Three-year period ended December 30, 2017
(Dollars in thousands, except per share amounts)
(18) DEFINED BENEFIT RETIREMENT PLAN
Delta Ltd., a wholly-owned subsidiary of the Company, is the sponsor of the Delta Pension Plan ("Plan"). The Plan provides defined benefit retirement income to eligible employees in the United Kingdom. Pension retirement benefits to qualified employees are
1.67%
of final salary per year of service upon reaching the age of
65
years. This Plan has
no
active employees as members at
December 30, 2017
.
Funded Status
The Company recognizes the overfunded or underfunded status of the pension plan as an asset or liability. The funded status represents the difference between the projected benefit obligation (PBO) and the fair value of the plan assets. The PBO is the present value of benefits earned to date by plan participants, including the effect of assumed future salary increases (if applicable) and inflation. Plan assets are measured at fair value. Because the pension plan is denominated in British pounds sterling, the Company used exchange rates of
$1.234
/£ and
$1.349
/£ to translate the net pension liability into U.S. dollars at
December 31, 2016
and
December 30, 2017
, respectively. The net funded status of
$189,552
at December 30, 2017 is recorded as a noncurrent liability.
Projected Benefit Obligation and Fair Value of Plan Assets
—The accumulated benefit obligation (ABO) is the present value of benefits earned to date, assuming no future compensation growth.
As there are no active employees in the plan, the ABO is equal to the PBO for all years presented. The underfunded ABO represents the difference between the PBO and the fair value of plan assets. Changes in the PBO and fair value of plan assets for the pension plan for the period from December 31, 2015 to December 31, 2016 were as follows:
|
Projected
Benefit Obligation |
Plan
Assets |
Funded
status |
|||||||||
|
Fair Value at December 31, 2015
|
$
|
697,449
|
|
$
|
518,126
|
|
$
|
(179,323
|
)
|
||
|
Employer contributions
|
—
|
|
1,426
|
|
|||||||
|
Interest cost
|
23,496
|
|
—
|
|
|||||||
|
Actual return on plan assets
|
—
|
|
80,538
|
|
|||||||
|
Benefits paid
|
(17,792
|
)
|
(17,792
|
)
|
|||||||
|
Actuarial loss
|
125,765
|
|
—
|
|
|||||||
|
Currency translation
|
(132,781
|
)
|
(95,631
|
)
|
|||||||
|
Fair Value at December 31, 2016
|
$
|
696,137
|
|
$
|
486,667
|
|
$
|
(209,470
|
)
|
||
72
VALMONT INDUSTRIES, INC. AND SUBSIDIARIES
NOTES TO CONSOLIDATED FINANCIAL STATEMENTS (Continued)
Three-year period ended December 30, 2017
(Dollars in thousands, except per share amounts)
(18) DEFINED BENEFIT RETIREMENT PLAN (Continued)
Changes in the PBO and fair value of plan assets for the pension plan for the period from December 31, 2016 to December 31, 2017 were as follows:
|
Projected
Benefit Obligation |
Plan
Assets |
Funded
status |
|||||||||
|
Fair Value at December 31, 2016
|
$
|
696,137
|
|
$
|
486,667
|
|
$
|
(209,470
|
)
|
||
|
Employer contributions
|
—
|
|
40,245
|
|
|||||||
|
Interest cost
|
18,152
|
|
—
|
|
|||||||
|
Actual return on plan assets
|
—
|
|
40,842
|
|
|||||||
|
Benefits paid
|
(22,172
|
)
|
(22,172
|
)
|
|||||||
|
Actuarial loss
|
25,154
|
|
—
|
|
|||||||
|
Currency translation
|
66,030
|
|
48,167
|
|
|||||||
|
Fair Value at December 31, 2017
|
$
|
783,301
|
|
$
|
593,749
|
|
$
|
(189,552
|
)
|
||
Pre-tax amounts recognized in accumulated other comprehensive income (loss) as of December 30, 2017 and December 31, 2016 consisted of actuarial gains (losses):
|
Balance December 26, 2015
|
$
|
(106,959
|
)
|
|
Actuarial loss
|
(66,957
|
)
|
|
|
Currency translation gain
|
17,038
|
|
|
|
Balance December 31, 2016
|
(156,878
|
)
|
|
|
Actuarial loss
|
(1,789
|
)
|
|
|
Currency translation loss
|
(9,583
|
)
|
|
|
Balance December 30, 2017
|
$
|
(168,250
|
)
|
The estimated amount to be amortized from accumulated other comprehensive income into net periodic benefit cost in 2018 is approximately $2,982.
Assumptions
—The weighted-average actuarial assumptions used to determine the benefit obligation at December 31, 2017 and December 31, 2016 were as follows:
|
Percentages
|
2017
|
2016
|
|||
|
Discount rate
|
2.55
|
%
|
|
2.80
|
%
|
|
Salary increase
|
N/A
|
|
|
N/A
|
|
|
CPI inflation
|
2.20
|
%
|
|
2.25
|
%
|
|
RPI inflation
|
3.30
|
%
|
|
3.15
|
%
|
73
VALMONT INDUSTRIES, INC. AND SUBSIDIARIES
NOTES TO CONSOLIDATED FINANCIAL STATEMENTS (Continued)
Three-year period ended December 30, 2017
(Dollars in thousands, except per share amounts)
(18) DEFINED BENEFIT RETIREMENT PLAN (Continued)
Expense
Pension expense is determined based upon the annual service cost of benefits (the actuarial cost of benefits earned during a period) and the interest cost on those liabilities, less the expected return on plan assets. The expected long-term rate of return on plan assets is applied to the fair value of plan assets. Differences in actual experience in relation to assumptions are not recognized in net earnings immediately, but are deferred and, if necessary, amortized as pension expense.
The components of the net periodic pension expense for the fiscal years ended December 30, 2017 and December 31, 2016 were as follows:
|
2017
|
2016
|
|||||||
|
Net Periodic Benefit Cost:
|
||||||||
|
Interest cost
|
18,152
|
|
23,496
|
|
||||
|
Expected return on plan assets
|
(20,486
|
)
|
(22,986
|
)
|
||||
|
Amortization of actuarial loss
|
2,982
|
|
1,360
|
|
||||
|
Net periodic benefit expense (benefit)
|
$
|
648
|
|
$
|
1,870
|
|
||
Assumptions
—The weighted-average actuarial assumptions used to determine expense are as follows for fiscal 2017 and 2016:
|
Percentages
|
2017
|
2016
|
||||
|
Discount rate
|
2.80
|
%
|
3.75
|
%
|
||
|
Expected return on plan assets
|
4.22
|
%
|
5.15
|
%
|
||
|
CPI Inflation
|
2.25
|
%
|
2.15
|
%
|
||
|
RPI Inflation
|
3.35
|
%
|
3.35
|
%
|
||
The discount rate is based on the yields of AA-rated corporate bonds with durational periods similar to that of the pension liabilities. The expected return on plan assets is based on our asset allocation mix and our historical return, taking into account current and expected market conditions. Inflation is based on expected changes in the consumer price index or the retail price index in the U.K. depending on the relevant plan provisions.
Cash Contributions
The Company completed negotiations with Plan trustees in 2016 regarding annual funding for the Plan. The annual contributions into the Plan are
$13,490
(/£
10,000
) per annum as part of the Plan’s recovery plan, along with a contribution to cover the administrative costs of the Plan of approximately
$1,484
(/£
1,100
) per annum. The Company deferred its 2016 recovery plan contribution payment of £
10,000
, placing it into a restricted cash account. The restriction released in March 2017, when the Company contributed £
10,000
to the Plan. The Company also made its required £
10,000
annual contribution in March 2017 and prepaid the 2018 £
10,000
contribution in December 2017 to the Plan.
74
VALMONT INDUSTRIES, INC. AND SUBSIDIARIES
NOTES TO CONSOLIDATED FINANCIAL STATEMENTS (Continued)
Three-year period ended December 30, 2017
(Dollars in thousands, except per share amounts)
(18) DEFINED BENEFIT RETIREMENT PLAN (Continued)
Benefit Payments
The following table details expected pension benefit payments for the years 2018 through 2027:
|
2018
|
$
|
23,879
|
|
|
|
2019
|
24,689
|
|
||
|
2020
|
25,500
|
|
||
|
2021
|
26,308
|
|
||
|
2022
|
27,117
|
|
||
|
Years 2023 - 2027
|
149,078
|
|
||
Asset Allocation Strategy
The investment strategy for pension plan assets is to maintain a diversified portfolio consisting of
•
Long-term fixed‑income securities that are investment grade or government‑backed in nature;
•
Common stock mutual funds in U.K. and non-U.K. companies, and;
|
•
|
Diversified growth funds, which are invested in a number of investments, including common stock, fixed income funds, properties and commodities.
|
The Plan, as required by U.K. law, has an independent trustee that sets investment policy. The general strategy is to invest approximately
50%
of the assets of the plan in common stock mutual funds and diversified growth funds, with the remainder of the investments in long-term fixed income securities, including corporate bonds and index-linked U.K. gilts. The trustees regularly consult with representatives of the plan sponsor and independent advisors on such matters.
The pension plan investments are held in a trust. The weighted‑average maturity of the corporate bond portfolio was
13
years at December 30, 2017.
Fair Value Measurements
The pension plan assets are valued at fair value. The following is a description of the valuation methodologies used for the investments measured at fair value, including the general classification of such instruments pursuant to the valuation hierarchy.
Leveraged inflation-linked gilts (LDIs)
—LDIs are a combination of U.K. government-backed securities (such as bonds or other fixed income securities issued directly by the U.K. Treasury) money market instruments, and derivatives combined to give leveraged exposure to changes in the U.K. long-term interest and inflation rates. These funds are expected to offset a proportion of the impact changes in the long-term interest and inflation rates in the U.K. have on the pension plan's benefit plan obligation liability. The fair value recorded by the Plan is calculated using net asset value (NAV) for each investment.
Corporate Bonds
—Corporate bonds and debentures consist of fixed income securities issued by U.K. corporations. The fair value recorded by the Plan is calculated using NAV for each investment.
Corporate Stock
—This investment category consists of common and preferred stock, including mutual funds, issued by U.K. and non-U.K. corporations. The fair value recorded by the Plan is calculated using NAV for each investment, except for one small holding that is actively traded.
75
VALMONT INDUSTRIES, INC. AND SUBSIDIARIES
NOTES TO CONSOLIDATED FINANCIAL STATEMENTS (Continued)
Three-year period ended December 30, 2017
(Dollars in thousands, except per share amounts)
(18) DEFINED BENEFIT RETIREMENT PLAN (Continued)
Diversified growth funds
- This investment category consists of diversified investment funds, whose holdings include common stock, fixed income funds, properties and commodities of U.K. and non-U.K. securities. The fair value recorded by the Plan is calculated using NAV for each investment.
At December 31, 2017 and December 31, 2016, the pension plan assets measured at fair value on a recurring basis were as follows:
|
December 31, 2017
|
Quoted Prices in
Active Markets for Identical Inputs (Level 1) |
Significant Other
Observable Inputs (Level 2) |
Significant
Unobservable Inputs (Level 3) |
Total
|
||||||||||||
|
Plan assets at fair value:
|
||||||||||||||||
|
Temporary cash investments
|
$
|
17,915
|
|
$
|
—
|
|
$
|
—
|
|
$
|
17,915
|
|
||||
|
Corporate stock
|
536
|
|
—
|
|
—
|
|
536
|
|
||||||||
|
Total plan net assets at fair value
|
$
|
18,451
|
|
$
|
—
|
|
$
|
—
|
|
$
|
18,451
|
|
||||
|
Plan assets at NAV:
|
||||||||||||||||
|
Leveraged inflation-linked gilt funds
|
|
|
|
|
|
158,011
|
|
|||||||||
|
Corporate bonds
|
|
|
|
|
|
88,905
|
|
|||||||||
|
Corporate stock
|
|
|
|
|
|
212,505
|
|
|||||||||
|
Diversified growth funds
|
|
|
|
|
115,877
|
|
||||||||||
|
Total plan assets at NAV
|
|
|
|
575,298
|
|
|||||||||||
|
Total plan assets
|
|
|
|
$
|
593,749
|
|
||||||||||
|
December 31, 2016
|
Quoted Prices in
Active Markets for Identical Inputs (Level 1) |
Significant Other
Observable Inputs (Level 2) |
Significant
Unobservable Inputs (Level 3) |
Total
|
||||||||||||
|
Plan assets at fair value:
|
||||||||||||||||
|
Temporary cash investments
|
$
|
1,900
|
|
$
|
—
|
|
$
|
—
|
|
$
|
1,900
|
|
||||
|
Corporate stock
|
480
|
|
—
|
|
—
|
|
480
|
|
||||||||
|
Total plan net assets at fair value
|
$
|
2,380
|
|
$
|
—
|
|
$
|
—
|
|
$
|
2,380
|
|
||||
|
Plan assets at NAV:
|
||||||||||||||||
|
Index-linked gilts
|
|
|
|
|
135,141
|
|
||||||||||
|
Corporate bonds
|
|
|
|
|
83,834
|
|
||||||||||
|
Corporate stock
|
|
|
|
|
165,338
|
|
||||||||||
|
Diversified growth funds
|
|
|
|
|
99,974
|
|
||||||||||
|
Total plan assets at NAV
|
|
|
|
484,287
|
|
|||||||||||
|
Total plan assets
|
|
|
|
$
|
486,667
|
|
||||||||||
76
VALMONT INDUSTRIES, INC. AND SUBSIDIARIES
NOTES TO CONSOLIDATED FINANCIAL STATEMENTS (Continued)
Three-year period ended December 30, 2017
(Dollars in thousands, except per share amounts)
(19) BUSINESS SEGMENTS
In the fourth quarter of 2017, the Company's management structure and reporting was changed to reflect management's expectations of the future growth of certain product lines and to take into consideration the expected divestiture of the grinding media business, subject to regulatory approval, which historically was reported in the Energy and Mining segment. Grinding media will be reported in "Other" pending the completion of its divestiture. The access systems applications product line is now part of the Engineered Support Structures ("ESS") segment and the offshore and other complex structures product line is now part of the Utility segment. In the first quarter of 2017, the Company also changed its reportable segment operating income to separate out the LIFO expense (benefit). Certain inventories are accounted for using the LIFO basis in the consolidated financial statements. The segment financial information have been accordingly reclassified in this report to reflect these changes, for all periods presented.
The Company now has
four
reportable segments based on its management structure. Each segment is global in nature with a manager responsible for segment operational performance and the allocation of capital within the segment. Net corporate expense is net of certain service‑related expenses that are allocated to business units generally on the basis of employee headcounts and sales dollars.
Reportable segments are as follows:
ENGINEERED SUPPORT STRUCTURES:
This segment consists of the manufacture and distribution of engineered metal, and composite structures and components for lighting and traffic, access systems, wireless communication, and roadway safety;
UTILITY SUPPORT STRUCTURES:
This segment consists of the manufacture of engineered steel and concrete structures for the utility industry and on and offshore and other complex steel structures used in energy generation and distribution outside the United States;
COATINGS:
This segment consists of galvanizing, anodizing and powder coating services; and
IRRIGATION:
This segment consists of the manufacture of agricultural irrigation equipment and related parts and services for the agricultural industry and tubular products for industrial customers.
In addition to these
four
reportable segments, the Company had other businesses and activities that individually are not more than
10%
of consolidated sales, operating income or assets. This includes the manufacture of forged steel grinding media for the mining industry and is reported in the "Other" category.
The accounting policies of the reportable segments are the same as those described in Note 1. The Company evaluates the performance of its business segments based upon operating income and invested capital. The Company does not allocate LIFO expense, interest expense, non-operating income and deductions, or income taxes to its business segments.
77
VALMONT INDUSTRIES, INC. AND SUBSIDIARIES
NOTES TO CONSOLIDATED FINANCIAL STATEMENTS (Continued)
Three-year period ended December 30, 2017
(Dollars in thousands, except per share amounts)
(19) BUSINESS SEGMENTS (Continued)
Summary by Business
|
2017
|
2016
|
2015
|
|||||||||
|
SALES:
|
|||||||||||
|
Engineered Support Structures segment:
|
|||||||||||
|
Lighting, Traffic, and Roadway Products
|
$
|
633,178
|
|
$
|
612,868
|
|
$
|
580,877
|
|
||
|
Communication Products
|
171,718
|
|
162,148
|
|
162,635
|
|
|||||
|
Access Systems
|
133,206
|
|
131,703
|
|
138,349
|
|
|||||
|
Engineered Support Structures segment
|
938,102
|
|
906,719
|
|
881,861
|
|
|||||
|
Utility Support Structures segment:
|
|||||||||||
|
Steel
|
658,604
|
|
538,284
|
|
582,930
|
|
|||||
|
Concrete
|
99,738
|
|
90,256
|
|
95,581
|
|
|||||
|
Offshore and Other Complex Steel Structures
|
100,773
|
|
107,824
|
|
103,068
|
|
|||||
|
Utility Support Structures segment
|
859,115
|
|
736,364
|
|
781,579
|
|
|||||
|
Coatings segment
|
318,891
|
|
289,481
|
|
302,385
|
|
|||||
|
Irrigation segment
|
652,430
|
|
575,204
|
|
612,201
|
|
|||||
|
Other
|
76,300
|
|
83,110
|
|
103,690
|
|
|||||
|
Total
|
2,844,838
|
|
2,590,878
|
|
2,681,716
|
|
|||||
|
INTERSEGMENT SALES:
|
|||||||||||
|
Engineered Support Structures
|
25,862
|
|
15,620
|
|
1,059
|
|
|||||
|
Utility Support Structures
|
2,871
|
|
747
|
|
3,829
|
|
|||||
|
Coatings
|
62,080
|
|
45,604
|
|
46,912
|
|
|||||
|
Irrigation
|
8,058
|
|
7,231
|
|
6,430
|
|
|||||
|
Other
|
—
|
|
—
|
|
4,562
|
|
|||||
|
Total
|
98,871
|
|
69,202
|
|
62,792
|
|
|||||
|
NET SALES:
|
|||||||||||
|
Engineered Support Structures segment
|
912,240
|
|
891,099
|
|
880,802
|
|
|||||
|
Utility Support Structures segment
|
856,244
|
|
735,617
|
|
777,750
|
|
|||||
|
Coatings segment
|
256,811
|
|
243,877
|
|
255,473
|
|
|||||
|
Irrigation segment
|
644,372
|
|
567,973
|
|
605,771
|
|
|||||
|
Other
|
76,300
|
|
83,110
|
|
99,128
|
|
|||||
|
Total
|
$
|
2,745,967
|
|
$
|
2,521,676
|
|
$
|
2,618,924
|
|
||
78
VALMONT INDUSTRIES, INC. AND SUBSIDIARIES
NOTES TO CONSOLIDATED FINANCIAL STATEMENTS (Continued)
Three-year period ended December 30, 2017
(Dollars in thousands, except per share amounts)
(19) BUSINESS SEGMENTS (Continued)
|
2017
|
2016
|
2015
|
|||||||||
|
OPERATING INCOME (LOSS):
|
|||||||||||
|
Engineered Support Structures
|
$
|
62,960
|
|
$
|
72,273
|
|
$
|
28,792
|
|
||
|
Utility Support Structures
|
97,853
|
|
71,171
|
|
38,324
|
|
|||||
|
Coatings
|
50,179
|
|
46,596
|
|
27,369
|
|
|||||
|
Irrigation
|
101,498
|
|
90,945
|
|
78,218
|
|
|||||
|
Other
|
2,134
|
|
8,730
|
|
(4,767
|
)
|
|||||
|
Adjustment to LIFO inventory valuation method
|
(5,680
|
)
|
(2,972
|
)
|
12,103
|
|
|||||
|
Corporate
|
(42,512
|
)
|
(43,239
|
)
|
(48,344
|
)
|
|||||
|
Total
|
266,432
|
|
243,504
|
|
131,695
|
|
|||||
|
Interest expense, net
|
(39,908
|
)
|
(41,304
|
)
|
(41,325
|
)
|
|||||
|
Other
|
1,940
|
|
18,254
|
|
2,637
|
|
|||||
|
Earnings before income taxes and equity in earnings of nonconsolidated subsidiaries
|
$
|
228,464
|
|
$
|
220,454
|
|
$
|
93,007
|
|
||
|
TOTAL ASSETS:
|
|||||||||||
|
Engineered Support Structures
|
$
|
846,881
|
|
$
|
776,161
|
|
$
|
790,004
|
|
||
|
Utility Support Structures
|
597,231
|
|
544,015
|
|
569,205
|
|
|||||
|
Coatings
|
288,890
|
|
274,666
|
|
270,793
|
|
|||||
|
Irrigation
|
369,798
|
|
313,982
|
|
310,967
|
|
|||||
|
Other
|
68,934
|
|
65,296
|
|
72,646
|
|
|||||
|
Corporate
|
430,516
|
|
417,611
|
|
378,767
|
|
|||||
|
Total
|
$
|
2,602,250
|
|
$
|
2,391,731
|
|
$
|
2,392,382
|
|
||
|
CAPITAL EXPENDITURES:
|
|||||||||||
|
Engineered Support Structures
|
$
|
16,433
|
|
$
|
13,313
|
|
$
|
12,415
|
|
||
|
Utility Support Structures
|
14,012
|
|
7,969
|
|
13,467
|
|
|||||
|
Coatings
|
11,080
|
|
24,873
|
|
6,836
|
|
|||||
|
Irrigation
|
7,055
|
|
8,836
|
|
7,756
|
|
|||||
|
Other
|
2,376
|
|
1,601
|
|
2,318
|
|
|||||
|
Corporate
|
4,310
|
|
1,328
|
|
2,676
|
|
|||||
|
Total
|
$
|
55,266
|
|
$
|
57,920
|
|
$
|
45,468
|
|
||
79
VALMONT INDUSTRIES, INC. AND SUBSIDIARIES
NOTES TO CONSOLIDATED FINANCIAL STATEMENTS (Continued)
Three-year period ended December 30, 2017
(Dollars in thousands, except per share amounts)
(19) BUSINESS SEGMENTS (Continued)
|
2017
|
2016
|
2015
|
|||||||||
|
DEPRECIATION AND AMORTIZATION:
|
|||||||||||
|
Engineered Support Structures
|
$
|
27,637
|
|
$
|
27,824
|
|
$
|
30,775
|
|
||
|
Utility Support Structures
|
25,079
|
|
24,639
|
|
27,305
|
|
|||||
|
Coatings
|
15,115
|
|
12,883
|
|
12,962
|
|
|||||
|
Irrigation
|
11,173
|
|
12,097
|
|
11,746
|
|
|||||
|
Other
|
2,486
|
|
2,502
|
|
3,992
|
|
|||||
|
Corporate
|
3,467
|
|
2,472
|
|
4,364
|
|
|||||
|
Total
|
$
|
84,957
|
|
$
|
82,417
|
|
$
|
91,144
|
|
||
Summary by Geographical Area by Location of Valmont Facilities:
|
2017
|
2016
|
2015
|
|||||||||
|
NET SALES:
|
|||||||||||
|
United States
|
$
|
1,702,826
|
|
$
|
1,535,321
|
|
$
|
1,586,702
|
|
||
|
Australia
|
356,959
|
|
315,470
|
|
347,975
|
|
|||||
|
Denmark
|
100,773
|
|
99,719
|
|
98,628
|
|
|||||
|
Other
|
585,409
|
|
571,166
|
|
585,619
|
|
|||||
|
Total
|
$
|
2,745,967
|
|
$
|
2,521,676
|
|
$
|
2,618,924
|
|
||
|
LONG-LIVED ASSETS:
|
|||||||||||
|
United States
|
$
|
544,724
|
|
$
|
568,085
|
|
$
|
575,737
|
|
||
|
Australia
|
227,483
|
|
216,416
|
|
259,326
|
|
|||||
|
Denmark
|
90,372
|
|
85,654
|
|
90,463
|
|
|||||
|
Other
|
267,106
|
|
268,360
|
|
240,004
|
|
|||||
|
Total
|
$
|
1,129,685
|
|
$
|
1,138,515
|
|
$
|
1,165,530
|
|
||
No single customer accounted for more than 10% of net sales in
2017
,
2016
, or
2015
. Net sales by geographical area are based on the location of the facility producing the sales and do not include sales to other operating units of the company. Australia accounted for approximately
13%
of the Company's net sales in 2017; no other foreign country accounted for more than 5% of the Company’s net sales.
Operating income by business segment are based on net sales less identifiable operating expenses and allocations and includes profits recorded on sales to other operating units of the company. Long-lived assets consist of property, plant and equipment, net of depreciation, goodwill, other intangible assets and other assets. Long-lived assets by geographical area are based on location of facilities.
80
VALMONT INDUSTRIES, INC. AND SUBSIDIARIES
NOTES TO CONSOLIDATED FINANCIAL STATEMENTS (Continued)
Three-year period ended December 30, 2017
(Dollars in thousands, except per share amounts)
(20) GUARANTOR/NON-GUARANTOR FINANCIAL INFORMATION
The Company has three tranches of senior unsecured notes. All of the senior notes are guaranteed, jointly, severally, fully and unconditionally (subject to certain customary release provisions, including sale of the subsidiary guarantor, or sale of all or substantially all of its assets) by certain of the Company’s current and future direct and indirect domestic and foreign subsidiaries (collectively the “Guarantors”), excluding its other current domestic and foreign subsidiaries which do not guarantee the debt (collectively referred to as the “Non-Guarantors”). All Guarantors are
100%
owned by the parent company. The Company is the issuer.
Consolidated financial information for the Company ("Parent"), the Guarantor subsidiaries and the Non-Guarantor subsidiaries is as follows:
CONDENSED CONSOLIDATED STATEMENTS OF EARNINGS
For the
Year ended December 30, 2017
|
Parent
|
Guarantors
|
Non-
Guarantors |
Eliminations
|
Total
|
|||||||||||||||
|
Net sales
|
$
|
1,200,181
|
|
$
|
485,448
|
|
$
|
1,312,214
|
|
$
|
(251,876
|
)
|
$
|
2,745,967
|
|
||||
|
Cost of sales
|
898,799
|
|
375,383
|
|
1,042,199
|
|
(252,182
|
)
|
2,064,199
|
|
|||||||||
|
Gross profit
|
301,382
|
|
110,065
|
|
270,015
|
|
306
|
|
681,768
|
|
|||||||||
|
Selling, general and administrative expenses
|
192,182
|
|
47,955
|
|
175,199
|
|
—
|
|
415,336
|
|
|||||||||
|
Operating income
|
109,200
|
|
62,110
|
|
94,816
|
|
306
|
|
266,432
|
|
|||||||||
|
Other income (expense):
|
|||||||||||||||||||
|
Interest expense
|
(43,642
|
)
|
(13,866
|
)
|
(1,003
|
)
|
13,866
|
|
(44,645
|
)
|
|||||||||
|
Interest income
|
838
|
|
42
|
|
17,723
|
|
(13,866
|
)
|
4,737
|
|
|||||||||
|
Other
|
5,681
|
|
58
|
|
(3,799
|
)
|
—
|
|
1,940
|
|
|||||||||
|
(37,123
|
)
|
(13,766
|
)
|
12,921
|
|
—
|
|
(37,968
|
)
|
||||||||||
|
Earnings before income taxes and equity in earnings of nonconsolidated subsidiaries
|
72,077
|
|
48,344
|
|
107,737
|
|
306
|
|
228,464
|
|
|||||||||
|
Income tax expense (benefit):
|
|||||||||||||||||||
|
Current
|
29,407
|
|
17,928
|
|
18,920
|
|
135
|
|
66,390
|
|
|||||||||
|
Deferred
|
10,307
|
|
—
|
|
29,448
|
|
—
|
|
39,755
|
|
|||||||||
|
39,714
|
|
17,928
|
|
48,368
|
|
135
|
|
106,145
|
|
||||||||||
|
Earnings before equity in earnings of nonconsolidated subsidiaries
|
32,363
|
|
30,416
|
|
59,369
|
|
171
|
|
122,319
|
|
|||||||||
|
Equity in earnings of nonconsolidated subsidiaries
|
83,877
|
|
22,146
|
|
—
|
|
(106,023
|
)
|
—
|
|
|||||||||
|
Net earnings
|
116,240
|
|
52,562
|
|
59,369
|
|
(105,852
|
)
|
122,319
|
|
|||||||||
|
Less: Earnings attributable to noncontrolling interests
|
—
|
|
—
|
|
(6,079
|
)
|
—
|
|
(6,079
|
)
|
|||||||||
|
Net earnings attributable to Valmont Industries, Inc
|
$
|
116,240
|
|
$
|
52,562
|
|
$
|
53,290
|
|
$
|
(105,852
|
)
|
$
|
116,240
|
|
||||
81
VALMONT INDUSTRIES, INC. AND SUBSIDIARIES
NOTES TO CONSOLIDATED FINANCIAL STATEMENTS (Continued)
Three-year period ended December 30, 2017
(Dollars in thousands, except per share amounts)
(20) GUARANTOR/NON-GUARANTOR FINANCIAL INFORMATION (Continued)
CONDENSED CONSOLIDATED STATEMENTS OF EARNINGS
For the
Year ended December 31, 2016
|
Parent
|
Guarantors
|
Non-
Guarantors |
Eliminations
|
Total
|
|||||||||||||||
|
Net sales
|
$
|
1,126,985
|
|
$
|
390,756
|
|
$
|
1,195,812
|
|
$
|
(191,877
|
)
|
$
|
2,521,676
|
|
||||
|
Cost of sales
|
837,616
|
|
285,924
|
|
932,609
|
|
(190,716
|
)
|
1,865,433
|
|
|||||||||
|
Gross profit
|
289,369
|
|
104,832
|
|
263,203
|
|
(1,161
|
)
|
656,243
|
|
|||||||||
|
Selling, general and administrative expenses
|
184,493
|
|
46,244
|
|
182,002
|
|
—
|
|
412,739
|
|
|||||||||
|
Impairment of goodwill and intangible assets
|
—
|
|
—
|
|
—
|
|
—
|
|
—
|
|
|||||||||
|
Operating income
|
104,876
|
|
58,588
|
|
81,201
|
|
(1,161
|
)
|
243,504
|
|
|||||||||
|
Other income (expense):
|
|||||||||||||||||||
|
Interest expense
|
(43,703
|
)
|
(10
|
)
|
(696
|
)
|
—
|
|
(44,409
|
)
|
|||||||||
|
Interest income
|
273
|
|
112
|
|
2,720
|
|
—
|
|
3,105
|
|
|||||||||
|
Other
|
1,480
|
|
77
|
|
16,697
|
|
—
|
|
18,254
|
|
|||||||||
|
(41,950
|
)
|
179
|
|
18,721
|
|
—
|
|
(23,050
|
)
|
||||||||||
|
Earnings before income taxes and equity in earnings of nonconsolidated subsidiaries
|
62,926
|
|
58,767
|
|
99,922
|
|
(1,161
|
)
|
220,454
|
|
|||||||||
|
Income tax expense (benefit):
|
|||||||||||||||||||
|
Current
|
24,539
|
|
20,270
|
|
21,262
|
|
(323
|
)
|
65,748
|
|
|||||||||
|
Deferred
|
6,216
|
|
—
|
|
(29,901
|
)
|
—
|
|
(23,685
|
)
|
|||||||||
|
30,755
|
|
20,270
|
|
(8,639
|
)
|
(323
|
)
|
42,063
|
|
||||||||||
|
Earnings before equity in earnings of nonconsolidated subsidiaries
|
32,171
|
|
38,497
|
|
108,561
|
|
(838
|
)
|
178,391
|
|
|||||||||
|
Equity in earnings of nonconsolidated subsidiaries
|
141,061
|
|
66,128
|
|
—
|
|
(207,189
|
)
|
—
|
|
|||||||||
|
Net earnings
|
173,232
|
|
104,625
|
|
108,561
|
|
(208,027
|
)
|
178,391
|
|
|||||||||
|
Less: Earnings attributable to noncontrolling interests
|
—
|
|
—
|
|
(5,159
|
)
|
—
|
|
(5,159
|
)
|
|||||||||
|
Net earnings attributable to Valmont Industries, Inc
|
$
|
173,232
|
|
$
|
104,625
|
|
$
|
103,402
|
|
$
|
(208,027
|
)
|
$
|
173,232
|
|
||||
82
VALMONT INDUSTRIES, INC. AND SUBSIDIARIES
NOTES TO CONSOLIDATED FINANCIAL STATEMENTS (Continued)
Three-year period ended December 30, 2017
(Dollars in thousands, except per share amounts)
(20) GUARANTOR/NON-GUARANTOR FINANCIAL INFORMATION (Continued)
CONDENSED CONSOLIDATED STATEMENTS OF EARNINGS
For the
Year ended December 26, 2015
|
Parent
|
Guarantors
|
Non-
Guarantors |
Eliminations
|
Total
|
|||||||||||||||
|
Net sales
|
$
|
1,169,674
|
|
$
|
423,928
|
|
$
|
1,238,609
|
|
$
|
(213,287
|
)
|
$
|
2,618,924
|
|
||||
|
Cost of sales
|
890,242
|
|
332,847
|
|
987,729
|
|
(212,927
|
)
|
1,997,891
|
|
|||||||||
|
Gross profit
|
279,432
|
|
91,081
|
|
250,880
|
|
(360
|
)
|
621,033
|
|
|||||||||
|
Selling, general and administrative expenses
|
194,335
|
|
45,549
|
|
207,484
|
|
—
|
|
447,368
|
|
|||||||||
|
Impairment of goodwill and intangible assets
|
—
|
|
—
|
|
41,970
|
|
—
|
|
41,970
|
|
|||||||||
|
Operating income
|
85,097
|
|
45,532
|
|
1,426
|
|
(360
|
)
|
131,695
|
|
|||||||||
|
Other income (expense):
|
|||||||||||||||||||
|
Interest expense
|
(43,552
|
)
|
—
|
|
(1,069
|
)
|
—
|
|
(44,621
|
)
|
|||||||||
|
Interest income
|
9
|
|
103
|
|
3,184
|
|
—
|
|
3,296
|
|
|||||||||
|
Other
|
(2,374
|
)
|
60
|
|
4,951
|
|
—
|
|
2,637
|
|
|||||||||
|
(45,917
|
)
|
163
|
|
7,066
|
|
—
|
|
(38,688
|
)
|
||||||||||
|
Earnings before income taxes and equity in earnings of nonconsolidated subsidiaries
|
39,180
|
|
45,695
|
|
8,492
|
|
(360
|
)
|
93,007
|
|
|||||||||
|
Income tax expense (benefit):
|
|||||||||||||||||||
|
Current
|
863
|
|
23,261
|
|
18,446
|
|
(1
|
)
|
42,569
|
|
|||||||||
|
Deferred
|
10,042
|
|
(6,224
|
)
|
1,040
|
|
—
|
|
4,858
|
|
|||||||||
|
10,905
|
|
17,037
|
|
19,486
|
|
(1
|
)
|
47,427
|
|
||||||||||
|
Earnings before equity in earnings of nonconsolidated subsidiaries
|
28,275
|
|
28,658
|
|
(10,994
|
)
|
(359
|
)
|
45,580
|
|
|||||||||
|
Equity in earnings of nonconsolidated subsidiaries
|
11,842
|
|
(39,418
|
)
|
(247
|
)
|
27,576
|
|
(247
|
)
|
|||||||||
|
Net earnings
|
40,117
|
|
(10,760
|
)
|
(11,241
|
)
|
27,217
|
|
45,333
|
|
|||||||||
|
Less: Earnings attributable to noncontrolling interests
|
—
|
|
—
|
|
(5,216
|
)
|
—
|
|
(5,216
|
)
|
|||||||||
|
Net earnings attributable to Valmont Industries, Inc
|
$
|
40,117
|
|
$
|
(10,760
|
)
|
$
|
(16,457
|
)
|
$
|
27,217
|
|
$
|
40,117
|
|
||||
83
VALMONT INDUSTRIES, INC. AND SUBSIDIARIES
NOTES TO CONSOLIDATED FINANCIAL STATEMENTS (Continued)
Three-year period ended December 30, 2017
(Dollars in thousands, except per share amounts)
(20) GUARANTOR/NON-GUARANTOR FINANCIAL INFORMATION (Continued)
CONDENSED CONSOLIDATED STATEMENTS OF COMPREHENSIVE INCOME
For the
Year ended December 30, 2017
|
Parent
|
Guarantors
|
Non-
Guarantors |
Eliminations
|
Total
|
|||||||||||||||
|
Net earnings
|
$
|
116,240
|
|
$
|
52,562
|
|
$
|
59,369
|
|
$
|
(105,852
|
)
|
$
|
122,319
|
|
||||
|
Other comprehensive income (loss), net of tax:
|
|||||||||||||||||||
|
Foreign currency translation adjustments:
|
|||||||||||||||||||
|
Unrealized translation gains (losses)
|
—
|
|
138,795
|
|
(59,516
|
)
|
—
|
|
79,279
|
|
|||||||||
|
Gain (loss) on hedging activity:
|
|||||||||||||||||||
|
Unrealized gain (loss) on net investment hedge
|
(1,695
|
)
|
—
|
|
—
|
|
—
|
|
(1,695
|
)
|
|||||||||
|
Amortization cost included in interest expense
|
74
|
|
—
|
|
—
|
|
—
|
|
74
|
|
|||||||||
|
(1,621
|
)
|
—
|
|
—
|
|
—
|
|
(1,621
|
)
|
||||||||||
|
Actuarial gain (loss) in defined benefit pension plan liability
|
—
|
|
—
|
|
(10,871
|
)
|
—
|
|
(10,871
|
)
|
|||||||||
|
Equity in other comprehensive income
|
68,958
|
|
—
|
|
—
|
|
(68,958
|
)
|
—
|
|
|||||||||
|
Other comprehensive income (loss)
|
67,337
|
|
138,795
|
|
(70,387
|
)
|
(68,958
|
)
|
66,787
|
|
|||||||||
|
Comprehensive income (loss)
|
183,577
|
|
191,357
|
|
(11,018
|
)
|
(174,810
|
)
|
189,106
|
|
|||||||||
|
Comprehensive income attributable to noncontrolling interests
|
—
|
|
—
|
|
(5,529
|
)
|
—
|
|
(5,529
|
)
|
|||||||||
|
Comprehensive income (loss) attributable to Valmont Industries, Inc.
|
$
|
183,577
|
|
$
|
191,357
|
|
$
|
(16,547
|
)
|
$
|
(174,810
|
)
|
$
|
183,577
|
|
||||
84
VALMONT INDUSTRIES, INC. AND SUBSIDIARIES
NOTES TO CONSOLIDATED FINANCIAL STATEMENTS (Continued)
Three-year period ended December 30, 2017
(Dollars in thousands, except per share amounts)
(20) GUARANTOR/NON-GUARANTOR FINANCIAL INFORMATION (Continued)
CONDENSED CONSOLIDATED STATEMENTS OF COMPREHENSIVE INCOME
For the
Year ended December 31, 2016
|
Parent
|
Guarantors
|
Non-
Guarantors |
Eliminations
|
Total
|
|||||||||||||||
|
Net earnings
|
$
|
173,232
|
|
$
|
104,625
|
|
$
|
108,561
|
|
$
|
(208,027
|
)
|
$
|
178,391
|
|
||||
|
Other comprehensive income (loss), net of tax:
|
|||||||||||||||||||
|
Foreign currency translation adjustments:
|
|||||||||||||||||||
|
Unrealized translation gains (losses)
|
—
|
|
49
|
|
(58,364
|
)
|
—
|
|
(58,315
|
)
|
|||||||||
|
—
|
|
49
|
|
(58,364
|
)
|
—
|
|
(58,315
|
)
|
||||||||||
|
Gain (loss) on hedging activity:
|
|||||||||||||||||||
|
Amortization cost included in interest expense
|
74
|
|
—
|
|
—
|
|
—
|
|
74
|
|
|||||||||
|
Unrealized gain on net investment hedge
|
4,226
|
|
—
|
|
—
|
|
—
|
|
4,226
|
|
|||||||||
|
4,300
|
|
—
|
|
—
|
|
—
|
|
4,300
|
|
||||||||||
|
Actuarial gain (loss) in defined benefit pension plan liability
|
—
|
|
—
|
|
(24,141
|
)
|
—
|
|
(24,141
|
)
|
|||||||||
|
Equity in other comprehensive income
|
(83,252
|
)
|
—
|
|
—
|
|
83,252
|
|
—
|
|
|||||||||
|
Other comprehensive income (loss)
|
(78,952
|
)
|
49
|
|
(82,505
|
)
|
83,252
|
|
(78,156
|
)
|
|||||||||
|
Comprehensive income (loss)
|
94,280
|
|
104,674
|
|
26,056
|
|
(124,775
|
)
|
100,235
|
|
|||||||||
|
Comprehensive income attributable to noncontrolling interests
|
—
|
|
—
|
|
(6,144
|
)
|
—
|
|
(6,144
|
)
|
|||||||||
|
Comprehensive income (loss) attributable to Valmont Industries, Inc.
|
$
|
94,280
|
|
$
|
104,674
|
|
$
|
19,912
|
|
$
|
(124,775
|
)
|
$
|
94,091
|
|
||||
85
VALMONT INDUSTRIES, INC. AND SUBSIDIARIES
NOTES TO CONSOLIDATED FINANCIAL STATEMENTS (Continued)
Three-year period ended December 30, 2017
(Dollars in thousands, except per share amounts)
(20) GUARANTOR/NON-GUARANTOR FINANCIAL INFORMATION (Continued)
CONDENSED CONSOLIDATED STATEMENTS OF COMPREHENSIVE INCOME
For the
Year ended December 26, 2015
|
Parent
|
Guarantors
|
Non-
Guarantors |
Eliminations
|
Total
|
|||||||||||||||
|
Net earnings
|
$
|
40,117
|
|
$
|
(10,760
|
)
|
$
|
(11,241
|
)
|
$
|
27,217
|
|
$
|
45,333
|
|
||||
|
Other comprehensive income (loss), net of tax:
|
|||||||||||||||||||
|
Foreign currency translation adjustments:
|
|||||||||||||||||||
|
Unrealized translation gains (losses)
|
—
|
|
(15,166
|
)
|
(81,528
|
)
|
—
|
|
(96,694
|
)
|
|||||||||
|
—
|
|
(15,166
|
)
|
(81,528
|
)
|
—
|
|
(96,694
|
)
|
||||||||||
|
Gain (loss) on hedging activity:
|
|||||||||||||||||||
|
Amortization cost included in interest expense
|
74
|
|
—
|
|
—
|
|
—
|
|
74
|
|
|||||||||
|
Realized (gain) loss included in net earnings
|
(3,130
|
)
|
—
|
|
—
|
|
—
|
|
(3,130
|
)
|
|||||||||
|
Unrealized gain on cash flow hedges
|
2,855
|
|
—
|
|
—
|
|
—
|
|
2,855
|
|
|||||||||
|
(201
|
)
|
—
|
|
—
|
|
—
|
|
(201
|
)
|
||||||||||
|
Actuarial gain (loss) in defined benefit pension plan liability
|
—
|
|
—
|
|
(40,274
|
)
|
—
|
|
(40,274
|
)
|
|||||||||
|
Equity in other comprehensive income
|
(132,584
|
)
|
—
|
|
—
|
|
132,584
|
|
—
|
|
|||||||||
|
Other comprehensive income (loss)
|
(132,785
|
)
|
(15,166
|
)
|
(121,802
|
)
|
132,584
|
|
(137,169
|
)
|
|||||||||
|
Comprehensive income
|
(92,668
|
)
|
(25,926
|
)
|
(133,043
|
)
|
159,801
|
|
(91,836
|
)
|
|||||||||
|
Comprehensive income attributable to noncontrolling interests
|
—
|
|
—
|
|
(832
|
)
|
—
|
|
(832
|
)
|
|||||||||
|
Comprehensive income attributable to Valmont Industries, Inc.
|
$
|
(92,668
|
)
|
$
|
(25,926
|
)
|
$
|
(133,875
|
)
|
$
|
159,801
|
|
$
|
(92,668
|
)
|
||||
86
VALMONT INDUSTRIES, INC. AND SUBSIDIARIES
NOTES TO CONSOLIDATED FINANCIAL STATEMENTS (Continued)
Three-year period ended December 30, 2017
(Dollars in thousands, except per share amounts)
(20) GUARANTOR/NON-GUARANTOR FINANCIAL INFORMATION (Continued)
CONDENSED CONSOLIDATED BALANCE SHEETS
December 30, 2017
|
Parent
|
Guarantors
|
Non-
Guarantors |
Eliminations
|
Total
|
|||||||||||||||
|
ASSETS
|
|||||||||||||||||||
|
Current assets:
|
|||||||||||||||||||
|
Cash and cash equivalents
|
$
|
83,329
|
|
$
|
5,304
|
|
$
|
404,172
|
|
$
|
—
|
|
$
|
492,805
|
|
||||
|
Receivables, net
|
149,221
|
|
82,995
|
|
271,461
|
|
—
|
|
503,677
|
|
|||||||||
|
Inventories
|
160,444
|
|
46,801
|
|
217,551
|
|
(3,848
|
)
|
420,948
|
|
|||||||||
|
Prepaid expenses, restricted cash, and other assets
|
8,607
|
|
970
|
|
34,066
|
|
—
|
|
43,643
|
|
|||||||||
|
Refundable income taxes
|
11,492
|
|
—
|
|
—
|
|
—
|
|
11,492
|
|
|||||||||
|
Total current assets
|
413,093
|
|
136,070
|
|
927,250
|
|
(3,848
|
)
|
1,472,565
|
|
|||||||||
|
Property, plant and equipment, at cost
|
557,371
|
|
160,767
|
|
447,549
|
|
—
|
|
1,165,687
|
|
|||||||||
|
Less accumulated depreciation and amortization
|
368,668
|
|
84,508
|
|
193,583
|
|
—
|
|
646,759
|
|
|||||||||
|
Net property, plant and equipment
|
188,703
|
|
76,259
|
|
253,966
|
|
—
|
|
518,928
|
|
|||||||||
|
Goodwill
|
20,108
|
|
110,562
|
|
207,050
|
|
—
|
|
337,720
|
|
|||||||||
|
Other intangible assets
|
130
|
|
30,955
|
|
107,514
|
|
—
|
|
138,599
|
|
|||||||||
|
Investment in subsidiaries and intercompany accounts
|
1,416,446
|
|
1,181,537
|
|
927,179
|
|
(3,525,162
|
)
|
—
|
|
|||||||||
|
Other assets
|
50,773
|
|
—
|
|
83,665
|
|
—
|
|
134,438
|
|
|||||||||
|
Total assets
|
$
|
2,089,253
|
|
$
|
1,535,383
|
|
$
|
2,506,624
|
|
$
|
(3,529,010
|
)
|
$
|
2,602,250
|
|
||||
|
LIABILITIES AND SHAREHOLDERS’ EQUITY
|
|||||||||||||||||||
|
Current liabilities:
|
|||||||||||||||||||
|
Current installments of long-term debt
|
$
|
—
|
|
$
|
—
|
|
$
|
966
|
|
$
|
—
|
|
$
|
966
|
|
||||
|
Notes payable to banks
|
—
|
|
—
|
|
161
|
|
—
|
|
161
|
|
|||||||||
|
Accounts payable
|
69,915
|
|
18,039
|
|
139,952
|
|
—
|
|
227,906
|
|
|||||||||
|
Accrued employee compensation and benefits
|
44,086
|
|
8,749
|
|
31,591
|
|
—
|
|
84,426
|
|
|||||||||
|
Accrued expenses
|
28,198
|
|
9,621
|
|
43,210
|
|
—
|
|
81,029
|
|
|||||||||
|
Dividends payable
|
8,510
|
|
—
|
|
—
|
|
—
|
|
8,510
|
|
|||||||||
|
Total current liabilities
|
150,709
|
|
36,409
|
|
215,880
|
|
—
|
|
402,998
|
|
|||||||||
|
Deferred income taxes
|
20,885
|
|
—
|
|
14,021
|
|
—
|
|
34,906
|
|
|||||||||
|
Long-term debt, excluding current installments
|
750,821
|
|
185,078
|
|
9,836
|
|
(191,847
|
)
|
753,888
|
|
|||||||||
|
Defined benefit pension liability
|
—
|
|
—
|
|
189,552
|
|
—
|
|
189,552
|
|
|||||||||
|
Deferred compensation
|
42,928
|
|
—
|
|
5,598
|
|
—
|
|
48,526
|
|
|||||||||
|
Other noncurrent liabilities
|
11,074
|
|
6
|
|
9,505
|
|
—
|
|
20,585
|
|
|||||||||
|
Shareholders’ equity:
|
|||||||||||||||||||
|
Common stock of $1 par value
|
27,900
|
|
457,950
|
|
648,682
|
|
(1,106,632
|
)
|
27,900
|
|
|||||||||
|
Additional paid-in capital
|
—
|
|
159,414
|
|
1,107,536
|
|
(1,266,950
|
)
|
—
|
|
|||||||||
|
Retained earnings
|
1,954,344
|
|
622,044
|
|
619,622
|
|
(1,241,666
|
)
|
1,954,344
|
|
|||||||||
|
Accumulated other comprehensive income (loss)
|
(279,022
|
)
|
74,482
|
|
(352,567
|
)
|
278,085
|
|
(279,022
|
)
|
|||||||||
|
Treasury stock
|
(590,386
|
)
|
—
|
|
—
|
|
—
|
|
(590,386
|
)
|
|||||||||
|
Total Valmont Industries, Inc. shareholders’ equity
|
1,112,836
|
|
1,313,890
|
|
2,023,273
|
|
(3,337,163
|
)
|
1,112,836
|
|
|||||||||
|
Noncontrolling interest in consolidated subsidiaries
|
—
|
|
—
|
|
38,959
|
|
—
|
|
38,959
|
|
|||||||||
|
Total shareholders’ equity
|
1,112,836
|
|
1,313,890
|
|
2,062,232
|
|
(3,337,163
|
)
|
1,151,795
|
|
|||||||||
|
Total liabilities and shareholders’ equity
|
$
|
2,089,253
|
|
$
|
1,535,383
|
|
$
|
2,506,624
|
|
$
|
(3,529,010
|
)
|
$
|
2,602,250
|
|
||||
87
VALMONT INDUSTRIES, INC. AND SUBSIDIARIES
NOTES TO CONSOLIDATED FINANCIAL STATEMENTS (Continued)
Three-year period ended December 30, 2017
(Dollars in thousands, except per share amounts)
(20) GUARANTOR/NON-GUARANTOR FINANCIAL INFORMATION (Continued)
CONDENSED CONSOLIDATED BALANCE SHEETS
December 31, 2016
|
Parent
|
Guarantors
|
Non-
Guarantors |
Eliminations
|
Total
|
|||||||||||||||
|
ASSETS
|
|||||||||||||||||||
|
Current assets:
|
|||||||||||||||||||
|
Cash and cash equivalents
|
$
|
67,225
|
|
$
|
6,071
|
|
$
|
326,652
|
|
$
|
—
|
|
$
|
399,948
|
|
||||
|
Receivables, net
|
134,351
|
|
60,522
|
|
244,469
|
|
—
|
|
439,342
|
|
|||||||||
|
Inventories
|
126,669
|
|
45,457
|
|
182,056
|
|
(4,154
|
)
|
350,028
|
|
|||||||||
|
Prepaid expenses, restricted cash, and other assets
|
13,271
|
|
880
|
|
43,146
|
|
—
|
|
57,297
|
|
|||||||||
|
Refundable income taxes
|
6,601
|
|
—
|
|
—
|
|
—
|
|
6,601
|
|
|||||||||
|
Total current assets
|
348,117
|
|
112,930
|
|
796,323
|
|
(4,154
|
)
|
1,253,216
|
|
|||||||||
|
Property, plant and equipment, at cost
|
547,076
|
|
153,596
|
|
405,064
|
|
—
|
|
1,105,736
|
|
|||||||||
|
Less accumulated depreciation and amortization
|
352,960
|
|
76,776
|
|
157,665
|
|
—
|
|
587,401
|
|
|||||||||
|
Net property, plant and equipment
|
194,116
|
|
76,820
|
|
247,399
|
|
—
|
|
518,335
|
|
|||||||||
|
Goodwill
|
20,108
|
|
110,561
|
|
190,441
|
|
—
|
|
321,110
|
|
|||||||||
|
Other intangible assets
|
184
|
|
35,953
|
|
108,241
|
|
—
|
|
144,378
|
|
|||||||||
|
Investment in subsidiaries and intercompany accounts
|
1,279,413
|
|
901,758
|
|
1,089,369
|
|
(3,270,540
|
)
|
—
|
|
|||||||||
|
Other assets
|
43,880
|
|
—
|
|
110,812
|
|
—
|
|
154,692
|
|
|||||||||
|
Total assets
|
$
|
1,885,818
|
|
$
|
1,238,022
|
|
$
|
2,542,585
|
|
$
|
(3,274,694
|
)
|
$
|
2,391,731
|
|
||||
|
LIABILITIES AND SHAREHOLDERS’ EQUITY
|
|||||||||||||||||||
|
Current liabilities:
|
|||||||||||||||||||
|
Current installments of long-term debt
|
$
|
—
|
|
$
|
—
|
|
$
|
851
|
|
$
|
—
|
|
$
|
851
|
|
||||
|
Notes payable to banks
|
—
|
|
—
|
|
746
|
|
—
|
|
746
|
|
|||||||||
|
Accounts payable
|
52,272
|
|
15,732
|
|
109,484
|
|
—
|
|
177,488
|
|
|||||||||
|
Accrued employee compensation and benefits
|
34,508
|
|
7,243
|
|
30,653
|
|
—
|
|
72,404
|
|
|||||||||
|
Accrued expenses
|
30,261
|
|
15,242
|
|
44,411
|
|
—
|
|
89,914
|
|
|||||||||
|
Dividends payable
|
8,445
|
|
—
|
|
—
|
|
—
|
|
8,445
|
|
|||||||||
|
Total current liabilities
|
125,486
|
|
38,217
|
|
186,145
|
|
—
|
|
349,848
|
|
|||||||||
|
Deferred income taxes
|
22,481
|
|
—
|
|
13,322
|
|
—
|
|
35,803
|
|
|||||||||
|
Long-term debt, excluding current installments
|
751,251
|
|
—
|
|
3,544
|
|
—
|
|
754,795
|
|
|||||||||
|
Defined benefit pension liability
|
—
|
|
—
|
|
209,470
|
|
—
|
|
209,470
|
|
|||||||||
|
Deferred compensation
|
39,476
|
|
—
|
|
4,843
|
|
—
|
|
44,319
|
|
|||||||||
|
Other noncurrent liabilities
|
3,642
|
|
5
|
|
11,263
|
|
—
|
|
14,910
|
|
|||||||||
|
Shareholders’ equity:
|
|||||||||||||||||||
|
Common stock of $1 par value
|
27,900
|
|
457,950
|
|
648,683
|
|
(1,106,633
|
)
|
27,900
|
|
|||||||||
|
Additional paid-in capital
|
—
|
|
159,414
|
|
1,107,536
|
|
(1,266,950
|
)
|
—
|
|
|||||||||
|
Retained earnings
|
1,874,722
|
|
646,749
|
|
603,338
|
|
(1,250,087
|
)
|
1,874,722
|
|
|||||||||
|
Accumulated other comprehensive income (loss)
|
(346,359
|
)
|
(64,313
|
)
|
(284,663
|
)
|
348,976
|
|
(346,359
|
)
|
|||||||||
|
Treasury stock
|
(612,781
|
)
|
—
|
|
—
|
|
—
|
|
(612,781
|
)
|
|||||||||
|
Total Valmont Industries, Inc. shareholders’ equity
|
943,482
|
|
1,199,800
|
|
2,074,894
|
|
(3,274,694
|
)
|
943,482
|
|
|||||||||
|
Noncontrolling interest in consolidated subsidiaries
|
—
|
|
—
|
|
39,104
|
|
—
|
|
39,104
|
|
|||||||||
|
Total shareholders’ equity
|
943,482
|
|
1,199,800
|
|
2,113,998
|
|
(3,274,694
|
)
|
982,586
|
|
|||||||||
|
Total liabilities and shareholders’ equity
|
$
|
1,885,818
|
|
$
|
1,238,022
|
|
$
|
2,542,585
|
|
$
|
(3,274,694
|
)
|
$
|
2,391,731
|
|
||||
88
VALMONT INDUSTRIES, INC. AND SUBSIDIARIES
NOTES TO CONSOLIDATED FINANCIAL STATEMENTS (Continued)
Three-year period ended December 30, 2017
(Dollars in thousands, except per share amounts)
(20) GUARANTOR/NON-GUARANTOR FINANCIAL INFORMATION (Continued)
CONDENSED CONSOLIDATED STATEMENTS OF CASH FLOWS
For the
Year ended December 30, 2017
|
Parent
|
Guarantors
|
Non-
Guarantors |
Eliminations
|
Total
|
|||||||||||||||
|
Cash flows from operating activities:
|
|||||||||||||||||||
|
Net earnings
|
$
|
116,240
|
|
$
|
52,562
|
|
$
|
59,369
|
|
$
|
(105,852
|
)
|
$
|
122,319
|
|
||||
|
Adjustments to reconcile net earnings to net cash flows from operations:
|
|||||||||||||||||||
|
Depreciation and amortization
|
26,237
|
|
15,003
|
|
43,717
|
|
—
|
|
84,957
|
|
|||||||||
|
Noncash loss on trading securities
|
—
|
|
—
|
|
237
|
|
—
|
|
237
|
|
|||||||||
|
Decrease in restricted cash - pension plan trust
|
—
|
|
—
|
|
12,568
|
|
—
|
|
12,568
|
|
|||||||||
|
Stock-based compensation
|
10,706
|
|
—
|
|
—
|
|
—
|
|
10,706
|
|
|||||||||
|
Defined benefit pension plan expense (benefit)
|
—
|
|
—
|
|
648
|
|
—
|
|
648
|
|
|||||||||
|
Contribution to defined benefit pension plan
|
—
|
|
—
|
|
(40,245
|
)
|
—
|
|
(40,245
|
)
|
|||||||||
|
(Gain) loss on sale of property, plant and equipment
|
(664
|
)
|
8
|
|
(3,268
|
)
|
—
|
|
(3,924
|
)
|
|||||||||
|
Equity in earnings in nonconsolidated subsidiaries
|
(83,877
|
)
|
(22,146
|
)
|
—
|
|
106,023
|
|
—
|
|
|||||||||
|
Deferred income taxes
|
10,307
|
|
—
|
|
29,448
|
|
—
|
|
39,755
|
|
|||||||||
|
Changes in assets and liabilities (net of acquisitions):
|
|||||||||||||||||||
|
Receivables
|
(13,120
|
)
|
(22,473
|
)
|
(13,519
|
)
|
—
|
|
(49,112
|
)
|
|||||||||
|
Inventories
|
(33,775
|
)
|
(1,345
|
)
|
(22,016
|
)
|
(306
|
)
|
(57,442
|
)
|
|||||||||
|
Prepaid expenses
|
(2,207
|
)
|
(90
|
)
|
(3,741
|
)
|
—
|
|
(6,038
|
)
|
|||||||||
|
Accounts payable
|
17,643
|
|
2,307
|
|
19,455
|
|
—
|
|
39,405
|
|
|||||||||
|
Accrued expenses
|
7,516
|
|
(4,116
|
)
|
(5,398
|
)
|
—
|
|
(1,998
|
)
|
|||||||||
|
Other noncurrent liabilities
|
(140
|
)
|
—
|
|
(7,088
|
)
|
—
|
|
(7,228
|
)
|
|||||||||
|
Income taxes payable (refundable)
|
(11,837
|
)
|
728
|
|
12,217
|
|
—
|
|
1,108
|
|
|||||||||
|
Net cash flows from operating activities
|
43,029
|
|
20,438
|
|
82,384
|
|
(135
|
)
|
145,716
|
|
|||||||||
|
Cash flows from investing activities:
|
|||||||||||||||||||
|
Purchase of property, plant and equipment
|
(20,460
|
)
|
(9,454
|
)
|
(25,352
|
)
|
—
|
|
(55,266
|
)
|
|||||||||
|
Proceeds from sale of assets
|
748
|
|
3
|
|
7,434
|
|
—
|
|
8,185
|
|
|||||||||
|
Acquisitions, net of cash acquired
|
—
|
|
—
|
|
(5,362
|
)
|
—
|
|
(5,362
|
)
|
|||||||||
|
Proceeds from settlement of net investment hedge
|
5,123
|
|
—
|
|
—
|
|
—
|
|
5,123
|
|
|||||||||
|
Other, net
|
684
|
|
(22,777
|
)
|
19,663
|
|
135
|
|
(2,295
|
)
|
|||||||||
|
Net cash flows from investing activities
|
(13,905
|
)
|
(32,228
|
)
|
(3,617
|
)
|
135
|
|
(49,615
|
)
|
|||||||||
|
Cash flows from financing activities:
|
|||||||||||||||||||
|
Payments under short-term agreements
|
—
|
|
—
|
|
(585
|
)
|
—
|
|
(585
|
)
|
|||||||||
|
Principal payments on long-term borrowings
|
|
|
—
|
|
(887
|
)
|
—
|
|
(887
|
)
|
|||||||||
|
Dividends paid
|
(33,862
|
)
|
—
|
|
—
|
|
—
|
|
(33,862
|
)
|
|||||||||
|
Dividends to noncontrolling interest
|
—
|
|
—
|
|
(5,674
|
)
|
—
|
|
(5,674
|
)
|
|||||||||
|
Intercompany dividends
|
22,662
|
|
—
|
|
(22,662
|
)
|
—
|
|
—
|
|
|||||||||
|
Intercompany capital contribution
|
(10,818
|
)
|
10,818
|
|
—
|
|
|||||||||||||
|
Proceeds from exercises under stock plans
|
35,159
|
|
—
|
|
—
|
|
—
|
|
35,159
|
|
|||||||||
|
Purchase of common treasury shares - stock plan exercises
|
(26,161
|
)
|
—
|
|
—
|
|
—
|
|
(26,161
|
)
|
|||||||||
|
Net cash flows from financing activities
|
(13,020
|
)
|
10,818
|
|
(29,808
|
)
|
—
|
|
(32,010
|
)
|
|||||||||
|
Effect of exchange rate changes on cash and cash equivalents
|
—
|
|
205
|
|
28,561
|
|
—
|
|
28,766
|
|
|||||||||
|
Net change in cash and cash equivalents
|
16,104
|
|
(767
|
)
|
77,520
|
|
—
|
|
92,857
|
|
|||||||||
|
Cash and cash equivalents—beginning of year
|
67,225
|
|
6,071
|
|
326,652
|
|
—
|
|
399,948
|
|
|||||||||
|
Cash and cash equivalents—end of period
|
$
|
83,329
|
|
$
|
5,304
|
|
$
|
404,172
|
|
$
|
—
|
|
$
|
492,805
|
|
||||
89
VALMONT INDUSTRIES, INC. AND SUBSIDIARIES
NOTES TO CONSOLIDATED FINANCIAL STATEMENTS (Continued)
Three-year period ended December 30, 2017
(Dollars in thousands, except per share amounts)
(20) GUARANTOR/NON-GUARANTOR FINANCIAL INFORMATION (Continued)
CONDENSED CONSOLIDATED STATEMENTS OF CASH FLOWS
For the
Year ended December 31, 2016
|
Parent
|
Guarantors
|
Non-
Guarantors |
Eliminations
|
Total
|
|||||||||||||||
|
Cash flows from operating activities:
|
|||||||||||||||||||
|
Net earnings
|
$
|
173,232
|
|
$
|
104,625
|
|
$
|
108,561
|
|
$
|
(208,027
|
)
|
$
|
178,391
|
|
||||
|
Adjustments to reconcile net earnings to net cash flows from operations:
|
|||||||||||||||||||
|
Depreciation and amortization
|
27,096
|
|
13,316
|
|
42,005
|
|
—
|
|
82,417
|
|
|||||||||
|
Noncash loss on trading securities
|
—
|
|
—
|
|
586
|
|
—
|
|
586
|
|
|||||||||
|
Increase in restricted cash - pension plan trust
|
—
|
|
—
|
|
(13,652
|
)
|
—
|
|
(13,652
|
)
|
|||||||||
|
Impairment of property, plant and equipment
|
—
|
|
—
|
|
1,099
|
|
—
|
|
1,099
|
|
|||||||||
|
Stock-based compensation
|
9,931
|
|
—
|
|
—
|
|
—
|
|
9,931
|
|
|||||||||
|
Change in fair value of contingent consideration
|
—
|
|
—
|
|
(3,242
|
)
|
—
|
|
(3,242
|
)
|
|||||||||
|
Defined benefit pension plan expense (benefit)
|
—
|
|
—
|
|
1,870
|
|
—
|
|
1,870
|
|
|||||||||
|
Contribution to defined benefit pension plan
|
—
|
|
—
|
|
(1,488
|
)
|
—
|
|
(1,488
|
)
|
|||||||||
|
(Gain) loss on sale of property, plant and equipment
|
165
|
|
103
|
|
363
|
|
—
|
|
631
|
|
|||||||||
|
Equity in earnings in nonconsolidated subsidiaries
|
(141,061
|
)
|
(66,128
|
)
|
—
|
|
207,189
|
|
—
|
|
|||||||||
|
Deferred income taxes
|
6,216
|
|
—
|
|
(29,901
|
)
|
—
|
|
(23,685
|
)
|
|||||||||
|
Changes in assets and liabilities (net of acquisitions):
|
|||||||||||||||||||
|
Receivables
|
(3,610
|
)
|
5,865
|
|
22,367
|
|
—
|
|
24,622
|
|
|||||||||
|
Inventories
|
5,554
|
|
(7,078
|
)
|
(11,097
|
)
|
1,160
|
|
(11,461
|
)
|
|||||||||
|
Prepaid expenses
|
(1,250
|
)
|
(114
|
)
|
2,502
|
|
—
|
|
1,138
|
|
|||||||||
|
Accounts payable
|
(14,452
|
)
|
2,052
|
|
12,504
|
|
—
|
|
104
|
|
|||||||||
|
Accrued expenses
|
1,423
|
|
(6,664
|
)
|
(6,966
|
)
|
—
|
|
(12,207
|
)
|
|||||||||
|
Other noncurrent liabilities
|
(2,333
|
)
|
5
|
|
(21,552
|
)
|
—
|
|
(23,880
|
)
|
|||||||||
|
Income taxes payable (refundable)
|
32,873
|
|
(16,567
|
)
|
(8,312
|
)
|
—
|
|
7,994
|
|
|||||||||
|
Net cash flows from operating activities
|
93,784
|
|
29,415
|
|
95,647
|
|
322
|
|
219,168
|
|
|||||||||
|
Cash flows from investing activities:
|
|||||||||||||||||||
|
Purchase of property, plant and equipment
|
(9,031
|
)
|
(22,320
|
)
|
(26,569
|
)
|
—
|
|
(57,920
|
)
|
|||||||||
|
Proceeds from sale of assets
|
44
|
|
102
|
|
4,980
|
|
—
|
|
5,126
|
|
|||||||||
|
Other, net
|
(633
|
)
|
(5,085
|
)
|
5,785
|
|
(322
|
)
|
(255
|
)
|
|||||||||
|
Net cash flows from investing activities
|
(9,620
|
)
|
(27,303
|
)
|
(15,804
|
)
|
(322
|
)
|
(53,049
|
)
|
|||||||||
|
Cash flows from financing activities:
|
|||||||||||||||||||
|
Payments under short-term agreements
|
—
|
|
—
|
|
(200
|
)
|
—
|
|
(200
|
)
|
|||||||||
|
Principal payments on long-term borrowings
|
(215
|
)
|
—
|
|
(1,791
|
)
|
—
|
|
(2,006
|
)
|
|||||||||
|
Dividends paid
|
(34,053
|
)
|
—
|
|
—
|
|
—
|
|
(34,053
|
)
|
|||||||||
|
Purchase of noncontrolling interest
|
—
|
|
—
|
|
(11,009
|
)
|
—
|
|
(11,009
|
)
|
|||||||||
|
Dividends to noncontrolling interest
|
—
|
|
—
|
|
(2,938
|
)
|
—
|
|
(2,938
|
)
|
|||||||||
|
Proceeds from exercises under stock plans
|
11,153
|
|
—
|
|
—
|
|
—
|
|
11,153
|
|
|||||||||
|
Purchase of treasury shares
|
(53,800
|
)
|
—
|
|
—
|
|
—
|
|
(53,800
|
)
|
|||||||||
|
Purchase of common treasury shares - stock plan exercises
|
(2,305
|
)
|
—
|
|
—
|
|
—
|
|
(2,305
|
)
|
|||||||||
|
Net cash flows from financing activities
|
(79,220
|
)
|
—
|
|
(15,938
|
)
|
—
|
|
(95,158
|
)
|
|||||||||
|
Effect of exchange rate changes on cash and cash equivalents
|
—
|
|
(49
|
)
|
(20,038
|
)
|
—
|
|
(20,087
|
)
|
|||||||||
|
Net change in cash and cash equivalents
|
4,944
|
|
2,063
|
|
43,867
|
|
—
|
|
50,874
|
|
|||||||||
|
Cash and cash equivalents—beginning of year
|
62,281
|
|
4,008
|
|
282,785
|
|
—
|
|
349,074
|
|
|||||||||
|
Cash and cash equivalents—end of period
|
$
|
67,225
|
|
$
|
6,071
|
|
$
|
326,652
|
|
$
|
—
|
|
$
|
399,948
|
|
||||
90
VALMONT INDUSTRIES, INC. AND SUBSIDIARIES
NOTES TO CONSOLIDATED FINANCIAL STATEMENTS (Continued)
Three-year period ended December 30, 2017
(Dollars in thousands, except per share amounts)
(20) GUARANTOR/NON-GUARANTOR FINANCIAL INFORMATION (Continued)
CONDENSED CONSOLIDATED STATEMENTS OF CASH FLOWS
For the
Year ended December 26, 2015
|
Parent
|
Guarantors
|
Non-
Guarantors |
Eliminations
|
Total
|
|||||||||||||||
|
Cash flows from operating activities:
|
|||||||||||||||||||
|
Net earnings
|
$
|
40,117
|
|
$
|
(10,760
|
)
|
$
|
(11,241
|
)
|
$
|
27,217
|
|
$
|
45,333
|
|
||||
|
Adjustments to reconcile net earnings to net cash flows from operations:
|
|||||||||||||||||||
|
Depreciation and amortization
|
29,433
|
|
12,611
|
|
49,100
|
|
—
|
|
91,144
|
|
|||||||||
|
Noncash loss on trading securities
|
—
|
|
—
|
|
4,555
|
|
—
|
|
4,555
|
|
|||||||||
|
Impairment of property, plant and equipment
|
7,486
|
|
542
|
|
11,808
|
|
—
|
|
19,836
|
|
|||||||||
|
Impairment of goodwill & intangibles assets
|
—
|
|
—
|
|
41,970
|
|
—
|
|
41,970
|
|
|||||||||
|
Stock-based compensation
|
7,244
|
|
—
|
|
—
|
|
—
|
|
7,244
|
|
|||||||||
|
Defined benefit pension plan expense (benefit)
|
—
|
|
—
|
|
(610
|
)
|
—
|
|
(610
|
)
|
|||||||||
|
Contribution to defined benefit pension plan
|
—
|
|
—
|
|
(16,500
|
)
|
—
|
|
(16,500
|
)
|
|||||||||
|
(Gain) loss on sale of property, plant and equipment
|
983
|
|
319
|
|
1,025
|
|
—
|
|
2,327
|
|
|||||||||
|
Equity in earnings in nonconsolidated subsidiaries
|
(11,842
|
)
|
39,418
|
|
247
|
|
(27,576
|
)
|
247
|
|
|||||||||
|
Deferred income taxes
|
10,042
|
|
(6,224
|
)
|
1,040
|
|
—
|
|
4,858
|
|
|||||||||
|
Changes in assets and liabilities (net of acquisitions):
|
|||||||||||||||||||
|
Receivables
|
27,576
|
|
3,547
|
|
19,144
|
|
—
|
|
50,267
|
|
|||||||||
|
Inventories
|
(4,364
|
)
|
18,130
|
|
(12,698
|
)
|
2,228
|
|
3,296
|
|
|||||||||
|
Prepaid expenses
|
2,337
|
|
(172
|
)
|
8,679
|
|
—
|
|
10,844
|
|
|||||||||
|
Accounts payable
|
6,831
|
|
(1,970
|
)
|
(11,666
|
)
|
—
|
|
(6,805
|
)
|
|||||||||
|
Accrued expenses
|
(16,485
|
)
|
17,713
|
|
7,366
|
|
324
|
|
8,918
|
|
|||||||||
|
Other noncurrent liabilities
|
177
|
|
—
|
|
(1,941
|
)
|
—
|
|
(1,764
|
)
|
|||||||||
|
Income taxes payable (refundable)
|
7,895
|
|
(306
|
)
|
(482
|
)
|
—
|
|
7,107
|
|
|||||||||
|
Net cash flows from operating activities
|
107,430
|
|
72,848
|
|
89,796
|
|
2,193
|
|
272,267
|
|
|||||||||
|
Cash flows from investing activities:
|
|||||||||||||||||||
|
Purchase of property, plant and equipment
|
(14,362
|
)
|
(7,718
|
)
|
(23,388
|
)
|
—
|
|
(45,468
|
)
|
|||||||||
|
Proceeds from sale of assets
|
3,996
|
|
302
|
|
(1,049
|
)
|
—
|
|
3,249
|
|
|||||||||
|
Acquisitions, net of cash acquired
|
—
|
|
(12,778
|
)
|
—
|
|
—
|
|
(12,778
|
)
|
|||||||||
|
Other, net
|
72,866
|
|
(50,447
|
)
|
(13,400
|
)
|
(2,193
|
)
|
6,826
|
|
|||||||||
|
Net cash flows from investing activities
|
62,500
|
|
(70,641
|
)
|
(37,837
|
)
|
(2,193
|
)
|
(48,171
|
)
|
|||||||||
|
Cash flows from financing activities:
|
|||||||||||||||||||
|
Payments under short-term agreements
|
—
|
|
—
|
|
(12,853
|
)
|
—
|
|
(12,853
|
)
|
|||||||||
|
Proceeds from long-term borrowings
|
68,000
|
|
—
|
|
—
|
|
—
|
|
68,000
|
|
|||||||||
|
Principal payments on long-term borrowings
|
(68,213
|
)
|
—
|
|
(885
|
)
|
—
|
|
(69,098
|
)
|
|||||||||
|
Dividends paid
|
(35,357
|
)
|
—
|
|
—
|
|
—
|
|
(35,357
|
)
|
|||||||||
|
Intercompany dividends
|
26,115
|
|
—
|
|
(26,115
|
)
|
—
|
|
—
|
|
|||||||||
|
Dividends to noncontrolling interest
|
—
|
|
—
|
|
(2,634
|
)
|
—
|
|
(2,634
|
)
|
|||||||||
|
Proceeds from exercises under stock plans
|
13,075
|
|
—
|
|
—
|
|
—
|
|
13,075
|
|
|||||||||
|
Excess tax benefits from stock option exercises
|
1,699
|
|
—
|
|
—
|
|
—
|
|
1,699
|
|
|||||||||
|
Purchase of treasury shares
|
(168,983
|
)
|
—
|
|
—
|
|
—
|
|
(168,983
|
)
|
|||||||||
|
Purchase of common treasury shares - stock plan exercises
|
(13,854
|
)
|
—
|
|
—
|
|
—
|
|
(13,854
|
)
|
|||||||||
|
Net cash flows from financing activities
|
(177,518
|
)
|
—
|
|
(42,487
|
)
|
—
|
|
(220,005
|
)
|
|||||||||
|
Effect of exchange rate changes on cash and cash equivalents
|
—
|
|
(356
|
)
|
(26,240
|
)
|
—
|
|
(26,596
|
)
|
|||||||||
|
Net change in cash and cash equivalents
|
(7,588
|
)
|
1,851
|
|
(16,768
|
)
|
—
|
|
(22,505
|
)
|
|||||||||
|
Cash and cash equivalents—beginning of year
|
69,869
|
|
2,157
|
|
299,553
|
|
—
|
|
371,579
|
|
|||||||||
|
Cash and cash equivalents—end of period
|
$
|
62,281
|
|
$
|
4,008
|
|
$
|
282,785
|
|
$
|
—
|
|
$
|
349,074
|
|
||||
91
VALMONT INDUSTRIES, INC. AND SUBSIDIARIES
NOTES TO CONSOLIDATED FINANCIAL STATEMENTS (Continued)
Three-year period ended December 30, 2017
(Dollars in thousands, except per share amounts)
(21) QUARTERLY FINANCIAL DATA (Unaudited)
|
Net Earnings
|
|||||||||||||||||||||||||||||||
|
Gross
|
Per Share
|
Stock Price
|
Dividends
|
||||||||||||||||||||||||||||
|
Net Sales
|
Profit
|
Amount
|
Basic
|
Diluted
|
High
|
Low
|
Declared
|
||||||||||||||||||||||||
|
2017
|
|||||||||||||||||||||||||||||||
|
First
|
$
|
637,473
|
|
$
|
164,605
|
|
$
|
38,979
|
|
$
|
1.73
|
|
$
|
1.72
|
|
$
|
165.20
|
|
$
|
135.95
|
|
$
|
0.375
|
|
|||||||
|
Second
|
712,737
|
|
183,280
|
|
45,664
|
|
2.03
|
|
2.01
|
|
157.60
|
|
144.65
|
|
0.375
|
|
|||||||||||||||
|
Third
|
680,779
|
|
163,594
|
|
35,208
|
|
1.56
|
|
1.55
|
|
160.35
|
|
140.90
|
|
0.375
|
|
|||||||||||||||
|
Fourth (1)
|
714,978
|
|
170,289
|
|
(3,611
|
)
|
(0.16
|
)
|
|
(0.16
|
)
|
176.35
|
|
153.65
|
|
0.375
|
|
||||||||||||||
|
Year
|
$
|
2,745,967
|
|
$
|
681,768
|
|
$
|
116,240
|
|
$
|
5.16
|
|
$
|
5.11
|
|
$
|
176.35
|
|
$
|
135.95
|
|
$
|
1.50
|
|
|||||||
|
2016
|
|||||||||||||||||||||||||||||||
|
First
|
$
|
596,605
|
|
$
|
160,968
|
|
$
|
32,969
|
|
$
|
1.45
|
|
$
|
1.45
|
|
$
|
125.69
|
|
$
|
96.50
|
|
$
|
0.375
|
|
|||||||
|
Second
|
640,249
|
|
175,117
|
|
42,026
|
|
1.86
|
|
1.85
|
|
145.94
|
|
117.10
|
|
0.375
|
|
|||||||||||||||
|
Third
|
610,247
|
|
155,023
|
|
28,173
|
|
1.25
|
|
1.24
|
|
139.62
|
|
125.60
|
|
0.375
|
|
|||||||||||||||
|
Fourth (2)
|
674,575
|
|
165,135
|
|
70,064
|
|
3.12
|
|
3.10
|
|
156.05
|
|
120.65
|
|
0.375
|
|
|||||||||||||||
|
Year
|
$
|
2,521,676
|
|
$
|
656,243
|
|
$
|
173,232
|
|
$
|
7.68
|
|
$
|
7.63
|
|
$
|
156.05
|
|
$
|
96.50
|
|
$
|
1.50
|
|
|||||||
Earnings per share are computed independently for each of the quarters. Therefore, the sum of the quarterly earnings per share may not equal the total for the year.
_______________________________
|
(1)
|
The fourth quarter of 2017 was impacted by the 2017 Tax Act. We remeasured our U.S. deferred income tax assets using a blended rate of
25.0%
recognizing deferred income tax expense of approximately
$20,372
(
$0.90
per share). We also recorded a provision charge of approximately
$9,890
(
$0.44
per share) of income tax expense for the deemed repatriation transition tax and
$11,673
(
$0.51
per share) of deferred expenses related to foreign withholding taxes and U.S. state income taxes.
|
(2) The fourth quarter of 2016 included a deferred income tax benefit of
$30,590
(
$1.35
per share)
primarily attributable to the re-measurement of the deferred tax asset related to the Company's U.K. defined benefit pension plan. In addition, fiscal 2016 included
$9,888
(
$0.44
per share) recorded as a valuation allowance against a tax credit asset. Finally, the fourth quarter of 2016 included the reversal of a contingent liability that was recognized as part of the Delta purchase accounting of
$16,591
(
$0.73
per share).
92
None.
The Company carried out an evaluation under the supervision and with the participation of the Company’s management, including the Company’s Chief Executive Officer and Chief Financial Officer, of the effectiveness of the design and operation of the Company’s disclosure controls and procedures pursuant to Securities Exchange Act Rule 13a-15. Based upon that evaluation, the Chief Executive Officer and Chief Financial Officer concluded that, as of the end of the period covered by this report, the Company’s disclosure controls and procedures are effective to provide reasonable assurance that information required to be disclosed by the Company in the reports the Company files or submits under the Securities Exchange Act of 1934 is (1) accumulated and communicated to management, including the Company’s Chief Executive Officer and Chief Financial Officer, to allow timely decisions regarding required disclosures and (2) recorded, processed, summarized and reported, within the time periods specified in the Commission’s rules and forms.
MANAGEMENT’S REPORT ON INTERNAL CONTROL OVER FINANCIAL REPORTING
The Company’s management is responsible for establishing and maintaining adequate internal control over financial reporting as such term is defined in Securities Exchange Act Rule 13a-15(f). The Company carried out an evaluation under the supervision and with the participation of the Company’s management, including the Company’s Chief Executive Officer and Chief Financial Officer, of the effectiveness of the Company’s internal control over financial reporting. The Company’s management used the framework in
Internal Control—Integrated Framework
(2013)
issued by the Committee of Sponsoring Organizations (COSO) to perform this evaluation. Based on that evaluation, the Company’s management concluded that the Company’s internal control over financial reporting was effective as of December 30, 2017.
The effectiveness of the Company’s internal control over financial reporting as of December 30, 2017 has been audited by Deloitte & Touche LLP, an independent registered public accounting firm, as stated in their report, a copy of which is included in this Annual Report on Form 10-K.
93
REPORT OF INDEPENDENT REGISTERED PUBLIC ACCOUNTING FIRM
To the Shareholders and Board of Directors of Valmont Industries, Inc.
Opinion on Internal Control over Financial Reporting
We have audited the internal control over financial reporting of Valmont Industries, Inc. and subsidiaries (the “Company”) as of
December 30, 2017
, based on criteria established in
Internal Control—Integrated Framework (2013)
issued by the Committee of Sponsoring Organizations of the Treadway Commission (COSO). In our opinion, the Company maintained, in all material respects, effective internal control over financial reporting as of
December 30, 2017
, based on the criteria established in
Internal Control—Integrated Framework (2013)
issued by COSO.
We have also audited, in accordance with the standards of the Public Company Accounting Oversight Board (United States) (PCAOB), the consolidated financial statements as of and for the year ended
December 30, 2017
, of the Company and our report dated
February 28, 2018
expressed an unqualified opinion on those financial statements.
Basis for Opinion
The Company’s management is responsible for maintaining effective internal control over financial reporting and for its assessment of the effectiveness of internal control over financial reporting, included in the accompanying
Management’s Report on Internal Control Over Financial Reporting
. Our responsibility is to express an opinion on the Company’s internal control over financial reporting based on our audit. We are a public accounting firm registered with the PCAOB and are required to be independent with respect to the Company in accordance with the U.S. federal securities laws and the applicable rules and regulations of the Securities and Exchange Commission and the PCAOB.
We conducted our audit in accordance with the standards of the PCAOB. Those standards require that we plan and perform the audit to obtain reasonable assurance about whether effective internal control over financial reporting was maintained in all material respects. Our audit included obtaining an understanding of internal control over financial reporting, assessing the risk that a material weakness exists, testing and evaluating the design and operating effectiveness of internal control based on the assessed risk, and performing such other procedures as we considered necessary in the circumstances. We believe that our audit provides a reasonable basis for our opinion.
Definition and Limitations of Internal Control over Financial Reporting
A company’s internal control over financial reporting is a process designed to provide reasonable assurance regarding the reliability of financial reporting and the preparation of financial statements for external purposes in accordance with generally accepted accounting principles. A company’s internal control over financial reporting includes those policies and procedures that (1) pertain to the maintenance of records that, in reasonable detail, accurately and fairly reflect the transactions and dispositions of the assets of the company; (2) provide reasonable assurance that transactions are recorded as necessary to permit preparation of financial statements in accordance with generally accepted accounting principles, and that receipts and expenditures of the company are being made only in accordance with authorizations of management and directors of the company; and (3) provide reasonable assurance regarding prevention or timely detection of unauthorized acquisition, use, or disposition of the company’s assets that could have a material effect on the financial statements.
Because of its inherent limitations, internal control over financial reporting may not prevent or detect misstatements. Also, projections of any evaluation of effectiveness to future periods are subject to the risk that controls may become inadequate because of changes in conditions, or that the degree of compliance with the policies or procedures may deteriorate.
/s/ Deloitte & Touche LLP
Omaha, Nebraska
February 28, 2018
94
Shareholder Return Performance Graphs
The graphs below compare the yearly change in the cumulative total shareholder return on the Company’s common stock with the cumulative total returns of the S&P Mid Cap 400 Index and the S&P Mid Cap 400 Industrial Machinery Index for the five and ten-year periods ended
December 30, 2017
. The Company was added to these indexes in 2009 by Standard & Poor’s. The graphs assume that the beginning value of the investment in Valmont Common Stock and each index was $100 and that all dividends were reinvested.

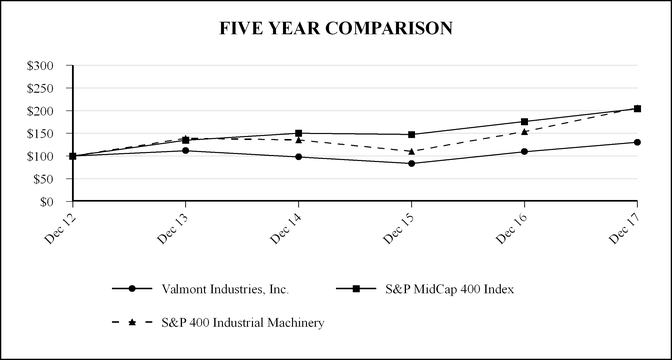
95
Except for the information relating to the executive officers of the Company set forth in Part I of this 10-K Report, the information called for by items 10, 11, and 13 is incorporated by reference to the sections entitled “Certain Shareholders”, “Corporate Governance”, “Board of Directors and Election of Directors”, “Compensation Discussion and Analysis”, "Compensation Risk Assessment", “Human Resources Committee Report”, "Pay Ratio Information", “Summary Compensation Table”, “Grants of Plan-Based Awards for Fiscal Year 2017”, “Outstanding Equity Awards at Fiscal Year-End”, “Options Exercised in Fiscal 2017”, “Nonqualified Deferred Compensation”, “Director Compensation”, “Potential Payments Upon Termination or Change-in-Control” and “Section 16(a) Beneficial Ownership Reporting Compliance” in the Proxy Statement.
The Company has adopted a Code of Ethics for Senior Officers that applies to the Company’s Chief Executive Officer, Chief Financial Officer and Controller and has posted the code on its website at
www.valmont.com
through the “Investors Relations” link. The Company intends to satisfy the disclosure requirement under Item 5.05 of Form 8-K relating to amendments to or waivers from any provision of the Code of Ethics for Senior Officers applicable to the Company’s Chief Executive Officer, Chief Financial Officer or Controller by posting that information on the Company’s Web site at
www.valmont.com
through the “Investors Relations” link.
See Item 10.
Incorporated herein by reference to “Certain Shareholders” and “Equity Compensation Plan Information” in the Proxy Statement.
See Item 10.
The information called for by Item 14 is incorporated by reference to the sections titled “Ratification of Appointment of Independent Auditors” in the Proxy Statement.
96
(a)(1)(2)
Financial Statements and Schedules
.
The following consolidated financial statements of the Company and its subsidiaries are included herein as listed below:
|
Consolidated Financial Statements
|
|
|
Consolidated Balance Sheets—December 30, 2017 and December 31, 2016
|
|
|
The following financial statement schedule of the Company is included herein:
|
|
All other schedules have been omitted as the required information is inapplicable or the information is included in the consolidated financial statements or related notes. Separate financial statements of the registrant have been omitted because the registrant meets the requirements which permit omission.
(a)(3)
The exhibits listed on the "Index to Exhibits” are filed with this Form 10-K or incorporated by reference as set forth below.
(b)
The exhibits listed on the "Index to Exhibits” are filed with this Form 10-K or incorporated by reference as set forth below.
(c) Additional Financial Statement Schedules
97
Schedule II
VALMONT INDUSTRIES, INC. AND SUBSIDIARIES
Valuation and Qualifying Accounts
(Dollars in thousands)
|
Balance at
beginning of period |
Charged to
profit and loss |
Currency Translation Adjustment
|
Deductions
from reserves* |
Balance at
close of period |
||||||||||||
|
Fifty-three weeks ended December 30, 2017
|
||||||||||||||||
|
Reserve deducted in balance sheet from the asset to which it applies—
|
||||||||||||||||
|
Allowance for doubtful receivables
|
$
|
18,991
|
|
2,060
|
|
510
|
|
(11,748
|
)
|
$
|
9,813
|
|
||||
|
Allowance for deferred income tax asset valuation
|
81,923
|
|
7,728
|
|
5,762
|
|
(67,549
|
)
|
27,864
|
|
||||||
|
Fifty-two weeks ended December 31, 2016
|
||||||||||||||||
|
Reserve deducted in balance sheet from the asset to which it applies—
|
||||||||||||||||
|
Allowance for doubtful receivables
|
$
|
21,008
|
|
1,273
|
|
(734
|
)
|
(2,556
|
)
|
$
|
18,991
|
|
||||
|
Allowance for deferred income tax asset valuation
|
90,837
|
|
9,888
|
|
(18,129
|
)
|
(673
|
)
|
81,923
|
|
||||||
|
Fifty-two weeks ended December 26, 2015
|
||||||||||||||||
|
Reserve deducted in balance sheet from the asset to which it applies—
|
||||||||||||||||
|
Allowance for doubtful receivables
|
$
|
9,922
|
|
12,420
|
|
(1,143
|
)
|
(191
|
)
|
$
|
21,008
|
|
||||
|
Allowance for deferred income tax asset valuation
|
104,487
|
|
1,267
|
|
(14,917
|
)
|
—
|
|
90,837
|
|
||||||
______________________________________________
|
*
|
The deductions from reserves are net of recoveries.
|
98
INDEX TO EXHIBITS
|
—
|
The Company’s Restated Certificate of Incorporation, as amended. This document was filed as Exhibit 3.1 to the Company’s Quarterly Report on Form 10-Q (Commission file number 001-31429) for the quarter ended March 28, 2009 and is incorporated herein by this reference.
|
|
|
—
|
The Company's By-Laws, as amended. This document was filed as Exhibit 3.1 to the Company's Quarterly Report on Form 10-Q for the quarter ended March 29, 2014 and is incorporated herein (Commission file number 001-31429) by reference.
|
|
|
—
|
Credit Agreement, dated as of August 15, 2012, among the Company, Valmont Industries Holland B.V. and Valmont Group Pty. Ltd., as Borrowers, JPMorgan Chase Bank, N.A., as Administrative Agent, and the other lenders party thereto. This document was filed as Exhibit 10.1 to the Company's Current Report on Form 8-K (Commission file number 001-31429) dated August 15, 2012 and is incorporated herein by reference.
|
|
|
—
|
First Amendment dated as of October 17, 2014 to Credit Agreement, dated as of August 15, 2012, among the Company, Valmont Industries Holland B.V. and Valmont Group Pty. Ltd., as Borrowers, JPMorgan Chase Bank, N.A., as Administrative Agent, and the other lenders party thereto. This document was filed as exhibit 10.1 to the Company's Current Report on Form 8-K (Commission file number 001-31429) dated October 17, 2014 and is incorporated herein by this reference.
|
|
|
—
|
Second Amendment dated as of February 23, 2016 to Credit Agreement, dated as of August 15, 2012, among the Company, Valmont Industries Holland B.V. and Valmont Group Pty. Ltd., as Borrowers, JPMorgan Chase Bank, N.A., as Administrative Agent, and the other lenders party thereto. This document was filed as Exhibit 10.1 to the Company’s Current Report on Form 8-K (Commission file number 001-31429) dated February 23, 2016 and is incorporated herein by reference.
|
|
|
—
|
First Amended and Restated Credit Agreement, dated as of October 18, 2017, among the Company, Valmont Industries Holland B.V. and Valmont Group Pty. Ltd., as Borrowers, JPMorgan Chase Bank, N.A., as Administrative Agent, and the other lenders party thereto. This document was filed as Exhibit 10.1 to the Company’s Current Report on Form 8-K (Commission file number 001-31429) dated October 18, 2017 and is incorporated herein by reference.
|
|
|
Indenture relating to senior debt, dated as of April 12, 2010, among Valmont Industries, Inc., the Subsidiary Guarantors party thereto and Wells Fargo Bank, National Association., as Trustee. This document was filed as Exhibit 4.1 to the Company’s Current Report on Form 8-K (Commission file number 001-31429) dated April 12, 2010 and is incorporated herein by this reference.
|
||
|
—
|
First Supplemental Indenture, dated as of April 12, 2010, to indenture relating to senior debt, dated as of April 12, 2010, among Valmont Industries, Inc., the Subsidiary Guarantors party thereto and Wells Fargo Bank, National Association, as Trustee. This document was filed as Exhibit 4.2 to the Company’s Current Report on Form 8-K (Commission file number 001-31429) dated April 12, 2010 and is incorporated herein by this reference.
|
|
|
—
|
Second Supplemental Indenture, dated as of September 22, 2014, to Indenture relating to senior debt, dated as of April 12, 2010, among Valmont Industries, Inc., the Subsidiary Guarantors party thereto and Wells Fargo Bank, National Association, as Trustee. This document was filed as Exhibit 4.2 to the Company's Current Report on Form 8-K (Commission file number 001-31429) dated September 22, 2014 and is incorporated herein by this reference.
|
|
99
|
—
|
Third Supplemental Indenture, dated as of September 22, 2014, to Indenture relating to senior debt, dated as of April 12, 2010, among Valmont Industries, Inc., the Subsidiary Guarantors party thereto and Wells Fargo Bank, National Association, as Trustee. This document was filed as Exhibit 4.3 to the Company's Current Report on Form 8-K (Commission file number 001-31429) dated September 22, 2014 and is incorporated herein by this reference.
|
|
|
—
|
The Company’s 2008 Stock Plan. This document was filed as Exhibit 10.5 to the Company's Annual Report on Form 10-K (Commission file number 001-31429) for the fiscal year ended December 28, 2013 and is incorporated herein by this reference.
|
|
|
—
|
The Company's 2013 Stock Plan. This document was filed as Exhibit 10.1 to the Company’s Current Report on Form 8-K (Commission file number 001-31429) dated April 30, 2013 and is incorporated herein by reference.
|
|
|
2013 Stock Plan Amendment, dated December 17, 2015. This document was filed as Exhibit 10.7 to the Company’s Annual Report on Form 10-K (Commission file number 001-31429) for the year ended December 26, 2015 and is incorporated herein by this reference.
|
||
|
—
|
Form of Stock Option Agreement. This document was filed as Exhibit 10.8 to the Company’s Annual Report on Form 10-K (Commission file number 001-31429) for the year ended December 31, 2016 and is incorporated herein by this reference.
|
|
|
—
|
Form of Restricted Stock Agreement. This document was filed as Exhibit 10.4 to the Company’s Current Report on Form 8-K (Commission file number 001-31429) dated April 30, 2013 and is incorporated herein by reference.
|
|
|
—
|
Form of Restricted Stock Unit Agreement (Director). This document was filed as Exhibit 10.5 to the Company’s Current Report on Form 8-K (Commission file number 001-31429) dated April 30, 2013 and is incorporated herein by reference.
|
|
|
—
|
Form of Restricted Stock Unit Agreement (Domestic). This document was filed as Exhibit 10.11 to the Company’s Annual Report on Form 10-K (Commission file number 001-31429) for the year ended December 31, 2016 and is incorporated herein by this reference.
|
|
|
—
|
Form of Restricted Stock Unit Agreement (International). This document was filed as Exhibit 10.12 to the Company’s Annual Report on Form 10-K (Commission file number 001-31429) for the year ended December 26, 2015 and is incorporated herein by this reference.
|
|
|
—
|
Form of Director Stock Option Agreement. This document was filed as Exhibit 10.9 to the Company's Annual Report on form 10-K (Commission file number 001-31429) for the year ended December 29, 2012 and is incorporated herein by reference.
|
|
|
—
|
The 2013 Valmont Executive Incentive Plan. This document was filed as Exhibit 10.2 to the Company’s Current Report on Form 8-K (Commission file number 001-31429) dated April 30, 2013 and is incorporated herein by reference.
|
|
|
—
|
The Amended Unfunded Deferred Compensation Plan for Nonemployee Directors. This document was filed as Exhibit 10.15 to the Company's Annual Report on Form 10-K (Commission file number 001-31429) for the fiscal year ended December 28, 2013 and is incorporated herein by this reference.
|
|
100
|
—
|
VERSP Deferred Compensation Plan. This document was filed as Exhibit 10.16 to the Company's Annual Report on Form 10-K (Commission file number 001-31429) for the fiscal year ended December 28, 2013 and is incorporated herein by this reference.
|
|
|
—
|
Subsidiaries of the Company.
|
|
|
—
|
Consent of Deloitte & Touche LLP.
|
|
|
—
|
Power of Attorney.
|
|
|
—
|
Section 302 Certification of Chief Executive Officer.
|
|
|
—
|
Section 302 Certification of Chief Financial Officer.
|
|
|
—
|
Section 906 Certifications.
|
|
|
Exhibit 101
|
—
|
The following financial information from the Company’s Annual Report on Form 10-K for the year ended December 30, 2017, formatted in XBRL (eXtensible Business Reporting Language): (i) the Consolidated Statements of Earnings, (ii) the Consolidated Statements of Comprehensive Income,(iii) the Consolidated Balance Sheets, (iv) the Consolidated Statements of Cash Flows, (v) the Consolidated Statements of Shareholders’ Equity, (vi) Notes to Consolidated Financial Statements, and (vii) document and entity information.
|
_____________________________________________
|
*
|
Filed herewith
|
Pursuant to Item 601(b)(4) of Regulation S-K, certain instruments with respect to the registrant’s long-term debt are not filed with this Form 10-K. Valmont will furnish a copy of such long-term debt agreements to the Securities and Exchange Commission upon request.
Management contracts and compensatory plans are set forth as exhibits 10.1 through 10.12.
101
SIGNATURES
Pursuant to the requirements of Section 13 or 15(d) of the Securities Exchange Act of 1934, the registrant has duly caused this report to be signed on its behalf by the undersigned, thereunto duly authorized, on the
28th day of February, 2018
.
|
Valmont Industries, Inc.
|
||
|
By:
|
/s/
STEPHEN G. KANIEWSKI
|
|
|
Stephen G. Kaniewski
President and Chief Executive Officer
|
||
Pursuant to the requirements of the Securities Exchange Act of 1934, this report has been signed below by the following persons on behalf of the registrant and in the capacities indicated and on the dates indicated.
|
Signature
|
Title
|
Date
|
||||||||||||||||||||
|
/s/
Stephen G. Kaniewski
|
Director, President and Chief Executive Officer (Principal Executive Officer)
|
2/28/2018
|
||||||||||||||||||||
|
Stephen G. Kaniewski
|
||||||||||||||||||||||
|
/s/
MARK C. JAKSICH
|
Executive Vice President and Chief Financial Officer (Principal Financial Officer)
|
2/28/2018
|
||||||||||||||||||||
|
Mark C. Jaksich
|
||||||||||||||||||||||
|
/s/
TIMOTHY
P.
FRANCIS
|
Vice President and Controller (Principal Accounting Officer)
|
2/28/2018
|
||||||||||||||||||||
|
Timothy P. Francis
|
||||||||||||||||||||||
|
Mogens C. Bay*
|
Daniel P. Neary*
|
|||||||||||||||||||||
|
K.R. den Daas*
|
Catherine J. Paglia*
|
|||||||||||||||||||||
|
Theo W. Freye*
|
Clark T. Randt*
|
|||||||||||||||||||||
|
James B. Milliken*
|
Walter Scott, Jr.*
|
|||||||||||||||||||||
|
Donna M. Milrod*
|
Kenneth E. Stinson*
|
|||||||||||||||||||||
______________________________________________
|
*
|
Stephen G. Kaniewski, by signing his name hereto, signs the Annual Report on behalf of each of the directors indicated on this
28th day of February, 2018
. A Power of Attorney authorizing Stephen G. Kaniewski to sign the Annual Report on Form 10-K on behalf of each of the indicated directors of Valmont Industries, Inc. has been filed herein as Exhibit 24.
|
|
By:
|
/s/
STEPHEN G. KANIEWSKI
|
|
|
Stephen G. Kaniewski
Attorney-in-Fact
|
||
102
TABLE OF CONTENTS
Part IItem 1. BusinessItem 1A. Risk FactorsItem 1B. Unresolved Staff CommentsItem 2. PropertiesItem 3. Legal ProceedingsItem 4. Mine Safety DisclosuresPart IIItem 5. Market For Registrant S Common Equity, Related StockholderItem 6. Selected Financial DataItem 7. Management S Discussion and Analysis Of Financial Condition and Results Of OperationItem 7A. Quantitative and Qualitative Disclosures About Market RiskItem 8. Financial Statements and Supplementary DataItem 9. Changes in and Disagreements with Accountants on Accounting and Financial DisclosureItem 9A. Controls and ProceduresItem 9B. Other InformationPart IIIItem 10. Directors, Executive Officers and Corporate GovernanceItem 11. Executive CompensationItem 12. Security Ownership Of Certain Beneficial Owners and Management and Related Stockholder MattersItem 13. Certain Relationships and Related Transactions, and Director IndependenceItem 14. Principal Accountant Fees and ServicesPart IVItem 15. Exhibits and Financial Statement Schedules