VOXX INTERNATIONAL CORP
10-Ks and 10-Qs
|
|
|
|
|
|
|
|
|
|
|
|
|
|
|
|
|
|
|
|
|
|
|
|
|
|
|
|
|
|
|
|
|
|
|
|
|
|
|
|
|
|
|
|
UNITED STATES SECURITIES AND EXCHANGE COMMISSION
Washington, D.C. 20549
FORM 10-K
Annual Report Pursuant to Section 13 or 15 (d) of the Securities Exchange Act of 1934
For the fiscal year ended
February 28, 2013
Commission file number 0-28839
VOXX INTERNATIONAL CORPORATION
(Exact name of registrant as specified in its charter)
|
Delaware
(State or other jurisdiction of
incorporation or organization)
|
13-1964841
(IRS Employer Identification No.)
|
|
180 Marcus Blvd., Hauppauge, New York
(Address of principal executive offices)
|
11788
(Zip Code)
|
|
(631) 231-7750
(Registrant's telephone number, including area code)
|
|
|
Securities registered pursuant to Section 12(b) of the Act:
|
|
|
|
|
|
Title of each class:
|
Name of Each Exchange on which Registered
|
|
Class A Common Stock $.01 par value
|
The Nasdaq Stock Market LLC
|
Securities registered pursuant to Section 12(g) of the Act:
None
Indicate by check mark if the registrant is a well-known seasoned issuer, as defined in Rule 405 of the Securities Act.
Yes
o
No
x
Indicate by check mark if the registrant is not required to file reports pursuant to Section 13 or Section 15(d) of the Act.
Yes
o
No
x
Indicate by check mark whether the registrant (1) has filed all reports required to be filed by Section 13 or 15(d) of the Securities Exchange Act of 1934 during the preceding 12 months (or for such shorter period that the registrant was required to file such reports) and (2) has been subject to such filing requirements for the past 90 days.
Yes
x
No
o
Indicate by check mark if disclosure of delinquent filers pursuant to Item 405 of Regulation S-K is not contained herein, and will not be contained, to the best of registrant's knowledge, in definitive proxy or information statements incorporated by reference in Part III of this Form 10-K or any amendment to this Form 10-K.
x
Indicate by check mark whether registrant is a large accelerated filer, an accelerated filer, or a non-accelerated filer or a smaller reporting company. See definition of "accelerated filer", "large accelerated filer" and "smaller reporting company" in Rule 12b-2 of the Exchange Act. (check one):
Large accelerated filer
o
Accelerated filer
x
Non-accelerated filer
o
Smaller reporting company
o
Indicate by check mark whether the Registrant is a shell company (as defined in rule 12b-2 of the Act).
Yes
o
No
x
1
Indicate by check mark whether the registrant has submitted electronically and posted on its corporate Web site, if any, every Interactive Data File required to be submitted and posted pursuant to Rule 405 of Regulation S-T (§232.405 of this chapter) during the preceding 12 months (or for such shorter period that the registrant was required to submit and post such files).
Yes
x
No
o
The aggregate market value of the common stock held by non-affiliates of the Registrant was
$159,184,640
(based upon closing price on the Nasdaq Stock Market on August 31,
2012
).
The number of shares outstanding of each of the registrant's classes of common stock, as of
May 14, 2013
was:
|
Class
|
Outstanding
|
|
|
|
|
Class A common stock $.01 par value
|
21,586,269
|
|
Class B common stock $.01 par value
|
2,260,954
|
DOCUMENTS INCORPORATED BY REFERENCE
Part III - (Items 10, 11, 12, 13 and 14) Proxy Statement for Annual Meeting of Stockholders to be filed on or before June 28, 2013.
2
VOXX INTERNATIONAL CORPORATION
Index to Form 10-K
|
Table of Contents
|
||
|
|
|
|
|
PART I
|
||
|
|
|
|
|
Item 1
|
Business
|
|
|
Item 1A
|
Risk Factors
|
|
|
Item 1B
|
Unresolved Staff Comments
|
|
|
Item 2
|
Properties
|
|
|
Item 3
|
Legal Proceedings
|
|
|
Item 4
|
Removed and Reserved
|
|
|
|
|
|
|
PART II
|
||
|
|
|
|
|
Item 5
|
Market for the Registrant's Common Equity, Related Stockholder Matters and Issuer Purchases of Equity Securities
|
|
|
Item 6
|
Selected Consolidated Financial Data
|
|
|
Item 7
|
Management's Discussion and Analysis of Financial Condition and Results of Operations
|
|
|
Item 7A
|
Quantitative and Qualitative Disclosures About Market Risk
|
|
|
Item 8
|
Consolidated Financial Statements and Supplementary Data
|
|
|
Item 9
|
Changes in and Disagreements with Accountants on Accounting and Financial Disclosure
|
|
|
Item 9A
|
Controls and Procedures
|
|
|
Item 9B
|
Other Information
|
|
|
|
|
|
|
PART III
|
||
|
|
|
|
|
Item 10
|
Directors, Executive Officers and Corporate Governance
|
|
|
Item 11
|
Executive Compensation
|
|
|
Item 12
|
Security Ownership of Certain Beneficial Owners and Management and Related Stockholder Matters
|
|
|
Item 13
|
Certain Relationships and Related Transactions, and Director Independence
|
|
|
Item 14
|
Principal Accounting Fees and Services
|
|
|
|
|
|
|
PART IV
|
||
|
|
|
|
|
Item 15
|
Exhibits, Financial Statement Schedules
|
|
|
|
|
|
|
SIGNATURES
|
||
3
CAUTIONARY STATEMENT RELATING TO THE SAFE HARBOR PROVISIONS OF THE PRIVATE SECURITIES LITIGATION REFORM ACT OF 1995
This Annual Report on Form 10-K, including "Management's Discussion and Analysis of Financial Condition and Results of Operations" in Item 7, and the information incorporated by reference contains "forward-looking statements" within the meaning of section 27A of the Securities Act of 1933 and Section 21E of the Securities Exchange Act of 1934. We intend those forward looking-statements to be covered by the safe harbor provisions for forward-looking statements. All statements regarding our expected financial position and operating results, our business strategy, our financing plans and the outcome of any contingencies are forward-looking statements. Any such forward-looking statements are based on current expectations, estimates, and projections about our industry and our business. Words such as "anticipates," "expects," "intends," "plans," "believes," "seeks," "estimates," or variations of those words and similar expressions are intended to identify such forward-looking statements. Forward-looking statements are subject to risks and uncertainties that could cause actual results to differ materially from those stated in or implied by any forward-looking statements. Factors that could cause actual results to differ materially from forward-looking statements include, but are not limited to, matters listed in Item 1A under "Risk Factors" of this annual report. The Company assumes no obligation and does not intend to update these forward-looking statements.
NOTE REGARDING DOLLAR AMOUNTS AND FISCAL YEAR
In this annual report, all dollar amounts are expressed in thousands, except for share prices and per-share amounts. Unless specifically indicated otherwise, all amounts and percentages in our Form 10-K are exclusive of discontinued operations.
The Company’s current fiscal year began March 1, 2012 and ended
February 28, 2013
.
Effective December 1, 2011, Audiovox Corporation changed its name to VOXX International Corporation ("Voxx," "We," "Our," "Us" or the "Company"). The Company believes that the name VOXX International would be a name that better represents the widely diversified interests of the Company, and the more than 30 global brands it has acquired and grown throughout the years, achieving a powerful international corporate image and creating a vehicle for each of these respective brands to emerge with its own identity. Voxx is a leading international distributor in the automotive, audio and consumer accessory industries. On March 14, 2012, the Company acquired Car Communication Holding, GmbH and its worldwide subsidiaries, a recognized tier-1 supplier of communications and infotainment solutions, primarily in the automotive industry. We conduct our business through nineteen wholly-owned subsidiaries: American Radio Corp., Audiovox Electronics Corporation ("AEC"), VOXX Accessories Corp. ("AAC"), Audiovox Consumer Electronics, Inc. ("ACE"), Audiovox German Holdings GmbH ("Audiovox Germany"), Audiovox Venezuela, C.A., Audiovox Canada Limited, Audiovox Hong Kong Ltd., Audiovox International Corp., Audiovox Mexico, S. de R.L. de C.V. ("Audiovox Mexico"), Technuity, Inc., Code Systems, Inc., Oehlbach Kabel GmbH ("Oehlbach"), Schwaiger GmbH ("Schwaiger"), Invision Automotive Systems, Inc. ("Invision"), Klipsch Holding LLC ("Klipsch"), Car Communication Holding GmbH ("Hirschmann"), Omega Research and Development, LLC ("Omega") and Audiovox Websales LLC. We market our products under the Audiovox® brand name, other brand names and licensed brands, such as Acoustic Research®, Advent®, Ambico®, Car Link®, Chapman®, Code-Alarm®, Discwasher®, Energy®, Heco®, Hirschmann Car Communication®, Incaar
™
, Invision®, Jamo®, Jensen®, Klipsch®, Mac Audio
™
, Magnat®, Mirage®, Movies2Go®, Oehlbach®, Omega®, Phase Linear®, Prestige®, Pursuit®, RCA®, RCA Accessories®, Recoton®, Road Gear®, Schwaiger®, Spikemaster® and Terk®, as well as private labels through a large domestic and international distribution network. We also function as an OEM ("Original Equipment Manufacturer") supplier to several customers.
Audiovox was incorporated in Delaware on April 10, 1987, as successor to a business founded in 1960 by John J. Shalam, our Chairman and controlling stockholder. Our extensive distribution network and long-standing industry relationships have allowed us to benefit from growing market opportunities and emerging niches in the electronics business.
During the fourth quarter of Fiscal 2013, the Company realigned its subsidiaries into three operating segments based upon the Company's products and internal organizational structure. The operating segments consist of the Automotive, Premium Audio and Consumer Accessories segments. The Automotive segment designs, manufactures, distributes and markets rear-seat entertainment, satellite radio products, automotive security, remote start systems, digital TV tuners, mobile antennas, mobile multimedia, aftermarket/OE-styled radios, car-link smartphone telematics application, collision avoidance systems and location-based services. The Premium Audio segment designs, manufactures, distributes and markets home theater systems, high-end loudspeakers, outdoor speakers, iPod/computer speakers, business music systems, cinema speakers, flat panel speakers, soundbars, headphones and Apple Air Play. The Consumer Accessories segment designs and markets remote controls, reception products, wireless speakers,
4
iPod docks/iPod sound, A/V connectivity, portable/home charging, rechargeable battery packs, digital consumer products and personal sound amplifiers. See Note 13 to the Company's Consolidated Financial Statements for segment and geographic area information.
We make available financial information, news releases and other information on our web site at www.voxxintl.com. There is a direct link from the web site to the Securities and Exchange Commission's ("SEC") filings web site, where our annual report on Form 10-K, quarterly reports on Form 10-Q, current reports on Form 8-K and any amendments to these reports filed or furnished pursuant to Section 13(a) or 15(d) of the Securities Exchange Act of 1934 are available free of charge as soon as reasonably practicable after we file such reports and amendments with, or furnish them to, the SEC. In addition, we have adopted a Code of Business Conduct and Ethics which is available free of charge upon request. Any such request should be directed to the attention of: Chris Lis Johnson, Company Secretary, 180 Marcus Boulevard, Hauppauge, New York 11788, (631) 231-7750.
Acquisitions
We have recently acquired and continue to integrate the following acquisitions, discussed below, into our existing business structure:
On March 14, 2012, Voxx International (Germany) GmbH, a wholly owned subsidiary of Voxx, acquired all of the issued and outstanding shares of Car Communication Holding GmbH and its worldwide subsidiaries ("Hirschmann") for a total purchase price of approximately $114 million (based on the rate of exchange as of the close of business on the closing date) plus related transaction fees, expenses and working capital adjustments. Hirschmann is a recognized tier-1 supplier of communications and infotainment solutions and antenna solutions, primarily to the automotive industry, and counts among its global customers Audi, BMW, DAF, Daimler, PSA, Renault, Volkswagen Group and AT&T, among others. Hirschmann delivers technologically advanced automotive antenna systems and automotive digital TV tuner systems and is recognized throughout the industry for its commitment to innovation, having developed the world's first analog to digital tuner and the first digital TV tuner for the Chinese market.
Prior to Fiscal 2013, the Company expanded its market presence by acquiring and fully integrating the following businesses:
On March 1, 2011, Soundtech LLC, a Delaware limited liability company and wholly-owned subsidiary of Voxx, acquired all of the issued and outstanding shares of Klipsch Group, Inc. and its worldwide subsidiaries ("Klipsch") for a total purchase price of $169.6 million including contingent consideration of $2.2 million as a result of a contractual agreement with a former principal shareholder, plus related transaction fees and expenses. Klipsch is a global provider of high-end speakers for audio, multi-media and home theater applications. The acquisition of Klipsch added world-class brand names to Voxx's offerings, increased its distribution network, both domestically and abroad, and provided the Company with entry into the high-end installation market at both the residential and commercial installation market. In addition to the Klipsch® brand, the Klipsch portfolio includes Jamo®, Mirage®, and Energy®.
In February 2010, the Company’s subsidiary, Invision Automotive Systems, Inc. completed the acquisition of the assets of Invision Industries, Inc., a leading manufacturer of rear seat entertainment systems to Original Equipment Manufacturers ("OEM"’s), Toyota port facilities, and car dealers. The purpose of this acquisition was to increase our R&D capabilities, add a manufacturing facility to our business structure and augment our OE group.
In October 2009, Audiovox German Holdings GmbH completed the acquisition of certain assets of Schwaiger GmbH, a German market leader in the consumer electronics, SAT and receiver technologies. The purpose of this acquisition was to expand our European operations and increase our presence in the European accessory market.
Refer to Note 2 "Business Acquisitions" of the Notes to Consolidated Financial Statements for additional information regarding the Fiscal 2013 and Fiscal 2012 acquisitions.
Strategy
Our objective is to grow our business both organically and through strategic acquisitions. We will drive the business organically by continued product development in new and emerging technologies that should increase gross margins, and improve operating income. We are focused on expanding sales both domestically and internationally and broadening our customer and partner base as we bring these new products to our target markets. In addition, we plan to continue to acquire synergistic companies that would allow us to leverage our overhead, penetrate new markets and expand existing product categories.
The key elements of our strategy are as follows:
5
Capitalize on the VOXX family of brands.
We believe the "VOXX" portfolio of brands is one of our greatest strengths and offers us significant opportunity for increased market penetration. Today, VOXX International has over 30 global brands in its portfolio, which provides the Company with the ability to bring to market products under brands that consumers know to be quality. In addition, with such a wide brand portfolio, we can manage channels and sell into multiple outlets as well as leverage relationships with distributors, retailers, aftermarket car dealers and expeditors, and to global Original Equipment Manufacturers (OEMs). Finally, we are open to opportunities to license some of the brands as an additional use of the brands and a growth strategy.
Capitalize on niche product and distribution opportunities in our target markets.
Throughout our history, we have used our extensive distribution and supply networks to capitalize on niche product and distribution opportunities in the automotive, premium audio and consumer accessories categories. We will continue that focus as we remain committed to innovation, developing products internally and through our outsourced technology and manufacturing partners to provide our customers with products that are in demand by consumers.
Combine new, internal manufacturing capabilities with our proven outsourced manufacturing with industry partners
. For years, VOXX International has employed an outsourced manufacturing strategy that has enabled the Company to deliver the latest technological advances without the fixed costs associated with manufacturing. With recent acquisitions, the Company now has added manufacturing capabilities to produce select product lines, such as high-end speakers, rear-seat entertainment systems and digital TV tuners and antennas. This blend of internal and outsourced manufacturing enables the Company to drive innovation, control product quality and speed time-to-market.
Leverage our domestic and international distribution network.
We believe that today VOXX International has the most expansive distribution network in its history. Our distribution network, which includes power retailers, mass merchandisers, distributors, professional and commercial installation channels, car dealers and OEM's will allow us to increase our market penetration. Recently, we have expanded into new channels, such as drug store, hardware and furniture chains.
Grow our international presence.
We continue to expand our international presence in Europe through our subsidiaries in Germany, as well as operations in Canada, Mexico, Venezuela and Hong Kong. We also continue to export from our domestic operations in the United States. Through our most recent acquisitions of Klipsch and Hirschmann we have expanded our presence throughout Europe, the Asia Pacific region and in select emerging markets.
Pursue strategic and complementary acquisitions.
We continue to monitor economic and industry conditions in order to evaluate potential synergistic business acquisitions that would allow us to leverage overhead, penetrate new markets and expand our existing business distribution. Over the past several years, the Company has employed an M&A strategy to build its brand portfolio and enhance its product offering in higher margin product categories, while at the same time, exiting lower margin and commoditized product lines; resulting in improved bottom-line performance. The Company is focused on continuing to grow organically, but may pursue opportunistic acquisitions within the areas of automotive, primarily with OEM accounts, consumer accessories and premium audio.
Improve bottom-line performance and generate sustainable shareholder returns.
The Company has instituted an aggressive strategy in recent years to shift its product mix to higher-margin product categories, while controlling costs and strategically investing in its infrastructure. All of these collective changes have resulted in higher gross profit margins and in recent periods, higher operating and net income. The Company remains focused on growing its business organically, continuing to grow its gross profit margins and leveraging its fixed overhead structure to generate sustainable returns for its shareholders.
Industry
We participate in selected product categories in the automotive, premium audio and consumer accessories markets within the electronics industry. These markets are large and diverse, encompass a broad range of products and offer the ability to specialize in niche product groups. The introduction of new products and technological advancements are the major growth drivers in these markets. Based on this, we continue to introduce new products across all segments, with an increased focus on niche product offerings.
Products
The Company currently reports sales data for the following three operating segments:
Automotive products include:
|
▪
|
mobile multi-media video products, including in-dash, overhead and headrest systems,
|
6
|
▪
|
autosound products including radios, amplifiers and CD changers,
|
|
▪
|
satellite radios including plug and play models and direct connect models,
|
|
▪
|
automotive security and remote start systems,
|
|
▪
|
automotive power accessories,
|
|
▪
|
rear observation and collision avoidance systems,
|
|
▪
|
TV tuners and antennas, and
|
|
▪
|
location based services.
|
Premium Audio products include:
|
▪
|
premium loudspeakers,
|
|
▪
|
architectural speakers,
|
|
▪
|
commercial speakers,
|
|
▪
|
on-ear and in-ear headphones,
|
|
▪
|
soundbars, and
|
|
▪
|
airplay products.
|
Accessories products include:
|
▪
|
High-Definition Television ("HDTV") antennas,
|
|
▪
|
Wireless Fidelity ("WiFi") antennas,
|
|
▪
|
High-Definition Multimedia Interface ("HDMI") accessories,
|
|
▪
|
home electronic accessories such as cabling,
|
|
▪
|
other connectivity products,
|
|
▪
|
power cords,
|
|
▪
|
performance enhancing electronics,
|
|
▪
|
TV universal remotes,
|
|
▪
|
flat panel TV mounting systems,
|
|
▪
|
iPod specialized products,
|
|
▪
|
wireless headphones,
|
|
▪
|
wireless speakers,
|
|
▪
|
rechargeable battery backups (UPS) for camcorders, cordless phones and portable video (DVD) batteries and accessories,
|
|
▪
|
power supply systems and charging products,
|
|
▪
|
electronic equipment cleaning products,
|
|
▪
|
personal sound amplifiers,
|
|
▪
|
set-top boxes,
|
|
▪
|
home and portable stereos,
|
|
▪
|
digital multi-media products, such as personal video recorders and MP3 products,
|
|
▪
|
camcorders,
|
|
▪
|
clock radios,
|
|
▪
|
digital voice recorders, and
|
|
▪
|
portable DVD players.
|
We believe our product groups have expanding market opportunities with certain levels of volatility related to domestic and international markets, new car sales, increased competition by manufacturers, private labels, technological advancements, discretionary consumer spending and general economic conditions. Also, all of our products are subject to price fluctuations, which could affect the carrying value of inventories and gross margins in the future.
Net sales by product category, gross profit and net assets are as follows:
7
|
Fiscal
|
Fiscal
|
Fiscal
|
|||||||||
|
2013
|
2012
|
2011
|
|||||||||
|
Automotive
|
$
|
426,983
|
|
$
|
297,145
|
|
$
|
298,126
|
|
||
|
Premium Audio
|
192,987
|
|
191,427
|
|
20,071
|
|
|||||
|
Consumer Accessories
|
214,275
|
|
215,604
|
|
240,128
|
|
|||||
|
Corporate/Eliminations
|
1,332
|
|
2,886
|
|
3,347
|
|
|||||
|
Total net sales
|
$
|
835,577
|
|
$
|
707,062
|
|
$
|
561,672
|
|
||
|
Gross profit
|
$
|
236,822
|
|
$
|
202,955
|
|
$
|
123,937
|
|
||
|
Gross margin percentage
|
28.3
|
%
|
28.7
|
%
|
22.1
|
%
|
|||||
|
Total assets
|
$
|
829,272
|
|
$
|
632,882
|
|
$
|
501,097
|
|
||
Patents, Trademarks/Tradenames, Licensing and Royalties
The Company regards its trademarks, copyrights, patents, domain names, and similar intellectual property as important to its operations. It relies on trademark, copyright and patent law, domain name regulations, and confidentiality or license agreements to protect its proprietary rights. The Company has registered, or applied for the registration of, a number of patents, trademarks, domain names and copyrights by U.S. and foreign governmental authorities. Additionally, the Company has filed U.S. and international patent applications covering certain of its proprietary technology. The Company renews its registrations, which vary in duration, as it deems appropriate from time to time.
The Company has licensed in the past, and expects that it may license in the future, certain of its proprietary rights to third parties. Some of the Company's products are designed to include intellectual property licensed or otherwise obtained from third parties. While it may be necessary in the future to seek or renew licenses relating to various aspects of the Company's products, the Company believes, based upon past experience and industry practice, such licenses generally could be obtained on commercially reasonable terms; however, there is no guarantee such licenses could be obtained at all. We intend to operate in a way that does not result in willful infringement of the patent, trade secret and other intellectual property rights of other parties. Nevertheless, there can be no assurance that a claim of infringement will not be asserted against us or that any such assertion will not result in a judgment or order requiring us to obtain a license in order to make, use, or sell our products.
License and royalty programs offered to our manufacturers, customers and other electronic suppliers are structured using a fixed amount per unit or a percentage of net sales, depending on the terms of the agreement. Current license and royalty agreements have duration periods which range from 1 to 17 years or continue in perpetuity. Certain agreements may be renewed at termination of the agreement. The Company's license and royalty income is recorded upon sale and amounted to
$2,559
,
$2,239
and
$4,248
for the years ended
February 28, 2013
,
February 29, 2012
and
February 28, 2011
, respectively.
Distribution and Marketing
We sell our products to:
|
•
|
power retailers,
|
|
•
|
mass merchants,
|
|
•
|
regional chain stores,
|
|
•
|
specialty and internet retailers,
|
|
•
|
independent 12 volt retailers,
|
|
•
|
distributors,
|
|
•
|
new car dealers,
|
|
•
|
vehicle manufacturers,
|
|
•
|
vehicle and transportation equipment manufacturers (OEM's),
|
|
•
|
system integrators,
|
|
•
|
communication network providers,
|
|
•
|
smart grid manufacturers,
|
|
•
|
the U.S. military, and
|
|
•
|
cinema operators.
|
8
We sell our products under OEM arrangements with domestic and/or international subsidiaries of automobile manufacturers such as Volkswagen, Audi, BMW, DAF Daimler, Peugeot, Ford Motor Company, Chrysler, General Motors Corporation, Toyota, Kia, Mazda, Subaru, Nissan, Porsche and Bentley. These arrangements require a close partnership with the customer as we develop products to meet specific requirements. OEM products accounted for approximately
33%
,
19%
and
20%
of net sales for the years ended
February 28, 2013
,
February 29, 2012
and
February 28, 2011
, respectively.
Our five largest customers represented
28%
of net sales during the year ended
February 28, 2013
,
26%
for the year ended
February 29, 2012
, and
30%
for the year ended
February 28, 2011
. Best Buy accounted for more than 10% of the Company's sales for Fiscal
2012
and Wal-Mart accounted for more than 10% of the Company's sales for Fiscal
2011
. No one customer accounted for more than 10% of the Company's sales for the year ended
February 28, 2013
.
We also provide value-added management services, which include:
|
•
|
product design and development,
|
|
•
|
engineering and testing,
|
|
•
|
sales training and customer packaging,
|
|
•
|
in-store display design,
|
|
•
|
installation training and technical support,
|
|
•
|
product repair services and warranty,
|
|
•
|
nationwide installation network,
|
|
•
|
warehousing, and
|
|
•
|
specialized manufacturing.
|
We have flexible shipping policies designed to meet customer needs. In the absence of specific customer instructions, we ship products within 24 to 48 hours from the receipt of an order from public warehouses, as well as owned and leased facilities throughout the United States, Canada, Mexico, Venezuela, China, Hong Kong, France, the Netherlands, Hungary and Germany. The Company also employs a direct ship model from our suppliers for select customers upon their request.
Product Development, Warranty and Customer Service
Our product development cycle includes:
|
•
|
identifying consumer trends and potential demand,
|
|
•
|
responding to those trends through product design and feature integration, which includes software design, electrical engineering, industrial design and pre-production testing. In the case of OEM customers, the product development cycle may also include product validation to customer quality standards, and
|
|
•
|
evaluating and testing new products in our own facilities to ensure compliance with our design specifications and standards.
|
Utilizing our company-owned and third party facilities in the United States, Europe and Asia, we work closely with customers and suppliers throughout the product design, testing and development process in an effort to meet the expectations of consumer demand for technologically-advanced and high quality products. Our Hauppauge, New York, Troy, Michigan and Orlando, Florida facilities are ISO/TS 16949:2009 and/or ISO 14001:2004 certified, which requires the monitoring of quality standards in all facets of business.
We are committed to providing product warranties for all of our product lines, which generally range from 90 days up to five years. The Company also provides warranties for certain vehicle security products for the life of the vehicle for the original owner. To support our warranties, we have independent warranty centers throughout the United States, Canada, Mexico, Central America, Puerto Rico, Europe and Venezuela. Our customer service group along with our Company websites, provide product information, answer questions and serve as technical hotlines for installation help for end-users and customers.
Suppliers
We work directly with our suppliers on industrial design, feature sets, product development and testing in order to ensure that our products and component parts meet our design specifications.
We purchase our products and component parts from manufacturers principally located in several Pacific Rim countries, including China, Hong Kong, Indonesia, Malaysia, South Korea, Taiwan and Singapore, as well as the United States, Canada, Mexico and Europe. In selecting our manufacturers, we consider quality, price, service, reputation, financial stability, as well as labor practices, disruptions, or shortages. In order to provide coordination and supervision of supplier performance such as price negotiations,
9
delivery and quality control, we maintain buying and inspection offices in China and Hong Kong. We consider relations with our suppliers to be good and alternative sources of supply are generally available within 120 days. We have few long-term contracts with our suppliers and we generally purchase our products under short-term purchase orders. Although we believe that alternative sources of supply are currently available, an unplanned shift to a new supplier could result in product delays and increased cost, which may have a material impact on our operations.
Competition
The electronics industry is highly competitive across all product categories, and we compete with a number of well-established companies that manufacture and sell similar products. Brand name, design, advancement of technology and features as well as price are the major competitive factors within the electronics industry. Our Automotive products compete against factory-supplied products, including those provided by, among others, Volkswagen, Audi, General Motors, Ford and Chrysler, as well as against major companies in the automotive aftermarket, such as Sony, Panasonic, Kenwood, Directed Electronics, Autopage, Rosen, Myron and Davis, Coby, Phillips, Insignia, and Pioneer and other Tier 1 OEM's, such as Delphi and Kathrein. Our Premium Audio products compete against major companies such as Polk, Definitive, Yamaha, Bose, Pioneer and Sony. Our Consumer Accessories product lines compete against major companies such as Sony, Phillips, Coby, Emerson Radio, Jasco and Belkin.
Financial Information About Foreign and Domestic Operations
The amounts of net sales and long-lived assets, attributable to foreign and domestic operations for all periods presented are set forth in Note 13 of the Notes to Consolidated Financial Statements, included herein.
Equity Investment
We have a 50% non-controlling ownership interest in ASA Electronics, LLC ("ASA") which acts as a distributor of televisions and other automotive sound, security and accessory products to specialized markets for specialized vehicles, such as, but not limited to, RV's, van conversions and marine vehicles.
Employees
As of
February 28, 2013
, we employed approximately 2,100 people worldwide, of which 337 were covered under collective bargaining agreements. We consider our relations with employees to be good as of
February 28, 2013
.
We have identified certain risk factors that apply to us. You should carefully consider each of the following risk factors and all of the other information included or incorporated by reference in this Form 10-K. If any of these risks, or other risks not presently known to us or that we currently believe not to be significant, develop into actual events, then our business, financial condition, liquidity, or results of operations could be adversely affected. If that happens, the market price of our common stock would likely decline, and you may lose all or part of your investment.
The Automotive, Premium Audio and Consumer Accessories businesses are highly competitive and face significant competition from Original Equipment Manufacturers (OEMs) and direct imports by our retail customers.
The market for mobile electronics, premium audio products and consumer accessories is highly competitive across all product lines. We compete against many established companies, some of whom have substantially greater financial and engineering resources than we do. We compete directly with OEMs, including divisions of well-known automobile manufacturers, in the autosound, auto security, mobile video and accessories markets. We believe that OEMs have diversified and improved their product offerings and place increased sales pressure on new car dealers with whom they have close business relationships to purchase OEM-supplied equipment and accessories. To the extent that OEMs succeed in their efforts, this success would have a material adverse effect on our sales of automotive entertainment and security products to new car dealers. In addition, we compete with major retailers who may at any time choose to direct import products that we may currently supply.
We have few long-term sales contracts with any of our customers that contain guaranteed customer purchase commitments.
Sales of our many of products are made by written purchase orders and are terminable at will by either party. We do have long-term sales contracts with certain customers, however, these contracts do not require the customers to guarantee specific levels of product purchases over the term of the contracts. The unexpected loss of all or a significant portion of sales to any one of our large customers could have a material adverse effect on our performance.
10
Sales in our Automotive, Premium Audio and Consumer Accessories businesses are dependent on new products, product development and consumer acceptance.
Our Automotive, Premium Audio and Consumer Accessories businesses depend, to a large extent, on the introduction and availability of innovative products and technologies. If we are not able to continually introduce new products that achieve consumer acceptance, our sales and profit margins may decline.
The impact of future selling prices and technological advancements may cause price erosion and adversely impact our profitability and inventory value.
Since we do not manufacture all of our products and do not conduct a majority of our own research, we cannot assure you that we will be able to source technologically advanced products in order to remain competitive. Furthermore, the introduction or expected introduction of new products or technologies may depress sales of existing products and technologies. This may result in declining prices and inventory obsolescence. Since we maintain a substantial investment in product inventory, declining prices and inventory obsolescence could have a material adverse effect on our business and financial results.
Our estimates of excess and obsolete inventory may prove to be inaccurate, in which case the provision required for excess and obsolete inventory may be understated or overstated. Although we make every effort to ensure the accuracy of our forecasts of future product demand, any significant unanticipated changes in demand or technological developments could have a significant impact on the value of our inventory and operating results.
There is no guarantee that patent/royalty rights will be renewed or licensing agreements will be maintained
Certain product development and revenues are dependent on the ownership and or use of various patents, licenses and license agreements. If the Company is not able to successfully renew or renegotiate these rights, we may suffer from a loss of product sales or royalty revenue associated with these rights or incur additional expense to pursue alternative arrangements.
We plan to continue to expand the international marketing and distribution of our products, which will subject us to risks associated with international operations, including exposure to foreign currency fluctuations.
As part of our business strategy, we intend to continue to increase our international sales, although we cannot assure you that we will be able to do so. Approximately 31% of our net sales currently originate in markets outside the U.S. While geographic diversity helps to reduce the Company's exposure to risk in any one country or part of the world, it also means that we are subject to the full range of risks associated with significant international operations, including, but not limited to:
|
•
|
changes in exchange rates for foreign countries, which may reduce the U.S. dollar value of revenues, profits and cash flows we receive from non-U.S. markets or increase our supply costs, as measured in U.S. dollars, in those markets,
|
|
•
|
exchange controls and other limits on our ability to import raw materials or finished product or to repatriate earnings from overseas,
|
|
•
|
political and economic instability, social or labor unrest or changing macroeconomic conditions in our markets,
|
|
•
|
foreign ownership restrictions and the potential for nationalization or expropriation of property or other resources, and
|
|
•
|
other foreign or domestic legal and regulatory requirements, including those resulting in potentially adverse tax consequences or other imposition of onerous trade restrictions, price controls or other government controls.
|
These risks could have a significant impact on our ability to sell our products on a competitive basis in international markets and may have a material adverse effect on our results of operations, cash flows and financial condition.
In an effort to reduce the impact on earnings of foreign currency rate movements, we engage in a combination of cost-containment measures and selective hedging of foreign currency transactions. However, these measures may not succeed in offsetting any negative impact of foreign currency rate movements on our business and results of operations.
For example, in February 2013, the government of Venezuela devalued its currency, which has affected our business and results of operations for Fiscal 2013. Likewise, in 2010, our results of operations were impacted by the designation of Venezuela as hyperinflationary and the subsequent currency devaluations in Venezuela that year. Volume restrictions on the conversion of the Venezuelan Bolivar Fuerte to U.S. Dollar limits purchasing activity for our Venezuelan subsidiary. In March 2013, the president of Venezuela passed away, creating further uncertainty about the country's political and economic future. Going forward, additional government actions, including further currency devaluations or continued worsening import authorization controls, foreign exchange price controls or labor unrest in Venezuela could have further adverse impacts on our business and results of operations.
11
Concerns regarding the European debt crisis and market perceptions concerning the instability of the Euro, the potential re-introduction of individual currencies within the Eurozone, or the potential dissolution of the Euro entirely, could adversely affect our business, results of operations and financing.
We have concerns regarding the debt burden of certain Eurozone countries and their ability to meet future financial obligations, the overall stability of the Euro and the suitability of the Euro as a single currency given the diverse economic and political circumstances within individual Eurozone countries. These concerns could lead to the reintroduction of individual currencies in one or more Eurozone countries, or, in more extreme circumstances, the possible dissolution of the Euro currency entirely. Should the Euro dissolve entirely, the legal and contractual consequences for holders of Euro-denominated obligations would be determined by laws in effect at such time. These potential developments, or market perceptions concerning these and related issues, could adversely affect the value of the Company's Euro-denominated assets and obligations. In addition, concerns over the effect of this financial crisis on financial institutions in Europe and globally could have an adverse impact on the economy generally, and more specifically on the consumers' demand for our products.
We are responsible for product warranties and defects.
Whether we outsource manufacturing or manufacture products directly for our customers, we provide warranties for all of our products for which we have provided an estimated liability. Therefore, we are highly dependent on the quality of our suppliers’ products.
Our capital resources may not be sufficient to meet our future capital and liquidity requirements.
We believe our current funds and available credit lines would provide sufficient resources to fund our existing operations for the foreseeable future. However, we may need additional capital to operate our business if:
|
•
|
market conditions change,
|
|
•
|
our business plans or assumptions change,
|
|
•
|
we make significant acquisitions,
|
|
•
|
we need to make significant increases in capital expenditures or working capital, or
|
|
•
|
our restrictive covenants may not provide sufficient credit.
|
Our success will depend on a less diversified line of business.
Currently, we generate substantially all of our sales from the Automotive, Premium Audio and Consumer Accessories businesses. We cannot assure you that we can grow the revenues of our Automotive, Premium Audio and Consumer Accessories businesses or maintain profitability. As a result, the Company's revenues and profitability will depend on our ability to maintain and generate additional customers and develop new products. A reduction in demand for our existing products and services would have a material adverse effect on our business. The sustainability of current levels of our Automotive, Premium Audio and Consumer Accessories businesses and the future growth of such revenues, if any, will depend on, among other factors:
|
•
|
the overall performance of the economy and discretionary consumer spending,
|
|
•
|
competition within key markets,
|
|
•
|
customer acceptance of newly developed products and services, and
|
|
•
|
the demand for other products and services.
|
We cannot assure you that we will maintain or increase our current level of revenues or profits from the Automotive, Premium Audio and Consumer Accessories businesses in future periods.
OEM sales are dependent on economic success of automotive industry.
A portion of our OEM sales are to automobile manufacturers. In the past, some domestic OEM manufacturers have reorganized their operations as a result of general economic conditions. There is no guarantee that additional automobile manufacturers will not face similar reorganizations in the future. If additional reorganizations do take place and are not successful, it could have a material adverse effect on a portion of our OEM business.
We depend on a small number of key customers for a large percentage of our sales.
12
The electronics industry is characterized by a number of key customers. Specifically
28%
,
26%
and
30%
of our sales were to five customers in Fiscal
2013
,
2012
and
2011
, respectively. The loss of one or more of these customers could have a material adverse impact on our business.
If our sales during the holiday season fall below our expectations, our annual results could also fall below expectations.
Seasonal consumer shopping patterns significantly affect our business. We generally make a substantial amount of our sales and net income during September, October and November. We expect this trend to continue. December is also a key month for us, due largely to the increase in promotional activities by our customers during the holiday season. If the economy faltered in these periods, if our customers altered the timing or frequency of their promotional activities or if the effectiveness of these promotional activities declined, particularly around the holiday season, it could have a material adverse effect on our annual financial results.
A decline in general economic conditions could lead to reduced consumer demand for the discretionary products we sell.
Consumer spending patterns, especially discretionary spending for products such as mobile, consumer and accessory electronics, are affected by, among other things, prevailing economic conditions, energy costs, raw material costs, wage rates, inflation, consumer confidence and consumer perception of economic conditions. A general slowdown in the U.S. and certain international economies or an uncertain economic outlook could have a material adverse effect on our sales and operating results.
We have debt outstanding and must comply with restrictive covenants in our debt agreements.
Our existing debt agreements contain a number of significant covenants, which limit our ability to, among other things, borrow additional money, make capital expenditures, pay dividends, dispose of assets and acquire new businesses. These covenants also require us to maintain a specified debt leverage ratio and Earnings Before Interest and Taxes (EBIT) to Interest Expense ratio. If the Company is unable to comply with these covenants, there would be a default under these debt agreements. Changes in economic or business conditions, results of operations or other factors could cause the Company to default under its debt agreements. A default, if not waived by our lenders, could result in acceleration of our debt and possible bankruptcy.
We have recorded, or may record in the future, goodwill and other intangible assets as a result of acquisitions, and changes in future business conditions could cause these investments to become impaired, requiring substantial write-downs that would reduce our operating income.
Goodwill and other intangible assets recorded on our balance sheet as of
February 28, 2013
was
$352,078
. We evaluate the recoverability of recorded goodwill and other intangible asset amounts annually, or when evidence of potential impairment exists. The annual impairment test is based on several factors requiring judgment. Changes in our operating performance or business conditions, in general, could result in an impairment of goodwill, if applicable, and/or other intangible assets, which could be material to our results of operations.
A portion of our workforce is represented by labor unions. Collective bargaining agreements can increase our expenses. Labor disruptions could adversely affect our operations.
As of
February 28, 2013
, 337 of our full-time employees were covered by collective bargaining agreements. While it is unlikely that disruptions to our operations due to labor related problems would have an adverse effect on our business based on the current number of union employees, as the Company continues to pursue selected business acquisitions, it is possible that the number of employees covered by collective bargaining agreements may increase. We cannot predict whether labor unions may be successful in organizing other portions of our workforce or what additional costs we could incur as a result.
We depend on our suppliers to provide us with adequate quantities of high quality competitive products and/or component parts on a timely basis.
We have few long-term contracts with our suppliers. Most of our products and component parts are imported from suppliers under short-term purchase orders. Accordingly, we can give no assurance that:
|
•
|
our supplier relationships will continue as presently in effect,
|
|
•
|
our suppliers will be able to obtain the components necessary to produce high-quality, technologically-advanced products for us,
|
|
•
|
we will be able to obtain adequate alternatives to our supply sources, should they be interrupted,
|
|
•
|
if obtained, alternatively sourced products of satisfactory quality would be delivered on a timely basis, competitively priced, comparably featured or acceptable to our customers,
|
13
|
•
|
our suppliers have sufficient financial resources to fulfill their obligations,
|
|
•
|
our suppliers will be able to obtain raw materials and labor necessary for production,
|
|
•
|
our suppliers could be impacted by natural disasters directly or via their supply chains, and
|
|
•
|
as it relates to products we do not manufacture, our suppliers will not become our competitors.
|
On occasion, our suppliers have not been able to produce the quantities of products or component parts that we desire. Our inability to manufacture and/or supply sufficient quantities of products that are in demand could reduce our profitability and have a material adverse effect on our relationships with our customers. If any of our supplier relationships were terminated or interrupted, we could experience an immediate or long-term supply shortage, which could have a material adverse effect on our business.
Because we purchase a significant amount of our products from suppliers in Pacific Rim countries, we are subject to the economic risks associated with inherent changes in the social, political, regulatory and economic conditions in these countries.
We import most of our products from suppliers in the Pacific Rim. Countries in the Pacific Rim have experienced significant social, political and economic upheaval over the past several years. Due to the large concentrations of our purchases in Pacific Rim countries, particularly China, Hong Kong, South Korea, Malaysia and Taiwan, any adverse changes in the social, political, regulatory and economic conditions in these countries may materially increase the cost of the products that we buy from our foreign suppliers or delay shipments of products, which could have a material adverse effect on our business. In addition, our dependence on foreign suppliers forces us to order products further in advance than we would if our products were manufactured domestically. This increases the risk that our products will become obsolete or face selling price reductions before we can sell our inventory.
Our products could infringe the intellectual property rights of others and we may be exposed to costly litigation.
The products we sell are continually changing as a result of improved technology. Although we and our suppliers attempt to avoid infringing known proprietary rights of third parties in our products, we may be subject to legal proceedings and claims for alleged infringement by us, our suppliers or our distributors, of a third party’s patents, trade secrets, trademarks or copyrights.
Any claims relating to the infringement of third-party proprietary rights, even if not meritorious, could result in costly litigation, divert management’s attention and resources, or require us to either enter into royalty or license agreements which are not advantageous to us or pay material amounts of damages. In addition, parties making these claims may be able to obtain an injunction, which could prevent us from selling our products. We may increasingly be subject to infringement claims as we expand our product offerings.
Our cash and cash equivalents could be adversely affected if the financial institutions in which we hold our cash and cash equivalents fail.
Our cash and cash equivalents consist of demand deposits and highly liquid money market funds with original maturities of three months or less at the time of purchase. We maintain the cash and cash equivalents with major financial institutions. Some deposits with these banks exceed the Federal Deposit Insurance Corporation ("FDIC") insurance limits or similar limits in foreign jurisdictions. While we monitor daily the cash balances in the operating accounts and adjust the balances as appropriate, these balances could be impacted if one or more of the financial institutions with which we deposit fails or is subject to other adverse conditions in the financial or credit markets. To date, we have experienced no loss or lack of access to our invested cash or cash equivalents; however, we can provide no assurance that access to our invested cash and cash equivalents will not be impacted by adverse conditions in the financial and credit markets.
Acquisitions and strategic investments may divert our resources and management attention; results may fall short of expectations.
We intend to continue pursuing selected acquisitions of and investments in businesses, technologies and product lines as a key component of our growth strategy. Any future acquisition or investment may result in the use of significant amounts of cash, potentially dilutive issuances of equity securities, or the incurrence of debt and amortization expenses related to intangible assets. Acquisitions involve numerous risks, including:
|
•
|
difficulties in the integration and assimilation of the operations, technologies, products and personnel of an acquired business,
|
|
•
|
diversion of management’s attention from other business concerns,
|
|
•
|
increased expenses associated with the acquisition, and
|
|
•
|
potential loss of key employees or customers of any acquired business.
|
14
We cannot assure you that our acquisitions will be successful and will not adversely affect our business, results of operations or financial condition.
We invest in marketable securities and other investments as part of our investing activities. These investments fluctuate in value based on economic, operational, competitive, political and technological factors. These investments could be subject to loss or impairment based on their performance.
The Company has incurred other-than-temporary impairments on its investment in Bliss-tel Public Company Limited ("Bliss-tel") and continues to monitor its investments in a non-controlled corporation as well as its Venezuelan TICC bonds for potential future impairments. In addition, there is no guarantee that the fair values recorded for other investments will be sustained in the future.
We depend heavily on existing directors, management and key personnel and our ability to recruit and retain qualified personnel.
Our success depends on the continued efforts of our directors, executives and senior vice presidents, many of whom have worked with VOXX for over three decades, as well as our other executive officers and key employees. We have no employment contracts with any of our executive officers or key employees, except our President and Chief Executive Officer, as well as certain executive officers of Audiovox Germany, Klipsch and Hirschmann. The loss or interruption of the continued full-time service of certain of our executive officers and key employees could have a material adverse effect on our business.
In addition, to support our continued growth, we must effectively recruit, develop and retain additional qualified personnel both domestically and internationally. Our inability to attract and retain necessary qualified personnel could have a material adverse effect on our business.
Our stock price could fluctuate significantly.
The market price of our common stock could fluctuate significantly in response to various factors and events, including:
|
•
|
operating results being below market expectations,
|
|
•
|
announcements of technological innovations or new products by us or our competitors,
|
|
•
|
loss of a major customer or supplier,
|
|
•
|
changes in, or our failure to meet, financial estimates by securities analysts,
|
|
•
|
industry developments,
|
|
•
|
economic and other external factors,
|
|
•
|
general downgrading of our industry sector by securities analysts,
|
|
•
|
inventory write-downs, and
|
|
•
|
ability to integrate acquisitions.
|
In addition, the securities markets have experienced significant price and volume fluctuations over the past several years that have often been unrelated to the operating performance of particular companies. These market fluctuations may also have a material adverse effect on the market price of our common stock.
John J. Shalam, our Chairman, controls a significant portion of the voting power of our common stock and can exercise control over our affairs
.
Mr. Shalam beneficially owns approximately 53% of the combined voting power of both classes of common stock. This will allow him to elect our Board of Directors and, in general, determine the outcome of any other matter submitted to the stockholders for approval. Mr. Shalam's voting power may have the effect of delaying or preventing a change in control of the Company.
We have two classes of common stock: Class A common stock is traded on the Nasdaq Stock Market under the symbol VOXX and Class B common stock, which is not publicly traded and substantially all of which is beneficially owned by Mr. Shalam. Each share of Class A common stock is entitled to one vote per share and each share of Class B common stock is entitled to ten votes per share. Both classes vote together as a single class, except in certain circumstances, for the election and removal of directors and as otherwise may be required by Delaware law. Since our charter permits shareholder action by written consent, Mr. Shalam may be able to take significant corporate actions without prior notice and a shareholder meeting.
We exercise our option for the "controlled company" exemption under NASDAQ rules.
15
The Company has exercised its right to the "controlled company" exemption under NASDAQ rules which enables us to forego certain NASDAQ requirements which include: (i) maintaining a majority of independent directors; (ii) electing a nominating committee composed solely of independent directors; (iii) ensuring the compensation of our executive officers is determined by a majority of independent directors or a compensation committee composed solely of independent directors; and (iv) selecting, or recommending for the Board's selection, director nominees, either by a majority of the independent directors or a nominating committee composed solely of independent directors. Although we do not maintain a nominating committee and do not have a majority of independent directors, the Company notes that at the present time we do maintain a compensation committee comprised solely of independent directors who approve executive compensation, and the recommendations for director nominees are governed by a majority of independent directors. However, election of the "controlled company" exemption under NASDAQ rules allows us to modify our position at any time.
Other Risks
Other risks and uncertainties include:
|
•
|
changes in U.S federal, state and local law,
|
|
•
|
our ability to implement operating cost structures that align with revenue growth,
|
|
•
|
trade sanctions against or for foreign countries,
|
|
•
|
successful integration of business acquisitions and new brands in our distribution network,
|
|
•
|
compliance with the Sarbanes-Oxley Act, and
|
|
•
|
compliance with complex financial accounting and tax standards.
|
As of the filing of this annual report on Form 10-K, there were no unresolved comments from the staff of the Securities and Exchange Commission.
Our Corporate headquarters is located at 180 Marcus Blvd. in Hauppauge, New York. In addition, as of
February 28, 2013
, the Company leased a total of 24 operating facilities or offices located in 7 states as well as Germany, China, Canada, Mexico, Hong Kong, England and France. The leases have been classified as operating leases, with the exception of one, which is recorded as a capital lease. Within the United States, these facilities are located in Florida, Georgia, New York, Ohio, California, Arkansas and Michigan. The Company also owns 9 of its operating facilities or offices located in Indiana and Arkansas in the United States, as well as in Germany, Venezuela and Hungary. These facilities serve as offices, warehouses, distribution centers or retail locations. Additionally, we utilize public warehouse facilities located in Virginia, Nevada, Indiana, Florida, Mexico, China, the Netherlands, Germany and Canada.
The Company is currently, and has in the past been, a party to various routine legal proceedings incident to the ordinary course of business. If management determines, based on the underlying facts and circumstances, that it is probable a loss will result from a litigation contingency and the amount of the loss can be reasonably estimated, the estimated loss is accrued for. The Company believes its outstanding litigation matters will not have a material adverse effect on the Company's financial statements, individually or in the aggregate; however, due to the uncertain outcome of these matters, the Company disclosed these specific matters below:
The products the Company sells are continually changing as a result of improved technology. As a result, although the Company and its suppliers attempt to avoid infringing known proprietary rights, the Company may be subject to legal proceedings and claims for alleged infringement by its suppliers or distributors, of third party patents, trade secrets, trademarks or copyrights. Any claims relating to the infringement of third-party proprietary rights, even if not meritorious, could result in costly litigation, divert management’s attention and resources, or require the Company to either enter into royalty or license agreements which are not advantageous to the Company, or pay material amounts of damages.
The Company has been party to a breach of license agreement lawsuit brought against it by MPEG LA, LLC ("MPEG"). During the third quarter of Fiscal 2012, the Company's claim for summary judgment was denied and the case was tried in the New York Supreme Court, Suffolk County. In December 2011, the Company received advisory judgment in the case, concluding that the Company owed MPEG penalties related to license agreement obligations arising from the manufacture and sale of its products. The Company recorded a charge of approximately
$3.6 million
in Fiscal 2012 and, based on the advisory jury's verdict, remitted payment of
$2.6 million
to MPEG in December 2011 in order to resolve this matter. On May 29, 2012, the Company received
16
notice that the advisory judgment was overturned by the presiding Judge in the case. The Judge's ruling gave the Company and MPEG the option to (a) reach an agreement on the balance still owed; (b) allow the Judge to determine the balance; or (c) proceed to another trial and have a new jury determine the balance owed. On June 29, 2012, the Company reached a settlement agreement with MPEG and agreed to pay an additional
$10.5 million
in final resolution of the matter. The payment is in addition to the funds paid in December 2011, bringing the total settlement to
$13.1 million
. As a result of this settlement, the Company recorded a charge of
$9.5 million
during the first quarter of Fiscal 2013. The charge was recorded in "Other (Expense) Income" in the Consolidated Statement of Operations and Comprehensive Income. The Company has continued to seek indemnification from its suppliers for royalty payments previously paid to them that it maintains they were responsible to remit to MPEG and has vigorously pursued its option under its indemnification agreements. The Company completed negotiations with one vendor for an amount of
$1.1 million
during the first quarter of Fiscal 2013. In February 2013, the Company completed negotiations with one additional vendor for an amount totaling
$6 million
, which will be received over a period exceeding one year and has been recorded at a fair value of
$5.7 million
. Both amounts were recorded as an offset to the settlement expense as recoveries in "Other (Expense)Income" on the Consolidated Statement of Operations and Comprehensive Income, for a net charge of
$2.7 million
during Fiscal 2013. At this time, the Company is not aware of any additional vendors that it may recover funds from related to this matter.
None
17
Securities
Market Information
The Class A Common Stock of Voxx is traded on the Nasdaq Stock Market under the symbol "VOXX." The following table sets forth the low and high sale price of our Class A Common Stock, based on the last daily sale in each of the last eight fiscal quarters:
|
Year ended February 28, 2013
|
High
|
Low
|
||||||
|
First Quarter
|
$
|
13.95
|
|
$
|
9.86
|
|
||
|
Second Quarter
|
9.89
|
|
7.10
|
|
||||
|
Third Quarter
|
7.82
|
|
5.65
|
|
||||
|
Fourth Quarter
|
10.39
|
|
6.25
|
|
||||
|
Year ended February 29, 2012
|
High
|
Low
|
||||||
|
First Quarter
|
$
|
8.16
|
|
$
|
7.03
|
|
||
|
Second Quarter
|
7.74
|
|
5.73
|
|
||||
|
Third Quarter
|
7.49
|
|
4.88
|
|
||||
|
Fourth Quarter
|
14.29
|
|
6.96
|
|
||||
Dividends
We have not paid or declared any cash dividends on our common stock. We have retained, and currently anticipate that we will continue to retain, all of our earnings for use in developing our business. Future cash dividends, if any, will be paid at the discretion of our Board of Directors and will depend, among other things, upon our future operations and earnings, capital requirements and surplus, general financial condition, contractual restrictions and such other factors as our Board of Directors may deem relevant giving consideration to any requirements or restrictions under the Company's recently negotiated credit agreement (see Note 6(a)).
Holders
There are approximately 815 holders of record of our Class A Common Stock and 4 holders of Class B Convertible Common Stock.
Issuer Purchases of Equity Securities
In September 2000, we were authorized by the Board of Directors to repurchase up to 1,563,000 shares of Class A Common Stock in the open market under a share repurchase program (the "Program"). In July 2006, the Board of Directors authorized an additional repurchase up to 2,000,000 Class A Common Stock in the open market in connection with the Program. As of
February 28, 2013
, the cumulative total of acquired shares (net of reissuances of
8,615
) pursuant to the program was
1,816,132
, with a cumulative value of
$18,360
reducing the remaining authorized share repurchase balance to
1,738,243
. During the year ended
February 28, 2013
, the Company did not purchase any shares.
Performance Graph
The following table compares the annual percentage change in our cumulative total stockholder return on our common Class A common stock during a period commencing on February 28, 2008 and ending on
February 28, 2013
with the cumulative total return of the Nasdaq Stock Market (US) Index and our SIC Code Index, during such period.
18
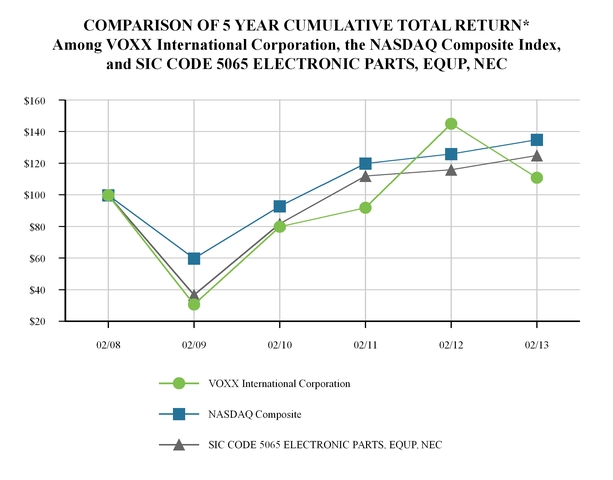
*$100 invested on 2/29/08 in stock or index, including reinvestment of dividends.
The following selected consolidated financial data for the last five years should be read in conjunction with the consolidated financial statements and related notes and "Management's Discussion and Analysis of Financial Condition and Results of Operations" of this Form 10-K.
19
|
Year
Ended
|
Year
Ended
|
Year
Ended
|
Year
Ended
|
Year
Ended
|
|||||||||||||||
|
February 28, 2013 (3)
|
February 29,
2012 (2)
|
February 28,
2011
|
February 28,
2010 (1)
|
February 28,
2009
|
|||||||||||||||
|
Consolidated Statement of Operations Data
|
|
|
|
|
|
||||||||||||||
|
Net sales
|
$
|
835,577
|
|
$
|
707,062
|
|
$
|
561,672
|
|
$
|
550,695
|
|
$
|
603,099
|
|
||||
|
Operating income (loss)
|
41,696
|
|
43,874
|
|
9,017
|
|
3,760
|
|
(53,443
|
)
|
|||||||||
|
Net income (loss)
|
22,492
|
|
25,649
|
|
23,031
|
|
22,483
|
|
(71,029
|
)
|
|||||||||
|
Net income (loss) per common share:
|
|
|
|
|
|
|
|
|
|||||||||||
|
Basic
|
$
|
0.96
|
|
$
|
1.11
|
|
$
|
1.00
|
|
$
|
0.98
|
|
$
|
(3.11
|
)
|
||||
|
Diluted
|
$
|
0.95
|
|
$
|
1.10
|
|
$
|
1.00
|
|
$
|
0.98
|
|
$
|
(3.11
|
)
|
||||
|
|
As of
|
As of
|
As of
|
As of
|
As of
|
||||||||||||||
|
|
February 28,
|
February 29,
|
February 28,
|
February 28,
|
February 28,
|
||||||||||||||
|
|
2013
|
2012
|
2011
|
2010
|
2009
|
||||||||||||||
|
Consolidated Balance Sheet Data
|
|
|
|
|
|
|
|
|
|
|
|||||||||
|
Total assets
|
$
|
829,272
|
|
$
|
632,882
|
|
$
|
501,097
|
|
$
|
488,978
|
|
$
|
461,296
|
|
||||
|
Working capital
|
200,703
|
|
184,282
|
|
258,528
|
|
239,787
|
|
241,080
|
|
|||||||||
|
Long-term obligations (4)
|
228,197
|
|
88,255
|
|
25,849
|
|
32,176
|
|
31,651
|
|
|||||||||
|
Stockholders' equity
|
444,536
|
|
421,797
|
|
392,946
|
|
364,263
|
|
340,502
|
|
|||||||||
|
(1)
|
2010 amounts reflect the acquisition of Schwaiger and Invision.
|
|
(2)
|
2012 amounts reflect the acquisition of Klipsch (see Note 2 of the Notes to Consolidated Financial Statements).
|
|
(3)
|
2013 amounts reflect the acquisition of Hirschmann (see Note 2 of the Notes to Consolidated Financial Statements).
|
|
(4)
|
Long-term obligations include long-term debt, capital lease obligations, deferred compensation, deferred and other tax liabilities, as well as other long term liabilities.
|
This section should be read in conjunction with the "Cautionary Statements" and "Risk Factors" in Item 1A of Part I, and Item 8 of Part II, "Consolidated Financial Statements and Supplementary Data."
We begin Management’s Discussion and Analysis of Financial Condition and Results of Operations with an overview of the business, including our strategy to give the reader a summary of the goals of our business and the direction in which our business is moving. This is followed by a discussion of the Critical Accounting Policies and Estimates that we believe are important to understanding the assumptions and judgments incorporated in our reported financial results. In the next section, we discuss our Results of Operations for the year ended
February 28, 2013
compared to the years ended
February 29, 2012
and
February 28, 2011
. Next, we present adjusted EBITDA and diluted adjusted EBIDTA per common share for the year ended
February 28, 2013
compared to the years ended
February 29, 2012
and
February 28, 2011
in order to provide a useful and appropriate supplemental measure of our performance. We then provide an analysis of changes in our balance sheet and cash flows, and discuss our financial commitments in the sections entitled "Liquidity and Capital Resources, including Contractual and Commercial Commitments." We conclude this MD&A with a discussion of "Related Party Transactions" and "Recent Accounting Pronouncements."
Business Overview and Strategy
Effective December 1, 2011, Audiovox Corporation changed its name to VOXX International Corporation ("Voxx," "We," "Our," "Us" or "Company"). The Company believes that the name VOXX International would be a name that better represents the widely diversified interests of the Company, and the more than 30 global brands it has acquired and grown throughout the years, achieving a powerful international corporate image and creating a vehicle for each of these respective brands to emerge with its own identity.
20
Voxx is a leading international distributor and value added service provider in the automotive, premium audio and consumer accessory industries. We conduct our business through nineteen wholly-owned subsidiaries. Voxx has a broad portfolio of brand names used to market our products as well as private labels through a large domestic and international distribution network. We also function as an OEM ("Original Equipment Manufacturer") supplier to several customers.
Over the last several years, we have focused on our intention to acquire synergistic businesses with the addition of nine new subsidiaries. These subsidiaries helped us to expand our core business and broaden our presence in the accessory and OEM markets. Our acquisitions of Hirschmann, Klipsch and Invision have provided the opportunity to enter the manufacturing arena. Our intention is to continue to pursue business opportunities which will allow us to further expand our business model while leveraging overhead and exploring specialized niche markets in the electronics industry.
During the fourth quarter of Fiscal 2013, the Company realigned its subsidiaries into three operating and reporting segments, based upon our products and internal organizational structure. The operating and reporting segments consist of the Automotive, Premium Audio and Consumer Accessories segments. The characteristics of our operations that are relied on in making and reviewing business decisions within these segments include the similarities in our products, the commonality of our customers, suppliers and product developers across multiple brands, our unified marketing and distribution strategy, our centralized inventory management and logistics, and the nature of the financial information used by our Chief Operating Decision Maker ("CODM"). The CODM reviews the financial results of the Company based on the performance of the Automotive, Premium Audio and Consumer Accessories groups.
The Company’s domestic and international business is subject to retail industry conditions and the sales of new and used vehicles. The recent worldwide economic condition had an adverse impact on consumer spending and vehicle sales. If the global macroeconomic environment does not continue to improve or if it deteriorates further, this could have a negative effect on the Company’s revenues and earnings. In an attempt to offset the recent market conditions, the Company continues to explore strategies and alternatives to reduce its operating expenses, such as consolidation of facilities and IT systems, and has been introducing new product to obtain a greater market share. The Company continues to focus on cash flow and anticipates having sufficient resources to operate during Fiscal
2014
and
2015
.
Although we believe our product groups have expanding market opportunities, there are certain levels of volatility related to domestic and international markets, new car sales, increased competition by manufacturers, private labels, technological advancements, discretionary consumer spending and general economic conditions. Also, all of our products are subject to price fluctuations which could affect the carrying value of inventories and gross margins in the future.
Acquisitions
We have acquired and integrated several acquisitions which are outlined in the
Acquisitions
section of Part I and presented in detail in Note
2
.
Net Sales Growth
Net sales over a five-year period have
increased
38.5%
from
$603,099
for the year ended
February 28, 2009
to
$835,577
for the year ended
February 28, 2013
. During this period, our sales were impacted by the following items:
|
•
|
the introduction of new products and lines such as digital antennas and mobile multi-media devices, mobile iPad and iPod interfaces and the Tagg™ GPS tracking device,
|
|
•
|
acquisition of Hirschmann's mobile communications and infotainment business,
|
|
•
|
acquisition of Klipsch's high-end speaker business,
|
|
•
|
acquisition of Invision’s mobile entertainment business,
|
|
•
|
acquisition of Schwaiger’s accessory business.
|
Partially offset by:
|
•
|
The discontinuance of various high volume/low margin product lines such as navigation, GMRS radios, flat-panel TV’s, camcorders, clock radios, digital players and digital voice recorders,
|
|
•
|
volatility in core mobile, consumer and accessories sales due to increased competition, lower selling prices and the decline in the national and global economy.
|
Critical Accounting Policies and Estimates
21
General
Our consolidated financial statements are prepared in conformity with accounting principles generally accepted in the United States of America. The preparation of these financial statements requires us to make certain estimates, judgments and assumptions that we believe are reasonable based upon the information available. These estimates and assumptions can be subjective and complex and may affect the reported amounts of assets and liabilities, revenues and expenses reported in those financial statements. As a result, actual results could differ from such estimates and assumptions. The significant accounting policies and estimates which we believe are the most critical in fully understanding and evaluating the reported consolidated financial results include the following:
Revenue Recognition
We recognize revenue from product sales at the time of passage of title and risk of loss to the customer either at FOB Shipping Point or FOB Destination, based upon terms established with the customer. Any customer acceptance provisions, which are related to product testing, are satisfied prior to revenue recognition. We have no further obligations subsequent to revenue recognition except for returns of product from customers. We do accept returns of products, if properly requested, authorized and approved. We continuously monitor and track such product returns and record the provision for the estimated amount of such future returns at point of sale, based on historical experience and any notification we receive of pending returns.
Sales Incentives
We offer sales incentives to our customers in the form of (1) co-operative advertising allowances; (2) market development funds; (3) volume incentive rebates; and (4) other trade allowances. We account for sales incentives in accordance with ASC 605-50 "Customer Payments and Incentives" ("ASC 605-50"). Except for other trade allowances, all sales incentives require the customer to purchase our products during a specified period of time. All sales incentives require customers to claim the sales incentive within a certain time period (referred to as the "claim period") and claims are settled either by the customer claiming a deduction against an outstanding account receivable or by the customer requesting a check. All costs associated with sales incentives are classified as a reduction of net sales, and the following is a summary of the various sales incentive programs:
Co-operative advertising allowances are offered to customers as a reimbursement towards their costs for print or media advertising in which our product is featured on its own or in conjunction with other companies' products. The amount offered is either a fixed amount or is based upon a fixed percentage of sales revenue or fixed amount per unit sold to the customer during a specified time period.
Market development funds are offered to customers in connection with new product launches or entrance into new markets. The amount offered for new product launches is based upon a fixed amount or fixed percentage of our sales revenue to the customer or a fixed amount per unit sold to the customer during a specified time period. We accrue the cost of co-operative advertising allowances and market development funds at the latter of when the customer purchases our products or when the sales incentive is offered to the customer.
Volume incentive rebates offered to customers require that minimum quantities of product be purchased during a specified period of time. The amount offered is either based upon a fixed percentage of our sales revenue to the customer or a fixed amount per unit sold to the customer. We make an estimate of the ultimate amount of the rebate customers will earn based upon past history with the customer and other facts and circumstances. We have the ability to estimate these volume incentive rebates, as there does not exist a relatively long period of time for a particular rebate to be claimed. Any changes in the estimated amount of volume incentive rebates are recognized immediately using a cumulative catch-up adjustment.
Other trade allowances are additional sales incentives that we provide to customers subsequent to the related revenue being recognized. In accordance with ASC 605-50, we record the provision for these additional sales incentives at the latter of when the sales incentive is offered or when the related revenue is recognized. Such additional sales incentives are based upon a fixed percentage of the selling price to the customer, a fixed amount per unit, or a lump-sum amount.
The accrual balance for sales incentives at
February 28, 2013
and
February 29, 2012
was
$16,821
and
$18,154
, respectively. The decrease in Fiscal 2013 is due to the effects of the European markets, which resulted in decreases in the Company's international sales. Although we make our best estimate of sales incentive liabilities, many factors, including significant unanticipated changes in the purchasing volume and the lack of claims from customers could have a significant impact on the liability for sales incentives and reported operating results.
22
We reverse earned but unclaimed sales incentives based upon the expiration of the claim period of each program. Unclaimed sales incentives that have no specified claim period are reversed in the quarter following one year from the end of the program. We believe that the reversal of earned but unclaimed sales incentives upon the expiration of the claim period is a disciplined, rational, consistent and systematic method of reversing unclaimed sales incentives.
For the years ended
February 28, 2013
,
February 29, 2012
and
February 28, 2011
, reversals of previously established sales incentive liabilities amounted to
$3,350
,
$3,662
and
$1,725
, respectively. These reversals include unearned and unclaimed sales incentives. Unearned sales incentives are volume incentive rebates where the customer did not purchase the required minimum quantities of product during the specified time. Volume incentive rebates are reversed into income in the period when the customer did not reach the required minimum purchases of product during the specified time. Reversals of unearned sales incentives for the years ended
February 28, 2013
,
February 29, 2012
and
February 28, 2011
amounted to
$2,933
,
$2,200
and
$977
, respectively. Unclaimed sales incentives are sales incentives earned by the customer but the customer has not claimed payment within the claim period (period after program has ended). Reversals of unclaimed sales incentives for the years ended
February 28, 2013
,
February 29, 2012
and
February 28, 2011
amounted to
$417
,
$1,462
and
$748
, respectively.
Accounts Receivable
We perform ongoing credit evaluations of our customers and adjust credit limits based upon payment history and current credit worthiness, as determined by a review of current credit information. We continuously monitor collections from our customers and maintain a provision for estimated credit losses based upon historical experience and any specific customer collection issues that have been identified. We record charges for estimated credit losses against operating expenses and charges for price adjustments against net sales in the consolidated financial statements. The reserve for estimated credit losses at
February 28, 2013
and
February 29, 2012
were
$7,840
and
$5,737
, respectively. The increase in the reserve is due to the Company's acquisition of Hirschmann and the related increases in sales and accounts receivable. While such credit losses have historically been within management's expectations and the provisions established, we cannot guarantee that we will continue to experience the same credit loss rates that have been experienced in the past. Since our accounts receivable are concentrated in a relatively few number of large customers, a significant change in the liquidity or financial position of any one of these customers could have a material adverse impact on the collectability of accounts receivable and our results of operations.
Inventories
We value our inventory at the lower of the actual cost to purchase (primarily on a weighted moving average basis, with a portion valued at standard cost) and/or the current estimated market value of the inventory less expected costs to sell the inventory. We regularly review inventory quantities on-hand and record a provision, in cost of sales, for excess and obsolete inventory based primarily from selling price reductions subsequent to the balance sheet date, indications from customers based upon current negotiations, and purchase orders. A significant sudden increase in the demand for our products could result in a short-term increase in the cost of inventory purchases while a significant decrease in demand could result in an increase in the amount of excess inventory quantities on-hand. In addition, our industry is characterized by rapid technological change and frequent new product introductions that could result in an increase in the amount of obsolete inventory quantities on-hand. During the years ended
February 28, 2013
,
February 29, 2012
and
February 28, 2011
, we recorded inventory write-downs of
$4,300
,
$2,942
and
$3,911
, respectively.
Estimates of excess and obsolete inventory may prove to be inaccurate, in which case we may have understated or overstated the provision required for excess and obsolete inventory. Although we make every effort to ensure the accuracy of our forecasts of future product demand, any significant unanticipated changes in demand or technological developments could have a significant impact on the carrying value of inventory and our results of operations.
Goodwill and Other Intangible Assets
Goodwill and other intangible assets, which consists of the excess cost over fair value of assets acquired (goodwill) and other intangible assets (patents, contracts, licenses, trademarks and customer relationships) amounted to
$352,078
at
February 28, 2013
and
$261,418
at
February 29, 2012
. Goodwill and other intangible assets are determined in accordance with ASC 805 "Business Combinations" ("ASC 805") and ASC 350 "Intangibles – Goodwill and Other" ("ASC 350"), (see Goodwill and Other Intangible Assets (Note 1(k)).
Goodwill is calculated as the excess of the cost of purchased businesses over the value of their underlying net assets. The Company has used the Discounted Future Cash Flow Method (DCF) as the principle method to determine the Fair Value ("FV") of acquired businesses. The discount rates used for our analysis ranged from 10.4% to 15.6%. A five-year period was analyzed using a risk adjusted discount rate.
23
The value of potential intangible assets separate from goodwill is evaluated and assigned to the respective categories using certain methodologies (see Note 1(k)). Certain estimates and assumptions are used in applying these methodologies, including projected sales, which include incremental revenue to be generated from the product markets that the Company has not been previously exposed to, disclosed future contracts and adjustments for declines in existing core sales; ongoing market demand for the relevant products; and required returns on tangible and intangible assets. In the event that actual results or market conditions deviate from these estimates and assumptions used, the future FV may be different than that determined by management and may result in an impairment loss.
The Company categorizes its intangible assets between goodwill and intangible assets. Goodwill and other intangible assets that have an indefinite useful life are not amortized. Intangible assets that have a definite useful life are amortized over their estimated useful lives.
On an annual basis, or as needed for a triggering event, we test goodwill and other indefinite lived intangible assets for impairment (see Note 1(k)). To determine the fair value of these intangible assets, there are many assumptions and estimates used that directly impact the results of the testing. We have the ability to influence the outcome and ultimate results based on the assumptions and estimates we choose. To mitigate undue influence, we set criteria that are reviewed and approved by various levels of management. Additionally, we may evaluate our recorded intangible assets with the assistance of a third-party valuation firm, as necessary. All reports and conclusions are reviewed by management who has ultimate responsibility for their content. Goodwill is tested using a two-step process. The first step is to identify a potential impairment, and the second step measures the amount of the impairment loss, if any. Goodwill is considered impaired if the carrying amount of the reporting unit's goodwill exceeds its estimated fair value. Based upon our most recent annual impairment test completed as of December 1, 2012 as a result of the realigning of our segments, and rolled forward to February 28, 2013, the fair value of each of the Company's reporting units is in excess of its related carrying value. For Fiscal 2013, management determined that its intangible assets were not impaired.
Determining whether impairment of indefinite lived intangibles has occurred requires an analysis of each identifiable asset. If estimates used in the valuation of each identifiable asset proved to be inaccurate based on future results, there could be additional impairment charges in subsequent periods.
Warranties
We offer warranties of various lengths depending upon the specific product. Our standard warranties require us to repair or replace defective product returned by both end users and customers during such warranty period at no cost. We record an estimate for warranty related costs, in cost of sales, based upon actual historical return rates and repair costs at the time of sale. The estimated liability for future warranty expense, which has been included in accrued expenses and other current liabilities, amounted to
$12,788
at
February 28, 2013
and
$6,425
at
February 29, 2012
. The increase in warranty liability is a result of our Hirschmann acquisition on March 14, 2012, as well as due to a recall initiated by Subaru in the fourth quarter of Fiscal 2013. While warranty costs have historically been within expectations and the provisions established, we cannot guarantee that we will continue to experience the same warranty return rates or repair costs that have been experienced in the past. A significant increase in product return rates, or a significant increase in the costs to repair products, could have a material adverse impact on our operating results.
Stock-Based Compensation
We use the Black-Scholes option pricing model to compute the estimated fair value of stock-based awards. The Black-Scholes option pricing model includes assumptions regarding dividend yields, expected volatility, expected option term and risk-free interest rates. The assumptions used in computing the fair value of stock-based awards reflect our best estimates, but involve uncertainties relating to market and other conditions, many of which are outside of our control. We estimate expected volatility by considering the historical volatility of our stock, the implied volatility of publicly traded stock options in our stock and our expectations of volatility for the expected term of stock-based compensation awards. As a result, if other assumptions or estimates had been used for options granted in the current and prior periods, the total stock-based compensation expense of
$435
that was recorded for the year ended
February 28, 2013
could have been materially different. Furthermore, if different assumptions are used in future periods, stock-based compensation expense could be materially impacted in the future.
Income Taxes
We account for income taxes in accordance with the guidance issued under Statement ASC 740, "Income Taxes" with consideration for uncertain tax positions. We record a valuation allowance to reduce our deferred tax assets to the amount of future tax benefit that is more likely than not to be realized.
24
During Fiscal
2013
, the Company recorded an income tax provision of $13.2 million related to federal, state and foreign taxes. The Company's effective tax rate differs from the U.S. federal statutory rate of 35% primarily due to state and local taxes, non-deductible expenses, and the U.S. effect of foreign operations including tax rate differences in foreign jurisdictions. The Company maintains a valuation allowance against deferred tax assets in certain foreign jurisdictions and with respect to its foreign tax credits and various investments which are more likely than not to generate capital losses in the future. Any decline in the valuation allowance could have a favorable impact on our income tax provision and net income in the period in which such determination is made.
Since March 1, 2007, the Company has accounted for uncertain tax positions in accordance with the authoritative guidance issued under ASC 740, which addresses the determination of whether tax benefits claimed or expected to be claimed on tax returns should be recorded in the financial statements. The Company may recognize the tax benefit from an uncertain tax position only if it is more likely than not that the tax position will be sustained on examination by the taxing authorities based on the technical merits of the position. The tax benefits recognized in the financial statements from such position should be measured based on the largest benefit that has a greater than fifty percent likelihood of being realized upon ultimate settlement. The Company provides loss contingencies for federal, state and international tax matters relating to potential tax examination issues, planning initiatives and compliance responsibilities. The development of these reserves requires judgments about tax issues, potential outcomes and timing, which if different, may materially impact the Company's financial condition and results of operations. The Company classifies interest and penalties associated with income taxes as a component of income tax expense (benefit) on the consolidated statement of operations and comprehensive income.
Results of Operations
Included in Item 8 of this annual report on Form 10-K are the consolidated balance sheets at
February 28, 2013
and
February 29, 2012
and the consolidated statements of operations and comprehensive income, consolidated statements of stockholders’ equity and consolidated statements of cash flows for the years ended
February 28, 2013
,
February 29, 2012
and
February 28, 2011
. In order to provide the reader meaningful comparison, the following analysis provides comparison of the audited year ended
February 28, 2013
with the audited years ended
February 29, 2012
, and
February 28, 2011
. We analyze and explain the differences between periods in the specific line items of the consolidated statements of operations and comprehensive income.
Year Ended
February 28, 2013
Compared to the Years Ended
February 29, 2012
and
February 28, 2011
Continuing Operations
The following table sets forth, for the periods indicated, certain Statement of Operations data for the years ended
February 28, 2013
("Fiscal
2013
"),
February 29, 2012
("Fiscal
2012
") and
February 28, 2011
("Fiscal
2011
").
Net Sales
|
Fiscal
|
Fiscal
|
Fiscal
|
|||||||||
|
2013
|
2012
|
2011
|
|||||||||
|
Automotive
|
$
|
426,983
|
|
$
|
297,145
|
|
$
|
298,126
|
|
||
|
Premium Audio
|
192,987
|
|
191,427
|
|
20,071
|
|
|||||
|
Consumer Accessories
|
214,275
|
|
215,604
|
|
240,128
|
|
|||||
|
Corporate
|
1,332
|
|
2,886
|
|
3,347
|
|
|||||
|
Total net sales
|
$
|
835,577
|
|
$
|
707,062
|
|
$
|
561,672
|
|
||
Fiscal
2013
Automotive sales, which include both OEM and aftermarket automotive electronics, represented
51.1%
of the net sales for the year ended
February 28, 2013
, compared to
42.0%
in the prior year. For the year ended
February 28, 2013
, approximately $153 million of our sales from this product group was the result of our recent acquisition of Hirschmann. In addition, the Automotive group experienced increases in its OEM manufacturing lines during the year ended
February 28, 2013
due to the launch of new programs with Ford and Nissan in the second quarter of Fiscal
2013
, as well as due to new product introductions, such as the mobile iPad and iPod interfaces. These increases were partially offset by a decline in satellite fulfillment sales and slower mobile audio sales in Europe and the United States.
25
Premium Audio sales increased
$1,560
during the year ended
February 28, 2013
as compared to the prior year. The increase in Premium Audio was primarily related to increased sales of on-ear and in-ear headphones and soundbars, offset by declines in our European sales.
Consumer Accessories represented
25.6%
of our net sales for the year ended
February 28, 2013
, compared to
30.5%
in the prior year. The decrease in the Consumer Accessories group was primarily related to decreased sales in our international markets as a result of European market conditions as well as the decrease in low margin products, such as camcorders, clock radios and digital players that the Company has been exiting throughout the year. These decreases were offset by sales of new wireless speaker products and increased sales of portable power lines and power supply systems due to the growing predominance of electronic devices in consumer homes.
Fiscal
2012
Automotive sales decreased
$981
in Fiscal
2012
as a result of a decline in satellite fulfillment sales, as well as the absence of FLO-TV products, whose program ended in the third quarter of Fiscal 2011. These decreases were offset by increases in the Company's OEM manufacturing lines due to increases in domestic automotive sales and the launch of new programs, both domestically and internationally.
Premium Audio sales increased
$171,356
in Fiscal
2012
, due primarily to our acquisition of Klipsch. Approximately $169,500 of our sales in this segment were contributed by Klipsch in Fiscal 2012.
Consumer Accessories sales decreased
$24,524
in Fiscal
2012
primarily as a result of decreased sales in such products as camcorders, clock radios, digital players, digital voice recorders, rechargeable batteries and surge protectors as a result of the economy, competition, and changes in demand, as well as changes in technology. Certain car chargers and cables were also phased out by the Company in Fiscal 2012 to make way for new offerings in the coming fiscal year. The decreases were offset by increased sales in our international markets, as well as certain domestic products such as antennas, wireless speakers and personal sound amplifiers.
Sales incentive expenses were
$32,286
,
$40,009
and
$26,279
for Fiscal
2013
,
2012
and
2011
, respectively, which included reversals for unclaimed and unearned sales incentives of
$3,350
,
$3,662
and
$1,725
, respectively. We believe the reversal of unearned and earned but unclaimed sales incentives upon the expiration of the claim period is a disciplined, rational, consistent and systematic method of reversing unearned and earned but unclaimed sales incentives. These sales incentive programs are expected to continue and will either increase or decrease based upon competition and customer demands.
Gross Profit and Gross Margin Percentage
|
Fiscal
|
Fiscal
|
Fiscal
|
|||||||||
|
2013
|
2012
|
2011
|
|||||||||
|
Automotive
|
$
|
114,675
|
|
$
|
73,440
|
|
$
|
61,519
|
|
||
|
26.9
|
%
|
24.7
|
%
|
20.6
|
%
|
||||||
|
Premium Audio
|
65,352
|
|
72,647
|
|
7,323
|
|
|||||
|
33.9
|
%
|
38.0
|
%
|
36.5
|
%
|
||||||
|
Consumer Accessories
|
55,472
|
|
53,392
|
|
51,762
|
|
|||||
|
25.9
|
%
|
24.8
|
%
|
21.6
|
%
|
||||||
|
Corporate
|
1,323
|
|
3,476
|
|
3,333
|
|
|||||
|
$
|
236,822
|
|
$
|
202,955
|
|
$
|
123,937
|
|
|||
|
28.3
|
%
|
28.7
|
%
|
22.1
|
%
|
||||||
Fiscal
2013
Gross margins in the Automotive segment increased 220 basis points due primarily to the acquisition of Hirschmann, increased sales in OEM related products and the net impact of the currency devaluation in Venezuela. This was offset by a decrease in sales of higher margin car speakers at Audiovox Germany and unfavorable swings between hedged costs and related sales.
Gross margins in the Premium Audio segment decreased 410 basis points primarily as a result of declines in international sales due to European market conditions, as well as due to the cost of shifting warehouse facilities in Asia, and a moderate increase in
26
inventory provisions related to various products. This was partially offset by increases in sales of certain higher margin products, such as on-ear and in-ear headphones and soundbars.
Gross margins in the Consumer Accessories segment increased 110 basis points primarily as a result of an increase in sale of higher margin consumer products, such as bluetooth speakers and a decrease in sales of lower margin products, such as camcorders, clock radios and digital players that the Company has been exiting during the year. This was offset by decreases in international sales due to European economic conditions and unfavorable swings between hedged costs and related sales.
Fiscal
2012
Gross margins in the Automotive segment increased 410 basis points due to increased sales in our OEM manufacturing lines and the launch of new programs, both domestically and internationally. These increases were offset by declines in satellite fulfillment sales.
Gross margins in the Premium Audio segment increased 150 basis points due primarily to the acquisition of Klipsch, which took place on March 1, 2011.
Gross margins in the Consumer Accessories segment increased 320 basis points due to better sales in our existing product lines and decreased sales in lower margin products, such as camcorders, clock radios, digital players and digital voice recorders, which the Company has begun to exit. In addition, decreases in required inventory provisions and warehouse assembly expenses improved gross margins.
Operating Expenses and Operating Income / (Loss)
|
Fiscal
|
Fiscal
|
Fiscal
|
|||||||||
|
2013
|
2012
|
2011
|
|||||||||
|
Operating Expenses:
|
|
|
|
||||||||
|
Selling
|
$
|
51,976
|
|
$
|
47,282
|
|
$
|
34,517
|
|
||
|
General and administrative
|
114,653
|
|
93,219
|
|
67,262
|
|
|||||
|
Engineering and technical support
|
26,971
|
|
15,825
|
|
11,934
|
|
|||||
|
Acquisition related costs
|
1,526
|
|
2,755
|
|
1,207
|
|
|||||
|
Total Operating Expenses
|
$
|
195,126
|
|
$
|
159,081
|
|
$
|
114,920
|
|
||
|
Operating income
|
$
|
41,696
|
|
$
|
43,874
|
|
$
|
9,017
|
|
||
Fiscal
2013
Operating expenses
increased
$36,045
in Fiscal
2013
as compared to Fiscal
2012
. The increase in total operating expenses was due primarily to our recent acquisition of Hirschmann which accounted for $43 million of our operating expenses during the year ended
February 28, 2013
, as well as an increase in advertising expense Company-wide, not including Hirschmann. Not taking into account the acquisition of Hirschmann, the increases were partially offset by reductions in depreciation expense, headcount reduction in select groups, reductions of commissions as a result of lower net sales, reduced occupancy costs due to the purchase of Klipsch headquarters in Indianapolis, IN, which had previously been leased, as well as lower professional fees as a result of the conclusion of the MPEG lawsuit in June 2012.
Fiscal
2012
Operating expenses
increased
$44,161
in Fiscal
2012
as compared to Fiscal
2011
. The increase in total operating expenses was due primarily to our recent acquisition of Klipsch which accounted for $39.2 million of our operating expenses during the year ended
February 29, 2012
, as well as an increase in legal fees to defend a patent suit, compensation expense as a result of performance related targets and acquisition costs incurred during the fourth quarter of Fiscal 2012 related to the purchase of Hirschmann on March 14, 2012. These increases were partially offset by reductions in depreciation expense, headcount reduction in select groups and a benefit recorded related to a put option.
Other Income/(Expense)
27
|
Fiscal
|
Fiscal
|
Fiscal
|
|||||||||
|
2013
|
2012
|
2011
|
|||||||||
|
Interest and bank charges
|
$
|
(8,288
|
)
|
$
|
(5,630
|
)
|
$
|
(2,630
|
)
|
||
|
Equity in income of equity investees
|
4,880
|
|
4,035
|
|
2,905
|
|
|||||
|
Other, net
|
(2,633
|
)
|
(3,387
|
)
|
3,204
|
|
|||||
|
Total other income (expense)
|
$
|
(6,041
|
)
|
$
|
(4,982
|
)
|
$
|
3,479
|
|
||
Fiscal
2013
Other, net, for the year ended
February 28, 2013
includes net charges in connection with a patent suit of approximately $2,700, and losses on foreign exchange contracts of approximately $2,700 incurred in conjunction with the Hirschmann acquisition and settled during the first quarter of Fiscal 2013. These charges were partially offset by income recorded related to favorable legal settlements received by Klipsch of approximately $1,000 during the first and third quarters of Fiscal 2013 and rental income of approximately $1,100. Other, net for the year ended
February 29, 2012
included charges in connection with a patent lawsuit of approximately $3,600, a contingent consideration adjustment of approximately $2,000 related to a prior acquisition and an other than temporary impairment of an investment in marketable securities of approximately $1,200. These charges were partially offset by gains of approximately $1,600 in forward exchange contracts in the fourth quarter of Fiscal 2012 related to the Hirschmann acquisition and a rental income of approximately $500.
Interest and bank charges represent expenses for bank obligations of VOXX International Corporation and Audiovox Germany, interest for a capital lease, and amortization of deferred financing costs on our credit facility. The increase in these expenses for the year ended
February 28, 2013
, is due primarily to interest expense, fees and amortization of deferred financing costs related to the Credit Facility entered into on March 14, 2012 primarily to fund our Hirschmann acquisition.
Equity in income of equity investees increased due to increased equity income of ASA Electronics, LLC (ASA) as a result of improved sales and profitability, as well as market expansion.
Fiscal
2012
Other, net, for the year ended
February 29, 2012
included charges in connection with a patent lawsuit of approximately $3,600, a contingent consideration adjustment of approximately $2,000 related to a prior acquisition and an other than temporary impairment of an investment in marketable securities of approximately $1,200. These charges were partially offset by gains of approximately $1,600 in forward exchange contracts in the fourth quarter of Fiscal
2012
related to the Hirschmann acquisition. Other, net for the year ended
February 28, 2011
included the net foreign exchange gain in U.S. dollar denominated assets and liabilities in Venezuela of $1,400.
Interest and bank charges represent expenses for bank obligations of VOXX International Corporation and Audiovox Germany, interest for a capital lease, and amortization of deferred financing costs on our credit facility. The increase in these expenses for the year ended
February 29, 2012
, is due primarily to interest expense, fees and amortization of deferred financing costs related to the Credit Facility entered into on March 1, 2011 primarily to fund our Klipsch acquisition.
Equity in income of equity investees increased due to increased equity income of ASA Electronics, LLC (ASA) as a result of improved sales and profitability.
Income Tax Provision
The effective tax rate in Fiscal
2013
was an income tax provision of
36.9%
on pre-tax income from operations of
$35,655
as compared to a benefit of
34%
on a pre-tax income of
$38,892
from continuing operations in the prior year. The effective tax rate in Fiscal 2013 differs from the statutory rate of 35% primarily due to state and local taxes, non-deductible expenses and the U.S. effect of foreign operations including tax rate differences in foreign jurisdictions.
The effective tax rate in Fiscal 2012 differs from the statutory rate due to state and local taxes, non-deductible expenses, the generation of research and development credits and the U.S. effect of foreign operations including tax rate differences in foreign jurisdictions.
28
The effective tax rate in Fiscal 2011 was lower than the statutory tax rate due the Company's ability to record an income tax benefit as a significant portion of the Company's deferred tax assets became realizable on a more-likely-than-not basis based on current operating results and forecasts of pre-tax earnings and U.S. taxable income.
Net Income
The following table sets forth, for the periods indicated, selected statement of operations data beginning with operating income from operations to reported net income and basic and diluted net income per common share:
|
Fiscal
|
Fiscal
|
Fiscal
|
|||||||||
|
2013
|
2012
|
2011
|
|||||||||
|
Operating income
|
$
|
41,696
|
|
$
|
43,874
|
|
$
|
9,017
|
|
||
|
Other income (expense), net
|
(6,041
|
)
|
(4,982
|
)
|
3,479
|
|
|||||
|
Income from operations before income taxes
|
35,655
|
|
38,892
|
|
12,496
|
|
|||||
|
Income tax expense (benefit)
|
13,163
|
|
13,243
|
|
(10,535
|
)
|
|||||
|
Net income
|
$
|
22,492
|
|
$
|
25,649
|
|
$
|
23,031
|
|
||
|
Net income per common share:
|
|
|
|
|
|
|
|||||
|
Basic
|
$
|
0.96
|
|
$
|
1.11
|
|
$
|
1.00
|
|
||
|
Diluted
|
$
|
0.95
|
|
$
|
1.10
|
|
$
|
1.00
|
|
||
Net income for Fiscal
2013
was
$22,492
as compared to
$25,649
in Fiscal
2012
and
$23,031
in Fiscal
2011
. Fiscal
2013
net income was unfavorably impacted by losses on forward exchange contracts and a decrease in sales in European markets, offset by the acquisition of Hirschmann, an increase in sales in domestic markets and a net foreign currency gain related to the devaluation of the bolivar fuerte in Venezuela.
During Fiscal
2012
, net income was favorably impacted by the acquisition of Klipsch.
During Fiscal
2011
, net income was favorably impacted by the net tax benefits of approximately $10,500 as a result of a partial reduction of a valuation allowance on deferred taxes.
Adjusted EBITDA and Adjusted Diluted Earnings per Common Share
Adjusted EBITDA and diluted adjusted earnings per common share are not financial measures recognized by GAAP. Adjusted EBITDA represents net income, computed in accordance with GAAP, before interest expense and bank charges, taxes, depreciation and amortization, stock-based compensation expense, restructuring charges, litigation settlements and costs and foreign exchange gains or losses relating to our acquisitions. Depreciation, amortization, and stock-based compensation expense are non-cash items. Diluted adjusted earnings per common share represent the Company's diluted earnings per common share based on adjusted EBITDA.
We present adjusted EBITDA and diluted adjusted earnings per commons share in this Form 10-K because we consider them to be useful and appropriate supplemental measures of our performance. Adjusted EBITDA and diluted adjusted earnings per common share help us to evaluate our performance without the effects of certain GAAP calculations that may not have a direct cash impact on our current operating performance. In addition, the exclusion of costs relating to the Company's acquisitions, restructuring and litigation settlements allows for a more meaningful comparison of our results from period-to-period. These non-GAAP measures, as we define them, are not necessarily comparable to similarly entitled measures of other companies and may not be an appropriate measure for performance relative to other companies. Adjusted EBITDA should not be assessed in isolation from or construed as a substitute for EBITDA prepared in accordance with GAAP. Adjusted EBITDA and diluted adjusted earnings per common share are not intended to represent, and should not be considered to be more meaningful measures than, or alternatives to, measures of operating performance as determined in accordance with GAAP.
Reconciliation of GAAP Net Income to Adjusted EBITDA and Adjusted Diluted Earnings per Common Share
29
|
Fiscal
|
Fiscal
|
Fiscal
|
||||||||||
|
2013
|
2012
|
2011
|
||||||||||
|
Net income
|
$
|
22,492
|
|
$
|
25,649
|
|
$
|
23,031
|
|
|||
|
Adjustments:
|
||||||||||||
|
Interest expense and bank charges
|
8,288
|
|
5,630
|
|
2,630
|
|
||||||
|
Depreciation and amortization
|
16,446
|
|
10,295
|
|
7,865
|
|
||||||
|
Income tax expense (benefit)
|
13,163
|
|
13,243
|
|
(10,535
|
)
|
||||||
|
EBITDA
|
60,389
|
|
54,817
|
|
22,991
|
|
||||||
|
Stock-based compensation
|
435
|
|
1,082
|
|
1,284
|
|
||||||
|
Net settlement charges related to MPEG suit
|
2,676
|
|
3,621
|
|
—
|
|
||||||
|
Klipsch settlement recovery
|
(1,015
|
)
|
—
|
|
—
|
|
||||||
|
Asia restructuring charges
|
789
|
|
—
|
|
—
|
|
||||||
|
Acquisition related costs
|
1,526
|
|
2,755
|
|
1,207
|
|
||||||
|
Loss/(gain) on foreign exchange as a result of Hirschmann acquisition
|
2,670
|
|
(1,581
|
)
|
—
|
|
||||||
|
Adjusted EBITDA
|
$
|
67,470
|
|
$
|
60,694
|
|
$
|
25,482
|
|
|||
|
Diluted earnings per common share
|
$
|
0.97
|
|
$
|
1.10
|
|
$
|
1.00
|
|
|||
|
Diluted adjusted EBITDA per common share
|
$
|
2.86
|
|
$
|
2.61
|
|
$
|
1.10
|
|
|||
Liquidity and Capital Resources
Cash Flows, Commitments and Obligations
As of
February 28, 2013
, we had working capital of
$200,703
which includes cash and cash equivalents of
$19,777
compared with working capital of
$184,282
at
February 29, 2012
, which included cash and cash equivalents of $
13,606
. The increase in cash is primarily due to draws on the Company's Amended Credit Facility (a portion of which was used to finance the purchase of Hirschmann). These increases were partially offset by the purchase and renovation of the Klipsch headquarters, repayment of outstanding bank obligations, and an increase in inventory. We plan to utilize our current cash position as well as collections from accounts receivable, the cash generated from our operations and the income on our investments to fund the current operations of the business. However, we may utilize all or a portion of current capital resources to pursue other business opportunities, including acquisitions or pay down our debt. The following table summarizes our cash flow activity for all periods presented:
|
Year
Ended
|
Year
Ended
|
Year
Ended
|
|||||||||
|
February 28,
2013 |
February 29,
2012 |
February 28,
2011 |
|||||||||
|
Cash (used in) provided by:
|
|
|
|
||||||||
|
Operating activities
|
$
|
25,523
|
|
$
|
62,867
|
|
$
|
32,130
|
|
||
|
Investing activities
|
(125,574
|
)
|
(179,410
|
)
|
1,420
|
|
|||||
|
Financing activities
|
108,254
|
|
31,416
|
|
(4,382
|
)
|
|||||
|
Effect of exchange rate changes on cash
|
(2,032
|
)
|
103
|
|
(49
|
)
|
|||||
|
Net (decrease) increase in cash and cash equivalents
|
$
|
6,171
|
|
$
|
(85,024
|
)
|
$
|
29,119
|
|
||
Operating activities
provided
cash of
$25,523
for Fiscal
2013
from: i) net income generated from operations of
$22,492
, and depreciation and amortization of
$16,446
, and ; ii) increased accounts payable, partially offset by increased accounts receivable and inventory, due primarily to the acquisition of Hirschmann.
Investing activities
used
cash of
$125,574
during Fiscal
2013
, primarily due to the acquisition of Hirschmann on March 14, 2012, as well as due to the purchase and renovation of the Klipsch headquarters facility, the purchase of buildings in Germany and Venezuela and the Company's system upgrade.
Financing activities
provided
cash of
$108,254
during Fiscal
2013
, primarily from cash draws from the Company's Amended Credit Facility to finance the acquisition of Hirschmann, offset by the repayment of those obligations, as well as other bank obligations and mortgages.
30
From March 1, 2012 through March 13, 2012, we had a revolving credit facility ("the Credit Facility") with an aggregated committed availability of up to $175 million. The Company could borrow under the Credit Facility as needed, provided the aggregate amounts outstanding did not exceed 85% of certain eligible accounts receivable, plus 65% of certain eligible inventory balances less the outstanding amounts for Letters of Credit Usage, if applicable. This amount could be further reduced by the aggregated amounts of reserves that may be required at the reasonable discretion of Wells Fargo in its role as the Administrative Agent. Generally, the Company could designate specific borrowings under the Credit Facility as either Base Rate Loans or LIBOR Rate Loans, except that Swing Loans could only be designated as Base Rate Loans. Loans designated as LIBOR Rate Loans bear interest at a rate equal to the then applicable LIBOR rate plus a range of 2.25 - 2.75% based on excess availability in the borrowing base. Loans designated as Base Rate loans bear interest at a rate equal to the base rate plus an applicable margin ranging from 1.25 - 1.75% based on excess availability in the borrowing base. This facility was amended and restated as indicated below on March 14, 2012.
On March 14, 2012, the Company amended and restated its Credit Facility (the "Amended Facility"). The Amended Facility provides for senior secured credit facilities in an aggregate principal amount of $205 million, consisting of a revolving credit facility of $130 million (comprised of a U.S. revolving credit facility of $80 million and a $50 million multicurrency revolving facility, of which up to the equivalent of $50 million is available only to VOXX International (Germany) GmbH in euros) and a five year term loan facility in the aggregate principal amount of $75 million. $60 million of the U. S. revolving credit facility is available on a revolving basis for five years from the closing date. An additional $20 million is available during the periods from September 1, 2012 through January 31, 2013 and from September 1, 2013 through November 30, 2013. The Amended Facility includes a $25 million sublimit for issuers of letters of credit for domestic borrowings and a $10 million sublimit for Swing Loans.
Generally, the Company may designate specific borrowings under the Amended Facility as either Alternate Base Rate Loans or LIBOR Rate Loans, except that Swing Loans may only be designated as Alternate Base Rate Loans. VOXX International (Germany) GmbH may only borrow euros, and only as LIBOR rate loans. Loans designated as LIBOR Rate Loans shall bear interest at a rate equal to the then applicable LIBOR rate plus a range of 1.25 - 2.25% based upon leverage, as defined in the agreement. Loans designated as Alternate Base Rate loans shall bear interest at a rate equal to the base rate plus an applicable margin ranging from 0.25 - 1.25% based on leverage.
All amounts outstanding under the Amended Facility will mature and become due on March 13, 2017. The Company may prepay any amounts outstanding at any time, subject to payment of certain breakage and redeployment costs relating to LIBOR Rate Loans. The commitments under the Amended Facility may be irrevocably reduced at any time without premium or penalty. The $75 million five year term loan facility is payable in twenty quarterly installments of principal commencing May 31, 2012, each in the amount of $3,750.
The Amended Facility requires compliance with financial covenants calculated as of the last day of each fiscal quarter, consisting of a Total Leverage Ratio, a Consolidated EBIT to Consolidated Interest Expense Ratio and Capital Expenditures.
The Amended Facility contains covenants that limit the ability of certain entities of the Company to, among other things: (i) incur additional indebtedness; (ii) incur liens; (iii) merge, consolidate or exit a substantial portion of their respective businesses; (iv) make any material change in the nature of their business; (v) prepay or otherwise acquire indebtedness; (vi) cause any Change of Control; (vii) make any Restricted Payments; (viii) change their fiscal year or method of accounting; (ix) make advances, loans or investments; (x) enter into or permit any transaction with an Affiliate of certain entities of the Company; or (xi) use proceeds for certain items (including capital expenditures). On May 14, 2013, the Company received a waiver for non-compliance with the covenant limiting the use of proceeds for capital expenditures. As of
February 28, 2013
, the Company was in compliance with all other debt covenants.
The Amended Facility contains customary events of default, including, without limitation: failure to pay principal thereunder when due; failure to pay any interest or other amounts thereunder for a period of three (3) business days after becoming due; failure to comply with certain agreements or covenants contained in the Amended Facility; failure to satisfy certain judgments against a Loan Party or any of its Subsidiaries (other than Immaterial Subsidiaries); certain insolvency and bankruptcy events; and failure to pay when due certain other indebtedness in an amount in excess of $5 million.
The Obligations under the Amended Facility are secured by a general lien on and security interest in the assets of certain entities of the Company, including accounts receivable, equipment, substantially all of the real estate, general intangibles and inventory provided that the assets of Hirschmann Car Communication GmbH and the foreign guarantors will only secure the Foreign Obligations. All Guarantors other than subsidiaries of Hirschmann Car Communication GmbH have jointly and severally guaranteed (or will jointly and severally guarantee) the obligations of any and all Credit Party Obligations, and each Foreign Guarantor will jointly and severally guarantee the obligations of Hirschmann Car Communications GmbH under the Credit Agreement (i.e., the Foreign Obligations).
31
On March 14, 2012, the Company borrowed approximately $148 million under this amended credit facility as a result of its stock purchase agreement related to Hirschmann (see Note 2 of the Consolidated Financial Statements).
In addition, Audiovox Germany has accounts receivable factoring arrangements totaling 16,000 Euro, a 4,000 Euro Asset-Based Lending ("ABL") credit facility and a 2,000 Euro credit line.
Certain contractual cash obligations and other commitments will impact our short and long-term liquidity. At
February 28, 2013
, such obligations and commitments are as follows:
|
|
Amount of Commitment Expiration per Period (9)
|
|||||||||||||||||||
|
|
|
Less than
|
1-3
|
4-5
|
After
|
|||||||||||||||
|
Contractual Cash Obligations
|
Total
|
1 Year
|
Years
|
Years
|
5 Years
|
|||||||||||||||
|
Capital lease obligation (1)
|
$
|
9,509
|
|
$
|
574
|
|
$
|
1,148
|
|
$
|
1,949
|
|
$
|
5,838
|
|
|||||
|
Operating leases (2)
|
16,704
|
|
9,052
|
|
5,796
|
|
1,195
|
|
661
|
|
||||||||||
|
Total contractual cash obligations
|
$
|
26,213
|
|
$
|
9,626
|
|
$
|
6,944
|
|
$
|
3,144
|
|
$
|
6,499
|
|
|||||
|
Other Commitments
|
||||||||||||||||||||
|
Bank obligations (3)
|
$
|
155,676
|
|
$
|
16,341
|
|
$
|
—
|
|
$
|
139,335
|
|
$
|
—
|
|
|||||
|
Stand-by letters of credit (4)
|
817
|
|
817
|
|
—
|
|
—
|
|
—
|
|
||||||||||
|
Commercial letters of credit (4)
|
273
|
|
273
|
|
—
|
|
—
|
|
—
|
|
||||||||||
|
Other (5)
|
23,661
|
|
9,677
|
|
6,964
|
|
2,629
|
|
4,391
|
|
||||||||||
|
Contingent earn-out payments and other (6)
|
3,914
|
|
1,998
|
|
1,916
|
|
—
|
|
—
|
|
||||||||||
|
Pension obligation (7)
|
8,440
|
|
560
|
|
1,216
|
|
510
|
|
6,154
|
|
||||||||||
|
Unconditional purchase obligations (8)
|
105,193
|
|
105,193
|
|
—
|
|
—
|
|
—
|
|
||||||||||
|
Total commercial commitments
|
$
|
297,974
|
|
$
|
134,859
|
|
$
|
10,096
|
|
$
|
142,474
|
|
$
|
10,545
|
|
|||||
|
Total Commitments
|
$
|
324,187
|
|
$
|
144,485
|
|
$
|
17,040
|
|
$
|
145,618
|
|
$
|
17,044
|
|
|||||
|
(1)
|
Represents total payments (interest and principal) due under a capital lease obligation which has a current (included in other current liabilities) and long term principal balance of $164 and $5,764, respectively at
February 28, 2013
.
|
|
(2)
|
We enter into operating leases in the normal course of business.
|
|
(3)
|
Represents amounts outstanding under the Company's Amended Credit Facility and amounts outstanding under the Audiovox Germany Euro asset-based lending facility at
February 28, 2013
.
|
|
(4)
|
Commercial letters of credit are issued during the ordinary course of business through major domestic banks as requested by certain suppliers. We also issue standby letters of credit to secure certain insurance requirements.
|
|
(5)
|
The amount includes amounts outstanding under a call-put option with certain employees of Audiovox Germany; amounts outstanding under a term loan agreement for Audiovox Germany; an assumed mortgage on a facility in connection with our Klipsch acquisition; and amounts outstanding under mortgages for facilities purchased at Schwaiger and Klipsch.
|
|
(6)
|
Represents contingent payments and other liabilities in connection with the Thomson Audio/Video, Invision and Klipsch acquisitions (see Note 2 of the Consolidated Financial Statements).
|
|
(7)
|
Represents the liability for an employer defined benefit pension plan covering certain eligible Hirschmann employees, as well as a retirement incentive accrual for certain Hirschmann employees.
|
|
(8)
|
Open purchase obligations represent inventory commitments. These obligations are not recorded in the consolidated financial statements until commitments are fulfilled and such obligations are subject to change based on negotiations with manufacturers.
|
32
|
(9)
|
At
February 28, 2013
, the Company had unrecognized tax benefits of $11,463. A reasonable estimate of the timing related to these liabilities is not possible, therefore such amounts are not reflected in this contractual obligation and commitments schedule.
|
We regularly review our cash funding requirements and attempt to meet those requirements through a combination of cash on hand, cash provided by operations, available borrowings under bank lines of credit and possible future public or private debt and/or equity offerings. At times, we evaluate possible acquisitions of, or investments in, businesses that are complementary to ours, which transactions may require the use of cash. We believe that our cash, other liquid assets, operating cash flows, credit arrangements, access to equity capital markets, taken together, provides adequate resources to fund ongoing operating expenditures. In the event that they do not, we may require additional funds in the future to support our working capital requirements or for other purposes and may seek to raise such additional funds through the sale of public or private equity and/or debt financings as well as from other sources. No assurance can be given that additional financing will be available in the future or that if available, such financing will be obtainable on terms favorable when required.
Off-Balance Sheet Arrangements
We do not maintain any off-balance sheet arrangements, transactions, obligations or other relationships with unconsolidated entities that would be expected to have a material current or future effect upon our financial condition or results of operations.
Impact of Inflation and Currency Fluctuation
To the extent that we expand our operations in Europe, Canada, Latin America and the Pacific Rim, the effects of inflation and currency fluctuations could impact our financial condition and results of operations. While the prices we pay for products purchased from our suppliers are principally denominated in United States dollars, price negotiations depend in part on the foreign currency of foreign manufacturers, as well as market, trade and political factors. The Company also has exposure related to transactions in which the currency collected from customers is different from the currency utilized to purchase the product sold in its foreign operations, and U. S. dollar denominated purchases in its foreign subsidiaries. The Company enters forward contracts to hedge certain euro-related transactions. The Company minimizes the risk of nonperformance on the forward contracts by transacting with major financial institutions. During Fiscal
2013
,
2012
and
2011
, the Company held forward contracts specifically designated for hedging (see Note 1(e)). As of
February 28, 2013
and
February 29, 2012
, unrealized gains of $197 and unrealized losses of $(123), respectively, were recorded in other comprehensive income associated with these contracts. During the fourth quarter of Fiscal 2012, the Company entered two forward contracts in the amount of $63,750 to hedge the euros required to close its pending Hirschmann acquisition in the first quarter of Fiscal 2013. These contracts were not designated for hedging, and as such, were valued at February 29, 2012. A gain of $1,581 associated with these contracts was recorded through other income during Fiscal 2012 and a loss of $2,670 was recorded during the first quarter of Fiscal 2013 when the contracts were settled. Additionally, the Company acquired 36 contracts in conjunction with the Hirschmann acquisition that were unable to qualify for hedge accounting during the year ended February 28, 2013. Thirty two of these contracts were settled during Fiscal 2013 for a gain of $106 and recorded through other income.
Effective January 1, 2010, according to the guidelines in ASC 830, Venezuela had been designated as a hyper-inflationary economy. A hyper-inflationary economy designation occurs when a country has experienced cumulative inflation of approximately 100 percent or more over a 3 year period. The hyper-inflationary designation requires the local subsidiary in Venezuela to record all transactions as if they were denominated in U.S. dollars. The Company transitioned to hyper-inflationary accounting on March 1, 2010 and continues to account for Venezuela under this method.
In February 2013, the Venezuelan government announced the devaluation of the Bolivar fuerte, moving the official exchange rate from 4.30 to 6.30 per U.S. dollar. The devaluation resulted in a one-time net currency exchange gain of approximately $2,400 in the fourth quarter of Fiscal 2013.
The Company has certain U. S. dollar denominated assets and liabilities in its Venezuelan operations. Our TICC bond investment (see Note 1(f)) and our U. S dollar denominated intercompany debt have been subject to currency fluctuations associated with the devaluation of the Bolívar fuerte, the most recent devaluation taking place in February 2013, and the temporary institution in 2010 of a two-tier exchange rate by the Venezuelan government. The TICC bond is valued at the current Venezuelan exchange rate of 6.3 and classified as a held-to-maturity investment at amortized cost at
February 28, 2013
.
Seasonality
33
We typically experience seasonality in our operations. We generally sell a substantial amount of our products during September, October and November due to increased promotional and advertising activities during the holiday season. Our business is also significantly impacted by the holiday season.
Related Party Transactions
During 1996, we entered into a 30-year capital lease for a building with our principal stockholder and chairman, which was the headquarters of the discontinued Cellular operation sold in 2004. Payments on the capital lease were based upon the construction costs of the building and the then-current interest rates. This capital lease was refinanced in December 2006 and the lease expires on November 30, 2026. The effective interest rate on the capital lease obligation is 8%. The Company subleases the building to Airtyme Communications LLC for monthly payments of $60 for a term of three years, which expires on October 15, 2015. We also lease another facility from our principal stockholder which expires on November 30, 2016.
As a result of the acquisition of Klipsch, the Company assumed a lease for the facility housing the Klipsch headquarters in Indianapolis, IN. The lessor was Woodview, LLC ("Woodview"), of which certain partners are executives of Klipsch. On April 20, 2012, the Company purchased this building from Woodview for $10.9 million. The Company paid cash of $3.1 million at closing plus $106 in closing costs, and assumed the mortgage held by Woodview in the amount of $7.8 million. The mortgage is due in June 2013 and bears interest at 5.85%.
Total lease payments required under all related party leases for the five-year period ending February 28,
2018
are $5,987.
Recent Accounting Pronouncements
We are required to adopt certain new accounting pronouncements. See Note 1(w) to our consolidated financial statements of this Annual Report on Form 10-K.
The market risk inherent in our market instruments and positions is the potential loss arising from adverse changes in marketable equity security prices, interest rates and foreign currency exchange rates.
Marketable Securities
Marketable securities at
February 28, 2013
, which are recorded at fair value of $3,660, include an unrealized gain of $3 and have exposure to price fluctuations. This risk is estimated as the potential loss in fair value resulting from a hypothetical 10% adverse change in prices quoted by stock exchanges and amounts to $366 as of
February 28, 2013
. Actual results may differ.
Interest Rate Risk
Our earnings and cash flows are subject to fluctuations due to changes in interest rates on investment of available cash balances in money market funds and investment grade corporate and U.S. government securities. Currently, we do not use interest rate derivative instruments to manage exposure to interest rate changes. In addition, our bank loans expose us to changes in short-term interest rates since interest rates on the underlying obligations are either variable or fixed.
Foreign Exchange Risk
We are subject to risk from changes in foreign exchange rates for our subsidiaries and marketable securities that use a foreign currency as their functional currency and are translated into U.S. dollars. These changes result in cumulative translation adjustments, which are included in accumulated other comprehensive income (loss). At
February 28, 2013
, we had translation exposure to various foreign currencies with the most significant being the Euro, Hong Kong Dollar, Mexican Peso, Venezuelan Bolivar, Hungarian Forint and Canadian Dollar. The potential loss resulting from a hypothetical 10% adverse change in quoted foreign currency exchange rates, as of
February 28, 2013
amounts to $3,688. Actual results may differ.
The Company continues to monitor the political and economic climate in Venezuela. Venezuela represents 1.4% of year to date sales. The majority of assets invested in Venezuela are cash related and are subject to government foreign exchange controls including its investment in Venezuelan government bonds (see Note 1(f)).
34
The information required by this item begins on page
37
of this Annual Report on Form 10-K and is incorporated herein by reference.
Not applicable.
Evaluation of Disclosure Controls and Procedures
VOXX International Corporation and subsidiaries (the "Company") maintains disclosure controls and procedures that are designed to ensure that information required to be disclosed in the reports that the Company files or submits under the Securities and Exchange Act is recorded, processed, summarized, and reported within the time periods specified in accordance with the SEC's rules and regulations, and that such information is accumulated and communicated to the Company’s management, including its Chief Executive Officer and Chief Financial Officer, as appropriate, to allow timely decisions regarding required financial disclosures.
As of the end of the period covered by this report, the Company carried out an evaluation, under the supervision and with the participation of the Company’s management, including the Chief Executive Officer and Chief Financial Officer, of the effectiveness of the design and operation of its disclosure controls and procedures pursuant to the Securities and Exchange Act Rule 13a-15. Based upon this evaluation as of
February 28, 2013
, the Chief Executive Officer and Chief Financial Officer concluded that the Company’s disclosure controls and procedures are effective and adequately designed.
Management's Report on Internal Control Over Financial Reporting
The Company’s management is responsible for establishing and maintaining adequate internal control over financial reporting; as such term is defined in the Securities and Exchange Act Rules 13a-15(f) and 15d-15(f). The Company’s internal control over financial reporting is a process designed to provide reasonable assurance regarding the reliability of financial reporting and the preparation of financial statements for external purposes in accordance with generally accepted accounting principles and includes those policies and procedures that:
|
•
|
Pertain to the maintenance of records that in reasonable detail accurately and fairly reflect the transactions and dispositions of the assets of the Company;
|
|
•
|
Provide reasonable assurance that transactions are recorded as necessary to permit preparation of financial statements in accordance with generally accepted accounting principles, and that receipts and expenditures of the Company are being made only in accordance with authorizations of management and directors of the Company; and
|
|
•
|
Provide reasonable assurance regarding prevention or timely detection of unauthorized acquisition, use or disposition of the Company’s assets that could have a material effect on the financial statements.
|
Because of its inherent limitations, internal control over financial reporting may not prevent or detect misstatements. Projections of any evaluation of effectiveness to future periods are subject to the risk that controls may become inadequate because of changes in conditions, or that the degree of compliance with the policies or procedures may deteriorate.
Management evaluated the effectiveness of the Company’s internal control over financial reporting using the criteria set forth by the Committee of Sponsoring Organizations of the Treadway Commission (COSO) in Internal Control-Integrated Framework. Under the supervision and with the participation of the Company’s management, including the Chief Executive Officer and Chief Financial Officer, the Company conducted an evaluation of the effectiveness of its internal control over financial reporting as of
February 28, 2013
. Based on that evaluation, management concluded that the Company's internal control over financial reporting was effective as of
February 28, 2013
based on the COSO criteria.
The certifications of the Company’s Chief Executive Officer and Chief Financial Officer included in Exhibits 31.1 and 31.2 to this Annual Report on Form 10-K includes, in paragraph 4 of such certifications, information concerning the Company’s disclosure controls and procedures and internal control over financial reporting. Such certifications should be read in conjunction with the information contained in this Item 9A. Controls and Procedures, for a more complete understanding of the matters covered by such certifications.
The effectiveness of the Company’s internal control over financial reporting as of
February 28, 2013
, has been audited by Grant Thornton LLP, an independent registered public accounting firm who also audited the Company’s consolidated financial statements.
35
Grant Thornton LLP’s attestation report on the effectiveness of the Company’s internal control over financial reporting is included below.
36
REPORT OF INDEPENDENT REGISTERED PUBLIC ACCOUNTING FIRM
Board of Directors and Stockholders
VOXX International Corporation
We have audited the internal control over financial reporting of Voxx International Corporation (a Delaware corporation) and subsidiaries(the “Company”) as of
February 28, 2013
, based on criteria established in
Internal Control - Integrated Framework
issued by the Committee of Sponsoring Organizations of the Treadway Commission (COSO). The Company's management is responsible for maintaining effective internal control over financial reporting and for its assessment of the effectiveness of internal control over financial reporting, included in the accompanying Management's Report on Internal Control Over Financial Reporting. Our responsibility is to express an opinion on the Company's internal control over financial reporting based on our audit.
We conducted our audit in accordance with the standards of the Public Company Accounting Oversight Board (United States). Those standards require that we plan and perform the audit to obtain reasonable assurance about whether effective internal control over financial reporting was maintained in all material respects. Our audit included obtaining an understanding of internal control over financial reporting, assessing the risk that a material weakness exists, testing and evaluating the design and operating effectiveness of internal control based on the assessed risk, and performing such other procedures as we considered necessary in the circumstances. We believe that our audit provides a reasonable basis for our opinion.
A company's internal control over financial reporting is a process designed to provide reasonable assurance regarding the reliability of financial reporting and the preparation of financial statements for external purposes in accordance with generally accepted accounting principles. A company's internal control over financial reporting includes those policies and procedures that (1) pertain to the maintenance of records that, in reasonable detail, accurately and fairly reflect the transactions and dispositions of the assets of the company; (2) provide reasonable assurance that transactions are recorded as necessary to permit preparation of financial statements in accordance with generally accepted accounting principles, and that receipts and expenditures of the company are being made only in accordance with authorizations of management and directors of the company; and (3) provide reasonable assurance regarding prevention or timely detection of unauthorized acquisition, use, or disposition of the company's assets that could have a material effect on the financial statements.
Because of its inherent limitations, internal control over financial reporting may not prevent or detect misstatements. Also, projections of any evaluation of effectiveness to future periods are subject to the risk that controls may become inadequate because of changes in conditions, or that the degree of compliance with the policies or procedures may deteriorate.
In our opinion, the Company maintained, in all material respects, effective internal control over financial reporting as of
February 28, 2013
, based on criteria established in
Internal Control - Integrated Framework
issued by COSO.
We also have audited, in accordance with the standards of the Public Company Accounting Oversight Board (United States), the consolidated financial statements of the Company as of and for the year ended
February 28, 2013
, and our report dated
May 14, 2013
expressed an unqualified opinion on those financial statements.
/s/ GRANT THORNTON LLP
Melville, New York
May 14, 2013
37
Changes in Internal Controls Over Financial Reporting
There were no material changes in our internal control over financial reporting (as such term is defined in Exchange Act Rules 13a-15(f) and 15d-15(f)) during the most recently completed fiscal fourth quarter ended
February 28, 2013
covered by this report, that have materially affected, or are reasonably likely to materially affect, our internal controls over financial reporting.
Not Applicable
The information required by Item 10 (Directors, Executive Officers and Corporate Governance), Item 11 (Executive Compensation), Item 12 (Security Ownership of Certain Beneficial Owners and Management and Related Stockholder Matters), Item 13 (Certain Relationships and Related Transactions, and Director Independence) and Item 14 (Principal Accounting Fees and Services) of Form 10-K, will be included in our Proxy Statement for the Annual meeting of Stockholders, which will be filed on or before
June 28, 2013
, and such information is incorporated herein by reference.
(1 and 2) Financial Statements and Financial Statement Schedules. See Index to Consolidated Financial Statements attached hereto.
(3) Exhibits. A list of exhibits is included subsequent to Schedule II on page S-1.
38
VOXX INTERNATIONAL CORPORATION
INDEX TO CONSOLIDATED FINANCIAL STATEMENTS
|
Financial Statements:
|
Page
|
|
Report of Independent Registered Public Accounting Firm
|
|
|
Consolidated Balance Sheets as of February 28, 2013 and February 29, 2012
|
|
|
Consolidated Statements of Operations and Comprehensive Income for the years ended February 28, 2013, February 29, 2012 and February 28, 2011
|
|
|
Consolidated Statements of Stockholders’ Equity for the years ended February 28, 2013, February 29, 2012 and February 28, 2011
|
|
|
Consolidated Statements of Cash Flows for the years ended February 28, 2013, February 29, 2012 and February 28, 2011
|
|
|
Notes to Consolidated Financial Statements
|
|
|
Financial Statement Schedule:
|
|
|
Schedule II - Valuation and Qualifying Accounts
|
|
39
REPORT OF INDEPENDENT REGISTERED PUBLIC ACCOUNTING FIRM
Board of Directors and Stockholders
VOXX International Corporation
We have audited the accompanying consolidated balance sheets of Voxx International Corporation (a Delaware corporation) and subsidiaries (the “Company”) as of
February 28, 2013
and
February 29, 2012
, and the related consolidated statements of operations and comprehensive income, stockholders' equity and cash flows for each of the three years in the period ended
February 28, 2013
. Our audits of the basic consolidated financial statements included the financial statement schedule listed in the index appearing under Item 15. These financial statements and financial statement schedule are the responsibility of the Company's management. Our responsibility is to express an opinion on these financial statements and financial statement schedule based on our audits.
We conducted our audits in accordance with the standards of the Public Company Accounting Oversight Board (United States). Those standards require that we plan and perform the audit to obtain reasonable assurance about whether the financial statements are free of material misstatement. An audit includes examining, on a test basis, evidence supporting the amounts and disclosures in the financial statements. An audit also includes assessing the accounting principles used and significant estimates made by management, as well as evaluating the overall financial statement presentation. We believe that our audits provide a reasonable basis for our opinion.
In our opinion, the consolidated financial statements referred to above present fairly, in all material respects, the financial position of Voxx International Corporation and subsidiaries as of
February 28, 2013
and
February 29, 2012
, and the results of their operations and their cash flows for each of the three years in the period ended
February 28, 2013
in conformity with accounting principles generally accepted in the United States of America. Also in our opinion, the related financial statement schedule, when considered in relation to the basic consolidated financial statements taken as a whole, presents fairly, in all material respects, the information set forth therein.
We also have audited, in accordance with the standards of the Public Company Accounting Oversight Board (United States), the Company's internal control over financial reporting as of
February 28, 2013
, based on criteria established in
Internal Control - Integrated Framework
issued by the Committee of Sponsoring Organizations of the Treadway Commission (COSO) and our report dated
May 14, 2013
expressed an unqualified opinion.
/s/ GRANT THORNTON LLP
Melville, New York
May 14, 2013
40
VOXX International Corporation and Subsidiaries
February 28, 2013
and
February 29, 2012
(In thousands, except share data)
|
February 28,
2013 |
February 29,
2012 |
||||||
|
Assets
|
|
|
|||||
|
Current assets:
|
|
|
|||||
|
Cash and cash equivalents
|
$
|
19,777
|
|
$
|
13,606
|
|
|
|
Accounts receivable, net
|
152,596
|
|
142,585
|
|
|||
|
Inventory
|
159,099
|
|
129,514
|
|
|||
|
Receivables from vendors
|
9,943
|
|
4,011
|
|
|||
|
Prepaid expenses and other current assets
|
12,017
|
|
13,549
|
|
|||
|
Income tax receivable
|
448
|
|
698
|
|
|||
|
Deferred income taxes
|
3,362
|
|
3,149
|
|
|||
|
Total current assets
|
357,242
|
|
307,112
|
|
|||
|
Investment securities
|
13,570
|
|
13,102
|
|
|||
|
Equity investments
|
17,518
|
|
14,893
|
|
|||
|
Property, plant and equipment, net
|
76,208
|
|
31,779
|
|
|||
|
Goodwill
|
146,680
|
|
86,069
|
|
|||
|
Intangible assets, net
|
205,398
|
|
175,349
|
|
|||
|
Deferred income taxes
|
924
|
|
796
|
|
|||
|
Other assets
|
11,732
|
|
3,782
|
|
|||
|
Total assets
|
$
|
829,272
|
|
$
|
632,882
|
|
|
|
Liabilities and Stockholders' Equity
|
|
|
|
|
|||
|
Current liabilities:
|
|
|
|
|
|||
|
Accounts payable
|
$
|
56,894
|
|
$
|
42,026
|
|
|
|
Accrued expenses and other current liabilities
|
51,523
|
|
52,679
|
|
|||
|
Income taxes payable
|
5,103
|
|
5,864
|
|
|||
|
Accrued sales incentives
|
16,821
|
|
18,154
|
|
|||
|
Deferred income taxes
|
178
|
|
515
|
|
|||
|
Current portion of long-term debt
|
26,020
|
|
3,592
|
|
|||
|
Total current liabilities
|
156,539
|
|
122,830
|
|
|||
|
Long-term debt
|
148,996
|
|
34,860
|
|
|||
|
Capital lease obligation
|
5,764
|
|
5,196
|
|
|||
|
Deferred compensation
|
4,914
|
|
3,196
|
|
|||
|
Other tax liabilities
|
9,631
|
|
2,943
|
|
|||
|
Deferred tax liabilities
|
43,944
|
|
34,220
|
|
|||
|
Other long-term liabilities
|
14,948
|
|
7,840
|
|
|||
|
Total liabilities
|
384,736
|
|
211,085
|
|
|||
|
Commitments and contingencies
|
|
|
|
|
|||
|
Stockholders' equity:
|
|
|
|
|
|||
|
Preferred stock
|
—
|
|
—
|
|
|||
|
Common stock
|
254
|
|
250
|
|
|||
|
Paid-in capital
|
283,971
|
|
281,213
|
|
|||
|
Retained earnings
|
185,168
|
|
162,676
|
|
|||
|
Accumulated other comprehensive loss
|
(6,497
|
)
|
(3,973
|
)
|
|||
|
Treasury stock, at cost
|
(18,360
|
)
|
(18,369
|
)
|
|||
|
Total stockholders' equity
|
444,536
|
|
421,797
|
|
|||
|
Total liabilities and stockholders' equity
|
$
|
829,272
|
|
$
|
632,882
|
|
|
See accompanying notes to consolidated financial statements.
41
VOXX International Corporation and Subsidiaries
Years Ended
February 28, 2013
,
February 29, 2012
and
February 28, 2011
(In thousands, except share and per share data)
|
Year
Ended
|
Year
Ended
|
Year
Ended
|
|||||||||
|
February 28,
2013 |
February 29,
2012 |
February 28,
2011 |
|||||||||
|
Net sales
|
$
|
835,577
|
|
$
|
707,062
|
|
$
|
561,672
|
|
||
|
Cost of sales
|
598,755
|
|
504,107
|
|
437,735
|
|
|||||
|
Gross profit
|
236,822
|
|
202,955
|
|
123,937
|
|
|||||
|
Operating expenses:
|
|
|
|
|
|
|
|||||
|
Selling
|
51,976
|
|
47,282
|
|
34,517
|
|
|||||
|
General and administrative
|
114,653
|
|
93,219
|
|
67,262
|
|
|||||
|
Engineering and technical support
|
26,971
|
|
15,825
|
|
11,934
|
|
|||||
|
Acquisition related costs
|
1,526
|
|
2,755
|
|
1,207
|
|
|||||
|
Total operating expenses
|
195,126
|
|
159,081
|
|
114,920
|
|
|||||
|
Operating income
|
41,696
|
|
43,874
|
|
9,017
|
|
|||||
|
Other (expense) income:
|
|
|
|
|
|
|
|||||
|
Interest and bank charges
|
(8,288
|
)
|
(5,630
|
)
|
(2,630
|
)
|
|||||
|
Equity in income of equity investee
|
4,880
|
|
4,035
|
|
2,905
|
|
|||||
|
Other, net
|
(2,633
|
)
|
(3,387
|
)
|
3,204
|
|
|||||
|
Total other (expenses) income, net
|
(6,041
|
)
|
(4,982
|
)
|
3,479
|
|
|||||
|
Income from operations before income taxes
|
35,655
|
|
38,892
|
|
12,496
|
|
|||||
|
Income tax expense (benefit)
|
13,163
|
|
13,243
|
|
(10,535
|
)
|
|||||
|
Net income
|
22,492
|
|
25,649
|
|
23,031
|
|
|||||
|
Other comprehensive income (loss):
|
|||||||||||
|
Foreign currency translation adjustments
|
(1,281
|
)
|
(1,153
|
)
|
795
|
|
|||||
|
Derivatives designated for hedging
|
(174
|
)
|
(131
|
)
|
238
|
|
|||||
|
Reclassification adjustment of other-than-temporary impairment loss (gain) on available-for-sale investment into net income
|
—
|
|
1,225
|
|
1,600
|
|
|||||
|
Pension plan adjustments, net of tax
|
(1,031
|
)
|
—
|
|
—
|
|
|||||
|
Unrealized holding gain (loss) on available-for-sale investment securities arising during the period, net of tax
|
(38
|
)
|
(65
|
)
|
796
|
|
|||||
|
Other comprehensive income (loss), net of tax
|
(2,524
|
)
|
(124
|
)
|
3,429
|
|
|||||
|
Comprehensive income
|
$
|
19,968
|
|
$
|
25,525
|
|
$
|
26,460
|
|
||
|
Net income per common share (basic)
|
$
|
0.96
|
|
$
|
1.11
|
|
$
|
1.00
|
|
||
|
Net income per common share (diluted)
|
$
|
0.95
|
|
$
|
1.10
|
|
$
|
1.00
|
|
||
|
Weighted-average common shares outstanding (basic)
|
23,415,570
|
|
23,080,081
|
|
22,938,754
|
|
|||||
|
Weighted-average common shares outstanding (diluted)
|
23,617,101
|
|
23,265,206
|
|
23,112,518
|
|
|||||
See accompanying notes to consolidated financial statements.
42
VOXX International Corporation and Subsidiaries
Consolidated Statements of Stockholders' Equity
Years Ended
February 28, 2013
,
February 29, 2012
and
February 28, 2011
(In thousands, except share data)
|
Class A
and Class B
Common
Stock
|
Paid-in
Capital
|
Retained
Earnings
|
Accumulated
other
comprehensive
income (loss)
|
Treasury
stock
|
Total
Stock-
holders'
equity
|
|||||||||||||||||||
|
Balances at February 28, 2010
|
$
|
247
|
|
$
|
275,684
|
|
$
|
113,996
|
|
$
|
(7,278
|
)
|
$
|
(18,386
|
)
|
$
|
364,263
|
|
||||||
|
Net income
|
—
|
|
—
|
|
23,031
|
|
—
|
|
—
|
|
23,031
|
|
||||||||||||
|
Other comprehensive income, net of tax
|
—
|
|
—
|
|
—
|
|
3,429
|
|
—
|
|
3,429
|
|
||||||||||||
|
Exercise of stock options into 189,125 shares of common stock
|
1
|
|
931
|
|
—
|
|
—
|
|
—
|
|
932
|
|
||||||||||||
|
Stock-based compensation expense
|
—
|
|
1,284
|
|
—
|
|
—
|
|
—
|
|
1,284
|
|
||||||||||||
|
Issuance of 975 shares of treasury stock
|
—
|
|
(3
|
)
|
—
|
|
—
|
|
10
|
|
7
|
|
||||||||||||
|
Balances at February 28, 2011
|
248
|
|
277,896
|
|
137,027
|
|
(3,849
|
)
|
(18,376
|
)
|
392,946
|
|
||||||||||||
|
Net income
|
—
|
|
—
|
|
25,649
|
|
—
|
|
—
|
|
25,649
|
|
||||||||||||
|
Other comprehensive income, net of tax
|
—
|
|
—
|
|
—
|
|
(124
|
)
|
—
|
|
(124
|
)
|
||||||||||||
|
Exercise of stock options into 61,875 shares of common stock
|
2
|
|
2,235
|
|
—
|
|
—
|
|
—
|
|
2,237
|
|
||||||||||||
|
Stock-based compensation expense
|
—
|
|
1,082
|
|
—
|
|
—
|
|
—
|
|
1,082
|
|
||||||||||||
|
Issuance of 720 shares of treasury stock
|
—
|
|
—
|
|
—
|
|
—
|
|
7
|
|
7
|
|
||||||||||||
|
Balances at February 29, 2012
|
250
|
|
281,213
|
|
162,676
|
|
(3,973
|
)
|
(18,369
|
)
|
421,797
|
|
||||||||||||
|
Net income
|
—
|
|
—
|
|
22,492
|
|
—
|
|
—
|
|
22,492
|
|
||||||||||||
|
Other comprehensive income, net of tax
|
—
|
|
—
|
|
—
|
|
(2,524
|
)
|
—
|
|
(2,524
|
)
|
||||||||||||
|
Exercise of stock options into 404,852 shares of common stock
|
4
|
|
2,323
|
|
—
|
|
—
|
|
—
|
|
2,327
|
|
||||||||||||
|
Stock-based compensation expense
|
—
|
|
435
|
|
—
|
|
—
|
|
—
|
|
435
|
|
||||||||||||
|
Issuance of 1,000 shares of treasury stock
|
—
|
|
—
|
|
—
|
|
—
|
|
9
|
|
9
|
|
||||||||||||
|
Balances at February 28, 2013
|
$
|
254
|
|
$
|
283,971
|
|
$
|
185,168
|
|
$
|
(6,497
|
)
|
$
|
(18,360
|
)
|
$
|
444,536
|
|
||||||
See accompanying notes to consolidated financial statements.
43
VOXX International Corporation and Subsidiaries
Years Ended
February 28, 2013
,
February 29, 2012
and
February 28, 2011
(Amounts in thousands)
|
Year
Ended
|
Year
Ended
|
Year
Ended
|
|||||||||
|
February 28,
2013 |
February 29,
2012 |
February 28,
2011 |
|||||||||
|
Cash flows from operating activities:
|
|
|
|
||||||||
|
Net income
|
$
|
22,492
|
|
$
|
25,649
|
|
$
|
23,031
|
|
||
|
Adjustments to reconcile net income to net cash provided by operating activities:
|
|
|
|
|
|
|
|||||
|
Depreciation and amortization
|
16,446
|
|
10,295
|
|
7,865
|
|
|||||
|
Amortization of deferred financing costs
|
1,210
|
|
680
|
|
—
|
|
|||||
|
Bad debt expense
|
1,377
|
|
1,771
|
|
1,022
|
|
|||||
|
Equity in income of equity investee
|
(4,880
|
)
|
(4,035
|
)
|
(2,905
|
)
|
|||||
|
Distribution of income from equity investees
|
2,256
|
|
1,906
|
|
1,413
|
|
|||||
|
Deferred income tax (benefit) expense, net
|
(407
|
)
|
4,075
|
|
(13,566
|
)
|
|||||
|
Loss on disposal of property, plant and equipment
|
1
|
|
237
|
|
64
|
|
|||||
|
Non-cash compensation adjustment
|
523
|
|
(139
|
)
|
717
|
|
|||||
|
Non-cash stock based compensation expense
|
435
|
|
1,082
|
|
1,284
|
|
|||||
|
Realized loss on sale of investment
|
—
|
|
—
|
|
182
|
|
|||||
|
Impairment loss on marketable securities
|
—
|
|
1,225
|
|
1,600
|
|
|||||
|
Tax benefit on stock options exercised
|
(117
|
)
|
(1,846
|
)
|
—
|
|
|||||
|
Changes in operating assets and liabilities (net of assets and liabilities acquired):
|
|
|
|
|
|
|
|||||
|
Accounts receivable
|
13,382
|
|
(8,834
|
)
|
22,462
|
|
|||||
|
Inventory
|
(9,982
|
)
|
13,269
|
|
(12,007
|
)
|
|||||
|
Receivables from vendors
|
(5,824
|
)
|
4,363
|
|
2,802
|
|
|||||
|
Prepaid expenses and other
|
(2,865
|
)
|
(5,908
|
)
|
4,657
|
|
|||||
|
Investment securities-trading
|
(210
|
)
|
357
|
|
(646
|
)
|
|||||
|
Accounts payable, accrued expenses, accrued sales incentives and other current liabilities
|
(13,511
|
)
|
12,698
|
|
(9,273
|
)
|
|||||
|
Income taxes payable
|
5,197
|
|
6,022
|
|
3,428
|
|
|||||
|
Net cash provided by operating activities
|
25,523
|
|
62,867
|
|
32,130
|
|
|||||
|
Cash flows from investing activities:
|
|
|
|
|
|
|
|||||
|
Purchases of property, plant and equipment
|
(20,210
|
)
|
(12,364
|
)
|
(3,055
|
)
|
|||||
|
Purchase of short-term investments
|
—
|
|
—
|
|
(23,981
|
)
|
|||||
|
Sale of short-term investments
|
—
|
|
—
|
|
24,210
|
|
|||||
|
Sale of long-term investment
|
—
|
|
—
|
|
4,368
|
|
|||||
|
Purchase of long-term investment
|
(261
|
)
|
—
|
|
(245
|
)
|
|||||
|
Decrease in notes receivable
|
34
|
|
214
|
|
180
|
|
|||||
|
Purchase of acquired businesses, less cash acquired
|
(105,137
|
)
|
(167,260
|
)
|
(57
|
)
|
|||||
|
Net cash (used in) provided by investing activities
|
(125,574
|
)
|
(179,410
|
)
|
1,420
|
|
|||||
|
Cash flows from financing activities:
|
|
|
|
|
|
|
|||||
|
Repayment of short-term debt
|
(141
|
)
|
(927
|
)
|
(3,950
|
)
|
|||||
|
Borrowings from bank obligations
|
146,911
|
|
89,248
|
|
285
|
|
|||||
|
Repayments on bank obligations
|
(37,482
|
)
|
(55,765
|
)
|
(1,479
|
)
|
|||||
|
Principal payments on capital lease obligation
|
(329
|
)
|
(102
|
)
|
(180
|
)
|
|||||
|
Proceeds from exercise of stock options and warrants
|
2,623
|
|
399
|
|
942
|
|
|||||
|
Deferred financing costs
|
(3,445
|
)
|
(3,283
|
)
|
—
|
|
|||||
|
Tax expense on stock options exercised
|
117
|
|
1,846
|
|
—
|
|
|||||
|
Net cash provided by (used in) financing activities
|
108,254
|
|
31,416
|
|
(4,382
|
)
|
|||||
|
Effect of exchange rate changes on cash
|
(2,032
|
)
|
103
|
|
(49
|
)
|
|||||
|
Net increase (decrease) in cash and cash equivalents
|
6,171
|
|
(85,024
|
)
|
29,119
|
|
|||||
|
Cash and cash equivalents at beginning of year
|
13,606
|
|
98,630
|
|
69,511
|
|
|||||
|
Cash and cash equivalents at end of year
|
$
|
19,777
|
|
$
|
13,606
|
|
$
|
98,630
|
|
||
|
Supplemental Cash Flow Information:
|
|
|
|
|
|
|
|||||
|
Cash paid during the period for:
|
|
|
|
|
|
|
|||||
|
Interest, excluding bank charges
|
$
|
6,302
|
|
$
|
3,520
|
|
$
|
2,138
|
|
||
|
Income taxes (net of refunds)
|
$
|
5,486
|
|
$
|
1,499
|
|
$
|
1,257
|
|
||
See accompanying notes to consolidated financial statements.
44
VOXX International Corporation and Subsidiaries
Notes to Consolidated Financial Statements
February 28, 2013
(Amounts in thousands, except share and per share data)
|
1)
|
Description of Business and Summary of Significant Accounting Policies
|
a)
Description of Business
Effective December 1, 2011, Audiovox Corporation changed its name to VOXX International Corporation ("Voxx," "We," "Our," "Us" or "the Company"). The Company believes that the name VOXX International would be a name that better represents the widely diversified interests of the Company, and the more than 30 global brands it has acquired and grown throughout the years, achieving a powerful international vehicle for each of these respective brands to emerge with its own identity. Voxx is a leading international distributor in the accessory, mobile and consumer electronics industries. We conduct our business through nineteen wholly-owned subsidiaries: American Radio Corp., Audiovox Electronics Corporation ("AEC"), VOXX Accessories Corp. ("AAC"), Audiovox Consumer Electronics, Inc. ("ACE"), Audiovox German Holdings GmbH ("Audiovox Germany"), Audiovox Venezuela, C.A., Audiovox Canada Limited, Audiovox Hong Kong Ltd., Audiovox International Corp., Audiovox Mexico, S. de R.L. de C.V. ("Audiovox Mexico"), Technuity, Inc., Code Systems, Inc., Oehlbach Kabel GmbH ("Oehlbach"), Schwaiger GmbH ("Schwaiger"), Invision Automotive Systems, Inc. ("Invision"), Klipsch Holding LLC ("Klipsch"), Car Communication Holding GmbH ("Hirschmann"), Omega Research and Development, LLC ("Omega") and Audiovox Websales LLC. We market our products under the Audiovox® brand name, other brand names and licensed brands, such as Acoustic Research®, Advent®, Ambico®, Car Link®, Chapman®, Code-Alarm®, Discwasher®, Energizer®, Energy®, Heco®, Hirschmann Car Communication®, Incaar
™
, Invision®, Jamo®, Jensen®, Klipsch®, Mac Audio
™
, Magnat®, Mirage®, Movies2Go®, Oehlbach®, Omega®, Phase Linear®, Prestige®, Pursuit®, RCA®, RCA Accessories®, Recoton®, Road Gear®, Schwaiger®, Spikemaster® and Terk®, as well as private labels through a large domestic and international distribution network. We also function as an OEM ("Original Equipment Manufacturer") supplier to several customers and presently have three reportable segments, which are organized by product category: Automotive, Premium Audio and Consumer Accessories.
b)
Principles of Consolidation, Reclassifications and Accounting Principles
The consolidated financial statements include the financial statements of VOXX International Corporation and its wholly-owned subsidiaries. All significant intercompany balances and transactions have been eliminated in consolidation. The Company acquired Car Communication Holding GmbH ("Hirschmann") on March 14, 2012. The consolidated financial statements presented for the year ended
February 28, 2013
include the operations of Hirschmann beginning March 14, 2012. The Company acquired Klipsch Group, Inc. and its worldwide subsidiaries ("Klipsch") on March 1, 2011. The consolidated financial statements for the full years ended
February 28, 2013
and
February 29, 2012
include the operations of Klipsch.
Equity investments in which the Company exercises significant influence but does not control and is not the primary beneficiary are accounted for using the equity method. The Company's share of its equity method investees' earnings or losses are included in other income in the accompanying Consolidated Statements of Operations and Comprehensive Income. The Company eliminates its pro rata share of gross profit on sales to its equity method investees for inventory on hand at the investee at the end of the year. Investments in which the Company is not able to exercise significant influence over the investee are accounted for under the cost method.
Certain amounts in prior years have been reclassified to conform to the current year presentation. Effective December 1, 2012, the Company realigned its subsidiaries into three operating segments based upon the Company's products and internal organization structure (see Note 13).
The financial statements and accompanying notes are prepared in accordance with accounting principles generally accepted in the United States of America.
45
c)
Use of Estimates
The preparation of these financial statements require the Company to make estimates and assumptions that affect reported amounts of assets, liabilities, revenue and expenses. Such estimates include the allowance for doubtful accounts, inventory valuation, recoverability of deferred tax assets, reserve for uncertain tax positions, valuation of long-lived assets, accrued sales incentives, warranty reserves, stock-based compensation, valuation and impairment assessment of investment securities, goodwill, trademarks and other intangible assets, and disclosure of contingent assets and liabilities at the date of the consolidated financial statements. Actual results could differ from those estimates.
d)
Cash and Cash Equivalents
Cash and cash equivalents consist of demand deposits with banks and highly liquid money market funds with original maturities of three months or less when purchased. Cash and cash equivalents amounted to
$19,777
and
$13,606
at
February 28, 2013
and
February 29, 2012
, respectively. Cash amounts held in foreign bank accounts amounted to
$12,121
and
$5,828
at
February 28, 2013
and
February 29, 2012
, respectively. The majority of these amounts are in excess of government insurance. The Company places its cash and cash equivalents in institutions and funds of high credit quality. We perform periodic evaluations of these institutions and funds.
e)
Fair Value Measurements and Derivatives
The Company applies the authoritative guidance on "Fair Value Measurements," which among other things, requires enhanced disclosures about investments that are measured and reported at fair value. This guidance establishes a hierarchal disclosure framework that prioritizes and ranks the level of market price observability used in measuring investments at fair value. Market price observability is impacted by a number of factors, including the type of investment and the characteristics specific to the investment. Investments with readily available active quoted prices or for which fair value can be measured from actively quoted prices generally will have a higher degree of market price observability and a lesser degree of judgment used in measuring fair value.
Investments measured and reported at fair value are classified and disclosed in one of the following categories:
Level 1 - Quoted market prices in active markets for identical assets or liabilities.
Level 2 - Inputs other than Level 1 inputs that are either directly or indirectly observable.
Level 3 - Unobservable inputs developed using the Company's estimates and assumptions, which reflect those that market participants would use.
The following table presents assets measured at fair value on a recurring basis at
February 28, 2013
:
|
|
|
Fair Value Measurements at Reporting Date Using
|
|||||||||
|
|
|
Level 1
|
Level 2
|
||||||||
|
Cash and cash equivalents:
|
|
|
|
||||||||
|
Cash and money market funds
|
$
|
19,777
|
|
$
|
19,777
|
|
$
|
—
|
|
||
|
Derivatives
|
|
|
|
|
|
|
|||||
|
Designated for hedging
|
$
|
(10
|
)
|
$
|
—
|
|
$
|
(10
|
)
|
||
|
Not designated
|
(21
|
)
|
—
|
|
(21
|
)
|
|||||
|
Total derivatives
|
$
|
(31
|
)
|
$
|
—
|
|
$
|
(31
|
)
|
||
|
Long-term investment securities:
|
|
|
|
|
|
|
|||||
|
Trading securities
|
$
|
3,657
|
|
$
|
3,657
|
|
$
|
—
|
|
||
|
Available-for-sale securities
|
3
|
|
3
|
|
—
|
|
|||||
|
Other investments at amortized cost (a)
|
9,910
|
|
—
|
|
—
|
|
|||||
|
Total long-term investment securities
|
$
|
13,570
|
|
$
|
3,660
|
|
$
|
—
|
|
||
46
The following table presents assets measured at fair value on a recurring basis at
February 29, 2012
:
|
|
|
Fair Value Measurements at Reporting Date Using
|
|||||||||
|
|
|
Level 1
|
Level 2
|
||||||||
|
Cash and cash equivalents:
|
|
|
|
||||||||
|
Cash and money market funds
|
$
|
13,606
|
|
$
|
13,606
|
|
$
|
—
|
|
||
|
Derivatives
|
|
|
|
|
|
|
|||||
|
Designated for hedging
|
$
|
(103
|
)
|
$
|
—
|
|
$
|
(103
|
)
|
||
|
Not designated
|
1,581
|
|
—
|
|
1,581
|
|
|||||
|
Total derivatives
|
$
|
1,478
|
|
$
|
—
|
|
$
|
1,478
|
|
||
|
Long-term investment securities:
|
|
|
|
|
|
|
|||||
|
Trading securities
|
$
|
3,447
|
|
$
|
3,447
|
|
$
|
—
|
|
||
|
Available-for-sale securities
|
3
|
|
3
|
|
—
|
|
|||||
|
Other investments at amortized cost (a)
|
9,652
|
|
—
|
|
—
|
|
|||||
|
Total long-term investment securities
|
$
|
13,102
|
|
$
|
3,450
|
|
$
|
—
|
|
||
|
(a)
|
There were no events or changes in circumstances that occurred to indicate a significant adverse effect on the cost of these investments.
|
The carrying amount of the Company's accounts receivable, short-term debt, accounts payable, accrued expenses, bank obligations and long-term debt approximates fair value because of (i) the short-term nature of the financial instrument; (ii) the interest rate on the financial instrument being reset every quarter to reflect current market rates, and (iii) the stated or implicit interest rate approximates the current market rates or are not materially different than market rates.
Derivative Instruments
The Company's derivative instruments include forward foreign currency contracts utilized to hedge a portion of its foreign currency inventory purchases as well as its general economic exposure to foreign currency fluctuations created in the normal course of business. The derivatives qualifying for hedge accounting are designated as cash flow hedges and valued using observable forward rates for the same or similar instruments (Level 2). Forward foreign currency contracts not designated under hedged transactions were valued at spot rates for the same or similar instruments (Level 2). The duration of open forward foreign currency contracts range from 1 - 12 months and are classified in the balance sheet according to their terms.
It is the Company's policy to enter into derivative instrument contracts with terms that coincide with the underlying exposure being hedged. As such, the Company's derivative instruments are expected to be highly effective. Hedge ineffectiveness, if any, is recognized as incurred through other income (expense) in the Company's Consolidated Statements of Operations and Comprehensive Income and amounted to
$30
and
$8
for the years ended
February 28, 2013
and
February 29, 2012
, respectively.
Financial Statement Classification
The Company holds derivative instruments that are designated as hedging instruments as well as certain instruments not so designated. The following table discloses the fair value as of
February 28, 2013
and
February 29, 2012
for both types of derivative instruments:
47
|
Derivative Assets and Liabilities
|
||||||||||
|
Fair Value
|
||||||||||
|
Account
|
February 28, 2013
|
February 29, 2012
|
||||||||
|
Designated derivative instruments
|
||||||||||
|
Foreign currency contracts
|
Accrued expenses and other current liabilities
|
$
|
(87
|
)
|
$
|
(103
|
)
|
|||
|
Prepaid expenses and other current assets
|
77
|
|
—
|
|
||||||
|
Derivatives not designated
|
||||||||||
|
Foreign currency contracts
|
Accrued expenses and other current liabilities
|
(21
|
)
|
—
|
|
|||||
|
Prepaid expenses and other current assets
|
—
|
|
1,581
|
|
||||||
|
Total derivatives
|
$
|
(31
|
)
|
$
|
1,478
|
|
||||
In connection with the acquisition of Hirschmann, on March 14, 2012, the Company acquired
36
contracts which were unable to qualify for hedge accounting during the year ended
February 28, 2013
. There were
four
contracts of this nature outstanding at
February 28, 2013
, with a current notional amount of approximately
$700
.
Thirty-two
of these contracts settled during the year ended
February 28, 2013
for a gain of
$106
. The change in fair value of the open contracts not designated for hedging for the twelve months ended
February 28, 2013
was a gain of
$48
. As of
February 29, 2012
, the Company held
two
foreign currency contracts that were derivatives not designated in hedged transactions. These contracts were settled in March 2012. During the twelve months ended
February 29, 2012
, the Company recorded gains on the change in fair value of these derivatives of
$1,581
in other income and expense on the Company's Consolidated Statement of Operations and Comprehensive Income and a loss upon the settlement of these contracts in the first quarter of Fiscal 2013 of
$2,670
.
Cash flow hedges
During Fiscal
2013
, the Company entered into forward foreign currency contracts, which have a current outstanding notional value of
$31,200
and are designated as cash flow hedges. For cash flow hedges, the effective portion of the gain or loss is reported as a component of other comprehensive income and reclassified into earnings in the same period or periods during which the hedged transaction affects earnings.
Activity related to cash flow hedges recorded during the twelve months ended
February 28, 2013
and
February 29, 2012
was as follows:
|
February 28, 2013
|
February 29, 2012
|
||||||||||||||||||||||
|
Gain (Loss) Recognized in Other Comprehensive Income
|
Gain (Loss) Reclassified into Cost of Sales
|
Gain (Loss) for Ineffectiveness in Other Income
|
Gain (Loss) Recognized in Other Comprehensive Income
|
Gain (Loss) Reclassified into Cost of Sales
|
Gain (Loss) for Ineffectiveness in Other Income
|
||||||||||||||||||
|
Cash flow hedges
|
|||||||||||||||||||||||
|
Foreign currency contracts
|
$
|
197
|
|
$
|
(326
|
)
|
$
|
30
|
|
$
|
(123
|
)
|
$
|
52
|
|
$
|
8
|
|
|||||
The net loss recognized in other comprehensive income for foreign currency contracts is expected to be recognized in cost of sales within the next fifteen months. No amounts were excluded from the assessment
48
49
50
51
52
53
54
55
56
57
58
59
60
61
62
63
64
65
ofhedge effectiveness during the respective periods. As of
February 28, 2013
,
no
contracts originally designated for hedged accounting were de-designated or terminated.
f)
Investment Securities
In accordance with the Company's investment policy, all long and short-term investment securities are invested in "investment grade" rated securities. As of
February 28, 2013
and
February 29, 2012
, the Company had the following investments:
|
|
February 28, 2013
|
February 29, 2012
|
|||||||||||||||||||||
|
Cost
Basis
|
Unrealized
holding
gain/(loss)
|
Fair
Value
|
Cost
Basis
|
Unrealized
holding
gain/(loss)
|
Fair
Value
|
||||||||||||||||||
|
Long-Term Investments
|
|
|
|
|
|
|
|
|
|
|
|
|
|||||||||||
|
Marketable Securities
|
|
|
|
|
|
|
|
|
|
|
|
|
|||||||||||
|
Trading
|
|
|
|
|
|
|
|
|
|
|
|
|
|||||||||||
|
Deferred Compensation
|
$
|
3,657
|
|
$
|
—
|
|
$
|
3,657
|
|
$
|
3,447
|
|
$
|
—
|
|
$
|
3,447
|
|
|||||
|
Available-for-sale
|
|
|
|
|
|
|
|
|
|
|
|
|
|||||||||||
|
Cellstar
|
—
|
|
3
|
|
3
|
|
—
|
|
3
|
|
3
|
|
|||||||||||
|
Bliss-tel
|
—
|
|
—
|
|
—
|
|
—
|
|
—
|
|
—
|
|
|||||||||||
|
Held-to-maturity Investment
|
7,591
|
|
—
|
|
7,591
|
|
7,545
|
|
—
|
|
7,545
|
|
|||||||||||
|
Total Marketable Securities
|
11,248
|
|
3
|
|
11,251
|
|
10,992
|
|
3
|
|
10,995
|
|
|||||||||||
|
Other Long-Term Investment
|
2,319
|
|
—
|
|
2,319
|
|
2,107
|
|
—
|
|
2,107
|
|
|||||||||||
|
Total Long-Term Investments
|
$
|
13,567
|
|
$
|
3
|
|
$
|
13,570
|
|
$
|
13,099
|
|
$
|
3
|
|
$
|
13,102
|
|
|||||
Long-Term Investments
Trading Securities
The Company’s trading securities consist of mutual funds, which are held in connection with the Company’s deferred compensation plan (see Note 10). Unrealized holding gains and losses on trading securities offset those associated with the corresponding deferred compensation liability.
Available-For-Sale Securities
The Company’s available-for-sale marketable securities include a less than
20%
equity ownership in CLST Holdings, Inc. ("Cellstar") and Bliss-tel Public Company Limited ("Bliss-tel").
Unrealized holding gains and losses, net of the related tax effect (if applicable), on available-for-sale securities are reported as a component of accumulated other comprehensive income (loss) until realized. Realized gains and losses from the sale of available-for-sale securities are determined on a specific identification basis.
A decline in the market value of any available-for-sale security below cost that is deemed other-than-temporary results in a reduction in carrying amount to fair value. The impairment is charged to earnings and a new cost basis for the security is established. The Company considers numerous factors, on a case-by-case basis, in evaluating whether the decline in market value of an available-for-sale security below cost is other-than-temporary. Such factors include, but are not limited to, (i) the length of time and the extent to which the market value has been less than cost; (ii) the financial condition and the near-term prospects of the issuer of the investment; and (iii) whether the Company's intent to retain the investment for the period of time is sufficient to allow for any anticipated recovery in market value. During Fiscal 2011 and Fiscal 2012, the Company monitored the performance of its Bliss-tel investment and determined that its investment in the company was other than temporarily impaired based on factors, such as its market price (which has consistently remained below cost in excess of twelve months), Bliss-tel's continued losses, its deteriorating financial position, and conditions in the
66
local and global economy, as well as the political environment in Thailand. During Fiscal
2012
, Bliss-tel stopped trading on the Thai stock exchange and has remained suspended from trading through
February 28, 2013
. As a result, the Company recorded other than temporary impairment losses of
$1,225
and
$1,600
for the years ended
February 29, 2012
and
February 28, 2011
, respectively. As of
February 28, 2013
, the Company owns
72,500,000
shares in Bliss-tel.
22,500,000
warrants expired unexercised in July 2012. As all of the above factors remain present and the company remains suspended from trading, management's estimate of the value of this investment remains
$0
at
February 28, 2013
.
Held-to-Maturity Investment
Long-term investments include an investment in U.S. dollar-denominated bonds issued by the Venezuelan government, which is classified as held-to-maturity and accounted for under the amortized cost method.
Other Long-Term Investments
Other long-term investments include an investment in a non-controlled corporation of
$2,319
and
$2,107
at
February 28, 2013
and
February 29, 2012
, respectively, accounted for by the cost method. During Fiscal 2011, the Company invested an additional
$257
in this investment as part of a capital infusion by four select investors. During Fiscal 2013, the Company loaned an additional
$250
to the company.
No
investments or loans were made in or to the investment in Fiscal 2012. As of
February 28, 2013
the Company holds approximately
16%
of the outstanding shares of this company.
g)
Revenue Recognition
The Company recognizes revenue from product sales at the time of passage of title and risk of loss to the customer either at FOB shipping point or FOB destination, based upon terms established with the customer. The Company's selling price to its customers is a fixed amount that is not subject to refund or adjustment or contingent upon additional rebates. Any customer acceptance provisions, which are related to product testing, are satisfied prior to revenue recognition. There are no further obligations on the part of the Company subsequent to revenue recognition except for product returns from the Company's customers. The Company does accept product returns, if properly requested, authorized, and approved by the Company. The Company records an estimate of product returns by its customers and records the provision for the estimated amount of such future returns at point of sale, based on historical experience and any notification the Company receives of pending returns.
The Company includes all costs incurred for shipping and handling as cost of sales and all amounts billed to customers as revenue. During the years ended
February 28, 2013
,
February 29, 2012
, and
February 28, 2011
, freight costs expensed through cost of sales amounted to
$18,757
,
$18,172
and
$13,399
, respectively and freight billed to customers amounted to
$990
,
$1,181
and
$1,161
, respectively.
h)
Accounts Receivable
The majority of the Company's accounts receivable are due from companies in the retail, mass merchant and OEM industries. Credit is extended based on an evaluation of a customer's financial condition. Accounts receivable are generally due within 30-60 days and are stated at amounts due from customers, net of an allowance for doubtful accounts. Accounts outstanding longer than the contracted payment terms are considered past due.
Accounts receivable is comprised of the following:
67
|
February 28,
2013 |
February 29,
2012 |
||||||
|
Trade accounts receivable and other
|
$
|
161,667
|
|
$
|
149,787
|
|
|
|
Less:
|
|
|
|
|
|||
|
Allowance for doubtful accounts
|
7,840
|
|
5,737
|
|
|||
|
Allowance for cash discounts
|
1,231
|
|
1,465
|
|
|||
|
|
$
|
152,596
|
|
$
|
142,585
|
|
|
The Company performs ongoing credit evaluations of its customers and adjusts credit limits based upon payment history and the customers' current credit worthiness, as determined by a review of their current credit information. The Company continuously monitors collections and payments from its customers and maintains a provision for estimated credit losses based upon historical experience and any specific customer collection issues that have been identified. While such credit losses have historically been within management's expectations and the provisions established, the Company cannot guarantee it will continue to experience the same credit loss rates that have been experienced in the past. Since the Company's accounts receivable are concentrated in a relatively few number of customers, a significant change in the liquidity or financial position of any one of these customers could have a material adverse impact on the collectability of the Company's accounts receivable and future operating results.
i)
Inventory
The Company values its inventory at the lower of the actual cost to purchase (primarily on a weighted moving-average basis with a portion valued at standard cost) and/or the current estimated market value of the inventory less expected costs to sell the inventory. The Company regularly reviews inventory quantities on-hand and records a provision for excess and obsolete inventory based primarily on selling prices, indications from customers based upon current price negotiations and purchase orders. The Company's industry is characterized by rapid technological change and frequent new product introductions that could result in an increase in the amount of obsolete inventory quantities on-hand. The Company recorded inventory write-downs of
$4,300
,
$2,942
and
$3,911
for the years ended
February 28, 2013
,
February 29, 2012
and
February 28, 2011
, respectively.
Inventories by major category are as follows:
|
February 28,
2013 |
February 29,
2012 |
||||||
|
Raw materials
|
$
|
35,240
|
|
$
|
18,495
|
|
|
|
Work in process
|
5,316
|
|
1,888
|
|
|||
|
Finished goods
|
118,543
|
|
109,131
|
|
|||
|
Inventory, net
|
$
|
159,099
|
|
$
|
129,514
|
|
|
j)
Property, Plant and Equipment
Property, plant and equipment are stated at cost less accumulated depreciation. Property under a capital lease is stated at the present value of minimum lease payments. Major improvements and replacements that extend service lives of the assets are capitalized. Minor replacements, and routine maintenance and repairs are charged to expense as incurred. Upon retirement or disposal of assets, the cost and related accumulated depreciation are removed from the consolidated balance sheets.
A summary of property, plant and equipment, net, is as follows:
68
|
February 28,
2013 |
February 29,
2012 |
||||||
|
Land
|
$
|
6,421
|
|
$
|
1,623
|
|
|
|
Buildings
|
42,670
|
|
15,101
|
|
|||
|
Property under capital lease
|
6,981
|
|
6,981
|
|
|||
|
Furniture, fixtures and displays
|
4,296
|
|
4,237
|
|
|||
|
Machinery and equipment
|
26,758
|
|
11,331
|
|
|||
|
Construction-in-progress
|
4,159
|
|
734
|
|
|||
|
Computer hardware and software
|
24,325
|
|
29,227
|
|
|||
|
Automobiles
|
914
|
|
915
|
|
|||
|
Leasehold improvements
|
9,415
|
|
9,453
|
|
|||
|
|
125,939
|
|
79,602
|
|
|||
|
Less accumulated depreciation and amortization
|
49,731
|
|
47,823
|
|
|||
|
|
$
|
76,208
|
|
$
|
31,779
|
|
|
Depreciation is calculated on the straight-line method over the estimated useful lives of the assets as follows:
|
Buildings
|
|
20-30 years
|
|
Furniture, fixtures and displays
|
|
5-10 years
|
|
Machinery and equipment
|
|
5-10 years
|
|
Computer hardware and software
|
|
3-5 years
|
|
Automobiles
|
|
3 years
|
Leasehold improvements are depreciated over the shorter of the lease term or estimated useful life of the asset. Assets acquired under capital leases are amortized over the term of the respective lease. Capitalized computer software costs obtained for internal use are depreciated on a straight-line basis.
Depreciation and amortization of property, plant and equipment amounted to
$10,440
,
$6,111
and
$5,576
for the years ended
February 28, 2013
,
February 29, 2012
and
February 28, 2011
, respectively. Included in depreciation and amortization expense is amortization of computer software costs of
$794
,
$553
and
$562
for the years ended
February 28, 2013
,
February 29, 2012
and
February 28, 2011
, respectively. Also included in depreciation and amortization expense is
$251
of amortization related to property under a capital lease for each of the years ended
February 28, 2013
,
February 29, 2012
and
February 28, 2011
.
k)
Goodwill and Intangible Assets
Goodwill and other intangible assets consist of the excess over the fair value of assets acquired (goodwill) and other intangible assets (patents, contracts, trademarks/tradenames and customer relationships). Values assigned to the respective assets are determined in accordance with ASC 805 "Business Combinations" ("ASC 805") and ASC 350 "Intangibles – Goodwill and Other" ("ASC 350").
Goodwill is calculated as the excess of the cost of purchased businesses over the value of their underlying net assets. Generally, the primary valuation method used to determine the Fair Value ("FV") of acquired businesses is the Discounted Future Cash Flow Method ("DCF"). A five-year period is analyzed using a risk adjusted discount rate, which ranged from 10.4% to 15.6%.
The value of potential intangible assets separate from goodwill are evaluated and assigned to the respective categories. The largest categories from recently acquired businesses are Trademarks and Customer Relationships. The FV’s of trademarks acquired are determined using the Relief from Royalty Method based on projected sales of the trademarked products. The FV’s of customer relationships are determined using the Multi-Period Excess Earnings Method which includes a DCF analysis, adjusted for a required return on tangible and intangible assets. The guidance in ASC 350, including management’s business intent for its use; ongoing market
69
demand for products relevant to the category and their ability to generate future cash flows; legal, regulatory or contractual provisions on its use or subsequent renewal, as applicable; and the cost to maintain or renew the rights to the assets, are considered in determining the useful life of all intangible assets. If the Company determines that there are no legal, regulatory, contractual, competitive, economic or other factors which limit the useful life of the asset, an indefinite life will be assigned and evaluated for impairment as indicated below. Goodwill and other intangible assets that have an indefinite useful life are not amortized. Intangible assets that have a definite useful life are amortized over their estimated useful life.
Goodwill and intangible assets with indefinite useful lives are required to be tested for impairment at least annually or more frequently if an event occurs or circumstances change that could more likely than not reduce the fair value of a reporting unit below its carrying amount. Intangible assets with estimable useful lives are required to be amortized over their respective estimated useful lives and reviewed for impairment
.
Our impairment reviews require the use of certain estimates. If a significant change in these estimates occurs, the Company could experience an impairment charge associated with these assets in future periods.
Goodwill is tested using a two-step process. The first step is to identify a potential impairment, and the second step measures the amount of the impairment loss, if any. Goodwill is considered impaired if the carrying amount of the reporting unit's goodwill exceeds its estimated fair value. Voxx's reporting units that carry goodwill are Hirschmann, Invision and Klipsch. Effective December 1, 2012, the Company realigned its subsidiaries into three operating segments based upon the Company's products and internal organizational structure (see Note 13). These operating segments are the Automotive, Premium Audio and Consumer Accessories segments. The Hirschmann and Invision reporting units are located within the Automotive segment with goodwill balances of
$60,611
and
$7,374
, respectively, at
February 28, 2013
and the Klipsch reporting unit is located within the Premium Audio segment with a goodwill balance of
$78,695
at
February 28, 2013
, for the purposes of evaluating goodwill for impairment. The Company estimates the fair value of the reporting units based on discounted future cash flows, as well as consideration of each reporting unit's equity value to the market capitalization of the Company's stock. We primarily relied on the discounted future cash flows as the full effect of the ongoing earning potential of the Company's newest Klipsch and Hirschmann acquisitions may not be fully reflected in the Company's stock value as of the measurement date; however, the discounted future cash flows would fairly estimate these effects. The Company considered its segment realignment on December 1, 2012 a triggering event and evaluated the goodwill at the three reporting units for impairment as of this date and rolled forward this impairment test to February 28, 2013, the date at which the Company performs its annual impairment test. Based upon this impairment test and roll forward completed in the fourth quarter of Fiscal 2013, the fair values of the reporting units are in excess of the related carrying values.
For intangible assets with indefinite lives, primarily trademarks, the Company compared the fair value of each intangible asset with its carrying amount and determined that there were no impairments at
February 28, 2013
. We determined that the realignment of our segments on December 1, 2012 did not result in a triggering event to test these assets at an interim date. To compute the fair value at
February 28, 2013
, various considerations were evaluated including current sales associated with these brands, management’s expectations for future sales and performance of the business. At the present time, management intends to continue the development, marketing and selling of products associated with its intangible assets and there are no known restrictions on the continuation of their use. We utilized a Relief-from-Royalty Method, applying royalty rates of
0.5%
to
8.5%
for the relative trademarks and domain names after reviewing comparable market rates, the profitability of the products associated with relative intangible assets, and other qualitative factors. We determined that risk-adjusted discount rates ranging from
12.7%
to
16.3%
were appropriate as a result of weighted average cost of capital analyses. No impairment losses were recorded related to indefinite lived intangible assets during the twelve months ended
February 29, 2012
and
February 29, 2012
.
The cost of other intangible assets with definite lives are amortized on a straight-line basis over their respective lives. Management has determined that the current lives of these assets are appropriate. Management has determined that there were no impairment triggering events that would cause the carrying values related to intangible assets with definite lives to exceed their expected future cash flows and as such, were not impaired at
February 28, 2013
. Intangible assets with definite lives were not impaired at
February 29, 2012
or
February 29, 2012
.
70
During the fourth quarter of Fiscal 2013, the Company identified an error in the consolidated financial statements for the year ended February 29, 2012, related to the purchase price of the Company's Klipsch acquisition that took place on March 1, 2011. Accounts payable acquired in the acquisition was incorrectly overstated and income taxes payable acquired was understated, which also resulted in an overstatement of goodwill from the purchase price. We evaluated the materiality of the error from a qualitative and quantitative perspective. Based on such evaluation, we concluded that the correction was not material to any individual prior period or for the year ended February 28, 2013, taking into account the requirements of the Securities and Exchange Commission Staff Accounting Bulletin No. 108, "Considering The Effects of Prior Year Misstatements in the Current Year Financial Statements," or SAB 108. As discussed in SAB108, though the error correction does require restating consolidated financial statements for prior periods, the error correction does not require the amendment of prior period filings. As a result, the accounting correction has reduced accounts payable by
$1,729
and goodwill by
$1,297
and has increased income taxes payable by
$432
on the consolidated balance sheets at February 28, 2013 and February 29, 2012.
Goodwill
The change in the carrying amount of goodwill is as follows:
|
February 28,
2013 |
February 29,
2012 |
||||||
|
(restated)
|
|||||||
|
Net beginning balance
|
$
|
86,069
|
|
$
|
7,373
|
|
|
|
Goodwill related to Klipsch acquisition
|
—
|
|
78,696
|
|
|||
|
Goodwill related to Hirschmann acquisition
|
60,611
|
|
—
|
|
|||
|
Net ending balance
|
$
|
146,680
|
|
$
|
86,069
|
|
|
Intangible Assets
|
|
February 28, 2013
|
||||||||||
|
Gross
Carrying
Value
|
Accumulated
Amortization
|
Total Net
Book
Value
|
|||||||||
|
Finite-lived intangible assets:
|
|||||||||||
|
Customer relationships (5-20 years)
|
$
|
69,293
|
|
$
|
12,029
|
|
$
|
57,264
|
|
||
|
Trademarks/Tradenames (3-12 years)
|
1,237
|
|
810
|
|
427
|
|
|||||
|
Patents (5-13 years)
|
9,998
|
|
1,894
|
|
8,104
|
|
|||||
|
License (5 years)
|
1,400
|
|
1,400
|
|
—
|
|
|||||
|
Contract subject to amortization (5 years)
|
1,556
|
|
1,383
|
|
173
|
|
|||||
|
Total finite-lived intangible assets
|
$
|
83,484
|
|
$
|
17,516
|
|
65,968
|
|
|||
|
Indefinite-lived intangible assets
|
|||||||||||
|
Trademarks
|
139,430
|
|
|||||||||
|
Total net intangible assets
|
|
|
|
|
$
|
205,398
|
|
||||
71
|
February 29, 2012
|
|||||||||||
|
Gross
Carrying
Value
|
Accumulated
Amortization
|
Total Net
Book
Value
|
|||||||||
|
Finite-lived intangible assets:
|
|||||||||||
|
Customer relationships (5-20 years)
|
50,113
|
|
7,432
|
|
42,681
|
|
|||||
|
Trademarks/Tradenames (3-12 years)
|
1,237
|
|
722
|
|
515
|
|
|||||
|
Patents (5-10 years)
|
2,942
|
|
1,005
|
|
1,937
|
|
|||||
|
License (5 years)
|
1,400
|
|
1,213
|
|
187
|
|
|||||
|
Contract subject to amortization (5 years)
|
1,556
|
|
1,292
|
|
264
|
|
|||||
|
Total finite-lived intangible assets
|
$
|
57,248
|
|
$
|
11,664
|
|
45,584
|
|
|||
|
Indefinite-lived intangible assets
|
|||||||||||
|
Trademarks
|
129,765
|
|
|||||||||
|
Total net intangible assets
|
|
|
|
|
$
|
175,349
|
|
||||
During the year ended
February 28, 2013
, the Company recorded
$7,055
of patents subject to amortization,
$19,392
of amortizing customer relationships and
$10,400
of indefinite lived trade names, plus increases of
$14,414
in both definite and indefinite life intangibles in connection with the final purchase price allocation for its Hirschmann acquisition. The weighted-average remaining amortization period for amortizing intangibles as of
February 28, 2013
is approximately 13 years. The Company expenses the renewal costs of patents as incurred. The weighted-average period before the next renewal is approximately 10 years.
Amortization expense for intangible assets amounted to
$5,790
,
$3,992
and
$2,255
for the years ended
February 28, 2013
,
February 29, 2012
and
February 28, 2011
, respectively. The estimated aggregate amortization expense for all amortizable intangibles for each of the succeeding years ending February 28,
2018
is as follows:
|
Fiscal Year
|
Amount
|
|||
|
2014
|
$
|
5,810
|
|
|
|
2015
|
5,803
|
|
||
|
2016
|
5,697
|
|
||
|
2017
|
5,683
|
|
||
|
2018
|
5,599
|
|
||
l)
Sales Incentives
The Company offers sales incentives to its customers in the form of (1) co-operative advertising allowances; (2) market development funds; (3) volume incentive rebates and (4) other trade allowances. The Company accounts for sales incentives in accordance with ASC 605-50 "Customer Payments and Incentives" ("ASC 605-50"). Except for other trade allowances, all sales incentives require the customer to purchase the Company's products during a specified period of time. All sales incentives require customers to claim the sales incentive within a certain time period (referred to as the "claim period") and claims are settled either by the customer claiming a deduction against an outstanding account receivable or by the customer requesting a cash payout. All costs associated with sales incentives are classified as a reduction of net sales. The following is a summary of the various sales incentive programs:
Co-operative advertising allowances are offered to customers as reimbursement towards their costs for print or media advertising in which the Company’s product is featured on its own or in conjunction with other companies' products. The amount offered is either a fixed amount or is based upon a fixed percentage of sales revenue or a fixed amount per unit sold to the customer during a specified time period.
72
Market development funds are offered to customers in connection with new product launches or entrance into new markets. The amount offered for new product launches is based upon a fixed amount, or percentage of sales revenue to the customer or a fixed amount per unit sold to the customer during a specified time period.
Volume incentive rebates offered to customers require minimum quantities of product to be purchased during a specified period of time. The amount offered is either based upon a fixed percentage of sales revenue to the customer or a fixed amount per unit sold to the customer. The Company makes an estimate of the ultimate amount of the rebate their customers will earn based upon past history with the customers and other facts and circumstances. The Company has the ability to estimate these volume incentive rebates, as the period of time for a particular rebate to be claimed is relatively short. Any changes in the estimated amount of volume incentive rebates are recognized immediately using a cumulative catch-up adjustment. The Company accrues the cost of co-operative advertising allowances, volume incentive rebates and market development funds at the latter of when the customer purchases our products or when the sales incentive is offered to the customer.
Other trade allowances are additional sales incentives that the Company provides to customers subsequent to the related revenue being recognized. The Company records the provision for these additional sales incentives at the later of when the sales incentive is offered or when the related revenue is recognized. Such additional sales incentives are based upon a fixed percentage of the selling price to the customer, a fixed amount per unit, or a lump-sum amount.
The accrual balance for sales incentives at
February 28, 2013
and
February 29, 2012
was
$16,821
and
$18,154
, respectively. Although the Company makes its best estimate of its sales incentive liability, many factors, including significant unanticipated changes in the purchasing volume of its customers and the lack of claims made by customers could have a significant impact on the sales incentives liability and reported operating results.
For the years ended
February 28, 2013
,
February 29, 2012
and
February 28, 2011
, reversals of previously established sales incentive liabilities amounted to
$3,350
,
$3,662
and
$1,725
, respectively. These reversals include unearned and unclaimed sales incentives. Reversals of unearned sales incentives are volume incentive rebates where the customer did not purchase the required minimum quantities of product during the specified time. Volume incentive rebates are reversed into income in the period when the customer did not reach the required minimum purchases of product during the specified time. Unearned sales incentives for the years ended
February 28, 2013
,
February 29, 2012
and
February 28, 2011
amounted to
$2,933
,
$2,200
and
$977
, respectively. Unclaimed sales incentives are sales incentives earned by the customer but the customer has not claimed payment from the Company within the claim period (period after program has ended). Unclaimed sales incentives for the years ended
February 28, 2013
,
February 29, 2012
and
February 28, 2011
amounted to
$417
,
$1,462
and
$748
, respectively.
The Company reverses earned but unclaimed sales incentives based upon the expiration of the claim period of each program. Unclaimed sales incentives that have no specified claim period are reversed in the quarter following one year from the end of the program. The Company believes the reversal of earned but unclaimed sales incentives upon the expiration of the claim period is a systematic, rational, consistent and conservative method of reversing unclaimed sales incentives.
A summary of the activity with respect to accrued sales incentives is provided below:
73
|
Year
Ended
|
Year
Ended
|
Year
Ended
|
|||||||||
|
February 28,
2013 |
February 29,
2012 |
February 28,
2011 |
|||||||||
|
Opening balance
|
$
|
18,154
|
|
$
|
11,981
|
|
$
|
10,606
|
|
||
|
Liabilities acquired during acquisition
|
—
|
|
7,149
|
|
—
|
|
|||||
|
Accruals
|
35,636
|
|
43,671
|
|
28,004
|
|
|||||
|
Payments and credits
|
(33,619
|
)
|
(40,985
|
)
|
(24,904
|
)
|
|||||
|
Reversals for unearned sales incentives
|
(2,933
|
)
|
(2,200
|
)
|
(977
|
)
|
|||||
|
Reversals for unclaimed sales incentives
|
(417
|
)
|
(1,462
|
)
|
(748
|
)
|
|||||
|
Ending balance
|
$
|
16,821
|
|
$
|
18,154
|
|
$
|
11,981
|
|
||
The majority of the reversals of previously established sales incentive liabilities pertain to sales recorded in prior periods.
m)
Advertising
Excluding co-operative advertising, the Company expensed the cost of advertising, as incurred, of
$9,499
,
$7,786
and
$6,076
for the years ended
February 28, 2013
,
February 29, 2012
and
February 28, 2011
, respectively.
n)
Research and Development
Expenditures for research and development are charged to expense as incurred. Such expenditures amount to
$15,890
,
$441
and
$0
for the years ended
February 28, 2013
,
February 29, 2012
and
February 28, 2011
, respectively, and are included within engineering and technical support expenses on the Consolidated Statements of Operations and Comprehensive Income.
o)
Product Warranties and Product Repair Costs
The Company generally warranties its products against certain manufacturing and other defects. The Company provides warranties for all of its products ranging from 90 days to the lifetime of the product. Warranty expenses are accrued at the time of sale based on the Company's estimated cost to repair expected product returns for warranty matters. This liability is based primarily on historical experiences of actual warranty claims as well as current information on repair costs. The warranty liability of
$12,788
and
$6,425
is recorded in accrued expenses in the accompanying consolidated balance sheets as of
February 28, 2013
and
February 29, 2012
, respectively. In addition, the Company records a reserve for product repair costs which is based upon the quantities of defective inventory on hand and an estimate of the cost to repair such defective inventory. The reserve for product repair costs of
$1,763
and
$2,370
is recorded as a reduction to inventory in the accompanying consolidated balance sheets as of
February 28, 2013
and
February 29, 2012
, respectively. Warranty claims and product repair costs expense for the years ended
February 28, 2013
,
February 29, 2012
and
February 28, 2011
were
$13,798
,
$11,839
and
$11,560
, respectively.
In March 2013, Subaru of America recalled certain vehicles as a result of potentially faulty remote start devices for which Voxx was the distributor. During the fourth quarter of the fiscal year ended
February 28, 2013
, the Company recorded a reserve of
$3 million
in accrued product warranties in order to cover the cost of replacing these devices and a corresponding receivable of
$2.1 million
from one of the Company's suppliers, who has agreed to replace a specified number of these devices.
Changes in the Company's accrued product warranties and product repair costs are as follows:
74
|
Year
Ended
|
Year
Ended
|
Year
Ended
|
|||||||||
|
February 28,
2013 |
February 29,
2012 |
February 28,
2011 |
|||||||||
|
Beginning balance
|
$
|
8,795
|
|
$
|
9,051
|
|
$
|
13,058
|
|
||
|
Liabilities acquired during acquisitions
|
1,799
|
|
1,480
|
|
115
|
|
|||||
|
Liabilities accrued for warranties issued during the year and repair cost
|
13,798
|
|
11,839
|
|
11,560
|
|
|||||
|
Warranty claims paid during the year
|
(9,841
|
)
|
(13,575
|
)
|
(15,682
|
)
|
|||||
|
Ending balance
|
$
|
14,551
|
|
$
|
8,795
|
|
$
|
9,051
|
|
||
p)
Foreign Currency
Assets and liabilities of those subsidiaries and former equity investees located outside the United States whose cash flows are primarily in local currencies have been translated at rates of exchange at the end of the period or historical exchange rates, as appropriate in accordance with ASC 830, "Foreign Currency Matters" ("ASC 830"). Revenues and expenses have been translated at the weighted-average rates of exchange in effect during the period. Gains and losses resulting from translation are recorded in the cumulative foreign currency translation account in accumulated other comprehensive income (loss). For the years ended
February 28, 2013
,
February 29, 2012
and
February 28, 2011
, the Company recorded foreign currency transaction (losses)/gains in the amount of
$445
,
$1,748
and
$2,241
, respectively.
The Company has certain operations in Venezuela. Venezuela has been operating in a difficult economic environment, which has been troubled with local political issues and various foreign currency and price controls. The country has experienced high rates of inflation over the last several years. The President of Venezuela has the authority to legislate certain areas by decree, which allows the government to nationalize certain industries or expropriate certain companies and property. These factors may have a negative impact on our business and our financial condition. In 2003, Venezuela created the Commission of Administration of Foreign Currency ("CADIVI") which establishes and administers currency controls and their associated rules and regulations. These controls include creating a fixed exchange rate between the Bolivar and the U.S. Dollar, and the ability to restrict the exchange of Bolivar Fuertes for U.S. Dollars and vice versa.
Effective January 1, 2010, according to the guidelines in ASC 830, Venezuela was designated as a hyper-inflationary economy. A hyper-inflationary economy designation occurs when a country has experienced cumulative inflation of approximately 100 percent or more over a 3 year period. The hyper-inflationary designation requires the local subsidiary in Venezuela to record all transactions as if they were denominated in U.S. dollars. The Company transitioned to hyper-inflationary accounting on March 1, 2010 and continues to account for its Venezuela operations under this method.
On June 9, 2010, the Venezuelan government introduced a newly regulated foreign currency exchange system, Sistema de Transacciones con Titulos en Moneda Extranjera ("SITME"), which is controlled by the Central Bank of Venezuela ("BCV"). The SITME imposes volume restrictions on the conversion of Venezuelan Bolivar Fuertes to U.S. Dollars, currently limiting such activity to a maximum equivalent of $350 per month. As a result of this restriction, we have limited new U.S. dollar purchases to remain within the guidelines imposed by SITME.
The Company has certain U.S. dollar denominated assets and liabilities in its Venezuelan operations. Our TICC bond investment (See Note 1(f)) and our U.S. dollar denominated intercompany debt have been subject to currency fluctuations associated with the devaluation of the Bolivar Fuerte and the temporary institution in 2010 of a two-tier exchange rate by the Venezuelan government. The TICC bond is valued at the current Venezuela exchange rate of
6.30
and classified as a held-to-maturity investment at amortized cost at
February 28, 2013
.
In February 2013, the Venezuelan government announced the devaluation of the Bolivar Fuerte, moving the official exchange rate from
4.30
to
6.30
per U.S. dollar. The devaluation resulted in a one time net currency gain of approximately
$2,400
recognized by the Company in the fourth quarter of Fiscal 2013, which is included in
75
cost of sales and other income (expenses) on the Consolidated Statement of Operations and Comprehensive Income.
q)
Income Taxes
Income taxes are accounted for under the asset and liability method. Deferred tax assets and liabilities are recognized for the future tax consequences attributable to differences between the financial statement carrying amounts of existing assets and liabilities and their respective tax basis and operating loss and tax credit carryforwards. Deferred tax assets and liabilities are measured using enacted tax rates expected to apply to taxable income in the years in which those temporary differences are expected to be recovered or settled (see Note 7). The effect on deferred tax assets and liabilities of a change in tax rates is recognized in income in the period that includes the enactment date.
Uncertain Tax Positions
The Company adopted guidance included in ASC 740 "Income Taxes" ("ASC 740") as it relates to uncertain tax positions. The guidance addresses the determination of whether tax benefits claimed or expected to be claimed on a tax return should be recorded in the financial statements. Under ASC 740, the Company may recognize the tax benefit from an uncertain tax position only if it is more likely than not that the tax position will be sustained on examination by the taxing authorities based on the technical merits of the position. The tax benefits recognized in the financial statements from such position should be measured based on the largest benefit that has a greater than fifty percent likelihood of being realized upon ultimate settlement. ASC 740 also provides guidance on derecognition, classification, interest and penalties, accounting in interim periods and disclosure requirements.
Tax interest and penalties
The Company classifies interest and penalties associated with income taxes as a component of income tax expense (benefit) on the consolidated statement of operations.
r)
Net Income Per Common Share
Basic net income per common share is based upon the weighted-average number of common shares outstanding during the period. Diluted net income per common share reflects the potential dilution that would occur if securities or other contracts to issue common stock were exercised or converted into common stock.
There are
no
reconciling items which impact the numerator of basic and diluted net income per common share. A reconciliation between the denominator of basic and diluted net income per common share is as follows:
|
Year
Ended
|
Year
Ended
|
Year
Ended
|
||||||
|
February 28, 2013
|
February 29, 2012
|
February 28, 2011
|
||||||
|
Weighted-average number of common shares outstanding (basic)
|
23,415,570
|
|
23,080,081
|
|
22,938,754
|
|
||
|
Effect of dilutive securities:
|
|
|
|
|
|
|
||
|
Stock options, warrants and restricted stock
|
201,531
|
|
185,125
|
|
173,764
|
|
||
|
Weighted-average number of common and potential common shares outstanding (diluted)
|
23,617,101
|
|
23,265,206
|
|
23,112,518
|
|
||
Stock options and stock warrants totaling
90,735
,
361,464
and
165,802
for the years ended
February 28, 2013
,
February 29, 2012
and
February 28, 2011
, respectively, were not included in the net income per common share calculation because the exercise price of these options and warrants was greater than the average market price of the Company's common stock during the period.
s)
Other Income (Expense)
76
Other income (expense) is comprised of the following:
|
Year
Ended
|
Year
Ended
|
Year
Ended
|
|||||||||
|
February 28, 2013
|
February 29, 2012
|
February 28, 2011
|
|||||||||
|
Other-than-temporary impairment of investment in Bliss-tel marketable securities
|
$
|
—
|
|
$
|
(1,225
|
)
|
$
|
(1,600
|
)
|
||
|
(Loss) gain on foreign currency contracts related to Hirschmann acquisition
|
(2,670
|
)
|
1,581
|
|
—
|
|
|||||
|
Net settlement charges related to patent lawsuit
|
(2,676
|
)
|
(3,621
|
)
|
—
|
|
|||||
|
Foreign currency gain
|
445
|
|
1,748
|
|
2,241
|
|
|||||
|
Interest Income
|
685
|
|
744
|
|
1,453
|
|
|||||
|
Rental income
|
1,120
|
|
531
|
|
530
|
|
|||||
|
Miscellaneous
|
463
|
|
(3,145
|
)
|
580
|
|
|||||
|
Total other, net
|
$
|
(2,633
|
)
|
$
|
(3,387
|
)
|
$
|
3,204
|
|
||
Miscellaneous for the year ended
February 28, 2013
includes income related to legal settlements received by Klipsch of approximately
$1,000
. Miscellaneous for the year ended
February 29, 2012
includes charges related to a contingent consideration adjustment of approximately
$2,000
. Net foreign currency gain for the year ended
February 28, 2013
includes a
$447
loss related to the February 2013 devaluation of the Bolivar Fuerte by the Venezuelan government. Net foreign currency gain for the year ended
February 28, 2011
includes a translation gain of approximately
$1,400
related to the elimination of the
2.6
exchange rate in Venezuela.
t)
Accounting for the Impairment of Long-Lived Assets and for Long-Lived Assets to be Disposed of
Long-lived assets and certain identifiable intangibles are reviewed for impairment in accordance with ASC 360 whenever events or changes in circumstances indicate that the carrying amount of an asset may not be recoverable. Recoverability of assets to be held and used is measured by a comparison of the carrying amount of an asset to future undiscounted net cash flows expected to be generated by the asset. Recoverability of assets held for sale is measured by comparing the carrying amount of the assets to their estimated fair market value. If such assets are considered to be impaired, the impairment to be recognized is measured by the amount by which the carrying amount of the assets exceed the fair value of the assets.
u)
Accounting for Stock-Based Compensation
The Company has a stock-based compensation plan under which employees and non-employee directors may be granted incentive stock options ("ISO's") and non-qualified stock options ("NQSO's") to purchase shares of Class A common stock. Under the plan, the exercise price of the ISO's will not be less than the market value of the Company's Class A common stock or greater than 110% of the market value of the Company's Class A common stock on the date of grant. The exercise price of the NQSO's may not be less than 50% of the market value of the Company's Class A common stock on the date of grant. The plan permits for options to be exercised at various intervals as determined by the Board of Directors. However, the maximum expiration period is ten years from date of grant. The vesting requirements are determined by the Board of Directors at the time of grant. Exercised options are issued from authorized Class A common stock. As of
February 28, 2013
, approximately
1,784,000
shares were available for future grants under the terms of these plans.
Options are measured at the fair value of the award at the date of grant and are recognized as an expense over the requisite service period. Compensation expense related to stock-based awards with vesting terms are amortized using the straight-line attribution method.
77
The Company granted
256,250
options during December of 2012, which vest on July 1, 2013, expire two years from date of vesting (June 30, 2015), have an exercise price equal to
$6.79
,
$0.25
above the sales price of the Company's stock on the day prior to the date of grant, have a contractual term of
2.5
years and a grant date fair value of
$1.99
per share, determined on a Black-Scholes valuation model (refer to the tables below for assumptions used to determine fair value).
In addition, the Company issued
17,500
warrants during December of 2012 to purchase the Company's common stock with the same terms as those of the options above as consideration for future legal and professional services. These warrants are included in the outstanding options and warrants table below and will be exercisable on July 1, 2013.
The Company granted
246,250
options during May of 2011, which vested on February 29, 2012, expire two years from date of vesting (February 28, 2014), have an exercise price equal to
$7.75
,
$0.25
above the sales price of the Company's stock on the day prior to the date of grant, have a contractual term of
2.75
years and a grant date fair value of
$3.08
per share determined based on a Black-Scholes valuation model. (Refer to the table below for assumptions used to determine fair value.)
In addition, the Company issued
22,500
warrants during May of 2011 to purchase the Company's common stock with the same terms as those of the options above as consideration for future legal and professional services. These warrants are included in the outstanding options and warrant table below and considered exercisable at February 29, 2012.
The Company granted
861,250
options in September of 2009, one-half vested on November 30, 2009 and one-half vested on November 30, 2010, expire three years from date of vesting (November 30, 2012 and November 30, 2013, respectively), have an exercise price equal to
$6.37
(the sales price of the Company’s stock on the day prior to the date of grant) have a contractual term between
3.2
and
4.2
years, and a grant date fair value of
$2.69
per share determined based upon a Black-Scholes valuation model (refer to the table below for assumptions used to determine fair value).
20,000
of these options expired unexercised on November 30, 2012.
In addition, the Company issued
17,500
warrants in September of 2009 to purchase the Company’s common stock with the same terms as those above as consideration for future legal services. These warrants are included in the outstanding options and warrants table below and considered exercisable at February 29, 2012.
6,250
of these warrants expired unexercised on November 30, 2012.
The per share weighted-average fair value of stock options granted during the years ended
February 28, 2013
and
February 29, 2012
was
$1.99
and
$3.08
, respectively on the date of grant. There were
no
stock options granted during the year ended
February 28, 2011
.
The fair value of stock options and warrants on the date of grant, and the assumptions used to estimate the fair value of the stock options and warrants using the Black-Scholes option valuation model granted during the year was as follows:
|
Year
Ended
|
Year
Ended
|
||||
|
February 28,
2013 |
February 29,
2012 |
||||
|
Dividend yield
|
0
|
%
|
0
|
%
|
|
|
Volatility
|
51.3
|
%
|
65.4
|
%
|
|
|
Risk-free interest rate
|
0.32
|
%
|
0.94
|
%
|
|
|
Expected life (years)
|
2.5
|
|
2.8
|
|
|
The expected dividend yield is based on historical and projected dividend yields. The Company estimates expected volatility based primarily on historical price changes of the Company’s stock equal to the expected life of the option. The Company uses monthly stock prices as the Company’s stock experiences low-volume trading. We believe that daily fluctuations are distortive to the volatility and as such will continue to use monthly inputs
78
in the future. The risk free interest rate is based on the U.S. Treasury yield in effect at the time of the grant. The expected option term is the number of years the Company estimates the options will be outstanding prior to exercise based on employment termination behavior.
The Company recognized stock-based compensation expense (before deferred income tax benefits) for awards granted under the Company’s stock option plans in the following line items in the consolidated statement of operations and comprehensive income:
|
Year
Ended
|
Year
Ended
|
Year
Ended
|
|||||||||
|
February 28, 2013
|
February 29, 2012
|
February 28, 2011
|
|||||||||
|
Cost of sales
|
$
|
5
|
|
$
|
23
|
|
$
|
18
|
|
||
|
Selling expense
|
25
|
|
116
|
|
89
|
|
|||||
|
General and administrative expenses
|
149
|
|
681
|
|
1,172
|
|
|||||
|
Engineering and technical support
|
3
|
|
8
|
|
5
|
|
|||||
|
Stock-based compensation expense before income tax benefits
|
$
|
182
|
|
$
|
828
|
|
$
|
1,284
|
|
||
Net income was impacted by
$113
(after tax),
$505
(after tax) and
$783
(after tax) in stock based compensation expense or
$0.00
,
$0.02
and
$0.03
per diluted share for the years ended
February 28, 2013
,
February 29, 2012
and
February 28, 2011
, respectively. The Company recorded an income tax benefit in Fiscal 2011, as the Company believes it is more likely than not that the tax benefit will be realized in future periods.
Information regarding the Company's stock options and warrants are summarized below:
|
Number
of Shares
|
Weighted-
Average
Exercise
Price
|
|||||
|
Outstanding and exercisable at February 28, 2010
|
1,315,584
|
|
$
|
6.91
|
|
|
|
Granted
|
—
|
|
—
|
|
||
|
Exercised
|
(189,125
|
)
|
4.93
|
|
||
|
Forfeited/expired
|
(240,209
|
)
|
10.38
|
|
||
|
Outstanding and exercisable at February 28, 2011
|
886,250
|
|
6.40
|
|
||
|
Granted
|
268,750
|
|
7.75
|
|
||
|
Exercised
|
(61,875
|
)
|
6.37
|
|
||
|
Forfeited/expired
|
(22,500
|
)
|
7.36
|
|
||
|
Outstanding and exercisable at February 29, 2012
|
1,070,625
|
|
6.72
|
|
||
|
Granted
|
273,750
|
|
6.79
|
|
||
|
Exercised
|
(404,852
|
)
|
6.49
|
|
||
|
Forfeited/expired
|
(26,250
|
)
|
6.37
|
|
||
|
Outstanding and exercisable at February 28, 2013
|
913,273
|
|
$
|
6.85
|
|
|
At
February 28, 2013
, the Company had unrecognized compensation costs of
$363
related to non-vested options. These unrecognized compensation costs will be fully recognized by July 3, 2013. At
February 29, 2012
, the Company had
no
unrecognized compensation costs as all stock options were fully vested.
Summarized information about stock options outstanding as of
February 28, 2013
is as follows:
79
|
|
Outstanding and Exercisable
|
||||||||||
|
Exercise
Price
Range
|
Number
of Shares
|
Weighted-
Average
Exercise
Price
of Shares
|
Weighted-
Average
Life
Remaining
in Years
|
||||||||
|
6.37
|
406,123
|
|
$
|
6.37
|
|
0.38
|
|||||
|
7.75
|
233,400
|
|
$
|
7.75
|
|
1.00
|
|||||
|
6.79
|
273,750
|
|
$
|
6.79
|
|
2.33
|
|||||
|
6.37
|
-
|
7.75
|
913,273
|
|
$
|
6.85
|
|
1.12
|
|||
The aggregate pre-tax intrinsic value (the difference between the Company’s average closing stock price for the last quarter of Fiscal
2013
and the exercise price, multiplied by the number of in-the-money options) that would have been received by the option holders had all option holders exercised their options on
February 28, 2013
was
$1,162
. This amount changes based on the fair market value of the Company’s stock. The total intrinsic values of options exercised for the years ended
February 28, 2013
,
February 29, 2012
and
February 28, 2011
were
$1,845
,
$387
and
$444
, respectively
In May of 2011, the Company granted
100,000
shares of restricted stock. A restricted stock award is an award of common stock that is subject to certain restrictions during a specified period. Restricted stock awards are independent of option grants and are subject to forfeiture if employment terminates prior to the release of the restrictions. Shares under the above grant will not be issued to the grantee before they vest. The grantee cannot transfer the rights to receive shares before the restricted shares vest. The restricted stock awards vest one-third on February 29, 2012, one-third on February 28, 2013 and one-third on February 28, 2014. The Company expenses the cost of the restricted stock awards on a straight-line basis over the period during which the restrictions lapse. The fair market value of the restricted stock of
$7.60
was determined based on the closing price of the Company's common stock on the grant date.
The following table presents a summary of the Company's restricted stock activity for the year ended
February 28, 2013
:
|
Number of shares (in thousands)
|
Weighted Average Grant Date Fair Value
|
|||||
|
Balance at February 28, 2011
|
—
|
|
$
|
—
|
|
|
|
Granted
|
100,000
|
|
7.60
|
|
||
|
Vested
|
(33,333
|
)
|
7.60
|
|
||
|
Forfeited
|
—
|
|
—
|
|
||
|
Balance at February 29, 2012
|
66,667
|
|
$
|
7.60
|
|
|
|
Granted
|
—
|
|
$
|
—
|
|
|
|
Vested
|
(33,333
|
)
|
$
|
7.60
|
|
|
|
Forfeited
|
—
|
|
$
|
—
|
|
|
|
Balance at February 28, 2013
|
33,334
|
|
$
|
7.60
|
|
|
During both of the years ended
February 28, 2013
and
February 29, 2012
, the Company recorded
$253
in stock-based compensation related to restricted stock awards. As of
February 28, 2013
, there was
$253
of unrecognized stock-based compensation expense related to unvested restricted stock awards. This expense is expected to be fully recognized by February 28, 2014.
v)
Accumulated Other Comprehensive Loss
80
|
February 28,
2013 |
February 29,
2012 |
|||||||
|
|
||||||||
|
Accumulated other comprehensive losses:
|
||||||||
|
Foreign exchange losses
|
$
|
(5,340
|
)
|
$
|
(4,059
|
)
|
||
|
Unrealized losses on investments, net of tax
|
(59
|
)
|
(21
|
)
|
||||
|
Pension plan adjustments, net of tax
|
(1,031
|
)
|
—
|
|
||||
|
Derivatives designated in hedging relationship
|
(67
|
)
|
107
|
|
||||
|
Total accumulated other comprehensive losses
|
$
|
(6,497
|
)
|
$
|
(3,973
|
)
|
||
During the year ended
February 29, 2012
,
$1,225
of unrealized losses on available-for-sale investment securities were transferred into earnings. The Fiscal
2012
charge was as a result of declines deemed other-than-temporary. The currency translation adjustments are not adjusted for income taxes as they relate to indefinite investments in non-U.S. subsidiaries and equity investments.
w)
New Accounting Pronouncements
In January 2010, the FASB issued authoritative guidance under ASC 820 "Fair Value Measurements and Disclosures" that improves disclosures around fair value measurements. This pronouncement requires additional disclosures regarding transfers between Levels 1, 2 and 3 of the fair value hierarchy of this pronouncement as well as a more detailed reconciliation of recurring Level 3 measurements. Certain disclosure requirements of this pronouncement were effective and adopted by the Company on March 1, 2010, and did not have a material impact on the Company's financial statements. The remaining disclosure requirements of this pronouncement were effective for the Company's first quarter in Fiscal 2012. The adoption of this pronouncement did not have a material impact on the Company's financial statements. In May 2011, ASC 820 was further amended to clarify certain disclosure requirements and improve consistency with international reporting standards. This amendment is to be applied prospectively and was effective for the Company's first quarter in Fiscal 2013. The adoption has not had a material effect on the Company's financial statements.
In June 2011, the FASB issued authoritative guidance included in ASC 220 "Comprehensive Income" related to the presentation of comprehensive income. Specifically, the new guidance allows an entity to present components of net income and other comprehensive income in one continuous statement, referred to as the statement of comprehensive income, or in two separate, but consecutive statements. The new guidance eliminates the current option to report other comprehensive income and its components in the statement of changes in equity. While the new guidance changes the presentation of comprehensive income, there are no changes to the components that are recognized in net income or other comprehensive income under current accounting guidance. The adoption of this disclosure-only guidance did not have an impact on the Company's consolidated financial results and was adopted by the Company beginning in the first quarter of Fiscal 2013.
In September 2011, the FASB issued authoritative guidance in ASC 350 "Intangibles - Goodwill and other" intended to simplify goodwill impairment testing. Entities will be allowed to perform a qualitative assessment on goodwill impairment to determine whether it is more likely than not (defined as having a likelihood of more than 50 percent) that the fair value of a reporting unit is less than its carrying amount as a basis for determining whether it is necessary to perform the two-step goodwill impairment test. This guidance is effective for goodwill impairment tests performed in interim and annual periods for fiscal years beginning after December 15, 2011, or the Company's first quarter of Fiscal 2013. The Company adopted this guidance as of March 1, 2012 and does not expect the guidance to have a material impact on its financial statements.
In February 2013, the FASB issued ASU 2013-02 "Reporting of Amounts Reclassified Out of Accumulated Other Comprehensive Income," which requires an entity to report, either on the face of the statement where net income is presented, or in the notes, the effect of significant reclassifications out of accumulated other comprehensive income on the respective line items in net income if the amount being reclassified is required under U.S. GAAP to be reclassified in their entirety to net income. For other amounts that are not required under U.S. GAAP to be reclassified in their entirety to net income in the same reporting period, an entity is required
81
to cross-reference other disclosures required under U.S. GAAP that provide additional detail about those amounts. This disclosure only guidance is effective prospectively for fiscal years beginning after December 15, 2012,
2
)
Business Acquisitions
Hirschmann
On
March 14, 2012
(the "Closing Date"), Voxx, through its wholly-owned subsidiary VOXX International (Germany) GmbH ("Voxx Germany"), purchased the stock of Car Communication Holding GmbH, a recognized tier-1 supplier of communications and infotainment solutions, primarily to the automotive industry, pursuant to the Sale and Purchase Agreement for
€87,571
(
$114,397
based upon the rate of exchange as of the close of business on the Closing Date) subject to an adjustment for working capital plus related transaction fees and expenses. The acquisition of Hirschmann further diversifies Voxx's offerings and creates strategic opportunities for the Company to leverage Hirschmann's advanced technologies. The Company believes this will lead to more advanced and creative mobile electronics products and continued growth with car manufacturers worldwide.
On the Closing Date, the Company, certain of its directly and indirectly wholly-owned domestic subsidiaries, and Voxx Germany (collectively, the "Borrowers") entered into an Amended and Restated Credit Agreement (the "Amended Facility") with Wells Fargo Bank, National Association ("Wells Fargo"), as Agent, and the other lenders party thereto. The Company borrowed
$148 million
under the Amended Facility on the Closing Date and used a portion of the proceeds from such borrowing to fund Voxx Germany's acquisition of Hirschmann. On the Closing Date, the Company also repaid and terminated its existing asset-based loan facility with Wells Fargo Capital Finance, LLC.
In order to hedge the fluctuation in the exchange rate before closing, the Company entered into two forward contracts totaling
$63,750
, both due in March 2012. The forward contracts were not designated for hedging, and as such, were marked to market at
February 29, 2012
and when they were settled in the first quarter of Fiscal
2013
. A foreign currency gain of
$1,581
was recorded in the fourth quarter of Fiscal
2012
when the contracts were marked to market at year-end and a foreign currency loss of
$2,670
was recorded during the
three months ended
May 31, 2012
, when the contracts were settled, reflecting the loss on settlement.
Net sales attributable to Hirschmann in the Company's consolidated statements of operations for the year ended
February 28, 2013
were approximately
$153 million
.
The following table summarizes the fair values of the assets acquired and liabilities assumed, as of the Closing Date, and the amounts assigned to goodwill and intangible asset classifications:
82
|
March 14, 2012 (as initially reported)
|
Measurement Period Adjustments
|
March 14, 2012 (as adjusted)
|
||||||||||
|
Cash
|
$
|
6,769
|
|
$
|
31
|
|
$
|
6,800
|
|
|||
|
Accounts receivable
|
25,921
|
|
(3,029
|
)
|
22,892
|
|
||||||
|
Inventory
|
20,178
|
|
—
|
|
20,178
|
|
||||||
|
Prepaid expenses and other current assets
|
2,281
|
|
(227
|
)
|
2,054
|
|
||||||
|
Property, plant and equipment
|
18,659
|
|
—
|
|
18,659
|
|
||||||
|
Goodwill
|
70,864
|
|
(10,253
|
)
|
60,611
|
|
||||||
|
Intangible assets
|
22,433
|
|
14,414
|
|
36,847
|
|
||||||
|
Other assets
|
940
|
|
—
|
|
940
|
|
||||||
|
Total assets acquired
|
168,045
|
|
936
|
|
168,981
|
|
||||||
|
Accounts payable and accrued expenses
|
26,953
|
|
(4,778
|
)
|
22,175
|
|
||||||
|
Income taxes payable
|
2,848
|
|
—
|
|
2,848
|
|
||||||
|
Deferred taxes, net
|
5,639
|
|
3,933
|
|
9,572
|
|
||||||
|
Bank obligations
|
11,430
|
|
—
|
|
11,430
|
|
||||||
|
Capital lease obligations
|
911
|
|
—
|
|
911
|
|
||||||
|
Other long-term liabilities
|
5,867
|
|
1,749
|
|
7,616
|
|
||||||
|
Net tangible and intangible assets acquired
|
$
|
114,397
|
|
$
|
32
|
|
$
|
114,429
|
|
|||
During the measurement period, the Company recorded
$10.7 million
of net deferred tax liabilities related to the basis difference between the financial reporting value and the tax value, and the adjustments to the intangible assets value in connection with our preliminary purchase price valuation.
The amounts assigned to goodwill and intangible assets for the acquisition are as follows:
|
March 14, 2012 (as initially reported)
|
Measurement Period Adjustments
|
March 14, 2012 (as adjusted)
|
Amortization Period (Years)
|
||||||||||
|
Goodwill (non-deductible)
|
$
|
70,864
|
|
$
|
(10,253
|
)
|
$
|
60,611
|
|
N/A
|
|||
|
Tradenames (non-deductible)
|
6,761
|
|
3,639
|
|
10,400
|
|
Indefinite
|
||||||
|
Customer relationships
|
9,376
|
|
10,016
|
|
19,392
|
|
15
|
||||||
|
Patents
|
6,296
|
|
759
|
|
7,055
|
|
10
|
||||||
|
$
|
93,297
|
|
$
|
4,161
|
|
$
|
97,458
|
|
|||||
Acquisition related costs relating to this acquisition of
$1,131
and
$1,526
were expensed as incurred during the latter half of the year ended
February 29, 2012
and during the year ended
February 28, 2013
, respectively, and are included in acquisition-related costs for these respective periods in the consolidated statements of operations and comprehensive income.
Klipsch
On March 1, 2011, Soundtech LLC, a Delaware limited liability company and wholly-owned subsidiary of Voxx, acquired all of the issued and outstanding shares of Klipsch Group, Inc. and its worldwide subsidiaries for a total purchase price of
$169.6 million
, consisting of cash paid at closing of
$167.4 million
, including a working capital adjustment, and contingent consideration of
$2.2 million
as a result of a contractual arrangement with former shareholders, plus related transaction fees and expenses. Klipsch is a global provider of high-end speakers for audio, multi-media and home theater applications. The acquisition of Klipsch adds world-class brand names to Voxx's offerings, increases its distribution network, both domestically and abroad, and provides the Company with entry into the high-end installation market at both the residential and commercial level. In addition to the Klipsch® brand, the Klipsch portfolio includes Jamo®, Mirage®, and Energy®.
83
In connection with the acquisition, the Company entered into a
$175 million
credit agreement with Wells Fargo Capital Finance, LLC to fund a portion of the acquisition and future working capital needs, as applicable. At closing, approximately
$89 million
was borrowed under the Credit Agreement to fund the balance of the purchase price.
Net sales attributable to Klipsch in the Company's consolidated statements of operations and comprehensive income for the years ended
February 28, 2013
and
February 29, 2012
were approximately
$174 million
and
$170 million
, respectively.
During the fourth quarter of Fiscal 2013, the Company identified an error in the consolidated financial statements for the year ended February 29, 2012, related to the Klipsch purchase price. Accounts payable acquired in the acquisition was incorrectly overstated and income taxes payable acquired was understated, which also resulted in an overstatement of goodwill from the purchase price. We evaluated the materiality of the error from a qualitative and quantitative perspective. Based on such evaluation, we concluded that the correction was not material to any individual prior period or for the year ended February 28, 2013, taking into account the requirements of the Securities and Exchange Commission Staff Accounting Bulletin No. 108, "Considering The Effects of Prior Year Misstatements in the Current Year Financial Statements," or SAB 108. As discussed in SAB108, though the error correction does require restating consolidated financial statements for prior periods, the error correction does not require the amendment of prior period filings. As a result, the accounting correction has reduced accounts payable by
$1,729
and goodwill by
$1,297
and has increased income taxes payable by
$432
on the consolidated balance sheets at February 28, 2013 and February 29, 2012.
The following table summarizes the final allocation of the purchase price to the fair values of the assets acquired and liabilities assumed at the date of the acquisition and adjusted for the error identified in Fiscal 2013:
|
March 1, 2011
|
|||
|
Accounts receivable
|
$
|
28,614
|
|
|
Inventory
|
30,167
|
|
|
|
Prepaid expenses and other current assets
|
846
|
|
|
|
Property, plant and equipment, net
|
6,347
|
|
|
|
Goodwill
|
78,696
|
|
|
|
Intangible assets
|
82,563
|
|
|
|
Deferred tax assets
|
3,086
|
|
|
|
Total assets acquired
|
230,319
|
|
|
|
Accounts payable
|
14,067
|
|
|
|
Accrued expenses and other liabilities
|
13,096
|
|
|
|
Deferred tax liabilities
|
33,557
|
|
|
|
Net assets acquired
|
$
|
169,599
|
|
During the measurement period, the Company recorded
$30.5 million
of net deferred tax liabilities related to the basis difference between the financial reporting value and the tax value, and the adjustments to the intangible asset values in connection with our preliminary purchase price valuation. In addition, the original purchase price allocation was adjusted by
$2.2 million
during the quarter ended August 31, 2011 to account for contingent purchase price consideration. As a result of these changes, goodwill associated with this transaction was adjusted accordingly.
The amounts assigned to goodwill and intangible assets for the acquisition are as follows and adjusted for the error identified in Fiscal 2013:
84
|
March 1, 2011
|
Amortization Period (Years)
|
||||
|
Goodwill (non-deductible)
|
$
|
78,696
|
|
N/A
|
|
|
Tradenames (non-deductible)
|
49,316
|
|
Indefinite
|
||
|
Customer relationships
|
32,000
|
|
15
|
||
|
Patents
|
1,247
|
|
13
|
||
|
$
|
161,259
|
|
|||
Acquisition related costs of
$374
and
$988
were expensed as incurred in the years ended
February 29, 2012
and
February 28, 2011
, respectively and are included in general and administrative expenses in the accompanying consolidated statements of operations and comprehensive income. Approximately
$1,250
of costs were contingent upon the completion of the acquisition and were expensed on March 1, 2011.
Pro-forma Financial Information
The following unaudited pro-forma financial information for the years ended
February 28, 2013
,
February 29, 2012
and
February 28, 2011
represents the combined results of the Company's operations as if Klipsch was included for the full year of Fiscal
2011
and as if the Hirschmann acquisition had occurred at March 1, 2011. The unaudited pro-forma financial information does not necessarily reflect the results of operations that would have occurred had the Company constituted a single entity during such periods.
|
Year
Ended
|
Year
Ended
|
Year
Ended
|
|||||||||
|
February 28,
2013 |
February 29,
2012 |
February 28,
2011 |
|||||||||
|
Net Sales
|
$
|
843,091
|
|
$
|
860,372
|
|
$
|
728,266
|
|
||
|
Net income
|
26,624
|
|
22,225
|
|
32,430
|
|
|||||
|
Net income per share-diluted
|
$
|
1.13
|
|
$
|
0.96
|
|
$
|
1.40
|
|
||
The above pro-forma results include certain adjustments for the periods presented to adjust the financial results and give consideration to the assumption that the acquisitions of Hirschmann and Klipsch occurred on the first day of Fiscal
2012
and Fiscal
2011
, respectively. These adjustments include costs such as an estimate for amortization and depreciation associated with intangible and fixed assets acquired, additional financing costs as a result of the acquisitions, and the movement of expenses specific to the acquisitions from Fiscal
2013
and Fiscal
2012
to Fiscal
2012
and Fiscal
2011
, respectively. These pro-forma results of operations have been estimated for comparative purposes only and may not reflect the actual results of operations that would have been achieved had the transactions occurred on the dates presented or be indicative of results to be achieved in the future.
|
3)
|
Receivables from Vendors
|
The Company has recorded receivables from vendors in the amount of
$9,943
and
$4,011
as of
February 28, 2013
and
February 29, 2012
, respectively. Receivables from vendors represent prepayments on product shipments and product reimbursements.
|
4)
|
Equity Investment
|
The Company has a
50%
non-controlling ownership interest in ASA Electronics, LLC and Subsidiary ("ASA") which acts as a distributor to markets for specialized vehicles, such as RV’s, van conversions and marine vehicles, of televisions and other automotive sound, security and accessory products. ASC 810 requires the Company to evaluate non-consolidated entities periodically, and as circumstances change, to determine if an implied controlling interest exists. During Fiscal
2013
, the Company evaluated this equity investment and concluded that this is still a variable interest entity and the Company is not the primary beneficiary. ASA’s fiscal year end is
November 30, 2012
, however, the proportionate results of ASA as of and through
February 28, 2013
have been recorded in the consolidated financial statements.
85
The following presents unaudited summary financial information for ASA. Such summary financial information has been provided herein based upon the individual significance of this unconsolidated equity investment to the consolidated financial information of the Company.
|
February 28,
2013 |
February 29,
2012 |
||||||
|
|
(unaudited)
|
(unaudited)
|
|||||
|
Current assets
|
$
|
34,409
|
|
$
|
28,934
|
|
|
|
Non-current assets
|
4,980
|
|
5,068
|
|
|||
|
Current liabilities
|
4,353
|
|
4,216
|
|
|||
|
Members' equity
|
35,036
|
|
29,786
|
|
|||
The equity balance carried on the Company’s balance sheet amounts to
$17,518
and
$14,893
at
February 28, 2013
and
February 29, 2012
, respectively.
|
Year
Ended
|
Year
Ended
|
Year
Ended
|
|||||||||
|
February 28,
2013 |
February 29,
2012 |
February 28,
2011 |
|||||||||
|
|
(unaudited)
|
(unaudited)
|
(unaudited)
|
||||||||
|
Net sales
|
$
|
88,062
|
|
$
|
73,392
|
|
$
|
68,796
|
|
||
|
Gross profit
|
25,452
|
|
21,735
|
|
18,478
|
|
|||||
|
Operating income
|
9,728
|
|
8,039
|
|
5,756
|
|
|||||
|
Net income
|
9,760
|
|
8,071
|
|
5,810
|
|
|||||
The Company's share of income from ASA for the years ended
February 28, 2013
,
February 29, 2012
and
February 28, 2011
was
$4,880
,
$4,035
and
$2,905
, respectively. In addition, the Company received cash distributions from ASA totaling
$2,256
,
$1,906
and
$1,413
during the years ended
February 28, 2013
,
February 29, 2012
and
February 28, 2011
, respectively.
Undistributed earnings from equity investments included in retained earnings amounted to
$12,192
and
$9,567
at
February 28, 2013
and
February 29, 2012
, respectively.
The following represents summary information of transactions between the Company and ASA:
|
Year
Ended
|
Year
Ended
|
Year
Ended
|
|||||||||
|
February 28,
2013 |
February 29,
2012 |
February 28,
2011 |
|||||||||
|
|
(unaudited)
|
(unaudited)
|
(unaudited)
|
||||||||
|
Net Sales
|
$
|
396
|
|
$
|
633
|
|
$
|
477
|
|
||
|
February 28,
2013 |
February 29,
2012 |
||||||
|
Accounts receivable
|
$
|
59
|
|
$
|
4
|
|
|
|
5)
|
Accrued Expenses and Other Current Liabilities
|
Accrued expenses and other current liabilities consist of the following:
86
|
February 28,
2013 |
February 29,
2012 |
||||||
|
Commissions
|
$
|
787
|
|
$
|
737
|
|
|
|
Employee compensation
|
18,521
|
|
21,609
|
|
|||
|
Professional fees and accrued settlements
|
2,107
|
|
4,970
|
|
|||
|
Future warranty
|
12,788
|
|
6,425
|
|
|||
|
Freight and duty
|
2,565
|
|
2,297
|
|
|||
|
Payroll and other taxes
|
1,539
|
|
1,141
|
|
|||
|
Royalties, advertising and other
|
13,216
|
|
15,500
|
|
|||
|
Total accrued expenses and other current liabilities
|
$
|
51,523
|
|
$
|
52,679
|
|
|
|
6)
|
Financing Arrangements
|
The Company has the following financing arrangements:
|
February 28,
2013 |
February 29,
2012 |
|||||||
|
Domestic bank obligations (a)
|
$
|
154,335
|
|
$
|
31,510
|
|
||
|
Euro asset-based lending obligation (b)
|
1,341
|
|
1,818
|
|
||||
|
Euro term loan agreement (c)
|
695
|
|
2,024
|
|
||||
|
Schwaiger mortgage (d)
|
1,888
|
|
2,230
|
|
||||
|
Klipsch notes (e)
|
8,388
|
|
870
|
|
||||
|
Audiovox Germany mortgage (f)
|
8,369
|
|
—
|
|
||||
|
Hirschmann line of credit (g)
|
—
|
|
—
|
|
||||
|
Total debt
|
175,016
|
|
38,452
|
|
||||
|
Less: current portion of long-term debt
|
26,020
|
|
3,592
|
|
||||
|
Total long-term debt
|
$
|
148,996
|
|
$
|
34,860
|
|
||
a)
Domestic Bank Obligations
From March 1, 2012 through March 13, 2012, we had a revolving credit facility (the "Credit Facility"). Funds from the Credit Facility were used to complete the acquisition of Klipsch in March 2011, as well as to fund the temporary short-term working capital needs of the Company. The Credit Facility had an aggregated committed availability of up to
$175 million
, which could be increased at the option of the Company up to a maximum of
$200 million
. The Credit Facility included a
$25 million
sublimit for issuances of letters of credit and a
$20 million
sublimit for Swing Loans.
The Credit Agreement contained covenants that limited the ability of certain entities of the Company to, among other things: (i) incur additional indebtedness: (ii) incur liens; (iii) merge, consolidate or exit a substantial portion of their business; (iv) transfer or dispose of assets; (v) change their names, organizational identification number, state or province of organization or organizational identity; (vi) make any material change in their nature of business; (vii) prepay or otherwise acquire indebtedness; (viii) cause any Change of Control; (ix) make any Restricted Junior Payment; (x) change their fiscal year or method of accounting; (xi) make advances, loans or investments; (xii) enter into or permit any transactions with an Affiliate of certain entities of the Company; (xiii) use proceeds for certain items; (xiv) issue or sell any of their stock; and/or (xv) consign or sell any of their inventory on certain terms.
As a result of the addition of the Credit Facility, the Company incurred debt financing costs of approximately
$3.3 million
in Fiscal 2012, which are recorded as deferred financing costs and are included in other assets and amortized through interest and bank charges over the term of the Credit Facility.
87
On March 14, 2012, the Company amended and restated its Credit Facility (the "Amended Facility"). The Amended Facility provides for senior secured credit facilities in an aggregate principal amount of
$205 million
, consisting of a revolving credit facility of
$130 million
(comprised of a U.S. revolving credit facility of
$80 million
and a
$50 million
multicurrency revolving facility, of which up to the equivalent of
$50 million
is available only to VOXX International (Germany) GmbH in euros) and a five year term loan facility in the aggregate principal amount of
$75 million
.
$60 million
of the U. S. revolving credit facility is available on a revolving basis for five years from the closing date. An additional
$20 million
is available during the periods from September 1, 2012 through January 31, 2013 and from September 1, 2013 through November 30, 2013. The Amended Facility includes a
$25 million
sublimit for issuers of letters of credit for domestic borrowings and a
$10 million
sublimit for Swing Loans.
Generally, the Company may designate specific borrowings under the Amended Facility as either Alternate Base Rate Loans or LIBOR Rate Loans, except that Swing Loans may only be designated as Alternate Base Rate Loans. VOXX International (Germany) GmbH may only borrow euros, and only as LIBOR rate loans. Loans designated as LIBOR Rate Loans shall bear interest at a rate equal to the then applicable LIBOR rate plus a range of
1.25
-
2.25%
based upon leverage, as defined in the agreement. Loans designated as Alternate Base Rate loans shall bear interest at a rate equal to the base rate plus an applicable margin ranging from
0.25
-
1.25%
based on excess availability in the borrowing base. As of
February 28, 2013
, the interest rate on the facility was
2.54%
.
The
$75 million
five year term loan facility is payable in
twenty
quarterly installments of principal commencing May 31, 2012, each in the amount of
$3,750
. All other amounts outstanding under the Amended Facility will mature and become due on March 13, 2017. The Company may prepay any amounts outstanding at any time, subject to payment of certain breakage and redeployment costs relating to LIBOR Rate Loans. The commitments under the Amended Facility may be irrevocably reduced at any time without premium or penalty.
The Amended Facility requires compliance with financial covenants calculated as of the last day of each fiscal quarter consisting of a Total Leverage Ratio, a Consolidated EBIT to Consolidated Interest Expense Ratio and Capital Expenditures.
The Amended Facility contains covenants that limit the ability of certain entities of the Company to, among other things: (i) incur additional indebtedness; (ii) incur liens; (iii) merge, consolidate or exit a substantial portion of their respective businesses; (iv) make any material change in the nature of their business; (v) prepay or otherwise acquire indebtedness; (vi) cause any Change of Control; (vii) make any Restricted Payments; (viii) change their fiscal year or method of accounting; (ix) make advances, loans or investments; (x) enter into or permit any transaction with an Affiliate of certain entities of the Company; or (xi) use proceeds for certain items (including capital expenditures). On May 14, 2013, the Company received a waiver for non-compliance with the covenant limiting the use of proceeds for capital expenditures. As of
February 28, 2013
, the Company was in compliance with all other debt covenants.
The Amended Facility contains customary events of default, including, without limitation: failure to pay principal thereunder when due; failure to pay any interest or other amounts thereunder for a period of three (3) business days after becoming due; failure to comply with certain agreements or covenants contained in the Amended Facility; failure to satisfy certain judgments against a Loan Party or any of its Subsidiaries (other than Immaterial Subsidiaries); certain insolvency and bankruptcy events; and failure to pay when due certain other indebtedness in an amount in excess of $5 million.
The Obligations under the Amended Facility are secured by a general lien on and security interest in the assets of certain entities of the Company, including accounts receivable, equipment, substantially all of the real estate, general intangibles and inventory provided that the assets of Hirschmann Car Communication GmbH and the foreign guarantors will only secure the Foreign Obligations. All Guarantors other than subsidiaries of Hirschmann Car Communication GmbH have jointly and severally guaranteed (or will jointly and severally guarantee) the obligations of any and all Credit Party Obligations, and each Foreign Guarantor will jointly and severally guarantee the obligations of Hirschmann Car Communications GmbH under the Credit Agreement (i.e., the Foreign Obligations).
88
On March 14, 2012, the Company borrowed approximately
$148 million
under this amended credit facility as a result of its stock purchase agreement related to Hirschmann (see Note 2). As of
February 28, 2013
, approximately
$154 million
was outstanding under the line.
As a result of the amendment to the Credit Facility, the Company incurred additional debt financing costs of approximately
$3.4 million
, which are recorded as deferred financing costs. The Company has accounted for the amendment as a modification of debt and has added these costs to the remaining financing costs related to the original Credit Facility. These deferred financing costs have been included in other assets on the accompanying consolidated balance sheets and are being amortized through interest and bank charges over the five year term of the Amended Facility. During the years ended
February 28, 2013
and
February 29, 2012
, the Company amortized
$1,210
and
$680
of these costs, respectively.
b)
Euro Asset-Based Lending Obligation
Foreign bank obligations include a financing arrangement entered into in October 2000, totaling
16,000
Euros and consisting of a Euro accounts receivable factoring arrangement and a Euro Asset-Based Lending ("ABL") (up to
60%
of eligible non-factored accounts receivable) credit facility for the Company's subsidiary, Audiovox Germany, which expires on
November 1, 2013
. Selected accounts receivable are purchased from the Company on a non-recourse basis at
85%
of face value and payment of the remaining
15%
upon receipt from the customer of the balance of the receivable purchased. The activity under the factoring agreement is accounted for as a sale of accounts receivable. The rate of interest is the three month Euribor plus
1.9%
(
2.11%
at
February 28, 2013
), and the Company pays
0.22%
of its gross sales as a fee for the accounts receivable factoring arrangement. As of
February 28, 2013
, the amount of accounts receivable available for factoring exceeded the amounts outstanding under this obligation.
c)
Euro Loan Agreement
On March 30, 2008, Audiovox Germany entered into a
5,000
Euro term loan agreement. This agreement is for a
five
year term with a financial institution and was used to repay the Audiovox Germany intercompany debt to VOXX International Corporation. Payments under the term loan are to be made in two semi-annual installments of
500
Euros beginning on
September 30, 2008
and ending on
March 30, 2013
. Interest accrues at a fixed rate of
4.82%
. Any amount repaid cannot be reborrowed. The term loan is secured by a pledge of the stock of Audiovox Germany and the Magnat brand name, prohibits the distribution of dividends, and takes precedence to all other intercompany loans with VOXX International Corporation.
d)
Schwaiger Mortgage
In January 2012, the Company's Schwaiger subsidiary purchased a building, entering into a mortgage note payable. The mortgage note bears interest at
3.75%
and will be fully paid by December 2019.
e)
Klipsch Notes
Included in this balance is a note payable on a facility included in the assets acquired in connection with the Klipsch transaction on March 1, 2011 and assumed by Voxx. The balance at
February 28, 2013
is
$724
and will be fully paid by the end of Fiscal 2018.
On April 20, 2012, the Company purchased the building housing Klipsch's headquarters in Indianapolis, IN for
$10.9 million
. The Company paid
$3.1 million
cash at closing, plus
$106
in closing costs, and assumed the mortgage held by the seller, Woodview LLC, in the amount of
$7.8 million
. The mortgage is due in June 2013 and bears interest at
5.85%
and the balance at
February 28, 2013
is
$7.7 million
. Woodview LLC is a related party, as certain partners are executives of Klipsch.
f)
Audiovox Germany Mortgage
89
In January 2013, Audiovox Germany purchased the land and building housing their headquarters in Pulheim, Germany, entering into a mortgage note payable. The mortgage bears interest at
2.85%
, payable in twenty-six quarterly installments through June 2019.
g)
Hirschmann Line of Credit
On July 15, 2012, Hirschmann entered into an agreement for a
€6,000
working capital line of credit with a financial institution. The agreement is payable on demand and is mutually cancelable. The rate of interest is the three month Euribor plus
2%
(
2.21%
at
February 28, 2013
) and the line of credit is guaranteed by VOXX International Corporation. There was
no
outstanding balance on the line of credit as of
February 28, 2013
.
The following is a maturity table for debt and bank obligations outstanding at
February 28, 2013
:
|
2014
|
$
|
26,020
|
|
|
2015
|
1,321
|
|
|
|
2016
|
1,321
|
|
|
|
2017
|
1,314
|
|
|
|
2018
|
140,649
|
|
|
|
Thereafter
|
4,391
|
|
|
|
Total
|
$
|
175,016
|
|
The weighted-average interest rate on short-term debt was
4.52%
and
4.64%
for Fiscal
2013
and
2012
, respectively. Interest expense for the years ended
February 28, 2013
,
February 29, 2012
and
February 28, 2011
was
$6,302
,
$3,520
and
$2,138
, respectively, of which
$4,133
was related to the Credit Facility for the year ended
February 28, 2013
.
7)
Income Taxes
The components of income before the provision for income taxes are as follows:
|
Year
Ended
|
Year
Ended
|
Year
Ended
|
|||||||||
|
February 28,
2013 |
February 29,
2012 |
February 28,
2011 |
|||||||||
|
Domestic Operations
|
$
|
27,485
|
|
$
|
28,229
|
|
$
|
6,276
|
|
||
|
Foreign Operations
|
8,170
|
|
10,663
|
|
6,220
|
|
|||||
|
|
$
|
35,655
|
|
$
|
38,892
|
|
$
|
12,496
|
|
||
The provision (benefit) for income taxes is comprised of the following:
90
|
Year
Ended
|
Year
Ended
|
Year
Ended
|
|||||||||
|
February 28,
2013 |
February 29,
2012 |
February 28,
2011 |
|||||||||
|
Current provision
|
|
|
|
||||||||
|
Federal
|
$
|
8,349
|
|
$
|
5,296
|
|
$
|
278
|
|
||
|
State
|
1,075
|
|
629
|
|
(35
|
)
|
|||||
|
Foreign
|
4,327
|
|
3,324
|
|
3,120
|
|
|||||
|
Total current provision
|
$
|
13,751
|
|
$
|
9,249
|
|
$
|
3,363
|
|
||
|
Deferred (benefit) provision
|
|
|
|
|
|
|
|||||
|
Federal
|
$
|
1,739
|
|
$
|
4,396
|
|
$
|
(12,103
|
)
|
||
|
State
|
42
|
|
(561
|
)
|
(1,355
|
)
|
|||||
|
Foreign
|
(2,369
|
)
|
159
|
|
(440
|
)
|
|||||
|
Total deferred (benefit) provision
|
$
|
(588
|
)
|
$
|
3,994
|
|
$
|
(13,898
|
)
|
||
|
Total provision (benefit)
|
|
|
|
|
|
|
|||||
|
Federal
|
$
|
10,088
|
|
$
|
9,692
|
|
$
|
(11,825
|
)
|
||
|
State
|
1,117
|
|
68
|
|
(1,390
|
)
|
|||||
|
Foreign
|
1,958
|
|
3,483
|
|
2,680
|
|
|||||
|
Total provision (benefit)
|
$
|
13,163
|
|
$
|
13,243
|
|
$
|
(10,535
|
)
|
||
The effective tax rate before income taxes varies from the current statutory U.S. federal income tax rate as follows:
|
Year
Ended
|
Year
Ended
|
Year
Ended
|
||||||||||||||||||
|
February 28,
2013 |
February 29,
2012 |
February 28,
2011 |
||||||||||||||||||
|
Tax provision at Federal statutory rates
|
$
|
12,479
|
|
35.0
|
%
|
$
|
13,612
|
|
35.0
|
%
|
$
|
4,373
|
|
35.0
|
%
|
|||||
|
State income taxes, net of Federal benefit
|
637
|
|
1.8
|
|
1,145
|
|
2.9
|
|
167
|
|
1.3
|
|
||||||||
|
Change in valuation allowance
|
1,034
|
|
2.9
|
|
192
|
|
0.5
|
|
(16,254
|
)
|
(130.1
|
)
|
||||||||
|
Change in tax reserves
|
315
|
|
0.9
|
|
(241
|
)
|
(0.6
|
)
|
159
|
|
1.3
|
|
||||||||
|
US effects of foreign operations
|
(1,090
|
)
|
(3.1
|
)
|
(135
|
)
|
(0.4
|
)
|
92
|
|
0.8
|
|
||||||||
|
Permanent differences and other
|
388
|
|
1.1
|
|
921
|
|
2.3
|
|
928
|
|
7.4
|
|
||||||||
|
Change in tax rate
|
(270
|
)
|
(0.8
|
)
|
(885
|
)
|
(2.2
|
)
|
—
|
|
—
|
|
||||||||
|
Research & development credits
|
(330
|
)
|
(0.9
|
)
|
(1,366
|
)
|
(3.5
|
)
|
—
|
|
—
|
|
||||||||
|
Effective tax rate
|
$
|
13,163
|
|
36.9
|
%
|
$
|
13,243
|
|
34.0
|
%
|
$
|
(10,535
|
)
|
(84.3
|
)%
|
|||||
The U.S. effects of foreign operations include differences in the statutory tax rate of the foreign countries as compared to the statutory tax rate in the U.S. and foreign operating losses for which no tax benefit has been provided.
Deferred income taxes reflect the net tax effects of temporary differences between the carrying amounts of assets and liabilities for financial reporting and tax purposes. Significant components of the Company's deferred tax assets and liabilities are as follows:
91
|
February 28,
2013 |
February 29,
2012 |
||||||
|
Deferred tax assets:
|
|
|
|||||
|
Accounts receivable
|
$
|
419
|
|
$
|
480
|
|
|
|
Inventory
|
2,657
|
|
3,028
|
|
|||
|
Property, plant and equipment
|
447
|
|
170
|
|
|||
|
Accruals and reserves
|
8,340
|
|
6,599
|
|
|||
|
Unrealized gains and losses
|
1,696
|
|
1,894
|
|
|||
|
Foreign and state operating losses
|
3,685
|
|
3,180
|
|
|||
|
Tax credits
|
6,266
|
|
5,244
|
|
|||
|
Deferred tax assets before valuation allowance
|
23,510
|
|
20,595
|
|
|||
|
Less: valuation allowance
|
(10,413
|
)
|
(9,035
|
)
|
|||
|
Total deferred tax assets
|
13,097
|
|
11,560
|
|
|||
|
Deferred tax liabilities:
|
|
|
|
|
|||
|
Intangible assets
|
(50,723
|
)
|
(39,546
|
)
|
|||
|
Prepaid expenses
|
(1,378
|
)
|
(1,802
|
)
|
|||
|
Deferred financing fees
|
(832
|
)
|
(1,002
|
)
|
|||
|
Total deferred tax liabilities
|
(52,933
|
)
|
(42,350
|
)
|
|||
|
Net deferred tax liability
|
$
|
(39,836
|
)
|
$
|
(30,790
|
)
|
|
The Company recorded net deferred tax liabilities of
$10.7 million
in connection with the Hirschmann acquisition.
In assessing the realizability of deferred tax assets, Management considers whether it is more-likely-than-not that some portion or all of the deferred tax assets will be realized. The ultimate realization of deferred tax assets is dependent upon the generation of future taxable income in those periods in which temporary differences become deductible and/or net operating loss carryforwards can be utilized. We consider the level of historical taxable income, scheduled reversal of temporary differences, tax planning strategies and projected future taxable income in determining whether a valuation allowance is warranted.
During Fiscal 2013, the Company increased its valuation allowance by
$1.4 million
. The Company maintains a valuation allowance against deferred tax assets in certain foreign jurisdictions and with respect to its foreign tax credits and various investments which are more likely than not to generate capital losses in the future. Any decline in the valuation allowance could have a favorable impact on our income tax provision and net income in the period in which such determination is made.
The Company has not provided for U.S. federal and foreign withholding taxes on its foreign subsidiaries undistributed earnings in Germany as of
February 28, 2013
, because such earnings are intended to be indefinitely reinvested overseas. The amount of unrecognized deferred tax liabilities for temporary differences related to investments in undistributed earnings is not practicable to determine at this time.
A reconciliation of the beginning and ending amount of unrecognized tax benefits, excluding interest and penalties, is as follows:
92
|
Balance at February 28, 2011
|
$
|
3,335
|
|
|
Additions based on tax positions taken in the current and prior years
|
1,192
|
|
|
|
Additions in connection with acquisitions
|
624
|
|
|
|
Settlements
|
(30
|
)
|
|
|
Lapse in statute of limitations
|
(471
|
)
|
|
|
Recognition of excess tax benefits
|
(1,738
|
)
|
|
|
Balance at February 29, 2012
|
$
|
2,912
|
|
|
Additions based on tax positions taken in the current and prior years
|
8,744
|
|
|
|
Lapse in statute of limitations
|
(25
|
)
|
|
|
Decrease in prior year tax positions
|
(168
|
)
|
|
|
Balance at February 28, 2013
|
$
|
11,463
|
|
Of the amounts reflected in the table above at
February 28, 2013
,
$8.9 million
, if recognized, would reduce our effective tax rate. The Company records accrued interest and penalties related to income tax matters in the provision for income taxes in the accompanying consolidated statement of operations. The balance as
February 28, 2013
of was
$752
. In addition, the Company believes that the uncertain tax positions will not materially change within the next twelve months.
The Company, or one of its subsidiaries, files its tax returns in the U.S. and certain state and foreign income tax jurisdictions with varying statutes of limitations. The earliest years' tax returns filed by the Company that are still subject to examination by the tax authorities in the major jurisdictions are as follows:
|
Jurisdiction
|
|
Tax Year
|
|
|
|
|
|
U.S.
|
|
2009
|
|
Netherlands
|
2009
|
|
|
Germany
|
|
2009
|
|
Canada
|
|
2010
|
8)
Other Long-Term Liabilities
On August 29, 2003, the Company entered into a call/put option agreement with certain employees of Audiovox Germany, whereby these employees can acquire up to a maximum of
20%
of the Company's stated share capital in Audiovox Germany at a call price equal to the same proportion of the actual price paid by the Company for Audiovox Germany. The put options become immediately exercisable upon (i) the sale of Audiovox Germany or (ii) the termination of employment or death of the employee. The put price to be paid to the employee upon exercise will be the then net asset value per share of Audiovox Germany. Accordingly, the Company recognizes compensation expense based on
20%
of the increase in Audiovox Germany's net assets, subject to certain adjustments as defined in the agreement, representing the incremental change of the put price over the call option price. The balance of the call/put option included in other long-term liabilities on the Consolidated Balance Sheets at
February 28, 2013
and
February 29, 2012
was $
4,322
and $
3,898
, respectively. Compensation expense for these options amounted to
$148
,
$127
and
$727
for the years ended
February 28, 2013
,
February 29, 2012
and
February 28, 2011
, respectively.
Also included in other long-term liabilities are the non-current portions of contingent considerations related to certain acquisitions of the Company and the non-current portion of a pension liability for Hirschmann employees (see Note 10).
|
9)
|
Capital Structure
|
The Company's capital structure is as follows:
93
|
|
|
Shares Authorized
|
Shares Outstanding
|
|
|||||||||||||||||
|
Security
|
Par
Value
|
February 28,
2013 |
February 29,
2012 |
February 28,
2013 |
February 29,
2012 |
Voting
Rights per
Share
|
Liquidation
Rights
|
||||||||||||||
|
Preferred Stock
|
$
|
50.00
|
|
50,000
|
|
50,000
|
|
—
|
|
—
|
|
—
|
|
$50 per share
|
|||||||
|
Series Preferred Stock
|
$
|
0.01
|
|
1,500,000
|
|
1,500,000
|
|
—
|
|
—
|
|
—
|
|
|
|||||||
|
Class A Common Stock
|
$
|
0.01
|
|
60,000,000
|
|
60,000,000
|
|
21,300,670
|
|
20,875,600
|
|
one
|
Ratably with Class B
|
||||||||
|
Class B Common Stock
|
$
|
0.01
|
|
10,000,000
|
|
10,000,000
|
|
2,260,954
|
|
2,260,954
|
|
ten
|
Ratably with Class A
|
||||||||
The holders of Class A and Class B common stock are entitled to receive cash or property dividends declared by the Board of Directors. The Board of Directors can declare cash dividends for Class A common stock in amounts equal to or greater than the cash dividends for Class B common stock. Dividends other than cash must be declared equally for both classes. Each share of Class B common stock may, at any time, be converted into one share of Class A common stock.
Stock held in treasury by the Company is accounted for using the cost method which treats stock held in treasury as a reduction to total stockholders' equity and amounted to
1,816,132
and
1,817,112
shares at
February 28, 2013
and
February 29, 2012
, respectively. The cost basis for subsequent sales of treasury shares is determined using an average cost method. As of
February 28, 2013
,
1,738,243
shares of the Company's Class A common stock are authorized to be repurchased in the open market. During the years ended
February 28, 2013
,
February 29, 2012
and
February 28, 2011
, the Company did not purchase any shares.
|
10)
|
Other Stock and Retirement Plans
|
a)
Restricted Stock Plan
The Company has restricted stock plans under which key employees and directors may be awarded restricted stock. Awards under the restricted stock plan may be performance-accelerated shares or performance-restricted shares. No performance accelerated shares or performance-restricted shares were granted or outstanding during the year ended
February 28, 2011
. (See Note 1(u)).
As of
February 28, 2013
, approximately
1,784,000
shares of the Company's Class A common stock are reserved for issuance under the Company's Restricted and Stock Option Plan.
b)
Profit Sharing Plans
The Company has established two non-contributory employee profit sharing plans for the benefit of its eligible employees in the United States and Canada. The plans are administered by trustees appointed by the Company. No contributions were made during the years ended
February 28, 2013
,
February 29, 2012
and
February 28, 2011
. Contributions required by law to be made for eligible employees in Canada were not material for all periods presented.
c)
401(k) Plans
|
(1)
|
The VOXX International 401(k) plan is for all eligible domestic employees, with the exception of Klipsch employees, who continued to participate in a separate 401(k) plan for the years ended
February 28, 2013
and
February 29, 2012
. The Company matches a portion of the participant's contributions after three months of service under a predetermined formula based on the participant's contribution level. As of February 1, 2008, the Company suspended all matching contributions to contain operating expenses until economic conditions improved. Shares of the Company's Common Stock are not an investment option in the Savings Plan and the Company does not use such shares to match participants' contributions.
|
94
|
(2)
|
Klipsch sponsors a 401(k) plan for the subsidiary's eligible employees. All of Klipsch's full-time employees are eligible to participate. Klipsch contributes a matching amount to participants who are at least 21 years of age and have attained six months of service as of entry dates of January 1 or July 1. Klipsch matches
25%
of the participants first
4%
of salary. During the year ended
February 28, 2013
, the Company contributed, net of forfeitures, approximately
$157
to the 401(k) Plan.
|
d)
Cash Bonus Profit Sharing Plan
During Fiscal 2009, the Board of Directors authorized a Cash Bonus Profit Sharing Plan that allows the Company to make profit sharing contributions for the benefit of eligible employees, for any fiscal year based on a pre-determined formula on the Company's pre-tax profits. The size of the contribution is dependent upon the performance of the Company. A participant’s share of the contribution is determined pursuant to the participant’s eligible wages for the fiscal year as a percentage of total eligible wages for all participants. For the year ended February 28, 2011, this plan was temporarily suspended and the Company elected to pay back previous temporary salary reductions to all employees, in lieu of contributions to the Profit Sharing Plan. The plan has remained suspended for the years ended
February 28, 2013
and
February 29, 2012
and will be reinstated only after all other suspended benefits of the Company have been restored.
e)
Deferred Compensation Plan
Effective December 1, 1999, the Company adopted a Deferred Compensation Plan (the Plan) for Vice Presidents and above. The Plan is intended to provide certain executives with supplemental retirement benefits as well as to permit the deferral of more of their compensation than they are permitted to defer under the Profit Sharing and 401(k) Plan. The Plan provides for a matching contribution equal to
25%
of the employee deferrals up to
$20
. As of February 1, 2008, the Company has temporarily suspended all matching contributions to contain operating expenses until economic conditions improve. The Plan is not intended to be a qualified plan under the provisions of the Internal Revenue Code. All compensation deferred under the Plan is held by the Company in an investment trust which is considered an asset of the Company. The Company has the option of amending or terminating the Plan at any time.
The investments, which amounted to
$3,657
and
$3,447
at
February 28, 2013
and
February 29, 2012
, respectively, have been classified as long-term marketable securities and are included in investment securities on the accompanying consolidated balance sheets and a corresponding liability is recorded with
$250
recorded in accrued expenses and the balance in deferred compensation which is classified as a long-term liability. Unrealized gains and losses on the marketable securities and corresponding deferred compensation liability net to zero in the accompanying consolidated statements of operations and comprehensive income.
f)
Defined Benefit Pension Plan
The Company sponsors an employer financed defined benefit pension plan ("the plan") at its Hirschmann subsidiary, which covers eligible Hirschmann regular full-time employees. The plan provides for retirement and disability benefits for participating employees, and are only granted if the participating employee is at least 25 years of age and has completed ten years of service. The retirement age as it pertains to the plan is 65. Benefits available under the plan are generally determined by years of service and the levels of compensation during those years. In October 1994, the benefits under this plan at Hirschmann were closed to new participants and pension benefits continue to accrue only for previously existing plan members still employed by Hirschmann. No contributions were made to the plan during the year ended
February 28, 2013
and the plan has no assets. The unfunded balance of the plan at
February 28, 2013
is equal to the total plan liability of
$6,911
. The Company did not have a defined benefit pension plan prior to the acquisition of Hirschmann on March 14, 2012.
Following is the reconciliation of the pension benefit obligation for the year ended
February 28, 2013
.
95
|
Pension benefit obligation
|
Fiscal 2013
|
||
|
Balance, March 14, 2012
|
$
|
5,300
|
|
|
Interest cost
|
284
|
|
|
|
Benefits paid
|
(110
|
)
|
|
|
Actuarial loss
|
1,437
|
|
|
|
$
|
6,911
|
|
|
As of
February 28, 2013
the following amounts were recognized in the balance sheet and in accumulated other comprehensive income:
|
Balance Sheet
|
February 28, 2013
|
||
|
As a current liability
|
$
|
157
|
|
|
As a non-current liability
|
$
|
6,754
|
|
|
Accumulated Other Comprehensive Income
|
Fiscal 2013
|
||
|
Actuarial loss
|
$
|
1,437
|
|
Pension expense for Fiscal 2013 comprised the following:
|
Fiscal 2013
|
|||
|
Interest cost
|
$
|
284
|
|
|
$
|
284
|
|
|
Pension expense is recorded within general and administrative expenses on the Consolidated Statement of Operations and Comprehensive Income.
|
11)
|
Lease Obligations
|
During 1996, the Company entered into a 30-year capital lease for a building with its principal stockholder and current chairman, which was the headquarters of the discontinued Cellular operation. Payments on the capital lease were based upon the construction costs of the building and the then-current interest rates. The effective interest rate on the capital lease obligation is 8%. This lease was refinanced in December 2006 and expires on November 30, 2026. The Company currently subleases the building to Airtyme Communications LLC for monthly payments of
$60
for a term of three years, terminating on
October 15, 2015
. We also lease another facility from our principal stockholder which expires on November 30, 2016.
The Company leases certain facilities from its principal stockholder. At
February 28, 2013
, minimum annual rental payments on these related party leases, including capital lease payments, which are included in the table below, are as follows:
|
2014
|
$
|
1,354
|
|
|
2015
|
1,377
|
|
|
|
2016
|
1,402
|
|
|
|
2017
|
1,223
|
|
|
|
2018
|
631
|
|
|
|
Thereafter
|
5,837
|
|
|
|
Total
|
$
|
11,824
|
|
96
Total lease payments required under all related party leases for the five-year period ending
February 28, 2018
are
$5,987
.
At
February 28, 2013
, the Company was obligated under non-cancellable capital and operating leases for equipment and warehouse facilities for minimum annual rental payments as follows:
|
Capital
Lease
|
Operating
Leases
|
||||||
|
2014
|
$
|
574
|
|
$
|
9,052
|
|
|
|
2015
|
574
|
|
3,383
|
|
|||
|
2016
|
574
|
|
2,413
|
|
|||
|
2017
|
588
|
|
962
|
|
|||
|
2018
|
1,361
|
|
233
|
|
|||
|
Thereafter
|
5,838
|
|
661
|
|
|||
|
Total minimum lease payments
|
9,509
|
|
$
|
16,704
|
|
||
|
Less: minimum sublease income
|
1,920
|
|
|
|
|||
|
Net
|
7,589
|
|
|
|
|||
|
Less: amount representing interest
|
1,661
|
|
|
|
|||
|
Present value of net minimum lease payments
|
5,928
|
|
|
|
|||
|
Less: current installments included in accrued expenses and other current liabilities
|
164
|
|
|
|
|||
|
Long-term capital obligation
|
$
|
5,764
|
|
|
|
||
Rental expense for the above-mentioned operating lease agreements and other leases on a month-to-month basis was
$5,531
,
$4,797
and
$2,741
for the years ended
February 28, 2013
,
February 29, 2012
and
February 28, 2011
, respectively.
|
12)
|
Financial Instruments
|
a)
Off-Balance Sheet Risk
Commercial letters of credit are issued by the Company during the ordinary course of business through major domestic banks as requested by certain suppliers. The Company also issues standby letters of credit principally to secure certain bank obligations and insurance policies. The Company had
$273
open commercial letters of credit at both
February 28, 2013
and
February 29, 2012
. Standby letters of credit amounted to
$817
at both
February 28, 2013
and
February 29, 2012
. The terms of these letters of credit are all less than one year. No material loss is anticipated due to nonperformance by the counter parties to these agreements. The fair value of the standby letters of credit is estimated to be the same as the contract values based on the short-term nature of the fee arrangements with the issuing banks.
At
February 28, 2013
, the Company had unconditional purchase obligations for inventory commitments of
$105,193
. These obligations are not recorded in the consolidated financial statements until commitments are fulfilled and such obligations are subject to change based on negotiations with manufacturers.
b)
Concentrations of Credit Risk
Financial instruments, which potentially subject the Company to concentrations of credit risk, consist principally of trade receivables. The Company's customers are located principally in the United States, Canada, Europe and Asia Pacific and consist of, among others, distributors, mass merchandisers, warehouse clubs and independent retailers. The Company generally grants credit based upon analyses of customers' financial condition and previously established buying and payment patterns. For certain customers, the Company establishes collateral rights in accounts receivable and inventory and obtains personal guarantees from certain customers based upon management's credit evaluation. Certain customers in Europe and Latin America have credit insurance equaling their credit limit.
97
At
February 28, 2013
and
February 29, 2012
, one customer accounted for approximately
32%
and
22.3%
of accounts receivable, respectively. During the years ended
February 28, 2013
,
February 29, 2012
and
February 28, 2011
one customer accounted for
8.7%
,
10.3%
and
13.5%
of net sales, respectively. The Company's five largest customers represented
28%
of net sales during the year ended
February 28, 2013
,
26%
for the year ended
February 29, 2012
and
30%
for the year ended
February 28, 2011
.
A portion of the Company's customer base may be susceptible to downturns in the retail economy, particularly in the consumer electronics industry. Additionally, customers specializing in certain automotive sound, security and accessory products may be impacted by fluctuations in automotive sales.
|
13)
|
Financial and Product Information About Foreign and Domestic Operations
|
Segment
In connection with recent acquisitions, effective December 1, 2012, we reorganized our financial reporting into three distinct operating segments based upon our products and our internal organizational structure. The three operating segments, which are also the Company's reportable segments, are Automotive, Premium Audio and Consumer Accessories.
Our Automotive segment designs, manufactures, distributes
and markets rear-seat entertainment, satellite radio products, automotive security, remote start systems, digital TV tuners, mobile antennas, mobile multimedia, aftermarket/OE-styled radios, car link-smartphone telematics application, collision avoidance systems and location-based services.
Our Premium Audio segment designs, manufactures, distributes
and markets home theater systems, high-end loudspeakers, outdoor speakers, iPod/computer speakers, business music systems, cinema speakers, flat panel speakers, soundbars, headphones and Apple AirPlay.
Our Consumer Accessories segment designs and markets remote controls, reception products, wireless speakers, iPod docks/iPod sound, A/V connectivity, portable/home charging, rechargeable battery packs, digital consumer products and personal sound amplifier.
Each operating segment is individually reviewed and evaluated by our Chief Operating Decision Maker (CODM), who allocates resources and assesses performance of each segment individually. Prior to December 1, 2012 our CODM reviewed financial information presented on a consolidated basis, accompanied by disaggregated information about revenues for purposes of making operating decisions and assessing financial performance.
The Company's Chief Executive Officer has been identified as the CODM. The CODM evaluates performance and allocates resources based upon a number of factors, the primary profit measure being income before income taxes
of each segment. Certain costs and royalty income are not allocated to the segments and are reported as Corporate/Eliminations. Costs not allocated to the segments include professional fees, public relations costs, acquisition cost and costs associated with executive and corporate management departments including salaries, benefits, depreciation, rent and insurance.
The segments share many common resources, infrastructures and assets in the normal course of business. Thus, the Company does not report assets or capital expenditures by segment to the CODM.
The accounting principles applied at the consolidated financial statement level are generally the same as those applied at the operating segment level and there are no material intersegment sales. The segments are allocated interest expense, based upon a pre-determined formula, which utilizes a percentage of each operating segment's intercompany balance, which is offset in corporate/eliminations.
Prior period disclosure of net sales by product category has been reclassified to conform with the new operating segment structure which had no impact on our consolidated financial statements. Segment data for each of the Company's segments are presented below:
98
|
Automotive
|
Premium Audio
|
Consumer Accessories
|
Corporate/ Eliminations
|
Total
|
|||||||||||||||
|
Fiscal Year Ended February 28, 2013
|
|||||||||||||||||||
|
Net sales
|
$
|
426,983
|
|
$
|
192,987
|
|
$
|
214,275
|
|
$
|
1,332
|
|
$
|
835,577
|
|
||||
|
Equity in income of equity investees
|
4,880
|
|
—
|
|
—
|
|
—
|
|
4,880
|
|
|||||||||
|
Interest expense and bank charges
|
7,414
|
|
7,651
|
|
9,753
|
|
(16,530
|
)
|
8,288
|
|
|||||||||
|
Depreciation and amortization expense
|
8,579
|
|
3,548
|
|
2,575
|
|
1,744
|
|
16,446
|
|
|||||||||
|
Income before income taxes
|
15,542
|
|
16,983
|
|
2,322
|
|
808
|
|
35,655
|
|
|||||||||
|
Fiscal Year Ended February 29, 2012
|
|||||||||||||||||||
|
Net sales
|
$
|
297,145
|
|
$
|
191,427
|
|
$
|
215,604
|
|
$
|
2,886
|
|
$
|
707,062
|
|
||||
|
Equity in income of equity investees
|
4,035
|
|
—
|
|
—
|
|
—
|
|
4,035
|
|
|||||||||
|
Interest expense and bank charges
|
4,894
|
|
8,836
|
|
9,502
|
|
(17,602
|
)
|
5,630
|
|
|||||||||
|
Depreciation and amortization expense
|
1,654
|
|
3,989
|
|
2,742
|
|
1,910
|
|
10,295
|
|
|||||||||
|
Income (loss) before income taxes
|
24,854
|
|
17,612
|
|
(1,064
|
)
|
(2,510
|
)
|
38,892
|
|
|||||||||
|
Fiscal Year Ended February 28, 2011
|
|||||||||||||||||||
|
Net sales
|
$
|
298,126
|
|
$
|
20,071
|
|
$
|
240,128
|
|
$
|
3,347
|
|
$
|
561,672
|
|
||||
|
Equity in income of equity investees
|
2,905
|
|
—
|
|
—
|
|
—
|
|
2,905
|
|
|||||||||
|
Interest expense and bank charges
|
6,412
|
|
347
|
|
9,816
|
|
(13,945
|
)
|
2,630
|
|
|||||||||
|
Depreciation and amortization expense
|
2,138
|
|
188
|
|
3,483
|
|
2,056
|
|
7,865
|
|
|||||||||
|
Income (loss) before income taxes
|
12,341
|
|
583
|
|
(5,530
|
)
|
5,102
|
|
12,496
|
|
|||||||||
One
customer during fiscal years ended
February 29, 2012
and
February 28, 2011
accounted for more than 10% of consolidated net sales. Such customer sales of
$72.6 million
and
$75.5 million
, respectively, are recorded in the Automotive, Premium Audio and Consumer Accessories segments during the year ended
February 29, 2012
and in the Automotive and Consumer Accessories segments during the year ended
February 28, 2011
.
No
one customer accounted for more than 10% of consolidated net sales during the fiscal year ended February 28, 2013.
Geographic net sales information in the table below is based on the location of the selling entity. Long-lived assets, primarily fixed assets, are reported below based on the location of the asset.
|
North America
|
Latin America
|
Germany
|
Other
|
Total
|
|||||||||||||||
|
Fiscal Year Ended February 28, 2013
|
|||||||||||||||||||
|
Net sales
|
$
|
575,481
|
|
$
|
27,090
|
|
$
|
229,033
|
|
$
|
3,973
|
|
$
|
835,577
|
|
||||
|
Long-lived assets
|
274,527
|
|
11,983
|
|
141,663
|
|
113
|
|
428,286
|
|
|||||||||
|
Fiscal Year Ended February 29, 2012
|
|||||||||||||||||||
|
Net sales
|
$
|
585,293
|
|
$
|
26,728
|
|
$
|
90,042
|
|
$
|
4,999
|
|
$
|
707,062
|
|
||||
|
Long-lived assets
|
265,870
|
|
7,405
|
|
19,748
|
|
174
|
|
293,197
|
|
|||||||||
|
Fiscal Year Ended February 28, 2011
|
|||||||||||||||||||
|
Net sales
|
$
|
457,349
|
|
$
|
20,258
|
|
$
|
76,845
|
|
$
|
7,220
|
|
$
|
561,672
|
|
||||
|
Long-lived assets
|
107,657
|
|
423
|
|
17,805
|
|
240
|
|
126,125
|
|
|||||||||
|
14)
|
Contingencies
|
99
The Company is currently, and has in the past been a party to various routine legal proceedings incident to the ordinary course of business. If management determines, based on the underlying facts and circumstances, that it is probable a loss will result from a litigation contingency and the amount of the loss can be reasonably estimated, the estimated loss is accrued for. The Company believes its outstanding litigation matters disclosed below will not have a material adverse effect on the Company's financial statements, individually or in the aggregate; however, due to the uncertain outcome of these matters, the Company disclosed these specific matters below:
The products the Company sells are continually changing as a result of improved technology. As a result, although the Company and its suppliers attempt to avoid infringing known proprietary rights, the Company may be subject to legal proceedings and claims for alleged infringement by its suppliers or distributors, of third party patents, trade secrets, trademarks or copyrights. Any claims relating to the infringement of third-party proprietary rights, even if not meritorious, could result in costly litigation, divert management’s attention and resources, or require the Company to either enter into royalty or license agreements which are not advantageous to the Company, or pay material amounts of damages.
The Company has been party to a breach of license agreement lawsuit brought against it by MPEG LA, LLC ("MPEG"). During the third quarter of Fiscal 2012, the Company's claim for summary judgment was denied and the case was tried in the New York Supreme Court, Suffolk County. In December 2011, the Company received advisory judgment in the case, concluding that the Company owed MPEG penalties related to license agreement obligations arising from the manufacture and sale of its products. The Company recorded a charge of approximately
$3.6 million
in Fiscal 2012 and, based on the advisory jury's verdict, remitted payment of
$2.6 million
to MPEG in December 2011 in order to resolve this matter. On May 29, 2012, the Company received notice that the advisory judgment was overturned by the presiding Judge in the case. The Judge's ruling gave the Company and MPEG the option to (a) reach an agreement on the balance still owed; (b) allow the Judge to determine the balance; or (c) proceed to another trial and have a new jury determine the balance owed. On June 29, 2012, the Company reached a settlement agreement with MPEG and agreed to pay an additional
$10.5 million
in final resolution of the matter. The payment is in addition to the funds paid in December 2011, bringing the total settlement to
$13.1 million
. As a result of this settlement, the Company recorded a charge of
$9.5 million
during the first quarter of Fiscal 2013. The charge is recorded in "Other (Expense) Income" in the Consolidated Statement of Operations and Comprehensive Income. The Company has continued to seek indemnification from its suppliers for royalty payments previously paid to them that it maintains they were responsible to remit to MPEG and has vigorously pursued its option under its indemnification agreements. The Company completed negotiations with one vendor for an amount of
$1.1 million
during the first quarter of Fiscal 2013. In February 2013, the Company completed negotiations with one additional vendor for an amount of
$6 million
, which will be received over a period exceeding one year and has been recorded at a fair value of
$5.7 million
. The total amount of the settlements with these two vendors has been recorded as an offset to the settlement expense as a recovery in "Other (Expense) Income" on the Consolidated Statement of Operations and Comprehensive Income, for a net charge of
$2.7 million
for the year ended
February 28, 2013
. At this time, the Company is not aware of any additional vendors that it may recover funds from related to this matter.
|
15)
|
Unaudited Quarterly Financial Data
|
Selected unaudited, quarterly financial data of the Company for the years ended
February 28, 2013
and
February 29, 2012
appear below:
100
|
|
Quarters Ended
|
|||||||||||||||
|
|
Feb 28, 2013
|
Nov 30, 2012
|
Aug 31, 2012
|
May 31, 2012
|
||||||||||||
|
2013
|
|
|
|
|
||||||||||||
|
Net sales
|
$
|
206,790
|
|
$
|
243,036
|
|
$
|
191,715
|
|
$
|
194,036
|
|
||||
|
Gross profit
|
61,691
|
|
69,949
|
|
54,686
|
|
50,496
|
|
||||||||
|
Net income (loss)
|
10,270
|
|
13,202
|
|
3,720
|
|
(4,700
|
)
|
||||||||
|
|
|
|
|
|
|
|
|
|||||||||
|
Net income (loss) per common share (basic)
|
0.44
|
|
0.56
|
|
0.16
|
|
(0.20
|
)
|
||||||||
|
|
|
|
|
|
|
|
|
|||||||||
|
Net income (loss) per common share (diluted)
|
0.43
|
|
0.56
|
|
0.16
|
|
(0.20
|
)
|
||||||||
|
|
Quarters Ended
|
|||||||||||||||
|
|
Feb 29, 2012
|
Nov 30, 2011
|
Aug 31, 2011
|
May 31, 2011
|
||||||||||||
|
2012
|
|
|
|
|
|
|
|
|
||||||||
|
Net sales
|
$
|
176,597
|
|
$
|
206,803
|
|
$
|
158,337
|
|
$
|
165,325
|
|
||||
|
Gross profit
|
55,562
|
|
59,843
|
|
43,862
|
|
43,688
|
|
||||||||
|
Net income
|
10,866
|
|
8,858
|
|
3,439
|
|
2,487
|
|
||||||||
|
|
|
|
|
|
|
|
|
|||||||||
|
Net income per common share (basic)
|
0.47
|
|
0.38
|
|
0.15
|
|
0.11
|
|
||||||||
|
|
|
|
|
|
|
|
|
|||||||||
|
Net income per common share (diluted)
|
0.46
|
|
0.38
|
|
0.15
|
|
0.11
|
|
||||||||
Net income per common share are computed separately for each quarter. Therefore, the sum of such quarterly per share amounts may differ from the total for the years.
16)
Subsequent Events
With the exception of the matter discussed in Note 1(o) with regard to the recall initiated by Subaru of America, there were not material subsequent events that required recognition or additional disclosure in these financial statements.
101
SCHEDULE II
AUDIOVOX CORPORATION AND SUBSIDIARIES
Valuation and Qualifying Accounts
Years ended
February 28, 2013
,
February 29, 2012
and
February 28, 2011
(In thousands)
|
Column A
|
Column B
|
Column C
|
Column D
|
Column E
|
||||||||||||||||
|
Description
|
Balance at
Beginning
of Year
|
Gross
Amount
Charged to
Costs and
Expenses
|
Reversals of
Previously
Established Accruals
|
Deductions (a)
|
Balance
at End
of Year
|
|||||||||||||||
|
Year ended February 28, 2011
|
|
|
|
|
|
|||||||||||||||
|
Allowance for doubtful accounts
|
$
|
5,742
|
|
$
|
827
|
|
$
|
—
|
|
$
|
390
|
|
$
|
6,179
|
|
|||||
|
Cash discount allowances
|
785
|
|
4,723
|
|
—
|
|
4,623
|
|
885
|
|
||||||||||
|
Accrued sales incentives
|
10,606
|
|
28,004
|
|
(1,725
|
)
|
24,904
|
|
11,981
|
|
||||||||||
|
Reserve for warranties and product repair costs (b)
|
13,058
|
|
11,561
|
|
—
|
|
15,568
|
|
9,051
|
|
||||||||||
|
|
$
|
30,191
|
|
$
|
45,115
|
|
$
|
(1,725
|
)
|
$
|
45,485
|
|
$
|
28,096
|
|
|||||
|
Year ended February 29, 2012
|
|
|
|
|
|
|
|
|
|
|
||||||||||
|
Allowance for doubtful accounts
|
$
|
6,179
|
|
$
|
1,067
|
|
$
|
—
|
|
$
|
1,509
|
|
$
|
5,737
|
|
|||||
|
Cash discount allowances
|
885
|
|
28,723
|
|
—
|
|
28,143
|
|
1,465
|
|
||||||||||
|
Accrued sales incentives
|
11,981
|
|
50,820
|
|
(3,662
|
)
|
40,985
|
|
18,154
|
|
||||||||||
|
Reserve for warranties and product repair costs (b)
|
9,051
|
|
11,839
|
|
—
|
|
12,095
|
|
8,795
|
|
||||||||||
|
|
$
|
28,096
|
|
$
|
92,449
|
|
$
|
(3,662
|
)
|
$
|
82,732
|
|
$
|
34,151
|
|
|||||
|
Year ended February 28, 2013
|
|
|
|
|
|
|
|
|
|
|
||||||||||
|
Allowance for doubtful accounts
|
$
|
5,737
|
|
$
|
4,170
|
|
$
|
—
|
|
$
|
2,067
|
|
$
|
7,840
|
|
|||||
|
Cash discount allowances
|
1,465
|
|
26,246
|
|
—
|
|
26,480
|
|
1,231
|
|
||||||||||
|
Accrued sales incentives
|
18,154
|
|
35,636
|
|
(3,350
|
)
|
33,619
|
|
16,821
|
|
||||||||||
|
Reserve for warranties and product repair costs (b)
|
8,795
|
|
13,798
|
|
—
|
|
8,042
|
|
14,551
|
|
||||||||||
|
|
$
|
34,151
|
|
$
|
79,850
|
|
$
|
(3,350
|
)
|
$
|
70,208
|
|
$
|
40,443
|
|
|||||
|
(a)
|
For the allowance for doubtful accounts, cash discount allowances, and accrued sales incentives deductions represent currency effects, chargebacks and payments made or credits issued to customers. For the reserve for warranties and product repair costs, deductions represent currency effects and payments for labor and parts made to service centers and vendors for the repair of units returned under warranty.
|
|
(b)
|
Column C includes
$115
of liabilities acquired during our Invision acquisition for Fiscal 2011, as well as
$1,480
of liabilities acquired during our Klipsch acquisition for Fiscal 2012 and
$1,799
of liabilities acquired during our Hirschmann acquisition for Fiscal 2013.
|
102
|
Exhibit
Number
|
|
Description
|
|
|
|
|
|
3.1
|
Amended and Restated Certificate of Incorporation of the Company as filed with the Delaware Secretary of State on April 17, 2000 (incorporated by reference to the Company's Annual Report on Form 10-K for the year ended November 30, 2000).
|
|
|
3.2
|
Certificate of Ownership and Merger (incorporated by reference to the Company's Form 8-K filed on December 6, 2011).
|
|
|
3.3
|
Amended and Restated Bylaws of the Company (incorporated by reference to the Company's Form 8-K filed on December 6, 2011).
|
|
|
10.1
|
First amendment dated as of November 29, 2012, to Amended and Restated Credit Agreement, among VOXX International Corporation, as Parent and certain of its directly and indirectly wholly-owned subsidiaries with, Wells Fargo Bank, National Association as Administrative Agent, Fifth Third Bank and HSBC Bank USA N. A., as Co-Syndication Agents and Citibank, N. A. and RBS Citizens, N. A., as Co-Documentation Agents (filed herewith).
|
|
|
21
|
|
Subsidiaries of the Registrant (filed herewith).
|
|
|
|
|
|
23
|
|
Consent of Grant Thornton LLP (filed herewith).
|
|
|
|
|
|
31.1
|
|
Certification of Principal Executive Officer Pursuant to Rule 13a-14(a) and rule 15d-14(a) of the Securities Exchange Act of 1934 (filed herewith).
|
|
|
|
|
|
31.2
|
|
Certification of Principal Financial Officer Pursuant to Rule 13a-14(a) and rule 15d-14(a) of the Securities Exchange Act of 1934 (filed herewith).
|
|
|
|
|
|
32.1
|
|
Certification Pursuant to 18 U.S.C. Section 1350, as Adopted Pursuant to Section 906 of the Sarbanes-Oxley Act of 2002 (furnished herewith).
|
|
|
|
|
|
32.2
|
|
Certification Pursuant to 18 U.S.C. Section 1350, as Adopted Pursuant to Section 906 of the Sarbanes-Oxley Act of 2002 (furnished herewith).
|
|
|
|
|
|
99.1
|
|
Consolidated Financial Report of Audiovox Specialized Applications LLC (ASA) as of November 30, 2012 and 2011 and for the Years Ended November 30, 2012, 2011 and 2010 (filed herewith).
|
|
|
|
|
|
99.2
|
|
Consent of McGladrey LLP (filed herewith).
|
|
101
|
The following materials from VOXX International Corporation's Annual Report on Form 10-K for the period ended February 28, 2013, formatted in eXtensible Business Reporting Language (XBRL): (i) the Consolidated Balance Sheets , (ii), the Consolidated Statements of Income, (iii) the Consolidated Statements of Cash Flows, and (iv) Notes to Consolidated Financial Statements.
|
|
(d) All other schedules are omitted because the required information is shown in the financial statements or notes thereto or because they are not applicable.
103
SIGNATURES
Pursuant to the requirements of Section 13 or 15(d) of the Securities Exchange Act of 1934, the registrant has duly caused this report to be signed on its behalf by the undersigned, thereunto duly authorized.
|
VOXX INTERNATIONAL CORPORATION
|
|
|
May 14, 2013
|
By:
/s/ Patrick M. Lavelle
|
|
Patrick M. Lavelle,
|
|
|
President and Chief Executive Officer
|
|
104
Pursuant to the requirements of the Securities Exchange Act of 1934, this report has been signed below by the following persons on behalf of the registrant and in the capacities and on the dates indicated.
|
Signature
|
Title
|
Date
|
|
/s/ Patrick M. Lavelle
Patrick M. Lavelle
|
President; Chief Executive Officer
(Principal Executive Officer) and Director
|
May 14, 2013
|
|
/s/ Charles M. Stoehr
Charles M. Stoehr
|
Senior Vice President,
Chief Financial Officer (Principal
Financial and Accounting Officer) and Director
|
May 14, 2013
|
|
/s/ John J. Shalam
John J. Shalam
|
Chairman of the Board of Directors
|
May 14, 2013
|
|
/s/ Philip Christopher
Philip Christopher
|
Director
|
May 14, 2013
|
|
/s/ Paul C. Kreuch, Jr.
Paul C. Kreuch, Jr.
|
Director
|
May 14, 2013
|
|
/s/ Dennis McManus
Dennis McManus
|
Director
|
May 14, 2013
|
|
/s/ Peter A. Lesser
Peter A. Lesser
|
Director
|
May 14, 2013
|
|
/s/ Ari Shalam
Ari Shalam
|
Director
|
May 14, 2013
|
|
/s/ Fred Klipsch
Fred Klipsch
|
Director
|
May 14, 2013
|
105
TABLE OF CONTENTS
Part IItem 1-businessItem 1a-risk FactorsItem 1b-unresolved Staff CommentsItem 2-propertiesItem 3-legal ProceedingsItem 4-removed and ReservedPart IIItem 5-market For The Registrant's Common Equity, Related Stockholder Matters and Issuer Purchases Of EquityItem 6-selected Consolidated Financial DataItem 7-management's Discussion and Analysis Of Financial Condition and Results Of Operations ("md&a")Item 7a-quantitative and Qualitative Disclosures About Market RiskItem 8-consolidated Financial Statements and Supplementary DataItem 9-changes in and Disagreements with Accountants on Accounting and Financial DisclosureItem 9a-controls and ProceduresItem 9B - Other InformationPart IIIPart IVItem 15-exhibits, Financial Statement Schedules