VOXX INTERNATIONAL CORP
10-Ks and 10-Qs
|
|
|
|
|
|
|
|
|
|
|
|
|
|
|
|
|
|
|
|
|
|
|
|
|
|
|
|
|
|
|
|
|
|
|
|
|
|
|
|
|
|
|
|
UNITED STATES SECURITIES AND EXCHANGE COMMISSION
Washington, D.C. 20549
FORM 10-K
Annual Report Pursuant to Section 13 or 15 (d) of the Securities Exchange Act of 1934
For the fiscal year ended
February 28, 2018
Commission file number 0-28839
VOXX INTERNATIONAL CORPORATION
(Exact name of registrant as specified in its charter)
|
Delaware
(State or other jurisdiction of
incorporation or organization)
|
13-1964841
(IRS Employer Identification No.)
|
|
2351 J. Lawson Boulevard, Orlando, Florida
(Address of principal executive offices)
|
32824
(Zip Code)
|
|
(800) 645-7750
(Registrant's telephone number, including area code)
|
|
|
Securities registered pursuant to Section 12(b) of the Act:
|
|
|
|
|
|
Title of each class:
|
Name of Each Exchange on which Registered
|
|
Class A Common Stock $.01 par value
|
The Nasdaq Stock Market LLC
|
Securities registered pursuant to Section 12(g) of the Act:
None
Indicate by check mark if the registrant is a well-known seasoned issuer, as defined in Rule 405 of the Securities Act.
Yes
o
No
x
Indicate by check mark if the registrant is not required to file reports pursuant to Section 13 or Section 15(d) of the Act.
Yes
o
No
x
Indicate by check mark whether the registrant (1) has filed all reports required to be filed by Section 13 or 15(d) of the Securities Exchange Act of 1934 during the preceding 12 months (or for such shorter period that the registrant was required to file such reports) and (2) has been subject to such filing requirements for the past 90 days.
Yes
x
No
o
Indicate by check mark if disclosure of delinquent filers pursuant to Item 405 of Regulation S-K is not contained herein, and will not be contained, to the best of registrant's knowledge, in definitive proxy or information statements incorporated by reference in Part III of this Form 10-K or any amendment to this Form 10-K.
o
Indicate by check mark whether the registrant is a large accelerated filer, an accelerated filer, a non-accelerated filer, a smaller reporting company or an emerging growth company. See definition of "large accelerated filer," "accelerated filer," "smaller reporting company," and "emerging growth company" in Rule 12b-2 of the Exchange Act. (check one):
Large accelerated filer
o
Accelerated filer
x
Non-accelerated filer
o
Smaller reporting company
o
Emerging growth company
o
1
If an emerging growth company, indicate by check mark if the registrant has elected not to use the extended transition period for complying with any new or revised financial accounting standards provided pursuant to Section 13(a) of the Exchange Act
o
Indicate by check mark whether the Registrant is a shell company (as defined in rule 12b-2 of the Act).
Yes
o
No
x
Indicate by check mark whether the registrant has submitted electronically and posted on its corporate Web site, if any, every Interactive Data File required to be submitted and posted pursuant to Rule 405 of Regulation S-T (§232.405 of this chapter) during the preceding 12 months (or for such shorter period that the registrant was required to submit and post such files).
Yes
x
No
o
The aggregate market value of the common stock held by non-affiliates of the Registrant was
$159,725,387
(based upon closing price on the Nasdaq Stock Market on August 31,
2017
).
The number of shares outstanding of each of the registrant's classes of common stock, as of
May 11, 2018
was:
|
Class
|
Outstanding
|
|
|
|
|
Class A common stock $.01 par value
|
21,938,100
|
|
Class B common stock $.01 par value
|
2,260,954
|
DOCUMENTS INCORPORATED BY REFERENCE
Part III - (Items 10, 11, 12, 13 and 14) Proxy Statement for Annual Meeting of Stockholders to be filed on or before
June 8, 2018
.
2
VOXX INTERNATIONAL CORPORATION
Index to Form 10-K
|
Table of Contents
|
||
|
|
|
|
|
PART I
|
||
|
|
|
|
|
Item 1
|
Business
|
|
|
Item 1A
|
Risk Factors
|
|
|
Item 1B
|
Unresolved Staff Comments
|
|
|
Item 2
|
Properties
|
|
|
Item 3
|
Legal Proceedings
|
|
|
Item 4
|
Removed and Reserved
|
|
|
|
|
|
|
PART II
|
||
|
|
|
|
|
Item 5
|
Market for the Registrant's Common Equity, Related Stockholder Matters and Issuer Purchases of Equity Securities
|
|
|
Item 6
|
Selected Consolidated Financial Data
|
|
|
Item 7
|
Management's Discussion and Analysis of Financial Condition and Results of Operations
|
|
|
Item 7A
|
Quantitative and Qualitative Disclosures About Market Risk
|
|
|
Item 8
|
Consolidated Financial Statements and Supplementary Data
|
|
|
Item 9
|
Changes in and Disagreements with Accountants on Accounting and Financial Disclosure
|
|
|
Item 9A
|
Controls and Procedures
|
|
|
Item 9B
|
Other Information
|
|
|
|
|
|
|
PART III
|
||
|
|
|
|
|
Item 10
|
Directors, Executive Officers and Corporate Governance
|
|
|
Item 11
|
Executive Compensation
|
|
|
Item 12
|
Security Ownership of Certain Beneficial Owners and Management and Related Stockholder Matters
|
|
|
Item 13
|
Certain Relationships and Related Transactions, and Director Independence
|
|
|
Item 14
|
Principal Accounting Fees and Services
|
|
|
|
|
|
|
PART IV
|
||
|
|
|
|
|
Item 15
|
Exhibits, Financial Statement Schedules
|
|
|
|
|
|
|
SIGNATURES
|
||
3
CAUTIONARY STATEMENT RELATING TO THE SAFE HARBOR PROVISIONS OF THE PRIVATE SECURITIES LITIGATION REFORM ACT OF 1995
This Annual Report on Form 10-K, including "Management's Discussion and Analysis of Financial Condition and Results of Operations" in Item 7, and the information incorporated by reference contains "forward-looking statements" within the meaning of section 27A of the Securities Act of 1933 and Section 21E of the Securities Exchange Act of 1934. We intend those forward looking-statements to be covered by the safe harbor provisions for forward-looking statements. All statements regarding our expected financial position and operating results, our business strategy, our financing plans and the outcome of any contingencies are forward-looking statements. Any such forward-looking statements are based on current expectations, estimates, and projections about our industry and our business. Words such as "anticipates," "expects," "intends," "plans," "believes," "seeks," "estimates," "should," "would," or variations of those words and similar expressions are intended to identify such forward-looking statements. Forward-looking statements are subject to risks and uncertainties that could cause actual results to differ materially from those stated in or implied by any forward-looking statements. Factors that could cause actual results to differ materially from forward-looking statements include, but are not limited to, matters listed in Item 1A under "Risk Factors" of this annual report. The Company assumes no obligation and does not intend to update these forward-looking statements.
NOTE REGARDING DOLLAR AMOUNTS AND FISCAL YEAR
In this annual report, all dollar amounts are expressed in thousands, except for share prices and per-share amounts. Unless specifically indicated otherwise, all amounts and percentages in our Form 10-K are exclusive of discontinued operations.
The Company’s current fiscal year began March 1,
2017
and ended
February 28, 2018
.
VOXX International Corporation ("Voxx," "We," "Our," "Us," or the "Company") is a leading international manufacturer and distributor in the Automotive, Premium Audio and Consumer Accessories industries. The Company has widely diversified interests, with more than 30 global brands that it has acquired and grown throughout the years, achieving a powerful international corporate image and creating a vehicle for each of these respective brands to emerge with its own identity. We conduct our business through sixteen wholly-owned subsidiaries: Audiovox Atlanta Corp., VOXX Electronics Corporation, VOXX Accessories Corp., VOXX German Holdings GmbH ("Voxx Germany"), Audiovox Canada Limited, Voxx Hong Kong Ltd., Audiovox International Corp., Audiovox Mexico, S. de R.L. de C.V. ("Voxx Mexico"), Code Systems, Inc., Oehlbach Kabel GmbH ("Oehlbach"), Schwaiger GmbH ("Schwaiger"), Invision Automotive Systems, Inc. ("Invision"), Klipsch Holding LLC ("Klipsch"), Omega Research and Development, LLC ("Omega"), Voxx Automotive Corp., and Audiovox Websales LLC, as well as a majority owned subsidiary, EyeLock LLC ("EyeLock"). We market our products under the Audiovox® brand name and other brand names and licensed brands, such as 808®, AR for Her, Acoustic Research®, Advent®, Ambico®, Car Link®, Chapman®, Code-Alarm®, Discwasher®, Energy®, Heco®, Incaar
™
, Invision®, Jamo®, Jensen®, Klipsch®, Mac Audio
™
, Magnat®, Mirage®, myris®, Oehlbach®, Omega®, Phase Linear®, Prestige®, Project Nursery®, Pursuit®, RCA®, RCA Accessories, Recoton®, Rosen®, Schwaiger®, Terk® and Voxx Automotive as well as private labels through a large domestic and international distribution network. We also function as an OEM ("Original Equipment Manufacturer") supplier to several customers, as well as market a number of products under exclusive distribution agreements, such as SiriusXM satellite radio products and 360 Fly
®
Action Cameras.
VOXX International Corporation was incorporated in Delaware on April 10, 1987 under its former name, Audiovox Corp., as successor to a business founded in 1960 by John J. Shalam, our Chairman and controlling stockholder. Our extensive distribution network and long-standing industry relationships have allowed us to benefit from growing market opportunities and emerging niches in the electronics business.
The Company operates in three segments based upon the Company's products and internal organizational structure. The operating segments consist of the Automotive, Premium Audio and Consumer Accessories segments. The Automotive segment designs, manufactures, distributes and markets rear-seat entertainment devices, satellite radio products, automotive security, remote start systems, mobile multimedia devices, aftermarket/OE-styled radios, car-link smartphone telematics applications, collision avoidance systems and location-based services. The Premium Audio segment designs, manufactures, distributes and markets home theater systems, high-end loudspeakers, outdoor speakers, iPad/iPod and computer speakers, business music systems, cinema speakers, flat panel speakers, Bluetooth speakers, soundbars, headphones and DLNA (Digital Living Network Alliance) compatible devices. The Consumer Accessories segment designs, manufactures, markets and distributes remote controls; wireless and Bluetooth speakers; karaoke products; action cameras; iris identification and biometric security related products; personal sound amplifiers; smart-home security and safety products; infant and nursery products; and A/V connectivity, portable/home charging,
4
reception and digital consumer products. See Note 13 to the Company's Consolidated Financial Statements for segment and geographic area information.
We make available financial information, news releases and other information on our web site at www.voxxintl.com. There is a direct link from the web site to the Securities and Exchange Commission's ("SEC") filings web site, where our annual report on Form 10-K, quarterly reports on Form 10-Q, current reports on Form 8-K and any amendments to these reports filed or furnished pursuant to Section 13(a) or 15(d) of the Securities Exchange Act of 1934 are available free of charge as soon as reasonably practicable after we file such reports and amendments with, or furnish them to, the SEC. In addition, we have adopted a Code of Business Conduct and Ethics which is available free of charge upon request. Any such request should be directed to the attention of the Company's Human Resources Department, 180 Marcus Boulevard, Hauppauge, New York 11788, (631) 231-7750.
Acquisitions and Dispositions
We have acquired and integrated the following acquisitions, discussed below, into our existing business structure:
Effective September 1, 2015 ("the Closing Date"), Voxx completed its acquisition of a majority voting interest in substantially all of the assets and certain specified liabilities of Eyelock, Inc. and Eyelock Corporation (collectively the “Seller”) through a newly-formed entity, Eyelock LLC, for a total purchase consideration of
$31,880
, which consisted of a cash payment of
$15,504
, assignment of the fair value of the indebtedness owed to the Company by the Seller of
$4,676
and the fair value of the non-controlling interest of
$12,900
, reduced by
$1,200
for amounts owed to the LLC by the selling shareholders. EyeLock develops and markets iris-based identity authentication solutions and this acquisition allows the Company to enter into the growing biometrics market. Refer to Note 2 "Business Acquisitions and Dispositions" of the Notes to Consolidated Financial Statements for additional information regarding the EyeLock acquisition in Fiscal 2016.
On April 18, 2017, Voxx acquired certain assets and assumed certain liabilities of Rosen Electronics LLC for cash consideration of
$1,814
. In addition, the Company agreed to pay a 2% fee related to future net sales of Rosen products for three years. The purpose of this acquisition was to increase the Company's market share and strengthen its intellectual property related to the rear seat entertainment market. Details of the tangible and intangible assets acquired are outlined in Note 2 of this report. Refer to Note 2 "Business Acquisitions and Dispositions" of the Notes to Consolidated Financial Statements for additional information regarding the Rosen acquisition in Fiscal 2018.
On August 31, 2017 (the "Closing Date"), the Company completed its sale of Hirschmann Car Communication GmbH and its subsidiaries (collectively, “Hirschmann”) to a subsidiary of TE Connectivity Ltd ("TE"). The consideration received by the Company was €
148,500
. The purchase price, at the exchange rate as of the close of business on the Closing Date approximated
$177,000
and is subject to adjustment based upon the final working capital. The Hirschmann subsidiary group, which was included within the Automotive segment, qualified to be presented as a discontinued operation in accordance with ASC 205-20 beginning in the Company's second quarter ending August 31, 2017. Refer to Note 2 "Business Acquisitions and Dispositions" of the Notes to Consolidated Financial Statements for additional information regarding the sale of Hirschmann in Fiscal 2018.
Strategy
Our objective is to grow our business both organically and through strategic acquisitions. We will drive the business organically by continued product development in new and emerging technologies that should increase gross margins and improve operating income. We are focused on expanding sales both domestically and internationally and broadening our customer and partner base as we bring these new products to our target markets. In addition, we plan to continue to acquire synergistic companies that would allow us to leverage our overhead, penetrate new markets and expand existing product categories. Notwithstanding the above, if the appropriate opportunity arises, the Company will explore the potential divestiture of a product line or business.
The key elements of our strategy are as follows:
Continue to build and capitalize on the VOXX family of brands.
We believe the "VOXX" portfolio of brands is one of our greatest strengths and offers us significant opportunity for increased market penetration. Today, VOXX International has over 30 global brands in its portfolio, which provides the Company with the ability to bring to market products under brands that consumers know to be quality. In addition, with such a wide brand portfolio, we can manage channels and sell into multiple outlets as well as leverage relationships with distributors, retailers, aftermarket car dealers and expeditors, and to global OEMs. Finally, we are open to opportunities to license some of the brands as an additional use of the brands and as a growth strategy.
Continue to maintain diversified, blue chip customer base.
Voxx distributes products through a wide range of specialty and mass merchandise channels and has arrangements with tier-1 and tier-2 auto OEMs. OEM products account for approximately
15%
of
5
Fiscal 2018
sales from continuing operations. The top-five customers of the Company represented
26%
of sales from continuing operations, and no single customer accounted for over 10% of Fiscal
2018
sales.
Capitalize on niche product and distribution opportunities in our target markets.
Throughout our history, we have used our extensive distribution and supply networks to capitalize on niche product and distribution opportunities in the automotive, premium audio and consumer accessories categories. We will continue that focus as we remain committed to innovation, developing products internally and through our outsourced technology and manufacturing partners to provide our customers with products that are in demand by consumers.
Combine new, internal manufacturing capabilities with our proven outsourced manufacturing with industry partners
. For years, VOXX International employed an outsourced manufacturing strategy that enabled the Company to deliver the latest technological advances without the fixed costs associated with manufacturing. Within the last decade, the Company has added manufacturing capabilities to produce select product lines, such as high-end speakers, rear-seat entertainment systems, and security related products. This blend of internal and outsourced manufacturing enables the Company to drive innovation, control product quality and speed time-to-market.
Use innovative technology generation capabilities to enable us to build a robust pipeline of new products.
Voxx has invested significantly in R&D. The Company uses a mix of internal and external R&D, internal and external manufacturing, and has a number of valuable trademarks, copyrights, patents, domain names and other intellectual property. Through Voxx's increased focus on R&D, the Company has built a pipeline of new products across all three segments.
Leverage our domestic and international distribution network.
VOXX International Corporation has a highly expansive distribution network. Our distribution network, which includes various types of retailers and chain stores, mass merchandisers, distributors, e-commerce platforms, system integrators, communication network providers, smart grid manufacturers, banks, cinema operators, cell phone providers, the U.S. military, car dealers and OEM's should allow us to increase our market penetration. We intend to capitalize on new and existing distribution outlets to further grow our business across our three operating segments, both domestically and abroad.
Grow our international presence.
We have expanded our international presence through our local subsidiaries in Europe, as well as operations in Canada and China. We also continue to export from our domestic operations in the United States. Our strategy remains to diversify our exposure to any particular geography, while expanding our product offerings and distribution touch points across the world.
Pursue strategic and complementary acquisitions.
We continue to monitor economic and industry conditions in order to evaluate potential strategic and synergistic business acquisitions that are expected to allow us to leverage overhead, penetrate new markets and expand our existing business distribution. Over the past several years, the Company has employed an M&A strategy to build its brand portfolio and enhance its product offering in higher margin product categories, while at the same time, exiting lower margin and commoditized product lines, resulting in improved bottom-line performance. The Company is focused on continuing to grow organically, but may pursue opportunistic acquisitions to augment our automotive (primarily with OEM accounts), consumer accessories and premium audio segments.
Maintain disciplined acquisition criteria.
Virtually all of our acquisitions over the past decade have been made to strengthen our product offerings, customer reach and growth potential across our operating business segments. Our strategy remains to acquire complimentary businesses, products and/or assets in our Automotive, Premium Audio and Consumer Accessories operating segments. Additionally, acquisitions should have a gross margin structure equal to or higher than our consolidated gross margins, and we will continue to look for acquisitions where we can leverage our corporate overhead and resources. Furthermore, it is important that management remains with Voxx as part of the acquisition, as their legacy expertise, knowledge of both the inner workings of their respective companies and the end-markets they serve are paramount to successfully running operations and achieving growth. We also pursue acquisitions that will be accretive for the Company and its shareholders in the first year such acquisitions are made.
Rapidly integrate acquired businesses.
One of the more compelling factors as to why acquired businesses choose VOXX International Corporation is that we are perceived as both a financial and strategic partner. We are operators, and companies view their association with us as a positive for the future of their businesses in that we can provide resources and support that others in our sector, or in the Private Equity community, cannot. Our strategy upon acquisition, and in the years that follow, is to leverage our corporate strengths and integrate acquisitions into our operations. We provide accounting, MIS, warehouse and logistics support, as well as a host of value-added services that enable acquired companies to lower their cost basis and improve profitability. In recent years, we have consolidated facilities in our German operations and in Indiana, where we brought our RCA® and Klipsch operating groups together.
6
Improve bottom-line performance and generate sustainable shareholder returns.
The Company has instituted an aggressive strategy in recent years to shift its product mix to higher-margin product categories, while controlling costs and strategically investing in its infrastructure. The Company remains focused on growing its business organically, continuing to enhance its gross profit margins and leveraging its fixed overhead structure to generate sustainable returns for its stockholders.
Industry
We participate in selected product categories in the automotive, premium audio and consumer accessories markets within the electronics industry. These markets are large and diverse, encompass a broad range of products and offer the ability to specialize in niche product groups. The introduction of new products and technological advancements are the major growth drivers in these markets. Based on this, we continue to introduce new products across all segments, with an increased focus on niche product offerings.
Products
The Company currently reports sales data for the following three operating segments:
Automotive products include:
|
▪
|
mobile multi-media video products, including in-dash, overhead and headrest systems,
|
|
▪
|
autosound products including radios and amplifiers,
|
|
▪
|
satellite radios including plug and play models and direct connect models,
|
|
▪
|
smart phone telematics applications,
|
|
▪
|
automotive security and remote start systems,
|
|
▪
|
automotive power accessories,
|
|
▪
|
rear observation and collision avoidance systems, and
|
|
▪
|
power lift gates.
|
Premium Audio products include:
|
▪
|
premium loudspeakers,
|
|
▪
|
architectural speakers,
|
|
▪
|
commercial speakers,
|
|
▪
|
outdoor speakers,
|
|
▪
|
flat panel speakers,
|
|
▪
|
wireless speakers,
|
|
▪
|
Bluetooth speakers,
|
|
▪
|
home theater systems,
|
|
▪
|
business music systems,
|
|
▪
|
streaming music systems,
|
|
▪
|
on-ear and in-ear headphones,
|
|
▪
|
wireless and Bluetooth headphones,
|
|
▪
|
soundbars and sound bases, and
|
|
▪
|
DLNA (Digital Living Network Alliance) compatible devices.
|
Consumer Accessories products include:
|
▪
|
High-Definition Television ("HDTV") antennas,
|
|
▪
|
Wireless Fidelity ("WiFi") antennas,
|
|
▪
|
High-Definition Multimedia Interface ("HDMI") accessories,
|
|
▪
|
smart-home security and safety-related products,
|
|
▪
|
home electronic accessories such as cabling,
|
|
▪
|
other connectivity products,
|
|
▪
|
power cords,
|
|
▪
|
performance enhancing electronics,
|
|
▪
|
TV universal remotes,
|
|
▪
|
flat panel TV mounting systems,
|
|
▪
|
iPad/iPod specialized products,
|
7
|
▪
|
wireless headphones,
|
|
▪
|
wireless speakers,
|
|
▪
|
Bluetooth speakers,
|
|
▪
|
action cameras,
|
|
▪
|
karaoke products,
|
|
▪
|
infant/nursery products,
|
|
▪
|
activity tracking bands,
|
|
▪
|
power supply systems and charging products,
|
|
▪
|
electronic equipment cleaning products,
|
|
▪
|
personal sound amplifiers,
|
|
▪
|
set-top boxes,
|
|
▪
|
home and portable stereos,
|
|
▪
|
digital multi-media products, such as personal video recorders and MP3 products, and
|
|
▪
|
iris identification and biometric security related products.
|
We believe our segments have expanding market opportunities with certain levels of volatility related to domestic and international markets, new car sales, increased competition by manufacturers, private labels, technological advancements, discretionary consumer spending and general economic conditions. Also, all of our products are subject to price fluctuations, which could affect the carrying value of inventories and gross margins in the future.
Net sales from continuing operations, by segment, gross profit and total assets are as follows:
|
Fiscal
|
Fiscal
|
Fiscal
|
|||||||||
|
2018
|
2017
|
2016
|
|||||||||
|
Automotive
|
$
|
155,480
|
|
$
|
170,729
|
|
$
|
201,125
|
|
||
|
Premium Audio
|
172,406
|
|
166,789
|
|
140,508
|
|
|||||
|
Consumer Accessories
|
178,756
|
|
176,216
|
|
187,272
|
|
|||||
|
Corporate/Eliminations
|
450
|
|
796
|
|
1,301
|
|
|||||
|
Total net sales
|
$
|
507,092
|
|
$
|
514,530
|
|
$
|
530,206
|
|
||
|
Gross profit
|
$
|
132,297
|
|
$
|
144,030
|
|
$
|
143,536
|
|
||
|
Gross margin percentage
|
26.1
|
%
|
28.0
|
%
|
27.1
|
%
|
|||||
|
Total assets
|
$
|
575,644
|
|
$
|
668,486
|
|
$
|
667,190
|
|
||
Patents, Trademarks/Tradenames, Licensing and Royalties
The Company regards its trademarks, copyrights, patents, domain names, and similar intellectual property as important to its operations. It relies on trademark, copyright and patent law, domain name regulations, and confidentiality or license agreements to protect its proprietary rights. The Company has registered, or applied for the registration of, a number of patents, trademarks, domain names and copyrights by U.S. and foreign governmental authorities. Additionally, the Company has filed U.S. and international patent applications covering certain of its proprietary technology. The Company renews its registrations, which vary in duration, as it deems appropriate from time to time.
The Company has licensed in the past, and expects that it may license in the future, certain of its proprietary rights to third parties. Some of the Company's products are designed to include intellectual property licensed or otherwise obtained from third parties. While it may be necessary in the future to seek or renew licenses relating to various aspects of the Company's products, the Company believes, based upon past experience and industry practice, such licenses generally could be obtained on commercially reasonable terms; however, there is no guarantee such licenses could be obtained at all. We intend to operate in a way that does not result in willful infringement of the patents, trade secrets and other intellectual property rights of other parties. Nevertheless, there can be no assurance that a claim of infringement will not be asserted against us or that any such assertion will not result in a judgment or order requiring us to obtain a license in order to make, use, or sell our products.
License and royalty programs offered to our manufacturers, customers and other electronic suppliers are structured using a fixed amount per unit or a percentage of net sales, depending on the terms of the agreement. Current license and royalty agreements have duration periods which range from 1 to 12 years or continue in perpetuity. Certain agreements may be renewed at termination
8
of the agreement. The Company's license and royalty income is recorded upon sale and amounted to
$1,538
,
$1,669
and
$1,463
for the years ended
February 28, 2018
,
February 28, 2017
and
February 29, 2016
, respectively.
Distribution and Marketing
We sell our products to:
|
•
|
mass merchants,
|
|
•
|
regional chain stores,
|
|
•
|
e-commerce platforms,
|
|
•
|
premium department stores,
|
|
•
|
lifestyle retailers,
|
|
•
|
specialty and internet retailers,
|
|
•
|
power retailers
|
|
•
|
independent 12-volt retailers,
|
|
•
|
distributors,
|
|
•
|
new car dealers,
|
|
•
|
automotive and vehicle manufacturers,
|
|
•
|
automotive, vehicle and transportation equipment manufacturers (OEM's),
|
|
•
|
system integrators,
|
|
•
|
communication network providers,
|
|
•
|
smart grid manufacturers,
|
|
•
|
banks,
|
|
•
|
the U.S. military,
|
|
•
|
cinema operators,
|
|
•
|
sporting goods equipment retailers,
|
|
•
|
cell phone carriers,
|
|
•
|
public safety sector, and
|
|
•
|
private security providers.
|
We sell our products under OEM arrangements with domestic and/or international subsidiaries of automobile manufacturers such as Ford, Chrysler, General Motors, Toyota, Kia, Mazda, Subaru and Nissan. These arrangements require a close partnership with the customer as we develop products to meet specific requirements. OEM products accounted for approximately
15%
of net sales from continuing operations for the year ended
February 28, 2018
,
17%
for the year ended
February 28, 2017
, and
19%
for the year ended
February 29, 2016
.
Our five largest customers represented
26%
of net sales from continuing operations for the year ended
February 28, 2018
,
28%
for the year ended
February 28, 2017
, and
29%
for the year ended
February 29, 2016
. No one customer accounted for more than 10% of the Company's sales for the years ended
February 28, 2018
,
February 28, 2017
or
February 29, 2016
.
We also provide value-added management services, which include:
|
•
|
product design and development,
|
|
•
|
engineering and testing,
|
|
•
|
sales training and customer packaging,
|
|
•
|
in-store display design,
|
|
•
|
installation training and technical support,
|
|
•
|
product repair services and warranty,
|
|
•
|
consignment,
|
|
•
|
fulfillment,
|
|
•
|
warehousing, and
|
|
•
|
specialized manufacturing.
|
We have flexible shipping policies designed to meet customer needs. In the absence of specific customer instructions, we ship products within 24 to 48 hours from the receipt of an order from public warehouses, as well as owned and leased facilities throughout the United States, Canada, China, Hong Kong, Mexico, the Netherlands, and Germany. The Company also employs a direct ship model from our suppliers for select customers upon their request.
Product Development, Warranty and Customer Service
9
Our product development cycle includes:
|
•
|
identifying consumer trends and potential demand,
|
|
•
|
responding to those trends through product design and feature integration, which includes software design, electrical engineering, industrial design and pre-production testing. In the case of OEM customers, the product development cycle may also include product validation to customer quality standards, and
|
|
•
|
evaluating and testing new products in our own facilities to ensure compliance with our design specifications and standards.
|
Utilizing our company-owned and third-party facilities in the United States, Europe and Asia, we work closely with our suppliers throughout the product design, testing and development process in an effort to meet the expectations of consumer demand for technologically-advanced and high quality products. Our Troy, Michigan and Orlando, Florida facilities are ISO/TS 16949:2009, ISO 14001:2004 and/or ISO 9001:2008 certified, which requires the monitoring of quality standards in all facets of business.
We provide product warranties for all of our product lines, which primarily range from 30 days to three years. The Company also provides limited lifetime warranties for certain products, which limit the end-user's remedy to the repair or replacement of the defective product during it's lifetime, as well as warranties for certain vehicle security products for the life of the vehicle for the original owner. To support our warranties, we have independent warranty centers in the United States and Europe. Our customer service group, along with our Company websites, provides product information, answers questions and serves as a technical hotline for installation help for end-users and customers.
Suppliers
We work directly with our suppliers on industrial design, feature sets, product development and testing in order to ensure that our products and component parts meet our design specifications.
We purchase our products and component parts from manufacturers principally located in several Pacific Rim countries, including China, Hong Kong, Indonesia, Malaysia, Thailand, Vietnam, South Korea, Taiwan and Singapore, as well as the United States, Canada, Mexico and Europe. In selecting our manufacturers, we consider quality, price, service, reputation, financial stability, as well as labor practices, disruptions, or shortages. In order to provide coordination and supervision of supplier performance such as price negotiations, delivery and quality control, we maintain buying and inspection offices in China and Hong Kong. We consider relations with our suppliers to be good and alternative sources of supply are generally available within 120 days. We have few long-term contracts with our suppliers and we generally purchase our products under short-term purchase orders. Although we believe that alternative sources of supply are currently available, an unplanned shift to a new supplier could result in product delays and increased cost, which may have a material impact on our operations.
Competition
The electronics industry is highly competitive across all product categories, and we compete with a number of well-established companies that manufacture and sell similar products. Brand name, design, advancement of technology and features as well as price are the major competitive factors within the electronics industry. Our Automotive products compete against factory-supplied products, including those provided by, among others, General Motors, Ford and Chrysler, as well as against major companies in the automotive aftermarket, such as Sony, Panasonic, Kenwood, Directed Electronics, Autopage, Myron and Davis, Phillips, Insignia, and Pioneer. Our Premium Audio products compete against major companies such as Polk, Definitive, Bose, Sonos, Sonance, and Bowers and Wilkins. Our Consumer Accessories product lines compete against major companies such as Sony, Phillips, Emerson Radio, Jasco, Belkin and Private Label Brands.
Financial Information about Foreign and Domestic Operations
The amounts of net sales and long-lived assets, attributable to foreign and domestic operations for all periods presented are set forth in Note 13 of the Notes to Consolidated Financial Statements, included herein.
Equity Investment
We have a 50% non-controlling ownership interest in ASA Electronics, LLC ("ASA") which acts as a distributor of mobile electronics specifically designed for niche markets within the automotive industry, including: RV's; buses; and commercial, heavy duty, agricultural, construction, powersport, and marine vehicles.
10
Employees
As of
February 28, 2018
, we employed 972 people worldwide, of which 38 were covered under collective bargaining agreements. We consider our relations with employees to be good as of
February 28, 2018
.
We have identified certain risk factors that apply to us. Each of the following risk factors should be carefully considered, as well as all of the other information included or incorporated by reference in this Form 10-K. If any of these risks, or other risks not presently known to us or that we currently believe not to be significant, develop into actual events, then our business, financial condition, liquidity, or results of operations could be adversely affected. If that happens, the market price of our common stock would likely decline, and you may lose all or part of your investment.
The Automotive, Premium Audio and Consumer Accessories businesses are highly competitive and face significant competition from Original Equipment Manufacturers (OEMs) and direct imports by our retail customers.
The market for mobile electronics, premium audio products and consumer accessories is highly competitive across all product lines. We compete against many established companies, some of whom have substantially greater financial and engineering resources than we do. We compete directly with OEMs, including divisions of well-known automobile manufacturers, in the auto security, mobile video and accessories markets. We believe that OEMs have diversified and improved their product offerings and place increased sales pressure on new car dealers with whom they have close business relationships to purchase OEM-supplied equipment and accessories. To the extent that OEMs succeed in their efforts, this success would have a material adverse effect on our sales of automotive entertainment and security products to new car dealers. In addition, we compete with major retailers who may at any time choose to direct import products that we may currently supply.
OEM sales are dependent on the economic success of the automotive industry.
A portion of our OEM sales are to automobile manufacturers. In the past, some domestic OEM manufacturers have reorganized their operations as a result of general economic conditions. There is no guarantee that additional automobile manufacturers will not face similar reorganizations in the future. If additional reorganizations do take place and are not successful, it could have a material adverse effect on a portion of our OEM business.
Sales in our Automotive, Premium Audio and Consumer Accessories businesses are dependent on new products, product development and consumer acceptance.
Our Automotive, Premium Audio and Consumer Accessories businesses depend, to a large extent, on the introduction and availability of innovative products and technologies. If we are not able to continually introduce new products that achieve consumer acceptance, our sales and profit margins may decline.
The impact of future selling prices and technological advancements may cause price erosion and adversely impact our profitability and inventory value.
Since we do not manufacture all of our products and do not conduct a majority of our own research, we cannot assure you that we will be able to source technologically advanced products in order to remain competitive. Furthermore, the introduction or expected introduction of new products or technologies may depress sales of existing products and technologies. This may result in declining prices and inventory obsolescence. Since we maintain a substantial investment in product inventory, declining prices and inventory obsolescence could have a material adverse effect on our business and financial results.
Our estimates of excess and obsolete inventory may prove to be inaccurate, in which case the provision required for excess and obsolete inventory may be understated or overstated. Although we make every effort to ensure the accuracy of our forecasts of future product demand, any significant unanticipated changes in demand or technological developments could have a significant impact on the value of our inventory and operating results.
A commercial market for biometrics technology is still developing. There can be no assurance our iris-based identity authentication technology will be successful or achieve market acceptance.
11
A component of our strategy to grow revenue includes expansion of our iris-based identity authentication solutions into commercial markets. To date, biometrics technology has received only limited acceptance in such markets. Although the recent appearance of biometric readers on popular consumer products, such as smartphones, has increased interest in biometrics as a means of authenticating and/or identifying individuals, commercial markets for biometrics technology are in the process of developing and evolving. Biometrics-based solutions compete with more traditional security methods including keys, cards, personal identification numbers and security personnel. Acceptance of biometrics as an alternative to such traditional methods depends upon a number of factors including:
|
•
|
the cost, performance and reliability of our products and services and the products and services offered by our competitors;
|
|
•
|
the continued growth in demand for biometrics solutions within the government and law enforcement markets as well as the development and growth of demand for biometric solutions in markets outside of government and law enforcement;
|
|
•
|
customers’ perceptions regarding the benefits of biometrics solutions;
|
|
•
|
public perceptions regarding the intrusiveness of these solutions and the manner in which organizations use the biometric information collected;
|
|
•
|
public perceptions regarding the confidentiality of private information;
|
|
•
|
proposed or enacted legislation related to privacy of information;
|
|
•
|
customers’ satisfaction with biometrics solutions; and
|
|
•
|
marketing efforts and publicity regarding biometrics solutions.
|
We face intense competition from other biometrics solutions providers.
A significant number of established companies have developed or are developing and marketing software and hardware for biometrics products and applications, including facial recognition and fingerprint biometrics, that currently compete with or will compete directly with our iris-based identity authentication solutions. We believe that additional competitors will enter the biometrics market and become significant long-term competitors, and that, as a result, competition will increase. Companies competing with us may introduce solutions that are competitively priced, have increased performance or functionality or incorporate technological advances we have not yet developed or implemented.
There is no guarantee that patent/royalty rights will be renewed, or licensing agreements will be maintained.
Certain product development and revenues are dependent on the ownership and or use of various patents, licenses and license agreements. If the Company is not able to successfully renew or renegotiate these rights, we may suffer from a loss of product sales or royalty revenue associated with these rights or incur additional expense to pursue alternative arrangements.
A portion of our workforce is represented by labor unions. Collective bargaining agreements can increase our expenses. Labor disruptions could adversely affect our operations.
As of
February 28, 2018
, 38 of our full-time employees were covered by collective bargaining agreements. We cannot predict whether labor unions may be successful in organizing other portions of our workforce or what additional costs we could incur as a result.
We depend on our suppliers to provide us with adequate quantities of high quality competitive products and/or component parts on a timely basis.
We have few long-term contracts with our suppliers. Most of our products and component parts are imported from suppliers under short-term purchase orders. Accordingly, we can give no assurance that:
|
•
|
our supplier relationships will continue as presently in effect;
|
|
•
|
our suppliers will be able to obtain the components necessary to produce high-quality, technologically-advanced products for us;
|
|
•
|
we will be able to obtain adequate alternatives to our supply sources, should they be interrupted;
|
|
•
|
if obtained, alternatively sourced products of satisfactory quality would be delivered on a timely basis, competitively priced, comparably featured or acceptable to our customers;
|
|
•
|
our suppliers have sufficient financial resources to fulfill their obligations;
|
|
•
|
our suppliers will be able to obtain raw materials and labor necessary for production;
|
|
•
|
shipments from our suppliers will not be affected by labor disputes within the shipping and transportation industries;
|
|
•
|
our suppliers could be impacted by natural disasters directly or via their supply chains; and
|
|
•
|
as it relates to products we do not manufacture, our suppliers will not become our competitors.
|
12
On occasion, our suppliers have not been able to produce the quantities of products or component parts that we desire. Our inability to manufacture and/or supply sufficient quantities of products that are in demand could reduce our profitability and have a material adverse effect on our relationships with our customers. If any of our supplier relationships were terminated or interrupted, we could experience an immediate or long-term supply shortage, which could have a material adverse effect on our business.
We have few long-term sales contracts with our customers that contain guaranteed customer purchase commitments.
Sales of many of our products are made by purchase orders and are terminable at will by either party. We do have long-term sales contracts with certain customers; however, these contracts do not require the customers to guarantee specific levels of product purchases over the term of the contracts. The unexpected loss of all or a significant portion of sales to any one of our large customers could have a material adverse effect on our performance.
Our success will depend on a less diversified line of business.
Currently, we generate substantially all of our sales from the Automotive, Premium Audio and Consumer Accessories businesses. We cannot assure you that we can grow the revenues of our Automotive, Premium Audio and Consumer Accessories businesses or maintain profitability. As a result, the Company's revenues and profitability will depend on our ability to maintain and generate additional customers and develop new products. A reduction in demand for our existing products and services would have a material adverse effect on our business. The sustainability of current levels of our Automotive, Premium Audio and Consumer Accessories businesses and the future growth of such revenues, if any, will depend on, among other factors:
|
•
|
the overall performance of the economy and discretionary consumer spending,
|
|
•
|
competition within key markets,
|
|
•
|
customer acceptance of newly developed products and services, and
|
|
•
|
the demand for other products and services.
|
We cannot assure you that we will maintain or increase our current level of revenues or profits from the Automotive, Premium Audio and Consumer Accessories businesses in future periods.
We depend on a small number of key customers for a large percentage of our sales.
The electronics industry is characterized by a number of key customers. Specifically,
26%
of our sales from continuing operations were to five customers in Fiscal
2018
,
28%
in Fiscal
2017
, and
29%
in Fiscal
2016
. The loss of one or more of these customers could have a material adverse impact on our business.
We plan to continue to expand the international marketing and distribution of our products, which will subject us to risks associated with international operations, including exposure to foreign currency fluctuations.
As part of our business strategy, we intend to continue to increase our international sales, although we cannot assure you that we will be able to do so. Approximately
12%
of our net sales from continuing operations currently originate in markets outside the U.S. While geographic diversity helps to reduce the Company's exposure to risk in any one country or part of the world, it also means that we are subject to the full range of risks associated with significant international operations, including, but not limited to:
|
•
|
changes in exchange rates for foreign countries, which may reduce the U.S. dollar value of revenues, profits and cash flows we receive from non-U.S. markets or increase our supply costs, as measured in U.S. dollars, in those markets;
|
|
•
|
exchange controls and other limits on our ability to import raw materials or finished product or to repatriate earnings from overseas;
|
|
•
|
political and economic instability, social or labor unrest or changing macroeconomic conditions in our markets;
|
|
•
|
foreign ownership restrictions and the potential for nationalization or expropriation of property or other resources; and
|
|
•
|
other foreign or domestic legal and regulatory requirements, including those resulting in potentially adverse tax consequences or other imposition of onerous trade restrictions, price controls or other government controls.
|
These risks could have a significant impact on our ability to sell our products on a competitive basis in international markets and may have a material adverse effect on our results of operations, cash flows and financial condition.
In an effort to reduce the impact on earnings of foreign currency rate movements, we engage in a combination of cost-containment measures and selective hedging of foreign currency transactions. However, these measures may not succeed in offsetting any negative impact of foreign currency rate movements on our business and results of operations. For example, since 2010, Venezuela
13
has been designated as hyperinflationary and the resulting currency devaluations in Venezuela in that initial year affected our business and results of operations. The government of Venezuela has also devalued its currency several times since 2013, which has also affected our business and results of operations. Going forward, additional government actions, including further currency devaluations, foreign exchange price controls or political and social unrest in Venezuela could have further adverse impacts on the Company.
Substantial political and economic uncertainty in Venezuela puts our local assets at risk.
We have a subsidiary in Venezuela, whose operations are currently suspended due to the economic and political climate in that country. We hold fixed assets at this subsidiary and have incurred impairment charges related to our long-lived assets in Venezuela in the past. If conditions continue to deteriorate, we may be at risk of additional losses to our capital assets, including further declines in fair value or government confiscation of certain assets.
Conditions in the global economy, the geographic markets we serve, and the financial markets may adversely affect us.
Concerns persist regarding the lingering effects of the European debt crisis and the ability of certain Eurozone countries to meet future financial obligations; the overall stability of the Euro and the suitability of the Euro as a single currency, given the diverse economic and political circumstances within individual Eurozone countries; and the uncertainty relating to the British Pound Sterling, particularly in light of the United Kingdom's intended exit from the European Union and the uncertainties regarding the terms of such exit. There have also been concerns regarding slower growth in the Chinese economy and other Asian economies, as well as the economic effect of tensions in the relationship between China and surrounding Asian countries. These concerns or market perceptions regarding these and related issues could adversely affect the value of the Company's Euro-denominated assets and obligations. In addition, concerns over the effect of this financial crisis on financial institutions in Europe, China and globally could have an adverse impact on the economy generally, and more specifically on the consumers' demand for our products.
A decline in general economic conditions could lead to reduced consumer demand for the discretionary products we sell.
Consumer spending patterns, especially discretionary spending for products such as mobile, consumer and accessory electronics, are affected by, among other things, prevailing economic conditions, energy costs, raw material costs, wage rates, inflation, consumer confidence and consumer perception of economic conditions. A general slowdown in the U.S. and certain international economies or an uncertain economic outlook could have a material adverse effect on our sales and operating results.
Changes in the retail industry could have a material adverse effect on our business or financial condition.
In recent years, the retail industry has experienced consolidation, store closures, bankruptcies and other ownership changes. In the future, retailers in the United States and in foreign markets may further consolidate, undergo restructurings or reorganizations, or realign their affiliations, any of which could decrease the number of stores that carry our products. Changing shopping patterns, including the rapid expansion of online retail shopping, have adversely affected customer traffic in mall and outlet centers. We expect competition in the e-commerce market will intensify. As a greater portion of consumer expenditures with retailers occurs online and through mobile commerce applications, our brick-and-mortar wholesale customers who fail to successfully integrate their physical retail stores and digital retail may experience financial difficulties, including store closures, bankruptcies or liquidations. We cannot control the success of individual malls, and an increase in store closures by other retailers may lead to store vacancies and reduced foot traffic. A continuation or worsening of these trends could have a material adverse effect on our sales, results of operations, financial condition and cash flows.
We purchase a significant amount of our products from suppliers in Pacific Rim countries and we are subject to the economic risks associated with inherent changes in the social, political, regulatory and economic conditions not only in these countries, but also in other countries we do business in, including our own.
We import most of our products from suppliers in the Pacific Rim. Countries in the Pacific Rim have experienced significant social, political and economic upheaval over the past several years. Due to the large concentrations of our purchases in Pacific Rim countries, particularly China, Hong Kong, South Korea, Vietnam, Malaysia and Taiwan, any adverse changes in the social, political, regulatory and economic conditions in these countries may materially increase the cost of the products that we buy from our foreign suppliers or delay shipments of products, which could have a material adverse effect on our business. In addition, our dependence on foreign suppliers forces us to order products further in advance than we would if our products were manufactured domestically. This increases the risk that our products will become obsolete or face selling price reductions before we can sell our inventory.
14
President Donald J. Trump and his administration took office in the United States on January 20, 2017. President Trump has expressed apprehension toward existing trade agreements, suggesting renegotiation of The North American Free Trade Agreement and the implementation of tariffs, duties, border taxes or other similar assessments that could impact the level of trade between the U.S. and Mexico. The Trump Administration has also recently introduced tariffs on China, with China imposing retaliatory tariffs on certain products from the United States. President Trump has also publicly stated that he may seek to impose additional tariffs, duties, border taxes or other similar assessments on products imported from China and other countries. In addition, on January 23, 2017, President Trump signed a presidential memorandum to withdraw the U.S. from the Trans-Pacific Partnership. Such tariffs, duties, border taxes or other assessments imposed on the products we import into the United States will increase the total cost of these products and may decrease demand for such products. In addition, we may not be able to fully pass the added cost of such tariffs, taxes, duties or assessments on to our customers, which may adversely affect our business, financial condition and results of operations.
Our stock price could fluctuate significantly.
The market price of our common stock could fluctuate significantly in response to various factors and events, including:
|
•
|
operating results being below market expectations,
|
|
•
|
announcements of technological innovations or new products by us or our competitors,
|
|
•
|
loss of a major customer or supplier,
|
|
•
|
changes in, or our failure to meet, financial estimates by securities analysts,
|
|
•
|
industry developments,
|
|
•
|
economic and other external factors,
|
|
•
|
general downgrading of our industry sector by securities analysts,
|
|
•
|
inventory write-downs, and
|
|
•
|
ability to integrate acquisitions.
|
In addition, the securities markets have experienced significant price and volume fluctuations over the past several years that have often been unrelated to the operating performance of particular companies. These market fluctuations may also have a material adverse effect on the market price of our common stock.
We invest in marketable securities and other investments as part of our investing activities and from time to time, provide additional funding in the form of loans. These investments fluctuate in value based on economic, operational, competitive, political and technological factors. These investments could be subject to loss or impairment based on their performance and loan balances may become uncollectible.
The Company has, in the past, incurred other-than-temporary impairments on its investments and continues to monitor its investments in non-controlled corporations for potential future impairments. In addition, there is no guarantee that the fair values recorded for other investments will be sustained in the future. From time to time, the Company may also provide additional funding to investees in the form of loans, which are collateralized. Should the borrowers default on the loans and should the collateral be insufficient to satisfy the total outstanding balance owed to Voxx, we may not be able to recover 100% of these loan balances.
We are subject to governmental regulations.
We always face the possibility of new governmental regulations which could have a substantial effect on our operations and profitability. The Dodd-Frank Wall Street Reform and Consumer Protection Act contains provisions to improve transparency and accountability concerning the supply of certain minerals, known as “conflict minerals,” originating from the Democratic Republic of Congo and adjoining countries. There are costs associated with complying with these disclosure requirements, including for due diligence to determine the sources of conflict minerals used in our products and other potential changes to products, processes or sources of supply as a consequence of such verification activities. These rules could adversely affect the sourcing, supply and pricing of materials used in our products. As there may be only a limited number of suppliers offering "conflict free" conflict minerals, we cannot be sure that we will be able to obtain necessary conflict minerals from such suppliers in sufficient quantities or at competitive prices. Also, we may face reputational challenges if we determine that certain of our products contain minerals not determined to be conflict free or if we are unable to sufficiently verify the origins for all conflict minerals used in our products through the procedures we may implement.
The recently passed comprehensive tax reform bill could adversely affect our business and financial condition.
On December 22, 2017, President Trump signed into law the Tax Cuts and Jobs Act ("TCJA"). The TCJA contains significant changes to corporate taxation, including reduction of the corporate tax rate from a top marginal rate of 35% to a flat rate of 21%,
15
additional limitation on the tax deduction for interest expense and executive compensation, accelerates business asset expensing, eliminates net operating loss carrybacks, and makes significant changes to the taxation of foreign earnings including the imposition of a one-time repatriation tax on accumulated foreign earnings at reduced rates regardless of whether they are repatriated and imposes a minimum tax on global intangible low tax income (“GILTI”). At this stage, it is unclear how many U.S. states will incorporate these federal tax law changes or portions thereof into their tax codes. Further, our effective tax rate may fluctuate as a result of the TCJA in future reporting periods.
We continue to examine the impact these changes may have on our business. Notwithstanding the reduction in the corporate income tax rate, the overall impact of the TCJA is uncertain, and our results of operations, cash flows and financial conditions, as well as the trading price of our Common Stock, could be adversely affected.
We are increasingly dependent on the continuous and reliable operation of our information technology systems, and a disruption of these systems, resulting from cyber security attacks or other events, could adversely affect our business.
We increasingly depend on our information technology, or IT, infrastructure in order to achieve our business objectives. If we experience a problem that impairs this infrastructure, such as a computer virus, a problem with the functioning of an important IT application, or an intentional disruption of our IT systems by a third party, the resulting disruptions could impede our ability to record or process orders, manufacture and ship in a timely manner, or otherwise carry on our business in the ordinary course. Any such events could cause us to lose customers or revenue and could require us to incur significant expense to eliminate these problems and address related security concerns.
Computer viruses, malware, and other “hacking” programs and devices may cause significant damage, delays or interruptions to our systems and operations or to certain of the products we sell, resulting in damage to our reputation and brand names. They may also attack our infrastructure, industrial machinery, software or hardware causing significant damage, delays or other service interruptions to our systems and operations. “Hacking” involves efforts to gain unauthorized access to information or systems or to cause intentional malfunctions, loss or corruption of data, software, hardware or other computer equipment. In addition, increasingly sophisticated malware may target real-world infrastructure or product components, including certain of the products that we currently or may in the future sell by attacking, disrupting, reconfiguring and/or reprogramming industrial control software. We may incur significant costs to protect our systems and equipment against the threat of, and to repair any damage caused by, computer viruses and hacking. Moreover, if a computer virus or hacking affects our systems or products, our reputation and brand names could be materially damaged and use of our products may decrease.
A data privacy breach or failure to comply with data privacy laws could damage our reputation and customer relationships, expose us to litigation risk and potential fines and adversely affect our business.
As part of our normal operations, we collect, process, transmit and where appropriate, retain certain confidential employee and customer information, including credit card information. There is significant concern by consumers and employees over the security of personal information, consumer identity theft and user privacy. Despite the security measures we have in place, our facilities and systems, and those of our third party service providers, may be vulnerable to security breaches, cyber-attacks, acts of vandalism, computer viruses, misplaced or lost data, programming and/or human errors, or other similar events. As a result of recent security breaches at a number of prominent companies, the media and public scrutiny of information security and privacy has become more intense and the regulatory environment has become more uncertain. Any security breach involving the misappropriation, loss or other unauthorized disclosure of confidential information, whether by us or our vendors, could result in significant legal and remediation expenses, severely damage our reputation and our customer relationships, harm sales, expose us to risks of litigation and liability and result in a material adverse effect on our business, financial condition and results of operations. Additionally, changing privacy laws in the United States, Europe and elsewhere, including the adoption by the European Union of the General Data Protection Regulation (“GDPR”), which becomes effective May 2018, creates new individual privacy rights and imposes increased obligations on companies handling personal data. Consequently, we may incur significant costs related to prevention and to comply with laws regarding the protection and unauthorized disclosure of personal information. A failure to comply with the stringent rules of the GDPR could result in fines of up to €20 million.
We are responsible for product warranties and defects.
Whether we outsource manufacturing or manufacture products directly for our customers, we provide warranties for all of our products for which we have provided an estimated liability. Therefore, we are highly dependent on the quality of our suppliers’ products.
If we experience an increase in warranty claims, or if our costs associated with such warranty claims increase significantly, we will begin to incur liabilities for potential warranty claims after the sale of our products at levels that we have not previously
16
incurred or anticipated. In addition, an increase in the frequency of our warranty claims or amount of warranty costs may harm our reputation and could have a material adverse effect on our financial condition and results of operations.
We must comply with restrictive covenants in our debt agreements.
Our existing debt agreements contain a number of covenants, which limit our ability to, among other things, borrow additional money, pay dividends, dispose of assets and acquire new businesses. These covenants also require us to maintain a specified fixed charge coverage ratio. If the Company is unable to comply with these covenants, there would be a default under these debt agreements, should we have debt outstanding. Changes in economic or business conditions, results of operations or other factors could cause the Company to default under its debt agreements. A default, if not waived by our lenders, could result in acceleration of our debt and possible bankruptcy.
We may be unable to collect amounts owed to us by our customers.
We typically grant our customers credit on a short-term basis. Related credit risks are inherent as we do not typically collateralize receivables due from customers. We provide estimates for uncollectible accounts based primarily on our judgment using historical losses, current economic conditions and individual evaluations of each customer as evidence supporting the receivables valuations stated on our financial statements. However, our receivables valuation estimates may not be accurate and receivables due from customers reflected in our financial statements may not be collectible. Our inability to perform under our contractual obligations, or our customers’ inability or unwillingness to fulfill their contractual commitments to us, may have a material adverse effect on our financial condition, results of operations and cash flows.
We provide financial support to one of our subsidiaries through an intercompany loan agreement and may need to secure additional financing for our own operations, but we cannot be sure that additional financing will be available.
We have entered into intercompany loan agreements with our majority owned subsidiary, EyeLock LLC, which is expected to continue to require additional funding beyond one year. In funding the loans to EyeLock LLC, we have less cash flow available to support our domestic operations and other activities. If we are unable to generate sufficient cash flows in the future to support our operations and service our debt as a result of funding EyeLock LLC, we may be required to refinance all or a portion of our existing debt, as applicable, or to obtain additional financing. There can be no assurance that any refinancing will be possible or that any additional financing could be obtained on acceptable terms. The inability to service or refinance our existing debt or to obtain additional financing would have a material adverse effect on our financial position, liquidity, and results of operations.
Our capital resources may not be sufficient to meet our future capital and liquidity requirements.
We believe our current funds and available credit lines would provide sufficient resources to fund our existing operations for the foreseeable future. However, we may need additional capital to operate our business if:
|
•
|
market conditions change,
|
|
•
|
our business plans or assumptions change,
|
|
•
|
we make significant acquisitions,
|
|
•
|
we need to make significant increases in capital expenditures or working capital,
|
|
•
|
our restrictive covenants do not provide sufficient credit, or
|
|
•
|
we need to continue to provide financial support to EyeLock LLC for an extended period of time.
|
We have recorded, or may record in the future, goodwill and other intangible assets as a result of acquisitions, and changes in future business conditions could cause these investments to become impaired, requiring substantial write-downs that would reduce our operating income.
We evaluate the recoverability of recorded goodwill and other intangible asset amounts annually, or when evidence of potential impairment exists. The annual impairment test is based on several factors requiring judgment. Changes in our operating performance, business conditions, or restrictions on our field of use resulted in an impairment of certain intangible assets in Fiscal 2016, and could result in additional future impairments, which could be material to our results of operations.
Our cash and cash equivalents could be adversely affected if the financial institutions in which we hold our cash and cash equivalents fail.
17
Our cash and cash equivalents consist of demand deposits and highly liquid money market funds with original maturities of three months or less at the time of purchase. We maintain the cash and cash equivalents with major financial institutions. Some deposits with these banks exceed the Federal Deposit Insurance Corporation ("FDIC") insurance limits or similar limits in foreign jurisdictions. While we monitor daily the cash balances in the operating accounts and adjust the balances as appropriate, these balances could be impacted if one or more of the financial institutions with which we deposit fails or is subject to other adverse conditions in the financial or credit markets. To date, we have experienced no loss or lack of access to our invested cash or cash equivalents; however, we can provide no assurance that access to our invested cash and cash equivalents will not be impacted by adverse conditions in the financial and credit markets.
If our sales during the holiday season fall below our expectations, our annual results could also fall below expectations.
Seasonal consumer shopping patterns significantly affect our business. We generally make a substantial amount of our sales and net income during September, October and November. We expect this trend to continue. December is also a key month for us, due largely to the increase in promotional activities by our customers during the holiday season. If the economy faltered in these periods, if our customers altered the timing or frequency of their promotional activities or if the effectiveness of these promotional activities declined, particularly around the holiday season, it could have a material adverse effect on our annual financial results.
Our business could be affected by weather-related factors.
Our results of operations may be adversely affected by weather-related factors. Severe winter weather conditions may deter or prevent patrons from reaching facilities where our products are sold. Although our budget assumes certain seasonal fluctuations in our revenues to ensure adequate cash flow during expected periods of lower revenues, we cannot ensure that weather-related factors will not have a material adverse effect on our operations.
Our products could infringe the intellectual property rights of others and we may be exposed to costly litigation.
The products we sell are continually changing as a result of improved technology. Although we and our suppliers attempt to avoid infringing known proprietary rights of third parties in our products, we may be subject to legal proceedings and claims for alleged infringement by us, our suppliers or our distributors, or of a third party’s patents, trade secrets, trademarks or copyrights.
Any claims relating to the infringement of third-party proprietary rights, even if not meritorious, could result in costly litigation, divert management’s attention and resources, or require us to either enter into royalty or license agreements which are not advantageous to us or pay material amounts of damages. In addition, parties making these claims may be able to obtain an injunction, which could prevent us from selling our products. We may increasingly be subject to infringement claims as we expand our product offerings.
Acquisitions and strategic investments may divert our resources and management attention; results may fall short of expectations.
We intend to continue pursuing selected acquisitions of and investments in businesses, technologies and product lines as a key component of our growth strategy. Any future acquisition or investment may result in the use of significant amounts of cash, potentially dilutive issuances of equity securities, or the incurrence of debt and amortization expenses related to intangible assets. Acquisitions involve numerous risks, including:
|
•
|
difficulties in the integration and assimilation of the operations, technologies, products and personnel of an acquired business;
|
|
•
|
diversion of management’s attention from other business concerns;
|
|
•
|
increased expenses associated with the acquisition, and
|
|
•
|
potential loss of key employees or customers of any acquired business.
|
We cannot assure you that our acquisitions will be successful and will not adversely affect our business, results of operations or financial condition.
We depend heavily on existing directors, management and key personnel and our ability to recruit and retain qualified personnel.
Our success depends on the continued efforts of our directors, executives and senior vice presidents, many of whom have worked with VOXX International Corporation for several decades, as well as our other executive officers and key employees. We have employment contracts with most of our executive officers. The loss or interruption of the continued full-time service of certain of our executive officers and key employees could have a material adverse effect on our business.
18
In addition, to support our continued growth, we must effectively recruit, develop and retain additional qualified personnel both domestically and internationally. Our inability to attract and retain necessary qualified personnel could have a material adverse effect on our business.
John J. Shalam, our Chairman, controls a significant portion of the voting power of our common stock and can exercise control over our affairs
.
Mr. Shalam beneficially owns approximately 52% of the combined voting power of both classes of common stock. This will allow him to elect the majority of our Board of Directors and, in general, determine the outcome of any other matter submitted to the stockholders for approval. Mr. Shalam's voting power may have the effect of delaying or preventing a change in control of the Company.
We have two classes of common stock: Class A common stock is traded on the Nasdaq Stock Market under the symbol VOXX and Class B common stock, which is not publicly traded and substantially all of which is beneficially owned by Mr. Shalam. Each share of Class A common stock is entitled to one vote per share and each share of Class B common stock is entitled to ten votes per share. Class A shareholders vote separately for the election/removal of the Class A directors, while both classes vote together as a single class on all other matters and as otherwise may be required by Delaware law. Since our charter permits shareholder action by written consent, Mr. Shalam may be able to take significant corporate actions without prior notice and a shareholder meeting.
We exercise our option for the "controlled company" exemption under NASDAQ rules.
The Company has exercised its right to the "controlled company" exemption under NASDAQ rules which enables us to forego certain NASDAQ requirements which include: (i) maintaining a majority of independent directors; (ii) electing a nominating committee composed solely of independent directors; (iii) ensuring the compensation of our executive officers is determined by a majority of independent directors or a compensation committee composed solely of independent directors; and (iv) selecting, or recommending for the Board's selection, director nominees, either by a majority of the independent directors or a nominating committee composed solely of independent directors. Although we do not maintain a nominating committee and do not have a majority of independent directors, the Company notes that at the present time we do maintain a compensation committee comprised solely of independent directors who approve executive compensation, and the recommendations for director nominees are governed by a majority of independent directors. However, election of the "controlled company" exemption under NASDAQ rules allows us to modify our position at any time.
Other Risks
Other risks and uncertainties include:
|
•
|
additional changes in U.S. federal, state and local law,
|
|
•
|
our ability to implement operating cost structures that align with revenue growth,
|
|
•
|
additional trade sanctions against or for foreign countries,
|
|
•
|
successful integration of business acquisitions and new brands in our distribution network,
|
|
•
|
compliance with the Sarbanes-Oxley Act, and
|
|
•
|
compliance with complex financial accounting and tax standards, both foreign and domestic.
|
As of the filing of this annual report on Form 10-K, there were no unresolved comments from the staff of the Securities and Exchange Commission.
Our Corporate headquarters is located at 2351 J. Lawson Blvd. in Orlando, Florida. In addition, as of
February 28, 2018
, the Company leased a total of 14 operating facilities or offices located in 7 states as well as China, Canada, Mexico, and Hong Kong. The leases have been classified as operating leases. Within the United States, these facilities are located in Georgia, New York, Ohio, New Jersey, Texas, Arkansas and Michigan. The Company also owns 8 of its operating facilities or offices located in New York, Indiana, Florida, and Arkansas in the United States, as well as in Germany and Venezuela. These facilities serve as offices, warehouses, manufacturing facilities and distribution centers. Additionally, we utilize public warehouse facilities located in Virginia, Nevada, Indiana, Florida, Mexico, China, the Netherlands, Germany and Canada.
19
The Company is currently, and has in the past, been a party to various routine legal proceedings incident to the ordinary course of business. If management determines, based on the underlying facts and circumstances, that it is probable a loss will result from a litigation contingency and the amount of the loss can be reasonably estimated, the estimated loss is accrued for. The Company does not believe that any of its outstanding litigation matters will have a material adverse effect on the Company's financial statements, individually or in the aggregate.
The products the Company sells are continually changing as a result of improved technology. As a result, although the Company and its suppliers attempt to avoid infringing known proprietary rights, the Company may be subject to legal proceedings and claims for alleged infringement by patent, trademark or other intellectual property owners. Any claims relating to the infringement of third-party proprietary rights, even if not meritorious, could result in costly litigation, divert management’s attention and resources, or require the Company to either enter into royalty or license agreements which are not advantageous to the Company, or pay material amounts of damages.
None
20
Market Information
The Class A Common Stock of Voxx is traded on the Nasdaq Stock Market under the symbol "VOXX." The following table sets forth the low and high sale price of our Class A Common Stock, based on the last daily sale in each of the last eight fiscal quarters:
|
Year ended February 28, 2018
|
High
|
Low
|
||||||
|
First Quarter
|
$
|
7.30
|
|
$
|
4.50
|
|
||
|
Second Quarter
|
8.90
|
|
6.00
|
|
||||
|
Third Quarter
|
8.70
|
|
6.30
|
|
||||
|
Fourth Quarter
|
6.85
|
|
5.15
|
|
||||
|
Year ended February 28, 2017
|
High
|
Low
|
||||||
|
First Quarter
|
$
|
4.92
|
|
$
|
2.97
|
|
||
|
Second Quarter
|
3.36
|
|
2.53
|
|
||||
|
Third Quarter
|
5.70
|
|
2.50
|
|
||||
|
Fourth Quarter
|
5.30
|
|
4.15
|
|
||||
Dividends
We have not paid or declared any cash dividends on our common stock. We have retained, and currently anticipate that we will continue to retain, all of our earnings for use in developing our business. Future cash dividends, if any, will be paid at the discretion of our Board of Directors and will depend, among other things, upon our future operations and earnings, capital requirements and surplus, general financial condition, contractual restrictions and such other factors as our Board of Directors may deem relevant giving consideration to any requirements or restrictions under the Company's credit agreement (see Note 7(a) to the Notes to the Consolidated Financial Statements).
Holders
There are 748 holders of record of our Class A Common Stock and 4 holders of Class B Convertible Common Stock.
Issuer Purchases of Equity Securities
In May 1999, we were authorized by the Board of Directors to repurchase up to 1,563,000 shares of Class A Common Stock in the open market under a share repurchase program (the "Program"). In July 2006, the Board of Directors authorized an additional repurchase up to 2,000,000 shares of Class A Common Stock in the open market in connection with the Program. During the year ended
February 28, 2018
, the Company did not purchase any shares. As of
February 28, 2018
, the cumulative total of acquired shares (net of reissuances of
11,635
) pursuant to the program was
2,168,094
, with a cumulative value of
$21,176
. The remaining authorized share repurchase balance is
1,383,271
at
February 28, 2018
.
Performance Graph
The following table compares the annual percentage change in our cumulative total stockholder return on our Class A common stock during a period commencing on February 28, 2013 and ending on
February 28, 2018
with the cumulative total return of the Nasdaq Stock Market (U.S.) Index and our SIC Code Index, during such period.
21
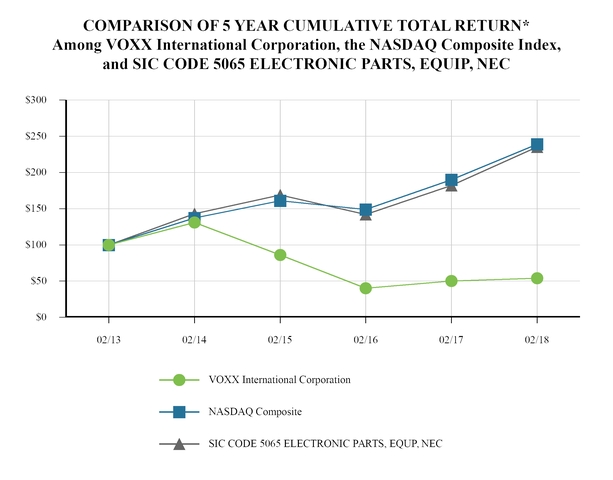
*$100 invested on 2/28/13 in stock or index, including reinvestment of dividends.
22
The following selected consolidated financial data for the last five years should be read in conjunction with the consolidated financial statements and related notes and "Management's Discussion and Analysis of Financial Condition and Results of Operations" of this Form 10-K. The Company's financial statements for the prior periods presented herein have been recast to reflect a certain business that was classified as discontinued operations during the second quarter of Fiscal 2018. See Note 2 of the Notes to the Consolidated Financial Statements for additional information.
|
Year
Ended
|
Year
Ended
|
Year
Ended
|
Year
Ended
|
Year
Ended
|
|||||||||||||||
|
February 28, 2018
|
February 28, 2017
|
February 29, 2016 (1)
|
February 28, 2015 (2)
|
February 28, 2014 (3)
|
|||||||||||||||
|
Consolidated Statement of Operations Data
|
|
|
|
|
|
||||||||||||||
|
Net sales
|
$
|
507,092
|
|
$
|
514,530
|
|
$
|
530,206
|
|
$
|
585,360
|
|
$
|
640,084
|
|
||||
|
Operating (loss) income
|
(19,099
|
)
|
(8,168
|
)
|
(17,067
|
)
|
8,604
|
|
(38,265
|
)
|
|||||||||
|
Net loss from continuing operations
|
(6,659
|
)
|
(9,268
|
)
|
(10,821
|
)
|
(7,087
|
)
|
(31,541
|
)
|
|||||||||
|
Net income from discontinued operations, net of taxes
|
34,618
|
|
6,066
|
|
4,758
|
|
6,145
|
|
4,944
|
|
|||||||||
|
Net income (loss) attributable to VOXX International Corporation
|
35,304
|
|
4,422
|
|
(2,682
|
)
|
(942
|
)
|
(26,597
|
)
|
|||||||||
|
Earnings (loss) per share - basic:
|
|||||||||||||||||||
|
Continuing operations
|
$
|
0.03
|
|
$
|
(0.07
|
)
|
$
|
(0.31
|
)
|
$
|
(0.29
|
)
|
$
|
(1.31
|
)
|
||||
|
Discontinued operations
|
$
|
1.43
|
|
$
|
0.25
|
|
$
|
0.20
|
|
$
|
0.25
|
|
$
|
0.21
|
|
||||
|
Attributable to VOXX International Corporation
|
$
|
1.45
|
|
$
|
0.18
|
|
$
|
(0.11
|
)
|
$
|
(0.04
|
)
|
$
|
(1.10
|
)
|
||||
|
Earnings (loss) per share - diluted:
|
|||||||||||||||||||
|
Continuing operations
|
$
|
0.03
|
|
$
|
(0.07
|
)
|
$
|
(0.31
|
)
|
$
|
(0.29
|
)
|
$
|
(1.31
|
)
|
||||
|
Discontinued operations
|
$
|
1.41
|
|
$
|
0.25
|
|
$
|
0.20
|
|
$
|
0.25
|
|
$
|
0.21
|
|
||||
|
Attributable to VOXX International Corporation
|
$
|
1.44
|
|
$
|
0.18
|
|
$
|
(0.11
|
)
|
$
|
(0.04
|
)
|
$
|
(1.10
|
)
|
||||
|
|
As of
|
As of
|
As of
|
As of
|
As of
|
||||||||||||||
|
|
February 28,
|
February 28,
|
February 29,
|
February 28,
|
February 28,
|
||||||||||||||
|
|
2018
|
2017
|
2016 (1)
|
2015 (2)
|
2014 (3)
|
||||||||||||||
|
Consolidated Balance Sheet Data
|
|
|
|
|
|
|
|
|
|
|
|||||||||
|
Total assets
|
$
|
575,644
|
|
$
|
668,486
|
|
$
|
667,190
|
|
$
|
677,513
|
|
$
|
747,150
|
|
||||
|
Working capital
|
170,472
|
|
143,281
|
|
132,167
|
|
154,312
|
|
179,077
|
|
|||||||||
|
Long-term obligations (4)
|
30,139
|
|
147,104
|
|
139,412
|
|
133,970
|
|
170,786
|
|
|||||||||
|
Stockholders' equity
|
450,118
|
|
391,315
|
|
395,894
|
|
396,140
|
|
429,584
|
|
|||||||||
|
(1)
|
Fiscal 2016 amounts reflect the acquisition of a controlling interest in all of the assets and certain liabilities of EyeLock Inc. and EyeLock Corporation (see Note 2 of the Notes to Consolidated Financial Statements), as well as intangible asset impairment charges.
|
|
(2)
|
Fiscal 2015 amounts include Venezuela currency devaluation and impairment charges related to Venezuela investment properties.
|
23
|
(3)
|
Fiscal 2014 amounts include a goodwill impairment charge, as well as impairment charges related to intangible and long-lived assets.
|
|
(4)
|
Long-term obligations include long-term debt, capital lease obligations, deferred compensation, deferred and other tax liabilities, as well as other long-term liabilities.
|
This section should be read in conjunction with the "Cautionary Statements" and "Risk Factors" in Item 1A of Part I, and Item 8 of Part II, "Consolidated Financial Statements and Supplementary Data."
We begin Management’s Discussion and Analysis of Financial Condition and Results of Operations with an overview of the business, including our strategy to give the reader a summary of the goals of our business and the direction in which our business is moving. This is followed by a discussion of the Critical Accounting Policies and Estimates that we believe are important to understanding the assumptions and judgments incorporated in our reported financial results. In the next section, we discuss our Results of Operations for the year ended
February 28, 2018
compared to the years ended
February 28, 2017
and
February 29, 2016
. Next, we present adjusted EBITDA and diluted adjusted EBITDA per common share for the year ended
February 28, 2018
compared to the years ended
February 28, 2017
and
February 29, 2016
in order to provide a useful and appropriate supplemental measure of our performance. We then provide an analysis of changes in our balance sheet and cash flows and discuss our financial commitments in the sections entitled "Liquidity and Capital Resources." We conclude this MD&A with a discussion of "Related Party Transactions" and "Recent Accounting Pronouncements."
Business Overview and Strategy
VOXX International Corporation ("Voxx," "We," "Our," "Us," or the "Company") is a leading international distributor, manufacturer and value-added service provider in the automotive, premium audio and consumer accessory industries. We conduct our business through sixteen wholly-owned subsidiaries and one majority owned subsidiary. Voxx has a broad portfolio of brand names used to market our products as well as private labels through a large domestic and international distribution network. We also function as an OEM ("Original Equipment Manufacturer") supplier to several customers, as well as market a number of products under exclusive distribution agreements.
In recent years, we have focused on our intention to acquire synergistic businesses with the addition of several new subsidiaries. These subsidiaries have helped us to expand our core business and broaden our presence in the accessory and OEM markets. Our acquisitions of Klipsch and Invision provided the opportunity to enter the manufacturing arena, and our acquisition of a controlling interest in EyeLock Inc. and EyeLock Corporation has allowed us to enter the growing and innovative biometrics market. Our intention is to continue to pursue business opportunities which will allow us to further expand our business model while leveraging overhead and exploring specialized niche markets in the electronics industry. Notwithstanding the above acquisitions, if the appropriate opportunity arises, the Company has been willing to explore the potential divestiture of a product line or business, such as with the sale of the Company's Hirschmann subsidiary on August 31, 2017.
The Company aligns its subsidiaries in three operating and reporting segments, based upon our products and internal organizational structure. The operating and reporting segments consist of the Automotive, Premium Audio and Consumer Accessories segments. The characteristics of our operations that are relied on in making and reviewing business decisions within these segments include the similarities in our products, the commonality of our customers, suppliers and product developers across multiple brands, our unified marketing and distribution strategy, our centralized inventory management and logistics, and the nature of the financial information used by our Chief Operating Decision Maker ("CODM"). The CODM reviews the financial results of the Company based on the performance of the Automotive, Premium Audio and Consumer Accessories groups.
The Company’s domestic and international business is subject to retail industry trends and conditions and the sales of new and used vehicles. Recent worldwide economic conditions have had an adverse impact on consumer spending. If the global macroeconomic environment does not continue to improve or if it deteriorates further, this could have a negative effect on the Company’s revenues and earnings. In an attempt to offset the recent market conditions, the Company continues to explore strategies and alternatives to reduce its operating expenses, such as the consolidation of facilities and IT systems, and has been introducing new products to obtain a greater market share. The Company continues to focus on cash flow and anticipates having sufficient resources to operate during Fiscal
2019
.
Although we believe our product groups have expanding market opportunities, there are certain levels of volatility related to domestic and international markets, new car sales, increased competition by manufacturers, private labels, technological advancements, discretionary consumer spending and general economic conditions. Also, all of our products are subject to price fluctuations which could affect the carrying value of inventories and gross margins in the future.
24
Acquisitions and Dispositions
We have acquired and integrated several businesses, as well as divested certain businesses, the most recent of which are outlined in the
Acquisitions and Dispositions
section of Part I and presented in detail in Note
2
to the Notes to the Consolidated Financial Statements.
Net Sales Growth
Net sales from continuing operations over a five-year period have
decreased
(20.8)%
from
$640,084
for the year ended
February 28, 2014
to
$507,092
for the year ended
February 28, 2018
. During this period, our sales were adversely impacted by the following items:
|
•
|
Volatility in core Automotive, Premium Audio and Consumer Accessories sales due to increased competition, lower selling prices, changes in technology and demand, and the volatility of the national and global economy;
|
|
•
|
the discontinuance and reduction of various high volume/low margin product lines such as camcorders, clock radios, digital players, digital voice recorders, and portable DVD players;
|
|
•
|
the sale of certain branded product inventory of the Company to a third party in order to license the brand name for a commission;
|
|
•
|
political and economic volatility in Venezuela; and
|
|
•
|
Euro devaluation against the U.S. Dollar.
|
These items were partially offset by:
|
•
|
the introduction of new products and lines across the Automotive, Premium Audio and Consumer Accessories segments, such as: mobile multi-media devices; various Bluetooth and wireless speaker products; neckband, on-ear, in-ear and over-ear headphones; mobile iPad and iPod interfaces; and nursery products.
|
Critical Accounting Policies and Estimates
General
Our consolidated financial statements are prepared in conformity with accounting principles generally accepted in the United States of America. The preparation of these financial statements requires us to make certain estimates, judgments and assumptions that we believe are reasonable based upon the information available. These estimates and assumptions can be subjective and complex and may affect the reported amounts of assets and liabilities, revenues and expenses reported in those financial statements. As a result, actual results could differ from such estimates and assumptions. The significant accounting policies and estimates which we believe are the most critical in fully understanding and evaluating the reported consolidated financial results include the following:
Revenue Recognition
We recognize revenue from product sales at the time title and risk of loss passes to the customer either at FOB Shipping Point or FOB Destination, based upon terms established with the customer. Any customer acceptance provisions, which are related to product testing, are satisfied prior to revenue recognition. We have no further obligations subsequent to revenue recognition except for returns of product from customers. We accept returns of products only if properly requested, authorized and approved. We continuously monitor and track such product returns and record the provision for the estimated amount of such future returns at point of sale, based on historical experience.
Sales Incentives
We offer sales incentives to our customers in the form of (1) co-operative advertising allowances; (2) market development funds; (3) volume incentive rebates; and (4) other trade allowances. We account for sales incentives in accordance with ASC 605-50 "Customer Payments and Incentives" ("ASC 605-50"). Except for other trade allowances, all sales incentives require the customer to purchase our products during a specified period of time. All sales incentives require customers to claim the sales incentive within a certain time period (referred to as the "claim period"). All costs associated with sales incentives are classified as a reduction of net sales.
25
The accrual balance for sales incentives at
February 28, 2018
and
February 28, 2017
was
$14,020
and
$13,154
, respectively. Although we make our best estimate of sales incentive liabilities, many factors, including significant unanticipated changes in the purchasing volume and the lack of claims from customers could have a significant impact on the liability for sales incentives and reported operating results.
Unearned sales incentives are volume incentive rebates where the customer did not purchase the required minimum quantities of product during the specified time. Volume incentive rebates are reversed into income in the period when the customer did not reach the required minimum purchases of product during the specified time. Unclaimed sales incentives are sales incentives earned by the customer, but the customer has not claimed payment within the claim period (period after program has ended). Unclaimed sales incentives are investigated in a timely manner after the end of the program and reversed if deemed appropriate.
Accounts Receivable
We perform ongoing credit evaluations of our customers and adjust credit limits based upon payment history and current credit worthiness, as determined by a review of current credit information. We continuously monitor collections from our customers and maintain a provision for estimated credit losses based upon historical experience and any specific customer collection issues that have been identified. While such credit losses have historically been within management's expectations and the provisions established, we cannot guarantee that we will continue to experience the same credit loss rates that have been experienced in the past. Since our accounts receivable are concentrated in a relatively few number of large customers, a significant change in the liquidity or financial position of any one of these customers could have a material adverse impact on the collectability of accounts receivable and our results of operations.
The Company has supply chain financing agreements and factoring agreements with certain financial institutions for the purpose of accelerating receivable collection and better managing cash flow. Under the agreements, the Company has agreed to sell certain of its accounts receivable balances to these institutions, who have agreed to advance amounts equal to the net accounts receivable balances due, less a discount as set forth in the respective agreements. The balances under these agreements are accounted for as sales of accounts receivable, as they are sold without recourse. Cash proceeds from these agreements are reflected as operating activities included in the change in accounts receivable in the Company's Consolidated Statements of Cash Flows. Total balances sold, net of discounts, for the years ended
February 28, 2018
,
February 28, 2017
and
February 29, 2016
were approximately
$142,000
,
$141,000
and
$154,000
, respectively. Fees incurred in connection with the agreements totaled
$957
,
$877
and
$770
for the years ended
February 28, 2018
,
February 28, 2017
and
February 29, 2016
, respectively, and are recorded as interest expense by the Company.
Inventory
We value our inventory at the lower of the actual cost to purchase or the net realizable value of the inventory. Net realizable value is defined as estimated selling prices, less cost of completion, disposal, and transportation. We regularly review inventory quantities on-hand and record a provision in cost of sales for excess and obsolete inventory based primarily on selling prices, indications from customers based upon current price negotiations, and purchase orders. The cost of the inventory is determined primarily on a weighted moving average basis, with a portion valued at standard cost, which approximates actual costs on the first in, first out basis. Our industry is characterized by rapid technological change and frequent new product introductions that could result in an increase in the amount of obsolete inventory quantities on-hand. In addition, and as necessary, specific reserves for future known or anticipated events may be established. During the years ended
February 28, 2018
,
February 28, 2017
and
February 29, 2016
, we recorded inventory write-downs of
$2,733
,
$1,987
and
$1,008
, respectively.
Estimates of excess and obsolete inventory may prove to be inaccurate, in which case we may have understated or overstated the provision required for excess and obsolete inventory. Although we make every effort to ensure the accuracy of our forecasts of future product demand, any significant unanticipated changes in demand or technological developments could have a significant impact on the carrying value of inventory and our results of operations.
Asset Impairments
As of
February 28, 2018
, intangible assets totaled
$150,320
and property, plant and equipment totaled
$61,717
(excluding Venezuelan investment properties of
$3,542
, which are discussed below). Management makes estimates and assumptions in preparing the consolidated financial statements for which actual results will emerge over long periods of time. This includes the recoverability of long-lived assets employed in the business, including assets of acquired businesses. These estimates and assumptions are closely monitored by management and periodically adjusted as circumstances warrant. For instance, expected asset lives may be shortened or an impairment recorded based upon a change in the expected use of the asset or performance of
26
the related asset group. At the present time, management intends to continue the development, marketing and selling of products associated with its intangible assets, and there are no known restrictions on the continuation of their use.
Certain indefinite lived trademarks were impaired during the second and fourth quarter of Fiscal 2016, resulting in impairment charges of
$6,210
and
$2,860
, respectively. No impairment losses were recorded related to indefinite lived intangible assets during Fiscal 2018 and Fiscal 2017.
The cost of other intangible assets with definite lives and long-lived assets are amortized on a straight-line basis over their respective lives. Management has determined that the current lives of these assets are appropriate. Management has determined that there were no indicators of impairment that would cause the carrying values related to intangible assets with definite lives to exceed their expected future cash flows at
February 28, 2018
.
Approximately 52.7% of our indefinite-lived trademarks ($53,444) are at risk of impairment as of
February 28, 2018
. The Company uses an income approach, based on the relief from royalty method, to value the indefinite-lived trademarks as part of its impairment test. This impairment test involves the use of accounting estimates and assumptions, changes in which could materially impact our financial condition or operating performance if actual results differ from such estimates and assumptions. The critical assumptions in the discounted cash flow model include revenues, long-term growth rates, royalty rates, and discount rates. Management exercises judgment in developing these assumptions. Certain of these assumptions are based upon industry projections, facts specific to the trademarks and consideration of our long-term view for the trademark and the markets we operate in. If we were to experience sales declines, a significant change in operating margins which may impact estimated royalty rates, an increase in our discount rates, and/or a decrease in our projected long-term growth rates, there would be an increased risk of impairment of these indefinite-lived trademarks.
Voxx’s goodwill totaled
$54,785
as of
February 28, 2018
. Goodwill is tested for impairment as of the last day of each fiscal year at the reporting unit level. Application of the goodwill impairment test requires judgment, including the identification of reporting units, assignment of assets and liabilities to reporting units, assignment of goodwill to reporting units, and estimation of the fair value of each reporting unit. Based on the Company's goodwill impairment assessment, all the reporting units with goodwill had estimated fair values as of
February 28, 2018
that exceeded their carrying values. As a result of the annual assessment, no impairment charges were recorded related to goodwill during Fiscal 2018, Fiscal 2017 or Fiscal 2016.
Goodwill allocated to our Klipsch, Invision, and Rosen reporting units was
84.9%
(
$46,533
),
13.5%
(
$7,372
), and
1.6%
(
$880
), respectively. The fair values of the Klipsch and Invision reporting units are greater than their carrying values by approximately 157% ($21,999) and 19% ($5,128), respectively, as of
February 28, 2018
. The Company uses a discounted cash flow model to value the reporting unit as part of its impairment test. This impairment test involves the use of accounting estimates and assumptions, changes in which could materially impact our financial condition or operating performance if actual results differ from such estimates and assumptions. The critical assumptions in the discounted cash flow model are revenues, operating margins, working capital and a discount rate (developed using a weighted average cost of capital analysis). Management exercises judgment in developing these assumptions. Certain of these assumptions are based upon industry projections, facts specific to the reporting unit, market participant assumptions and data, and consideration of our long-term view for the reporting unit and the markets we operate in. If the Klipsch reporting unit were to experience sales declines, sustained pricing pressures, unfavorable operating margins, lack of new product acceptance by consumers, changes in consumer trends and preferred shopping channels, less than anticipated results for the holiday season, an increase to the discount rate, and/or a decrease in our projected long-term growth rates used in the discounted cash flow model, there would be an increased risk of goodwill impairment for the Klipsch reporting unit. If the Invision reporting unit experienced an increase to the discount rate, a lack or delay in new product acceptance, or a change in our projected long-term growth rates used in the discounted cash flow model, there would be an increased risk of goodwill impairment for the Invision reporting unit. If the Rosen reporting unit experienced an increase to the discount rate, sales declines, changes in consumer trends, or a decrease in our projected long-term growth rates used in the discounted cash flow model, there would be an increased risk of goodwill impairment for the Rosen reporting unit.
Long-lived assets and certain identifiable intangibles are reviewed for impairment in accordance with ASC 360 whenever events or changes in circumstances indicate that the carrying amount of an asset may not be recoverable. Recoverability of assets to be held and used is measured by a comparison of the carrying amount of an asset to future undiscounted net cash flows expected to be generated by the asset. Recoverability of long-lived assets is measured by comparing the carrying amount of the assets to their estimated fair market value. If such assets are considered to be impaired, the impairment to be recognized is measured by the amount by which the carrying amount of the assets exceeds the fair value of the assets.
The Company holds certain long-lived assets in Venezuela, which are held for investment purposes. The value of the Company's properties held for investment purposes in Venezuela is
$3,542
as of
February 28, 2018
. The Company continues to monitor the
27
economic conditions and recoverability of these assets as necessary. Any changes in accounting estimates and assumptions could result in further impairment charges from these long-lived assets.
Warranties
We offer warranties of various lengths depending upon the specific product. Our standard warranties require us to repair or replace defective product returned by both end users and customers during such warranty period at no cost. We record an estimate for warranty related costs in cost of sales, based upon actual historical return rates and repair costs at the time of sale. The total estimated liability for future warranty expense, which has been included in accrued expenses and other current liabilities, amounted to
$4,261
at
February 28, 2018
and
$3,911
at
February 28, 2017
. While warranty costs have historically been within expectations and the provisions established, we cannot guarantee that we will continue to experience the same warranty return rates or repair costs that have been experienced in the past. A significant increase in product return rates, or a significant increase in the costs to repair products, could have a material adverse impact on our operating results.
Stock-Based Compensation
We use the Black-Scholes option pricing model to compute the estimated fair value of stock-based awards. The Black-Scholes option pricing model includes assumptions regarding dividend yields, expected volatility, expected option term and risk-free interest rates. The assumptions used in computing the fair value of stock-based awards reflect our best estimates, but involve uncertainties relating to market and other conditions, many of which are outside of our control. We estimate expected volatility by considering the historical volatility of our stock, the implied volatility of publicly traded stock options in our stock and our expectations of volatility for the expected term of stock-based compensation awards. For restricted stock awards, the fair value of the award is the price on the date of grant. As a result, if other assumptions or estimates had been used for options or restricted stock awards granted in the current and prior periods, the total stock-based compensation expense from continuing operations of
$502
that was recorded for the year ended
February 28, 2018
could have been materially different. Furthermore, if different assumptions are used in future periods, stock-based compensation expense could be materially impacted in the future.
Income Taxes
We account for income taxes in accordance with the guidance issued under Statement ASC 740, "Income Taxes" with consideration for uncertain tax positions. We record a valuation allowance to reduce our deferred tax assets to the amount of future tax benefit that is more likely than not to be realized.
Income taxes are accounted for under the asset and liability method. Deferred tax assets and liabilities are recognized for the future tax consequences attributable to differences between the financial statement carrying amounts of existing assets and liabilities and their respective tax basis and operating loss and tax credit carryforwards. In evaluating our ability to recover our deferred tax assets within the jurisdiction from which they arise, we consider all positive and negative evidence including the results of recent operations, scheduled reversal of deferred tax liabilities, future taxable income and tax planning strategies. Deferred tax assets and liabilities are measured using enacted tax rates expected to apply to taxable income in the years in which those temporary differences are expected to be recovered or settled (see Note 8). The effect on deferred tax assets and liabilities of a change in tax rates is recognized in income in the period that includes the enactment date.
The Company accounts for uncertain tax positions in accordance with the authoritative guidance issued under ASC 740, which addresses the determination of whether tax benefits claimed or expected to be claimed on a tax return should be recorded in the financial statements. The Company may recognize the tax benefit from an uncertain tax position only if it is more likely than not that the tax position will be sustained on examination by the taxing authorities based on the technical merits of the position. The tax benefits recognized in the financial statements from such position should be measured based on the largest benefit that has a greater than fifty percent likelihood of being realized upon ultimate settlement. The Company provides loss contingencies for federal, state and international tax matters relating to potential tax examination issues, planning initiatives and compliance responsibilities. The development of these reserves requires judgments about tax issues, potential outcomes and timing, which if different, may materially impact the Company's financial condition and results of operations. The Company classifies interest and penalties associated with income taxes as a component of Income Tax Expense (Benefit) on the Consolidated Statement of Operations and Comprehensive Income (Loss). See Note 8 for discussion of the enactment of the Tax Cuts and Job Acts on December 22, 2017.
Results of Operations
Included in Item 8 of this annual report on Form 10-K are the Consolidated Balance Sheets as of
February 28, 2018
and
February 28, 2017
and the Consolidated Statements of Operations and Comprehensive Income (Loss), Consolidated Statements of Stockholders’
28
Equity and Consolidated Statements of Cash Flows for the years ended
February 28, 2018
,
February 28, 2017
and
February 29, 2016
. In order to provide the reader meaningful comparison, the following analysis provides comparison of the audited year ended
February 28, 2018
with the audited years ended
February 28, 2017
, and
February 29, 2016
. We analyze and explain the differences between periods in the specific line items of the Consolidated Statements of Operations and Comprehensive Income (Loss).
The Company's financial statements for the prior periods presented herein have been recast to reflect a certain business that was classified as discontinued operations during the second quarter of Fiscal 2018. See Note 2 of the Notes to the Consolidated Financial Statements for additional information.
Year Ended
February 28, 2018
Compared to the Years Ended
February 28, 2017
and
February 29, 2016
Continuing Operations
The following table sets forth, for the periods indicated, certain Statement of Operations data for the years ended
February 28, 2018
("Fiscal
2018
"),
February 28, 2017
("Fiscal
2017
") and
February 29, 2016
("Fiscal
2016
").
Net Sales
|
Fiscal
|
Fiscal
|
Fiscal
|
|||||||||
|
2018
|
2017
|
2016
|
|||||||||
|
Automotive
|
$
|
155,480
|
|
$
|
170,729
|
|
$
|
201,125
|
|
||
|
Premium Audio
|
172,406
|
|
166,789
|
|
140,508
|
|
|||||
|
Consumer Accessories
|
178,756
|
|
176,216
|
|
187,272
|
|
|||||
|
Corporate
|
450
|
|
796
|
|
1,301
|
|
|||||
|
Total net sales
|
$
|
507,092
|
|
$
|
514,530
|
|
$
|
530,206
|
|
||
Fiscal
2018
Automotive sales, which include both OEM and aftermarket automotive electronics, represented
30.7%
of the net sales for the year ended
February 28, 2018
, compared to
33.2%
in the prior year. The Company experienced a decrease in automotive sales during the year ended
February 28, 2018
partially due to the continued decline in satellite radio sales, as a result of most vehicles being built equipped with these products as standard vehicle options. Additionally, the Company had a decrease in sales during the year ended
February 28, 2018
related to its international OEM manufacturing line as a result of the completion of a program with Bentley during the first quarter of Fiscal 2018, with final spare parts shipments during the first half of the fiscal year. Within the Company's domestic OEM manufacturing lines, there was a slight decrease in sales during the year ended
February 28, 2018
related to the winding down of certain headrest programs with General Motors and Ford in preparation for new programs which experienced delayed launches. These programs began at the end of the third quarter of Fiscal 2018. The decreases in sales were partially offset by a net increase in aftermarket product sales primarily due to overhead and headrest DVD player sales resulting from the Company's acquisition of Rosen Electronics LLC during the first quarter of Fiscal 2018, as well as increases to domestic OEM sales during the year ended
February 28, 2018
due to additional vehicle models added to existing programs with Subaru.
Premium Audio sales represented
34.0%
of net sales for the year ended
February 28, 2018
as compared to
32.4%
in the prior year. Sales in Premium Audio increased for the year ended
February 28, 2018
partially as a result of an increase in sales of several of its existing lines of home entertainment speakers due to successful marketing and promotional activity. Additionally, sales have increased in this segment as a result of the introduction of several new products, including various lines of HD wireless speakers, wireless soundbars, Klipsch Heritage products, and wireless and multi-room streaming audio systems, including Capital Records branded products, which launched throughout Fiscal 2018. The Company also offered several close out promotions on certain soundbar models that have been phased out to make room for newer product lines, which resulted in further sales increases during the fiscal year. Finally, within the Company's European market, a modest increase in the Euro also resulted in a positive impact on sales revenue. These increases were partially offset by decreases in sales of mobility products during the year ended
February 28, 2018
, such as wireless headphones and portable bluetooth speakers, as a result of certain vendor delays on some of the Company's new headphone and neckband lines, as well as decreases in wired headphone products due to changes in technology and the migration toward wireless products. The segment also experienced a decrease in commercial speaker sales due to the delay of certain projects and programs, which is primarily a result of slower box office sales that have affected many of the Company's cinema customers.
29
Consumer Accessories represented
35.3%
of our net sales for the year ended
February 28, 2018
, compared to
34.2%
in the prior year. The Company experienced increases in sales during the year ended
February 28, 2018
related to its new Striiv activity tracking bands, which launched during the second quarter of Fiscal 2018, as well as an increase in sales of the Company's new Project Nursery line, which includes baby monitors, and launched in the second quarter of Fiscal 2017. The Company also experienced an increase in sales of wireless speakers as a result of new orders and placements at retailers, and the launch of new product lines. Additionally, during the year ended
February 28, 2018
, the Company experienced an increase in international sales, primarily due to the roll out of an upgrade to the digital broadcasting platform in Europe during Fiscal 2017, which has required consumers to purchase new equipment, such as set top boxes, as well as due to a modest increase in the Euro, which contributed positively to the Company's revenues for the year. As an offset to these increases, the Company experienced decreases in consumer accessory sales during the year ended
February 28, 2018
due to factors including the decline in sales of the 360Fly action camera product and Singtrix product. There was also a decrease in sales of hook-up products; remotes; clock radios; docking stations; digital audio products; and power products, such as cables and surge protectors, due primarily to competition, changes in demand and changes in technology during the year ended
February 28, 2018
.
Fiscal
2017
Automotive sales, which include both OEM and aftermarket automotive electronics, represented
33.2%
of the net sales for the year ended
February 28, 2018
, compared to
37.9%
in the prior year. The Company experienced a decrease in automotive sales due to several factors during the year, including the completion and winding down of certain OEM programs during Fiscal 2017 that had experienced strong performance in the comparative prior year period. Remote start products were negatively impacted for the year ended
February 28, 2017
, as a result of warmer Winter seasons in both Fiscal 2016 and Fiscal 2017, resulting in several customers carrying excess inventory into the Company's Fiscal 2017 year and lower overall sales of these products for the year, as well as due to the fact that more vehicles are being built equipped with remote start capabilities. Sales of satellite radios during the year ended
February 28, 2017
also decreased as a result of more vehicles being built equipped with these products. The Company also experienced decreases in aftermarket overhead and headrest DVD player sales as a result of price reductions and competition within these product lines. Finally, during Fiscal 2016, the Company sold all of its Jensen Mobile product inventory, consisting of car speakers and amplifiers, to a third party in order to license the brand name for a commission. This resulted in reduced sales of these products for the year ended
February 28, 2017
of approximately $6,500. As an offset to these decreases, the Company began a new OEM program with Subaru, resulting in an increase in domestic OEM sales.
Premium Audio sales represented
32.4%
of net sales for the year ended
February 28, 2017
as compared to
26.5%
in the prior year. Sales in Premium Audio increased
18.7%
for the year ended
February 28, 2017
primarily as a result of the introduction of several new products, including various lines of HD wireless desktop and bookshelf size speakers, wireless soundbars and multi-room streaming audio systems. These products were launched between the fourth quarter of Fiscal 2016 and the third quarter of Fiscal 2017 and have been experiencing strong sales for the segment during the year ended
February 28, 2017
. The Company also saw increases in sales in several of its existing lines of home entertainment speakers due to successful marketing and promotional activity, as well as increased commercial speaker sales as a result of new distribution agreements and growth in China. Additionally, headphone sales have increased as a result of promotions offered during the year ended
February 28, 2017
that were not provided in the prior year, as well as due to the launch of four new unique headphone products during the third quarter of Fiscal 2017, consisting of neckband headphones, as well as new on-ear, in-ear and over-ear headphones. These increases were partially offset by decreases in European sales during the year ended
February 28, 2017
as a result of a slower market overseas.
Consumer Accessories represented
34.2%
of our net sales for the year ended
February 28, 2017
, compared to
35.3%
in the prior year. The Company experienced a decrease in consumer accessory sales due to several factors during the year, including the decrease in sales of wireless speakers, as compared to the year ended February 29, 2016. While the sales of wireless speakers in this segment have remained strong in Fiscal 2017, the Company had higher sales in the prior year due to load in shipments of certain new wireless speaker products in order to fill its customers' inventory pipelines, which were not repeated in the current year. There were additional declines in wireless speaker sales as a result of certain promotions of new product that were offered during the prior year but not repeated in Fiscal 2017, as well as the timing of certain customer Spring shipment orders that were delayed to Fiscal 2018. There was also a decrease during the year ended
February 28, 2017
in sales of hook-up products; remotes; clock radios; docking stations; reception products, such as antennas; and power products, such as cables and surge protectors, due to competition, changes in demand and changes in technology. Additionally, the segment experienced a decrease in sales of its Singtrix karaoke product, primarily as a result of promotional activity in the prior fiscal year that did not repeat in Fiscal 2017, as well as large customer load in shipments in the prior year that did not repeat, and slower international consumer accessories sales for several product lines. As an offset to these decreases, the segment experienced increases in sales during the year ended
February 28, 2017
related to new products, such as the Company's Project Nursery baby monitors, which launched in the second quarter of Fiscal 2017, and the 360Fly® Action Camera, which launched in the third quarter of Fiscal 2016 and has had an expansion in distribution, as well as the introduction of new models since its launch date. Internationally, the Company did experience an
30
increase in sales of certain products related to the roll out of an upgrade to the digital broadcasting platform in Europe, which will require new equipment.
Gross Profit and Gross Margin Percentage
|
Fiscal
|
Fiscal
|
Fiscal
|
|||||||||
|
2018
|
2017
|
2016
|
|||||||||
|
Automotive
|
$
|
39,829
|
|
$
|
46,744
|
|
$
|
51,198
|
|
||
|
25.6
|
%
|
27.4
|
%
|
25.5
|
%
|
||||||
|
Premium Audio
|
53,374
|
|
55,053
|
|
46,582
|
|
|||||
|
31.0
|
%
|
33.0
|
%
|
33.2
|
%
|
||||||
|
Consumer Accessories
|
38,867
|
|
41,537
|
|
45,490
|
|
|||||
|
21.7
|
%
|
23.6
|
%
|
24.3
|
%
|
||||||
|
Corporate
|
227
|
|
696
|
|
266
|
|
|||||
|
$
|
132,297
|
|
$
|
144,030
|
|
$
|
143,536
|
|
|||
|
26.1
|
%
|
28.0
|
%
|
27.1
|
%
|
||||||
Fiscal
2018
Gross margins in the Automotive segment decreased 180 basis points for the year ended
February 28, 2018
. The main driver of this decline in margins was related to the delays in the launch of new headrest programs that were scheduled for early in the fiscal year, but did not begin until the end of the Company's third quarter. During these delays, the Company continued to employ certain warehouse and assembly personnel specializing in the programs, rather than reduce headcount and re-train new employees at a later date. As a result, these additional warehouse and assembly expenditures contributed to an overall reduction in margins on these OEM sales within the Company's Automotive segment for the year ended
February 28, 2018
. This was partially offset by an increase in sales of certain higher margin products, such as the Company's aftermarket overhead and headrest DVD players, due to the acquisition of Rosen in the first quarter of Fiscal 2018, as well as decreased sales of lower margin products, such as satellite radio fulfillments during the year ended
February 28, 2018
.
Gross margins in the Premium Audio segment decreased 200 basis points for the year ended
February 28, 2018
compared to the prior year. During the year ended
February 28, 2018
, the segment experienced lower sales of its higher margin commercial speakers. Additionally, certain portable mobile devices, such as headphones and neckbands, experienced higher sales at higher margins in the prior year, as compared to lower sales with close-out promotions in the current year to make way for newer models, which also experienced delays coming to market. The combination of these factors negatively impacted the blended margin of these portable mobile devices. During the year ended
February 28, 2018
, the Company also offered heavy promotions of older soundbar models that have now been phased out in order to make way for a newer line of products. As an offset to these decreases, the segment experienced an increase in sales of its higher margin home entertainment speakers and systems, which contributed positively to overall margins.
Gross margins in the Consumer Accessories segment decreased 190 basis points for the year ended
February 28, 2018
compared to the prior year. For the year ended
February 28, 2018
, margins were negatively impacted by decreased sales of certain higher margin products, including hookup products, clock radios, docking stations, digital audio products, and power products, as well as by the increase in sales of the Company's new Striiv activity band, which contributed significant sales during the year ended
February 28, 2018
, but generated lower margins for the segment. The Company also offered significant promotions on certain products within its Project Nursery line, which caused a reduction in margins for these products during the current fiscal year. Additionally, the Company incurred increased freight charges due to significant demand for certain remote products, thus driving down margins and also incurred a one-time settlement charge related to a contract shortfall with a vendor for the purchase of certain products, which caused margins to be negatively impacted for the year. These decreases were offset by an increase in sales of higher margin products, such as the segment's wireless speakers, as well as an increase in sales of set top boxes and other high margin products within the European market related to an upgrade to the digital broadcasting platform in Europe. There was also a decrease in sales of action cameras and the Company's Singtrix product during the year ended
February 28, 2018
. As the sales of these products generally produce lower margins for the Company, the decrease in these sales partially offset the overall decline in margins for the year ended
February 28, 2018
.
Fiscal
2017
31
Gross margins in the Automotive segment increased 190 basis points for the year ended
February 28, 2017
. The segment experienced decreases in sales of lower margin products such as satellite radio fulfillments and a decrease in sales of its lower margin Jensen products, whose inventory was sold in the prior year, contributing to overall margin improvements for the segment. This was offset by decreased sales of higher margin products during the year, such as remote start and aftermarket overhead and headrest DVD products, as well as certain products within the OEM manufacturing line.
Gross margins in the Premium Audio segment decreased 20 basis points for the year ended
February 28, 2017
compared to the prior year. For the year ended
February 28, 2017
, the segment experienced a significant increase in sales of the Company's newest wireless soundbars and speakers, which earn lower margins for the segment. The Company also offered heavy holiday promotions of its newest soundbar products and incurred significant expedited freight charges in order to fulfill customer demand for the holiday season, as well as offered discounts on an older headphone product line being phased out to make way for its latest product launches, which caused margins to be reduced further. As an offset to these decreases, margins improved primarily due to the fact that in the prior year, this segment experienced heavy promotions on several product close outs and obsolete items in order to make way for newer product, which did not repeat in the current fiscal year. The segment has also seen an increase in sales for the year ended
February 28, 2017
of certain higher margin products, such as home entertainment speakers and premium loudspeakers.
Gross margins in the Consumer Accessories segment decreased 70 basis points for the year ended
February 28, 2017
compared to the prior year. For the year ended
February 28, 2017
, margins were negatively impacted by decreased sales of certain higher margin products, including remotes, hookup, reception and power products, as well as the Singtrix karaoke product and wireless speakers. Margins were also impacted by the launch of the new 360Fly® Action Camera, which contributed to a substantial increase in sales for the year ended
February 28, 2017
, but produce overall lower margins for the segment. This was partially offset by an increase in sales of higher margin products, such as the Company's new line of baby monitors and international product sales related to the roll out of an upgrade to the digital broadcasting platform in Europe.
Operating Expenses
|
Fiscal
|
Fiscal
|
Fiscal
|
|||||||||
|
2018
|
2017
|
2016
|
|||||||||
|
Operating Expenses:
|
|
|
|
||||||||
|
Selling
|
$
|
45,999
|
|
$
|
43,108
|
|
$
|
43,576
|
|
||
|
General and administrative
|
78,957
|
|
79,573
|
|
84,234
|
|
|||||
|
Engineering and technical support
|
26,440
|
|
29,517
|
|
22,923
|
|
|||||
|
Intangible asset impairment charges
|
—
|
|
—
|
|
9,070
|
|
|||||
|
Acquisition related costs
|
—
|
|
—
|
|
800
|
|
|||||
|
Total Operating Expenses
|
$
|
151,396
|
|
$
|
152,198
|
|
$
|
160,603
|
|
||
Fiscal
2018
The Company experienced an overall
decrease
in operating expenses of
$802
for Fiscal
2018
as compared to Fiscal
2017
. Selling expenses increased during the year ended
February 28, 2018
due primarily to advertising and marketing related expenses. This was driven mainly as a result of increased web advertising and promotion expenses due to higher online sales, as well as an increase in store displays and in-store vignettes for product promotion. These increases were offset by decreases in selling commissions for the fiscal year, as a result of an overall decrease in sales. Within general and administrative expenses, the Company experienced a net decrease in expenses for the year ended
February 28, 2018
. Decreases in general and administrative expenses were due to a decline in professional expenses as a result of lower legal services for the year; lower occupancy expenses related to the consolidation of the Company's shared services into one location, which was completed during the fourth quarter of Fiscal 2017; the consolidation of the Company's phone system; a decline in licensing fees related to MIS; and lower insurance expenditures related to fewer workers' compensation claims for the year ended
February 28, 2018
as compared to the prior year. In addition, during the prior year, the Company incurred significant bad debt expense related to one of the Company's larger customers who filed bankruptcy during the fourth quarter of Fiscal 2017, which did not repeat in the current year, thus contributing to lower G&A expense for the year ended
February 28, 2018
. These decreases were offset by higher salary and benefits expenses due both to severance expense at certain business units related to headcount reductions during the year, as well as higher executive bonus accruals resulting from Company profitability. Additionally, an employee furlough program was provided at one of the Company's foreign subsidiaries in Fiscal 2017 that resulted in lower salary expenditures for the Company in the prior year and was no longer in effect for Fiscal
32
2018. Engineering and technical support expenses decreased during the year ended
February 28, 2018
primarily due to certain development delays, the timing of new projects, as well as due to headcount reductions and cost cutting measures.
Fiscal
2017
Operating expenses decreased
$8,405
in Fiscal
2017
as compared to
Fiscal 2016
. The Company has experienced decreases in salary, payroll and benefits expenses for the full year ended
February 28, 2017
as a result of Company-wide headcount reductions made throughout Fiscal 2016, as well as due to changes to the Company's medical plan that resulted in additional benefit expense decreases in Fiscal 2017. The Company also experienced decreases in professional fees due to fewer legal matters in comparison to the prior year, the absence of acquisition costs related to EyeLock LLC that were incurred in Fiscal 2016, lower moving expenses as a result of the relocation to a new Company-owned manufacturing facility and executive office in Lake Nona, FL in Fiscal 2016, and lower occupancy expenses, primarily as a result of the renegotiation of the lease for the Company's shared services office in New York. The Company has also made increased efforts in the current year to streamline and reduce travel and entertainment expense, which has resulted in an overall decrease in such expenditures for the year ended
February 28, 2017
. Additionally, the Company has not incurred any impairment charges for the year ended
February 28, 2017
, as compared to the Fiscal 2016, in which $9,070 of intangible asset impairment charges were incurred. As an offset to these operating expense decreases, there have been significant increases in research and development expenditures during the year ended
February 28, 2017
, related to the Company's Klipsch and Invision subsidiaries both of which increased their research and development spending in comparison to the prior year, as well as due to the EyeLock LLC subsidiary, which has been included in the Company's operations for the full fiscal year. Since the acquisition of a majority voting interest in substantially all of the assets and certain liabilities of EyeLock Inc. and EyeLock Corporation in the third quarter of Fiscal 2016, this new subsidiary has incurred significant research and development expenses related to its iris-based authentication solutions for the continued expansion of the applications of the technology. The Company also incurred an increase in bad debt expense for the year ended
February 28, 2017
, primarily as a result of the bankruptcy of one of the Company's customers, and an increase in depreciation and amortization expenses both as a result of a full year of depreciation of the Company's new manufacturing facility and executive offices in Florida, which was completed during the fourth quarter of Fiscal 2016, and a full year of amortization of intangible assets acquired in conjunction with the EyeLock acquisition. For the year ended
February 28, 2017
, there has also been an increase in salary and benefit expenses related to the full year inclusion of EyeLock LLC, as well as the Company's efforts to build EyeLock LLC's sales force.
Other (Expense)Income
|
Fiscal
|
Fiscal
|
Fiscal
|
|||||||||
|
2018
|
2017
|
2016
|
|||||||||
|
Interest and bank charges
|
$
|
(6,009
|
)
|
$
|
(7,105
|
)
|
$
|
(7,898
|
)
|
||
|
Equity in income of equity investee
|
7,178
|
|
6,797
|
|
6,538
|
|
|||||
|
Investment gain
|
1,416
|
|
—
|
|
—
|
|
|||||
|
Gain on bargain purchase
|
—
|
|
—
|
|
4,679
|
|
|||||
|
Other, net
|
(7,590
|
)
|
(454
|
)
|
576
|
|
|||||
|
Total other (expense) income
|
$
|
(5,005
|
)
|
$
|
(762
|
)
|
$
|
3,895
|
|
||
Fiscal
2018
Interest and bank charges represent expenses for the Company's bank obligations, interest related to capital leases, and amortization of deferred financing costs. These charges decreased for the year ended
February 28, 2018
as compared to the prior year as a result of a lower average outstanding balance on the Company's Credit Facility due to the repayment of the entire outstanding balance following the sale of Hirschmann on August 31, 2017.
Equity in income of equity investee represents the Company's share of income from its 50% non-controlling ownership interest in ASA Electronics, LLC ("ASA"). The increase in income for the year ended
February 28, 2018
was due to favorable product mix and new product offerings, resulting in higher sales for several of the investee's existing customers, as well as a special project performed for one of their customers during the year.
During July 2017, one of the Company's cost method investments, Rx Networks, was sold to a third party, resulting in a gain recognized by the Company for the year ended
February 28, 2018
representing the excess of the consideration for the investment held by the Company on the date of the transaction.
33
Other, net, for the year ended
February 28, 2018
includes net losses on foreign currency of
$(8,769)
, interest income of
$210
and rental income of
$553
. Other, net, for the year ended
February 28, 2017
included net losses on foreign currency of
$(509)
, interest income of
$137
and rental income of
$646
. Included in the foreign currency losses for the year ended February 28, 2018 are losses on forward contracts totaling
$(6,618)
incurred in conjunction with the sale of Hirschmann.
Fiscal
2017
Interest and bank charges represent expenses for the Company's bank obligations, interest related to capital leases, and amortization of deferred financing costs. These charges decreased for the year ended
February 28, 2017
as compared to the prior year. During the fourth quarter of Fiscal 2016, the Company wrote off approximately $1,300 of deferred financing costs as a result an amendment to the Company's credit facility, which was charged to interest expense and was not repeated in the current year. As an offset to this decrease in interest and bank charges, the Company has experienced increases in these expenses for the year ended
February 28, 2017
primarily due to interest expense related to the Company's outstanding Florida mortgage, which was entered into during Fiscal 2016 in order to finance the construction of the Company's manufacturing facility and executive offices in Lake Nona, FL. This mortgage was entered into in July 2015 and was not outstanding during much of the first half of Fiscal 2016. During the year ended
February 28, 2017
, the Company also carried a higher outstanding balance on its Credit Facility as compared to the prior year period and as such, incurred higher interest charges related to this facility.
Equity in income of equity investee represents the Company's share of income from its 50% non-controlling ownership interest in ASA Electronics, LLC ("ASA"). The increase in income for the year ended
February 28, 2017
was a result of an improvement in ASA's product mix.
On September 1, 2015, Voxx completed the acquisition of a majority voting interest in substantially all of the assets and certain specified liabilities of Eyelock, Inc. and Eyelock Corporation (collectively, "the Seller"), through a newly-formed entity Eyelock LLC. The excess of the assets and liabilities acquired over the amount paid for Voxx's interest in EyeLock resulted in a bargain purchase gain of $4,679 recognized for the year ended February 29, 2016.
Other, net, for the year ended
February 28, 2017
includes net losses on foreign currency of $(509), interest income of $137 and rental income of $646. Other, net, for the year ended
February 29, 2016
included net gains on foreign currency of $108, interest income of $805 and rental income of $450. The decrease in interest income during the year ended
February 28, 2017
compared to the year ended February 29, 2016 relates to income earned on notes receivable from EyeLock. Inc. during Fiscal 2016 through the acquisition date of September 1, 2015.
Income from Discontinued Operations
Fiscal
2018
On August 31, 2017 (the "Closing Date"), the Company completed its sale of Hirschmann to a subsidiary of TE. The consideration received by the Company was €
148,500
. The purchase price, at the exchange rate as of the close of business on the Closing Date approximated
$177,000
and is subject to adjustment based upon the final working capital. For the year ended
February 28, 2018
, income from discontinued operations consisted primarily of a gain on sale of
$36,118
, as well as operating income of
$2,817
. For the year ended
February 28, 2017
, income from discontinued operations consisted primarily of operating income of
$7,996
. Operating income for the Company's discontinued operation in both periods was comprised primarily of tuner and antenna sales, which ceased following the sale of Hirschmann on August 31, 2017.
Fiscal
2017
Operating income from discontinued operations for the year ended
February 28, 2017
was
$7,996
as compared to
$5,497
in the comparable prior year and was comprised primarily of tuner and antenna sales, which experienced an increase in Fiscal 2017 due to new program launches.
Income Tax Provision
On December 22, 2017, the U.S. government enacted comprehensive tax reform commonly referred to as the Tax Cuts and Jobs Act (“TCJA”). Under Accounting Standards Codification (“ASC”) 740, the effects of changes in tax rates and laws are recognized in the period which the new legislation is enacted. The TCJA makes broad and complex changes to the U.S. tax code, including, but not limited to: (1) reducing the U.S. federal corporate tax rate from
35%
to
21%
; (2) changing rules related to uses and limitations of net operating loss carryforwards created in tax years beginning after December 31, 2017; (3) accelerated expensing on certain qualified property; (4) creating a new limitation on deductible interest expense to 30% of tax adjusted EBITDA through 2021 and then 30% of tax adjusted EBIT thereafter; (5) eliminating the corporate alternative minimum tax; (6) further limitations on the
34
deductibility of executive compensation under IRC §162(m) for tax years beginning after December 31, 2017; (7) a one-time transition tax related to the transition of U.S. international tax from a worldwide tax system to a territorial tax system; and (8) additional changes to the U.S. international tax rules including imposing a minimum tax on global intangible low taxed income (“GILTI”) and other base erosion anti-abuse provisions.
In response to the TCJA, the U.S. Securities and Exchange Commission (“SEC”) staff issued Staff Accounting Bulletin No. 118 (“SAB 118”), which provides guidance on accounting for the tax effects of TCJA. The purpose of SAB 118 was to address any uncertainty or diversity of view in applying ASC Topic 740, Income Taxes in the reporting period in which the TCJA was enacted. SAB 118 addresses situations where the accounting is incomplete for certain income tax effects of the TCJA upon issuance of a company’s financial statements for the reporting period which include the enactment date. SAB 118 allows for a provisional amount to be recorded if it is a reasonable estimate of the impact of the TCJA. Additionally, SAB 118 allows for a measurement period to finalize the impacts of the TCJA, not to extend beyond one year from the date of enactment.
In connection with the Company’s initial analysis of the impact of the TCJA, the Company has recorded a provisional decrease in its deferred tax assets and liabilities of
$4,706
related to the remeasurement of the deferred tax assets and liabilities at the reduced U.S. federal tax rate of
21%
. The Company is subject to a one-time transition tax based on the total post-1986 earnings and profits that were previously deferred from U.S. income and profits. The Company recorded a liability in connection with the one-time transition tax of
$2,696
, which was principally offset by the Company’s tax attributes.
Pursuant to SAB 118, the Company is in the process of assessing the impact of the TCJA on its indefinite reinvestment assertion and any associated impact on its financial statements. This assessment includes, but is not limited to, assessing how the TCJA will impact the consequence of indefinitely reinvesting the Company’s foreign earnings and evaluating how the Company, having a minimal tax liability for the transition tax, will be impacted by future repatriations. Therefore, no adjustments have been made in the Company’s financial statements with respect to its indefinite reinvestment criteria
The Company has not made a policy election with respect to the income tax effects of the new GILTI provisions. Companies can either account for taxes on GILTI as a current period expense or recognize deferred taxes when basis differences exist that are expected to affect the amount of GILTI inclusion upon reversal. Due to the complexity of these new tax rules, the Company is continuing to evaluate the expected impact. In accordance with SAB 118, the Company has not included an estimate of the tax expense or benefit related to GILTI for the fiscal year ended February 28, 2018.
While the Company is able to make a reasonable estimate of the impact of the reduction in the corporate rate and transition tax, the provisional amounts may change due to a variety of factors, including, among other things, (i) anticipated guidance from the U.S. Department of Treasury about implementing the TCJA, (ii) potential additional guidance from the SEC or the FASB related to the TCJA, and (iii) the Company’s further assessment of the TCJA and related regulatory guidance. The Company is not complete in its assessment of the impact of the TCJA on its income tax accounts and financial statements.
During Fiscal
2018
, the Company recorded an income tax benefit of
$(17,445)
related to federal, state and foreign taxes from continuing operations. The effective tax rate in Fiscal
2018
was
72.4%
for continuing operation. The Company's effective tax rate differs from the statutory rate of
32.7%
primarily due to the impact of TCJA, the partial reversal of the Company’s valuation allowance as certain deferred tax assets became realizable on a more-likely-than-not basis and the reversal of uncertain tax positions under ASC 740 related to the expiration of the statute of limitations. During Fiscal
2018
, the Company maintained a valuation allowance against its U.S. deferred tax assets and certain foreign jurisdictions. Any decline in the valuation allowance could have a favorable impact on our income tax provision and net income in the period in which such determination is made.
The effective tax rate of
3.8%
in Fiscal 2017 differs from the statutory rate of
35%
primarily due to the impact of the reversal of uncertain tax positions under ASC 740 related to settlement of an income tax examination, non-controlling interest, an income tax provision resulting from the increase in deferred tax liabilities related to indefinite-lived intangible assets, and tax rate differences due to the mix of domestic and foreign earnings. During Fiscal 2017, the Company maintained a valuation allowance against its U.S. deferred tax assets and certain foreign jurisdictions. Any decline in the valuation allowance could have a favorable impact on our income tax provision and net income in the period in which such determination is made.
The effective tax rate of
17.8%
in Fiscal 2016 differs from the statutory rate of 35% primarily due to the impact of the bargain purchase gain, the non-controlling interest related to EyeLock and the U.S. effect of foreign operations, including tax rate differences in foreign jurisdictions. During Fiscal 2016, the Company recorded a valuation allowance against its U.S. deferred tax assets and maintains a valuation in certain foreign jurisdictions. Any decline in the valuation allowance could have a favorable impact on our income tax provision and net income in the period in which such determination is made.
EBITDA, Adjusted EBITDA and Adjusted Diluted EBITDA per Common Share
35
EBITDA, Adjusted EBITDA and Diluted Adjusted EBITDA per common share are not financial measures recognized by GAAP. EBITDA represents net income (loss), computed in accordance with GAAP, before interest expense and bank charges, taxes, and depreciation and amortization. Adjusted EBITDA represents EBITDA adjusted for stock-based compensation expense, gains on the sale of discontinued operations, losses on forward contracts, investment gains, impairment charges, as well as costs and bargain purchase gains relating to our acquisitions. Depreciation, amortization, stock-based compensation, bargain gains and impairment charges are non-cash items. Diluted adjusted EBITDA per common share represents the Company's diluted earnings per common share based on Adjusted EBITDA.
We present EBITDA, Adjusted EBITDA and Diluted Adjusted EBITDA per common share in this Form 10-K because we consider them to be useful and appropriate supplemental measures of our performance. Adjusted EBITDA and diluted adjusted earnings per common share help us to evaluate our performance without the effects of certain GAAP calculations that may not have a direct cash impact on our current operating performance. In addition, the exclusion of certain costs or gains relating to non-recurring events allows for a more meaningful comparison of our results from period-to-period. These non-GAAP measures, as we define them, are not necessarily comparable to similarly entitled measures of other companies and may not be an appropriate measure for performance relative to other companies. EBITDA, Adjusted EBITDA and Diluted Adjusted EBITDA per common share should not be assessed in isolation from, are not intended to represent, and should not be considered to be more meaningful measures than, or alternatives to, measures of operating performance as determined in accordance with GAAP.
Reconciliation of GAAP Net Income Attributable to VOXX International Corporation to EBITDA, Adjusted EBITDA and Diluted Adjusted EBITDA per Common Share (2)
|
Fiscal
|
Fiscal
|
Fiscal
|
||||||||||
|
2018
|
2017
|
2016
|
||||||||||
|
Net income (loss) attributable to VOXX International Corporation
|
$
|
35,304
|
|
$
|
4,422
|
|
$
|
(2,682
|
)
|
|||
|
Adjustments:
|
||||||||||||
|
Interest expense and bank charges (1)
|
5,169
|
|
6,860
|
|
7,960
|
|
||||||
|
Depreciation and amortization (1)
|
13,879
|
|
17,064
|
|
15,228
|
|
||||||
|
Income tax expense (benefit)
|
(13,262
|
)
|
1,759
|
|
(1,735
|
)
|
||||||
|
EBITDA
|
41,090
|
|
30,105
|
|
18,771
|
|
||||||
|
Adjustments:
|
||||||||||||
|
Stock-based compensation attributable to stock options and restricted stock
|
552
|
|
753
|
|
859
|
|
||||||
|
Gain on sale of discontinued operations
|
(36,118
|
)
|
—
|
|
—
|
|
||||||
|
Loss on forward contracts attributable to sale of business
|
6,618
|
|
—
|
|
—
|
|
||||||
|
Investment gain
|
(1,416
|
)
|
—
|
|
—
|
|
||||||
|
Intangible and long-lived asset impairment charges
|
—
|
|
—
|
|
9,070
|
|
||||||
|
Acquisition related costs
|
—
|
|
—
|
|
800
|
|
||||||
|
Gain on bargain purchase
|
—
|
|
—
|
|
(4,679
|
)
|
||||||
|
Adjusted EBITDA
|
$
|
10,726
|
|
$
|
30,858
|
|
$
|
24,821
|
|
|||
|
Diluted income (loss) per common share attributable to VOXX International Corporation
|
$
|
1.44
|
|
$
|
0.18
|
|
$
|
(0.11
|
)
|
|||
|
Diluted adjusted EBITDA per common share attributable to VOXX International Corporation
|
$
|
0.44
|
|
$
|
1.28
|
|
$
|
1.03
|
|
|||
(1) For purposes of calculating Adjusted EBITDA for the Company, interest expense, bank charges, as well as depreciation and amortization expense added back to net income (loss) have been adjusted in order to exclude the minority interest portion of these expenses attributable to EyeLock LLC.
(2) EBITDA, Adjusted EBITDA and Diluted Adjusted EBITDA per common share in this presentation are based on a reconciliation to Net income attributable to VOXX International Corporation, which includes net income (loss) from both continuing and discontinued operations for all periods presented. The Company sold its Hirschmann subsidiary on August 31, 2017.
Liquidity and Capital Resources
36
Cash Flows, Commitments and Obligations
As of
February 28, 2018
, we had working capital of
$170,472
which includes cash and cash equivalents of
$51,740
compared with working capital of
$143,281
at
February 28, 2017
, which included cash and cash equivalents of $
956
. We plan to utilize our current cash position as well as collections from accounts receivable, the cash generated from our operations and the income on our investments to fund the current operations of the business. However, we may utilize all or a portion of current capital resources to pursue other business opportunities, including acquisitions or to further pay down our debt. The following table summarizes our cash flow activity for all periods presented:
|
Year
Ended
|
Year
Ended
|
Year
Ended
|
|||||||||
|
February 28,
2018 |
February 28,
2017 |
February 29,
2016 |
|||||||||
|
Cash (used in) provided by:
|
|
|
|
||||||||
|
Operating activities
|
$
|
(25,539
|
)
|
$
|
(1,790
|
)
|
$
|
27,521
|
|
||
|
Investing activities
|
161,360
|
|
(12,130
|
)
|
(38,587
|
)
|
|||||
|
Financing activities
|
(92,247
|
)
|
9,695
|
|
13,695
|
|
|||||
|
Effect of exchange rate changes on cash
|
366
|
|
258
|
|
690
|
|
|||||
|
Net increase (decrease) in cash and cash equivalents
|
$
|
43,940
|
|
$
|
(3,967
|
)
|
$
|
3,319
|
|
||
Net cash used in/provided by operating activities:
Operating activities
used
cash of
$25,539
for Fiscal
2018
principally due to an increase in the Company's prepaid expenses and other assets, as well as a net decrease in accounts payable and accrued expenses. This was offset by a decrease in inventory.
During Fiscal 2017, operating activities used cash of
$1,790
primarily as a result of an increase in inventory, as well as accounts receivable, partially offset by a decrease in vendor receivables.
During Fiscal 2016, operating activities provided cash of
$27,521
primarily as a result of decreased customer accounts receivable and inventory, as well as the factoring of certain trade accounts receivable balances during the year ended February 29, 2016 (see Note 1(h) of the Consolidated Financial Statements), partially offset by decreased accounts payable.
Net cash used in investing activities:
Investing activities
provided
cash of
$161,360
during Fiscal
2018
, primarily as a result of the sale of Hirschmann on August 31, 2017 (see Note 2), which was offset by capital additions, as well as the acquisition of Rosen Electronics LLC (see Note 2) and the issuance of notes receivable to 360fly, Inc. (see Note 1(f)).
During Fiscal 2017, investing activities used cash of
$12,130
primarily due to capital additions related to new computer equipment, as well as the in-progress additions to the Company's shared service facility in Hauppauge, NY.
During Fiscal 2016, investing activities used cash of
$38,587
, primarily due to capital additions and the Company's acquisition of a controlling interest in substantially all of the assets and certain liabilities of Eyelock, Inc. and EyeLock Corporation on September 1, 2015 (see Note 2).
Net cash provided by/used in financing activities:
Financing activities
used
cash of
$92,247
during Fiscal
2018
, primarily due to the repayment of balances outstanding on the Company's Credit Facility following the sale of Hirschmann on August 31, 2017.
During Fiscal 2017, financing activities provided cash of
$9,695
, due to borrowings of bank obligations net of repayments, primarily in relation to the Company's Credit Facility.
During Fiscal 2016, financing activities provided cash of
$13,695
, primarily due to borrowings from our Credit Facility net of repayments, as well as borrowings from the construction loan used to build the Company's new manufacturing facility and executive offices in Lake Nona, Florida.
37
The Company has a senior secured credit facility (the "Credit Facility") that provides for a revolving credit facility with committed availability of up to
$140,000
, which may be increased, at the option of the Company, up to a maximum of
$175,000
, and a term loan in the amount of
$15,000
. The Credit Facility also includes a
$15,000
sublimit for letters of credit and a
$15,000
sublimit for swingline loans. The availability under the revolving credit line within the Credit Facility is subject to a borrowing base, which is based on eligible accounts receivable, eligible inventory and certain real estate, subject to reserves as determined by the lender, and is also limited by amounts outstanding under the Florida Mortgage (see Note 7(b)). As of
February 28, 2018
, there was
no
balance outstanding under the revolving credit facility. The remaining availability under the revolving credit line of the Credit Facility was
$95,796
as of
February 28, 2018
.
All amounts outstanding under the Credit Facility will mature and become due on April 26, 2021; however, it is subject to acceleration upon the occurrence of an Event of Default (as defined in the Credit Agreement). The Company may prepay any amounts outstanding at any time, subject to payment of certain breakage and redeployment costs relating to LIBOR Rate Loans. The commitments under the Credit Facility may be irrevocably reduced at any time, without premium or penalty as set forth in the agreement.
Generally, the Company may designate specific borrowings under the Credit Facility as either Base Rate Loans or LIBOR Rate Loans, except that swingline loans may only be designated as Base Rate Loans. Loans under the Credit Facility designated as LIBOR Rate Loans shall bear interest at a rate equal to the then-applicable LIBOR Rate plus a range of
1.75%
-
2.25%
. Loans under the Credit Facility designated as Base Rate Loans shall bear interest at a rate equal to the applicable margin for Base Rate Loans of
0.75%
-
1.25%
, as defined in the agreement.
The Credit Facility requires compliance with a financial covenant calculated as of the last day of each month, consisting of a Fixed Charge Coverage Ratio. The Credit Facility also contains covenants that limit the ability of the loan parties and certain of their subsidiaries which are not loan parties to, among other things: (i) incur additional indebtedness; (ii) incur liens; (iii) merge, consolidate or dispose of a substantial portion of their business; (iv) transfer or dispose of assets; (v) change their name, organizational identification number, state or province of organization or organizational identity; (vi) make any material change in their nature of business; (vii) prepay or otherwise acquire indebtedness; (viii) cause any Change of Control; (ix) make any Restricted Junior Payment; (x) change their fiscal year or method of accounting; (xi) make advances, loans or investments; (xii) enter into or permit any transaction with an Affiliate of any Borrower or any of their Subsidiaries; (xiii) use proceeds for certain items; (xiv) issue or sell any of their stock; (xv) consign or sell any of their inventory on certain terms. In addition, if excess availability under the Credit Facility were to fall below certain specified levels, as defined in the agreement, the lenders would have the right to assume dominion and control over the Company's cash. As of
February 28, 2018
, the Company was in compliance with this cash dominion covenant.
The obligations under the loan documents are secured by a general lien on and security interest in substantially all of the assets of the borrowers and certain of the guarantors, including accounts receivable, equipment, real estate, general intangibles and inventory. The Company has guaranteed the obligations of the borrowers under the Credit Facility.
On August 31, 2017, the Company completed its sale of Hirschmann to a subsidiary of TE. The consideration received by the Company was €
148,500
. The purchase price, at the exchange rate as of the close of business on August 31, 2017 approximated
$177,000
and is subject to adjustment based upon the final working capital. At
February 28, 2017
, a total of
$92,793
was outstanding under the Credit Facility. The decrease in the outstanding credit facility balance as compared to
February 28, 2018
is principally a result of the Company's decision to pay down the outstanding balance of the Credit Facility in conjunction with the sale of Hirschmann.
We also utilize supply chain financing arrangements and factoring agreements as an integral part of our financing for working capital, which accelerates receivable collection and helps to better manage cash flow. Under the agreements, the Company has agreed to sell certain of its accounts receivable balances to banking institutions who have agreed to advance amounts equal to the net accounts receivable balances due, less a discount as set forth in the respective agreements. The balances under these agreements are accounted for as sales of accounts receivable, as they are sold without recourse. Cash proceeds from these agreements are reflected as operating activities included in the change in accounts receivable in the Company's Consolidated Statements of Cash Flows. Fees incurred in connection with the agreements are recorded as interest expense by the Company.
Certain contractual cash obligations and other commitments will impact our short and long-term liquidity. At
February 28, 2018
, such obligations and commitments are as follows:
38
|
|
Amount of Commitment Expiration per Period
|
|||||||||||||||||||
|
|
|
Less than
|
1-3
|
4-5
|
After
|
|||||||||||||||
|
Contractual Cash Obligations
|
Total
|
1 Year
|
Years
|
Years
|
5 Years
|
|||||||||||||||
|
Capital lease obligation (1)
|
$
|
1,011
|
|
$
|
312
|
|
$
|
581
|
|
$
|
118
|
|
$
|
—
|
|
|||||
|
Operating leases (2)
|
2,923
|
|
1,341
|
|
912
|
|
466
|
|
204
|
|
||||||||||
|
Total contractual cash obligations
|
$
|
3,934
|
|
$
|
1,653
|
|
$
|
1,493
|
|
$
|
584
|
|
$
|
204
|
|
|||||
|
Other Commitments
|
||||||||||||||||||||
|
Bank obligations (3)
|
$
|
6,119
|
|
$
|
6,119
|
|
$
|
—
|
|
$
|
—
|
|
$
|
—
|
|
|||||
|
Stand-by letters of credit (4)
|
1,161
|
|
1,161
|
|
—
|
|
—
|
|
—
|
|
||||||||||
|
Other (5)
|
12,746
|
|
1,611
|
|
4,022
|
|
998
|
|
6,115
|
|
||||||||||
|
Contingent earn-out payments and other (6)
|
507
|
|
270
|
|
237
|
|
—
|
|
—
|
|
||||||||||
|
Pension obligation (7)
|
697
|
|
—
|
|
—
|
|
—
|
|
697
|
|
||||||||||
|
Unconditional purchase obligations (8)
|
61,869
|
|
61,869
|
|
—
|
|
—
|
|
—
|
|
||||||||||
|
Total commercial commitments
|
$
|
83,099
|
|
$
|
71,030
|
|
$
|
4,259
|
|
$
|
998
|
|
$
|
6,812
|
|
|||||
|
Total Commitments
|
$
|
87,033
|
|
$
|
72,683
|
|
$
|
5,752
|
|
$
|
1,582
|
|
$
|
7,016
|
|
|||||
|
(1)
|
Represents total principal payments due under capital lease obligations which have a current (included in other current liabilities) and long-term principal balance totaling
$312
and
$699
, respectively at
February 28, 2018
.
|
|
(2)
|
We enter into operating leases in the normal course of business.
|
|
(3)
|
Represents amounts outstanding under the Voxx Germany Euro asset-based lending facility at
February 28, 2018
.
|
|
(4)
|
We issue standby letters of credit to secure certain purchases and insurance requirements. These letters of credit are issued during the ordinary course of business through major domestic banks as requested by certain suppliers.
|
|
(5)
|
This amount includes balances outstanding under loans and mortgages for the construction of our manufacturing facility in Florida and for facilities purchased at Schwaiger and Voxx Germany.
|
|
(6)
|
Represents contingent consideration payments due in connection with the Rosen acquisition.
|
|
(7)
|
Represents the liability for an employer defined benefit pension plan covering certain eligible employees of Voxx Germany.
|
|
(8)
|
Open purchase obligations represent inventory commitments. These obligations are not recorded in the consolidated financial statements until commitments are fulfilled and such obligations are subject to change based on negotiations with manufacturers.
|
We regularly review our cash funding requirements and attempt to meet those requirements through a combination of cash on hand, cash provided by operations, available borrowings under bank lines of credit and possible future public or private debt and/or equity offerings. At times, we evaluate possible acquisitions of, or investments in, businesses that are complementary to ours, which transactions may require the use of cash. We believe that our cash, other liquid assets, operating cash flows, credit arrangements, access to equity capital markets, taken together, provides adequate resources to fund ongoing operating expenditures. In the event that they do not, we may require additional funds in the future to support our working capital requirements or for other purposes and may seek to raise such additional funds through the sale of public or private equity and/or debt financings as well as from other sources. No assurance can be given that additional financing will be available in the future or that if available, such financing will be obtainable on terms favorable when required.
Off-Balance Sheet Arrangements
We do not maintain any off-balance sheet arrangements, transactions, obligations or other relationships with unconsolidated entities that would be expected to have a material current or future effect upon our financial condition or results of operations.
Impact of Inflation and Currency Fluctuation
39
Voxx conducts business in various non-U.S. countries including Germany, Canada, Mexico, China, Denmark, the Netherlands and France and thus is exposed to market risk for changes in foreign currency exchange rates. While the prices we pay for products purchased from our suppliers are principally denominated in United States dollars, price negotiations depend in part on the foreign currency of foreign manufacturers, as well as market, trade and political factors. The Company also has exposure related to transactions in which the currency collected from customers is different from the currency utilized to purchase the product sold in its foreign operations, and U. S. dollar denominated purchases in its foreign subsidiaries. The Company enters forward contracts to hedge certain euro-related transactions. The Company minimizes the risk of nonperformance on the forward contracts by transacting with major financial institutions. During Fiscal
2018
,
2017
and
2016
, the Company held forward contracts specifically designated for hedging (see Note 1(e) of the Notes to Consolidated Financial Statements). As of
February 28, 2018
and
February 28, 2017
, unrealized (losses) gains of $
(1,635)
and $
442
, respectively, were recorded in other comprehensive income associated with these contracts.
Effective January 1, 2010, according to the guidelines in ASC 830, Venezuela was designated as a hyper-inflationary economy. A hyper-inflationary economy designation occurs when a country has experienced cumulative inflation of approximately 100 percent or more over a 3-year period. The hyper-inflationary designation requires the local subsidiary in Venezuela to record all transactions as if they were denominated in U.S. dollars. The Company transitioned to hyper-inflationary accounting on March 1, 2010 for Venezuela and continues to account for the subsidiary under this method.
Since January 2014, the Venezuelan government has created multiple alternative exchange rates designated to be used for the purchase of goods and services deemed non-essential. In February 2015, the Venezuelan government introduced a new currency system, referred to as the Marginal Currency System, or SIMADI rate. This market-based exchange system consisted of a mechanism from which both businesses and individuals were allowed to purchase and sell foreign currency at the price set by the market. At
February 29, 2016
this rate was approximately
205
Bolivar Fuerte/$1 and a net currency exchange loss of
$2
was recorded for the year ended
February 29, 2016
. In March 2016, the Venezuelan government enacted further changes to its foreign currency exchange mechanisms, including a 59% devaluation of the official government exchange rate (re-named DIPRO) from
6.3
bolivars to
10
Bolivar Fuerte/$1. The SIMADI exchange rate was replaced by the DICOM exchange rate, which the Venezuelan government reported would be allowed to float to meet market needs. As of
February 28, 2017
, the DICOM rate was deemed to be the appropriate rate to use for remeasuring its Venezuelan subsidiary’s financial statements and the published rate offered was
700
Bolivar Fuerte/$1. A net currency exchange loss of
$8
was recorded for the year ended
February 28, 2017
. In January 2018, the Venezuelan government eliminated the government DIPRO rate, stating that all currency transactions must now be carried out at the DICOM rate. As of
February 28, 2018
, the published DICOM rate was
35,280
Bolivar Fuerte/$1. A net currency exchange loss of
$148
was recorded for the year ended
February 28, 2018
. All currency exchange gains and losses are included in Other Income (Expense) on the Consolidated Statements of Operations and Comprehensive Income (Loss).
The Company has certain U. S. dollar denominated assets and liabilities in its Venezuelan subsidiary, including our U.S. dollar denominated intercompany debt, which has been subject to currency fluctuations associated with the devaluation of the VBF.
Seasonality
We typically experience seasonality in our operations. We generally sell a substantial amount of our products during September, October and November due to increased promotional and advertising activities during the holiday season. Our business is also significantly impacted by the holiday season.
Related Party Transactions
None noted.
Recent Accounting Pronouncements
We are required to adopt certain new accounting pronouncements. See Note 1(w) of the Notes to the Consolidated Financial Statements of this Annual Report on Form 10-K.
The market risk inherent in our market instruments and positions is the potential loss arising from adverse changes in marketable equity security prices, interest rates and foreign currency exchange rates.
Marketable Securities
40
Marketable securities at
February 28, 2018
, which are recorded at fair value of
$3,620
, include an unrealized gain of
$0
and have exposure to price fluctuations. This risk is estimated as the potential loss in fair value resulting from a hypothetical 10% adverse change in prices quoted by stock exchanges and amounts to $362 as of
February 28, 2018
. Actual results may differ.
Interest Rate Risk
Our earnings and cash flows are subject to fluctuations due to changes in interest rates on investment of available cash balances in money market funds and investment grade corporate and U.S. government securities. In addition, our bank loans expose us to changes in short-term interest rates since interest rates on the underlying obligations are either variable or fixed. In connection with our Florida Mortgage, we have debt outstanding in the amount
$8,613
at
February 28, 2018
. Interest on the Florida Mortgage is charged at 70% of 1-month LIBOR plus 1.54%. We have an interest rate swap for the Florida Mortgage with a notional amount of
$8,613
at
February 28, 2018
which locks the interest rate at 3.48% (inclusive of credit spread) through the mortgage end date of March 2026.
Foreign Exchange Risk
We are subject to risk from changes in foreign exchange rates for our subsidiaries and marketable securities that use a foreign currency as their functional currency and are translated into U.S. dollars. These changes result in cumulative translation adjustments, which are included in Accumulated Other Comprehensive Income (Loss). At
February 28, 2018
, we had translation exposure to various foreign currencies with the most significant being the Euro, Hong Kong Dollar, Chinese Yuan, and Mexican Peso. The potential decrease in sales, and net income, resulting from a hypothetical 10% adverse change in quoted foreign currency exchange rates for the year ended
February 28, 2018
amounts to approximately $8,783 and $476, respectively. Actual results may differ.
The Company continues to monitor the political and economic climate in Venezuela. Venezuela did not have any sales for the year ended
February 28, 2018
. Approximately
$11
of assets invested in Venezuela are cash related and are subject to government foreign exchange controls. The Company also maintains
$3,542
in real estate property in Venezuela that could be subject to government foreign exchange controls upon their ultimate sale.
The information required by this item begins on page
39
of this Annual Report on Form 10-K and is incorporated herein by reference.
None.
Evaluation of Disclosure Controls and Procedures
VOXX International Corporation and subsidiaries (the "Company") maintains disclosure controls and procedures that are designed to ensure that information required to be disclosed in the reports that the Company files or submits under the Securities and Exchange Act is recorded, processed, summarized, and reported within the time periods specified in accordance with the SEC's rules and regulations, and that such information is accumulated and communicated to the Company’s management, including its Chief Executive Officer and Chief Financial Officer, as appropriate, to allow timely decisions regarding required financial disclosures.
As of the end of the period covered by this report, the Company carried out an evaluation, under the supervision and with the participation of the Company’s management, including the Chief Executive Officer and Chief Financial Officer, of the effectiveness of the design and operation of its disclosure controls and procedures pursuant to the Securities and Exchange Act Rule 13a-15. Based upon this evaluation as of
February 28, 2018
, the Chief Executive Officer and Chief Financial Officer concluded that the Company’s disclosure controls and procedures were deemed to be effective and adequately designed.
Management's Report on Internal Control Over Financial Reporting
The Company’s management is responsible for establishing and maintaining adequate internal control over financial reporting; as such term is defined in the Securities and Exchange Act Rules 13a-15(f) and 15d-15(f). The Company’s internal control over financial reporting is a process designed to provide reasonable assurance regarding the reliability of financial reporting and the
41
preparation of financial statements for external purposes in accordance with generally accepted accounting principles and includes those policies and procedures that:
|
•
|
Pertain to the maintenance of records that in reasonable detail accurately and fairly reflect the transactions and dispositions of the assets of the Company;
|
|
•
|
Provide reasonable assurance that transactions are recorded as necessary to permit preparation of financial statements in accordance with generally accepted accounting principles, and that receipts and expenditures of the Company are being made only in accordance with authorizations of management and directors of the Company; and
|
|
•
|
Provide reasonable assurance regarding prevention or timely detection of unauthorized acquisition, use or disposition of the Company’s assets that could have a material effect on the financial statements.
|
Because of its inherent limitations, internal control over financial reporting may not prevent or detect misstatements. Projections of any evaluation of effectiveness to future periods are subject to the risk that controls may become inadequate because of changes in conditions, or that the degree of compliance with the policies or procedures may deteriorate.
Under the supervision, and with the participation of the Company’s management, including the Chief Executive Officer and Chief Financial Officer, the Company evaluated the effectiveness of the Company’s internal control over financial reporting as of
February 28, 2018
based on the framework set forth by the 2013 Internal Control-Integrated Framework issued by the Committee of Sponsoring Organizations of the Treadway Commission (the "2013 COSO Framework"). Based on that evaluation, management concluded that the Company's internal control over financial reporting was effective as of
February 28, 2018
based on the criteria established in the 2013 COSO Framework.
The certifications of the Company’s Chief Executive Officer and Chief Financial Officer included in Exhibits 31.1 and 31.2 to this Annual Report on Form 10-K includes, in paragraph 4 of such certifications, information concerning the Company’s disclosure controls and procedures and internal control over financial reporting. Such certifications should be read in conjunction with the information contained in this Item 9A. Controls and Procedures, for a more complete understanding of the matters covered by such certifications.
The effectiveness of the Company’s internal control over financial reporting as of
February 28, 2018
has been audited by Grant Thornton LLP, an independent registered public accounting firm who also audited the Company’s Consolidated Financial Statements. Grant Thornton LLP’s report on the effectiveness of the Company’s internal control over financial reporting is included below.
42
REPORT OF INDEPENDENT REGISTERED PUBLIC ACCOUNTING FIRM
Board of Directors and Stockholders
VOXX International Corporation
Opinion on internal control over financial reporting
We have audited the internal control over financial reporting of VOXX International Corporation (a Delaware corporation) and subsidiaries (the “Company”) as of February 28, 2018, based on criteria established in the 2013
Internal Control-Integrated Framework
issued by the Committee of Sponsoring Organizations of the Treadway Commission (“COSO”). In our opinion, the Company maintained, in all material respects, effective internal control over financial reporting as of February 28, 2018, based on criteria established in the 2013
Internal Control-Integrated Framework
issued by COSO.
We also have audited, in accordance with the standards of the Public Company Accounting Oversight Board (United States) (“PCAOB”), the consolidated
financial statements of the Company as of and for the year ended February 28, 2018 and our report dated May 14, 2018 expressed an unqualified opinion on those financial statements.
Basis for opinion
The Company’s management is responsible for maintaining effective internal control over financial reporting and for its assessment of the effectiveness of internal control over financial reporting, included in the accompanying
Management’s Report on Internal Control over Financial Reporting. Our responsibility is to express an opinion on the Company’s internal control over financial reporting based on our audit. We are a public accounting firm registered with the PCAOB and are required to be independent with respect to the Company in accordance with the U.S. federal securities laws and the applicable rules and regulations of the Securities and Exchange Commission and the PCAOB.
We conducted our audit in accordance with the standards of the PCAOB. Those standards require that we plan and perform the audit to obtain reasonable assurance about whether effective internal control over financial reporting was maintained in all material respects. Our audit included obtaining an understanding of internal control over financial reporting, assessing the risk that a material weakness exists, testing and evaluating the design and operating effectiveness of internal control based on the assessed risk, and performing such other procedures as we considered necessary in the circumstances. We believe that our audit provides a reasonable basis for our opinion.
Definition and limitations of internal control over financial reporting
A company’s internal control over financial reporting is a process designed to provide reasonable assurance regarding the reliability of financial reporting and the preparation of financial statements for external purposes in accordance with generally accepted accounting principles. A company’s internal control over financial reporting includes those policies and procedures that (1) pertain to the maintenance of records that, in reasonable detail, accurately and fairly reflect the transactions and dispositions of the assets of the company; (2) provide reasonable assurance that transactions are recorded as necessary to permit preparation of financial statements in accordance with generally accepted accounting principles, and that receipts and expenditures of the company are being made only in accordance with authorizations of management and directors of the company; and (3) provide reasonable assurance regarding prevention or timely detection of unauthorized acquisition, use, or disposition of the company’s assets that could have a material effect on the financial statements.
Because of its inherent limitations, internal control over financial reporting may not prevent or detect misstatements. Also, projections of any evaluation of effectiveness to future periods are subject to the risk that controls may become inadequate because of changes in conditions, or that the degree of compliance with the policies or procedures may deteriorate.
/s/ GRANT THORNTON LLP
Melville, New York
May 14, 2018
43
Changes in Internal Controls Over Financial Reporting
There were no material changes in our internal control over financial reporting (as such term is defined in Exchange Act Rules 13a-15(f) and 15d-15(f)) during the most recently completed fiscal fourth quarter ended
February 28, 2018
covered by this report, that have materially affected, or are reasonably likely to materially affect, our internal controls over financial reporting.
Not Applicable
The information required by Item 10 (Directors, Executive Officers and Corporate Governance), Item 11 (Executive Compensation), Item 12 (Security Ownership of Certain Beneficial Owners and Management and Related Stockholder Matters), Item 13 (Certain Relationships and Related Transactions, and Director Independence) and Item 14 (Principal Accounting Fees and Services) of Form 10-K, will be included in our Proxy Statement for the Annual meeting of Stockholders, which will be filed on or before
June 8, 2018
, and such information is incorporated herein by reference.
(1 and 2) Financial Statements and Financial Statement Schedules. See Index to Consolidated Financial Statements attached hereto.
(3) Exhibits. A list of exhibits is included subsequent to Schedule II on page S-1.
44
VOXX INTERNATIONAL CORPORATION
INDEX TO CONSOLIDATED FINANCIAL STATEMENTS
|
Financial Statements:
|
Page
|
|
Report of Independent Registered Public Accounting Firm
|
|
|
Consolidated Balance Sheets as of February 28, 2018 and February 28, 2017
|
|
|
Consolidated Statements of Operations and Comprehensive Income (Loss) for the years ended February 28, 2018, February 28, 2017 and February 29, 2016
|
|
|
Consolidated Statements of Stockholders’ Equity for the years ended February 28, 2018, February 28, 2017 and February 29, 2016
|
|
|
Consolidated Statements of Cash Flows for the years ended February 28, 2018, February 28, 2017 and February 29, 2016
|
|
|
Notes to Consolidated Financial Statements
|
|
|
Financial Statement Schedule:
|
|
|
Schedule II - Valuation and Qualifying Accounts
|
|
45
REPORT OF INDEPENDENT REGISTERED PUBLIC ACCOUNTING FIRM
Board of Directors and Stockholders
VOXX International Corporation
Opinion on the financial statements
We have audited the accompanying consolidated balance sheets of VOXX International Corporation (a Delaware corporation) and subsidiaries (the “Company”) as of February 28, 2018 and 2017, the related consolidated statements of operations and comprehensive income (loss), stockholders’ equity, and cash flows for each of the three years in the period ended February 28, 2018 and the related notes and schedule listed in the index appearing under Item 15 (collectively referred to as the “financial statements”). In our opinion, the financial statements present fairly, in all material respects, the financial position of the Company as of February 28, 2018 and 2017, and the results of its operations and its cash flows for each of the three years in the period ended February 28, 2018, in conformity with accounting principles generally accepted in the United States of America.
We also have audited, in accordance with the standards of the Public Company Accounting Oversight Board (United States) (“PCAOB”), the Company’s internal control over financial reporting as of February 28, 2018, based on criteria established in the 2013
Internal Control-Integrated Framework
issued by the Committee of Sponsoring Organizations of the Treadway Commission (“COSO”), and our report dated May 14, 2018
expressed an unqualified opinion.
Basis for opinion
These financial statements are the responsibility of the Company’s management. Our responsibility is to express an opinion on the Company’s financial statements based on our audits. We are a public accounting firm registered with the PCAOB and are required to be independent with respect to the Company in accordance with the U.S. federal securities laws and the applicable rules and regulations of the Securities and Exchange Commission and the PCAOB.
We conducted our audits in accordance with the standards of the PCAOB. Those standards require that we plan and perform the audit to obtain reasonable assurance about whether the financial statements are free of material misstatement, whether due to error or fraud. Our audits included performing procedures to assess the risks of material misstatement of the financial statements, whether due to error or fraud, and performing procedures that respond to those risks. Such procedures included examining, on a test basis, evidence supporting the amounts and disclosures in the financial statements. Our audits also included evaluating the accounting principles used and significant estimates made by management, as well as evaluating the overall presentation of the financial statements. We believe that our audits provide a reasonable basis for our opinion.
/s/ GRANT THORNTON LLP
We have served as the Company's auditor since 2003.
Melville, New York
May 14, 2018
46
VOXX International Corporation and Subsidiaries
February 28, 2018
and
February 28, 2017
(In thousands, except share data)
47
|
|
|||||||
|
February 28,
2018 |
February 28,
2017 |
||||||
|
Assets
|
|
|
|||||
|
Current assets:
|
|
|
|||||
|
Cash and cash equivalents
|
$
|
51,740
|
|
$
|
956
|
|
|
|
Accounts receivable, net
|
81,116
|
|
79,971
|
|
|||
|
Inventory, net
|
117,992
|
|
122,352
|
|
|||
|
Receivables from vendors
|
493
|
|
634
|
|
|||
|
Prepaid expenses and other current assets
|
14,007
|
|
12,332
|
|
|||
|
Income tax receivable
|
511
|
|
1,596
|
|
|||
|
Assets held for sale, current
|
—
|
|
55,507
|
|
|||
|
Total current assets
|
265,859
|
|
273,348
|
|
|||
|
Investment securities
|
4,167
|
|
10,388
|
|
|||
|
Equity investments
|
21,857
|
|
21,926
|
|
|||
|
Property, plant and equipment, net
|
65,259
|
|
65,589
|
|
|||
|
Goodwill
|
54,785
|
|
53,905
|
|
|||
|
Intangible assets, net
|
150,320
|
|
154,939
|
|
|||
|
Deferred tax assets
|
24
|
|
23
|
|
|||
|
Other assets
|
13,373
|
|
1,699
|
|
|||
|
Assets held for sale, non-current
|
—
|
|
86,669
|
|
|||
|
Total assets
|
$
|
575,644
|
|
$
|
668,486
|
|
|
|
Liabilities and Stockholders' Equity
|
|
|
|
|
|||
|
Current liabilities:
|
|
|
|
|
|||
|
Accounts payable
|
$
|
34,700
|
|
$
|
46,244
|
|
|
|
Accrued expenses and other current liabilities
|
36,350
|
|
32,110
|
|
|||
|
Income taxes payable
|
2,587
|
|
703
|
|
|||
|
Accrued sales incentives
|
14,020
|
|
13,154
|
|
|||
|
Current portion of long-term debt
|
7,730
|
|
9,215
|
|
|||
|
Liabilities held for sale, current
|
—
|
|
28,641
|
|
|||
|
Total current liabilities
|
95,387
|
|
130,067
|
|
|||
|
Long-term debt, net of debt issuance costs
|
8,476
|
|
97,747
|
|
|||
|
Capital lease obligation
|
699
|
|
926
|
|
|||
|
Deferred compensation
|
3,369
|
|
3,844
|
|
|||
|
Deferred tax liabilities
|
12,217
|
|
27,627
|
|
|||
|
Other tax liabilities
|
2,191
|
|
3,194
|
|
|||
|
Other long-term liabilities
|
3,187
|
|
2,125
|
|
|||
|
Liabilities held for sale, non-current
|
—
|
|
11,641
|
|
|||
|
Total liabilities
|
125,526
|
|
277,171
|
|
|||
|
Commitments and contingencies
|
|
|
|
|
|||
|
Stockholders' equity:
|
|
|
|
|
|||
|
Preferred stock:
|
|||||||
|
No shares issued or outstanding (see Note 9)
|
—
|
|
—
|
|
|||
|
Common stock:
|
|||||||
|
Class A, $.01 par value; 60,000,000 shares authorized, 24,106,194 and 24,067,444 shares issued and 21,938,100 and 21,899,370 shares outstanding at February 28, 2018 and February 28, 2017, respectively
|
256
|
|
256
|
|
|||
|
Class B Convertible, $.01 par value, 10,000,000 shares authorized, 2,260,954 shares issued and outstanding
|
22
|
|
22
|
|
|||
|
Paid-in capital
|
296,395
|
|
295,432
|
|
|||
|
Retained earnings
|
194,673
|
|
159,369
|
|
|||
|
Accumulated other comprehensive loss
|
(14,222
|
)
|
(43,898
|
)
|
|||
|
Treasury stock, at cost, 2,168,094 and 2,168,074 shares of Class A Common Stock at February 28, 2018 and February 28, 2017, respectively
|
(21,176
|
)
|
(21,176
|
)
|
|||
|
Total VOXX International Corporation stockholders' equity
|
455,948
|
|
390,005
|
|
|||
|
Non-controlling interest
|
(5,830
|
)
|
1,310
|
|
|||
|
Total stockholders' equity
|
450,118
|
|
391,315
|
|
|||
|
Total liabilities and stockholders' equity
|
$
|
575,644
|
|
$
|
668,486
|
|
|
See accompanying notes to consolidated financial statements.
48
VOXX International Corporation and Subsidiaries
Years Ended
February 28, 2018
,
February 28, 2017
and
February 29, 2016
(In thousands, except share and per share data)
|
Year Ended
|
Year Ended
|
Year Ended
|
|||||||||
|
February 28,
2018 |
February 28,
2017 |
February 29,
2016 |
|||||||||
|
Net sales
|
$
|
507,092
|
|
$
|
514,530
|
|
$
|
530,206
|
|
||
|
Cost of sales
|
374,795
|
|
370,500
|
|
386,670
|
|
|||||
|
Gross profit
|
132,297
|
|
144,030
|
|
143,536
|
|
|||||
|
Operating expenses:
|
|
|
|
|
|
|
|||||
|
Selling
|
45,999
|
|
43,108
|
|
43,576
|
|
|||||
|
General and administrative
|
78,957
|
|
79,573
|
|
84,234
|
|
|||||
|
Engineering and technical support
|
26,440
|
|
29,517
|
|
22,923
|
|
|||||
|
Intangible asset impairment charges
|
—
|
|
—
|
|
9,070
|
|
|||||
|
Acquisition related costs
|
—
|
|
—
|
|
800
|
|
|||||
|
Total operating expenses
|
151,396
|
|
152,198
|
|
160,603
|
|
|||||
|
Operating loss
|
(19,099
|
)
|
(8,168
|
)
|
(17,067
|
)
|
|||||
|
Other (expense) income:
|
|
|
|
|
|
|
|||||
|
Interest and bank charges
|
(6,009
|
)
|
(7,105
|
)
|
(7,898
|
)
|
|||||
|
Equity in income of equity investee
|
7,178
|
|
6,797
|
|
6,538
|
|
|||||
|
Investment gain
|
1,416
|
|
—
|
|
—
|
|
|||||
|
Gain on bargain purchase
|
—
|
|
—
|
|
4,679
|
|
|||||
|
Other, net
|
(7,590
|
)
|
(454
|
)
|
576
|
|
|||||
|
Total other (expense) income, net
|
(5,005
|
)
|
(762
|
)
|
3,895
|
|
|||||
|
Loss from continuing operations before income taxes
|
(24,104
|
)
|
(8,930
|
)
|
(13,172
|
)
|
|||||
|
Income tax (benefit) expense from continuing operations
|
(17,445
|
)
|
338
|
|
(2,351
|
)
|
|||||
|
Net loss from continuing operations
|
$
|
(6,659
|
)
|
$
|
(9,268
|
)
|
$
|
(10,821
|
)
|
||
|
Net income from discontinued operations, net of tax (Note 2)
|
34,618
|
|
6,066
|
|
4,758
|
|
|||||
|
Net income (loss)
|
$
|
27,959
|
|
$
|
(3,202
|
)
|
$
|
(6,063
|
)
|
||
|
Less: net loss attributable to non-controlling interest
|
(7,345
|
)
|
(7,624
|
)
|
(3,381
|
)
|
|||||
|
Net income (loss) attributable to VOXX International Corporation
|
$
|
35,304
|
|
$
|
4,422
|
|
$
|
(2,682
|
)
|
||
|
Other comprehensive income (loss):
|
|||||||||||
|
Foreign currency translation adjustments
|
28,804
|
|
(3,194
|
)
|
(5,702
|
)
|
|||||
|
Derivatives designated for hedging, net of tax
|
(698
|
)
|
210
|
|
(2,440
|
)
|
|||||
|
Pension plan adjustments, net of tax
|
1,496
|
|
(180
|
)
|
640
|
|
|||||
|
Unrealized holding gain (loss) on available-for-sale investment securities arising during the period, net of tax
|
74
|
|
(17
|
)
|
20
|
|
|||||
|
Other comprehensive income (loss), net of tax
|
29,676
|
|
(3,181
|
)
|
(7,482
|
)
|
|||||
|
Comprehensive income (loss) attributable to VOXX International Corporation
|
$
|
64,980
|
|
$
|
1,241
|
|
$
|
(10,164
|
)
|
||
|
Earnings (loss) per share - basic:
|
|||||||||||
|
Continuing operations
|
$
|
0.03
|
|
$
|
(0.07
|
)
|
$
|
(0.31
|
)
|
||
|
Discontinued operations
|
$
|
1.43
|
|
$
|
0.25
|
|
$
|
0.20
|
|
||
|
Attributable to VOXX International Corporation
|
$
|
1.45
|
|
$
|
0.18
|
|
$
|
(0.11
|
)
|
||
49
|
Earnings (loss) per share - diluted:
|
|||||||||||
|
Continuing operations
|
$
|
0.03
|
|
$
|
(0.07
|
)
|
$
|
(0.31
|
)
|
||
|
Discontinued operations
|
$
|
1.41
|
|
$
|
0.25
|
|
$
|
0.20
|
|
||
|
Attributable to VOXX International Corporation
|
$
|
1.44
|
|
$
|
0.18
|
|
$
|
(0.11
|
)
|
||
|
Weighted-average common shares outstanding (basic)
|
24,290,563
|
|
24,160,324
|
|
24,172,710
|
|
|||||
|
Weighted-average common shares outstanding (diluted)
|
24,547,246
|
|
24,160,324
|
|
24,172,710
|
|
|||||
See accompanying notes to consolidated financial statements.
50
VOXX International Corporation and Subsidiaries
Consolidated Statements of Stockholders' Equity
Years Ended
February 28, 2018
,
February 28, 2017
and
February 29, 2016
(In thousands, except share data)
|
Class A
and Class B
Common
Stock
|
Paid-in
Capital
|
Retained
Earnings
|
Accumulated
Other
Comprehensive
Income (Loss)
|
Non-controlling Interests
|
Treasury
Stock
|
Total
Stock-
holders'
Equity
|
||||||||||||||||||||||
|
Balances at February 28, 2015
|
$
|
277
|
|
$
|
292,427
|
|
$
|
157,629
|
|
$
|
(33,235
|
)
|
$
|
—
|
|
$
|
(20,958
|
)
|
$
|
396,140
|
|
|||||||
|
Net loss
|
—
|
|
—
|
|
(2,682
|
)
|
—
|
|
(3,381
|
)
|
—
|
|
(6,063
|
)
|
||||||||||||||
|
Other comprehensive loss, net of tax
|
—
|
|
—
|
|
—
|
|
(7,482
|
)
|
—
|
|
—
|
|
(7,482
|
)
|
||||||||||||||
|
Fair value of non-controlling interest
|
—
|
|
—
|
|
—
|
|
—
|
|
12,900
|
|
—
|
|
12,900
|
|
||||||||||||||
|
Receivable from selling shareholders
|
—
|
|
—
|
|
—
|
|
—
|
|
(1,200
|
)
|
—
|
|
(1,200
|
)
|
||||||||||||||
|
Exercise of stock options into 64,204 shares of common stock
|
1
|
|
436
|
|
—
|
|
—
|
|
—
|
|
—
|
|
437
|
|
||||||||||||||
|
Stock-based compensation expense
|
—
|
|
1,179
|
|
—
|
|
—
|
|
205
|
|
—
|
|
1,384
|
|
||||||||||||||
|
Repurchase of 39,529 shares of common stock
|
—
|
|
—
|
|
—
|
|
—
|
|
—
|
|
(227
|
)
|
(227
|
)
|
||||||||||||||
|
Issuance of 905 shares of treasury stock
|
—
|
|
(4
|
)
|
—
|
|
—
|
|
—
|
|
9
|
|
5
|
|
||||||||||||||
|
Balances at February 29, 2016
|
278
|
|
294,038
|
|
154,947
|
|
(40,717
|
)
|
8,524
|
|
(21,176
|
)
|
395,894
|
|
||||||||||||||
|
Net income (loss)
|
—
|
|
—
|
|
4,422
|
|
—
|
|
(7,624
|
)
|
—
|
|
(3,202
|
)
|
||||||||||||||
|
Other comprehensive loss, net of tax
|
—
|
|
—
|
|
—
|
|
(3,181
|
)
|
—
|
|
—
|
|
(3,181
|
)
|
||||||||||||||
|
Stock-based compensation expense
|
—
|
|
1,394
|
|
—
|
|
—
|
|
410
|
|
—
|
|
1,804
|
|
||||||||||||||
|
Balances at February 28, 2017
|
278
|
|
295,432
|
|
159,369
|
|
(43,898
|
)
|
1,310
|
|
(21,176
|
)
|
391,315
|
|
||||||||||||||
|
Net income (loss)
|
—
|
|
—
|
|
35,304
|
|
—
|
|
(7,345
|
)
|
—
|
|
27,959
|
|
||||||||||||||
|
Other comprehensive income, net of tax
|
—
|
|
—
|
|
—
|
|
29,676
|
|
—
|
|
—
|
|
29,676
|
|
||||||||||||||
|
Exercise of stock options into 38,750 shares of common stock
|
—
|
|
300
|
|
—
|
|
—
|
|
—
|
|
—
|
|
300
|
|
||||||||||||||
|
Stock-based compensation expense
|
—
|
|
663
|
|
—
|
|
—
|
|
205
|
|
—
|
|
868
|
|
||||||||||||||
|
Balances at February 28, 2018
|
$
|
278
|
|
$
|
296,395
|
|
$
|
194,673
|
|
$
|
(14,222
|
)
|
$
|
(5,830
|
)
|
$
|
(21,176
|
)
|
$
|
450,118
|
|
|||||||
See accompanying notes to consolidated financial statements.
51
VOXX International Corporation and Subsidiaries
Years Ended
February 28, 2018
,
February 28, 2017
and
February 29, 2016
(Amounts in thousands)
52
|
Year Ended
|
Year Ended
|
Year Ended
|
||||||||||
|
February 28,
2018 |
February 28,
2017 |
February 29,
2016 |
||||||||||
|
Cash flows from operating activities:
|
|
|
|
|||||||||
|
Net loss from continuing operations
|
$
|
(6,659
|
)
|
$
|
(9,268
|
)
|
$
|
(10,821
|
)
|
|||
|
Net income from discontinued operations
|
34,618
|
|
6,066
|
|
4,758
|
|
||||||
|
Adjustments to reconcile net income (loss) to net cash (used in) provided by operating activities:
|
|
|
|
|
|
|
||||||
|
Depreciation and amortization
|
15,112
|
|
18,294
|
|
15,838
|
|
||||||
|
Amortization of deferred financing costs
|
822
|
|
820
|
|
2,404
|
|
||||||
|
Impairment charges
|
—
|
|
—
|
|
9,070
|
|
||||||
|
Bad debt expense
|
929
|
|
2,126
|
|
774
|
|
||||||
|
Interest on notes receivable from EyeLock, Inc.
|
—
|
|
—
|
|
(677
|
)
|
||||||
|
Loss (gain) on forward contracts
|
6,975
|
|
(947
|
)
|
(3,753
|
)
|
||||||
|
Loss on interest rate swap unwind
|
—
|
|
114
|
|
—
|
|
||||||
|
Equity in income of equity investee
|
(7,178
|
)
|
(6,797
|
)
|
(6,538
|
)
|
||||||
|
Distribution of income from equity investees
|
7,247
|
|
6,820
|
|
6,237
|
|
||||||
|
Deferred income tax expense (benefit), net
|
(15,350
|
)
|
19
|
|
(4,644
|
)
|
||||||
|
(Gain) loss on disposal of property, plant and equipment
|
(11
|
)
|
7
|
|
(449
|
)
|
||||||
|
Non-cash compensation adjustment
|
204
|
|
1,419
|
|
202
|
|
||||||
|
Non-cash stock-based compensation expense
|
552
|
|
753
|
|
859
|
|
||||||
|
Venezuela currency devaluation on investment securities
|
—
|
|
—
|
|
23
|
|
||||||
|
Gain on sale of RxNetworks
|
(1,416
|
)
|
—
|
|
—
|
|
||||||
|
Gain on sale of Hirschmann
|
(36,118
|
)
|
—
|
|
—
|
|
||||||
|
Gain on sale of intangible asset
|
—
|
|
—
|
|
(30
|
)
|
||||||
|
Gain on bargain purchase
|
—
|
|
—
|
|
(4,679
|
)
|
||||||
|
Changes in operating assets and liabilities (net of assets and liabilities) acquired):
|
|
|
|
|
|
|
||||||
|
Accounts receivable
|
1,501
|
|
(6,684
|
)
|
13,683
|
|
||||||
|
Inventory
|
7,150
|
|
(10,227
|
)
|
11,285
|
|
||||||
|
Receivables from vendors
|
474
|
|
2,287
|
|
1,613
|
|
||||||
|
Prepaid expenses and other
|
(11,830
|
)
|
(1,973
|
)
|
8,510
|
|
||||||
|
Investment securities-trading
|
474
|
|
(178
|
)
|
595
|
|
||||||
|
Accounts payable, accrued expenses, accrued sales incentives and other current liabilities
|
(22,139
|
)
|
(1,564
|
)
|
(18,151
|
)
|
||||||
|
Income taxes receivable/payable
|
(896
|
)
|
(2,877
|
)
|
1,412
|
|
||||||
|
Net cash (used in) provided by operating activities
|
(25,539
|
)
|
(1,790
|
)
|
27,521
|
|
||||||
|
Cash flows from investing activities:
|
|
|
|
|
|
|
||||||
|
Purchases of property, plant and equipment
|
(6,238
|
)
|
(12,177
|
)
|
(19,636
|
)
|
||||||
|
Proceeds from sale of property, plant and equipment
|
14
|
|
47
|
|
328
|
|
||||||
|
Proceeds from sale of intangible asset
|
—
|
|
—
|
|
150
|
|
||||||
|
Proceeds from sale of long-term investment
|
2,678
|
|
—
|
|
—
|
|
||||||
|
Increase in notes receivable
|
(3,300
|
)
|
—
|
|
(4,176
|
)
|
||||||
|
Proceeds from sale of short-term investment
|
—
|
|
—
|
|
251
|
|
||||||
|
Purchase of acquired businesses, less cash acquired (see Note 2)
|
(1,814
|
)
|
—
|
|
(15,504
|
)
|
||||||
|
Proceeds from sale of Hirschmann, net of settlement of forward contracts
|
170,020
|
|
—
|
|
—
|
|
||||||
|
Net cash provided by (used in) investing activities
|
161,360
|
|
(12,130
|
)
|
(38,587
|
)
|
||||||
|
Cash flows from financing activities:
|
|
|
|
|
|
|
||||||
|
Borrowings from bank obligations
|
37,603
|
|
60,672
|
|
248,797
|
|
||||||
|
Repayments on bank obligations
|
(129,585
|
)
|
(50,452
|
)
|
(234,429
|
)
|
||||||
|
Principal payments on capital lease obligation
|
(565
|
)
|
(525
|
)
|
(425
|
)
|
||||||
|
Proceeds from exercise of stock options and warrants
|
300
|
|
—
|
|
436
|
|
||||||
|
Deferred financing costs
|
—
|
|
—
|
|
(457
|
)
|
||||||
|
Purchase of treasury stock
|
—
|
|
—
|
|
(227
|
)
|
||||||
|
Net cash (used in) provided by financing activities
|
(92,247
|
)
|
9,695
|
|
13,695
|
|
||||||
|
Effect of exchange rate changes on cash
|
366
|
|
258
|
|
690
|
|
||||||
|
Net increase (decrease) in cash and cash equivalents
|
43,940
|
|
(3,967
|
)
|
3,319
|
|
||||||
|
Cash and cash equivalents at beginning of year
|
(a)
|
7,800
|
|
11,767
|
|
8,448
|
|
|||||
|
Cash and cash equivalents at end of year
|
$
|
51,740
|
|
$
|
7,800
|
|
$
|
11,767
|
|
|||
|
Supplemental Cash Flow Information:
|
|
|
|
|
|
|
||||||
|
Non-cash investing activities:
|
||||||||||||
|
Capital lease obligations
|
$
|
—
|
|
$
|
1,041
|
|
$
|
1,109
|
|
|||
|
Mortgage settlement funded by long-term obligation
|
—
|
|
5,590
|
|
—
|
|
||||||
|
Deferred financing costs funded by long-term obligation
|
—
|
|
1,779
|
|
—
|
|
||||||
|
Investment in equity security exchanged for note receivable
|
4,453
|
|
—
|
|
—
|
|
||||||
|
Acquisition of long-term investment
|
547
|
|
—
|
|
1,453
|
|
||||||
|
Cash paid during the period for:
|
|
|
|
|
|
|
||||||
|
Interest, excluding bank charges
|
$
|
3,752
|
|
$
|
5,195
|
|
$
|
4,336
|
|
|||
|
Income taxes (net of refunds)
|
2,908
|
|
4,409
|
|
1,673
|
|
||||||
(a)
Cash and cash equivalents at February 28, 2015, February 29, 2016, and
February 28, 2017
include
$5,328
,
$6,789
, and
$6,844
, respectively, in current assets held for sale for Hirschmann.
53
See accompanying notes to consolidated financial statements.
54
VOXX International Corporation and Subsidiaries
Notes to Consolidated Financial Statements
February 28, 2018
(Amounts in thousands, except share and per share data)
|
1)
|
Description of Business and Summary of Significant Accounting Policies
|
a)
Description of Business
VOXX International Corporation ("Voxx," "We," "Our," "Us" or "the Company") is a leading international manufacturer and distributor in the Automotive, Premium Audio and Consumer Accessories industries. The Company has widely diversified interests, with more than 30 global brands that it has acquired and grown throughout the years, achieving a powerful international corporate image and creating a vehicle for each of these respective brands to emerge with its own identity. We conduct our business through sixteen wholly-owned subsidiaries: Audiovox Atlanta Corp., VOXX Electronics Corporation, VOXX Accessories Corp., VOXX German Holdings GmbH ("Voxx Germany"), Audiovox Canada Limited, Voxx Hong Kong Ltd., Audiovox International Corp., Audiovox Mexico, S. de R.L. de C.V. ("Voxx Mexico"), Code Systems, Inc., Oehlbach Kabel GmbH ("Oehlbach"), Schwaiger GmbH ("Schwaiger"), Invision Automotive Systems, Inc. ("Invision"), Klipsch Holding LLC ("Klipsch"), Omega Research and Development, LLC ("Omega"), Voxx Automotive Corp., and Audiovox Websales LLC, as well as one majority-owned subsidiary, EyeLock LLC ("EyeLock"). We market our products under the Audiovox® brand name, other brand names and licensed brands, such as 808®, AR for Her®, Acoustic Research®, Advent®, Ambico®, Car Link®, Chapman®, Code-Alarm®, Discwasher®, Energy®, Heco®, Incaar
™
, Invision®, Jamo®, Klipsch®, Mac Audio
™
, Magnat®, Mirage®, myris®, Oehlbach®, Omega®, Phase Linear®, Prestige®, Project Nursery®, Pursuit®, RCA®, RCA Accessories®, Recoton®, Rosen®, Schwaiger®, Terk® and Voxx Automotive, as well as private labels through a large domestic and international distribution network. We also function as an OEM ("Original Equipment Manufacturer") supplier to several customers, as well as market a number of products under exclusive distribution agreements, such as SiriusXM satellite radio products and 360Fly™ Action Cameras.
On August 31, 2017, the Company completed its sale of Hirschmann Car Communication GmbH and its subsidiaries. See Note 2 for more details of this transaction.
b)
Principles of Consolidation, Reclassifications and Accounting Principles
The consolidated financial statements and accompanying notes include the financial statements of VOXX International Corporation and its wholly and majority-owned subsidiaries and have been prepared pursuant to the rules and regulations of the Securities and Exchange Commission and in accordance with accounting principles generally accepted in the United States of America. All significant intercompany balances and transactions have been eliminated in consolidation. The Company acquired a controlling interest in all of the assets and certain liabilities of EyeLock Inc. and EyeLock Corporation effective September 1, 2015, through a newly formed entity, EyeLock LLC ("EyeLock"). The consolidated financial statements include the operations of EyeLock beginning September 1, 2015.
The Company follows FASB Accounting Standards Codification 810-10-65-1 to report a non-controlling interest in the consolidated balance sheets within the equity section, separately from the Company’s retained earnings. Non-controlling interest represents the non-controlling interest holder’s proportionate share of the equity of the Company’s majority-owned subsidiary, EyeLock. Non-controlling interest is adjusted for the non-controlling interest holder’s proportionate share of the earnings or losses and other comprehensive income (loss), if any, and the non-controlling interest continues to be attributed its share of losses even if that attribution results in a deficit non-controlling interest balance.
Equity investments in which the Company exercises significant influence but does not control and is not the primary beneficiary are accounted for using the equity method. The Company's share of its equity method investee's earnings or losses is included in Other Income (Expense) in the accompanying Consolidated Statements of Operations and Comprehensive Income (Loss). The Company eliminates its pro rata share of gross profit on sales to its equity method investee for inventory on hand at the investee at the end of the year. Investments in which the Company does not exercise significant influence over the investee are accounted for under the cost method.
55
The Company's financial statements for the prior periods presented herein have been recast to reflect a certain business that was classified as discontinued operations during the second quarter of Fiscal 2018. See Note 2 for additional information. Net income (loss) per share amounts for continuing and discontinued operations are computed independently. As a result, the sum of the per share amounts may not equal the total.
c)
Use of Estimates
The preparation of these consolidated financial statements requires the Company to make estimates and assumptions that affect reported amounts of assets, liabilities, revenue and expenses. Such estimates include the allowance for doubtful accounts and inventory valuation, recoverability of deferred tax assets, reserve for uncertain tax positions, valuation of long-lived assets, accrued sales incentives, warranty reserves, stock-based compensation, valuation and impairment assessment of investment securities, goodwill, trademarks and other intangible assets, and disclosure of contingent assets and liabilities at the date of the consolidated financial statements. Actual results could differ from those estimates.
d)
Cash and Cash Equivalents
Cash and cash equivalents consist of demand deposits with banks and highly liquid money market funds with original maturities of three months or less when purchased. Cash and cash equivalents amounted to
$51,740
and
$956
at
February 28, 2018
and
February 28, 2017
, respectively. Cash amounts held in foreign bank accounts amounted to
$303
and
$278
at
February 28, 2018
and
February 28, 2017
, respectively. Many of these amounts are in excess of government insurance. The Company places its cash and cash equivalents in institutions and funds of high credit quality. We perform periodic evaluations of these institutions and funds.
e)
Fair Value Measurements and Derivatives
The Company applies the authoritative guidance on "Fair Value Measurements," which among other things, requires enhanced disclosures about investments that are measured and reported at fair value. This guidance establishes a hierarchal disclosure framework that prioritizes and ranks the level of market price observability used in measuring investments at fair value. Market price observability is impacted by a number of factors, including the type of investment and the characteristics specific to the investment. Investments with readily available active quoted prices or for which fair value can be measured from actively quoted prices generally will have a higher degree of market price observability and a lesser degree of judgment used in measuring fair value.
Investments measured and reported at fair value are classified and disclosed in one of the following categories:
Level 1 - Quoted market prices in active markets for identical assets or liabilities.
Level 2 - Inputs other than Level 1 inputs that are either directly or indirectly observable.
Level 3 - Unobservable inputs developed using the Company's estimates and assumptions, which reflect those that market participants would use.
56
The following table presents assets and liabilities measured at fair value on a recurring basis at
February 28, 2018
:
|
|
|
Fair Value Measurements at Reporting Date Using
|
|||||||||
|
|
|
Level 1
|
Level 2
|
||||||||
|
Cash and cash equivalents:
|
|
|
|
||||||||
|
Cash and money market funds
|
$
|
51,740
|
|
$
|
51,740
|
|
$
|
—
|
|
||
|
Derivatives
|
|
|
|
|
|
|
|||||
|
Designated for hedging
|
$
|
(262
|
)
|
$
|
—
|
|
$
|
(262
|
)
|
||
|
Investment securities:
|
|
|
|
|
|
|
|||||
|
Trading securities
|
$
|
3,620
|
|
$
|
3,620
|
|
$
|
—
|
|
||
|
Available-for-sale securities
|
—
|
|
—
|
|
—
|
|
|||||
|
Other investments at amortized cost (a)
|
547
|
|
—
|
|
—
|
|
|||||
|
Total investment securities
|
$
|
4,167
|
|
$
|
3,620
|
|
$
|
—
|
|
||
The following table presents assets and liabilities measured at fair value on a recurring basis at
February 28, 2017
:
|
|
|
Fair Value Measurements at Reporting Date Using
|
|||||||||
|
|
|
Level 1
|
Level 2
|
||||||||
|
Cash and cash equivalents:
|
|
|
|
||||||||
|
Cash and money market funds
|
$
|
956
|
|
$
|
956
|
|
$
|
—
|
|
||
|
Derivatives
|
|
|
|
|
|
|
|||||
|
Designated for hedging
|
$
|
335
|
|
$
|
—
|
|
$
|
335
|
|
||
|
Investment securities:
|
|
|
|
|
|
|
|||||
|
Trading securities
|
$
|
4,094
|
|
$
|
4,094
|
|
$
|
—
|
|
||
|
Available-for-sale securities
|
6
|
|
6
|
|
—
|
|
|||||
|
Other investments at amortized cost (a)
|
6,288
|
|
—
|
|
—
|
|
|||||
|
Total investment securities
|
$
|
10,388
|
|
$
|
4,100
|
|
$
|
—
|
|
||
|
(a)
|
Included in this balance is one investment in a non-controlled corporation at
February 28, 2018
and two investments in non-controlled corporations at
February 28, 2017
accounted for at cost (See Note 1(f)). The fair value of these investments would be based upon Level 3 inputs. At
February 28, 2018
and
February 28, 2017
, it is not practicable to estimate the fair values of these items.
|
The carrying amount of the Company's accounts receivable, short-term debt, accounts payable, accrued expenses, bank obligations and long-term debt approximates fair value because of (i) the short-term nature of the financial instrument; (ii) the interest rate on the financial instrument being reset every quarter to reflect current market rates, or (iii) the stated or implicit interest rate approximates the current market rates or are not materially different than market rates.
Derivative Instruments
The Company's derivative instruments include forward foreign currency contracts utilized to hedge a portion of its foreign currency inventory purchases. The Company also has an interest rate swap agreement as of
February 28, 2018
that hedges interest rate exposure related to the forecasted outstanding balance of its Florida Mortgage with monthly payments due through March 2026. The forward foreign currency derivatives qualifying for hedge accounting are designated as cash flow hedges and valued using observable forward rates for the same or similar instruments (Level 2). The duration of open forward foreign currency contracts ranges from
1 month
57
-
12 months
and are classified in the balance sheet according to their terms. Interest rate swap agreements qualifying for hedge accounting are designated as cash flow hedges and valued based on a comparison of the change in fair value of the actual swap contracts designated as the hedging instruments and the change in fair value of a hypothetical swap contract (Level 2). We calculate the fair value of interest rate swap agreements quarterly based on the quoted market price for the same or similar financial instruments. Interest rate swaps are classified in the balance sheet as either non-current assets or non-current liabilities based on the fair value of the instruments at the end of the period.
Two interest rate swap agreements that hedged interest rate exposure related to the Company's Credit Facility expired on April 30, 2016 and February 28, 2017, respectively, each with a fair value of
$0
on the date of expiration. A third agreement, which hedged interest rate exposure related to the forecasted outstanding balance of one of its mortgage notes, was unwound during the first quarter of Fiscal 2017 when that mortgage was paid in full (see Note 7(e)). The fair value of this interest rate swap agreement on the date it was unwound was
$(114)
, which was charged to interest expense in the Company's Consolidated Statements of Operations and Comprehensive Income (Loss) during the year ended February 28, 2017. The swap agreement related to the Company's Florida Mortgage locks the interest rate on the debt at
3.48%
(inclusive of credit spread) through the maturity date of the mortgage.
It is the Company's policy to enter into derivative instrument contracts with terms that coincide with the underlying exposure being hedged. As such, the Company's derivative instruments are expected to be highly effective. Hedge ineffectiveness, if any, is recognized as incurred through Other Income (Expense) in the Company's Consolidated Statements of Operations and Comprehensive Income (Loss) and amounted to
$(48)
,
$130
and
$93
for the years ended
February 28, 2018
,
February 28, 2017
and
February 29, 2016
respectively.
Financial Statement Classification
The Company holds derivative instruments that are designated as hedging instruments. The following table discloses the fair value as of
February 28, 2018
and
February 28, 2017
for derivative instruments:
|
Derivative Assets and Liabilities
|
||||||||||
|
Fair Value
|
||||||||||
|
Account
|
February 28, 2018
|
February 28, 2017
|
||||||||
|
Designated derivative instruments
|
||||||||||
|
Foreign currency contracts
|
Accrued expenses and other current liabilities
|
$
|
(227
|
)
|
$
|
—
|
|
|||
|
Prepaid expenses and other current assets
|
—
|
|
643
|
|
||||||
|
Interest rate swap
|
Other long-term liabilities
|
(35
|
)
|
(298
|
)
|
|||||
|
Total derivatives
|
$
|
(262
|
)
|
$
|
345
|
|
||||
Cash flow hedges
During Fiscal
2018
, the Company entered into forward foreign currency contracts, which have a current outstanding notional value of
$9,600
at
February 28, 2018
and are designated as cash flow hedges. The current outstanding notional value of the Company's interest rate swap at
February 28, 2018
was
$8,613
. For cash flow hedges, the effective portion of the gain or loss is reported as a component of other comprehensive income and reclassified into earnings in the same period or periods during which the hedged transaction affects earnings.
58
Activity related to cash flow hedges from continuing operations recorded during the twelve months ended
February 28, 2018
and
February 28, 2017
was as follows:
|
February 28, 2018
|
February 28, 2017
|
||||||||||||||||||||||
|
Gain (Loss) Recognized in Other Comprehensive Income
|
Gain (Loss) Reclassified into Cost of Sales
|
Gain (Loss) for Ineffectiveness in Other Income
|
Gain (Loss) Recognized in Other Comprehensive Income
|
Gain (Loss) Reclassified into Cost of Sales
|
Gain (Loss) for Ineffectiveness in Other Income
|
||||||||||||||||||
|
Cash flow hedges
|
|||||||||||||||||||||||
|
Foreign currency contracts
|
$
|
(1,635
|
)
|
$
|
(297
|
)
|
$
|
(48
|
)
|
$
|
442
|
|
$
|
589
|
|
$
|
130
|
|
|||||
|
Interest rate swaps
|
$
|
263
|
|
$
|
—
|
|
$
|
—
|
|
$
|
(449
|
)
|
$
|
(114
|
)
|
$
|
—
|
|
|||||
The net gain recognized in other comprehensive income for foreign currency contracts is expected to be recognized in cost of sales within the next
fifteen months
. No amounts were excluded from the assessment of hedge effectiveness during the respective periods. During the year ended
February 28, 2018
,
no
contracts originally designated for hedge accounting were de-designated. During the year ended February 29, 2016,
seven
contracts originally designated for hedge accounting were de-designated, resulting in a gain of
$64
recorded in Other Income (Expense) for the year ended February 29, 2016 within the Company's Consolidated Statement of Operations and Comprehensive Income (Loss). These contracts have all been settled as of
February 28, 2018
. As of
February 28, 2018
, no contracts originally designated for hedge accounting were terminated. Refer to Note 1(v) for information regarding activity related to cash flow hedges pertaining to discontinued operations.
f)
Investment Securities
In accordance with the Company's investment policy, all long and short-term investment securities are invested in "investment grade" rated securities. As of
February 28, 2018
and
February 28, 2017
, the Company had the following investments:
|
|
February 28, 2018
|
February 28, 2017
|
|||||||||||||||||||||
|
Cost
Basis
|
Unrealized
holding
gain/(loss)
|
Fair
Value
|
Cost
Basis
|
Unrealized
holding
gain/(loss)
|
Fair
Value
|
||||||||||||||||||
|
Investment Securities
|
|
|
|
|
|
|
|
|
|
|
|
|
|||||||||||
|
Marketable Securities
|
|
|
|
|
|
|
|
|
|
|
|
|
|||||||||||
|
Trading
|
|
|
|
|
|
|
|
|
|
|
|
|
|||||||||||
|
Deferred Compensation
|
$
|
3,620
|
|
$
|
—
|
|
$
|
3,620
|
|
$
|
4,094
|
|
$
|
—
|
|
$
|
4,094
|
|
|||||
|
Available-for-sale
|
|
|
|
|
|
|
|
|
|
|
|
|
|||||||||||
|
Cellstar
|
—
|
|
—
|
|
—
|
|
—
|
|
6
|
|
6
|
|
|||||||||||
|
Total Marketable Securities
|
3,620
|
|
—
|
|
3,620
|
|
4,094
|
|
6
|
|
4,100
|
|
|||||||||||
|
Other Long-Term Investments
|
547
|
|
—
|
|
547
|
|
6,288
|
|
—
|
|
6,288
|
|
|||||||||||
|
Total Investment Securities
|
$
|
4,167
|
|
$
|
—
|
|
$
|
4,167
|
|
$
|
10,382
|
|
$
|
6
|
|
$
|
10,388
|
|
|||||
Long-Term Investments
Trading Securities
The Company’s trading securities consist of mutual funds, which are held in connection with the Company’s deferred compensation plan (see Note 10). Unrealized holding gains and losses on trading securities offset those associated with the corresponding deferred compensation liability.
59
Available-For-Sale Securities
The Company’s available-for-sale marketable securities include a less than
20%
equity ownership in CLST Holdings, Inc. ("Cellstar").
Unrealized holding gains and losses, net of the related tax effect (if applicable), on available-for-sale securities are reported as a component of Accumulated Other Comprehensive Income (Loss) until realized. Realized gains and losses from the sale of available-for-sale securities are determined on a specific identification basis and reported in Other Income (Expense).
A decline in the market value of any available-for-sale security below cost that is deemed other-than-temporary results in a reduction in carrying amount to fair value. The impairment is charged to earnings and a new cost basis for the security is established.
No
other-than-temporary losses were incurred for the years ended
February 28, 2018
,
February 28, 2017
or
February 29, 2016
.
Other Long-Term Investments
Other long-term investments include an investment in a non-controlled corporation accounted for by the cost method. On July 31, 2017, RxNetworks, a Canadian company in which Voxx held a cost method investment consisting of shares of the investee's preferred stock, was sold to a third party. In consideration for its holdings in RxNetworks on July 31, 2017, Voxx received cash, as well as a proportionate share of the value (consisting of preferred stock) in a newly formed subsidiary of RxNetworks, called Fathom Systems Inc. ("Fathom"). As a result of this transaction, Voxx recognized a gain of
$1,416
for the year ended
February 28, 2018
. The cash proceeds were subject to a hold-back provision, which was not included in the calculation of the gain recognized. The Company's investment in Fathom totaled
$547
at
February 28, 2018
, and we held
8.1%
of the outstanding shares of this company as of
February 28, 2018
.
At
February 28, 2017
, the Company had an investment in 360fly, Inc., consisting of shares of the investee's preferred stock, totaling
$4,453
, or
4.7%
of the outstanding shares of 360fly, Inc. During Fiscal 2018, the Company issued a total of five senior secured notes to 360fly, Inc. A portion of the notes consists of various miscellaneous balances due to the Company that were consolidated into a senior secured note receivable during the third quarter of the fiscal year. Additionally, one of the notes issued to the investee on
February 28, 2018
was issued in the amount of, and in exchange for, the outstanding equity investment held by the Company on that date of
$4,453
. As a result of this loan, all of the preferred stock shares of 360fly, Inc. owned by Voxx were canceled and the Company has no remaining investment in the equity of 360fly, Inc. as of
February 28, 2018
. Total cash transferred to 360fly, Inc. for these senior secured loans during Fiscal 2018 was
$3,300
. Interest on all of the notes accrues at
8%
. The notes are due on August 31, 2019 and are convertible into equity at the option of the Company only. The total balance of the notes outstanding from 360fly, Inc. at
February 28, 2018
is
$10,888
and is included in Other assets on the Consolidated Balance Sheet.
g)
Revenue Recognition
The Company recognizes revenue from product sales at the time title and risk of loss passes to the customer either at FOB shipping point or FOB destination, based upon terms established with the customer. The Company's selling price to its customers is a fixed amount that is not subject to refund or adjustment or contingent upon additional rebates. Any customer acceptance provisions, which are related to product testing, are satisfied prior to revenue recognition. There are no further obligations on the part of the Company subsequent to revenue recognition except for product returns from the Company's customers. The Company does accept product returns, if properly requested, authorized, and approved by the Company. The Company records an estimate of product returns by its customers and records the provision for the estimated amount of such future returns at point of sale, based on historical experience.
The Company includes all costs incurred for shipping and handling as cost of sales and all amounts billed to customers as revenue. During the years ended
February 28, 2018
,
February 28, 2017
, and
February 29, 2016
, freight costs expensed through cost of sales from continuing operations amounted to
$14,948
,
$14,658
and
60
$14,523
, respectively and freight from continuing operations billed to customers amounted to
$861
,
$729
and
$796
, respectively.
h)
Accounts Receivable
The majority of the Company's accounts receivable are due from companies in the retail, mass merchant and OEM industries. Credit is extended based on an evaluation of a customer's financial condition. Accounts receivable are generally due within
30 days
-
60 days
and are stated at amounts due from customers, net of an allowance for doubtful accounts. Accounts outstanding longer than the contracted payment terms are considered past due.
Accounts receivable is comprised of the following:
|
February 28,
2018 |
February 28,
2017 |
||||||
|
Trade accounts receivable and other
|
$
|
84,517
|
|
$
|
85,699
|
|
|
|
Less:
|
|
|
|
|
|||
|
Allowance for doubtful accounts
|
2,196
|
|
4,495
|
|
|||
|
Allowance for cash discounts
|
1,205
|
|
1,233
|
|
|||
|
|
$
|
81,116
|
|
$
|
79,971
|
|
|
The Company performs ongoing credit evaluations of its customers and adjusts credit limits based upon payment history and the customers' current credit worthiness, as determined by a review of their current credit information. The Company continuously monitors collections and payments from its customers and maintains a provision for estimated credit losses based upon historical experience and any specific customer collection issues that have been identified. While such credit losses have historically been within management's expectations and the provisions established, the Company cannot guarantee it will continue to experience the same credit loss rates that have been experienced in the past. The Company writes off uncollectible accounts receivable when collection efforts have been exhausted. Since the Company's accounts receivable are concentrated in a relatively few number of customers, a significant change in the liquidity or financial position of any one of these customers could have a material adverse impact on the collectability of the Company's accounts receivable and future operating results.
The Company has three supply chain financing agreements and factoring agreements with certain financial institutions to accelerate receivable collection and better manage cash flow. Under the agreements, the Company has agreed to sell these institutions certain of its accounts receivable balances. For those accounts receivables tendered to the banks and that the banks choose to purchase, the banks have agreed to advance an amount equal to the net accounts receivable balances due, less a discount as set forth in the respective agreements. The balances under these agreements are sold without recourse and are accounted for as sales of accounts receivable. Cash proceeds from these agreements are reflected as operating activities included in the change in accounts receivable in the Company's Consolidated Statements of Cash Flows. Total balances from continuing operations sold under the agreements, net of discounts, for the years ended
February 28, 2018
,
February 28, 2017
and
February 29, 2016
were approximately
$142,000
,
$141,000
and
$154,000
, respectively. Fees incurred in connection with the agreements totaled
$957
,
$877
and
$770
for the years ended
February 28, 2018
,
February 28, 2017
and
February 29, 2016
, respectively, and are recorded within Interest and Bank Charges in the Consolidated Statements of Operations.
i)
Inventory
The Company values its inventory at the lower of cost and net realizable value ("NRV") of the inventory. NRV is defined as estimated selling prices less costs of completion, disposal, and transportation. The cost of the inventory is determined primarily on an average basis with a portion valued at standard cost, which approximates actual costs on the first-in, first-out basis. The Company regularly reviews inventory quantities on-hand and records a provision for excess and obsolete inventory based primarily on selling prices, indications from customers based upon current price negotiations and purchase orders. The Company's industry is characterized
61
by rapid technological change and frequent new product introductions that could result in an increase in the amount of obsolete inventory quantities on-hand. In addition, and as necessary, specific reserves for future known or anticipated events may be established. The Company recorded inventory write-downs from continuing operations of
$2,733
,
$1,987
and
$1,008
for the years ended
February 28, 2018
,
February 28, 2017
and
February 29, 2016
, respectively.
Inventories by major category are as follows:
|
February 28,
2018 |
February 28,
2017 |
||||||
|
Raw materials
|
$
|
28,071
|
|
$
|
20,488
|
|
|
|
Work in process
|
2,485
|
|
2,270
|
|
|||
|
Finished goods
|
87,436
|
|
99,594
|
|
|||
|
Inventory, net
|
$
|
117,992
|
|
$
|
122,352
|
|
|
j)
Property, Plant and Equipment
Property, plant and equipment are stated at cost less accumulated depreciation. Property under a capital lease is stated at the present value of minimum lease payments. Major improvements and replacements that extend service lives of the assets are capitalized. Minor replacements, and routine maintenance and repairs are charged to expense as incurred. Upon retirement or disposal of assets, the cost and related accumulated depreciation are removed from the Consolidated Balance Sheets.
A summary of property, plant and equipment, net, is as follows:
|
February 28,
2018 |
February 28,
2017 |
||||||
|
Land
|
$
|
9,522
|
|
$
|
8,893
|
|
|
|
Buildings
|
51,375
|
|
45,426
|
|
|||
|
Property under capital lease
|
1,578
|
|
1,441
|
|
|||
|
Furniture and fixtures
|
4,262
|
|
3,430
|
|
|||
|
Machinery and equipment
|
10,373
|
|
9,327
|
|
|||
|
Construction-in-progress
|
148
|
|
4,705
|
|
|||
|
Computer hardware and software
|
37,408
|
|
36,253
|
|
|||
|
Automobiles
|
921
|
|
828
|
|
|||
|
Leasehold improvements
|
2,713
|
|
2,561
|
|
|||
|
|
118,300
|
|
112,864
|
|
|||
|
Less accumulated depreciation and amortization
|
53,041
|
|
47,275
|
|
|||
|
|
$
|
65,259
|
|
$
|
65,589
|
|
|
Depreciation is calculated on the straight-line method over the estimated useful lives of the assets as follows:
|
Buildings and improvements
|
|
20
|
-
|
40 years
|
|
Furniture and fixtures
|
|
5
|
-
|
15 years
|
|
Machinery and equipment
|
|
5
|
-
|
10 years
|
|
Computer hardware and software
|
|
3
|
-
|
5 years
|
|
Automobiles
|
|
3 years
|
||
62
Leasehold improvements are depreciated over the shorter of the lease term or estimated useful life of the asset. Assets acquired under capital leases are amortized over the term of the respective lease. Accumulated amortization of assets under capital lease totaled
$669
and
$394
at
February 28, 2018
and
2017
, respectively.
Depreciation and amortization of property, plant and equipment from continuing operations amounted to
$5,658
,
$5,907
and
$4,702
for the years ended
February 28, 2018
,
February 28, 2017
and
February 29, 2016
, respectively. Included in depreciation and amortization expense is amortization of computer software costs of
$1,611
,
$1,473
and
$1,329
for the years ended
February 28, 2018
,
February 28, 2017
and
February 29, 2016
, respectively. Also included in depreciation and amortization expense is
$372
,
$153
and
$59
of amortization expense related to property under capital leases for the years ended
February 28, 2018
,
February 28, 2017
and
February 29, 2016
, respectively.
k)
Goodwill and Intangible Assets
Goodwill and other intangible assets consist of the excess over the fair value of assets acquired (goodwill), and other intangible assets (patents, contracts, trademarks/tradenames, developed technology and customer relationships). Values assigned to the respective assets are determined in accordance with ASC 805 "Business Combinations" ("ASC 805") and ASC 350 "Intangibles – Goodwill and Other" ("ASC 350").
Goodwill is calculated as the excess of the cost of purchased businesses over the value of their underlying net assets. Generally, the primary valuation method used to determine the fair value ("FV") of acquired businesses is the Discounted Future Cash Flow Method ("DCF"). A five-year period is analyzed using a risk adjusted discount rate.
The value of potential intangible assets separate from goodwill are independently evaluated and assigned to the respective categories. The largest categories from our recently acquired businesses are Developed Technology, Trademarks, and Customer Relationships. The FV’s of trademarks acquired are determined using the Relief from Royalty Method based on projected sales of the trademarked products. The FV’s of customer relationships and developed technology are determined using the Multi-Period Excess Earnings Method which includes a DCF analysis, adjusted for a required return on tangible and intangible assets. The Company categorizes this fair value determination as Level 3 (unobservable) in the fair value hierarchy, as described in Note 1(e).
The guidance in ASC 350, including management’s business intent for its use; ongoing market demand for products relevant to the category and their ability to generate future cash flows; legal, regulatory or contractual provisions on its use or subsequent renewal, as applicable; and the cost to maintain or renew the rights to the assets, are considered in determining the useful life of all intangible assets. If the Company determines that there are no legal, regulatory, contractual, competitive, economic or other factors which limit the useful life of the asset, an indefinite life will be assigned and evaluated for impairment as indicated below. Goodwill and other intangible assets that have an indefinite useful life are not amortized. Intangible assets that have a definite useful life are amortized on a straight line basis over their estimated useful life.
ASC 350 requires that goodwill and intangible assets with indefinite useful lives be tested for impairment at least annually or more frequently if an event occurs or circumstances change that could more likely than not reduce the fair value of a reporting unit below its carrying amount. Intangible assets with estimable useful lives are required to be amortized over their respective estimated useful lives and reviewed for impairment if indicators of impairment exist
.
To determine the fair value of goodwill and intangible assets, there are many assumptions and estimates used that directly impact the results of the testing. Management has the ability to influence the outcome and ultimate results based on the assumptions and estimates chosen. If a significant change in these assumptions and/or estimates occurs, the Company could experience impairment charges, in addition to those noted below, in future periods.
Goodwill is tested using a two-step process. The first step is to identify a potential impairment, and the second step measures the amount of the impairment loss, if any. Goodwill is considered impaired if the carrying amount of the reporting unit's goodwill exceeds its estimated fair value. For intangible assets with indefinite lives, primarily trademarks, the Company compared the fair value of each intangible asset with its carrying amount. Intangible assets with indefinite lives are considered impaired if the carrying value exceeds the fair value.
63
Voxx's reporting units that carry goodwill are Invision, Rosen, and Klipsch. The Company has three operating segments based upon its products and internal organizational structure (see Note 13). These operating segments are the Automotive, Premium Audio and Consumer Accessories segments. The Invision and Rosen reporting units are located within the Automotive segment and the Klipsch reporting unit is located within the Premium Audio segment.
The Company performed its annual impairment test for goodwill as of
February 28, 2018
. The discount rates (developed using a weighted average cost of capital analysis) used in the goodwill test ranged from
13.6%
to
13.8%
. Based on the Company's goodwill impairment assessment, all reporting units with goodwill had estimated fair values as of
February 28, 2018
that exceeded their carrying values.
No
goodwill impairment charges were recorded during the years ended
February 28, 2018
,
February 28, 2017
and
February 29, 2016
. The goodwill balances of Invision, Klipsch and Rosen at
February 28, 2018
are
$7,372
,
$46,533
, and
$880
, respectively.
The Company also tested its indefinite-lived intangible assets as of
February 28, 2018
. The respective fair values were estimated using a Relief-from-Royalty Method, applying royalty rates of
0.5%
to
7.0%
for the trademarks after reviewing comparable market rates, the profitability of the products associated with relative intangible assets, and other qualitative factors. We determined that risk-adjusted discount rates ranging from
13.0%
to
35.0%
were appropriate as a result of weighted average cost of capital analyses. As a result of this analysis, it was determined that there was
no
impairment of the Company's indefinite-lived intangible assets at
February 28, 2018
. Additionally,
no
impairment charges were recorded related to definite or indefinite-lived intangible assets for the year ended February 28, 2017.
During the second quarter of Fiscal 2016, the Company re-evaluated its projections for its Klipsch reporting unit, based on lower than anticipated results due to certain marketing strategies and re-evaluation of its market position for certain product lines. Accordingly, this was considered an indicator of impairment requiring the Company to test the related indefinite-lived tradename for impairment and perform a step 1 impairment analysis on the goodwill for this reporting unit. The discount rates (developed using a weighted average cost of capital analysis) used in this goodwill and intangible analysis were
13.1%
and
13.8%
, respectively. The long-term growth rate was
2.0%
. As a result of this analysis, the Company determined that the tradename for this reporting unit was impaired and recorded an impairment charge of
$6,210
in the second quarter of Fiscal 2016. Further, as a result of the Company's Fiscal 2016 annual indefinite-lived testing procedures, it was determined that one of its Consumer Accessories tradenames was impaired at February 29, 2016 and recorded an impairment charge of
$2,860
in the fourth quarter of Fiscal 2016. This impairment charge was the result of a judgment received in the fourth quarter of Fiscal 2016 related to the field of use for this trademark, which restricted the Company's rights to use the tradename for select products. The Company determined that this indicator of impairment required the Company to evaluate the related long-lived assets at the lowest level for which there are separately identifiable cash flows. After further analysis,
no
additional impairments of long-lived assets were recorded for the year ended February 29, 2016.
Management has determined that the current lives of its long-lived assets are appropriate. Management has determined that there were no other indicators of impairment that would cause the carrying values related to intangible assets with definite lives to exceed their expected future cash flows at
February 28, 2018
.
Goodwill
The change in the carrying amount of goodwill is as follows:
64
|
February 28, 2018
|
February 28, 2017
|
February 29, 2016
|
|||||||||
|
Beginning of period
|
$
|
53,905
|
|
$
|
53,905
|
|
$
|
53,905
|
|
||
|
Goodwill acquired (see Note 2)
|
880
|
|
—
|
|
—
|
|
|||||
|
End of period
|
$
|
54,785
|
|
$
|
53,905
|
|
$
|
53,905
|
|
||
|
Gross carrying amount
|
$
|
86,948
|
|
$
|
86,068
|
|
$
|
86,068
|
|
||
|
Accumulated impairment losses
|
(32,163
|
)
|
(32,163
|
)
|
(32,163
|
)
|
|||||
|
Net carrying amount
|
$
|
54,785
|
|
$
|
53,905
|
|
$
|
53,905
|
|
||
|
February 28, 2018
|
February 28, 2017
|
February 29, 2016
|
|||||||||
|
Automotive
|
|||||||||||
|
Beginning of period
|
$
|
7,372
|
|
$
|
7,372
|
|
$
|
7,372
|
|
||
|
Goodwill acquired (see Note 2)
|
880
|
|
—
|
|
—
|
|
|||||
|
End of period
|
$
|
8,252
|
|
$
|
7,372
|
|
$
|
7,372
|
|
||
|
Gross carrying amount
|
$
|
8,252
|
|
$
|
7,372
|
|
$
|
7,372
|
|
||
|
Accumulated impairment charge
|
—
|
|
—
|
|
—
|
|
|||||
|
Net carrying amount
|
$
|
8,252
|
|
$
|
7,372
|
|
$
|
7,372
|
|
||
|
Premium Audio
|
|||||||||||
|
Beginning of period
|
$
|
46,533
|
|
$
|
46,533
|
|
$
|
46,533
|
|
||
|
Impairment charge
|
—
|
|
—
|
|
—
|
|
|||||
|
End of period
|
$
|
46,533
|
|
$
|
46,533
|
|
$
|
46,533
|
|
||
|
Gross carrying amount
|
$
|
78,696
|
|
$
|
78,696
|
|
$
|
78,696
|
|
||
|
Accumulated impairment charge
|
(32,163
|
)
|
(32,163
|
)
|
(32,163
|
)
|
|||||
|
Net carrying amount
|
$
|
46,533
|
|
$
|
46,533
|
|
$
|
46,533
|
|
||
|
Total goodwill, net
|
$
|
54,785
|
|
$
|
53,905
|
|
$
|
53,905
|
|
||
Note: The Company's Consumer Accessories segment did not carry a balance for goodwill at
February 28, 2018
,
February 28, 2017
, or
February 29, 2016
.
Intangible Assets
65
|
|
February 28, 2018
|
||||||||||
|
Gross
Carrying
Value
|
Accumulated
Amortization
|
Total Net
Book
Value
|
|||||||||
|
Finite-lived intangible assets:
|
|||||||||||
|
Customer relationships (4-20 years)
|
$
|
50,249
|
|
$
|
26,807
|
|
$
|
23,442
|
|
||
|
Trademarks/Tradenames (3-12 years)
|
415
|
|
400
|
|
15
|
|
|||||
|
Developed technology (11.5 years)
|
31,290
|
|
6,802
|
|
24,488
|
|
|||||
|
Patents (5-13 years)
|
2,830
|
|
2,138
|
|
692
|
|
|||||
|
License (5 years)
|
1,400
|
|
1,400
|
|
—
|
|
|||||
|
Contracts (5 years)
|
2,141
|
|
1,849
|
|
292
|
|
|||||
|
Total finite-lived intangible assets
|
$
|
88,325
|
|
$
|
39,396
|
|
48,929
|
|
|||
|
Indefinite-lived intangible assets
|
|||||||||||
|
Trademarks
|
101,391
|
|
|||||||||
|
Total net intangible assets
|
|
|
|
|
$
|
150,320
|
|
||||
|
February 28, 2017
|
|||||||||||
|
Gross
Carrying
Value
|
Accumulated
Amortization
|
Total Net
Book
Value
|
|||||||||
|
Finite-lived intangible assets:
|
|||||||||||
|
Customer relationships (5-20 years)
|
$
|
49,005
|
|
$
|
22,615
|
|
$
|
26,390
|
|
||
|
Trademarks/Tradenames (3-12 years)
|
415
|
|
395
|
|
20
|
|
|||||
|
Developed technology (11.5 years)
|
31,290
|
|
4,081
|
|
27,209
|
|
|||||
|
Patents (5-10 years)
|
2,755
|
|
1,930
|
|
825
|
|
|||||
|
License (5 years)
|
1,400
|
|
1,400
|
|
—
|
|
|||||
|
Contracts (5 years)
|
2,141
|
|
1,732
|
|
409
|
|
|||||
|
Total finite-lived intangible assets
|
$
|
87,006
|
|
$
|
32,153
|
|
54,853
|
|
|||
|
Indefinite-lived intangible assets
|
|||||||||||
|
Trademarks
|
100,086
|
|
|||||||||
|
Total net intangible assets
|
|
|
|
|
$
|
154,939
|
|
||||
The weighted-average remaining amortization period for amortizing intangibles as of
February 28, 2018
is approximately
8
years. The Company expenses the renewal costs of patents as incurred. The weighted-average period before the next patent renewal is approximately
6
years.
Amortization expense for intangible assets amounted to
$6,516
,
$6,479
and
$4,953
for the years ended
February 28, 2018
,
February 28, 2017
and
February 29, 2016
, respectively. At
February 28, 2018
, the estimated aggregate amortization expense for all amortizable intangibles for each of the succeeding five fiscal years is as follows:
|
Fiscal Year
|
Amount
|
|||
|
2019
|
$
|
6,323
|
|
|
|
2020
|
6,310
|
|
||
|
2021
|
6,102
|
|
||
|
2022
|
5,974
|
|
||
|
2023
|
5,667
|
|
||
l)
Sales Incentives
66
The Company offers sales incentives to its customers in the form of (1) co-operative advertising allowances; (2) market development funds; (3) volume incentive rebates; and (4) other trade allowances. The Company accounts for sales incentives in accordance with ASC 605-50 "Customer Payments and Incentives" ("ASC 605-50"). Except for other trade allowances, all sales incentives require the customer to purchase the Company's products during a specified period of time. All sales incentives require customers to claim the sales incentive within a certain time period (referred to as the "claim period") and claims are settled either by the customer claiming a deduction against an outstanding account receivable or by the customer requesting a cash payout. All costs associated with sales incentives are classified as a reduction of net sales. The following is a summary of the various sales incentive programs:
Co-operative advertising allowances are offered to customers as reimbursement towards their costs for print or media advertising in which the Company’s product is featured on its own or in conjunction with other companies' products. The amount offered is either a fixed amount or is based upon a fixed percentage of sales revenue or a fixed amount per unit sold to the customer during a specified time period.
Market development funds are offered to customers in connection with new product launches or entrance into new markets. The amount offered for new product launches is based upon a fixed amount, or percentage of sales revenue to the customer or a fixed amount per unit sold to the customer during a specified time period.
Volume incentive rebates offered to customers require minimum quantities of product to be purchased during a specified period of time. The amount offered is either based upon a fixed percentage of sales revenue to the customer or a fixed amount per unit sold to the customer. The Company makes an estimate of the ultimate amount of the rebate their customers will earn based upon past history with the customers and other facts and circumstances. The Company has the ability to estimate these volume incentive rebates, as the period of time for a particular rebate to be claimed is relatively short. Any changes in the estimated amount of volume incentive rebates are recognized immediately using a cumulative catch-up adjustment. The Company accrues the cost of co-operative advertising allowances, volume incentive rebates and market development funds at the latter of when the customer purchases our products or when the sales incentive is offered to the customer.
Unearned sales incentives are volume incentive rebates where the customer did not purchase the required minimum quantities of product during the specified time. Volume incentive rebates are reversed into income in the period when the customer did not reach the required minimum purchases of product during the specified time. Unclaimed sales incentives are sales incentives earned by the customer, but the customer has not claimed payment within the claim period (period after program has ended). Unclaimed sales incentives are investigated in a timely manner after the end of the program and reversed if deemed appropriate. The Company believes the reversal of earned but unclaimed sales incentives upon the expiration of the claim period is a systematic, rational, consistent and conservative method of reversing unclaimed sales incentives.
Other trade allowances are additional sales incentives the Company provides to customers subsequent to the related revenue being recognized. The Company records the provision for these additional sales incentives at the latter of when the sales incentive is offered or when the related revenue is recognized. Such additional sales incentives are based upon a fixed percentage of the selling price to the customer, a fixed amount per unit, or a lump-sum amount.
The accrual balance for sales incentives at
February 28, 2018
and
February 28, 2017
was
$14,020
and
$13,154
, respectively. Although the Company makes its best estimate of its sales incentive liability, many factors, including significant unanticipated changes in the purchasing volume of its customers and the lack of claims made by customers, could have a significant impact on the sales incentives liability and reported operating results.
A summary of the activity with respect to accrued sales incentives is provided below:
67
|
Year
Ended
|
Year
Ended
|
Year
Ended
|
|||||||||
|
February 28,
2018 |
February 28,
2017 |
February 29,
2016 |
|||||||||
|
Opening balance
|
$
|
13,154
|
|
$
|
12,439
|
|
$
|
14,097
|
|
||
|
Accruals
|
42,722
|
|
36,413
|
|
28,428
|
|
|||||
|
Payments and credits
|
(41,811
|
)
|
(35,590
|
)
|
(30,009
|
)
|
|||||
|
Reversals for unearned sales incentives
|
(45
|
)
|
(108
|
)
|
(77
|
)
|
|||||
|
Reversals for unclaimed sales incentives
|
—
|
|
—
|
|
—
|
|
|||||
|
Ending balance
|
$
|
14,020
|
|
$
|
13,154
|
|
$
|
12,439
|
|
||
The majority of the reversals of previously established sales incentive liabilities pertain to sales recorded in prior periods.
m)
Advertising
Excluding co-operative advertising, the Company expensed the cost of advertising, as incurred, of
$11,753
,
$8,597
and
$8,600
for the years ended
February 28, 2018
,
February 28, 2017
and
February 29, 2016
, respectively.
n)
Research and Development
Expenditures for research and development are charged to expense as incurred. Such expenditures amounted to
$10,954
,
$13,202
and
$7,234
for the years ended
February 28, 2018
,
February 28, 2017
and
February 29, 2016
, respectively, net of customer reimbursement, of
$106
,
$0
and
$44
, respectively, and are included within Engineering and Technical Support expenses on the Consolidated Statements of Operations and Comprehensive Income (Loss). Reimbursements from OEM customers for development services are reflected as a reduction of research and development expense because the performance of contract development services is not central to the Company's operations.
o)
Product Warranties and Product Repair Costs
The Company generally warranties its products against certain manufacturing and other defects. The Company provides warranties for all of its products ranging primarily from 30 days to three years. Warranty expenses are accrued at the time of sale based on the Company's estimated cost to repair expected product returns for warranty matters. This liability is based primarily on historical experiences of actual warranty claims as well as current information on repair costs and contract terms with certain manufacturers. The warranty liability of
$4,261
and
$3,911
is recorded in Accrued Expenses in the accompanying Consolidated Balance Sheets as of
February 28, 2018
and
February 28, 2017
, respectively. In addition, the Company records a reserve for product repair costs which is based upon the quantities of defective inventory on hand and an estimate of the cost to repair such defective inventory. The reserve for product repair costs of
$1,972
and
$1,697
is recorded as a reduction to inventory in the accompanying Consolidated Balance Sheets as of
February 28, 2018
and
February 28, 2017
, respectively. Warranty claims and product repair costs expense relating to continuing operations for the years ended
February 28, 2018
,
February 28, 2017
and
February 29, 2016
were
$7,928
,
$5,843
and
$8,028
, respectively.
Changes in the Company's accrued product warranties and product repair costs are as follows:
68
|
Year
Ended
|
Year
Ended
|
Year
Ended
|
|||||||||
|
February 28,
2018 |
February 28,
2017 |
February 29,
2016 |
|||||||||
|
Beginning balance
|
$
|
5,608
|
|
$
|
7,608
|
|
$
|
8,233
|
|
||
|
Liabilities acquired during acquisitions
|
500
|
|
—
|
|
100
|
|
|||||
|
Liabilities accrued for warranties issued during the year and repair cost
|
7,428
|
|
5,843
|
|
8,028
|
|
|||||
|
Warranty claims settled during the year
|
(7,303
|
)
|
(7,843
|
)
|
(8,753
|
)
|
|||||
|
Ending balance
|
$
|
6,233
|
|
$
|
5,608
|
|
$
|
7,608
|
|
||
p)
Foreign Currency
Assets and liabilities of subsidiaries located outside the United States whose cash flows are primarily in local currencies have been translated at rates of exchange at the end of the period or historical exchange rates, as appropriate in accordance with ASC 830, "Foreign Currency Matters" ("ASC 830"). Revenues and expenses have been translated at the weighted-average rates of exchange in effect during the period. Gains and losses resulting from translation are recorded in the cumulative foreign currency translation account in Accumulated Other Comprehensive Income (Loss). For the years ended
February 28, 2018
,
February 28, 2017
and
February 29, 2016
, the Company recorded total net foreign currency transaction (losses)/gains in the amount of
$(8,769)
,
$(509)
and
$108
, respectively. Included within the losses recorded for the year ended
February 28, 2018
is the loss on forward contracts totaling
$(6,618)
incurred in conjunction with the sale of Hirschmann (see Note 2).
The Company has a subsidiary in Venezuela. Venezuela is currently experiencing significant political and civil unrest and economic instability and has been troubled with various foreign currency and price controls. The country has experienced high rates of inflation over the last several years. The President of Venezuela has the authority to legislate certain areas by decree, which allows the government to nationalize certain industries or expropriate certain companies and property. These factors have had a negative impact on our business and financial condition. In 2003, Venezuela created the Commission of Administration of Foreign Currency ("CADIVI") which establishes and administers currency controls and their associated rules and regulations. These controls include creating a fixed exchange rate between the Bolivar and the U.S. Dollar, and the ability to restrict the exchange of Bolivar Fuertes for U.S. Dollars and vice versa. On March 1, 2010, the Company transitioned to hyper-inflationary accounting for Venezuela in accordance with the guidelines in ASC 830, "Foreign Currency." A hyper-inflationary economy designation occurs when a country has experienced cumulative inflation of approximately 100 percent or more over a 3-year period. The hyper-inflationary designation requires the local subsidiary in Venezuela to record all transactions as if they were denominated in U.S. dollars.
Since January 2014, the Venezuelan government has created multiple alternative exchange rates designated to be used for the purchase of goods and services deemed non-essential. In February 2015, the Venezuelan government introduced a new currency system, referred to as the Marginal Currency System, or SIMADI rate. This market-based exchange system consisted of a mechanism from which both businesses and individuals were allowed to purchase and sell foreign currency at the price set by the market. The SIMADI rate was used by the Company at
February 29, 2016
and was
205
Bolivar Fuerte/$1. A net currency exchange loss of
$2
was recorded for the year ended February 29, 2016. In March 2016, the Venezuelan government enacted further changes to its foreign currency exchange mechanisms, including a devaluation of the official government exchange rate (re-named DIPRO) from
6.3
bolivars to
10.0
bolivars to the U.S. dollar. Additionally, the SIMADI exchange rate was replaced by the DICOM exchange rate, which the Venezuelan government reported would be allowed to float to meet market needs. The Company evaluated all of the facts and circumstances surrounding its Venezuelan operations and determined that as of
February 28, 2017
, the DICOM rate was the appropriate rate to use for remeasuring the subsidiary’s financial statements. As of
February 28, 2017
, the published DICOM rate offered was
700
Bolivar Fuerte/$1. A net currency exchange gain loss of
$8
was recorded for the year ended
February 28, 2017
. In January 2018, the Venezuelan government eliminated the DIPRO exchange rate, stating that all currency transactions would now be carried out at the DICOM rate. As of
February 28, 2018
, the published DICOM rate was
35,280
Bolivar Fuerte/$1. A net currency exchange rate loss of
$148
was recorded for the year
69
ended
February 28, 2018
. All currency exchange gains and losses are included in Other Income (Expense) on the Consolidated Statements of Operations and Comprehensive Income (Loss).
The Company holds certain long-lived assets in Venezuela, which includes an office location the subsidiary uses for its local personnel, as its automotive operations are currently suspended, as well as other rental properties. All of these properties are held for investment purposes as of
February 28, 2018
. The value of the Company's properties held for investment purposes in Venezuela was
$3,542
and
$3,679
as of
February 28, 2018
and
February 28, 2017
, respectively. No impairments were recorded for the years ended
February 28, 2018
,
February 28, 2017
, or
February 29, 2016
. The Company continues to monitor closely the continued economic instability, increasing inflation and currency restrictions imposed by the government and will continue to evaluate its local properties. Further devaluations or regulatory actions could further impair the carrying value of these properties.
q)
Income Taxes
Income taxes are accounted for under the asset and liability method. Deferred tax assets and liabilities are recognized for the future tax consequences attributable to differences between the financial statement carrying amounts of existing assets and liabilities and their respective tax basis and operating loss and tax credit carryforwards. In evaluating our ability to recover our deferred tax assets within the jurisdiction from which they arise, we consider all positive and negative evidence including the results of recent operations, scheduled reversal of deferred tax liabilities, future taxable income and tax planning strategies. Deferred tax assets and liabilities are measured using enacted tax rates expected to apply to taxable income in the years in which those temporary differences are expected to be recovered or settled (see Note 8). The effect on deferred tax assets and liabilities of a change in tax rates is recognized in income in the period that includes the enactment date.
Uncertain Tax Positions
The Company adopted guidance included in ASC 740 "Income Taxes" ("ASC 740") as it relates to uncertain tax positions. The guidance addresses the determination of whether tax benefits claimed or expected to be claimed on a tax return should be recorded in the financial statements. Under ASC 740, the Company may recognize the tax benefit from an uncertain tax position only if it is more likely than not that the tax position will be sustained on examination by the taxing authorities based on the technical merits of the position. The tax benefits recognized in the financial statements from such position should be measured based on the largest benefit that has a greater than fifty percent likelihood of being realized upon ultimate settlement. ASC 740 also provides guidance on derecognition, classification, interest and penalties, accounting in interim periods and disclosure requirements.
Tax interest and penalties
The Company classifies interest and penalties associated with income taxes as a component of Income Tax Expense (Benefit) on the Consolidated Statement of Operations and Comprehensive Income (Loss).
r)
Net Income (Loss) Per Common Share
Basic net income (loss) per common share from continuing operations, net of non-controlling interest, is based upon the weighted-average number of common shares outstanding during the period. Diluted net income (loss) per common share from continuing operations reflects the potential dilution that would occur if common stock equivalent securities or other contracts to issue common stock were exercised or converted into common stock.
There are
no
reconciling items which impact the numerator of basic and diluted net income (loss) per common share. A reconciliation between the denominator of basic and diluted net income (loss) per common share is as follows:
70
|
Year
Ended
|
Year
Ended
|
Year
Ended
|
||||||
|
February 28, 2018
|
February 28, 2017
|
February 29, 2016
|
||||||
|
Weighted-average common shares outstanding (basic)
|
24,290,563
|
|
24,160,324
|
|
24,172,710
|
|
||
|
Effect of dilutive securities:
|
|
|
|
|
|
|
||
|
Stock options, warrants and restricted stock
|
256,683
|
|
—
|
|
—
|
|
||
|
Weighted-average common and potential common shares outstanding (diluted)
|
24,547,246
|
|
24,160,324
|
|
24,172,710
|
|
||
Restricted stock, stock options and warrants totaling
534,327
,
237,930
and
383,881
for the years ended
February 28, 2018
,
February 28, 2017
and
February 29, 2016
, respectively, were not included in the net income (loss) per common share calculation because the exercise price of these options and warrants was greater than the average market price of the Company's common stock during these periods, or the inclusion of these components would have been anti-dilutive.
s)
Other (Expense) Income
Other (expense) income is comprised of the following:
|
Year
Ended
|
Year
Ended
|
Year
Ended
|
|||||||||
|
February 28, 2018
|
February 28, 2017
|
February 29, 2016
|
|||||||||
|
Foreign currency (loss) gain
|
$
|
(8,769
|
)
|
$
|
(509
|
)
|
$
|
108
|
|
||
|
Interest income
|
210
|
|
137
|
|
805
|
|
|||||
|
Rental income
|
553
|
|
646
|
|
450
|
|
|||||
|
Miscellaneous
|
416
|
|
(728
|
)
|
(787
|
)
|
|||||
|
Total other, net
|
$
|
(7,590
|
)
|
$
|
(454
|
)
|
$
|
576
|
|
||
Included within the foreign currency loss for the year ended February 28, 2018 is a loss on forward contracts totaling
$(6,618)
incurred in conjunction with the sale of Hirschmann (see Note 2). Included in interest income for the year ended February 29, 2016 is income related to notes receivable from EyeLock, Inc. through the acquisition date of September 1, 2015 (see Note 2).
t)
Accounting for the Impairment of Long-Lived Assets and for Long-Lived Assets to be Disposed of
Long-lived assets and certain identifiable intangibles are reviewed for impairment in accordance with ASC 360 whenever events or changes in circumstances indicate that the carrying amount of an asset may not be recoverable. Recoverability of assets to be held and used is measured by a comparison of the carrying amount of an asset to future undiscounted net cash flows expected to be generated by the asset. Recoverability of long-lived assets is measured by comparing the carrying amount of the assets to their estimated fair market value. If such assets are considered to be impaired, the impairment to be recognized is measured by the amount by which the carrying amount of the assets exceeds the fair value of the assets. There were
no
impairments of long-lived assets recorded during the years ended
February 28, 2018
,
February 28, 2017
and
February 29, 2016
.
u)
Accounting for Stock-Based Compensation
The Company has a stock-based compensation plan under which employees and non-employee directors may be granted incentive stock options ("ISO's") and non-qualified stock options ("NQSO's") to purchase shares of Class A common stock. Under the plan, the exercise price of the ISO's granted to a ten percent stockholder cannot be less than 110% of the fair market value of the Company's Class A common stock or greater than 110% of the market value of the Company's Class A common stock on the date of grant. The exercise price of all other
71
Options and Stock Appreciation Right ("SAR") awards may not be less than 100% of the fair market value of the Company's Class A common stock on the date of grant. If an option or SAR is granted pursuant to an assumption of, or substitution for, another option or SAR pursuant to a Corporate Transaction, and in a manner consistent with Section 409A of the Code, the exercise or strike price may be less than 100% of the fair market value on the date of grant. The plan permits for options to be exercised at various intervals as determined by the Board of Directors. However, the maximum expiration period is ten years from date of grant. The vesting requirements are determined by the Board of Directors at the time of grant. Exercised options are issued from authorized Class A common stock. As of
February 28, 2018
, approximately
1,301,000
shares were available for future grants under the terms of these plans.
Options are measured at the fair value of the award at the date of grant and are recognized as an expense over the requisite service period. Compensation expense related to stock-based awards with vesting terms are amortized using the straight-line attribution method.
The Company granted
125,000
options in October 2014, which vested on October 16, 2015, had an exercise price equal to
$7.76
,
$0.25
above the sales price of the Company’s stock on the day prior to the date of grant, a contractual term of
3.0
years and a grant date fair value of
$2.78
per share determined based upon a Black-Scholes valuation model. In addition, the Company issued
15,000
warrants in October 2014 to purchase the Company’s common stock with the same terms as those of the options above as consideration for future legal and professional services. All unexercised options and warrants from this grant expired on October 16, 2017.
There were
no
stock options granted during the years ended
February 28, 2018
,
February 28, 2017
and
February 29, 2016
.
The Company recognized stock-based compensation expense (before deferred income tax benefits) for awards granted under the Company’s stock option plans in the following line items in the Consolidated Statement of Operations and Comprehensive Income (Loss) during the year ended
February 29, 2016
:
|
Year
Ended
|
||||
|
February 29, 2016
|
||||
|
Cost of sales
|
$
|
12
|
|
|
|
Selling expense
|
55
|
|
||
|
General and administrative expenses
|
143
|
|
||
|
Engineering and technical support
|
16
|
|
||
|
Stock-based compensation expense before income tax benefits
|
$
|
226
|
|
|
During the years ended
February 28, 2018
and
February 28, 2017
there were
no
stock-based compensation costs or professional fees recorded by the Company and the Company had
no
unrecognized compensation costs at
February 28, 2018
related to stock options and warrants. Net income was impacted by
$142
(after tax) in stock-based compensation expense or
$0.01
per diluted share for the year ended
February 29, 2016
.
Information regarding the Company's stock options and warrants are summarized below:
72
|
Number
of Shares
|
Weighted-
Average
Exercise
Price
|
|||||
|
Outstanding and exercisable at February 28, 2015
|
204,204
|
|
$
|
7.46
|
|
|
|
Granted
|
—
|
|
—
|
|
||
|
Exercised
|
(64,204
|
)
|
6.79
|
|
||
|
Forfeited/expired
|
(8,750
|
)
|
7.76
|
|
||
|
Outstanding and exercisable at February 29, 2016
|
131,250
|
|
7.76
|
|
||
|
Granted
|
—
|
|
—
|
|
||
|
Exercised
|
—
|
|
—
|
|
||
|
Forfeited/expired
|
(15,000
|
)
|
7.76
|
|
||
|
Outstanding and exercisable at February 28, 2017
|
116,250
|
|
7.76
|
|
||
|
Granted
|
—
|
|
—
|
|
||
|
Exercised
|
(38,750
|
)
|
7.76
|
|
||
|
Forfeited/expired
|
(77,500
|
)
|
7.76
|
|
||
|
Outstanding and exercisable at February 28, 2018
|
—
|
|
$
|
—
|
|
|
The aggregate pre-tax intrinsic value (the difference between the Company’s average closing stock price for the last quarter of Fiscal
2018
and the exercise price, multiplied by the number of in-the-money options) that would have been received by the option holders had all option holders exercised their options on
February 28, 2018
was
$0
, as all options had been exercised or had expired by this date. The total intrinsic values of options exercised for the years ended
February 28, 2018
and
February 29, 2016
were
$108
and
$128
, respectively. There were
no
stock options exercised for the year ended
February 28, 2017
.
A restricted stock award is an award of common stock that is subject to certain restrictions during a specified period. Restricted stock awards are independent of option grants and are subject to forfeiture if employment terminates for a reason other than death, disability or retirement, prior to the release of the restrictions. Shares under restricted stock grants are not issued to the grantees before they vest. In Fiscal 2014, the Company established the Supplemental Executive Retirement Plan ("SERP") (refer to Note 10(a)). During Fiscal 2016, Fiscal 2017, and Fiscal 2018 an additional
79,268
,
165,619
and
74,156
shares of restricted stock were granted under the SERP, respectively. These shares were granted based on certain performance criteria and vest on the later of three years from the date of grant (or three years from the date of participation in the SERP with respect to shares granted in Fiscal 2014), or the grantee reaching the age of 65 years. The shares will also vest upon termination of the grantee's employment by the Company without cause, provided that the grantee, at the time of termination, has been employed by the Company for at least 10 years, or as a result of the sale of all of the issued and outstanding stock, or all, or substantially all, of the assets of the subsidiary of which the grantee serves as CEO and/or President. When vested shares are issued to the grantee, the awards will be settled in shares or in cash, at the Company's sole option. The grantees cannot transfer the rights to receive shares before the restricted shares vest. There are no market conditions inherent in the award, only an employee performance requirement, and the service requirement that the respective employee continues employment with the Company through the vesting date. The Company expenses the cost of the restricted stock awards on a straight-line basis over the requisite service period of each employee. For these purposes, the fair market value of the restricted stock awards,
$8.13
,
$2.69
and
$6.52
for Fiscal 2016, Fiscal 2017, and Fiscal 2018, respectively, were determined based on the mean of the high and low price of the Company's common stock on the grant dates.
In conjunction with the sale of Hirschmann on August 31, 2017 (see Note 2), all restricted shares granted to the CEO and President of Hirschmann, totaling
72,300
shares immediately vested in accordance with the SERP and were settled in cash in the amount of
$582
. The remaining unrecognized stock-based compensation expense related to this individual's restricted stock awards was recognized as a reduction of the gain on sale of discontinued operations in the amount of
$373
.
73
The following table presents a summary of the Company's restricted stock activity for the year ended
February 28, 2018
:
|
Number of shares
|
Weighted Average Grant Date Fair Value
|
|||||
|
Outstanding at February 28, 2015
|
202,646
|
|
$
|
10.21
|
|
|
|
Granted
|
79,268
|
|
8.13
|
|
||
|
Forfeited
|
(10,090
|
)
|
10.08
|
|
||
|
Outstanding at February 29, 2016
|
271,824
|
|
$
|
9.61
|
|
|
|
Granted
|
165,619
|
|
2.69
|
|
||
|
Forfeited
|
—
|
|
—
|
|
||
|
Outstanding at February 28, 2017
|
437,443
|
|
$
|
6.99
|
|
|
|
Granted
|
74,156
|
|
6.52
|
|
||
|
Vested and settled
|
(72,300
|
)
|
5.98
|
|
||
|
Forfeited
|
—
|
|
—
|
|
||
|
Outstanding at February 28, 2018
|
439,299
|
|
$
|
7.08
|
|
|
|
Vested and unissued at February 28, 2018
|
117,049
|
|
$
|
10.58
|
|
|
During the years ended
February 28, 2018
,
February 28, 2017
and
February 29, 2016
the Company recorded
$502
,
$669
and
$576
, respectively, in stock-based compensation related to restricted stock awards for continuing operations. As of
February 28, 2018
, unrecognized stock-based compensation expense related to unvested restricted stock awards was approximately
$1,050
and will be recognized over the requisite service period of each employee.
v)
Accumulated Other Comprehensive Loss
74
|
Foreign Exchange Losses
|
Unrealized losses on investments, net of tax
|
Pension plan adjustments, net of tax
|
Derivatives designated in a hedging relationship
|
Total
|
|||||||||||||||
|
Balance at February 28, 2015
|
$
|
(32,935
|
)
|
$
|
(101
|
)
|
$
|
(2,742
|
)
|
$
|
2,543
|
|
$
|
(33,235
|
)
|
||||
|
Other comprehensive (loss) income before reclassifications
|
(5,702
|
)
|
20
|
|
640
|
|
28
|
|
(5,014
|
)
|
|||||||||
|
Reclassified from accumulated other comprehensive loss
|
—
|
|
—
|
|
—
|
|
(2,468
|
)
|
(2,468
|
)
|
|||||||||
|
Net current-period other comprehensive (loss) income
|
(5,702
|
)
|
20
|
|
640
|
|
(2,440
|
)
|
(7,482
|
)
|
|||||||||
|
Balance at February 29, 2016
|
$
|
(38,637
|
)
|
$
|
(81
|
)
|
$
|
(2,102
|
)
|
$
|
103
|
|
$
|
(40,717
|
)
|
||||
|
Other comprehensive (loss) income before reclassifications
|
(3,194
|
)
|
(17
|
)
|
(180
|
)
|
742
|
|
(2,649
|
)
|
|||||||||
|
Reclassified from accumulated other comprehensive loss
|
—
|
|
—
|
|
—
|
|
(532
|
)
|
(532
|
)
|
|||||||||
|
Net current-period other comprehensive (loss) income
|
(3,194
|
)
|
(17
|
)
|
(180
|
)
|
210
|
|
(3,181
|
)
|
|||||||||
|
Balance at February 28, 2017
|
$
|
(41,831
|
)
|
$
|
(98
|
)
|
$
|
(2,282
|
)
|
$
|
313
|
|
$
|
(43,898
|
)
|
||||
|
Other comprehensive (loss) income before reclassifications
|
18,065
|
|
(15
|
)
|
(459
|
)
|
(1,358
|
)
|
16,233
|
|
|||||||||
|
Reclassified from accumulated other comprehensive loss
|
10,739
|
|
89
|
|
1,955
|
|
660
|
|
13,443
|
|
|||||||||
|
Net current-period other comprehensive (loss) income
|
28,804
|
|
74
|
|
1,496
|
|
(698
|
)
|
29,676
|
|
|||||||||
|
Balance at February 28, 2018
|
$
|
(13,027
|
)
|
$
|
(24
|
)
|
$
|
(786
|
)
|
$
|
(385
|
)
|
$
|
(14,222
|
)
|
||||
In the above table, all reclassifications of other comprehensive income (loss) for the year ended
February 28, 2018
for foreign currency translation, investments and pension plan adjustments are related to the sale of Hirschmann on August 31, 2017 (see Note 2). Within reclassifications for derivatives designated in a hedging relationship, gains totaling
$71
are related to cash flow hedge activity of discontinued operations for the year ended
February 28, 2018
, and
$384
is related to the sale of Hirschmann on August 31, 2017. Within other comprehensive income (loss) before reclassifications for derivatives designated in a hedging relationship,
$(501)
is related to cash flow hedge activity of discontinued operations for the year ended
February 28, 2018
.
During the years ended
February 28, 2018
,
February 28, 2017
and
February 29, 2016
, the Company recorded tax related to unrealized losses on investments of
$0
, pension plan adjustments of
$0
,
$(106)
and
$312
, respectively and derivatives designated in a hedging relationship of
$(645)
,
$(97)
and
$(636)
, respectively.
The other comprehensive income (loss) before reclassification of
18,065
,
(3,194)
,
(5,702)
, respectively, includes the remeasurement of intercompany transactions of a long term nature of
$12,488
,
$(2,320)
and
$(1,710)
, respectively, with certain subsidiaries whose functional currency is not the U.S. dollar, and
$5,577
,
$(874)
and
$(3,992)
, respectively, from translating the financial statements of the Company's non-U.S. dollar functional currency subsidiaries into our reporting currency, which is the U.S. dollar. Intercompany loans and transactions that are of a long-term investment nature are remeasured and resulting gains and losses shall be reported in the same manner as translation adjustments. Foreign currency translation losses reclassified from accumulated other comprehensive income (loss) of
$10,739
for the year ended February 28, 2018 included
$9,911
due to the settlement of a Euro-based loan and the recognition of the cumulative translation adjustment of
$828
due to the sale of Hirschmann. Within foreign exchange losses in other comprehensive (loss) income for the years ended
February 28, 2018
,
February 28, 2017
and
February 29, 2016
, the Company recorded total (losses) gains of
$17,559
,
$(3,200)
, and
$(4,177)
, respectively, related to the Euro;
$250
,
$176
, and
$(788)
, respectively, related to the Canadian Dollar;
$71
,
$(142)
and
$(692)
, respectively, for the Mexican Peso, as well as
$185
,
$(28)
and
75
$(45)
, respectively, for various other currencies. These adjustments were caused by the strengthening/(weakening) of the U.S. Dollar against the Euro, Canadian Dollar and the Mexican Peso between
(13)%
and
(3)%
in Fiscal 2018,
(2)%
and
10%
in Fiscal 2017, and
3%
and
21%
in Fiscal 2016.
w)
New Accounting Pronouncements
In May 2014, the Financial Accounting Standards Board ("FASB") issued Accounting Standards Update ("ASU") 2014-09, "Revenues from Contracts with Customers (Topic 606)," which outlines a single comprehensive model for entities to use in accounting for revenue arising from contracts with customers and supersedes most current revenue recognition guidance, including industry-specific guidance. The standard requires entities to recognize revenue to depict the transfer of promised goods or services to customers in an amount that reflects the consideration to which the entity expects to be entitled in exchange for those goods and services. The new guidance also includes a cohesive set of disclosure requirements intended to provide users of financial statements comprehensive information about the nature, amounts, timing and uncertainty of revenue and cash flows arising from a company's contracts with customers. ASU 2014-09 defines a five-step process to achieve this core principle and in doing so, it is possible that more judgment and estimates may be required within the revenue recognition process than are required under existing guidance, including identifying performance obligations in the contract, estimating the amount of variable consideration to include in the transaction price and allocating the transaction price to separate performance obligations, among others. The new standard will be effective for the Company beginning March 1, 2018. The FASB issued four subsequent standards in 2016 containing implementation guidance related to the new standard. These standards provide additional guidance related to principal versus agent considerations, licensing, and identifying performance obligations. Additionally, these standards provide narrow-scope improvements and practical expedients as well as technical corrections and improvements.
The guidance permits two methods of adoption: retrospectively to each prior reporting period presented (full retrospective method), or retrospectively with the cumulative effect of initially applying the guidance recognized at the date of initial application (the modified retrospective method). The Company will be adopting the standard using the modified retrospective method effective March 1, 2018.
The Company has completed its implementation procedures with respect to the new revenue recognition standard. The Company's revenues are primarily generated from the sale of finished products to customers. Those sales predominantly contain a single delivery element and revenue is recognized at a single point in time when ownership, risks and rewards transfer. The timing of revenue recognition for these product sales are not materially impacted by the new standard. However, we utilized a comprehensive approach to assess the impact of the guidance on our current contract portfolio by reviewing our current accounting policies and practices to identify potential differences that would result from applying the new requirements to our revenue contracts, including evaluation of performance obligations in the contract, estimating the amount of variable consideration to include in the transaction price, allocating the transaction price to each separate performance obligation and accounting treatment of costs to obtain and fulfill contracts. In addition, as part of completing its quantitative assessment, the Company updated its internal controls over financial reporting and reviewed the tax impact the adoption of the new standard would have. Based on the reviews and procedures performed, the Company has concluded that its previously recorded and future revenue will not be materially impacted by the implementation of this guidance; however, it does expect that the adoption of the new standard will result in expanded and disaggregated disclosure requirements.
In January 2016, the FASB issued ASU 2016-01 "Recognition and Measurement of Financial Assets and Financial Liabilities,
"
which amends certain aspects of recognition, measurement, presentation and disclosure of financial instruments. This amendment requires all equity investments to be measured at fair value with changes in the fair value recognized through net income (other than those accounted for under equity method of accounting or those that result in consolidation of the investee). This standard will be effective for fiscal years beginning after December 15, 2017, including interim periods within those fiscal years. The Company does not expect the adoption of ASU 2016-01 to have a material impact on its consolidated financial statements.
In February 2016, the FASB issued ASU 2016-02, "Leases (Topic 842)." ASU 2016-02 requires that a lessee recognize the assets and liabilities that arise from operating leases. A lessee should recognize in the statement
76
of financial position a liability to make lease payments (the lease liability) and a right-of-use asset representing its right to use the underlying asset for the lease term. For leases with a term of 12 months or less, a lessee is permitted to make an accounting policy election by class of underlying asset not to recognize lease assets and lease liabilities. In transition, lessees and lessors are required to recognize and measure leases at the beginning of the earliest period presented using a modified retrospective approach. This amendment will be effective for fiscal years beginning after December 15, 2018, including interim periods within those fiscal years. Early application is permitted. The Company has not yet determined the effect of the adoption of this standard on the Company’s consolidated financial position and results of operations.
In June 2016, the FASB issued ASU 2016-13, “Financial Instruments - Credit Losses (Topic 326): Measurement of Credit Losses on Financial Instruments.” The standard significantly changes how entities will measure credit losses for most financial assets and certain other instruments that aren’t measured at fair value through net income. The standard will replace today’s “incurred loss” approach with an “expected loss” model for instruments measured at amortized cost. For available-for-sale debt securities, entities will be required to record allowances rather than reduce the carrying amount, as they do today under the other-than-temporary impairment model. It also simplifies the accounting model for purchased credit-impaired debt securities and loans. The amendment will affect loans, debt securities, trade receivables, net investments in leases, off balance sheet credit exposures, reinsurance receivables, and any other financial assets not excluded from the scope that have the contractual right to receive cash. The amendments should be applied on either a prospective transition or modified-retrospective approach depending on the subtopic. This ASU is effective for annual periods beginning after December 15, 2019, and interim periods therein. Early adoption is permitted for annual periods beginning after December 15, 2018, and interim periods therein. The Company is currently evaluating the impact of the adoption of this standard on its consolidated financial statements.
In August 2016, the FASB issued ASU No. 2016-15, "Statement of Cash Flows (Topic 230) - Classification of Certain Cash Receipts and Cash Payments," which addresses eight specific cash flow issues and is intended to reduce diversity in practice in how certain cash receipts and cash payments are presented and classified in the statement of cash flows. The guidance is effective for interim and annual periods beginning after December 15, 2017. The adoption of this guidance is not expected to have a material impact on the Company's consolidated financial statements.
In October 2016, the FASB issued ASU No. 2016-16, “Income Taxes (Topic 740): Intra-Entity Transfers of Assets Other Than Inventory,” which is intended to improve the accounting for the income tax consequences of intra-entity transfers of assets other than inventory. This update removes the current exception in GAAP prohibiting entities from recognizing current and deferred income tax expenses or benefits related to transfer of assets, other than inventory, within the consolidated entity. The current exception to defer the recognition of any tax impact on the transfer of inventory within the consolidated entity until it is sold to a third party remains unaffected. The amendments in this update are effective for public entities for annual reporting periods beginning after December 15, 2017. The Company does not expect the adoption of this ASU to have a material impact on its consolidated financial statements.
In November 2016, the FASB issued
ASU No. 2016-18
,
"Statement of Cash Flows (Topic 230)"
to reduce
diversity in practice related to the classification and presentation of changes in restricted cash on the statement of cash flows under Topic 230, Statement of Cash Flows. The revised guidance requires that amounts generally described as restricted cash and restricted cash equivalents be included with cash and cash equivalents when reconciling the beginning-of-period and end-of-period total amounts shown on the statement of cash flows. The guidance will be applied on a retrospective basis beginning with the earliest period presented. The amendments in this ASU are effective for annual and interim periods beginning after December 15, 2017. The Company does not expect the adoption of this ASU to have a material impact on its consolidated financial statements.
In January 2017, the FASB issued ASU No. 2017-01, "Business Combinations (Topic 805) - Clarifying the Definition of a Business," with the objective to assist entities with evaluating whether transactions should be accounted for as acquisitions (or disposals) of assets versus businesses. The amendments in ASU 2017-01 provide a screen to determine when a set of assets and activities is not a business. The screen requires that when substantially all of the fair value of the gross assets acquired (or disposed of) is concentrated in a single identifiable asset or a group of similar identifiable assets, the set is not a business. This screen is expected to reduce the
77
number of transactions that need to be further evaluated. If the screen is not met, the amendments in ASU 2017-01 (i) require that to be considered a business, a set of assets and liabilities acquired must include, at a minimum, an input and a substantive process that together significantly contribute to the ability to create output; and (ii) remove the evaluation of whether a market participant could replace missing elements. The amendments in this ASU are effective for annual and interim periods beginning after December 15, 2017 and should be applied prospectively. Early adoption is permitted for transactions for which the acquisition date occurs before the issuance date of ASU 2017-01, only when the transaction has not been reported in financial statements that have been issued or made available for issuance. The impact of the adoption of this pronouncement will not be material to the Company's consolidated financial statements.
In January 2017, the FASB issued ASU No. 2017-04, "Intangibles - Goodwill and Other (Topic 350): Simplifying the Test for Goodwill Impairment." Under the new guidance, if a reporting unit's carrying value amount exceeds its fair value, an entity will record an impairment charge based on that difference. The impairment charge will be limited to the amount of goodwill allocated to that reporting unit. The standard eliminates today's requirement to calculate goodwill impairment using Step 2, which calculates an impairment charge by comparing the implied fair value of goodwill with its carrying amount. The standard does not change the guidance on completing Step 1 of the goodwill impairment test. The amendments in this ASU are effective for annual or any interim goodwill impairments tests in fiscal years beginning after December 15, 2019 and should be applied prospectively. Early adoption is permitted for interim or annual goodwill impairment tests performed on testing dates after January 1, 2017. The Company is currently evaluating the impact of the new standard on our consolidated financial statements.
In March 2017, the FASB issued ASU No. 2017-07, "Compensation-Retirement Benefits: Improving the Presentation of Net Periodic Pension Cost and Net Periodic Postretirement Benefit Cost." The new standard requires that an employer disaggregate the service cost component of net benefit cost. Also, these amendments provide guidance on how to present the service cost component and the other components of net benefit costs in the income statement and allow only the service cost component of net benefit cost to be eligible for capitalization. The guidance is effective for fiscal years beginning after December 15, 2017. The Company does not expect the adoption of this ASU to have a material impact on its consolidated financial statements.
In May 2017, the FASB issued ASU No. 2017-09, “Compensation-Stock Compensation (Topic 718) - Scope of Modification Accounting," which amends the scope of modification accounting for share-based payment arrangements. The standard provides guidance on the types of changes to the terms or conditions of share-based payment awards to which an entity would be required to apply modification accounting under ASC 718. Specifically, an entity would not apply modification accounting if the fair value, vesting conditions, and classification of the awards are the same immediately before and after the modification. The new standard is effective for annual periods beginning after December 15, 2017 and interim periods within those years. The Company does not expect the adoption of this ASU to have a material impact on its consolidated financial statements.
In August 2017, the FASB issued ASU No. 2017-12, "Derivatives and Hedging: Targeted Improvements to Accounting for Hedging Activities," which improves the financial reporting of hedging relationships to better align risk management activities in financial statements and make certain targeted improvements to simplify the application of the hedge accounting guidance in current GAAP. The standard is effective for fiscal years beginning after December 15, 2018, including interim periods within those fiscal years. Early adoption is permitted for any interim and annual financial statements that have not yet been issued. The Company is currently in the process of evaluating the impact of this new pronouncement on its consolidated financial statements.
In February 2018, the FASB issued ASU No. 2018-02, "Income Statement - Reporting Comprehensive Income (Topic 220): Reclassification of Certain Tax Effects from Accumulated Other Comprehensive Income." ASU 2018-02 was issued to address the income tax accounting treatment of the stranded tax effects within other comprehensive income due to the prohibition of backward tracing due to an income tax rate change that was initially recorded in other comprehensive income due to the enactment of the Tax Cuts and Jobs Act ("TCJA") on December 22, 2017, which changed the Company's income tax rate from 35% to 21%. The amendments to the ASU changed US GAAP whereby an entity may elect to reclassify the stranded tax effect from accumulated other comprehensive income to retained earnings. The amendments of the ASU may be adopted in total or in
78
part using a full retrospective or modified retrospective method. The amendments of the ASU are effective for periods beginning after December 15, 2018. Early adoption is permitted. The Company is assessing the effect of ASU 2018-02 on its consolidated financial statements.
2
)
Acquisitions and Dispositions
Acquisitions:
Rosen Electronics LLC
On April 18, 2017, Voxx acquired certain assets and assumed certain liabilities of Rosen Electronics LLC for cash consideration of
$1,814
. In addition, the Company agreed to pay a
2%
fee related to future net sales of Rosen products for three years, which resulted in a contingent consideration of
$530
.
Rosen's results of operations have been included in the consolidated financial statements from the date of acquisition. The purpose of this acquisition was to increase the Company's market share and strengthen its intellectual property related to the rear seat entertainment market.
The following summarizes the allocation of the purchase price for the fair value of the assets acquired and liabilities assumed at the date of acquisition:
|
April 18, 2017 (as originally reported)
|
Measurement Period Adjustments
|
April 18, 2017 (as adjusted)
|
|||||||||
|
Assets acquired:
|
|||||||||||
|
Inventory
|
$
|
2,314
|
|
(870
|
)
|
1,444
|
|
||||
|
Goodwill
|
10
|
|
870
|
|
880
|
|
|||||
|
Intangible assets including trademarks and customer relationships
|
520
|
|
—
|
|
520
|
|
|||||
|
Total assets acquired
|
$
|
2,844
|
|
$
|
—
|
|
$
|
2,844
|
|
||
|
Liabilities assumed:
|
|||||||||||
|
Warranty accrual
|
500
|
|
—
|
|
500
|
|
|||||
|
Total
|
$
|
500
|
|
$
|
—
|
|
$
|
500
|
|
||
|
Total purchase price
|
$
|
2,344
|
|
$
|
—
|
|
$
|
2,344
|
|
||
EyeLock
Effective September 1, 2015 ("the Closing Date"), Voxx completed its acquisition of a
54%
voting equity interest in substantially all of the assets and certain specified liabilities of Eyelock, Inc. and Eyelock Corporation (collectively the “Seller”), a developer and marketer of iris-based identity authentication solutions, through a newly-formed entity Eyelock LLC. Eyelock LLC acquired substantially all of the assets and certain specified liabilities of the Seller for a total purchase consideration of
$31,880
, which consisted of a cash payment of
$15,504
, assignment of the fair value of the indebtedness owed to the Company by the Seller of
$4,676
and the fair value of the non-controlling interest of
$12,900
, reduced by
$1,200
for amounts owed to the LLC by the selling shareholders. Additionally, units in Eyelock LLC were issued to certain executives of EyeLock LLC. The fair value of these units is recorded as compensation expense over the requisite service period of two years. This acquisition allows the Company to enter into the growing biometrics market. The fair value of the non-controlling interest was determined, with the assistance of a third-party valuation expert, by grossing up the consideration transferred for the controlling interest by the voting equity interest percentage (adjusted for certain distribution thresholds required until a return of capital is achieved). The Company considered all the rights and preferences of the different classes of security holders and determined that there was no evidence of any disproportionate allocation of cash flow between the controlling and non-controlling interest at the date of acquisition. The adjusted controlling interest percentage in the fair value calculation amounted to
61%
. The non-controlling interest of
$12,900
, valued at
39%
,
79
did not contain any further discount for lack of control. The Company believes the bargain gain implied in the transaction would eliminate any further discount for lack of control.
In connection with the closing, the Company entered into a Loan Agreement with Eyelock LLC. The terms of the Loan Agreement allowed Eyelock LLC to borrow up to
$12,000
. During Fiscal 2017 and Fiscal 2018, the Company issued four convertible promissory notes to EyeLock LLC, allowing the entity to borrow up to a total of
$21,000
in additional funds. Amounts outstanding under the initial loan agreement were due on February 28, 2018, while the four convertible promissory notes executed during Fiscal 2017 and Fiscal 2018 were due on dates ranging from February 28, 2018 through September 1, 2018. On April 1, 2018, all outstanding promissory notes were amended and restated with Voxx issuing a consolidated convertible promissory note to EyeLock LLC to borrow up to
$39,000
. The promissory notes outstanding at February 28, 2018, as well as the amended and restated convertible promissory note issued on April 1, 2018 bear interest at
10%
and can be used to repay protective advances and to fund working capital requirements of the company. The amended and restated promissory note is due on February 28, 2019. The outstanding principal balance of this promissory note is convertible at the sole option of Voxx into units of EyeLock LLC. If Voxx chooses not to convert into equity, the outstanding loan principal of the amended and restated promissory note will be repaid at a multiple of
1.50
based on the repayment date. The agreement includes customary events of default and is collateralized by all of the property of EyeLock LLC. The total balance outstanding related to these notes at
February 28, 2018
was
$33,722
.
The following table summarizes the allocation of the purchase price over the fair values of the assets acquired and liabilities assumed, as of the Closing Date:
|
September 1, 2015
|
||||
|
Assets acquired:
|
||||
|
Accounts receivable
|
$
|
77
|
|
|
|
Inventory
|
304
|
|
||
|
Property, plant and equipment
|
259
|
|
||
|
Intangible assets
|
43,780
|
|
||
|
Total assets acquired
|
$
|
44,420
|
|
|
|
Liabilities assumed:
|
||||
|
Accounts payable and accrued expenses
|
$
|
729
|
|
|
|
Deferred tax liability
|
2,756
|
|
||
|
Bridge loans payable to Voxx
|
3,176
|
|
||
|
Other long-term liabilities
|
1,200
|
|
||
|
Net assets acquired
|
36,559
|
|
||
|
Less: purchase price
|
31,880
|
|
||
|
Gain on bargain purchase
|
$
|
4,679
|
|
|
The acquisition of substantially all of the assets of Eyelock Inc. and Eyelock Corporation resulted in a bargain purchase gain of
$4,679
, which was recognized in the Company's Consolidated Statement of Operations and Comprehensive Income (Loss) for the year ended February 29, 2016. Prior to the recognition of the bargain purchase gain, the Company reassessed the fair value of the tangible and identifiable intangible assets acquired, and liabilities assumed in the acquisition. The Company believes it was able to acquire those assets of Eyelock Inc. and EyeLock Corporation for less than their fair value due to the distressed financial position of the company, its inability to secure additional financing to support its ongoing operations, and the lack of potential bidders for the entity prior to Voxx's acquisition.
The fair values assigned to the intangible assets acquired and their related amortization periods are as follows:
80
|
September 1, 2015
|
Amortization Period (Years)
|
||||||
|
Developed technology
|
$
|
31,290
|
|
11.5 years
|
|||
|
Tradename
|
8,435
|
|
Indefinite
|
||||
|
Customer relationships
|
3,470
|
|
15.5 years
|
||||
|
Non-compete agreement
|
585
|
|
5.0 years
|
||||
|
$
|
43,780
|
|
|||||
The fair values of the intangible assets acquired are measured using Level 3 inputs and are determined using variations of the income approach such as the discounted cash flows, multi-period excess earnings and relief from royalty valuation methods. Significant inputs and assumptions used in determining the fair values of the intangible assets acquired include management’s projections of future revenues, earnings and cash flows from Eyelock LLC, a weighted average cost of capital and distributor rates, customer attrition rates, royalty rates and technological obsolescence rates.
Acquisition related costs relating to this transaction of
$800
were expensed as incurred during the year ended February 29, 2016 and are included in acquisition-related costs on the Consolidated Statements of Operations and Comprehensive Income (Loss). Net sales attributable to EyeLock LLC in the Company's consolidated statements of operations for the year ended
February 28, 2018
were
$335
.
Pro-forma Financial Information
The following unaudited pro-forma financial information for the year ended February 29, 2016 represents the results of the Company's operations as if EyeLock LLC was included for the entire year of Fiscal 2016. The results of EyeLock LLC are included in the Company's continuing operations. The unaudited pro-forma financial information does not necessarily reflect the results of operations that would have occurred had the Company constituted a single entity during such periods (amounts in thousands, except per share data).
|
Year Ended
|
||||
|
February 29, 2016
|
||||
|
Net sales from continuing operations:
|
||||
|
As reported
|
$
|
530,206
|
|
|
|
Pro forma
|
531,321
|
|
||
|
Net loss attributable to VOXX International Corporation:
|
||||
|
As reported
|
$
|
(2,682
|
)
|
|
|
Pro forma
|
(12,098
|
)
|
||
|
Basic loss per share attributable to VOXX International Corporation:
|
||||
|
As reported
|
$
|
(0.11
|
)
|
|
|
Pro forma
|
(0.50
|
)
|
||
|
Diluted loss per share attributable to VOXX International Corporation:
|
||||
|
As reported
|
$
|
(0.11
|
)
|
|
|
Pro forma
|
$
|
(0.50
|
)
|
|
|
Average shares - basic
|
24,172,710
|
|
||
|
Average shares - diluted
|
24,172,710
|
|
||
The above pro-forma results include certain adjustments for the periods presented to adjust the financial results and give consideration to the assumption that the acquisition occurred on the first day of Fiscal 2015. These adjustments include costs such as an estimate for amortization associated with intangible assets acquired, the removal of interest expense, as well as rent and utility expenses on debt and property leases not assumed, and the movement of expenses and gains specific to the acquisition from Fiscal 2016 to Fiscal 2015. These pro-forma results of operations have been estimated
81
for comparative purposes only and may not reflect the actual results of operations that would have been achieved had the transaction occurred on the date presented or be indicative of results to be achieved in the future.
Dispositions:
Hirschmann Car Communication GmbH
On August 31, 2017 (the "Closing Date"), the Company completed its sale of Hirschmann Car Communication GmbH and its subsidiaries (collectively, “Hirschmann”) to a subsidiary of TE Connectivity Ltd ("TE"). The consideration received by the Company was €
148,500
. The purchase price, at the exchange rate as of the close of business on the Closing Date approximated
$177,000
and is subject to adjustment based upon the final working capital. VOXX International (Germany) GmbH, the Company's German wholly-owned subsidiary, was the selling entity in this transaction.
The Hirschmann subsidiary group, which was included within the Automotive segment, qualified to be presented as a discontinued operation in accordance with ASC 205-20 beginning in the Company's second quarter ending August 31, 2017. Voxx will not have any continuing involvement in the Hirschmann business subsequent to the Closing Date. Hirschmann and TE will not be related parties of the Company after the deconsolidation of Hirschmann.
In order to hedge the fluctuation in the exchange rate before closing, the Company entered into forward contracts totaling €
148,500
, which could be settled on dates ranging from August 31, 2017 through September 6, 2017. As the sale of Hirschmann closed on August 31, 2017, the Company settled all of the forward contracts on this date. The forward contracts were not designated for hedging and a total foreign currency loss of
$(6,618)
was recorded when the contracts were settled, within continuing operations for the year ended February 28, 2018.
The following table presents a reconciliation of the carrying amounts of major classes of assets and liabilities of the discontinued operation to the amounts presented separately in the Company's Consolidated Balance Sheet:
|
February 28, 2017
|
||||
|
Cash and cash equivalents
|
$
|
6,844
|
|
|
|
Accounts receivable, net
|
10,670
|
|
||
|
Inventory, net
|
30,701
|
|
||
|
Receivables from vendors
|
31
|
|
||
|
Prepaid expenses and other current assets
|
7,261
|
|
||
|
Assets held for sale, current
|
$
|
55,507
|
|
|
|
Property, plant and equipment, net
|
16,012
|
|
||
|
Goodwill
|
49,307
|
|
||
|
Intangible assets, net
|
21,350
|
|
||
|
Assets held for sale, non-current
|
$
|
86,669
|
|
|
|
Accounts payable
|
14,899
|
|
||
|
Accrued expenses and other current liabilities
|
10,366
|
|
||
|
Income taxes payable
|
2,374
|
|
||
|
Current portion of long-term debt
|
1,002
|
|
||
|
Liabilities held for sale, current
|
$
|
28,641
|
|
|
|
Capital lease obligation
|
474
|
|
||
|
Deferred compensation
|
380
|
|
||
|
Deferred income tax liabilities
|
2,528
|
|
||
|
Other long-term liabilities
|
8,259
|
|
||
|
Liabilities held for sale, non-current
|
$
|
11,641
|
|
|
|
Net assets held for sale
|
$
|
101,894
|
|
|
82
The following table presents a reconciliation of the major financial lines constituting the results of operations for discontinued operations to the net income from discontinued operations, net of tax, presented separately in the Consolidated Statements of Operations and Comprehensive Income (Loss):
|
Year ended February 28, 2018
|
Year ended February 28, 2017
|
Year ended February 29, 2016
|
||||||||||
|
Net sales
|
$
|
91,824
|
|
$
|
166,512
|
|
$
|
150,540
|
|
|||
|
Cost of sales
|
63,610
|
|
109,027
|
|
98,391
|
|
||||||
|
Gross profit
|
28,214
|
|
57,485
|
|
52,149
|
|
||||||
|
Operating expenses:
|
||||||||||||
|
Selling
|
2,778
|
|
5,097
|
|
4,937
|
|
||||||
|
General and administrative
|
14,699
|
|
28,309
|
|
27,148
|
|
||||||
|
Engineering and technical support
|
7,920
|
|
16,083
|
|
14,567
|
|
||||||
|
Total operating expenses
|
25,397
|
|
49,489
|
|
46,652
|
|
||||||
|
Operating income from discontinued operations
|
2,817
|
|
7,996
|
|
5,497
|
|
||||||
|
Other (expense) income:
|
||||||||||||
|
Interest and bank charges (a)
|
(279
|
)
|
(383
|
)
|
(177
|
)
|
||||||
|
Other, net
|
145
|
|
(126
|
)
|
54
|
|
||||||
|
Total other expense of discontinued operations, net
|
(134
|
)
|
(509
|
)
|
(123
|
)
|
||||||
|
Gain on sale of discontinued operations before taxes
|
36,118
|
|
—
|
|
—
|
|
||||||
|
Total income from discontinued operations before taxes
|
38,801
|
|
7,487
|
|
5,374
|
|
||||||
|
Income tax expense on discontinued operations (b)
|
4,183
|
|
1,421
|
|
616
|
|
||||||
|
Income from discontinued operations, net of taxes
|
$
|
34,618
|
|
$
|
6,066
|
|
$
|
4,758
|
|
|||
|
Income per share - basic
|
$
|
1.43
|
|
$
|
0.25
|
|
$
|
0.20
|
|
|||
|
Income per share - diluted
|
$
|
1.41
|
|
$
|
0.25
|
|
$
|
0.20
|
|
|||
(a) Includes an allocation of consolidated interest expense and interest expense directly related to debt assumed by the buyer. The allocation of consolidated interest expense was based upon the ratio of net assets of the discontinued operations to that of the Consolidated Company.
(b) The income tax expense on discontinued operations for the year ended February 28, 2018 was positively impacted by an income tax benefit related to the partial reversal of the Company’s valuation allowance as the Company utilized a significant portion of its tax attributes to offset the U.S. tax gain related to the sale of Hirschmann.
The following table presents supplemental cash flow information of the discontinued operations:
83
|
Year ended February 28, 2018
|
Year ended February 28, 2017
|
Year ended February 29, 2016
|
|||||||||
|
Operating activities:
|
|||||||||||
|
Depreciation and amortization expense
|
$
|
2,939
|
|
$
|
5,908
|
|
$
|
6,183
|
|
||
|
Stock-based compensation expense
|
50
|
|
84
|
|
57
|
|
|||||
|
Investing activities:
|
|||||||||||
|
Capital expenditures
|
2,652
|
|
5,122
|
|
4,065
|
|
|||||
|
Non-cash investing and financing activities:
|
|||||||||||
|
Capital expenditures funded by long-term obligations
|
1,916
|
|
—
|
|
1,074
|
|
|||||
|
3)
|
Variable Interest Entities
|
A variable interest entity ("VIE") is an entity that either (i) has insufficient equity to permit the entity to finance its activities without additional subordinated financial support, or (ii) has equity investors who lack the characteristics of a controlling financial interest. Under ASC 810, an entity that holds a variable interest in a VIE and meets certain requirements would be considered to be the primary beneficiary of the VIE and required to consolidate the VIE in its consolidated financial statements. In order to be considered the primary beneficiary of a VIE, an entity must hold a variable interest in the VIE and have both:
•
the power to direct the activities that most significantly impact the economic performance of the VIE; and
•
the right to receive benefits from, or the obligation to absorb losses of, the VIE that could be potentially significant to the VIE.
Effective September 1, 2015, Voxx acquired a majority voting interest in substantially all of the assets and certain specified liabilities of Eyelock, Inc. and Eyelock Corporation, a market leader of iris-based identity authentication solutions, through a newly-formed entity, Eyelock LLC (See Note 2). We have determined that we hold a variable interest in EyeLock LLC as a result of:
•
our majority voting interest and ownership of substantially all of the assets and certain liabilities of the entity; and
•
a loan agreement with EyeLock LLC, executed in conjunction with the acquisition, as well as during Fiscal 2017 and Fiscal 2018, in which the subsidiary may borrow funds from Voxx for working capital purposes. The total outstanding balance of these loans as of
February 28, 2018
was
$33,722
. See Note 2 for discussion of the original notes, as well as the amendment and restatement of all of the notes outstanding, which was executed on April 1, 2018.
We concluded that we became the primary beneficiary of EyeLock LLC on September 1, 2015 in conjunction with the acquisition. This was the first date that we had the power to direct the activities of EyeLock LLC that most significantly impact the economic performance of the entity because we acquired a majority interest in substantially all of the assets and certain liabilities of EyeLock Inc. and EyeLock Corporation on this date, as well as obtained a majority voting interest as a result of this transaction. Although we are considered to have control over EyeLock LLC under ASC 810, as a result of our majority ownership interest, the assets of EyeLock LLC can only be used to satisfy the obligations of EyeLock LLC. As a result of our majority ownership interest in the entity and our primary beneficiary conclusion, we consolidated EyeLock LLC in our consolidated financial statements beginning on September 1, 2015. Prior to September 1, 2015, EyeLock Inc. and EyeLock Corporation were not required to be consolidated in our consolidated financial statements, as we concluded that we were not the primary beneficiary of these entities prior to that time.
84
Assets and Liabilities of EyeLock LLC
In accordance with ASC 810, the consolidation of EyeLock LLC was treated as an acquisition of assets and liabilities and, therefore, the assets and liabilities of EyeLock LLC were included in our consolidated financial statements at their fair value as of September 1, 2015. Refer to Note 2 for the fair value of the assets and liabilities of EyeLock LLC on the acquisition date and the discussion of purchase accounting procedures performed.
The following table sets forth the carrying values of assets and liabilities of EyeLock LLC that were included on our Consolidated Balance Sheet as of
February 28, 2018
and
February 28, 2017
:
|
February 28, 2018
|
February 28, 2017
|
|||||||
|
Assets
|
||||||||
|
Current assets:
|
||||||||
|
Cash and cash equivalents
|
$
|
(101
|
)
|
$
|
11
|
|
||
|
Accounts receivable, net
|
128
|
|
295
|
|
||||
|
Inventory, net
|
(119
|
)
|
135
|
|
||||
|
Prepaid expenses and other current assets
|
117
|
|
189
|
|
||||
|
Total current assets
|
25
|
|
630
|
|
||||
|
Property, plant and equipment, net
|
186
|
|
276
|
|
||||
|
Intangible assets, net
|
36,126
|
|
39,187
|
|
||||
|
Other assets
|
119
|
|
96
|
|
||||
|
Total assets
|
$
|
36,456
|
|
$
|
40,189
|
|
||
|
Liabilities and Stockholders' Equity
|
||||||||
|
Current liabilities:
|
||||||||
|
Accounts payable
|
$
|
4,610
|
|
$
|
710
|
|
||
|
Accrued expenses and other current liabilities
|
2,557
|
|
3,506
|
|
||||
|
Total current liabilities
|
7,167
|
|
4,216
|
|
||||
|
Long-term debt
|
33,722
|
|
22,098
|
|
||||
|
Other long-term liabilities
|
1,200
|
|
1,200
|
|
||||
|
Total liabilities
|
42,089
|
|
27,514
|
|
||||
|
Commitments and contingencies
|
||||||||
|
Partners' equity:
|
||||||||
|
Capital
|
41,416
|
|
40,891
|
|
||||
|
Retained earnings
|
(47,049
|
)
|
(28,216
|
)
|
||||
|
Total partners' equity
|
(5,633
|
)
|
12,675
|
|
||||
|
Total liabilities and partners' equity
|
$
|
36,456
|
|
$
|
40,189
|
|
||
The assets of EyeLock LLC can only be used to satisfy the obligations of EyeLock LLC.
Revenue and Expenses of EyeLock LLC
The following table sets forth the revenue and expenses of EyeLock LLC that were included in our Consolidated Statements of Operations and Comprehensive Income (Loss) for the years ended
February 28, 2018
,
February 28, 2017
, and
February 29, 2016
:
85
|
Year ended February 28, 2018
|
Year ended February 28, 2017
|
Year ended February 29, 2016
|
||||||||||
|
Net sales
|
$
|
335
|
|
$
|
243
|
|
$
|
143
|
|
|||
|
Cost of sales
|
455
|
|
301
|
|
11
|
|
||||||
|
Gross profit
|
(120
|
)
|
(58
|
)
|
132
|
|
||||||
|
Operating expenses:
|
||||||||||||
|
Selling
|
1,893
|
|
2,227
|
|
877
|
|
||||||
|
General and administrative
|
6,792
|
|
6,956
|
|
3,239
|
|
||||||
|
Engineering and technical support
|
7,159
|
|
8,698
|
|
4,393
|
|
||||||
|
Total operating expenses
|
15,844
|
|
17,881
|
|
8,509
|
|
||||||
|
Operating loss
|
(15,964
|
)
|
(17,939
|
)
|
(8,377
|
)
|
||||||
|
Interest and bank charges
|
(2,869
|
)
|
(1,609
|
)
|
(294
|
)
|
||||||
|
Other, net
|
—
|
|
—
|
|
3
|
|
||||||
|
Loss before income taxes
|
(18,833
|
)
|
(19,548
|
)
|
(8,668
|
)
|
||||||
|
Income tax expense
|
—
|
|
—
|
|
—
|
|
||||||
|
Net loss
|
$
|
(18,833
|
)
|
$
|
(19,548
|
)
|
$
|
(8,668
|
)
|
|||
|
4)
|
Receivables from Vendors
|
The Company has recorded receivables from vendors in the amount of
$493
and
$634
as of
February 28, 2018
and
February 28, 2017
, respectively. Receivables from vendors primarily represent prepayments on product shipments and product reimbursements.
|
5)
|
Equity Investment
|
The Company has a
50%
non-controlling ownership interest in ASA Electronics, LLC and Subsidiary ("ASA"), which acts as a distributor of mobile electronics specifically designed for niche markets within the Automotive industry, including RV’s; buses; and commercial, heavy duty, agricultural, construction, powersport, and marine vehicles. ASC 810 requires the Company to evaluate non-consolidated entities periodically, and as circumstances change, to determine if an implied controlling interest exists. During Fiscal
2018
, the Company evaluated this equity investment and concluded that this is still a variable interest entity and the Company is not the primary beneficiary. ASA’s fiscal year end is
November 30, 2017
; however, the results of ASA as of and through
February 28, 2018
have been recorded in the consolidated financial statements.
The Company's share of income from ASA for the years ended
February 28, 2018
,
February 28, 2017
and
February 29, 2016
was
$7,178
,
$6,797
and
$6,538
, respectively. In addition, the Company received cash distributions from ASA totaling
$7,247
,
$6,820
and
$6,237
during the years ended
February 28, 2018
,
February 28, 2017
and
February 29, 2016
, respectively.
Undistributed earnings from equity investments amounted to
$16,531
and
$16,600
at
February 28, 2018
and
February 28, 2017
, respectively.
Net sales transactions between the Company and ASA were
$315
,
$611
and
$1,608
for the years ended
February 28, 2018
,
February 28, 2017
and
February 29, 2016
, respectively. Accounts receivable balances from ASA were
$65
and
$51
as of
February 28, 2018
and
February 28, 2017
, respectively.
|
6)
|
Accrued Expenses and Other Current Liabilities
|
Accrued expenses and other current liabilities consist of the following:
86
|
February 28,
2018 |
February 28,
2017 |
||||||
|
Commissions
|
$
|
711
|
|
$
|
598
|
|
|
|
Employee compensation
|
17,173
|
|
14,713
|
|
|||
|
Professional fees and accrued settlements
|
1,427
|
|
1,616
|
|
|||
|
Future warranty
|
4,261
|
|
3,911
|
|
|||
|
Freight and duty
|
1,880
|
|
2,651
|
|
|||
|
Payroll and other taxes
|
256
|
|
414
|
|
|||
|
Royalties, advertising and other
|
10,642
|
|
8,207
|
|
|||
|
Total accrued expenses and other current liabilities
|
$
|
36,350
|
|
$
|
32,110
|
|
|
The Company has a call/put option agreement with certain employees of Voxx Germany, whereby these employees may acquire up to a maximum of
20%
of the Company's stated share capital in Voxx Germany at a call price equal to the same proportion of the actual price paid by the Company for Voxx Germany. The put and call prices are fixed at
€3,000
and
€0
, respectively, with the put subject only to downward adjustments for losses incurred by Voxx Germany. The put options become immediately exercisable upon (i) the sale of Voxx Germany or (ii) the termination of employment or death of the employee. For each fiscal year, the employees also receive a dividend equal to 20% of Voxx Germany's net after tax profits. Accordingly, the Company recognizes compensation expense based on
20%
of the after tax net profits of Voxx Germany, subject to certain tax treatment adjustments as defined in the agreement, representing the annual dividend. The balance of the call/put option included in Accrued Expenses and Other Current Liabilities on the Consolidated Balance Sheets at
February 28, 2018
and
February 28, 2017
was
$3,966
and
$3,586
, respectively, and is included within employee compensation in the table above. Compensation expense for these options amounted to
$285
,
$405
and
$357
for the years ended
February 28, 2018
,
February 28, 2017
and
February 29, 2016
, respectively.
|
7)
|
Financing Arrangements
|
The Company has the following financing arrangements:
|
February 28,
2018 |
February 28,
2017 |
|||||||
|
Domestic credit facility (a)
|
$
|
—
|
|
$
|
92,793
|
|
||
|
Florida mortgage (b)
|
8,613
|
|
9,113
|
|
||||
|
Euro asset-based lending obligation (c)
|
6,119
|
|
3,905
|
|
||||
|
Schwaiger mortgage (d)
|
468
|
|
644
|
|
||||
|
Klipsch note (e)
|
—
|
|
113
|
|
||||
|
VOXX Germany mortgage (f)
|
3,665
|
|
3,875
|
|
||||
|
Total debt
|
18,865
|
|
110,443
|
|
||||
|
Less: current portion of long-term debt
|
7,730
|
|
9,215
|
|
||||
|
Long-term debt before debt issuance costs
|
11,135
|
|
101,228
|
|
||||
|
Debt issuance costs
|
2,659
|
|
3,481
|
|
||||
|
Total long-term debt
|
$
|
8,476
|
|
$
|
97,747
|
|
||
a)
Domestic Bank Obligations
The Company has a senior secured credit facility ("the Credit Facility") that provides for a revolving credit facility with committed availability of up to
$140,000
, which may be increased, at the option of the Company, up to a maximum of
$175,000
, and a term loan in the amount of
$15,000
. The Credit Facility also includes a
$15,000
sublimit for letters of credit and a
$15,000
sublimit for swingline loans. The availability under the
87
revolving credit line within the Credit Facility is subject to a borrowing base, which is based on eligible accounts receivable, eligible inventory and certain real estate, subject to reserves as determined by the lender, and is also limited by amounts outstanding under the Florida Mortgage (see Note 7(b)). In conjunction with the sale of Hirschmann on August 31, 2017 (see Note 2), the Company paid down substantially all of the outstanding balance of the revolving credit facility, as well as the entire outstanding balance of the term loan, which is not renewable. As of
February 28, 2018
, there was
no
balance outstanding under the revolving credit facility. The remaining availability under the revolving credit line of the Credit Facility was
$95,796
as of
February 28, 2018
.
All amounts outstanding under the Credit Facility will mature and become due on April 26, 2021; however, it is subject to acceleration upon the occurrence of an Event of Default (as defined in the Credit Agreement). The Company may prepay any amounts outstanding at any time, subject to payment of certain breakage and redeployment costs relating to LIBOR Rate Loans. The commitments under the Credit Facility may be irrevocably reduced at any time, without premium or penalty as set forth in the agreement.
Generally, the Company may designate specific borrowings under the Credit Facility as either Base Rate Loans or LIBOR Rate Loans, except that swingline loans may only be designated as Base Rate Loans. Loans under the Credit Facility designated as LIBOR Rate Loans shall bear interest at a rate equal to the then-applicable LIBOR Rate plus a range of
1.75%
-
2.25%
. Loans under the Credit Facility designated as Base Rate Loans shall bear interest at a rate equal to the applicable margin for Base Rate Loans of
0.75%
-
1.25%
, as defined in the agreement. As of
February 28, 2018
, the weighted average interest rate on the Credit Facility was
5.25%
.
The Credit Facility requires compliance with a financial covenant calculated as of the last day of each month consisting of a Fixed Charge Coverage Ratio. The Credit Facility also contains covenants that limit the ability of the loan parties and certain of their subsidiaries which are not loan parties to, among other things: (i) incur additional indebtedness; (ii) incur liens; (iii) merge, consolidate or dispose of a substantial portion of their business; (iv) transfer or dispose of assets; (v) change their name, organizational identification number, state or province of organization or organizational identity; (vi) make any material change in their nature of business; (vii) prepay or otherwise acquire indebtedness; (viii) cause any change of control; (ix) make any restricted junior payment; (x) change their fiscal year or method of accounting; (xi) make advances, loans or investments; (xii) enter into or permit any transaction with an affiliate of any borrower or any of their subsidiaries; (xiii) use proceeds for certain items; (xiv) issue or sell any of their stock; (xv) consign or sell any of their inventory on certain terms. In addition, if excess availability under the Credit Facility were to fall below certain specified levels, as defined in the agreement, the lenders would have the right to assume dominion and control over the Company's cash. As of
February 28, 2018
, the Company was in compliance with all covenants included within the Credit Facility.
The obligations under the loan documents are secured by a general lien on, and security interest in, substantially all of the assets of the borrowers and certain of the guarantors, including accounts receivable, equipment, real estate, general intangibles and inventory. The Company has guaranteed the obligations of the borrowers under the Credit Facility.
The Company has deferred financing costs related to the Credit Facility and a previous amendment and modification of the Credit Facility. These deferred financing costs are included in Long-term debt on the accompanying Consolidated Balance Sheets as a contra-liability balance and are amortized through Interest and bank charges in the Consolidated Statements of Operations and Comprehensive Income (Loss) over the five year term of the Credit Facility. During Fiscal 2016, the Company made an amendment to the Credit Facility, which was also accounted for as a modification of debt; however, as the Company reduced the available credit in conjunction with this amendment, unamortized deferred financing costs of
$1,309
were written off and charged to Interest and bank charges in the Consolidated Statement of Operations and Comprehensive Income (Loss) for the year ended February 29, 2016. During the years ended
February 28, 2018
,
February 28, 2017
and
February 29, 2016
, the Company amortized
$791
,
$789
and
$1,074
of these costs, respectively.
Charges incurred on the unused portion of the Credit Facility and its predecessor revolving credit facility during the years ended
February 28, 2018
,
February 28, 2017
and
February 29, 2016
totaled
$404
,
$241
and
$321
, respectively, and are included within Interest and Bank Charges on the Consolidated Statement of Operations and Comprehensive Income (Loss).
88
b)
Florida Mortgage
On July 6, 2015, VOXX HQ LLC, the Company’s wholly owned subsidiary, closed on a
$9,995
industrial development revenue tax exempt bond under a loan agreement in favor of the Orange County Industrial Development Authority (the “Authority”) to finance the construction of the Company's manufacturing facility and executive offices in Lake Nona, Florida (the “Construction Loan”). Wells Fargo Bank, N.A. ("Wells Fargo") was the purchaser of the bond and U.S. Bank National Association is the trustee under an Indenture of Trust with the Authority. Voxx borrowed the proceeds of the bond purchase from the Authority during construction as a revolving loan, which converted to a permanent mortgage upon completion of the facility in January 2016 (the "Florida Mortgage"). The Company makes principal and interest payments to Wells Fargo, which began March 1, 2016 and will continue through March of 2026. The Florida Mortgage bears interest at
70%
of 1-month LIBOR plus
1.54%
(
3.14%
at
February 28, 2018
) and is secured by a first mortgage on the property, a collateral assignment of leases and rents and a guaranty by the Company. The Company is in compliance with the financial covenants of the Florida Mortgage, which are as defined in the Company’s Credit Facility with Wells Fargo dated April 26, 2016.
The Company incurred debt financing costs totaling approximately
$332
as a result of obtaining the Florida Mortgage, which are recorded as deferred financing costs and included in Long-term debt as a contra-liability balance on the accompanying Consolidated Balance Sheets and are being amortized through Interest and bank charges in the Consolidated Statements of Operations and Comprehensive Income (Loss) over the ten-year term of the Florida Mortgage. The Company amortized
$31
of these costs during both of the years ended
February 28, 2018
and
February 28, 2017
, and
$21
during the year ended
February 29, 2016
.
On July 20, 2015, the Company entered into an interest rate swap agreement in order to hedge interest rate exposure related to the Florida Mortgage and pays a fixed rate of
3.48%
under the swap agreement (See Note 1 e)).
c)
Euro Asset-Based Lending Obligation
Foreign bank obligations include a Euro accounts receivable factoring arrangement, which has a credit limit of up to
60%
of eligible non-factored accounts receivable (see Note 1(h)) and a Euro Asset-Based Lending ("ABL") credit facility, which has a credit limit of
€8,000
, for the Company's subsidiary, VOXX Germany, which expires on July 31, 2020. The rate of interest for the factoring agreement is the three-month Euribor plus
1.6%
(
1.3%
at
February 28, 2018
) and the rate of interest for the ABL is the three-month Euribor plus
2.3%
(
2.0%
at
February 28, 2018
). As of
February 28, 2018
, the amounts outstanding under these facilities, which are payable on demand, do not exceed their respective credit limits.
d)
Schwaiger Mortgage
In January 2012, the Company's Schwaiger subsidiary purchased a building, entering into a mortgage note payable. The mortgage note bears interest at
3.75%
and will be fully paid by December 2019.
e)
Klipsch Notes
This balance represents a mortgage on a facility included in the assets acquired in connection with the Klipsch acquisition on March 1, 2011 and assumed by Voxx. The remaining balance of this note was paid in full during the third quarter of Fiscal 2018.
f)
VOXX Germany Mortgage
Included in this balance is a mortgage on the land and building housing VOXX Germany's headquarters in Pulheim, Germany, which was entered into in January 2013. The mortgage bears interest at
2.85%
, payable in twenty-six quarterly installments through June 2019.
89
The following is a maturity table for debt and bank obligations outstanding at
February 28, 2018
for each of the following fiscal years:
|
2019
|
$
|
7,730
|
|
|
2020
|
2,011
|
|
|
|
2021
|
2,011
|
|
|
|
2022
|
499
|
|
|
|
2023
|
499
|
|
|
|
Thereafter
|
6,115
|
|
|
|
Total
|
$
|
18,865
|
|
The weighted-average interest rate on short-term debt was
2.25%
for Fiscal
2018
and
2.33%
for Fiscal
2017
. Interest expense related to the Company's financing arrangements for the years ended
February 28, 2018
,
February 28, 2017
and
February 29, 2016
was
$3,473
,
$3,879
and
$3,142
, respectively, of which
$1,708
,
$2,723
and
$2,126
was related to the Credit Facility for the years ended
February 28, 2018
,
February 28, 2017
and
February 29, 2016
, respectively.
8)
Income Taxes
The components of income before the (benefit) provision for income taxes are as follows:
|
Year
Ended
|
Year
Ended
|
Year
Ended
|
|||||||||
|
February 28,
2018 |
February 28,
2017 |
February 29,
2016 |
|||||||||
|
Domestic Operations
|
$
|
(27,214
|
)
|
$
|
(12,834
|
)
|
$
|
(14,069
|
)
|
||
|
Foreign Operations
|
3,110
|
|
3,904
|
|
897
|
|
|||||
|
|
$
|
(24,104
|
)
|
$
|
(8,930
|
)
|
$
|
(13,172
|
)
|
||
The provision (benefit) for income taxes is comprised of the following:
90
|
Year
Ended
|
Year
Ended
|
Year
Ended
|
|||||||||
|
February 28,
2018 |
February 28,
2017 |
February 29,
2016 |
|||||||||
|
Current provision (benefit)
|
|
|
|
||||||||
|
Federal
|
$
|
(1,451
|
)
|
$
|
(2,118
|
)
|
$
|
(415
|
)
|
||
|
State
|
150
|
|
238
|
|
10
|
|
|||||
|
Foreign
|
1,814
|
|
1,580
|
|
1,588
|
|
|||||
|
Total current provision (benefit)
|
$
|
513
|
|
$
|
(300
|
)
|
$
|
1,183
|
|
||
|
Deferred (benefit) provision
|
|
|
|
|
|
|
|||||
|
Federal
|
$
|
(17,198
|
)
|
$
|
658
|
|
$
|
(5,540
|
)
|
||
|
State
|
(827
|
)
|
279
|
|
1,395
|
|
|||||
|
Foreign
|
67
|
|
(299
|
)
|
611
|
|
|||||
|
Total deferred (benefit) provision
|
$
|
(17,958
|
)
|
$
|
638
|
|
$
|
(3,534
|
)
|
||
|
Total (benefit) provision
|
|
|
|
|
|
|
|||||
|
Federal
|
$
|
(18,649
|
)
|
$
|
(1,460
|
)
|
$
|
(5,955
|
)
|
||
|
State
|
(677
|
)
|
517
|
|
1,405
|
|
|||||
|
Foreign
|
1,881
|
|
1,281
|
|
2,199
|
|
|||||
|
Total (benefit) provision
|
$
|
(17,445
|
)
|
$
|
338
|
|
$
|
(2,351
|
)
|
||
The effective tax rate before income taxes varies from the current statutory U.S. federal income tax rate as follows:
|
Year
Ended
|
Year
Ended
|
Year
Ended
|
||||||||||||||||||
|
February 28,
2018 |
February 28,
2017 |
February 29,
2016 |
||||||||||||||||||
|
Tax benefit at Federal statutory rates
|
$
|
(7,891
|
)
|
32.7
|
%
|
$
|
(3,123
|
)
|
35.0
|
%
|
$
|
(4,611
|
)
|
35.0
|
%
|
|||||
|
State income taxes, net of Federal benefit
|
(249
|
)
|
1.0
|
|
(788
|
)
|
8.8
|
|
1,100
|
|
(8.3
|
)
|
||||||||
|
Change in valuation allowance
|
(2,546
|
)
|
10.6
|
|
6,588
|
|
(73.8
|
)
|
2,820
|
|
(21.4
|
)
|
||||||||
|
Change in tax reserves
|
(2,443
|
)
|
10.1
|
|
(5,974
|
)
|
66.9
|
|
101
|
|
(0.8
|
)
|
||||||||
|
Non-controlling interest
|
2,404
|
|
(10.0
|
)
|
2,668
|
|
(29.9
|
)
|
1,183
|
|
(9.0
|
)
|
||||||||
|
Bargain purchase gain
|
—
|
|
—
|
|
—
|
|
—
|
|
(1,638
|
)
|
12.4
|
|
||||||||
|
US effects of foreign operations
|
614
|
|
(2.5
|
)
|
556
|
|
(6.2
|
)
|
(474
|
)
|
3.6
|
|
||||||||
|
Permanent differences and other
|
1,190
|
|
(4.9
|
)
|
589
|
|
(6.6
|
)
|
(488
|
)
|
3.7
|
|
||||||||
|
Foreign exchange loss
|
(3,376
|
)
|
14.0
|
|
—
|
|
—
|
|
—
|
|
—
|
|
||||||||
|
NOL carryback
|
—
|
|
—
|
|
1,413
|
|
(15.8
|
)
|
—
|
|
—
|
|
||||||||
|
Change in tax rate
|
(2,462
|
)
|
10.2
|
|
(110
|
)
|
1.2
|
|
172
|
|
(1.3
|
)
|
||||||||
|
Research & development credits
|
(524
|
)
|
2.2
|
|
(625
|
)
|
7.0
|
|
(452
|
)
|
3.4
|
|
||||||||
|
Tax credits
|
(2,162
|
)
|
9.0
|
|
(856
|
)
|
9.6
|
|
(64
|
)
|
0.5
|
|
||||||||
|
Effective tax rate
|
$
|
(17,445
|
)
|
72.4
|
%
|
$
|
338
|
|
(3.8
|
)%
|
$
|
(2,351
|
)
|
17.8
|
%
|
|||||
The U.S. effects of foreign operations include differences in the statutory tax rate of the foreign countries as compared to the statutory tax rate in the U.S.
91
On December 22, 2017, the U.S. government enacted comprehensive tax reform commonly referred to as the Tax Cuts and Jobs Act (“TCJA”). Under Accounting Standards Codification (“ASC”) 740, the effects of changes in tax rates and laws are recognized in the period which the new legislation is enacted. The TCJA makes broad and complex changes to the U.S. tax code, including, but not limited to: (1) reducing the U.S. federal corporate tax rate from
35%
to
21%
; (2) changing rules related to uses and limitations of net operating loss carryforwards created in tax years beginning after December 31, 2017; (3) accelerated expensing on certain qualified property; (4) creating a new limitation on deductible interest expense to 30% of tax adjusted EBITDA through 2021 and then 30% of tax adjusted EBIT thereafter; (5) eliminating the corporate alternative minimum tax; (6) further limitations on the deductibility of executive compensation under IRC §162(m) for tax years beginning after December 31, 2017 ; (7) a one-time transition tax related to the transition of U.S. international tax from a worldwide tax system to a territorial tax system; and (8) additional changes to the U.S. international tax rules including imposing a minimum tax on global intangible low taxed income (“GILTI”) and other base erosion anti-abuse provisions.
In response to the TCJA, the U.S. Securities and Exchange Commission (“SEC”) staff issued Staff Accounting Bulletin No. 118 (“SAB 118”), which provides guidance on accounting for the tax effects of TCJA. The purpose of SAB 118 was to address any uncertainty or diversity of view in applying ASC Topic 740, Income Taxes in the reporting period in which the TCJA was enacted. SAB 118 addresses situations where the accounting is incomplete for certain income tax effects of the TCJA upon issuance of a company’s financial statements for the reporting period which include the enactment date. SAB 118 allows for a provisional amount to be recorded if it is a reasonable estimate of the impact of the TCJA. Additionally, SAB 118 allows for a measurement period to finalize the impacts of the TCJA, not to extend beyond one year from the date of enactment.
In connection with the Company’s initial analysis of the impact of the TCJA, the Company has recorded a provisional decrease in its deferred tax assets and liabilities of
$4,706
related to the remeasurement of the deferred tax assets and liabilities at the reduced U.S. federal tax rate of
21%
. The Company is subject to a one-time transition tax based on the total post-1986 earnings and profits that were previously deferred from U.S. income and profits. The Company recorded a liability in connection with the one-time transition tax of
$2,696
, which was principally offset by the Company’s tax attributes.
Pursuant to SAB 118, the Company is in the process of assessing the impact of the TCJA on its indefinite reinvestment assertion and any associated impact on its financial statements. This assessment includes, but is not limited to, assessing how the TCJA will impact the consequence of indefinitely reinvesting the Company’s foreign earnings and evaluating how the Company, having a minimal tax liability for the transition tax, will be impacted by future repatriations. Therefore, no adjustments have been made in the Company’s financial statements with respect to its indefinite reinvestment criteria.
The Company has not made a policy election with respect to the income tax effects of the new GILTI provisions. Companies can either account for taxes on GILTI as a current period expense or recognize deferred taxes when basis differences exist that are expected to affect the amount of GILTI inclusion upon reversal. Due to the complexity of these new tax rules, the Company is continuing to evaluate the expected impact. In accordance with SAB 118, the Company has not included an estimate of the tax expense or benefit related to GILTI for the fiscal year ended February 28, 2018.
While the Company is able to make a reasonable estimate of the impact of the reduction in the corporate rate and transition tax, the provisional amounts may change due to a variety of factors, including, among other things, (i) anticipated guidance from the U.S. Department of Treasury about implementing the TCJA, (ii) potential additional guidance from the SEC or the FASB related to the TCJA, and (iii) the Company’s further assessment of the TCJA and related regulatory guidance. The Company is not complete in its assessment of the impact of the TCJA on its income tax accounts and financial statements.
Deferred income taxes reflect the net tax effects of temporary differences between the carrying amounts of assets and liabilities for financial reporting and tax purposes. Significant components of the Company's deferred tax assets and liabilities are as follows:
92
|
February 28,
2018 |
February 28,
2017 |
||||||
|
Deferred tax assets:
|
|
|
|||||
|
Accounts receivable
|
$
|
52
|
|
$
|
642
|
|
|
|
Inventory
|
2,011
|
|
2,177
|
|
|||
|
Property, plant and equipment
|
479
|
|
—
|
|
|||
|
Accruals and reserves
|
2,375
|
|
4,794
|
|
|||
|
Deferred compensation
|
806
|
|
1,460
|
|
|||
|
Warranty reserves
|
976
|
|
1,421
|
|
|||
|
Unrealized gains and losses
|
1,335
|
|
1,764
|
|
|||
|
Net operating losses
|
13,191
|
|
9,557
|
|
|||
|
Foreign tax credits
|
4,501
|
|
2,616
|
|
|||
|
Other tax credits
|
3,530
|
|
2,937
|
|
|||
|
Deferred tax assets before valuation allowance
|
29,256
|
|
27,368
|
|
|||
|
Less: valuation allowance
|
(15,881
|
)
|
(18,199
|
)
|
|||
|
Total deferred tax assets
|
13,375
|
|
9,169
|
|
|||
|
Deferred tax liabilities:
|
|
|
|
|
|||
|
Property, plant and equipment
|
—
|
|
(445
|
)
|
|||
|
Intangible assets
|
(23,157
|
)
|
(32,721
|
)
|
|||
|
Partnership investments
|
(100
|
)
|
(588
|
)
|
|||
|
Prepaid expenses
|
(1,995
|
)
|
(2,353
|
)
|
|||
|
Deferred financing fees
|
(316
|
)
|
(666
|
)
|
|||
|
Total deferred tax liabilities
|
(25,568
|
)
|
(36,773
|
)
|
|||
|
Net deferred tax liability
|
$
|
(12,193
|
)
|
$
|
(27,604
|
)
|
|
In assessing the realizability of deferred tax assets, management considers whether it is more-likely-than-not that some portion or all of the deferred tax assets will be realized. The ultimate realization of deferred tax assets is dependent upon the generation of future taxable income in those periods in which temporary differences become deductible and/or net operating loss carryforwards can be utilized. We consider the level of historical taxable income, scheduled reversal of temporary differences, tax planning strategies and projected future taxable income in determining whether a valuation allowance is warranted.
During Fiscal 2018, the Company maintained a valuation allowance against its U.S. deferred tax assets and certain foreign jurisdictions. The Company's valuation allowance decreased by
$2,318
during the year ended
February 28, 2018
. Any further decline in the valuation allowance could have a favorable impact on our income tax provision and net income in the period in which such determination is made.
Pursuant to SAB 118, the Company is evaluating its assertion with respect to undistributed earnings of its foreign subsidiaries in light of the changes made by the TCJA. As of
February 28, 2018
, the Company has not provided for U.S. federal and foreign withholding taxes with respect to VOXX International (Germany) GmbH. The cumulative undistributed earnings have been subjected to U.S. taxation in connection with the one-time transition tax enacted with the TCJA. If these future earnings are repatriated to the United States, or if the Company determines that such earnings will be remitted in the foreseeable future, additional tax provisions may be required. Due to the complexities of the tax laws and the assumptions that would have to be made, it is not practicable to estimate the amounts of income tax provisions that may be required. The amount of unrecognized deferred tax liabilities for temporary differences related to investments in undistributed earnings is not practicable to determine at this time.
The Company has U.S. federal net operating losses of
$42,376
, of which
$17,703
expire in Fiscal 2035 through 2037 if not utilized, and
$24,673
have an indefinite carryforward period. The Company has foreign tax credits of
$3,231
which expire in tax year 2025 through 2028. The Company has research and development tax credits of
$1,795
, which expire in tax years 2034 through 2038. The Company has various foreign net operating loss carryforwards, state net operating loss carryforwards, and state tax credits that expire in various years and amounts through tax year 2038.
93
A reconciliation of the beginning and ending amount of unrecognized tax benefits, excluding interest and penalties, is as follows:
|
Balance at February 28, 2015
|
$
|
14,575
|
|
|
Additions based on tax positions taken in the current and prior years
|
1,366
|
|
|
|
Settlements
|
—
|
|
|
|
Decreases based on tax positions taken in the prior years
|
(915
|
)
|
|
|
Other
|
(554
|
)
|
|
|
Balance at February 29, 2016
|
$
|
14,472
|
|
|
Additions based on tax positions taken in the current and prior years
|
3,147
|
|
|
|
Settlements
|
—
|
|
|
|
Decreases based on tax positions taken in the prior years
|
(6,470
|
)
|
|
|
Other
|
(305
|
)
|
|
|
Balance at February 28, 2017
|
$
|
10,844
|
|
|
Additions based on tax positions taken in the current and prior years
|
630
|
|
|
|
Settlements
|
—
|
|
|
|
Decreases based on tax positions taken in prior years
|
(2,945
|
)
|
|
|
Other
|
578
|
|
|
|
Balance at February 28, 2018
|
$
|
9,107
|
|
Of the amounts reflected in the table above at
February 28, 2018
,
$9,107
, if recognized, would reduce our effective tax rate. If recognized,
$7,517
of the unrecognized tax benefits are likely to attract a full valuation allowance, thereby offsetting the favorable impact to the effective tax rate. Our unrecognized tax benefit non-current consolidated balance sheet liability, including interest and penalties, is
$2,191
. The Company records accrued interest and penalties related to income tax matters in the provision for income taxes in the accompanying Consolidated Statement of Operations and Comprehensive Income (Loss). For the years ended
February 28, 2018
,
February 28, 2017
and February 29, 2016, interest and penalties on unrecognized tax benefits were
$(145)
,
$98
and
$23
, respectively. The balance as of
February 28, 2018
and
February 28, 2017
was
$602
and
$746
, respectively. The Company does not expect a significant change to its unrecognized tax benefits within the next 12 months.
The Company, or one of its subsidiaries, files its tax returns in the U.S. and certain state and foreign income tax jurisdictions with varying statutes of limitations. The earliest years' tax returns filed by the Company that are still subject to examination by the tax authorities in the major jurisdictions are as follows:
|
Jurisdiction
|
|
Tax Year
|
|
|
|
|
|
U.S.
|
|
2014
|
|
Netherlands
|
2014
|
|
|
Germany
|
|
2014
|
|
9)
|
Capital Structure
|
The Company's capital structure is as follows:
94
|
|
|
Shares Authorized
|
Shares Outstanding
|
|
|||||||||||||||||
|
Security
|
Par
Value
|
February 28,
2018 |
February 28,
2017 |
February 28,
2018 |
February 28,
2017 |
Voting
Rights per
Share
|
Liquidation
Rights
|
||||||||||||||
|
Preferred Stock
|
$
|
50.00
|
|
50,000
|
|
50,000
|
|
—
|
|
—
|
|
—
|
|
$50 per share
|
|||||||
|
Series Preferred Stock
|
$
|
0.01
|
|
1,500,000
|
|
1,500,000
|
|
—
|
|
—
|
|
—
|
|
|
|||||||
|
Class A Common Stock
|
$
|
0.01
|
|
60,000,000
|
|
60,000,000
|
|
21,938,100
|
|
21,899,370
|
|
one
|
Ratably with Class B
|
||||||||
|
Class B Common Stock
|
$
|
0.01
|
|
10,000,000
|
|
10,000,000
|
|
2,260,954
|
|
2,260,954
|
|
ten
|
Ratably with Class A
|
||||||||
The holders of Class A and Class B common stock are entitled to receive cash or property dividends declared by the Board of Directors. The Board of Directors can declare cash dividends for Class A common stock in amounts equal to or greater than the cash dividends for Class B common stock. Dividends other than cash must be declared equally for both classes. Each share of Class B common stock may, at any time, be converted into one share of Class A common stock.
Stock held in treasury by the Company is accounted for using the cost method which treats stock held in treasury as a reduction to total stockholders' equity and amounted to
2,168,094
and
2,168,074
shares at
February 28, 2018
and
February 28, 2017
, respectively. The cost basis for subsequent sales of treasury shares is determined using an average cost method. During the year ended February 29, 2016, the Company repurchased
39,529
shares for an aggregate cost of
$227
. During the years ended
February 28, 2017
and
February 28, 2018
, the Company repurchased
no
shares. As of
February 28, 2018
,
1,383,271
shares of the Company's Class A common stock are authorized to be repurchased in the open market.
|
10)
|
Other Stock and Retirement Plans
|
a)
Supplemental Executive Retirement Plan
During Fiscal 2014, the Company established a Supplemental Executive Retirement Plan ("SERP") to provide additional retirement income to its Chairman and select executive officers. Subject to certain performance criteria, service requirements and age restrictions, employees who participate in the SERP will receive restricted stock awards. The restricted stock awards vest on the later of three years from the date of grant (or three years from the date of participation in the SERP with respect to shares granted in Fiscal 2014), or the grantee reaching the age of 65 years (refer to Note 1(u)).
As of
February 28, 2018
, approximately
1,301,000
shares of the Company's Class A common stock are reserved for issuance under the Company's Restricted and Stock Option Plans.
b)
Profit Sharing Plans
The Company has established two non-contributory employee profit sharing plans for the benefit of its eligible employees in the United States and Canada. The plans are administered by trustees appointed by the Company.
No
discretionary contributions were made during the years ended
February 28, 2018
,
February 28, 2017
and
February 29, 2016
. Contributions required by law to be made for eligible employees in Canada were not material for all periods presented.
c)
401(k) Plans
The VOXX International Corporation 401(k) plan is for all eligible domestic employees. The Company matches a portion of the participant's contributions after three months of service under a predetermined formula based on the participant's contribution level. Shares of the Company's Common Stock are not an investment option in the Savings Plan and the Company does not use such shares to match participants' contributions. During the
95
years ended
February 28, 2018
,
February 28, 2017
and
February 29, 2016
, the Company contributed, net of forfeitures,
$388
,
$408
and
$623
to the 401(k) Plan.
d)
Cash Bonus Profit Sharing Plan
During Fiscal 2009, the Board of Directors authorized a Cash Bonus Profit Sharing Plan that allows the Company to make profit sharing contributions for the benefit of eligible employees, for any fiscal year based on a pre-determined formula on the Company's pre-tax profits. The size of the contribution is dependent upon the performance of the Company. A participant’s share of the contribution is determined pursuant to the participant’s eligible wages for the fiscal year as a percentage of total eligible wages for all participants. There were
no
contributions made to the plan for the years ended
February 28, 2018
,
February 28, 2017
and
February 29, 2016
.
e)
Deferred Compensation Plan
Effective December 1, 1999, the Company adopted a Deferred Compensation Plan (the Plan) for Vice Presidents and above. The Plan is intended to provide certain executives with supplemental retirement benefits as well as to permit the deferral of more of their compensation than they are permitted to defer under the Profit Sharing and 401(k) Plans. The Plan provides for a matching contribution equal to
25%
of the employee deferrals up to
$20
. On February 1, 2008, the Company suspended all matching contributions to contain operating expenses. The matching contributions have remained suspended for the years ended
February 28, 2018
,
February 28, 2017
and
February 29, 2016
. The Plan is not intended to be a qualified plan under the provisions of the Internal Revenue Code. All compensation deferred under the Plan is held by the Company in an investment trust which is considered an asset of the Company. The Company has the option of amending or terminating the Plan at any time.
The investments, which amounted to
$3,620
and
$4,094
at
February 28, 2018
and
February 28, 2017
, respectively, have been classified as long-term marketable securities and are included in investment securities on the accompanying Consolidated Balance Sheets and a corresponding liability is recorded with
$250
recorded in Accrued expenses and the balance in deferred compensation which is classified as a long-term liability. Unrealized gains and losses on the marketable securities and corresponding deferred compensation liability net to zero in the accompanying Consolidated Statements of Operations and Comprehensive Income (Loss).
|
11)
|
Lease Obligations
|
At
February 28, 2018
, the Company was obligated under non-cancellable operating leases for equipment and warehouse facilities related to continuing operations for minimum annual rental payments for each of the succeeding fiscal years:
|
Operating
Leases
|
||||
|
2019
|
$
|
1,341
|
|
|
|
2020
|
609
|
|
||
|
2021
|
303
|
|
||
|
2022
|
257
|
|
||
|
2023
|
209
|
|
||
|
Thereafter
|
204
|
|
||
|
Total minimum lease payments
|
$
|
2,923
|
|
|
Rental expense for the above-mentioned operating lease agreements and other rental agreements on a month-to-month basis was
$1,163
,
$1,898
and
$2,087
for the years ended
February 28, 2018
,
February 28, 2017
and
February 29, 2016
, respectively.
The Company leased a facility from its principal shareholder and current chairman, which was accounted for as an operating lease, and had an expiration date of November 30, 2016. This facility was sold to an unrelated third party during the second quarter of Fiscal 2017. The Company has
no
related party leases as of
February 28, 2018
.
96
The Company has capital leases with a total lease liability of
$1,011
at
February 28, 2018
. These leases have maturities through Fiscal 2022.
|
12)
|
Financial Instruments
|
a)
Off-Balance Sheet Risk
Commercial letters of credit are issued by the Company during the ordinary course of business through major domestic banks as requested by certain suppliers. The Company also issues standby letters of credit principally to secure certain bank obligations and insurance policies. The Company had
no
open commercial letters of credit at
February 28, 2018
and
February 28, 2017
. Standby letters of credit amounted to
$1,161
and
$1,306
at
February 28, 2018
and
February 28, 2017
, respectively. The terms of these letters of credit are all less than one year. No material loss is anticipated due to nonperformance by the counter parties to these agreements. The fair value of the standby letters of credit is estimated to be the same as the contract values based on the short-term nature of the fee arrangements with the issuing banks.
At
February 28, 2018
, the Company had unconditional purchase obligations for inventory commitments of
$61,869
. These obligations are not recorded in the consolidated financial statements until commitments are fulfilled and such obligations are subject to change based on negotiations with manufacturers.
b)
Concentrations of Credit Risk
Financial instruments, which potentially subject the Company to concentrations of credit risk, consist principally of trade receivables. The Company's customers are located principally in the United States, Canada, Europe and Asia Pacific and consist of, among others, distributors, mass merchandisers, warehouse clubs, major automobile manufacturers, and independent retailers. The Company generally grants credit based upon analyses of customers' financial conditions and previously established buying and payment patterns. For certain customers, the Company establishes collateral rights in accounts receivable and inventory and obtains personal guarantees from certain customers based upon management's credit evaluation. Certain customers in Europe and Latin America have credit insurance equaling their credit limits.
At
February 28, 2018
and
February 28, 2017
, the Company's largest customer balance accounted for approximately
5.4%
and
4.8%
of accounts receivable, respectively.
No
customer accounted for more than
10%
of net sales from continuing operations during the years ended
February 28, 2018
,
February 28, 2017
or
February 29, 2016
. The Company's five largest customers represented
26%
,
28%
, and
29%
of net sales from continuing operations during the years ended
February 28, 2018
,
February 28, 2017
, and
February 29, 2016
, respectively.
A portion of the Company's customer base may be susceptible to downturns in the retail economy, particularly in the consumer electronics industry. Additionally, customers specializing in certain automotive sound, security and accessory products may be impacted by fluctuations in automotive sales.
|
13)
|
Financial and Product Information About Foreign and Domestic Operations
|
Segment
The Company operates in three distinct segments based upon our products and our internal organizational structure. The three operating segments, which are also the Company's reportable segments, are Automotive, Premium Audio and Consumer Accessories.
Our Automotive segment designs, manufactures, distributes
and markets rear-seat entertainment devices, satellite radio products, automotive security, remote start systems, mobile multimedia devices, aftermarket/OE-styled radios, car link-smartphone telematics application, collision avoidance systems and location-based services.
Our Premium Audio segment designs, manufactures, distributes
and markets home theater systems, high-end
97
loudspeakers, outdoor speakers, iPod/iPad and computer speakers, business music systems, cinema speakers, flat panel speakers, Bluetooth speakers, soundbars, headphones and DLNA (Digital Living Network Alliance) compatible devices.
Our Consumer Accessories segment designs, markets and distributes remote controls; wireless and Bluetooth speakers; karaoke products; action cameras; iris identification and biometric security related products; personal sound amplifiers; infant/nursery products; activity tracking bands; smart-home security and safety products; infant and nursery products; and A/V connectivity, portable/home charging, reception and digital consumer products.
Each operating segment is individually reviewed and evaluated by our Chief Operating Decision Maker (CODM), who allocates resources and assesses performance of each segment individually. The Company's Chief Executive Officer has been identified as the CODM. The CODM evaluates performance and allocates resources based upon a number of factors, the primary profit measure being income before income taxes
of each segment. Certain costs and royalty income are not allocated to the segments and are reported as Corporate/Eliminations. Costs not allocated to the segments include professional fees, public relations costs, acquisition costs and costs associated with executive and corporate management departments including salaries, benefits, depreciation, rent and insurance.
The segments share many common resources, infrastructures and assets in the normal course of business. Thus, the Company does not report assets or capital expenditures by segment to the CODM.
The accounting principles applied at the consolidated financial statement level are generally the same as those applied at the operating segment level and there are no material intersegment sales. The segments are allocated interest expense, based upon a pre-determined formula, which utilizes a percentage of each operating segment's intercompany balance, which is offset in corporate/eliminations.
Segment data from continuing operations for each of the Company's segments are presented below:
|
Automotive
|
Premium Audio
|
Consumer Accessories
|
Corporate/ Eliminations
|
Total
|
|||||||||||||||
|
Fiscal Year Ended February 28, 2018
|
|||||||||||||||||||
|
Net sales
|
$
|
155,480
|
|
$
|
172,406
|
|
$
|
178,756
|
|
$
|
450
|
|
$
|
507,092
|
|
||||
|
Equity in income of equity investees
|
7,178
|
|
—
|
|
—
|
|
—
|
|
7,178
|
|
|||||||||
|
Interest expense and bank charges
|
967
|
|
7,979
|
|
7,113
|
|
(10,050
|
)
|
6,009
|
|
|||||||||
|
Depreciation and amortization expense
|
1,027
|
|
3,492
|
|
4,663
|
|
2,992
|
|
12,174
|
|
|||||||||
|
Income (loss) before income taxes
|
13,922
|
|
1,137
|
|
(23,841
|
)
|
(15,322
|
)
|
(24,104
|
)
|
|||||||||
|
Fiscal Year Ended February 28, 2017
|
|||||||||||||||||||
|
Net sales
|
$
|
170,729
|
|
$
|
166,789
|
|
$
|
176,216
|
|
$
|
796
|
|
$
|
514,530
|
|
||||
|
Equity in income of equity investees
|
6,797
|
|
—
|
|
—
|
|
—
|
|
6,797
|
|
|||||||||
|
Interest expense and bank charges
|
3,109
|
|
5,295
|
|
4,716
|
|
(6,015
|
)
|
7,105
|
|
|||||||||
|
Depreciation and amortization expense
|
1,322
|
|
3,688
|
|
4,702
|
|
2,674
|
|
12,386
|
|
|||||||||
|
Income (loss) before income taxes
|
13,871
|
|
8,316
|
|
(20,300
|
)
|
(10,817
|
)
|
(8,930
|
)
|
|||||||||
|
Fiscal Year Ended February 29, 2016
|
|||||||||||||||||||
|
Net sales
|
$
|
201,125
|
|
$
|
140,508
|
|
$
|
187,272
|
|
$
|
1,301
|
|
$
|
530,206
|
|
||||
|
Equity in income of equity investees
|
6,538
|
|
—
|
|
—
|
|
—
|
|
6,538
|
|
|||||||||
|
Interest expense and bank charges
|
5,634
|
|
8,979
|
|
5,766
|
|
(12,481
|
)
|
7,898
|
|
|||||||||
|
Depreciation and amortization expense
|
1,144
|
|
3,477
|
|
2,904
|
|
2,130
|
|
9,655
|
|
|||||||||
|
Income (loss) before income taxes (a)
|
12,483
|
|
(8,945
|
)
|
(17,044
|
)
|
334
|
|
(13,172
|
)
|
|||||||||
|
(a)
|
Included in the loss before taxes for the year ended February 29, 2016 within the Consumer Accessories segment is the
$4,679
gain on bargain purchase recognized in conjunction with the EyeLock transaction, as well as an impairment loss
|
98
on intangible assets totaling
$2,860
. Included in the loss before taxes for the year ended February 29, 2016 within the Premium Audio segment is an impairment loss on intangible assets totaling
$6,210
.
No
customer accounted for more than
10%
of consolidated net sales from continuing operations during the years ended
February 28, 2018
,
February 28, 2017
or
February 29, 2016
.
Geographic net sales information from continuing operations in the table below is based on the location of the selling entity. Long-lived assets, primarily fixed assets, are reported below based on the location of the asset.
|
United States
|
Germany
|
Other
|
Total
|
||||||||||||
|
Fiscal Year Ended February 28, 2018
|
|||||||||||||||
|
Net sales
|
$
|
446,262
|
|
$
|
57,447
|
|
$
|
3,383
|
|
$
|
507,092
|
|
|||
|
Long-lived assets
|
48,571
|
|
12,979
|
|
3,709
|
|
65,259
|
|
|||||||
|
Fiscal Year Ended February 28, 2017
|
|||||||||||||||
|
Net sales
|
$
|
449,865
|
|
$
|
59,856
|
|
$
|
4,809
|
|
$
|
514,530
|
|
|||
|
Long-lived assets
|
49,937
|
|
11,688
|
|
3,964
|
|
65,589
|
|
|||||||
|
Fiscal Year Ended February 29, 2016
|
|||||||||||||||
|
Net sales
|
$
|
461,606
|
|
$
|
61,161
|
|
$
|
7,439
|
|
$
|
530,206
|
|
|||
|
Long-lived assets
|
47,092
|
|
12,450
|
|
3,989
|
|
63,531
|
|
|||||||
|
14)
|
Contingencies
|
The Company is currently, and has in the past, been a party to various routine legal proceedings incident to the ordinary course of business. If management determines, based on the underlying facts and circumstances, that it is probable a loss will result from a litigation contingency and the amount of the loss can be reasonably estimated, the estimated loss is accrued for. The Company does not believe that any of its current outstanding litigation matters will have a material adverse effect on the Company's financial statements, individually or in the aggregate.
The products the Company sells are continually changing as a result of improved technology. As a result, although the Company and its suppliers attempt to avoid infringing known proprietary rights, the Company may be subject to legal proceedings and claims for alleged infringement by patent, trademark or other intellectual property owners. Any claims relating to the infringement of third-party proprietary rights, even if not meritorious, could result in costly litigation, divert management’s attention and resources, or require the Company to either enter into royalty or license agreements which are not advantageous to the Company, or pay material amounts of damages.
|
15)
|
Unaudited Quarterly Financial Data
|
Selected unaudited, quarterly financial data of the Company for the years ended
February 28, 2018
and
February 28, 2017
appear below:
99
|
|
Quarters Ended
|
|||||||||||||||
|
|
Feb 28, 2018
|
Nov 30, 2017
|
Aug 31, 2017
|
May 31, 2017
|
||||||||||||
|
2018
|
|
|
|
|
||||||||||||
|
Net sales from continuing operations
|
$
|
122,236
|
|
$
|
156,563
|
|
$
|
113,470
|
|
$
|
114,823
|
|
||||
|
Gross profit from continuing operations
|
32,213
|
|
41,519
|
|
28,421
|
|
30,144
|
|
||||||||
|
Net income (loss) from continuing operations
|
$
|
8,396
|
|
$
|
7,477
|
|
$
|
(19,848
|
)
|
$
|
(2,684
|
)
|
||||
|
Net income (loss) from discontinued operations
|
2,276
|
|
(368
|
)
|
34,931
|
|
(2,221
|
)
|
||||||||
|
Net income (loss) attributable to Voxx International Corporation
|
12,585
|
|
8,644
|
|
17,106
|
|
(3,031
|
)
|
||||||||
|
Earnings (loss) per share - basic:
|
|
|
|
|
|
|
|
|
||||||||
|
Continuing operations
|
$
|
0.42
|
|
$
|
0.37
|
|
$
|
(0.74
|
)
|
$
|
(0.03
|
)
|
||||
|
Discontinued operations
|
0.09
|
|
(0.02
|
)
|
1.45
|
|
(0.09
|
)
|
||||||||
|
Attributable to VOXX International Corporation
|
0.52
|
|
0.36
|
|
0.71
|
|
(0.13
|
)
|
||||||||
|
Earnings (loss) per share - diluted:
|
|
|
|
|
|
|
|
|
||||||||
|
Continuing operations
|
$
|
0.42
|
|
$
|
0.37
|
|
$
|
(0.74
|
)
|
$
|
(0.03
|
)
|
||||
|
Discontinued operations
|
0.09
|
|
(0.02
|
)
|
1.45
|
|
(0.09
|
)
|
||||||||
|
Attributable to VOXX International Corporation
|
0.51
|
|
0.35
|
|
0.71
|
|
(0.13
|
)
|
||||||||
|
|
Quarters Ended
|
|||||||||||||||
|
|
Feb 28, 2017
|
Nov 30, 2016
|
Aug 31, 2016
|
May 31, 2016
|
||||||||||||
|
2017
|
|
|
|
|
|
|
|
|
||||||||
|
Net sales from continuing operations
|
$
|
124,894
|
|
$
|
157,411
|
|
$
|
118,325
|
|
$
|
113,900
|
|
||||
|
Gross profit from continuing operations
|
35,966
|
|
43,648
|
|
32,443
|
|
31,973
|
|
||||||||
|
Net (loss) income from continuing operations
|
$
|
(7,945
|
)
|
$
|
1,627
|
|
$
|
3,471
|
|
$
|
(6,421
|
)
|
||||
|
Net income (loss) from discontinued operations
|
5,649
|
|
2,283
|
|
(2,167
|
)
|
301
|
|
||||||||
|
Net (loss) income attributable to Voxx International Corporation
|
(90
|
)
|
5,800
|
|
3,020
|
|
(4,308
|
)
|
||||||||
|
|
|
|
|
|
|
|
|
|||||||||
|
Earnings (loss) per share - basic:
|
||||||||||||||||
|
Continuing operations
|
$
|
(0.24
|
)
|
$
|
0.15
|
|
$
|
0.21
|
|
$
|
(0.19
|
)
|
||||
|
Discontinued operations
|
0.23
|
|
0.09
|
|
(0.09
|
)
|
0.01
|
|
||||||||
|
Attributable to VOXX International Corporation
|
0.00
|
|
0.24
|
|
0.12
|
|
(0.18
|
)
|
||||||||
|
Earnings (loss) per share - diluted:
|
||||||||||||||||
|
Continuing operations
|
$
|
(0.24
|
)
|
$
|
0.14
|
|
$
|
0.21
|
|
$
|
(0.19
|
)
|
||||
|
Discontinued operations
|
0.23
|
|
0.09
|
|
(0.09
|
)
|
0.01
|
|
||||||||
|
Attributable to VOXX International Corporation
|
0.00
|
|
0.24
|
|
0.12
|
|
(0.18
|
)
|
||||||||
Net income per common share is computed separately for each quarter. Therefore, the sum of such quarterly per share amounts may differ from the total for the years.
100
SCHEDULE II
VOXX INTERNATIONAL CORPORATION AND SUBSIDIARIES
Valuation and Qualifying Accounts
Years ended
February 28, 2018
,
February 28, 2017
and
February 29, 2016
(In thousands)
|
Column A
|
Column B
|
Column C
|
Column D (b)
|
Column E
|
||||||||||||||||
|
Description
|
Balance at
Beginning
of Year
|
Gross
Amount
Charged to
Costs and
Expenses
|
Reversals of
Previously
Established Accruals
|
Deductions (a)
|
Balance
at End
of Year
|
|||||||||||||||
|
Year ended February 28, 2018
|
|
|
|
|
|
|||||||||||||||
|
Allowance for doubtful accounts
|
$
|
4,495
|
|
$
|
667
|
|
$
|
—
|
|
$
|
2,966
|
|
$
|
2,196
|
|
|||||
|
Cash discount allowances
|
1,233
|
|
31,160
|
|
—
|
|
31,188
|
|
1,205
|
|
||||||||||
|
Accrued sales incentives
|
13,154
|
|
42,722
|
|
(45
|
)
|
41,811
|
|
14,020
|
|
||||||||||
|
Reserve for warranties and product repair costs
|
5,608
|
|
7,428
|
|
—
|
|
6,803
|
|
6,233
|
|
||||||||||
|
|
$
|
24,490
|
|
$
|
81,977
|
|
$
|
(45
|
)
|
$
|
82,768
|
|
$
|
23,654
|
|
|||||
|
Year ended February 28, 2017
|
||||||||||||||||||||
|
Allowance for doubtful accounts
|
$
|
3,917
|
|
$
|
1,299
|
|
$
|
—
|
|
$
|
721
|
|
$
|
4,495
|
|
|||||
|
Cash discount allowances
|
1,077
|
|
32,589
|
|
—
|
|
32,433
|
|
1,233
|
|
||||||||||
|
Accrued sales incentives
|
12,439
|
|
36,413
|
|
(108
|
)
|
35,590
|
|
13,154
|
|
||||||||||
|
Reserve for warranties and product repair costs
|
7,608
|
|
5,843
|
|
—
|
|
7,843
|
|
5,608
|
|
||||||||||
|
|
$
|
25,041
|
|
$
|
76,144
|
|
$
|
(108
|
)
|
$
|
76,587
|
|
$
|
24,490
|
|
|||||
|
Year ended February 29, 2016
|
||||||||||||||||||||
|
Allowance for doubtful accounts
|
$
|
3,852
|
|
$
|
810
|
|
$
|
—
|
|
$
|
745
|
|
$
|
3,917
|
|
|||||
|
Cash discount allowances
|
1,190
|
|
24,630
|
|
—
|
|
24,743
|
|
1,077
|
|
||||||||||
|
Accrued sales incentives
|
14,097
|
|
28,428
|
|
(77
|
)
|
30,009
|
|
12,439
|
|
||||||||||
|
Reserve for warranties and product repair costs
|
8,233
|
|
8,028
|
|
—
|
|
8,653
|
|
7,608
|
|
||||||||||
|
|
$
|
27,372
|
|
$
|
61,896
|
|
$
|
(77
|
)
|
$
|
64,150
|
|
$
|
25,041
|
|
|||||
|
(a)
|
For the allowance for doubtful accounts, cash discount allowances, and accrued sales incentives, deductions represent currency effects, chargebacks and payments made or credits issued to customers. For the reserve for warranties and product repair costs, deductions represent currency effects and payments for labor and parts made to service centers and vendors for the repair of units returned under warranty.
|
|
(b)
|
Column D includes
$500
of liabilities acquired during our Rosen acquisition in Fiscal 2018 and
$100
of liabilities acquired during our EyeLock acquisition in Fiscal 2016.
|
101
|
Exhibit
Number
|
|
Description
|
|
|
|
|
|
3.1
|
|
|
|
3.2
|
|
|
|
3.3
|
|
|
|
10.1
|
||
|
21
|
|
|
|
23
|
||
|
|
|
|
|
31.1
|
|
|
|
|
|
|
|
31.2
|
|
|
|
|
|
|
|
32.1
|
|
|
|
|
|
|
|
32.2
|
|
|
|
|
|
|
|
99.1
|
|
|
|
|
|
|
|
99.2
|
||
|
101
|
The following materials from VOXX International Corporation's Annual Report on Form 10-K for the period ended February 28, 2018, formatted in eXtensible Business Reporting Language (XBRL): (i) the Consolidated Balance Sheets, (ii), the Consolidated Statements of Operations and Comprehensive Income (Loss), (iii) the Consolidated Statements of Stockholders' Equity, (iv) the Consolidated Statements of Cash Flows, and (v) Notes to Consolidated Financial Statements.
|
|
All other schedules are omitted because the required information is shown in the financial statements or notes thereto or because they are not applicable.
102
SIGNATURES
Pursuant to the requirements of Section 13 or 15(d) of the Securities Exchange Act of 1934, the registrant has duly caused this report to be signed on its behalf by the undersigned, thereunto duly authorized.
|
VOXX INTERNATIONAL CORPORATION
|
|
|
May 14, 2018
|
By:
/s/ Patrick M. Lavelle
|
|
Patrick M. Lavelle,
|
|
|
President and Chief Executive Officer
|
|
103
Pursuant to the requirements of the Securities Exchange Act of 1934, this report has been signed below by the following persons on behalf of the registrant and in the capacities and on the dates indicated.
|
Signature
|
Title
|
Date
|
|
/s/ Patrick M. Lavelle
Patrick M. Lavelle
|
President; Chief Executive Officer
(Principal Executive Officer) and Director
|
May 14, 2018
|
|
/s/ Charles M. Stoehr
Charles M. Stoehr
|
Senior Vice President,
Chief Financial Officer (Principal
Financial and Accounting Officer) and Director
|
May 14, 2018
|
|
/s/ John J. Shalam
John J. Shalam
|
Chairman of the Board of Directors
|
May 14, 2018
|
|
/s/ John Adamovich, Jr.
John Adamovich, Jr.
|
Director
|
May 14, 2018
|
|
/s/ Denise Gibson
Denise Gibson
|
Director
|
May 14, 2018
|
|
/s/ Peter A. Lesser
Peter A. Lesser
|
Director
|
May 14, 2018
|
|
/s/ Ari Shalam
Ari Shalam
|
Director
|
May 14, 2018
|
104
TABLE OF CONTENTS
Part IItem 1-businessItem 1a-risk FactorsItem 1b-unresolved Staff CommentsItem 2-propertiesItem 3-legal ProceedingsItem 4-removed and ReservedPart IIItem 5-market For The Registrant's Common Equity, Related Stockholder Matters and Issuer Purchases Of Equity SecuritiesItem 6-selected Consolidated Financial DataItem 7-management's Discussion and Analysis Of Financial Condition and Results Of Operations ("md&a")Item 7a-quantitative and Qualitative Disclosures About Market RiskItem 8-consolidated Financial Statements and Supplementary DataItem 9-changes in and Disagreements with Accountants on Accounting and Financial DisclosureItem 9a-controls and ProceduresItem 9B - Other InformationPart IIIPart IVItem 15-exhibits, Financial Statement Schedules