VAREX IMAGING CORP
UNITED STATES
SECURITIES AND EXCHANGE COMMISSION
Washington, D.C. 20549
____________________________________________________________
FORM 10-K
____________________________________________________________
|
ý
|
ANNUAL REPORT PURSUANT TO SECTION 13 or 15(d) OF THE SECURITIES EXCHANGE ACT OF 1934
|
For the year ended September 29, 2017
or
|
¨
|
TRANSITION REPORT PURSUANT TO SECTION 13 or 15(d) OF THE SECURITIES EXCHANGE ACT OF 1934
|
For the transition period from to
Commission File Number 001-37860
____________________________________________________________
VAREX IMAGING CORPORATION
(Exact name of registrant as specified in its charter)
|
Delaware
|
81-3434516
|
|
|
(State or other jurisdiction of
incorporation or organization)
|
(I.R.S. Employer
Identification Number)
|
|
|
1678 S. Pioneer Road,
Salt Lake City, Utah
|
84104
|
|
|
(Address of principal executive offices)
|
(Zip Code)
|
|
(Registrant’s telephone number, including area code)
____________________________________________________________
Securities registered pursuant to Section 12(b) of the Act:
|
Title of each class
|
—
|
Name of each exchange on which registered
|
|
Common stock, par value $0.01 per share
|
—
|
NASDAQ Global Select Market
|
Securities registered pursuant to Section 12(g) of the Act: None
Indicate by check mark if the registrant is a well-known seasoned issuer, as defined in Rule 405 of the Securities Act. Yes
¨
No
ý
Indicate by check mark if the registrant is not required to file reports pursuant to Section 13 or Section 15(d) of the Exchange Act. Yes
¨
No
ý
Indicate by check mark whether the registrant: (1) has filed all reports required to be filed by Section 13 or 15(d) of the Securities Exchange Act of 1934 during the preceding 12 months (or for such shorter period that the registrant was required to file such reports), and (2) has been subject to such filing requirements for the past 90 days. Yes
ý
No
¨
Indicate by check mark whether the registrant has submitted electronically and posted on its corporate Web site, if any, every Interactive Data File required to be submitted and posted pursuant to Rule 405 of Regulation S-T (§232.405 of this chapter) during the preceding 12 months (or for such shorter period that the registrant was required to submit and post such files). Yes
ý
No
¨
Indicate by check mark if disclosure of delinquent filers pursuant to Item 405 of Regulation S-K is not contained herein, and will not be contained, to the best of registrant’s knowledge, in definitive proxy or information statements incorporated by reference in Part III of this Form 10-K or any amendment to this Form 10-K.
ý
Indicate by check mark whether the registrant is a large accelerated filer, an accelerated filer, a non-accelerated filer, a smaller reporting company, or an emerging growth company. See the definitions of “large accelerated filer,” “accelerated filer,” “smaller reporting company,” and "emerging growth company" in Rule 12b-2 of the Exchange Act.
|
Large Accelerated filer
|
o
|
Accelerated filer
|
o
|
|||
|
Non-Accelerated filer
|
x
|
Smaller reporting company
|
o
|
|||
|
Emerging growth company
|
x
|
|||||
|
If an emerging growth company, indicate by check mark if the registrant has elected not to use the extended transition period for complying with any new or revised financial accounting standards provided pursuant to Section 13(a) of the Exchange Act.
|
o
|
|||||
Indicate by check mark whether the registrant is a shell company (as defined in Rule 12b-2 of the Exchange Act). Yes
¨
No
ý
As of March 31, 2017, the last business day of the registrant’s most recently completed second fiscal quarter, the aggregate market value of shares of the registrant’s common stock held by non-affiliates of the registrant (based upon the closing sale price of such shares on the NASDAQ Global Select Market on March 31, 2017) was $1,122,413,712. Shares of the registrant’s common stock held by the registrant’s executive officers and directors and by each entity that owned 10% or more of the registrant’s outstanding common stock have been excluded in that such persons may be deemed to be affiliates. This determination of affiliate status is not necessarily a conclusive determination for other purposes.
As of November 30, 2017, there were 37,739,440 shares of the registrant’s common stock outstanding.
Documents Incorporated by Reference
Portions of registrant’s proxy statement relating to registrant’s 2018 annual meeting of stockholders have been incorporated by reference in Part III of this annual report on Form 10-K.
VAREX IMAGING CORPORATION
INDEX
|
|
|||
|
|
|||
|
|
|||
1
Forward-Looking Statements
This Annual Report on Form 10-K (this “Annual Report”), including the section entitled “Management’s Discussion and Analysis of Financial Condition and Results of Operations” (“MD&A”) contains “forward-looking” statements within the meaning of the Private Securities Litigation Reform Act of 1995, which provides a “safe harbor” for statements about future events, products and future financial performance that are based on the beliefs of, estimates made by, and information currently available to the management of Varex Imaging Corporation (“we,” “our,” “us,” the “Company,” “Varex,” or “Varex Imaging”). The outcome of the events described in these forward-looking statements is subject to risks and uncertainties. Actual results and the outcome or timing of certain events may differ significantly from those projected in these forward-looking statements or management’s current expectations due to the factors cited in the Risk Factors listed under Part I, Item 1A of this Annual Report, MD&A and other factors described from time to time in our other filings with the U.S. Securities and Exchange Commission (the “SEC”), or other reasons. For this purpose, statements concerning: industry or market segment outlook; market acceptance of or transition to new products or technology such as advanced X-ray tube and digital flat panel detector products; growth drivers; future orders, revenues, backlog, earnings or other financial results; and any statements using the terms “believe,” “expect,” “anticipate,” “can,” “should,” “would,” “could,” “estimate,” “may,” “intended,” “potential,” and “possible” or similar statements are forward-looking statements that involve risks and uncertainties that could cause our actual results and the outcome and timing of certain events to differ materially from those projected or management’s current expectations. By making forward-looking statements, we have not assumed any obligation to, and you should not expect us to, update or revise those statements because of new information, future events or otherwise.
Overview
Varex Imaging Corporation, a Delaware corporation formed in 2016, is a leading innovator, designer and manufacturer of X-ray imaging components, which include X-ray tubes, digital flat panel detectors and linear accelerators, which are key components of X-ray imaging systems. On January 28, 2017, Varian Medical Systems, Inc. ("Varian") completed its separation and distribution of Varex. In connection with the distribution, Varex became an independent publicly-traded company and is listed on The NASDAQ Global Select Market under the ticker “VREX” with 37.4 million shares of common stock distributed to Varian shareholders. With a 65+ year history of successful innovation, Varex’s components are used in medical imaging as well as in industrial and security imaging applications. Global OEM manufacturers of X-ray imaging systems use the company’s X-ray sources, digital detectors, connecting devices and imaging software as components in their systems to detect, diagnose and protect.
On May 1, 2017, we acquired the Medical Imaging business of PerkinElmer, Inc. ("Acquired Detector Business") for $273.3 million. The acquisition consisted of PerkinElmer Medical Holdings, Inc. and Dexela Limited, together with certain assets of PKI and its direct and indirect subsidiaries relating to digital flat panel detectors that serve as components for industrial, medical, dental and veterinary X-ray imaging systems. The acquired business included approximately 280 employees with operations in Santa Clara, California as well as operations in Germany, the Netherlands and the United Kingdom.
Our products are sold in three geographic regions: the Americas, EMEA, and APAC. The Americas includes North America (primarily the United States) and Latin America. EMEA includes Europe, Russia, the Middle East, India and Africa. APAC includes Asia and Australia. Revenues by region are based on the known final destination of products sold.
Our success depends upon our ability to anticipate changes in our markets, the direction of technological innovation and the demands of our customers. We continue to invest in research and development and have over 500 engineers (including 55 with a doctorate degree) in the company. Combining this focus on innovation and product performance with strong long-term customer relationships allows us to partner with our customers to bring industry-leading products to the x-ray imaging market. In addition, total product lifecycle cost is important. We continue to improve the life and quality of our imaging components and leverage our scale as the largest x-ray imaging component supplier to provide cost effective solutions.
Our Chief Executive Officer, who is our Chief Operating Decision Maker (“CODM”), evaluates the product groupings and measures the business performance in two reportable operating segments: Medical and Industrial. The segments align our products and service offerings with customer use in medical and industrial markets and are consistent with how the CODM evaluates the business for the allocation of resources. The CODM allocates resources to and evaluates the financial performance of each operating segment primarily based on revenues and gross margin.
Medical
2
In our Medical business segment, we design, manufacture, sell and service X-ray imaging components for use in a range of applications, including radiographic and fluoroscopic imaging, mammography, computed tomography (“CT”), radiation therapy and computer-aided detection. We provide a broad range of X-ray imaging components for medical customers, including X-ray tubes, digital flat panel image detectors, high voltage connectors, image-processing software and workstations, computer-aided diagnostic software, collimators, automatic exposure control devices, generators, ionization chambers and buckys.
A significant portion of our revenues come from the sales of high-end X-ray tubes used in CT imaging and high-end dynamic digital detectors used in fluoroscopic and dental applications. These upper-tier imaging components are characterized by increased levels of technological complexity, engineering and intellectual property that typically allow these products to have a higher sales price and gross margin.
The digital flat panel detector market continues to mature from initial product introductions more than 10 years ago. For the past few years, we have experienced price erosion for these products, predominantly in the highly-competitive market for radiographic detectors. We anticipate this trend will continue in the foreseeable future.
Our X-ray imaging components are primarily sold to imaging system original equipment manufacturer (“OEM”) customers that incorporate them into their medical diagnostic, radiation therapy, dental and veterinary imaging systems. To a much lesser extent, we also sell our X-ray imaging components to independent service companies, distributors and directly to end-users for replacement purposes.
Industrial
In our Industrial business segment, we design, manufacture, sell and service products for use in security and industrial inspection applications, such as airport security screening at ports and borders and nondestructive examination in a variety of applications. The products include Linatron X-ray accelerators, X-ray tubes, digital flat panel detectors, high voltage connectors and image-processing software that we generally sell to OEM customers that incorporate these products into their inspection systems.
The security market primarily consists of airport security (carry-on baggage, checked baggage and palletized cargo) and cargo screening at ports and borders. The end customers for border protection systems are typically government agencies, many of which are in oil-based economies and war zones. In 2015, we saw a significant decline in demand for border protection systems due to the volatility of oil prices with moderate increases in demand in the following years.
The non-destructive testing market utilizes x-ray imaging to scan items for inspection of manufacturing defects and product integrity in a wide range of industries including the aerospace, automotive, food packaging, metal castings and 3D printing industries. We provide x-ray sources, digital flat panel detectors, high voltage connectors and image processing software to OEM customers, system integrators and manufacturers. In addition, new applications for x-ray sources are being developed, such as sterilization of food and its packaging.
Customers
Varex’s customers are primarily large OEMs. Its top five customers, measured by revenue, are Toshiba Medical Systems, Hologic, Inc., Hitachi Ltd., General Electric Company and Varian, which collectively accounted for approximately
34%
of Varex’s revenues in fiscal year 2017. Varex’s largest customer, Toshiba Medical Systems, accounted for approximately
19%
,
23%
and
26%
of its total revenues in fiscal 2017, 2016 and 2015 respectively. The loss of one or more of Varex’s top customers would have a material and adverse effect on Varex’s business. For more information, see “Risk Factors—Varex sells its products to a limited number of OEM customers, many of which are also its competitors, and a reduction in or loss of business of one or more of these customers may materially reduce its sales.”
Competition
The imaging components market is highly competitive. Our OEM customers may choose to develop and manufacture the components in-house or they may choose to out-source to a supplier such as Varex or other providers of imaging components. Our success depends upon our ability to anticipate changes in our markets, the direction of technological innovation and the demands of our customers. To remain competitive, we must continue to invest in research and development focused on innovation, product performance and improving the quality and cost of our imaging components. Significant capital investment is required for imaging
3
component manufacturers and Varex leverages its high volume to reduce its per-unit costs by spreading the fixed costs over more units.
Medical
Varex often competes with the in-house X-ray tube manufacturing operations of major diagnostic imaging systems companies, which are the primary OEM customers for Varex’s Medical products. In order to effectively compete with these in-house
alternatives, Varex must have a competitive advantage in one or more significant areas, such as superior technology and performance,
better product quality or lower product cost. Consequently, Varex sells a significant volume of its X-ray tubes to OEM customers that have in-house X-ray tube production capability. In addition, Varex competes with some OEM customers, such as Toshiba Medical Systems Corporation and Dunlee, a division of Philips Healthcare, who sell X-ray tubes to other manufacturers, and other non-OEMs, such as Industria Applicazioni Elettroniche S.p.A, as well as emerging X-ray tube manufacturers in China. High capital costs and mastery of complex manufacturing processes that drive production yield and product life are significant characteristics of the X-ray tubes business.
The market for digital flat panel detectors is also very competitive. Varex sells its digital flat panel detectors to a number of OEM customers that incorporate Varex’s flat panel detectors into their medical diagnostic, radiation therapy, dental, veterinary and industrial imaging systems. Varex’s amorphous silicon based flat panel detector technology and complementary metal-oxide-semiconductor ("CMOS") technology competes with other detector technologies, such as amorphous selenium, charge-coupled devices and variations of amorphous silicon scintillators. Varex believes that its products provide a competitive advantage due to product quality and performance and lower overall product lifecycle costs. In the digital flat panel detector market, Varex primarily competes against Trixell S.A.S., Canon, Inc., Vieworks Co., Ltd., and Hamamatsu Corporation, as well as emerging low-cost manufacturers from China such as iRay Technology (Shanghai) Limited, and Jiangsu CareRay Medical Systems Co., Ltd.
Industrial
In the Industrial segment, Varex competes with other OEM suppliers, such as General Electric, Toshiba Medical Systems Corporation, Nuctech Company Limited (“Nuctech”) and Comet AG. While there are other manufacturers of low-energy X-ray tubes and digital flat panel detectors for specialized and niche industrial applications, Varex’s products are designed for a broad range of applications in inspection, analysis, and testing. In the high-energy market, Varex competes against technologies from Nuctech, Siemens AG, and Foton Ltd., whose X-ray sources are used in applications that include cargo and container scanning, border security, aerospace applications, castings and pressure vessel inspections.
Customer Services and Support
Varex generally warrants its products for 12 to 24 months. In certain cases, the warranty also may be specified by usage metrics such as number of scans. It provides technical advice and consultation to major OEM customers from its US offices in Utah, Nevada, South Carolina, New York and Illinois; and internationally in the Philippines, China, Netherlands, Germany, France, Switzerland, the United Kingdom, Italy and Japan. Varex’s applications specialists and engineers make recommendations to meet the customer’s technical requirements within the customer’s budgetary constraints. Varex often develops specifications for a unique product that will be designed and manufactured to meet a specific customer’s requirements.
Manufacturing and Supplies
Varex manufactures its products in Salt Lake City, Utah; Santa Clara, California; Las Vegas, Nevada; Liverpool, New York; Downers Grove, Illinois; Dinxperlo and Heerlen, the Netherlands; Walluf and Bremen, Germany; and Calamba City, Philippines. These facilities employ state-of-the-art manufacturing techniques and several have been honored by the press, governments and trade organizations for their commitment to quality improvement. These manufacturing facilities are certified by International Standards Organization (“ISO”) under ISO 9001 (for industrial products) or ISO 13485 (for medical devices). In addition, Varex has service centers in North Charleston, South Carolina; Willich, Germany; and Wuxi, China. The combined medical and industrial manufacturing infrastructure enables Varex to leverage production scale to achieve productivity and low cost advantage as well as research and development synergies.
Manufacturing processes at Varex’s various facilities include machining, fabrication, subassembly, system assembly and final testing. Varex has invested in various automated and semi-automated equipment for the fabrication and machining of the parts and assemblies that it incorporates into its products. Varex may, from time to time, invest further in such equipment. Varex’s quality
4
assurance program includes various quality control measures from inspection of raw materials, purchased parts and assemblies through in-line inspection. In some cases, Varex may outsource the manufacturing of sub-assemblies while still performing system design, final assembly and testing in-house. In such cases, Varex believes outsourcing enables it to reduce or maintain fixed costs and capital expenditures, while also providing it with the flexibility to increase production capacity. Varex purchases material and components from various suppliers that are either standard products or customized to its specifications. Some of the components included in Varex’s products may be sourced from a limited group of suppliers or from a single source supplier, such as the wave guides for linear accelerators; transistor arrays and cesium iodide coatings for flat panel detectors and specialized integrated circuits, X-ray tube targets, housings, bearings and various other components. Varex requires certain raw materials, such as copper, lead, tungsten, rhenium, molybdenum zirconium, and various high grades of steel alloy for X-ray tubes and industrial products. Worldwide demand, availability and pricing of these raw materials have been volatile, and Varex expects that availability and pricing will continue to fluctuate in the future.
Research and Development
Developing products, systems and services based on advanced technology is essential to Varex’s ability to compete effectively in the marketplace. It maintains a research and development and engineering staff responsible for product design and engineering.
Research and development is primarily conducted at Varex’s Salt Lake City, Utah; San Jose and Santa Clara, California; Las Vegas, Nevada; Liverpool, New York; Lincolnshire and Downers Grove, Illinois facilities domestically and at its Netherlands, United Kingdom and Germany facilities internationally, and is primarily focused on developing and improving imaging component technology. Current X-ray source development areas include smaller footprint linear accelerators, improvements to tube life and tube stability, reductions of tube noise and tube designs that will enable OEMs to continue to reduce dose delivered, and improve image resolution, cost effectively. Research in digital flat panel imaging technology is aimed at developing new panel technologies with better dose utilization, improved image quality, lower product costs and new image processing tools for advanced applications.
Industrial products share some of the same base technology competencies and platforms as medical products and Varex’s medical and industrial development teams are therefore co-located in Salt Lake City, San Jose, Santa Clara, Dinxperlo, and in Walluf. One of Varex’s competitive advantages is that some of the foundational technologies and software components developed for medical applications may also be applicable in industrial components, and vice versa. In addition to these product development synergies, Varex is also able to realize sourcing, production, service center, and logistics synergies across the different markets.
Product and Other Liabilities
Varex’s business exposes it to potential product liability claims that are inherent in the manufacture, sale, installation, servicing and support of X-ray imaging devices, related software and other devices that contain hazardous material and/or deliver radiation. Because its products are involved in the intentional delivery of radiation to the human body and other situations where people may come in contact with radiation (for example, when Varex’s Industrial products are being used to scan cargo) as well as the detection, planning and treatment of medical problems, the possibility for significant injury and/or death exists. Varex may face substantial liability to patients, its customers and others for damages resulting from the faulty, or allegedly faulty, design, manufacture, installation, servicing, support, testing or interoperability of Varex’s and its customers’ products, or their misuse or failure. Varex may also be subject to claims for property damages or economic loss related to or resulting from any errors or defects in its products, or the installation, servicing and support of its products. Any accident or mistreatment could subject Varex to legal costs, litigation, adverse publicity and damage to Varex’s reputation, whether or not its products or services were a factor. In addition, if a product Varex designs or manufactures were defective (whether due to design, labeling or manufacturing defects, improper use of the product or other reasons), or found to be so by a competent regulatory authority, Varex may be required to correct or recall the product and notify other regulatory authorities. Varex maintains limited product liability, professional liability and omissions liability insurance coverage.
Government Regulation
U.S. Regulations
Laws governing marketing a medical device
. In the United States, as a manufacturer and seller of medical devices and devices emitting radiation or utilizing radioactive by-product material, Varex and some of its suppliers and distributors are subject to extensive regulation by federal governmental authorities, such as the U.S. Food and Drug Administration (the "FDA"), Nuclear Regulatory Commission (“NRC”), and state and local regulatory agencies, such as the State of California, to ensure the devices are
5
safe and effective and comply with laws governing products which emit, produce or control radiation. Similar international regulations apply overseas. These regulations, which include the U.S. Food, Drug and Cosmetic Act (the “FDC Act”) and regulations promulgated by the FDA, govern, among other things, the design, development, testing, manufacturing, packaging, labeling, distribution, import/export, sale and marketing and disposal of medical devices, post market surveillance and reporting of serious injuries and death, repairs, replacements, recalls and other matters relating to medical devices, radiation emitting devices and devices utilizing radioactive by-product material. State regulations are extensive and vary from state to state. Varex’s X-ray tube products, imaging workstations and flat panel detectors are considered medical devices. Under the FDC Act, each medical device manufacturer must comply with quality system regulations that are strictly enforced by the FDA.
Unless an exception applies, the FDA requires that the manufacturer of a new medical device or a new indication for use of, or other significant change in, existing currently marketed medical device obtain either 510(k) pre-market notification clearance or pre-market approval (“PMA”) before it can market or sell those products in the United States. The 510(k) clearance process is applicable when the device introduced into commercial distribution is substantially equivalent to a legally marketed device. The process of obtaining 510(k) clearance generally takes at least six months from the date the application is filed, but could take significantly longer, and generally requires submitting supporting testing data. After a product receives 510(k) clearance, any modifications or enhancements to a product that could significantly affect its safety or effectiveness, or that would constitute a major change in the intended use of the device, technology, materials, labeling, packaging, or manufacturing process may require a new 510(k) clearance. The FDA requires each manufacturer to make this determination in the first instance, but the FDA can review any such decision. If the FDA disagrees with the manufacturer’s decision, it may retroactively require the manufacturer to submit a request for 510(k) pre-market notification clearance and can require the manufacturer to cease marketing and/or recall the product until 510(k) clearance is obtained. The FDA has issued draft guidance that, if finalized and implemented, will result in manufacturers needing to seek a significant number of new clearances for changes made to legally marketed devices. If we cannot establish that a proposed product is substantially equivalent to a legally marketed device, we must seek pre-market approval through a PMA application. Under the PMA process, the applicant submits extensive supporting data, including, in most cases, data from clinical studies, in the PMA application to establish reasonable evidence of the safety and effectiveness of the product. This process typically takes at least one to two years from the date the PMA is accepted for filing, but can take significantly longer for the FDA to review. Most of Varex’s products are Class I medical devices, which do not require 510(k) clearance.
Quality systems
. Varex’s manufacturing operations for medical devices, and those of its third-party manufacturers, are required to comply with the FDA’s Quality System Regulation (“QSR”), which addresses a company’s responsibility for product design, testing, and manufacturing quality assurance, and the maintenance of records and documentation. The QSR requires that each manufacturer establish a quality systems program by which the manufacturer monitors the manufacturing process and maintains records that show compliance with FDA regulations and the manufacturer’s written specifications and procedures relating to the devices. QSR compliance is necessary to receive and maintain FDA clearance or approval to market new and existing products. The FDA makes announced and unannounced periodic and ongoing inspections of medical device manufacturers to determine compliance with the QSR. If in connection with these inspections the FDA believes the manufacturer has failed to comply with applicable regulations and/or procedures, it may issue observations that would necessitate prompt corrective action. If FDA inspection observations are not addressed and/or corrective action taken in a timely manner and to the FDA’s satisfaction, the FDA may issue a Warning Letter (which would similarly necessitate prompt corrective action) and/or proceed directly to other forms of enforcement action. Failure to respond timely to FDA inspection observations, a Warning Letter or other notice of noncompliance and to promptly come into compliance could result in the FDA bringing enforcement action against us, which could include the total shutdown of Varex’s production facilities, denial of importation rights to the United States for products manufactured in overseas locations and denial of export rights for U.S. products and criminal and civil fines.
The FDA and the Federal Trade Commission (the “FTC”) also regulate advertising and promotion of Varex’s products to ensure that the claims it makes are consistent with its regulatory clearances, that it has adequate and reasonable scientific data to substantiate the claims and that its promotional labeling and advertising is neither false nor misleading. Varex may not promote or advertise its products for uses not within the scope of its intended use statement in its clearances or approvals or make unsupported safety and effectiveness claims.
It is also important that Varex’s products comply with electrical safety and environmental standards, such as those of Underwriters Laboratories (“UL”), the Canadian Standards Association (“CSA”), and the International Electrotechnical Commission (“IEC”). In addition, the manufacture and distribution of medical devices utilizing radioactive material requires a specific radioactive material license. For the United States, manufacture and distribution of these radioactive sources and devices also must be in accordance with a model-specific certificate issued by either the NRC or by an Agreement State. In essentially every country and state, installation and service of these products must be in accordance with a specific radioactive materials license issued by the applicable
6
radiation control agency. Service of these products must be in accordance with a specific radioactive materials license. Varex is also subject to a variety of additional environmental laws regulating Varex’s manufacturing operations and the handling, storage, transport and disposal of hazardous substances, and which impose liability for the cleanup of any contamination from these substances.
Other applicable U.S. regulations
. As a participant in the healthcare industry, Varex is also subject to extensive laws and regulations protecting the privacy and integrity of patient medical information that it receives, including the Health Insurance Portability and Accountability Act of 1996 (“HIPAA”), “fraud and abuse” laws and regulations, including, physician self-referral prohibitions, and false claims laws. From time to time, these laws and regulations may be revised or interpreted in ways that could make it more difficult for Varex’s customers to conduct their businesses, such as recent proposed revisions to the laws prohibiting physician self-referrals, and such revisions could have an adverse effect on the demand for Varex’s products, and therefore its business and results of operations. Varex also must comply with numerous federal, state and local laws of more general applicability relating to such matters as environmental protection, safe working conditions, manufacturing practices, fire hazard control and other matters.
The laws and regulations and their enforcement are constantly undergoing change, and Varex cannot predict what effect, if any, changes to these laws and regulations may have on its business. For example, national and state laws regulate privacy and may regulate Varex’s use of data. Furthermore, HIPAA was amended by the HITECH Act to provide that business associates who have access to patient health information provided by hospitals and healthcare providers are now directly subject to HIPAA, including the associated enforcement scheme and inspection requirements.
Medicare and Medicaid Reimbursement
The federal and state governments of the United States establish guidelines and pay reimbursements to hospitals and free-standing clinics for diagnostic examinations and therapeutic procedures under Medicare at the federal level and Medicaid at the state level. Private insurers often establish payment levels and policies based on reimbursement rates and guidelines established by the government.
The federal government and Congress review and adjust rates annually, and from time to time consider various Medicare and other healthcare reform proposals that could significantly affect both private and public reimbursement for healthcare services in hospitals and free-standing clinics. In the past, Varex has seen demand for its customers’ systems (in which Varex’s products are incorporated) negatively impacted by the uncertainties surrounding reimbursement rates in the United States. State government reimbursement for services is determined pursuant to each state’s Medicaid plan, which is established by state law and regulations, subject to requirements of federal law and regulations.
The provisions of the Affordable Care Act went into effect in 2012. Specifically, one of the components of the law is a 2.3% excise tax on sales of most medical devices, which may in the future negatively affect Varex’s customers and have an indirect negative effect on Varex’s gross margin, although it was suspended for 2016 and 2017. Other elements of this legislation, including comparative effectiveness research, an independent payment advisory board, payment system reforms (including shared savings pilots) and other provisions, could meaningfully change the way healthcare is developed and delivered, and may materially impact numerous aspects of Varex’s business, including the demand and availability of its products. Various healthcare reform proposals have also emerged at the state level, and Varex is unable to predict which, if any, of these proposals will be enacted. In addition, it is possible that changes in administration and policy, including the potential repeal of the Affordable Care Act, resulting from the recent U.S. presidential election could result in additional proposals and/or changes to health care system legislation which could have a material adverse effect on our business. Varex believes that the uncertainty created by healthcare reform in the United States has complicated its customers’ decision-making process and, therefore, impacted its business, and may continue to do so.
The sale of medical devices, the referral of patients for diagnostic examinations and treatments utilizing such devices, and the submission of claims to third-party payors (including Medicare and Medicaid) seeking reimbursement for such services, are subject to various federal and state laws pertaining to healthcare “fraud and abuse.” Anti-kickback laws make it illegal to solicit, induce, offer, receive or pay any remuneration in exchange for the referral of business, including the purchase of medical devices from a particular manufacturer or the referral of patients to a particular supplier of diagnostic services utilizing such devices. False claims laws prohibit anyone from knowingly and willfully presenting, or causing to be presented, claims for payment to third-party payors (including Medicare and Medicaid) that are false or fraudulent, for services not provided as claimed, or for medically unnecessary services. The Office of the Inspector General prosecutes violations of fraud and abuse laws and any violation may result in criminal and/or civil sanctions, including, in some instances, imprisonment and exclusion from participation in federal healthcare programs such as Medicare and Medicaid, which may negatively impact the demand for Varex’s products.
7
Foreign Regulations
Varex’s operations, sales and service of its products outside the United States are subject to regulatory requirements that vary from country to country and may differ significantly from those in the United States. In general, Varex’s products are regulated outside the United States as medical devices by foreign governmental agencies similar to the FDA.
Marketing a medical device internationally
. For Varex to market its products internationally, it must obtain clearances or approvals for products and product modifications. Varex is required to affix the CE mark to its products to sell them in member countries of the European Union (“EU”). The CE mark is an international symbol of adherence to certain essential principles of safety and effectiveness, which once affixed enables a product to be sold in member countries of the EEA. The CE mark is also recognized in many countries outside the EU, such as Switzerland and Norway and can assist in the clearance process. To receive permission to affix the CE mark to its medical devices products, Varex must obtain Quality System certification,
e.g
., ISO 13485, and must otherwise have a quality management system that complies with the EU Medical Device Directive. The ISO promulgates standards for certification of quality assurance operations. Varex is certified as complying with the ISO 9001 for its security and inspection products and ISO 13485 for its medical devices. Several Asian countries, including Japan and China, have adopted regulatory schemes that are comparable, and in some cases more stringent, than the EU scheme. To import medical devices into Japan, the requirements of Japan’s New Medical Device Regulation must be met and a “shonin,” the approval to sell medical products in Japan, must be obtained. Similarly, in China, a registration certification issued by the State Food and Drug Administration and a China Compulsory Certification mark for certain products are required to sell medical devices in that country. Obtaining such certifications on its products can be time-consuming and can cause Varex to delay marketing or sales of certain products in such countries. Similarly, prior to selling a device in Canada, manufacturers of Class II, III and IV devices must obtain a medical device license, though Varex does not currently sell these types of devices in Canada. Additionally, many countries have laws and regulations relating to radiation and radiation safety that also apply to Varex’s products. In most countries, radiological regulatory agencies require some form of licensing or registration by the facility prior to acquisition and operation of an X-ray generating device or a radiation source. The handling, transportation and recycling of radioactive metals and source materials are also highly regulated.
A number of countries, including the members of the EU, have implemented or are implementing regulations that would require manufacturers to dispose, or bear certain disposal costs, of products at the end of a product’s useful life and restrict the use of some hazardous substances in certain products sold in those countries.
Manufacturing and selling a device internationally
. Varex is also subject to laws and regulations outside the United States applicable to manufacturers of radiation-producing devices and products utilizing radioactive materials, and laws and regulations of general applicability relating to matters such as environmental protection, safe working conditions, manufacturing practices and other matters, in each case that are often comparable to, if not more stringent than, regulations in the United States. In addition, Varex’s sales of products in foreign countries are also subject to regulation of matters such as product standards, packaging requirements, labeling requirements, import restrictions, environmental and product recycling requirements, tariff regulations, duties and tax requirements. In some countries, Varex relies on its foreign distributors and agents to assist Varex in complying with foreign regulatory requirements.
Other applicable international regulations
. In addition to the U.S. laws regarding the privacy and integrity of patient medical information, Varex is subject to similar laws and regulations in foreign countries covering data privacy and other protection of health and employee information. Particularly within Europe, data protection legislation is comprehensive and complex and there has been a recent trend toward more stringent enforcement of requirements regarding protection and confidentiality of personal data, as well as enactment of stricter legislation. Varex is also subject to international “fraud and abuse” laws and regulations, as well as false claims and misleading advertisement laws. Varex also must comply with numerous international laws of more general applicability relating to such matters as environmental protection, safe working conditions, manufacturing practices, fire hazard control and other matters.
On June 23, 2016, the United Kingdom (the “U.K.”) held a referendum in which voters approved an exit from the E.U., commonly referred to as “Brexit”. Brexit could lead to legal uncertainty and potentially divergent national laws and regulations as the U.K. determines which E.U. laws to replace or replicate. Given the lack of comparable precedent, it is unclear what financial, regulatory and legal implications the withdrawal of the U.K. from the E.U. would have and how such withdrawal would affect Varex.
Anti-Corruption Laws and Regulations
Varex is subject to the U.S. Foreign Corrupt Practices Act and anti-corruption laws, and similar laws in foreign countries, such as the U.K. Bribery Act of 2010, which became effective on July 1, 2011, and the law “On the Fundamentals of Health Protection in the Russian Federation,” which became effective in January 2012. In general, there is a worldwide trend to strengthen anti-
8
corruption laws and their enforcement, and the healthcare industry and medical equipment manufacturers have been particular targets of these investigation and enforcement efforts. Any violation of these laws by Varex or its agents or distributors could create a substantial liability for Varex, subject Varex’s officers and directors to personal liability and also cause a loss of reputation in the market.
Transparency International’s 2015 Corruption Perceptions Index measured the degree to which public sector corruption is perceived to exist in 168 countries/territories around the world, and found that two-thirds of the countries in the index, including many that Varex considers to be high-growth areas for its products, such as China and India, scored below 50, on a scale from 100 (very clean) to 0 (highly corrupt). Varex currently operates in many countries where the public sector is perceived as being more or highly corrupt and its strategic business plans include expanding Varex’s business in regions and countries that are rated as higher risk for corruption activity by Transparency International.
Increased business in higher-risk countries could subject Varex and its officers and directors to increased scrutiny and increased liability. In addition, becoming familiar with and implementing the infrastructure necessary to comply with laws, rules and regulations applicable to new business activities and mitigating and protecting against corruption risks could be quite costly. Failure by Varex or its agents or distributors to comply with these laws, rules and regulations could delay its expansion into high-growth markets and could materially and adversely affect its business.
Competition and Trade Compliance Laws
Varex is subject to various competition and trade compliance laws in the jurisdictions in which it operates. Regulatory authorities under whose laws Varex operates may have enforcement powers that can subject Varex to sanctions, and can impose changes or conditions in the way Varex conducts its business. In addition, an increasing number of jurisdictions also provide private rights of action for competitors or consumers to seek damages asserting claims of anti-competitive conduct. Increased government scrutiny of Varex’s actions or enforcement or private rights of action could materially and adversely affect its business or damage its reputation. In addition, Varex may conduct, or it may be required to conduct, internal investigations or face audits or investigations by one or more domestic or foreign government agencies, which could be costly and time-consuming, and could divert its management and key personnel from its business operations. An adverse outcome under any such investigation or audit could subject Varex to fines or criminal or other penalties, which could materially and adversely affect Varex’s business and financial results. Furthermore, competition laws may prohibit or increase the cost of future acquisitions that Varex may desire to undertake.
International sales of certain of our Linatron X-ray accelerators are subject to U.S. export licenses that are issued at the discretion of the U.S. government. Orders and revenues for our security and inspection products have been and may continue to be unpredictable as governmental agencies may place large orders with us or with our OEM customers over a short period of time and then may not place additional orders until complete deployment and installation of previously ordered products. We have seen domestic and international governments postpone purchasing decisions and delay installations of products for security and inspection systems. Furthermore, tender awards in this business may be subject to challenge by third parties, as we have previously encountered, which can make the conversion of orders to revenues unpredictable for some security and inspection products. The market for border protection systems has slowed significantly and end customers, particularly in oil-based economies and war zones in which we have a significant customer base, are delaying system deployments or tenders and have considered moving to alternative sources.
Intellectual Property
Varex places considerable importance on obtaining and maintaining patent, copyright and trade secret protection for significant new technologies, products and processes, because of the length of time and expense associated with bringing new products through the development process and to the marketplace.
Varex generally relies upon a combination of patents, copyrights, trademarks, trade secret and other laws, and contractual restrictions on disclosure, copying and transferring title, including confidentiality agreements with vendors, strategic partners, co-developers, employees, consultants and other third parties, to protect Varex’s proprietary rights in the developments, improvements and inventions that Varex has originated and which are incorporated in its products or that fall within its fields of interest. As of
September 29, 2017
, Varex owns over 250 patents issued in the United States, over 170 patents issued throughout the rest of the world and had over another 100 patent applications on file with various patent agencies worldwide. The patents and patents issuing from the pending applications generally expire between 2017 and 2035. Varex intends to file additional patent applications as appropriate. Varex has trademarks, both registered and unregistered, that are maintained and enforced to provide customer recognition for its products in the marketplace. Varex also has agreements with third parties that provide for licensing of patented or proprietary
9
technology, including royalty-bearing licenses and technology cross-licenses. These licenses generally can only be terminated for breach.
In conjunction with the separation, Varex and Varian entered into an Intellectual Property Matters Agreement, pursuant to which, among other things, each of Varex and Varian granted the other licenses to use certain intellectual property.
Environmental Matters
Varex’s operations and facilities, past and present, are subject to environmental laws, including laws that regulate the handling, storage, transport and disposal of hazardous substances. Certain of those laws impose cleanup liabilities under certain circumstances. In connection with those laws and certain of Varex’s past and present operations and facilities, Varex is obligated to indemnify Varian for 20% of the cleanup liabilities related to corporate, discontinued or sold operations prior to the 1999 separation and distribution (after adjusting for any insurance proceeds or tax benefits received by Varian), as well as fully indemnify Varian for other liabilities arising from the operations of the business transferred to it as part of the separation. Those include facilities sold as part of Varian’s electron devices business in 1995 and thin film systems business in 1997. In addition, the U.S. Environmental Protection Agency (“EPA”) or third parties have named Varian as a potentially responsible party under the amended Comprehensive Environmental Response Compensation and Liability Act of 1980 (“CERCLA”), at sites to which Varian or the facilities of the businesses sold in 1995 and 1997 were alleged to have shipped waste for recycling or disposal (the “CERCLA sites”). It is anticipated that Varex will be obligated to reimburse Varian for 20% of the liabilities of Varian related to these CERCLA sites (after adjusting for any insurance proceeds or tax benefits received by Varian). In connection with the CERCLA sites, to date Varian has been required to pay only a small portion of the total amount as its contribution to the cleanup efforts and Varex anticipates that any reimbursement to Varian in the future will not be material.
Financial Information about Geographic Areas
Varex does business globally, with manufacturing and research and development in the United States, Europe, Philippines and China, and sales and service operations throughout the world. Approximately two-thirds of Varex’s revenues are generated from its international regions. In addition to the potentially adverse impact of foreign regulations, see “Government Regulation—Foreign Regulations,” Varex also may be affected by other factors related to its international sales, such as: lower average selling prices and profit margins, delays in shipments due to required export licensing, and longer time periods from shipment to cash collection (which increases days sales outstanding (“DSO”)). To the extent that the geographic distribution of Varex’s sales continues to shift more towards international regions, its overall revenues and margins may suffer. Although a significant portion of Varex customers are outside of the United States, its products are generally priced in U.S. Dollars. As a result, fluctuations in foreign currency exchange rates may impact the demand for products.
Varex is also exposed to other economic, political and other risks inherent in doing business globally. For an additional discussion of these risks, see Item 1A, “Risk Factors.”
Employees
As of
September 29, 2017
, Varex had approximately 2,000 full-time and part-time employees worldwide. None of its employees based in the United States are unionized or subject to collective bargaining agreements. Employees based in some foreign countries may, from time to time, be represented by works councils or unions or subject to collective bargaining agreements. Varex currently considers its relations with its employees to be good.
Information Available to Investors
As soon as reasonably practicable after our filing or furnishing the information to the SEC, we make the following available free of charge on the Investors page of our website
http://www.vareximaging.com
: our annual reports on Form 10-K; quarterly reports on Form 10-Q; current reports on Form 8-K (including any amendments to those reports); and proxy statements. Our Code of Conduct, Corporate Governance Guidelines and the charters of the Audit Committee, Compensation and Management Development Committee, Ethics and Compliance Committee, Nominating and Corporate Governance Committee and Executive Committee are also available on the Investors page of our website. Investors and others should note that we announce material financial and operational information to our investors using our investor relations website (http://investors.vareximaging.com/), press releases, SEC filings and public conference calls and webcasts. Please note that information on, or that can be accessed through, our website is not deemed
10
“filed” with the SEC and is not to be incorporated by reference into any of our filings under the Securities Act of 1933, as amended (the “Securities Act”), or the Securities Exchange Act of 1934, as amended (the “Exchange Act”).
Executive Officers of the Registrant
The biographical summaries of our executive officers are as follows:
Sunny S. Sanyal,
52, has
served as President, Chief Executive Officer, and Director since January 2017. Prior to the separation of Varex from Varian, Sunny served as senior vice president and president of Varian’s Imaging Components business for Varian since February 2014. Prior to joining Varian in 2014, Sunny was CEO of T-System, a privately held company providing information technology solutions and services to hospitals and urgent care facilities. He also served as president of McKesson Provider Technologies, where he led the company to significant market expansion with its clinical software, medical imaging technology, and services solutions. Sunny has held executive positions at GE Healthcare, Accenture, and IDX Systems. He received a master of business administration from Harvard Business School, a master of science in industrial engineering from Louisiana State University, and a bachelor of engineering in electrical engineering from the University of Bombay.
Clarence R. Verhoef,
61, has
served as Chief Financial Officer, and Senior Vice President since January 2017. Prior to the separation of Varex from Varian, Clarence served as senior vice president, Chief Accounting Officer and corporate controller for Varian since August 2012. He joined Varian in 2006 and served as the divisional controller of Varian’s Imaging Components business until 2012. Prior to joining Varian, Clarence served in numerous executive management roles, including chief financial officer of Techniscan Medical Systems, and chief financial officer and vice president of marketing for GE OEC Medical Systems. He holds a bachelor’s degree in finance from the University of Utah.
Kimberley E. Honeysett,
46,
has served as Senior Vice President, General Counsel, and Corporate Secretary since January 2017. Prior to the separation of Varex from Varian, Kim served vice president and assistant general counsel and assistant corporate secretary for Varian, where she advised Varian’s Board of Directors, executive management and corporate functions, including business development, investor relations, human resources, information technology and was responsible for corporate governance, general compliance matters, litigation and global subsidiary governance. Prior to joining Varian in 2005, Kim served as group director, legal affairs at Siebel Systems, Inc., an enterprise software company, and as an associate with the law firm Brobeck, Phleger & Harrison LLP. Kim holds juris doctor from Cornell Law School and a bachelor’s degree in communications from the University of California, Los Angeles.
Brian Giambattista,
59, has
served as Senior Vice President, and General Manager - X-ray Detectors since May 2017 and joined Varex after the acquisition of the PerkinElmer Medical Imaging business. He has nearly 30 years of experience in the industry, having held various management and engineering roles at PerkinElmer and General Electric, and received his doctorate degree in Physics from the University of Virginia.
Mark S. Jonaitis,
55, has served as Senior Vice President, and General Manager - X-Ray Sources since 2017. Prior to the separation, Mark served in various management positions at Varian, including most recently vice president and general manager, X-ray Tube Products and global manufacturing. Mark joined Varian’s predecessor, Varian Associates, in 1983, where he served in various product and engineering positions. Mark received his bachelor of science in physics from the University of Utah.
Carl E. LaCasce
, 61, has
served as Senior Vice President - Sales & Marketing and Customer Operations since 2017. Prior to the separation of Varex from Varian, Carl was Vice President - Global Sales & Marketing of Varian. He is overseeing all customer facing operations. Carl joined Varian in May 1986. Carl holds a Bachelor’s degree in Business Administration from Elmhurst College.
Richard E. Colbeth
, 56, has
served as Senior Vice President of Engineering, X-ray Detectors since January 2017. He is overseeing flat panel operations. Prior to the separation of Varex from Varian, Rick served in various management roles for Varian, including Vice President and General Manager, Imaging Products and Vice President of Engineering, Imaging Products. Rick joined Varian’s predecessor, Varian Associates, in 1989, where he served in various research and development positions. He received a Ph.D. in electrical engineering from Columbia University, a master of science in electrical engineering from Yale University, and a bachelor of science in electrical engineering from Lehigh University.
Kevin B. Yankton,
51, has served as Chief Accounting Officer, Corporate Controller since January 2017. Prior to joining Varex, Kevin held the position of VP of Global Business Services and Assistant Corporate Controller for Verifone, Inc. from July 2013 to October 2016. Having started his career with PricewaterhouseCoopers’ San Jose office, he transitioned to Applied Materials where he held
11
various finance roles in their corporate, regional HQ, and business units. In addition to Applied Materials, he has held finance roles with increasing levels of responsibility at Silicon Image, Cisco Systems, and Gap Corporate Offices. Mr. Yankton graduated from the University of California Santa Barbara with a Bachelor of Arts in Business Economics, holds a MBA from Boston University, is a California CPA, and is a Certified Internal Auditor.
The following risk factors and other information included in this Annual Report on Form 10-K should be carefully considered. Although the risk factors described below are the ones management deems significant, additional risks and uncertainties not presently known to us or that we presently deem less significant may also adversely affect our business operations. If any of the following risks or additional risks and uncertainties actually occur, our business, operating results, and financial condition could be adversely affected.
Varex sells its products and services to a limited number of OEM customers, many of which are also its competitors, and a reduction in or loss of business of one or more of these customers may materially reduce its sales.
Varex had one customer during fiscal year 2017 that accounted for
19.3%
of its revenue. Varex’s ten largest customers as a group accounted for approximately
48%
, 54% and 63% of its revenue for fiscal years 2017, 2016 and 2015, respectively.
Varex sells its products to a limited number of OEM customers, many of which are also its competitors with in-house X-ray tube manufacturing operations. Although Varex seeks to broaden its customer base, it will continue to depend on sales to a relatively small number of major customers. Because it often takes significant time to replace lost business, it is likely that Varex’s operating results would be materially and adversely affected if one or more of its major OEM customers were to cancel, delay, or reduce orders in the future.
On January 28, 2017, Varian and Varex entered into a Separation and Distribution Agreement (the “Separation and Distribution Agreement”), whereby Varex became an independent publicly-traded company. Although it is expected that Varian will continue as a customer of Varex, and while Varex has entered into a multi-year Supply Agreement with Varian, there can be no assurance that Varian will continue to source from Varex long-term.
Furthermore, Varex generates significant accounts receivables from the sale of its products and the provision of services to its major customers. Although Varex’s major customers are large corporations, if one or more of these customers were to cancel a product order or service contract (whether in accordance with its terms or otherwise), become insolvent or otherwise be unable or fail to pay for Varex products and services, Varex’s operating results and financial condition could be materially and adversely affected.
Varex may not be able to accurately predict the demand for its products by its OEM customers.
Economic uncertainties over the past few years, natural disasters, and other matters beyond Varex’s control have made it difficult for its OEM customers to accurately forecast and plan future business activities. Such economic uncertainties and natural disasters, as well as other factors, have previously impacted Varex’s business, resulting in inventory reduction and slowdowns in sales at some of these customers. Similar inventory adjustments and slowdowns in sales could occur in the future. Varex’s OEM customers also face inherent competitive issues and new product introduction delays which can result in changes in forecasts. As such, the market and regulatory risks faced by Varex’s OEM customers in the X-ray-based diagnostic imaging space also ultimately impact Varex’s ability to forecast future business. Varex’s agreements for imaging components, such as the recent three-year pricing agreement with Toshiba Medical Systems, may contain purchasing estimates that are based on its customers’ historical purchasing patterns rather than firm commitments, and actual purchasing volumes under the agreements may vary significantly from these estimates. The variation from forecasted purchasing volume may be due, in part, to the increasing life of X-ray tubes, which can result in reduced demand for replacement X-ray tubes in ways Varex may not be able to accurately forecast. Reductions in purchasing patterns have in the past and may in the future materially and adversely affect Varex’s operating results.
Varex competes in highly competitive markets, and it may lose business to its customers or other companies with greater resources or the ability to develop more effective technologies, or it could be forced to reduce its prices.
Rapidly-evolving technology, intense competition and pricing pressure characterize the market in which Varex competes. Varex often competes with companies that have greater financial, marketing and other resources than Varex, including Varex’s customers. If these customers manufacture a greater percentage of their components in house or otherwise lower external sourcing costs, which may occur for a number of reasons, including a strong U.S. Dollar, Varex could experience reductions in purchasing volume by, or loss of, one or more of these customers. Such a reduction or loss may have a material and adverse effect on its business. Some of the major diagnostic imaging systems companies, which are the primary OEM customers for Varex’s X-ray components, also
12
manufacture X-ray components, including X-ray tubes, for use in their own imaging systems products. Varex must compete with these in-house manufacturing operations for business. In addition, Varex competes against other stand-alone, independent X-ray tube manufacturers for both the OEM business of major diagnostic imaging equipment manufacturers and the independent servicing business for X-ray tubes. The market for flat panel detectors is also very competitive, and Varex faces intense competition from over a dozen smaller competitors. As a result of these competitive dynamics, in order for Varex to effectively retain the business of its customers and compete with its competitors, it must have an advantage in one or more significant areas, such as lower product cost, better product quality and/or superior technology and/or performance.
With Varex’s industrial products, Varex competes with other OEM suppliers, primarily outside of the United States. The market for its X-ray tube and flat panel products used for nondestructive testing in industrial applications is small and highly fragmented. In addition, some of Varex’s competitors outside the United States may have resources and support from their governments that Varex cannot replicate, such as preferences for local manufacturers, and may not be subject to the same trade compliance regulations to which Varex is subject. Therefore, Varex’s ability to compete in certain high-growth markets may be limited as compared to its competitors.
Existing competitors’ actions and new entrants may materially and adversely affect Varex’s ability to compete. These competitors could develop technologies and products that are more effective than those Varex currently uses or produces or that could render its products obsolete or noncompetitive. In addition, the timing of Varex’s competitors’ introduction of products into the market could affect the market acceptance and sales of Varex’s products. Some competitors offer specialized products that provide, or may be perceived by customers to provide, a marketing advantage over Varex’s products. Also, some of Varex’s competitors may not be subject to the same standards, regulatory and/or other legal requirements to which Varex is subject, and therefore, they could have a competitive advantage in developing, manufacturing and marketing products and services. Any inability to develop, gain regulatory approval for and supply commercial quantities of competitive products to the market as quickly and effectively as Varex’s competitors could limit market acceptance of Varex’s products and reduce its sales. In addition, some of its smaller competitors could be acquired by larger companies that have greater financial strength, which could enable them to compete more aggressively. Varex’s competitors could also acquire some of its customers, suppliers or distributors, which could disrupt supply or distribution arrangements and result in loss of customers and less predictable and reduced revenues in Varex’s businesses. Any of these competitive factors could negatively and materially affect Varex’s pricing, sales, revenues, market share and gross margins and its ability to maintain or increase its operating margins.
Varex’s success depends on the successful development, introduction, and commercialization of new generations of products and enhancements to or simplifications of existing product lines.
Rapid change and technological innovation characterize the markets in which Varex operates, particularly with respect to flat panel technology. Varex’s customers use its products in their medical diagnostic, security, and industrial imaging systems, and Varex must continually introduce new products at competitive costs while also improving existing products with higher quality, lower costs, and increased features. In order to be successful, Varex must anticipate its customers’ needs and demands, as well as potential shifts in market preferences. Varex’s failure to do so has in the past resulted, and may in the future result in the loss of customers and an adverse impact to its financial performance. With a relatively strong U.S. Dollar, Varex’s ability to meet its customers’ pricing expectations is particularly challenging and may result in erosion of product margin and market share.
Varex may need to spend more time and money than it expects to develop and introduce new products or enhancements, and, even if Varex succeeds, Varex may not be able to recover all or a meaningful part of its investment. Once introduced, new products may materially and adversely impact sales of Varex’s existing products or make them less desirable or even obsolete, which could materially and adversely impact Varex’s revenues and operating results. In addition, certain costs, including installation and warranty costs, associated with new products may be proportionately greater than the costs associated with other products and may therefore disproportionately, materially, and adversely affect Varex’s gross and operating margins. If Varex is unable to lower these costs over time, Varex’s operating results could be materially and adversely affected. Some of the electronic components and integrated circuits used in Varex’s flat panel detectors are susceptible to discontinuance and obsolescence risks, which may force Varex to incorporate newer generations of these components, resulting in unplanned additional R&D expenses, delays in the launch of new products, supply disruption, or inventory write downs.
Varex’s ability to successfully develop and introduce new products and product enhancements and simplifications, and the revenues and costs associated with these efforts, are affected by Varex’s ability to:
|
•
|
properly identify customer needs or long-term customer demands;
|
|
•
|
prove the feasibility of new products;
|
|
•
|
limit the time required from proof of feasibility to routine production;
|
13
|
•
|
timely and efficiently comply with internal quality assurance systems and processes;
|
|
•
|
limit the timing and cost of regulatory approvals;
|
|
•
|
accurately predict and control costs associated with inventory overruns caused by the phase-in of new products and the phase-out of old products;
|
|
•
|
price its products competitively and profitably, which can be particularly difficult with a strong U.S. Dollar;
|
|
•
|
manufacture, deliver, and install its products in sufficient volumes on time and accurately predict and control costs associated with manufacturing installation, warranty, and maintenance of the products;
|
|
•
|
appropriately manage its supply chain;
|
|
•
|
manage customer acceptance and payment for products; and
|
|
•
|
anticipate, respond to, and compete successfully with competitors.
|
Furthermore, as discussed in greater detail elsewhere in this “Risk Factors” section, Varex cannot be sure that it will be able to successfully develop, manufacture, or introduce new products or enhancements, the roll-out of which involves compliance with complex quality assurance processes, including the Quality System Regulation (“QSR”) of the U.S. Food and Drug Administration (“FDA”). Failure to complete these processes timely and efficiently could result in delays that could affect Varex’s ability to attract and retain customers or cause customers to delay or cancel orders, which would materially and adversely affect Varex’s revenues and operating results.
Varex may face additional risks from the acquisition or development of new lines of business.
From time to time, Varex may acquire or develop new lines of business. There are substantial risks and uncertainties associated with new lines of business, particularly in instances where the markets are not fully developed. Risks include developing knowledge of and experience in the new business, recruiting market professionals, increasing research and development expenditures, and developing and capitalizing on new relationships with experienced market participants. This may mean significant investment and involvement of Varex’s senior management to acquire or develop, then integrate, the business into its operations. Timelines for integration of new businesses may not be achieved, and price and profitability targets may not prove feasible, as new products can carry lower gross margins than existing products. External factors, such as compliance with regulations, competitive alternatives, and shifting market preferences may also impact whether implementation of a new business will be successful. Failure to manage these risks could have a material and adverse effect on Varex’s business, results of operations, and/or financial condition.
Varex may be unable to complete future acquisitions or realize expected benefits from acquisitions of or investments in new businesses, products, or technologies, which could harm Varex’s business.
Varex’s ability to identify and take advantage of attractive acquisitions or other business development opportunities is an important component in implementing its overall business strategy. Varex needs to grow its businesses in response to changing technologies, customer demands, and competitive pressures. In some circumstances, Varex may decide to grow its business through the acquisition of complementary businesses, products, or technologies, rather than through internal development. For example, during fiscal year 2015, Varex acquired Claymount Investments B.V. ("Claymount") and MeVis Medical Solutions AG ("MeVis"), and in May 2017, Varex acquired the medical imaging business of PerkinElmer, Inc. (the “Acquired Detector Business”).
Identifying suitable acquisition candidates can be difficult, time consuming, and costly, and Varex may not be able to identify suitable candidates or successfully complete or finance identified acquisitions, including as a result of failing to obtain regulatory or competition clearances, which could impair Varex’s growth and ability to compete. In addition, completing an acquisition can divert Varex’s management and key personnel from its current business operations, which could harm its business and affect its financial results. Even if Varex completes an acquisition, Varex may not be able to successfully integrate newly-acquired organizations, products, technologies, or employees into its operations or may not fully realize some of the expected synergies.
Integrating an acquisition can also be expensive and time consuming and may strain Varex’s resources. It may cost Varex more to commercialize new products than originally anticipated or cause Varex to increase its expenses related to research and development, either of which could materially and adversely impact its results of operations. In many instances, integrating a new business will also involve implementing or improving internal controls appropriate for a public company into a business that lacks them. It is also possible that an acquisition could increase Varex’s risk of litigation, as a third party may be more likely to assert a legal claim following an acquisition because of perceived deeper pockets or a perceived greater value of a claim. In addition, Varex may be unable to retain the employees of acquired companies or the acquired company’s customers, suppliers, distributors, or other partners for a variety of reasons, including the fact that these entities may be Varex’s competitors or may have close relationships with its competitors.
Further, Varex may find that it needs to restructure or divest acquired businesses or assets of those businesses. Even if it does so, an acquisition may not produce the full efficiencies, growth, or benefits that were expected. If Varex decides to sell assets or a
14
business, it may be difficult to identify buyers or alternative exit strategies on acceptable terms, in a timely manner, or at all, which could delay the accomplishment of its strategic objectives. Varex may be required to dispose of a business at a lower price or on less advantageous terms, or to recognize greater losses than it had anticipated.
If Varex acquires a business, it allocates the total purchase price to the acquired business’ tangible assets and liabilities, identifiable intangible assets, and liabilities based on their fair values as of the date of the acquisition and records the excess of the purchase price over those values as goodwill. If it fails to achieve the anticipated growth from an acquisition, or if it decides to sell assets or a business, it may be required to recognize an impairment loss on the write down of its assets and goodwill, which could materially and adversely affect its financial results. In addition, acquisitions can result in potentially dilutive issuances of equity securities or the incurrence of debt, contingent liabilities or expenses, or other charges, any of which could harm Varex’s business and affect its financial results.
Additionally, Varex has investments in privately-held companies (for example, its 40% ownership in its major supplier of its amorphous silicon-based thin film transistor arrays (flat panels) used in its digital detectors, dpiX LLC) that are subject to risk of loss of investment capital. These investments are inherently risky, in some instances because the markets for the technologies or products these companies have under development may never materialize. If these companies do not succeed, Varex could lose some or all of its investment in these companies.
Our Acquired Detector Business may not achieve strategic objectives, anticipated synergies, and/or other expected potential benefits.
Varex expects to realize strategic and other financial and operating benefits as a result of the Acquired Detector Business. However, Varex cannot predict with certainty the extent to which these benefits will actually be achieved or the timing of any such benefits. The following factors, among others, may prevent Varex from realizing these benefits:
|
•
|
the inability of the acquired business to increase product sales;
|
|
•
|
unfavorable customer reaction to the transaction or Varex’s products following the closing;
|
|
•
|
competitive factors, including technological advances attained by competitors or the decision of certain companies currently engaged in the industrial sector to compete in the medical imaging sector;
|
|
•
|
the failure of key markets for Varex’s products to develop to the extent or as rapidly as currently expected;
|
|
•
|
changes in technology that require Varex to make significant capital expenditures to develop competitive products;
|
|
•
|
employment laws or regulations or other limitations in foreign jurisdictions, or other operational issues, that could have an impact on the timing or amount of synergies; and
|
|
•
|
the failure to retain key employees.
|
Failure to achieve the strategic objectives of the transaction could have a material adverse effect on the revenues, expenses, operating results, and cash resources of Varex and could result in Varex not achieving the anticipated potential benefits of the transaction. In addition, there is no assurance that the growth rate of the acquired business will equal the historical growth rate experienced by PerkinElmer.
Varex may not successfully integrate its business with the Acquired Detector Business.
Achieving the potential benefits of the Acquired Detector Business will depend in substantial part on the successful integration of the technologies, operations, and personnel of the acquired business. Varex may face challenges integrating the Acquired Detector Business, including:
|
•
|
consolidating and rationalizing corporate information technology, engineering and administrative infrastructures;
|
|
•
|
integrating product offerings;
|
|
•
|
coordinating sales and marketing efforts;
|
|
•
|
coordinating and integrating the manufacturing activities of the acquired business; and
|
|
•
|
coordinating and rationalizing research and development activities to enhance introduction of new products and technologies with reduced cost.
|
The integration of the Acquired Detector Business is a complex, time-consuming and expensive process. It is not certain that the Acquired Detector Business can be successfully integrated in a timely manner, in a cost-efficient manner, or at all. Failure to do so could have a material adverse effect on the revenues, expenses, operating results, and cash resources of Varex and could result in Varex not achieving the anticipated potential benefits of the transaction.
15
The trading price of Varex’s common stock may decline or fluctuate significantly and fluctuations in Varex’s operating results, including quarterly revenues, and margins, may cause its stock price to be volatile, which could cause losses for its stockholders.
A public market did not exist for Varex common stock prior to the distribution, and since the distribution, Varex's stock price has ranged from a low of $25.41 to a high of $36.58. Varex cannot guarantee that an active trading market will be sustained for its common stock. Nor can Varex predict the prices at which shares of its common stock may trade. Similarly, Varex cannot predict the long-term effect of the distribution on the trading prices of its common stock. Varex has experienced and expects in the future to experience fluctuations in its operating results, including revenues and margins, from period to period.
Varex’s quarterly operating results, including its revenues and margins, may be affected by a number of other factors, including:
|
•
|
the introduction and timing of announcement of new products or product enhancements by Varex and its competitors;
|
|
•
|
change in its or its competitors’ pricing or discount levels;
|
|
•
|
changes in foreign currency exchange rates and other economic uncertainty;
|
|
•
|
changes in the relative portion of its revenues represented by its various products, including the relative mix between higher margin and lower-margin products;
|
|
•
|
changes in the relative portion of its revenues represented by its international region as a whole and by regions within the overall region, as well as by individual countries (notably, those in emerging markets);
|
|
•
|
fluctuation in its effective tax rate, which may or may not be known to Varex in advance;
|
|
•
|
the availability of economic stimulus packages or other government funding, or reductions thereof;
|
|
•
|
disruptions in the supply or changes in the costs of raw materials, labor, product components or transportation services;
|
|
•
|
changes to its organizational structure, which may result in restructuring or other charges;
|
|
•
|
disruptions in its operations, including its ability to manufacture products, caused by events such as earthquakes, fires, floods, terrorist attacks or the outbreak of epidemic diseases;
|
|
•
|
the unfavorable outcome of any litigation or administrative proceeding or inquiry, as well as ongoing costs associated with legal proceedings; and,
|
|
•
|
accounting changes and adoption of new accounting pronouncements.
|
Because many of Varex’s operating expenses are based on anticipated capacity levels, and a high percentage of these expenses are fixed for the short term, a small variation in the timing of revenue recognition can cause significant variations in operating results from quarter to quarter. If Varex’s gross margins fall below the expectation of securities analysts and investors, the trading price of Varex common stock may decline.
In addition, as discussed in more detail elsewhere in this Annual Report, significant changes may occur in Varex’s cost structure, management, financing and business operations as a result of operating as a company separate from Varian.
Our secured revolving credit facility and secured term loan credit facility restrict certain activities, and failure to comply with these facilities may have an adverse effect on its business, liquidity and financial position.
Varex entered into a secured revolving credit facility and a secured term loan credit facility in connection with the Acquired Detector Business, each of which contains restrictive financial covenants, including financial covenants that require Varex to comply with specified financial ratios. Varex may have to curtail some of its operations to comply with these covenants. In addition, its credit facilities contain other affirmative and negative covenants that could restrict its operating and financing activities. These provisions will limit its ability to, among other things, incur future indebtedness, contingent obligations or liens, guarantee indebtedness, make certain investments and capital expenditures, sell stock or assets and pay dividends and consummate certain mergers or acquisitions. If Varex fails to comply with the credit facility requirements, it may be in default. Upon an event of default, if the Credit Agreement is not amended or the event of default is not waived, the lender could declare all amounts then outstanding, together with accrued interest, to be immediately due and payable. If this happens, Varex may not be able to make those payments or borrow sufficient funds from alternative sources to make those payments. Even if Varex were to obtain additional financing, that financing may be on unfavorable terms.
Varex has significant debt obligations that could adversely affect Varex’s business, profitability and ability to meet its obligations.
As of September 29, 2017, Varex’s total combined indebtedness was approximately $494 million. The borrowings under Varex’s credit facilities bear interest at floating interest rates. As part of its overall risk management practices, Varex entered into financial derivatives, interest rate swaps designed as cash flow hedges, to hedge the floating LIBOR interest rate on
$292.5 million
of its debt As a result, Varex will be exposed to fluctuations in interest rates to the extent of the balance of its borrowings under the LIBOR-based portion of its credit facilities.
16
This debt could potentially have important consequences to Varex and its investors, including:
|
•
|
requiring that a portion of Varex’s cash flow from operations be used to make principal and interest payments on this debt, which would reduce cash flow available for other corporate purposes;
|
|
•
|
increasing Varex’s vulnerability to shifts in interest rates and to general adverse economic and industry conditions;
|
|
•
|
limiting Varex’s flexibility in planning for, or reacting to, changes in its business and the industry; and,
|
|
•
|
limiting Varex’s ability to borrow additional funds as needed or increasing the costs of any such borrowing.
|
In addition, Varex’s actual cash requirements in the future may be greater than expected. Varex’s cash flow from operations may not be sufficient to repay all of the outstanding debt as it becomes due, and Varex may not be able to borrow money, sell assets, or otherwise raise funds on acceptable terms, or at all, to refinance Varex’s debt.
A disruption at Varex’s manufacturing facilities, as well as fluctuating manufacturing costs, could materially and adversely affect its business.
The majority of Varex’s products are manufactured in its manufacturing facility in Salt Lake City, Utah. Varex’s manufacturing operations are subject to potential power failures, the breakdown, failure, or substandard performance of equipment, the improper installation or operation of equipment, and natural or other disasters. Loss or damage to this manufacturing facility due to any of these factors or otherwise could materially and adversely affect Varex’s ability to manufacture sufficient quantities of its products or otherwise deliver products to meet customer demand or contractual requirements, which may result in a loss of revenue and other adverse business consequences. Because of the time required to obtain regulatory approval and licensing of a manufacturing facility, Varex may not be available on a timely basis to replace any lost manufacturing capacity. The occurrence of these or any other operational issues at Varex’s manufacturing facilities could have a material and adverse effect on Varex’s business, financial condition, and results of operations. In addition, some of Varex’s products from the Acquired Detector Business and the Claymount acquisition are also manufactured in Walluf, Germany; Heerlen and Dinxperlo, the Netherlands; and Calamba City, Philippines, which are subject to similar risks but may also face additional regulatory and political risks, which could impact Varex’s ability to manufacture and ship products in a timely manner or at all. Varex manufactures its security products in Las Vegas, Nevada, and certain flat panels in Santa Clara, California, and these operations are also subject to potential power failures, the breakdown, failure, or substandard performance of equipment, the improper installation or operation of equipment, earthquakes, and other disasters, all of which could materially and adversely affect Varex’s ability to deliver products to meet customer demand. In addition, Varex’s costs associated with manufacturing its products can vary significantly from quarter to quarter, and fluctuations thereof may adversely affect its business, operating results, and/or financial condition.
Significantly more than half of Varex’s revenues are generated from customers located outside the United States, and economic, political, and other risks associated with international sales and operations could materially and adversely affect Varex’s sales or make them less predictable.
Varex conducts business globally. Revenues generated from customers located outside the United States accounted for approximately
66%
, 65% and 62% of Varex’s total revenues during each of fiscal years 2017, 2016 and 2015, respectively. As a result, Varex must provide significant service and support globally. Varex intends to continue to expand its presence in international markets and expects to expend significant resources in doing so. Varex cannot be sure that it will be able to meet its sales, service, and support objectives or obligations in these international markets or recover its investment in attempting to do so. Varex’s future results could be harmed by a variety of factors, including:
|
•
|
currency fluctuations, and in particular the strength of the U.S. Dollar relative to many currencies, which have and may in the future adversely affect Varex’s financial results and cause some customers to delay purchasing decisions or move to in-sourcing supply or migrate to lower cost alternatives or ask for additional discounts;
|
|
•
|
the longer payment cycles associated with many customers located outside the United States;
|
|
•
|
difficulties in interpreting or enforcing agreements and collecting receivables through many foreign countries’ legal systems;
|
|
•
|
changes in restrictions on trade between the United States and other countries or unstable regional political and economic conditions, such as those that may result from the Trump administration;
|
|
•
|
changes in the political, regulatory, safety or economic conditions in a country or region, including as a result of the United Kingdom’s June 2016 vote and formal notice in March 2017 to leave the European Union (“Brexit”) or the change in the U.S. administration;
|
|
•
|
the imposition by governments of additional taxes, tariffs, global economic sanctions programs, or other restrictions on foreign trade;
|
|
•
|
any inability to obtain required export or import licenses or approvals;
|
|
•
|
failure to comply with export laws and requirements, which may result in civil or criminal penalties and restrictions on Varex’s ability to export its products, particularly its industrial linear accelerator products;
|
17
|
•
|
risks unique to the Chinese market, including import barriers and preferences for local manufacturers;
|
|
•
|
failure to obtain proper business licenses or other documentation or to otherwise comply with local laws and requirements regarding marketing, sales, service, or any other business Varex conducts in a foreign jurisdiction, which may result in civil or criminal penalties and restrictions on its ability to conduct business in that jurisdiction; and,
|
|
•
|
the possibility that it may be more difficult to protect Varex’s intellectual property in foreign countries.
|
Although Varex’s sales fluctuate from period to period, in recent years Varex’s international region has represented a larger share of its business. The more Varex depends on sales in the international region, the more vulnerable Varex becomes to these factors.
Varex’s effective tax rate is impacted by tax laws in both the United States and in the countries in which its international subsidiaries do business. Earnings from Varex’s international region are generally taxed at rates lower than U.S. rates. A change in the percentage of Varex’s total earnings from the international region, a change in the mix of particular tax jurisdictions within the international region, or a change in currency exchange rates could cause Varex’s effective tax rate to increase or decrease. Also, Varex is not currently taxed in the United States on certain undistributed earnings of certain foreign subsidiaries. These earnings could become subject to incremental foreign withholding or U.S. federal and state taxes should they either be deemed to be or actually are remitted to the United States, in which case Varex’s financial results could be materially and adversely affected. In addition, changes in the valuation of Varex’s deferred tax assets or liabilities, changes in tax laws or rates, changes in the interpretation of tax laws, or other changes beyond Varex’s control could materially and adversely affect its financial position and results of operations.
Varex’s results have been and may continue to be affected by continuing worldwide economic instability, including changes in foreign currency exchange rates and fluctuations in the price of crude oil and other commodities.
The global economy has been impacted by a number of economic and political factors. In many markets, these conditions have shrunk capital equipment budgets, slowed decision-making and made it difficult for Varex’s customers and vendors to accurately forecast and plan future business activities. This, in turn, has caused Varex’s customers to be more cautious with, and sometimes freeze, delay, or dramatically reduce purchases and capital project expenditures. Some countries have adopted and may in the future adopt austerity or stimulus programs that could positively or negatively affect Varex’s results from period to period, making it difficult for investors to compare its financial results. In addition, the recent change in the U.S. administration, and the pending withdrawal of the United Kingdom from the European Union ("EU") may also create global economic uncertainty, which may cause our customers to reduce their spending, which in turn, could adversely affect our business, financial condition, operating results, and cash flows. An uncertain economic environment may also disrupt supply or affect our service business, as customers’ constrained budgets may result in pricing pressure, extended warranty provisions, and even cancellation of service contracts.
In addition, concerns over continued economic instability could make it more difficult for Varex to collect outstanding receivables. A continued weak or deteriorating healthcare market would inevitably materially and adversely affect Varex’s business, financial conditions, and results of operations.
Because Varex’s products are generally priced in U.S. Dollars, the strengthening of the U.S. Dollar in the last several years has caused, and could continue to cause, some customers to ask for additional discounts, delay purchasing decisions, or consider moving to in-sourcing supply of such components or migrating to lower cost alternatives. Further, because Varex’s business is global and some payments may be made in local currency, fluctuations in foreign currency exchange rates can impact its results by affecting product demand, revenues and expenses, and/or the profitability in U.S. Dollars of products and services that Varex provides in foreign markets.
Changes in monetary or other policies here and abroad, including as a result of economic and/or political instability or in reaction thereto, would also likely affect foreign currency exchange rates. Furthermore, in the event that one or more European countries were to replace the Euro with another currency, Varex’s sales in these countries, or in Europe generally, would likely be materially and adversely affected until such time as stable exchange rates are established.
Additionally, fluctuations in commodities prices could materially and adversely affect Varex’s performance. Rising commodities prices will increase Varex’s costs and those of Varex’s medical OEM customers, which could in turn result in reduced demand for Varex’s products. Further, Varex’s security product revenues from oil-producing countries, in which Varex has a significant customer base, have in the past suffered as a result of volatility in oil prices and remain sensitive to fluctuations in the future.
The loss of a supplier or any inability to obtain supplies of important components could restrict Varex’s ability to manufacture products, cause delays in its ability to deliver products, or significantly increase its costs.
Varex obtains from a limited group of suppliers or from sole-source suppliers some of the components included in its products, such as wave guides for industrial linear accelerators, transistor arrays, cesium iodide coatings and specialized integrated
18
circuits for flat panel detectors, X-ray tube targets, housings, glass frames, high-voltage cable, bearings and various other components. For example, Varex’s major supplier of its amorphous silicon-based thin film transistor arrays (flat panels) used in its digital image detectors is dpiX LLC. Although Varex holds a 40% ownership interest in dpiX, Varex does not have majority voting rights and does not have the power to direct the activities of dpiX. In addition, Varian is Varex’s sole source supplier for a key component in linear accelerators used in Varex’s security and inspection products subsystems, which are specially made for Varex. While Varex entered into a Supply Agreement for this component, there can be no assurance that this component will continue to be available on reasonable terms, or at all.
If Varex loses any of these limited- or sole-source suppliers, if their operations are substantially interrupted, or if any of them fail to meet performance or quality specifications, Varex may be required to obtain and qualify one or more replacement suppliers. Such an event (i) may then also require Varex to redesign or modify its products to incorporate new parts and/or further require Varex to obtain clearance, qualification, or certification of these products, including by the FDA, or obtain other applicable regulatory approvals in other countries, or (ii) could significantly increase costs for the affected products and cause material delays in delivery of those and other related products. In addition, manufacturing capacity limitations of any of Varex’s limited- or sole-source suppliers or other inability of these suppliers to meet increasing demand could limit growth opportunities for the affected product lines and damage customer relationships. Shortage of, and greater demand for, components and subassemblies could also increase manufacturing costs if the supply/demand imbalance increases the price of the components and subassemblies. Any of these events could materially and adversely affect Varex’s business and financial results.
A shortage or change in source of, or increase in price of, raw materials could restrict Varex’s ability to manufacture products, cause delays, or significantly increase its cost of goods.
Varex relies upon the supplies of certain raw materials such as tungsten, lead, iridium, and copper for security and inspection products and copper, lead, tungsten, rhenium, molybdenum zirconium, and various high grades of steel alloy for X-ray tubes. Worldwide demand, availability, and pricing of these raw materials have been volatile, and Varex expects that availability and pricing will continue to fluctuate in the future. If supplies are restricted or become unavailable or if prices increase, this could constrain Varex’s manufacturing of affected products, reduce its profit margins, or otherwise materially and adversely affect its business.
Pursuant to the Dodd-Frank Wall Street Reform and Consumer Protection Act, the SEC has promulgated rules regarding disclosure of (1) the presence in a company’s products of certain metals known as “conflict minerals,” which are metals mined from the Democratic Republic of the Congo and adjoining countries, as well as (2) procedures regarding a manufacturer’s efforts to identify the sourcing of those minerals from this region. Varex’s complex supply chain may inhibit Varex’s ability to sufficiently verify the origins of the relevant minerals used in its products through the due diligence procedures that it implements, which may harm Varex’s reputation. In addition, Varex may encounter challenges in satisfying customers who require that all of the components of Varex products are certified as conflict-free, which could place Varex at a competitive disadvantage if it is unable to do so. Moreover, complying with these rules requires investigative efforts, which has and will continue to cause Varex to incur associated costs and could materially and adversely affect the sourcing, supply, and pricing of materials used in Varex’s products or result in process or manufacturing modifications, all of which could materially and adversely affect its results of operations.
Compliance with U.S. laws and regulations applicable to the marketing, manufacture, and distribution of Varex’s products may be costly, and failure or delays in obtaining regulatory clearances or approvals or failure to comply with applicable laws and regulations could prevent Varex from distributing its products, require Varex to recall its products, or result in significant penalties or other harm to Varex’s business.
Some of Varex’s products and those of OEMs that incorporate Varex’s products are subject to extensive and rigorous government regulation in the United States. Compliance with these laws and regulations is expensive and time-consuming, and failure to comply with these laws and regulations could materially and adversely affect Varex’s business.
Most of Varex’s products are Class I devices, with a small number of software products designated as Class II devices. Generally, Varex’s manufacturing operations for medical devices, and those of its third-party manufacturers, are required to comply with the FDA’s QSR, as well as other federal and state regulations for medical devices and radiation-emitting products. The FDA makes announced and unannounced periodic and on-going inspections of medical device manufacturers to determine compliance with QSR and, in connection with these inspections, issues reports known as Form FDA 483 reports when the FDA believes the manufacturer has failed to comply with applicable regulations and/or procedures. If observations from the FDA issued on Form FDA 483 reports are not addressed and/or corrective action is not taken in a timely manner and to the FDA’s satisfaction, the FDA may issue a Warning Letter and/or proceed directly to other forms of enforcement action. Similarly, if a Warning Letter were issued, prompt corrective action to come into compliance would be required. Failure to respond in a timely manner to Form FDA 483 observations, a Warning Letter, or any other notice of noncompliance and to promptly come into compliance could result in the FDA bringing an enforcement action, which could include the total shutdown of Varex’s production facilities, denial of importation rights to
19
the United States for products manufactured in overseas locations, adverse publicity, and criminal and civil fines. The expense and costs of any corrective actions that Varex may take, which may include product recalls, correction and removal of products from customer sites, and/or changes to its product manufacturing and quality systems, could materially and adversely impact Varex’s financial results and may also divert management resources, attention, and time. Additionally, if a Warning Letter were issued, customers could delay purchasing decisions or cancel orders, and Varex could face increased pressure from its competitors, who could use the Warning Letter against Varex in competitive sales situations, either of which could materially and adversely affect Varex’s reputation, business, and stock price.
In addition, Varex is required to timely file various reports with the FDA, including reports required by the medical device reporting regulations (“MDRs”), that require that Varex report to regulatory authorities if its devices may have caused or contributed to a death or serious injury or malfunctioned in a way that would likely cause or contribute to a death or serious injury if the malfunction were to recur. In addition, if Varex initiates a correction or removal of a device to reduce a risk to health posed by the device, Varex would be required to submit a publicly-available Correction and Removal Report to the FDA and, in many cases, similar reports to other regulatory agencies. This report could be classified by the FDA as a device recall, which could lead to increased scrutiny by the FDA, other international regulatory agencies, and Varex’s customers regarding the quality and safety of Varex’s devices. If these MDRs or correction and removal reports are not filed on a timely basis, regulators may impose sanctions, sales of Varex’s products may suffer, and Varex may be subject to product liability or regulatory enforcement actions, all of which could harm its business.
Government regulation may also cause significant delays or even prevent the marketing and full commercialization of future products or services that Varex may develop and/or may impose costly requirements on Varex’s business. Further, as Varex enters new businesses or pursues new business opportunities, Varex will become subject to additional laws, rules, and regulations, including FDA and foreign rules and regulations. Becoming familiar with and implementing the infrastructure necessary to comply with these laws, rules, and regulations is costly and time consuming. In addition, failure to comply with these laws, rules and regulations could delay the introduction of new products and could materially and adversely affect Varex’s business.
If Varex or any of its suppliers, distributors, agents, or customers fail to comply with FDA, Federal Trade Commission, or other applicable U.S. regulatory requirements or are perceived to potentially have failed to comply therewith, Varex may face:
|
•
|
adverse publicity affecting both Varex and its customers;
|
|
•
|
increased pressures from competitors;
|
|
•
|
investigations by governmental authorities;
|
|
•
|
fines, injunctions, civil penalties, and criminal prosecution;
|
|
•
|
partial suspension or total shutdown of production facilities or the imposition of operating restrictions;
|
|
•
|
increased difficulty in obtaining required clearances or approvals or losses of clearances or approvals already granted;
|
|
•
|
seizures or recalls of Varex products or those of its customers;
|
|
•
|
delays in purchasing decisions by customers or cancellation of existing orders;
|
|
•
|
the inability to sell Varex products; and,
|
|
•
|
difficulty in obtaining product liability or operating insurance at a reasonable cost, or at all.
|
Varex is also subject to federal and state laws and regulations of general applicability relating to matters such as environmental protection, safe working conditions, manufacturing practices, and other matters. Insurance coverage is not commercially available for violations of law, including the fines, penalties, or investigatory costs that Varex may incur as the consequence of regulatory violations. Consequently, Varex does not have insurance that would cover this type of liability.
Varex sells certain X-ray tube products as replacements which are subject to medical device certification and product registration laws and regulations, which vary by country, and are subject to change, and Varex may be unable to receive registration approval or renewal of existing registrations if it fails to meet regulatory approval requirements or if the process of gaining approval becomes commercially infeasible or impractical.
Varex markets and distributes certain X-ray tubes through distributors and third-party/multi-vendor service organizations that are used as equivalent replacements for specific OEM tubes. Varex is subject to medical device certification and product registration laws, which vary by country and are subject to periodic reviews and changes by regulatory authorities in those countries. For example, to sell X-ray tubes for replacement applications in China, product registrations have to be approved by the Chinese FDA or province-specific authorities. Registration requirements are subject to change, and Varex may not be able to receive registration approval or renewal of existing registrations if Varex fails to meet regulatory approval requirements or if the process of gaining approval becomes commercially infeasible or impractical. Certain of these local laws and regulations have the effect of serving as a barrier to trade and can be difficult to navigate predictably.
20
In addition, certain countries in which Varex products are sold require products to undergo re-registration if the product is altered in any significant way, and it may be determined that the separation of Varex from Varian, including Varex’s new name, will require these products to be re-registered as Varex products, even if they are physically unchanged.
These registration processes can be costly and time consuming, and customers may decide to purchase products from Varex’s competitors that do not have to be involved in a re-registration process. In addition, Varex’s inability to receive or renew product registrations may prevent Varex from marketing and/or distributing those particular products for replacement applications in the specific country.
Compliance with foreign laws and regulations applicable to the marketing, manufacture, and distribution of Varex’s products may be costly, and failure to comply may result in significant penalties and other harm to Varex’s business.
Regulatory requirements affecting Varex’s operations and sales outside the United States vary from country to country, often differing significantly from those in the United States. In general, outside the United States, some of Varex’s products are regulated as medical devices by foreign governmental agencies similar to the FDA.
For Varex to market its products internationally, Varex must obtain clearances or approvals for products and product modifications. These processes (including, for example, in the EU, the European Economic Area (“EEA”), Switzerland, China, Japan and Canada) can be time consuming, expensive and uncertain, which can delay Varex’s ability to market products in those countries. Delays in the receipt of or failure to receive regulatory approvals, the inclusion of significant limitations on the indicated uses of a product, the loss of previously obtained approvals or failure to comply with existing or future regulatory requirements could restrict or prevent Varex from doing business in a country or subject Varex to a variety of enforcement actions and civil or criminal penalties, which would materially and materially and adversely affect its business. In addition, compliance with changing regulatory schemes, such as what may occur in connection with Brexit, may add additional complexity, cost and delays in marketing or selling Varex’s products. Brexit could lead to legal uncertainty and potentially divergent national laws and regulations and, given the lack of comparable precedent, it is unclear what financial, regulatory and legal implications the withdrawal of the United Kingdom from the EU would have and how such withdrawal would affect Varex.
Within the EU/EEA, Varex must obtain, and in turn affix, a CE mark certification, which is a European marking of conformity that indicates that a product meets the essential requirements of the Medical Device Directive. Compliance with the Medical Device Directive is done through a self-certification process that is then verified by an independent certification body called a “Notified Body,” which is an organization empowered by the legislature to conduct this verification. Once the CE mark is affixed, the Notified Body will regularly audit Varex to ensure that it remains in compliance with the applicable European laws and Medical Device Directive. By affixing the CE mark to its product, Varex is certifying that its products comply with the laws and regulations required by the EU/EEA countries, thereby allowing the free movement of its products within these countries and others that accept CE mark standards. If Varex cannot support its performance claims and demonstrate compliance with the applicable European laws and the Medical Device Directive, Varex would lose its right to affix the CE mark to its products, which would prevent Varex from selling its products within the EU/EEA/Switzerland territory and in other countries that recognize the CE mark. In April 2017, the European Commission adopted two new regulations on medical devices. One MDR, which will enter into force in 2020, replaced Medical Device Directive 93/42/EEC and Active Implantable Medical Device 90/385/EEC, and the other MDR, entitled In Vitro Diagnostic Medical Devices Regulation, replaced IVD Directive 98/79/EEC and will enter into force in 2022. These new regulations impose stricter requirements for placing medical devices in the market, as well as for Notified Bodies. Varex may be subject to risks associated with additional testing, modification, certification, or amendment of its existing market authorizations, or Varex may be required to modify products already installed at its customers’ facilities to comply with the official interpretations of these revised regulations.
Varex is also subject to international laws and regulations of general applicability relating to matters such as environmental protection, safe working conditions, and manufacturing practices, as well as others. These are often comparable to, if not more stringent than, the equivalent regulations in the United States. Sales overseas are also affected by regulation of matters such as product standards, packaging, labeling, environmental and product recycling requirements, import and export restrictions, tariffs, duties, and taxes.
In addition, Varex is required to timely file various reports with international regulatory authorities similar to the reports it is required to timely file with U.S. regulatory authorities, including reports required by international adverse event reporting regulations. If these reports are not timely filed, regulators may impose sanctions, including temporarily suspending Varex’s market authorizations or CE mark, and sales of its products may suffer.
Further, as Varex enters new businesses or pursues new business opportunities internationally, or as regulatory schemes change, Varex may become subject to additional laws, rules, and regulations. Becoming familiar with and implementing the
21
infrastructure necessary to comply with these laws, rules, and regulations is costly. Additionally, in some countries, Varex relies or may rely in the future on foreign distributors and agents to assist in complying with foreign regulatory requirements, and Varex cannot be sure that they will always do so. The failure of Varex or its agents to comply with these laws, rules, and regulations could delay the introduction of new products, cause reputational harm, or result in investigations, fines, injunctions, civil penalties, criminal prosecution, or an inability to sell Varex’s products in or to import its products into certain countries, which could materially and adversely affect Varex’s business.
Existing and future healthcare reforms, including the Affordable Care Act and changes to reimbursement rates, may indirectly have a material adverse effect on Varex’s business and results of operations.
Sales of Varex’s products to OEMs in the medical sector indirectly depend on whether adequate reimbursement is available for its customers’ products from a variety of sources, such as government healthcare insurance programs, including U.S. Medicare and Medicaid programs, foreign government programs, private insurance plans, health maintenance organizations, and preferred provider organizations. Without adequate reimbursement, the demand for Varex’s customers’ products, and therefore indirectly Varex’s products, may be limited.
Healthcare reform proposals and medical cost containment measures in the United States and in many foreign countries could limit the use of both Varex’s and its customers’ products, reduce reimbursement available for such use, further tax the sale or use of Varex’s products, and further increase the administrative and financial burden of compliance. These reforms and measures, including the uncertainty in the medical community regarding their nature and effect, could have a material and adverse effect on Varex’s and its customers’ purchasing decisions regarding its products and treatments and could harm Varex’s business, results of operations, financial condition, and prospects. Varex cannot predict the specific healthcare programs and regulations that will be ultimately implemented by local, regional, and national governments globally. However, any changes that lower reimbursements for Varex’s or its customers’ products and/or procedures using these products, including, for example, existing reimbursement incentives to convert from analog to digital X-ray systems, or changes that reduce medical procedure volumes or increase cost containment pressures on Varex or others in the healthcare sector could materially and adversely affect Varex’s business and results of operations.
On March 23, 2010, President Obama signed into law the Affordable Care Act. Although the continuation of this Act is currently in question under the Trump administration, it could adversely impact the demand for Varex’s and its customers’ products and services and therefore its financial position and results of operations, possibly materially. Changes in access to diagnostic radiology or the reimbursement rates associated with diagnostic radiology as a result of the Affordable Care Act and similar state proposals would likely affect domestic demand for Varex’s and its customers’ products and services.
In general, employers and third-party payors in the United States have become increasingly cost-conscious, with higher deductibles imposed or encouraged in many medical plans. The imposition of higher deductibles tends to restrain individuals from seeking the same level of medical treatments as they might seek if the costs they bear were lower, particularly in the medical diagnostic portion of Varex’s business. Third-party payors have also increased utilization controls related to the use of its products by healthcare providers.
Furthermore, there is no uniform policy on reimbursement among third-party payors, and Varex cannot be sure that third-party payors will reimburse its customers for procedures using its products that will enable Varex to achieve or maintain adequate sales and price levels for its products. Without adequate support from third-party payors, the market for Varex’s products may be limited.
Varex is unable to predict what effect new healthcare reform proposals or ongoing uncertainty surrounding foreign, federal, and state health reform proposals will have on its customers’ purchasing decisions. However, an expansion in any government’s role in the healthcare industry may materially and adversely affect Varex’s business. In addition, it is possible that changes in administration and policy, including the repeal of all or parts of the Affordable Care Act by the U.S. Congress and Trump administration could result in additional proposals and/or changes to health care system legislation, which could have a material adverse effect on Varex’s business. The effect that a full or partial repeal of the Affordable Care Act would have on Varex's business remains unclear at this time.
Varex is subject to federal, state, and foreign laws governing its business practices which, if violated, could result in substantial penalties. Additionally, challenges to or investigations into Varex’s practices could cause adverse publicity and be costly to respond to and thus could harm its business.
Anti-corruption laws and regulations
. Varex is subject to the U.S. Foreign Corrupt Practices Act and anti-corruption laws, as well as similar laws in foreign countries, such as the U.K. Bribery Act and the Law On the Fundamentals of Health Protection in the Russian Federation. In general, there is a worldwide trend to strengthen anti-corruption laws and their enforcement, and the healthcare industry and medical equipment manufacturers have been particular targets of these investigation and enforcement efforts. Any violation of these laws by Varex or its agents or distributors could create substantial liability for Varex, subject its officers and
22
directors to personal liability, and cause a loss of reputation in the market. Transparency International’s 2015 Corruption Perceptions Index measured the degree to which public sector corruption is perceived to exist in 168 countries/territories around the world and found that two-thirds of the countries in the index, including many that Varex considers to be high-growth areas for Varex’s products, such as China and India, scored below 50 on a scale from 100 (very clean) to 0 (highly corrupt). Varex currently operates in many countries where the public sector is perceived as being more or highly corrupt. Varex’s strategic business plans include expanding its business in regions and countries that are rated as higher risk for corruption activity by Transparency International. Becoming familiar with and implementing the infrastructure necessary to comply with laws, rules, and regulations applicable to new business activities and mitigating and protecting against corruption risks could be quite costly. In addition, failure by Varex or its agents or distributors to comply with these laws, rules, and regulations could delay its expansion into high-growth markets and could materially and adversely affect its business. This notwithstanding, Varex will inevitably do more business, directly and potentially indirectly, in countries where the public sector is perceived to be more or highly corrupt and will be engaging in business in more countries perceived to be more or highly corrupt. Increased business in higher-risk countries could subject Varex and its officers and directors to increased scrutiny and increased liability from its business operations.
Competition and trade compliance laws
. Varex is subject to various competition and trade compliance laws in the jurisdictions in which it operates. Regulatory authorities under whose laws Varex operates may have enforcement powers that can subject Varex to sanctions and can impose changes or conditions in the way Varex conducts its business. In addition, an increasing number of jurisdictions also provide private rights of action for competitors or consumers to seek damages asserting claims of anti-competitive conduct. Increased government scrutiny of Varex’s actions or enforcement or private rights of action could materially and adversely affect its business or damage its reputation. In addition, Varex may conduct, or it may be required to conduct, internal investigations or face audits or investigations by one or more domestic or foreign government agencies, which could be costly and time consuming and could divert its management and key personnel from its business operations. An adverse outcome under any such investigation or audit could subject Varex to fines and/or or criminal or other penalties, which could materially and adversely affect Varex’s business and financial results. Furthermore, competition laws may prohibit or increase the cost of future acquisitions that Varex may desire to undertake.
Laws and ethical rules governing interactions with healthcare providers
. Generally, Varex does not sell its products directly to healthcare providers, although occasionally it may sell its products to healthcare providers through distributors. The U.S. Medicare and Medicaid “anti-kickback” laws, and similar state laws, prohibit payments or other remuneration that is intended to induce hospitals, physicians, or others either to refer patients or to purchase, lease, or order, or to arrange for or recommend the purchase, lease, or order of healthcare products or services for which payment may be made under federal and state healthcare programs, such as Medicare and Medicaid. These laws affect Varex’s sales, marketing, and other promotional activities by limiting the kinds of financial arrangements Varex may have with hospitals, physicians, or other potential purchasers of its products. They particularly impact how Varex structures its sales offerings, including discount practices, customer support, education and training programs, physician consulting, research grants, and other fee-for-service arrangements. These laws are broadly written, and it is often difficult to determine precisely how these laws will be applied to specific circumstances.
Federal and state “false claims” laws generally prohibit knowingly presenting, or causing to be presented, claims for payment from Medicare, Medicaid, or other government payors that are false or fraudulent, or for items or services that were not provided as claimed. Although Varex does not submit claims directly to payors, manufacturers can be, and have been, held liable under these laws if they are deemed to “cause” the submission of false or fraudulent claims by providing inaccurate billing or coding information to customers or through certain other activities, including promoting products for uses not approved or cleared by the FDA, which is called off-label promotion. Violating “anti-kickback” and “false claims” laws can result in civil and criminal penalties, which can be substantial, as well as potential mandatory or discretionary exclusion from healthcare programs for noncompliance. Even an unsuccessful challenge or investigation into Varex’s practices could cause adverse publicity and be costly to defend and thus could harm its business and results of operations. Additionally, several recently-enacted state and federal laws, including laws in Massachusetts and Vermont, and the federal Physician Payment Sunshine Act, now require, among other things, extensive tracking and maintenance of databases regarding the disclosure of equity ownership and payments to physicians, healthcare providers, and hospitals. These laws may require Varex to implement the necessary and costly infrastructure to track and report certain payments to healthcare providers. Failure to comply with these new tracking and reporting laws could subject Varex to significant civil monetary penalties.
Varex is subject to similar laws in foreign countries where it conducts business. For example, within the EU, the control of unlawful marketing activities is a matter of national law in each of the member states. The member states of the EU closely monitor perceived unlawful marketing activity by companies. Varex could face civil, criminal, and administrative sanctions if any member state determines that Varex has breached its obligations under such state’s national laws. Industry associations also closely monitor the activities of member companies. If these organizations or authorities name Varex as having breached its obligations under their
23
regulations, rules, or standards, its reputation would suffer, and its business and financial condition could be materially and adversely affected.
Warranty claims may materially and adversely affect Varex’s business.
Varex could experience an increase in warranty claims as a result of issues with product quality or product failures as a direct result of Varex’s design, manufacturing, or issues in its supply chain. Such an occurrence may damage Varex’s market reputation, cause sales to decline, or require repairs or voluntary remedial measures to enhance customer satisfaction, which could materially and adversely impact Varex’s financial results. Increased warranty claims on any given product could cause Varex to halt production on that product and could significantly impair Varex’s liquidity and profitability, as well as cause reputational harm to Varex. Because some categories of products tend to experience higher numbers of warranty claims than others, a shift in the types of products that Varex’s customers purchase could lead to an increase in warranty claims. If actual levels of warranty claims are greater than the level of claims Varex estimates, cost of sales could increase, and Varex’s financial condition could be materially and adversely affected. In addition, product quality issues could result in significant follow-on effects for Varex, including, among other things, reputational harm to Varex and its customers, loss of customers, and liability as a result of product quality issues. These outcomes would materially and adversely affect Varex’s business and financial condition.
If Varex is not able to match its manufacturing capacity with demand for its products, its financial results may suffer.
Many of Varex’s products have a long production cycle, and Varex needs to anticipate demand for its products to ensure adequate manufacturing or testing capacity. If Varex is unable to anticipate demand, and its manufacturing or testing capacity does not keep pace with product demand, Varex will not be able to fulfill orders in a timely manner, which may negatively impact its financial results and overall business. Conversely, if demand for Varex’s products decreases, the fixed costs associated with excess manufacturing capacity may harm its financial results.
Additionally, Varex’s manufacturing is primarily conducted at its Salt Lake City, Utah; Las Vegas, Nevada; and Calamba City, Philippines facilities. If any of these facilities experiences a disruption, Varex would have no other means of manufacturing the components manufactured at each respective facility until Varex is able to restore the capability at its current facilities or develop the same capability at an alternative facility.
Delivery schedules for Varex’s security, industrial, and inspection products tend to be unpredictable.
Varex designs, manufactures, sells, and services Linatron X-ray accelerators, image-processing software, and image detection products for security and inspection, such as cargo screening at ports and borders and nondestructive examination for a variety of applications, as well as industrial applications. Varex generally sells security and inspection products to OEMs who incorporate its products into their inspection systems, which are then sold to customs and other government agencies, as well as to commercial organizations in the casting, power, aerospace, chemical, petro-chemical, and automotive industries. Varex believes growth in its security and inspection products will be driven by security cargo screening and border protection needs, as well as by the needs of customs agencies to verify shipments for assessing duties and taxes. This business is heavily influenced by domestic and international government policies on border and port security, political change, and government budgets. In addition, Varex believes growth in this product line may be driven in part by industrial customers engaged in 3-D printing, which, as a developing market, may be difficult to predict. Orders for Varex’s security and inspection products have been and may continue to be unpredictable, as governmental agencies may place large orders with Varex or its OEM customers in a short time period and then may not place any orders for a long time period thereafter. Because it is difficult to predict Varex’s OEM customer delivery, the actual timing of sales and revenue recognition varies significantly. The market for border protection systems has slowed significantly, and end customers, particularly in oil-based economies and war zones in which Varex has a significant customer base, are delaying system deployments or tenders and considering moving to alternative sources, resulting in a decline in the demand for security and inspection products.
In addition, demand for Varex’s security and inspection products is heavily influenced by U.S. and foreign governmental policies on national and homeland security, border protection, and customs activities, which depend upon government budgets and appropriations that are subject to economic conditions, as well as political changes and oil prices. Varex has seen customers freeze or dramatically reduce purchases and capital project expenditures, delay projects, or act cautiously as governments around the world wrestle with spending priorities. As economic growth remains sluggish in various jurisdictions and appears to be deteriorating in others, and as concerns about levels of government employment and government debt continue, Varex expects that these effects will also continue. Furthermore, bid awards in this business may be subject to challenge by third parties, as Varex has previously encountered with a large government project. These factors make this business more unpredictable and could cause volatility in Varex’s revenues and earnings, and therefore the price of Varex’s common stock.
24
Varex’s international manufacturing operations subject it to volatility and other risks, including high security risks, which could result in harm to its employees and contractors or substantial costs.
Varex conducts certain manufacturing operations internationally in order to reduce costs and streamline its manufacturing operations. There are administrative, legal, and governmental risks to operating internationally that could increase operating expenses or hamper the development of these operations. The risks from operating internationally that could increase Varex’s operating expenses and materially and adversely affect its operating results, financial condition, and ability to deliver its products and grow its business include, among others:
|
•
|
difficulties in staffing and managing employee relations and foreign operations, particularly in attracting and retaining personnel qualified to design, sell, test, and support its products;
|
|
•
|
fluctuations in currency exchange rates;
|
|
•
|
difficulties in coordinating its operations globally and in maintaining uniform standards, controls, procedures, and policies across its operations;
|
|
•
|
difficulties in enforcing contracts and protecting intellectual property;
|
|
•
|
diversion of management attention;
|
|
•
|
imposition of burdensome governmental regulations, including changing laws and regulations with respect to collection and maintenance of personally identifiable data;
|
|
•
|
regional and country-specific political and economic instability, as discussed in greater detail below; and
|
|
•
|
inadequacy of the local infrastructure to support its operations.
|
In addition, Varex’s international locations expose it to high security risks, which could result in both harm to its employees and contractors or substantial costs. Some of its services are performed in or adjacent to high-risk locations where the country or location and surrounding area is suffering from political, social, or economic turmoil, war or civil unrest, or has a high level of criminal or terrorist activity. In those locations where Varex has employees or operations, Varex may incur substantial costs to maintain the safety of its personnel. Despite these precautions, the safety of its personnel in these locations may continue to be at risk, and Varex may in the future suffer the loss of employees and contractors, which could harm its business and operating results.
Certain of Varex’s products are subject to regulations relating to use of radioactive material, compliance with which may be costly, and a failure to comply therewith may materially and adversely affect Varex’s business.
As a manufacturer and seller of medical devices and devices emitting radiation or utilizing radioactive by-product material, Varex and some of Varex’s suppliers and distributors are subject to extensive regulation by United States governmental authorities, such as the FDA, the Nuclear Regulatory Commission (“NRC”), and state and local regulatory agencies, such as the State of California, to ensure the devices are safe and effective and comply with laws governing products which emit, produce, or control radiation. These regulations govern, among other things, the design, development, testing, manufacturing, packaging, labeling, distribution, import/export, sale, and marketing and disposal of Varex’s products. Varex is also subject to international laws and regulations that apply to manufacturers of radiation-emitting devices and products utilizing radioactive materials. These are often comparable to, if not more stringent than, the equivalent regulations in the United States.
Varex’s industrial and medical devices utilizing radioactive material are subject to NRC clearance and approval requirements, and the manufacture and sale of these products are subject to extensive federal and state regulation that varies from state to state and among regions. Varex’s manufacture, distribution, installation, service, and removal of industrial devices utilizing radioactive material or emitting radiation also requires Varex to obtain a number of licenses and certifications for these devices and materials. Service of these products must also be in accordance with a specific radioactive materials license. Obtaining licenses and certifications may be time consuming, expensive, and uncertain.
In addition, Varex is subject to a variety of environmental laws regulating its manufacturing operations and the handling, storage, transport, and disposal of hazardous substances, which impose liability for the cleanup of any contamination from these substances. In particular, the handling and disposal of radioactive materials resulting from the manufacture, use, or disposal of Varex’s products may impose significant costs and requirements. Disposal sites for the lawful disposal of materials generated by the manufacture, use, or decommissioning of Varex’s products may no longer accept these substances in the future or may accept them on unfavorable terms.
If Varex is unable to obtain required FDA clearances or approvals for a product or is unduly delayed in doing so, or the uses of that product were limited, Varex’s business could suffer.
Typically, Varex’s OEM customers are responsible for obtaining 510(k) pre-market notification clearance on their systems that integrate Varex products, the substantial majority of which are Class I devices. A small portion of Varex’s products, however, is software that is classified as a Class II device subject to 510(k) clearance. Unless an exception applies, Varex may be required by FDA
25
regulations to obtain a 510(k) pre-market notification clearance in connection with the manufacture of a new medical device or a new indication for use of, or other significant change in, an existing currently marketed medical device before it can market or sell those products in the United States. Modifications or enhancements to a product that could significantly affect its safety or effectiveness, or that would constitute a major change in the intended use of the device, technology, materials, labeling, packaging, or manufacturing process also require a new 510(k) clearance. Although manufacturers make the initial determination whether a change to a cleared device requires a new 510(k) clearance, Varex cannot assure you that the FDA will agree with its decisions not to seek additional approvals or clearances for particular modifications to its products or that Varex will be successful in obtaining new 510(k) clearances for modifications. Obtaining clearances or approvals is time consuming, expensive, and uncertain. Varex may not be able to obtain the necessary clearances or approvals or may be unduly delayed in doing so, which could harm its business. Furthermore, even if Varex is granted regulatory clearances or approvals, they may include significant limitations on the indicated uses of the product, which may limit the market for the product. If Varex is unable to obtain required FDA clearance or approval for a product or is unduly delayed in doing so, or the uses of that product were limited, Varex’s business could suffer.
Disruption of critical information systems or material breaches in the security of Varex’s products may materially and adversely affect its business and customer relations.
Information technology helps Varex operate efficiently, interface with and support its customers, maintain financial accuracy and efficiency, and produce its financial statements. There is an increasing threat of information security attacks that pose risks to companies, including Varex. Because the techniques used to obtain unauthorized access, or to sabotage systems, change frequently and generally are not recognized until launched against a target, Varex may be unable to anticipate these techniques or to implement adequate preventative measures. If Varex does not allocate and effectively manage the resources necessary to build and sustain the proper technology infrastructure, Varex could be subject to, among other things, transaction errors, processing inefficiencies, the loss of customers, business disruptions, or the loss of or damage to intellectual property through a security breach or misappropriation of intellectual property. Such security breaches could expose Varex to a risk of loss of information, litigation, and possible liability to employees, customers, and/or regulatory authorities. If Varex’s data management systems do not effectively collect, secure, store, process, and report relevant data for the operation of its business, whether due to equipment malfunction or constraints, software deficiencies, or human error, Varex’s ability to effectively plan, forecast, and execute its business plan and comply with applicable laws and regulations will be impaired, perhaps materially. Any such impairment could materially and adversely affect Varex’s financial condition, results of operations, cash flows, and the timeliness with which Varex reports its operating results internally and externally.
Moreover, Varex offers cloud-based training software. A security breach, whether of Varex’s products, of Varex’s customers’ network security and systems, or of third-party hosting services could disrupt access to Varex’s customers’ stored information and could lead to the loss of, damage to or public disclosure of Varex’s customers’ stored information, including patient health information. Such an event could have serious negative consequences, including possible patient injury, regulatory action, fines, penalties and damages, reduced demand for Varex’s solutions, an unwillingness of its customers to use its solutions, harm to its reputation and brand, and time-consuming and expensive litigation, any of which could have a material and adverse effect on Varex’s financial results.
Protecting Varex’s intellectual property can be costly, and Varex may not be able to maintain licensed rights, and, in either case, its competitive position would be harmed if Varex is not able to do so.
Varex files applications as appropriate for patents covering new products and manufacturing processes. Varex cannot be sure, however, that its current patents, the claims allowed under its current patents, or patents for technologies licensed to Varex will be sufficiently broad to protect its technology position against competitors. Issued patents owned by, or licensed to, Varex may be challenged, invalidated, or circumvented, or the rights granted under the patents may not provide Varex with competitive advantages. Varex also cannot be sure that patents will be issued from any of Varex’s pending or future patent applications. Asserting Varex’s patent rights against others in litigation or other legal proceedings is costly and diverts managerial resources. In addition, Varex may not be able to detect patent infringement by others or may lose its competitive position in the market before Varex is able to do so.
Varex also relies on a combination of copyright, trade secret, and other laws, and contractual restrictions on disclosure, copying and transferring title (including confidentiality agreements with vendors, strategic partners, co-developers, employees, consultants, and other third parties), to protect its proprietary, and other confidential rights. These protections may prove to be inadequate, since agreements may still be breached, Varex may not have adequate remedies for a breach, and its trade secrets may otherwise become known to or be independently developed by others, including as a result of misappropriation by unauthorized access to Varex’s technology systems. In the event that Varex’s proprietary or confidential information is misappropriated, its business and financial results could be materially and adversely impacted. Varex has trademarks, both registered and unregistered, that are maintained and enforced to provide customer recognition for its products in the marketplace, but unauthorized third parties may still use them. Varex also has agreements with third parties that license to Varex certain patented or proprietary technologies. In some cases, products with
26
substantial revenues may depend on these license rights. If Varex were to lose the rights to license these technologies, or its costs to license these technologies were to materially increase, its business would suffer.
Third parties may claim that Varex is infringing upon their intellectual property, and Varex could suffer significant litigation or licensing expenses or be prevented from selling its products.
There is a substantial amount of litigation over patent and other intellectual property rights in the industries in which Varex competes. Varex’s competitors, like companies in many high technology businesses, continually review other companies’ activities for possible conflicts with their own intellectual property rights. In addition, non-practicing entities may review Varex’s activities for conflicts with their patent rights. Determining whether a product infringes upon a third party’s intellectual property rights involves complex legal and factual issues, and the outcome of this type of litigation is often uncertain. Third parties may claim that Varex is infringing upon their intellectual property rights. Varex may not be aware of intellectual property rights of others that relate to its products, services, or technologies. From time to time, Varex has received notices from third parties asserting infringement, and Varex has been subject to lawsuits alleging infringement of third-party patent or other intellectual property rights. Any dispute regarding patents or other intellectual property could be costly and time consuming and could divert Varex’s management and key personnel from its business operations. Varex may not prevail in a dispute. Varex does not maintain insurance for intellectual property infringement, so costs of defense, whether or not Varex is successful in defending an infringement claim, will be borne by Varex and could be significant. If Varex is unsuccessful in defending or appealing an infringement claim, Varex may be subject to significant damages, and its combined financial position, results of operations, or cash flows could be materially and adversely affected. If actual liabilities significantly exceed its estimates regarding potential liabilities, its combined financial position, results of operations, or cash flows could be materially and adversely affected. Varex may also be subject to injunctions against development and sale of its products, the effect of which could be to materially reduce its revenues. Furthermore, a third party claiming infringement may not be willing to license its rights to Varex, and even if a third-party rights holder is willing to do so, the amounts Varex might be required to pay under the associated royalty or license agreement could be significant. As such, Varex could decide to alter its business strategy or voluntarily cease the allegedly infringing actions rather than face litigation or pay a royalty, which could materially and adversely impact its business and results of operations.
Product defects or misuse may result in material product liability or professional errors and omissions claims, litigation, investigation by regulatory authorities, or product recalls that could harm Varex’s future revenues and require it to pay material uninsured claims.
Varex’s business exposes it to potential product liability claims that are inherent in the manufacture, sale, installation, servicing, and support of components that are used in medical devices and other devices that deliver radiation. Because Varex’s products, through incorporation in OEMs’ systems, are involved in the intentional delivery of radiation to the human body and other situations where people may come into contact with radiation (for example, when Varex’s security and inspection products are being used to scan cargo or in the diagnosis of medical problems), the possibility for significant injury and/or death exists to the intended or unintended recipient of such delivery. In addition, although Varex’s products are incorporated into OEMs’ systems, and thus only perform pursuant to the design and operating systems of OEMs, Varex may also be subject to claims for property damage, personal injury, or economic loss related to or resulting from any errors or defects in its products or the installation, servicing, or support of its products. Any accident or mistreatment could subject Varex to legal costs, litigation, adverse publicity, and damage to its reputation, whether or not its products or services were a factor.
If Varex’s X-ray inspection systems fail to detect the presence of bombs, explosives, weapons, contraband, or other threats to personal safety, Varex could be subject to product and other liability claims or negative publicity, which could result in increased costs, reduced sales, and a decline in the market price of Varex’s common stock. There are many factors beyond Varex’s control that could result in the failure of its products to detect the presence of bombs, explosives, weapons, contraband, or other threats to personal safety. Examples of these factors include operator error and misuse of or malfunction of Varex equipment. The failure of Varex’s systems to detect the presence of these dangerous materials may lead to personal injury, loss of life, and extensive property damage and may result in potential claims against Varex.
Product liability actions are subject to significant uncertainty and may be expensive, time consuming, and disruptive to Varex’s operations. For these and other reasons, Varex may choose to settle product liability claims against it, regardless of their actual merit. If a product liability action were ultimately determined against Varex, it could result in adverse publicity or significant damages, including the possibility of punitive damages, and Varex’s combined financial position, results of operations, or cash flows could be materially and adversely affected.
In addition, if a product Varex designs or manufactures were defective (whether due to design, labeling or manufacturing defects, improper use of the product, or other reasons) or found to be so by a competent regulatory authority, Varex may be required to correct or recall the product and notify other regulatory authorities. The adverse publicity resulting from a correction or recall,
27
however imposed, could damage Varex’s reputation and cause customers to review and potentially terminate their relationships with Varex. A product correction or recall could consume management time and have an adverse financial impact on its business, including incurring substantial costs, losing revenues, and accruing losses under GAAP.
Varex maintains limited product liability insurance coverage. Varex’s product liability insurance policies are expensive and have high deductible amounts and self-insured retentions. Varex’s insurance coverage may also prove to be inadequate, and future policies may not be available on acceptable terms or in sufficient amounts, if at all. If a material claim is successfully brought against Varex relating to a liability that is in excess of its insurance coverage, or for which insurance coverage is denied or limited, Varex could have to pay substantial damages, which could have a material and adverse effect on its financial position and/or results of operations.
Unfavorable results of legal proceedings could materially and adversely affect Varex’s financial results.
From time to time, Varex is a party to or otherwise involved in legal proceedings, claims, government inspections or investigations, and other legal matters, both inside and outside the United States, arising in the ordinary course of its business or otherwise. Legal proceedings are often lengthy, taking place over a period of years with interim motions or judgments subject to multiple levels of review (such as appeals or rehearings) before the outcome is final. Litigation is subject to significant uncertainty and may be expensive, time consuming, and disruptive to Varex’s operations. For these and other reasons, Varex may choose to settle legal proceedings and claims, regardless of their actual merit.
If a legal proceeding were ultimately resolved against Varex, it could result in significant compensatory damages, and, in certain circumstances, punitive or treble damages, disgorgement of revenue or profits, remedial corporate measures, or injunctive relief imposed on Varex. If Varex’s existing insurance does not cover the amount or types of damages awarded, or if other resolution or actions taken as a result of such legal proceeding were to restrain its ability to market one or more of its material products or services, its combined financial position, results of operations, or cash flows could be materially and adversely affected. In addition, legal proceedings, and any adverse resolution thereof, can result in adverse publicity and damage to Varex’s reputation, which could materially and adversely impact its business.
Varex’s business may suffer if it is not able to hire and retain qualified personnel.
Varex’s future success depends, to a great degree, on its ability to retain, attract, expand, integrate, and train its management team and other key personnel, such as qualified engineering, service, sales, marketing, and other staff. Varex competes for key personnel with other medical equipment and software manufacturers and technology companies, as well as universities and research institutions. Because this competition is intense, particularly in Utah, where unemployment rates are relatively low, compensation-related costs could increase significantly if the supply of qualified personnel decreases or demand increases. If Varex is unable to hire and train qualified personnel, Varex may not be able to maintain or expand its business. Additionally, if Varex is unable to retain key personnel, Varex may not be able to replace them readily or on terms that are reasonable, which also could hurt its business.
Changes in interpretation or application of generally accepted accounting principles may materially and adversely affect Varex’s operating results.
Varex prepares its financial statements to conform to GAAP. These principles are subject to interpretation by the FASB, American Institute of Certified Public Accountants, the SEC, and various other regulatory and/or accounting bodies. A change in interpretations of, or its application of, these principles can have a significant effect on Varex’s reported results and may even affect its reporting of transactions completed before a change is announced. In addition, when Varex is required to adopt new accounting standards, Varex’s methods of accounting for certain items may change, which could cause its results of operations to fluctuate from period to period and make it more difficult to compare its financial results to prior periods.
As its operations evolve over time, Varex may introduce new products and/or new technologies that require Varex to apply different accounting principles, including ones regarding revenue recognition, than Varex has applied in past periods. The application of different types of accounting principles and related potential changes may make it more difficult to compare its financial results from quarter to quarter, and the trading price of Varex common stock could suffer or become more volatile as a result.
Environmental laws impose compliance costs on Varex’s business and may also result in liability.
Varex is subject to environmental laws around the world. These laws regulate many aspects of its operations, including its handling, storage, transport, and disposal of hazardous substances, such as the chemicals and materials that Varex uses in the course of its manufacturing operations. They can also impose cleanup liabilities, including with respect to discontinued operations. As a consequence, Varex can incur significant environmental costs and liabilities, some recurring and others not recurring. Although its follows procedures intended to comply with existing environmental laws, Varex, like other businesses, may mishandle or inadequately
28
manage hazardous substances used in its manufacturing operations and can never completely eliminate the risk of contamination or injury from certain materials that it uses in its business and, therefore, it cannot completely eliminate the prospect of resulting claims and damage payments. Varex may also be assessed fines and/or other penalties for failure to comply with environmental laws and regulations. Insurance has provided coverage for portions of cleanup costs resulting from historical occurrences, but Varex does not expect to maintain insurance coverage for costs or claims that might result from any future contamination.
Future changes in environmental laws could also increase its costs of doing business, perhaps significantly. Several countries, including some in the EU, now require medical equipment manufacturers to bear certain disposal costs of products at the end of the product’s useful life, increasing its costs. The EU has also adopted directives that may lead to restrictions on the use of certain hazardous substances or other regulated substances in some of its products sold there. These directives, along with another that requires substance information to be provided upon request, could increase Varex’s operating costs in order to maintain its access to certain markets. All of these costs, and any future violations or liabilities under environmental laws or regulations, could have a material adverse effect on its business.
Varex’s operations are vulnerable to interruption or loss due to natural or other disasters, power loss, strikes, and other events beyond its control.
Varex conducts some of its activities, including manufacturing, research and development, administration, and data processing at facilities located in areas that have in the past experienced or may in the future experience natural disasters. Varex’s insurance coverage for such disasters may not be adequate or continue to be available at commercially-reasonable terms, or at all. A major disaster (such as a major fire, hurricane, earthquake, flood, tsunami, volcanic eruption or terrorist attack) affecting Varex’s facilities, or those of its suppliers, could significantly disrupt its operations and delay or prevent product manufacture and shipment during the time required to repair, rebuild, or replace its or its suppliers’ damaged manufacturing facilities. These delays could be lengthy and costly. If any of Varex’s customers’ facilities are adversely affected by a disaster, shipments of its products could be delayed. Additionally, customers may delay purchases of Varex’s products until its operations return to normal. For example, following the earthquake and tsunami disasters in Japan in 2011, the operations of Toshiba Medical, our largest customer, were impacted, and, as a consequence, orders to and product shipment from our business were delayed for several months. Even if Varex is able to quickly respond to a disaster, the ongoing effects of the disaster could create some uncertainty in the operations of its business. In addition, Varex’s facilities may be subject to a shortage of available electrical power and other energy supplies. Any shortages may increase its costs for power and energy supplies or could result in blackouts, which could disrupt the operations of its affected facilities and harm its business. Further, Varex’s products are typically shipped from a limited number of ports, and any disaster, strike, or other event blocking shipment from these ports could delay or prevent shipments and harm its business. In addition, concerns about terrorism, the effects of a terrorist attack, political turmoil, or an outbreak of epidemic diseases could have a negative effect on Varex’s business operations, those of its suppliers and customers, and the ability to travel, resulting in adverse consequences on its revenues and financial performance.
Varex is an “emerging growth company,” and, as a result of the reduced disclosure and governance requirements applicable to emerging growth companies, its common stock may be less attractive to investors.
Varex is an “emerging growth company,” as defined in the JOBS Act, and it intends to take advantage of some of the exemptions from the reporting requirements that are afforded to emerging growth companies, including, but not limited to, scaled disclosure requirements relating to financial statements and executive compensation, not being required to comply with the auditor attestation requirements of Section 404 of the Sarbanes-Oxley Act, and exemptions from the requirements of holding a nonbinding advisory vote on executive compensation and stockholder approval of any golden parachute payments not previously approved. Varex cannot predict if investors will find its common stock less attractive because it intends to rely on these exemptions. If some investors find its common stock less attractive as a result, there may be a less active trading market for its common stock, and its stock price may become more volatile. Varex may take advantage of these exemptions until it is no longer an emerging growth company.
Certain provisions in Varex’s Amended and Restated Certificate of Incorporation and Bylaws, and of Delaware law, may prevent or delay an acquisition of Varex, which could decrease the trading price of Varex’s common stock.
Varex’s Amended and Restated Certificate of Incorporation and Amended and Restated Bylaws contain, and Delaware law contains, provisions that are intended to deter coercive takeover practices and inadequate takeover bids by making such practices or bids unacceptably expensive to the bidder and to encourage prospective acquirers to negotiate with Varex’s board of directors rather than to attempt a hostile takeover. These provisions include, among others:
|
•
|
the inability of Varex’s stockholders to call a special meeting;
|
|
•
|
the inability of Varex’s stockholders to act without a meeting of stockholders;
|
|
•
|
rules regarding how stockholders may present proposals or nominate directors for election at stockholder meetings;
|
|
•
|
the right of Varex’s board of directors to issue preferred stock without stockholder approval;
|
29
|
•
|
the division of Varex’s board of directors into three classes of directors, with each class serving a staggered three-year term, and this classified board provision could have the effect of making the replacement of incumbent directors more time-consuming and difficult, until the 2022 annual meeting of stockholders, after which directors will be elected annually;
|
|
•
|
a provision that stockholders may only remove directors with cause while the board is classified;
|
|
•
|
the ability of Varex’s directors, and not stockholders, to fill vacancies on Varex’s board of directors; and,
|
|
•
|
the requirement that the affirmative vote of stockholders holding at least 66 2/3% of Varex’s voting stock is required to amend certain provisions in Varex’s amended and restated certificate of incorporation (relating to the term and removal of its directors, the filling of its board vacancies, the calling of special meetings of stockholders, stockholder action by written consent, the elimination of liability of directors to the extent permitted by Delaware law and indemnification of directors and officers); provided, however, that the provisions of the amended and restated certificate of incorporation relating to the 66 2/3% voting threshold will be of no force and effect effective as of the completion of the 2021 annual meeting of stockholders, and the amended and restated certificate of incorporation may thereafter be amended by the affirmative vote of the holders of at least a majority of the outstanding voting stock.
|
In addition, because Varex did not elect to be exempt from Section 203 of the Delaware General Corporation Law (the “DGCL”), this provision could also delay or prevent a change of control that stockholders may favor. Section 203 provides that, subject to limited exceptions, persons that acquire, or who are affiliated with a person that acquires, more than 15% of the outstanding voting stock of a Delaware corporation (an “interested stockholder”) shall not engage in any business combination with that corporation, including by merger, consolidation, or acquisitions of additional shares, for a three-year period following the date on which the person became an interested stockholder, unless: (i) prior to such time, the board of directors of such corporation approved either the business combination or the transaction that resulted in the stockholder becoming an interested stockholder; (ii) upon consummation of the transaction that resulted in the stockholder becoming an interested stockholder, the interested stockholder owned at least 85% of the voting stock of such corporation at the time the transaction commenced (excluding for purposes of determining the voting stock outstanding (but not the outstanding voting stock owned by the interested stockholder) the voting stock owned by directors who are also officers or held in employee benefit plans in which the employees do not have a confidential right to tender or vote stock held by the plan); or, (iii) on or subsequent to such time the business combination is approved by the board of directors of such corporation and authorized at a meeting of stockholders by the affirmative vote of at least two-thirds of the outstanding voting stock of such corporation not owned by the interested stockholder.
Varex believes these provisions will protect its stockholders from coercive or otherwise unfair takeover tactics by requiring potential acquirers to negotiate with Varex’s board of directors and by providing Varex’s board of directors with more time to assess any acquisition proposal. These provisions are not intended to make Varex immune from takeovers. However, these provisions will apply even if the offer may be considered beneficial by some stockholders and could delay or prevent an acquisition that Varex’s board of directors determines is not in the best interests of Varex and Varex’s stockholders. These provisions may also prevent or discourage attempts to remove and replace incumbent directors.
In addition, an acquisition or further issuance of Varex’s stock could trigger the application of Section 355(e) of the Internal Revenue Code of 1986, causing the distribution to be taxable to Varian. Under the Tax Matters Agreement, Varex would be required to indemnify Varian for the resulting tax, and this indemnity obligation might discourage, delay, or prevent a change of control that Varex stockholders may consider favorable.
Varex’s Amended and Restated Certificate of Incorporation contains an exclusive forum provision that may discourage lawsuits against Varex and Varex’s directors and officers.
Varex’s Amended and Restated Certificate of Incorporation provides that unless the board of directors otherwise determines, the state courts in the State of Delaware or, if no state court located within the State of Delaware has jurisdiction, the federal court for the District of Delaware, will be the sole and exclusive forum for any derivative action or proceeding brought on behalf of Varex, any action asserting a claim of breach of a fiduciary duty owed by any director or officer of Varex to Varex or Varex’s stockholders, any action asserting a claim against Varex or any director or officer of Varex arising pursuant to any provision of the DGCL or Varex’s amended and restated certificate of incorporation or bylaws, or any action asserting a claim against Varex or any director or officer of Varex governed by the internal affairs doctrine. This exclusive forum provision may limit the ability of Varex’s stockholders to bring a claim in a judicial forum that such stockholders find favorable for disputes with Varex or Varex’s directors or officers, which may discourage such lawsuits against Varex and Varex’s directors and officers. Alternatively, if a court outside of Delaware were to find this exclusive forum provision inapplicable to, or unenforceable in respect of, one or more of the specified types of actions or proceedings described above, Varex may incur additional costs associated with resolving such matters in other jurisdictions, which could materially and adversely affect Varex’s business, financial condition or results of operations.
30
Prior to its separation from Varian, Varex had no history of operating as an independent company, and its historical financial information is not necessarily representative of the results that it would have achieved as a separate, publicly-traded company and may not be a reliable indicator of its future results.
The historical information about Varex in this Annual Report prior to January 28, 2017 refers to Varex’s business as operated by and integrated with Varian. Varex’s historical financial information prior to January 28, 2017 included in this Annual Report is derived from the consolidated financial statements and accounting records of Varian. Accordingly, this historical financial information does not necessarily reflect the financial condition, results of operations, or cash flows that Varex would have achieved as a separate, publicly-traded company during the periods presented or that which Varex will achieve in the future, primarily as a result of the factors described below:
|
•
|
Prior to the separation, Varex’s business was operated by Varian as part of its broader corporate organization, rather than as an independent company. Varian or one of its affiliates performed various corporate functions for Varex such as accounting, legal, human resources, information technology, treasury, tax, facilities, research and development, insurance, and other corporate and infrastructure services. Varex’s historical financial results reflect allocations of corporate expenses from Varian for such functions and are likely to be less than the expenses Varex would have incurred had it operated as a separate publicly-traded company. Following the separation, Varex’s costs related to such functions previously performed by Varian may therefore increase.
|
|
•
|
Prior to the separation, Varex’s business was integrated with the other businesses of Varian. Historically, Varex has shared economies of scope and scale in costs, employees, vendor relationships, and customer relationships. Although Varex entered into a Transition Services Agreement with Varian, the arrangements provided by such agreement may not fully capture the benefits that Varex enjoyed when integrated with Varian and may result in Varex paying higher charges than in the past for these services. This could have a material and adverse effect on Varex’s results of operations and financial condition.
|
|
•
|
Generally, Varex’s working capital requirements and capital for its general corporate purposes, including acquisitions and capital expenditures, have historically been satisfied as part of the corporate-wide cash management policies of Varian. Following the separation, Varex may need to obtain additional financing from banks, through public offerings or private placements of debt or equity securities, strategic relationships or other arrangements, which may or may not be available and may be more costly.
|
|
•
|
The cost of capital for Varex’s business is expected to be higher than Varian’s cost of capital prior to the separation.
|
Other significant changes are likely to occur in Varex’s cost structure, management, financing, and business operations as a result of operating as a company separate from Varian, including as a result of additional costs incurred by Varex as a result of the separation.
Potential indemnification liabilities to Varian pursuant to the Separation and Distribution Agreement could materially and adversely affect Varex’s business, financial condition, results of operations, and cash flows.
The Separation and Distribution Agreement provides for, among other things, indemnification obligations designed to make Varex financially responsible for: any Varex liabilities; the failure of Varex to pay, perform, or otherwise promptly discharge any Varex liabilities or contracts in accordance with their respective terms; any guarantee, indemnification obligation, surety bond or other credit support agreement, arrangement, commitment, or understanding by Varian for the benefit of Varex, unless related to Varian liabilities; any breach by Varex of the Separation and Distribution Agreement or any of the ancillary agreements; any action by Varex in contravention of its Amended and Restated Certificate of Incorporation or Amended and Restated Bylaws; and, any untrue statement or alleged untrue statement of a material fact or omission or alleged omission to state a material fact required to be stated therein or necessary to make the statements therein not misleading, with respect to all information contained in the Registration Statement on Form 10 (as amended or supplemented) or any other disclosure document that describes the separation, the distribution, Varex and its subsidiaries, or the transactions contemplated by the Separation and Distribution Agreement, subject to certain exceptions. If Varex is required to indemnify Varian under the circumstances set forth in the Separation and Distribution Agreement, Varex may be subject to substantial liabilities.
In connection with Varex’s separation from Varian, Varian has agreed to indemnify Varex for certain liabilities. However, there can be no assurance that the indemnity will be sufficient to insure Varex against the full amount of such liabilities or that Varian’s ability to satisfy its indemnification obligation will not be impaired in the future.
Pursuant to the Separation and Distribution Agreement and certain other agreements with Varian, Varian agreed to indemnify Varex for certain liabilities. However, third parties could also seek to hold Varex responsible for any of the liabilities that Varian retained, and there can be no assurance that the indemnity from Varian will be sufficient to protect Varex against the full amount of such liabilities or that Varian will be able to fully satisfy its indemnification obligations. In addition, Varian’s insurers may attempt to deny coverage to Varex for liabilities associated with certain occurrences of indemnified liabilities prior to the separation. Moreover, even if Varex ultimately succeeds in recovering from Varian or such insurance providers any amounts for which Varex is held liable,
31
Varex may be temporarily required to bear these losses. Each of these risks could negatively affect Varex’s business, financial position, results of operations, and/or cash flows.
If the distribution, together with certain related transactions, does not qualify as a transaction that is generally tax-free for U.S. federal income tax purposes, Varian, Varex, and Varian stockholders could be subject to significant tax liabilities, and, in certain circumstances, Varex could be required to indemnify Varian for material taxes and other related amounts pursuant to indemnification obligations under the Tax Matters Agreement.
It was a condition to the distribution that Varian receive an opinion of counsel, satisfactory to the Varian board of directors, regarding the qualification of the distribution, together with certain related transactions, as a transaction that is generally tax-free for U.S. federal income tax purposes under Sections 355 and 368(a)(1)(D) of the Code. The opinion of counsel was based upon and relied on, among other things, certain facts and assumptions, as well as certain representations, statements, and undertakings of Varian and Varex, including those relating to the past and future conduct of Varian and Varex. If any of these representations, statements, or undertakings are, or become, inaccurate or incomplete, or if Varian or Varex breaches any of its covenants in the separation documents, the opinion of counsel may be held to be invalid, and the conclusions reached therein could be jeopardized. Notwithstanding the opinion of counsel, the Internal Revenue Service (the “IRS”) could determine that the distribution, together with certain related transactions, should be treated as a taxable transaction if it determines that any of the facts, assumptions, representations, statements, or undertakings upon which the opinion of counsel was based are false or have been violated or if it disagrees with the conclusions in the opinion of counsel. The opinion of counsel is not binding on the IRS, and there can be no assurance that the IRS will not assert a contrary position.
If the distribution, together with certain related transactions, fails to qualify as a transaction that is generally tax-free for U.S. federal income tax purposes under Sections 355 and 368(a)(1)(D) of the Code, Varian would recognize taxable gain as if it had sold the Varex common stock in a taxable sale for its fair market value, and Varian stockholders who received Varex shares in the distribution would be subject to tax as if they had received a taxable distribution equal to the fair market value of such shares.
Under the Tax Matters Agreement entered into by Varian and Varex in connection with the separation, Varex is generally required to indemnify Varian for any taxes resulting from the separation (and any related costs and other damages) to the extent such amounts resulted from (i) an acquisition of all or a portion of the equity securities or assets of Varex, whether by merger or otherwise (and regardless of whether Varex participated in or otherwise facilitated the acquisition), (ii) other actions or failures to act by Varex, or (iii) should any of the representations or undertaking of Varex contained in any of the separation-related agreements or in the documents relating to the opinion of counsel be incorrect or violated. Any such indemnity obligations could be material.
Varex may not be able to engage in certain desirable strategic or capital-raising transactions following the separation.
Under current law, a spin-off can be rendered taxable to the parent corporation and its stockholders as a result of certain post-spin-off acquisitions of shares or assets of the spun-off corporation. For example, a spin-off may result in taxable gain to the parent corporation under Section 355(e) of the Code if the spin-off were later deemed to be part of a plan (or series of related transactions) pursuant to which one or more persons acquire, directly or indirectly, shares representing a 50% or greater interest (by vote or value) in the spun-off corporation. To preserve the tax-free treatment of the separation and the distribution, and in addition to Varex’s indemnity obligations described above, the Tax Matters Agreement restricts Varex, for the two-year period following the separation, except in specific circumstances, from: (i) entering into any transaction pursuant to which all or a portion of the shares of Varex common stock would be acquired, whether by merger or otherwise; (ii) issuing equity securities beyond certain thresholds; (iii) repurchasing shares of Varex common stock other than in certain open-market transactions; and, (iv) ceasing to actively conduct certain of its businesses. The Tax Matters Agreement also prohibits Varex from taking or failing to take any other action that would prevent the distribution and certain related transactions from qualifying as a transaction that is generally tax-free for U.S. federal income tax purposes under Sections 355 and 368(a)(1)(D) of the Code. These restrictions may limit Varex’s ability to pursue certain strategic transactions, equity issuances or repurchases, or other transactions that it may believe to be in the best interests of its stockholders or that might increase the value of its business.
As a result of the distribution, certain members of management and directors hold stock in both Varian and Varex, and as a result may face actual or potential conflicts of interest.
After the distribution, certain of the management and directors of each of Varian and Varex own both Varian common stock and Varex common stock. This ownership overlap could create, or appear to create, potential conflicts of interest when Varex management and directors and Varian’s management and directors face decisions that could have different implications for Varex and Varian. For example, potential conflicts of interest could arise in connection with the resolution of any dispute between Varex and Varian regarding the terms of the agreements governing the distribution and Varex’s relationship with Varian thereafter. These agreements include the Separation and Distribution Agreement, the Tax Matters Agreement, the Employee Matters Agreement, the
32
Transition Services Agreement, the Intellectual Property Matters Agreement, the Trademark License Agreement, and one or more Supply/Distribution Agreements. Potential conflicts of interest may also arise out of any commercial arrangements that Varex or Varian may enter into in the future.
Varex may not achieve some or all of the expected benefits of the separation, and the separation may materially and adversely affect Varex’s business.
Varex may not be able to achieve the full strategic and financial benefits expected to result from the separation, or such benefits may be delayed or not occur at all. The separation and distribution is expected to provide the following benefits, among others:
|
•
|
more effective pursuit of each company’s distinct operating priorities and strategies;
|
|
•
|
more efficient allocation of capital for both Varian and Varex;
|
|
•
|
direct access by Varex to the capital markets;
|
|
•
|
facilitation of incentive compensation arrangements for employees more directly tied to the performance of the relevant company’s business, and potential enhancement of employee hiring and retention by, among other things, improving the alignment of management and employee incentives with performance and growth objectives, while at the same time creating an independent equity structure that will facilitate Varex’s ability to effect future acquisitions utilizing Varex common stock; and
|
|
•
|
a distinct investment identity of Varex, allowing investors to evaluate the merits, performance, and future prospects of Varex separately from Varian.
|
Varex may not achieve these and other anticipated benefits for a variety of reasons, including, among others: (i) following the separation, Varex may be more susceptible to market fluctuations and other adverse events than if it were still a part of Varian; and, (ii) following the separation, Varex’s business is less diversified and has less scale than Varian’s business prior to the separation. If Varex fails to achieve some or all of the benefits expected to result from the separation, or if such benefits are delayed, the business, operating results, and financial condition of Varex could be materially and adversely affected.
Varex or Varian may fail to perform under various transaction agreements that have been executed as part of the separation, or Varex may fail to have necessary systems and services in place when certain of the transaction agreements expire.
In connection with the separation, Varex and Varian entered into a Separation and Distribution Agreement, as well as various other agreements, including a Transition Services Agreement, an Intellectual Property Matters Agreement, a Tax Matters Agreement, one or more Supply/Distribution Agreements, a Trademark License Agreement, and an Employee Matters Agreement. The Separation and Distribution Agreement, the Tax Matters Agreement, the Employee Matters Agreement, and the Intellectual Property Matters Agreement determine the allocation of assets and liabilities between the companies following the separation for those respective areas and include any necessary indemnifications related to liabilities and obligations. The Transition Services Agreement provides for the performance of certain services by each company for the benefit of the other for a limited period of time after the separation, and the Supply/Distribution Agreements provide for the provision of products and services by each company and for the benefit of the other. Varex will rely on Varian to satisfy its performance and payment obligations under these agreements. If Varian is unable to satisfy its obligations under these agreements, including its indemnification obligations, Varex could incur operational difficulties or losses. If Varex does not have in place its own systems and services, or if Varex does not have agreements with other providers of these services once certain transaction agreements expire, Varex may not be able to operate its business effectively, and its profitability may decline.
Potential liabilities may arise due to fraudulent transfer considerations, which could materially and adversely affect Varex’s financial condition and its results of operations.
In connection with the separation and distribution, Varian has undertaken several corporate restructuring transactions, which, along with the separation and distribution, may be subject to federal and state fraudulent conveyance and transfer laws. If, under these laws, a court were to determine that, at the time of the separation and distribution, any entity involved in these restructuring transactions or the separation and distribution:
|
•
|
was insolvent;
|
|
•
|
was rendered insolvent by reason of the separation and distribution;
|
|
•
|
had remaining assets constituting unreasonably small capital; or,
|
|
•
|
intended to incur, or believed it would incur, debts beyond its ability to pay these debts as they matured,
|
then the court could void the separation and distribution, in whole or in part, as a fraudulent conveyance or transfer. The court could then require Varex’s stockholders to return to Varian some or all of the shares of Varex common stock issued in the distribution or require Varian or Varex, as the case may be, to fund liabilities of the other company for the benefit of creditors. The measure of insolvency will vary depending upon the jurisdiction whose law is being applied. Generally, however, an entity would be considered
33
insolvent if the fair value of its assets was less than the amount of its liabilities or if it incurred debt beyond its ability to repay the debt as it matures.
Fulfilling obligations incidental to being a public company, including with respect to the requirements of and related rules under the Sarbanes-Oxley Act of 2002, will place significant demands on Varex’s management, administrative, and operational resources, including accounting and information technology resources.
As a public company, Varex is subject to the reporting requirements of the Securities Exchange Act of 1934, as amended (the “Exchange Act”), the Sarbanes-Oxley Act, and the Dodd-Frank Act and is required to prepare its financial statements according to the rules and regulations required by the SEC. In addition, the Exchange Act requires that Varex file annual, quarterly, and current reports. Varex’s failure to prepare and disclose this information in a timely manner or to otherwise comply with applicable law could subject it to penalties under federal securities laws, expose it to lawsuits and restrict its ability to access financing.
In addition, the Sarbanes-Oxley Act requires that Varex, among other things, establish and maintain effective internal controls and procedures for financial reporting and disclosure purposes. Internal control over financial reporting is complex and may be revised over time to adapt to changes in Varex’s business or changes in applicable accounting rules. Varex cannot assure that its internal control over financial reporting will be effective in the future or that a material weakness will not be discovered with respect to a prior period for which it had previously believed that internal controls were effective.
Matters impacting Varex’s internal controls may cause Varex to be unable to report its financial information on a timely basis or may cause Varex to restate previously-issued financial information, thereby subjecting Varex to adverse regulatory consequences, including sanctions or investigations by the SEC or in respect of violations of applicable stock exchange listing rules. There could also be a negative reaction in the financial markets due to a loss of investor confidence in Varex and the reliability of its financial statements. In addition, by virtue of its smaller size, Varex will be subject to a lower materiality threshold than Varian.
For as long as Varex is an emerging growth company under the recently enacted JOBS Act, its independent registered public accounting firm will not be required to attest to the effectiveness of Varex’s internal control over financial reporting pursuant to Section 404(b). An independent assessment of the effectiveness of Varex’s internal controls could detect problems that Varex’s management’s assessment might not. Undetected material weaknesses in Varex’s internal controls could lead to financial statement restatements and require Varex to incur the expense of remediation.
None.
Our business is primarily located in Salt Lake City, Utah, where we own approximately 37 acres of land and approximately 494,000 square feet of space used for manufacturing, administrative functions and research and development, for both our Medical and Industrial segments. We also own or lease 34 other facilities throughout North America, Europe and Asia that comprise over 2 million square feet of manufacturing facilities, warehouses, sales and service, research and development and office space located in 7 states and 16 foreign countries.
In addition to our location in Salt Lake City, Utah, primary owned facilities include approximately 5 acres of land in Las Vegas, Nevada and approximately 61,000 square feet in Franklin Park, Illinois, both which are used for manufacturing and administrative functions for our Industrial segment.
Primary leased facilities include approximately 111,000 square feet in Laguna, Philippines, approximately 73,000 square feet in Santa Clara, California, approximately 46,000 square feet in Wuxi, China, approximately 47,000 square feet in Dinxperlo, the Netherlands, approximately 34,000 square feet in Bremen, Germany and approximately 33,000 of square feet in Walluf, Germany, all of which are used for manufacturing and administrative functions for our Medical and Industrial segments.
From time to time, we are involved in legal proceedings arising in the ordinary course of business or otherwise. We do not believe that any material liability will be imposed as a result of these matters. If actual liabilities significantly exceed the estimates
34
made, our combined financial position, results of operations, comprehensive earnings or cash flows could be materially and adversely affected. Legal expenses relating to legal matters are expensed as incurred.
Not applicable.
We became an independent publicly-traded company after separating from Varian on January 28, 2017. Varex's common stock is traded on the NASDAQ Global Select Market (the "NASDAQ") under the symbol “VREX.” The following table sets forth the high and low closing sales prices for Varex common stock as reported in the consolidated transaction reporting system for the NASDAQ in fiscal year 2017.
|
Fiscal Year 2017
|
High
|
Low
|
||||||
|
First Quarter
|
$
|
—
|
|
$
|
—
|
|
||
|
Second Quarter (beginning January 30, 2017)
|
$
|
35.14
|
|
$
|
27.27
|
|
||
|
Third Quarter
|
$
|
36.04
|
|
$
|
32.77
|
|
||
|
Fourth Quarter
|
$
|
34.18
|
|
$
|
28.25
|
|
||
Since our inception, we have not paid any cash dividends and have no current plan to pay cash dividends on Varex common stock. As of
September 29, 2017
, there were 1,911 holders of record of Varex common stock.
35
This graph shows the total return on VREX common stock with comparative total returns for the Russell 2000 Index ("RUT") and the Dow Jones Medical Equipment Index ("DJUSAM").
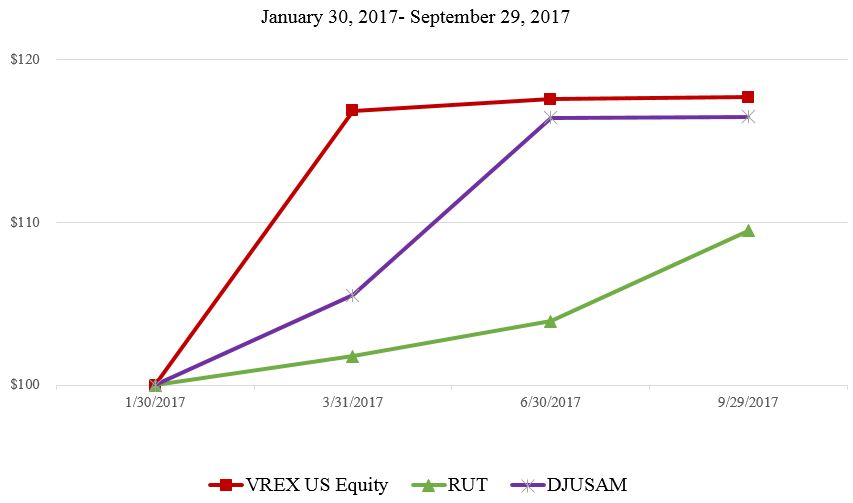
On January 28, 2017, we separated from Varian. Prior to the date of separation, the financial statements were prepared on a stand-alone basis and derived from Varian’s consolidated financial statements as we operated as part of Varian.
The following data, insofar as it relates to each of the fiscal years from 2013 through 2017, has been derived from annual financial statements, including the consolidated balance sheets at September 29, 2017 and September 30, 2016 and the related consolidated statements of earnings, of comprehensive earnings, and of cash flows for the fiscal years in the period ended September 29, 2017 and notes thereto appearing elsewhere herein. In addition, the following financial data should be read in conjunction with our consolidated financial statements and the accompanying notes and the MD&A included elsewhere herein.
36
|
Summary of Operations:
|
Fiscal Years
|
||||||||||||||||||
|
(In millions, except per share amounts)
|
2017
(1)
|
2016
|
2015
|
2014
|
2013
|
||||||||||||||
|
Revenues
|
$
|
698.1
|
|
$
|
620.1
|
|
$
|
632.3
|
|
$
|
685.2
|
|
$
|
669.8
|
|
||||
|
Gross margin
|
$
|
253.5
|
|
$
|
248.4
|
|
$
|
250.6
|
|
$
|
278.6
|
|
$
|
268.1
|
|
||||
|
Earnings before taxes
|
74.8
|
|
105.0
|
|
127.6
|
|
174.2
|
|
171.3
|
|
|||||||||
|
Taxes on earnings
|
22.8
|
|
36.0
|
|
46.8
|
|
64.1
|
|
61.7
|
|
|||||||||
|
Net earnings
|
52.0
|
|
69.0
|
|
80.8
|
|
110.1
|
|
109.6
|
|
|||||||||
|
Less: Net earnings attributable to noncontrolling interests
|
0.4
|
|
0.5
|
|
0.8
|
|
—
|
|
—
|
|
|||||||||
|
Net earnings attributable to Varex
|
$
|
51.6
|
|
$
|
68.5
|
|
$
|
80.0
|
|
$
|
110.1
|
|
$
|
109.6
|
|
||||
|
Net earnings per share attributable to Varex
|
|||||||||||||||||||
|
Net earnings per share - basic
|
$
|
1.37
|
|
$
|
1.83
|
|
$
|
2.14
|
|
$
|
2.94
|
|
$
|
2.93
|
|
||||
|
Net earnings per share - diluted
|
$
|
1.36
|
|
$
|
1.82
|
|
$
|
2.12
|
|
$
|
2.92
|
|
$
|
2.91
|
|
||||
|
Financial Position at Fiscal Year End:
|
|||||||||||||||||||
|
Working capital
|
$
|
343.5
|
|
$
|
282.1
|
|
$
|
237.5
|
|
$
|
201.8
|
|
$
|
195.3
|
|
||||
|
Total assets
|
1,040.1
|
|
622.4
|
|
583.6
|
|
433.1
|
|
399.8
|
|
|||||||||
|
Total debt (including current maturities)
|
483.9
|
|
—
|
|
—
|
|
—
|
|
—
|
|
|||||||||
|
(1) The summary of operations for fiscal year 2017 includes operating results from the Acquired Detector Business for the period from May 1, 2017 through September 29, 2017.
|
|||||||||||||||||||
Selected Quarterly Financial Data (Unaudited)
The following table sets forth selected financial data from our unaudited quarterly consolidated statements of earnings for the eight quarters ended fiscal year 2017. The information for each quarter has been derived from unaudited financial statements and in the opinion of management, include all adjustments, consisting only of normal recurring adjustments, necessary for a fair statement of the results for the unaudited interim periods and includes certain reclassifications and rounding differences. The quarterly data should be read together with our consolidated financial statements and related notes appearing elsewhere in this annual report.
On January 28, 2017, Varian completed its separation and distribution of Varex. In connection with the distribution, Varex became an independent publicly-traded company and is listed on The NASDAQ Global Select Market under the ticker “VREX” with 37.4 million shares of common stock distributed to Varian shareholders.
|
Fiscal Year 2017
|
|||||||||||||||||||
|
(In millions, except per share amounts, unaudited)
|
First Quarter
|
Second Quarter
|
Third Quarter
|
Fourth Quarter
|
Total Year
|
||||||||||||||
|
Total revenues
|
$
|
157.4
|
|
$
|
154.8
|
|
$
|
170.1
|
|
$
|
215.7
|
|
$
|
698.1
|
|
||||
|
Gross Margin
|
$
|
58.8
|
|
$
|
57.6
|
|
$
|
59.5
|
|
$
|
77.8
|
|
$
|
253.5
|
|
||||
|
Net earnings
|
$
|
11.2
|
|
$
|
15.0
|
|
$
|
10.7
|
|
$
|
15.1
|
|
$
|
52.0
|
|
||||
|
Net earnings attributable to Varex
|
$
|
11.1
|
|
$
|
15.0
|
|
$
|
10.6
|
|
$
|
15.0
|
|
$
|
51.6
|
|
||||
|
Net earnings per share - basic
|
$
|
0.30
|
|
$
|
0.40
|
|
$
|
0.28
|
|
$
|
0.40
|
|
$
|
1.37
|
|
||||
|
Net earnings per share - diluted
|
$
|
0.29
|
|
$
|
0.40
|
|
$
|
0.28
|
|
$
|
0.39
|
|
$
|
1.36
|
|
||||
|
Fiscal Year 2016
|
|||||||||||||||||||
|
(In millions, except per share amounts, unaudited)
|
First Quarter
|
Second Quarter
|
Third Quarter
|
Fourth Quarter
|
Total Year
|
||||||||||||||
|
Total revenues
|
$
|
146.8
|
|
$
|
149.8
|
|
$
|
151.4
|
|
$
|
172.1
|
|
$
|
620.1
|
|
||||
|
Gross Margin
|
$
|
57.1
|
|
$
|
59.1
|
|
$
|
63.0
|
|
$
|
69.2
|
|
$
|
248.4
|
|
||||
|
Net earnings
|
$
|
14.2
|
|
$
|
14.8
|
|
$
|
17.8
|
|
$
|
22.1
|
|
$
|
371.7
|
|
||||
|
Net earnings attributable to Varex
|
$
|
14.1
|
|
$
|
14.7
|
|
$
|
17.6
|
|
$
|
21.9
|
|
$
|
68.5
|
|
||||
|
Net earnings per share - basic
|
$
|
0.38
|
|
$
|
0.39
|
|
$
|
0.47
|
|
$
|
0.59
|
|
$
|
1.83
|
|
||||
|
Net earnings per share - diluted
|
$
|
0.37
|
|
$
|
0.39
|
|
$
|
0.47
|
|
$
|
0.58
|
|
$
|
1.82
|
|
||||
37
Basis of Presentation
On January 28, 2017, Varian completed its separation and distribution of Varex. In connection with the distribution, Varex became an independent publicly-traded company and is listed on The NASDAQ Global Select Market under the ticker “VREX” with 37.4 million shares of common stock distributed to Varian shareholders.
Prior to the separation, we operated as part of Varian and not as a stand-alone company. Accordingly, certain shared costs have been allocated to us and are reflected as expenses in the accompanying financial statements. Management considers the allocation methodologies used to be reasonable and appropriate reflections of the related expenses attributable to us for purposes of the carve-out financial statements; however, the expenses reflected in these financial statements may not be indicative of the actual expenses that would have been incurred during the periods presented if we had operated as a separate stand-alone entity. The allocation methods include revenue, headcount, actual usage of services, and others. In addition, the expenses reflected in the financial statements may not be indicative of expenses that will be incurred by us in the future.
Our products are sold in three geographic regions: The Americas, EMEA, and APAC. The Americas includes North America (primarily United States) and Latin America. EMEA includes Europe, Russia, the Middle East, India and Africa. APAC includes Asia and Australia. Revenues by region are based on the known final destination of products sold.
On May 1, 2017, we completed the acquisition of the Acquired Detector Business for net cash consideration of $271.8 million (the "Acquired Detector Business"). The acquisition consisted of PerkinElmer Medical Holdings, Inc. and Dexela Limited, together with certain assets of PKI and its direct and indirect subsidiaries relating to digital flat panel X-ray detectors that serve as components for industrial, medical, dental and veterinary X-ray imaging systems. The Acquired Detector Business has about 280 employees, is headquartered in Santa Clara, California and has additional operations in Germany, the Netherlands and the United Kingdom. We believe the acquisition complements our existing imaging detector business and will provide increased expertise and opportunities for Varex in the future.
Our business performance is measured in two reportable operating segments: Medical and Industrial. The segments align our products and service offerings with customer use in medical and industrial markets and are consistent with how resources are allocated and evaluated for financial performance by our Chief Operating Decision Maker. Each operating segment is primarily evaluated for financial performance based on revenues and gross margin.
Medical
In our Medical business segment, we design, manufacture, sell and service X-ray imaging components for use in a range of applications, including radiographic and fluoroscopic imaging, mammography, computed tomography (“CT”), radiation therapy and computer-aided detection. We provide a broad range of X-ray imaging components for medical customers, including X-ray tubes, digital flat panel image detectors, high voltage connectors, image-processing software and workstations, computer-aided diagnostic software, collimators, automatic exposure control devices, generators, ionization chambers and buckys.
A significant portion of our revenues come from the sales of high-end X-ray tubes used in CT imaging and high-end dynamic digital detectors used in fluoroscopic and dental applications. These upper-tier imaging components are characterized by increased levels of technological complexity, engineering and intellectual property that typically allow these products to have a higher sales price and gross margin.
The digital flat panel detector market continues to mature from initial product introductions more than 10 years ago. For the past few years, we have experienced price erosion for these products, predominantly in the highly-competitive market for radiographic detectors. We anticipate this trend will continue in the foreseeable future.
Our X-ray imaging components are primarily sold to imaging system original equipment manufacturer (“OEM”) customers that incorporate them into their medical diagnostic, radiation therapy, dental and veterinary imaging systems. To a much lesser extent, we also sell our X-ray imaging components to independent service companies, distributors and directly to end-users for replacement purposes.
Industrial
In our Industrial business segment, we design, manufacture, sell and service products for use in security and industrial inspection applications, such as airport security, cargo screening at ports and borders and nondestructive examination in a variety of
38
applications. The products include Linatron X-ray accelerators, X-ray tubes, digital flat panel detectors, high voltage connectors and image-processing software that we generally sell to OEM customers that incorporate these products into their inspection systems.
The security market primarily consists of airport security (carry-on baggage, checked baggage and palletized cargo) and cargo screening at ports and borders. The end customers for border protection systems are typically government agencies, many of which are in oil-based economies and war zones. In 2015, we saw a significant decline in demand for border protection systems due to the volatility of oil prices with moderate increases in demand in the following years.
The non-destructive testing market utilizes x-ray imaging to scan items for inspection of manufacturing defects and product integrity in a wide range of industries including aerospace, automotive, food packaging, metal castings and 3D printing. We provide x-ray sources, digital flat panel detectors, high voltage connectors and image processing software to OEM customers, system integrators and manufacturers. In addition, new applications for x-ray sources are being developed, such as sterilization of food and its packaging.
Fiscal Year
Our fiscal year is the 52- or 52-week period ending on the Friday nearest September 30. Fiscal year 2017 was the 52-week period that ended September 29, 2017, fiscal year 2016 was the 52-week period ended September 30, 2016, and fiscal year 2015 was the 53-week period ended on October 2, 2015. Set forth below is a discussion of our results of operations for fiscal years 2017, 2016 and 2015.
Discussion of Results of Operations for Fiscal Year 2017 and 2016
Revenues
|
Fiscal Years
|
|||||||||||
|
(In millions)
|
2017
|
2016
|
$ Change
|
% Change
|
|||||||
|
Medical
|
556.9
|
|
505.8
|
|
51.1
|
|
10
|
%
|
|||
|
Industrial
|
141.2
|
|
114.3
|
|
26.9
|
|
24
|
%
|
|||
|
Total revenues
|
698.1
|
|
620.1
|
|
78.0
|
|
13
|
%
|
|||
|
Medical as a percentage of total revenues
|
80
|
%
|
82
|
%
|
|||||||
|
Industrial as a percentage of total revenues
|
20
|
%
|
18
|
%
|
|||||||
Medical revenues increased
$51.1 million
primarily due to
$41.1 million
in revenue from the Acquired Detector Business. The remaining increase is due to higher sales of X-ray tubes in APAC partially offset by lower digital detector sales. Industrial revenues increased
$26.9 million
primarily due to
$20.2 million
in revenue from the Acquired Detector Business. The remaining increase is due to higher sales of industrial X-ray tubes and higher service and linear accelerator revenues for our security products. These increases in Industrial revenues were partially offset by a decrease in revenue from industrial detectors.
Revenues by Region
|
Fiscal Years
|
||||||||||||||
|
(In millions)
|
2017
|
2016
|
$ Change
|
% Change
|
||||||||||
|
Americas
|
$
|
239.8
|
|
$
|
224.7
|
|
$
|
15.1
|
|
7
|
%
|
|||
|
EMEA
|
219.5
|
|
179.5
|
|
40.0
|
|
22
|
%
|
||||||
|
APAC
|
238.8
|
|
215.9
|
|
22.9
|
|
11
|
%
|
||||||
|
Total revenues
|
$
|
698.1
|
|
$
|
620.1
|
|
$
|
78.0
|
|
13
|
%
|
|||
|
Americas as a percentage of total revenues
|
34
|
%
|
36
|
%
|
||||||||||
|
EMEA as a percentage of total revenues
|
31
|
%
|
29
|
%
|
||||||||||
|
APAC as a percentage of total revenues
|
34
|
%
|
35
|
%
|
||||||||||
The Americas revenues included
$20.7 million
in revenue from the Acquired Detector Business, partially offset by lower sales of X-ray tubes. EMEA revenues included
$31.2 million
in revenue from the Acquired Detector Business, as well as higher sales
39
of security and industrial products. APAC revenues included
$9.3 million
in revenue from the Acquired Detector Business and higher sales of X-ray tubes, partially offset by lower sales of digital detectors.
Gross Margin
|
Fiscal Years
|
||||||||||||||
|
(In millions)
|
2017
|
2016
|
$ Change
|
% Change
|
||||||||||
|
Medical
|
$
|
193.6
|
|
$
|
195.8
|
|
$
|
(2.2
|
)
|
(1
|
)%
|
|||
|
Industrial
|
59.9
|
|
52.6
|
|
7.3
|
|
14
|
%
|
||||||
|
Total gross margin
|
$
|
253.5
|
|
$
|
248.4
|
|
$
|
5.1
|
|
2
|
%
|
|||
|
Medical gross margin %
|
34.8
|
%
|
38.7
|
%
|
||||||||||
|
Industrial gross margin %
|
42.4
|
%
|
46.0
|
%
|
||||||||||
|
Total gross margin %
|
36.3
|
%
|
40.1
|
%
|
||||||||||
The decrease in total gross margin percentage was primarily due to higher amortization of intangible assets, a step-up inventory costs as a result of purchase price accounting related to the Acquired Detector Business, and continued price erosion in digital detectors. The decrease in medical gross margin percentage was primarily due to the reasons stated above and higher sales of CT tubes in the prior-year. The decrease in industrial gross margin percentage was primarily due to the reasons stated above and a change in product mix.
Operating Expenses
|
Fiscal Years
|
||||||||||||||
|
(In millions)
|
2017
|
2016
|
$ Change
|
% Change
|
||||||||||
|
Research and development
(1)
|
$
|
67.3
|
|
$
|
53.5
|
|
$
|
13.8
|
|
26
|
%
|
|||
|
As a percentage of total revenues
|
9.6
|
%
|
8.6
|
%
|
||||||||||
|
Selling, general and administrative
(2)
|
$
|
102.5
|
|
$
|
85.8
|
|
$
|
16.7
|
|
19
|
%
|
|||
|
As a percentage of total revenues
|
14.7
|
%
|
13.8
|
%
|
||||||||||
|
Operating expenses
|
$
|
169.8
|
|
$
|
139.3
|
|
$
|
30.5
|
|
22
|
%
|
|||
|
As a percentage of total revenues
|
24.3
|
%
|
22.5
|
%
|
||||||||||
(1) Research and development expenses included $0.0 million and
$1.2 million
allocated to us by Varian in fiscal years 2017 and 2016, respectively.
(2) Selling, general and administrative expenses include
$12.4 million
and
$37.7 million
of corporate costs allocated to us by Varian in fiscal years 2017 and 2016, respectively.
Research and Development
The increase in research and development expenses in fiscal year 2017 was due to acceleration and development of CT X-ray tubes and digital detectors, and includes approximately
$7.2 million
related to the Acquired Detector Business. We are committed to investing in the business to support long-term growth and believe long-term research and development expenses of approximately 8% to 10% of annual revenues is the appropriate range that will allow us to continue to innovate and bring new products to market for our global OEM customers.
Selling, General and Administrative
Selling, general and administrative expenses in fiscal year 2017 increased due to approximately
$5.0 million
of acquisition and integration related costs, increased marketing personnel expenses, partially offset by lower corporate and administration expenses as the prior year included costs allocated from Varian. Selling, general and administrative expenses includes approximately
$7.7 million
related to the Acquired Detector Business.
Interest and Other Income (Expense), Net
40
The following table summarizes our interest and other income (expense), net:
|
Fiscal Years
|
|||||||||||
|
(In millions)
|
2017
|
2016
|
$ Change
|
||||||||
|
Interest income
|
$
|
0.2
|
|
$
|
0.3
|
|
$
|
(0.1
|
)
|
||
|
Interest expense
|
(12.3
|
)
|
(1.9
|
)
|
(10.4
|
)
|
|||||
|
Other
|
3.2
|
|
(2.5
|
)
|
5.7
|
|
|||||
|
Interest and other income (expense), net
|
$
|
(8.9
|
)
|
$
|
(4.1
|
)
|
$
|
(4.8
|
)
|
||
The increase in interest and other income (expense), net was due to increases in interest expense as a result of borrowings under our credit agreement, partially offset by income from an equity method investment and foreign currency translation gains. Interest and other income (expense) in fiscal year 2016 primarily represents allocations of Varian’s interest expense and loss in an equity method investment.
Taxes on Earnings
|
Fiscal Years
|
|||||
|
2017
|
2016
|
||||
|
Effective tax rate
|
30.5
|
%
|
34.3
|
%
|
|
The decrease in the effective tax rate for the current year results from a difference in the mix of earnings by jurisdiction and overall global tax structure for Varex as a stand-alone company compared to the prior year when it was part of Varian. It is also impacted by the benefit of adjustments to certain deferred tax assets and the release of valuation allowances in jurisdictions where increased earnings allowed for the utilization of net operating loss carryforwards.
In general, our effective income tax rate differs from the U.S. federal statutory rate due to increases resulting from U.S. state income tax expense and earnings in certain foreign jurisdictions that are taxed currently in the U.S. These increases are partially offset by decreases due to earnings in foreign jurisdictions that are taxed at lower rates, a U.S. domestic production activities deduction, and research and development credits.
Discussion of Results of Operations for Fiscal Year 2016 and 2015
Revenues
|
Fiscal Years
|
||||||||||||||
|
(In millions)
|
2016
|
2015
|
$ Change
|
% Change
|
||||||||||
|
Medical
|
$
|
505.8
|
|
$
|
534.3
|
|
$
|
(28.5
|
)
|
(5
|
)%
|
|||
|
Industrial
|
114.3
|
|
98.0
|
|
16.3
|
|
17
|
%
|
||||||
|
Total revenues
|
$
|
620.1
|
|
$
|
632.3
|
|
$
|
(12.2
|
)
|
(2
|
)%
|
|||
|
Medical as a percentage of total revenues
|
82
|
%
|
85
|
%
|
||||||||||
|
Industrial as a percentage of total revenues
|
18
|
%
|
15
|
%
|
||||||||||
Medical revenues decreased in fiscal year 2016 over fiscal year 2015 primarily due to decreases in revenues from flat panel products and X-ray tube products, partially offset by an increase in revenues of $36.9 million from our acquisitions completed in the second half of fiscal year 2015. Revenues from our flat panel and X-ray tube products decreased primarily due to pricing pressures resulting from a strong U.S. Dollar, customers migrating to lower cost alternatives, and the decision of a key customer to in-source some of its flat panel products in the second half of fiscal year 2015. In addition, lower purchases from a key customer with higher X-ray tube inventory, due in part to longer tube life, also contributed to the declines in revenues.
Industrial revenues increased in fiscal year 2016 over fiscal year 2015 primarily due to an increase in revenues from our flat panel Industrial customers, in addition to an increase in revenues of $5.7 million from our acquisitions, and to a lesser extent an increase from security products.
41
Revenues by Region
|
Fiscal Years
|
||||||||||||||
|
(In millions)
|
2016
|
2015
|
$ Change
|
% Change
|
||||||||||
|
Americas
|
$
|
224.7
|
|
$
|
249.2
|
|
$
|
(24.5
|
)
|
(10
|
)%
|
|||
|
EMEA
|
179.5
|
|
153.0
|
|
26.5
|
|
17
|
%
|
||||||
|
APAC
|
215.9
|
|
230.1
|
|
(14.2
|
)
|
(6
|
)%
|
||||||
|
Total revenues
|
$
|
620.1
|
|
$
|
632.3
|
|
$
|
(12.2
|
)
|
(2
|
)%
|
|||
|
Americas as a percentage of total revenues
|
36
|
%
|
39
|
%
|
||||||||||
|
EMEA as a percentage of total revenues
|
29
|
%
|
24
|
%
|
||||||||||
|
APAC as a percentage of total revenues
|
35
|
%
|
36
|
%
|
||||||||||
The Americas revenues decreased in fiscal year 2016 over fiscal year 2015 primarily due to a decrease in revenues from flat panel products, partially offset by an increase of $16.8 million in revenues from our acquisitions completed in the second half of fiscal year 2015. The decrease in revenues from flat panel products was primarily due to a decision of a key customer to in-source some of the products they had purchased from us, in the second half of fiscal year 2015.
EMEA revenues increased in fiscal year 2016 over fiscal year 2015 primarily due to an increase of $16.7 million in revenues from our acquisitions completed in the second half of fiscal year 2015 and increases in revenues from flat panel products and security and inspection products, partially offset by a decrease in revenues from X-ray tube products.
APAC revenues decreased in fiscal year 2016 over fiscal year 2015 primarily due to a decrease in revenues from X-ray tube products, and to a lesser extent, a decrease in revenues from flat panel products, partially offset by an increase of $8.8 million in revenues from our acquisitions completed in the second half of fiscal year 2015. The decrease in revenues from X-ray tube products was primarily due to lower purchases from a key customer with higher X-ray tube inventory, due in part to longer tube life. In addition, the decrease in revenues from flat panel products was primarily due to pricing pressures resulting from a strong U.S. Dollar.
Gross Margin
|
Fiscal Years
|
||||||||||||||
|
(In millions)
|
2016
|
2015
|
$ Change
|
% Change
|
||||||||||
|
Medical
|
$
|
195.8
|
|
$
|
207.1
|
|
$
|
(11.3
|
)
|
(5
|
)%
|
|||
|
Industrial
|
52.6
|
|
43.5
|
|
9.1
|
|
21
|
%
|
||||||
|
Total gross margin
|
$
|
248.4
|
|
$
|
250.6
|
|
$
|
(2.2
|
)
|
(1
|
)%
|
|||
|
Medical gross margin %
|
38.7
|
%
|
38.8
|
%
|
||||||||||
|
Industrial gross margin %
|
46.0
|
%
|
44.4
|
%
|
||||||||||
|
Total gross margin %
|
40.1
|
%
|
39.6
|
%
|
||||||||||
Medical gross margin percentage remained flat in fiscal year 2016 over fiscal year 2015. Favorable product mix and productivity improvements were offset by increased quality costs and pricing pressures.
Industrial gross margin percentage increased in fiscal year 2016 over fiscal year 2015 primarily due to favorable product mix partially offset by lower margins from industrial products from our acquisitions.
42
Operating Expenses
|
Fiscal Years
|
||||||||||||||
|
(In millions)
|
2016
|
2015
|
$ Change
|
% Change
|
||||||||||
|
Research and development
(1)
|
$
|
53.5
|
|
$
|
50.4
|
|
$
|
3.1
|
|
6
|
%
|
|||
|
As a percentage of total revenues
|
8.6
|
%
|
8.0
|
%
|
||||||||||
|
Selling, general and administrative
(2)
|
$
|
85.8
|
|
$
|
72.7
|
|
$
|
13.1
|
|
18
|
%
|
|||
|
As a percentage of total revenues
|
13.8
|
%
|
11.5
|
%
|
||||||||||
|
Operating expenses
|
$
|
139.3
|
|
$
|
123.1
|
|
$
|
16.2
|
|
13
|
%
|
|||
|
As a percentage of total revenues
|
22.5
|
%
|
19.5
|
%
|
||||||||||
(1) Research and development expenses include $1.2 million and $1.4 million allocated to us by Varian in Fiscal Years 2016 and 2015, respectively.
(2) Selling, general and administrative expenses include $37.7 million and $38.0 million of corporate costs allocated to us by Varian in Fiscal Years 2016 and 2015, respectively.
Research and Development
Research and development expenses increased in fiscal year 2016 over fiscal year 2015 primarily due to $7.1 million in additional expenses from our acquisitions completed in the second half of fiscal year 2015, partially offset by a reduction in spending on our current projects.
Selling, General and Administrative
Selling, general and administrative expenses increased in fiscal year 2016 over fiscal year 2015 due to $10.2 million in additional operating expenses from our acquisitions completed in the second half of fiscal year 2015.
Interest and Other Income (Expense), Net
The following table summarizes our interest and other income (expense), net:
|
Fiscal Years
|
|||||||||||
|
(In millions)
|
2016
|
2015
|
$ Change
|
||||||||
|
Interest income
|
$
|
0.3
|
|
$
|
0.5
|
|
$
|
(0.2
|
)
|
||
|
Interest expense
|
(1.9
|
)
|
(1.2
|
)
|
(0.7
|
)
|
|||||
|
Other
|
(2.5
|
)
|
0.8
|
|
(3.3
|
)
|
|||||
|
Interest and other income (expense), net
|
$
|
(4.1
|
)
|
$
|
0.1
|
|
$
|
(4.2
|
)
|
||
The change in interest and other income (expense), net in fiscal year 2016 compared to fiscal year 2015 was primarily due to a loss from our equity method investments in fiscal year 2016, compared to income in the year-ago period, and higher interest expense allocated to us as a result of Varian’s increased borrowings in fiscal year 2016.
Taxes on Earnings
|
Fiscal Years
|
|||||
|
2016
|
2015
|
||||
|
Effective tax rate
|
34.3
|
%
|
36.7
|
%
|
|
Our effective tax rate decreased in fiscal year 2016 over fiscal year 2015 primarily due to the retroactive reinstatement of the federal research and development credit. Due to the timing of the prior lapse and the retroactive reinstatement of the federal research and development credit, the Company received seven quarters of benefit in fiscal year 2016, but only four quarters of benefit in fiscal year 2015.
Liquidity and Capital Resources
43
Prior to the separation, Varian provided financing, cash management and other treasury services to us. As part of Varian, we were dependent upon Varian for all of our working capital and financing requirements, as Varian uses a centralized approach to cash management and financing of its operations. Cash transferred to and from Varian is reflected in net parent investment in the accompanying historical condensed consolidated financial statements. Accordingly, none of Varian’s cash, cash equivalents or debt at the corporate level has been assigned to us in the condensed consolidated financial statements. Cash and cash equivalents included in the condensed consolidated balance sheets primarily reflect cash and cash equivalents from acquired entities that are specifically attributable to us.
We assess our liquidity in terms of our ability to generate cash to fund our operating and investing activities. We continue to generate substantial cash from operating activities and believe that our operating cash flow, credit facility, and other sources of liquidity will be sufficient to allow us to continue to invest in our existing businesses, consummate strategic acquisitions and manage our capital structure on a short and long-term basis. Although we believe that our future cash from operations, together with our access to banking and capital markets, will provide adequate resources to fund our operating and financing needs, our access to, and the availability of, financing on acceptable terms in the future will be affected by many factors, including: (i) the liquidity of the overall capital markets and (ii) the current state of the economy. There can be no assurances that we will continue to have access to these markets on terms acceptable to us. See “Risk Factors” for a further discussion. At September 29, 2017 we had
$463.9 million
in long-term debt and
$20.0 million
of current maturities of long-term debt, net of deferred issuance costs of
$10.1 million
.
Cash and Cash Equivalents
The following table summarizes our cash and cash equivalents:
|
(In millions)
|
September 29, 2017
|
September 30, 2016
|
$ Change
|
% Change
|
||||||||||
|
Cash and cash equivalents
|
$
|
83.3
|
|
$
|
36.5
|
|
$
|
46.8
|
|
128
|
%
|
|||
In accordance with the Separation and Distribution Agreement, we transferred
$27.1 million
of cash during the twelve months ended September 29, 2017, which represented all cash and cash equivalents in excess of $5 million to Varian, other than any cash and cash equivalents held by MeVis on January 28, 2017 and held by any Varex entities in order to complete the transfer of certain assets and subsidiaries from Varian. Funds held to complete these asset and subsidiary transfers was approximately
$7.9 million
as of September 29, 2017.
Cash Flows
|
Fiscal Years
|
|||||||||||
|
(In millions)
|
2017
|
2016
|
2015
|
||||||||
|
Net cash flow provided by (used in):
|
|||||||||||
|
Operating activities
|
$
|
74.6
|
|
$
|
74.2
|
|
$
|
85.2
|
|
||
|
Investing activities
|
(292.0
|
)
|
(21.6
|
)
|
(102.1
|
)
|
|||||
|
Financing activities
|
263.3
|
|
(36.8
|
)
|
36.7
|
|
|||||
|
Effects of exchange rate changes on cash and cash equivalents
|
0.9
|
|
0.1
|
|
0.3
|
|
|||||
|
Net increase in cash and cash equivalents
|
$
|
46.8
|
|
$
|
15.9
|
|
$
|
20.1
|
|
||
Net Cash Provided by Operating Activities.
Cash from operating activities consists primarily of net earnings adjusted for certain non-cash items, including share-based compensation, depreciation, amortization of intangible assets, deferred income taxes, income and loss from equity investments and the effect of changes in operating assets and liabilities.
For fiscal year 2017, net cash provided by operating activities was
$74.6 million
and consisted of net earnings of
$52.0 million
, increases from non-cash items of
$29.2 million
and decreases from operating assets and liabilities activities of
$6.6 million
. Operating assets and liabilities activity primarily consisted of increases in accounts receivables of
$23.1 million
and increases in inventories of
$4.2 million
, partially offset by increases in accounts payable and accrued liabilities of
$33.0 million
.
For fiscal year 2016, net cash provided by operating activities was $74.2 million and consisted of net earnings of $69.0 million, non-cash items of $31.4 million and decreases from operating assets and liabilities activities of $26.2 million. Operating assets and liabilities activity included increases in inventories of $23.5 million and increases in accounts receivable of $4.6 million.
44
For fiscal year 2015, net cash provided by operating activities was $85.2 million and consisted of net earnings of $80.8 million, non-cash items of $19.5 million and decreases from operating assets and liabilities activities of $15.1 million. Operating assets and liabilities activity included increases in inventories of $25.9 million, decreases in accrued liabilities of $7.2 million and decreases in accounts receivable of $19.3 million.
Net Cash Used in Investing Activities.
Net cash used in investing activities was
$292.0 million
,
$21.6 million
, and
$102.1 million
for the fiscal years 2017, 2016 and 2015, respectively. Net cash used in investing activities for fiscal year 2017 related to the Acquired Detector Business for
$271.8 million
and capital expenditures for property plant and equipment of
$20.2 million
. Net cash used in investing activities for fiscal year 2016 related to capital expenditures for property plant and equipment of
$28.9 million
offset by sales of available-for-sale securities of $8.6 million. Net cash used in investing activities for fiscal year 2015 related to capital expenditures for property plant and equipment of
$34.3 million
and acquisitions for
$67.9 million
.
Net Cash Provided by (Used in) Financing Activities.
Financing activities for the fiscal year 2017 primarily consisted of borrowings under our credit agreements of
$749.0 million
and net transfers from Varian of
$5.0 million
, partially offset by distributions to Varian of
$227.1 million
, repayments of borrowings of
$255.0 million
and payment of debt issuance costs of
$11.9 million
. Financing activities for the fiscal years 2016 and 2015 primarily consisted of transfers to Varian of
$36.7 million
and from Varian of
$35.8 million
, respectively.
Days Sales Outstanding
Trade accounts receivable days sales outstanding (“DSO”) was 66 days at September 29, 2017 and September 30, 2016. Our accounts receivable and DSO are impacted by a number of factors, primarily including the timing of product shipments, collections performance, payment terms, the mix of revenues from different regions and the effects of economic instability.
Contractual Obligations
In October 2013, we entered into an amended agreement with dpiX and other parties that, among other things, provides us with the right to 50% of dpiX’s total manufacturing capacity produced after January 1, 2014. The amended agreement requires us to pay for 50% of the fixed costs (as defined in the amended agreement), as determined at the beginning of each calendar year. For the remainder of calendar year 2017, we estimate that we have fixed cost commitments of
$4.1 million
related to this amended agreement. The fixed cost commitment for future periods will be determined and approved by the dpiX board of directors at the beginning of each calendar year. The amended agreement will continue unless the ownership structure of dpiX changes (as defined in the amended agreement).
In October 2015, we committed to grant the noncontrolling shareholders of MeVis: (1) an annual recurring net compensation of €0.95 per MeVis share; and, (2) a put right for their MeVis shares at €19.77 per MeVis share. As of September 29, 2017, noncontrolling shareholders together held approximately 0.5 million shares of MeVis, representing 26.3% of the outstanding shares.
The following table summarizes, as of September 29, 2017, the total amount of future payments due in various future periods:
|
Payments Due by Period
|
|||||||||||||||||||
|
(In millions)
|
Total
|
Fiscal Year 2018
|
Fiscal Years 2019-2020
|
Fiscal Years 2021-2022
|
Beyond
|
||||||||||||||
|
Operating lease obligations
|
$
|
16.4
|
|
$
|
4.0
|
|
$
|
6.3
|
|
$
|
5.2
|
|
$
|
0.9
|
|
||||
|
Principal payments on borrowings
|
494.0
|
|
20.0
|
|
55.0
|
|
419.0
|
|
—
|
|
|||||||||
|
Total
|
$
|
510.4
|
|
$
|
24.0
|
|
$
|
61.3
|
|
$
|
424.2
|
|
$
|
0.9
|
|
||||
We lease office space under non-cancelable operating leases. The leases expire at various dates through 2025, excluding extensions at our option, and contain provisions for rental adjustments, including in certain cases, adjustments based on increases in the Consumer Price Index. The leases generally contain renewal provisions for varying periods of time.
For further discussion regarding our borrowings, see Note 7, "Borrowings" of the Notes to the Consolidated Financial Statements.
45
Contingencies
From time to time, we are a party to or otherwise involved in legal proceedings, claims and government inspections or investigations and other legal matters both inside and outside the United States, arising in the ordinary course of our business or otherwise. Such matters are subject to many uncertainties and outcomes are not predictable with assurance. See Note 10 “Commitments and Contingencies” in the notes to the consolidated financial statements, which discussion is incorporated herein by reference.
Off-Balance Sheet Arrangements
In conjunction with the sale of our products in the ordinary course of business, we provide standard indemnification of business partners and customers for losses suffered or incurred for property damages, death and injury and for patent, copyright or any other intellectual property infringement claims by any third parties with respect to our products. The terms of these indemnification arrangements are generally perpetual. Except for losses related to property damages, the maximum potential amount of future payments we could be required to make under these arrangements is unlimited. As of September 29, 2017, we have not incurred any material costs to defend lawsuits or settle claims related to these indemnification arrangements. As a result, we believe the estimated fair value of these arrangements is minimal.
We have indemnification obligations to our directors and officers and certain of our employees that serve as officers or directors of our foreign subsidiaries that may require us to indemnify our directors and officers and those certain employees against liabilities that may arise by reason of their status or service as directors or officers, and to advance their expenses incurred as a result of any legal proceeding against them as to which they could be indemnified.
Critical Accounting Policies and Estimates
The preparation of our condensed consolidated financial statements and related disclosures in conformity with GAAP requires us to make estimates and assumptions that affect the reported amounts of assets, liabilities, revenues and expenses. These estimates and assumptions are based on historical experience and on various other factors that we believe are reasonable under the circumstances. Our critical accounting policies that are affected by accounting estimates require us to use judgments, often as a result of the need to make estimates and assumptions regarding matters that are inherently uncertain, and actual results could differ materially from these estimates. For a discussion of how these estimates and other factors may affect our business, see “Risk Factors.”
We periodically review our accounting policies, estimates and assumptions and make adjustments when facts and circumstances dictate. Such accounting policies require us to use judgments, often as a result of the need to make estimates and assumptions regarding matters that are inherently uncertain, and actual results could differ materially from these estimates. For a discussion of how these estimates and other factors may affect our business, see Item 1A, “Risk Factors.”
Revenue Recognition
Our revenues are derived primarily from the sale of hardware and software products, as well as services. We recognize revenues net of any value added or sales tax and net of sales discounts.
We occasionally enter into sales arrangements with customers that contain multiple elements or deliverables such as hardware, software and services. Judgments as to the allocation of consideration from an arrangement to the multiple elements of the arrangement, and the appropriate timing of revenue recognition are critical with respect to these arrangements to ensure compliance with GAAP.
The allocation of consideration in a multiple element arrangement is affected by the determination of whether any software deliverables that function together with other hardware components to deliver the hardware products’ essential functionality are considered as non-software products for purposes of revenue recognition. The allocation of consideration to each non-software deliverable is based on the assumptions we use to establish its selling price, which are based on vendor-specific objective evidence of selling price, if it exists, otherwise, third-party evidence of selling price, if it exists, and, if not, on estimated selling prices.
Changes to the elements in an arrangement and the amounts allocated to each element could affect the timing and amount of revenue recognition. Revenue recognition also depends on the timing of shipment, availability of products or customer acceptance terms. If shipments are not made on scheduled timelines or if the products are not accepted by the customer in a timely manner, our reported revenues may differ materially from expectations.
46
Service revenues include revenues from hardware service contracts, software service agreements, bundled support arrangements, paid services and trainings, and parts that are sold by the service department. Revenues allocated to service contracts are generally recognized ratably over the period of the related contracts.
Corporate Allocations
Prior to January 28, 2017, we operated as part of Varian and not as a stand-alone company. Accordingly, certain shared costs have been allocated to us and are reflected as expenses in the accompanying financial statements. Management considers the allocation methodologies used to be reasonable and appropriate reflections of the related expenses attributable to us for purposes of the carve-out financial statements; however, the expenses reflected in these financial statements may not be indicative of the actual expenses that would have been incurred during the periods presented if we had operated as a separate stand-alone entity. The allocation methods include revenue, headcount, actual usage of services, and others. In addition, the expenses reflected in the financial statements may not be indicative of expenses that will be incurred in the future by the Company. See Note 3, “Related Party Transactions” of the Notes to the audited combined financial statements for a description of our corporate allocations and related-party transactions.
Share-based Compensation Expense
Prior to the separation, our employees participated in Varian’s equity-based incentive plans. Subsequent to the separation, our employees participated in Varex’s equity-based incentive plans. Share-based compensation expense includes expense related to awards and terms granted to our employees as well as allocation of expenses from Varian’s corporate employees.
We value stock options granted and the option component of the shares of common stock purchased under the Employee Stock Purchase Plan using the Black-Scholes option-pricing model. Share-based compensation expense for restricted stock units is measured using the fair value of Varex’s stock on the date of grant and is amortized over the award’s respective service period. The determination of fair value of share-based payment awards on the date of grant under the Black-Scholes option-pricing model is affected by Varex’s stock price, as well as the input of other subjective assumptions, including the expected terms of share-based awards and the expected price volatilities of shares of Varex common stock and peer companies that are used to assess certain performance targets over the expected term of the awards, and the expected dividend yield of shares of Varex common stock.
We measure and recognize expense for all share-based payment awards based on their fair values. Share-based compensation expense recognized in the Combined Statements of Earnings includes compensation expense for the share-based payment awards based on the grant date fair value estimated in accordance with the guidance on share-based compensation. Share-based compensation expense recognized is based on the value of the portion of share-based payment awards that is ultimately expected to vest. We attribute the value of share-based compensation to expense using the straight-line method. We consider only the direct tax impacts of share-based compensation awards when calculating the amount of tax windfalls or shortfalls.
Allowance for Doubtful Accounts
We evaluate the creditworthiness of our customers prior to authorizing shipment for all major sale transactions. On a quarterly basis, we evaluate aged items in the accounts receivable aging report and provide an allowance in an amount we deem adequate for doubtful accounts. If our evaluation of our customers’ financial conditions does not reflect our future ability to collect outstanding receivables, additional provisions may be needed and our operating results could be negatively affected.
Inventories
Our inventories include high technology parts and components that are highly specialized in nature and that are subject to technological obsolescence. We have programs to minimize the required inventories on hand and we regularly review inventory quantities on hand and on order and adjust for excess and obsolete inventory based primarily on historical usage rates and our estimates of product demand and production. Actual demand may differ from our estimates, in which case we may have understated or overstated the provision required for obsolete and excess inventory, which would have an impact on our operating results.
Goodwill and Intangible Assets
Goodwill is initially recorded when the purchase price paid for a business acquisition exceeds the estimated fair value of the net identified tangible and intangible assets acquired. Our future operating performance will be impacted by the future amortization of these acquired intangible assets and potential impairment charges related to these intangibles or to goodwill if indicators of impairment exist. The allocation of the purchase price from business acquisitions to goodwill and intangible assets could have a material impact on our future operating results. In addition, the allocation of the purchase price of the acquired businesses to goodwill and intangible assets requires us to make significant estimates and assumptions, including estimates of future cash flows expected to be generated by the acquired assets and the appropriate discount rate for those cash flows. Should conditions differ from
47
management’s estimates at the time of the acquisition, material write-downs of intangible assets and/or goodwill may be required, which would adversely affect our operating results.
We evaluate goodwill for impairment at least annually or whenever an event occurs or circumstances change that would more likely than not reduce the fair value of a reporting unit below its carrying amount. The evaluation includes consideration of qualitative factors including industry and market considerations, overall financial performance, and other relevant events and factors affecting the reporting unit. If we determine that a quantitative analysis is necessary, the impairment test for goodwill is a two-step process. Step one consists of a comparison of the fair value of a reporting unit against its carrying amount, including the goodwill allocated to each reporting unit. We determine the fair value of our reporting units based on a combination of income and market approaches. The income approach is based on the present value of estimated future cash flows of the reporting units and the market approach is based on a market multiple calculated for each reporting unit based on market data of other companies engaged in similar business. If the carrying amount of the reporting unit is in excess of its fair value, step two requires the comparison of the implied fair value of the reporting unit’s goodwill against the carrying amount of the reporting unit’s goodwill. Any excess of the carrying value of the reporting unit’s goodwill over the implied fair value of the reporting unit’s goodwill is recorded as an impairment loss.
In fiscal years 2017, 2016 and 2015, we performed the annual goodwill impairment test for our two reporting units and found no impairment. We performed the annual goodwill analysis as of the first day of the fourth quarter of each fiscal year (using balances as of the end of the third quarter of that fiscal year). For both reporting units, based upon the annual goodwill analysis that we performed as of the first day of the fourth quarter of the respective fiscal years, either step one of the impairment test was not completed based on evaluation of qualitative factors or, if step one was completed, the fair value was substantially in excess of carrying value. However, significant changes in our projections about our operating results or other factors could cause us to make interim assessments of impairments in any quarter that could result in some or all of the goodwill being impaired.
We will continue to make assessments of impairment on an annual basis or more frequently if indicators of potential impairment arise.
Warranty Obligations
We warrant most of our products for a specific period of time, usually 12 to 24 months from delivery or acceptance, against material defects. We provide for the estimated future costs of warranty obligations in cost of revenues when the related revenues are recognized. The accrued warranty costs represent our best estimate at the time of sale of the total costs that we will incur to repair or replace product parts that fail while still under warranty. The amount of accrued estimated warranty costs obligation for established products is primarily based on historical experience as to product failures adjusted for current information on repair costs. For new products, estimates will include historical experience of similar products, as well as reasonable allowance for warranty expenses associated with new products. On a quarterly basis, we review the accrued balances of our warranty obligations and update the historical warranty cost trends, if required.
Loss Contingencies
From time to time, we are a party to or otherwise involved in legal proceedings, claims and government inspections or investigations or other legal matters, both inside and outside the United States, arising in the ordinary course of our business or otherwise. We accrue amounts, to the extent they can be reasonably estimated, that we believe are adequate to address any liabilities related to legal proceedings and other loss contingencies that we believe will result in a probable loss. Such matters are subject to many uncertainties, outcomes are not predictable with assurance, and actual liabilities could materially exceed our estimates of potential liabilities. In addition, we are subject to a variety of environmental laws around the world. Those laws regulate multiple aspects of our operations, including the handling, storage, transport and disposal of hazardous substances. They may impose costs on our operations.
Impairment of Investments
We have investments in privately held companies that are accounted for under the equity method of accounting as we hold at least a 20% ownership interest or have the ability to exercise significant influence in these investments. We monitor these investments for events or circumstances indicative of potential impairment, and we make appropriate reductions in carrying values if we determine that an impairment charge is required, based primarily on the financial condition, near-term prospects and recent financing activities of the investee.
Taxes on Earnings
Taxes on earnings, as presented, are calculated on a separate return basis. Under this method, we compute taxes on earnings as if we were a separate taxpayer filing our own income tax returns for the full year. However, as we only became an actual separate taxpayer upon separation from Varian, the amounts recorded may differ from the amounts that would have been reflected in the
48
financial statements had we been an entity that operated independently of Varian for the entire period. This is partially due to a different tax structure and tax accounting elections and assertions for the periods before and after separation.
We are subject to taxes on earnings in the United States and numerous foreign jurisdictions. As a global taxpayer, significant judgments and estimates are required in evaluating our tax positions and determining our provision for taxes on earnings. We account for uncertainty in income taxes following a two-step approach for recognizing and measuring uncertain tax positions. The first step is to evaluate the tax position for recognition by determining whether the weight of available evidence indicates that it is more likely than not that, based on the technical merits, the position will be sustained on audit, including resolution of related appeals or litigation processes, if any. The second step is to measure the tax benefit as the largest amount that is more than 50% likely of being realized upon settlement. Recognition and measurement are based on management’s best judgment given the facts, circumstances and information available at the end of the accounting period.
Generally, the carrying value of our net deferred tax assets assumes that we will be able to generate sufficient future taxable earnings in the applicable tax jurisdictions to utilize these deferred tax assets. In the period in which we conclude it is more likely than not that we will be unable to recover our net deferred tax assets in these tax jurisdictions, we will increase our valuation allowance and our tax provision will increase in the period in which we make such a determination.
Our foreign earnings are generally taxed at rates lower than U.S. rates. Our effective tax rate is impacted by existing tax laws in both the United States and in the respective countries in which our foreign subsidiaries do business. A change in the percentage of our total earnings from foreign countries, or in the mix of foreign countries or tax jurisdictions, could increase or decrease our effective tax rate. Taxes on earnings for the current period do not assume U.S. taxes on certain undistributed profits of certain foreign subsidiaries. They also do not assume any benefit for reduced U.S. tax rates or holidays on repatriated earnings as currently contemplated by Congress. These earnings could become subject to incremental foreign withholding or U.S. federal and state taxes should they either be deemed or actually remitted to the United States.
Backlog
Backlog is the accumulation of all orders for which revenues have not been recognized and are still considered valid. Backlog also includes a small portion of billed service contracts that are included in deferred revenue. Our total backlog at
September 29, 2017
was
$231.9 million
, a decrease of
6.6%
from the backlog of
$248.4 million
million at September 30, 2016, which was primarily due to several of our customers providing quarterly orders rather than annual orders.
Orders may be revised or canceled, either according to their terms or as customers’ needs change. Consequently, it is difficult to predict with certainty the amount of backlog that will result in revenues. We perform a quarterly review to verify that outstanding orders in the backlog remain valid. Aged orders that are not expected to be converted to revenues are deemed dormant and are reflected as a reduction in the backlog amounts in the period identified.
In addition to orders for which revenues have not been recognized and are still considered valid, we have pricing agreements with many of our established customers that span multi-year periods. These pricing agreements include volume ranges under which orders are placed.
Recent Accounting Standards or Updates Not Yet Effective
See Note 1, “Summary of Significant Accounting Policies” of the notes to the condensed consolidated financial statements for a description of recent accounting standards, including the expected dates of adoption and the estimated effects on our consolidated financial statements.
We are exposed to four primary types of market risks: foreign currency exchange rate risk, credit and counterparty risk, interest rate risk and commodity price risk.
Foreign Currency Exchange Rate Risk
A significant portion of our customers are outside the United States and our products are generally priced in U.S. Dollars. A strong U.S. Dollar may result in pricing pressure for our customers that are located outside the United States and that conduct their businesses in currencies other than the U.S. Dollar. Such pricing pressure has caused, and could continue to cause, some of our
49
customers to ask for discounted prices, delay purchasing decisions, consider moving to in-sourcing supply of components or migrating to lower cost alternatives. In addition, because our business is global and some payments may be made in local currency, fluctuations in foreign currency exchange rates can impact our revenues and expenses and/or the profitability in U.S. Dollars of products and services that we provide in foreign markets.
Credit and Counterparty Risk
We use a centralized approach to manage substantially all of our cash and to finance our operations. Our cash and cash equivalents may be exposed to a concentration of credit risk and we may also be exposed to credit risk and interest rate risk to the extent that we enter into credit facilities.
We perform ongoing credit evaluations of our customers and we maintain strong credit controls in evaluating and granting customer credit, including performing ongoing evaluations of our customers’ financial condition and creditworthiness and often using letters of credit and requiring industrial customers to provide a down payment.
Interest Rate Risk
At
September 29, 2017
, we had borrowings of
$483.9 million
. Borrowings under our credit facilities bear interest at floating interest rates. As a result, we are exposed to fluctuations in interest rates to the extent of our borrowings under the credit facilities. As part of our overall risk management program, we entered into several interest rate swaps designed as cash flow hedges, to hedge the floating LIBOR components of our interest rate which represented a notional value of
$292.5 million
of our debt as of
September 29, 2017
. See Note 6, “Financial Derivatives and Hedging Activities” for further information on hedging activities. .
Commodity Price Risk
We are exposed to market risks related to volatility in the prices of raw materials used in our products. The prices of these raw materials fluctuate in response to changes in supply and demand fundamentals and our product margins and level of profitability tend to fluctuate with changes in these raw materials prices. We try to protect against such volatility through various business strategies. During the fiscal year ended
September 29, 2017
, we did not have any commodity derivative instruments in place to manage our exposure to price changes.
The Consolidated Financial Statements and Schedules listed in the Index to Financial Statements, Schedules and Exhibits on page F-1 are filed as part of this annual report.
None.
Evaluation of disclosure controls and procedures.
Based on the evaluation of our disclosure controls and procedures (as defined in the Rules 13a-15(e) and 15d-15(e) under the Exchange Act required by Exchange Act) Rules 13a-15(b) or 15d-15(b), our principal executive officer and principal financial officer have concluded that as of the end of the period covered by this report, our disclosure controls and procedures were effective to ensure that information required to be disclosed by the Company in reports that it files or submits under the Exchange Act is recorded, processed, summarized and reported within the time periods specified in SEC rules and forms, and include controls and procedures designed to ensure that information required to be disclosed by us in such reports is accumulated and communicated to our management, including the principal executive officer and principal financial officer, as appropriate, to allow timely decisions regarding required disclosure.
Report of management on internal control over financial reporting.
This Annual Report on Form 10-K does not include a report of management’s assessment regarding internal control over financial reporting or an attestation report of our independent registered public accounting firm due to a transition period established by the rules of the SEC for newly public companies.
Changes in internal control over financial reporting.
There were no changes in our internal control over financial reporting that occurred during our fourth fiscal quarter of fiscal year 2017 that have materially affected, or are reasonably likely to materially affect, our internal control over financial reporting.
50
None.
Directors and Executive Officers
The information required by this item with respect to our executive officers is set forth in Part I of this Annual Report on Form 10-K. The information required by this item with respect to our directors, our Audit Committee and its members, and audit committee financial expert is incorporated by reference from our definitive proxy statement for the 2018 Annual Meeting of Stockholders under the caption “Proposal One-Election of Directors." The information required by this item with respect to compliance with Section 16(a) of the Exchange Act is incorporated by reference from our definitive proxy statement for the 2018 Annual Meeting of Stockholders under the caption “Stock Ownership-Section 16(a) Beneficial Ownership Reporting Compliance.”
Code of Conduct
We have adopted a Code of Conduct that applies to all of our executive officers and directors. The Code of Conduct is posted on our website. The Internet address for our website is http://www.vareximaging.com, and the Code of Conduct may be found as follows:
1. From our main web page, first click “Investors.”
2. Next click on “Governance Highlights” under “Corporate Governance” in the drop-down menu.
3. Finally, click on “Code of Conduct.”
We intend to satisfy the disclosure requirements under Item 5.05(c) of Form 8-K regarding an amendment to, or waiver from, a provision of the Code of Conduct that applies to our principal executive officer, principal financial officer, principal accounting officer or controller or persons performing similar functions by posting such information on our website, at the address and location specified above.
The information required by this item is incorporated by reference from our definitive proxy statement for the 2018 Annual Meeting of Stockholders under the caption “Executive Compensation.”
The information required by this item with respect to the security ownership of certain beneficial owners and the security ownership of directors and executive officers is incorporated by reference from our definitive proxy statement for the 2018 Annual Meeting of Stockholders under the caption “Stock Ownership-Beneficial Ownership of Certain Stockholders, Directors and Executive Officers.”
The information required by this item with respect to securities authorized for issuance under equity compensation plans is incorporated by reference from our definitive proxy statement for the 2018 Annual Meeting of Stockholders under the caption “Description of the 2017 Stock Plan.”
The information required by this item with respect to certain relationships and related transactions is incorporated by reference from our definitive proxy statement for the 2018 Annual Meeting of Stockholders under the caption “Certain Relationships and Related Transactions.” The information required by this item with respect to director and committee member independence is incorporated by reference from our definitive proxy statement for the 2018 Annual Meeting of Stockholders under the caption “Proposal One-Election of Directors.”
The information required by this item is incorporated by reference from our definitive proxy statement for the 2018 Annual Meeting of Stockholders under the caption “Proposal Four-Ratification of the Appointment of Our Independent Registered Public Accounting Firm.”
51
Documents filed as part of this annual report include:
|
1.
|
Consolidated Financial Statements.
We have filed the consolidated financial statements listed in the index to Consolidated Financial Statements, Schedules and Exhibits on page F-1 as part of this annual report on Form-10K.
|
|
2.
|
Financial Statement Schedules and Other.
All financial statement schedules have been omitted because they are not applicable, not material or the required information is shown in the consolidated financial statements or the notes thereto.
|
|
3.
|
Exhibits.
The exhibits listed below are filed as part of this annual report on Form 10-K.
|
|
Exhibit Number
|
Description
|
|
|
2.1
|
|
|
|
2.2
|
|
|
|
2.3
|
|
|
|
2.4
|
|
|
|
2.5
|
|
|
|
3.1*
|
|
|
|
3.2
|
|
|
|
10.1
|
|
|
|
10.2
|
|
|
|
10.3
|
|
|
52
|
10.4
|
|
|
|
10.5
|
|
|
|
10.6++
|
|
|
|
10.7
|
|
|
|
10.8†
|
|
|
|
10.9†
|
|
|
|
10.10†
|
||
|
10.11†
|
||
|
10.12†
|
|
|
|
10.13†
|
||
|
10.14†
|
||
|
10.15†
|
||
|
10.16†
|
||
|
10.17*†
|
|
|
|
21.1*
|
||
|
23.1*
|
||
|
31.1*
|
||
|
31.2*
|
|
|
|
32.1*
|
|
|
53
|
32.2*
|
|
|
|
101.INS
|
XBRL Instance Document
|
|
|
101.SCH
|
XBRL Taxonomy Extension Schema Document
|
|
|
101.CAL
|
XBRL Taxonomy Extension Calculation Linkbase Document
|
|
|
101.DEF
|
XBRL Taxonomy Extension Definition Linkbase Document
|
|
|
101.LAB
|
XBRL Taxonomy Extension Label Linkbase Document
|
|
|
101.PRE
|
XBRL Taxonomy Extension Presentation Linkbase Document
|
|
|
*
|
Filed herewith
|
|
|
†
|
Management contract or compensatory agreement.
|
|
|
++
|
Portions of this exhibit have been omitted pursuant to a confidential treatment request filed pursuant to Rule 24b-2 of the Securities Exchange Act of 1934, as amended.
|
|
54
SIGNATURES
Pursuant to the requirements of Section 13 or 15(d) of the Securities Exchange Act of 1934, the Registrant has duly caused this report to be signed on its behalf by the undersigned thereunto duly authorized.
|
VAREX IMAGING CORPORATION
|
|||
|
Date:
|
December 12, 2017
|
By:
|
/s/ CLARENCE R. VERHOEF
|
|
Clarence R. Verhoef
|
|||
|
Senior Vice President and Chief Financial Officer
|
|||
|
(Duly Authorized Officer and Principal Financial Officer)
|
|||
Pursuant to the requirements of the Securities Exchange Act of 1934, this report has been signed below by the following persons on behalf of the registrant and in the capacities and on the dates indicated.
|
Signature
|
Capacity
|
Date
|
||
|
/s/ SUNNY S. SANYAL
|
President and Chief Executive Officer and Director
(Principal Executive Officer)
|
December 12, 2017
|
||
|
Sunny S. Sanyal
|
||||
|
/s/ CLARENCE R. VERHOEF
|
Senior Vice President and Chief Financial Officer
(Principal Financial Officer)
|
December 12, 2017
|
||
|
Clarence R. Verhoef
|
||||
|
/s/ KEVIN B. YANKTON
|
Corporate Controller and Chief Accounting Officer
(Principal Accounting Officer)
|
December 12, 2017
|
||
|
Kevin B. Yankton
|
||||
|
/s/ RUEDIGER NAUMANN-ETIENNE
|
Chairman of the Board
|
December 12, 2017
|
||
|
Ruediger Naumann-Etienne
|
||||
|
/s/ JOCELYN D. CHERTOFF
|
Director
|
December 12, 2017
|
||
|
Jocelyn D. Chertoff
|
||||
|
/s/ CHRISTINE A. TSINGOS
|
Director
|
December 12, 2017
|
||
|
Christine A. Tsingos
|
||||
|
/s/ JAY K. KUNKEL
|
Director
|
December 12, 2017
|
||
|
Jay K. Kunkel
|
||||
|
/s/ ERICH R. REINHARDT
|
Director
|
December 12, 2017
|
||
|
Erich R. Reinhardt
|
||||
|
/s/ DOW R. WILSON
|
Director
|
December 12, 2017
|
||
|
Dow R. Wilson
|
||||
55
INDEX TO CONSOLIDATED FINANCIAL STATEMENTS
56
REPORT OF INDEPENDENT REGISTERED PUBLIC ACCOUNTING FIRM
To
the Board of Directors and Shareholders of Varex Imaging Corporation
In our opinion, the accompanying consolidated balance sheets and the related consolidated statements of earnings, of comprehensive earnings, of equity, and of cash flows present fairly, in all material respects, the financial position of Varex Imaging Corporation and its subsidiaries as of September 29, 2017 and September 30, 2016, and the results of their operations and their cash flows for each of the three years in the period ended September 29, 2017
in conformity with accounting principles generally accepted in the United States of America. These financial statements are the responsibility of the Company’s management. Our responsibility is to express an opinion on these financial statements based on our audits. We conducted our audits of these financial statements in accordance with the standards of the Public Company Accounting Oversight Board (United States). Those standards require that we plan and perform the audit to obtain reasonable assurance about whether the financial statements are free of material misstatement. An audit includes examining, on a test basis, evidence supporting the amounts and disclosures in the financial statements, assessing the accounting principles used and significant estimates made by management, and evaluating the overall financial statement presentation. We believe that our audits provide a reasonable basis for our opinion.
/s/ PricewaterhouseCoopers LLP
Salt Lake City, Utah
December 12, 2017
F-1
VAREX IMAGING CORPORATION
|
Fiscal Years
|
|||||||||||
|
(In millions)
|
2017
|
2016
|
2015
|
||||||||
|
Revenues
|
$
|
698.1
|
|
$
|
620.1
|
|
$
|
632.3
|
|
||
|
Cost of revenues
|
444.6
|
|
371.7
|
|
381.7
|
|
|||||
|
Gross margin
|
253.5
|
|
248.4
|
|
250.6
|
|
|||||
|
Operating expenses:
|
|||||||||||
|
Research and development
|
67.3
|
|
53.5
|
|
50.4
|
|
|||||
|
Selling, general and administrative
|
102.5
|
|
85.8
|
|
72.7
|
|
|||||
|
Total operating expenses
|
169.8
|
|
139.3
|
|
123.1
|
|
|||||
|
Operating earnings
|
83.7
|
|
109.1
|
|
127.5
|
|
|||||
|
Interest income
|
0.2
|
|
0.3
|
|
0.5
|
|
|||||
|
Interest expense
|
(12.3
|
)
|
(1.9
|
)
|
(1.2
|
)
|
|||||
|
Other income (expense), net
|
3.2
|
|
(2.5
|
)
|
0.8
|
|
|||||
|
Interest and other income (expenses), net
|
(8.9
|
)
|
(4.1
|
)
|
0.1
|
|
|||||
|
Earnings before taxes
|
74.8
|
|
105.0
|
|
127.6
|
|
|||||
|
Taxes on earnings
|
22.8
|
|
36.0
|
|
46.8
|
|
|||||
|
Net earnings
|
52.0
|
|
69.0
|
|
80.8
|
|
|||||
|
Less: Net earnings attributable to noncontrolling interests
|
0.4
|
|
0.5
|
|
0.8
|
|
|||||
|
Net earnings attributable to Varex
|
$
|
51.6
|
|
$
|
68.5
|
|
$
|
80.0
|
|
||
|
Net earnings per common share attributable to Varex
|
|||||||||||
|
Basic
|
$
|
1.37
|
|
$
|
1.83
|
|
$
|
2.14
|
|
||
|
Diluted
|
$
|
1.36
|
|
$
|
1.82
|
|
$
|
2.12
|
|
||
|
Weighted average common shares outstanding
|
|||||||||||
|
Basic
|
37.6
|
|
37.4
|
|
37.4
|
|
|||||
|
Diluted
|
38.0
|
|
37.7
|
|
37.7
|
|
|||||
See accompanying notes to the consolidated financial statements.
F-2
VAREX IMAGING CORPORATION
CONSOLIDATED STATEMENTS OF COMPREHENSIVE EARNINGS
|
Fiscal Years
|
|||||||||||
|
(In millions)
|
2017
|
2016
|
2015
|
||||||||
|
Net earnings
|
$
|
52.0
|
|
$
|
69.0
|
|
$
|
80.8
|
|
||
|
Other comprehensive earnings (loss), net of tax:
|
|||||||||||
|
Unrealized gain on interest rate swap contracts, net of tax
|
0.6
|
|
—
|
|
—
|
|
|||||
|
Unrealized gain on defined benefit obligations, net of tax
|
0.2
|
|
—
|
|
—
|
|
|||||
|
Available-for-sale securities:
|
|||||||||||
|
Change in unrealized loss, net of tax
|
—
|
|
(0.3
|
)
|
(0.1
|
)
|
|||||
|
Reclassification adjustments, net of tax
|
—
|
|
0.4
|
|
—
|
|
|||||
|
Other comprehensive earnings (loss), net of tax
|
0.8
|
|
0.1
|
|
(0.1
|
)
|
|||||
|
Comprehensive earnings
|
52.8
|
|
69.1
|
|
80.7
|
|
|||||
|
Less: Comprehensive earnings attributable to noncontrolling interests
|
0.4
|
|
0.5
|
|
0.8
|
|
|||||
|
Comprehensive earnings attributable to Varex
|
$
|
52.4
|
|
$
|
68.6
|
|
$
|
79.9
|
|
||
See accompanying notes to the consolidated financial statements.
F-3
VAREX IMAGING CORPORATION
|
(In millions, except per share amounts)
|
September 29, 2017
|
September 30, 2016
|
|||||
|
Assets
|
|||||||
|
Current assets:
|
|||||||
|
Cash and cash equivalents
|
$
|
83.3
|
|
$
|
36.5
|
|
|
|
Accounts receivable, net of allowance for doubtful accounts of $0.4 and $0.2 at September 29, 2017 and September 30, 2016, respectively
|
163.6
|
|
122.2
|
|
|||
|
Inventories, net
|
234.5
|
|
197.4
|
|
|||
|
Prepaid expenses and other current assets
|
13.9
|
|
3.8
|
|
|||
|
Total current assets
|
$
|
495.3
|
|
$
|
359.9
|
|
|
|
Property, plant and equipment, net
|
148.3
|
|
108.9
|
|
|||
|
Goodwill
|
241.9
|
|
74.7
|
|
|||
|
Intangibles assets
|
91.3
|
|
20.7
|
|
|||
|
Investments in privately-held companies
|
52.3
|
|
49.3
|
|
|||
|
Deferred tax assets
|
—
|
|
5.5
|
|
|||
|
Other assets
|
11.0
|
|
3.4
|
|
|||
|
Total assets
|
$
|
1,040.1
|
|
$
|
622.4
|
|
|
|
Liabilities, Redeemable Noncontrolling Interests and Equity
|
|||||||
|
Current liabilities:
|
|||||||
|
Accounts payable
|
$
|
58.9
|
|
$
|
41.9
|
|
|
|
Accrued liabilities
|
62.4
|
|
23.9
|
|
|||
|
Current maturities of long-term debt
|
20.0
|
|
—
|
|
|||
|
Deferred revenues
|
10.5
|
|
12.0
|
|
|||
|
Total current liabilities
|
$
|
151.8
|
|
$
|
77.8
|
|
|
|
Long-term debt
|
463.9
|
|
—
|
|
|||
|
Deferred tax liabilities
|
29.5
|
|
3.0
|
|
|||
|
Other long-term liabilities
|
4.7
|
|
5.3
|
|
|||
|
Total liabilities
|
$
|
649.9
|
|
$
|
86.1
|
|
|
|
Commitments and contingencies (Note 10)
|
|
|
|||||
|
Redeemable noncontrolling interests
|
11.2
|
|
10.3
|
|
|||
|
Equity:
|
|||||||
|
Preferred stock, $.01 par value: 20,000,000 shares authorized, none issued
|
—
|
|
—
|
|
|||
|
Common stock, $.01 par value:
|
|||||||
|
Authorized shares - 150,000,000
|
|||||||
|
Issued shares - 37,633,747 and 0
|
|||||||
|
Outstanding shares - 37,633,747 and 0
|
0.4
|
|
—
|
|
|||
|
Net parent investment
|
—
|
|
526.0
|
|
|||
|
Additional paid-in capital
|
342.7
|
|
—
|
|
|||
|
Accumulated other comprehensive loss
|
0.8
|
|
—
|
|
|||
|
Retained earnings
|
35.1
|
|
—
|
|
|||
|
Total stockholders' equity
|
$
|
379.0
|
|
$
|
526.0
|
|
|
|
Total liabilities, redeemable noncontrolling interests and Varex stockholders' equity
|
$
|
1,040.1
|
|
$
|
622.4
|
|
|
See accompanying notes to the consolidated financial statements.
F-4
VAREX IMAGING CORPORATION
|
Fiscal Years
|
|||||||||||
|
(In millions)
|
2017
|
2016
|
2015
|
||||||||
|
Cash flows from operating activities:
|
|||||||||||
|
Net earnings
|
$
|
52.0
|
|
$
|
69.0
|
|
$
|
80.8
|
|
||
|
Adjustments to reconcile net earnings to net cash provided by operating activities:
|
|||||||||||
|
Share-based compensation expense
|
8.4
|
|
9.5
|
|
9.6
|
|
|||||
|
Excess tax benefits from share-based compensation
|
—
|
|
0.1
|
|
(1.7
|
)
|
|||||
|
Depreciation
|
16.9
|
|
9.8
|
|
9.6
|
|
|||||
|
Amortization of intangible assets
|
10.5
|
|
5.5
|
|
2.7
|
|
|||||
|
Deferred taxes
|
(8.9
|
)
|
4.2
|
|
(0.8
|
)
|
|||||
|
(Income) loss from equity method investments
|
(1.3
|
)
|
1.6
|
|
(0.3
|
)
|
|||||
|
Amortization of deferred loan costs
|
1.8
|
|
—
|
|
—
|
|
|||||
|
Other, net
|
1.8
|
|
0.7
|
|
0.4
|
|
|||||
|
Changes in assets and liabilities:
|
|||||||||||
|
Accounts receivable
|
(23.1
|
)
|
(4.6
|
)
|
19.3
|
|
|||||
|
Inventories
|
(4.2
|
)
|
(23.5
|
)
|
(25.9
|
)
|
|||||
|
Prepaid expenses and other assets
|
(10.7
|
)
|
(0.9
|
)
|
0.3
|
|
|||||
|
Accounts payable
|
4.9
|
|
(1.9
|
)
|
(4.3
|
)
|
|||||
|
Accrued operating liabilities and other long-term operating liabilities
|
28.1
|
|
2.8
|
|
(7.2
|
)
|
|||||
|
Deferred revenues
|
(1.6
|
)
|
1.9
|
|
2.7
|
|
|||||
|
Net cash provided by operating activities
|
74.6
|
|
74.2
|
|
85.2
|
|
|||||
|
Cash flows from investing activities:
|
|||||||||||
|
Purchases of property, plant and equipment
|
(20.2
|
)
|
(28.9
|
)
|
(34.3
|
)
|
|||||
|
Sale of available-for-sale securities
|
—
|
|
8.6
|
|
—
|
|
|||||
|
Acquisitions of businesses, net of cash acquired
|
(271.8
|
)
|
(1.2
|
)
|
(67.9
|
)
|
|||||
|
Other
|
—
|
|
(0.1
|
)
|
0.1
|
|
|||||
|
Net cash used in investing activities
|
(292.0
|
)
|
(21.6
|
)
|
(102.1
|
)
|
|||||
|
Cash flows from financing activities:
|
|||||||||||
|
Net transfers from (to) parent
|
5.0
|
|
(36.7
|
)
|
35.8
|
|
|||||
|
Distributions to Varian Medical Systems, Inc.
|
(227.1
|
)
|
—
|
|
—
|
|
|||||
|
Taxes related to net share settlement of equity awards
|
(1.9
|
)
|
—
|
|
—
|
|
|||||
|
Borrowings under credit agreements
|
749.0
|
|
—
|
|
—
|
|
|||||
|
Repayments of borrowing under credit agreements
|
(255.0
|
)
|
—
|
|
—
|
|
|||||
|
Proceeds from exercise of stock options
|
2.8
|
|
—
|
|
—
|
|
|||||
|
Excess tax benefits from share-based compensation
|
2.4
|
|
(0.1
|
)
|
1.7
|
|
|||||
|
Payment of debt issuance costs
|
(11.9
|
)
|
—
|
|
—
|
|
|||||
|
Other financing activities
|
—
|
|
—
|
|
(0.8
|
)
|
|||||
|
Net cash provided by (used in) financing activities
|
263.3
|
|
(36.8
|
)
|
36.7
|
|
|||||
|
Effects of exchange rate changes on cash and cash equivalents
|
0.9
|
|
0.1
|
|
0.3
|
|
|||||
|
Net increase in cash and cash equivalents
|
46.8
|
|
15.9
|
|
20.1
|
|
|||||
|
Cash and cash equivalents at beginning of period
|
36.5
|
|
20.6
|
|
0.5
|
|
|||||
|
Cash and cash equivalents at end of period
|
$
|
83.3
|
|
$
|
36.5
|
|
$
|
20.6
|
|
||
|
Supplemental cash flow information:
|
|||||||||||
|
Cash paid for interest
|
$
|
9.8
|
|
$
|
—
|
|
$
|
—
|
|
||
|
Cash paid for income tax
|
6.0
|
|
—
|
|
—
|
|
|||||
|
Supplemental non-cash activities:
|
|||||||||||
|
Purchases of property, plant and equipment financed through accounts payable
|
$
|
4.0
|
|
$
|
3.1
|
|
$
|
9.0
|
|
||
|
Transfers of property, plant and equipment from Varian Medical Systems, Inc.
|
15.0
|
|
—
|
|
—
|
|
|||||
|
Other non-cash transfers to Varian Medical Systems, Inc.
|
1.6
|
|
—
|
|
—
|
|
|||||
F-5
VAREX IMAGING CORPORATION
CONSOLIDATED STATEMENTS OF EQUITY
|
Common Stock
|
Additional Paid-in Capital
|
Net Parent Investment
|
Retained Earnings
|
Total Stockholders' Equity
|
|||||||||||||||||||||||||||||||
|
(In millions)
|
Shares
|
Amount
|
Accumulated Other Comprehensive Income (Loss)
|
Total Varex Equity
|
Non-controlling Interests
|
||||||||||||||||||||||||||||||
|
September 26, 2014
|
—
|
|
$
|
—
|
|
$
|
—
|
|
$
|
359.3
|
|
$
|
—
|
|
$
|
—
|
|
$
|
359.3
|
|
$
|
—
|
|
$
|
359.3
|
|
|||||||||
|
Net earnings
|
—
|
|
—
|
|
—
|
|
80.0
|
|
—
|
|
—
|
|
80.0
|
|
0.8
|
|
80.8
|
|
|||||||||||||||||
|
Net transfers from parent
|
—
|
|
—
|
|
—
|
|
45.4
|
|
—
|
|
—
|
|
45.4
|
|
—
|
|
45.4
|
|
|||||||||||||||||
|
Other comprehensive loss
|
—
|
|
—
|
|
—
|
|
—
|
|
(0.1
|
)
|
—
|
|
(0.1
|
)
|
—
|
|
(0.1
|
)
|
|||||||||||||||||
|
Acquisition of MeVis Medical Solutions AG
|
—
|
|
—
|
|
—
|
|
—
|
|
—
|
|
—
|
|
—
|
|
10.2
|
|
10.2
|
|
|||||||||||||||||
|
October 2, 2015
|
—
|
|
—
|
|
—
|
|
484.7
|
|
(0.1
|
)
|
—
|
|
484.6
|
|
11.0
|
|
495.6
|
|
|||||||||||||||||
|
Net earnings
|
—
|
|
—
|
|
—
|
|
68.5
|
|
—
|
|
—
|
|
68.5
|
|
—
|
|
68.5
|
|
|||||||||||||||||
|
Net transfers to parent
|
—
|
|
—
|
|
—
|
|
(27.2
|
)
|
0.1
|
|
—
|
|
(27.1
|
)
|
—
|
|
(27.1
|
)
|
|||||||||||||||||
|
Reclassification of non-controlling interests in MeVis Medical Solutions AG to redeemable non-controlling interests
|
—
|
|
—
|
|
—
|
|
—
|
|
—
|
|
—
|
|
—
|
|
(10.4
|
)
|
(10.4
|
)
|
|||||||||||||||||
|
Other
|
—
|
|
—
|
|
—
|
|
—
|
|
—
|
|
—
|
|
—
|
|
(0.6
|
)
|
(0.6
|
)
|
|||||||||||||||||
|
September 30, 2016
|
—
|
|
—
|
|
—
|
|
526.0
|
|
—
|
|
—
|
|
526.0
|
|
—
|
|
526.0
|
|
|||||||||||||||||
|
Net earnings
|
—
|
|
—
|
|
—
|
|
16.5
|
|
—
|
|
35.1
|
|
51.6
|
|
—
|
|
51.6
|
|
|||||||||||||||||
|
Net transfers from parent
|
—
|
|
—
|
|
—
|
|
18.4
|
|
—
|
|
—
|
|
18.4
|
|
—
|
|
18.4
|
|
|||||||||||||||||
|
Distribution to Varian Medical Systems
|
—
|
|
—
|
|
—
|
|
(227.1
|
)
|
—
|
|
—
|
|
(227.1
|
)
|
—
|
|
(227.1
|
)
|
|||||||||||||||||
|
Conversion of net parent investment into common stock
|
37.4
|
|
0.4
|
|
333.4
|
|
(333.8
|
)
|
—
|
|
—
|
|
—
|
|
—
|
|
—
|
|
|||||||||||||||||
|
Exercise of stock options
|
0.1
|
|
—
|
|
2.8
|
|
—
|
|
—
|
|
—
|
|
2.8
|
|
—
|
|
2.8
|
|
|||||||||||||||||
|
Common stock issued upon vesting of restricted shares
|
0.2
|
|
—
|
|
—
|
|
—
|
|
—
|
|
—
|
|
—
|
|
—
|
|
—
|
|
|||||||||||||||||
|
Shares withheld on vesting of restricted stock
|
(0.1
|
)
|
—
|
|
(1.9
|
)
|
—
|
|
—
|
|
—
|
|
(1.9
|
)
|
—
|
|
(1.9
|
)
|
|||||||||||||||||
|
Share-based compensation
|
—
|
|
—
|
|
6.2
|
|
—
|
|
—
|
|
—
|
|
6.2
|
|
—
|
|
6.2
|
|
|||||||||||||||||
|
Unrealized gain on interest rate swap contracts, net of tax
|
—
|
|
—
|
|
—
|
|
—
|
|
0.6
|
|
—
|
|
0.6
|
|
—
|
|
0.6
|
|
|||||||||||||||||
|
Unrealized gain on defined benefit obligations, net of tax
|
—
|
|
—
|
|
—
|
|
—
|
|
0.2
|
|
—
|
|
0.2
|
|
—
|
|
0.2
|
|
|||||||||||||||||
|
Tax impacts to APIC related to share-based award activity
|
—
|
|
—
|
|
2.4
|
|
—
|
|
—
|
|
—
|
|
2.4
|
|
—
|
|
2.4
|
|
|||||||||||||||||
|
Other
|
—
|
|
—
|
|
(0.2
|
)
|
—
|
|
—
|
|
—
|
|
(0.2
|
)
|
—
|
|
(0.2
|
)
|
|||||||||||||||||
|
September 29, 2017
|
37.6
|
|
$
|
0.4
|
|
$
|
342.7
|
|
$
|
—
|
|
$
|
0.8
|
|
$
|
35.1
|
|
$
|
379.0
|
|
$
|
—
|
|
$
|
379.0
|
|
|||||||||
See accompanying notes to the consolidated financial statements.
F-6
VAREX IMAGING CORPORATION
NOTES TO CONSOLIDATED FINANCIAL STATEMENTS
1. SUMMARY OF SIGNIFICANT ACCOUNTING POLICIES
Description of Business
Varex Imaging Corporation (the “Company,” “Varex” or “Varex Imaging”) designs, manufactures, sells and services a broad range of X-ray imaging components, including X-ray tubes, digital detectors and accessories, high voltage connectors, high-energy inspection accelerators, image processing software and workstations, computer-aided diagnostic software, collimators, automatic exposure control devices, generators, ionization chambers and buckys, for use in a range of applications, including radiographic or fluoroscopic imaging, mammography, computed tomography, radio therapy and computer-aided detection. The Company sells its products to imaging system original equipment manufacturer (“OEM”) customers for incorporation into new medical diagnostic, radiation therapy, dental, veterinary and industrial imaging systems, to independent service companies, distributors and directly to end-users for replacement purposes.
The Company also designs, manufacturers, sells and services industrial products, which include Linatron® X-ray accelerators, imaging processing software and image detection products for security and inspection purposes, such as cargo screening at ports and borders and nondestructive examination in a variety of applications. The Company generally sells security and inspection products to OEM customers who incorporate Varex’s products into their inspection systems. The Company conducts an active research and development program to focus on new technology and applications in both the medical and industrial X-ray imaging markets.
Varex Imaging Corporation was incorporated in Delaware on July 18, 2016 for the purpose of holding the assets and liabilities associated with the Company's business and separated from Varian Medical Systems, Inc. ("Varian") on January 28, 2017, upon which Varian completed the distribution of
100%
of the outstanding common stock of Varex to Varian stockholders. Each Varian stockholder received
0.4
of a share of Varex common stock for every one share of Varian common stock held on the close of business on January 20, 2017 (the “Record date”). Following the separation and distribution, Varex became an independent publicly-traded company and is listed on the NASDAQ Global Select Market under the ticker “VREX.”
Basis of Presentation and Principle of Consolidation
The accompanying consolidated financial statements are audited and have been prepared by the Company pursuant to the rules and regulations of the Securities and Exchange Commission (“SEC”) and prepared in accordance with accounting principles generally accepted in the United States (“GAAP”). Prior to the date of separation and distribution, the financial statements were prepared on a stand-alone basis and are derived from Varian’s consolidated financial statements and records as it operated as part of Varian prior to the distribution, in conformity with GAAP.
The consolidated financial statements include the accounts of the Company and certain other assets and liabilities that were historically held at the Varian corporate level but are specifically identifiable and attributable to the Company. Prior to the separation and distribution, the consolidated financial statements included allocations of certain Varian corporate expenses, including costs of information technology, human resources, accounting, legal, facilities, insurance, treasury and other corporate and infrastructure services. In addition, allocated costs included research and development expenses from Varian’s scientific research facility. Prior to the separation, these costs were allocated to the Company on the basis of direct usage when identifiable or other systematic measures that reflect utilization of services provided to or benefits received by the Company. The Company considers the expense allocation methodology and results to be reasonable for periods prior to separation from Varian.
All transactions between the Company and Varian prior to the separation have been included in the accompanying consolidated financial statements. All intercompany transactions while the Company operated as part of Varian were considered to be effectively settled for cash and are reflected as a component of financing activities as net transfers from (to) Varian in the consolidated statements of cash flows at the time the transactions were recorded.
Prior to the separation, the Company was dependent upon Varian for its working capital and financing requirements, as Varian uses a centralized approach to cash management and financing of its operations. Financial transactions relating to the Company
F-7
were accounted for through the net parent investment account. Cash and cash equivalents held by Varian were not allocated to the Company.
Net parent investment in the consolidated balance sheets and statements of equity represents Varian’s historical investment in the Company, the net effect of transactions with and allocations from Varian and the Company’s accumulated earnings. See Note 3, “Related Party Transactions” for further information regarding the Company’s relationships with Varian and other related-party transactions.
Segment Reporting
The Company has
two
reportable operating segments; (i) Medical and (ii) Industrial which align with how its CEO, who is identified as the CODM, views and measures the Company’s business performance. In fiscal year 2016, we re-segmented the Company's operating segments and reclassified the segment data for the prior years to conform to the current year presentation. See Note 14, “Segment Information” for further information on the Company’s segments.
Fiscal Year
The fiscal years of the Company as reported are the 52 or 53-week period ending on the Friday nearest September 30. Fiscal year 2017 is the 52-week period ending September 29, 2017. Fiscal year 2016 was the 52-week period that ended on September 30, 2016. Fiscal year 2015 was the 52-week period that ended on October 2, 2015.
Variable Interest Entities
For entities in which the Company has variable interests, the Company focuses on identifying which entity has the power to direct the activities that most significantly impact the variable interest entity’s economic performance and which enterprise has the obligation to absorb losses or the right to receive benefits from the variable interest entity. If the Company is the primary beneficiary of a variable interest entity, the assets, liabilities and results of operations of the variable interest entity will be included in the Company’s consolidated financial statement. As of September 29, 2017, the Company had
two
variable interest entities, only
one
of which were consolidated, because it was determined that the Company was the primary beneficiary. As of September 29, 2017, total assets and liabilities for the consolidated variable interest entity was
$6.4 million
and
$0.2 million
, respectively.
Use of Estimates
The preparation of financial statements in conformity with GAAP requires management to make estimates and assumptions that affect the reported amounts of assets and liabilities and disclosure of contingent assets and liabilities at the date of the consolidated financial statements and the reported amounts of revenues and expenses during the reporting periods. Actual results could differ from these estimates.
Cash and Cash Equivalents
The Company considers currency on hand, demand deposits, time deposits and all highly-liquid investments with an original maturity of three months or less at the date of purchase to be cash and cash equivalents.
Fair Value
Fair value is defined as the exchange price that would be received for an asset or paid to transfer a liability (an exit price) in the principal or most advantageous market for the asset or liability in an orderly transaction between market participants at the measurement date. There is a three-level fair value hierarchy that prioritizes the inputs used to measure fair value. This hierarchy requires entities to maximize the use of observable inputs and minimize the use of unobservable inputs. The three levels of inputs used to measure fair value are as follows:
Level 1—Quoted prices in active markets for identical assets or liabilities.
Level 2—Observable inputs other than quoted prices included in Level 1, such as quoted prices for similar assets and liabilities in active markets; quoted prices for identical or similar assets and liabilities in markets that are not active; or, other inputs that are observable or can be corroborated by observable market data.
F-8
Level 3—Unobservable inputs that are supported by little or no market activity and that are significant to the fair value of the assets or liabilities.
Derivative instruments and hedging activities
The Company records all derivatives on the balance sheet at fair value. For a derivative such as an interest rate swap that is designated as a cash flow hedge, the effective portion of changes in the fair value of the derivative is initially reported in accumulated other comprehensive income (loss) on the consolidated balance sheet and the ineffective portion of changes in the fair value of the derivative is recognized directly in earnings. To the extent the effective portion of a hedge subsequently becomes ineffective, the corresponding amount of the change in fair value of the derivative initially reported in accumulated other comprehensive income (loss) is reclassified and is recognized directly in earnings. Accordingly, on a quarterly basis, the Company assesses the effectiveness of each hedging relationship by comparing the changes in fair value or cash flows of the derivative hedging instrument with the changes in fair value or cash flows of a hypothetical designated perfect hedged item or transaction. If the change in the actual swap is greater than the change in the hypothetical perfect swap, the difference is referred to as “ineffectiveness” and is recognized in earnings in the current period.
Concentration of Risk
Financial instruments that potentially expose the Company to concentrations of credit risk consist principally of cash, cash equivalents and trade accounts receivable. Cash held with financial institutions may exceed the Federal Deposit Insurance Corporation insurance limits or similar limits in foreign jurisdictions. The Company has not experienced any losses on its deposits of cash and cash equivalents. The Company performs ongoing credit evaluations of its customers and, except for government tenders, group purchases and orders with a letter of credit, its industrial customers often provide a down payment. The Company maintains an allowance for doubtful accounts based upon the expected collectability of all accounts receivable. The Company obtains some of the components in its products from a limited group of suppliers or from a single-source supplier. The Company has neither experienced nor expects any significant disruptions to its operations due to supplier concentration.
During the periods presented, two customers accounted for a significant portion of revenues, which are as follows:
|
Fiscal Year
|
||||||||
|
2017
|
2016
|
2015
|
||||||
|
Toshiba Medical Systems
|
19.3
|
%
|
23.0
|
%
|
26.0
|
%
|
||
|
Carestream
|
*
|
|
*
|
|
12.0
|
%
|
||
|
* Indicates less than 10% of revenues for the periods presented
|
||||||||
Toshiba Medical Systems accounted for
9.0%
and
11.5%
of the Company’s accounts receivable as of
September 29, 2017
and
September 30, 2016
, respectively.
Inventories, net
Inventories, net are valued at net realizable value. Excess and obsolete inventories are determined primarily based on future demand forecasts, and write-downs of excess and obsolete inventories are recorded as a component of cost of revenues. Cost is computed using standard cost (which approximates actual cost) on a first-in-first-out basis.
The following table summarizes the Company’s inventories, net:
|
(In millions)
|
September 29, 2017
|
September 30, 2016
(1)
|
|||||
|
Raw materials and parts
|
$
|
164.5
|
|
$
|
140.8
|
|
|
|
Work-in-process
|
20.3
|
|
16.4
|
|
|||
|
Finished goods
|
49.7
|
|
40.2
|
|
|||
|
Total inventories, net
|
$
|
234.5
|
|
$
|
197.4
|
|
|
|
(1) The Company identified immaterial errors in prior periods relating to the classification of raw material and work-in-process inventory categories. The impact of these errors are $9.2 million and were not material to any prior period. Consequently, the Company corrected the errors by revising the prior year inventory disclosure. As the two line items are adjusted by offsetting amounts that do not impact the total inventory balance, the corrections had no impact on the consolidated balance sheets, income statement or statements of cash flows.
|
|||||||
F-9
Total inventories, net as of
September 29, 2017
includes approximately
$29.7 million
of inventories, net at
September 29, 2017
that related to the Acquired Detector Business.
Property, Plant and Equipment, net
Property, plant and equipment are stated at cost, net of accumulated depreciation. Major improvements are capitalized, while repairs and maintenance are expensed as incurred. Depreciation and amortization are computed using the straight-line method over the estimated useful lives of the assets. Land is not subject to depreciation, but land improvements are depreciated over
fifteen
years. Land leasehold rights and leasehold improvements are amortized over the lesser of their estimated useful lives or remaining lease terms. Buildings are depreciated over
twenty
years. Machinery and equipment are depreciated over their estimated useful lives, which range from
three
to
seven
years. Assets subject to lease are amortized over the lesser of their estimated useful lives or remaining lease terms. Estimated useful lives are periodically reviewed and, when appropriate, changes are made prospectively. When certain events or changes in operating conditions occur, asset lives may be adjusted, and an impairment assessment may be performed on the recoverability of the carrying amounts. When assets are retired or otherwise disposed of, the assets and related accumulated depreciation are removed from the accounts.
The following table summarizes the Company’s property, plant and equipment, net:
|
(In millions)
|
September 29, 2017
|
September 30, 2016
|
|||||
|
Land and land improvements
|
$
|
5.1
|
|
$
|
2.9
|
|
|
|
Buildings and leasehold improvements
|
132.2
|
|
103.3
|
|
|||
|
Machinery
|
153.9
|
|
121.0
|
|
|||
|
Construction in progress
|
24.3
|
|
18.3
|
|
|||
|
$
|
315.5
|
|
$
|
245.5
|
|
||
|
Accumulated depreciation and amortization
|
(167.2
|
)
|
(136.6
|
)
|
|||
|
Property, plant, and equipment, net
|
$
|
148.3
|
|
$
|
108.9
|
|
|
Total property, plant, and equipment, net as of
September 29, 2017
includes approximately
$21.1 million
of property, plant, and equipment, net at
September 29, 2017
that related to the Acquired Detector Business.
The Company recorded depreciation expense of
$16.9 million
,
$9.8 million
and
$9.6 million
, in fiscal yeas 2017, 2016 and 2015, respectively.
Investments
The Company accounts for its equity investments in privately-held companies under the equity method of accounting if the Company has the ability to exercise significant influence in these investments. The Company monitors these equity investments for impairment and makes appropriate reductions in carrying values if the Company determines that impairment charges are required based primarily on the financial condition and near-term prospects of these companies.
Goodwill and Intangible Assets
Goodwill is recorded when the purchase price of an acquisition exceeds the fair value of the net identified tangible and intangible assets acquired. Purchased intangible assets are carried at cost, net of accumulated amortization, and are included in intangible assets in the Company's consolidated balance sheets. Intangible assets with finite lives are amortized over their estimated useful lives of primarily
two
to
seven
years using the straight-line method.
Impairment of Long-lived Assets, Intangible Assets and Goodwill
The Company reviews long-lived assets and identifiable intangible assets with finite lives for impairment whenever events or changes in circumstances indicate that the carrying amount of these assets may not be recoverable. The Company assesses these assets for impairment based on their estimated undiscounted future cash flows. If the carrying value of the assets exceeds the estimated
F-10
future undiscounted cash flows, the Company recognizes an impairment loss based on the excess of the carrying amount over the fair value of the assets. The Company did not recognize any impairment charges for long-lived assets and identifiable intangible assets during any of the periods presented.
The Company evaluates goodwill and indefinite lived intangible assets qualitatively for impairment at least annually in beginning of the fourth quarter of each fiscal year or whenever an event occurs or circumstances change that would more likely than not reduce the fair value of a reporting unit below its carrying amount. If the Company determines that a quantitative analysis is necessary, the impairment test for goodwill is currently a two-step process. Step one consists of a comparison of the fair value of a reporting unit against its carrying amount, including the goodwill allocated to each reporting unit. The Company determines the fair value of its reporting units based on a combination of income and market approaches. The income approach is based on the present value of estimated future cash flows of the reporting units, and the market approach is based on a market multiple calculated for each reporting unit based on market data of other companies engaged in similar business. If the carrying amount of the reporting unit is in excess of its fair value, step two requires the comparison of the implied fair value of the reporting unit’s goodwill against the carrying amount of the reporting unit’s goodwill. Any excess of the carrying value of the reporting unit’s goodwill over the implied fair value of the reporting unit’s goodwill is recorded as an impairment loss. The impairment test for intangible assets with indefinite useful lives, if any, consists of a comparison of fair value to carrying value, with any excess of carrying value over fair value being recorded as an impairment loss.
No impairment charges were recognized in fiscal year 2017, 2016 or 2015. As a result of the segment realignment in the fourth quarter of fiscal year 2016, goodwill was re-allocated to the Medical and Industrial reporting units based on their relative fair values.
No
impairment charges were recognized as a result of the change in reporting units. The Company performs its annual goodwill impairment analysis during the fourth quarter of its fiscal year.
Loss Contingencies
From time to time, the Company is a party to or otherwise involved in legal proceedings, claims and government inspections or investigations and other legal matters, both inside and outside the United States, arising in the ordinary course of its business or otherwise. The Company accrues amounts, to the extent they can be reasonably estimated, that it believes are adequate to address any liabilities related to legal proceedings and other loss contingencies that it believes will result in a probable loss.
Product Warranty
The Company warrants most of its products for a specific period of time, usually
12
to
24
months from delivery or acceptance, against material defects. The Company provides for the estimated future costs of warranty obligations in cost of revenues when the related revenues are recognized. The accrued warranty costs represent the best estimate at the time of sale of the total costs that the Company will incur to repair or replace product parts that fail while still under warranty.
The amount of the accrued estimated warranty costs obligation for established products is primarily based on historical experience as to product failures adjusted for current information on repair costs. For new products, estimates include the historical experience of similar products, as well as reasonable allowance for warranty expenses associated with new products. On a quarterly basis, the Company reviews the accrued warranty costs and updates the historical warranty cost trends, if required.
The following table reflects the changes in the Company’s accrued product warranty:
|
Fiscal Years
|
|||||||
|
(In millions)
|
2017
|
2016
|
|||||
|
Accrued product warranty, at beginning of period
|
$
|
6.9
|
|
$
|
6.1
|
|
|
|
Product warranty for acquisitions during period
|
1.3
|
|
—
|
|
|||
|
Charged to cost of revenues
|
10.7
|
|
13.1
|
|
|||
|
Actual product warranty expenditures
|
(11.9
|
)
|
(12.3
|
)
|
|||
|
Accrued product warranty, at end of period
|
$
|
7.0
|
|
$
|
6.9
|
|
|
Revenue Recognition
F-11
The Company’s revenues are derived primarily from the sale of hardware and software products, and services. The Company recognizes its revenues net of any value added or sales tax and net of sales discounts.
The Company sells a high proportion of its X-ray products to a limited number of OEM customers. X-ray tubes, digital detectors and image-processing tools and security and inspection products are generally sold on a stand-alone basis. However, the Company occasionally sells its digital detectors, X-ray tubes and imaging processing tools as a package that is optimized for digital X-ray imaging and sells its Linatron
®
X-ray accelerators together with its imaging processing software and image detection products to OEM customers that incorporate them into their inspection systems. Service contracts are often sold with certain security and inspection products and computer-aided detection products. Revenues related to service contracts usually start after the expiration of the warranty period for non-software products or upon delivery of software products.
For a multiple-element arrangement that includes software and non-software deliverables which includes service contracts, the Company first allocates revenues among the software and non-software deliverables on a relative selling price basis. The amounts allocated to the non-software products and software are accounted for as follows:
Non-Software Products
Non-software products include hardware products, software components that function together with the hardware components to deliver the product’s essential functionality, as well as service contracts. Except as described below under “Service,” the Company recognizes revenues for non-software products when persuasive evidence of an arrangement exists, delivery has occurred or services have been rendered, the price is fixed or determinable and collectability is reasonably assured.
For multiple-element revenue arrangements that involve non-software products, a delivered non-software element is considered as a separate unit of accounting when it has stand-alone value and there is no customer-negotiated refund or return rights for the delivered element. The allocation of revenue to all deliverables based on their relative selling prices is determined at the inception of the arrangement. The selling price for each deliverable is determined using vendor-specific objective evidence (“VSOE”) of selling price, if it exists; otherwise, third-party evidence of selling price (“TPE”) is used.
If the Company is not able to establish VSOE or TPE of selling prices for its non-software products, the Company uses the deliverable's estimated selling price (“ESP”). The Company estimates selling prices following an established process that considers market conditions, including the product offerings and pricing strategies of competitors, as well as internal factors such as historical pricing practices and margin objectives. The establishment of product and service ESPs is controlled and reviewed by the appropriate level of management in all of the Company’s businesses.
The Company recognizes revenues upon the transfer of risk of loss, which is either at the time of shipment or delivery, depending upon the terms of the contract, provided that all other revenue recognition criteria have been met.
Software Products
The Company recognizes revenues for software products in accordance with the software revenue recognition guidance. The Company recognizes license revenues when all of the following criteria have been met: persuasive evidence of an arrangement exists, the vendor’s fee is fixed or determinable, collection of the related receivable is probable and delivery of the product has occurred.
Revenues earned on software arrangements involving multiple elements are allocated to each element based on VSOE of fair value, which is based on the price charged when the same element is sold separately. In instances when evidence of VSOE of fair value of all undelivered elements exists, but evidence does not exist for one or more delivered elements, revenues are recognized using the residual method. Under the residual method, the fair value of the undelivered elements is deferred and the remaining portion of the arrangement fee is recognized as revenue.
For those software products that are not sold stand-alone or for which VSOE cannot be established or maintained, all software revenue under the contract will be deferred until the software product(s) that lack VSOE are all delivered. If the only undelivered software element that lacks VSOE is maintenance and support, then the software revenue would be recognized ratably over the term of the maintenance and support arrangement.
The Company recognizes revenues upon the transfer of risk of loss, which is either at the time of shipment or delivery, depending upon the shipping terms of the contract, provided that all other criteria for revenue recognition have been met.
F-12
Service
Service revenues include revenues from hardware and software service contracts, including maintenance and support, bundled support arrangements, paid services and trainings and parts that are sold by the service department. Revenues allocated to service contracts are recognized ratably over the period of performance of the related contracts. Revenues related to services performed on a time-and-materials basis are recognized when they are earned and billable.
Deferred Revenues
Deferred revenue primarily represents (i) the amount billed, billable or received applicable to non-software products for which parts and services have not been delivered, (ii) the amount billed, billable or received applicable to software products for which the Company’s obligations under the maintenance contracts have not been fulfilled and (iii) the amount billed, billable or received for service contracts for which the services have not been rendered. Except for government tenders, group purchases and orders with letters of credit, the Company's security and inspection customers often provide a down payment prior to transfer of risk of loss of ordered products. These payments are also included in deferred revenue on the consolidated balance sheets.
Allowance for Doubtful Accounts
The Company evaluates the creditworthiness of customers prior to authorizing shipment for all major sale transactions. On a quarterly basis, the Company evaluates aged items in the accounts receivable aging report and provide an allowance in an amount deemed adequate for doubtful accounts. If the evaluation of customers’ financial conditions does not reflect a future ability to collect outstanding receivables, additional provisions may be needed.
The following table reflects the changes in the Company’s allowance for doubtful accounts:
|
Fiscal Years
|
|||||||
|
(In millions)
|
2017
|
2016
|
|||||
|
Allowance for doubtful accounts, at beginning of period
|
$
|
0.2
|
|
$
|
0.1
|
|
|
|
Charged to bad debt expense
|
0.4
|
|
0.1
|
|
|||
|
Write-offs charged to allowance
|
(0.2
|
)
|
—
|
|
|||
|
Allowance for doubtful accounts, at end of period
|
$
|
0.4
|
|
$
|
0.2
|
|
|
Share-Based Compensation Expense
The Company has an equity-based incentive plan that provides for the grant of nonqualified stock options and restricted stock units to directors, officers and other employees. The Company also permits employees to purchase shares under the Varex employee stock purchase plan. Prior to the separation, the Company’s employees historically participated in Varian’s equity-based incentive plans. Share-based compensation expense through the date of separation included allocations to the Company based on the awards and terms previously granted to its employees as well as an allocation of Varian’s corporate and shared functional employee expenses.
The Company values stock options granted and the option component of the shares of common stock purchased under the equity-based incentive plans and stock purchased under the employee stock purchase plan using the Black-Scholes option-pricing model. Share-based compensation expense for restricted stock units is measured using the fair value of the Company’s stock on the date of grant and is amortized over the award’s respective service period. The Black-Scholes option-pricing model requires the input of certain assumptions, and changes in the assumptions can materially affect the fair value estimates of share-based payment awards.
The Company measures and recognizes expense for all share-based payment awards based on their fair values. Share-based compensation expense recognized in the consolidated statements of earnings includes compensation expense for the share-based payment awards based on the grant date fair value estimated in accordance with the guidance on share-based compensation. Share-based compensation expense recognized is based on the value of the portion of share-based payment awards that is ultimately expected to vest. The Company attributes the value of share-based compensation to expense using the straight-line method. The Company considers only the direct tax impacts of share-based compensation awards when calculating the amount of tax windfalls or shortfalls.
F-13
Shipping and Handling Costs
Shipping and handling costs are included as a component of cost of revenues.
Research and Development
Research and development costs have been expensed as incurred. These costs primarily include employees’ compensation, consulting fees and material costs.
Software Development Costs
Costs for the development of new software products and substantial enhancements to existing software products are expensed as incurred until technological feasibility has been established, at which time any additional costs would be capitalized. No costs associated with the development of software have been capitalized, as the Company believes its current software development process is essentially completed concurrent with the establishment of technological feasibility.
Taxes on Earnings
Taxes on earnings, as presented, are calculated on a separate return basis. Under this method, the Company computes taxes on earnings as if it were a separate taxpayer filing its own income tax returns for the full year. However, as the Company only became an actual separate taxpayer upon separation from Varian, the amounts recorded may differ from the amounts that would have been reflected in the financial statements had it been an entity that operated independently of Varian for the entire period. This is partially due to a different tax structure and tax accounting elections and assertions for the periods before and after separation.
Generally, the carrying value of net deferred tax assets assumes that the Company will generate sufficient future taxable earnings in the applicable tax jurisdictions to utilize these deferred tax assets. In the period in which the Company concludes that it will be unable to recover the net deferred tax assets in each jurisdiction, it will increase the valuation allowance and its tax provision will increase in the period in which it makes such a determination.
Significant judgments and estimates are required in evaluating the Company’s tax positions and provision for taxes on earnings. The Company accounts for uncertainty in income taxes following a two-step approach for recognizing and measuring uncertain tax positions. The first step is to evaluate the tax position for recognition by determining whether the weight of available evidence indicates that it is more likely than not that, based on the technical merits, the position will be sustained on audit, including resolution of related appeals or litigation processes, if any. The second step is to measure the tax benefit as the largest amount that is more than 50% likely of being realized upon settlement. Recognition and measurement are based on management’s best judgment given the facts, circumstances and information available at the end of the accounting period.
The Company is subject to taxes on earnings in both the United States and numerous foreign jurisdictions. Foreign earnings are generally taxed at rates lower than United States rates, earnings in certain foreign jurisdictions are currently subject to tax in the United States, and the benefit of losses generated in other foreign jurisdictions is reduced due to full valuation allowance positions in those jurisdictions. Our effective tax rate is impacted by these factors as well as existing laws in both the United States and in the respective countries in which foreign subsidiaries do business. In addition, a change in the mix of earnings and losses among the various jurisdictions could increase or decrease our effective tax rate.
Foreign Currency Translation
The Company uses the U.S. Dollar as the functional currency of its foreign operations. Gains and losses from remeasurement of foreign currency balances into U.S. Dollars are included in the consolidated statements of earnings.
Recent Accounting Standards Updates Not Yet Effective
In August 2017, the FASB issued issued Accounting Standard Update ("ASU") 2017-12 which targets improvements to accounting for hedging activities which amends and simplifies existing guidance in order to allow companies to more accurately present the economic effects of risk management activities in the financial statements. The guidance is effective for fiscal years
F-14
beginning after December 15, 2018, and interim periods within those fiscal years. The Company does not expect that the adoption of this guidance will have a material impact on its consolidated financial statements.
In May 2017, the FASB issued ASU 2017-09 which provides guidance about which changes to the terms or conditions of a share-based payment award require an entity to apply modification accounting. The guidance is effective for the Company beginning in the first quarter of fiscal year 2019. Early adoption is permitted. The Company does not expect that the adoption of this guidance will have a material impact on its consolidated financial statements.
In March 2017, the FASB issued ASU 2017-07 which amended its guidance on the accounting related to defined benefit plans and other post-retirement benefits. This amendment requires the service cost component of net periodic pension and post-retirement benefit cost be presented in the same line item as other employee compensation costs, while the other components be presented separately as non-operating income (expense). The amendment will be effective for the Company beginning in its first quarter of fiscal year 2019. Early adoption is permitted. The Company is evaluating the impact of adopting this amendment to its consolidated financial statements.
In January 2017, the FASB issued ASU 2017-04 which clarified its guidance to simplify the measurement of goodwill by eliminating the Step 2 impairment test. The new guidance requires companies to perform the goodwill impairment test by comparing the fair value of a reporting unit with its carrying amount. The amendment will be effective for the Company beginning in its first quarter of fiscal year 2021. The amendment is required to be adopted prospectively. Early adoption is permitted. The Company is evaluating the impact of adopting this amendment to its consolidated financial statements.
In February 2016, the FASB issued ASU 2016-02 on accounting for leases. The new standard is intended to provide enhanced transparency and comparability by requiring lessees to record right-of-use assets and corresponding lease liabilities on the balance sheet. The new standard will continue to classify leases as either finance or operating, with classification affecting the pattern of expense recognition in the statement of earnings. The new standard is required to be adopted using a modified retrospective method to each prior reporting period presented with various optional practical expedients. The new standard will be effective for the Company beginning in its first quarter of fiscal year 2020 with early adoption permitted. The Company is evaluating the impact of adopting this new standard to its consolidated financial statements.
In March 2016, the FASB issued ASU 2016-09 which includes an amendment to its accounting guidance related to employee share-based payments. The amendment simplifies several aspects of the accounting for employee share-based payments, including the accounting for income taxes, forfeitures, and statutory tax withholding requirements, as well as classification in the statement of cash flows. The amendment will be effective for the Company beginning in its first quarter of fiscal year 2018 with early adoption permitted. The Company is evaluating the impact of adopting this amendment to its consolidated financial statements.
In May 2014, the FASB issued ASU 2014-09, a new revenue standard, which sets forth a single, comprehensive revenue recognition model for all contracts with customers to improve comparability. The new standard requires revenue recognition to depict the transfer of goods or services to customers in an amount that reflects the consideration to which the entity expects to be entitled in exchange for those goods or services. In March 2016, the FASB amended the principal-versus-agent implementation guidance and illustrations in the new standard. In April 2016, the FASB amended the guidance on identifying performance obligations and the implementation guidance on licensing in the new standard. In May 2016, the FASB amended the guidance on collectability, noncash consideration, presentation of sales tax and transition in the new standard. The new standard will be effective for the Company beginning in its first quarter of fiscal year 2019, with early adoption permitted, but not before the first quarter of fiscal year 2018. The new standard can be applied either retrospectively to each prior reporting period presented (
i.e.
, full retrospective adoption) or with the cumulative effect of initially applying the update recognized at the date of the initial application (
i.e.
, modified retrospective adoption) along with additional disclosures. The Company is evaluating the timing and the impact of adopting this standard to its consolidated financial statements.
2. BUSINESS COMBINATIONS
Acquisition of PerkinElmer’s Medical Imaging Business
On May 1, 2017, the Company completed the acquisition of the PerkinElmer, Inc. (“PKI”) Medical Imaging business (“Acquired Detector Business”) for the initial purchase price of
$277.4 million
, or
$273.2 million
after post-closing working capital adjustments. The acquisition consisted of PerkinElmer Medical Holdings, Inc. and Dexela Limited, together with certain assets of PKI and its direct and indirect subsidiaries relating to digital flat panel X-ray detectors that serve as components for industrial, medical,
F-15
dental and veterinary X-ray imaging systems. The Acquired Detector Business has about
280
employees, is headquartered in Santa Clara, California and has additional operations in Germany, the Netherlands, China and the United Kingdom. The acquisition of Acquired Detector Business was pursuant to the Master Purchase and Sale Agreement, dated December 21, 2016 (the “Purchase Agreement”), by and between PKI and Varian and the subsequent Assignment and Assumption Agreement, dated January 27, 2017, by and between Varian and Varex, pursuant to which Varian assigned and conveyed all of its rights, obligations, title and interest in the Purchase Agreement to Varex. The Company believes that the acquisition could result in opportunities to increase its imaging expertise and complement its existing imaging detector business while providing revenue and cost synergy opportunities over time.
The following amounts represent the preliminary determination of the fair value of identifiable assets acquired and liabilities for the Acquired Detector Business:
|
(In millions)
|
Fair Value
|
||
|
Total cash consideration
|
$
|
273.2
|
|
|
Allocation of the purchase consideration:
|
|||
|
Cash
|
1.4
|
|
|
|
Accounts Receivable
|
18.7
|
|
|
|
Inventory
|
34.7
|
|
|
|
Prepaids and other current assets
|
0.6
|
|
|
|
Property, plant, and equipment
|
21.4
|
|
|
|
Other assets, non-current
|
2.0
|
|
|
|
Intangibles
|
81.1
|
|
|
|
Goodwill
|
167.3
|
|
|
|
Total assets acquired
|
327.2
|
|
|
|
Current liabilities
|
(17.2
|
)
|
|
|
Other liabilities, non-current
|
(36.8
|
)
|
|
|
Total liabilities assumed
|
(54.0
|
)
|
|
|
Net assets acquired
|
$
|
273.2
|
|
The fair value assigned to goodwill is attributable to expected cost synergy opportunities. Included in the goodwill recorded for the Acquired Detector Business is approximately
$35 million
that will be deductible for income tax purposes in Germany, China and the Netherlands. The remaining goodwill related to the stock acquisition in the United States is not tax deductible. Also, as a result of the acquisition, non-current deferred income tax liability increased by approximately
$31 million
related to basis differences for both tangible and intangible assets acquired as part of the stock purchases in the United States and the United Kingdom, and asset purchases in Germany, the Netherlands and China.
The following amounts represent the preliminary determination of the fair value of identifiable intangible assets for the Acquired Detector Business, which are amortized straight-line:
|
(In millions)
|
Fair Value
|
Estimated
Useful Life (In Years) |
|||
|
Favorable leasehold interests
|
$
|
3.8
|
|
16
|
|
|
Backlog
|
1.2
|
|
1
|
||
|
Trade names
|
1.4
|
|
5
|
||
|
Developed technology
|
37.7
|
|
7
|
||
|
In-process research and development
|
4.0
|
|
indefinite
|
||
|
Customer relationships
|
33.0
|
|
7
|
||
|
Total intangible assets acquired
|
$
|
81.1
|
|
||
F-16
The following amounts represent revenues by reporting segment from the Acquired Detector Business from the acquisition date of May 1, 2017 through September 29, 2017:
|
(In millions)
|
May 1, 2017 through September 29, 2017
|
||
|
Acquired Detector Business
|
|||
|
Medical
|
$
|
41.1
|
|
|
Industrial
|
20.2
|
|
|
|
Total Acquired Detector Business revenues
|
$
|
61.3
|
|
Unaudited Pro Forma Information
The unaudited pro-forma amounts presented below for the fiscal year 2017 and fiscal year 2016 are presented for informational purposes only. In addition to the Company's results for the periods presented, the amounts below also include effects of the Acquired Detector Business as if it had been consummated on October 3, 2015. Audited results for the Acquired Detector Business for the fiscal years ended 2016 and 2015, are noted in the Company’s Form 8-K/A filed with the SEC on July 7, 2017. These unaudited pro-forma results include effects that are directly attributable to the acquisition which include the amortization of intangible assets, interest expense, and other adjustments, including estimated tax effects. The unaudited pro-forma results do not reflect any operating efficiencies or potential cost savings which may result from the consolidation of the Acquired Detector Business and are not necessarily indicative of what the actual results of operations of the combined company would have been if the acquisition had occurred at the beginning of the period presented nor are they indicative of future results of operations or results that might have been achieved had the acquisition been consummated as of October 3, 2015.
|
Fiscal Year
|
|||||||
|
(In millions)
|
2017
|
2016
|
|||||
|
Revenue
|
$
|
777.8
|
|
$
|
766.3
|
|
|
|
Operating earnings
|
$
|
84.7
|
|
$
|
115.9
|
|
|
|
Net earnings
|
$
|
43.1
|
|
$
|
64.8
|
|
|
|
Net earnings per share, basic
|
$
|
1.15
|
|
$
|
1.73
|
|
|
|
Net earnings per share, diluted
|
$
|
1.13
|
|
$
|
1.72
|
|
|
3. RELATED-PARTY TRANSACTIONS
Transactions with Varian Medical Systems, Inc.
During fiscal years 2017, 2016 and 2015, the Company recorded sales to Varian of
$24.6 million
,
$22.5 million
and
$21.1 million
, respectively, and recorded purchases of products from Varian of
$1.9 million
,
$0.9 million
and
$2.8 million
, respectively.
Allocated Costs
Prior to the separation on January 28, 2017, the consolidated financial statements include allocations of corporate expenses from Varian to the Company. These allocated expenses include costs of information technology, human resources, accounting, legal, facilities, insurance, treasury and other corporate and infrastructure services. Allocated costs also include research and development expenses from Varian’s scientific research facility. These costs have been allocated to the Company on the basis of direct usage when identifiable or other systematic measures that reflect utilization of services provided to or benefits received by the Company. The Company considers the expense allocation methodology and results to be reasonable for all periods presented.
Allocated costs included in the accompanying consolidated statements of earnings are as follows:
|
Fiscal Year
|
|||||||||||
|
(In millions)
|
2017
|
2016
|
2015
|
||||||||
|
Selling, general and administrative
|
$
|
12.4
|
|
$
|
37.7
|
|
$
|
38.0
|
|
||
|
Research and development
|
—
|
|
1.2
|
|
1.4
|
|
|||||
|
Interest expense, net of interest income
|
0.5
|
|
1.6
|
|
0.7
|
|
|||||
F-17
Net Parent Investment
In conjunction with the separation, net parent company investment in the consolidated balance sheets and consolidated statements of equity was converted into Varex common stock.
In accordance with the Separation and Distribution Agreement, the Company transferred
$27.1 million
to Varian during the twelve months ended 2017, which represented all cash and cash equivalents in excess of
$5 million
, other than any cash and cash equivalents held by MeVis Medical Solutions AG (“MeVis”) on January 28, 2017 and any Varex entities needed in order to complete the transfer of certain assets and subsidiaries from Varian. Funds held to complete these asset and subsidiary transfers was approximately
$7.9 million
as of 2017 and is included in accrued liabilities.
Investment in Privately-Held Companies
The Company has a
40%
ownership interest in dpiX Holding LLC (“dpiX Holding”), a
four
-member consortium that has a
100%
ownership interest in dpiX LLC (“dpiX”), a supplier of amorphous silicon based thin film transistor arrays for digital flat panel image detectors. In accordance with the dpiX Holding Agreement, net profits or losses are allocated to the members, in accordance with their ownership interests.
The equity investment in dpiX Holding is accounted for under the equity method of accounting. When the Company recognizes its share of net profits or losses of dpiX Holding, profits or losses in inventory purchased from dpiX are eliminated until realized by the Company. In fiscal years 2017, 2016 and 2015, the Company recorded income and (loss) on the equity investment in dpiX Holding of
$0.8 million
,
$(1.5) million
and
$0.1 million
, respectively. Income and loss on the equity investment in dpiX Holding is included in other income (expense), net in the consolidated statements of earnings. The carrying value of the equity investment in dpiX Holding, which was included in investments in privately-held companies on the consolidated balance sheets, was
$50.0 million
and
$47.2 million
at September 29, 2017 and September 30, 2016, respectively.
In fiscal years 2017, 2016 and 2015, the Company purchased glass transistor arrays from dpiX totaling
$24.7 million
,
$23.4 million
and
$21.3 million
, respectively. These purchases of glass transistor arrays are included as a component of inventories on the consolidated balance sheets or cost of revenues in the consolidated statements of earnings for these fiscal years.
As of September 29, 2017 and September 30, 2016, the Company had accounts payable to dpiX totaling
$3.4 million
and
$4.2 million
, respectively.
In October 2013, the Company entered into an amended agreement with dpiX and other parties that, among other things, provides the Company with the right to
50%
of dpiX’s total manufacturing capacity produced after January 1, 2014. The amended agreement requires the Company to pay for
50%
of the fixed costs (as defined in the amended agreement), as determined at the beginning of each calendar year. As of September 29, 2017, the Company estimated it has fixed cost commitments of
$4.1 million
related to this amended agreement through the remainder of calendar year 2017. The fixed cost commitment for future periods will be determined and approved by the dpiX board of directors at the beginning of each calendar year. The amended agreement will continue unless the ownership structure of dpiX changes (as defined in the amended agreement).
The Company has determined that dpiX is a variable interest entity because at-risk equity holders, as a group, lack the characteristics of a controlling financial interest. Majority votes are required to direct the manufacturing activities, legal operations and other activities that most significantly affect dpiX’s economic performance. The Company does not have majority voting rights and no power to direct the activities of dpiX and therefore is not the primary beneficiary of dpiX. The Company’s exposure to loss as a result of its involvement with dpiX is limited to the carrying value of the Company’s investment of
$50.0 million
and fixed cost commitments of
$4.1 million
.
4. OTHER FINANCIAL INFORMATION
F-18
The following table summarizes the Company’s accrued liabilities:
|
(In millions)
|
September 29, 2017
|
September 30, 2016
|
|||||
|
Accrued compensation and benefits
|
$
|
26.0
|
|
$
|
13.6
|
|
|
|
Product warranty
|
7.0
|
|
6.9
|
|
|||
|
Income taxes payable
|
13.2
|
|
0.2
|
|
|||
|
Payable to Varian Medical Systems
|
7.9
|
|
—
|
|
|||
|
Other
|
8.3
|
|
3.2
|
|
|||
|
Total accrued liabilities
|
$
|
62.4
|
|
$
|
23.9
|
|
|
The following table summarizes the Company’s other long-term liabilities:
|
(In millions)
|
September 29, 2017
|
September 30, 2016
|
|||||
|
Long-term income tax payable
|
$
|
—
|
|
$
|
4.9
|
|
|
|
Environment liabilities
|
$
|
1.3
|
|
$
|
0.3
|
|
|
|
Defined benefit obligation liability
|
3.2
|
|
—
|
|
|||
|
Other
|
0.2
|
|
0.1
|
|
|||
|
Total other long-term liabilities
|
$
|
4.7
|
|
$
|
5.3
|
|
|
The following table summarizes the Company’s other income (expense), net:
|
Fiscal Years
|
|||||||||||
|
(In millions)
|
2017
|
2016
|
2015
|
||||||||
|
Income (loss) from equity method investments
|
$
|
1.3
|
|
$
|
(1.6
|
)
|
$
|
0.3
|
|
||
|
Realized income (loss) on foreign currencies
|
1.9
|
|
(0.9
|
)
|
0.5
|
|
|||||
|
Total other income (expense), net
|
$
|
3.2
|
|
$
|
(2.5
|
)
|
$
|
0.8
|
|
||
5. NET EARNINGS PER SHARE
Basic net earnings per common share is computed by dividing the net earnings for the period by the weighted average number of shares of common stock outstanding during the reporting period. Diluted net earnings per common share reflects the effects of potentially dilutive securities, which is computed by dividing net earnings by the sum of the weighted average number of common shares outstanding and dilutive common shares, which consists of stock options and unvested restricted stock.
A reconciliation of the numerator and denominator used in the calculation of basic and diluted net income per common share is as follows:
|
Fiscal Year
|
|||||||||||
|
(In millions, except per share amounts)
|
2017
|
2016
(1)
|
2015
(1)
|
||||||||
|
Net earnings attributable to Varex
|
$
|
51.6
|
|
$
|
68.5
|
|
$
|
80.0
|
|
||
|
Weighted average shares outstanding - basic
|
37.6
|
|
37.4
|
|
37.4
|
|
|||||
|
Dilutive effect of potential common shares
|
0.4
|
|
0.3
|
|
0.3
|
|
|||||
|
Weighted average shares outstanding - diluted
|
38.0
|
|
37.7
|
|
37.7
|
|
|||||
|
Net earnings per share attributable to Varex - basic
|
$
|
1.37
|
|
$
|
1.83
|
|
$
|
2.14
|
|
||
|
Net earnings per share attributable to Varex - diluted
|
$
|
1.36
|
|
$
|
1.82
|
|
$
|
2.12
|
|
||
|
Anti-dilutive employee shared based awards, excluded
|
1.0
|
|
0.7
|
|
0.7
|
|
|||||
(1) Basic and diluted net earnings for fiscal years 2016 and 2015 is calculated using the number of common shares distributed on January 28, 2017.
F-19
The Company excludes potentially dilutive common shares (consisting of shares underlying stock options and the employee stock purchase plan) from the computation of diluted weighted average shares outstanding if the inclusion of the shares underlying these stock awards would be anti-dilutive to earnings per share.
6. FINANCIAL DERIVATIVES AND HEDGING ACTIVITIES
As part of the Company’s overall risk management practices, the Company enters into financial derivatives, which include interest rate swaps designed as cash flow hedges, to hedge the LIBOR-based, floating interest rate on its debt.
The Company records all derivatives on the consolidated balance sheets at fair value. The accounting for changes in the fair value of derivatives depends on the intended use of the derivative, whether the Company has elected to designate a derivative in a hedging relationship and apply hedge accounting, and whether the hedging relationship has satisfied the criteria necessary to apply hedge accounting.
The effective portion of the gain or loss on derivative instruments designated and qualifying for cash flow hedge accounting is deferred in other comprehensive income. Any ineffectiveness in these designated hedging relationships is recognized in current period earnings. The changes in fair value for all trades that are not designated for hedge accounting are recognized in current period earnings. Deferred gains or losses from designated cash flow hedges are reclassified into earnings in the period that the hedged interest expense effect earnings. The effectiveness of cash flow hedges is assessed at inception and quarterly thereafter. If the instrument were to no longer qualify for hedge accounting due to it becoming probable that the originally-forecasted hedged transactions will not occur, then hedge accounting would cease and the related change in fair value of the ineffective portion of the derivative instrument would be reclassified from accumulated other comprehensive income (loss) and recognized in earnings. The Company does not offset fair value amounts recognized for derivative instruments in its balance sheet for presentation purposes.
Credit risk related to derivative transactions reflects the risk that a party to the transaction could fail to meet its obligation under the derivative contracts. Therefore, the Company’s exposure to the counterparty’s credit risk is generally limited to the amounts, if any, by which the counterparty’s obligations to the Company exceed the Company’s obligations to the counterparty. The Company’s policy is to enter into contracts only with financial institutions which meet certain minimum credit ratings to help mitigate counterparty credit risk.
Derivatives Designated as Hedging Instruments - Cash Flow Hedges
The Company uses interest rate swap contracts as cash flow hedges to manage its exposure to fluctuations in LIBOR interest rates. Interest rate swap contracts hedging variable rate debt effectively fix the LIBOR component of its interest rate for a specific period of time.
The effective portion of changes in the fair value of derivatives designated and qualifying as cash flow hedges is deferred as a component of accumulated other comprehensive income in the accompanying consolidated balance sheets and is subsequently reclassified into earnings in the period that the hedged interest expense effects earnings. The ineffective portion of the changes in fair value of derivatives designated as cash flow hedges are recognized directly to earnings and reflected in the accompanying consolidated statements of earnings. No ineffectiveness was reported in earnings for fiscal year 2017.
As of September 29, 2017, the Company had the following outstanding derivatives designated as hedging instruments:
|
(In millions, except for number of instruments)
|
Number of Instruments
|
Notional Value
|
|||
|
Interest Rate Swap Contracts
|
6
|
$
|
292.5
|
|
|
These contracts have maturities of
four years
or less.
The following table summarizes the amount of income recognized from derivative instruments for the periods indicated and the line items in the accompanying statements of operations where the results are recorded for cash flow hedges:
F-20
|
Amount of Gain (Loss) Recognized in OCI on Derivative (Effective Portion) Fiscal Year Ended
|
Location of Gain or (Loss) Reclassified from Accumulated OCI into Income (Effective Portion)
|
Amount of Gain (Loss) Reclassified from Accumulated OCI into Income (Effective Portion) Fiscal Year Ended
|
Location of Gain or (Loss) Recognized in Income on Derivative (Ineffective Portion)
|
Amount of Gain or (Loss) Recognized in Income on Derivative (Ineffective Portion)
Fiscal Year Ended |
|||||||||||||||||||||||||||||||||||
|
(In millions)
|
2017
|
2016
|
2015
|
2017
|
2016
|
2015
|
2017
|
2016
|
2015
|
||||||||||||||||||||||||||||||
|
Interest Rate Swap Contracts
|
$
|
0.6
|
|
$
|
—
|
|
$
|
—
|
|
Interest expense
|
$
|
(0.3
|
)
|
$
|
—
|
|
$
|
—
|
|
Interest expense
|
$
|
—
|
|
$
|
—
|
|
$
|
—
|
|
||||||||||
The Company expects that approximately
$0.9 million
recorded as a component of accumulated other comprehensive income (loss) will be realized in the statements of earnings over the next 12 months and the amount will vary depending on interest rates.
These derivative instruments are subject to master netting agreements giving effect to rights of offset with each counterparty. The following table summarizes the fair values of derivative instruments as of the periods indicated and the line items in the accompanying consolidated balance sheets where the instruments are recorded:
|
Derivative Assets
|
Derivative Liabilities
|
||||||||||||||||||
|
(In millions)
|
September 29, 2017
|
September 30, 2016
|
September 29, 2017
|
September 30, 2016
|
|||||||||||||||
|
Derivatives designated as cash flow hedges
|
Balance sheet location
|
Balance sheet location
|
|||||||||||||||||
|
Interest rate swap contracts
|
Other non-current assets
|
$
|
1.6
|
|
$
|
—
|
|
Other non-current assets
|
$
|
—
|
|
$
|
—
|
|
|||||
|
Interest rate swap contracts
|
Other current liabilities
|
—
|
|
—
|
|
Other current liabilities
|
(0.6
|
)
|
—
|
|
|||||||||
|
$
|
1.6
|
|
$
|
—
|
|
$
|
(0.6
|
)
|
$
|
—
|
|
||||||||
7. BORROWINGS
Credit Facility
On January 25, 2017, the Company entered into a revolving credit facility (the "Previous Revolving Credit Facility"), which matured in
five years
, and a term facility (the "Previous Term Facility"), which was to be repaid over
five
years, with
7.5%
payable in quarterly installments during the first two years,
10%
payable in quarterly installments during the third and fourth years and
15%
payable in quarterly installments in the fifth year. The credit agreement relating to the Previous Revolving Credit Facility and the Previous Term Facility (the “Previous Credit Agreement”) contained various customary restrictive covenants that limited, among other things, the incurrence of indebtedness by Varex and its subsidiaries, the grant or incurrence of liens by Varex and its subsidiaries, the entry into sale and leaseback transactions by Varex and its subsidiaries, and the entry into certain fundamental change transactions by Varex and its subsidiaries. It also contained customary events of default and certain financial covenants, including the requirement to maintain certain financial ratios. The Previous Credit Agreement was secured by the stock and assets of certain Varex subsidiaries. The Previous Credit Agreement had several borrowing and interest rate options including the following indices: (i) the LIBOR rate, or (ii) the base rate (equal to the greater of the prime rate, the federal funds rate plus
0.50%
or the LIBOR rate for a one-month period plus
1.00%
). Loans under the Previous Credit Agreement bore interest at a rate per annum using the applicable indices plus a varying interest rate margin of between
1.125%
and
2.125%
. The Previous Credit Agreement also provided for fees applicable to amounts available to be drawn under outstanding letters of credit of
0.125%
and a fee on unused commitments which ranges from
0.20%
to
0.40%
. On January 25, 2017, Varex borrowed
$203 million
under Previous Term Facility and transferred
$200.0 million
to Varian. On May 1, 2017, Varex repaid the Previous Term Agreement and Previous Credit Agreement and terminated both agreements.
On May 1, 2017 and in connection with the Acquired Detector Business, the Company entered into a new secured revolving credit facility (the "Revolving Credit Facility") in an aggregate principal amount of up to
$200 million
with a
five
-year term, and a secured term facility (the "Term Facility" and together with the Revolving Credit Facility, the "Credit Agreement") in an aggregate principal amount of
$400 million
. The Term Facility will be repaid over
five
years, with
5.0%
payable in quarterly installments during each of the first two years of the term thereof,
7.5%
payable in quarterly installments during the third and fourth years of the term thereof, and
10%
payable in quarterly installments in the fifth year of the term thereof, with the remaining amount due at maturity. Varex used the net proceeds from the Term Facility, and the net proceeds from approximately
$97 million
drawn on the Revolving Credit Facility, to pay the approximately
$276 million
purchase price for the Acquired Detector Business, plus related
F-21
credit facility fees, and to repay all of Varex’s obligations under the Previous Credit Agreement. Both the Term Facility and Revolving Credit Facility expire on May 1, 2022.
The Credit Agreement contains various customary restrictive covenants that limits, among other things, the incurrence of indebtedness by Varex and its subsidiaries, the grant or incurrence of liens by Varex and its subsidiaries, the entry into sale and leaseback transactions by Varex and its subsidiaries, and the entry into certain fundamental change transactions by Varex and its subsidiaries. It also contains customary events of default and certain financial covenants, including the requirement to maintain certain financial ratios. The Company was in compliance with all financial covenants under the Credit Agreement as of September 29, 2017. The Credit Agreement is secured by the stock and assets of Varex’s material subsidiaries. The Credit Agreement has several borrowing and interest rate options including the following indices: (a) LIBOR rate, or (b) the base rate (equal to the greater of the prime rate, the federal funds rate plus
0.50%
or the LIBOR rate for a one-month period plus
1.00%
). Loans under the Credit Agreement bear interest at a rate per annum using the applicable indices plus a varying interest rate margin of between
1.75%
and
2.75%
(for LIBOR rate loans) and
0.75%
-
1.75%
(for base rate loans). The Credit Agreement also provides for fees applicable to amounts available to be drawn under outstanding letters of credit of
0.125%
, and a fee on unused commitments which ranges from
0.25%
to
0.40%
.
At
September 29, 2017
, the Company had
$463.9 million
in long-term debt outstanding and
$20.0 million
of current maturities of long-term debt outstanding, net of deferred issuance costs of
$10.1 million
.
8. FAIR VALUE
Assets/Liabilities Measured at Fair Value on a Recurring Basis
In the tables below, the Company has segregated all assets and liabilities that are measured at fair value on a recurring basis into the most appropriate level within the fair value hierarchy based on the inputs used to determine the fair value at the measurement date.
|
(In millions)
|
Fair Value Measurements at September 29, 2017
|
||||||||||||||
|
Quoted Prices in Active Markets for Identical Assets and Liabilities
(Level 1) |
Significant Other
Observable Inputs (Level 2) |
Significant Unobservable Inputs
(Level 3) |
Total
|
||||||||||||
|
Assets:
|
|||||||||||||||
|
Cash equivalents - Money market funds
|
$
|
—
|
|
$
|
11.4
|
|
$
|
—
|
|
$
|
11.4
|
|
|||
|
Interest rate swap contracts
|
—
|
|
1.6
|
|
—
|
|
1.6
|
|
|||||||
|
Total assets measured at fair value
|
$
|
—
|
|
$
|
13.0
|
|
$
|
—
|
|
$
|
13.0
|
|
|||
|
Liabilities:
|
|||||||||||||||
|
Interest rate swap contracts
|
$
|
—
|
|
$
|
0.6
|
|
$
|
—
|
|
$
|
0.6
|
|
|||
As of September 29, 2017, the outstanding borrowings under the Company's credit agreement were
$483.9 million
, net of deferred loan costs, which approximated its fair value because it is carried at a market observable interest rate that resets periodically and is categorized as Level 2 in the fair value hierarchy. The fair values of certain of the Company’s financial instruments, including bank deposits included in cash and cash equivalents, accounts receivable and accounts payable, also approximate their fair values due to their short maturities.
At September 30, 2016, the Company did not have any assets or liabilities measured at fair value on a recurring basis.
There were no financial assets or liabilities measured on a recurring basis using significant unobservable inputs (Level 3) and there were no transfers in or out of Level 1, 2 or 3 during fiscal year 2017.
9. GOODWILL AND INTANGIBLE ASSETS
The following table reflects goodwill by reportable operating segment:
F-22
|
(In millions)
|
Medical
|
Industrial
|
Total
|
|||||
|
Balance at September 30, 2016
|
55.7
|
|
19.0
|
|
74.7
|
|
||
|
Business combinations - PerkinElmer Medical Imaging Business
|
91.3
|
|
76.0
|
|
167.3
|
|
||
|
Disposition of business
|
(0.1
|
)
|
—
|
|
(0.1
|
)
|
||
|
Balance at 2017
|
146.9
|
|
95.0
|
|
241.9
|
|
||
In the fourth quarter of fiscal year 2016, the Company realigned its segments and goodwill was re-allocated to the Medical and Industrial reporting units based on their relative fair values. There were no impairment charges recognized as a result of the change in reporting units between September 30, 2016 and September 29, 2017.
The following table reflects the gross carrying amount and accumulated amortization of the Company’s finite-lived intangible assets included in other assets in the consolidated balance sheets:
|
(In millions)
|
September 29, 2017
|
September 30, 2016
(1)
|
|||||
|
Acquired existing technology
|
$
|
57.0
|
|
$
|
22.4
|
|
|
|
Patents, licenses and other
|
19.4
|
|
10.2
|
|
|||
|
Customer contracts and supplier relationship
|
42.1
|
|
9.1
|
|
|||
|
Accumulated amortization
|
(31.2
|
)
|
(21.0
|
)
|
|||
|
Total intangible assets with finite lives
|
87.3
|
|
20.7
|
|
|||
|
In-process research and development with indefinite lives
|
4.0
|
|
0.0
|
|
|||
|
Total intangible assets
|
$
|
91.3
|
|
$
|
20.7
|
|
|
|
(1) The Company identified immaterial errors in prior periods relating to the classification of licenses and customer contracts. The impact of these errors were not material to any prior period. Consequently, the Company corrected the errors by revising the prior year intangible assets disclosure.The corrections had no impact on the consolidated balance sheets, income statement or statements of cash flows.
|
|||||||
Amortization expense for intangible assets was
$10.5 million
,
$5.5 million
and
$2.7 million
in fiscal years 2017, 2016 and 2015, respectively.
As of September 29, 2017, the estimated future amortization expense of intangible assets with finite lives is as follows:
|
(In millions)
|
|||
|
Fiscal years:
|
|||
|
2018
|
$
|
16.1
|
|
|
2019
|
15.0
|
|
|
|
2020
|
14.6
|
|
|
|
2021
|
13.4
|
|
|
|
2022
|
11.8
|
|
|
|
Thereafter
|
16.4
|
|
|
|
Total
|
$
|
87.3
|
|
10. COMMITMENTS AND CONTINGENCIES
Lease Commitments
At September 29, 2017, the Company was committed to minimum rentals under non-cancelable operating leases (including rent escalation clauses) for fiscal years 2018 through 2022 and thereafter, as follows:
$4.0 million
,
$3.3 million
,
$3.0 million
,
$2.6 million
,
$2.6 million
, and
$0.9 million
, respectively. Rental expenses were
$4.0 million
,
$2.8 million
, and
$1.4 million
for fiscal years 2017, 2016 and 2015, respectively.
Other Commitments
F-23
See Note 3, “Related Party Transactions” for additional information about the Company’s commitments to dpiX.
See Note 11, “Redeemable Noncontrolling Interests & Noncontrolling Interests” for additional information about the Company’s commitment to the noncontrolling shareholders of MeVis.
The Company has an environmental liability of approximately
$1.3 million
as of
September 29, 2017
due to Varian for Varex's portion of future estimated environmental costs.
Contingencies
From time to time, the Company is a party to or otherwise involved in legal proceedings, claims and government inspections or investigations and other legal matters, both inside and outside the United States, arising in the ordinary course of its business or otherwise. The Company accrues amounts, to the extent they can be reasonably estimated, that it believes are adequate to address any liabilities related to legal proceedings and other loss contingencies that the Company believes will result in a probable loss (including, among other things, probable settlement value). A loss or a range of loss is disclosed when it is reasonably possible that a material loss will be incurred and can be estimated or when it is reasonably possible that the amount of a loss, when material, will exceed the recorded provision. The Company did not have any contingent liabilities as of
September 29, 2017
and September 30, 2016. Legal expenses are expensed as incurred.
11.
REDEEMABLE NONCONTROLLING INTERESTS &
NONCONTROLLING INTERESTS
In April 2015, the Company completed the acquisition of
73.5%
of the then outstanding shares of MeVis Medical Solutions AG (“MeVis”), a public company based in Bremen, Germany that provides image processing software and services for cancer screening.
In August 2015, the Company, through one of its German subsidiaries, entered into a domination and profit and loss transfer agreement (the “DPLTA”) with MeVis. In October 2015, the DPLTA became effective upon its registration at the local court of Bremen, Germany. Under the DPLTA, MeVis subordinates its management to the Company and undertakes to transfer all of its annual profits and losses to the Company. In return, the DPLTA grants the noncontrolling shareholders of MeVis: (1) an annual recurring net compensation of
€0.95
per MeVis share starting from January 1, 2015 and (2) a put right for their MeVis shares at
€19.77
per MeVis share. Upon effectiveness of the DPLTA, the noncontrolling interests in MeVis became redeemable as a result of the put right and were reclassified to temporary equity. As of September 29, 2017, the redemption value of redeemable noncontrolling interests in MeVis was
$11.2 million
.
During fiscal year 2017, an immaterial number of MeVis’ shares were purchased under the put right. As of September 29, 2017, noncontrolling shareholders together held approximately
0.5 million
shares of MeVis, representing
26.4%
of the outstanding shares.
Changes in redeemable noncontrolling interests and noncontrolling interests relating to MeVis were as follows:
|
Fiscal Years
|
|||||||||||
|
2017
|
2016
|
||||||||||
|
(In millions)
|
Redeemable
Noncontrolling Interests |
Noncontrolling
Interests |
Redeemable
Noncontrolling Interests |
||||||||
|
Balance at beginning of period
|
$
|
10.3
|
|
$
|
11.0
|
|
$
|
—
|
|
||
|
Net earnings attributable to noncontrolling interests
|
0.4
|
|
—
|
|
0.5
|
|
|||||
|
Reclassification of noncontrolling interests in MeVis to redeemable noncontrolling interests
|
—
|
|
(10.4
|
)
|
10.4
|
|
|||||
|
Other
|
0.5
|
|
(0.6
|
)
|
(0.6
|
)
|
|||||
|
Balance at end of period
|
$
|
11.2
|
|
$
|
—
|
|
$
|
10.3
|
|
||
12. EMPLOYEE STOCK PLANS
F-24
Employee Stock Plans
The Company's employees participate in Varex Imaging Corporation 2017 Omnibus Stock Plan (the "2017 Stock Plan") and Varex Imaging Corporation 2017 Employee Stock Purchase Plan (the "2017 ESPP") which allows the grants of stock options, restricted stock units and performance shares among other types of awards. Prior to the separation and distribution, the Company’s employees participated in Varian's stock-based compensation plans, which provided for the grants of stock options, restricted stock units and performance shares among other types of awards under Varian’s Third Amended and Restated 2005 Omnibus 2005 Stock Plan.
In January 2017, Varex stockholders approved the 2017 ESPP, which provides eligible employees with an opportunity to purchase shares of Varex common stock at
85%
of the lower of its fair market value at the start and end of a
six months
purchase period. The 2017 ESPP provides for the purchase of up to
one million
shares of Varex common stock.
Share-Based Compensation Expense
As share-based compensation expense recognized in the consolidated statements of earnings is based on awards ultimately expected to vest. Share-based compensation expense includes expenses related to the Company’s direct employees. Prior to the separation, Varian also charged the Company for the allocated share-based compensation costs of certain employees of Varian who provided selling, general and administrative services on the Company’s behalf.
The table below summarizes the effect of recording share-based compensation expense and for the option component of the employee stock purchase plan shares:
|
Fiscal Year
|
|||||||||||
|
(In millions)
|
2017
|
2016
|
2015
|
||||||||
|
Cost of revenues
|
$
|
0.9
|
|
$
|
1.0
|
|
$
|
1.3
|
|
||
|
Research and development
|
1.5
|
|
1.4
|
|
1.4
|
|
|||||
|
Selling, general and administrative
(1)
|
6.0
|
|
7.1
|
|
6.9
|
|
|||||
|
Total share-based compensation expense
|
$
|
8.4
|
|
$
|
9.5
|
|
$
|
9.6
|
|
||
(1)
Includes allocated share-based compensation of
$0.8 million
,
$3.4 million
and
$3.2 million
for fiscal years 2017, 2016 and 2015, respectively, and represents charges by Varian to the Company for certain Varian employees who provided general and administrative services on the Company’s behalf.
The unrecognized share-based compensation cost as of
September 29, 2017
was
$17.5 million
, and is expected to be recognized in the next
3
to
4
fiscal years. As of
September 29, 2017
, there were approximately
5.3 million
and
1.0 million
shares of common stock available for future issuances under the 2017 Stock Plan and the 2017 ESPP, respectively.
The Company utilized the Black-Scholes valuation model for estimating the fair value of stock options granted and the option component of the 2017 ESPP. The Company calculated the fair value of each option grant and option component of the 2017 ESPP on the respective dates of grant using the following weighted average assumptions:
|
Employee Stock Option Plan
|
Employee Stock Purchase Plans
|
||||
|
Fiscal Year
|
Fiscal Year
|
||||
|
2017
|
2017
|
||||
|
Expected term (in years)
|
4.2
|
|
0.5
|
|
|
|
Risk-free interest rate
|
1.6
|
%
|
1.0
|
%
|
|
|
Expected volatility
|
23.6
|
%
|
28.0
|
%
|
|
|
Expected dividend
|
0.0
|
%
|
0.0
|
%
|
|
|
Weighted average fair value at grant date
|
$8.08
|
$7.81
|
|||
Option valuation methods, including Black-Scholes, require the input of subjective assumptions, which are discussed below.
Risk-Free Interest Rate
F-25
The interest rates used are based on the implied yield currently available on U.S. Treasury zero-coupon issues with an equivalent remaining term equal to the expected life of the award.
Expected Term
Options granted generally vest over a period of
36
to
48
months and expire
7
to
10
years from date of grant. Employee stock purchase plan offering periods are 6 months and provides eligible employees with an opportunity to purchase shares of Varex common stock at 85% of the lower of its fair market value at the start and end of a six-month purchase period.
Expected Dividend Yield
The dividend rate used is zero as the Company has never paid any cash dividends on its common stock and does not anticipate doing so in the foreseeable future. The Company is also restricted from paying dividends on common stock under its credit facility.
Expected Volatility
Authoritative accounting guidance on stock-based compensation indicates that companies should consider volatility over a period generally commensurate with the expected or contractual term of the stock option. Adequate Company-specific data does not exist for this time period as the Company began trading in January 2017. The volatility variable used is a benchmark of other comparable companies’ volatility rates.
Stock Option Activity
The following table summarizes the activity for stock options under Varex’s employee incentive plans for the Company’s employees:
|
(In thousands, except per share amounts and the remaining term)
|
Options Outstanding
|
Price range
|
Weighted Average
Exercise Price |
Weighted Average Remaining Term (in years)
|
Aggregate Intrinsic Value (2)
|
||||||||
|
Balance at September 30, 2016
(1)
|
1,015
|
$17.53 - $30.74
|
$
|
26.14
|
|
||||||||
|
Granted
|
1,052
|
$31.08 - $34.13
|
31.20
|
|
|||||||||
|
Canceled, expired or forfeited
|
(18)
|
$25.17 - $30.74
|
27.85
|
|
|||||||||
|
Exercised
|
(123)
|
$17.53 - $30.74
|
22.61
|
|
|||||||||
|
Balance at September 29, 2017
|
1,926
|
$19.21 - $34.13
|
$
|
29.11
|
|
5.3
|
$
|
9,118.1
|
|
||||
|
Exercisable at September 29, 2017
|
709
|
$19.21 - $34.13
|
$
|
26.74
|
|
3.7
|
$
|
5,032.1
|
|
||||
(1) The outstanding options at September 30, 2016 represent outstanding options after converting such awards in accordance with the Employee Matters Agreement filed as Exhibit 10.3 to the Company's Form 10 filed with the SEC on January 12, 2017.
(2) The aggregate intrinsic value represents the total pre-tax intrinsic value, which is computed based on the difference between the exercise price and the closing price of Varex common stock of
$33.84
as of September 29, 2017, the last trading date of the Company's fiscal 2017, and which represents the amount that would have been received by the option holders had all option holders exercised their options and sold the shares received upon exercise as of that date.
Restricted Stock Units, Restricted Stock Awards and Deferred Stock Units
The following table summarizes the activity for restricted stock units, restricted stock awards and deferred stock units under Varex’s employee incentive plans for the Company’s employees:
|
(In thousands, except per share amounts)
|
Number of Shares
|
Weighted Average
Grant-Date Fair Value |
|||
|
Balance at September 30, 2016
(1)
|
385
|
$
|
27.42
|
|
|
|
Granted
|
337
|
31.33
|
|
||
|
Vested
|
(189)
|
27.90
|
|
||
|
Canceled or expired
|
(8)
|
26.71
|
|
||
|
Balance at September 29, 2017
|
525
|
$
|
29.54
|
|
|
F-26
(1) The outstanding RSUs at September 30, 2016 represent outstanding units after converting such units in accordance with the Employee Matters Agreement filed as Exhibit 10.3 to the Company's Form 10 filed with the SEC on January 12, 2017.
The total grant-date fair value of shares granted in fiscal year 2017 was
$11.4 million
. Shares outstanding at
September 29, 2017
had an estimated market value of
$17.8 million
.
13. TAXES ON EARNINGS
Taxes on earnings, as presented, are calculated on a separate return basis. Under this method, the Company computes taxes on earnings as if it were a separate taxpayer filing its own income tax returns for the full year. However, as the Company only became an actual separate taxpayer upon separation from Varian, the amounts recorded may differ from the amounts that would have been reflected in the financial statements had it been an entity that operated independently of Varian for the entire period. This is partially due to a different tax structure and tax accounting elections and assertions for the periods before and after separation.
The Company’s operations have historically been included in Varian’s U.S. federal and state income tax returns and non-U.S. jurisdiction tax returns. Income tax expense is based on reported income or loss before income taxes. Deferred income taxes reflect the effect of temporary differences between asset and liability amounts that are recognized for financial reporting purposes and the amounts that are recognized for income tax purposes. These deferred taxes are measured by applying currently enacted tax laws. Valuation allowances are recognized to reduce deferred tax assets to the amount that is more likely than not to be realized.
Taxes on earnings were as follows:
|
Fiscal Years
|
|||||||||||
|
(In millions)
|
2017
|
2016
|
2015
|
||||||||
|
Current provision:
|
|||||||||||
|
Federal
|
$
|
24.8
|
|
$
|
26.4
|
|
$
|
40.2
|
|
||
|
State and local
|
1.6
|
|
3.9
|
|
4.9
|
|
|||||
|
Foreign
|
5.3
|
|
2.0
|
|
2.5
|
|
|||||
|
Total current
|
31.7
|
|
32.3
|
|
47.6
|
|
|||||
|
Deferred provision (benefit):
|
|||||||||||
|
Federal
|
(7.0
|
)
|
3.6
|
|
(1.4
|
)
|
|||||
|
State and local
|
(1.0
|
)
|
—
|
|
(0.1
|
)
|
|||||
|
Foreign
|
(0.9
|
)
|
0.1
|
|
0.7
|
|
|||||
|
Total deferred
|
(8.9
|
)
|
3.7
|
|
(0.8
|
)
|
|||||
|
Taxes on earnings
|
$
|
22.8
|
|
$
|
36.0
|
|
$
|
46.8
|
|
||
Earnings before taxes are generated from the following geographic areas:
|
Fiscal Years
|
|||||||||||
|
(In millions)
|
2017
|
2016
|
2015
|
||||||||
|
United States
|
$
|
55.5
|
|
$
|
105.6
|
|
$
|
122.9
|
|
||
|
Foreign
|
19.3
|
|
(0.6
|
)
|
4.7
|
|
|||||
|
Earnings before taxes
|
$
|
74.8
|
|
$
|
105.0
|
|
$
|
127.6
|
|
||
The effective tax rate differs from the U.S. federal statutory tax rate as a result of the following:
F-27
|
Fiscal Years
|
||||||||
|
2017
|
2016
|
2015
|
||||||
|
Federal statutory income tax rate
|
35.0
|
%
|
35.0
|
%
|
35.0
|
%
|
||
|
State and local taxes, net of federal tax benefit
|
1.3
|
%
|
2.4
|
%
|
2.5
|
%
|
||
|
Domestic production activities deduction
|
(2.4
|
)%
|
(2.2
|
)%
|
(2.3
|
)%
|
||
|
Research and development credit
|
(2.6
|
)%
|
(2.2
|
)%
|
(0.6
|
)%
|
||
|
Foreign deferred tax adjustments
|
(4.0
|
)%
|
—
|
%
|
—
|
%
|
||
|
Change in valuation allowance
|
3.8
|
%
|
—
|
%
|
—
|
%
|
||
|
Other
|
(0.6
|
)%
|
1.3
|
%
|
2.1
|
%
|
||
|
Effective tax rate
|
30.5
|
%
|
34.3
|
%
|
36.7
|
%
|
||
During fiscal years 2017, 2016 and 2015, the Company’s effective tax rate varied from the U.S. federal statutory rate primarily because of a difference in the mix of earnings by jurisdiction and overall global tax structure for Varex as a stand-alone company compared to the prior years when it was part of Varian. The effective tax rate is also impacted by the benefit of adjustments to certain deferred tax assets and the release of valuation allowances in jurisdictions where increased earnings allowed for the utilization of net operating loss carryforwards. The effective tax rate also differs from the U.S. federal statutory rate due to increases resulting from U.S. state income tax expense and earnings in certain foreign jurisdictions that are taxed currently in the U.S. These increases are partially offset by decreases due to earnings in foreign jurisdictions that are taxed at lower rates, a U.S. domestic production activities deduction, and research and development credits. Due to the timing of lapses and retroactive reinstatements of the federal research and development credit, the Company received
seven
quarters of benefit in fiscal year 2016 and
four
quarters of benefit in fiscal year 2015.
Significant components of deferred tax assets and liabilities are as follows:
|
(In millions)
|
September 29, 2017
|
September 30, 2016
|
|||||
|
Deferred Tax Assets:
|
|||||||
|
Inventory adjustments
|
$
|
15.0
|
|
$
|
13.3
|
|
|
|
Share-based compensation
|
1.9
|
|
2.8
|
|
|||
|
Product warranty
|
2.2
|
|
2.3
|
|
|||
|
Deferred compensation
|
1.3
|
|
1.2
|
|
|||
|
Net operating loss carryforwards
|
2.4
|
|
7.7
|
|
|||
|
Accrued vacation
|
2.1
|
|
—
|
|
|||
|
Excess foreign tax credits
|
1.9
|
|
—
|
|
|||
|
Other
|
2.2
|
|
6.0
|
|
|||
|
29.0
|
|
33.3
|
|
||||
|
Valuation allowance
|
(4.3
|
)
|
(6.4
|
)
|
|||
|
Total deferred tax assets
|
24.7
|
|
26.9
|
|
|||
|
Deferred Tax Liabilities:
|
|||||||
|
Acquired intangibles
|
(26.4
|
)
|
(6.5
|
)
|
|||
|
Property, plant and equipment
|
(19.9
|
)
|
(10.1
|
)
|
|||
|
Investments in privately held companies
|
(6.9
|
)
|
(6.7
|
)
|
|||
|
Other
|
(1
|
)
|
(1.1
|
)
|
|||
|
Total deferred tax liabilities
|
(54.2
|
)
|
(24.4
|
)
|
|||
|
Net deferred tax (liabilities) assets
|
$
|
(29.5
|
)
|
$
|
2.5
|
|
|
|
Reported As:
|
|||||||
|
Deferred tax assets
|
$
|
25.3
|
|
$
|
5.5
|
|
|
|
Deferred tax liabilities
|
(54.8
|
)
|
(3.0
|
)
|
|||
|
Net deferred tax (liabilities) assets
|
$
|
(29.5
|
)
|
$
|
2.5
|
|
|
F-28
The Company has not provided for U.S. federal income and foreign withholding taxes on approximately
$45.5 million
of
cumulative undistributed earnings of non-U.S. subsidiaries as of September 29, 2017. Such earnings are intended to be reinvested in the non-U.S. subsidiaries for an indefinite period of time. If such earnings were not considered to be reinvested indefinitely, an additional deferred tax liability of approximately
$4.9 million
would be provided.
The Company has federal net operating loss carryforwards of approximately
$10.9 million
expiring between 2019 and 2024.
The valuation allowance relates primarily to excess foreign tax credits in the U.S. and net operating losses in certain foreign jurisdictions where, based on the weight of available evidence, it is more likely than not that the tax benefit of the net operating losses will not be realized. The valuation allowance decreased by
$2.1 million
during fiscal year 2017, increased by
$1.7 million
during fiscal year 2016 and increased by
$3.2 million
during fiscal year 2015.
In addition, the current year change in the valuation allowance is impacted by adjustments to deferred tax balances resulting from the separation from Varian that did not impact the current year effective tax rate.
In fiscal year 2017, the Company
paid U.S and foreign taxes of approximately
$6.0 million
.
In fiscal year 2016, the Company’s separate, taxpaying legal entities received a federal refund of approximately
$0.6 million
and paid foreign taxes of approximately
$1.0 million
. In fiscal year 2015, the Company’s separate, taxpaying legal entities paid foreign taxes of approximately
$0.7 million
. For other jurisdictions and periods, the Company’s operations have been included in Varian’s U.S. federal and state income tax returns and non-U.S. jurisdiction tax returns.
The Company accounts for uncertainty in income taxes following a two-step approach for recognizing and measuring uncertain tax positions. The first step is to evaluate the tax position for recognition by determining whether the weight of available evidence indicates that it is more likely than not that, based on the technical merits, the position will be sustained on audit, including resolution of related appeals or litigation processes, if any. The second step is to measure the tax benefit as the largest amount that is more than 50% likely of being realized upon settlement.
Changes in the Company’s unrecognized tax benefits were as follows:
|
Fiscal Years
|
|||||||||||
|
(In millions)
|
2017
|
2016
|
2015
|
||||||||
|
Unrecognized tax benefits balance–beginning of fiscal year
|
$
|
4.4
|
|
$
|
4.5
|
|
$
|
4.5
|
|
||
|
Additions based on tax positions related to a prior year
|
—
|
|
—
|
|
0.1
|
|
|||||
|
Additions based on tax positions related to the current year
|
0.5
|
|
1.0
|
|
1.0
|
|
|||||
|
Reductions resulting from the expiration of the applicable statute of limitations
|
—
|
|
(1.1
|
)
|
(1.1
|
)
|
|||||
|
Adjustments resulting from current year separation
|
(4.4
|
)
|
—
|
|
—
|
|
|||||
|
Unrecognized tax benefits balance—end of fiscal year
|
$
|
0.5
|
|
$
|
4.4
|
|
$
|
4.5
|
|
||
As of September 29, 2017, the total amount of gross unrecognized tax benefits was
$0.5 million
,
all of which would affect the effective tax rate if recognized.
As of September 30, 2016, the total amount of gross
unrecognized tax benefits was
$4.4 million
. As a result of the separation from Varian, all of the gross unrecognized tax benefits through September 30, 2016 were retained by Varian and none were transferred to Varex.
The Company includes interest and penalties related to income taxes within taxes on earnings on the Combined Statements of Earnings. As the initial tax returns for the year ended September 29, 2017 are not yet due,
no
interest or penalties related to unrecognized tax benefits have been included in taxes on earnings for that period.
As of September 30, 2016, the Company had accrued
$0.4 million
for the payment of interest and penalties related to unrecognized tax benefits. During fiscal year 2016, a net benefit of an immaterial amount related to interest and penalties was included in taxes on earnings. As of October 2, 2015, the Company had accrued
$0.5 million
for the payment of interest and penalties related to unrecognized tax benefits. During fiscal year 2015, a net benefit of an immaterial amount related to interest and penalties was included in taxes on earnings.
The Company will file U.S. Federal and state income tax returns and non-U.S. income tax returns in various jurisdictions. All of these returns will be subject to examination by their respective taxing jurisdictions from the date of filing through each applicable statute of limitation period. The Company’s significant operations up to the date of separation have historically been included in Varian’s U.S. federal and state income tax returns and non-U.S. jurisdiction tax returns. The Varian group’s U.S. federal
F-29
tax returns are generally no longer subject to tax examinations for years prior to 2013. For U.S. states and other foreign tax returns, the Company is generally no longer subject to tax examinations for years prior to 2007.
14. SEGMENT INFORMATION
As part of the Company's transition to a stand-alone company, the Company’s Chief Executive Officer, who is also its Chief Operating Decision Maker (“CODM”), re-evaluated the product groupings and how he views and measures the business performance, and, therefore, subsequent to the filing of the preliminary registration statement on Form 10 on August 11, 2016, the Company reorganized its
two
reportable operating segments into Medical and Industrial. The realigned segments better align the Company’s products and service offerings with customer use in medical and industrial markets and are consistent with how the CODM evaluates the business for the allocation of resources. The CODM allocates resources to and evaluates the financial performance of each operating segment primarily based on revenues and gross margin. The new operating and reportable segment structure provides better visibility and clarity into the financial performance of the Company’s products, as well as an alignment between business strategies and operating results.
Description of Segments
The Medical segment designs, manufactures, sells and services X-ray imaging components for use in a range of applications, including radiographic and fluoroscopic imaging, mammography, computed tomography, radiation therapy and computer-aided detection. The Company provides a broad range of X-ray imaging components for Medical customers including X-ray tubes, digital flat panel detectors, generators, high voltage connectors, image-processing software and workstations, computer-aided diagnostic software, collimators, automatic exposure control devices, generators, ionization chambers and buckys. The Company’s X-ray imaging components are primarily sold to imaging system OEM customers that incorporate them into their medical diagnostic, radiation therapy, dental, veterinary and industrial imaging systems. The Company also sells its X-ray imaging components to independent service companies, distributors and directly to end-users for replacement purposes.
The Industrial segment designs, manufactures, sells and services products for use in the security and industrial inspection applications, such as airport security, cargo screening at ports and borders and nondestructive examination in a variety of applications. The products include Linatron X-ray accelerators, X-ray tubes, digital flat panel detectors, high voltage connectors and image processing software that we generally sell to OEM customers that incorporate these products into their inspection systems.
Accordingly, the following information is provided for purposes of achieving an understanding of operations, but it may not be indicative of the financial results of the reported segments were they independent organizations. In addition, comparisons of the Company’s operations to similar operations of other companies may not be meaningful.
Information related to the Company’s segments is as follows:
|
Fiscal Year
|
|||||||||||
|
(In millions)
|
2017
|
2016
|
2015
|
||||||||
|
Revenues
|
|||||||||||
|
Medical
|
$
|
556.9
|
|
$
|
505.8
|
|
$
|
534.3
|
|
||
|
Industrial
|
141.2
|
|
114.3
|
|
98.0
|
|
|||||
|
Total revenues
|
698.1
|
|
620.1
|
|
632.3
|
|
|||||
|
Gross margin
|
|||||||||||
|
Medical
|
193.6
|
|
195.8
|
|
207.1
|
|
|||||
|
Industrial
|
59.9
|
|
52.6
|
|
43.5
|
|
|||||
|
Total gross margin
|
253.5
|
|
248.4
|
|
250.6
|
|
|||||
|
Total operating expenses
|
169.8
|
|
139.3
|
|
123.1
|
|
|||||
|
Interest and other income (expenses), net
|
(8.9
|
)
|
(4.1
|
)
|
0.1
|
|
|||||
|
Earnings before taxes
|
74.8
|
|
105.0
|
|
127.6
|
|
|||||
|
Taxes on earnings
|
22.8
|
|
36.0
|
|
46.8
|
|
|||||
|
Net earnings
|
52.0
|
|
69.0
|
|
80.8
|
|
|||||
|
Less: Net earnings attributable to noncontrolling interests
|
0.4
|
|
0.5
|
|
0.8
|
|
|||||
|
Net earnings attributable to Varex
|
$
|
51.6
|
|
$
|
68.5
|
|
$
|
80.0
|
|
||
F-30
The following table summarizes the Company’s total assets by its reportable segments:
|
(In millions)
|
September 29, 2017
|
September 30, 2016
|
|||||
|
Identifiable assets:
|
|||||||
|
Medical
|
$
|
832.1
|
|
$
|
481.4
|
|
|
|
Industrial
|
208.0
|
|
134.7
|
|
|||
|
Total reportable segments
|
$
|
1,040.1
|
|
$
|
616.1
|
|
|
|
Unallocated corporate assets
|
—
|
|
6.3
|
|
|||
|
Total combined assets
|
$
|
1,040.1
|
|
$
|
622.4
|
|
|
Geographic Information
|
Revenues
|
Property, plant and equipment, net
|
||||||||||||||||||
|
Fiscal Year
|
Fiscal Years
|
||||||||||||||||||
|
(In millions)
|
2017
|
2016
|
2015
|
2017
|
2016
|
||||||||||||||
|
Americas
|
$
|
239.8
|
|
$
|
224.7
|
|
$
|
249.2
|
|
$
|
132.1
|
|
$
|
98.0
|
|
||||
|
EMEA
|
219.5
|
|
179.5
|
|
153.0
|
|
8.4
|
|
2.5
|
|
|||||||||
|
APAC
|
238.8
|
|
215.9
|
|
230.1
|
|
7.8
|
|
8.4
|
|
|||||||||
|
Total company
|
$
|
698.1
|
|
$
|
620.1
|
|
$
|
632.3
|
|
$
|
148.3
|
|
$
|
108.9
|
|
||||
The Company operates various manufacturing and marketing operations outside the United States. The Americas includes North America (primarily United States) and Latin America. EMEA includes Europe, Russia, the Middle East, India and Africa. APAC includes Asia and Australia. Revenues by region are based on the known final destination of products sold.
15. EMPLOYEE BENEFIT PLANS
Varex’s 401(k) plan became effective on January 1, 2017. Varex’s 401(k) plan is intended to be qualified under Section 401(a) of the Code with the 401(k) plan’s related trust intended to be tax exempt under Section 501(a) of the Code and intended for all full-time employees in the United States. This plan allows employees to contribute a portion of their pretax salary up to the maximum dollar limitation prescribed by the Internal Revenue Service. Prior to Varex's 401(k) plan becoming effective, Company employees participated in Varian's 401(k) plan. The Company made matching contributions to the plan totaling
$4.3 million
,
$3.3 million
and
$3.1 million
in fiscal year 2017, 2016 and 2015, respectively.
The Company also maintains defined benefit plans for employees located outside the US. The net pension liability is included in non-current liability on the Company's Consolidated Balance Sheets and totaled
$3.2 million
as of September 29, 2017. Prior to the separation from Varian, net pension liability was held at Varian and not allocated to the Company.
F-31
TABLE OF CONTENTS
Part IItem 1. BusinessItem 1A. Risk FactorsItem 1B. Unresolved Staff CommentsItem 2. PropertiesItem 3. Legal ProceedingsItem 4. Mine Safety DisclosuresPart IIItem 5. Market For The Registrant S Common Equity, Related Stockholder Matters and Issuer Purchases Of Equity SecuritiesItem 6. Selected Financial DataItem 7. Management S Discussion and Analysis Of Financial Condition and Results Of OperationsItem 7A. Quantitative and Qualitative Disclosures About Market RisksItem 8. Financial Statements and Supplementary DataItem 9. Changes in and Disagreements with Accountants on Accounting and Financial DisclosureItem 9A. Controls and ProceduresItem 9B. Other InformationPart IIIItem 10. Directors, Executive Officers and Corporate GovernanceItem 11. Executive CompensationItem 12. Security Ownership Of Certain Beneficial Owners and Management and Related Stockholder MattersItem 13. Certain Relationships and Related Transactions and Director IndependenceItem 14. Principal Accountant Fees and ServicesPart IVItem 15. Exhibits, Consolidated Financial Statements and Financial Statement Schedules