VARONIS SYSTEMS INC
10-Ks and 10-Qs
|
|
|
|
|
|
|
|
|
|
|
|
|
|
|
|
|
|
|
|
|
|
|
|
|
|
|
|
|
|
|
|
|
|
|
|
|
|
|
|
|
UNITED STATES
SECURITIES AND EXCHANGE COMMISSION
Washington, D.C. 20549
_____________________
FORM 10-K
_____________________
(Mark One)
|
ý
|
ANNUAL REPORT PURSUANT TO SECTION 13 OR 15(D) OF THE SECURITIES EXCHANGE ACT OF 1934
|
for the Fiscal Year Ended
December 31, 2018
or
|
¨
|
TRANSITION REPORT PURSUANT TO SECTION 13 OR 15(D) OF THE SECURITIES EXCHANGE ACT OF 1934
|
for the transition period from to
Commission file number: 001-36324
________________________
VARONIS SYSTEMS, INC.
(Exact name of registrant as specified in its charter)
_____________________________
|
Delaware
|
57-1222280
|
|
(State or other jurisdiction of incorporation)
|
(I.R.S. Employer Identification Number)
|
1250 Broadway, 29th Floor
New York, NY 10001
(Address of principal executive offices including zip code)
Registrant’s telephone number, including area code: (877) 292-8767
Securities registered pursuant to Section 12(b) of the Act:
|
Common Stock, par value $0.001 per share
|
The NASDAQ Stock Market LLC
|
|
(Title of class)
|
(Name of exchange on which registered)
|
Securities registered pursuant to Section 12(g) of the Act: None
_____________________________
Indicate by check mark if the registrant is a well-known seasoned issuer, as defined in Rule 405 of the Securities Act. Yes
ý
No
¨
Indicate by check mark if the registrant is not required to file reports pursuant to Section 13 or Section 15(d) of the Act. Yes
¨
No
ý
Indicate by check mark whether the registrant (1) has filed all reports required to be filed by Section 13 or 15(d) of the Securities Exchange Act of 1934 during the preceding 12 months (or for such shorter period that the registrant was required to file such reports), and (2) has been subject to such filing requirements for the past 90 days. Yes
ý
No
¨
Indicate by check mark whether the registrant has submitted electronically every Interactive Data File required to be submitted pursuant to Rule 405 of Regulation S-T (§232.405 of this chapter) during the preceding 12 months (or for such shorter period that the registrant was required to submit such files). Yes
ý
No
¨
Indicate by check mark if disclosure of delinquent filers pursuant to Item 405 of Regulation S-K (§229.405 of this chapter) is not contained herein and will not be contained, to the best of the registrant’s knowledge, in definitive proxy or information statements incorporated by reference in Part III of this Form 10-K or any amendment to this Form 10-K.
¨
Indicate by check mark whether the registrant is a large accelerated filer, an accelerated filer, a non-accelerated filer, a smaller reporting company, or an emerging growth company. See the definitions of “large accelerated filer,” “accelerated filer,” “smaller reporting company” and “emerging growth company” in Rule 12b-2 of the Exchange Act.
|
Large Accelerated Filer
|
ý
|
Accelerated Filer
|
¨
|
|
|
|
|
|
|
Non-accelerated Filer
|
¨
|
Smaller reporting company
|
¨
|
|
|
|
|
|
|
|
|
Emerging growth company
|
¨
|
If an emerging growth company, indicate by check mark if the registrant has elected not to use the extended transition period for complying with any new or revised financial accounting standards provided pursuant to Section 13(a) of the Exchange Act.
¨
Indicate by check mark whether the registrant is a shell company (as defined in Rule 12b-2 of the Act). Yes
¨
No
ý
The aggregate market value of voting stock held by non-affiliates of the registrant as of June 29, 2018 at a closing sale price of $74.50 as reported by the NASDAQ Global Select Market was approximately $2.15 billion. Shares of common stock held by each officer and director and by each person who owns or may be deemed to own 10% or more of the outstanding common stock have been excluded since such persons may be deemed to be affiliates. This determination of affiliate status is not necessarily a conclusive determination for other purposes.
As of
February 8, 2019
, the registrant had
29,580,605
shares of common stock, par value $0.001 per share, outstanding.
DOCUMENTS INCORPORATED BY REFERENCE
Portions of the Registrant’s Proxy Statement to be used in connection with the solicitation of proxies for the Registrant’s 2019 Annual Meeting of Stockholders are incorporated by reference in Part III of this Annual Report on Form 10-K.
Special Note Regarding Forward-Looking Statements
This report contains forward-looking statements that involve risks and uncertainties. Our actual results could differ materially from those discussed in the forward-looking statements. The statements contained in this report that are not purely historical are forward-looking statements within the meaning of Section 27A of the Securities Act of 1933, as amended (the “Securities Act”), and Section 21E of the Securities Exchange Act of 1934, as amended (the “Exchange Act”). Forward-looking statements are often identified by the use of words such as, but not limited to, “anticipate,” “believe,” “can,” “continue,” “could,” “estimate,” “expect,” “intend,” “may,” “plan,” “project,” “seek,” “should,” “strategy,” “target,” “will,” “would” and similar expressions or variations intended to identify forward-looking statements. These statements are based on the beliefs and assumptions of our management based on information currently available to management. Such forward-looking statements are subject to risks, uncertainties and other important factors that could cause actual results and the timing of certain events to differ materially from future results expressed or implied by such forward-looking statements. Factors that could cause or contribute to such differences include, but are not limited to, those identified below and those discussed in the section titled “Risk Factors” included under Part I, Item 1A below. Furthermore, such forward-looking statements speak only as of the date of this report. Except as required by law, we undertake no obligation to update any forward-looking statements to reflect events or circumstances after the date of such statements.
i
VARONIS SYSTEMS, INC.
ANNUAL REPORT ON FORM 10-K
For The Fiscal Year Ended
December 31, 2018
TABLE OF CONTENTS
|
|
|
Page
|
|
PART I
|
|
|
|
|
|
|
|
|
|
|
|
PART II
|
|
|
|
|
|
|
|
|
|
|
|
PART III
|
|
|
|
|
|
|
|
|
|
|
|
PART IV
|
|
|
|
|
|
|
ii
PART I
|
Item 1.
|
Business
|
We were incorporated under the laws of the State of Delaware on November 3, 2004 and commenced operations on January 1, 2005. Our principal executive offices are located at 1250 Broadway, 29th Floor, New York, NY 10001. For convenience in this report, the terms “Company,” “Varonis,” “we” and “us” may be used to refer to Varonis Systems, Inc. and/or its subsidiaries, except where indicated otherwise. Our telephone number is (877) 292-8767.
Overview
Varonis is a pioneer in data security and analytics, fighting a different battle than conventional cybersecurity companies. We are pioneers because over a decade ago, we recognized that enterprise capacity to create and share data far exceeded its capacity to protect it. We believed the vast movement of information from analog to digital mediums combined with increasing information dependence would change both the global economy and the risk profiles of corporations and governments. Since then our focus has been on using innovation to address the cyber-implications of this movement, creating software that provides ways to track and protect data wherever it is stored.
Our software allows enterprises to protect data stored on premises and in the cloud: sensitive files and emails; confidential customer, patient and employee data; financial records; strategic and product plans; and other intellectual property. Recognizing the complexities of securing data, we have built a single integrated platform for security and analytics to simplify and streamline security and data management.
The Varonis Data Security Platform, built on patented technology, allows enterprises to protect data against insider threats and cyberattacks. Our products enable enterprises to analyze data, account activity and user behavior to detect attacks. Our Data Security Platform prevents or limits unauthorized use of sensitive information, prevents potential cyberattacks and limits others by locking down sensitive and stale data. Our products efficiently sustain a secure state with automation and addresses additional use cases including data protection, governance, compliance, classification and threat detection and response. Our Data Security Platform is driven by a proprietary technology, the Metadata Framework, that extracts critical metadata, or data about data, from an enterprise’s IT infrastructure. Our Data Security Platform uses this contextual information to map functional relationships among employees, data objects, content and usage.
The revolution in internet search occurred when search engines began to mine internet metadata, such as the links between pages, in addition to page content, thereby making the internet’s content more usable and consequently more valuable. Similarly, our Data Security Platform creates advanced searchable data structures out of available content and metadata, providing real-time intelligence about an enterprise’s massive volumes of data, making it more accessible, manageable and secured.
We believe that the technology underlying our Data Security Platform is our primary competitive advantage. The strength of our solution is driven by several proprietary technologies and methodologies that we have developed, coupled with how we have combined them into our highly versatile platform. Our belief in our technological advantage stems from us having developed a way to do each of the following:
|
•
|
determine relevant metadata and security information to capture;
|
|
•
|
capture that metadata without imposing any strains or latencies on the enterprise’s computing infrastructure;
|
|
•
|
modify that metadata in a way that makes it comparable and analyzable despite it having originated from disparate IT systems;
|
|
•
|
create supplemental metadata, as needed, when the existing IT infrastructure’s activity logs are not sufficient;
|
|
•
|
decipher the key functional relationships of metadata, the underlying data, and its creators;
|
|
•
|
use those functional relationships to create a graphical depiction, or map, of the data that will endure as enterprises add large volumes of data to their network and storage resources on a daily basis;
|
|
•
|
analyze the data and related metadata utilizing sophisticated algorithms, including cluster analyses and machine learning;
|
1
|
•
|
visualize and depict the analyses in an intuitive manner, including simulating contemplated changes and automatically execute tasks that are normally manually intensive for IT and business personnel;
|
|
•
|
identify and classify the data as sensitive, critical, private or regulated;
|
|
•
|
automate changes to directory service objects and access controls on large file systems;
|
|
•
|
detect suspicious account behavior and unusual file and email activity using deep analysis of metadata, machine learning and user behavior analytics;
|
|
•
|
generate meaningful, actionable alerts when security-related incidents are detected; and
|
|
•
|
enable security teams to investigate and respond to cyber threats more efficiently and conclusively.
|
The broad applicability of our technology has resulted in our customers deploying our platform for numerous use cases. These use cases include: discovery and classification of high-risk, sensitive data; centralized visibility into enterprise data and monitoring of user behavior and file activity; security monitoring and risk reduction; data breach, insider threat, malware and ransomware detection; data ownership identification; reporting and auditing with searchable logs; meeting security policy and compliance regulation; data migration; and intelligent archiving.
We sell substantially all of our products and services to channel partners, including distributors and resellers, which sell to end-user customers, which we refer to in this report as our customers. We believe that our sales model, which combines the leverage of a channel sales model with our highly trained and professional sales force, has played and will continue to play a major role in our ability to grow and to successfully deliver our unique value proposition for enterprise data. While our products serve customers of all sizes, in all industries and all geographies, the marketing focus and majority of our sales focus is on targeting organizations with 1,000 users or more who can make larger purchases with us over time and have a greater potential lifetime value. As of
December 31, 2018
, we had approximately 6,600 customers, spanning leading firms in the financial services, public, healthcare, industrial, insurance, energy and utilities, consumer and retail, media and entertainment, technology and education sectors.
Historically, an insignificant amount of our revenues has been sold under subscription-based license arrangements which are sold on premises. In these arrangements, the customer has the right to use the software over a designated period of time. As we transition to a more subscription-based model, we expect that over the next several years revenues from subscription-based arrangements will become a more significant portion of our total revenues.
Size of Our Market Opportunity
The International Data Corporation’s Data Age 2025: The Digitization of the World from Edge to Core study estimates that the amount of data created in the world will grow from 33 Zettabytes in 2018 to 175 Zettabytes (or 175 trillion gigabytes) in 2025, representing an approximately 27% compound annual growth rate. Every enterprise will almost certainly require new technologies to protect and manage their data and centralize data management, analytics, data security and privacy.
We believe that the diverse functionalities offered by our platform position us at the intersection of several powerful trends in the digital enterprise data universe. We further believe that the business intelligence and functionalities delivered by our platform define a new market, and we are not aware of any third party studies that accurately define our addressable market. The functionality of our software platform overlaps with portions of several established and growing enterprise software markets as defined by Gartner, Inc. in 2018, including security software ($23.6 billion), IT operations management ($27.2 billion), storage management ($15.0 billion), infrastructure software ($10.4 billion) and data integration ($5.4 billion). We believe that our comprehensive product offering will attract a meaningful portion of this overall spend, estimating that our total addressable market is approximately 20% of these combined markets, or more than $16.0 billion.
Our Technology
Our proprietary technology extracts critical information about an enterprise’s data and uses this contextual information, or metadata, to create a functional map of an enterprise’s data and underlying file systems. Our Metadata Framework technology has been architected to process large volumes of enterprise data and the related metadata at a massive scale with minimal demands on the existing IT infrastructure. All of our products utilize our Data Security Platform and a core single codebase, thereby streamlining our product development initiatives.
Key Benefits of Our Technology
2
Data Protection
Comprehensive Solution for Managing and Protecting Enterprise Data.
Our products enable a broad range of functionality, including data governance and intelligent retention, all from one core technology platform. Moreover, our platform is applicable across most major enterprise data stores (Windows, UNIX/Linux, Intranets, email systems, Office365 and Box).
Actionable Intelligence Analytics, and Automation.
Our products help customers automatically lock down sensitive data and remediate security vulnerabilities, so that they are less vulnerable to internal and external threats, more compliant and consistently following a least privilege model.
Visibility and Data Monitoring Capabilities All in One Place.
Our solutions focus on protecting enterprise data on-premises and in the cloud in a single view. As data storage becomes more fragmented, functioning in a hybrid space, our Data Security Platform provides customers with a single pane of glass to monitor and protect enterprise data regardless of where it is stored.
Fast Time to Value and Low Total Cost of Ownership.
Our solutions do not require custom implementations or long deployment cycles. Our Data Security Platform can be installed and ready for use within hours and allows customers to realize real value once used. We designed our platform to operate on commodity hardware with standard operating systems, further reducing the cost of ownership of our product.
Ease of Use.
While we utilize complex data structures and algorithms in our data engine, we abstract that complexity to provide a sleek, intuitive interface. Our software is accessible through either the local client or a standard web browser and requires limited training, saving time and cost and making it accessible to a broader set of non-technical users.
Highly Scalable and Flexible Data Engine.
Our metadata analysis technology is built to be highly scalable and flexible, allowing our customers to analyze vast amounts of enterprise data. Moreover, our proprietary Metadata Framework is built with a modular architecture, allowing customers to grow into the full capabilities of our solutions over time.
Threat Detection and Response
Threat Detection and Response with User, Data and System Context.
Our solutions combine classification and data access governance with User and Entity Behavior Analytics (UEBA) on data stores, directory services and perimeter devices, including DNS, VPN and web proxy, for accurate detection and risk reduction. Our solutions reduce risk relating to unauthorized use and cyberattacks.
Protect Data from Insider Threats, Data Breaches and Cyberattacks.
Our solutions analyze how employee accounts, service accounts and admin accounts use and access data, profile employees’ roles and file contents, baseline “normal” behavior patterns, and alert on significant deviations from profiled behaviors. Our customers are able to detect rogue insiders, attackers that have compromised internal systems and employee accounts, malware and other significant threats.
Compliance
Discover and Identify Regulated Data.
Our solutions discover, identify and classify sensitive, critical and regulated data to help meet compliance requirements.
Monitor and Detect Security Vulnerabilities.
Our solutions analyze, monitor, detect and report on potential security vulnerabilities: helping companies achieve compliance by enabling full audit trails, achieving least privilege and locking down sensitive data to only those who need it, and facilitate breach notification and security investigations.
Fulfill Data Subject Access Requests and Protect Consumer Data.
Our solutions help fulfill data subject access requests. Customers can find relevant files, pinpoint who has access and enforce policies to move and quarantine regulated data.
Our Growth Strategy
Our objective is to be the primary vendor to which enterprises turn to protect and analyze their data. The following are key elements of our growth strategy.
3
Extend Our Technological Capabilities Through Innovation.
We intend to increase our current level of investment in product development in order to enhance existing products to address new use cases and deliver new products. We believe that the flexibility, sophistication and broad applicability of our Metadata Framework will allow us to use this framework as the core of numerous future products built on our same core technology. Our ability to leverage our research and development resources has enabled us to create a new product development engine that we believe can proactively identify and solve enterprise needs.
Grow Our Customer Base.
The unabated rise in enterprise data, ubiquitous reliance on digital collaboration and increased cybersecurity concerns will continue to drive demand for data protection, compliance and threat detection and response solutions. We intend to capitalize on this demand by targeting new customers, vertical markets and use cases for our solutions. Our solutions address the needs of customers of all sizes ranging from small and medium businesses to large multinational companies with thousands of employees and petabytes of data. Although our solutions are applicable to organizations of all sizes, we will continue our focus on targeting larger organizations who can make larger purchases with us over time.
Increase Sales to Existing Customers.
We believe significant opportunities exist to further expand relationships with existing customers. Data growth (and subsequent security concerns) continues across all data stores, and enterprises want to standardize on solutions that help them manage, protect and extract more value from their data wherever it is stored. We will continue to cultivate incremental sales from our existing customers by driving increased use of our software within our installed base by expanding footprint and usage. We currently have six product families, and, as of
December 31, 2018
, approximately 73% of our customers had purchased two or more product families and approximately 40% of our customers had purchased three or more product families. We believe our existing customer base serves as a strong source of incremental revenues given the broad platform of products we have and the growing volumes and complexity of enterprise data that our customers have. As we innovate and expand our product offering, we expect to have an even broader suite of products to offer our customers.
Grow Sales From Our Newer Licenses.
During the past year, we have introduced additional licenses to existing products to support new functionalities. In 2018, we released Varonis Edge, which analyzes perimeter devices like DNS, VPN and Web Proxies to detect attacks like malware, APT intrusion and data exfiltration. Varonis Edge enables enterprises to correlate events and alerts to track potential data leaks and spot vulnerabilities at the point of entry. We also released Data Classification Labels, integrating with Microsoft Information Protection (MIP) to help enterprises better classify, track and secure files across enterprise data stores. We enhanced DatAnswers to address data privacy and compliance use cases, enabling customers to fulfill data subject access requests and protect personally identifiable information. We have enhanced our products to provide even more value to our customers including: an updated user interface for DataPrivilege, additional data store support, new geolocation support, enhanced threat detection and security monitoring and new threat models to protect sensitive and regulated data against security breaches, malware, ransomware and insider threats. We believe these new additions to our product offering can be a meaningful contributor to our growth.
Expand Our Sales Force.
Continuing to expand our salesforce will be essential to achieving our customer base expansion goals. The salesforce and our approach to introducing products to the market has been key to our successful growth in the past and will be central to our growth plan in the future. While our products serve customers of all sizes, in all industries and all geographies, the marketing focus and majority of our sales focus is on targeting organizations with 1,000 users or more who can make larger purchases with us over time and generate a greater potential lifetime value. The ability of our sales teams to support our channel partners to efficiently identify leads, perform risk assessments and convert them to satisfied customers will continue to impact our ability to grow. We intend to expand our sales capacity by adding headcount throughout our sales and marketing department.
Establish Our Data Security Platform as the Industry Standard.
We have worked with several of the leading providers of network attached storage, or NAS, hybrid cloud storage, including EMC, IBM, NetApp, HP, Hitachi and Nasuni in order to expand our market reach and deliver enhanced functionality to our customers. We have worked with these vendors to assure compatibility with their product lines. Through the use of application programming interfaces, or APIs, and other integration work, our solutions also integrate with many providers of solutions in the ecosystem. We will continue to pursue such collaborations wherever they advance our strategic goals, thereby expanding our reach and establishing our product user interface as the de facto industry standard when it comes to enterprise data.
Continue International Expansion.
We believe there is a significant opportunity for our platform in international markets to comply with regulations such as the European Union's ("EU") General Data Protection Regulation ("GDPR"). Revenues from Europe, the Middle East and Africa (“EMEA") accounted for approximately a third of our revenues in
2018
. Europe represented the substantial majority of revenues outside the United States. Although we have experienced inconsistent quarterly
4
growth rates over the last few years in our European market, we believe that international expansion will be a key component of our growth strategy, and we will continue to market our products and services overseas.
Our Products
We have six product families that utilize our core Metadata Framework technology to deliver features and functionality that allow enterprises to fully understand, secure and benefit from the value of their data. This architecture easily extends through modular functionalities giving our clients the flexibility to select the features they require for their business needs and the flexibility to expand their usage simply by adding a license.
|
•
|
DatAdvantage.
DatAdvantage, our flagship product, launched in 2006, builds on our Metadata Framework and captures, aggregates, normalizes and analyzes every data access event for every user on Windows and UNIX/Linux servers, storage devices, email systems and Intranet servers, without requiring native operating system auditing functionalities or impacting performance or storage on file systems. Through an intuitive graphical interface, DatAdvantage presents insights from massive volumes of data using normal computing infrastructure. It is also our presentation layer for IT departments, which provides an interactive map of relevant users, groups and data objects, usage and content, facilitating analysis from multiple vectors. IT departments can pinpoint areas of interest starting with any metadata object, simulate changes measuring potential impact against historical access patterns, and easily execute changes on all data stores through a unified interface. DatAdvantage identifies where users have unneeded access based on user behavior.
|
|
•
|
The Automation Engine, a module introduced in 2017, helps customers accelerate the enforcement of least privilege by limiting broad access without all the manual legwork. It automatically repairs and maintains file systems, helping reduce customers’ risk profiles and decreasing their overhead and resources required to get to a least privilege model.
|
|
•
|
DatAlert.
Introduced in 2013, DatAlert profiles users and their behaviors with respect to systems and data, detects and alerts on meaningful deviations to established baselines, and provides a web-based dashboard and investigative interface. DatAlert helps enterprises detect suspicious activity, prevents data breaches and cyberattacks, performs security forensics, visualizes risk and prioritizes investigation.
|
|
•
|
Varonis Edge, a module introduced in early 2018, analyzes perimeter devices like DNS, VPN and Web Proxy to detect attacks like malware, APT intrusion and exfiltration and enables enterprises to correlate events and alerts at the perimeter with alerts and events concerning data to better spot attacks at the point of entry and egress.
|
|
•
|
Data Classification Engine (
introduced in 2009 as
IDU Classification Framework).
As the volume of an enterprise’s information grows, enterprises struggle to find and tag different types of sensitive data, such as intellectual property, regulated content, including Personally Identifiable Information, and medical records. Furthermore, content by itself does not provide adequate context to determine ownership, relevance, or protection requirements. Data Classification Engine identifies and tags data based on criteria set in multiple metadata dimensions and provides business and IT personnel with actionable intelligence about this data, including a prioritized list of folders and files containing the most sensitive data and with the most inadequate permissions. For the identified folders and files, it also identifies who has access to that data, who is using it, who owns it, and recommendations for how to restrict access without disrupting workflow. Data Classification Engine provides visibility into the content of data across file systems and Intranet sites and combines it with other metadata, including usage and accessibility.
|
|
•
|
GDPR Patterns, introduced in 2017, uses the Data Classification Engine as a foundation to identify and classify regulated data in the EU that falls under the GDPR, with hundreds of unique patterns that cover all 28 countries in the EU.
|
|
•
|
Data Classification Labels, introduced in 2018, integrates with Microsoft Information Protection (MIP) to protect sensitive data across customer environments regardless of where it lives or how it is shared. Data Classification Labels allows users to automatically apply classification labels and encrypt files that it has identified as sensitive.
|
|
•
|
DataPrivilege.
DataPrivilege, launched in 2006 and designed for use by business unit personnel, provides a self-service web portal that allows users to request access to data necessary for their business functions, and owners to grant access without IT intervention. DataPrivilege enhances data protection and compliance by enabling business
|
5
users to make access decisions based on queries, user requests and metadata analytics information, rather than static IT policies. DataPrivilege provides a presentation layer for business users to review accessibility, sensitivity and usage of their data assets and grant and revoke access.
|
•
|
Data Transport Engine.
We introduced Data Transport Engine in 2012 to provide an execution engine that unifies the manipulation of data and metadata, translating business decisions and instructions into technical commands such as data migration or archiving. Data Transport Engine allows both IT and business personnel to standardize and streamline activities for data management and retention, from day-to-day maintenance to complex data store and domain migrations and archiving. Data Transport Engine ensures that data migrations automatically synchronize source and destination data with incremental copying even if the source data is still in use, translates access permissions across data stores and domains and provides reporting capabilities for data migration status. Moreover, it also provides IT personnel the flexibility to schedule recurring migrations to automatically find and move certain types of data such as sensitive or stale data and to perform active migrations, dispositions and archiving safely and efficiently.
|
|
•
|
DatAnswers.
DatAnswers was introduced in 2014 to provide secure, relevant and timely search functionality for enterprise data. In 2018, we enhanced DatAnswers to help meet growing demands to comply with data privacy regulations and eDiscovery requests, and to facilitate Data Subject Access Requests (DSARs). As data privacy laws are becoming more prevalent across the globe, meeting subject access requests is a primary requirement in data regulation. As companies continue to generate and store data in numerous enterprise data stores, relevant files become harder to find and manage, and compliance officers, controllers, and administrators need to identify and locate relevant content related to a data subject. DatAnswers provides elevated search for compliance and e-discovery, helping solve the growing problem of being able to fulfill subject access requests to meet data privacy laws.
|
Our Customers
Our customer base has grown from approximately 550 customers at December 31, 2009 to approximately 6,600 customers in 80 countries as of
December 31, 2018
. Our customers span numerous industries and vary greatly in size, ranging from small and medium businesses to large multinational enterprises with hundreds of thousands of employees and hundreds of terabytes of data.
Services
Maintenance and Support
Our customers typically purchase one year of software maintenance and support as part of their initial purchase of our products, with an option to renew their maintenance agreements. These maintenance agreements provide customers the right to receive support and unspecified upgrades and enhancements when and if they become available during the maintenance period and access to our technical support services.
We maintain a customer support organization that provides all levels of support to our customers. Our customers that purchase maintenance and support services receive guaranteed response times, direct telephonic support and access to online support portals. Our customer support organization has global capabilities with expertise in both our software and complex IT environments and associated third-party infrastructure.
Professional Services
While users can easily download, install and deploy our software on their own, certain enterprises use our professional service team to provide fee-based services, which include training our customers in the use of our products, providing advice on network design, product configuration and implementation, automating and customizing reports and tuning policies and configuration of our products for the particular characteristics of the customer’s environment.
Sales and Marketing
Sales
We sell the vast majority of our products and services to a global network of hundreds of resellers and distributors that we refer to as our channel partners. Our channel partners, in turn, sell the products they purchase from us to customers globally.
6
In addition, we maintain a highly trained professional sales force that is responsible for overall market development, including the management of the relationships with our channel partners and supporting channel partners in winning customers through operating demonstrations and risk assessments. Our channel partners identify potential sales targets, maintain relationships with customers and introduce new products to existing customers. Sales to our channel partners are generally subject to our standard, non-exclusive channel partner agreement, meaning our channel partners may offer customers the products of several different companies. These agreements are generally for a term of one year with a one year renewal term and can be terminated by us or the channel partner for any reason upon 30 days’ notice. A termination of the agreement has no effect on orders already placed. Payment to us from the channel partner is typically due within 30 to 60 calendar days of the invoice date.
Marketing
Our marketing strategy focuses on building our brand and product awareness, increasing customer adoption and demand, communicating advantages and business benefits and generating leads for our channel partners and sales force. We market our software as a Data Security Platform, a solution for securing and managing file systems and enterprise data and transforming that data into actionable intelligence. We execute our marketing strategy by leveraging a combination of internal marketing professionals, external marketing partners and a network of regional and global channel partners. Our internal marketing organization is responsible for branding, content generation, demand generation, field marketing and product marketing and works with our business operations team to support channel marketing and sales support programs. We provide one on one and community education and awareness and promote the expanded use of our software. We host in-person Varonis Connect! customers events annually across sales regions, as well as free, online monthly or bi-weekly technical webinars in multiple regions. We focus our efforts on events, campaigns, tools and activities that can be leveraged by our channel partners worldwide to extend our marketing reach, such as sales tools, information regarding product awards and technical certifications, training, regional seminars and conferences, webinars, podcasts and various other demand-generation activities. Our marketing efforts also include public relations in multiple regions, analyst relations, customer marketing, extensive content development available through our web site and content syndication, and our active blog, “The Inside Out Security Blog.”
Seasonality
See Item 7, “Management’s Discussion and Analysis of Financial Condition and Results of Operations — Seasonality and Quarterly Trends.”
Research and Development
Our research and development efforts are focused primarily on improving and enhancing our existing products and services, as well as developing new products, features and functionality. Use of our products has expanded from governance into new areas such as data security, accessibility and retention, and we anticipate that customers and innovation will drive functionality into additional areas. We regularly release new versions of our products which incorporate new features and enhancements to existing ones. We conduct substantially all of our research and development activities in Israel, and we believe this provides us with access to world class engineering talent.
Our research and development expense was $70.0 million, $47.4 million and $36.7 million in
2018
,
2017
and
2016
, respectively.
Intellectual Property
We rely on patent, trademark, copyright and trade secret laws, confidentiality procedures and contractual provisions to protect our technology and the related intellectual property. The nature and extent of legal protection of our intellectual property rights depends on, among other things, its type and the jurisdiction in which it arises. As of January 31, 2019, we had 63 issued patents and 38 pending patent applications in the United States. Our issued U.S. patents expire between 2025 and 2039. We also had 26 patents issued and 70 applications pending for examination in non-U.S. jurisdictions, and three pending Patent Cooperation Treaty (“PCT”) patent applications, all of which are counterparts of our U.S. patent applications. Certain of our patents are owned by our Israeli subsidiary. The claims for which we have sought patent protection relate primarily to inventions we have developed for incorporation into our products. We also license software from third parties for use in developing our products and for integration into our products, including open source software.
Despite our efforts to protect our proprietary technologies and intellectual property rights, unauthorized parties may attempt to copy aspects of our products or obtain and use our trade secrets or other confidential information. We generally enter into confidentiality agreements with our employees, consultants, service providers, vendors and customers and generally limit internal and external access to, and distribution of, our proprietary information and proprietary technology through certain
7
procedural safeguards. These agreements may not effectively prevent unauthorized use or disclosure of our intellectual property or technology and may not provide an adequate remedy in the event of unauthorized use or disclosure of our intellectual property or technology. We cannot assure you that the steps taken by us will prevent misappropriation of our trade secrets or technology or infringement of our intellectual property. In addition, the laws of some foreign countries do not protect our proprietary rights to as great an extent as the laws of the United States, and many foreign countries do not enforce these laws as diligently as government agencies and private parties in the United States.
Our industry is characterized by the existence of a large number of relevant patents and frequent claims and related litigation regarding patents and other intellectual property rights. From time to time, third-parties have asserted and may assert their patent, copyright, trademark and other intellectual property rights against us, our channel partners or customers. Successful claims of infringement or misappropriation by a third party could prevent us from distributing certain products or performing certain services or could require us to pay substantial damages (including, for example, treble damages if we are found to have willfully infringed patents and increased statutory damages if we are found to have willfully infringed copyrights), royalties or other fees. Such claims also could require us to cease making, licensing or using solutions that are alleged to infringe or misappropriate the intellectual property of others, or to expend additional development resources to attempt to redesign our products or services or otherwise to develop non-infringing technology. Even if third parties may offer a license to their technology, the terms of any offered license may not be acceptable, and the failure to obtain a license or the costs associated with any license could cause our business, results of operations or financial condition to be materially and adversely affected. In some cases, we indemnify our channel partners and customers against claims that our products infringe the intellectual property of third parties.
Competition
While there are some companies which offer certain features similar to those embedded in our solutions, as well as others with which we compete in certain use cases, we believe that we do not currently compete with a company that offers the same breadth of functionalities that we offer in a single integrated solution. Nevertheless, we do compete against a select group of software vendors, such as Veritas Technologies LLC and Quest Software, that provide standalone solutions, similar to those found in our comprehensive software suite, in the specific markets in which we operate. We also face direct competition with respect to certain of our products, specifically Data Transport Engine, DatAnswers and DatAdvantage for Directory Services. As we continue to augment our functionality with insider threat detection and user behavior analytics and as we expand our classification capabilities to better serve compliance needs with new regulations, like GDPR and other data privacy laws, we may face increased perceived and real competition from other security and classification technologies. In the future, as customer requirements evolve and new technologies are introduced, we may experience increased competition if established or emerging companies develop solutions that address the enterprise data market. Furthermore, because we operate in a relatively new and evolving area, we anticipate that competition will increase based on customer demand for these types of products.
A number of factors influence our ability to compete in the markets in which we operate, including, without limitation: the continued reliability and effectiveness of our products’ functionalities; the breadth and completeness of our solutions’ features; the scalability of our solutions; and the ease of deployment and use of our products. We believe that we generally compete favorably in each of these categories. We also believe that we distinguish ourselves from others by delivering a single, integrated solution to address our customers’ needs regarding access, governance, security and retention with respect to their enterprise data. There can, however, be no assurance that we will remain unique in this capacity or that we will be able to compete favorably with other providers in the future.
If a more established company were to target our market, we may face significant competition. They may have competitive advantages, such as greater name recognition, larger sales, marketing, research and acquisition resources, access to larger customer bases and channel partners, a longer operating history and lower labor and development costs, which may enable them to respond more quickly to new or emerging technologies and changes in customer requirements or devote greater resources to the development, promotion and sale of their products than we do. Increased competition could result in us failing to attract customers or maintain renewals and licenses at the same rate. It could also lead to price cuts, alternative pricing structures or the introduction of products available for free or a nominal price, reduced gross margins, longer sales cycles and loss of market share.
In addition, our current or prospective channel partners may establish cooperative relationships with any future competitors. These relationships may allow future competitors to rapidly gain significant market share. These developments could also limit our ability to generate revenues from existing and new customers. If we are unable to compete successfully against current and future competitors our business, results of operations and financial condition may be harmed.
Employees
8
As of
December 31, 2018
, we had 1,460 employees and independent contractors, of which 604 were in the United States, 497 were in Israel and 359 were in other countries. None of our employees is represented by an external labor union with respect to his or her employment with us. Employees in certain European countries have the benefits of collective bargaining arrangements at the national level. We have not experienced any work stoppages, and we consider our relations with our employees to be good.
Available Information
Our website is located at www.varonis.com, and our investor relations website is located at http://ir.varonis.com/. The information posted on our website is not incorporated into this Annual Report on Form 10-K. Our Annual Report on Form 10-K, Quarterly Reports on Form 10-Q, Current Reports on Form 8-K and amendments to reports filed or furnished pursuant to Sections 13(a) and 15(d) of the Exchange Act are available free of charge on our investor relations website as soon as reasonably practicable after we electronically file such material with, or furnish it to, the Securities and Exchange Commission (the “SEC"). You may also access all of our public filings through the SEC’s website at www.sec.gov.
Investors and other interested parties should note that we use our media and investor relations website and our social media channels to publish important information about us, including information that may be deemed material to investors. We encourage investors and other interested parties to review the information we may publish through our media and investor relations website and the social media channels listed on our media and investor relations website, in addition to our SEC filings, press releases, conference calls and webcasts.
|
Item 1A.
|
Risk Factors
|
Investing in our common stock involves a high degree of risk. You should carefully consider the following risks and all other information contained herein, including our consolidated financial statements and the related notes thereto, before investing in our common stock. The risks and uncertainties described below are not the only ones we face. Additional risks and uncertainties that we are unaware of, or that we currently believe are not material, also may become important factors that affect us. If any of the following risks materialize, our business, financial condition and results of operations could be materially harmed. In that case, the trading price of our common stock could decline, and you may lose some or all of your investment.
Risks Related to Our Business and Industry
The market for software that analyzes, secures, manages and migrates enterprise data is new and unproven and may not grow.
We believe our future success depends in large part on the growth of the market for software that enables enterprises to analyze, secure, manage and migrate their data. In order for us to market and sell our products, we must successfully demonstrate to enterprise IT, security and business personnel the potential value of their data and the risk of that data getting compromised or stolen. We must persuade them to devote a portion of their budgets to a unified platform that we offer to manage, protect, secure and extract value from this resource. We cannot provide any assurance that enterprises will recognize the need for our products or, if they do, that they will decide that they need a solution that offers the range of functionalities that we offer. Software solutions focused on enterprise data may not yet be viewed as a necessity, and accordingly, our sales effort is and will continue to be focused in large part on explaining the need for, and value offered by, our solution. We can provide no assurance that the market for our solution will continue to grow at its current rate or at all. The failure of the market to develop would materially adversely impact our results of operations.
9
Our quarterly results of operations have fluctuated and may fluctuate significantly due to variability in our revenues which could adversely impact our stock price.
Our revenues and other results of operations have fluctuated from quarter to quarter in the past and could continue to fluctuate in the future. As a result, comparing our revenues and results of operations on a period-to-period basis may not be meaningful, and you should not rely on any particular past quarter or other period results. Our revenues depend in part on the conversion of enterprises that have undergone risk assessments into paying customers. In this regard, most of our sales are typically made during the last three weeks of every quarter. We may fail to meet market expectations for that quarter if we are unable to close the number of transactions that we expect during this short period and closings are deferred to a subsequent quarter. In addition, our sales cycle from initial contact to delivery of and payment for the software license generally becomes longer and less predictable with respect to large transactions and often involves multiple meetings or consultations at a substantial cost and time commitment to us. Although we try to minimize the potential impact of large transactions on our quarterly results of operations, the closing of a large transaction in a particular quarter may raise our revenues in that quarter and thereby make it more difficult for us to meet market expectations in subsequent quarters, and our failure to close a large transaction in a particular quarter may adversely impact our revenues in that quarter. Moreover, we base our current and future expense levels on our revenue forecasts and operating plans, and our expenses are relatively fixed in the short term. Accordingly, we would likely not be able to reduce our costs sufficiently to compensate for an unexpected shortfall in revenues and even a relatively small decrease in revenues could disproportionately and adversely affect our financial results for that quarter.
The variability and unpredictability of these and other factors, many of which are outside of our control, could result in our failing to meet or exceed financial expectations for a given period. If our revenues or results of operations fall below the expectations of investors or any securities analysts that cover our stock, the price of our common stock could decline substantially.
A failure to hire and integrate additional sales and marketing personnel or maintain their productivity could adversely affect our results of operations and growth prospects.
Our business requires intensive sales and marketing activities. Our sales and marketing personnel are essential to attracting new customers and expanding sales to existing customers, both of which are key to our future growth. We face a number of challenges in successfully expanding our sales force. We must locate and hire a significant number of qualified individuals, and competition for such individuals is intense. In addition, as we expand into new markets with which we have less familiarity, we will need to recruit individuals who are multilingual or who have skills particular to a certain geography, and it may be difficult to find candidates with those qualifications. We may be unable to achieve our hiring or integration goals due to a number of factors, including, but not limited to, the number of individuals we hire, challenges in finding individuals with the correct background due to increased competition for such hires and increased attrition rates among new hires and existing personnel. Furthermore, based on our past experience in mature territories, it often can take up to 12 months before a new sales force member is trained and operating at a level that meets our expectations. We invest significant time and resources in training new members of our sales force, and we may be unable to achieve our target performance levels with new sales personnel as rapidly as we have done in the past due to larger numbers of hires or lack of experience training sales personnel to operate in new jurisdictions. Our failure to hire a sufficient number of qualified individuals, to integrate new sales force members within the time periods we have achieved historically or to keep our attrition rates at levels comparable to others in our industry may materially impact our projected growth rate.
Failure to attract, recruit and retain highly qualified engineers could adversely affect our results of operations and growth prospects.
Our future success and growth depend, in part, on our ability to continue to recruit and retain highly skilled personnel, particularly engineers. Any of our employees may terminate their employment at any time, we face intense competition for highly skilled engineering personnel, especially in Israel, where we have a substantial presence and need for qualified engineers, from numerous other companies, including other software and technology companies, many of whom have greater financial and other resources than we do. Moreover, to the extent we hire personnel from other companies, we may be subject to allegations that they have been improperly solicited or may have divulged proprietary or other confidential information to us. If we are unable to attract or retain qualified engineers, our ability to innovate, introduce new products and compete would be adversely impacted, and our financial condition and results of operations may suffer.
10
If we fail to manage our growth effectively, our business and results of operations will be adversely affected.
We have experienced rapid growth in a relatively short period of time. Our revenues grew from $74.6 million in 2013 to $270.3 million in
2018
. Our number of employees and independent contractors increased from 573 as of December 31, 2013 to 1,460 as of
December 31, 2018
. During this period, we also established and expanded our operations in a number of countries outside the United States and in additional locations within the United States. We intend to continue to grow our business and plan to continue to hire new employees, particularly in our sales and marketing and research and development groups. If we cannot adequately train these new employees, including our sales force, engineers and customer support staff, our sales may not grow at the rates we project or our customers may lose confidence in the knowledge and capability of our employees. In addition, we are expanding our current operations, and we intend to make investments to continue our expansion efforts. We must successfully manage our growth to achieve our objectives. Although our business has experienced significant growth in the past, we cannot provide any assurance that our business will continue to grow at the same rate, or at all.
Our ability to effectively manage any significant growth of our business will depend on a number of factors, including our ability to do the following:
|
•
|
effectively recruit, integrate, train and motivate a large number of new employees, including our sales force and engineers, while retaining existing employees, maintaining the beneficial aspects of our corporate culture and effectively executing our business plan;
|
|
•
|
satisfy existing customers and attract new customers;
|
|
•
|
transition from perpetual licenses to a more subscription-based business model;
|
|
•
|
successfully introduce new products and enhancements;
|
|
•
|
effectively manage existing channel partnerships and expand to new ones;
|
|
•
|
improve our key business applications and processes to support our business needs;
|
|
•
|
enhance information and communication systems to ensure that our employees and offices around the world are well-coordinated and can effectively communicate with each other and our growing customer base;
|
|
•
|
enhance our internal controls to ensure timely and accurate reporting of all of our operations and financial results;
|
|
•
|
protect and further develop our strategic assets, including our intellectual property rights; and
|
|
•
|
make sound business decisions in light of the scrutiny associated with operating as a public company.
|
These activities will require significant investments and allocation of valuable management and employee resources, and our growth will continue to place significant demands on our management and our operational and financial infrastructure. There are no guarantees we will be able to grow our business in an efficient or timely manner, or at all. Moreover, if we do not effectively manage the growth of our business and operations, the quality of our software could suffer, which could negatively affect our brand, results of operations and overall business.
Our failure to continually enhance and improve our technology could adversely affect sales of our products.
The market is characterized by the exponential growth in enterprise data, rapid technological advances, changes in customer requirements, including customer requirements driven by changes to legal, regulatory and self-regulatory compliance mandates, frequent new product introductions and enhancements and evolving industry standards in computer hardware and software technology. As a result, we must continually change and improve our products in response to changes in operating systems, application software, computer and communications hardware, networking software, data center architectures, programming tools, computer language technology and various regulations. Moreover, the technology in our products is especially complex because it needs to effectively identify and respond to a user’s data retention, security and governance needs, while minimizing the impact on database and file system performance. Our products must also successfully interoperate with products from other vendors.
We cannot guarantee that we will be able to anticipate future market needs and opportunities or be able to extend our technological expertise and develop new products or expand the functionality of our current products in a timely manner or at all. Even if we are able to anticipate, develop and introduce new products and expand the functionality of our current products, there can be no assurance that enhancements or new products will achieve widespread market acceptance.
Our product enhancements or new products could fail to attain sufficient market acceptance for many reasons, including:
|
•
|
failure to accurately predict market demand in terms of product functionality and to supply products that meet this demand in a timely fashion;
|
|
•
|
inability to interoperate effectively with the database technologies and file systems of prospective customers;
|
11
|
•
|
defects, errors or failures;
|
|
•
|
negative publicity or customer complaints about performance or effectiveness; and
|
|
•
|
poor business conditions, causing customers to delay IT purchases.
|
If we fail to anticipate market requirements or stay abreast of technological changes, we may be unable to successfully introduce new products, expand the functionality of our current products or convince our customers and potential customers of the value of our solutions in light of new technologies. Accordingly, our business, results of operations and financial condition could be materially and adversely affected.
If we fail to successfully manage the transition to a subscription-based business model, our results of operations could be negatively impacted.
We are currently transitioning to a more subscription-based business model. It is uncertain whether this transition will prove successful. Market acceptance of our products is dependent on our ability to include functionality and usability that address certain customer requirements. Additionally, we must optimally price our products in light of marketplace conditions, our costs and customer demand. This transition may have negative revenue implications, including on our quarterly results of operations. If we are unable to respond to these competitive threats, our business could be harmed.
This subscription strategy may give rise to a number of risks, including the following:
|
•
|
our revenues and cash flows may fluctuate more than anticipated over the short-term as a result of this strategy;
|
|
•
|
if new or current customers desire only perpetual licenses our subscription sales may lag behind our expectations;
|
|
•
|
the shift to a subscription strategy may raise concerns among our customer base, including concerns regarding changes to pricing over time and access to data once a subscription has expired;
|
|
•
|
we may be unsuccessful in maintaining or implementing our target pricing or new pricing models, product adoption and projected renewal rates, or we may select a target price or new pricing model that is not optimal and could negatively affect our sales or earnings;
|
|
•
|
our shift to a subscription licensing model may result in confusion among new or existing customers (which can slow adoption rates), resellers and investors;
|
|
•
|
if our customers do not renew their subscriptions, our revenues may decline and our business may suffer;
|
|
•
|
our relationships with existing partners that resell perpetual license products may be damaged; and
|
|
•
|
we may incur sales compensation costs at a higher than forecasted rate if the pace of our subscription transition is faster than anticipated.
|
We are dependent on the continued services and performance of our co-founder, Yakov Faitelson, the loss of whom could adversely affect our business.
Our future performance depends in large part on the continued services and continuing contributions of our co-founder, Chief Executive Officer and President, Yakov Faitelson, to successfully manage our company, to execute on our business plan and to identify and pursue new opportunities and product innovations. The loss of services of Mr. Faitelson could significantly delay or prevent the achievement of our development and strategic objectives and adversely affect our business.
Due to our rapid growth, we have a limited operating history at our current scale, which makes it difficult to evaluate and predict our future prospects and may increase the risk that we will not be successful.
We have been growing rapidly in recent periods and, as a result, have a relatively short history operating our business at its current scale. For example, we have significantly increased the number of our employees and have expanded our operations and product offerings. This limits our ability to forecast our future operating results and subjects us to a number of uncertainties, including our ability to plan for and model future growth. We have encountered and will continue to encounter risks and uncertainties frequently experienced by growing companies in new markets that may not develop as expected. Because we depend in part on the market’s acceptance of our products, it is difficult to evaluate trends that may affect our business. If our assumptions regarding these trends and uncertainties, which we use to plan our business, are incorrect or change in reaction to changes in our markets, or if we do not address these risks successfully, our operating and financial results could differ materially from our expectations and our business could suffer. Moreover, although we have experienced significant growth historically, we may not continue to grow as quickly in the future.
12
Our future success will depend in large part on our ability to, among other things:
|
•
|
maintain and expand our business, including our customer base and operations, to support our growth, both domestically and internationally;
|
|
•
|
hire, integrate, train and retain skilled talent, including members of our sales force and engineers;
|
|
•
|
develop new products and services and bring products and services in beta to market;
|
|
•
|
manage the transition to a more subscription-based business model successfully;
|
|
•
|
renew maintenance and support agreements with, and sell additional products to, existing customers;
|
|
•
|
maintain high customer satisfaction and ensure quality and timely releases of our products and product enhancements;
|
|
•
|
increase market awareness of our products and enhance our brand; and
|
|
•
|
maintain compliance with applicable governmental regulations and other legal obligations, including those related to intellectual property, international sales and taxation.
|
If we fail to address the risks and difficulties that we face, including those associated with the challenges listed above as well as those described elsewhere in this “Risk Factors” section, our business will be adversely affected, and our results of operations will suffer.
If we are unable to attract new customers and expand sales to existing customers, both domestically and internationally, our growth could be slower than we expect, and our business may be harmed.
Our future growth depends in part upon increasing our customer base, particularly those customers with potentially high customer lifetime values. Our ability to achieve significant growth in revenues in the future will depend, in large part, upon the effectiveness of our sales and marketing efforts, both domestically and internationally, and our ability to attract new customers. If we fail to attract new customers and maintain and expand those customer relationships, our revenues will grow more slowly than expected, and our business will be harmed.
Our future growth also depends upon expanding sales of our products to existing customers and their organizations. If our customers do not purchase additional licenses or capabilities, our revenues may grow more slowly than expected, may not grow at all or may decline. There can be no assurance that our efforts would result in increased sales to existing customers ("upsells") and additional revenues. If our efforts to upsell to our customers are not successful, our business would suffer. Additionally, while almost all of our software is currently licensed and sold under perpetual license agreements, we also enter into subscription license agreements with our customers and are currently transitioning to a more subscription-based business model. Due to the differences in average annual spending per customer, applied to perpetual versus subscription license sales, shifts in the mix of subscription licenses could produce significant variation in the revenues we recognize in a given period.
We have a history of losses, and we may not be profitable in the future.
We have incurred net losses in each year since our inception, including a net loss of $28.6 million, $13.8 million and $14.2 million in each of the years ended
December 31, 2018
,
2017
and
2016
, respectively. Because the market for our software is rapidly evolving and has still not yet reached widespread adoption, it is difficult for us to predict our future results of operations. We expect our operating expenses to increase over the next several years as we hire additional personnel, particularly in our sales and marketing and research and development groups, expand and improve the effectiveness of our distribution channels, and continue to develop features and applications for our software.
Prolonged economic uncertainties or downturns could materially adversely affect our business.
Our business depends on our current and prospective customers’ ability and willingness to invest money in information technology services, including cybersecurity projects, which in turn is dependent upon their overall economic health. Negative conditions in the general economy both in the United States and abroad, including conditions resulting from changes in gross domestic product growth, potential future government shutdowns, the federal government's failure to raise the debt ceiling, financial and credit market fluctuations, the imposition of trade barriers and restrictions such as tariffs, political deadlock, natural catastrophes, warfare and terrorist attacks, could cause a decrease in business investments, including corporate spending on enterprise software in general and negatively affect the rate of growth of our business.
Uncertainty in the global economy, particularly in EMEA, which accounted for approximately one-third of our revenues in
2018
, and where we have experienced inconsistent quarterly growth rates over the last few years, makes it extremely difficult for our customers and us to forecast and plan future business activities accurately. This could cause our customers to reevaluate decisions to purchase our product or to delay their purchasing decisions, which could lengthen our sales cycles.
13
We have a significant number of customers in the financial services, public sector, healthcare and industrial industries. A substantial downturn in any of these industries, or a reduction in public sector spending, may cause enterprises to react to worsening conditions by reducing their capital expenditures in general or by specifically reducing their spending on information technology. Customers may delay or cancel information technology projects, choose to focus on in-house development efforts or seek to lower their costs by renegotiating maintenance and support agreements. To the extent purchases of licenses for our software are perceived by customers and potential customers to be discretionary, our revenues may be disproportionately affected by delays or reductions in general information technology spending. In addition, the increased pace of consolidation in certain industries may result in reduced overall spending on our software. If the economic conditions of the general economy or industries in which we operate worsen from present levels, our business, results of operations and financial condition could be adversely affected.
If our technical support, customer success or professional services are not satisfactory to our customers, they may not renew their maintenance and support agreements or buy future products, which could adversely affect our future results of operations.
Our business relies on our customers’ satisfaction with the technical support and professional services we provide to support our products. Our customers typically purchase one year of software maintenance and support as part of their initial purchase of our products, with an option to renew their maintenance agreements. In order for us to maintain and improve our results of operations, it is important that our existing customers renew their maintenance and support agreements and subscription licenses, if applicable, when the initial contract term expires. Our customers have no obligation to renew their maintenance and support agreements or subscription licenses with us after the initial terms have expired. For example, our maintenance renewal rate for each of the years ended
December 31, 2018
,
2017
and
2016
was over 90%. Customer satisfaction will become even more important as we shift more of our licensing to subscription license agreements.
If we fail to provide technical support services that are responsive, satisfy our customers’ expectations and resolve issues that they encounter with our products and services, then they may elect not to purchase or renew annual maintenance and support contracts and they may choose not to purchase additional products and services from us. Accordingly, our failure to provide satisfactory technical support or professional services could lead our customers not to renew their agreements with us or renew on terms less favorable to us, and therefore have a material and adverse effect on our business and results of operations.
Breaches in our security, cyberattacks or other cyber-risks could expose us to significant liability and cause our business and reputation to suffer.
Our operations involve transmission and processing of our customers' confidential, proprietary and sensitive information. We have legal and contractual obligations to protect the confidentiality and appropriate use of customer data. Despite our security measures, our information technology and infrastructure may be vulnerable to attacks as a result of third party action, employee error or misconduct. Security risks, including, but not limited to, unauthorized use or disclosure of customer data, theft of proprietary information, loss or corruption of customer data and computer hacking attacks or other cyberattacks, could expose us to substantial litigation expenses and damages, indemnity and other contractual obligations, government fines and penalties, mitigation expenses and other liabilities. We are continuously working to improve our information technology systems, together with creating security boundaries around our critical and sensitive assets. We provide advanced security awareness training to our employees and contractors that focuses on various aspects of the cybersecurity world. All of these steps are taken in order to mitigate the risk of attack and to ensure our readiness to responsibly handle any security violation or attack. However, because techniques used to obtain unauthorized access or to sabotage systems change frequently and generally are not recognized until successfully launched against a target, we may be unable to anticipate these techniques or to implement adequate preventative measures. If an actual or perceived breach of our security occurs, the market perception of the effectiveness of our security measures and our products could be harmed, we could lose potential sales and existing customers, our ability to operate our business could be impaired, and we may incur significant liabilities.
If we are unable to maintain successful relationships with our channel partners, our business could be adversely affected.
We rely on channel partners, such as distribution partners and resellers, to sell licenses and support and maintenance agreements for our software. In
2018
, our channel partners fulfilled substantially all of our sales, and we expect that sales to channel partners will continue to account for substantially all of our revenues for the foreseeable future. Our ability to achieve revenue growth in the future will depend in part on our success in maintaining successful relationships with our channel partners.
14
Our agreements with our channel partners are generally non-exclusive, meaning our channel partners may offer customers the products of several different companies. If our channel partners do not effectively market and sell our software, choose to use greater efforts to market and sell their own products or those of others, or fail to meet the needs of our customers, our ability to grow our business, sell our software and maintain our reputation may be adversely affected. Our contracts with our channel partners generally allow them to terminate their agreements for any reason upon 30 days’ notice. A termination of the agreement has no effect on orders already placed. The loss of a substantial number of our channel partners, our possible inability to replace them, or the failure to recruit additional channel partners could materially and adversely affect our results of operations. If we are unable to maintain our relationships with these channel partners, our business, results of operations, financial condition or cash flows could be adversely affected.
Because we derive substantially all of our revenues and cash flows from sales of licenses from a single platform of products, failure of the products in the platform to satisfy customers or to achieve increased market acceptance would adversely affect our business.
In
2018
, we generated substantially all of our revenues from sales of licenses from five of our current product families, DatAdvantage, DatAlert, Data Classification Engine, DataPrivilege and Data Transport Engine. We expect to continue to derive a majority of our revenues from license sales relating to this platform in the future. As such, market acceptance of this platform of products is critical to our continued success. Demand for licenses for our platform of products is affected by a number of factors, some of which are outside of our control, including continued market acceptance of our software by referenceable accounts for existing and new use cases, technological change and growth or contraction in our market. We expect the proliferation of enterprise data to lead to an increase in the data analysis demands, and data security and retention concerns, of our customers, and our software, including the software underlying our Data Security Platform, may not be able to scale and perform to meet those demands. If we are unable to continue to meet customer demands or to achieve more widespread market acceptance of our software, our business, operations, financial results and growth prospects will be materially and adversely affected.
Failure to protect our proprietary technology and intellectual property rights could substantially harm our business.
The success of our business depends on our ability to obtain, protect and enforce our trade secrets, trademarks, copyrights, patents and other intellectual property rights. We attempt to protect our intellectual property under patent, trademark, copyrights and trade secret laws, and through a combination of confidentiality procedures, contractual provisions and other methods, all of which offer only limited protection.
As of January 31, 2019, we had 63 issued patents in the United States and 38 pending U.S. patent applications. We also had 26 patents issued and 70 applications pending for examination in non-U.S. jurisdictions, and three pending PCT patent applications, all of which are counterparts of our U.S. patent applications. We may file additional patent applications in the future. The process of obtaining patent protection is expensive and time-consuming, and we may not be able to prosecute all necessary or desirable patent applications at a reasonable cost or in a timely manner all the way through to the successful issuance of a patent. We may choose not to seek patent protection for certain innovations and may choose not to pursue patent protection in certain jurisdictions. Furthermore, it is possible that our patent applications may not issue as granted patents, that the scope of our issued patents will be insufficient or not have the coverage originally sought, that our issued patents will not provide us with any competitive advantages, and that our patents and other intellectual property rights may be challenged by others or invalidated through administrative process or litigation. In addition, issuance of a patent does not guarantee that we have an absolute right to practice the patented invention. Our policy is to require our employees (and our consultants and service providers that develop intellectual property included in our products) to execute written agreements in which they assign to us their rights in potential inventions and other intellectual property created within the scope of their employment (or, with respect to consultants and service providers, their engagement to develop such intellectual property), but we cannot assure you that we have adequately protected our rights in every such agreement or that we have executed an agreement with every such party. Finally, in order to benefit from patent and other intellectual property protection, we must monitor, detect and pursue infringement claims in certain circumstances in relevant jurisdictions, all of which is costly and time-consuming. As a result, we may not be able to obtain adequate protection or to enforce our issued patents or other intellectual property effectively.
15
In addition to patented technology, we rely on our unpatented proprietary technology and trade secrets. Despite our efforts to protect our proprietary technologies and our intellectual property rights, unauthorized parties, including our employees, consultants, service providers or customers, may attempt to copy aspects of our products or obtain and use our trade secrets or other confidential information. We generally enter into confidentiality agreements with our employees, consultants, service providers, vendors, channel partners and customers, and generally limit access to and distribution of our proprietary information and proprietary technology through certain procedural safeguards. These agreements may not effectively prevent unauthorized use or disclosure of our intellectual property or technology and may not provide an adequate remedy in the event of unauthorized use or disclosure of our intellectual property or technology. We cannot assure you that the steps taken by us will prevent misappropriation of our trade secrets or technology or infringement of our intellectual property. In addition, the laws of some foreign countries where we operate do not protect our proprietary rights to as great an extent as the laws of the United States, and many foreign countries do not enforce these laws as diligently as government agencies and private parties in the United States.
Moreover, industries in which we operate, such as data security, cybersecurity, compliance, data retention and data governance are characterized by the existence of a large number of relevant patents and frequent claims and related litigation regarding patent and other intellectual property rights. From time to time, third parties have asserted and may assert their patent, copyright, trademark and other intellectual property rights against us, our channel partners or our customers. Successful claims of infringement or misappropriation by a third party could prevent us from distributing certain products or performing certain services or could require us to pay substantial damages (including, for example, treble damages if we are found to have willfully infringed patents and increased statutory damages if we are found to have willfully infringed copyrights), royalties or other fees. Such claims also could require us to cease making, licensing or using solutions that are alleged to infringe or misappropriate the intellectual property of others or to expend additional development resources to attempt to redesign our products or services or otherwise to develop non-infringing technology. Even if third parties may offer a license to their technology, the terms of any offered license may not be acceptable, and the failure to obtain a license or the costs associated with any license could cause our business, results of operations or financial condition to be materially and adversely affected. In some cases, we indemnify our channel partners and customers against claims that our products infringe the intellectual property of third parties. Defending against claims of infringement or being deemed to be infringing the intellectual property rights of others could impair our ability to innovate, develop, distribute and sell our current and planned products and services. If we are unable to protect our intellectual property rights and ensure that we are not violating the intellectual property rights of others, we may find ourselves at a competitive disadvantage to others who need not incur the additional expense, time and effort required to create the innovative products that have enabled us to be successful to date.
We may face increased competition in our market.
While there are some companies which offer certain features similar to those embedded in our solutions, as well as others with whom we compete in certain tactical use cases, we believe that we do not currently compete with a company that offers the same breadth of functionalities that we offer in a single integrated solution. Nevertheless, we do compete against a select group of software vendors, such as Veritas Technologies LLC and Quest Software that provide standalone solutions, similar to those found in our comprehensive software suite, in the specific markets in which we operate. We also face direct competition with respect to certain of our products, specifically Data Transport Engine, DatAnswers and DatAdvantage for Directory Services. As we continue to augment our functionality with insider threat detection and user behavior analytics and as we expand our classification capabilities to better serve compliance needs with new regulations, like GDPR and other data privacy laws, we may face increased perceived and real competition from other security and classification technologies. As we expand our coverage and penetration in the cloud, we may face increased perceived and real competition from other cloud-focused technologies. In the future, as customer requirements evolve and new technologies are introduced, we may experience increased competition if established or emerging companies develop solutions that address the enterprise data market. Furthermore, because we operate in a relatively new and evolving area, we anticipate that competition will increase based on customer demand for these types of products.
In particular, if a more established company were to target our market, we may face significant competition. They may have competitive advantages, such as greater name recognition, larger sales, marketing, research and acquisition resources, access to larger customer bases and channel partners, a longer operating history and lower labor and development costs, which may enable them to respond more quickly to new or emerging technologies and changes in customer requirements or devote greater resources to the development, promotion and sale of their products than we do. Increased competition could result in us failing to attract customers or maintain licenses at the same rate. It could also lead to price cuts, alternative pricing structures or the introduction of products available for free or a nominal price, reduced gross margins, longer sales cycles and loss of market share.
16
In addition, our current or prospective channel partners may establish cooperative relationships with any future competitors. These relationships may allow future competitors to rapidly gain significant market share. These developments could also limit our ability to obtain revenues from existing and new customers.
Our ability to compete successfully in our market will also depend on a number of factors, including ease and speed of product deployment and use, the quality and reliability of our customer service and support, total cost of ownership, return on investment and brand recognition. Any failure by us to successfully address current or future competition in any one of these or other areas may reduce the demand for our products and adversely affect our business, results of operations and financial condition.
Interruptions or performance problems, including associated with our website or support website or any caused by cyberattacks, may adversely affect our business.
Our continued growth depends in part on the ability of our existing and potential customers to quickly access our website and support website. Access to our support website is also imperative to our daily operations and interaction with customers, as it allows customers to download our software, fixes and patches, as well as open and respond to support tickets and register license keys for evaluation or production purposes. We have experienced, and may in the future experience, website disruptions, outages and other performance problems due to a variety of factors, including technical failures, cyberattacks, natural disasters, infrastructure changes, human or software errors, capacity constraints due to an overwhelming number of users accessing our website simultaneously and denial of service or fraud. In some instances, we may not be able to identify the cause or causes of these website performance problems within an acceptable period of time. It may become increasingly difficult to maintain and improve the performance of our websites, especially during peak usage times and as our software becomes more complex and our user traffic increases. If our websites are unavailable or if our users are unable to download our software, patches or fixes within a reasonable amount of time or at all, we may suffer reputational harm and our business would be negatively affected.
Real or perceived errors, failures or bugs in our software could adversely affect our growth prospects.
Because our software uses complex technology, undetected errors, failures or bugs may occur. Our software is often installed and used in a variety of computing environments with different operating system management software, and equipment and networking configurations, which may cause errors or failures of our software or other aspects of the computing environment into which it is deployed. In addition, deployment of our software into computing environments may expose undetected errors, compatibility issues, failures or bugs in our software. Despite testing by us, errors, failures or bugs may not be found in our software until it is released to our customers. Moreover, our customers could incorrectly implement or inadvertently misuse our software, which could result in customer dissatisfaction and adversely impact the perceived utility of our products as well as our brand. Any of these real or perceived errors, compatibility issues, failures or bugs in our software could result in negative publicity, reputational harm, loss of or delay in market acceptance of our software, loss of competitive position or claims by customers for losses sustained by them. In such an event, we may be required, or may choose, for customer relations or other reasons, to expend additional resources in order to help correct the problem.
If our software is perceived as not being secure, customers may reduce the use of or stop using our software, and we may incur significant liabilities.
Our software involves the transmission of data between data stores, and between data stores and desktop and mobile computers, and may in the future involve the storage of data. Any security breaches with respect to such data could result in the loss of this information, litigation, indemnity obligations and other liabilities. While we have taken steps to protect the confidential information that we have access to, including confidential information we may obtain through our customer support services or customer usage of our products, we have no direct control over the substance of the content. Therefore, if customers use our software for the transmission of personally identifiable information and our security measures are breached as a result of third-party action, employee error, malfeasance or otherwise, our reputation could be damaged, our business may suffer and we could incur significant liability. Because techniques used to obtain unauthorized access or sabotage systems change frequently and generally are not identified until they are launched against a target, we may be unable to anticipate these techniques or to implement adequate preventative measures. While we maintain insurance coverage for some of the above events, the potential liabilities associated with these events could exceed the insurance coverage we maintain. Any or all of these issues could tarnish our reputation, negatively impact our ability to attract new customers or sell additional products to our existing customers, cause existing customers to elect not to renew their maintenance and support agreements or subject us to third-party lawsuits, regulatory fines or other action or liability, thereby adversely affecting our results of operations.
17
We are subject to a number of legal requirements, contractual obligations and industry standards regarding security, data protection and privacy, and any failure to comply with these requirements, obligations or standards could have an adverse effect on our reputation, business, financial condition and operating results.
Privacy and data information security have become a significant issue in the United States and in many other countries where we have employees and operations and where we offer licenses to our products. The regulatory framework for privacy and personal information security issues worldwide is rapidly evolving and is likely to remain uncertain for the foreseeable future. The U.S. federal and various state and foreign government bodies and agencies have adopted or are considering adopting laws and regulations limiting, or laws and regulations regarding, the collection, distribution, use, disclosure, storage and security of personal information. For example, California recently enacted the California Consumer Privacy Act, or CCPA, that will, among other things, require covered companies to provide new disclosures to California consumers, and afford such consumers new abilities to opt-out of certain sales of personal information, when it goes into effect on January 1, 2020. The CCPA recently was amended, and it is possible that it will be amended again before it goes into effect.
Internationally, virtually every jurisdiction in which we operate has established its own data security and privacy legal framework with which we or our customers must comply. Laws and regulations in these jurisdictions apply broadly to the collection, use, storage, disclosure and security of data that identifies or may be used to identify or locate an individual, such as names, email addresses and, in some jurisdictions, Internet Protocol addresses. These laws and regulations often are more restrictive than those in the United States and are rapidly evolving. For example, the new EU data protection regime, the GDPR became enforceable on May 25, 2018. Additionally, the United Kingdom enacted legislation in May 2018 that substantially implements the GDPR. Complying with the GDPR or other laws, regulations or other obligations relating to privacy, data protection or information security may cause us to incur substantial operational costs or require us to modify our data handling practices. Non-compliance could result in proceedings against us by governmental entities or others, could result in substantial fines or other liability and may otherwise adversely impact our business, financial condition and operating results.
Some statutory requirements, both in the United States and abroad, include obligations of companies to notify individuals of security breaches involving particular personal information, which could result from breaches experienced by us or our service providers. Even though we may have contractual protections with our service providers, a security breach could impact our reputation, harm our customer confidence, hurt our sales or cause us to lose existing customers and could expose us to potential liability or require us to expend significant resources on data security and in responding to such breach.
In addition to government regulation, privacy advocates and industry groups may propose new and different self-regulatory standards that either legally or contractually apply to us. We also expect that there will continue to be new proposed laws and regulations concerning privacy, data protection and information security, and we cannot yet determine the impact such future laws, regulations and standards may have on our business. New laws, amendments to or re-interpretations of existing laws and regulations, industry standards, contractual obligations and other obligations may require us to incur additional costs and restrict our business operations. Because the interpretation and application of laws and other obligations relating to privacy and data protection are still uncertain, it is possible that these laws and other obligations may be interpreted and applied in a manner that is inconsistent with our existing data management practices or the features of our software. If so, in addition to the possibility of fines, lawsuits and other claims, we could be required to fundamentally change our business activities and practices or modify our software, which could have an adverse effect on our business. We may be unable to make such changes and modifications in a commercially reasonable manner or at all, and our ability to develop new features could be limited. Any inability to adequately address privacy concerns, even if unfounded, or comply with applicable privacy or data protection laws, regulations and policies, could result in additional cost and liability to us, damage our reputation, inhibit sales and adversely affect our business.
Furthermore, the costs of compliance with, and other burdens imposed by, the laws, regulations and policies that are applicable to the businesses of our customers may limit the use and adoption of, and reduce the overall demand for, our products. Privacy and personal information security concerns, whether valid or not valid, may inhibit market adoption of our products particularly in certain industries and foreign countries.
Our long-term growth depends, in part, on being able to continue to expand internationally on a profitable basis, which subjects us to risks associated with conducting international operations.
Historically, we have generated a majority of our revenues from customers in North America. For the year ended
December 31, 2018
, approximately 62% of our total revenues were derived from sales in North America. Nevertheless, we have operations across the globe, and we plan to continue to expand our international operations as part of our long-term growth strategy. The further expansion of our international operations will subject us to a variety of risks and challenges, including:
18
|
•
|
sales and customer service challenges associated with operating in different countries;
|
|
•
|
increased management travel, infrastructure and legal compliance costs associated with having multiple international operations;
|
|
•
|
difficulties in receiving payments from different geographies, including difficulties associated with currency fluctuations, payment cycles, transfer of funds or collecting accounts receivable, especially in emerging markets;
|
|
•
|
variations in economic or political conditions between each country or region;
|
|
•
|
economic uncertainty around the world and adverse effects arising from economic interdependencies across countries and regions;
|
|
•
|
uncertainty around a potential reverse or renegotiation of international trade agreements and partnerships under the administration of U.S. President Donald J. Trump;
|
|
•
|
uncertainty around how the United Kingdom’s referendum in June 2016 in which voters approved an exit from the EU, commonly referred to as “Brexit,” will impact the United Kingdom’s access to the EU Single Market, the related regulatory environment, the global economy and the resulting impact on our business;
|
|
•
|
compliance with foreign laws and regulations and the risks and costs of non-compliance with such laws and regulations;
|
|
•
|
compliance with laws and regulations for foreign operations, including the U.S. Foreign Corrupt Practices Act of 1977, or the FCPA, the U.K. Bribery Act of 2010, import and export control laws, tariffs, trade barriers, economic sanctions and other regulatory or contractual limitations on our ability to sell our software in certain foreign markets, and the risks and costs of non-compliance;
|
|
•
|
heightened risks of unfair or corrupt business practices in certain geographies and of improper or fraudulent sales arrangements that may impact financial results and result in restatements of financial statements and irregularities in financial statements;
|
|
•
|
reduced protection for intellectual property rights in certain countries and practical difficulties and costs of enforcing rights abroad; and
|
|
•
|
compliance with the laws of numerous foreign taxing jurisdictions and overlapping of different tax regimes.
|
Any of these risks could adversely affect our international operations, reduce our revenues from outside the United States or increase our operating costs, adversely affecting our business, results of operations and financial condition and growth prospects. There can be no assurance that all of our employees, independent contractors and channel partners will comply with the formal policies we have and will implement, or applicable laws and regulations. Violations of laws or key control policies by our employees, independent contractors and channel partners could result in delays in revenue recognition, financial reporting misstatements, fines, penalties or the prohibition of the importation or exportation of our software and services and could have a material adverse effect on our business and results of operations.
If currency exchange rates fluctuate substantially in the future, our results of operations, which are reported in U.S. dollars, could be adversely affected.
Our functional and reporting currency is the U.S. dollar, and we generate a majority of our revenues and incur a majority of our expenses in U.S. dollars. Revenues and expenses are also incurred in other currencies, primarily Euros, Pounds Sterling, Canadian dollars, Australian dollars and New Israeli Shekels ("NIS"). Accordingly, changes in exchange rates may have a material adverse effect on our business, results of operations and financial condition. The exchange rates between the U.S. dollar and foreign currencies have fluctuated substantially in recent years and may continue to fluctuate substantially in the future. Furthermore, a strengthening of the U.S. dollar could increase the cost in local currency of our software and our maintenance renewals to customers outside the United States, which could adversely affect our business, results of operations, financial condition and cash flows. Volatility in exchange rates may continue in the short term as the United Kingdom negotiates its exit from the EU which is currently scheduled to occur on March 29, 2019. Brexit and the withdrawal of the United Kingdom from the EU, as well as other member countries' public discussions about the possibility of withdrawing from the EU, may also create global economic uncertainty, which may impact, among other things, the demand for our products.
We incur expenses for employee compensation and other operating expenses at our non-U.S. locations in local currencies. The weakening of the U.S. dollar against such currencies would cause the U.S. dollar equivalent of such expenses to increase which could have a negative impact on our reported results of operations. We use forward foreign exchange contracts to hedge or mitigate the effect of changes in foreign exchange rates on our operating expenses denominated in certain foreign currencies. However, this strategy might not eliminate our exposure to foreign exchange rate fluctuations and involves costs and risks of its own, such as cash expenditures, ongoing management time and expertise, external costs to implement the strategy and potential accounting implications. Additionally, our hedging activities may contribute to increased losses as a result of volatility in foreign currency markets.
19
Our use of open source software could negatively affect our ability to sell our software and subject us to possible litigation.
We use open source software and expect to continue to use open source software in the future. Some open source software licenses require users who distribute open source software as part of their own software product to publicly disclose all or part of the source code to such software product or to make available any derivative works of the open source code on unfavorable terms or at no cost. We may face ownership claims of third parties over, or seeking to enforce the license terms applicable to, such open source software, including by demanding the release of the open source software, derivative works or our proprietary source code that was developed using such software. These claims could also result in litigation, require us to purchase a costly license or require us to devote additional research and development resources to change our software, any of which would have a negative effect on our business and results of operations. In addition, if the license terms for the open source code change, we may be forced to re-engineer our software or incur additional costs. Finally, we cannot assure you that we have incorporated open source software into our own software in a manner that conforms with our current policies and procedures.
Our business is highly dependent upon our brand recognition and reputation, and the failure to maintain or enhance our brand recognition or reputation may adversely affect our business.
We believe that enhancing the “Varonis” brand identity and maintaining our reputation in the information technology industry is critical to our relationships with our customers and to our ability to attract new customers. Our brand recognition and reputation is dependent upon:
|
•
|
our ability to continue to offer high-quality, innovative and error- and bug-free products;
|
|
•
|
our ability to maintain customer satisfaction with our products;
|
|
•
|
our ability to be responsive to customer concerns and provide high quality customer support, training and professional services;
|
|
•
|
our marketing efforts;
|
|
•
|
any misuse or perceived misuse of our products;
|
|
•
|
positive or negative publicity;
|
|
•
|
interruptions, delays or attacks on our website; and
|
|
•
|
litigation or regulatory-related developments.
|
We may not be able to successfully promote our brand or maintain our reputation. In addition, independent industry analysts often provide reviews of our products, as well as other products available in the market, and perception of our product in the marketplace may be significantly influenced by these reviews. If these reviews are negative, or less positive than reviews about other products available in the market, our brand may be adversely affected. Furthermore, negative publicity relating to events or activities attributed to us, our employees, our channel partners or others associated with any of these parties, may tarnish our reputation and reduce the value of our brand. Damage to our reputation and loss of brand equity may reduce demand for our products and have an adverse effect on our business, results of operations and financial condition. Any attempts to rebuild our reputation and restore the value of our brand may be costly and time consuming, and such efforts may not ultimately be successful.
Moreover, it may be difficult to enhance our brand and maintain our reputation in connection with sales to channel partners. Promoting our brand requires us to make significant expenditures, and we anticipate that the expenditures will increase as our market becomes more competitive, as we expand into new markets and geographies and as more sales are generated to our channel partners. To the extent that these activities yield increased revenues, these revenues may not offset the increased expenses we incur. If we do not successfully enhance our brand and maintain our reputation, our business may not grow, we may have reduced pricing power relative to competitors with stronger brands, and we could lose customers, all of which would adversely affect our business, operations and financial results.
False detection of security breaches, false identification of malicious sources or misidentification of sensitive or regulated information could adversely affect our business.
20
Our cybersecurity products may falsely detect threats that do not actually exist. For example, our DatAlert product may enrich metadata collected by our products with information from external sources and third-party data providers. If the information from these data providers is inaccurate, the potential for false positives increases. These false positives, while typical in the industry, may affect the perceived reliability of our products and solutions and may therefore adversely impact market acceptance of our products. As definitions and instantiations of personal identifiers and other sensitive content change, automated classification technologies may falsely identify or fail to identify data as sensitive. If our products and solutions fail to detect exposures or restrict access to important systems, files or applications based on falsely identifying legitimate use as an attack or otherwise unauthorized, then our customers’ businesses could be adversely affected. Any such false identification of use and subsequent restriction could result in negative publicity, loss of customers and sales, increased costs to remedy any problem and costly litigation.
Our success depends in part on maintaining and increasing our sales to customers in the public sector.
We derive a portion of our revenues from contracts with federal, state, local and foreign governments and government-owned or -controlled entities (such as public health care bodies, educational institutions and utilities), which we refer to as the public sector herein. We believe that the success and growth of our business will continue to depend on our successful procurement of public sector contracts. Selling to public sector entities can be highly competitive, expensive and time consuming, often requiring significant upfront time and expense without any assurance that our efforts will produce any sales. Factors that could impede our ability to maintain or increase the amount of revenues derived from public sector contracts include:
|
•
|
changes in public sector fiscal or contracting policies;
|
|
•
|
decreases in available public sector funding;
|
|
•
|
changes in public sector programs or applicable requirements;
|
|
•
|
the adoption of new laws or regulations or changes to existing laws or regulations;
|
|
•
|
potential delays or changes in the public sector appropriations or other funding authorization processes;
|
|
•
|
the requirement of contractual terms that are unfavorable to us, such as most-favored-nation pricing provisions; and
|
|
•
|
delays in the payment of our invoices by public sector payment offices.
|
Furthermore, we must comply with laws and regulations relating to public sector contracting, which affect how we and our channel partners do business in both the United States and abroad. These laws and regulations may impose added costs on our business, and failure to comply with these or other applicable regulations and requirements, including non-compliance in the past, could lead to claims for damages from our channel partners, penalties, termination of contracts, and temporary suspension or permanent debarment from public sector contracting.
The occurrence of any of the foregoing could cause public sector customers to delay or refrain from purchasing licenses of our software in the future or otherwise have an adverse effect on our business, operations and financial results.
We are subject to governmental export and import controls that could subject us to liability or impair our ability to compete in international markets.
We incorporate encryption technology into certain of our products and these products are subject to U.S. export control. We are also subject to Israeli export controls on encryption technology since our product development initiatives are primarily conducted by our wholly-owned Israeli subsidiary. We have obtained the required licenses to export our products outside of the United States. In addition, the current encryption means used in our products are listed in the “free means encryption items” published by the Israeli Ministry of Defense, which means we are exempt from obtaining an encryption control license. If the applicable U.S. or Israeli legal requirements regarding the export of encryption technology were to change or if we change the encryption means in our products, we may need to apply for new licenses in the United States and may no longer be able to rely on our licensing exception in Israel. There can be no assurance that we will be able to obtain the required licenses under these circumstances. Furthermore, various other countries regulate the import of certain encryption technology, including import permitting and licensing requirements, and have enacted laws that could limit our ability to distribute our products or could limit our customers’ ability to implement our products in those countries.
21
We are also subject to U.S. and Israeli export control and economic sanctions laws, which prohibit the shipment of certain products to embargoed or sanctioned countries, governments and persons. Our products could be exported to these sanctioned targets by our channel partners despite the contractual undertakings they have given us and any such export could have negative consequences, including government investigations, penalties and reputational harm. Moreover, the Trump Administration may create further uncertainty regarding export or import regulations, economic sanctions or related legislation. It remains unclear what specifically President Trump would or would not do with respect to the initiatives he has raised and what support he would have to implement any such potential changes. Any change in export or import regulations, economic sanctions or related legislation, shift in the enforcement or scope of existing regulations, or change in the countries, governments, persons or technologies targeted by such regulations, could result in decreased use of our products by, or in our decreased ability to export or sell our products to, existing or potential customers with international operations. Any decreased use of our products or limitation on our ability to export or sell our products would likely adversely affect our business, financial condition and results of operations.
Our business in countries with a history of corruption and transactions with foreign governments increase the risks associated with our international activities.
As we operate and sell internationally, we are subject to the FCPA and other laws that prohibit improper payments or offers of payments to foreign governments and their officials and political parties for the purpose of obtaining or retaining business. We have operations, deal with and make sales to governmental customers in countries known to experience corruption, particularly certain emerging countries in Eastern Europe, South and Central America, East Asia, Africa and the Middle East. Our activities in these countries create the risk of unauthorized payments or offers of payments by one of our employees, consultants, channel partners or sales agents that could be in violation of various anti-corruption laws, even though these parties may not be under our control. While we have implemented safeguards to prevent these practices by our employees, consultants, channel partners and sales agents, our existing safeguards and any future improvements may prove to be less than effective, and our employees, consultants, channel partners or sales agents may engage in conduct for which we might be held responsible. Violations of the FCPA or other anti-corruption laws may result in severe criminal or civil sanctions, including suspension or debarment from government contracting, and we may be subject to other liabilities, which could negatively affect our business, operating results and financial condition.
Our tax rate may vary significantly depending on our stock price.
The tax effects of the accounting for stock-based compensation may significantly impact our effective tax rate from period to period. In periods in which our stock price is higher than the grant price of the stock-based compensation vesting in that period, we will recognize excess tax benefits that will decrease our effective tax rate. In future periods in which our stock price is lower than the grant price of the stock-based compensation vesting in that period, our effective tax rate may increase. The amount and value of stock-based compensation issued relative to our earnings in a particular period will also affect the magnitude of the impact of stock-based compensation on our effective tax rate. These tax effects are dependent on our stock price, which we do not control, and a decline in our stock price could significantly increase our effective tax rate and adversely affect our financial results.
Multiple factors may adversely affect our ability to fully utilize our net operating loss carryforwards.
A U.S. corporation's ability to utilize its federal net operating loss (“NOL”) carryforwards is limited under Section 382 of the Internal Revenue Code of 1986, as amended (the “Code”), if the corporation undergoes an ownership change. We performed a Section 382 analysis (the “Analysis”) which concluded that our ability to utilize our NOL and tax credit carryforwards is subject to an annual limitation, as we underwent a section 382 ownership change during 2017. The Analysis further concluded that our NOL carryforwards should be available for our utilization before they expire. As of December 31, 2017, our NOL carryforwards was $22.9 million.
During 2018, we generated an additional $32.0 million of NOLs, which are not subject to the annual limitation described above. Future changes in our stock ownership, including future offerings, as well as changes that may be outside of our control, could result in a subsequent ownership change under Section 382 of the Code that would impose an annual limitation on NOLs generated after December 31, 2017. In addition, the cash tax benefit from our NOLs is dependent upon our ability to generate sufficient taxable income. Accordingly, we may be unable to earn enough taxable income in order to fully utilize our current NOLs.
Changes in our provision for income taxes or adverse outcomes resulting from examination of our income tax returns could adversely affect our results.
22
We are subject to income taxation in the United States, Israel and numerous other jurisdictions. Determining our provision for income taxes requires significant management judgment. In addition, our provision for income taxes could be adversely affected by many factors, including, among other things, changes to our operating structure, changes in the amounts of earnings in jurisdictions with different statutory tax rates, changes in the valuation of deferred tax assets and liabilities and changes in tax laws. Significant judgment is required to determine the recognition and measurement attributes prescribed in Accounting Standards Codification (“ASC 740-10-25”). ASC 740-10-25 applies to all income tax positions, including the potential recovery of previously paid taxes, which if settled unfavorably could adversely impact our provision for income taxes. Our income in certain countries is subject to reduced tax rates provided we meet certain ongoing employment and capital investment commitments. Failure to meet these commitments could adversely impact our provision for income taxes.
We are also subject to the continuous examination of our income tax returns by the U.S. Internal Revenue Services and other tax authorities in various jurisdictions. Tax authorities may disagree with our intercompany charges, cross-jurisdictional transfer pricing or other matters and assess additional taxes. While we regularly assess the likelihood of adverse outcomes resulting from these examinations to determine the adequacy of our provision for income taxes, there can be no assurance that the outcomes from these continuous examinations will not have a material adverse effect on our results of operations and cash flows. Further, we may be audited in various jurisdictions, and such jurisdictions may assess additional taxes against us. Although we believe our tax estimates are reasonable, the final determination of any tax audits or litigation could be materially different from our historical tax provisions and accruals, which could have a material adverse effect on our results of operations or cash flows in the period or periods for which a determination is made.
The adoption of the U.S. tax reform and the enactment of additional legislation changes could materially impact our financial position and results of operations.
On December 22, 2017, President Trump signed into law the Tax Cuts and Jobs Act (the "TCJA") that significantly reforms the Code. The TCJA, among other things, includes changes to U.S. federal tax rates, imposes significant additional limitations on the deductibility of certain expenses, restricts the use of net operating loss carryforwards arising after
December 31, 2017
, allows for the expensing of capital expenditures, and puts into effect the migration from a “worldwide” system of taxation to a territorial system. Due to the expansion of our international business activities, any changes in the U.S. taxation of such activities may increase our worldwide effective tax rate and adversely affect our financial position and results of operations. Further, foreign governments may enact tax laws in response to the TCJA that could result in further changes to global taxation and materially affect our financial position and results of operations.
We conduct our operations in a number of jurisdictions worldwide and report our taxable income based on our business operations in those jurisdictions. Therefore, our intercompany relationships are subject to transfer pricing regulations administered by taxing authorities in various jurisdictions. The relevant taxing authorities may disagree with our determinations as to the income and expenses attributable to specific jurisdictions. If such a disagreement were to occur, and our position were not sustained, we could be required to pay additional taxes, interest and penalties, which could result in one-time tax charges, higher effective tax rates, reduced cash flows and lower overall profitability of our operations.
The Organization for Economic Cooperation and Development (“OECD”) introduced the base erosion and profit shifting project in 2013, which sets out a plan to address international taxation principles in a globalized, digitized business world (the “BEPS Plan”). In November 2015, the G20 adopted the OECD’s published guidance on domestic legislation and administrative changes to address the BEPS Plan action points. During 2018, as part of the BEPS Plan, more than 80 countries have been implementing the Multilateral Convention to Implement Tax Treaty Related Measures to Prevent BEPS (“MLI”). The MLI significantly changes the bilateral tax treaties signed by any country that chose to sign the MLI. Further, as a result of participating countries adopting the international tax policies set under the BEPS Plan, changes have been and continue to be made to numerous international tax principles and local tax regimes. Due to the expansion of our international business activities, those modifications may increase our worldwide effective tax rate and adversely affect our financial position.
Changes in financial accounting standards may cause adverse and unexpected revenue fluctuations and impact our reported results of operations.
A change in accounting standards or practices could harm our operating results and may even affect our reporting of transactions completed before the change is effective. New accounting pronouncements and varying interpretations of accounting pronouncements have occurred and may occur in the future. Changes to existing rules or the questioning of current practices may harm our operating results or the way we conduct our business. Additionally, the adoption of new or revised accounting principles may require that we make significant changes to our systems process and controls.
Acquisitions could disrupt our business and adversely affect our results of operations, financial condition and cash flows.
23
We may make acquisitions that could be material to our business, results of operations, financial condition and cash flows. Our ability as an organization to successfully acquire and integrate technologies or businesses is unproven. Acquisitions involve many risks, including the following:
|
•
|
an acquisition may negatively affect our results of operations, financial condition or cash flows because it may require us to incur charges or assume substantial debt or other liabilities, may cause adverse tax consequences or unfavorable accounting treatment, including potential write-downs of deferred revenues, may expose us to claims and disputes by third parties, including intellectual property claims and disputes, or may not generate sufficient financial return to offset additional costs and expenses related to the acquisition;
|
|
•
|
we may encounter difficulties or unforeseen expenditures in integrating the business, technologies, products, personnel or operations of any company that we acquire, particularly if key personnel of the acquired company decide not to work for us;
|
|
•
|
an acquisition may disrupt our ongoing business, divert resources, increase our expenses and distract our management;
|
|
•
|
an acquisition may result in a delay or reduction of customer purchases for both us and the company we acquired due to customer uncertainty about continuity and effectiveness of service from either company;
|
|
•
|
we may encounter difficulties in, or may be unable to, successfully sell any acquired products;
|
|
•
|
an acquisition may involve the entry into geographic or business markets in which we have little or no prior experience or where competitors have stronger market positions;
|
|
•
|
challenges inherent in effectively managing an increased number of employees in diverse locations;
|
|
•
|
the potential strain on our financial and managerial controls and reporting systems and procedures;
|
|
•
|
potential known and unknown liabilities or deficiencies associated with an acquired company that were not identified in advance;
|
|
•
|
our use of cash to pay for acquisitions would limit other potential uses for our cash and affect our liquidity;
|
|
•
|
if we incur debt to fund such acquisitions, such debt may subject us to material restrictions on our ability to conduct our business as well as financial maintenance covenants;
|
|
•
|
the risk of impairment charges related to potential write-downs of acquired assets or goodwill in future acquisitions;
|
|
•
|
to the extent that we issue a significant amount of equity or convertible debt securities in connection with future acquisitions, existing stockholders may be diluted and earnings per share may decrease; and
|
|
•
|
managing the varying intellectual property protection strategies and other activities of an acquired company.
|
We may not succeed in addressing these or other risks or any other problems encountered in connection with the integration of any acquired business. The inability to integrate successfully the business, technologies, products, personnel or operations of any acquired business, or any significant delay in achieving integration, could have a material adverse effect on our business, results of operations, financial condition and cash flows.
We may require additional capital to support our business growth, and this capital might not be available on acceptable terms, or at all.
We continue to make investments to support our business growth and may require additional funds to respond to business challenges, including the need to develop new features or enhance our software, improve our operating infrastructure or acquire complementary businesses and technologies. Accordingly, we may need to engage in equity or debt financing to secure additional funds. If we raise additional funds through future issuances of equity or convertible debt securities, our existing stockholders could suffer significant dilution, and any new equity securities we issue could have rights, preferences and privileges superior to those of holders of our common stock. Any debt financing that we may secure in the future could involve restrictive covenants relating to our capital raising activities and other financial and operational matters, which may make it more difficult for us to obtain additional capital and to pursue business opportunities, including potential acquisitions. We may not be able to obtain additional financing on terms favorable to us, if at all. If we are unable to obtain adequate financing on terms satisfactory to us when we require it, our ability to continue to support our business growth and to respond to business challenges could be significantly impaired, and our business may be adversely affected.
Our business is subject to the risks of fire, power outages, floods, earthquakes and other catastrophic events, and to interruption by manmade problems such as terrorism.
24
A significant natural disaster, such as a fire, flood or an earthquake, or a significant power outage could have a material adverse impact on our business, results of operations and financial condition. In the event our customers’ information technology systems or our channel partners’ selling or distribution abilities are hindered by any of these events, we may miss financial targets, such as revenues and sales targets, for a particular quarter. Further, if a natural disaster occurs in a region from which we derive a significant portion of our revenue, customers in that region may delay or forego purchases of our products, which may materially and adversely impact our results of operations for a particular period. In addition, acts of terrorism could cause disruptions in our business or the business of channel partners, customers or the economy as a whole. Given our typical concentration of sales at each quarter end, any disruption in the business of our channel partners or customers that impacts sales at the end of our quarter could have a significant adverse impact on our quarterly results. All of the aforementioned risks may be augmented if the disaster recovery plans for us and our channel partners prove to be inadequate. To the extent that any of the above results in delays or cancellations of customer orders, or the delay in the manufacture, deployment or shipment of our products, our business, financial condition and results of operations would be adversely affected.
Risks Related to our Operations in Israel
Conditions in Israel may limit our ability to develop and sell our products, which could result in a decrease of our revenues.
Our principal research and development facility, which also houses a portion of our support and general and administrative teams, is located in Israel. Since the establishment of the State of Israel in 1948, a number of armed conflicts have taken place between Israel and its neighboring countries, as well as incidents of terror activities and other hostilities, and a number of state and non-state actors have publicly committed to its destruction. Political, economic and security conditions in Israel could directly affect our operations. We could be adversely affected by hostilities involving Israel, including acts of terrorism or any other hostilities involving or threatening Israel, the interruption or curtailment of trade between Israel and its trading partners, a significant increase in inflation or a significant downturn in the economic or financial condition of Israel. Any on-going or future armed conflicts, terrorist activities, tension along the Israeli borders or with other countries in the region, including Iran, or political instability in the region could disrupt international trading activities in Israel and may materially and negatively affect our business and could harm our results of operations.
Certain countries, as well as certain companies and organizations, continue to participate in a boycott of Israeli companies, companies with large Israeli operations and others doing business with Israel and Israeli companies. The boycott, restrictive laws, policies or practices directed towards Israel, Israeli businesses or Israeli citizens could, individually or in the aggregate, have a material adverse effect on our business in the future.
Some of our officers and employees in Israel are obligated to perform routine military reserve duty in the Israel Defense Forces, depending on their age and position in the armed forces. Furthermore, they have been and may in the future be called to active reserve duty at any time under emergency circumstances for extended periods of time. Our operations could be disrupted by the absence, for a significant period, of one or more of our officers or key employees due to military service, and any significant disruption in our operations could harm our business.
The tax benefits that are available to our Israeli subsidiary require it to continue to meet various conditions and may be terminated or reduced in the future, which could increase its taxes.
Our Israeli subsidiary benefits from a status of a “Beneficiary Enterprise” under the Israeli Law for the Encouragement of Capital Investments, 5719-1959, or the Investment Law. Based on an evaluation of the relevant factors under the Investment Law, including the level of foreign (i.e., non-Israeli) investment in our company, we have determined that the effective tax rate to be paid by our Israeli subsidiary as a “Beneficiary Enterprise” has historically been approximately 10%. If our Israeli subsidiary does not meet the requirements for maintaining this status, for example, if the Israeli subsidiary materially changes the nature of its business or, if the level of foreign investment in our company decreases, it may no longer be eligible to enjoy this reduced tax rate. As a result, our Israeli subsidiary would be subject to Israeli corporate tax at the standard rate, which, as of January 1, 2019, was set at 23%. Even if our Israeli subsidiary continues to meet the relevant requirements, the tax benefits that the status of “Beneficiary Enterprise” provides may not be continued in the future at their current levels or at all. If these tax benefits were reduced or eliminated, the amount of taxes that our Israeli subsidiary would pay would likely increase, as all of our Israeli operations would consequently be subject to corporate tax at the standard rate, which could adversely affect our results of operations. Additionally, if our Israeli subsidiary increases its activities outside of Israel, for example, through acquisitions, these activities may not be eligible for inclusion in Israeli tax benefit programs. The tax benefit derived from the status of “Beneficiary Enterprise” is dependent upon the ability to generate sufficient taxable income. Accordingly, our Israeli subsidiary may be unable to earn enough taxable income in order to fully utilize its tax benefits.
Risks Related to the Ownership of our Common Stock
25
Our stock price has been and will likely continue to be volatile.
The market price for our common stock has been, and is likely to continue to be, volatile for the foreseeable future. For example, since shares of our common stock were sold in our initial public offering (“IPO”) in March 2014 at a price of $22.00 per share, our common stock’s price on The Nasdaq Global Select Market has ranged from $13.25 to $83.10 through February 8, 2019. On February 8, 2019, the closing price of our common stock was $62.74. The market price of our common stock may fluctuate significantly in response to a number of factors, many of which we cannot predict or control, including the factors listed below and other factors described in this “Risk Factors” section:
|
•
|
actual or anticipated fluctuations in our results or those of our competitors;
|
|
•
|
the financial projections we may provide to the public, any changes in these projections or our failure to meet these projections;
|
|
•
|
failure of securities analysts to initiate or maintain coverage of our company, changes in financial estimates by any securities analysts who follow our company, or our failure to meet these estimates or the expectations of investors;
|
|
•
|
ratings changes by any securities analysts who follow our company;
|
|
•
|
announcements of new products, services or technologies, commercial relationships, acquisitions or other events by us or our competitors;
|
|
•
|
changes in operating performance and stock market valuations of other technology companies generally, or those in our industry in particular;
|
|
•
|
price and volume fluctuations in in certain categories of companies or the overall stock market, including as a result of trends in the global economy;
|
|
•
|
changes in accounting principles;
|
|
•
|
sales of large blocks of our common stock, including sales by our executive officers, directors and significant stockholders;
|
|
•
|
additions or departures of any of our key personnel;
|
|
•
|
lawsuits threatened or filed against us;
|
|
•
|
short sales, hedging and other derivative transactions involving our capital stock;
|
|
•
|
general economic conditions in the United States and abroad;
|
|
•
|
changing legal or regulatory developments in the United States and other countries; and
|
|
•
|
other events or factors, including those resulting from war, incidents of terrorism or responses to these events.
|
In addition, the stock markets have experienced extreme price and volume fluctuations that have affected and continue to affect the market prices of equity securities of many technology companies. Stock prices of many technology companies have fluctuated in a manner unrelated or disproportionate to the operating performance of those companies. In the past, stockholders have instituted securities class action litigation following periods of market volatility. If we were to become involved in securities litigation, it could subject us to substantial costs, divert resources and the attention of management from our business and adversely affect our business, results of operations, financial condition and cash flows.
If securities or industry analysts do not publish research or reports about our business, or publish negative reports about our business, our stock price and trading volume could decline.
The trading market for our common stock depends in part on the research and reports that securities or industry analysts publish about us or our business, our market and our competitors. We do not have any control over these analysts or their expectations regarding our performance on a quarterly or annual basis. If one or more of the analysts who cover us downgrade our stock or change their opinion of our stock, our stock price would likely decline. If we fail to meet one or more of these analysts' published expectations regarding our performance on a quarterly basis, our stock price or trading volume could decline. If one or more of these analysts cease coverage of our company or fail to regularly publish reports on us, we could lose visibility in the financial markets, which could cause our stock price or trading volume to decline.
Substantial future sales of shares of our common stock could cause the market price of our common stock to decline.
Sales of a substantial number of shares of our common stock into the public market, or the perception that these sales might occur, could depress the market price of our common stock and could impair our ability to raise capital through the sale of additional equity securities. We are unable to predict the effect that such sales may have on the prevailing market price of our common stock.
26
As of
December 31, 2018
, we had options and restricted stock units (“RSUs”) outstanding that, if fully vested and exercised, would result in the issuance of approximately 3.2 million shares of our common stock. All of the shares of our common stock issuable upon exercise of options and vesting of RSUs have been registered for public resale under the Securities Act. Accordingly, these shares will be able to be freely sold in the public market upon issuance as permitted by any applicable vesting requirements.
The requirements of being a public company may strain our resources, divert management’s attention and affect our ability to attract and retain executive management and qualified board members.
As a public company, we are subject to the reporting requirements of the Exchange Act, the Sarbanes-Oxley Act of 2002 (the "Sarbanes-Oxley Act"), the Dodd-Frank Wall Street Reform and Consumer Protection Act of 2010, the listing requirements of The Nasdaq Global Select Market and other applicable securities rules and regulations. Compliance with these rules and regulations have increased our legal and financial compliance costs, make some activities more difficult, time-consuming or costly and increase demand on our systems and resources.
The Exchange Act requires, among other things, that we file annual, quarterly and current reports with respect to our business and results of operations. The Sarbanes-Oxley Act requires, among other things, that we maintain effective disclosure controls and procedures and internal control over financial reporting. In order to maintain and, if required, improve our disclosure controls and procedures and internal control over financial reporting to meet this standard, significant resources and management oversight is required. As a result, management’s attention may be diverted from other business concerns, which could adversely affect our business and results of operations. We may need to hire more employees in the future or engage outside consultants, which will increase our costs and expenses. In addition, changing laws, regulations and standards relating to corporate governance and public disclosure are creating uncertainty for public companies, increasing legal and financial compliance costs and making some activities more time consuming. These laws, regulations and standards are subject to varying interpretations, in many cases due to their lack of specificity, and, as a result, their application in practice may evolve over time as new guidance is provided by regulatory and governing bodies. This could result in continuing uncertainty regarding compliance matters and higher costs necessitated by ongoing revisions to disclosure and governance practices.
Being a public company, these rules and regulations have made it more expensive for us to obtain director and officer liability insurance, and in the future we may be required to accept reduced coverage or incur substantially higher costs to obtain coverage. These factors could also make it more difficult for us to attract and retain qualified members of our board of directors, particularly to serve on our audit and compensation committees, and qualified executive officers.
As a result of disclosure of information in our filings with the SEC, our business and financial condition have become more visible, which we believe may result in threatened or actual litigation, including by competitors and other third parties. If such claims are successful, our business and results of operations could be adversely affected, and even if the claims do not result in litigation or are resolved in our favor, these claims, and the time and resources necessary to resolve them, could divert the resources of our management and adversely affect our business and results of operations.
We are obligated to develop and maintain proper and effective internal control over financial reporting. These internal controls may not be determined to be effective, which may adversely affect investor confidence in our company and, as a result, the value of our common stock.
We are required, pursuant to Section 404 of the Sarbanes–Oxley Act, to furnish a report by management on, among other things, the effectiveness of our internal control over financial reporting on an annual basis. This assessment includes disclosure of any material weaknesses identified by our management in our internal control over financial reporting. We are also required to have our independent registered public accounting firm issue an opinion on the effectiveness of our internal control over financial reporting on an annual basis. During the evaluation and testing process, if we identify one or more material weaknesses in our internal control over financial reporting, we will be unable to assert that our internal control over financial reporting is effective.
If we are unable to assert that our internal control over financial reporting is effective, or if our independent registered public accounting firm is unable to express an opinion on the effectiveness of our internal control over financial reporting, we could lose investor confidence in the accuracy and completeness of our financial reports, which could cause the price of our common stock to decline, and we may be subject to investigation or sanctions by the SEC.
27
Future sales and issuances of our capital stock or rights to purchase capital stock could result in additional dilution of the percentage ownership of our stockholders and could cause our stock price to decline.
Future sales and issuances of our capital stock or rights to purchase our capital stock could result in substantial dilution to our existing stockholders. We may sell common stock, convertible securities and other equity securities in one or more transactions at prices and in a manner as we may determine from time to time. If we sell any such securities in subsequent transactions, investors may be materially diluted. New investors in such subsequent transactions could gain rights, preferences and privileges senior to those of holders of our common stock.
We do not intend to pay dividends on our common stock, so any returns will be limited to the value of our stock.
We have never declared or paid cash dividends on our common stock. We currently anticipate that we will retain any future earnings and do not expect to pay any dividends in the foreseeable future. Any determination to pay dividends in the future will be at the discretion of our board of directors and will be dependent on a number of factors, including our financial condition, results of operations, capital requirements, general business conditions and other factors that our board of directors may deem relevant. In addition, the loan agreement for our credit facility contains a prohibition on the payment of cash dividends. Until such time that we pay a dividend, investors must rely on sales of their common stock after price appreciation, which may never occur, as the only way to realize any future gains on their investments.
Anti-takeover provisions in our charter documents and under Delaware law could make an acquisition of us, which may be beneficial to our stockholders, more difficult and may prevent attempts by our stockholders to replace or remove our current management.
Provisions in our amended and restated certificate of incorporation and amended and restated bylaws may delay or prevent an acquisition of us or a change in our management. These provisions include:
|
•
|
authorizing “blank check” preferred stock, which could be issued by the board without stockholder approval and may contain voting, liquidation, dividend and other rights superior to our common stock, which would increase the number of outstanding shares and could thwart a takeover attempt;
|
|
•
|
a classified board of directors whose members can only be dismissed for cause;
|
|
•
|
the prohibition on actions by written consent of our stockholders;
|
|
•
|
the limitation on who may call a special meeting of stockholders;
|
|
•
|
the establishment of advance notice requirements for nominations for election to our board of directors or for proposing matters that can be acted upon at stockholder meetings; and
|
|
•
|
the requirement of at least 75% of the outstanding capital stock to amend any of the foregoing second through fifth provisions.
|
In addition, because we are incorporated in Delaware, we are governed by the provisions of Section 203 of the Delaware General Corporation Law, which limits the ability of stockholders owning in excess of 15% of our outstanding voting stock to merge or combine with us. Although we believe these provisions collectively provide for an opportunity to obtain greater value for stockholders by requiring potential acquirers to negotiate with our board of directors, they would apply even if an offer rejected by our board were considered beneficial by some stockholders. In addition, these provisions may frustrate or prevent any attempts by our stockholders to replace or remove our current management by making it more difficult for stockholders to replace members of our board of directors, which is responsible for appointing the members of our management.
|
Item 1B.
|
Unresolved Staff Comments
|
We do not have any unresolved comments from the SEC staff.
|
Item 2.
|
Properties
|
Our corporate headquarters are located in New York City in an office consisting of approximately 46,000 square feet. This lease expires in February 2026, although we have the option to both terminate the lease in February 2023 and extend the lease for an additional five years. We also lease offices in North Carolina consisting of approximately 23,700 square feet, which is our primary U.S. customer support and inside sales center. As of January 1, 2019, we are also leasing an additional office in North Carolina, consisting of approximately 68,500 square feet which will replace the current offices in North Carolina once the
28
construction work is completed. This lease expires in July 2030, although we have an option to extend the lease for an additional 10 years. Additionally, we currently lease an office located in Herzliya, Israel, consisting of approximately 93,000 square feet, where we employ our research and development team and a portion of our support and general and administrative teams. The lease for this office expires in December 2028, although we have the option to extend the lease for an additional five years. We also lease smaller offices in France, the United Kingdom, Ireland, Oregon, Virginia, Australia, Germany and the Netherlands (which serve as regional sales offices and some of which are customer support centers) and two additional offices in Herzliya, Israel (which house a portion of our research and development and general and administrative teams). We plan to invest in additional space as needed to accommodate our growth.
|
Item 3.
|
Legal Proceedings
|
We are not currently a party to any material litigation.
|
Item 4.
|
Mine Safety Disclosures
|
Not applicable.
29
PART II
|
Item 5.
|
Market for Registrant’s Common Equity, Related Stockholder Matters and Issuer Purchases of Equity Securities
|
Market for Registrant’s Common Equity
Our common stock has been listed on The NASDAQ Global Select Market under the symbol “VRNS” since February 28, 2014, the date of our initial public offering.
Dividend Policy
We have never declared or paid cash dividends on our common stock. We currently intend to retain any future earnings for use in the operation of our business and do not intend to declare or pay any cash dividends in the foreseeable future. Any further determination to pay dividends on our common stock will be at the discretion of our board of directors, subject to applicable laws, and will depend on our financial condition, results of operations, capital requirements, general business conditions and other factors that our board of directors considers relevant.
Stockholders
As of February 1, 2019, there were seven stockholders of record of our common stock, including The Depository Trust Company, which holds shares of our common stock on behalf of an indeterminate number of beneficial owners.
30
STOCK PERFORMANCE GRAPH
The following shall not be deemed “filed” for purposes of Section 18 of the Exchange Act, or incorporated by reference into any of our other filings under the Exchange Act or the Securities Act, except to the extent we specifically incorporate it by reference into such filing.
This chart compares the cumulative total return on our common stock with that of the NASDAQ Composite Index and the NASDAQ Computer Index. The chart assumes $100 was invested at the close of market on February 28, 2014 in our common stock, the NASDAQ Composite Index and the NASDAQ Computer Index, and assumes the reinvestment of any dividends. The stock price performance on the following graph is not necessarily indicative of future stock price performance.
The closing price of our common stock on
December 31, 2018
, the last trading day of our
2018
fiscal year, was $52.90 per share.
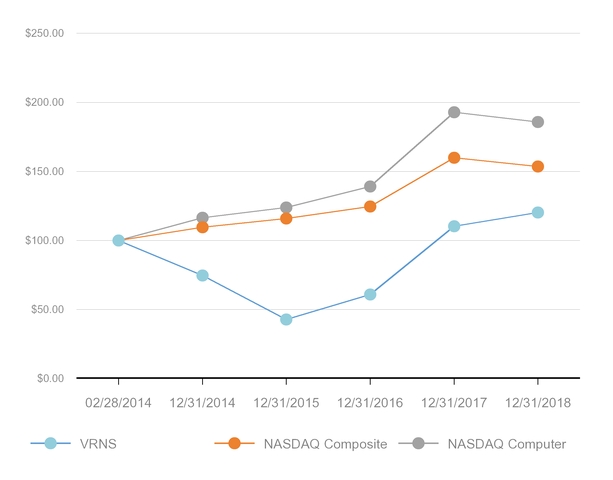
|
Company/Index
|
2/28/2014
|
|
12/31/2014
|
|
12/31/2015
|
|
12/31/2016
|
|
12/31/2017
|
|
12/31/2018
|
|
||||||||||||
|
VRNS
|
$
|
100.00
|
|
$
|
74.61
|
|
$
|
42.73
|
|
$
|
60.91
|
|
$
|
110.34
|
|
$
|
120.23
|
|
||||||
|
NASDAQ Composite
|
$
|
100.00
|
|
$
|
109.66
|
|
$
|
115.94
|
|
$
|
124.64
|
|
$
|
159.84
|
|
$
|
153.63
|
|
||||||
|
NASDAQ Computer
|
$
|
100.00
|
|
$
|
116.57
|
|
$
|
123.85
|
|
$
|
139.05
|
|
$
|
192.95
|
|
$
|
185.85
|
|
||||||
Sales of Unregistered Securities
None.
31
Purchase of Equity Securities by Issuer and Affiliated Purchasers
None.
|
Item 6.
|
Selected Financial Data
|
The following selected consolidated historical financial data are derived from our audited financial statements. The consolidated balance sheet data as of
December 31, 2018
and
2017
and the consolidated statement of operations data for the years ended
December 31, 2018
,
2017
and
2016
are derived from our audited consolidated financial statements and related notes that are included elsewhere in this Annual Report on Form 10-K. The consolidated balance sheet data as of
December 31, 2016
,
2015
and
2014
and the consolidated statement of operations for the years ended
December 31, 2015
and
2014
are derived from our audited consolidated financial statements and related notes which are not included in this Annual Report. The consolidated balance sheet data as of
December 31, 2017
and
2016
and the consolidated statement of operations data for the years ended
December 31, 2017
and
2016
have been adjusted for ASC 606. The consolidated balance sheet data as of
December 31, 2015
and
2014
and the consolidated statement of operations for the years ended
December 31, 2015
and
2014
have not been adjusted for ASC 606. The information set forth below should be read in conjunction with our historical financial statements, including the notes thereto, and “Management’s Discussion and Analysis of Financial Condition and Results of Operations,” included elsewhere in this Annual Report.
|
|
Year Ended December 31,
|
||||||||||||||||||
|
|
2018
|
2017
|
2016
|
2015
|
2014
|
||||||||||||||
|
(as adjusted)
|
(as adjusted)
|
||||||||||||||||||
|
|
(in thousands, except share and per share data)
|
||||||||||||||||||
|
Consolidated Statement of Operations Data:
|
|
|
|
|
|
|
|
|
|
|
|||||||||
|
Revenues:
|
|
|
|
|
|
|
|
|
|
|
|||||||||
|
Licenses
|
$
|
147,613
|
|
$
|
120,341
|
|
$
|
93,243
|
|
$
|
71,273
|
|
$
|
58,420
|
|
||||
|
Maintenance and services
|
122,675
|
|
95,049
|
|
72,620
|
|
55,937
|
|
42,928
|
|
|||||||||
|
Total revenues
|
270,288
|
|
215,390
|
|
165,863
|
|
127,210
|
|
101,348
|
|
|||||||||
|
Cost of revenues
(1)
|
27,683
|
|
20,714
|
|
15,737
|
|
12,019
|
|
9,911
|
|
|||||||||
|
Gross profit
|
242,605
|
|
194,676
|
|
150,126
|
|
115,191
|
|
91,437
|
|
|||||||||
|
Operating costs and expenses:
|
|
|
|
|
|
|
|
|
|
|
|||||||||
|
Research and development
(1)
|
69,971
|
|
47,369
|
|
36,660
|
|
31,792
|
|
28,086
|
|
|||||||||
|
Sales and marketing
(1)
|
168,309
|
|
133,925
|
|
105,639
|
|
86,367
|
|
68,787
|
|
|||||||||
|
General and administrative
(1)
|
33,460
|
|
26,801
|
|
19,822
|
|
16,106
|
|
11,872
|
|
|||||||||
|
Total operating expenses
|
271,740
|
|
208,095
|
|
162,121
|
|
134,265
|
|
108,745
|
|
|||||||||
|
Operating loss
|
(29,135
|
)
|
(13,419
|
)
|
(11,995
|
)
|
(19,074
|
)
|
(17,308
|
)
|
|||||||||
|
Financial income (expenses), net
|
970
|
|
2,362
|
|
(885
|
)
|
(1,523
|
)
|
(1,714
|
)
|
|||||||||
|
Loss before income taxes
|
(28,165
|
)
|
(11,057
|
)
|
(12,880
|
)
|
(20,597
|
)
|
(19,022
|
)
|
|||||||||
|
Income taxes
|
(413
|
)
|
(2,787
|
)
|
(1,313
|
)
|
(686
|
)
|
(376
|
)
|
|||||||||
|
Net loss
|
$
|
(28,578
|
)
|
$
|
(13,844
|
)
|
$
|
(14,193
|
)
|
$
|
(21,283
|
)
|
$
|
(19,398
|
)
|
||||
|
Net loss per share of common stock, basic and diluted
(2)
|
$
|
(0.98
|
)
|
$
|
(0.50
|
)
|
$
|
(0.54
|
)
|
$
|
(0.84
|
)
|
$
|
(0.91
|
)
|
||||
|
Weighted average shares used to compute net loss per share attributable to common stockholders, basic and diluted
|
29,020,645
|
|
27,467,440
|
|
26,406,312
|
|
25,198,546
|
|
21,242,313
|
|
|||||||||
(1) Includes non-cash stock-based compensation as follows:
32
|
|
Year Ended December 31,
|
||||||||||||||||||
|
|
2018
|
2017
|
2016
|
2015
|
2014
|
||||||||||||||
|
|
(in thousands)
|
||||||||||||||||||
|
Cost of revenues
|
$
|
1,757
|
|
$
|
1,078
|
|
$
|
699
|
|
$
|
419
|
|
$
|
192
|
|
||||
|
Research and development
|
9,645
|
|
5,209
|
|
3,052
|
|
1,954
|
|
1,198
|
|
|||||||||
|
Sales and marketing
|
16,081
|
|
8,542
|
|
6,104
|
|
3,041
|
|
2,478
|
|
|||||||||
|
General and administrative
|
7,478
|
|
5,006
|
|
3,083
|
|
2,380
|
|
796
|
|
|||||||||
|
Total
|
$
|
34,961
|
|
$
|
19,835
|
|
$
|
12,938
|
|
$
|
7,794
|
|
$
|
4,664
|
|
||||
|
(2)
|
Basic and diluted net loss per share of common stock is computed based on the weighted average number of shares of common stock outstanding during each period. For additional information, see Note 2.s to our consolidated financial statements included elsewhere in this Annual Report.
|
|
|
As of December 31,
|
||||||||||||||||||
|
|
2018
|
2017
|
2016
|
2015
|
2014
|
||||||||||||||
|
(as adjusted)
|
(as adjusted)
|
||||||||||||||||||
|
|
(in thousands)
|
||||||||||||||||||
|
Consolidated Balance Sheet Data:
|
|
|
|
|
|
|
|
|
|
|
|||||||||
|
Cash, cash equivalents, marketable securities and short-term deposits
|
$
|
158,915
|
|
$
|
136,557
|
|
$
|
113,808
|
|
$
|
106,344
|
|
$
|
111,695
|
|
||||
|
Working capital
|
112,750
|
|
109,918
|
|
91,734
|
|
85,086
|
|
99,316
|
|
|||||||||
|
Total assets
|
284,978
|
|
245,638
|
|
193,173
|
|
165,144
|
|
156,847
|
|
|||||||||
|
Deferred revenues, current and long-term
|
94,216
|
|
80,101
|
|
59,241
|
|
48,771
|
|
37,217
|
|
|||||||||
|
Total stockholders’ equity
|
125,370
|
|
114,642
|
|
95,955
|
|
83,587
|
|
95,026
|
|
|||||||||
|
Item 7.
|
Management’s Discussion and Analysis of Financial Condition and Results of Operations
|
The following discussion and analysis of our financial condition and results of operations should be read in conjunction with our consolidated financial statements and related notes appearing elsewhere in this Annual Report on Form 10-K. This discussion contains forward-looking statements that reflect our plans, estimates and beliefs, and involve risks and uncertainties. Our actual results and the timing of certain events could differ materially from those anticipated in these forward-looking statements as a result of several factors, including those discussed in the section titled “Risk Factors” included under Part I, Item 1A and elsewhere in this Annual Report. See “Special Note Regarding Forward-Looking Statements” in this Annual Report.
Overview
Varonis is a pioneer in data security and analytics, fighting a different battle than conventional cybersecurity companies. We are pioneers because over a decade ago, we recognized that enterprise capacity to create and share data far exceeded its capacity to protect it. We believed the vast movement of information from analog to digital mediums combined with increasing information dependence would change both the global economy and the risk profiles of corporations and government. Since then our focus has been on using innovation to address the cyber-implications of this movement, creating software that provides new ways to track and protect data wherever it is stored.
Our software allows enterprises to protect data stored on premises and in the cloud: sensitive files and emails; confidential customer, patient and employee data; financial records; strategic and product plans; and other intellectual property. Recognizing the complexities of securing data, we have built a single integrated platform for security and analytics to simplify and streamline security and data management.
The Varonis Data Security Platform, built on patented technology, allows enterprises to protect data against insider threats and cyberattacks. Our products enable enterprises to analyze data, account activity and user behavior to detect attacks. Our Data Security Platform prevents or limits unauthorized use of sensitive information, prevents potential cyberattacks and limits others by locking down sensitive and stale data. Our products efficiently sustain a secure state with automation and addresses
33
additional important use cases including data protection, governance, compliance, classification and threat detection and response. Our Data Security Platform is driven by a proprietary technology, our Metadata Framework, that extracts critical metadata, or data about data, from an enterprise’s IT infrastructure. Our Data Security Platform uses this contextual information to map functional relationships among employees, data objects, content and usage.
We started operations in 2005 with a vision to make enterprise data more accessible, manageable, secure and actionable. We began offering our flagship product, DatAdvantage, which provides centralized visibility for enterprise data, in 2006. Since then we have continued to invest in innovation and have consistently introduced new products to our customers. In 2006, we introduced DataPrivilege as our self-service web portal for business users. In 2008, we enhanced our DatAdvantage offering with DatAdvantage for UNIX/Linux. In 2009, we introduced the IDU Classification Framework (later renamed the Data Classification Engine) for sensitive data classification and DatAdvantage for SharePoint. We further enhanced our DatAdvantage offering by releasing DatAdvantage for Exchange in 2010, enabling our customers to exercise control over the information transferred through corporate e-mails. In 2011, we introduced DatAdvantage for Directory Services for increased visibility into Active Directory.
In 2012, we released the Data Transport Engine for intelligent data migration and archiving and DatAnywhere for secure hybrid cloud collaboration. In 2013, we introduced DatAlert to monitor and alert on sensitive data and file activity. In 2014, we introduced DatAnswers, a secure enterprise search solution for enterprise data that delivers highly relevant and secure search results to enterprise employees, greatly improving their productivity. In 2015, we enhanced our DatAdvantage, DataPrivilege and Data Classification Engine offerings; with DatAdvantage support for the following Microsoft Office 365 data stores: Exchange Online, SharePoint Online, OneDrive and Active Directory hosted in Azure; with DataPrivilege for SharePoint; and with Data Classification Engine for UNIX, SharePoint Online and OneDrive. In 2016, we enhanced our DatAdvantage offerings with additional Office 365 support; DatAnswers support for SharePoint Online and OneDrive; and introduced a new web UI for DatAlert for comprehensive security management and threat detection. In that year we also added additional user behavior analytics driven threat models to DatAlert to significantly enhance our detection of insider threats, including potential disgruntled employees, rogue administrators, hijacked accounts and malware, such as ransomware. We also established a behavioral research laboratory where a dedicated team of security experts and data scientists from Varonis continually research the latest threats and emerging security vulnerabilities and introduce new behavior-based threat models to DatAlert.
In 2017, we introduced the Automation Engine to allow customers to automatically repair and maintain file systems so that organizations are less vulnerable to attacks and security breaches, more compliant and consistently meeting a least privilege model. We enhanced DatAlert with DatAlert Analytics Rewind to allow customers to analyze past user and data activity to identify security breaches that may have occurred in the past and pre-emptively tune out false positives. We updated our web UI for DatAlert and added new threat models to detect suspicious mailbox, Exchange and Exchange Online behaviors, password resets, unusual activity from personal devices and more. We introduced a new security dashboard in DatAlert, along with enhanced behavioral analytics, geolocation and more to make it easier than ever to perform security investigations and forensics. In 2017, we also released GDPR Patterns, part of the Data Classification Engine family, to help enterprises identify data that falls under the GDPR and expanded our offerings that can help enterprises meet compliance and regulation requirements.
In 2018, we introduced Varonis Edge to extend our proactive security approach, enabling customers to spot signs of attack at the perimeter by analyzing telemetry from DNS, VPN and Web Proxies. We introduced Data Classification Labels, part of the Data Classification Engine family, to integrate with Microsoft Information Protection (MIP) and enable customers to better classify, track and secure files across enterprise data stores. We enhanced DatAnswers to address additional compliance requirements from new data privacy laws and standards. We added classification categories to the Data Classification Engine, to better identify and analyze regulated data like GDPR, PII, PCI and PHI. We updated the DataPrivilege UI for improved usability and added classification categories making it easier to see who can access regulated data. We updated our web UI and introduced new features to DatAlert, including new threat models to combat cyberattacks, support for more data stores and optimizations to make DatAlert faster and more intuitive for security investigations.
At the core of our technology is our ability to intelligently extract and analyze metadata from an enterprise’s vast, distributed data stores. The broad applicability of our technology has resulted in our customers deploying our platform for numerous use cases for security, IT, operations and business personnel. We currently have six product families, and, as of
December 31, 2018
, approximately 73% of our customers had purchased products in two or more families, one of which was DatAdvantage for all of these customers. As of
December 31, 2018
, approximately 40% of our customers had purchased products in three or more families. We believe our existing customer base serves as a strong source of incremental revenues given our broad platform of products, their growing volumes and complexity of enterprise data and associated security concerns. Our maintenance renewal rate for each of the years ended
December 31, 2018
,
2017
and
2016
was over 90%. Our key strategies to maintain our renewal
34
rate include focusing on the quality and reliability of our customer service and support to ensure our customers receive value from our products, providing consistent software upgrades and having sufficient dedicated renewal sales personnel.
We sell substantially all of our products and services to channel partners, including distributors and resellers, which sell to end-user customers, which we refer to in this report as our customers. We believe that our sales model, which combines the leverage of a channel sales model with our highly trained and professional sales force, has and will continue to play a major role in our ability to grow and to successfully deliver our unique value proposition for enterprise data. While our products serve customers of all sizes, in all industries and all geographies, the marketing focus and majority of our sales focus is on targeting organizations with 1,000 users or more who can make larger purchases with us over time and have a greater potential lifetime value. As of
December 31, 2018
, we had approximately 6,600 customers, spanning leading firms in the financial services, public, healthcare, industrial, insurance, energy and utilities, consumer and retail, media and entertainment, technology and education sectors. We believe our customer count is a key indicator of our market penetration and the value that our products bring to our customer base. We also believe our existing customers represent significant future revenue opportunities for us. We will continue our focus on targeting organizations with 1,000 users or more who can make larger purchases with us over time. The average spending per customer for each of the years ended
December 31, 2018
,
2017
and
2016
was approximately $91,000, $83,000 and $65,000, respectively.
We believe there is a significant long-term growth opportunity in both domestic and foreign markets, which could include any organization that uses file shares, intranets and email for collaboration, regardless of region. For the year ended
December 31, 2018
, approximately 62% of our revenues were derived from North America, while EMEA accounted for approximately 35% of our revenues and Rest of World (“ROW”) accounted for approximately 3% of our revenues. Growth in North America was 18% and 20%, respectively, for the three months and year ended
December 31, 2018
as compared to the comparable periods in the prior year. In EMEA, growth for the three months and year ended
December 31, 2018
was 22% and 36%, respectively, as compared to the comparable periods in the prior year. We expect both continued sales growth in North America and international expansion to be key components of our growth strategy, and we will continue to market our products and services in international markets.
We plan to continue to expand our international operations as part of our growth strategy. The expansion of our international operations depends in particular on our ability to hire, integrate and retain local sales and marketing personnel in these international markets, acquire new channel partners and implement an effective marketing strategy. Given the nominal amount of our ROW revenues, our ROW revenue growth rates have fluctuated in the past and may fluctuate in the future based on the timing of deal closures. In addition, the further expansion of our international operations will increase our sales and marketing and general and administrative expenses and will subject us to a variety of risks and challenges, including those related to economic and political conditions in each region, compliance with foreign laws and regulations, and compliance with domestic laws and regulations applicable to our international operations.
We derive revenues from license sales of our products, services, including initial maintenance contracts and professional services, and renewals. License revenues consist of the revenues recognized from sales of licenses to new customers and additional licenses to existing customers and include perpetual and subscription licensing arrangements. While historically fees from subscription licenses comprised an insignificant amount of our revenues, we expect that over the next several years revenues from subscription licenses will become a more significant portion of our total revenues as we transition to a more subscription-based business model. As a result, we expect license revenues to comprise a larger proportion of our total revenues in the future, resulting in revenues that are more recurring and predictable.
Substantially all of our license sales are derived from a platform of products, consisting of DatAdvantage, DatAlert, Data Classification Engine, DataPrivilege and Data Transport Engine. As of
December 31, 2018
,
2017
and
2016
, 100.0%, 99.6% and 99.6% of our customers, respectively, had purchased DatAdvantage; 50.4%, 47.3% and 40.6% of our customers, respectively, had purchased DatAlert; 49.3%, 43.8% and 37.7% of our customers, respectively, had purchased Data Classification Engine; 15.4%, 16.0% and 17.2% of our customers, respectively, had purchased DataPrivilege; and 7.7%, 6.7% and 5.9% of our customers, respectively, had purchased Data Transport Engine. As of
December 31, 2018
,
2017
and
2016
, 27.0%, 30.2% and 34.5% of our customers, respectively, made standalone purchases of DatAdvantage. No other product families outside of DatAdvantage can be sold on a standalone basis. Licenses sales accounted for 54.6%, 55.9% and 56.2% of our total revenues for the years ended
December 31, 2018
,
2017
and
2016
, respectively.
We have achieved significant growth and scale in recent periods utilizing our business model. For the years ended
December 31, 2018
,
2017
and
2016
, our revenues were $270.3 million, $215.4 million, and $165.9 million, respectively, representing year-over-year growth of 25% and 30%. For the years ended
December 31, 2018
,
2017
and
2016
, we had operating losses of
$29.1
million,
$13.4
million and
$12.0
million and net losses of
$28.6
million,
$13.8
million and
$14.2
million, respectively.
35
Components of Operating Results
Revenues
Our revenues consist of licenses and maintenance and services revenues.
License Revenues.
License revenues reflect the revenues recognized from sales of software licenses to new customers and sales of additional licenses to existing customers who can purchase additional users for existing licenses or purchase new licenses. Substantially all of our license revenues consist of revenues from perpetual licenses, under which we generally recognize the license fee portion of the arrangement upon delivery as the benefit of the asset has transferred. Customers may also purchase subscription license agreements which are sold on premises and provide customers with the same functionality
and differ in the duration over which the customer benefits from the software. We expect revenues from subscription licenses to become a larger percentage of our total license revenues. Due to the shifts in the mix of perpetual and subscription licenses, we could produce significant variation in the revenues we recognize in a given period. We are focused on acquiring new customers and increasing revenues from our existing customers.
Maintenance and Services Revenues.
Maintenance and services revenues consist of revenues from maintenance agreements and, to a lesser extent, professional services. Typically, when purchasing a perpetual license, a customer also purchases a one year maintenance contract for which we charge a percentage of the license fee. Customers may renew, and generally have renewed, their maintenance agreements for a fee that is based upon a percentage of the initial license fee paid. Customers with maintenance agreements are entitled to receive support and unspecified upgrades and enhancements when and if they become available during the maintenance period. We have experienced growth in maintenance revenues primarily due to increased license sales to new and existing customers and high annual retention of existing customers. We recognize the revenues associated with maintenance ratably, on a straight-line basis, over the associated maintenance period. We measure the perpetual license maintenance renewal rate for our customers over a 12-month period, based on a dollar renewal rate for contracts expiring during that time period. Our maintenance renewal rate for each of the years ended
December 31, 2018
,
2017
and
2016
has been over 90%. We also offer professional services focused on training our customers in the use of our products, providing advice on deployment planning, network design, product configuration and implementation, automating and customizing reports and tuning policies and configuration. We recognize the revenues associated with these professional services, which are generally provided on a time and materials basis, as we deliver the services, provide the training or when the service term has expired.
The following table sets forth the percentage of our revenues that have been derived from licenses and maintenance and services revenues for the periods presented.
|
|
Year Ended December 31,
|
|||||||
|
|
2018
|
2017
|
2016
|
|||||
|
|
(as a percentage of total revenues)
|
|||||||
|
Revenues:
|
|
|
|
|
|
|
||
|
Licenses
|
54.6
|
%
|
55.9
|
%
|
56.2
|
%
|
||
|
Maintenance and services
|
45.4
|
%
|
44.1
|
%
|
43.8
|
%
|
||
|
Total revenues
|
100.0
|
%
|
100.0
|
%
|
100.0
|
%
|
||
Our products are used by a wide range of enterprises, including Fortune 500 corporations and small and medium-sized businesses. As of
December 31, 2018
, we had approximately 6,600 customers across a broad array of company sizes and industries located in 80 countries.
Cost of Revenues, Gross Profit and Gross Margin
Our cost of revenues consists of cost of maintenance and services revenues. Cost of maintenance and services revenues consist primarily of salaries (including payroll tax expense related to stock-based compensation), employee benefits (including commissions and bonuses) and stock-based compensation for our maintenance and services employees; travel expenses; and allocated overhead costs for facilities, IT and depreciation of equipment. We recognize expenses related to maintenance and services as they are incurred. We expect that our cost of maintenance and services revenues will increase in absolute dollars as we increase our headcount to support revenue growth.
36
Gross profit is total revenues less total cost of revenues. Gross margin is gross profit expressed as a percentage of total revenues. Our gross margin has historically fluctuated slightly from period to period as a result of changes in the mix of license and maintenance and services revenues. Due to the seasonality of our business, the first quarter typically results in the lowest gross margin as our first quarter revenues have historically been the lowest for the year and the majority of our expenses are relatively fixed quarter over quarter. Conversely, the fourth quarter typically results in the highest gross margin as our fourth quarter revenues have historically been the highest for the year.
Operating Costs and Expenses
Our operating costs and expenses are classified into three categories: research and development, sales and marketing and general and administrative. For each category, the largest component is personnel costs, which consists of salaries (including payroll tax expense related to stock-based compensation), employee benefits (including commissions and bonuses) and stock-based compensation. Operating costs and expenses also include allocated overhead costs for depreciation of equipment. Allocated costs for facilities primarily consist of rent and office maintenance. Operating costs and expenses are generally recognized as incurred. We expect personnel costs to continue to increase in absolute dollars as we hire new employees to continue to grow our business.
Research and Development
. Research and development expenses primarily consist of personnel costs attributable to our research and development personnel, as well as allocated overhead costs. We expense research and development costs as incurred. We expect that our research and development expenses will continue to increase in absolute dollars as we increase our research and development headcount to further strengthen our technology platform and invest in the development of both existing and new products.
Sales and Marketing
. Sales and marketing expenses are the largest component of our operating costs and expenses and consist primarily of personnel costs, as well as marketing and business development costs, travel expenses, training and education and allocated overhead costs. We expect that sales and marketing expenses will continue to increase in absolute dollars, as we plan to expand our sales and marketing efforts, both domestically and internationally. We expect sales and marketing expenses to be our largest category of operating costs and expenses as we continue to expand our business worldwide.
General and Administrativ
e. General and administrative expenses mostly consist of personnel and facility-related costs for our executive, finance, legal, human resources and administrative personnel. Other expenses are comprised of legal, accounting and other consultant fees and other corporate expenses and allocated overhead. We expect that general and administrative expense will increase in absolute dollars as we grow and expand our operations, including higher legal, corporate insurance and accounting expenses, and the additional costs of achieving and maintaining compliance with the Sarbanes-Oxley Act and related regulations.
Financial Income (Expenses), Net
Financial income (expenses), net consist primarily of foreign exchange gains or losses and interest income. Foreign exchange gains or losses relate to our business activities in foreign countries with different operational reporting currencies. As a result of our business activities in foreign countries, we expect that foreign exchange gains or losses will continue to occur due to fluctuations in exchange rates in the countries where we do business. Brexit, as well as other member countries public discussions about the possibility of withdrawing from the EU, could also contribute to instability and volatility in the global financial and foreign exchange markets, including volatility in the value of Pounds Sterling, Euros and other currencies. Interest income represents interest received on our cash, cash equivalents, marketable securities and short-term deposits.
Income Taxes
We operate in several tax jurisdictions and are subject to taxes in each country or jurisdiction in which we conduct business. Earnings from our non-U.S. activities are subject to local country income tax and may be subject to U.S. income tax.
Because of our history of U.S. net operating losses, we have established a full valuation allowance against potential future benefits for deferred tax assets including loss carryforwards; however, we have recorded net deferred tax assets of $0.1 million as of
December 31, 2018
for certain foreign jurisdictions. Our income tax provision could be significantly impacted by estimates surrounding our uncertain tax positions and changes to our valuation allowance in future periods. We reevaluate the judgments surrounding our estimates and make adjustments as appropriate each reporting period.
37
Our Israeli subsidiary currently qualifies as a “Beneficiary Enterprise” which, upon fulfillment of certain conditions, allows it to qualify for a reduced tax rate based on the beneficiary program guidelines.
In addition, we are subject to the continuous examinations of our income tax returns by the tax authorities in each jurisdiction in which we operate. We regularly assess the likelihood of adverse outcomes resulting from these examinations to determine the adequacy of our provision for income taxes.
On December 22, 2017, the TCJA was signed into law making significant changes to the Code. These changes include, but are not limited to:
|
•
|
A corporate tax rate decrease from 35% to 21% effective for tax years beginning after December 31, 2017;
|
|
•
|
A one-time transition tax on the mandatory deemed repatriation of cumulative foreign earnings as of December 31, 2017 (the “Deemed Repatriation Transition Tax”);
|
|
•
|
Taxation of global intangible low-taxed income (“GILTI”) earned by foreign subsidiaries beginning after December 31, 2017. The GILTI tax imposes a tax on foreign income in excess of a deemed return on tangible assets of foreign corporations; and
|
|
•
|
Taxation of base erosion and anti-abuse (“BEAT”) payments made by U.S. corporations to foreign related parties. The BEAT tax applies only to corporations with average gross domestic sales of $500 million over three successive years.
|
We have completed the analysis of the accounting treatment related to the tax effects of the TCJA in our year end income tax provision in accordance with our understanding of the TCJA and guidance available as of the date of this filing. As a result:
|
•
|
As of December 31, 2018, we have concluded our accounting related to the Deemed Repatriation Transition Tax and did not make any related measurement-period adjustments.
|
|
•
|
Due to the aggregated net tested loss of our foreign subsidiaries, we should not be subject to GILTI tax for 2018.
|
|
•
|
For 2018, we should not be subject to any tax on account of BEAT.
|
|
•
|
Due to the NOLs generated during 2018, we will not benefit from the reduced tax rate of 13.125% on our foreign derived intangible income.
|
We recognize that the Internal Revenue Service (the "IRS"), the Financial Accounting Standards Board and the SEC are continuing to publish and finalize ongoing guidance with respect to the TCJA which may modify accounting interpretations of the TCJA. As such, we will account for these impacts in the period in which any changes are enacted.
Results of Operations
The following tables are a summary of our consolidated statements of operations in dollars and as a percentage of our total revenues.
38
|
|
Year Ended December 31,
|
||||||||||
|
|
2018
|
2017
|
2016
|
||||||||
|
(as adjusted)
|
(as adjusted)
|
||||||||||
|
|
(in thousands)
|
||||||||||
|
Statement of Operations Data:
|
|
|
|
|
|
|
|||||
|
Revenues:
|
|
|
|
|
|
|
|||||
|
Licenses
|
$
|
147,613
|
|
$
|
120,341
|
|
$
|
93,243
|
|
||
|
Maintenance and services
|
122,675
|
|
95,049
|
|
72,620
|
|
|||||
|
Total revenues
|
270,288
|
|
215,390
|
|
165,863
|
|
|||||
|
Cost of revenues
|
27,683
|
|
20,714
|
|
15,737
|
|
|||||
|
Gross profit
|
242,605
|
|
194,676
|
|
150,126
|
|
|||||
|
Operating costs and expenses:
|
|
|
|
|
|
|
|||||
|
Research and development
|
69,971
|
|
47,369
|
|
36,660
|
|
|||||
|
Sales and marketing
|
168,309
|
|
133,925
|
|
105,639
|
|
|||||
|
General and administrative
|
33,460
|
|
26,801
|
|
19,822
|
|
|||||
|
Total operating expenses
|
271,740
|
|
208,095
|
|
162,121
|
|
|||||
|
Operating loss
|
(29,135
|
)
|
(13,419
|
)
|
(11,995
|
)
|
|||||
|
Financial income (expenses), net
|
970
|
|
2,362
|
|
(885
|
)
|
|||||
|
Loss before income taxes
|
(28,165
|
)
|
(11,057
|
)
|
(12,880
|
)
|
|||||
|
Income taxes
|
(413
|
)
|
(2,787
|
)
|
(1,313
|
)
|
|||||
|
Net loss
|
$
|
(28,578
|
)
|
$
|
(13,844
|
)
|
$
|
(14,193
|
)
|
||
|
|
Year Ended December 31,
|
|||||||
|
|
2018
|
2017
|
2016
|
|||||
|
(as adjusted)
|
(as adjusted)
|
|||||||
|
|
(as a percentage of total revenues)
|
|||||||
|
Statement of Operations Data:
|
|
|
|
|
|
|
||
|
Revenues:
|
|
|
|
|
|
|
||
|
Licenses
|
54.6
|
%
|
55.9
|
%
|
56.2
|
%
|
||
|
Maintenance and services
|
45.4
|
|
44.1
|
|
43.8
|
|
||
|
Total revenues
|
100.0
|
|
100.0
|
|
100.0
|
|
||
|
Cost of revenues
|
10.2
|
|
9.6
|
|
9.5
|
|
||
|
Gross profit
|
89.8
|
|
90.4
|
|
90.5
|
|
||
|
Operating costs and expenses:
|
|
|
|
|
|
|
||
|
Research and development
|
25.9
|
|
22.0
|
|
22.1
|
|
||
|
Sales and marketing
|
62.3
|
|
62.2
|
|
63.7
|
|
||
|
General and administrative
|
12.4
|
|
12.4
|
|
11.9
|
|
||
|
Total operating expenses
|
100.6
|
|
96.6
|
|
97.7
|
|
||
|
Operating loss
|
(10.8
|
)
|
(6.2
|
)
|
(7.2
|
)
|
||
|
Financial income (expenses), net
|
0.4
|
|
1.1
|
|
(0.6
|
)
|
||
|
Loss before income taxes
|
(10.4
|
)
|
(5.1
|
)
|
(7.8
|
)
|
||
|
Income taxes
|
(0.2
|
)
|
(1.3
|
)
|
(0.8
|
)
|
||
|
Net loss
|
(10.6
|
)%
|
(6.4
|
)%
|
(8.6
|
)%
|
||
Comparison of Years Ended December 31, 2018 and 2017
Revenues
39
|
|
Year Ended
December 31,
|
|
||||||||
|
|
2018
|
2017
|
% Change
|
|||||||
|
|
(in thousands)
|
|
||||||||
|
Revenues:
|
|
|
|
|
|
|
||||
|
Licenses
|
$
|
147,613
|
|
$
|
120,341
|
|
22.7
|
%
|
||
|
Maintenance and services
|
122,675
|
|
95,049
|
|
29.1
|
%
|
||||
|
Total revenues
|
$
|
270,288
|
|
$
|
215,390
|
|
25.5
|
%
|
||
|
|
Year Ended December 31,
|
||||
|
|
2018
|
2017
|
|||
|
|
(as a percentage of total revenues)
|
||||
|
Revenues:
|
|
|
|
|
|
|
Licenses
|
54.6
|
%
|
55.9
|
%
|
|
|
Maintenance and services
|
45.4
|
%
|
44.1
|
%
|
|
|
Total revenues
|
100.0
|
%
|
100.0
|
%
|
|
Total revenue growth was achieved due to increased demand for our services and products from existing and new customers, mostly in the domestic market, as well as in international markets. The increase in license revenues was driven by sales to existing customers and larger aggregate sales to 873 new customers in
2018
compared to the aggregate sales to 961 new customers in
2017
. As of
December 31, 2018
and
2017
, we had approximately 6,600 and approximately 5,850 customers, respectively. Almost all of our license revenues was attributable to sales of perpetual licenses. The increase in maintenance and services revenues was primarily due to an increase in the sale of maintenance agreements resulting from the growth of our installed customer base. In each of
2018
and
2017
, our maintenance renewal rate was over 90%. Of the license and first year maintenance and services revenues recognized in the year ended
December 31, 2018
, 50% was attributable to revenues from new customers, and 50% was attributable to revenues from existing customers. Of the license and first year maintenance and services revenues recognized in the year ended
December 31, 2017
, 54% was attributable to revenues from new customers, and 46% was attributable to revenues from existing customers. As of
December 31, 2018
and
2017
, 73% and 69% of our customers, respectively, had purchased two or more product families. As of
December 31, 2018
and
2017
, 40% and 36% of our customers, respectively, had purchased three or more product families.
Cost of Revenues and Gross Margin
|
|
Year Ended
December 31,
|
|
||||||||
|
|
2018
|
2017
|
% Change
|
|||||||
|
|
(in thousands)
|
|
|
|||||||
|
Cost of revenues
|
$
|
27,683
|
|
$
|
20,714
|
|
33.6
|
%
|
||
|
|
Year Ended December 31,
|
|||||
|
|
2018
|
2017
|
||||
|
|
(as a percentage of total revenues)
|
|||||
|
Total gross margin
|
89.8
|
%
|
90.4
|
%
|
||
The increase in cost of revenues was primarily related to an increase of $6.2 million in salaries and benefits and stock based compensation expense due to increased headcount for support personnel to support our greater revenues and high renewal rate and a $0.6 million increase in facilities and allocated overhead costs.
Operating Costs and Expenses
40
|
|
Year Ended
December 31,
|
|
||||||||
|
|
2018
|
2017
|
% Change
|
|||||||
|
|
(in thousands)
|
|
||||||||
|
Operating costs and expenses:
|
|
|
|
|
|
|
||||
|
Research and development
|
$
|
69,971
|
|
$
|
47,369
|
|
47.7
|
%
|
||
|
Sales and marketing
|
168,309
|
|
133,925
|
|
25.7
|
%
|
||||
|
General and administrative
|
33,460
|
|
26,801
|
|
24.8
|
%
|
||||
|
Total operating expenses
|
$
|
271,740
|
|
$
|
208,095
|
|
30.6
|
%
|
||
|
|
Year Ended December 31,
|
||||
|
|
2018
|
2017
|
|||
|
|
(as a percentage of total revenues)
|
||||
|
Operating costs and expenses:
|
|
|
|
|
|
|
Research and development
|
25.9
|
%
|
22.0
|
%
|
|
|
Sales and marketing
|
62.3
|
%
|
62.2
|
%
|
|
|
General and administrative
|
12.4
|
%
|
12.4
|
%
|
|
|
Total operating expenses
|
100.6
|
%
|
96.6
|
%
|
|
The increase in research and development expenses was primarily related to an increase of $18.4 million in salaries and benefits and stock based compensation expense resulting from increased headcount as part of our focus on enhancing and developing our existing and new products. The remainder of the increase was attributable to a $4.0 million increase in facilities and allocated overhead costs.
The increase in sales and marketing expenses was primarily related to a $26.1 million increase in salaries and benefits and stock based compensation expense due to increased headcount to expand our sales force and commissions on increased customer orders. The remainder of the increase was attributable to a $5.6 million increase in facilities and allocated overhead costs and a $1.0 million increase in marketing related expenses.
The increase in general and administrative expenses was primarily related to an increase of $5.3 million in salaries and benefits and stock based compensation expense due to increased headcount to support the overall growth of our business and an increase of $1.4 million in professional fees.
Financial Income, Net
|
|
Year Ended
December 31,
|
|
||||||||
|
|
2018
|
2017
|
% Change
|
|||||||
|
|
(in thousands)
|
|
||||||||
|
Financial income, net
|
$
|
970
|
|
$
|
2,362
|
|
(58.9
|
)%
|
||
Financial income, net for the year ended
December 31, 2018
was primarily comprised of interest income partially offset by foreign currency losses compared to financial income, net for the year ended
December 31, 2017
that was primarily comprised of foreign currency gains.
Income Taxes
|
|
Year Ended
December 31,
|
|
||||||||
|
|
2018
|
2017
|
% Change
|
|||||||
|
|
(in thousands)
|
|
||||||||
|
Income taxes
|
$
|
(413
|
)
|
$
|
(2,787
|
)
|
(85.2
|
)%
|
||
41
Income taxes for the years ended
December 31, 2018
and
2017
were comprised primarily of foreign income taxes and state taxes.
Comparison of Years Ended December 31, 2017 and 2016
Revenues
|
|
Year Ended
December 31,
|
|
||||||||
|
|
2017
|
2016
|
% Change
|
|||||||
|
|
(in thousands)
|
|
||||||||
|
Revenues:
|
|
|
|
|
|
|
||||
|
Licenses
|
$
|
120,341
|
|
$
|
93,243
|
|
29.1
|
%
|
||
|
Maintenance and services
|
95,049
|
|
72,620
|
|
30.9
|
%
|
||||
|
Total revenues
|
$
|
215,390
|
|
$
|
165,863
|
|
29.9
|
%
|
||
|
|
Year Ended December 31,
|
||||
|
|
2017
|
2016
|
|||
|
|
(as a percentage of total revenues)
|
||||
|
Revenues:
|
|
|
|
|
|
|
Licenses
|
55.9
|
%
|
56.2
|
%
|
|
|
Maintenance and services
|
44.1
|
%
|
43.8
|
%
|
|
|
Total revenues
|
100.0
|
%
|
100.0
|
%
|
|
Total revenue growth was achieved due to increased demand for our products and services from existing and new customers, mostly in the domestic market, as well as in international markets. The increase in license revenues was driven by sales to existing customers, larger aggregate sales to 961 new customers in 2017 compared to the aggregate sales to 1,024 new customers in 2016 and sales of new products. As of December 31, 2017 and 2016, we had approximately 5,850 and approximately 5,000 customers, respectively. Almost all of our license revenues was attributable to sales of perpetual licenses. The increase in maintenance and services revenues was primarily due to an increase in the sale of maintenance agreements resulting from the growth of our installed customer base. In each of 2017 and 2016, our maintenance renewal rate was over 90%. Of the license and first year maintenance and services revenues recognized in the year ended December 31, 2017, 54% was attributable to revenues from new customers, and 46% was attributable to revenues from existing customers. Of the license and first year maintenance and services revenues recognized in the year ended December 31, 2016, 58% was attributable to revenues from new customers, and 42% was attributable to revenues from existing customers. As of December 31, 2017 and 2016, 69% and 65% of our customers, respectively, had purchased two or more product families. As of December 31, 2017 and 2016, 36% and 29% of our customers, respectively, had purchased three or more product families.
Cost of Revenues and Gross Margin
|
|
Year Ended
December 31,
|
|
||||||||
|
|
2017
|
2016
|
% Change
|
|||||||
|
|
(in thousands)
|
|
|
|||||||
|
Cost of revenues
|
$
|
20,714
|
|
$
|
15,737
|
|
31.6
|
%
|
||
|
|
Year Ended December 31,
|
|||||
|
|
2017
|
2016
|
||||
|
|
(as a percentage of total revenues)
|
|||||
|
Total gross margin
|
90.4
|
%
|
90.5
|
%
|
||
42
The increase in cost of revenues was primarily related to an increase of $3.6 million in salaries and benefits and stock based compensation expense due to increased headcount for support personnel to support our greater revenues and high renewal rate and a $0.9 million increase in facilities and allocated overhead costs.
Operating Costs and Expenses
|
|
Year Ended
December 31,
|
|
||||||||
|
|
2017
|
2016
|
% Change
|
|||||||
|
|
(in thousands)
|
|
||||||||
|
Operating costs and expenses:
|
|
|
|
|
|
|
||||
|
Research and development
|
$
|
47,369
|
|
$
|
36,660
|
|
29.2
|
%
|
||
|
Sales and marketing
|
133,925
|
|
105,639
|
|
26.8
|
%
|
||||
|
General and administrative
|
26,801
|
|
19,822
|
|
35.2
|
%
|
||||
|
Total operating expenses
|
$
|
208,095
|
|
$
|
162,121
|
|
28.4
|
%
|
||
|
|
Year Ended December 31,
|
||||
|
|
2017
|
2016
|
|||
|
|
(as a percentage of total revenues)
|
||||
|
Operating costs and expenses:
|
|
|
|
|
|
|
Research and development
|
22.0
|
%
|
22.1
|
%
|
|
|
Sales and marketing
|
62.2
|
%
|
63.7
|
%
|
|
|
General and administrative
|
12.4
|
%
|
11.9
|
%
|
|
|
Total operating expenses
|
96.6
|
%
|
97.7
|
%
|
|
The increase in research and development expenses was primarily related to an increase of $8.7 million in salaries and stock based compensation expense resulting from increased headcount as part of our focus on enhancing and developing our existing and new products. The remainder of the increase was attributable to a $1.6 million increase in facilities and allocated overhead costs.
The increase in sales and marketing expenses was primarily related to a $23.6 million increase in salaries and benefits and stock based compensation expense due to increased headcount to expand our sales force, and commissions on increased customer orders. The remainder of the increase was attributable to a $3.3 million increase in facilities and allocated overhead costs and a $0.6 million increase in marketing related expenses.
The increase in general and administrative expenses was primarily related to an increase of $5.0 million in salaries and benefits and stock based compensation expense due to increased headcount to support the overall growth of our business and an increase of $1.6 million of other expenses predominately relating to IT.
Financial Income (Expenses), Net
|
|
Year Ended
December 31,
|
|
||||||||
|
|
2017
|
2016
|
% Change
|
|||||||
|
|
(in thousands)
|
|
||||||||
|
Financial income (expenses), net
|
$
|
2,362
|
|
$
|
(885
|
)
|
366.9
|
%
|
||
Financial income (expense), net for the year ended December 31, 2017 was primarily comprised of foreign currency gains compared to foreign currency losses for the year ended December 31, 2016.
Income Taxes
43
|
|
Year Ended
December 31,
|
|
||||||||
|
|
2017
|
2016
|
% Change
|
|||||||
|
|
(in thousands)
|
|
||||||||
|
Income taxes
|
$
|
(2,787
|
)
|
$
|
(1,313
|
)
|
(112.3
|
)%
|
||
Income taxes for the years ended December 31, 2017 and 2016 were comprised primarily of foreign income taxes and state taxes.
Quarterly Results of Operations
The following table sets forth our unaudited quarterly consolidated statement of operations data for each of the eight quarters ended
December 31, 2018
. The data presented below has been prepared on the same basis as the audited consolidated financial statements included elsewhere in this Annual Report and, in the opinion of management, reflects all adjustments, consisting only of normal recurring adjustments, necessary for a fair presentation of this data. This information should be read in conjunction with our consolidated financial statements and related notes included elsewhere in this Annual Report. The results of historical periods are not necessarily indicative of the results of operations for a full year or any future period.
|
|
Three Months Ended
|
||||||||||||||||||||||||||||||
|
|
Dec. 31,
2018
|
Sept. 30,
2018
|
June 30,
2018
|
March 31,
2018
|
Dec. 31,
2017 |
Sept. 30,
2017 |
June 30,
2017 |
March 31,
2017 |
|||||||||||||||||||||||
|
|
(in thousands)
|
||||||||||||||||||||||||||||||
|
Revenues:
|
|
|
|
|
|||||||||||||||||||||||||||
|
Licenses
|
$
|
53,275
|
|
$
|
35,804
|
|
$
|
33,460
|
|
$
|
25,074
|
|
$
|
45,939
|
|
$
|
29,000
|
|
$
|
27,310
|
|
$
|
18,092
|
|
|||||||
|
Maintenance and services
|
34,243
|
|
31,248
|
|
28,730
|
|
28,454
|
|
27,062
|
|
24,365
|
|
22,121
|
|
21,501
|
|
|||||||||||||||
|
Total revenues
|
87,518
|
|
67,052
|
|
62,190
|
|
53,528
|
|
73,001
|
|
53,365
|
|
49,431
|
|
39,593
|
|
|||||||||||||||
|
Cost of revenues (1)
|
7,749
|
|
7,052
|
|
6,440
|
|
6,442
|
|
5,717
|
|
5,423
|
|
4,881
|
|
4,693
|
|
|||||||||||||||
|
Gross profit
|
79,769
|
|
60,000
|
|
55,750
|
|
47,086
|
|
67,284
|
|
47,942
|
|
44,550
|
|
34,900
|
|
|||||||||||||||
|
Operating costs and expenses:
|
|
|
|
|
|
|
|
|
|
|
|
|
|
|
|
|
|||||||||||||||
|
Research and development (1)
|
19,445
|
|
17,267
|
|
17,717
|
|
15,542
|
|
13,559
|
|
11,903
|
|
11,498
|
|
10,409
|
|
|||||||||||||||
|
Sales and marketing (1)
|
46,196
|
|
40,792
|
|
41,349
|
|
39,972
|
|
37,973
|
|
32,458
|
|
32,580
|
|
30,914
|
|
|||||||||||||||
|
General and administrative (1)
|
9,628
|
|
8,774
|
|
7,989
|
|
7,069
|
|
8,005
|
|
6,708
|
|
6,579
|
|
5,509
|
|
|||||||||||||||
|
Total operating expenses
|
75,269
|
|
66,833
|
|
67,055
|
|
62,583
|
|
59,537
|
|
51,069
|
|
50,657
|
|
46,832
|
|
|||||||||||||||
|
Operating income (loss)
|
4,500
|
|
(6,833
|
)
|
(11,305
|
)
|
(15,497
|
)
|
7,747
|
|
(3,127
|
)
|
(6,107
|
)
|
(11,932
|
)
|
|||||||||||||||
|
Financial income (expenses), net
|
704
|
|
99
|
|
(811
|
)
|
978
|
|
321
|
|
622
|
|
950
|
|
469
|
|
|||||||||||||||
|
Income (loss) before income taxes
|
5,204
|
|
(6,734
|
)
|
(12,116
|
)
|
(14,519
|
)
|
8,068
|
|
(2,505
|
)
|
(5,157
|
)
|
(11,463
|
)
|
|||||||||||||||
|
Benefit (provision) for income taxes
|
1,264
|
|
(583
|
)
|
(567
|
)
|
(527
|
)
|
(1,248
|
)
|
(759
|
)
|
(580
|
)
|
(200
|
)
|
|||||||||||||||
|
Net income (loss)
|
$
|
6,468
|
|
$
|
(7,317
|
)
|
$
|
(12,683
|
)
|
$
|
(15,046
|
)
|
$
|
6,820
|
|
$
|
(3,264
|
)
|
$
|
(5,737
|
)
|
$
|
(11,663
|
)
|
|||||||
44
|
|
Three Months Ended
|
||||||||||||||||||||||
|
|
Dec. 31,
2018 |
Sept. 30,
2018 |
June 30,
2018 |
March 31,
2018 |
Dec. 31,
2017 |
Sept. 30,
2017 |
June 30,
2017 |
March 31,
2017 |
|||||||||||||||
|
|
(as a percentage of total revenues)
|
||||||||||||||||||||||
|
Revenues:
|
|||||||||||||||||||||||
|
Licenses
|
60.9
|
%
|
53.4
|
%
|
53.8
|
%
|
46.8
|
%
|
62.9
|
%
|
54.3
|
%
|
55.2
|
%
|
45.7
|
%
|
|||||||
|
Maintenance and services
|
39.1
|
|
46.6
|
|
46.2
|
|
53.2
|
|
37.1
|
|
45.7
|
|
44.8
|
|
54.3
|
|
|||||||
|
Total revenues
|
100.0
|
|
100.0
|
|
100.0
|
|
100.0
|
|
100.0
|
|
100.0
|
|
100.0
|
|
100.0
|
|
|||||||
|
Cost of revenues
|
8.9
|
|
10.5
|
|
10.4
|
|
12.0
|
|
7.8
|
|
10.2
|
|
9.9
|
|
11.9
|
|
|||||||
|
Gross profit
|
91.1
|
|
89.5
|
|
89.6
|
|
88.0
|
|
92.2
|
|
89.8
|
|
90.1
|
|
88.1
|
|
|||||||
|
Operating costs and expenses:
|
|
|
|
|
|
|
|
|
|
|
|
|
|
|
|
|
|||||||
|
Research and development
|
22.2
|
|
25.8
|
|
28.5
|
|
29.1
|
|
18.6
|
|
22.3
|
|
23.3
|
|
26.3
|
|
|||||||
|
Sales and marketing
|
52.8
|
|
60.8
|
|
66.5
|
|
74.7
|
|
52.0
|
|
60.8
|
|
65.9
|
|
78.0
|
|
|||||||
|
General and administrative
|
11.0
|
|
13.1
|
|
12.8
|
|
13.2
|
|
11.0
|
|
12.6
|
|
13.3
|
|
13.9
|
|
|||||||
|
Total operating expenses
|
86.0
|
|
99.7
|
|
107.8
|
|
117.0
|
|
81.6
|
|
95.7
|
|
102.5
|
|
118.2
|
|
|||||||
|
Operating income (loss)
|
5.1
|
|
(10.2
|
)
|
(18.2
|
)
|
(29.0
|
)
|
10.6
|
|
(5.9
|
)
|
(12.4
|
)
|
(30.1
|
)
|
|||||||
|
Financial income (expenses), net
|
0.8
|
|
0.2
|
|
(1.3
|
)
|
1.9
|
|
0.5
|
|
1.2
|
|
2.0
|
|
1.1
|
|
|||||||
|
Income (loss) before income taxes
|
5.9
|
|
(10.0
|
)
|
(19.5
|
)
|
(27.1
|
)
|
11.1
|
|
(4.7
|
)
|
(10.4
|
)
|
(29.0
|
)
|
|||||||
|
Benefit (provision) for income taxes
|
1.5
|
|
(0.9
|
)
|
(0.9
|
)
|
(1.0
|
)
|
(1.8
|
)
|
(1.4
|
)
|
(1.2
|
)
|
(0.5
|
)
|
|||||||
|
Net income (loss)
|
7.4
|
%
|
(10.9
|
)%
|
(20.4
|
)%
|
(28.1
|
)%
|
9.3
|
%
|
(6.1
|
)%
|
(11.6
|
)%
|
(29.5
|
)%
|
|||||||
|
(1)
|
Includes non-cash stock-based compensation expense and payroll tax expense related to stock-based compensation as follows:
|
|
|
Three Months Ended
|
||||||||||||||||||||||||||||||
|
|
Dec. 31,
2018 |
Sept. 30,
2018 |
June 30,
2018 |
March 31,
2018 |
Dec. 31,
2017 |
Sept. 30,
2017 |
June 30,
2017 |
March 31,
2017 |
|||||||||||||||||||||||
|
|
(in thousands)
|
||||||||||||||||||||||||||||||
|
Cost of revenues
|
$
|
457
|
|
$
|
470
|
|
$
|
468
|
|
$
|
362
|
|
$
|
295
|
|
$
|
283
|
|
$
|
273
|
|
$
|
227
|
|
|||||||
|
Research and development
|
2,465
|
|
2,097
|
|
2,978
|
|
2,105
|
|
1,404
|
|
1,374
|
|
1,301
|
|
1,130
|
|
|||||||||||||||
|
Sales and marketing
|
5,732
|
|
3,600
|
|
3,648
|
|
3,101
|
|
2,265
|
|
1,856
|
|
2,362
|
|
2,059
|
|
|||||||||||||||
|
General and administrative
|
2,133
|
|
2,232
|
|
1,754
|
|
1,359
|
|
1,426
|
|
1,269
|
|
1,323
|
|
988
|
|
|||||||||||||||
|
Total non-cash stock-based compensation expense related to employees and consultants
|
$
|
10,787
|
|
$
|
8,399
|
|
$
|
8,848
|
|
$
|
6,927
|
|
$
|
5,390
|
|
$
|
4,782
|
|
$
|
5,259
|
|
$
|
4,404
|
|
|||||||
|
|
Three Months Ended
|
||||||||||||||||||||||||||||||
|
|
Dec. 31,
2018 |
Sept. 30,
2018 |
June 30,
2018 |
March 31,
2018 |
Dec. 31,
2017 |
Sept. 30,
2017 |
June 30,
2017 |
March 31,
2017 |
|||||||||||||||||||||||
|
|
(in thousands)
|
||||||||||||||||||||||||||||||
|
Cost of revenues
|
$
|
7
|
|
$
|
11
|
|
$
|
78
|
|
$
|
267
|
|
$
|
21
|
|
$
|
25
|
|
$
|
12
|
|
$
|
33
|
|
|||||||
|
Research and development
|
17
|
|
16
|
|
111
|
|
36
|
|
12
|
|
27
|
|
13
|
|
15
|
|
|||||||||||||||
|
Sales and marketing
|
214
|
|
394
|
|
1,057
|
|
1,470
|
|
243
|
|
213
|
|
166
|
|
319
|
|
|||||||||||||||
|
General and administrative
|
6
|
|
9
|
|
187
|
|
95
|
|
8
|
|
8
|
|
8
|
|
35
|
|
|||||||||||||||
|
Total payroll tax expense related to stock-based compensation
|
$
|
244
|
|
$
|
430
|
|
$
|
1,433
|
|
$
|
1,868
|
|
$
|
284
|
|
$
|
273
|
|
$
|
199
|
|
$
|
402
|
|
|||||||
Seasonality and Quarterly Trends
Our quarterly results reflect seasonality in the sale of our products and services. Historically, we have experienced a pattern of increased license sales in the fourth quarter. This trend makes it difficult to achieve sequential revenue growth in the
45
first quarter of the following year. Because of customer budget and purchasing trends, demand for our products and services is typically slowest in the first quarter resulting in a decrease in quarterly revenues from the fourth quarter to the first quarter of the subsequent fiscal year. We expect these seasonal patterns to continue in the future. Our gross margins and operating loss have been affected by these historical trends because the majority of our expenses are relatively fixed quarter over quarter. The timing of revenues in relation to our expenses, much of which does not vary directly with revenues, has an impact on the cost of revenues, research and development expenses, sales and marketing expenses and general and administrative expenses as a percentage of revenues in each calendar quarter during the year. The majority of our expenses is personnel-related costs, which consists of salaries (including payroll tax expense related to stock-based compensation), employee benefits (including commissions and bonuses) and stock-based compensation. As a result, we have not experienced significant seasonal fluctuations in the timing of expenses from period to period. Although these seasonal factors are common in the technology industry, historical patterns should not be considered a reliable indicator of our future sales activity or performance.
Our revenues increased in each quarter as compared with the same quarter in the prior year due to an increase in sales of our licenses to new customers as well as incremental sales to existing customers and due to increases in our maintenance and services revenues primarily resulting from increases in our installed base of customers.
Cost of revenues has increased in each quarter as compared with the same quarter in the prior year primarily due to the increased cost of providing maintenance and services to our expanding customer base.
Total operating costs and expenses increased in each quarter as compared with the same quarter in the prior year, primarily due to the addition of personnel in connection with the expansion of our business. Furthermore, our commission expense has historically been the greatest towards the end of the year due to increased commissions earned on customer orders entered at year end.
Liquidity and Capital Resources
The following table shows our cash flows from operating activities, investing activities and financing activities for the stated periods:
|
|
Year Ended December 31,
|
||||||||||
|
|
2018
|
2017
|
2016
|
||||||||
|
|
(in thousands)
|
||||||||||
|
Net cash provided by operating activities
|
$
|
23,545
|
|
$
|
16,351
|
|
$
|
7,347
|
|
||
|
Net cash used in investing activities
|
(40,188
|
)
|
(20,001
|
)
|
(12,324
|
)
|
|||||
|
Net cash provided by financing activities
|
8,114
|
|
12,083
|
|
4,072
|
|
|||||
|
Increase (decrease) in cash, cash equivalents and restricted cash
|
$
|
(8,529
|
)
|
$
|
8,433
|
|
$
|
(905
|
)
|
||
On
December 31, 2018
, our cash and cash equivalents, marketable securities and short-term deposits of $158.9 million were held for working capital purposes and were invested primarily in short-term deposits. We intend to increase our investment in capital expenditures in 2019 to support the growth in our business and operations mainly with leasehold improvements in our North Carolina and Israel offices. We believe that our existing cash and cash equivalents, marketable securities, short-term deposits and cash flow from operations will be sufficient to fund our operations and capital expenditures for at least the next 12 months. Our future capital requirements will depend on many factors, including our rate of revenue growth, the expansion of our sales and marketing activities, the timing and extent of spending to support product development efforts and expansion into new geographic locations, the timing of introductions of new software products and enhancements to existing software products, the continuing market acceptance of our software offerings and our use of cash to pay for acquisitions, if any.
Operating Activities
Net cash provided by operating activities is driven by sales of our products less costs and expenses, primarily payroll and related expenses, and adjusted for certain non-cash items, mainly depreciation and stock-based compensation, and changes in operating assets and liabilities. Changes in operating assets and liabilities are driven mainly by collection of accounts receivable from the sales of our software products and deferred revenues which represents unearned amounts billed to our channel partners, related to these sales.
46
For 2018, cash inflows from our operating activities were $23.5 million, compared to cash inflows of $16.4 million for the prior year. Our $28.6 million net loss, including non-cash charges of $52.3 million, was driven primarily by increased headcount of our sales force and research and development personnel. Net loss was further offset by changes in our working capital, including a $14.1 million increase in deferred revenues, a $9.9 million increase in accrued expenses and other short term liabilities and a $2.0 million increase in accounts payable due to timing of payments. This was partially offset by a $17.2 million increase in prepaid expenses and other current assets (including deferred commissions), an increase of $7.6 million in accounts receivable and a decrease of $1.0 million in other long term liabilities. This increase in working capital was impacted by the increased sales for the year ended December 31, 2018 and consistent with the seasonal pattern discussed above. Our days’ sales outstanding (“DSO”) for the three months and year ended December 31, 2018 was 74 and 66 days, respectively.
For 2017, cash inflows from our operating activities were $16.4 million, compared to cash inflows of $7.3 million for the prior year. Our $13.8 million net loss, including non-cash charges of $35.7 million, was driven primarily by increased headcount of our sales force and research and development personnel. Net loss was further offset by changes in our working capital, including an $20.9 million increase in deferred revenues and a $14.5 million increase in accrued expenses and other short term liabilities which were partially offset by a $21.7 million increase in accounts receivable. This increase in working capital was impacted by the increased sales for the year ended December 31, 2017 and consistent with the seasonal pattern discussed above. Other changes in our working capital included an increase of $18.1 million in prepaid expenses and other current assets (including deferred commissions), a decrease of $0.7 million in accounts payable due to timing of payments and a decrease of $0.4 million in other long term liabilities. Our DSO for the three months and year ended December 31, 2017 was 77 and 72 days, respectively.
For 2016, cash inflows from our operating activities were $7.3 million, compared to cash outflows of $2.7 million for the prior year. Our $14.2 million net loss, including non-cash charges of $24.6 million, was driven primarily by increased headcount of our sales force and research and development personnel. Net loss was further offset by changes in our working capital, including a $11.9 million increase in deferred revenues and a $5.3 million increase in accrued expenses and other short term liabilities which were partially offset by a decrease of $12.8 million in prepaid expenses and other current assets (including deferred commissions) and a $6.4 million increase in accounts receivable. This increase in working capital was impacted by the increased sales for the year ended December 31, 2016 and consistent with the seasonal pattern discussed above. Other changes in our working capital included a decrease of $1.3 million in accounts payable due to timing of payments. Our DSO for the three months and year ended December 31, 2016 was 76 and 74 days, respectively.
Investing Activities
Our investing activities consist primarily of capital expenditures to purchase property and equipment, leasehold improvements, sales and purchases of short-term deposits and changes in our restricted cash. In the future, we expect to continue to incur capital expenditures to support our expanding operations.
During 2018, net cash used in investing activities of $40.2 million was attributable to an increase of $30.3 million in short-term deposits and capital expenditures of $9.6 million to support our growth during the period including hardware, software, office equipment and leasehold improvements.
During 2017, net cash used in investing activities of $20.0 million was attributable to an increase of $14.4 million in short-term deposits and capital expenditures of $5.3 million to support our growth during the period including hardware, software, office equipment and leasehold improvements.
During 2016, net cash used in investing activities of $12.3 million was attributable to an increase of $8.4 million in short-term deposits and capital expenditures of $3.8 million to support our growth during the period including hardware, software, office equipment and leasehold improvements.
Financing Activities
In 2018, 2017 and 2016, net cash provided by financing activities of $8.1 million, $12.1 million and $4.1 million, respectively, was attributable to net proceeds from employee stock plans.
Promissory Note
On March 31, 2014, we entered into a promissory note and related security documents with Bank Leumi USA, which we have extended a number of times. We may borrow up to $7.0 million against certain of our accounts receivable outstanding amount, based on several conditions, at an annual interest rate of the Wall Street Journal Prime Rate plus 0.05%, provided that
47
the annual interest rate applicable to advances will not be lower than 4.10%. As of
December 31, 2018
, that rate amounted to 5.55%. This promissory note enables us, among other things, to engage in foreign currency hedging transactions with Bank Leumi USA to manage our exposure to foreign currency risk without restricted cash requirements. We may borrow under the promissory note until November 15, 2020 at which time the principal sum of each such loan, together with accrued and unpaid interest payable, will become due and payable. As of
December 31, 2018
, we had no balance outstanding under the promissory note. As part of the transaction, we granted the lender a security interest in our personal property, excluding intellectual property and other intangible assets. The promissory note also contains customary events of default.
Contractual Payment Obligations
Our principal commitments primarily consist of obligations under leases for office space and motor vehicles. Aggregate minimum rental commitments under non-cancelable leases as of
December 31, 2018
for the upcoming years were as follows:
|
|
Payments Due by Period
|
||||||||||||||||||||||||||
|
|
2019
|
2020
|
2021
|
2022
|
2023
|
Thereafter
|
Total
|
||||||||||||||||||||
|
|
|
|
|
|
(in thousands)
|
|
|||||||||||||||||||||
|
Operating lease obligations
|
$
|
7,174
|
|
$
|
9,086
|
|
$
|
8,865
|
|
$
|
8,876
|
|
$
|
8,690
|
|
$
|
37,507
|
|
$
|
80,198
|
|
||||||
We have obligations related to unrecognized tax benefit liabilities totaling $1.4 million and others related to severance pay, which have been excluded from the table above as we do not believe it is practicable to make reliable estimates of the periods in which payments for these obligations will be made.
Off-Balance Sheet Arrangements
As of
December 31, 2018
, we did not have any off-balance sheet arrangements.
Critical Accounting Policies and Estimates
We prepare our consolidated financial statements in accordance with generally accepted accounting principles in the United States. The preparation of consolidated financial statements also requires us to make estimates and assumptions that affect the reported amounts of assets, liabilities, revenues, costs and expenses and related disclosures. We base our estimates on historical experience and on various other assumptions that we believe to be reasonable under the circumstances. Actual results could differ significantly from the estimates made by our management. To the extent that there are differences between our estimates and actual results, our future financial statement presentation, financial condition, results of operations and cash flows will be affected. We believe that the accounting policies discussed below are critical to understanding our historical and future performance, as these policies relate to the more significant areas involving management’s judgments and estimates. Critical accounting policies and estimates are those that we consider the most important to the portrayal of our financial condition and results of operations because they require our most difficult, subjective or complex judgments, often as a result of the need to make estimates about the effect of the matters that are inherently uncertain.
Revenue Recognition:
We generate revenues in the form of software license fees and related maintenance and services fees. License fees include perpetual license fees and subscription license fees which provide customers with the same functionality and differ in the duration over which the customer benefits from the software. Maintenance and services primarily consist of fees for maintenance services (including support and unspecified upgrades and enhancements when and if they are available) and to a lesser extent professional services. These services focus on both operationalizing the software and training our customers to fully leverage the use of our products although customers can benefit from the software without our assistance. We sell our products worldwide directly to a network of distributors and VARs, and payment is typically due within 30 to 60 calendar days of the invoice date.
We recognize revenues in accordance with ASC No. 606, “Revenue from Contracts with Customers”. As such, we identify a contract with a customer, identify the performance obligations in the contract, determine the transaction price, allocate the transaction price to each performance obligation in the contract and recognize revenues when (or as) we satisfy a performance obligation.
48
Software license revenues are recognized at the point of time when the software license has been delivered and the benefit of the asset has transferred.
We recognize revenues from maintenance ratably over the term of the underlying maintenance contract term. The term of the maintenance contract is usually one year. Renewals of maintenance contracts create new performance obligations that are satisfied over the term with the revenues recognized ratably over the period.
Revenues from professional services consists mostly of time and material services. The performance obligations are satisfied, and revenues are recognized, when the services are provided or once the service term has expired.
We enter into contracts that can include combinations of products and services, which are generally capable of being distinct and accounted for as separate performance obligations. The license is distinct upon delivery as the customer can derive the economic benefit of the software without any professional services, updates or technical support. We allocate the transaction price to each performance obligation based on our relative standalone selling price out of the total consideration of the contract. For maintenance, we determine the standalone selling prices based on the price at which we separately sell a renewal contract. For professional services, we determine the standalone selling prices based on the price at which we separately sell those services. For software licenses, we use the residual approach to determine the standalone selling prices due to the lack of history of selling software license on a standalone basis.
Trade and other receivables are primarily comprised of trade receivables that are recorded at the invoice amount, net of an allowance for doubtful accounts.
Deferred revenues represent mostly unrecognized fees billed or collected for maintenance and professional services. Deferred revenues are recognized as (or when) we perform under the contract. The amount of revenues recognized in the period that was included in the opening deferred revenues balance was $73.2 million for the year ended December 31, 2018.
We do not grant a right of return to our customers, except for one of our resellers. During the years ended
December 31, 2018
,
2017
and
2016
, there were
no
returns from this reseller.
For information regarding disaggregated revenues, please refer to Note 11 to our consolidated financial statements.
Contract Costs:
We pay sales commissions to sales and marketing and certain management personnel based on their attainment of certain predetermined sales goals. Sales commissions earned by our employees are considered incremental and recoverable costs of obtaining a contract with a customer. Sales commissions paid for initial contracts, which are not commensurate with sales commissions paid for renewal contracts, are capitalized and amortized over an expected period of benefit. Based on our technology, customer contracts and other factors, we have determined the expected period of benefit to be approximately four years. Sales commissions for renewal contracts are capitalized and then amortized on a straight line basis over the related contractual renewal period. Amortization expenses related to these costs are mostly included in sales and marketing expenses in the accompanying consolidated statements of operations.
Accounting for Stock-Based Compensation:
We account for stock-based compensation in accordance with ASC No. 718, “Compensation-Stock Compensation.” ASC No. 718 requires companies to estimate the fair value of equity-based payment awards on the date of grant using an Option-Pricing Model (“OPM”). The value of the portion of the award that is ultimately expected to vest is recognized as an expense over the requisite service periods in our consolidated statements of operations.
We recognize compensation expenses for the value of our equity awards granted based on the straight-line method over the requisite service period of each of the awards. Upon adoption of ASU 2016-09, we elected to change our accounting policy to account for forfeitures as they occur.
We applied ASC 718 and ASC 505-50, “Equity-Based Payments to Non-Employees” with respect to options issued to non-employee consultants. Accordingly, we use option valuation models to measure the fair value of the options at the measurement date as defined in ASC 505-50.
49
We selected the Black-Scholes-Merton option pricing model as the most appropriate fair value method for our stock options awards, whereas the fair value of restricted stock units is based on the market value of the underlying shares at the date of grant.
Recently Adopted Accounting Pronouncements
In May 2014, the FASB issued ASU No. 2014-09, “Revenue from Contracts with Customers”, an updated standard on revenue recognition and issued subsequent amendments to the initial guidance in March 2016, April 2016, May 2016 and December 2016 within ASU 2016-08, 2016-10, 2016-12 and 2016-20, respectively. The new standards provide enhancements to the quality and consistency of how revenue is reported while also improving comparability in the financial statements of companies reporting using IFRS and US GAAP. The core principle of the new standard is for companies to recognize revenue to depict the transfer of goods or services to customers in amounts that reflect the consideration (that is, payment) to which the company expects to be entitled in exchange for those goods or services. The new standard results in enhanced disclosures about revenue, provides guidance for transactions that were not previously addressed comprehensively (for example, service revenue and contract modifications) and improves guidance for multiple-element arrangements. ASU 2014-09 was initially scheduled to be effective for annual and interim reporting periods beginning after December 15, 2016 and may be adopted either on a full retrospective or modified retrospective approach. However, on July 9, 2015, the FASB approved a one year deferral of the effective date of ASU 2014-09. The revised effective date is for annual reporting periods beginning after December 15, 2017 and interim periods thereafter, with an early adoption permitted as of the original effective date. We adopted this standard effective January 1, 2018 using the full retrospective method which requires each prior reporting period presented to be recast in future issuances of our financial statements. In preparation for adoption of the standard, we implemented internal controls and key system functionality to enable the preparation of financial information and have reached conclusions on key accounting assessments related to the standard, including our assessment of the impact.
The most significant impact of the new standard relates to the way we account for subscription agreements and commission expense. Specifically, under the new revenue standard, we recognize subscription license revenues upfront and the associated maintenance revenues over the contract period. Subscription arrangements include maintenance as part of the subscription service and are not priced or reported separately. We have also considered the impact of the guidance in ASC 340-40, “Other Assets and Deferred Costs” under the new standard. Under ASC 340-40, we are required to capitalize and amortize certain incremental costs of obtaining a contract such as the maintenance portion of sales commissions over the life of the maintenance period.
Adoption of the standard resulted in a reduction of revenues of $2.0 million for the year ended December 31, 2017 and recognition of additional revenues of $1.4 million for the year ended December 31, 2016, primarily due to the net change in subscription license revenue recognition. In addition, as of December 31, 2017, adoption of the standard resulted in an increase in deferred commission of $13.5 million, a decrease in short-term deferred revenues of $0.4 million, a decrease in long-term deferred revenues of $0.4 million and an increase of $1.2 million in deferred tax liabilities. This is the result of the capitalization of sales commission costs and the upfront recognition of license revenues from subscription licenses. The cumulative impact to our accumulated deficit as of January 1, 2016 is a reduction of $9.7 million.
Adoption of the standard related to revenue recognition had no impact to cash from or used in operating, financing or investing activities on our consolidated statements of cash flows.
Select recast financial statement information, which reflects the preliminary effect of the adoption of this standard, is set forth below.
50
|
|
Year ended
December 31, 2017 |
||||||||||
|
|
As Reported
|
Adjustments
|
Recast for Adoption
of ASC 606 |
||||||||
|
Revenues:
|
|||||||||||
|
License revenues
|
$
|
123,610
|
|
$
|
(3,269
|
)
|
$
|
120,341
|
|
||
|
Maintenance and service revenues
|
93,754
|
|
1,295
|
|
95,049
|
|
|||||
|
Total revenues
|
217,364
|
|
(1,974
|
)
|
215,390
|
|
|||||
|
Cost of revenues
|
20,873
|
|
(159
|
)
|
20,714
|
|
|||||
|
Gross profit
|
196,491
|
|
(1,815
|
)
|
194,676
|
|
|||||
|
Operating costs and expenses:
|
|||||||||||
|
Research and development
|
47,369
|
|
—
|
|
47,369
|
|
|||||
|
Sales and marketing
|
135,896
|
|
(1,971
|
)
|
133,925
|
|
|||||
|
General and administrative
|
26,823
|
|
(22
|
)
|
26,801
|
|
|||||
|
Total operating expenses
|
210,088
|
|
(1,993
|
)
|
208,095
|
|
|||||
|
Operating loss
|
(13,597
|
)
|
178
|
|
(13,419
|
)
|
|||||
|
Financial income, net
|
2,362
|
|
—
|
|
2,362
|
|
|||||
|
Loss before income taxes
|
(11,235
|
)
|
178
|
|
(11,057
|
)
|
|||||
|
Income taxes
|
(2,459
|
)
|
(328
|
)
|
(2,787
|
)
|
|||||
|
Net loss
|
$
|
(13,694
|
)
|
$
|
(150
|
)
|
$
|
(13,844
|
)
|
||
|
|
Year ended
December 31, 2016 |
||||||||||
|
|
As Reported
|
Adjustments
|
Recast for Adoption
of ASC 606 |
||||||||
|
Revenues:
|
|||||||||||
|
License revenues
|
$
|
92,873
|
|
$
|
370
|
|
$
|
93,243
|
|
||
|
Maintenance and service revenues
|
71,583
|
|
1,037
|
|
72,620
|
|
|||||
|
Total revenues
|
164,456
|
|
1,407
|
|
165,863
|
|
|||||
|
Cost of revenues
|
15,843
|
|
(106
|
)
|
15,737
|
|
|||||
|
Gross profit
|
148,613
|
|
1,513
|
|
150,126
|
|
|||||
|
Operating costs and expenses:
|
|||||||||||
|
Research and development
|
36,660
|
|
—
|
|
36,660
|
|
|||||
|
Sales and marketing
|
107,825
|
|
(2,186
|
)
|
105,639
|
|
|||||
|
General and administrative
|
19,822
|
|
—
|
|
19,822
|
|
|||||
|
Total operating expenses
|
164,307
|
|
(2,186
|
)
|
162,121
|
|
|||||
|
Operating loss
|
(15,694
|
)
|
3,699
|
|
(11,995
|
)
|
|||||
|
Financial expenses, net
|
(885
|
)
|
—
|
|
(885
|
)
|
|||||
|
Loss before income taxes
|
(16,579
|
)
|
3,699
|
|
(12,880
|
)
|
|||||
|
Income taxes
|
(1,131
|
)
|
(182
|
)
|
(1,313
|
)
|
|||||
|
Net loss
|
$
|
(17,710
|
)
|
$
|
3,517
|
|
$
|
(14,193
|
)
|
||
51
|
|
December 31, 2017
Balance Sheet Data |
||||||||||
|
|
As Reported
|
Adjustments
|
As Adjusted
|
||||||||
|
Assets
|
|
|
|
|
|
|
|||||
|
Current assets:
|
|
|
|
|
|
|
|||||
|
Prepaid expenses and other current assets
|
$
|
7,130
|
|
$
|
7,216
|
|
$
|
14,346
|
|
||
|
Long-term assets:
|
|||||||||||
|
Other assets
|
$
|
973
|
|
$
|
6,270
|
|
$
|
7,243
|
|
||
|
Liabilities and stockholders’ equity
|
|||||||||||
|
Current liabilities:
|
|||||||||||
|
Deferred revenues
|
$
|
73,891
|
|
$
|
(398
|
)
|
$
|
73,493
|
|
||
|
Long-term liabilities:
|
|||||||||||
|
Deferred revenues
|
$
|
7,034
|
|
$
|
(426
|
)
|
$
|
6,608
|
|
||
|
Other liabilities
|
$
|
6,561
|
|
$
|
1,246
|
|
$
|
7,807
|
|
||
|
Stockholders’ equity:
|
|||||||||||
|
Accumulated deficit
|
$
|
(122,454
|
)
|
$
|
13,064
|
|
$
|
(109,390
|
)
|
||
|
|
Statement of Cash Flows
Year Ended December 31, 2017 |
||||||||||
|
|
As Reported
|
Adjustments
|
As Adjusted
|
||||||||
|
Cash flows from operating activities
|
|
|
|
|
|
|
|||||
|
Net loss
|
$
|
(13,694
|
)
|
$
|
(150
|
)
|
$
|
(13,844
|
)
|
||
|
Amortization of deferred commissions
|
$
|
—
|
|
$
|
12,591
|
|
$
|
12,591
|
|
||
|
Deferred commissions
|
$
|
—
|
|
$
|
(14,742
|
)
|
$
|
(14,742
|
)
|
||
|
Deferred revenues
|
$
|
18,885
|
|
$
|
1,975
|
|
$
|
20,860
|
|
||
|
Other long term liabilities
|
$
|
(731
|
)
|
$
|
326
|
|
$
|
(405
|
)
|
||
|
Net cash provided by operating activities
|
$
|
16,351
|
|
$
|
—
|
|
$
|
16,351
|
|
||
|
|
Statement of Cash Flows
Year Ended December 31, 2016 |
||||||||||
|
|
As Reported
|
Adjustments
|
As Adjusted
|
||||||||
|
Cash flows from operating activities
|
|
|
|
|
|
|
|||||
|
Net loss
|
$
|
(17,710
|
)
|
$
|
3,517
|
|
$
|
(14,193
|
)
|
||
|
Amortization of deferred commissions
|
$
|
—
|
|
$
|
9,525
|
|
$
|
9,525
|
|
||
|
Deferred commissions
|
$
|
—
|
|
$
|
(11,817
|
)
|
$
|
(11,817
|
)
|
||
|
Deferred revenues
|
$
|
13,269
|
|
$
|
(1,409
|
)
|
$
|
11,860
|
|
||
|
Other long term liabilities
|
$
|
147
|
|
$
|
184
|
|
$
|
331
|
|
||
|
Net cash provided by operating activities
|
$
|
7,347
|
|
$
|
—
|
|
$
|
7,347
|
|
||
In November 2016, the FASB issued ASU 2016-18, “Statement of Cash Flows (Topic 230): Restricted Cash”, which requires companies to include amounts generally described as restricted cash and restricted cash equivalents in cash and cash equivalents when reconciling beginning-of-period and end-of-period total amounts shown on the statement of cash flows. This ASU is effective for annual and interim periods beginning after December 15, 2017. We adopted this standard effective December 31, 2017 using the retrospective transition method, as required by the new standard. The adoption of this standard had an immaterial impact on our consolidated statements of cash flows.
52
The following table provides a reconciliation of cash and cash equivalents, and long term restricted cash reported within the consolidated balance sheets that sum to the total of such amounts in the consolidated statements of cash flows:
|
|
December 31, 2018
|
December 31, 2017
|
December 31, 2016
|
||||||||
|
Cash and cash equivalents
|
$
|
48,707
|
|
$
|
56,689
|
|
$
|
48,315
|
|
||
|
Long term restricted cash included in other assets
|
—
|
|
547
|
|
488
|
|
|||||
|
Cash, cash equivalents and long term restricted cash shown in the consolidated statement of cash flows
|
$
|
48,707
|
|
$
|
57,236
|
|
$
|
48,803
|
|
||
Under U.S. GAAP, we are permitted to make an accounting policy election to either treat taxes due on future inclusions in U.S. taxable income related to GILTI as a component of current income tax expense when incurred or to factor such amounts into our measurement of our deferred tax expense. We have made an accounting policy election to treat GILTI as a component of current income tax expense.
Recently Issued Accounting Pronouncements Not Yet Adopted
In January 2016, the FASB issued ASU 2016-13, “Financial Instruments – Credit Losses on Financial Instruments”, which requires that expected credit losses relating to financial assets measured on an amortized cost basis and available for sale debt securities be recorded through an allowance for credit losses. ASU 2016-13 limits the amount of credit losses to be recognized for available for sale debt securities to the amount by which carrying value exceeds fair value and also requires the reversal of previously recognized credit losses if fair value increases. The new standard will be effective for interim and annual periods beginning after January 1, 2020, and early adoption is permitted. We are currently evaluating whether to early adopt this standard and the potential effect on our consolidated financial statements.
In February 2016, the FASB issued ASU 2016-02, “Leases”, on the recognition, measurement, presentation and disclosure of leases for both parties to a contract (i.e., lessees and lessors). The new standard requires lessees to apply a dual approach, classifying leases as either finance or operating leases based on the principle of whether or not the lease is effectively a financed purchase by the lessee. This classification will determine whether lease expense is recognized based on an effective interest method or on a straight line basis over the term of the lease, respectively. A lessee is also required to record a right-of-use asset ("ROU") and a lease liability for all leases with a term of greater than 12 months regardless of their classification. Leases with a term of 12 months or less will be accounted for in a manner similar to the accounting under existing guidance for operating leases today. The new standard requires lessors to account for leases using an approach that is substantially equivalent to existing guidance for sales-type leases, direct financing leases and operating leases. ASC 842 supersedes the previous leases standard, ASC 840, "Leases". The guidance is effective for the interim and annual periods beginning on or after December 15, 2018, and we have adopted the standard on January 1, 2019. A modified retrospective transition approach is required, applying the new standard to all leases existing at the date of initial application. The standard provides a number of optional practical expedients in transition. We are electing the ‘package of practical expedients’, which permits us not to reassess under the new standard our prior conclusions about lease identification, lease classification and initial direct costs. To adopt this new standard, we have implemented changes to our existing systems and processes in conjunction with a review of existing vendor agreements. We expect adoption of the standard to have a material impact on our consolidated balance sheets which will result in the recognition of ROU assets and lease liabilities of approximately $60 million to $70 million at January 1, 2019. The most significant impact from recognition of ROU assets and lease liabilities relates to our office space. However, we do not anticipate that the adoption of this standard will have a material impact on the operating expenses in our consolidated statements of operations since the expense recognition under this new standard will be similar to current practice. Our financial income (expenses), net will be impacted by the revaluation of the lease liabilities in non-USD denominated currencies.
In June 2018, the FASB issued ASU No. 2018-07, “Compensation - Stock Compensation (Topic 718): Improvements to Nonemployee Share-Based Payment Accounting.” These amendments expand the scope of Topic 718, Compensation - Stock Compensation (which currently only includes share-based payments to employees) to include share-based payments issued to nonemployees for goods or services. Consequently, the accounting for share-based payments to nonemployees and employees will be substantially aligned. This ASU supersedes Subtopic 505-50, Equity - Equity-Based Payments to Non-Employees. The guidance is effective for the interim and annual periods beginning after December 15, 2018. We expect to adopt this standard effective January 1, 2019 and do not expect it to have a material effect on our consolidated financial statements.
|
Item 7A.
|
Quantitative and Qualitative Disclosures About Market Risk
|
53
Market risk represents the risk of loss that may impact our financial position due to adverse changes in financial market prices and rates. Our market risk exposure is primarily a result of fluctuations in foreign currency exchange rates. We do not hold financial instruments for trading purposes.
Market Risk
We are exposed to certain financial risks, including fluctuations in foreign currency exchange rates and interest rates. We manage our exposure to these market risks through internally established policies and procedures. Our policies do not allow speculation in derivative instruments for profit or execution of derivative instrument contracts for which there are no underlying exposures. We do not use financial instruments for trading purposes, and we are not a party to any leveraged derivatives. We monitor our underlying market risk exposures on an ongoing basis and, where appropriate, may use hedging strategies to mitigate these risks.
Foreign Currency Exchange Risk
Approximately 30% of our revenues for the years ended
December 31, 2018
and
2017
were earned in non-U.S. dollar denominated currencies, mainly in the Euro and Pound Sterling. Our expenses are generally denominated in the currencies in which our operations are located, primarily the U.S. dollar and NIS, and to a lesser extent the Euro, Pound Sterling and Canadian dollar. Our NIS-denominated expenses consist primarily of personnel and overhead costs from our operations in Israel. Our consolidated results of operations and cash flow are, therefore, subject to fluctuations due to changes in foreign currency exchange rates and may be adversely affected in the future due to changes in foreign exchange rates. The effect of a hypothetical 10% change in foreign currency exchange rates applicable to our business would not have a material impact on our historical consolidated financial statements.
For purposes of our consolidated financial statements, local currency assets and liabilities are translated at the rate of exchange to the U.S. dollar on the balance sheet date and local currency revenues and expenses are translated at the exchange rate at the date of the transaction or the average exchange rate dollar during the reporting period to the United States.
To date, we have used derivative financial instruments, specifically foreign currency forward contracts, to manage exposure to foreign currency risks, by hedging a portion of our forecasted expenses denominated in NIS expected to occur within 12 months. The effect of exchange rate changes on foreign currency forward contracts is expected to offset the effect of exchange rate changes on the underlying hedged item. We also enter into forward contracts to hedge a portion of our monetary items in the balance sheet, such as trade receivables and payables, denominated in Pound Sterling and Euro for short term periods to protect the fair value of the monetary assets from foreign exchange rate fluctuations. The effect of exchange rate changes on foreign currency forward contracts is expected to offset the effect of exchange rate changes which impacts financial income (expenses), net. We do not use derivative financial instruments for speculative or trading purposes.
Interest Rate Risk
We had cash and cash equivalents, marketable securities and short-term deposits of $158.9 million as of
December 31, 2018
. We hold our cash and cash equivalents, marketable securities and short-term deposits for working capital purposes. Our cash and cash equivalents are held in cash deposits and money market funds. Due to the short-term nature of these instruments, we believe that we do not have any material exposure to changes in the fair value of our investment portfolio as a result of changes in interest rates. Declines in interest rates, however, would reduce our future interest income.
As of
December 31, 2018
, we had no outstanding obligations under our promissory note. To the extent we enter into other long-term debt arrangements in the future, we would be subject to fluctuations in interest rates which could have a material impact on our future financial condition and results of operation.
Inflation
We do not believe that inflation had a material effect on our business, financial condition or results of operations in the last three fiscal years. If our costs were to become subject to significant inflationary pressures, we may not be able to fully offset such higher costs through price increases. Our inability or failure to do so could harm our business, financial condition and results of operations.
54
|
Item 8.
|
Financial Statements and Supplementary Data
|
INDEX TO CONSOLIDATED FINANCIAL STATEMENTS
|
|
|
|
|
Page
|
55
|
|
Kost Forer Gabbay & Kasierer
144 Menachem Begin Road, Building A
Tel-Aviv 6492102, Israel
|
Tel: +972-3-6232525
Fax: +972-3-5622555
ey.com
|
REPORT OF INDEPENDENT REGISTERED PUBLIC ACCOUNTING FIRM
To the Stockholders and the Board of Directors of
VARONIS SYSTEMS, INC.
Opinion on the Financial Statements
We have audited the accompanying consolidated balance sheets of Varonis Systems, Inc. (the "Company") as of December 31, 2018 and 2017 and the related consolidated statements of operations, statements of comprehensive loss, changes in stockholders’ equity and cash flows for each of the three years in the period ended December 31, 2018 and the related notes (collectively referred to as the “consolidated financial statements”). In our opinion, the consolidated financial statements present fairly, in all material respects, the financial position of the Company at December 31, 2018 and 2017 and the results of its operations and its cash flows for each of the three years in the period ended December 31, 2018, in conformity with U.S. generally accepted accounting principles.
We also have audited, in accordance with the standards of the Public Company Accounting Oversight Board (United States) (PCAOB), the Company's internal control over financial reporting as of December 31, 2018, based on criteria established in Internal Control-Integrated Framework issued by the Committee of Sponsoring Organizations of the Treadway Commission (2013 framework) and our report dated February 12, 2019 expressed an unqualified opinion thereon.
Basis for Opinion
These financial statements are the responsibility of the Company's management. Our responsibility is to express an opinion on the Company’s financial statements based on our audits. We are a public accounting firm registered with the PCAOB and are required to be independent with respect to the Company in accordance with the U.S. federal securities laws and the applicable rules and regulations of the Securities and Exchange Commission and the PCAOB.
We conducted our audits in accordance with the standards of the PCAOB. Those standards require that we plan and perform the audit to obtain reasonable assurance about whether the financial statements are free of material misstatement, whether due to error or fraud. Our audits included performing procedures to assess the risks of material misstatement of the financial statements, whether due to error or fraud, and performing procedures that respond to those risks. Such procedures included examining, on a test basis, evidence regarding the amounts and disclosures in the financial statements. Our audits also included evaluating the accounting principles used and significant estimates made by management, as well as evaluating the overall presentation of the financial statements. We believe that our audits provide a reasonable basis for our opinion.
/s/ KOST FORER GABBAY & KASIERER
A Member of Ernst & Young Global
We have served as the Company’s auditor since 2007.
Tel-Aviv, Israel
February 12, 2019
56
|
|
Kost Forer Gabbay & Kasierer
144 Menachem Begin Road, Building A
Tel-Aviv 6492102, Israel
|
Tel: +972-3-6232525
Fax: +972-3-5622555
ey.com
|
REPORT OF INDEPENDENT REGISTERED PUBLIC ACCOUNTING FIRM
To the Stockholders and the Board of Directors of
VARONIS SYSTEMS, INC.
Opinion on Internal Control over Financial Reporting
We have audited Varonis Systems, Inc. (the “Company”) internal control over financial reporting as of December 31, 2018, based on criteria established in Internal Control - Integrated Framework issued by the Committee of Sponsoring Organizations of the Treadway Commission (2013 framework) (the "COSO Criteria"). In our opinion, the Company maintained, in all material respects, effective internal control over financial reporting as of December 31, 2018, based on the COSO Criteria.
We also have audited, in accordance with the standards of the Public Company Accounting Oversight Board (United States) (PCAOB), the consolidated balance sheets of the Company as of December 31, 2018 and 2017 and the related consolidated statements of operations, statements of comprehensive loss, changes in stockholders’ equity and cash flows for each of the three years in the period ended December 31, 2018 and the related notes of the Company, and our report dated February 12, 2019 expressed an unqualified opinion thereon.
Basis for Opinion
The Company’s management is responsible for maintaining effective internal control over financial reporting and for its assessment of the effectiveness of internal control over financial reporting included in the accompanying Management's Annual Report on Internal Control over Financial Reporting. Our responsibility is to express an opinion on the Company’s internal control over financial reporting based on our audit. We are a public accounting firm registered with the PCAOB and are required to be independent with respect to the Company in accordance with the U.S. federal securities laws and the applicable rules and regulations of the Securities and Exchange Commission and the PCAOB.
We conducted our audit in accordance with the standards of the PCAOB. Those standards require that we plan and perform the audit to obtain reasonable assurance about whether effective internal control over financial reporting was maintained in all material respects.
Our audit included obtaining an understanding of internal control over financial reporting, assessing the risk that a material weakness exists, testing and evaluating the design and operating effectiveness of internal control based on the assessed risk, and performing such other procedures as we considered necessary in the circumstances. We believe that our audit provides a reasonable basis for our opinion.
Definition and Limitations of Internal Control Over Financial Reporting
A company’s internal control over financial reporting is a process designed to provide reasonable assurance regarding the reliability of financial reporting and the preparation of financial statements for external purposes in accordance with generally accepted accounting principles. A company’s internal control over financial reporting includes those policies and procedures that (1) pertain to the maintenance of records that, in reasonable detail, accurately and fairly reflect the transactions and dispositions of the assets of the company; (2) provide reasonable assurance that transactions are recorded as necessary to permit preparation of financial statements in accordance with generally accepted accounting principles, and that receipts and expenditures of the company are being made only in accordance with authorizations of management and directors of the company; and (3) provide reasonable assurance regarding prevention or timely detection of unauthorized acquisition, use, or disposition of the company’s assets that could have a material effect on the financial statements.
57
|
Kost Forer Gabbay & Kasierer
144 Menachem Begin Road, Building A
Tel-Aviv 6492102, Israel
|
Tel: +972-3-6232525
Fax: +972-3-5622555
ey.com
|
|
Because of its inherent limitations, internal control over financial reporting may not prevent or detect misstatements. Also, projections of any evaluation of effectiveness to future periods are subject to the risk that controls may become inadequate because of changes in conditions, or that the degree of compliance with the policies or procedures may deteriorate.
/s/ KOST FORER GABBAY & KASIERER
A Member of Ernst & Young Global
Tel-Aviv, Israel
February 12, 2019
58
VARONIS SYSTEMS, INC. AND SUBSIDIARIES
CONSOLIDATED BALANCE SHEETS
(in thousands)
|
|
December 31,
|
||||||
|
|
2018
|
2017
|
|||||
|
(as adjusted, see Note 2)
|
|||||||
|
Assets
|
|
|
|
|
|||
|
Current assets:
|
|
|
|
|
|||
|
Cash and cash equivalents
|
$
|
48,707
|
|
$
|
56,689
|
|
|
|
Marketable securities
|
39,770
|
|
39,731
|
|
|||
|
Short-term deposits
|
70,438
|
|
40,137
|
|
|||
|
Trade receivables (net of allowance for doubtful accounts of $483 and $433 at December 31, 2018 and December 31, 2017, respectively)
|
83,223
|
|
75,596
|
|
|||
|
Prepaid expenses and other current assets
|
16,952
|
|
14,346
|
|
|||
|
Total current assets
|
259,090
|
|
226,499
|
|
|||
|
Long-term assets:
|
|
|
|
|
|||
|
Other assets
|
8,565
|
|
7,243
|
|
|||
|
Property and equipment, net
|
17,323
|
|
11,896
|
|
|||
|
Total long-term assets
|
25,888
|
|
19,139
|
|
|||
|
Total assets
|
$
|
284,978
|
|
$
|
245,638
|
|
|
The accompanying notes are an integral part of these consolidated financial statements.
59
VARONIS SYSTEMS, INC. AND SUBSIDIARIES
CONSOLIDATED BALANCE SHEETS
(in thousands, except share data)
|
|
December 31,
|
||||||
|
|
2018
|
2017
|
|||||
|
(as adjusted, see Note 2)
|
|||||||
|
Liabilities and stockholders’ equity
|
|
|
|
|
|||
|
Current liabilities:
|
|
|
|
|
|||
|
Trade payables
|
$
|
2,620
|
|
$
|
635
|
|
|
|
Accrued expenses and other short term liabilities
|
55,991
|
|
42,453
|
|
|||
|
Deferred revenues
|
87,729
|
|
73,493
|
|
|||
|
Total current liabilities
|
146,340
|
|
116,581
|
|
|||
|
Long-term liabilities:
|
|
|
|
|
|||
|
Deferred revenues
|
6,487
|
|
6,608
|
|
|||
|
Other liabilities
|
6,781
|
|
7,807
|
|
|||
|
Total long-term liabilities
|
13,268
|
|
14,415
|
|
|||
|
Stockholders’ equity:
|
|
|
|
|
|||
|
Share capital
|
|
|
|
|
|||
|
Common stock of $0.001 par value - Authorized: 200,000,000 shares at December 31, 2018 and 2017; Issued and outstanding: 29,576,880 shares at December 31, 2018 and 28,146,162 shares at December 31, 2017
|
30
|
|
28
|
|
|||
|
Accumulated other comprehensive income (loss)
|
(3,633
|
)
|
136
|
|
|||
|
Additional paid-in capital
|
266,941
|
|
223,868
|
|
|||
|
Accumulated deficit
|
(137,968
|
)
|
(109,390
|
)
|
|||
|
Total stockholders’ equity
|
125,370
|
|
114,642
|
|
|||
|
Total liabilities and stockholders’ equity
|
$
|
284,978
|
|
$
|
245,638
|
|
|
The accompanying notes are an integral part of these consolidated financial statements.
60
VARONIS SYSTEMS, INC. AND SUBSIDIARIES
CONSOLIDATED STATEMENTS OF OPERATIONS
(in thousands, except share and per share data)
|
Year ended
|
|||||||||||
|
|
December 31,
|
||||||||||
|
|
2018
|
2017
|
2016
|
||||||||
|
(as adjusted, see Note 2)
|
(as adjusted, see Note 2)
|
||||||||||
|
Revenues:
|
|
|
|
|
|
|
|||||
|
Licenses
|
$
|
147,613
|
|
$
|
120,341
|
|
$
|
93,243
|
|
||
|
Maintenance and services
|
122,675
|
|
95,049
|
|
72,620
|
|
|||||
|
Total revenues
|
270,288
|
|
215,390
|
|
165,863
|
|
|||||
|
Cost of revenues
|
27,683
|
|
20,714
|
|
15,737
|
|
|||||
|
Gross profit
|
242,605
|
|
194,676
|
|
150,126
|
|
|||||
|
Operating costs and expenses:
|
|
|
|
|
|
|
|||||
|
Research and development
|
69,971
|
|
47,369
|
|
36,660
|
|
|||||
|
Sales and marketing
|
168,309
|
|
133,925
|
|
105,639
|
|
|||||
|
General and administrative
|
33,460
|
|
26,801
|
|
19,822
|
|
|||||
|
Total operating expenses
|
271,740
|
|
208,095
|
|
162,121
|
|
|||||
|
Operating loss
|
(29,135
|
)
|
(13,419
|
)
|
(11,995
|
)
|
|||||
|
Financial income (expenses), net
|
970
|
|
2,362
|
|
(885
|
)
|
|||||
|
Loss before income taxes
|
(28,165
|
)
|
(11,057
|
)
|
(12,880
|
)
|
|||||
|
Income taxes
|
(413
|
)
|
(2,787
|
)
|
(1,313
|
)
|
|||||
|
Net loss
|
$
|
(28,578
|
)
|
$
|
(13,844
|
)
|
$
|
(14,193
|
)
|
||
|
Net loss per share of common stock, basic and diluted
|
$
|
(0.98
|
)
|
$
|
(0.50
|
)
|
$
|
(0.54
|
)
|
||
|
Weighted average number of shares used in computing net loss per share of common stock, basic and diluted
|
29,020,645
|
|
27,467,440
|
|
26,406,312
|
|
|||||
The accompanying notes are an integral part of these consolidated financial statements.
61
VARONIS SYSTEMS, INC. AND SUBSIDIARIES
CONSOLIDATED STATEMENTS OF COMPREHENSIVE LOSS
(in thousands)
|
Year ended
|
|||||||||||
|
|
2018
|
2017
|
2016
|
||||||||
|
(as adjusted, see Note 2)
|
(as adjusted, see Note 2)
|
||||||||||
|
Net loss
|
$
|
(28,578
|
)
|
$
|
(13,844
|
)
|
$
|
(14,193
|
)
|
||
|
Other comprehensive income (loss):
|
|||||||||||
|
Unrealized income (loss) on marketable securities, net of tax
|
48
|
|
(27
|
)
|
—
|
|
|||||
|
Gains on marketable securities reclassified into earnings, net of tax
|
(27
|
)
|
—
|
|
—
|
|
|||||
|
21
|
|
(27
|
)
|
—
|
|
||||||
|
Unrealized income (loss) on derivative instruments, net of tax
|
(7,531
|
)
|
3,291
|
|
184
|
|
|||||
|
Losses (gains) on derivative instruments reclassified into earnings, net of tax
|
3,741
|
|
(2,649
|
)
|
(332
|
)
|
|||||
|
(3,790
|
)
|
642
|
|
(148
|
)
|
||||||
|
Total other comprehensive income (loss)
|
(3,769
|
)
|
615
|
|
(148
|
)
|
|||||
|
Comprehensive loss
|
$
|
(32,347
|
)
|
$
|
(13,229
|
)
|
$
|
(14,341
|
)
|
||
The accompanying notes are an integral part of these consolidated financial statements.
62
VARONIS SYSTEMS, INC. AND SUBSIDIARIES
CONSOLIDATED STATEMENTS OF CHANGES IN STOCKHOLDERS’ EQUITY
(in thousands, except share data)
|
|
Common stock
|
Additional
paid-in capital
|
Accumulated
other
comprehensive loss
|
Accumulated deficit
|
Total
stockholders’ equity
|
|||||||||||||||||
|
|
Number
|
Amount
|
||||||||||||||||||||
|
Balance as of January 1, 2016
|
26,069,154
|
|
26
|
|
172,326
|
|
(331
|
)
|
(88,434
|
)
|
83,587
|
|
||||||||||
|
Effect of adoption of ASU 2014-09
|
—
|
|
—
|
|
—
|
|
—
|
|
9,697
|
|
9,697
|
|
||||||||||
|
Stock-based compensation expense
|
—
|
|
—
|
|
12,938
|
|
—
|
|
—
|
|
12,938
|
|
||||||||||
|
Common stock issued under employee stock plans, net
|
752,608
|
|
1
|
|
4,071
|
|
—
|
|
—
|
|
4,072
|
|
||||||||||
|
Unrealized loss on derivative instruments
|
—
|
|
—
|
|
—
|
|
(148
|
)
|
—
|
|
(148
|
)
|
||||||||||
|
Net loss
|
—
|
|
—
|
|
—
|
|
—
|
|
(14,193
|
)
|
(14,193
|
)
|
||||||||||
|
Balance as of December 31, 2016
|
26,821,762
|
|
27
|
|
189,335
|
|
(479
|
)
|
(92,930
|
)
|
95,953
|
|
||||||||||
|
Effect of adoption of ASU 2016-09
|
—
|
|
—
|
|
2,616
|
|
—
|
|
(2,616
|
)
|
—
|
|
||||||||||
|
Stock-based compensation expense
|
—
|
|
—
|
|
19,835
|
|
—
|
|
—
|
|
19,835
|
|
||||||||||
|
Common stock issued under employee stock plans, net
|
1,324,400
|
|
1
|
|
12,082
|
|
—
|
|
—
|
|
12,083
|
|
||||||||||
|
Unrealized gain on derivative instruments
|
—
|
|
—
|
|
—
|
|
642
|
|
—
|
|
642
|
|
||||||||||
|
Unrealized gains and losses on available for sale securities
|
—
|
|
—
|
|
—
|
|
(27
|
)
|
—
|
|
(27
|
)
|
||||||||||
|
Net loss
|
—
|
|
—
|
|
—
|
|
—
|
|
(13,844
|
)
|
(13,844
|
)
|
||||||||||
|
Balance as of December 31, 2017
|
28,146,162
|
|
$
|
28
|
|
$
|
223,868
|
|
$
|
136
|
|
$
|
(109,390
|
)
|
$
|
114,642
|
|
|||||
|
Stock-based compensation expense
|
—
|
|
—
|
|
34,961
|
|
—
|
|
—
|
|
34,961
|
|
||||||||||
|
Common stock issued under employee stock plans, net
|
1,430,718
|
|
2
|
|
8,112
|
|
—
|
|
—
|
|
8,114
|
|
||||||||||
|
Unrealized loss on derivative instruments
|
—
|
|
—
|
|
—
|
|
(3,790
|
)
|
—
|
|
(3,790
|
)
|
||||||||||
|
Unrealized gains and losses on available for sale securities
|
—
|
|
—
|
|
—
|
|
21
|
|
—
|
|
21
|
|
||||||||||
|
Net loss
|
—
|
|
—
|
|
—
|
|
—
|
|
(28,578
|
)
|
(28,578
|
)
|
||||||||||
|
Balance as of December 31, 2018
|
29,576,880
|
|
$
|
30
|
|
$
|
266,941
|
|
$
|
(3,633
|
)
|
$
|
(137,968
|
)
|
$
|
125,370
|
|
|||||
___________________
The accompanying notes are an integral part of these consolidated financial statements.
63
VARONIS SYSTEMS, INC. AND SUBSIDIARIES
CONSOLIDATED STATEMENTS OF CASH FLOWS
(in thousands)
|
Year ended
|
|||||||||||
|
|
December 31,
|
||||||||||
|
|
2018
|
2017
|
2016
|
||||||||
|
(as adjusted, see Note 2)
|
(as adjusted, see Note 2)
|
||||||||||
|
Cash flows from operating activities:
|
|||||||||||
|
Net loss
|
$
|
(28,578
|
)
|
$
|
(13,844
|
)
|
$
|
(14,193
|
)
|
||
|
Adjustments to reconcile net loss to net cash provided by operating activities:
|
|||||||||||
|
Depreciation
|
4,156
|
|
3,328
|
|
2,180
|
|
|||||
|
Stock-based compensation
|
34,961
|
|
19,835
|
|
12,938
|
|
|||||
|
Amortization of deferred commissions
|
13,185
|
|
12,591
|
|
9,525
|
|
|||||
|
Capital gain from disposal of fixed assets
|
(27
|
)
|
(20
|
)
|
(2
|
)
|
|||||
|
Changes in assets and liabilities:
|
|||||||||||
|
Trade receivables
|
(7,627
|
)
|
(21,735
|
)
|
(6,425
|
)
|
|||||
|
Prepaid expenses and other current assets
|
(1,932
|
)
|
(3,317
|
)
|
(1,028
|
)
|
|||||
|
Deferred commissions
|
(15,308
|
)
|
(14,742
|
)
|
(11,817
|
)
|
|||||
|
Other long term assets
|
(270
|
)
|
—
|
|
—
|
|
|||||
|
Trade payables
|
1,985
|
|
(653
|
)
|
(1,324
|
)
|
|||||
|
Accrued expenses and other short term liabilities
|
9,910
|
|
14,453
|
|
5,302
|
|
|||||
|
Deferred revenues
|
14,115
|
|
20,860
|
|
11,860
|
|
|||||
|
Other long term liabilities
|
(1,025
|
)
|
(405
|
)
|
331
|
|
|||||
|
Net cash provided by operating activities
|
23,545
|
|
16,351
|
|
7,347
|
|
|||||
|
Cash flows from investing activities:
|
|||||||||||
|
Decrease (increase) in short-term deposits
|
(30,280
|
)
|
25,329
|
|
(8,390
|
)
|
|||||
|
Increase in marketable securities
|
(39
|
)
|
(39,731
|
)
|
—
|
|
|||||
|
Increase in long-term deposits
|
(313
|
)
|
(305
|
)
|
(111
|
)
|
|||||
|
Proceeds from sale of property and equipment
|
27
|
|
20
|
|
2
|
|
|||||
|
Purchase of property and equipment
|
(9,583
|
)
|
(5,314
|
)
|
(3,825
|
)
|
|||||
|
Net cash used in investing activities
|
(40,188
|
)
|
(20,001
|
)
|
(12,324
|
)
|
|||||
|
Cash flows from financing activities:
|
|||||||||||
|
Proceeds from employee stock plans, net
|
8,114
|
|
12,083
|
|
4,072
|
|
|||||
|
Net cash provided by financing activities
|
8,114
|
|
12,083
|
|
4,072
|
|
|||||
|
Increase (decrease) in cash, cash equivalents and restricted cash
|
(8,529
|
)
|
8,433
|
|
(905
|
)
|
|||||
|
Cash, cash equivalents and restricted cash at beginning of period
|
57,236
|
|
48,803
|
|
49,708
|
|
|||||
|
Cash, cash equivalents and restricted cash at end of period
|
$
|
48,707
|
|
$
|
57,236
|
|
$
|
48,803
|
|
||
|
Supplemental disclosure of cash flow information:
|
|||||||||||
|
Cash paid for income taxes
|
$
|
710
|
|
$
|
469
|
|
$
|
246
|
|
||
The accompanying notes are an integral part of these consolidated financial statements.
64
VARONIS SYSTEMS, INC. AND SUBSIDIARIES
NOTES TO CONSOLIDATED FINANCIAL STATEMENTS
(in thousands, except share and per share data)
NOTE 1:- GENERAL
Varonis Systems, Inc. (“VSI” and together with its subsidiaries, collectively, the “Company”) was incorporated under the laws of the State of Delaware on November 3, 2004 and commenced operations on
January 1, 2005
.
VSI has
nine
wholly-owned subsidiaries: Varonis Systems Ltd. (“VSL”) incorporated under the laws of Israel on
November 24, 2004
; Varonis (UK) Limited (“VSUK”) incorporated under the laws of England on March 14, 2007; Varonis Systems (Deutschland) GmbH (“VSG”) incorporated under the laws of Germany on July 6, 2011; Varonis France SAS (“VSF”) incorporated under the laws of France on February 22, 2012; Varonis Systems Corp. (“VSC”) incorporated under the laws of British Columbia, Canada on February 19, 2013; Varonis Systems (Ireland) Limited (“VIRE”) incorporated under the laws of Ireland on November 11, 2016; and Varonis Systems (Australia) Pty Ltd (“VAUS”) incorporated under the laws of Victoria, Australia on February 28, 2017; Varonis Systems (Netherlands) B.V. ("VNL") incorporated under the laws of the Netherlands on March 13, 2018; and Varonis U.S. Public Sector LLC ("VPS") incorporated under the laws of the State of Delaware on May 14, 2018.
The Company’s software products and services allow enterprises to manage, analyze and secure enterprise data. Varonis focuses on protecting enterprise data: sensitive files and emails; confidential customer, patient and employee data; financial records; strategic and product plans; and other intellectual property. Through its products DatAdvantage (including the Automation Engine), DatAlert (including Varonis Edge), DataPrivilege, Data Classification Engine (including GDPR Patterns and Data Classification Labels), Data Transport Engine and DatAnswers, the software platform allows enterprises to protect sensitive data from insider threats and cyberattacks, and realize the value of their enterprise data in ways that are not resource-intensive and easy to implement.
VSI and VPS market and sell products and services mainly in the United States. VSUK, VSG, VSF, VSC, VIRE, VAUS and VNL resell the Company’s products and services mainly in the UK, Germany, France, Canada, Ireland, Australia and the Netherlands and Belgium, respectively. The Company primarily sells its products and services to a global network of distributors and Value Added Resellers (VARs), which sell the products to end user customers.
NOTE 2:- SIGNIFICANT ACCOUNTING POLICIES
The consolidated financial statements are prepared according to United States generally accepted accounting principles (“U.S. GAAP”), applied on a consistent basis, as follows:
|
a.
|
Use of Estimates:
|
The preparation of the consolidated financial statements in conformity with U.S. generally accepted accounting principles requires management to make estimates, judgments and assumptions. The Company’s management believes that the estimates, judgments and assumptions used are reasonable based upon information available at the time they are made. These estimates, judgments and assumptions can affect the reported amounts of assets and liabilities and disclosure of contingent assets and liabilities at the dates of the financial statements, and the reported amounts of revenues and expenses during the reporting period. Actual results could differ from those estimates. On an ongoing basis, the Company’s management evaluates estimates, including those related to accounts receivable and sales allowances, fair values of stock-based awards, deferred taxes and income tax uncertainties, and contingent liabilities. Such estimates are based on historical experience and on various other assumptions that are believed to be reasonable, the results of which form the basis for making judgments about the carrying values of assets and liabilities.
|
b.
|
Financial Statements in U.S. Dollars:
|
Most of the revenues and costs of VSI are denominated in United States dollars (“dollars”). Some of the subsidiaries’ revenues and costs are primarily incurred in Euros, the Pound Sterling, Canadian dollars, Australian dollars and NIS; however, the Company’s management believes that the dollar is the primary currency of the economic environment in which VSI and each of its subsidiaries operate. Thus, the dollar is the Company’s functional and reporting currency.
65
Accordingly, transactions denominated in currencies other than the functional currency are re-measured to the functional currency in accordance with ASC No. 830, “Foreign Currency Matters” at the exchange rate at the date of the transaction or the average exchange rate in the quarter. At the end of each reporting period, financial assets and liabilities are re-measured to the functional currency using exchange rates in effect at the balance sheet date. Non-financial assets and liabilities are re-measured at historical exchange rates. Gains and losses related to re-measurement are recorded as financial income (expense) in the consolidated statements of operations as appropriate.
|
c.
|
Principles of Consolidation:
|
The consolidated financial statements include the accounts of VSI and its wholly-owned subsidiaries, VSL, VSUK, VSG, VSF, VSC, VIRE, VAUS, VNL and VPS. All intercompany transactions and balances have been eliminated upon consolidation.
|
d.
|
Cash, Cash Equivalents, Marketable Securities and Short-Term Deposits:
|
The Company accounts for investments in marketable securities in accordance with ASC No. 320, “Investments—Debt and Equity Securities”. The Company considers all highly liquid investments with a maturity of three months or less when purchased to be cash equivalents. Cash and cash equivalents consist of cash on hand, highly liquid investments in money market funds and various deposit accounts.
The Company considers all high quality investments purchased with original maturities at the date of purchase greater than three months to be short-term deposits. Investments are available to be used for current operations and are, therefore, classified as current assets even though maturities may extend beyond one year. Cash equivalents, marketable securities and short-term deposits are classified as available for sale and are, therefore, recorded at fair value on the consolidated balance sheet, with any unrealized gains and losses reported in accumulated other comprehensive income (loss), which is reflected as a separate component of stockholders’ equity in the Company’s consolidated balance sheets, until realized. The Company uses the specific identification method to compute gains and losses on the investments. The amortized cost of securities is adjusted for amortization of premiums and accretion of discounts to maturity. Such amortization and accretion is included as a component of financial income, net in the consolidated statement of operations. Cash, cash equivalents, marketable securities and short-term deposits consist of the following (in thousands):
|
|
As of December 31, 2018
|
||||||||||||||
|
|
Amortized
Cost
|
Gross
Unrealized
Gains
|
Gross
Unrealized
Loss
|
Fair
Value
|
|||||||||||
|
Cash and cash equivalents
|
|
|
|
|
|
|
|
|
|||||||
|
Money market funds
|
$
|
2,594
|
|
$
|
—
|
|
$
|
—
|
|
$
|
2,594
|
|
|||
|
Total
|
$
|
2,594
|
|
$
|
—
|
|
$
|
—
|
|
$
|
2,594
|
|
|||
|
Marketable securities
|
|
|
|
|
|
|
|
|
|||||||
|
US Treasury securities
|
$
|
39,776
|
|
*)
|
|
$
|
(6
|
)
|
$
|
39,770
|
|
||||
|
Total
|
$
|
39,776
|
|
*)
|
|
$
|
(6
|
)
|
$
|
39,770
|
|
||||
|
Short-term deposits
|
|||||||||||||||
|
Term bank deposits
|
$
|
70,438
|
|
$
|
—
|
|
$
|
—
|
|
$
|
70,438
|
|
|||
|
Total
|
$
|
70,438
|
|
$
|
—
|
|
$
|
—
|
|
$
|
70,438
|
|
|||
*) Represents an amount lower than $1.
66
|
|
As of December 31, 2017
|
||||||||||||||
|
|
Amortized
Cost
|
Gross
Unrealized
Gains
|
Gross
Unrealized
Loss
|
Fair
Value
|
|||||||||||
|
Cash and cash equivalents
|
|
|
|
|
|
|
|
|
|||||||
|
Money market funds
|
$
|
6,870
|
|
$
|
—
|
|
$
|
—
|
|
$
|
6,870
|
|
|||
|
Total
|
$
|
6,870
|
|
$
|
—
|
|
$
|
—
|
|
$
|
6,870
|
|
|||
|
Marketable securities
|
|
|
|
|
|
|
|
|
|||||||
|
US Treasury securities
|
$
|
39,758
|
|
*)
|
|
$
|
(27
|
)
|
$
|
39,731
|
|
||||
|
Total
|
$
|
39,758
|
|
*)
|
|
$
|
(27
|
)
|
$
|
39,731
|
|
||||
|
Short-term deposits
|
|||||||||||||||
|
Term bank deposits
|
$
|
40,137
|
|
$
|
—
|
|
$
|
—
|
|
$
|
40,137
|
|
|||
|
Total
|
$
|
40,137
|
|
$
|
—
|
|
$
|
—
|
|
$
|
40,137
|
|
|||
*) Represents an amount lower than $1.
All the US Treasury securities in short-term deposits have a stated effective maturity of less than 12 months as of
December 31, 2018
and
2017
.
The gross unrealized loss related to these short-term deposits was due primarily to changes in interest rates. The Company reviews its short-term deposits on a regular basis to evaluate whether or not any security has experienced an other than temporary decline in fair value. The Company considers factors such as length of time and extent to which the market value has been less than the cost, the financial condition and near-term prospects of the issuer and its intent to sell, or whether it is more likely than not the Company will be required to sell the investment before recovery of the investment’s amortized cost basis. If the Company believes that an other than temporary decline exists in one of these securities, the Company writes down these investments to fair value. For debt securities, the portion of the write-down related to credit loss would be recorded to other income (expense), net in the Company’s consolidated statements of operations. Any portion not related to credit loss would be recorded to accumulated other comprehensive income (loss), which is reflected as a separate component of stockholders’ equity in the Company’s condensed consolidated balance sheets. During the year ended
December 31, 2018
and 2017, the Company did not consider any of its investments to be other-than-temporarily impaired.
A short-term bank deposit is a deposit with a maturity of more than three months but less than one year. Deposits in U.S. dollars bore interest at rates ranging from
1.30%
-
2.77%
and
0.60%
-
1.35%
, per annum, as of
December 31, 2018
and
2017
, respectively. There were no deposits in NIS as of
December 31, 2018
, and, as of
December 31, 2017
, the Company's deposits in NIS bore interest at a rate of
0.03%
per annum. Short-term deposits are presented at cost which approximates market value due to their short maturities.
|
e.
|
Restricted Cash:
|
Restricted cash is primarily invested in certificates of deposit and is used mostly as security for the Company’s lease commitments.
The Company had
no
short-term restricted cash as of
December 31, 2018
and
2017
. The Company had
no
long-term restricted cash as of
December 31, 2018
and
$547
in long-term restricted cash as of
December 31, 2017
.
|
f.
|
Property and Equipment:
|
Property and equipment are stated at cost, net of accumulated depreciation. Depreciation is calculated using the straight-line method over the estimated useful lives of the assets at the following annual rates:
67
|
|
%
|
||||
|
Computer equipment
|
|
33
|
|
||
|
Office furniture and equipment
|
14
|
—
|
15
|
||
|
Leasehold improvements
|
|
Over the shorter of the expected lease
term or estimated useful life |
|
||
|
g.
|
Impairment of Long-Lived Assets:
|
The Company’s long-lived assets are reviewed for impairment in accordance with ASC No. 360 “Property, Plant and Equipment” whenever events or changes in circumstances indicate that the carrying amount of an asset (or asset group) may not be recoverable. Recoverability of assets (or asset group) to be held and used is measured by a comparison of the carrying amount of an asset to the future undiscounted cash flows expected to be generated by the assets. If such assets are considered to be impaired, the impairment to be recognized is measured by the amount by which the carrying amount of the assets exceeds the fair value of the assets. During the years ended
December 31, 2018
,
2017
and
2016
,
no
impairment losses have been recorded.
|
h.
|
Long-Term Lease Deposits:
|
Long-term lease deposits include long-term deposits for offices.
|
i.
|
Revenue Recognition:
|
The Company generates revenues in the form of software license fees and related maintenance and services fees. License fees include perpetual license fees and subscription license fees which provide customers with the same functionality and differ in the duration over which the customer benefits from the software. Maintenance and services primarily consist of fees for maintenance services (including support and unspecified upgrades and enhancements when and if they are available) and to a lesser extent professional services which focus on both operationalizing the software and training the Company’s customers to fully leverage the use of its products although the user can benefit from the software without the Company’s assistance. The Company sells its products worldwide directly to a network of distributors and VARs, and payment is typically due within 30 to 60 calendar days of the invoice date.
The Company recognizes revenues in accordance with ASC No. 606, “Revenue from Contracts with Customers”. As such, the Company identifies a contract with a customer, identifies the performance obligations in the contract, determines the transaction price, allocates the transaction price to each performance obligation in the contract and recognizes revenues when (or as) the Company satisfies a performance obligation.
Software license revenues are recognized at the point of time when the software license has been delivered and the benefit of the asset has transferred.
The Company recognizes revenues from maintenance ratably over the term of the underlying maintenance contract term. The term of the maintenance contract is usually one year. Renewals of maintenance contracts create new performance obligations that are satisfied over the term with the revenues recognized ratably over the period.
Revenues from professional services consist mostly of time and material services. The performance obligations are satisfied, and revenues are recognized, when the services are provided or once the service term has expired.
The Company enters into contracts that can include combinations of products and services, which are generally capable of being distinct and accounted for as separate performance obligations. The license is distinct upon delivery as the customer can derive the economic benefit of the software without any professional services, updates or technical support. The Company allocates the transaction price to each performance obligation based on its relative standalone selling price out of the total consideration of the contract. For maintenance, the Company determines the standalone selling prices based on the price at which the Company separately sells a renewal contract. For professional services, the Company determines the standalone selling prices based on the price at which the Company separately sells those services. For
68
software licenses, the Company uses the residual approach to determine the standalone selling prices due to the lack of history of selling software license on a standalone basis.
Trade and other receivables are primarily comprised of trade receivables that are recorded at the invoice amount, net of an allowance for doubtful accounts.
Deferred revenues represent mostly unrecognized fees billed or collected for maintenance and professional services. Deferred revenues are recognized as (or when) the Company performs under the contract. The amount of revenues recognized in the period that was included in the opening deferred revenues balance was
$73,176
for the year ended December 31, 2018.
The Company does not grant a right of return to its customers, except for one of its resellers. During the years ended
December 31, 2018
,
2017
and
2016
, there were
no
returns from this reseller.
For information regarding disaggregated revenues, please refer to Note 11 below.
|
j.
|
Contract Costs:
|
The Company pays sales commissions to sales and marketing and certain management personnel based on their attainment of certain predetermined sales goals. Sales commissions earned by its employees are considered incremental and recoverable costs of obtaining a contract with a customer. Sales commissions paid for initial contracts, which are not commensurate with sales commissions paid for renewal contracts, are capitalized and amortized over an expected period of benefit. Based on its technology, customer contracts and other factors, the Company has determined the expected period of benefit to be approximately four years. Sales commissions for renewal contracts are capitalized and then amortized on a straight line basis over the related contractual renewal period. Amortization expenses related to these costs are mostly included in sales and marketing expenses in the accompanying consolidated statements of operations.
|
k.
|
Cost of Revenues:
|
Cost of revenues consists of the cost of maintenance and services, resulting from costs associated with support, and professional services.
|
l.
|
Accounting for Stock-Based Compensation:
|
The Company accounts for stock-based compensation in accordance with ASC No. 718, “Compensation-Stock Compensation”. ASC No. 718 requires companies to estimate the fair value of equity-based payment awards on the date of grant using an OPM. The value of the portion of the award that is ultimately expected to vest is recognized as an expense over the requisite service periods in the Company’s consolidated statements of operations.
The Company recognizes compensation expenses for the value of its awards granted based on the straight-line method over the requisite service period of each of the awards.
The Company applies ASC 718 and ASC 505-50, “Equity-Based Payments to Non-Employees” with respect to options issued to non-employee consultants. Accordingly, the Company uses option valuation models to measure the fair value of the options at the measurement date as defined in ASC 505-50.
The Company selected the Black-Scholes-Merton option pricing model as the most appropriate fair value method for its stock options awards, whereas the fair value of restricted stock units is based on the market value of the underlying shares at the date of grant.
The fair value of options granted to employees and non-employee directors is estimated at the date of grant using the following weighted average assumptions:
For the years ended
December 31, 2018
and
2017
, there were
no
stock options granted. For the year ended December 31, 2016, dividend yield was
0%
, expected volatility was
62.1%
, risk-free interest was
1.42%
and expected life was
6.25
.
69
The Company used its historical volatility in accordance with ASC 718. The computation of volatility uses historical volatility derived from the Company’s exchange traded shares. Expected term of options granted is calculated based on the simplified method, in accordance with SAB 110, (i.e., as the average between the vesting period and the contractual term of the options). The risk free interest rate assumption is the implied yield currently available on United States treasury zero-coupon issues with a remaining term equal to the expected life of the Company’s options. The dividend yield assumption is based on the Company’s historical experience and expectation of no future dividend payouts and may be subject to substantial change in the future. The Company has historically not paid cash dividends and has no foreseeable plans to pay cash dividends in the future.
The non-cash compensation expenses related to employees and consultants for the years ended
December 31, 2018
,
2017
and
2016
amounted to
$34,961
,
$19,835
and
$12,938
, respectively.
Effective as of January 1, 2017, the Company adopted Accounting Standards Update 2016-09, “Compensation—Stock Compensation (Topic 718)” (“ASU 2016-09”) on a modified, retrospective basis. ASU 2016-09 permits entities to make an accounting policy election related to how forfeitures will impact the recognition of compensation cost for stock-based compensation: to estimate the total number of awards for which the requisite service period will not be rendered or to account for forfeitures as they occur. Upon adoption of ASU 2016-09, the Company elected to change its accounting policy to account for forfeitures as they occur. The change was applied on a modified, retrospective basis with a cumulative-effect adjustment to retained earnings of
$2,616
(which increased the accumulated deficit) as of January 1, 2017.
ASU 2016-09 also eliminates the requirement that excess tax benefits be realized as a reduction in current taxes payable before the associated tax benefit can be recognized as an increase in paid in capital. Approximately
$7,131
of federal net operating losses and
$718
of state net operating losses, neither of which was included in the deferred tax assets recognized in the statement of financial position as of
December 31, 2017
, have been attributed to tax deduction for stock-based compensation in excess of the related book expense. Under ASU 2016-09, these previously unrecognized deferred tax assets will be recognized on a modified, retrospective basis as of the start of the year in which the ASU 2016-09 is adopted; in this case as of January 1, 2017. The U.S. federal and state net operating losses and credits that were recognized as of January 1, 2017 have been offset by a valuation allowance.
Additionally, ASU 2016-09 addresses the presentation of excess tax benefits and employee taxes paid on the statement of cash flows. The Company is now required to present excess tax benefits as an operating activity on the statement of cash flows rather than as a financing activity. The Company adopted this change prospectively.
|
m.
|
Research and Development Costs:
|
Research and development costs are charged to the statement of operations as incurred. ASC No. 985-20, “Software-Costs of Software to Be Sold, Leased, or Marketed,” requires capitalization of certain software development costs subsequent to the establishment of technological feasibility.
Based on the Company’s product development process, technological feasibility is established upon the completion of a working model. The Company does not incur material costs between the completion of the working model and the point at which the product is ready for general release. Therefore, research and development costs are charged to the statement of operations as incurred.
|
n.
|
Income Taxes:
|
The Company accounts for income taxes in accordance with ASC No. 740, using the liability method whereby deferred tax assets and liability account balances are determined based on the differences between financial reporting and the tax basis for assets and liabilities and are measured using the enacted tax rates and laws that will be in effect when the differences are expected to reverse. The Company provides a valuation allowance, if necessary, to reduce deferred tax assets to the amounts that are more likely-than-not to be realized.
ASC 740 contains a two-step approach to recognizing and measuring a liability for uncertain tax positions. The first step is to evaluate the tax position taken or expected to be taken in a tax return by determining if the weight of available
70
evidence indicates that it is more likely than not that, on an evaluation of the technical merits, the tax position will be sustained on audit, including resolution of any related appeals or litigation processes. The second step is to measure the tax benefit as the largest amount that is more than 50% likely to be realized upon ultimate settlement. The Company accrues interest and penalties related to unrecognized tax provisions in its taxes on income.
|
o.
|
Derivative Instruments:
|
The Company’s primary objective for holding derivative instruments is to reduce its exposure to foreign currency rate changes. The Company reduces its exposure by entering into forward foreign exchange contracts with respect to operating expenses that are forecast to be incurred in currencies other than the U.S. dollar. A majority of the Company’s revenues and operating expenditures are transacted in U.S. dollars. However, certain operating expenditures are incurred in or exposed to other currencies, primarily the NIS.
The Company has established forecasted transaction currency risk management programs to protect against fluctuations in fair value and the volatility of future cash flows caused by changes in exchange rates. The Company’s currency risk management program includes forward foreign exchange contracts designated as cash flow hedges. These forward foreign exchange contracts generally mature within 12 months. The Company does not enter into derivative financial instruments for trading purposes. In addition, the Company enters into forward contracts to hedge a portion of its monetary items in the balance sheet, such as trade receivables and payables, denominated in Pound Sterling and Euro for short term periods (the “Fair Value Hedging Program”). The purpose of the Fair Value Hedging Program is to protect the fair value of the monetary assets from foreign exchange rate fluctuations. Gains and losses from derivatives related to the Fair Value Hedging Program are not designated as hedging instruments.
Derivative instruments measured at fair value and their classification on the consolidated balance sheets are presented in the following table (in thousands):
|
Liabilities as of
|
Assets as of
|
||||||||||||||
|
|
December 31, 2018
|
December 31, 2017
|
|||||||||||||
|
|
Notional
Amount
|
Fair
Value
|
Notional
Amount
|
Fair
Value
|
|||||||||||
|
Foreign Exchange Forward Contract Derivatives in cash flow hedging relationships—included in other current assets and accrued expenses and other short term liabilities
|
$
|
75,153
|
|
$
|
(3,628
|
)
|
$
|
1,746
|
|
$
|
163
|
|
|||
|
Foreign exchange forward contract derivatives for monetary items included in accrued expenses and other short term liabilities
|
$
|
29,162
|
|
$
|
(18
|
)
|
$
|
—
|
|
$
|
—
|
|
|||
For the years ended
December 31, 2018
and
2017
, the consolidated statements of operations reflect a loss of approximately
$3,741
and a gain of
$2,649
, respectively, related to the effective portion of foreign currency forward contracts. Any ineffective portion of the cash flow hedges is recognized in financial income (expenses), net in the consolidated statement of operations.
No
material ineffective hedges were recognized in financial income (expenses), net for the years ended
December 31, 2018
and
2017
.
For the year ended
December 31, 2018
, the consolidated statements of operations reflect a gain of approximately
$98
in financial income (expenses), net, related to the Fair Value Hedging Program. The Company did not enter into any transactions related to the Fair Value Hedging Program for year ended
December 31, 2017
.
|
p.
|
Concentrations of Credit Risks:
|
Financial instruments that potentially subject the Company to concentrations of credit risk consist principally of cash, cash equivalents, marketable securities, short-term deposits and trade receivables.
The Company’s cash, cash equivalents, marketable securities and short-term deposits are invested in major banks mainly in the United States but also in the United Kingdom, France, Germany, Israel, Canada, Ireland, Australia and the Netherlands. Such deposits in the United States may be in excess of insured limits and are not insured in other
71
jurisdictions. The Company maintains cash and cash equivalents with diverse financial institutions and monitors the amount of credit exposure to each financial institution.
The Company’s trade receivables are geographically diversified and derived primarily from sales to a network of distributors and VARs mainly in the United States and Europe. Concentration of credit risk with respect to trade receivables is limited by credit limits, ongoing credit evaluation and account monitoring procedures. The Company performs ongoing credit evaluations of its channel partners and establishes an allowance for doubtful accounts based upon a specific review of all significant outstanding invoices. The Company writes off receivables when they are deemed uncollectible and having exhausted all collection efforts.
|
q.
|
Retirement and Severance Pay:
|
VSI makes available to its employees a retirement plan (the “U.S. Plan”) that qualifies as a deferred salary arrangement under Section 401(k) of the Internal Revenue Code of 1986, as amended (“the Code”). Participants in the U.S. Plan may elect to defer a portion of their pre-tax earnings, up to the Internal Revenue Service annual contribution limit. VSI matches
100%
of each participant’s contributions up to a maximum of
3%
of the participant’s total pay and
50%
of each participant’s contributions on contributions between
3%
and
5%
of the participant’s total pay. Each participant may contribute up to
80%
of total remuneration up to the Internal Revenue Service’s annual contribution limit. Contributions to the U.S. Plan are recorded during the year contributed as an expense in the consolidated statements of income.
Pursuant to Israel’s Severance Pay Law, Israeli employees are entitled to severance pay equal to one month’s salary for each year of employment, or a portion thereof. The employees of the Israeli subsidiary elected to be included under section 14 of the Severance Pay Law, 1963 (“section 14”). According to this section, these employees are entitled only to monthly deposits, at a rate of
8.33%
of their monthly salary, made in their name with insurance companies. Payments in accordance with section 14 release the Company from any future severance payments (under the above Israeli Severance Pay Law) in respect of those employees; therefore, related assets and liabilities are not presented in the balance sheet.
The Company’s liability for severance pay for the employees of its French subsidiary is calculated pursuant to French law, according to which French employees are entitled to an indemnity (a statutory redundancy). The law provides for the payment of severance payment to any employee working for the French subsidiary for at least a year.
VSUK makes available to certain eligible employees a pension plan whereby participants in the plan may elect to defer a portion of their earnings. VSUK matches
100%
of each participant’s contributions up to a maximum of
3%
of the participant’s net pay.
VIRE makes available to its employees a pension plan whereby participants in the plan may elect to defer a portion of their earnings. VIRE matches
100%
of each participant’s contributions up to a maximum of
3%
and
50%
of the participant's contributions on contributions between
3%
and
5%
of the participant’s net pay.
Total expenses related to retirement and severance pay amounted to
$6,765
,
$4,801
and
$3,775
for the years ended
December 31, 2018
,
2017
and
2016
, respectively. The amount of severance payable included in other liabilities as of
December 31, 2018
and
2017
is
$2,391
and
$1,781
, respectively.
|
r.
|
Fair Value of Financial Instruments:
|
Fair value is an exit price, representing the amount that would be received to sell an asset or paid to transfer a liability in an orderly transaction between market participants. As such, fair value is a market-based measurement that should be determined based on assumptions that market participants would use in pricing an asset or a liability.
A three tier fair value hierarchy is established as a basis for considering such assumptions and for inputs used in the valuation methodologies in measuring fair value:
|
•
|
Level 1: Observable inputs that reflect quoted prices (unadjusted) for identical assets or liabilities in active markets.
|
|
•
|
Level 2: Observable inputs that reflect quoted prices for identical assets or liabilities in markets that are not active; quoted prices for similar assets or liabilities in active markets; inputs other than quoted prices that are
|
72
observable for the assets or liabilities; or inputs that are derived principally from or corroborated by observable market data by correlation or other means.
|
•
|
Level 3: Unobservable inputs reflecting our own assumptions incorporated in valuation techniques used to determine fair value. These assumptions are required to be consistent with market participant assumptions that are reasonably available.
|
The fair value hierarchy also requires an entity to maximize the use of observable inputs and minimize the use of unobservable inputs when measuring fair value.
The carrying amounts of cash and cash equivalents, marketable securities, trade receivables, short-term deposits and trade payables approximate their fair value due to the short-term maturity of such instruments.
|
s.
|
Basic and Diluted Net Loss Per Share:
|
Basic net loss per share is computed by dividing the net loss by the weighted-average number of shares of common stock outstanding during the period.
Diluted net loss per share is computed by giving effect to all potential shares of common stock, including stock options, to the extent dilutive.
Basic and diluted net loss per share was the same for each period presented as the inclusion of all potential shares of common stock outstanding would have been anti-dilutive. There were
3,173,188
and
3,505,729
potentially dilutive shares from the conversion of outstanding restricted stock units and stock options that were not included in the calculation of diluted net loss per share as of
December 31, 2018
and
2017
, respectively.
|
t.
|
Contingent Liabilities:
|
The Company accounts for its contingent liabilities in accordance with ASC No. 450 “Contingencies”. A provision is recorded when it is both probable that a liability has been incurred and the amount of the loss can be reasonably estimated.
With respect to legal matters, provisions are reviewed and adjusted to reflect the impact of negotiations, estimated settlements, legal rulings, advice of legal counsel and other information and events pertaining to a particular matter. As of
December 31, 2018
and
2017
, the Company was not a party to any litigation that could have a material adverse effect on the Company’s business, financial position, results of operations or cash flows.
|
u.
|
Basis of Presentation:
|
Certain amounts in prior years' financial statements have been recast and reclassified to conform to the current year's presentation.
|
v.
|
Recently Adopted Accounting Pronouncements:
|
In May 2014, the FASB issued ASU No. 2014-09, “Revenue from Contracts with Customers”, an updated standard on revenue recognition and issued subsequent amendments to the initial guidance in March 2016, April 2016, May 2016 and December 2016 within ASU 2016-08, 2016-10, 2016-12 and 2016-20, respectively. The new standards provide enhancements to the quality and consistency of how revenue is reported while also improving comparability in the financial statements of companies reporting using IFRS and US GAAP. The core principle of the new standard is for companies to recognize revenue to depict the transfer of goods or services to customers in amounts that reflect the consideration (that is, payment) to which the company expects to be entitled in exchange for those goods or services. The new standard results in enhanced disclosures about revenue, provides guidance for transactions that were not previously addressed comprehensively (for example, service revenue and contract modifications) and improves guidance for multiple-element arrangements. ASU 2014-09 was initially scheduled to be effective for annual and interim reporting periods beginning after December 15, 2016 and may be adopted either on a full retrospective or modified retrospective
73
approach. However, on July 9, 2015, the FASB approved a one year deferral of the effective date of ASU 2014-09. The revised effective date is for annual reporting periods beginning after December 15, 2017 and interim periods thereafter, with an early adoption permitted as of the original effective date. The Company adopted this standard effective January 1, 2018 using the full retrospective method which requires each prior reporting period presented to be recast in future issuances of the Company’s financial statements. In preparation for adoption of the standard, the Company implemented internal controls and key system functionality to enable the preparation of financial information and have reached conclusions on key accounting assessments related to the standard, including the assessment of the impact.
The most significant impact of the new standard relates to the way the Company accounts for subscription agreements and commission expense. Specifically, under the new revenue standard, it recognizes subscription license revenues upfront and the associated maintenance revenues over the contract period. Subscription arrangements include maintenance as part of the subscription service and are not priced or reported separately. The Company has also considered the impact of the guidance in ASC 340-40, “Other Assets and Deferred Costs” under the new standard. Under ASC 340-40, its required to capitalize and amortize certain incremental costs of obtaining a contract such as the maintenance portion of sales commissions over the life of the maintenance period.
Adoption of the standard resulted in a reduction of revenues of
$1,974
for the year ended December 31, 2017 and recognition of additional revenues of
$1,407
for the year ended December 31, 2016, primarily due to the net change in subscription license revenue recognition. In addition, as of December 31, 2017, adoption of the standard resulted in an increase in deferred commission of
$13,486
, a decrease in short-term deferred revenues of
$398
, a decrease in long-term deferred revenues of
$426
and an increase of
$1,246
in deferred tax liabilities. This is the result of the capitalization of sales commission costs and the upfront recognition of license revenues from subscription licenses. The cumulative impact to the Company’s accumulated deficit as of January 1, 2016 is a reduction of
$9,697
.
Adoption of the standard related to revenue recognition had no impact to cash from or used in operating, financing or investing activities on the Company’s consolidated statements of cash flows.
Select recast financial statement information, which reflects the effect of the adoption of this standard, is set forth below.
|
|
Year ended
December 31, 2017 |
||||||||||
|
|
As Reported
|
Adjustments
|
Recast for Adoption
of ASC 606 |
||||||||
|
Revenues:
|
|||||||||||
|
License revenues
|
$
|
123,610
|
|
$
|
(3,269
|
)
|
$
|
120,341
|
|
||
|
Maintenance and service revenues
|
93,754
|
|
1,295
|
|
95,049
|
|
|||||
|
Total revenues
|
217,364
|
|
(1,974
|
)
|
215,390
|
|
|||||
|
Cost of revenues
|
20,873
|
|
(159
|
)
|
20,714
|
|
|||||
|
Gross profit
|
196,491
|
|
(1,815
|
)
|
194,676
|
|
|||||
|
Operating costs and expenses:
|
|||||||||||
|
Research and development
|
47,369
|
|
—
|
|
47,369
|
|
|||||
|
Sales and marketing
|
135,896
|
|
(1,971
|
)
|
133,925
|
|
|||||
|
General and administrative
|
26,823
|
|
(22
|
)
|
26,801
|
|
|||||
|
Total operating expenses
|
210,088
|
|
(1,993
|
)
|
208,095
|
|
|||||
|
Operating loss
|
(13,597
|
)
|
178
|
|
(13,419
|
)
|
|||||
|
Financial income, net
|
2,362
|
|
—
|
|
2,362
|
|
|||||
|
Loss before income taxes
|
(11,235
|
)
|
178
|
|
(11,057
|
)
|
|||||
|
Income taxes
|
(2,459
|
)
|
(328
|
)
|
(2,787
|
)
|
|||||
|
Net loss
|
$
|
(13,694
|
)
|
$
|
(150
|
)
|
$
|
(13,844
|
)
|
||
74
|
|
Year ended
December 31, 2016 |
||||||||||
|
|
As Reported
|
Adjustments
|
Recast for Adoption
of ASC 606 |
||||||||
|
Revenues:
|
|||||||||||
|
License revenues
|
$
|
92,873
|
|
$
|
370
|
|
$
|
93,243
|
|
||
|
Maintenance and service revenues
|
71,583
|
|
1,037
|
|
72,620
|
|
|||||
|
Total revenues
|
164,456
|
|
1,407
|
|
165,863
|
|
|||||
|
Cost of revenues
|
15,843
|
|
(106
|
)
|
15,737
|
|
|||||
|
Gross profit
|
148,613
|
|
1,513
|
|
150,126
|
|
|||||
|
Operating costs and expenses:
|
|||||||||||
|
Research and development
|
36,660
|
|
—
|
|
36,660
|
|
|||||
|
Sales and marketing
|
107,825
|
|
(2,186
|
)
|
105,639
|
|
|||||
|
General and administrative
|
19,822
|
|
—
|
|
19,822
|
|
|||||
|
Total operating expenses
|
164,307
|
|
(2,186
|
)
|
162,121
|
|
|||||
|
Operating loss
|
(15,694
|
)
|
3,699
|
|
(11,995
|
)
|
|||||
|
Financial expenses, net
|
(885
|
)
|
—
|
|
(885
|
)
|
|||||
|
Loss before income taxes
|
(16,579
|
)
|
3,699
|
|
(12,880
|
)
|
|||||
|
Income taxes
|
(1,131
|
)
|
(182
|
)
|
(1,313
|
)
|
|||||
|
Net loss
|
$
|
(17,710
|
)
|
$
|
3,517
|
|
$
|
(14,193
|
)
|
||
|
|
December 31, 2017
Balance Sheet Data |
||||||||||
|
|
As Reported
|
Adjustments
|
As Adjusted
|
||||||||
|
Assets
|
|
|
|
|
|
|
|||||
|
Current assets:
|
|
|
|
|
|
|
|||||
|
Prepaid expenses and other current assets
|
$
|
7,130
|
|
$
|
7,216
|
|
$
|
14,346
|
|
||
|
Long-term assets:
|
|||||||||||
|
Other assets
|
$
|
973
|
|
$
|
6,270
|
|
$
|
7,243
|
|
||
|
Liabilities and stockholders’ equity
|
|||||||||||
|
Current liabilities:
|
|||||||||||
|
Deferred revenues
|
$
|
73,891
|
|
$
|
(398
|
)
|
$
|
73,493
|
|
||
|
Long-term liabilities:
|
|||||||||||
|
Deferred revenues
|
$
|
7,034
|
|
$
|
(426
|
)
|
$
|
6,608
|
|
||
|
Other liabilities
|
$
|
6,561
|
|
$
|
1,246
|
|
$
|
7,807
|
|
||
|
Stockholders’ equity:
|
|||||||||||
|
Accumulated deficit
|
$
|
(122,454
|
)
|
$
|
13,064
|
|
$
|
(109,390
|
)
|
||
75
|
|
Statement of Cash Flows
Year Ended December 31, 2017 |
||||||||||
|
|
As Reported
|
Adjustments
|
As Adjusted
|
||||||||
|
Cash flows from operating activities
|
|
|
|
|
|
|
|||||
|
Net loss
|
$
|
(13,694
|
)
|
$
|
(150
|
)
|
$
|
(13,844
|
)
|
||
|
Amortization of deferred commissions
|
$
|
—
|
|
$
|
12,591
|
|
$
|
12,591
|
|
||
|
Deferred commissions
|
$
|
—
|
|
$
|
(14,742
|
)
|
$
|
(14,742
|
)
|
||
|
Deferred revenues
|
$
|
18,885
|
|
$
|
1,975
|
|
$
|
20,860
|
|
||
|
Other long term liabilities
|
$
|
(731
|
)
|
$
|
326
|
|
$
|
(405
|
)
|
||
|
Net cash provided by operating activities
|
$
|
16,351
|
|
$
|
—
|
|
$
|
16,351
|
|
||
|
|
Statement of Cash Flows
Year Ended December 31, 2016 |
||||||||||
|
|
As Reported
|
Adjustments
|
As Adjusted
|
||||||||
|
Cash flows from operating activities
|
|
|
|
|
|
|
|||||
|
Net loss
|
$
|
(17,710
|
)
|
$
|
3,517
|
|
$
|
(14,193
|
)
|
||
|
Amortization of deferred commissions
|
$
|
—
|
|
$
|
9,525
|
|
$
|
9,525
|
|
||
|
Deferred commissions
|
$
|
—
|
|
$
|
(11,817
|
)
|
$
|
(11,817
|
)
|
||
|
Deferred revenues
|
$
|
13,269
|
|
$
|
(1,409
|
)
|
$
|
11,860
|
|
||
|
Other long term liabilities
|
$
|
147
|
|
$
|
184
|
|
$
|
331
|
|
||
|
Net cash provided by operating activities
|
$
|
7,347
|
|
$
|
—
|
|
$
|
7,347
|
|
||
In November 2016, the FASB issued ASU 2016-18, “Statement of Cash Flows (Topic 230): Restricted Cash”, which requires companies to include amounts generally described as restricted cash and restricted cash equivalents in cash and cash equivalents when reconciling beginning-of-period and end-of-period total amounts shown on the statement of cash flows. This ASU is effective for annual and interim periods beginning after December 15, 2017. The Company adopted this standard effective December 31, 2017 using the retrospective transition method, as required by the new standard. The adoption of this standard had an immaterial impact on the Company’s consolidated statements of cash flows.
The following table provides a reconciliation of cash and cash equivalents, and long term restricted cash reported within the consolidated balance sheets that sum to the total of such amounts in the consolidated statements of cash flows:
|
|
December 31, 2018
|
December 31, 2017
|
December 31, 2016
|
||||||||
|
Cash and cash equivalents
|
$
|
48,707
|
|
$
|
56,689
|
|
$
|
48,315
|
|
||
|
Long term restricted cash included in other assets
|
—
|
|
547
|
|
488
|
|
|||||
|
Cash, cash equivalents and long term restricted cash shown in the consolidated statement of cash flows
|
$
|
48,707
|
|
$
|
57,236
|
|
$
|
48,803
|
|
||
Under U.S. GAAP, the Company is permitted to make an accounting policy election to either treat taxes due on future inclusions in U.S. taxable income related to GILTI as a component of current income tax expense when incurred or to factor such amounts into the Company’s measurement of its deferred tax expense. The Company has made an accounting policy election to treat GILTI as a component of current income tax expense.
|
w.
|
Recently Issued Accounting Pronouncements Not Yet Adopted:
|
In January 2016, the FASB issued ASU 2016-13, “Financial Instruments – Credit Losses on Financial Instruments”, which requires that expected credit losses relating to financial assets measured on an amortized cost basis and available for sale debt securities be recorded through an allowance for credit losses. ASU 2016-13 limits the amount of credit losses
76
to be recognized for available for sale debt securities to the amount by which carrying value exceeds fair value and also requires the reversal of previously recognized credit losses if fair value increases. The new standard will be effective for interim and annual periods beginning after January 1, 2020, and early adoption is permitted. The Company is currently evaluating whether to early adopt this standard and the potential effect on its consolidated financial statements.
In February 2016, the FASB issued ASU 2016-02, “Leases”, on the recognition, measurement, presentation and disclosure of leases for both parties to a contract (i.e., lessees and lessors). The new standard requires lessees to apply a dual approach, classifying leases as either finance or operating leases based on the principle of whether or not the lease is effectively a financed purchase by the lessee. This classification will determine whether lease expense is recognized based on an effective interest method or on a straight line basis over the term of the lease, respectively. A lessee is also required to record a right-of-use asset and a lease liability for all leases with a term of greater than 12 months regardless of their classification. Leases with a term of 12 months or less will be accounted for in a manner similar to the accounting under existing guidance for operating leases today. The new standard requires lessors to account for leases using an approach that is substantially equivalent to existing guidance for sales-type leases, direct financing leases and operating leases. ASC 842 supersedes the previous leases standard, ASC 840, "Leases". The guidance is effective for the interim and annual periods beginning on or after December 15, 2018, and the Company has adopted the standard on January 1, 2019. A modified retrospective transition approach is required, applying the new standard to all leases existing at the date of initial application. The standard provides a number of optional practical expedients in transition. The Company is electing the ‘package of practical expedients’, which permits it not to reassess under the new standard its prior conclusions about lease identification, lease classification and initial direct costs.
To adopt this new standard, the Company has implemented changes to its existing systems and processes in conjunction with a review of existing vendor agreements. The Company expects adoption of the standard to have a material impact on its consolidated balance sheets which will result in the recognition of ROU assets and lease liabilities of approximately
$60,000
to
$70,000
at January 1, 2019. The most significant impact from recognition of ROU assets and lease liabilities relates to its office space. However, the Company does not anticipate that the adoption of this standard will have a material impact on the operating expenses in its consolidated statements of operations since the expense recognition under this new standard will be similar to current practice. The Company's financial income (expenses), net will be impacted by the revaluation of the lease liabilities in non-USD denominated currencies.
In June 2018, the FASB issued ASU No. 2018-07, “Compensation - Stock Compensation (Topic 718): Improvements to Nonemployee Share-Based Payment Accounting.” These amendments expand the scope of Topic 718, Compensation - Stock Compensation (which currently only includes share-based payments to employees) to include share-based payments issued to nonemployees for goods or services. Consequently, the accounting for share-based payments to nonemployees and employees will be substantially aligned. This ASU supersedes Subtopic 505-50, Equity - Equity-Based Payments to Non-Employees. The guidance is effective for the interim and annual periods beginning after December 15, 2018. The Company expects to adopt this standard effective January 1, 2019 and does not expect it to have a material effect on its consolidated financial statements.
NOTE 3:- PREPAID EXPENSES AND OTHER CURRENT ASSETS
|
|
December 31,
|
||||||
|
|
2018
|
2017
|
|||||
|
Deferred commission
|
$
|
8,055
|
|
$
|
7,216
|
|
|
|
Prepaid expenses
|
6,857
|
|
6,044
|
|
|||
|
Government institutions & other receivables
|
1,874
|
|
542
|
|
|||
|
Foreign currency forward contracts derivatives
|
—
|
|
163
|
|
|||
|
Short-term deposits & other
|
166
|
|
381
|
|
|||
|
|
$
|
16,952
|
|
$
|
14,346
|
|
|
77
NOTE 4:- PROPERTY AND EQUIPMENT, NET
|
|
December 31,
|
||||||
|
|
2018
|
2017
|
|||||
|
Cost:
|
|
|
|||||
|
Computer equipment
|
$
|
12,848
|
|
$
|
8,473
|
|
|
|
Office furniture and equipment
|
3,193
|
|
2,263
|
|
|||
|
Leasehold improvements
|
12,814
|
|
9,163
|
|
|||
|
|
28,855
|
|
19,899
|
|
|||
|
Accumulated depreciation
|
11,532
|
|
8,003
|
|
|||
|
Property and equipment, net
|
$
|
17,323
|
|
$
|
11,896
|
|
|
Depreciation expenses for the years ended
December 31, 2018
,
2017
and
2016
were
$4,156
,
$3,328
and
$2,180
, respectively.
NOTE 5:- ACCRUED EXPENSES AND OTHER SHORT TERM LIABILITIES
|
|
December 31,
|
||||||
|
|
2018
|
2017
|
|||||
|
Employees
|
$
|
20,111
|
|
$
|
17,748
|
|
|
|
Accrued expenses
|
12,725
|
|
9,507
|
|
|||
|
Government authorities and other
|
18,196
|
|
14,006
|
|
|||
|
Foreign exchange forward contract derivatives
|
3,646
|
|
—
|
|
|||
|
Other short term liabilities
|
1,313
|
|
1,192
|
|
|||
|
|
$
|
55,991
|
|
$
|
42,453
|
|
|
NOTE 6:- COMMITMENTS AND CONTINGENT LIABILITIES
|
a.
|
Liens:
|
The Company has several liens granted to financial institutions mainly to secure various operating lease agreements in connection with its office space.
|
b.
|
Lease Commitments:
|
The Company rents its facilities in all locations under operating leases with lease periods expiring from 2019-2030. The lease agreements of VSL include extension options. VSL leases cars for its employees under operating lease agreements expiring at various dates from 2019-2021.
78
Aggregate minimum rental commitments under non-cancelable leases as of
December 31, 2018
for the upcoming years were as follows:
|
|
Payments Due By
Period
|
||
|
2019
|
$
|
7,174
|
|
|
2020
|
9,086
|
|
|
|
2021
|
8,865
|
|
|
|
2022
|
8,876
|
|
|
|
2023
|
8,690
|
|
|
|
Thereafter
|
37,507
|
|
|
|
|
$
|
80,198
|
|
Total rent expenses for the years ended
December 31, 2018
,
2017
and
2016
were
$6,570
,
$4,075
and
$3,258
, respectively.
For leases that contain predetermined fixed escalations of the minimum rent, the Company recognizes the related rent expense on a straight-line basis from the date of possession of the property to the end of the initial lease term. The Company records any differences between the straight-line rent amounts and amounts payable under the leases as part of deferred rent, in accrued liabilities or long-term liabilities, as appropriate. Cash or lease incentives received upon entering into certain leases (“tenant allowances”) are recognized on a straight-line basis as a reduction to rent from the date of possession of the property through the end of the initial lease term. The Company records the unamortized portion of tenant allowances as a part of deferred rent, in current liabilities or other long-term liabilities, as appropriate. As of
December 31, 2018
and
2017
, deferred rent included
$1,313
and
$941
, respectively, in current liabilities in the Company’s consolidated balance sheets, and deferred rent included
$4,236
and
$4,780
, respectively, in long-term liabilities in the Company’s consolidated balance sheets.
On March 31, 2014, the Company entered into a promissory note and related security documents with Bank Leumi USA, which the Company has extended a number of times. The Company may borrow up to
$7,000
against certain of its accounts receivable outstanding amount, based on several conditions, at an annual interest rate of the Wall Street Journal Prime Rate plus
0.05%
, provided that the annual interest rate applicable to advances will not be lower than
4.10%
. As of
December 31, 2018
, that rate amounted to
5.55%
. This promissory note enables the Company, among other things, to engage in foreign currency hedging transactions with Bank Leumi USA to manage exposure to foreign currency risk without restricted cash requirements. The Company may borrow under the promissory note until November 15, 2020 at which time the principal sum of each such loan, together with accrued and unpaid interest payable, will become due and payable. As of
December 31, 2018
, the Company had
no
balance outstanding under the promissory note. As part of the transaction, the Company granted the lender a security interest in its personal property, excluding intellectual property and other intangible assets. The promissory note also contains customary events of default.
79
N
OTE 7:- FAIR VALUE MEASUREMENTS
The following table sets forth the Company’s liabilities that were measured at fair value as of
December 31, 2018
and
2017
by level within the fair value hierarchy (in thousands):
|
|
As of December 31, 2018
|
As of December 31, 2017
|
|||||||||||||||||||||||||||||
|
|
Level I
|
Level
II
|
Level
III
|
Fair
Value
|
Level I
|
Level
II
|
Level
III
|
Fair
Value
|
|||||||||||||||||||||||
|
Financial assets:
|
|
|
|
|
|
|
|
|
|
|
|
|
|
|
|
|
|||||||||||||||
|
Cash equivalents:
|
|
|
|
|
|
|
|
|
|
|
|
|
|
|
|
|
|||||||||||||||
|
Money market funds
|
2,594
|
|
—
|
|
—
|
|
2,594
|
|
6,870
|
|
—
|
|
—
|
|
6,870
|
|
|||||||||||||||
|
Marketable securities:
|
|||||||||||||||||||||||||||||||
|
US Treasury securities
|
39,770
|
|
—
|
|
—
|
|
39,770
|
|
39,731
|
|
—
|
|
—
|
|
39,731
|
|
|||||||||||||||
|
Other current assets:
|
|||||||||||||||||||||||||||||||
|
Forward foreign exchange contracts
|
—
|
|
—
|
|
—
|
|
—
|
|
—
|
|
163
|
|
—
|
|
163
|
|
|||||||||||||||
|
Financial liabilities:
|
|||||||||||||||||||||||||||||||
|
Forward foreign exchange contracts
|
—
|
|
(3,647
|
)
|
—
|
|
(3,647
|
)
|
—
|
|
—
|
|
—
|
|
—
|
|
|||||||||||||||
|
Total financial assets (liabilities)
|
$
|
42,364
|
|
$
|
(3,647
|
)
|
$
|
—
|
|
$
|
38,717
|
|
$
|
46,601
|
|
$
|
163
|
|
$
|
—
|
|
$
|
46,764
|
|
|||||||
NOTE 8:- STOCKHOLDERS’ EQUITY
|
a.
|
Composition of common stock capital:
|
|
|
Authorized
|
Issued and outstanding
|
|||||||||
|
|
Number of shares
|
||||||||||
|
|
December 31,
|
December 31,
|
|||||||||
|
|
2018
|
2017
|
2018
|
2017
|
|||||||
|
Stock of $0.001 par value:
|
|
|
|
|
|||||||
|
Common stock
|
200,000,000
|
|
200,000,000
|
|
29,576,880
|
|
28,146,162
|
|
|||
|
b.
|
Common stock rights:
|
The Company’s Amended and Restated Certificate of Incorporation authorizes the Company to issue
200,000,000
shares of common stock, par value
$0.001
per share.
The common stock confers upon its holders the right to participate in the general meetings of the Company, to vote at such meetings (each share represents
one
vote), to elect board members and to participate in any distribution of dividends or any other distribution of the Company’s property, including the distribution of surplus assets upon liquidation.
|
c.
|
Stock option plans:
|
On December 30, 2005, the Company’s board of directors adopted the Varonis Systems, Inc. 2005 Stock Plan (the “2005 Stock Plan”). As of December 31, 2013, the Company had reserved
4,713,319
shares of common stock available for issuance to employees, directors, officers and consultants of the Company and its subsidiaries. The options generally vest over
four
years. No awards were granted under the 2005 Stock Plan subsequent to December 31, 2013, and no further awards will be granted under the 2005 Stock Plan.
80
On November 14, 2013, the Company’s board of directors adopted the Varonis Systems, Inc. 2013 Omnibus Equity Incentive Plan (the “2013 Plan”) which was subsequently approved by the Company’s stockholders. The Company initially reserved
1,904,633
shares of common stock for issuance under the 2013 Plan to employees, directors, officers and consultants of the Company and its subsidiaries. The number of shares of common stock available for issuance under the 2013 Plan was increased on January 1, 2016 and has been, and will be, increased on each January 1 thereafter by four percent (
4%
) of the number of shares of common stock issued and outstanding on each December 31 immediately prior to the date of increase (rounded down to the nearest whole share), but the amount of each increase will be limited to the number of shares of common stock necessary to bring the total number of shares of Common Stock available for grant and issuance under the 2013 Plan to five percent (
5%
) of the number of shares of common stock issued and outstanding on each December 31. On January 1, 2019, 2018, 2017 and 2016, the share reserve under the 2013 Plan was automatically increased by
1,183,075
,
1,125,846
,
1,072,870
and
1,042,766
shares, respectively. Awards granted under the 2013 Plan generally vest over four years. Any award that is forfeited or canceled before expiration becomes available for future grants under the 2013 Plan.
A summary of employees’ stock options activities during the year ended
December 31, 2018
is as follows:
|
Year ended
|
|||||||||||||
|
|
December 31, 2018
|
||||||||||||
|
|
Number
|
Weighted
average
exercise
price
|
Aggregate
intrinsic
value
(in thousands)
|
Weighted
average
remaining
contractual
life (years)
|
|||||||||
|
Options outstanding at the beginning of the year
|
1,456,285
|
|
$
|
16.172
|
|
$
|
47,152
|
|
4.906
|
|
|||
|
Granted
|
—
|
|
$
|
—
|
|
||||||||
|
Exercised
|
(744,636
|
)
|
$
|
14.469
|
|
||||||||
|
Forfeited
|
(1,981
|
)
|
$
|
32.473
|
|
||||||||
|
Options outstanding at the end of the period
|
709,668
|
|
$
|
17.941
|
|
$
|
24,810
|
|
4.513
|
|
|||
|
Options exercisable at the end of the period
|
687,508
|
|
$
|
17.856
|
|
$
|
24,093
|
|
4.439
|
|
|||
There were no options granted in 2018.
The aggregate intrinsic value in the table above represents the total intrinsic value that would have been received by the option holders had all option holders exercised their options on the last date of the period. Total intrinsic value of options exercised for the years ended
December 31, 2018
,
2017
and
2016
was
$40,610
,
$22,382
and
$9,418
, respectively. As of
December 31, 2018
and
2017
, there was
$142
and
$2,208
, respectively, of total unrecognized compensation cost related to non-vested share-based compensation arrangements granted under the 2005 Stock Plan and 2013 Plan. This cost is expected to be recognized over a period of approximately
0.712
and
0.887
years, respectively.
The options outstanding as of
December 31, 2018
have been separated into ranges of exercise price as follows:
|
Range of
exercise price
|
Options
outstanding
as of
December 31,
2018
|
Weighted
average
remaining
contractual
life (years)
|
Weighted
average
exercise
price
|
Options
exercisable
as of
December 31,
2018
|
Weighted
average
remaining
contractual
life (years)
|
Weighted
average
exercise
price of
options
exercisable
|
||||||||||||||||||||
|
$
|
1.256
|
|
—
|
1.576
|
130,479
|
|
0.663
|
|
$
|
1.282
|
|
130,479
|
|
0.663
|
|
$
|
1.282
|
|
||||||||
|
$
|
6.230
|
|
—
|
8.800
|
12,356
|
|
3.007
|
|
$
|
8.039
|
|
12,356
|
|
3.007
|
|
$
|
8.039
|
|
||||||||
|
$
|
12.470
|
|
—
|
16.870
|
147,125
|
|
5.014
|
|
$
|
14.030
|
|
132,541
|
|
4.781
|
|
$
|
13.637
|
|
||||||||
|
$
|
19.510
|
|
—
|
21.660
|
220,211
|
|
5.599
|
|
$
|
21.174
|
|
218,573
|
|
5.594
|
|
$
|
21.185
|
|
||||||||
|
$
|
22.010
|
|
—
|
24.230
|
85,870
|
|
5.284
|
|
$
|
22.364
|
|
85,870
|
|
5.284
|
|
$
|
22.364
|
|
||||||||
|
|
|
$29.880
|
|
66,349
|
|
6.145
|
|
$
|
29.880
|
|
60,411
|
|
6.145
|
|
$
|
29.880
|
|
|||||||||
|
|
|
$39.860
|
|
47,278
|
|
5.225
|
|
$
|
39.860
|
|
47,278
|
|
5.225
|
|
$
|
39.860
|
|
|||||||||
|
|
|
|
|
709,668
|
|
4.513
|
|
$
|
17.941
|
|
687,508
|
|
4.439
|
|
$
|
17.856
|
|
|||||||||
81
|
d.
|
Options issued to consultants:
|
The Company’s outstanding options granted to consultants for services as of
December 31, 2018
were as follows:
|
Issuance date
|
Options for
shares of
common stock
|
Exercise price
per share
|
Options
exercisable
|
Exercisable
through
|
|||||||
|
|
(number)
|
|
(number)
|
|
|||||||
|
February 2013
|
1,500
|
|
$
|
12.470
|
|
1,500
|
|
February 2023
|
|||
|
August 2013
|
4,000
|
|
$
|
21.140
|
|
4,000
|
|
August 2023
|
|||
|
March 2014
|
5,550
|
|
$
|
39.860
|
|
5,550
|
|
March 2024
|
|||
|
May 2014
|
3,700
|
|
$
|
22.010
|
|
3,700
|
|
May 2024
|
|||
|
November 2014
|
5,468
|
|
$
|
21.660
|
|
5,468
|
|
November 2024
|
|||
|
May 2015
|
1,137
|
|
$
|
19.510
|
|
929
|
|
May 2025
|
|||
|
February 2016
|
2,138
|
|
$
|
16.870
|
|
1,408
|
|
February 2026
|
|||
|
|
23,493
|
|
22,555
|
|
|||||||
|
e.
|
Restricted stock units:
|
The following provides a summary of the restricted stock unit activity for the Company for the year ended
December 31, 2018
:
|
|
Number of
Shares
Underlying
Outstanding
Restricted Stock
Units
|
Weighted-
Average
Grant Date
Fair Value
|
||||
|
Outstanding as of January 1, 2018
|
2,018,121
|
|
$
|
27.32
|
|
|
|
Granted
|
1,255,824
|
|
$
|
53.79
|
|
|
|
Vested
|
(671,768
|
)
|
$
|
28.54
|
|
|
|
Forfeited
|
(162,150
|
)
|
$
|
36.89
|
|
|
|
Unvested as of December 31, 2018
|
2,440,027
|
|
$
|
40.00
|
|
|
82
|
f.
|
2015 Employee Stock Purchase Plan
|
On May 5, 2015, the Company’s stockholders approved the Varonis Systems, Inc. 2015 Employee Stock Purchase Plan (the “ESPP”), which the Company’s board of directors had adopted on March 19, 2015. The ESPP became effective as of June 30, 2015. The ESPP allows eligible employees to purchase shares of the Company’s common stock at a discount through payroll deductions of up to
15%
of their eligible compensation, at not less than
85%
of the fair market value of the Company’s common stock on the first day or last trading day in the offering period, subject to any plan limitations. The Company initially reserved
500,000
shares of common stock for issuance under the ESPP. The number of shares available for issuance under the ESPP was increased on January 1, 2016 and has been, and will be, increased each January 1 thereafter, by an amount equal to the lesser of (i) one percent (
1%
) of the number of shares of common stock issued and outstanding on each December 31 immediately prior to the date of increase, except that the amount of each such increase will be limited to the number of shares of common stock necessary to bring the total number of shares of common stock available for issuance under the ESPP to two percent (
2%
) of the number of shares of common stock issued and outstanding on each such December 31, or (ii)
400,000.00
shares of common stock. On January 1, 2019, 2018, 2017 and 2016, the share reserve under the ESPP was automatically increased by
177,358
,
188,813
,
158,695
and
21,383
shares, respectively. The ESPP will continue in effect until the earlier of (i) the date when no shares of common stock are available for issuance thereunder or (ii) June 30, 2025; unless terminated prior thereto by the Company’s board of directors or compensation committee, each of which has the right to terminate the ESPP at any time.
|
g.
|
Stock-based compensation expense for employees and consultants:
|
The Company recognized non-cash stock-based compensation expense in the consolidated statements of operations as follows (in thousands):
|
Year ended
|
|||||||||||
|
|
December 31,
|
||||||||||
|
|
2018
|
2017
|
2016
|
||||||||
|
Cost of revenues
|
$
|
1,757
|
|
$
|
1,078
|
|
$
|
699
|
|
||
|
Research and development
|
9,645
|
|
5,209
|
|
3,052
|
|
|||||
|
Sales and marketing
|
16,081
|
|
8,542
|
|
6,104
|
|
|||||
|
General and administrative
|
7,478
|
|
5,006
|
|
3,083
|
|
|||||
|
Total
|
$
|
34,961
|
|
$
|
19,835
|
|
$
|
12,938
|
|
||
For the year ended
December 31, 2018
, the Company recognized tax benefits on stock-based compensation expense, which are reflected in the provision for income taxes in the consolidated statements of operations, of
$40
. The Company did not recognize any tax benefits on stock-based compensation expense in
2017
and
2016
.
NOTE 9:- INCOME TAXES
|
a.
|
Tax Reform:
|
On December 22, 2017, the TCJA was signed into law. The TCJA makes broad and complex changes to the Code that impact the Company's provision for income taxes. The changes include, but are not limited to:
•
Decreasing the corporate income tax rate from 35% to 21% effective for tax years beginning after December 31, 2017 (“Rate Reduction”);
•
The Deemed Repatriation Transition Tax; and
•
Taxation of GILTI earned by foreign subsidiaries beginning after December 31, 2017. The GILTI tax imposes a tax on foreign income in excess of a deemed return on tangible assets of foreign corporations.
Deemed Repatriation Transition Tax
83
The Deemed Repatriation Transition Tax is a tax on previously untaxed accumulated and current earnings and profits (“E&P”) of certain of our foreign subsidiaries. To determine the amount of the Deemed Repatriation Transition Tax, the Company calculated the amount of post-1986 E&P of its foreign subsidiaries, as well as the amount of non-U.S. income taxes paid on such earnings. Because the Company has a net cumulative deficit on the E&P of its foreign subsidiaries, it should not be subject to the Deemed Repatriation Transition Tax.
100% Dividend Received Deduction and Indefinite Reinvestment Assertion
Effective for tax years beginning after December 31, 2017, the TCJA provides a 100% dividend received deduction, subject to a one-year holding period, to a U.S. corporate shareholder for the foreign source portion of dividends received from a “specified 10-percent owned foreign corporation.”
Prior to the effectiveness of the TCJA, the Company did not recognize a deferred tax liability related to un-remitted foreign earnings because such earnings were expected to be reinvested indefinitely. Although the Company is not subject to the Deemed Repatriation Transition Tax, an actual repatriation from its non-U.S. subsidiaries could still be subject to additional foreign withholding taxes and U.S. state taxes. The Company’s intention is to continue reinvesting the earnings from its non-U.S. subsidiaries indefinitely.
GILTI Tax
The TCJA creates a new requirement that certain income (i.e., GILTI) earned by controlled foreign corporations (“CFCs”) must be included currently in the gross income of the CFCs’ U.S. shareholder. GILTI is the excess of the shareholder’s “net CFC tested income” over the net deemed tangible income return, which is currently defined as the excess of (1) 10 percent of the aggregate of the U.S. shareholder’s pro rata share of the qualified business asset investment of each CFC with respect to which it is a U.S. shareholder, over (2) the amount of certain interest expense taken into account in the determination of net CFC-tested income.
For 2018, the Company is not subject to tax on account of GILTI as it has net CFC tested loss on an aggregated basis. Under U.S. GAAP, the Company is permitted to make an accounting policy election to either treat taxes due on future inclusions in U.S. taxable income related to GILTI as a component of current income tax expense when incurred or to factor such amounts into the Company’s measurement of its deferred tax expense. The Company has made an accounting policy election to treat GILTI as a component of current income tax expense.
Accounting for the TCJA
In March 2018, FASB issued Accounting Standards Update No. 2018-05, "Income Taxes Topic (740): Amendments to SEC Paragraphs Pursuant to SEC Staff Accounting Bulletin No. 118" ("ASU 2018-05") to address the application of GAAP in situations when a registrant does not have the necessary information available, prepared or analyzed (including computations) in reasonable detail to complete the accounting for certain income tax effects of the TCJA.
The Company completed the accounting treatment related to the tax effects of the TCJA. As a result:
•
The Company recognizes its accounting for changes in the US federal rate and deferred tax impact for the rate change to be complete.
•
The Company's analysis for the Deemed Repatriation Transition Tax has been filed with its December 31, 2017 tax return and the Company considered its accounting for this area of the TCJA to be complete as of such date and did not make any measurement-period adjustments related to it.
•
The Company accounted for the tax impact related to others areas of the TCJA and believe its analysis to be completed and consistent with the guidance in ASU 2018-05. In particular, the Company concluded that for 2018, it should not be subject to any tax on account of GILTI or base erosion and anti-abuse payments made by U.S. corporations to foreign related parties. Further, due to the NOL generated during 2018, the Company concluded that for 2018, it would not benefit from the reduced tax rate of
13.125%
on its foreign derived intangible income.
84
The Company recognizes that the IRS, the Financial Accounting Standards Board and the SEC are continuing to publish and finalize ongoing guidance with respect to the TCJA which may modify accounting interpretation for the TCJA, the Company will account for these impacts in the period in which any changes are enacted.
|
b.
|
The Company:
|
The Company is taxed in accordance with U.S. tax laws.
As of
December 31, 2018
, the Company had net operating loss carry-forwards for federal, state and foreign income tax purposes of approximately
$54,872
,
$57,530
and
$1,204
, respectively. If not utilized, these carryforwards will expire starting in 2028, 2020 and indefinitely for federal, state and foreign tax purposes, respectively. In addition, as of
December 31, 2018
, the Company had federal research credit, retention credit, foreign tax credit and Ireland Employment credit carryforwards of approximately
$1,412
,
$24
,
$190
and
$78
, respectively. If not utilized, the federal tax carryforwards will begin to expire in 2033, 2032 and 2026, respectively. Ireland has no expiration on the employment credit.
A U.S. corporation's ability to utilize its federal and state NOL and tax credit carryforwards to offset its taxable income or income is limited under Section 382 of the Code if the corporation undergoes an ownership change (within the meaning of Code Section 382). In general, an “ownership change” occurs whenever the percentage of the stock of a corporation owned by “5-percent shareholders” (within the meaning of Code Section 382) increases by more than 50 percentage points over the lowest percentage of the stock of such corporation owned by such “5-percent shareholders” at any time over the testing period.
An ownership change under Code Section 382 would establish an annual limitation to the amount of NOL and tax credit carryforwards the Company could utilize to offset its taxable income or income tax in any single year. The Company performed a Section 382 analysis (the “Analysis”) which concluded that its ability to utilize its NOL and tax credit carryforwards is subject to an annual limitation as it underwent a section 382 ownership change during 2017. The Analysis further concluded that the Company's NOL carryforwards should be available for utilization by the Company before they expire, starting in 2028. As of December 31, 2017, the Company's U.S. federal NOL carryforwards was
$22,907
.
During 2018, the Company generated an additional
$31,965
of NOLs which are not subject to the annual limitation described above. The TCJA also modified the rules regarding utilization of NOL and NOLs generated subsequent to the TCJA can only be used to offset 80% of taxable income with an indefinite carryforward period for unused carryforwards (i.e., they should not expire). Utilization of the federal and state net operating losses and credits may be subject to a substantial annual limitation due to an additional ownership change. The annual limitation may result in the expiration of net operating losses and credits before utilization and in the event we have a change of ownership, utilization of the carryforwards could be restricted.
|
c.
|
Loss before taxes on income is comprised as follows:
|
|
Year ended
|
|||||||||||
|
|
December 31,
|
||||||||||
|
|
2018
|
2017
|
2016
|
||||||||
|
(as adjusted)
|
(as adjusted)
|
||||||||||
|
Domestic
|
$
|
(25,557
|
)
|
$
|
(19,239
|
)
|
$
|
(13,940
|
)
|
||
|
Foreign
|
(2,608
|
)
|
8,182
|
|
1,060
|
|
|||||
|
|
$
|
(28,165
|
)
|
$
|
(11,057
|
)
|
$
|
(12,880
|
)
|
||
|
d.
|
Taxes on income (loss) are comprised as follows:
|
85
|
Year ended
|
|||||||||||
|
|
December 31,
|
||||||||||
|
|
2018
|
2017
|
2016
|
||||||||
|
(as adjusted)
|
(as adjusted)
|
||||||||||
|
Current:
|
|
|
|
||||||||
|
Domestic:
|
|
|
|
||||||||
|
Federal
|
$
|
—
|
|
$
|
(92
|
)
|
$
|
92
|
|
||
|
State
|
169
|
|
191
|
|
109
|
|
|||||
|
Foreign
|
1,498
|
|
2,516
|
|
930
|
|
|||||
|
Total current income tax
|
$
|
1,667
|
|
$
|
2,615
|
|
$
|
1,131
|
|
||
|
Deferred:
|
|||||||||||
|
Foreign
|
$
|
(1,254
|
)
|
$
|
172
|
|
$
|
182
|
|
||
|
Total deferred income tax
|
$
|
(1,254
|
)
|
$
|
172
|
|
$
|
182
|
|
||
|
Income tax expense
|
$
|
413
|
|
$
|
2,787
|
|
$
|
1,313
|
|
||
|
e.
|
Deferred income taxes:
|
Deferred income taxes reflect the net tax effects of temporary differences between the carrying amounts of assets and liabilities for financial reporting purposes and the amounts used for income tax purposes. The Company’s deferred tax assets are derived from its U.S. net operating loss carry forwards and other temporary differences.
ASC 740 requires an assessment of both positive and negative evidence concerning the realizability of our deferred tax assets in each jurisdiction. After considering evidence such as current and cumulative financial reporting incomes, the expected sources of future taxable income and tax planning strategies, the Company's management concluded that a valuation allowance is required for US, state and Israel deferred tax assets. Future changes in these factors, including the Company's anticipated results, could have a significant impact on the realization of the deferred tax assets which would result in an increase or decrease to the valuation allowance and a corresponding charge to income tax expense.
|
|
December 31,
|
||||||
|
|
2018
|
2017
|
|||||
|
(as adjusted)
|
|||||||
|
Deferred tax assets:
|
|||||||
|
Carry forward losses and credits
|
$
|
15,547
|
|
$
|
7,407
|
|
|
|
Deferred revenues
|
13,995
|
|
14,226
|
|
|||
|
Accrued payroll, commissions, vacation
|
1,912
|
|
2,685
|
|
|||
|
Equity Compensation
|
5,737
|
|
908
|
|
|||
|
Allowance for doubtful accounts
|
940
|
|
633
|
|
|||
|
Accrued severance pay
|
297
|
|
238
|
|
|||
|
Other
|
1,346
|
|
1,760
|
|
|||
|
Deferred tax assets before valuation allowance
|
39,774
|
|
27,857
|
|
|||
|
Valuation allowance
|
(39,365
|
)
|
(27,702
|
)
|
|||
|
Deferred tax assets
|
$
|
409
|
|
$
|
155
|
|
|
|
Deferred tax liability:
|
|||||||
|
Accrued compensation and other accrued expense
|
$
|
(272
|
)
|
$
|
(289
|
)
|
|
|
Deferred tax liability
|
$
|
(272
|
)
|
$
|
(289
|
)
|
|
|
Net deferred tax asset (liability)
|
$
|
137
|
|
$
|
(134
|
)
|
|
86
The change in the valuation allowance was approximately an increase of
$15,826
and a decrease of
$8,623
during 2018 and 2017, which included the Company’s adoption of ASC 606. The adoption resulted in a decrease to deferred tax assets of
$3,796
and a decrease to valuation allowance of
$2,493
with an offsetting entry of
$1,302
to retained earnings. As the Company adopted ASC 606 using the full retrospective method, the 2017 and 2016 valuation allowances above have been adjusted for ASC 606 adoption. In addition, the 2017 and 2016 tax disclosures have been updated to reflect the ASC 606 adoption.
|
f.
|
Reconciliation of the theoretical tax expenses:
|
A reconciliation between the theoretical tax expense, assuming all income is taxed at the statutory tax rate applicable to income of the Company, and the actual tax expense (benefit) as reported in the consolidated statements of operations is as follows:
|
|
Year ended December 31,
|
||||||||||
|
|
2018
|
2017
|
2016
|
||||||||
|
(as adjusted)
|
(as adjusted)
|
||||||||||
|
Loss before taxes, as reported in the consolidated statements of operations
|
$
|
(28,165
|
)
|
$
|
(11,057
|
)
|
$
|
(12,880
|
)
|
||
|
Statutory tax rate
|
21
|
%
|
34
|
%
|
34
|
%
|
|||||
|
Theoretical tax benefits on the above amount at the US statutory tax rate
|
$
|
(5,915
|
)
|
$
|
(3,759
|
)
|
$
|
(4,379
|
)
|
||
|
Income tax at rate other than the U.S. statutory tax rate
|
692
|
|
(1,047
|
)
|
(6
|
)
|
|||||
|
Tax advances and non-deductible expenses including equity based compensation expenses
|
(7,623
|
)
|
3,123
|
|
4,298
|
|
|||||
|
Operating losses and other temporary differences for which valuation allowance was provided
|
15,826
|
|
(8,623
|
)
|
1,885
|
|
|||||
|
Research and Development Tax Credit
|
—
|
|
1,126
|
|
(1,182
|
)
|
|||||
|
State tax
|
(1,221
|
)
|
(601
|
)
|
(426
|
)
|
|||||
|
Impact of rate change
|
—
|
|
10,920
|
|
(360
|
)
|
|||||
|
Change in tax reserve for uncertain tax positions
|
(1,728
|
)
|
1,576
|
|
1,209
|
|
|||||
|
Other individually immaterial income tax items
|
382
|
|
72
|
|
274
|
|
|||||
|
Actual tax expense
|
$
|
413
|
|
$
|
2,787
|
|
$
|
1,313
|
|
||
|
g.
|
A reconciliation of the beginning and ending amounts of unrecognized tax benefits in the years ended December 31, 2018 and 2017 are as follows:
|
|
Gross unrecognized tax benefits as of January 1, 2017
|
$
|
2,106
|
|
|
Increase in tax position for current year
|
1,752
|
|
|
|
Increase in tax position for prior years
|
135
|
|
|
|
Decrease in tax position for prior years
|
(311
|
)
|
|
|
Gross unrecognized tax benefits as of December 31, 2017
|
$
|
3,682
|
|
|
Increase in tax position for current year
|
169
|
|
|
|
Increase in tax position for prior years
|
241
|
|
|
|
Decrease in tax position for prior years
|
(720
|
)
|
|
|
Decrease for lapse of statute of limitations/ settlements
|
(1,418
|
)
|
|
|
Gross unrecognized tax benefits as of December 31, 2018
|
$
|
1,954
|
|
There was
$1,954
of unrecognized income tax benefits that, if recognized, approximately
$1,431
would impact the effective tax rate in the period in which each of the benefits is recognized. The Company includes interest and penalties related
87
to unrecognized tax benefits within the provision for income taxes on the consolidated statements of operations. The total amount of penalties and interest is approximately
$93
as of
December 31, 2018
.
|
h.
|
Foreign taxation:
|
1. Israeli tax benefits under the Law for the Encouragement of Capital Investments, 1959 (the “Investment Law”):
Conditions for entitlement to the benefits:
The benefits available to a Beneficiary Enterprise relate only to taxable income attributable to the specific investment program and are conditioned upon terms stipulated in the Investment Law and the related regulations and the criteria set forth in the applicable certificate of approval (for a Beneficiary Enterprise). If VSL does not fulfill these conditions, in whole or in part, the benefits can be cancelled, and VSL may be required to refund the benefits, in an amount linked to the Israeli consumer price index plus interest.
The Office of the Chief Scientist at Israel’s Ministry of Industry, Trade and Labor approved the Israeli subsidiary as an R&D-incentive enterprise for a foreign resident company in accordance with the Encouragement of Capital Investments (Consolidated Version) Law.
If cash dividends are distributed out of tax exempt profits in a manner other than upon complete liquidation, VSL will then become liable for tax at the rate of
10%
-
25%
(depending on the level of foreign investments in VSL) in respect of the amount distributed.
2. Undistributed earnings of foreign subsidiaries:
As of
December 31, 2018
, the Company has accumulated undistributed earnings generated by its foreign subsidiaries of approximately
$678
. Because approximately
$285
of such earnings have previously been subject to the one-time transition tax on foreign earnings required by the TCJA, any additional taxes due with respect to such earnings or the excess of the amount for financial reporting over the tax basis of our foreign investments would generally be limited to foreign and state taxes. The Company plans to indefinitely reinvest any additional cash on hand outside of the previously taxed income and expects future U.S. cash generation to be sufficient to meet future U.S. cash needs.
|
i.
|
Tax assessments:
|
The Company was audited by the Internal Revenue Service for tax year 2016. As of December 31, 2018, our federal returns for the years ended 2010 through the current period and most state returns for the years ended 2009 through the current period are still open to examination. In addition, all of the net operating losses and research and development credit carryforwards that may be used in future years are still subject to adjustment.
The Company has final tax assessments for VSL in Israel through 2015, VSUK in UK through 2016 and VSF in France through 2015.
VSG in Germany, VSC in Canada, VIRE in Ireland and VAUS in Australia do not have final tax assessments since their respective inceptions.
88
NOTE 10:- FINANCIAL EXPENSES, NET
|
Year ended
|
|||||||||||
|
|
December 31,
|
||||||||||
|
|
2018
|
2017
|
2016
|
||||||||
|
Financial income:
|
|
|
|
|
|
|
|||||
|
Interest on bank deposits, net
|
$
|
1,741
|
|
$
|
747
|
|
$
|
520
|
|
||
|
Foreign currency transactions gains, net
|
—
|
|
1,773
|
|
—
|
|
|||||
|
Other
|
—
|
|
27
|
|
—
|
|
|||||
|
|
1,741
|
|
2,547
|
|
520
|
|
|||||
|
Financial expenses:
|
|||||||||||
|
Bank charges
|
195
|
|
185
|
|
149
|
|
|||||
|
Foreign currency transactions losses, net
|
574
|
|
—
|
|
1,224
|
|
|||||
|
Other
|
2
|
|
—
|
|
32
|
|
|||||
|
|
(771
|
)
|
(185
|
)
|
(1,405
|
)
|
|||||
|
|
$
|
970
|
|
$
|
2,362
|
|
$
|
(885
|
)
|
||
NOTE 11:- GEOGRAPHIC INFORMATION AND MAJOR CUSTOMER AND PRODUCT DATA
Summary information about geographic areas:
ASC 280, “Segment Reporting,” establishes standards for reporting information about operating segments. Operating segments are defined as components of an enterprise about which separate financial information is available that is evaluated regularly by the chief operating decision maker in deciding how to allocate resources and in assessing performance. The Company manages its business on the basis of
one
reportable segment, and derives revenues from licensing of software, sale of professional services, maintenance and technical support (see Note 1 above for a brief description of the Company’s business). The following is a summary of revenues within geographic areas:
|
Year ended
|
|||||||||||
|
|
December 31,
|
||||||||||
|
|
2018
|
2017
|
2016
|
||||||||
|
(as adjusted)
|
(as adjusted)
|
||||||||||
|
Revenues based on customer’s location:
|
|
|
|
|
|
|
|||||
|
North America
|
$
|
167,361
|
|
$
|
139,720
|
|
$
|
106,069
|
|
||
|
EMEA (*)
|
93,816
|
|
68,998
|
|
53,170
|
|
|||||
|
Rest of the World
|
9,111
|
|
6,672
|
|
6,624
|
|
|||||
|
Total revenues
|
$
|
270,288
|
|
$
|
215,390
|
|
$
|
165,863
|
|
||
(*) Sales to customers in France accounted for
$31,532
,
$22,658
and
$17,103
for the years ended
December 31, 2018
,
2017
and
2016
, respectively.
During the years ended
December 31, 2018
,
2017
and
2016
, there were
no
sales to a single customer exceeding 10% of the Company’s revenues.
89
|
|
December 31,
|
||||||
|
|
2018
|
2017
|
|||||
|
Long-lived assets by geographic region:
|
|
|
|
|
|||
|
United States
|
$
|
7,612
|
|
$
|
7,072
|
|
|
|
Israel
|
7,834
|
|
2,944
|
|
|||
|
France
|
1,243
|
|
1,426
|
|
|||
|
Other
|
634
|
|
454
|
|
|||
|
|
$
|
17,323
|
|
$
|
11,896
|
|
|
|
Item 9.
|
Changes in and Disagreements with Accountants on Accounting and Financial Disclosure
|
There have been no changes in our independent registered public accounting firm, Kost Forer Gabbay & Kasierer, a member of Ernst & Young Global, or disagreements with our accountants on matters of accounting and financial disclosure.
|
Item 9A.
|
Controls and Procedures
|
Evaluation of Disclosure Controls and Procedures
Our management, with the participation of our Chief Executive Officer and Chief Financial Officer, evaluated the effectiveness of our disclosure controls and procedures (as defined in Rules 13a-15(e) and 15d-15(e) of the Exchange Act) as of the end of the period covered by this report. Based on that evaluation, our Chief Executive Officer and Chief Financial Officer concluded that our disclosure controls and procedures as of the end of the period covered by this report were effective at a reasonable assurance level in ensuring that information required to be disclosed by us in reports that we file or submit under the Exchange Act is recorded, processed, summarized and reported within the time periods specified in the SEC’s rules and forms. We believe that a control system, no matter how well designed and operated, cannot provide absolute assurance that the objectives of the control system are met, and no evaluation of controls can provide absolute assurance that all control issues and instances of fraud, if any, within a company have been detected. The effectiveness of our internal control over financial reporting as of
December 31, 2018
has been audited by Kost Forer Gabbay & Kasierer, a member of Ernst & Young Global and an independent registered public accounting firm, as stated in their report which is included in Part II, Item 8 of this Annual Report on Form 10-K.
Management’s Annual Report on Internal Control Over Financial Reporting
Our management is responsible for establishing and maintaining adequate internal control over financial reporting (as defined in Rules 13a-15(f) and 15d-15(f) of the Exchange Act). Our management conducted an evaluation of the effectiveness of our internal control over financial reporting as of
December 31, 2018
based on the criteria established in Internal Control - Integrated Framework (2013) issued by the Committee of Sponsoring Organizations of the Treadway Commission.
Based on the results of its evaluation, management concluded that our internal control over financial reporting was effective as of
December 31, 2018
.
Changes in Internal Control over Financial Reporting
There was no change in our internal control over financial reporting that occurred during the three months ended
December 31, 2018
that has materially affected, or is reasonably likely to materially affect, our internal control over financial reporting.
|
Item 9B.
|
Other Information
|
None.
90
PART III
|
Item 10.
|
Directors, Executive Officers and Corporate Governance
|
The information required by this item (other than the information set forth in the next paragraph in this Item 10) will be included in our definitive proxy statement with respect to our
2019
Annual Meeting of Stockholders to be filed with the SEC and is incorporated herein by reference.
We have adopted a code of business conduct and ethics that is applicable to all of our employees, officers and directors, including our chief executive and senior financial officers. The code of business conduct and ethics is available on our website at www.varonis.com. We expect that any amendment to the code, or any waivers of its requirements, will be disclosed on our website. The inclusion of our website in this Form 10-K does not include or incorporate by reference the information on our website into this Form 10-K.
|
Item 11.
|
Executive Compensation
|
The information called for by this item will be included in our definitive proxy statement with respect to our
2019
Annual Meeting of Stockholders to be filed with the SEC and is incorporated herein by reference.
|
Item 12.
|
Security Ownership of Certain Beneficial Owners and Management and Related Stockholder Matters
|
The information called for by this item will be included in our definitive proxy statement with respect to our
2019
Annual Meeting of Stockholders to be filed with the SEC and is incorporated herein by reference.
|
Item 13.
|
Certain Relationships and Related Transactions, and Director Independence
|
The information called for by this item will be included in our definitive proxy statement with respect to our
2019
Annual Meeting of Stockholders to be filed with the SEC and is incorporated herein by reference.
|
Item 14.
|
Principal Accounting Fees and Services
|
The information called for by this item will be included in our definitive proxy statement with respect to our
2019
Annual Meeting of Stockholders to be filed with the SEC and is incorporated herein by reference.
PART IV
|
Item 15.
|
Exhibits and Financial Statement Schedules
|
(a) Financial Statements
Our consolidated financial statements are listed in the “Index to Consolidated Financial Statements” under Part II, Item 8 of this Annual Report on Form 10-K. All schedules are omitted because they are not applicable or the required information is shown in the financial statements or notes thereto.
91
(b) Exhibits
|
Exhibit
Number
|
Description of the Document
|
|
|
|
|
3.1(1)
|
|
|
|
|
|
3.2(2)
|
|
|
|
|
|
10.1(3)†
|
|
|
|
|
|
10.2(4)†
|
|
|
|
|
|
10.3(5)†
|
|
|
|
|
|
10.4(6)†
|
|
|
|
|
|
10.5(7)†
|
|
|
|
|
|
10.6(8)†
|
|
|
|
|
|
10.7(9)†
|
|
|
10.8(10)†
|
|
|
|
|
|
10.9(11)†
|
|
|
|
|
|
10.10(12)†
|
|
|
10.11(13)†
|
|
|
|
|
|
10.12(14)†
|
|
|
10.13†
|
|
|
10.14†
|
|
|
10.15(15)
|
|
|
|
|
|
10.16(16)
|
|
|
|
|
|
10.17(17)*
|
|
92
|
|
|
|
10.18(18)*
|
|
|
|
|
|
21.1
|
|
|
|
|
|
23.1
|
|
|
|
|
|
31.1
|
|
|
|
|
|
31.2
|
|
|
32.1**
|
|
|
|
|
|
32.2**
|
|
|
101
|
The following materials from the Company’s Annual Report on Form 10-K for the year ended December 31, 2018, formatted in XBRL (eXtensible Business Reporting Language): (i) the Consolidated Balance Sheets, (ii) the Consolidated Statements of Operations, (iii) the Consolidated Statements of Comprehensive Loss, (iv) the Consolidated Statements of Cash Flows and (v) related notes to these consolidated financial statements, tagged as blocks of text and in detail
|
____________________________________
93
|
†
|
Indicates management contract or compensatory plan or arrangement.
|
|
|
*
|
Confidential treatment for portions of this exhibit has been granted by the Securities and Exchange Commission.
|
|
|
**
|
Document has been furnished, is not deemed filed and is not to be incorporated by reference into any of the Company’s filings under the Securities Act of 1933, as amended, or the Securities Exchange Act of 1934, as amended, irrespective of any general incorporation language contained in any such filing.
|
|
|
(1)
|
Filed as Exhibit 3.1 to the Company’s Quarterly Report on Form 10-Q filed with the SEC on May 8, 2014 (the “Company’s First Quarter 2014 Form 10-Q”) and incorporated herein by reference.
|
|
|
(2)
|
Filed as Exhibit 3.2 to the Company’s First Quarter 2014 Form 10-Q and incorporated herein by reference.
|
|
|
(3)
|
Filed as Exhibit 10.1 to the Company's Registration Statement on Form S-1 (Registration No. 333-191840) (the "IPO Registration Statement") with the SEC on February 18, 2014 and incorporated herein by reference.
|
|
|
(4)
|
Filed as Exhibit 10.2 to the IPO Registration Statement with the SEC on October 22, 2013 and incorporated herein by reference.
|
|
|
(5)
|
Filed as Exhibit 99.2 to the Company’s Registration Statement on Form S-8 (Registration No. 333-194657) with the SEC on March 18, 2014 and incorporated herein by reference.
|
|
|
(6)
|
Filed as Exhibit 10.1 to the Company’s Quarterly Report on Form 10-Q filed with the SEC on August 6, 2014 (the “Company’s Third Quarter 2014 Form 10-Q”) and incorporated herein by reference.
|
|
|
(7)
|
Filed as Exhibit A of the Proxy Statement on Form DEF 14A with the SEC on March 26, 2015 and incorporated herein by reference.
|
|
|
(8)
|
Filed as Exhibit 10.8 to the IPO Registration Statement with the SEC on February 18, 2014 and incorporated herein by reference.
|
|
|
(9)
|
Filed as Exhibit 10.1 to the Company’s Current Report on Form 8-K filed with the SEC on August 31, 2018 and incorporated herein by reference.
|
|
|
(10)
|
Filed as Exhibit 10.1 to the Company’s Current Report on Form 8-K filed with the SEC on February 13, 2017 and incorporated herein by reference.
|
|
|
(11)
|
Filed as Exhibit 10.1 to the Company’s Current Report on Form 8-K filed with the SEC on February 12, 2018 and incorporated herein by reference.
|
|
|
(12)
|
Filed as Exhibit 10.2 to the Company’s Current Report on Form 8-K filed with the SEC on August 31, 2018 and incorporated herein by reference.
|
|
|
(13)
|
Filed as Exhibit 10.11 to the IPO Registration Statement with the SEC on February 18, 2014 and incorporated herein by reference.
|
|
|
(14)
|
Filed as Exhibit 10.3 to the Company’s Current Report on Form 8-K filed with the SEC on August 31, 2018 and incorporated herein by reference.
|
|
|
(15)
|
Filed as Exhibit 10.11 to the IPO Registration Statement with the SEC on October 22, 2013 and incorporated herein by reference.
|
|
|
(16)
|
Filed as Exhibit 10.2 to the Company’s Third Quarter 2014 Form 10-Q and incorporated herein by reference.
|
|
|
(17)
|
Filed as Exhibit 10.12 to the IPO Registration Statement with the SEC on October 22, 2013 and incorporated herein by reference.
|
|
|
(18)
|
Filed as Exhibit 10.13 to the IPO Registration Statement with the SEC on October 22, 2013 and incorporated herein by reference.
|
|
|
Item 16.
|
Form 10-K Summary
|
None.
94
SIGNATURES
Pursuant to the requirements of Section 13 or 15(d) of the Securities Exchange Act of 1934, the registrant has duly caused this report to be signed on its behalf by the undersigned thereunto duly authorized.
|
|
|
|
|
|
|
|
VARONIS SYSTEMS, INC.
|
|
|
|
|
|
|
|
February 12, 2019
|
|
By:
|
/s/ Yakov Faitelson
|
|
|
|
|
Yakov Faitelson
|
|
|
|
|
Chief Executive Officer and President
|
|
|
|
|
|
|
February 12, 2019
|
|
By:
|
/s/ Guy Melamed
|
|
|
|
|
Guy Melamed
|
|
|
|
|
Chief Financial Officer and Chief Operating Officer (Principal Financial Officer and Principal Accounting Officer)
|
POWER OF ATTORNEY
Each person whose signature appears below constitutes and appoints Yakov Faitelson and Guy Melamed, and each of them, his true and lawful attorneys-in-fact and agents, each with full power of substitution and resubstitution, severally, for him and in his name, place and stead, in any and all capacities, to sign any and all amendments (including post-effective amendments) to this Annual Report on Form 10-K, and to file the same, with all exhibits thereto and other documents in connection therewith, with the Securities and Exchange Commission, granting unto said attorneys-in-fact and agents, and each of them, full power and authority to do and perform each and every act and thing requisite and necessary to be done in and about the premises, as fully to all intents and purposes as he might or could do in person, hereby ratifying and confirming all that said attorneys-in-fact and agents, or any of them or their or his substitute or substitutes, may lawfully do or cause to be done by virtue hereof.
Pursuant to the requirements of the Securities Act, this report has been signed below by the following persons in the capacities and on the dates indicated below.
|
Signature
|
|
Title
|
|
Date
|
|
|
|
|
|
|
|
/s/ Yakov Faitelson
|
|
Chief Executive Officer, President
|
|
February 12, 2019
|
|
Yakov Faitelson
|
|
and Chairman of the Board
(Principal Executive Officer)
|
|
|
|
|
|
|
|
|
|
/s/ Guy Melamed
|
|
Chief Financial Officer and Chief Operating Officer
|
|
February 12, 2019
|
|
Guy Melamed
|
|
(Principal Financial Officer and Principal Accounting Officer)
|
|
|
|
|
|
|
|
|
|
/s/ Kevin Comolli
|
|
Director
|
|
February 12, 2019
|
|
Kevin Comolli
|
|
|
|
|
|
|
|
|
|
|
|
/s/ John J. Gavin, Jr.
|
|
Director
|
|
February 12, 2019
|
|
John J. Gavin, Jr.
|
|
|
|
|
|
|
|
|
|
|
|
/s/ Gili Iohan
|
|
Director
|
|
February 12, 2019
|
|
Gili Iohan
|
|
|
|
|
|
|
|
|
|
|
|
/s/ Ohad Korkus
|
|
Director
|
|
February 12, 2019
|
|
Ohad Korkus
|
|
|
|
|
|
/s/ Thomas F. Mendoza
|
|
Director
|
|
February 12, 2019
|
|
Thomas F. Mendoza
|
|
|
|
|
|
|
|
|
|
|
|
/s/ Ofer Segev
|
|
Director
|
|
February 12, 2019
|
|
Ofer Segev
|
|
|
|
|
|
|
|
|
|
|
|
/s/ Rona Segev-Gal
|
|
Director
|
|
February 12, 2019
|
|
Rona Segev-Gal
|
|
|
|
|
|
|
|
|
|
|
|
/s/ Fred Van Den Bosch
|
|
Director
|
|
February 12, 2019
|
|
Fred Van Den Bosch
|
|
|
|
|
EXHIBIT INDEX
|
Exhibit
Number
|
Description of the Document
|
|
|
|
|
3.1(1)
|
|
|
|
|
|
3.2(2)
|
|
|
|
|
|
10.1(3)†
|
|
|
|
|
|
10.2(4)†
|
|
|
|
|
|
10.3(5)†
|
|
|
|
|
|
10.4(6)†
|
|
|
|
|
|
10.5(7)†
|
|
|
|
|
|
10.6(8)†
|
|
|
|
|
|
10.7(9)†
|
|
|
10.8(10)†
|
|
|
|
|
|
10.9(11)†
|
|
|
|
|
|
10.10(12)†
|
|
|
10.11(13)†
|
|
|
|
|
|
10.12(14)†
|
|
|
10.13†
|
|
|
10.14†
|
|
|
10.15(15)
|
|
|
|
|
|
10.16(16)
|
|
|
|
|
|
10.17(17)*
|
|
|
|
|
|
10.18(18)*
|
|
|
|
|
|
21.1
|
|
|
|
|
|
23.1
|
|
|
|
|
|
31.1
|
|
|
|
|
|
31.2
|
|
|
|
|
|
32.1**
|
|
|
|
|
|
32.2**
|
|
|
|
|
|
101
|
The following materials from the Company’s Annual Report on Form 10-K for the year ended December 31, 2018, formatted in XBRL (eXtensible Business Reporting Language): (i) the Consolidated Balance Sheets, (ii) the Consolidated Statements of Operations, (iii) the Consolidated Statements of Comprehensive Loss, (iv) the Consolidated Statements of Cash Flows and (v) related notes to these consolidated financial statements, tagged as blocks of text and in detail
|
____________________________________
|
†
|
Indicates management contract or compensatory plan or arrangement.
|
|
|
*
|
Confidential treatment for portions of this exhibit has been granted by the Securities and Exchange Commission.
|
|
|
**
|
Document has been furnished, is not deemed filed and is not to be incorporated by reference into any of the Company’s filings under the Securities Act of 1933, as amended, or the Securities Exchange Act of 1934, as amended, irrespective of any general incorporation language contained in any such filing.
|
|
|
(1)
|
Filed as Exhibit 3.1 to the Company’s Quarterly Report on Form 10-Q filed with the SEC on May 8, 2014 (the “Company’s First Quarter 2014 Form 10-Q”) and incorporated herein by reference.
|
|
|
(2)
|
Filed as Exhibit 3.2 to the Company’s First Quarter 2014 Form 10-Q and incorporated herein by reference.
|
|
|
(3)
|
Filed as Exhibit 10.1 to the Company's Registration Statement on Form S-1 (Registration No. 333-191840) (the "IPO Registration Statement") with the SEC on February 18, 2014 and incorporated herein by reference.
|
|
|
(4)
|
Filed as Exhibit 10.2 to the IPO Registration Statement with the SEC on October 22, 2013 and incorporated herein by reference.
|
|
|
(5)
|
Filed as Exhibit 99.2 to the Company’s Registration Statement on Form S-8 (Registration No. 333-194657) with the SEC on March 18, 2014 and incorporated herein by reference.
|
|
|
(6)
|
Filed as Exhibit 10.1 to the Company’s Quarterly Report on Form 10-Q filed with the SEC on August 6, 2014 (the “Company’s Third Quarter 2014 Form 10-Q”) and incorporated herein by reference.
|
|
|
(7)
|
Filed as Exhibit A of the Proxy Statement on Form DEF 14A with the SEC on March 26, 2015 and incorporated herein by reference.
|
|
|
(8)
|
Filed as Exhibit 10.8 to the IPO Registration Statement with the SEC on February 18, 2014 and incorporated herein by reference.
|
|
|
(9)
|
Filed as Exhibit 10.1 to the Company’s Current Report on Form 8-K filed with the SEC on August 31, 2018 and incorporated herein by reference.
|
|
|
(10)
|
Filed as Exhibit 10.1 to the Company’s Current Report on Form 8-K filed with the SEC on February 13, 2017 and incorporated herein by reference.
|
|
|
(11)
|
Filed as Exhibit 10.1 to the Company’s Current Report on Form 8-K filed with the SEC on February 12, 2018 and incorporated herein by reference.
|
|
|
(12)
|
Filed as Exhibit 10.2 to the Company’s Current Report on Form 8-K filed with the SEC on August 31, 2018 and incorporated herein by reference.
|
|
|
(13)
|
Filed as Exhibit 10.11 to the IPO Registration Statement with the SEC on February 18, 2014 and incorporated herein by reference.
|
|
|
(14)
|
Filed as Exhibit 10.3 to the Company’s Current Report on Form 8-K filed with the SEC on August 31, 2018 and incorporated herein by reference.
|
|
|
(15)
|
Filed as Exhibit 10.11 to the IPO Registration Statement with the SEC on October 22, 2013 and incorporated herein by reference.
|
|
|
(16)
|
Filed as Exhibit 10.2 to the Company’s Third Quarter 2014 Form 10-Q and incorporated herein by reference.
|
|
|
(17)
|
Filed as Exhibit 10.12 to the IPO Registration Statement with the SEC on October 22, 2013 and incorporated herein by reference.
|
|
|
(18)
|
Filed as Exhibit 10.13 to the IPO Registration Statement with the SEC on October 22, 2013 and incorporated herein by reference.
|
|
TABLE OF CONTENTS
Part IItem 1. BusinessItem 1A. Risk FactorsItem 1B. Unresolved Staff CommentsItem 2. PropertiesItem 3. Legal ProceedingsItem 4. Mine Safety DisclosuresPart IIItem 5. Market For Registrant S Common Equity, Related Stockholder Matters and Issuer Purchases Of Equity SecuritiesItem 6. Selected Financial DataItem 7. Management S Discussion and Analysis Of Financial Condition and Results Of OperationsItem 7A. Quantitative and Qualitative Disclosures About Market RiskItem 8. Financial Statements and Supplementary DataNote 1:- GeneralNote 2:- Significant Accounting PoliciesNote 3:- Prepaid Expenses and Other Current AssetsNote 4:- Property and Equipment, NetNote 5:- Accrued Expenses and Other Short Term LiabilitiesNote 6:- Commitments and Contingent LiabilitiesNote 7:- Fair Value MeasurementsNote 8:- Stockholders EquityNote 9:- Income TaxesNote 10:- Financial Expenses, NetNote 11:- Geographic Information and Major Customer and Product DataItem 9. Changes in and Disagreements with Accountants on Accounting and Financial DisclosureItem 9A. Controls and ProceduresItem 9B. Other InformationPart IIIItem 10. Directors, Executive Officers and Corporate GovernanceItem 11. Executive CompensationItem 12. Security Ownership Of Certain Beneficial Owners and Management and Related Stockholder MattersItem 13. Certain Relationships and Related Transactions, and Director IndependenceItem 14. Principal Accounting Fees and ServicesPart IVItem 15. Exhibits and Financial Statement SchedulesItem 16. Form 10-k Summary