VERTEX PHARMACEUTICALS INC / MA
10-Ks and 10-Qs
|
|
|
|
|
|
|
|
|
|
|
|
|
|
|
|
|
|
|
|
|
|
|
|
|
|
|
|
|
|
|
|
|
|
|
|
|
|
|
|
|
|
|
|
|
|
|
|
|
|
|
|
|
|
|
|
|
|
|
UNITED STATES
SECURITIES AND EXCHANGE COMMISSION
WASHINGTON, D.C. 20549
________________________________________________________
FORM 10-K
|
x
|
ANNUAL REPORT PURSUANT TO SECTION 13 OR 15(d) OF THE SECURITIES EXCHANGE ACT OF 1934
|
|
For the Fiscal Year Ended December 31, 2012
|
|
|
or
|
|
|
o
|
TRANSITION REPORT PURSUANT TO SECTION 13 OR 15(d) OF THE SECURITIES EXCHANGE ACT OF 1934
|
|
For the transition period from
to
|
|
Commission file number 000-19319
____________________________________________
Vertex Pharmaceuticals Incorporated
(Exact name of registrant as specified in its charter)
|
Massachusetts
|
04-3039129
|
|
(State or other jurisdiction of
incorporation or organization) |
(I.R.S. Employer
Identification No.) |
|
130 Waverly Street, Cambridge, Massachusetts
|
02139-4242
|
|
(Address of principal executive offices)
|
(Zip Code)
|
Registrant’s telephone number, including area code
(617) 341-6100
____________________________________________
Securities registered pursuant to Section 12(b) of the Exchange Act:
|
Title of Each Class
|
Name of Each Exchange on Which Registered
|
|||
|
Common Stock, $0.01 Par Value Per Share
|
The NASDAQ Global Select Market
|
|||
Securities registered pursuant to Section 12(g) of the Exchange Act: None
______________________________________________
Indicate by check mark if the registrant is a well-known seasoned issuer, as defined in Rule 405 of the Securities Act. Yes
x
No
o
Indicate by check mark if the registrant is not required to file reports pursuant to Section 13 or Section 15(d) of the Exchange Act. Yes
o
No
x
Indicate by check mark whether the registrant: (1) has filed all reports required to be filed by Section 13 or 15(d) of the Securities Exchange Act of 1934 during the preceding 12 months (or for such shorter period that the registrant was required to file such reports), and (2) has been subject to such filing requirements for the past 90 days. Yes
x
No
o
Indicate by check mark whether the registrant has submitted electronically and posted on its corporate Web site, if any, every Interactive Data File required to be submitted and posted pursuant to Rule 405 of Regulation S-T during the preceding 12 months (or for such shorter period that the registrant was required to submit and post such files). Yes
x
No
o
Indicate by check mark if disclosure of delinquent filers pursuant to Item 405 of Regulation S-K is not contained herein, and will not be contained, to the best of the registrant’s knowledge, in definitive proxy or information statements incorporated by reference in Part III of this Form 10-K or any amendment to this Form 10 K.
o
Indicate by check mark whether the registrant is a large accelerated filer, an accelerated filer, a non-accelerated filer or a smaller reporting company. See definitions of “large accelerated filer,” “accelerated filer” and “smaller reporting company” in Rule 12b-2 of the Exchange Act. (Check one):
|
Large accelerated filer
x
|
Accelerated filer
o
|
Non-accelerated filer
o
|
Smaller reporting company
o
|
|
(Do not check if a smaller reporting company)
|
|||
Indicate by check mark whether the registrant is a shell company (as defined in Rule 12b-2 of the Exchange Act). Yes
o
No
x
The aggregate market value of the registrant’s common stock held by non-affiliates of the registrant (without admitting that any person whose shares are not included in such calculation is an affiliate) based on the last reported sale price of the common stock on June 29, 2012 (the last trading day of the registrant’s second fiscal quarter of 2012) was
$11.9 billion
. As of
February 15, 2013
, the registrant had
218,188,628
shares of common stock outstanding.
DOCUMENTS INCORPORATED BY REFERENCE
Portions of the definitive Proxy Statement for the 2013 Annual Meeting of Shareholders to be held on May 8, 2013 are incorporated by reference into Part III of this Annual Report on Form 10-K.
VERTEX PHARMACEUTICALS INCORPORATED
ANNUAL REPORT ON FORM 10-K
TABLE OF CONTENTS
|
Page
|
||
“We,” “us,” “Vertex” and the “Company” as used in this Annual Report on Form 10-K refer to Vertex Pharmaceuticals Incorporated, a Massachusetts corporation, and its subsidiaries.
“Vertex,” “INCIVEK
®
” and “KALYDECO™” are registered trademarks of Vertex. Other brands, names and trademarks contained in this Annual Report on Form 10-K, including “INCIVO™” and “TELAVIC™,” are the property of their respective owners.
|
ITEM 1.
|
BUSINESS
|
OVERVIEW
We are in the business of discovering, developing, manufacturing and commercializing small molecule drugs for patients with serious diseases. Over the last two years, we have obtained approval for, and initiated commercial sales of, our first two products: INCIVEK (telaprevir), which we market in the United States and Canada for the treatment of adults with genotype 1 hepatitis C virus, or HCV, infection; and KALYDECO (ivacaftor), which we market in the United States, Canada and Europe for the treatment of patients six years of age and older with cystic fibrosis, or CF, who have a specific genetic mutation that is referred to as the G551D mutation. We receive royalties from sales in Europe and other countries of telaprevir, which is marketed as INCIVO, by our collaborator, Janssen Pharmaceutica, N.V.
We invest in scientific innovation to create transformative medicines for patients with serious diseases, with a focus on specialty markets. Our strategy is to make focused investments to invent and develop innovative drugs, while we continue to market INCIVEK and KALYDECO to eligible patients to generate revenues and maintain a strong financial position. In the near term, we plan to focus most of our drug development investment on the following key programs:
Cystic Fibrosis -
Our goal is to develop treatment regimens that will provide benefits to as many patients with CF as possible and to maximize those benefits. We are conducting three Phase 3 label-expansion clinical trials and a proof-of-concept clinical trial of ivacaftor monotherapy in people with certain mutations in their cystic fibrosis transmembrane conductance regulator, or
CFTR,
gene that were not studied in prior Phase 3 clinical trials. If we are able to establish that these additional patient groups will benefit from ivacaftor monotherapy, there is the potential to increase the number of patients eligible for treatment with ivacaftor monotherapy to more than 10% of patients with CF. In February 2013, we initiated an international pivotal Phase 3 development program to evaluate combinations of ivacaftor and our investigational CF corrector VX-809 (lumacaftor) for patients with the most prevalent genetic mutation that causes CF. We plan to conduct two 24-week Phase 3 clinical trials to support the approval of the combination of VX-809 and ivacaftor in patients 12 years of age and older with CF who have two copies of the F508del mutation in the
CFTR
gene. We expect to obtain final, 24-week safety and efficacy data from both clinical trials in 2014. If these trials are successful, we plan to submit a New Drug Application to the U.S. Food and Drug Administration in 2014 and a Marketing Authorization Application to the European Medicines Agency. We also plan to conduct an 8-week exploratory Phase 2 clinical trial of VX-809 in combination with ivacaftor in patients with CF who are 12 years of age and older and who have one copy of the F508del mutation in the
CFTR
gene and a pharmacokinetics and safety clinical trial to evaluate VX-809 in combination with ivacaftor in children with CF six to eleven years of age who have two copies of the F508del mutation. If successful, we plan to use the data from the pharmacokinetics and safety clinical trial, along with data from the two Phase 3 clinical trials, for registration in the United States in patients six to eleven years of age, following registration in patients 12 years of age and older, and are continuing discussions with European regulatory agencies for patients in this age group.
HCV
- We are investigating all-oral, interferon-free treatment regimens that are 12 weeks or less in duration with a goal of providing a high viral cure rate and improved tolerability, in order to be commercially competitive in the HCV market of the future. We plan to conduct multiple Phase 2 clinical trials to evaluate all-oral combination treatment regimens that include our HCV nucleotide analogue VX-135 together with molecules that have potentially complimentary mechanisms, such as ribavirin, HCV protease inhibitors, HCV NS5A inhibitors and non-nucleoside HCV polymerase inhibitors.
Autoimmune Diseases
- We are evaluating our JAK3 inhibitor, VX-509, in a Phase 2 clinical trial that we expect to enroll approximately 350 patients with rheumatoid arthritis.
We may seek collaborators for some of our drug candidates in order to diversify risk, broaden or accelerate or otherwise benefit a development program in an effort to fully-realize the value of a drug candidate.
We plan to continue investing in our research programs and supporting scientific innovation in order to identify and develop transformative medicines. We believe that pursuing research in diverse areas allows us to balance the risks inherent in drug development and may provide the drug candidates that will form our pipeline in future years. We have later-stage research programs in the areas of cystic fibrosis, Huntington's disease, multiple sclerosis and cancer.
1
OUR PRODUCTS
|
Product
|
Indication
|
Mechanism
|
Markets
|
Marketing Rights
|
|
INCIVEK (telaprevir)
|
HCV Infection (genotype 1)
|
HCV Protease Inhibitor
|
United States and Canada
|
Vertex
|
|
KALYDECO (ivacaftor)
|
CF (G551D mutation)
|
CFTR Potentiator
|
United States, Canada and Europe
|
Vertex
|
|
INCIVO (telaprevir)
|
HCV Infection (genotype 1)
|
HCV Protease Inhibitor
|
Europe and other countries in Janssen's territories
|
Janssen
|
|
TELAVIC (telaprevir)
|
HCV Infection (genotype 1)
|
HCV Protease Inhibitor
|
Japan
|
Mitsubishi Tanabe
|
INCIVEK (telaprevir) is an orally-administered HCV protease inhibitor for adults with genotype 1 HCV infection that is prescribed in combination with pegylated-interferon, or peg-IFN, and ribavirin, or RBV. INCIVEK was approved by the U.S. Food and Drug Administration, or FDA, in the second quarter of 2011 and by Health Canada in the third quarter of 2011. In the third quarter of 2011, our collaborators, Janssen Pharmaceutica, N.V., referred to collectively with its affiliates as Janssen, and Mitsubishi Tanabe Pharma Corporation, or Mitsubishi Tanabe, obtained marketing approval for telaprevir from the European Commission and the Japanese Ministry of Health, Labor and Welfare, respectively. Janssen markets telaprevir under the brand name INCIVO in Europe and other countries in its territories, and Mitsubishi Tanabe markets telaprevir under the brand name TELAVIC in Japan. INCIVEK achieved rapid acceptance for the treatment of patients with genotype 1 HCV infection in the United States and was the principle driver of the increase of our total revenues from $143.4 million in 2010 to $1.5 billion in 2012. However, competitive treatment regimens are being developed in late-stage clinical trials for which there have been reported improved viral cure rates and/or tolerability over currently-available regimens, and, as the market has anticipated the approval of these newer regimens, INCIVEK revenues have been declining since reaching a peak in the fourth quarter of 2011. We expect that INCIVEK revenues will continue to decline, and that, as a consequence, our total revenues will decline in 2013 as compared to 2012.
KALYDECO (ivacaftor) is an orally-administered CFTR potentiator that is approved in the United States, Canada and the European Union for the treatment of patients six years of age and older with CF who have at least one copy of the G551D mutation in the
CFTR
gene. KALYDECO was approved by the FDA in the first quarter of 2012, by the European Commission in the third quarter of 2012 and by Health Canada in the fourth quarter of 2012. We use the brand name KALYDECO only when we refer to the product that has been approved and with respect to the indication(s) on the approved label. Otherwise, we refer to the compound by its scientific (or generic) name ivacaftor, including in discussions of our CF development programs. KALYDECO achieved rapid acceptance in the United States after it was approved, and we expect that our revenues from KALYDECO sales will increase as the product is approved and reimbursed in additional countries in the future.
OUR DRUG CANDIDATES
|
Drug Candidate
|
Mechanism
|
Development
Stage |
|
Cystic Fibrosis
|
||
|
ivacaftor (monotherapy - label expansion trials)
|
CFTR potentiator
|
Phase 3
|
|
VX-809 (in combination with ivacaftor)
|
CFTR corrector
|
Phase 3
|
|
VX-661 (in combination with ivacaftor)
|
CFTR corrector
|
Phase 2
|
|
HCV Infection
|
||
|
VX-135 (ALS-2200)
|
HCV nucleotide analogue
|
Phase 2
|
|
VX-222
|
Non-nucleoside HCV polymerase inhibitor
|
Phase 2
|
|
Autoimmune Diseases
|
||
|
VX-509
|
JAK3 inhibitor
|
Phase 2
|
|
Influenza
|
||
|
VX-787
|
Influenza virus inhibitor
|
Phase 2
|
2
CYSTIC FIBROSIS
Background
Cystic fibrosis is a rare, life-threatening genetic disease affecting approximately 70,000 people worldwide, including approximately 30,000 people in the United States and approximately 35,000 people in Europe. CF is caused by a defective or missing CFTR protein resulting from mutations in the
CFTR
gene. Children must inherit two defective
CFTR
genes, which are referred to as alleles - one from each parent - to have CF. There are more than 1,800 known mutations in the
CFTR
gene, including two of the most prevalent mutations, the G551D mutation and the F508del mutation.
The G551D mutation results in a “gating” defect in which the defective CFTR protein reaches the cell surface but does not efficiently transport chloride ions across the cell membrane. The F508del mutation results in a “trafficking” defect, in which the CFTR protein does not reach the cell surface in sufficient quantities. The absence of working CFTR proteins results in poor flow of salt and water into and out of cells in a number of organs, including the lungs. As a result, thick, sticky mucus builds up and blocks the passages in many organs, leading to a variety of symptoms. In particular, mucus builds up and clogs the airways in the lungs, causing chronic lung infections and progressive lung damage. CFTR correctors, such as VX-809 and VX-661, are believed to help CFTR protein reach the cell surface. Ivacaftor, known as a CFTR potentiator, keeps the CFTR protein channels on the cell surface open longer to increase the flow of salt and water into and out of the cell.
Based on the 2011 Cystic Fibrosis Foundation Patient Registry Annual Data Report, we estimate that in the United States:
|
Mutation in
CFTR
Gene
|
Approximate Percentage of Patients with CF in the U.S.
|
|
G551D mutation on at least one allele
|
4%
|
|
non-G551D gating mutation on at least one allele
|
1%
|
|
R117H mutation on at least one allele
|
3%
|
|
F508del mutation on both alleles (homozygous)
|
47%
|
|
F508del mutation on one allele but not both alleles (heterozygous)
|
40%
|
We believe that in Europe there are approximately 900-1,000 patients with CF who have the G551D mutation on at least one allele and that more than 40% of patients with CF in Europe have the F508del mutation on both alleles.
We chose to develop KALYDECO (ivacaftor) and our other CF drug candidates because of their potential to improve the function of defective CFTR proteins in patients with CF. We discovered ivacaftor, VX-809 and VX-661 in our research collaboration with the Cystic Fibrosis Foundation Therapeutics Incorporated, or CFFT. Pursuant to our collaboration with CFFT, our research group is continuing to work to identify additional corrector compounds that could be included in future dual- and/or triple-combination treatment regimens that have the potential to provide additional benefits to patients with CF. We hold worldwide development and commercialization rights to ivacaftor, VX-809 and VX-661. We pay royalties to CFFT on net sales of ivacaftor and will pay royalties to CFFT on any net sales of VX-809 and VX-661, if they are approved.
KALYDECO (ivacaftor)
KALYDECO (ivacaftor) is an orally-administered CFTR potentiator approved in the United States, the European Union and Canada for the treatment of patients six years of age and older with CF who have the G551D mutation on at least one allele. We also have submitted an application for approval of ivacaftor in Australia. KALYDECO has received recognition as a significant innovation in drug development. In the press release announcing KALYDECO's approval, the FDA identified KALYDECO as an excellent example of the promise of personalized medicine and a breakthrough therapy for the CF community, because other existing therapies treat only the symptoms of this genetic disease, while KALYDECO addresses the underlying cause. The Wall Street Journal named KALYDECO as the winner of its 2012 Technology Innovation award in the Medicine and Biotech category.
During development, ivacaftor was granted orphan drug designation in the United States and European Union and Fast-track designation in the United States and, due to its promise, was advanced rapidly through development. In 2008, we
3
evaluated ivacaftor in a small Phase 2a clinical trial that enrolled 39 patients with CF who had the G551D mutation on at least one allele. Based on the safety and efficacy data from this clinical trial, we moved directly into a Phase 3 clinical program, which we initiated in May 2009 and completed in mid-2011. We filed for approval to market ivacaftor in the United States in November 2011 and obtained approval from the FDA in January 2012, which was more than two months ahead of the original target date that had been established by the FDA. We also obtained rapid approval for ivacaftor in the European Union and Canada later in 2012.
Since KALYDECO's approval in the first quarter of 2012, most eligible patients in the United States have initiated and are receiving treatment with KALYDECO. We are in discussions regarding reimbursement for KALYDECO in multiple international markets. In France and Germany, we began commercial sales of KALYDECO in 2012, but we are continuing to discuss the reimbursement rate we will receive for KALYDECO in future periods. Funding for KALYDECO has been recommended in England and Ireland, and we anticipate that reimbursement in these countries will begin in the second quarter of 2013. In other countries, we must first complete the reimbursement discussions before we commence commercial sales.
CF Drug Development Programs
We are continuing our work in CF to develop treatment regimens that will provide benefits to as many patients with CF as possible and to maximize those benefits. We are seeking to increase the number of patients with CF who could benefit from our medicines both by evaluating ivacaftor monotherapy in patient groups who may benefit from monotherapy but that were not evaluated in our earlier clinical trials, and by evaluating combinations of ivacaftor with our investigational corrector compounds, VX-809 and VX-661, in patients with the most prevalent form of CF, those with the F508del mutation. Our ivacaftor monotherapy development program for additional indications has received a Breakthrough Therapy designation from the FDA. The FDA also has designated the combination regimen of VX-809 with ivacaftor for the treatment of patients with CF who have the F508del mutation on both alleles as a Breakthrough Therapy. Our two programs were the first to receive Breakthrough Therapy designations from the FDA under the 2012 Food and Drug Administration Safety and Innovation Act. See page 22 for a discuss
ion of Breakthrough Therapy designation.
Ivacaftor (monotherapy)
Ivacaftor monotherapy is approved (as KALYDECO) as a treatment for patients six years of age and older with CF who have the G551D mutation on at least one allele, which represents a small percentage of patients with CF. We believe that ivacaftor monotherapy also may be effective as a treatment for patients with CF who have non-G551D gating mutations on at least one allele, patients with CF who have the R117H mutation on at least one allele and patients who have clinical or laboratory evidence of residual CFTR protein function. We also are developing a pediatric formulation of ivacaftor that could be used to treat children two to five years of age. If we are able to establish that these additional patient groups will benefit from ivacaftor monotherapy, there is the potential to increase the number of patients eligible for treatment with ivacaftor monotherapy to more than 10% of patients with CF.
We are conducting three Phase 3 label-expansion clinical trials and a Phase 2 clinical trial of ivacaftor monotherapy:
|
•
|
We have completed enrollment in a Phase 3 clinical trial evaluating ivacaftor in patients six years of age and older with CF with gating mutations other than the G551D mutation.
|
|
•
|
We are continuing enrollment in a Phase 3 clinical trial evaluating ivacaftor in patients six years of age and older with CF with the R117H mutation in the
CFTR
gene on at least one allele.
|
|
•
|
We have begun dosing patients in a Phase 3 clinical trial in which we are evaluating a pediatric formulation of ivacaftor as a treatment for children two to five years of age with gating mutations in the
CFTR
gene, including the G551D mutation.
|
|
•
|
We are enrolling patients in a Phase 2 clinical trial in which we are evaluating ivacaftor in patients with CF who have clinical evidence of residual CFTR function.
|
We expect to obtain data from the Phase 3 clinical trials evaluating patients six years of age and older in 2013. We are discussing with the FDA how the Breakthrough Therapy designation may affect the timing and content of regulatory submissions in the United States to support expansion of the ivacaftor label.
4
VX-809 in Combination with Ivacaftor
In February 2013, we initiated an international pivotal Phase 3 clinical program to evaluate combinations of VX-809 and ivacaftor in patients with CF who are homozygous (a copy on both genes) with the F508del mutation in their
CFTR
gene. We plan to conduct two 24-week Phase 3 clinical trials designed to support approval of the combination of VX-809 and ivacaftor for patients with CF 12 years of age and older. We expect to obtain final 24-week safety and efficacy data from both of these Phase 3 clinical trials in 2014. If these trials are successful, we plan to submit a New Drug Application, or NDA, to the FDA in 2014 and a Marketing Authorization Application to the European Medicines Agency.
The two 24-week, randomized, double-blind, placebo-controlled Phase 3 clinical trials are known as TRAFFIC and TRANSPORT. Each Phase 3 clinical trial will enroll approximately 500 patients with CF who are homozygous for the F508del mutation, for a total of approximately 1,000 patients. The two clinical trials have the same design and together will be conducted at approximately 200 clinical trial sites in North America, Europe and Australia. Each clinical trial will include two 24-week combination treatment arms and one 24-week placebo arm. The treatment arms will evaluate two treatment regimens of VX-809 (600mg once-daily (QD) and 400mg every twelve hours (q12h)) in combination with ivacaftor (250mg every twelve hours (q12h)). Fixed-dose tablets that contain both VX-809 and ivacaftor or placebo will be used in both clinical trials. The initial 24-week treatment period will be followed with a separate rollover double-blind extension clinical trial where all eligible patients, including those who received placebo, will receive one of the combination treatment regimens for up to an additional 96 weeks.
The primary endpoint of each Phase 3 clinical trial is relative improvement in lung function (percent predicted FEV
1
) through 24 weeks of treatment compared to placebo. Safety and tolerability also will be assessed through 24 weeks. Key secondary endpoints include absolute improvement in FEV
1
, change in body mass index (BMI) or weight gain, number of pulmonary exacerbations, and improvements in patient-reported outcomes as measured by the CF Questionnaire Revised (CFQ-R), among others.
We also plan to conduct a clinical trial of VX-809 in combination with ivacaftor in patients with CF six to eleven years of age who are homozygous for the F508del mutation. This clinical trial will evaluate the pharmacokinetics and safety of VX-809 in combination with ivacaftor for up to 24 weeks. If successful, we plan to use the data from this clinical trial, along with data from the two Phase 3 clinical trials, for registration in the United States in patients six to eleven years of age, following registration in patients 12 years of age and older, and are continuing discussions with European regulatory agencies for patients in this age group.
The design of the Phase 3 clinical program was supported by data from a Phase 2 clinical trial of VX-809 in combination with ivacaftor. The two combination dosing regimens we selected for evaluation in Phase 3 clinical trials were evaluated in separate parts of this Phase 2 clinical trial referred to as Cohort 2 and Cohort 3.
|
•
|
Cohort 2 -
We evaluated the 600mg once-daily (QD) dose of VX-809 in combination with ivacaftor (250mg q12h) in Cohort 2 in 21 patients with CF who are homozygous for the F508del mutation. This regimen resulted in statistically significant improvements in lung function (within group and versus placebo) during the combination dosing period, as set forth in the following table:
|
|
Mean Absolute and Relative Changes in Percent Predicted FEV
1
|
||||
|
Day 0 - 28; VX-809 Alone
|
Day 28 - 56; VX-809 + ivacaftor
|
Day 0 - 56
|
||
|
VX-809 (600mg QD) + ivacaftor (250mg q12h)
|
Within Group
|
|||
|
Absolute
|
-2.9 (p=0.07)
|
+6.1 (p<0.001)
|
+3.4 (p=0.03)
|
|
|
Relative
|
-3.5 (p=0.13)
|
+9.7 (p<0.001)
|
+5.3 (p=0.02)
|
|
|
Versus Placebo
|
||||
|
Absolute
|
-2.0 (p=0.36)
|
+8.6 (p <0.001)
|
+6.7 (p=0.002)
|
|
|
Relative
|
-3.9 (p=0.21)
|
+12.8 (p<0.001)
|
+9.2 (p=0.004)
|
|
The result of statistical testing is often defined in terms of a "p-value," with p<0.05 generally considered to represent a statistically significant difference.
5
|
•
|
Cohort 3 -
Cohort 3 was designed to evaluate the safety and pharmacokinetics of the 400mg (q12h) dose of VX-809 to support inclusion of this dose in the Phase 3 development program. We evaluated the 400mg (q12h) dose of VX-809 in combination with ivacaftor in Cohort 3 in 11 patients with CF who are homozygous for the F508del mutation. Cohort 3 also included the randomization of four patients to placebo to allow for a blinded safety assessment. Three patients completed treatment in the placebo group. A pharmacokinetic model suggested that 400mg dosing every 12 hours (q12h) of VX-809 would provide a higher total exposure area under the curve, or AUC, compared to 600mg once-daily (QD) dosing, and data from Cohort 3 were consistent with this model.
|
Safety results from the 400mg (q12h) dose group were similar to that of the 600mg (QD) dose group. In both dose groups, VX-809 was generally well-tolerated alone and in combination with ivacaftor. The most common adverse events in both groups were respiratory in nature. In Cohort 3, one patient in the treatment group discontinued treatment because of a pulmonary adverse event.
Together, these pharmacokinetic and safety data support inclusion of VX-809 400mg (q12h) in combination with ivacaftor 250mg (q12h) in the Phase 3 program to evaluate the effect of higher exposures of VX-809 on efficacy and safety.
The pattern of lung function response observed in Cohort 3 was similar to that observed in the 600mg (QD) dose group in Cohort 2, with a decline in FEV
1
during the VX-809 monotherapy dosing period followed by a statistically significant increase in FEV
1
during the VX-809 and ivacaftor combination dosing period. The within-group mean absolute improvement in FEV
1
observed during the combination-dosing period in Cohort 3 was 6.6 percentage points, compared to 6.1 percentage points for the 600mg (QD) dose group in Cohort 2. Additional lung function results for Cohort 3 are provided below:
|
Mean Absolute and Relative Changes in Percent Predicted FEV
1
|
||||
|
Day 0 - 28; VX-809 Alone
|
Day 28 - 56; VX-809 + ivacaftor
|
Day 0 - 56
|
||
|
VX-809 (400mg q12h) + ivacaftor (250mg q12h)
|
Within Group
|
|||
|
Absolute
|
-4.3 (p=0.04)
|
+6.6 (p=0.01)
|
+1.9 (p=0.57)
|
|
|
Relative
|
-6.3 (p=0.08)
|
+8.8 (p=0.01)
|
+2.5 (p=0.67)
|
|
In addition to the clinical trials in patients with CF who are homozygous for the F508del mutation, we plan to conduct an 8-week exploratory Phase 2 clinical trial of VX-809 in combination with ivacaftor in patients with CF who are 12 years of age and older and who are heterozygous with a copy of the F508del mutation on one allele and a copy of a second mutation on the other allele that is not expected to respond to either ivacaftor or VX-809 alone. This clinical trial is designed to provide additional safety and lung function data on the combination in heterozygous patients and will evaluate the combination of VX-809 (400mg (q12h)) and ivacaftor (250mg (q12h)).
VX-661
We also are conducting a Phase 2 clinical trial of VX-661, a second CFTR corrector compound. In this clinical trial, we are evaluating VX-661 as both a monotherapy and in combination with ivacaftor in patients with CF who are homozygous for the F508del mutation. The first part of this clinical trial enrolled approximately 120 patients, and we expect to receive data from this clinical trial in the first half of 2013.
HCV INFECTION
Background
The Centers for Disease Control and Prevention, or CDC, have estimated that approximately 2.7 million to 3.9 million people in the United States are chronically infected with HCV. The World Health Organization, or WHO, has estimated that about 170 million people are chronically infected with HCV worldwide. Although exposure to HCV often leads to chronic infection, patients frequently do not have symptoms and are unaware that they have become infected with HCV. Over time, many patients develop liver inflammation. This inflammation can progress to scarring of the liver, called fibrosis, or more advanced scarring of the liver, called cirrhosis. Patients with cirrhosis may go on to develop liver failure or other
6
complications, including liver cancer. WHO estimates that HCV infection is responsible for more than 50% of all liver cancer cases and two-thirds of all liver transplants in the developed world.
Genotype 1 HCV infection is the most prevalent form of HCV infection in the United States and the most difficult to treat. There are many other less prevalent HCV infection genotypes, some of which are easier to treat, and each of which tend to respond differently to treatment. Patients who are successfully treated maintain undetectable HCV RNA levels after treatment has been completed, which is referred to as a sustained viral response, or SVR.
The number and type of treatments for HCV infection has and likely will continue to change rapidly. Prior to 2011, patients with genotype 1 HCV infection were treated with a combination of peg-IFN and RBV for 48 weeks. In May 2011, INCIVEK and another HCV protease inhibitor, Merck's VICTRELIS™ (boceprevir), were approved for administration in combination with peg-IFN and RBV. These treatment regimens incorporating HCV protease inhibitors offer substantially increased sustained viral response rates, and in many cases shorter treatment durations, for patients with genotype 1 HCV infection, compared to peg-IFN and RBV alone.
Since INCIVEK's approval in 2011, many companies, including us, have continued to pursue the development of treatment regimens for HCV infection that could potentially offer improved safety, efficacy and/or tolerability, including shorter duration therapies, therapies that do not require the administration of peg-IFN, and therapies that do not cause side effects seen with the currently approved HCV protease inhibitors. Many companies are investigating combination regimens that incorporate one or more of an HCV protease inhibitor, an HCV nucleotide analogue, an HCV non-nucleotide polymerase inhibitor or an NS5A inhibitor, each of which inhibit HCV viral replication through different mechanisms of action. Clinical trials of these investigational combination regimens are being conducted in a wide variety of patient populations, including treatment-naïve and treatment-failure patients, and across all HCV genotypes, which respond differently to different combinations of molecules employing different mechanisms.
In 2012, several companies advanced clinical development programs and released clinical data for potentially competitive treatment regimens. During this period, decreasing numbers of patients with genotype 1 HCV infection started treatment with available treatment options. We believe these decreases are the result of a combination of factors, including new safety and efficacy data that have been reported by our competitors regarding treatment regimens for HCV infection that may become commercially available over the next several years.
We believe that the next drugs that will become commercially available to treat genotype 1 HCV infection will first be approved as part of a treatment regimen that includes peg-IFN and RBV, and that it is likely that one or more of the drug candidates being developed by our competitors will be approved in late 2013 or 2014. All-oral treatment regimens that do not include peg-IFN also are in late-stage development, and it is possible that one or more of these treatment regimens will be approved as soon as late 2014. If one or more treatment regimens with a safety or efficacy profile better than or similar to our INCIVEK-based treatment regimen is approved, we expect that INCIVEK would lose a significant portion of its share of the genotype 1 HCV infection treatment market.
INCIVEK
INCIVEK (telaprevir) is an orally-administered HCV protease inhibitor that is indicated for the treatment of treatment-naïve and treatment-failure adults with genotype 1 HCV infection. Patients who are prescribed an INCIVEK-based treatment regimen receive INCIVEK, peg-IFN, a drug that is administered by weekly injection, and RBV for 12 weeks. After the first 12 weeks, patients stop receiving INCIVEK and continue treatment with peg-IFN and RBV alone for an additional 12 weeks or 36 weeks of treatment. INCIVEK is indicated for three-times-daily dosing, and we recently submitted a supplemental New Drug Application, or sNDA, to the FDA and a supplemental New Drug Submission, or sNDS, to Health Canada for twice-daily dosing. We are conducting Phase 3b clinical trials to evaluate telaprevir-based combination treatment regimens for patients with genotype 1 HCV infection who also have HIV infection and for patients who experience recurrent genotype 1 HCV infection following a liver transplant. Telaprevir was discovered in our collaboration, now ended, with Eli Lilly and Company, and we pay Eli Lilly and Company royalties on net sales of telaprevir.
7
HCV Drug Development Programs
Our goal is to improve treatment options available to patients with HCV infection by developing all-oral, interferon-free treatment regimens for HCV infection. The following table summarizes the treatment regimens for HCV infection that we are planning to evaluate:
|
Drug Candidate
|
Mechanism(s)
|
|
VX-135 (ALS-2200)
|
|
|
VX-135 in combination with RBV
|
HCV Nucleotide Analogue/RBV
|
|
VX-135 in combination with TMC435
|
HCV Nucleotide Analogue/HCV Protease Inhibitor
|
|
VX-135 in combination with GSK2336805
|
HCV Nucleotide Analogue/HCV NS5A Inhibitor
|
|
VX-135 in combination with VX-222
|
HCV Nucleotide Analogue/HCV Polymerase Inhibitor
|
|
VX-222
|
|
|
VX-222 in combination with telaprevir and RBV
|
HCV Polymerase Inhibitor/HCV Protease Inhibitor/RBV
|
VX-135, an HCV nucleotide analogue, is designed to inhibit the replication of HCV by inhibiting the HCV NS5B polymerase enzyme through mechanisms of action distinct from non-nucleoside HCV polymerase inhibitors such as VX-222. In July 2012, we announced positive results from a Phase 1 clinical trial that evaluated the safety and tolerability of single ascending doses of ALS-2200 (now formulated as VX-135) in healthy volunteers and the safety, tolerability and effects on viral kinetics of multiple ascending doses of ALS-2200 in treatment-naïve patients with genotype 1 HCV infection. In this clinical trial, patients with HCV infection who were dosed with ALS-2200 experienced a dose-dependent, consistent and rapid decline in plasma HCV RNA levels. In the treatment group in which patients received seven days of dosing with 200mg of ALS-2200 once daily, there was a median 4.54 log
10
reduction in HCV RNA levels at the end of the dosing period. In the treatment group in which patients received seven days of dosing with 200mg of ALS-2200 once daily in combination with RBV, there was a median 4.18 log
10
reduction in HCV RNA levels at the end of the dosing period. In this clinical trial, ALS-2200 was well-tolerated. There were no serious adverse events observed in patients dosed with ALS-2200 and no patients discontinued treatment due to adverse events.
VX-222, a non-nucleoside HCV polymerase inhibitor, is designed to inhibit the replication of HCV by inhibiting the HCV NS5B polymerase. VX-222 has been evaluated in a Phase 2 clinical trial in combination with telaprevir and RBV in treatment-naïve patients with genotype 1 HCV infection.
We are planning to evaluate multiple all-oral treatment regimens for patients with genotype 1 HCV infection in order to determine which regimen or regimens appear likely to provide benefits to patients and to take forward into Phase 3 clinical development. The clinical trials are:
|
•
|
We are conducting Phase 2 clinical trials to evaluate VX-135 in combination with RBV.
|
|
•
|
In October 2012, we entered into a non-exclusive collaboration with Janssen to conduct a clinical trial to evaluate all-oral combinations of Janssen's investigational once-daily HCV protease inhibitor TMC435 (simeprevir), and VX-135. Janssen recently announced positive results from a Phase 3 clinical trial that evaluated TMC435 in combination with peg-IFN and RBV. We expect that Janssen will conduct a drug-drug interaction trial with VX-135 and TMC435 to support the planned initiation of a Phase 2 clinical trial in mid-2013, pending discussions with regulatory authorities. We and Janssen will share equally development costs associated with this collaboration. No further clinical development activities are covered by this agreement beyond the planned Phase 2 clinical trials.
|
|
•
|
In October 2012, we entered into a non-exclusive collaboration with GlaxoSmithKline plc to evaluate all-oral combinations of GlaxoSmithKline's investigational once-daily NS5A inhibitor GSK2336805 and VX-135. We expect to initiate the Phase 2 clinical trial to evaluate VX-135 and GSK2336805 in the first half of 2013, pending discussions with regulatory authorities. We and GSK will share equally development costs associated with this collaboration. No further clinical development activities are covered by this agreement beyond the planned Phase 2 clinical trial.
|
|
•
|
We are planning to conduct a Phase 2 clinical trial to evaluate VX-135 in combination with our HCV polymerase inhibitor VX-222.
|
8
|
•
|
We are conducting a Phase 2 clinical trial that enrolled approximately 60 patients with genotype 1a HCV infection to evaluate a treatment regimen of telaprevir, VX-222 and RBV.
|
AUTOIMMUNE DISEASES (RHEUMATOID ARTHRITIS)
Background
Autoimmune diseases, including rheumatoid arthritis, are characterized by inflammation that is believed to be the result of an incorrectly regulated immune response. Rheumatoid arthritis is a chronic disease that affects 0.5% to 1.0% of the world’s population and, according to the CDC, approximately 1.5 million adults in the United States. Rheumatoid arthritis causes destruction of joint cartilage and erosion of adjacent bone, resulting in deformity, loss of function and substantial disability. Many patients with rheumatoid arthritis also eventually require joint replacements. While approved drugs, including oral and injectable disease-modifying antirheumatic drugs, or DMARDs, are effective in a portion of patients with rheumatoid arthritis, a significant portion of patients do not respond adequately to DMARDs or experience a decrease in the effectiveness of DMARDs over time. We are seeking to develop an oral therapy for the treatment of rheumatoid arthritis that could be used alone or in combination with existing DMARDs.
VX-509
VX-509 is an investigational oral drug candidate intended to inhibit Janus kinase 3, or JAK3, which is involved in the modulation of a type of white blood cell, referred to as a lymphocyte, that is central to autoimmune disease pathology. Because of JAK3’s role in lymphocyte biology, we believe it is a promising target for the design of immunosuppressant drugs for treatment of a variety of autoimmune diseases, including rheumatoid arthritis. Based on
in vitro
and
in vivo
data, VX-509 shows promise as a potent and selective inhibitor of JAK3. In 2011, we completed a Phase 2a clinical trial that evaluated VX-509 monotherapy in patients with rheumatoid arthritis. We achieved the two primary endpoints in this Phase 2a clinical trial, defined as a statistically significant improvement in the proportion of patients who achieved at least a 20% improvement in the signs and symptoms of rheumatoid arthritis, also known as ACR20, and a statistically significant improvement from baseline in Disease Activity Score 28, or DAS28.
The most frequently reported class of adverse event in the VX-509 and placebo arms of this Phase 2a clinical trial was infection. The most common individual adverse events observed in this Phase 2a clinical trial, each of which occurred in approximately 5% or less of patients, were nausea, headache and increased alanine transaminase, regardless of treatment arm. Five percent of patients discontinued treatment due to adverse events in the placebo group, compared to eight percent of patients in the VX-509 treatment arms.
Based on the efficacy and safety data from the Phase 2a clinical trial, we initiated a Phase 2b clinical trial in mid-2012 to evaluate once-daily and twice-daily doses of VX-509 in combination with methotrexate. We expect to enroll approximately 350 patients with active moderate-to-severe rheumatoid arthritis and to obtain data from this clinical trial in the second half of 2013. We also recently initiated a Phase 2 clinical trial that is expected to enroll approximately 40 patients with rheumatoid arthritis to evaluate the potential for VX-509 to improve structural joint changes as measured by magnetic resonance imaging and markers of inflammation and joint damage measured in joint fluid.
INFLUENZA
Background: Effects and Prevalence of Influenza
The CDC has estimated that in the United States more than 200,000 patients with influenza infection are hospitalized annually with respiratory and cardiac-related complications. While the number of influenza-related deaths varies significantly depending on the severity of the influenza season, the CDC has estimated the number of influenza-related deaths in the United States averages approximately 25,000 per year. In addition to vaccinations designed to prevent the spread of infection, we believe that there is a significant market for antiviral agents that could potentially be used to treat influenza. Currently, neuraminidase inhibitors, oseltamivir (Tamiflu) and zanamivir (Relenza) are the antiviral agents that are used to treat influenza infection, but these drugs must be administered within 24 to 48 hours of initial infection in order to be effective and do not produce responses in a significant portion of patients.
9
VX-787
VX-787 is an investigational drug candidate intended for the treatment of influenza A, which is typically the predominate strain of influenza and includes H1 (pandemic) and H5 (avian) influenza strains. VX-787 aims to treat influenza A through a mechanism that is different from neuraminidase inhibitors. In prioritizing our future development investment, we determined that we would only continue to advance the development of VX-787 as part of a collaboration or if we obtain external funding for this program. We have received final data from a Phase 2 clinical trial of VX-787 that enrolled approximately 140 healthy volunteers who were infected with live influenza virus. We plan to announce the results from this clinical trial in March 2013.
COMMERCIAL ORGANIZATION
Our North American commercial organization supports sales of INCIVEK and KALYDECO in the United States and Canada, and we have established a small international commercial organization to support sales of KALYDECO in other markets. Our sales force and managed markets organizations are responsible for promoting our products to health care providers and payors.
Our U.S. sales force includes approximately 150 employees, most of whom are focused on marketing INCIVEK and have experience in marketing drugs for the treatment of infectious diseases. Our HCV sales force focuses its efforts on those physicians in private practice and at major medical centers who write the majority of prescriptions for HCV therapies, as well as the health care professionals who support their practices. We also have a small sales force dedicated to marketing INCIVEK in Canada.
Our U.S. field-based CF commercial team includes approximately 15 therapeutic specialists who each have experience with CF. We focus our CF marketing efforts in the United States on a relatively small number of physicians and health care professionals who write most of the prescriptions for CF medicines. Many of these physicians and health care professionals are located at one of the approximately 110 accredited centers in the United States focused on the treatment of CF.
We market our products and educate physicians by calling on individual physicians, advertising, sending direct mail, public relations efforts and other activities. In addition, our government affairs and public policy group advocates for policies that promote life sciences innovation and increase awareness of the diseases on which we are focusing with state and federal legislatures, government agencies, public health officials and other policy-makers. We also have established programs in the United States that provide our products to qualified uninsured or underinsured patients at no charge or at a reduced charge, based on specific eligibility criteria.
RESEARCH
We believe that our integrated drug design approach has significantly enhanced our ability to discover and develop small molecule drug candidates directed at biologically complex targets associated with serious diseases. Our platform integrates biology, pharmacology, drug metabolism and pharmacokinetics, toxicology, material sciences, biophysics, medicinal chemistry and process chemistry, automation and information technologies in a coordinated fashion throughout the discovery process. We believe that our approach has been validated through our success in moving novel drug candidates into clinical trials and obtaining marketing approvals for INCIVEK and KALYDECO. Currently, the therapeutic areas of highest priority to us from a research perspective are: CF and other genetic diseases; infectious diseases; autoimmune diseases; cancer; and neurological diseases and disorders. We plan to focus our research activities on products that would be prescribed by specialist physicians for the treatment of rare or life-threatening diseases that typically affect relatively small patient populations, which are referred to as specialty markets. In CF, our research group is working to identify additional corrector compounds that could be included in future dual- and/or triple-combination treatment regimens that have the potential to provide additional benefits to patients with CF.
Within each therapeutic area, we focus initially on specific medical or disease indications. Driven by the complexity of the therapeutic areas selected, we attempt to identify multiple approaches within each indication that, either as a stand-alone therapy or combination therapy, could provide treatment options that are transformational in nature. The objective of this approach is to enable us eventually to provide multiple drugs in each of these therapeutic areas. We select therapeutic areas by mapping our research strengths, including expertise in kinases, proteases and membrane proteins, onto therapeutic areas with high unmet medical need, with an emphasis on indications where based on scientific insights we believe that we,
10
independently or in collaboration with other third parties, will be able to discover, develop and commercialize important medicines for serious diseases.
Our past drug discovery efforts have produced a variety of drug candidates that have been commercialized or are in preclinical or clinical development. We believe our ongoing research programs will continue to create value for us by generating new drug candidates in areas of significant unmet medical need. We are engaged in nonclinical activities involving a number of investigational compounds, one or more of which may enter clinical development in 2013.
To augment our internal research programs, we seek to collaborate with leading academic research institutions, government laboratories, foundations and other organizations in order to advance research in our areas of therapeutic interest as well as in areas of basic technological enablement. We have established relationships with organizations and consortia of organizations from around the world with expertise in areas of interest to us and intend to leverage that experience to further our research efforts.
COLLABORATIONS
We have entered into collaborations with pharmaceutical and other companies and organizations that provide us financial and other resources, including capabilities in research, development, manufacturing and sales and marketing, and licenses to intellectual property. These collaborations have provided us with drug candidates and/or important financial and non-financial resources that have contributed to our products and a number of the drug candidates in our current development pipeline. We may seek to license or acquire drugs, drug candidates and other technologies that have the potential to add to our pipeline or to provide us with new commercial opportunities. Furthermore, we may seek collaborators to support, develop and/or commercialize some of our current drug candidates and/or additional drug candidates that may emerge from our research activities.
Janssen Pharmaceutica, N.V.
In June 2006, we entered into a license, development, manufacturing and commercialization agreement with Janssen. Under the agreement, we collaborate with Janssen on the development and commercialization of telaprevir. We have exclusive commercial rights to telaprevir in North America and lead the development program for INCIVEK (telaprevir) in North America and the Janssen territories. Janssen has exclusive rights to commercialize INCIVO (telaprevir) outside of North America and the Far East.
Janssen pays us a tiered royalty, averaging in the mid-20% range, subject to adjustment for generic competition, if any, as a percentage of net sales of INCIVO in the Janssen territories. Janssen is responsible for certain third-party royalties in its territories. Pursuant to the collaboration agreement, we received an up-front payment of $165.0 million and milestone payments of $350.0 million related to the development and commercialization of INCIVO. We do not expect to receive any further milestone payments pursuant to this agreement. Janssen was responsible for 50% of drug development costs under the development program for North America and the Janssen territories through approval, and continues to be responsible for 50% of drug development costs related to certain post-approval activities. Janssen is required to use diligent efforts to maximize net sales of telaprevir in its territories through its commercial marketing, pricing and contracting strategies. Each of the parties to the collaboration agreement is responsible for drug supply in their respective territories.
Janssen may terminate the agreement upon the later of (i) one year’s advance notice and (ii) such period as may be required to assign and transfer to us specified filings and approvals. The agreement also may be terminated by either party for a material breach by the other, subject to notice and cure provisions. Unless earlier terminated, the agreement will continue in effect until the expiration of Janssen’s royalty obligations, which expire on a country-by-country basis on the later of (a) the last-to-expire patent covering INCIVO or (b) ten years after the first commercial sale in the country. In the European Union, we have a patent covering the composition-of-matter of INCIVO that expires in 2026.
Mitsubishi Tanabe Pharma Corporation
We have a collaboration agreement with Mitsubishi Tanabe pursuant to which Mitsubishi Tanabe has a fully-paid license to manufacture and commercialize TELAVIC (telaprevir) to treat HCV infection in Japan and other specified countries in the Far East. This agreement was entered into in 2004 and amended in 2009. Pursuant to this agreement, Mitsubishi Tanabe provided financial and other support for the development and commercialization of telaprevir, made a $105.0 million
11
payment to us in connection with the 2009 amendment of the collaboration agreement and made a $65.0 million payment to us in the fourth quarter of 2011 related to the commercialization of TELAVIC in Japan. There are no further payments due to us under this collaboration agreement. Mitsubishi Tanabe is responsible for its own development and manufacturing costs in its territory. Mitsubishi Tanabe may terminate the agreement at any time without cause upon 60 days’ prior written notice to us. The agreement also may be terminated by either party for a material breach by the other, subject to notice and cure provisions. Unless earlier terminated, the agreement will continue in effect until the expiration of the last-to-expire patent covering TELAVIC. In Japan, we have a patent covering the composition-of-matter of TELAVIC that expires in 2021.
Cystic Fibrosis Foundation Therapeutics Incorporated
We began working with CFFT in 1998. We entered into the current collaboration agreement with CFFT in 2004 and amended it several times to support research and development activities related to potentiator compounds and corrector compounds, including ivacaftor, VX-809 and VX-661. Pursuant to an April 2011 amendment to the collaboration agreement, CFFT agreed to provide financial support for development activities for VX-661, a corrector compound discovered under the collaboration, and additional research and development activities directed at discovering new corrector compounds. We retain worldwide rights to develop and commercialize ivacaftor, VX-809, VX-661 and any other compounds discovered during the course of the research collaboration with CFFT and are obligated to pay CFFT tiered royalties ranging from single digits to sub-teens, calculated as a percentage of net sales, on ivacaftor, as well as VX-809 and VX-661 and any other compounds discovered during the original research term or the research term that began in 2011. In 2012, we made a commercial milestone payment upon achievement of certain sales levels of KALYDECO and expect that in 2013 we will make the second and final commercial milestone payment that we are obligated to make to CFFT upon the achievement of certain sales levels of KALYDECO. Under the collaboration agreement, we also are obligated to make a total of two one-time commercial milestone payments upon achievement of certain sales levels for CFTR corrector compounds.
For each compound commercialized under this collaboration, we will have royalty obligations to CFFT until the expiration of patents covering that compound. We have patents in the United States and European Union covering the composition-of-matter of ivacaftor that expire in 2027 and 2025, respectively, subject to potential patent life extensions. CFFT may terminate its funding obligations under the collaboration, as amended, in certain circumstances, in which case there will be a proportional reduction in the royalty rates and commercial milestone payments for certain CFTR corrector compounds. The collaboration also may be terminated by either party for a material breach by the other, subject to notice and cure provisions.
Alios BioPharma, Inc.
In June 2011, we entered into a license and collaboration agreement with Alios BioPharma, Inc., or Alios, a privately-held biotechnology company. Pursuant to the agreement, we are collaborating on the research, development and commercialization of VX-135 (ALS-2200), an HCV nucleotide analogue discovered by Alios. In 2012, we ended development of ALS-2158, a second HCV nucleotide analogue discovered by Alios and licensed to us pursuant to the agreement. We are responsible for all costs related to development and commercialization of VX-135 and are providing funding to Alios for a research program directed to the discovery of additional HCV nucleotide analogues that act on the HCV polymerase.
Under the terms of the agreement, we have exclusive worldwide development and commercialization rights to VX-135 and have the option to select additional compounds discovered in the research program. Upon entering into the agreement, we paid Alios a
$60.0 million
up-front payment. As of December 31, 2012, Alios had earned an aggregate of $
60.0 million
in development milestone payments pursuant to the agreement, including a
$25.0 million
milestone payment in 2012. The agreement provides for development milestone payments to Alios of up to an additional $
312.5 million
if VX-135 is approved and commercialized. The agreement provides for additional development milestone payments to Alios if a second HCV nucleotide analogue is approved and commercialized. Alios also is eligible to receive commercial milestone payments of up to
$750.0 million
, as well as tiered royalties on net sales of approved drugs.
We may terminate our agreement with Alios (i) upon 30 days’ notice to Alios if we cease development of VX-135 after it has experienced a technical failure and/or (ii) upon 60 days’ notice to Alios at any time after we complete specified Phase 2a clinical trials. The agreement also may be terminated by either party for a material breach by the other, and by Alios for our inactivity or if we challenge certain Alios patents, in each case subject to notice and cure provisions. Unless earlier terminated, the agreement will continue in effect until the expiration of our royalty obligations, which expire on a country-by-
12
country basis on the later of (a) the date the last-to-expire patent covering a licensed product expires or (b) ten years after the first commercial sale in the country. In the United States and European Union, there are patent applications pending covering the composition-of-matter of VX-135 that, if granted, would expire in 2031.
INTELLECTUAL PROPERTY
We actively seek protection for our products and proprietary information by means of U.S. and foreign patents, trademarks and copyrights, as appropriate. In addition, we rely upon trade secret protection and contractual arrangements to protect certain of our proprietary information and products. We have patents and pending patent applications that relate to potential drug targets, compounds we are developing to modulate those targets, methods of making or using those compounds and proprietary elements of our drug discovery platform.
Much of our technology and many of our processes depend upon the knowledge, experience and skills of key scientific and technical personnel. To protect our rights to our proprietary know-how and technology, we require all employees, as well as our consultants and advisors when feasible, to enter into confidentiality agreements that require disclosure and assignment to us of ideas, developments, discoveries and inventions made by these employees, consultants and advisors in the course of their service to us.
While we have numerous issued patents and pending patent applications in our patent portfolio, we believe that the patents and patent applications in the United States and the European Union that are the most important to our business are those that claim the composition-of-matter of our drugs and drug candidates that have progressed at least into Phase 2 clinical trials. The following table sets forth the status of the primary patents and patent applications in the United States and the European Union covering the composition-of-matter of these drugs and drug candidates:
|
Drug/Drug Candidate
|
Status of United States Patent
(Anticipated Expiration, Subject to Potential Extensions) |
Status of European Union Patent
(Anticipated Expiration, Subject to Potential Extensions) |
|
INCIVEK/INCIVO (telaprevir)
|
Granted (2025)
|
Granted (2026)
|
|
KALYDECO (ivacaftor)
|
Granted (2027)
|
Application Pending (2025)
|
|
VX-135
|
Application Pending (2031)
|
Application Pending (2031)
|
|
VX-222
|
Granted (2030)
|
Application Pending (2027)
|
|
VX-809
|
Application Pending (2026)
|
Application Pending (2026)
|
|
VX-661
|
Granted (2027)
|
Application Pending (2027)
|
|
VX-509
|
Granted (2026)
|
Application Pending (2025)
|
|
VX-787
|
Application Pending (2030)
|
Application Pending (2030)
|
We hold issued patents and pending patent applications in the United States, and in foreign countries we deem appropriate, claiming intellectual property developed as part of our research and development programs. In addition to the composition-of-matter patents and patent applications listed above, our intellectual property holdings include:
|
•
|
U.S. and foreign patents and patent applications covering telaprevir, VX-222 and other HCV protease and polymerase inhibitors and the use of these compounds to treat HCV infection.
|
|
•
|
U.S. and foreign patent applications licensed from Alios covering VX-135 and other HCV nucleotide inhibitors and the use of these compounds to treat HCV infection.
|
|
•
|
U.S. and foreign patent applications covering potentiator compounds and corrector compounds for the CFTR protein, including ivacaftor, VX-809 and VX-661 and many other related compounds, and the use of those potentiators and correctors to treat CF.
|
|
•
|
U.S. and foreign patents and patent applications covering inhibitors of a variety of kinase proteins, including VX-509, and the use of those inhibitors to treat autoimmune disease, including rheumatoid arthritis.
|
|
•
|
U.S. and foreign patents and patent applications covering influenza virus inhibitors, including VX-787.
|
|
•
|
U.S. and foreign patent applications covering the manufacture, pharmaceutical compositions, related solid forms, formulations, dosing regimens and methods of use of these compounds, including our two marketed products telaprevir and ivacaftor.
|
13
We cannot be certain, however, that issued patents will be enforceable or provide adequate protection or that pending patent applications will result in issued patents.
From time to time we enter into non-exclusive license agreements for proprietary third-party technology used in connection with our research activities. These license agreements typically provide for the payment by us of a license fee, but may also include terms providing for milestone payments or royalties for the development and/or commercialization of our drug products arising from the related research.
Ivacaftor was granted orphan drug status in the United States and the European Union. We have a U.S. patent that covers the composition-of-matter of ivacaftor that we expect will provide intellectual property protection in the United States through its expiration date in 2027. We are entitled to orphan drug exclusivity for ivacaftor in the United States, which means that the FDA may not approve other applications to market ivacaftor for the same indication for seven years except in very limited circumstances. As a result of the seven-year orphan drug marketing exclusivity period, even if a competitor successfully challenges the ivacaftor patent it could not obtain approval from the FDA to market ivacaftor in the United States for at least seven years from the date of approval of ivacaftor in January 2012.
MANUFACTURING
Manufacturing Approach and Philosophy
As we market and sell our approved products and advance our drug candidates through clinical development toward commercialization, we continue to build and maintain our supply chain and quality assurance resources. We rely on an international network of third parties, including sole source suppliers of certain components of our products and drug candidates, to manufacture and distribute our products for commercial sale and post-approval clinical trials and to manufacture and distribute our drug candidates for clinical trials. We expect that we will continue for the foreseeable future to rely on third parties to meet most of our commercial and clinical supply needs.
Our supply chain for sourcing raw materials and manufacturing drug product ready for distribution is a multi-step international endeavor. Third-party contract manufacturers, including some in China, supply us with raw materials, and contract manufacturers in the European Union and the United States convert these raw materials into drug substance, and convert the drug substance into final dosage form. Establishing and managing this global supply chain for each of our drugs and drug candidates requires a significant financial commitment and the creation and maintenance of numerous third-party contractual relationships.
We have developed systems and processes to track, monitor and oversee our third-party manufacturers’ activities, including a quality assurance program intended to ensure that our third-party manufacturers comply with current Good Manufacturing Practices, or cGMP. We regularly evaluate the performance of our third-party manufacturers with the objective of confirming their continuing capabilities to meet our needs efficiently and economically. Manufacturing facilities, both foreign and domestic, are subject to inspections by or under the authority of the FDA and other U.S. and foreign government authorities. A failure by any of our third-party manufacturers to pass an inspection could adversely affect our ability to distribute INCIVEK (telaprevir) or KALYDECO (ivacaftor) in a timely manner.
Manufacture of INCIVEK (telaprevir)
We require a supply of INCIVEK (telaprevir) for our commercial sales in North America and our clinical trials. We provide a secondary commercial supply source for Janssen through our third-party manufacturers. We believe our efforts to establish and maintain relationships with third-party manufacturers and oversee their activities are important to support consistent supply of INCIVEK.
Janssen manufactures INCIVO (telaprevir) for sale in Janssen’s territories and serves as a secondary supply source of drug substance and drug product intermediate for us. We believe there are multiple third parties capable of providing most of the materials and services we need in order to manufacture and distribute INCIVEK. We have limited flexibility to adjust our supply in response to changes in demand, due to the significant lead times required to manufacture INCIVEK. Due in part to this limited flexibility and the INCIVEK inventories we manufactured in previous periods to ensure adequate supply, we recorded significant charges for excess and obsolete INCIVEK inventories in 2012. We currently believe that we have sufficient supply to meet forecasted demand for INCIVEK. In addition, we have significant quantities of materials that we do not expect to utilize.
14
Manufacture of KALYDECO (ivacaftor)
We require a supply of ivacaftor for commercial sale (as KALYDECO) and for use in our clinical trials. We obtain ivacaftor to meet our commercial and clinical supply needs through a third-party manufacturing network. Our supply chain includes sole source suppliers. A disruption in the commercial supply of KALYDECO for patients would have a significant impact on patients, our business and our product revenues. A disruption in the clinical supply of ivacaftor could delay the completion of clinical trials and impact timelines for filing an sNDA or NDA. Accordingly, we are in the process of establishing secondary sources for our KALYDECO supply needs to reduce the risk of a supply disruption. In 2013, we plan to obtain an alternative source for the active ingredient of ivacaftor, which is a sole-sourced material that is critical to the supply of ivacaftor, and to obtain second source suppliers in 2014 for other components of the ivacaftor supply chain.
COMPETITION
The pharmaceutical industry is characterized by extensive research efforts, rapid technological progress and intense competition. There are many public and private companies, including pharmaceutical companies and biotechnology companies, engaged in developing products for the indications our drugs are approved to treat and the therapeutic areas we are targeting with our research and development activities. Many of our competitors have substantially greater financial, technical and human resources than we do. We face competition based on the safety and efficacy of our products and drug candidates, the timing and scope of regulatory approvals, the availability and cost of supply, marketing and sales capabilities, reimbursement coverage, price, patent protection and other factors. Our competitors may develop or commercialize more effective, safer or more affordable products than we are able to develop or commercialize or obtain more effective patent protection. As a result, our competitors may commercialize products more rapidly or effectively than we do, which would adversely affect our competitive position, the likelihood that our drug candidates, if approved, would achieve and maintain market acceptance and our ability to generate meaningful revenues from our products. Future competitive products may render our products, or future products, obsolete or noncompetitive.
HCV Infection
The number and type of treatments for HCV infection has and likely will continue to change rapidly. Factors that may affect the market for any specific HCV treatment regimen, including INCIVEK triple-combination therapy, include the introduction of new competitive drugs or drug combinations, increased sales from currently approved drugs, adverse information regarding the safety characteristics or efficacy of the regimen, significant new information regarding potential treatment regimens being evaluated in clinical trials and enrollment by patients in clinical trials being conducted by us or our competitors.
We market INCIVEK in direct competition with Merck & Co., Inc.'s VICTRELIS (boceprevir), another HCV protease inhibitor that was approved for sale in the United States and Europe in 2011. Patients who are prescribed an INCIVEK-based treatment regimen receive INCIVEK, peg-IFN, a drug that is administered by weekly injection, and RBV for 12 weeks. After the first 12 weeks, patients stop receiving INCIVEK and continue treatment with peg-IFN and RBV alone for an additional 12 weeks or 36 weeks of treatment. In December 2012, we updated the INCIVEK label in the United States to include a Boxed Warning stating that fatal and non-fatal serious skin reactions have been reported in patients taking INCIVEK combination treatment. VICTRELIS is prescribed in a combination regimen with peg-IFN and RBV.
Since INCIVEK's approval in 2011, many companies, including us, have continued to pursue development programs involving HCV drugs and drug candidates with the goal of developing improved treatment regimens for HCV infection. In 2012, several companies advanced clinical development programs and released clinical data for potentially competitive treatment regimens. During this period, decreasing numbers of patients with genotype 1 HCV infection started treatment with available treatment options. We believe these decreases are the result of a combination of factors, including new safety and efficacy data that have been reported by our competitors regarding treatment regimens for HCV infection that may become commercially available over the next several years.
On the basis of clinical data reported by our competitors from numerous late-stage clinical trials, it appears likely that future improvements in HCV treatment regimens will come stepwise, with the next group of drugs to be approved for administration in combination with peg-IFN and RBV, followed quickly by drugs to be co-administered in all-oral regimens that do not require peg-IFN, an injectable. Gilead Sciences, Inc., or Gilead, and Janssen recently have completed Phase 3 clinical trials evaluating treatment regimens for patients with HCV infection. Gilead announced in February 2013 that it is on-track to make regulatory filings in the second quarter of 2013 for the approval of GS-7977, an HCV nucleotide analogue, in combination with peg-IFN and RBV for treatment-naïve patients with genotype 1, 4, 5 and 6 HCV infection and as part of an all-oral therapy with RBV for the treatment of patients with genotype 2 and 3 HCV infection. Janssen recently completed
15
Phase 3 clinical trials evaluating TMC435 in combination with peg-IFN and RBV in patients with genotype 1 HCV infection. The top-line results reported by Gilead and Janssen from these Phase 3 clinical trials suggest that the safety and efficacy profiles of GS-7977 and TMC435 will position them, if approved, to potentially take a significant portion of the market for HCV therapies.
In addition to the HCV treatment regimens that are being developed in combination with peg-IFN and RBV, many companies, including us, are seeking to develop all-oral treatment regimens for HCV infection that could render uncompetitive current and future treatment regimens that include the administration of peg-IFN by injection. We are planning to evaluate potential all-oral treatment regimens that include our HCV nucleotide analogue, VX-135, in Phase 2 clinical trials. Some of our competitors' potential all-oral treatment regimens are more advanced, including all-oral treatment regimens that are being evaluated in Phase 3 clinical trials being conducted by Gilead and Abbvie, Inc. While the development and regulatory timelines for these drug candidates are subject to risk and uncertainty, we believe that (i) substantial additional clinical data regarding potential all-oral treatment regimens will become available in 2013 and (ii) it is possible that one or more all-oral treatment regimens for genotype 1 HCV infection could be commercially available as soon as late 2014. As a result, if we are successful in developing all-oral treatment regimens that include VX-135 and/or VX-222, independently or with a collaborator, it is likely that our all-oral treatment regimens would compete directly with one or more previously approved all-oral treatment regimens.
The following table provides information regarding selected drug candidates that are being evaluated for the treatment of HCV infection.
|
Drug Candidate
|
Mechanism
|
Development Phase
|
|
Gilead
|
||
|
sofosbuvir (GS-7977)
|
HCV Nucleotide Analogue
|
Phase 3
|
|
GS-9451
|
HCV Protease Inhibitor
|
Phase 2
|
|
tegobuvir (GS-9190)
|
Non-nucleoside HCV Polymerase Inhibitor
|
Phase 2
|
|
GS-5885
|
HCV NS5A Inhibitor
|
Phase 2
|
|
Janssen/Medivir AB
|
||
|
simeprevir (TMC435)
|
HCV Protease Inhibitor
|
Phase 3
|
|
TMC647055
|
Non-nucleoside HCV Polymerase Inhibitor
|
Phase 2
|
|
Abbvie
|
||
|
ABT-450
|
HCV Protease Inhibitor
|
Phase 3
|
|
ABT-333
|
Non-nucleoside HCV Polymerase Inhibitor
|
Phase 3
|
|
ABT-267
|
HCV NS5A Inhibitor
|
Phase 3
|
|
Vertex
|
||
|
VX-135
|
HCV Nucleotide Analogue
|
Phase 2
|
|
VX-222
|
Non-nucleoside HCV Polymerase Inhibitor
|
Phase 2
|
|
Boehringer Ingelheim
|
||
|
faldaprevir (BI 201335)
|
HCV Protease Inhibitor
|
Phase 3
|
|
BI 207127
|
Non-nucleoside HCV Polymerase Inhibitor
|
Phase 3
|
|
Merck
|
||
|
vaniprevir (MK-7009)
|
HCV Protease Inhibitor
|
Phase 2
|
|
Bristol-Myers Squibb
|
||
|
daclatasvir
|
HCV NS5A Inhibitor
|
Phase 3
|
|
BMS-650032
|
HCV Protease Inhibitor
|
Phase 2
|
|
Achillion
|
||
|
Sovaprevir
|
HCV Protease Inhibitor
|
Phase 2
|
|
ACH-3102
|
HCV NS5A Inhibitor
|
Phase 2
|
|
Roche
|
||
|
danoprevir / RG7227
|
HCV Protease Inhibitor
|
Phase 2
|
|
setrobuvir
|
Non-nucleoside HCV Polymerase Inhibitor
|
Phase 2
|
|
GlaxoSmithKline
|
||
|
GSK2336805
|
HCV NS5A Inhibitor
|
Phase 2
|
|
Idenix
|
||
|
IDX719
|
HCV NS5A Inhibitor
|
Phase 2
|
16
Where companies have control of multiple drug candidates that span different mechanisms of action, they typically are investigating combination regimens of those drug candidates, with or without the addition of RBV. In addition, many companies, including us, are pursuing a strategy of evaluating drug candidates they control in combination with drug candidates controlled by third parties. For example, we entered into separate non-exclusive collaborations to evaluate VX-135 in combination with Janssen's HCV protease inhibitor TMC435 and GSK's HCV NS5A inhibitor GSK2336805, and Janssen is evaluating TMC435 in combination with Gilead's HCV nucleotide analogue GS-7977 and plans to evaluate TMC435 in combination with Idenix's HCV NS5A Inhibitor
IDX719
.
Cystic Fibrosis
A number of companies are seeking to identify and develop drug candidates for the treatment of CF, including Novartis, Pfizer, Genzyme and several private companies. We believe our competitors have research and development programs directed at identifying CFTR potentiators, CFTR correctors and drug candidates with other mechanisms of action with the goal of addressing the underlying cause of CF. While we believe that it will be several years before any of these competitive programs enter late-stage clinical development, if one or more competing therapies are successfully developed as a treatment for patients with CF, our revenues from KALYDECO and/or our other CF drug candidates, if then approved, could face competitive pressures.
GOVERNMENT REGULATION
The research, development, testing, manufacture, quality control, approval, labeling, packaging, storage, record keeping, promotion, advertising, distribution and marketing of our products and drug candidates are subject to extensive regulation by United States and foreign governmental authorities.
United States Government Regulation
New Drug Application Approval Processes
In the United States, the FDA regulates drugs under the Federal Food, Drug and Cosmetic Act, or the FDCA, and implementing regulations. The process of obtaining regulatory approvals and the subsequent compliance with applicable federal, state, local and foreign statutes and regulations require the expenditure of substantial time and financial resources. Failure to comply with the applicable U.S. requirements at any time during the drug development process, approval process or after approval, may subject us to administrative or judicial sanctions, any of which could have a material adverse effect on us. These sanctions could include:
|
•
|
refusal to approve pending applications;
|
|
•
|
withdrawal of an approval;
|
|
•
|
imposition of a clinical hold;
|
|
•
|
warning letters;
|
|
•
|
product seizures;
|
|
•
|
total or partial suspension of production or distribution; or
|
|
•
|
injunctions, fines, disgorgement, or civil or criminal penalties.
|
The process required by the FDA before a drug may be marketed in the United States generally involves the following:
|
•
|
completion of preclinical laboratory tests, animal studies and formulation studies conducted according to Good Laboratory Practices, or GLP, and other applicable regulations;
|
|
•
|
submission to the FDA of an investigational new drug, or IND, application, which must become effective before clinical trials in the United States may begin;
|
|
•
|
performance of adequate and well-controlled clinical trials according to Good Clinical Practices, or GCP, to establish the safety and efficacy of the proposed drug for its intended use;
|
|
•
|
submission to the FDA of an NDA;
|
17
|
•
|
satisfactory completion of an FDA inspection of the manufacturing facility or facilities at which the product will be produced to assess compliance with cGMP to assure that the facilities, methods and controls are adequate to preserve the product’s identity, strength, quality and purity; and
|
|
•
|
FDA review and approval of the NDA.
|
Once a drug candidate is identified for development, it enters the preclinical testing stage. Preclinical tests include laboratory evaluations of product chemistry, toxicity and formulation, as well as animal pharmacology and toxicology studies. An IND sponsor must submit the results of the preclinical tests, together with manufacturing information and analytical data, to the FDA as part of the IND. Preclinical or nonclinical testing typically continues even after the IND is submitted. In addition to including the results of the preclinical studies, the IND also will include a protocol detailing, among other things, the objectives of the initial clinical trial and the parameters to be used in monitoring safety. The IND automatically becomes effective 30 days after receipt by the FDA, unless the FDA, within the 30-day time period, places the IND on clinical hold. If an IND is placed on clinical hold, the IND sponsor and the FDA must resolve any outstanding concerns before clinical trials can begin. A clinical hold may occur at any time during the life of an IND, and may affect one or more specific clinical trials or all clinical trials conducted under the IND.
All clinical trials must be conducted under the supervision of one or more qualified investigators in accordance with GCP. They must be conducted under protocols detailing the objectives of the trial, dosing procedures, subject selection and exclusion criteria and the safety and effectiveness criteria to be evaluated. Each protocol and any amendments must be submitted to the FDA as part of the IND, and progress reports detailing the results of the clinical trials must be submitted at least annually to the FDA and more frequently in other situations, including the occurrence of serious adverse events. An institutional review board, or IRB, at each institution participating in the clinical trial must review and approve the protocol and any amendments before a clinical trial commences or continues at that institution, approve the information regarding the clinical trial and the consent form that must be provided to each trial subject or his or her legal representative, and monitor the clinical trial until completed and otherwise comply with IRB regulations.
Clinical trials typically are conducted in three sequential phases that may overlap or be combined:
|
•
|
Phase 1.
The drug initially is introduced into healthy human subjects and tested for safety, dosage tolerance, absorption, metabolism, distribution and elimination. In the case of some drug candidates for severe or life-threatening diseases, such as cancer, especially when the drug candidate may be inherently too toxic to ethically administer to healthy volunteers, the initial human testing is often conducted in patients.
|
|
•
|
Phase 2.
Clinical trials are initiated in a limited patient population intended to identify possible adverse effects and safety risks, to preliminarily evaluate the efficacy of the drug candidate for specific targeted diseases and to determine dosage tolerance and optimal dosage.
|
|
•
|
Phase 3.
Clinical trials are undertaken to further evaluate dosage, clinical efficacy and safety in an expanded patient population at geographically dispersed clinical trial sites. These clinical trials are intended to establish the overall risk-benefit ratio of the drug candidate and provide an adequate basis for regulatory approval and product labeling.
|
Phase 1, Phase 2 and Phase 3 testing may not be completed successfully within any specified period, if at all. The FDA or the sponsor may suspend a clinical trial at any time for a variety of reasons, including a finding that the healthy volunteers or patients are being exposed to an unacceptable health risk. Similarly, an IRB can suspend or terminate approval of a clinical trial at its institution if the clinical trial is not being conducted in accordance with the IRB’s requirements or if the drug candidate has been associated with unexpected serious harm to healthy volunteers or patients.
We estimate that it generally takes 10 to 15 years, or possibly longer, to discover, develop and bring to market a new pharmaceutical product in the United States, as outlined below:
18
|
Phase
|
Estimated Duration
|
|
|
Discovery
|
2 to 4 years
|
|
|
Preclinical
|
1 to 2 years
|
|
|
Phase 1
|
1 to 2 years
|
|
|
Phase 2
|
2 to 4 years
|
|
|
Phase 3
|
2 to 4 years
|
|
|
FDA approval
|
6 months to 2 years
|
|
During the development of a new drug, sponsors are given opportunities to meet with the FDA at certain points. These points may be prior to submission of an IND, at the end of Phase 2 testing, and before an NDA is submitted. Meetings at other times may be requested. These meetings can provide an opportunity for the sponsor to share information about the data gathered to date, for the FDA to provide advice, and for the sponsor and FDA to reach agreement on the next phase of development. Sponsors typically use the end of Phase 2 meeting to discuss their Phase 2 clinical results and present their plans for the pivotal Phase 3 clinical trial that they believe will support approval of the drug candidate.
Concurrently with clinical trials, companies usually complete additional animal safety studies and also must develop additional information about the chemistry and physical characteristics of the drug and finalize a process for manufacturing the product in accordance with cGMP requirements. The manufacturing process must be capable of consistently producing quality batches of the drug candidate, and the manufacturer must develop methods for testing the quality, purity and potency of the final products. Additionally, appropriate packaging must be selected and tested and stability studies must be conducted to demonstrate that the drug candidate does not undergo unacceptable deterioration over its shelf-life.
The results of drug development, preclinical studies and clinical trials, along with descriptions of the manufacturing process, analytical tests conducted on the chemistry of the drug candidate, proposed labeling and other relevant information are submitted to the FDA as part of an NDA requesting approval to market the drug candidate. The FDA reviews each NDA submitted to ensure that it is sufficiently complete for substantive review before it accepts it for filing. It may request additional information rather than accept an NDA for filing.
Once the submission is accepted for filing, the FDA begins an in-depth review. The FDA may not approve an NDA if the applicable regulatory criteria are not satisfied or may require additional clinical or other data. Even if such data are submitted, the FDA may ultimately decide that the NDA does not satisfy the criteria for approval. The FDA reviews an NDA to determine, among other things, whether a drug candidate is safe and effective for its intended use and whether its manufacturing is cGMP-compliant to assure and preserve the drug candidate’s identity, strength, quality and purity. The FDA may refer the NDA to an advisory committee for review and recommendation as to whether the NDA should be approved and under what conditions. The FDA is not bound by the recommendation of an advisory committee, but it generally follows such recommendations. Before approving an NDA, the FDA will inspect the facility or facilities where the drug candidate is manufactured and tested.
The FDA may require, as a condition of approval, restricted distribution and use, enhanced labeling, special packaging or labeling, expedited reporting of certain adverse events, pre-approval of promotional materials, restrictions on direct-to-consumer advertising or commitments to conduct additional research post-approval. The FDA will issue a complete response letter if the agency decides not to approve the NDA in its present form. The complete response letter usually describes all of the specific deficiencies in the NDA identified by the FDA. If a complete response letter is issued, the applicant may either resubmit the NDA, addressing all of the deficiencies identified in the letter, or withdraw the application.
Expedited Review and Approval
The FDA has various programs, including Fast Track, priority review, and accelerated approval, that are intended to expedite or simplify the process for reviewing drug candidates, and/or provide for approval on the basis of surrogate endpoints. Even if a drug candidate qualifies for one or more of these programs, the FDA may later decide that the drug candidate no longer meets the conditions for qualification or that the time period for FDA review or approval will not be shortened. Generally, drug candidates that may be eligible for these programs are those for serious or life-threatening conditions, those with the potential to address unmet medical needs, and those that offer meaningful benefits over existing treatments. For example, Fast Track is a process designed to facilitate the development, and expedite the review of drug candidates to treat serious diseases and fill an unmet medical need. Priority review is designed to give drug candidates that offer major advances in treatment or provide a treatment where no adequate therapy exists an initial review within six months
19
as compared to a standard review time of ten months. Although Fast Track and priority review do not affect the standards for approval, the FDA will attempt to facilitate early and frequent meetings with a sponsor of a Fast Track designated drug candidate and expedite review of the application for a drug candidate designated for priority review. Accelerated approval provides an earlier approval of drugs that treat serious diseases, and that fill an unmet medical need based on a surrogate endpoint, which is a laboratory measurement or physical sign used as an indirect or substitute measurement representing a clinically meaningful outcome. As a condition of approval, the FDA may require that a sponsor of a product receiving accelerated approval perform post-marketing clinical trials.
Post-approval Requirements
Once an approval is granted, the FDA may withdraw the approval if compliance with regulatory standards is not maintained or if problems occur after the product reaches the market. Later discovery of previously unknown problems with a product may result in restrictions on the product or complete withdrawal of the product from the market. In addition, under the FDCA the sponsor of an approved drug in the United States may not promote that drug for unapproved, or off-label, uses, although a physician may prescribe a drug for an off-label use in accordance with the practice of medicine. After approval, some types of changes to the approved product, such as adding new indications, manufacturing changes and additional labeling claims, are subject to further FDA review and approval. In addition, the FDA may require testing and surveillance programs to monitor the effect of approved products that have been commercialized, and the FDA has the power to prevent or limit further marketing of a product based on the results of these post-marketing programs.
Products manufactured or distributed by us pursuant to FDA approvals are subject to continuing regulation by the FDA, including, among other things:
|
•
|
record-keeping requirements;
|
|
•
|
reporting of adverse experiences with the product;
|
|
•
|
providing the FDA with updated safety and efficacy information;
|
|
•
|
drug sampling and distribution requirements;
|
|
•
|
notifying the FDA and gaining its approval of specified manufacturing or labeling changes;
|
|
•
|
complying with certain electronic records and signature requirements; and
|
|
•
|
complying with FDA promotion and advertising requirements.
|
Drug manufacturers and other entities involved in the manufacture and distribution of approved products are required to register with the FDA and certain state agencies, and are subject to periodic unannounced inspections by the FDA and some state agencies for compliance with cGMP and other laws.
We rely, and expect to continue to rely, on third parties for the production of our products. Future FDA and state inspections may identify compliance issues at the facilities of our contract manufacturers that may disrupt manufacture or distribution of our products, or require substantial resources to correct.
From time to time, new legislation is enacted that changes the statutory provisions governing the approval, manufacturing and marketing of products regulated by the FDA. In addition, FDA regulations and guidance often are revised or reinterpreted by the agency in ways that may significantly affect our business and our products. It is impossible to predict whether legislative changes will be enacted, or FDA regulations, guidance or interpretations changed.
Patent Term Restoration and Marketing Exclusivity
Depending upon the timing, duration and specifics of FDA approval of the use of our drugs, some of our United States patents may be eligible for limited patent term extension under the Drug Price Competition and Patent Term Restoration Act of 1984, referred to as the Hatch-Waxman Amendments. The Hatch-Waxman Amendments permit a patent restoration term of up to five years as compensation for patent term lost during product development and the FDA regulatory review process. However, patent term restoration cannot extend the remaining term of a patent beyond a total of 14 years from the product’s approval date. The patent term restoration period is generally one-half the time between the effective date of an IND, and the submission date of an NDA, plus the time between the submission date of an NDA and the approval of that application. Only
20
one patent applicable to an approved product is eligible for the extension and the extension must be applied for prior to expiration of the patent. The United States Patent and Trademark Office, in consultation with the FDA, reviews and approves the application for any patent term extension or restoration. In the future, we may apply for restorations of patent term for some of our currently owned or licensed patents to add patent life beyond their current expiration date, depending on the expected length of clinical trials and other factors involved in the submission of the relevant NDA.
Market exclusivity provisions under the FDCA also can delay the submission or the approval of certain applications. The FDCA provides a five-year period of non-patent marketing exclusivity within the United States to the first applicant to gain approval of an NDA for a new chemical entity. For a new chemical entity that qualifies for Orphan Drug designation, the FDCA provides such marketing exclusivity for a period of seven years. A product is a new chemical entity if the FDA has not previously approved any other new product containing the same active moiety, which is the molecule responsible for the action of the drug substance. During the exclusivity period, the FDA may not accept for review an abbreviated new drug application, or ANDA, or a 505(b)(2) NDA submitted by another company for another version of such product where the applicant does not own or have a legal right of reference to all the data required for approval. However, an application may be submitted after four years if it contains a certification of patent invalidity or non-infringement. The FDCA also provides three years of marketing exclusivity for an NDA, 505(b)(2) NDA or supplement to an existing NDA if new clinical investigations, other than bioavailability studies, that were conducted or sponsored by the applicant are deemed by the FDA to be essential to the approval of the application, for example, for new indications, dosages, or strengths of an existing drug. This three-year exclusivity covers only the conditions associated with the new clinical investigations and does not prohibit the FDA from approving ANDAs for drugs containing the original active agent.
Pediatric Exclusivity
Section 505A of the FDCA, as amended by the FDA Amendments Act of 2007, permits certain drugs to obtain an additional six months of exclusivity, if the sponsor submits information requested in writing by the FDA, or a written request, relating to the use of the drug in children. The FDA may not issue a written request for clinical trials on unapproved or approved indications or where it determines that information relating to the use of a drug in a pediatric population, or part of the pediatric population, may not produce health benefits in that population.
Foreign Regulation
In addition to regulations in the United States, we are subject to a variety of foreign regulations governing clinical trials and commercial sales and distribution of our products. Whether or not we obtain FDA approval for a drug candidate, we must obtain approval by the comparable regulatory authorities of foreign countries or economic areas, such as the European Union, before we can commence clinical trials or market products in those countries or areas. The approval process and requirements governing the conduct of clinical trials, product licensing, pricing and reimbursement vary greatly from place to place, and the time may be longer or shorter than that required for FDA approval.
Under European Union regulatory systems, a company may submit marketing authorization applications either under a centralized or decentralized procedure. The centralized procedure, which is compulsory for medicines produced by biotechnology or those medicines intended to treat AIDS, cancer, neurodegenerative disorders, or diabetes and optional for those medicines that are highly innovative, provides for the grant of a single marketing authorization that is valid for all European Union member states. The decentralized procedure provides for approval by one or more “concerned” member states based on an assessment of an application performed by one member state, known as the “reference” member state. Under the decentralized approval procedure, an applicant submits an application, or dossier, and related materials to the reference member state and concerned member states. The reference member state prepares a draft assessment and drafts of the related materials within 120 days after receipt of a valid application. Within 90 days of receiving the reference member state’s assessment report, each concerned member state must decide whether or not to approve the assessment report and related materials. If a member state does not recognize the marketing authorization, the disputed points are eventually referred to the European Commission, whose decision is binding on all member states.
Orphan Drug Designation
Under the Orphan Drug Act, the FDA may grant orphan drug designation to drug candidates intended to treat a rare disease or condition, which is generally a disease or condition that affects fewer than 200,000 people in the United States, or more than 200,000 people in the United States and for which there is no reasonable expectation that the cost of developing
21
and making available in the United States a drug for this type of disease or condition will be recovered from sales in the United States for that drug. Orphan drug designation must be requested before submitting an NDA. After the FDA grants orphan drug designation, the identity of the therapeutic agent and its potential orphan use are disclosed publicly by the FDA. Orphan drug designation does not convey any advantage in or shorten the duration of the regulatory review and approval process. KALYDECO and VX-809 have been granted designation as orphan drugs by the FDA.
If a drug candidate that has orphan drug designation subsequently receives the first FDA approval for the disease for which it has such designation, the product is entitled to orphan drug exclusivity, which means that the FDA may not approve any other applications to market the same drug for the same indication, except in very limited circumstances, for seven years. Orphan drug exclusivity, however, also could block the approval of our drug candidates for seven years if a competitor obtains approval of the same product as defined by the FDA or if our drug candidate is determined to be contained within the competitor’s product for the same indication or disease.
As in the United States, we may apply for designation of a drug candidate as an orphan drug for the treatment of a specific indication in the European Union before the application for marketing authorization is made. Orphan drugs in Europe enjoy economic and marketing benefits, including up to 10 years of market exclusivity for the approved indication unless another applicant can show that its product is safer, more effective or otherwise clinically superior to the orphan-designated product.
The FDA and foreign regulators expect holders of exclusivity for orphan drugs, such as KALYDECO, to assure the availability of sufficient quantities of their orphan drugs to meet the needs of patients. Failure to do so could result in the withdrawal of marketing exclusivity for the orphan drug.
Breakthrough Therapy Designation
In July 2012, the Food and Drug Administration Safety and Innovation Act, or FDASIA, was enacted, amending the FDCA. As part of FDASIA, Congress created a new drug designation called “Breakthrough Therapy.” This designation is intended to facilitate expedited development and review of a compound which, alone or in combination with one or more other compounds, is intended to treat a serious or life-threatening disease or condition and for which preliminary clinical evidence indicates that the compound may demonstrate substantial clinical improvement over existing therapies. Breakthrough Therapy designation may be requested at the filing of, or as an amendment to, an IND based on criteria established by the FDA.
Actions identified in FDASIA that may expedite the development and review of a Breakthrough Therapy include, as appropriate: holding meetings with the sponsor and the review team throughout the development of the drug; involving senior managers and experienced review staff, as appropriate, in a collaborative, cross-disciplinary review; and assigning a cross-disciplinary project lead for the FDA review team to facilitate efficient review of the development program and serve as a scientific liaison between the review team and the sponsor. We expect that over time the FDA will develop regulations and/or provide additional guidance regarding the development of drug candidates that receive Breakthrough Therapy designation. At this time, because this designation was provided pursuant to a newly enacted law and our programs were the first to receive this designation, we cannot determine if there will be any specific implications of the Breakthrough Therapy designations on our development programs.
Reimbursement
Sales of our products depend, in part, on the extent to which our products will be covered by third-party payors, such as government health programs, commercial insurance and managed health care organizations. These third-party payors increasingly are reducing reimbursements for medical products and services. Additionally, the containment of health care costs has become a priority of federal and state governments, and the prices of drugs have been a focus in this effort. The U.S. government, state legislatures and foreign governments have shown significant interest in implementing cost-containment programs, including price controls, restrictions on reimbursement and requirements for substitution of generic products. Adoption of price controls and cost-containment measures, and adoption of more restrictive policies in jurisdictions with existing controls and measures, could limit our revenues. Decreases in third-party reimbursement for a product or a decision by a third-party payor to not cover a product could reduce physician usage of the product.
22
The Medicare Prescription Drug, Improvement, and Modernization Act of 2003, or the MMA, established the Medicare Part D program to provide a voluntary prescription drug benefit to Medicare beneficiaries. Under Part D, Medicare beneficiaries may enroll in prescription drug plans offered by private entities, which will provide coverage of outpatient prescription drugs. Unlike Medicare Part A and B, Part D coverage is not standardized. Part D prescription drug plan sponsors are not required to pay for all covered Part D drugs, and each drug plan can develop its own drug formulary that identifies which drugs it will cover and at what tier or level. However, Part D prescription drug formularies must include drugs within each therapeutic category and class of covered Part D drugs, though not necessarily all the drugs in each category or class. Any formulary used by a Part D prescription drug plan must be developed and reviewed by a pharmacy and therapeutic committee. Government payment for some of the costs of prescription drugs may increase demand for products for which we receive marketing approval. However, any negotiated prices for our products covered by a Part D prescription drug plan likely will be lower than the prices we might otherwise obtain. Moreover, while the MMA applies only to drug benefits for Medicare beneficiaries, private payors often follow Medicare coverage policy and payment limitations in setting their own payment rates. Any reduction in payment that results from the MMA may result in a similar reduction in payments from non-governmental payors.
The American Recovery and Reinvestment Act of 2009 provides funding for the federal government to compare the effectiveness of different treatments for the same illness. A plan for the research will be developed by the Department of Health and Human Services, or HHS, the Agency for Healthcare Research and Quality and the National Institutes of Health, and periodic reports on the status of the research and related expenditures will be made to Congress. Although the results of the comparative effectiveness studies are not intended to mandate coverage policies for public or private payors, it is not clear what effect, if any, the research will have on the sales of our products. It is possible that comparative effectiveness research demonstrating benefits of a competitor’s product could adversely affect the sales of our products. If third-party payors do not consider our products to be cost-effective compared to other available therapies, they may not cover our products as a benefit under their plans or, if they do, the level of payment may not be sufficient to allow us to sell our products on a profitable basis.
The Patient Protection and Affordable Care Act, as amended by the Health Care and Education Affordability Reconciliation Act of 2010, which is referred to as the ACA, was enacted in March 2010 and is designed to expand coverage for the uninsured while at the same time containing overall health care costs. With regard to pharmaceutical products, among other things, the ACA is designed to expand and increase industry rebates for drugs covered under Medicaid programs, impose an annual fee on branded pharmaceutical manufacturers and make changes to the coverage requirements under the Medicare Part D program. In 2012 and 2011, our rebates associated with the Medicare Part D “donut hole” were $1.8 million and $1.4 million, respectively. In 2012 and 2011, we recorded $1.8 million and $0, respectively, in sales, general and administrative expenses related to the branded prescription drug fee established pursuant to the ACA. The branded prescription drug fee is not tax deductible. We cannot predict all of the effects of the ACA on pharmaceutical companies as many of the ACA reforms require the promulgation of detailed regulations implementing the statutory provisions, which has not yet occurred.
In Europe and many other foreign countries, the success of KALYDECO, and any other drug candidates we may develop, depends largely on obtaining and maintaining government reimbursement, because in many foreign countries patients are unlikely to use prescription pharmaceutical products that are not reimbursed by their governments. Negotiating reimbursement rates in foreign countries can delay the commercialization of a pharmaceutical product and generally results in a reimbursement rate that is lower than the net price that companies can obtain for the same product in the United States.
In some countries, such as Germany and France, commercial sales of a product can begin while the reimbursement rate that a company will receive in future periods is under discussion. In other countries, a company must complete the reimbursement discussions prior to the commencement of commercial sales of the pharmaceutical product. The requirements governing drug pricing vary widely from country to country. For example, the European Union provides options for its member states to restrict the range of drugs for which their national health insurance systems provide reimbursement and to control the prices of drugs for human use. A member state may approve a specific price for the drug or it may instead adopt a system of direct or indirect controls on the profitability of the company placing the drug on the market. Recently, many countries in the European Union have increased the amount of discounts required on pharmaceuticals and these efforts could continue as countries attempt to manage healthcare expenditures, especially in light of the severe fiscal and debt crises experienced by many countries in the European Union. There can be no assurance that any country that has price controls or reimbursement limitations for pharmaceutical products will allow favorable reimbursement and pricing arrangements for any of our products.
23
Other United States Regulations
Pharmaceutical companies also are subject to various federal and state laws pertaining to health care “fraud and abuse,” including anti-kickback laws and false claims laws, and the reporting of payments to physicians and teaching hospitals.
Anti-kickback Laws
U.S. federal laws prohibit fraud and abuse involving state and federal health care programs, such as Medicare and Medicaid. These laws are interpreted broadly and enforced aggressively by various state and federal agencies, including the Centers for Medicare & Medicaid Services, or CMS, the Department of Justice, the Office of Inspector General for HHS and various state agencies. These anti-kickback laws prohibit, among other things, knowingly and willfully offering, paying, soliciting, receiving or providing remuneration, directly or indirectly, in exchange for or to induce either the referral of an individual, or the furnishing, arranging for or recommending of an item or service that is reimbursable, in whole or in part, by a federal health care program. Remuneration is broadly defined to include anything of value, such as, cash payments, gifts or gift certificates, discounts, or the furnishing of services, supplies or equipment. The anti-kickback laws are broad and prohibit many arrangements and practices that are lawful in businesses outside of the health care industry.
The penalties for violating the anti-kickback laws can be severe. The sanctions include criminal and civil penalties, and possible exclusion from the federal health care programs. Many states have adopted laws similar to the federal anti-kickback laws, and some apply to items and services reimbursable by any payor, including third-party payors.
State and Federal Prohibitions on False Claims
The federal False Claims Act imposes liability on any person or entity that, among other things, knowingly presents, or causes to be presented, a false or fraudulent claim for payment to the federal government. Under the False Claims Act, a person acts knowingly if he has actual knowledge of the information or acts in deliberate ignorance or in reckless disregard of the truth or falsity of the information. Specific intent to defraud is not required. Provisions of the False Claims Act allow a private individual to bring an action on behalf of the federal government and to share in any amounts paid by the defendant to the government in connection with the action. The number of filings under these provisions has increased significantly in recent years. When an entity is determined to have violated the False Claims Act, it may be required to pay up to three times the actual damages sustained by the government, plus civil penalties for each false claim. Conduct that violates the False Claims Act may also lead to exclusion from the federal health care programs. Given the number of claims likely to be at issue, potential damages under the False Claims Act for even a single inappropriate arrangement could be significant. In addition, various states have enacted similar laws modeled after the False Claims Act that apply to items and services reimbursed under Medicaid and other state health care programs, and, in several states, such laws apply to claims submitted to all payors.
Federal Prohibitions on Health Care Fraud and False Statements Related to Health Care Matters
Under the administrative simplification provisions of the Health Insurance Portability and Accountability Act of 1996, or HIPAA, and state laws there are numerous regulations for protecting the privacy and security of protected health information. Additional administrative simplification provisions created the following new federal crimes: health care fraud, false statements relating to health care matters, theft or embezzlement in connection with a health benefit program and obstruction of criminal investigation of health care offenses. The health care fraud statute prohibits knowingly and willfully executing a scheme to defraud any health care benefit program, including a private insurer. The false statements statute prohibits knowingly and willfully falsifying, concealing, or covering up a material fact or making any materially false, fictitious, or fraudulent statement in connection with the delivery of or payment for health care benefits, items, or services. The theft or embezzlement statute prohibits knowingly and willfully embezzling, stealing or otherwise converting or misapplying the money or property of a health care benefit program. The obstruction of criminal investigations of health care offenses statute prohibits willfully preventing, obstructing, misleading or delaying the communication of information and records relating to a violation of a federal health care offense to a criminal investigator. A violation of any of these laws is a felony and may result in fines, or exclusion from the federal health care programs.
Physician Payment Sunshine Act
The Physician Payment Sunshine Act will require pharmaceutical manufacturers to report annually to the Secretary of HHS payments or other transfers of value made by that entity to physicians and teaching hospitals. In February 2013,
24
regulations were released that contain detailed guidance regarding the information that must be collected and reported. We will be required to collect information regarding such payments starting in August 2013 and to begin reporting such information in March 2014. Over the next several years, we will need to dedicate significant resources to enhance our systems and processes in order to comply with these regulations. Failure to comply with the reporting requirements would result in significant civil monetary penalties.
Other Regulations
In addition to the statutes and regulations described above, we also are subject to regulation in the United States under the Occupational Safety and Health Act, the Environmental Protection Act, the Toxic Substances Control Act, the Resource Conservation and Recovery Act and other federal, state, local and foreign statutes and regulations, now or hereafter in effect.
EMPLOYEES
As of
December 31, 2012
, we had approximately
2,200
employees. The number of our employees increased by approximately
10%
during
2012
, from approximately 2,000 on
December 31, 2011
. We are likely to further increase our headcount in 2013. Of these employees, approximately
1,950
were based in the United States,
175
were based in Europe and
75
were based in Canada. Our scientific staff members have diversified experience and expertise in molecular and cell biology, biochemistry, synthetic organic chemistry, protein X-ray crystallography, protein nuclear magnetic resonance spectroscopy, microbiology, computational chemistry, biophysical chemistry, medicinal chemistry, clinical pharmacology and clinical medicine. Our clinical development personnel have extensive expertise in designing and executing clinical trials. Employees in our commercial organization have extensive experience in selling and marketing pharmaceutical products as well as seeking reimbursement from government and third-party payors for pharmaceutical products. Our employees are not covered by a collective bargaining agreement, except for a small number of employees in France and Spain. Science magazine named Vertex as one of its top employers in the life sciences in both 2011 and 2012. We consider our relations with our employees to be good.
OTHER MATTERS
Financial Information and Significant Customers
Financial information about (i) our net product revenues and other revenues generated in the principal geographic regions in which we operate and our significant customers is set forth in
Note W, "Segment Information,"
to our consolidated financial statements included in this Annual Report on Form 10-K, (ii) net income (loss) per share attributable to Vertex common shareholders and our total assets is provided in our consolidated financial statements included in this Annual Report on Form 10-K and (iii) our research and development expenses in each of the last three fiscal years is provided in Item 7, "Management's Discussion and Analysis of Financial Condition and Results of Operations." A discussion of the risks attendant to our international operations is set forth in the “Risk Factors” section of this Annual Report on Form 10-K.
Information Available on the Internet
Our internet address is
www.vrtx.com.
Our annual reports on Form 10-K, quarterly reports on Form 10-Q, current reports on Form 8-K, and all amendments to those reports, are available to you free of charge through the “Investors-SEC Filings” section of our website as soon as reasonably practicable after those materials have been electronically filed with, or furnished to, the Securities and Exchange Commission.
Corporate Information
Vertex was incorporated in Massachusetts in 1989, and our principal executive offices are located at 130 Waverly Street, Cambridge, Massachusetts 02139. We have research sites located in San Diego, California; Coralville, Iowa; Montreal, Canada and Milton Park, U.K. We also have an office in Washington, D.C. We have established our European headquarters in Switzerland and have offices in France, Germany, Ireland and the United Kingdom.
25
DIRECTORS AND EXECUTIVE OFFICERS OF THE REGISTRANT
The names, ages and positions held by our executive officers and directors are as follows:
|
Name
|
Age
|
Position
|
|
|
Jeffrey M. Leiden, M.D., Ph.D.
|
57
|
Chairman of the Board, President and Chief Executive Officer
|
|
|
Stuart A. Arbuckle
|
47
|
Executive Vice President and Chief Commercial Officer
|
|
|
Kenneth L. Horton
|
46
|
Executive Vice President and Chief Legal Officer
|
|
|
Peter Mueller, Ph.D.
|
56
|
Executive Vice President, Global Research and Development, and Chief Scientific Officer
|
|
|
Ian F. Smith
|
47
|
Executive Vice President and Chief Financial Officer
|
|
|
Megan Pace
|
40
|
Senior Vice President, Corporate Communications
|
|
|
Amit K. Sachdev, J.D.
|
45
|
Senior Vice President, Global Government Strategy, Market Access and Value
|
|
|
Christiana Stamoulis, M.B.A.
|
42
|
Senior Vice President, Corporate Strategy and Business Development
|
|
|
Paul M. Silva
|
47
|
Senior Vice President and Corporate Controller
|
|
|
David Altshuler, M.D., Ph.D.
|
48
|
Director
|
|
|
Joshua S. Boger, Ph.D.
|
61
|
Director
|
|
|
Matthew W. Emmens
|
61
|
Director
|
|
|
Terrence C. Kearney
|
58
|
Director
|
|
|
Yuchun Lee
|
47
|
Director
|
|
|
Margaret G. McGlynn
|
53
|
Director
|
|
|
Wayne J. Riley, M.D., M.B.A.
|
53
|
Director
|
|
|
Bruce I. Sachs
|
53
|
Director
|
|
|
Elaine S. Ullian
|
65
|
Director
|
|
Dr. Leiden is our Chairman, Chief Executive Officer and President. He has held the positions of Chief Executive Officer and President since February 2012 after joining us as CEO Designee in December 2011. He has been a member of our Board of Directors since July 2009, the Chairman of our Board of Directors since May 2012, and served as our lead independent director from October 2010 through December 2011. Dr. Leiden was a Managing Director at Clarus Ventures, a life sciences venture capital firm, from 2006 through January 2012. Dr. Leiden was President and Chief Operating Officer of Abbott Laboratories, Pharmaceuticals Products Group, and a member of the Board of Directors of Abbott Laboratories from 2001 to 2006. From 1987 to 2000, Dr. Leiden held several academic appointments, including the Rawson Professor of Medicine and Pathology and Chief of Cardiology and Director of the Cardiovascular Research Institute at the University of Chicago, the Elkan R. Blout Professor of Biological Sciences at the Harvard School of Public Health, and Professor of Medicine at Harvard Medical School. He is an elected member of both the American Academy of Arts and Sciences, and the Institute of Medicine of the National Academy of Sciences. Dr. Leiden is a senior advisor to Clarus Ventures. Dr. Leiden was a director and the non-executive Vice Chairman of the board of Shire plc, a specialty biopharmaceutical company, from 2006 to January 2012, and was also a member of the Board of Directors of Millennium Pharmaceuticals, Inc. from October 2007 until it was acquired in June 2008. Dr. Leiden received his M.D., Ph.D. and B.A. degrees from the University of Chicago.
Mr. Arbuckle is our Executive Vice President and Chief Commercial Officer, a position he has held since September 2012. Prior to joining us, Mr. Arbuckle held multiple commercial leadership roles at Amgen, Inc., a 17,000 person biotechnology company, from July 2004 through August 2012. Mr. Arbuckle has worked in the biopharmaceuticals industry since 1986, including more than 15 years at GlaxoSmithKline plc, where he held sales and marketing roles of increasing responsibility for medicines aimed at treating respiratory, metabolic, musculoskeletal, cardiovascular and other diseases. He currently is a member of the Board of Directors of the Cancer Support Community, an international non-profit dedicated to providing support, education and hope to people affected by cancer. Mr. Arbuckle holds a BSc in pharmacology and physiology from the University of Leeds.
Mr. Horton is our Executive Vice President and Chief Legal Officer, a position he has held since June 2012. Prior to joining us, Mr. Horton served as General Counsel and Executive Vice President of Corporate Development at Nordion Inc. (formerly MDS Inc.), a global health science company, from 2005 to 2011. He joined MDS from PerkinElmer, Inc., where
26
he was Vice President, Acquisitions, Ventures and General Counsel for the Life and Analytical Sciences business unit. Mr. Horton began his legal career practicing corporate law at Ropes & Gray in Boston after working as a strategy consultant in the United States and Europe. Mr. Horton currently serves on the Board of Advisors for Beth Israel Deaconess-Needham Hospital and was formerly Chairman of Lumira Capital. Mr. Horton holds an A.B. from Dartmouth College, a J.D. from Harvard Law School and was awarded the D.A.A.D. Direktstipendium for study at the Universitaet Bonn.
Dr. Mueller is our Executive Vice President, Global Research and Development, a position he has held since May 2009, and has been our Chief Scientific Officer since July 2003. Dr. Mueller was our Executive Vice President, Drug Innovation and Realization, from February 2006 to May 2009, and our Senior Vice President, Drug Discovery and Innovation, from July 2003 to February 2006. Prior to joining us, Dr. Mueller was the Senior Vice President, Research and Development, of Boehringer Ingelheim Pharmaceuticals, Inc., with responsibility for the development of all drug candidates in the company’s portfolio in North America. He led research programs in the areas of immunology, inflammatory cardiovascular disease and gene therapy on a global basis. During his time with Boehringer Ingelheim, Dr. Mueller oversaw the discovery of numerous development candidates and held several positions in basic research, medicinal chemistry and management. Dr. Mueller received both an undergraduate degree and a Ph.D. in chemistry at the Albert Einstein University of Ulm, Germany, where he also holds a Professorship in Theoretic Organic Chemistry. He completed fellowships in quantum pharmacology at Oxford University and in biophysics at Rochester University.
Mr. Smith is our Executive Vice President and Chief Financial Officer, a position he has held since February 2006. From November 2003 to February 2006, he was our Senior Vice President and Chief Financial Officer, and from October 2001 to November 2003, he served as our Vice President and Chief Financial Officer. Prior to joining us, Mr. Smith served as a partner in the Life Science and Technology Practice Group of Ernst & Young LLP, an accounting firm, from 1999 to 2001. Mr. Smith initially joined Ernst & Young’s U.K. firm in 1987, and then joined its Boston office in 1995. Mr. Smith currently is a member of the Boards of Directors of Acorda Therapeutics, Inc., a drug development company, and Infinity Pharmaceuticals, Inc., a drug development company. Mr. Smith holds a B.A. in accounting and finance from Manchester Metropolitan University, U.K., is a member of the American Institute of Certified Public Accountants and is a Chartered Accountant of England and Wales.
Ms. Pace is our Senior Vice President, Corporate Communications, a position she has held since July 2012. Ms. Pace served as our Vice President, Corporate Communications from May 2010 through July 2012. Prior to joining us, Ms. Pace was a Senior Director at Genentech, Inc., a biotechnology company, from 2005 through April 2010, where she led the team responsible for public affairs, product public relations and patient advocacy. Prior to Genentech, she held government affairs and public relations roles at Eli Lilly & Company, and worked at Porter Novelli, a global public relations firm, where she managed disease awareness and public health campaigns for several biopharmaceutical companies and government agencies. Ms. Pace holds a B.A. from the College of Charleston.
Mr. Sachdev is our Senior Vice President, Global Government Strategy, Market Access and Value, a role he assumed in February 2013. As a Senior Vice President, he has led our government affairs, public policy and patient advocacy functions since he joined us in July 2007 and built and managed our Canadian business operations from October 2010 through February 2013. Mr. Sachdev served as Executive Vice President, Health of the Biotechnology Industry Organization (BIO) from April 2005 through June 2007. Mr. Sachdev was the Deputy Commissioner for Policy at the FDA from April 2004 through April 2005, and held several other senior positions within the FDA from September 2002 through April 2004. From 1998 to 2002, Mr. Sachdev served as Majority Counsel to the Committee on Energy and Commerce in the United States House of Representatives. From 1993 to 1997, Mr. Sachdev practiced law, first at the Chemical Manufacturers Association, and then with the law firm of Ropes & Gray. Mr. Sachdev holds a B.S from Carnegie Mellon University, and a J.D. from Emory University School of Law.
Ms. Stamoulis is our Senior Vice President, Corporate Strategy and Business Development, a position she has held since October 2009. Prior to joining us, she was a Managing Director in Citigroup’s Healthcare Banking Group from April 2006 to February 2009. From 2000 to April 2006, Ms. Stamoulis was an investment banker in the Healthcare Investment Banking Group of Goldman, Sachs & Co., where she was a Vice President from January 2002 through April 2006. Ms. Stamoulis started her career as a strategy consultant at The Boston Consulting Group. Ms. Stamoulis is a member of the Board of Directors of Hologic, Inc., a company focused on diagnostics, medical imaging systems and surgical products for women. Ms. Stamoulis holds a B.S. in Economics and a B.S. in Architecture from the Massachusetts Institute of Technology and an M.B.A. from the MIT Sloan School of Management.
27
Mr. Silva is our Senior Vice President and Corporate Controller, a position he has held since April 2011. Mr. Silva joined us in August 2007 as Senior Director, Accounting Operations and was our Vice President and Corporate Controller from September 2008 through April 2011. Prior to joining us, he was the Vice President, Internal Reporting at Iron Mountain Incorporated from July 2006 until August 2007 and a consultant to Iron Mountain’s financing department from April 2005 until July 2006. He was the Finance Director of the Bioscience Technologies Division of Thermo Electron Corporation from 2002 to April 2005. Mr. Silva holds a B.S. in accounting from Assumption College.
Dr. Altshuler has been a member of our Board of Directors since May 2012. Dr. Altshuler is the Director of the Program in Medical and Population Genetics at the Broad Institute of Harvard University and the Massachusetts Institute of Technology, a position he has held since 2003. He has served as the Institute's Deputy Director and Chief Academic Officer since 2009. He is one of four founding members of the Broad Institute, a research collaboration of Harvard, MIT, The Whitehead Institute and the Harvard Hospitals. Dr. Altshuler joined the faculty at Harvard Medical School and the Massachusetts General Hospital in 2000 and has held the academic rank of Professor of Genetics and Medicine since 2008. He has served as Adjunct Professor of Biology at MIT since 2012. Dr. Altshuler earned a B.S. from MIT, a Ph.D. from Harvard University and an M.D. from Harvard Medical School. Dr. Altshuler completed his clinical training in Internal Medicine, and in Endocrinology, Diabetes and Metabolism, at the Massachusetts General Hospital.
Dr. Boger is the founder of Vertex and has been a director since our inception in 1989. He was our Chief Executive Officer from 1992 through May 2009. He was our Chairman of the Board from 1997 until May 2006 and our President from our inception until December 2000, and from 2005 through February 2009. He was our Chief Scientific Officer from 1989 until May 1992. Prior to founding Vertex in 1989, Dr. Boger held the position of Senior Director of Basic Chemistry at Merck Sharp & Dohme Research Laboratories in Rahway, New Jersey, where he headed both the Department of Medicinal Chemistry of Immunology & Inflammation and the Department of Biophysical Chemistry. Dr. Boger holds a B.A. in chemistry and philosophy from Wesleyan University and M.S. and Ph.D. degrees in chemistry from Harvard University.
Mr. Emmens was our Chief Executive Officer from May 2009 through January 2012, our President from February 2009 through January 2012 and our Executive Chairman from February 2012 through May 2012. He has been a member of our Board of Directors since 2004 and was the Chairman of our Board of Directors from May 2009 through May 2012. Mr. Emmens is the Chairman of the Board of Directors of Shire plc, and has been a member of Shire’s board since March 2003. From March 2003 to June 2008, Mr. Emmens was also the Chief Executive Officer of Shire plc. Before joining Shire in 2003, Mr. Emmens served as President of Merck KGaA’s global prescription pharmaceuticals business in Darmstadt, Germany. In 1999, he joined Merck KGaA and established EMD Pharmaceuticals, Inc., its United States prescription pharmaceutical business. Mr. Emmens held the position of President and Chief Executive Officer at EMD Pharmaceuticals from 1999 to 2001. Prior to this, Mr. Emmens held various positions, including Chief Executive Officer, at Astra Merck, Inc. as well as several positions at Merck & Co., Inc. Mr. Emmens was a member of the Board of Directors of Incyte Corporation, a drug development company, from 2006 through February 2009. Mr. Emmens received a B.S. degree in business management from Farleigh Dickinson University.
Mr. Kearney has been a member of our Board of Directors since May 2011. Mr. Kearney served as the Chief Operating Officer of Hospira, Inc., a specialty pharmaceutical and medication delivery company, from April 2006 to January 2011. From April 2004 to April 2006, he served as Hospira’s Senior Vice President, Finance, and Chief Financial Officer, and he served as Acting Chief Financial Officer through August 2006. Mr. Kearney served as Vice President and Treasurer of Abbott Laboratories from 2001 to April 2004. From 1996 to 2001, Mr. Kearney was Divisional Vice President and Controller for Abbott’s International Division. He received his B.S. in biology from the University of Illinois and his M.B.A. from the University of Denver.
Mr. Lee has been a member of our Board of Directors since September 2012. Mr. Lee was the Vice President of IBM's Enterprise Marketing Management Group from November 2010 through January 2013. Mr. Lee co-founded Unica Corporation, a provider of software and services used to automate marketing processes, in 1992, and was Unica's President and/or Chief Executive Officer from 1992 through November 2010, when Unica was acquired by IBM. From 1989 to 1992, Mr. Lee was a senior consultant at Digital Equipment Corporation, a supplier of general computing technology and consulting services. Mr. Lee holds a B.S. and M.S. in electrical engineering and computer science from the Massachusetts Institute of Technology and an M.B.A. from Babson College.
Ms. McGlynn has been a member of our Board of Directors since May 2011. Ms. McGlynn has served as the President and Chief Executive Officer of the International AIDS Vaccine Initiative, a global not-for-profit organization whose mission
28
is to ensure the development of safe, effective and accessible HIV vaccines for use throughout the world, since July 2011. Ms. McGlynn served as President, Vaccines and Infectious Diseases of Merck & Co., Inc. from 2005 until 2009. Ms. McGlynn joined Merck in 1983 and served in a variety of marketing, sales and managed care roles. Currently, Ms. McGlynn serves as a member of the Board of Directors for Air Products and Chemicals, Inc., a company specializing in gases and chemicals for industrial uses, and Amicus Therapeutics, Inc., a biopharmaceutical company. She is also a member of the National Industrial Advisory Committee at the University at Buffalo School of Pharmacy and Pharmaceutical Sciences. Ms. McGlynn holds a B.S. in Pharmacy and an M.B.A. in Marketing from the State University of New York at Buffalo.
Dr. Riley has been a member of our Board of Directors since July 2010. Dr. Riley is President and Chief Executive Officer of Meharry Medical College, a position he has held since January 2007. In addition, he holds the academic rank of Professor of Internal Medicine at both Meharry and Vanderbilt University Schools of Medicine. From May 2004 to December 2006, Dr. Riley served as a corporate officer and member of the executive management team as Vice President and Vice Dean for Health Affairs and Governmental Relations and Associate Professor of Medicine at Baylor College of Medicine, and Assistant Chief of Medicine at Ben Taub General Hospital, Baylor’s primary adult public hospital teaching affiliate. He served as Assistant Dean for Education at Baylor College of Medicine from 2000 to 2004. Dr. Riley is a member of the Board of Directors of Pinnacle Financial Partners, Inc., a financial services holding firm, and HCA Holdings, Inc., a leading operator of hospitals and health facilities. Dr. Riley earned a B.A. from Yale University, an M.P.H. in health systems management from the Tulane University School of Public Health and Tropical Medicine, an M.D. from the Morehouse School of Medicine and an M.B.A. from the Jones Graduate School of Business, Rice University.
Mr. Sachs has been a member of our Board of Directors since 1998. He is a General Partner at Charles River Ventures, a venture capital firm he joined in 1999. From 1998 to 1999, he served as Executive Vice President and General Manager of Ascend Communications, Inc. From 1997 until 1998, Mr. Sachs served as President and Chief Executive Officer of Stratus Computer, Inc. From 1995 to 1997, he served as Executive Vice President and General Manager of the Internet Telecom Business Group at Bay Networks, Inc. From 1993 to 1995, he served as President and Chief Executive Officer at Xylogics, Inc. Mr. Sachs was a director of BigBand Networks, Inc., a network-based platform company, from 2005 through June 2009. Mr. Sachs holds a B.S.E.E. in electrical engineering from Bucknell University, an M.E.E. in electrical engineering from Cornell University, and an M.B.A. from Northeastern University.
Ms. Ullian has been a member of our Board of Directors since 1997. From 1996 through January 2010, she served as President and Chief Executive Officer of Boston Medical Center, a private, not-for-profit, 626-bed, academic medical center with a community-based focus. From 1994 to 1996, she served as President and Chief Executive Officer of Boston University Medical Center Hospital. From 1987 to 1994, Ms. Ullian served as President and Chief Executive Officer of Faulkner Hospital. She also serves as a director of Thermo Fisher Scientific Inc. and Hologic, Inc. Ms. Ullian holds a B.A. in political science from Tufts University and an M.P.H. from the University of Michigan.
29
RISK FACTORS
Investing in our common stock involves a high degree of risk, and you should carefully consider the risks and uncertainties described below in addition to the other information included or incorporated by reference in this Annual Report on Form 10-K. If any of the following risks or uncertainties actually occurs, our business, financial condition or results of operations would likely suffer, possibly materially. In that case, the trading price of our common stock could decline.
Risks Related to Our Products
A majority of our revenues are due to sales of INCIVEK (telaprevir) in the United States, and our future revenues from INCIVEK are expected to decline.
In 2012,
87%
of our total net product revenues were attributable to INCIVEK. Our net product revenues from sales of INCIVEK declined over the course of 2012. While we expect INCIVEK net product revenues to decline in 2013 as compared to 2012, we cannot accurately predict the extent of this decline. If our INCIVEK net product revenues, market share and/or other information regarding sales of INCIVEK do not meet the expectations of investors or public market analysts, the market price of our common stock may decline.
The number and type of treatments for HCV infection has and likely will continue to change rapidly. Factors that may affect the market for any specific HCV treatment regimen, including INCIVEK triple-combination therapy, include the introduction of new competitive drugs or drug combinations, increased sales from currently approved drugs, adverse information regarding the safety characteristics or efficacy of the regimen, significant new information regarding potential treatment regimens being evaluated in clinical trials and enrollment by patients in clinical trials being conducted by us or our competitors. We believe the decreases in INCIVEK net product revenues that we experienced in 2012 are the result of a combination of factors, including the safety and efficacy data that have been reported by our competitors regarding treatment regimens for HCV infection that may become commercially available over the next several years.
We market INCIVEK in direct competition with Merck & Co., Inc.'s VICTRELIS (boceprevir), another HCV protease inhibitor that was approved for sale in 2011. Since INCIVEK's approval in 2011, many companies have continued to pursue the development of treatment regimens for HCV infection that could potentially offer improved safety, efficacy and/or tolerability, including shorter duration therapies, therapies that do not require the administration of peg-IFN, and therapies that do not cause side effects seen with the currently approved HCV protease inhibitors. Many companies are investigating combination regimens that incorporate one or more of an HCV protease inhibitor, an HCV nucleotide analogue, an HCV non-nucleotide polymerase inhibitor or an NS5A inhibitor, each of which inhibit HCV viral replication through different mechanisms of action. Clinical trials of these investigational combination regimens are being conducted in a wide variety of patient populations, including treatment-naïve and treatment-failure patients, and across all HCV genotypes, which respond differently to different combinations of molecules employing different mechanisms.
On the basis of clinical data reported by our competitors from numerous late-stage clinical trials, it appears likely that future improvements in HCV treatment regimens will come stepwise, with the next group of drugs to be approved for administration in combination with peg-IFN and RBV, followed quickly by drugs to be co-administered in all-oral regimens that do not require peg-IFN, an injectable. Gilead's GS-7977, an HCV nucleotide analogue, and Janssen's TMC435, an HCV protease inhibitor, have been evaluated in Phase 3 clinical trials. The top-line results reported by Gilead and Janssen from these Phase 3 clinical trials suggest that the safety and efficacy profiles of GS-7977 and TMC435 will position them, if approved, to potentially take a significant portion of the market for HCV therapies. While it is difficult to estimate regulatory timelines and the response of regulatory agencies to submissions for marketing approval, we believe it is likely that GS-7977-based and/or TMC435-based treatment regimens will be approved in one or more markets as a treatment for genotype 1 HCV infection in late 2013 or 2014.
In addition to the HCV treatment regimens that are being developed in combination with peg-IFN and RBV, many all-oral treatment regimens for HCV infection are in development that could render uncompetitive current and future treatment regimens that include the administration of peg-IFN by injection. We are planning to evaluate all-oral treatment regimens that include our HCV nucleotide analogue, VX-135, in Phase 2 clinical trials. Some of our competitors' potential all-oral treatment regimens are more advanced, including all-oral treatment regimens that are being evaluated in Phase 3 clinical
30
trials being conducted by Gilead and Abbvie, Inc. While the development and regulatory timelines for these drug candidates are subject to risk and uncertainty, we believe that (i) substantial additional clinical data regarding potential all-oral treatment regimens will become available in 2013 and (ii) it is possible that one or more all-oral treatment regimens for genotype 1 HCV infection could be commercially available as soon as late 2014. As a result, if we are successful in developing all-oral treatment regimens that include VX-135 and/or VX-222, independently or with a collaborator, it is likely that our all-oral treatment regimens would compete directly with one or more previously approved all-oral treatment regimens.
If one or more treatment regimens with a similar or better efficacy, safety and/or tolerability profile than our telaprevir-based treatment regimen, is approved, we expect that INCIVEK would lose a significant portion of its share of the genotype 1 HCV infection treatment market.
Our future revenues from KALYDECO monotherapy are dependent, among other factors, on the outcomes of reimbursement discussions in international markets and ongoing clinical trials in which we are evaluating ivacaftor in additional patient groups.
In 2012, we obtained approval to market KALYDECO (ivacaftor) in the United States, Canada and the European Union for the treatment of patients with CF six years of age and older with the G551D mutation in the
CFTR
gene. S
ince its approval in the first quarter of 2012, most eligible patients in the United States have initiated and are receiving treatment with KALYDECO. We are in discussions regarding reimbursement for KALYDECO in multiple international markets. In France and Germany, we began commercial sales of KALYDECO in 2012, but we are continuing to discuss the reimbursement rate we will receive for KALYDECO in future periods. Funding for KALYDECO has been recommended in England and Ireland, and we anticipate that reimbursement in these countries will begin in the second quarter of 2013. In other countries, we must first complete the reimbursement discussions before we commence commercial sales. There can be no assurance that we will be able to obtain, obtain on a timely basis, or maintain appropriate reimbursement for KALYDECO in these international markets.
In order to expand the market for ivacaftor monotherapy, we will need to demonstrate that ivacaftor is safe and effective in additional patient populations. We are conducting three Phase 3 clinical trials and one Phase 2 clinical trial to evaluate ivacaftor as a monotherapy in additional patient populations, including patients younger than six years of age with gating mutations and patients with other mutations in the
CFTR
gene. These clinical trials are subject to many of the same risks and uncertainties that are described in these risk factors with respect to the development of our drug candidates. Even if these clinical trials are successful, we do not expect that we would obtain approval for the use of ivacaftor in additional populations until 2014 or later.
We cannot predict the royalty revenues we will receive based on INCIVO sales by Janssen in its territories.
Janssen began marketing INCIVO (telaprevir) in the second half of 2011, and we earned
$117.6 million
in royalty revenues on net sales of INCIVO by Janssen in 2012. In addition to the factors that contribute to the uncertainty of sales of INCIVEK (telaprevir) by us in the United States, which apply equally to Janssen’s sales in its territories, sales in Janssen’s territories are dependent upon Janssen’s sales and marketing efforts, which we do not control and may not be able to effectively influence, and the actions and decisions of foreign regulatory authorities. We cannot predict the royalty revenues that we will recognize in future periods from sales of INCIVO by Janssen or the timing of such revenues.
If our competitors bring drugs with superior product profiles to market, our drugs may not be competitive and our revenues could decline.
INCIVEK, KALYDECO and any drugs we develop in the future may not be able to compete effectively with marketed drugs or new drugs that may be developed by competitors. There are many other companies developing drugs for the same indications that we are pursuing. In order to compete successfully in these areas, we must demonstrate improved safety, efficacy and/or tolerability, and ease of manufacturing, and gain and maintain market acceptance over competing drugs. Many of our competitors, including major pharmaceutical companies such as Abbvie, Bristol-Myers Squibb, Gilead, Johnson & Johnson, Merck, Novartis, Pfizer, Sanofi and Roche, possess substantially greater financial, technical and human resources than we possess.
We are aware of a number of companies that are developing new treatments for HCV infection, including HCV nucleotide analogues, HCV protease inhibitors, non-nucleoside HCV polymerase inhibitors and HCV NS5A inhibitors. Although drug development is a lengthy process and involves a high degree of risk, we expect that over the next several years
31
several of these competitive HCV drug candidates may be approved as part of treatment regimens for HCV infection in the United States and elsewhere in the world. As a result, the commercial prospects for INCIVEK, and VX-135 and VX-222, if approved, will depend on, among other factors:
|
•
|
the efficacy, safety, tolerability and other characteristics of any combination therapy including INCIVEK, VX-135 and/or VX-222 relative to existing and future treatments for HCV infection;
|
|
•
|
our ability to establish VX-135 and/or VX-222, if approved, or INCIVEK as a significant component of any commercially competitive all-oral therapy for the treatment of HCV infection; and
|
|
•
|
the clinical data obtained and timing of marketing approvals for drug candidates being developed by our competitors, including any all-oral therapy or shorter duration therapy for the treatment of HCV infection.
|
One or more competing therapies for the treatment of HCV infection may be approved in late 2013 or 2014 with a similar or better efficacy, safety and/or tolerability profile than our telaprevir-based treatment regimen, which would negatively affect INCIVEK and INCIVO sales and could negatively affect our business and financial condition.
A number of companies are seeking to identify and develop drug candidates for the treatment of CF, including Novartis, Pfizer, Genzyme and several private companies. We believe our competitors have research and development programs directed at identifying CFTR potentiators, CFTR correctors and drug candidates with other mechanisms of action with the goal of addressing the underlying cause of CF. While we believe that it will be several years before any of these competitive programs enter late-stage clinical development, if one or more competing therapies are successfully developed as a treatment for patients with CF, our revenues from KALYDECO and/or other compounds, if then approved, could face competitive pressures.
If we discover safety issues with either of our products that were not known at the time of approval or if we fail to comply with continuing U.S. and applicable foreign regulations, commercialization efforts for the product could be negatively affected, the approved product could lose its approval or sales could be suspended, and our business could be materially harmed.
Our products are subject to continuing regulatory oversight, including the review of additional safety information. Drugs are more widely used by patients once approval has been obtained and therefore side-effects and other problems may be observed after approval that were not seen or anticipated, or were not as prevalent or severe, during pre-approval clinical trials or nonclinical studies. For example, in December 2012, we updated the INCIVEK label in the United States to include a Boxed Warning stating that fatal and non-fatal serious skin reactions have been reported in patients taking INCIVEK combination treatment. The subsequent discovery of previously unknown problems with a product could negatively affect commercial sales of the product, result in restrictions on the product or lead to the withdrawal of the product from the market. The reporting of adverse safety events involving our products or public speculation about such events could cause our stock price to decline or experience periods of volatility.
If we or our collaborators fail to comply with applicable continuing regulatory requirements, we or our collaborators may be subject to fines, suspension or withdrawal of regulatory approvals for specific products, product recalls and seizures, operating restrictions and/or criminal prosecutions. In addition, the manufacturers we engage to make our products and the manufacturing facilities in which our products are made are subject to periodic review and inspection by the FDA and foreign regulatory authorities. If problems are identified during the review or inspection of these manufacturers or manufacturing facilities, it could result in our inability to use the facility to make our product or a determination that inventories are not safe for commercial sale.
If physicians, patients and third-party payors do not accept our drugs, we may be unable to generate significant revenues in future periods.
Our drugs may not gain or maintain market acceptance among physicians and patients. Effectively marketing INCIVEK and KALYDECO, and any of our other drug candidates, if approved, requires substantial efforts, both prior to launch and after approval. Physicians may elect not to prescribe our drugs, and patients may elect not to request or take them, for a variety of reasons including:
32
|
•
|
lower demonstrated efficacy, safety and/or tolerability compared to other drugs;
|
|
•
|
prevalence and severity of adverse side-effects;
|
|
•
|
lack of cost-effectiveness;
|
|
•
|
lack of reimbursement availability from third-party payors;
|
|
•
|
a decision to wait for the approval of other therapies in development that have significant perceived advantages over our applicable drug;
|
|
•
|
convenience and ease of administration;
|
|
•
|
other potential advantages of alternative treatment methods; and
|
|
•
|
ineffective marketing and/or distribution support.
|
If our drugs fail to achieve or maintain market acceptance, we will not be able to generate significant revenues in future periods.
Government and other third-party payors seek to contain costs of health care through legislative and other means. If they fail to provide coverage and adequate reimbursement rates for our products, our revenues will be harmed.
In both domestic and foreign markets, our sales of products depend in part upon the availability of reimbursement from third-party payors. Third-party payors include government health programs such as Medicare and Medicaid in the United States and the national health care systems in many international markets, managed care providers, private health insurers and other organizations. Governments and other third-party payors seek to contain or reduce the costs of health care through various means, and in certain foreign markets, pricing or profitability of therapeutic and other pharmaceutical products is subject to governmental control. In the United States, there have been, and we expect that there will continue to be, a number of federal and state proposals to implement similar governmental control. The ACA requires discounts under the Medicare drug benefit program and increases the rebates paid by pharmaceutical companies on drugs covered by Medicaid. In addition, the ACA imposes an annual fee, which will increase annually, on sales by branded pharmaceutical manufacturers.
In addition, third-party payors attempt to contain health care costs by demanding price discounts or rebates and limiting both the types and variety of drugs that they will cover and the amounts that they will pay for drugs. As a result, they may not cover or provide adequate payment for our products. We might need to conduct post-marketing studies in order to demonstrate the cost-effectiveness of our products or any other future products to such payors’ satisfaction. Such studies might require us to commit a significant amount of management’s time and financial and other resources. Our products might not ultimately be considered cost-effective. Adequate third-party reimbursement might not be available to enable us to maintain price levels sufficient to realize an appropriate return on our investment in product development.
Reimbursement rates may vary according to the use of the drug and the clinical setting in which it is used, may be based on payments allowed for lower-cost products that already are reimbursed, may be incorporated into existing payments for other products or services and may reflect budgetary constraints and/or imperfections in the data used to calculate these rates. Net prices for products are reduced by mandatory discounts or rebates required by government health care programs and privately-negotiated discounts. While we have implemented policies in an effort to comply with mandated reimbursement rates, the U.S. federal government, state governments and private payors frequently pursue actions against pharmaceutical and biotechnology companies alleging that the companies have overstated prices in order to inflate reimbursement rates. Any such action could adversely affect the pricing of and revenues from our products.
Specialty pharmaceuticals are drugs that are prescribed by specialist physicians to treat rare or life-threatening conditions and typically address smaller patient populations. Each of our products is a specialty pharmaceutical product, and our research and development programs are focused on developing additional specialty pharmaceutical products. The increasing availability and use of innovative specialty pharmaceuticals, combined with their relative higher cost as compared to other types of pharmaceutical products, is beginning to generate significant third-party payor interest in developing cost-containment strategies targeted to this sector. While the effect on us of payers' efforts to control access to and pricing of specialty pharmaceuticals has been limited to date, the increasing use of health technology assessment in markets around the world and the deteriorating finances of governments may lead to significant adverse business affects in the future.
33
Any legislation or regulatory changes or relaxation of laws that restrict imports of drugs from other countries also could reduce the net price we receive for our products.
If we market any of our products in a manner that violates federal or state health care laws, including fraud and abuse laws, laws prohibiting off-label promotion, disclosure laws or other similar laws, we may be subject to civil or criminal penalties.
We are subject to health care fraud and abuse laws, such as the federal False Claims Act and the anti-kickback provisions of the federal Social Security Act, laws prohibiting off-label product promotion and other similar state and federal laws and regulations. While we have a corporate compliance program designed to actively identify, prevent and mitigate risk through the implementation of compliance policies and systems and the promotion of a culture of compliance, if we are found not to be in full compliance with these laws our business could be materially harmed.
The federal anti-kickback law prohibits knowingly and willfully offering, paying, soliciting, receiving or providing remuneration, directly or indirectly, in exchange for or to induce either the referral of an individual, or the ordering, furnishing, arranging for or recommending of an item or service that is reimbursable, in whole or in part, by a federal health care program, such as Medicare or Medicaid. The federal statute has been interpreted to apply to arrangements between pharmaceutical manufacturers on the one hand and prescribers, patients, purchasers and formulary managers on the other hand, and therefore constrains our marketing practices and our various service arrangements with physicians, including physicians who make clinical decisions to use our products. Although there are a number of statutory exemptions and regulatory safe harbors protecting certain common activities from prosecution, the exemptions and safe harbors are drawn narrowly, and practices that involve remuneration intended to induce prescribing, purchasing or recommending may be subject to scrutiny or penalty if they do not qualify for an exemption or safe harbor.
Federal false claims laws prohibit any person from knowingly presenting, or causing to be presented, a false claim for payment to the federal government, or knowingly making, or causing to be made, a false statement to get a false claim paid. Pharmaceutical companies have been prosecuted under these laws for a variety of alleged promotional and marketing activities, such as providing free product to customers with the expectation that the customers would bill federal programs for the product; reporting to pricing services inflated average wholesale prices that were then used by federal programs to set reimbursement rates; engaging in promotion for uses that the FDA has not approved, known as “off-label” uses, that caused claims to be submitted to Medicaid for non-covered off-label uses; and submitting inflated “best price” information to the Medicaid Rebate Program.
Although physicians are permitted, based on their medical judgment, to prescribe products for indications other than those cleared or approved by the FDA, manufacturers are prohibited from promoting their products for such off-label uses. We market INCIVEK for adults with genotype 1 HCV infection and KALYDECO for patients six years of age and older with CF who have the G551D mutation in the
CFTR
gene and provide promotional materials and training programs to physicians regarding the use of INCIVEK and KALYDECO in these patient populations. If the FDA determines that our promotional materials, training or other activities constitute off-label promotion, it could request that we modify our training or promotional materials or other activities or subject us to regulatory enforcement actions, including the issuance of a warning letter, injunction, seizure, civil fine and criminal penalties. It also is possible that other federal, state or foreign enforcement authorities might take action if they believe that the alleged improper promotion led to the submission and payment of claims for an off-label use, which could result in significant fines or penalties under other statutory authorities, such as laws prohibiting false claims for reimbursement. Even if it is later determined we were not in violation of these laws, we may be faced with negative publicity, incur significant expenses defending our actions and have to divert significant management resources from other matters.
Also applicable to some of our practices is HIPAA and its implementing regulations, which created federal criminal laws that prohibit executing a scheme to defraud any health care benefit program or making false statements relating to health care matters and which also imposes certain regulatory and contractual requirements regarding the privacy, security and transmission of individually identifiable health information.
The majority of states also have statutes or regulations similar to the federal anti-kickback law and false claims laws, which apply to items and services reimbursed under Medicaid and other state programs, or, in several states, apply regardless of the payor. In addition, certain states have laws governing the privacy of certain health information, which may differ from each other in significant ways and often are not preempted by HIPAA, complicating compliance efforts. Sanctions under
34
these federal and state laws may include civil monetary penalties, exclusion of a pharmaceutical manufacturer’s products from reimbursement under government programs and criminal fines. Even if we are not determined to have violated these laws, government investigations into these issues typically require the expenditure of significant resources and generate negative publicity, which could harm our business.
In recent years, several states and localities have enacted legislation requiring pharmaceutical companies to establish marketing compliance programs, file periodic reports with the state or make periodic public disclosures on sales, marketing, pricing, clinical trials, health care provider payments and other activities. Additionally, as part of the ACA, the federal government recently enacted the Physician Payment Sunshine Act provisions. The Physician Payment Sunshine Act provisions will require pharmaceutical manufacturers to report annually to the Secretary of HHS payments or other transfers of value made by that entity to physicians and teaching hospitals. In February 2013, regulations were released that contain detailed guidance regarding the information that must be collected and reported. We will be required to collect information regarding such payments starting in August 2013 and to begin reporting such information in March 2014. Over the next several years, we will need to dedicate significant resources to enhance our systems and processes in order to comply with these regulations. Failure to comply with the reporting requirements would result in significant civil monetary penalties. The ACA also includes various provisions designed to strengthen significantly fraud and abuse enforcement, such as increased funding for enforcement efforts and the lowering of the intent requirement of the federal anti-kickback statute and criminal health care fraud statute such that a person or entity no longer needs to have actual knowledge of this statute or specific intent to violate it.
If our past or present operations are found to be in violation of any such laws or any other governmental regulations that may apply to us, we may be subject to penalties, including civil and criminal penalties, damages, fines, exclusion from federal health care programs and/or the curtailment or restructuring of our operations. The risk of our being found in violation of these laws is increased by the fact that many of them have not been fully interpreted by the regulatory authorities or the courts, and their provisions are subject to a variety of interpretations. Any action against us for violation of these laws, even if we successfully defend against them, could cause us to incur significant legal expenses and divert our management’s attention from the operation of our business.
The sales and marketing practices of our industry have been the subject of increased scrutiny from federal and state government agencies, and we believe that this trend will continue. We have in place policies to govern how we may retain health care professionals as consultants that reflect the current climate on this issue and are providing training on these policies. Any action against us for violation of these laws, even if we successfully defend against them, could cause us to incur significant legal expenses and divert our management’s attention from the operation of our business.
Future health care reform measures could hinder or prevent commercial success of our products and drug candidates.
The United States federal government and other governments have shown significant interest in pursuing health care reform. Any government-adopted reform measures could adversely affect the pricing of health care products, including our approved products and/or any future drug candidates approved for sale. The continuing efforts of governments, insurance companies, managed care organizations and other payors for health care products to contain or reduce health care costs may adversely affect our ability to set prices we believe are fair for our products or any drugs we may develop and commercialize.
New laws, regulations and judicial decisions, or new interpretations of existing laws, regulations and decisions, relating to health care availability, methods of delivery or payment for drugs, or sales, marketing or pricing, may limit our potential revenues, and we may need to revise our research and development or commercialization programs. The pricing and reimbursement environment may change in the future and become more challenging for any of several reasons, including policies advanced by the U.S. government, new health care legislation or fiscal challenges faced by government health administration authorities. Specifically, in the United States and some foreign jurisdictions, there have been a number of legislative and regulatory proposals and initiatives to change the health care system in ways that could affect our ability to sell products. Some of these proposed and implemented reforms could result in reduced reimbursement rates for our current or future products, which would adversely affect our business, operations and financial results. The ACA has far reaching consequences for biopharmaceutical companies like us. As a result of this legislation, substantial changes are being made to the current system for paying for health care in the United States, including changes made in order to extend medical benefits to those who would otherwise lack health insurance coverage. If reimbursement for our products is substantially less than we expect in the future, or rebate obligations associated with them are substantially increased, our business could be materially and adversely affected.
35
Further federal and state proposals and health care reforms in and outside of the United States could limit the prices that can be charged for our products and may further limit our commercial opportunity. Our results of operations could be materially adversely affected by the ACA, by the Medicare prescription drug coverage legislation, by the possible effect of such current or future legislation on amounts that private insurers will pay and by other health care reforms that may be enacted or adopted in the future.
Risks Related to Development, Clinical Testing and Regulation of our Products and Drug Candidates
We are investing significant resources in our development program for VX-809 in combination with ivacaftor, based primarily on data from a Phase 2 clinical trial in which patients received VX-809 in combination with ivacaftor over a short duration. If we are unable to show the safety and efficacy of VX-809 in combination with ivacaftor, or experience delays in doing so, our business would be materially harmed.
In February 2013, we initiated a Phase 3 clinical development program for VX-809 in combination with ivacaftor. We initiated this program based primarily on data from a Phase 2 clinical trial in which a relatively small number of patients received VX-809 as a monotherapy for 28 days, followed by VX-809 in combination with ivacaftor for 28 days. The pattern of lung function response observed in both Cohort 2 and Cohort 3 of this clinical trial was similar, with a decline in FEV
1
during the VX-809 monotherapy dosing period followed by a statistically significant increase in FEV
1
during the VX-809 and ivacaftor combination dosing period. We expect to enroll approximately 500 patients with CF who are homozygous for the F508del mutation in each of our two Phase 3 clinical trials, for a total of approximately 1,000 patients. VX-809 will be evaluated in combination with ivacaftor over a significantly longer dosing period of 24 weeks and without the monotherapy lead-in period. In order to obtain approval for VX-809 in combination with ivacaftor, we will need to show that VX-809 in combination with ivacaftor is safe and effective in a significantly larger number of patients than were involved in the Phase 2 clinical trial, over the significantly longer 24-week combination dosing period. If we are unable to show the safety and efficacy of VX-809 and ivacaftor in the relevant patient populations, or experience delays in doing so, our business would be materially harmed.
Our drug candidates remain subject to clinical testing and regulatory approval. If we are unable to successfully develop additional drug candidates, our business will be materially harmed.
Our business depends upon the successful development and commercialization of additional drug candidates. These drug candidates are in various stages of development and must satisfy rigorous standards of safety and efficacy before they can be approved by the FDA or comparable foreign regulatory authorities for sale. To satisfy these standards, we must allocate resources among our various development programs and must engage in expensive and lengthy testing of our drug candidates. Discovery and development efforts for new pharmaceutical products, including new combination therapies, are resource-intensive and may take 10 to 15 years or longer for each drug candidate. Despite our efforts, our drug candidates may not:
|
•
|
offer therapeutic or other improvement over existing competitive drugs;
|
|
•
|
be proven safe and effective in clinical trials;
|
|
•
|
meet applicable regulatory standards;
|
|
•
|
be capable of being produced in commercial quantities at acceptable costs; or
|
|
•
|
if approved for commercial sale, be successfully marketed as pharmaceutical products.
|
We have ongoing or planned clinical trials for a number of our drug candidates and ivacaftor, which is being evaluated in additional patient groups. The strength of our company’s product portfolio and pipeline will depend in large part upon the outcomes of these clinical trials. Findings, including toxicology findings, in nonclinical studies conducted concurrently with clinical trials as well as results of our clinical trials could lead to abrupt changes in our development activities, including the possible cessation of development activities associated with a particular drug candidate or program. Furthermore, results from our clinical trials may not meet the level of statistical significance required by the FDA or other regulatory authorities for approval of a drug candidate.
Many companies in the pharmaceutical and biotechnology industries, including us, have suffered significant setbacks in later-stage clinical trials even after achieving promising results in earlier-stage clinical trials. Accordingly, the results from
36
completed preclinical studies and clinical trials may not be replicated in later clinical trials, and ongoing clinical trials for our drug candidates may not be predictive of the results we may obtain in later-stage clinical trials or of the likelihood of approval of a drug candidate for commercial sale. In addition, from time to time we report interim data from our clinical trials. Interim data from a clinical trial may not be predictive of final results from the clinical trial.
If we are unable to obtain regulatory approval, we will be unable to commercialize our drug candidates.
Our drug candidates are subject to extensive governmental regulations relating to their development, clinical evaluation, manufacturing and commercialization. Rigorous nonclinical testing and clinical trials and an extensive regulatory approval process are required in the United States and in most other countries prior to the commercial sale of drug candidates. Satisfaction of these and other regulatory requirements is costly, time-consuming, uncertain and subject to unanticipated delays. It is possible that none of the drug candidates we are developing will be approved for marketing.
The time required to complete clinical trials and to satisfy the FDA and other countries’ regulatory review processes is uncertain and typically takes many years. Our analysis of data obtained from nonclinical and clinical activities is subject to confirmation and interpretation by regulatory authorities, which could delay, limit or prevent regulatory approval. We also may encounter unanticipated delays or increased costs due to government regulation from future legislation or administrative action or changes in governmental policy during the period of drug development, clinical trials and governmental regulatory review.
Any failure to obtain regulatory approvals for a drug candidate would prevent us from commercializing that drug candidate. Any delay in obtaining required regulatory approvals could materially adversely affect our ability to successfully commercialize a drug candidate. Furthermore, any regulatory approval to market a drug may be subject to limitations that we do not expect on the indicated uses for which we may market the drug. Any such limitations could reduce the size of the market for the drug.
We also are subject to numerous foreign regulatory requirements governing the conduct of clinical trials, manufacturing and marketing authorization, pricing and third-party reimbursement. The foreign regulatory approval process includes all of the risks associated with the FDA approval process described above, as well as risks attributable to the satisfaction of foreign requirements. Approval by the FDA does not ensure approval by regulatory authorities outside the United States and approval by a foreign regulatory authority does not ensure approval by the FDA. In addition, the FDA may not favorably consider data from clinical trials conducted in foreign jurisdictions. Foreign jurisdictions have different approval procedures than those required by the FDA and may impose additional testing requirements for our drug candidates.
If clinical trials are prolonged or delayed, our development timelines for the affected development program could be extended, our costs to develop the compound could increase and the competitive position of the compound could be adversely affected.
We cannot predict whether or not we will encounter problems with any of our completed, ongoing or planned clinical trials that will cause us or regulatory authorities to delay or suspend clinical trials, or delay the analysis of data from our completed or ongoing clinical trials. Any of the following could delay our development programs:
|
•
|
ongoing discussions with the FDA or comparable foreign authorities regarding the scope or design of our clinical trials and the number of clinical trials we must conduct;
|
|
•
|
delays in enrolling volunteers or patients into clinical trials, including as a result of low numbers of patients that meet the eligibility criteria for the trial;
|
|
•
|
a lower than anticipated retention rate of volunteers or patients in clinical trials;
|
|
•
|
the need to repeat clinical trials as a result of inconclusive results, unforeseen complications in testing or clinical investigator error;
|
|
•
|
inadequate supply or deficient quality of drug candidate materials or other materials necessary for the conduct of our clinical trials;
|
|
•
|
unfavorable FDA or foreign regulatory authority inspection and review of a manufacturing facility that supplied clinical trial materials or its relevant manufacturing records or a clinical trial site or records of any clinical or preclinical investigation;
|
37
|
•
|
unfavorable scientific results from clinical trials;
|
|
•
|
serious and unexpected drug-related side-effects experienced by participants in our clinical trials or by participants in clinical trials being conducted by our competitors to evaluate drug candidates with similar mechanisms of action or structures to drug candidates that we are developing;
|
|
•
|
favorable results in testing of our competitors’ drug candidates, or FDA or foreign regulatory authority approval of our competitors’ drug candidates; or
|
|
•
|
action by the FDA or a foreign regulatory authority to place a clinical hold on a trial.
|
Our ability to enroll patients in our clinical trials in sufficient numbers and on a timely basis is subject to a number of factors, including the size of the patient population, the nature of the protocol, the proximity of patients to clinical sites, the availability of effective treatments for the relevant disease, the number of other clinical trials ongoing and competing for patients in the same indication and the eligibility criteria for the clinical trial. In addition, patients may drop out of our clinical trials or may be lost to follow-up medical evaluation after treatment ends, and this could impair the validity or statistical significance of the trials. Delays in patient enrollment or unforeseen drop-out rates may result in increased costs and longer development times.
We, our collaborators, the FDA or other applicable regulatory authorities may suspend clinical trials of a drug candidate at any time if we or they believe the healthy volunteers or patients participating in such clinical trials are being exposed to unacceptable health risks or for other reasons. Any such suspension could materially adversely affect the development of a particular drug candidate and our business.
We may not successfully develop VX-135 or VX-222 and, as a result, we could be subject to significant impairment charges in future periods.
In 2011, we licensed HCV nucleotide analogues from Alios and recorded
$250.6 million
as an intangible asset on our consolidated balance sheet. In 2009, we acquired ViroChem Pharma Inc., or ViroChem, for $100.0 million in cash and 10.7 million shares of our common stock. We acquired ViroChem to secure rights to two non-nucleoside HCV polymerase inhibitors, VX-222 and VX-759. In the third quarter of 2011, we determined that the fair value of VX-759 was zero dollars, which resulted in a
$105.8 million
impairment charge in the third quarter of 2011. As of December 31, 2012, our consolidated balance sheet included intangible assets of
$412.9 million
related to VX-222 and
$250.6 million
related to the Alios HCV nucleotide program.
There are numerous reasons why we may not be able to successfully develop a combination therapy for the treatment of HCV infection that includes VX-222, VX-135 or a combination of both of them, including:
|
•
|
data from clinical trials involving compounds evaluated separately may not predict possible outcomes, such as unforeseen drug interactions from compounds dosed in combination, which could negatively affect the efficacy and safety profile of the combination therapy;
|
|
•
|
positive results in small clinical trials and nonclinical studies may not be predictive of results in clinical trials involving large numbers of patients; and
|
|
•
|
favorable results of testing or earlier FDA or foreign regulatory approval of competitors’ products with a better product profile.
|
There can be no assurance that we will successfully develop VX-222 or VX-135, and if we do not successfully develop both of these drug candidates we will incur additional impairment charges in future periods related to VX-222 and/or VX-135. If we incur a significant impairment charge, the value of our common stock could decrease.
If our processes and systems are not compliant with regulatory requirements, we could be subject to restrictions on marketing our products or could be delayed in submitting regulatory filings seeking approvals for our drug candidates.
We have a number of regulated processes and systems that are required to obtain and maintain regulatory approval for our drugs and drug candidates. These processes and systems are subject to continual review and periodic inspection by the FDA and other regulatory bodies. If compliance issues are identified at any point in the development and approval process,
38
we may experience delays in filing for regulatory approval for our drug candidates, or delays in obtaining regulatory approval after filing. Any later discovery of previously unknown problems or safety issues with approved drugs or manufacturing processes, or failure to comply with regulatory requirements, may result in restrictions on such drugs or manufacturing processes, withdrawal of drugs from the market, the imposition of civil or criminal penalties or a refusal by the FDA and/or other regulatory bodies to approve pending applications for marketing approval of new drugs or supplements to approved applications, any of which could have a material adverse effect on our business. In addition, we are a party to agreements that transfer responsibility for complying with specified regulatory requirements, such as filing and maintenance of marketing authorizations and safety reporting or compliance with manufacturing requirements, to our collaborators and third-party manufacturers. If our collaborators or third-party manufacturers do not fulfill these regulatory obligations, any drugs for which we or they obtain approval may be subject to later restrictions on manufacturing or sale, which could have a material adverse effect on our business.
Risks Related to Collaborators, Manufacturing and Reliance on Third Parties
We depend on our collaborators to work with us to develop, manufacture and commercialize our products and some of our drug candidates.
We have granted development and commercialization rights for telaprevir to Janssen (worldwide other than North America and specific countries in Asia) and to Mitsubishi Tanabe (specific countries in Asia). We are entitled to royalties from sales of INCIVO (telaprevir) in Janssen’s territories. The success of the commercialization of INCIVO in Janssen’s territories is dependent, in part, upon Janssen’s sales and marketing efforts, which we do not control and may not be able to effectively influence. If Janssen does not effectively market INCIVO, our cash flows from royalties on net sales of INCIVO would be materially harmed. We also in-license VX-135 from Alios and any loss of this license would materially harm our efforts to develop an all-oral, interferon-free treatment regimen for HCV infection.
The risks that we face in connection with these existing and any future collaborations include the following:
|
•
|
Our collaborators may change the focus of their development and commercialization efforts or may have insufficient resources to effectively develop our drug candidates. The ability of some of our products and drug candidates to reach their potential could be limited if collaborators decrease or fail to increase development or commercialization efforts related to those products or drug candidates.
|
|
•
|
Any future collaboration agreements may have the effect of limiting the areas of research and development that we may pursue, either alone or in collaboration with third parties.
|
|
•
|
Collaborators may develop and commercialize, either alone or with others, drugs that are similar to or competitive with the drugs or drug candidates that are the subject of their collaborations with us. For example, Janssen is dedicating significant development resources and planning to seek approval to market TMC435, a potentially competitive HCV protease inhibitor, which could increase the likelihood that Janssen would terminate our collaboration or apply fewer resources to marketing INCIVO.
|
|
•
|
Our collaboration agreements are subject to termination under various circumstances, including, as in the case of our agreement with Janssen, termination without cause. Any such termination by Janssen could have a material adverse effect on our financial condition and/or disrupt the commercial sale of INCIVO in Janssen’s territories.
|
39
We depend on third-party manufacturers, including sole source suppliers, to manufacture our products and the materials we require for our clinical trials. We may not be able to maintain these relationships and could experience supply disruptions outside of our control.
We rely on a worldwide network of third-party manufacturers to manufacture and distribute INCIVEK (telaprevir) and KALYDECO (ivacaftor) for commercial sale and clinical trials, and our drug candidates for clinical trials. As a result of our reliance on these third-party manufacturers and suppliers, including sole source suppliers of certain components of our products and drug candidates, we could be subject to significant supply disruptions outside of our control. Our supply chain for sourcing raw materials and manufacturing drug product ready for distribution is a multi-step international endeavor. Third-party contract manufacturers, including some in China, supply us with raw materials, and contract manufacturers in the European Union and the United States convert these raw materials into drug substance and convert the drug substance into final dosage form. Establishing and managing this global supply chain requires a significant financial commitment and the creation and maintenance of numerous third-party contractual relationships. Although we attempt to effectively manage the business relationships with companies in our supply chain, we do not have control over their operations.
Supply disruptions may result from a number of factors, including shortages in product raw materials, labor or technical difficulties, regulatory inspections or restrictions, shipping or customs delays or any other performance failure by any third-party manufacturer on which we rely. Any supply disruptions could disrupt sales of our products and/or the timing of our clinical trials. Furthermore, we may be required to modify our production methods to permit us to economically manufacture our drugs for sale and our drug candidates for clinical trials. These modifications may require us to re-evaluate our resources and the resources of our third-party manufacturers, which could result in abrupt changes in our production methods and supplies.
We require a supply of INCIVEK for sale in North America. We believe there are multiple third parties capable of providing most of the materials and services we need in order to manufacture and distribute INCIVEK. It is also possible that supply of materials that can not be second-sourced can be managed with inventory planning. We have limited flexibility to adjust our supply in response to changes in demand, due to the significant lead times required to manufacture INCIVEK.
We require a supply of ivacaftor for commercial sale (as KALYDECO) and for use in our clinical trials. We obtain ivacaftor to meet our commercial and clinical supply needs through a third-party manufacturing network. Our supply chain includes several sole source suppliers. A disruption in the commercial supply of KALYDECO for patients would have a significant impact on patients, our business and our product revenues. A disruption in the clinical supply of ivacaftor could delay the completion of clinical trials and impact timelines for filing an sNDA or NDA. In 2013, we plan to obtain an alternative source for the active ingredient of ivacaftor, which is a sole-sourced material that is critical to the supply of ivacaftor, and to obtain second source suppliers in 2014 for other components of the ivacaftor supply chain. There can be no assurance that we will be able to establish secondary sources for all of our KALYDECO supply needs on a timely basis or at all.
In the course of providing its services, a contract manufacturer may develop process technology related to the manufacture of our products or drug candidates that the manufacturer owns, either independently or jointly with us. This would increase our reliance on that manufacturer or require us to obtain a license from that manufacturer in order to have our products or drug candidates manufactured by other suppliers utilizing the same process.
In 2012, we recorded an aggregate of
$133.2 million
in charges for excess and obsolete INCIVEK inventories, and future adverse changes in the outlook for commercial sales of INCIVEK could result in additional inventory write-downs and related charges.
In 2012, we recorded an aggregate of
$133.2 million
in charges for excess and obsolete INCIVEK inventories. These charges were based on our analysis of our INCIVEK inventory levels in relation to our commercial outlook for INCIVEK. As part of the analysis, we considered, among other factors, (i) decreases in demand for INCIVEK during 2012 and our expectation that demand would decrease further in the future, (ii) the potential development by us of other drugs and combination treatments for HCV infection, including pursuant to collaboration agreements to evaluate VX-135 in combination with drug candidates controlled by third parties, that make it unlikely that INCIVEK will play a role in future combination therapies, (iii) the placement of a Boxed Warning on the INCIVEK prescribing information in December 2012, (iv) the potential development by our competitors of other drugs and combination treatments for HCV infection, (v) positive results reported in 2012 from clinical trials of drug candidates being developed by us and our competitors and (vi) the
40
initiation by our competitors of additional Phase 2 and Phase 3 clinical trials evaluating drug candidates for the treatment of HCV infection. We will continue to evaluate our INCIVEK inventories on a quarterly basis, and future adverse changes in the outlook for commercial sales of INCIVEK, including changes due to future developments with respect to demand for INCIVEK or the advancement or approval of other drugs or combination treatments for HCV infection, could result in additional inventory write-downs and related charges in future periods, which could be material.
We may not be able to attract collaborators or external funding for the development and commercialization of certain of our drug candidates.
As part of our ongoing strategy, we may seek additional collaborative arrangements or external funding for certain of our development programs and/or seek to expand existing collaborations to cover additional commercialization and/or development activities. We have a number of research programs and early-stage and mid-stage clinical development programs, and we have entered into non-exclusive collaboration agreements to evaluate VX-135 in combination with compounds controlled by Janssen and GlaxoSmithKline. At any time, we may determine that in order to continue development of a drug candidate or program or successfully commercialize a drug we need to identify a collaborator or expand an existing collaboration. Potentially, and depending on the circumstances, we may desire that a collaborator either agree to fund portions of a drug development program led by us, or agree to provide all the funding and directly lead the development and commercialization of a program. No assurance can be given that any efforts we make to seek additional collaborative arrangements will be successfully completed on a timely basis or at all. If we are unable to enter into acceptable collaborative relationships, one or more of our development programs could be delayed or terminated and the possibility of our receiving a return on our investment in the program could be impaired.
We rely on third parties to conduct our clinical trials, and those third parties may not perform satisfactorily, including failing to meet established deadlines for the completion of such trials or regulatory requirements.
We rely on third parties such as contract research organizations to help manage our clinical trial process and on medical institutions and clinical investigators to enroll qualified patients and conduct our clinical trials. Our reliance on these third parties for clinical development activities reduces our control over these activities. Accordingly, these third-party contractors may not complete activities on schedule, or may not conduct our clinical trials in accordance with regulatory requirements or our trial design. If these third parties do not successfully carry out their contractual duties or meet expected deadlines, we may be required to replace them. Although we believe that there are a number of other third-party contractors we could engage to continue these activities, it may result in a delay of the affected trial. If clinical trials are not conducted in accordance with our contractual expectations or regulatory requirements, action by regulatory authorities might significantly and adversely affect the conduct or progress of these trials or in specific circumstances might result in a requirement that a trial be redone. Accordingly, our efforts to obtain regulatory approvals for and commercialize our drug candidates could be delayed.
Risks Related to Intellectual Property
If our patents do not protect our drugs, or our drugs infringe third-party patents, we could be subject to litigation and substantial liabilities.
We have numerous issued patents and patent applications pending in the United States, as well as counterparts in other countries. Our success will depend, in significant part, on our ability to obtain and maintain U.S. and foreign patent protection for our drugs, their uses and our processes, to preserve our trade secrets and to operate without infringing the proprietary rights of third parties. In particular, we believe that composition-of-matter claims are the most significant patent claims for companies in our segment of the pharmaceutical industry, which focuses on small molecules that are new chemical compounds. While we have patents or patent applications with composition-of-matter claims for each of our products and clinical drug candidates, only a portion of these patents have been granted. We cannot be certain that any patents will issue from our patent applications or, even if patents issue or have issued, that the issued claims will provide us with any significant protection against competitive products or otherwise be valuable commercially.
Due to evolving legal standards relating to the patentability, validity and enforceability of patents covering pharmaceutical inventions and the scope of claims made under these patents, our ability to maintain, obtain and enforce patents is uncertain and involves complex legal and factual questions. U.S. and foreign patent applications typically are maintained in confidence for a period of time after they initially are filed with the applicable patent office. Similarly,
41
publication of discoveries in the scientific literature often lag behind actual discoveries. Consequently, we cannot be certain that we or our licensors were the first to invent, or the first to file patent applications on, our products or drug candidates or their use. If a third party also has filed a U.S. patent application relating to our products or drug candidates or a similar invention, we may have to participate in interference proceedings to determine priority of invention and could lose our patent position. Furthermore, we may not have identified all U.S. and foreign patents or published applications that affect our business by blocking our ability to commercialize our drugs or drug candidates.
Our patents may be challenged by third parties, resulting in the patent being deemed invalid, unenforceable or narrowed in scope, or the third party may circumvent any such issued patents. Also, our pending patent applications may not issue, and we may not receive any additional patents. Our patents might not contain claims that are sufficiently broad to prevent others from utilizing our technologies. For instance, the issued patents relating to our products or drug candidates may be limited to a particular molecule or molecules and may not cover similar molecules that have similar clinical properties. Consequently, our competitors may independently develop competing products that do not infringe our patents or other intellectual property.
The laws of many foreign jurisdictions do not protect intellectual property rights to the same extent as in the United States and many companies have encountered significant difficulties in protecting and defending such rights in foreign jurisdictions. If we encounter such difficulties in protecting or are otherwise precluded from effectively protecting our intellectual property rights in foreign jurisdictions, our business could be substantially harmed.
Because of the extensive time required for development, testing and regulatory review of a drug candidate, it is possible that, before a drug candidate can be commercialized, the related patent may expire or remain in force for only a short period following commercialization of such drug candidate, thereby reducing any advantages of the patent. To the extent our drug candidates are not commercialized significantly ahead of the expiration date of any applicable patent, or to the extent we have no other patent protection on such drug candidates, those drug candidates would not be protected by patents, and we would then rely solely on other forms of exclusivity, such as regulatory exclusivity provided by the FDCA.
Risks Related To Our Operations
If we are unable to successfully implement our strategic plan, our business may be materially harmed.
Our strategy is to make focused investments to invent and develop innovative drugs, while we continue to market INCIVEK and KALYDECO to eligible patients to generate revenues and maintain a strong financial position. We expect our total revenues to decline in 2013 as compared to 2012 as a result of expected decreases in INCIVEK revenues. While we are seeking to increase our revenues from KALYDECO monotherapy, we do not believe that in the near term these potential increased revenues will be sufficient to offset expected declines in INCIVEK revenues. In order to maintain a strong financial position, we are focusing our development investment on our three key mid- to late-stage development programs in CF, HCV infection and autoimmune diseases. We also plan to continue our investment in research programs with a focus on identifying drug candidates for specialty markets.
Our INCIVEK net product revenues may decline more quickly than we currently anticipate and we may not be able to increase or sustain our KALYDECO revenues, which would make it difficult to maintain a strong financial position and continue our research and development investments at the levels we currently plan. In addition, there can be no assurance that our key development programs will be successful or that our research programs will result in drugs that we can successfully develop and commercialize.
If we fail to manage our operations effectively, our business may suffer.
We have experienced growth in our headcount and have expanded our global operations, which has placed, and will continue to place, significant demands on our management and our operational, research and development and financial infrastructure. To effectively manage our current and future potential growth, we will need to:
|
•
|
implement and clearly communicate our corporate-wide strategies;
|
|
•
|
enhance our operational and financial infrastructure, including our controls over records and information;
|
|
•
|
enhance our operational, financial and management processes, including our cross-functional decision-making processes and our portfolio management systems;
|
42
|
•
|
train and manage our global employee base;
|
|
•
|
transition from a U.S.-centric company into an organization capable of developing and commercializing multiple drug candidates in international markets; and
|
|
•
|
enhance our compliance and legal resources.
|
The transition to our new corporate headquarters in Boston, Massachusetts could materially disrupt our business operations.
We expect that the transition to our new corporate headquarters in Boston, Massachusetts will be complicated and will require us to expend significant logistical and financial resources in both 2013 and 2014. Our corporate headquarters and primary research facilities have been located in Cambridge, Massachusetts in close proximity to numerous other biotechnology companies since our founding in 1989. While we do not expect the move to result in significant turnover, we cannot be sure that we will be able to retain all our key scientific, commercial and management employees.
We are endeavoring to complete the interior fit-out of the two new buildings in Boston, Massachusetts by late 2013, and we are planning for a staggered move of employees, office and laboratory supplies and certain equipment from our current facilities to our new corporate headquarters beginning after the completion of the fit-out of the two new buildings. We will need to complete the fit-out and conduct the move on schedule in order to complete the decommissioning of our existing facilities in Cambridge, Massachusetts in a timely manner. We expect that the move, even if executed on schedule, will cause disruptions to our business operations in Massachusetts, including disruptions to our use of certain laboratories and other research and development facilities. Our business operations could be materially harmed if the completion of the interior fit-out is significantly delayed, if the move does not proceed as scheduled or if the disruptions to our use of laboratories and other research and development facilities are more significant than expected.
Our business has a substantial risk of product liability claims. If we do not obtain appropriate levels of insurance, product liability claims could adversely affect our business.
Our business exposes us to significant potential product liability risks that are inherent in the development, clinical testing, manufacturing and sales and marketing of human therapeutic products. We have product liability insurance and clinical trial insurance in amounts that we believe are adequate to cover this risk. However, our insurance may not provide adequate coverage against potential liabilities. If a claim is brought against us, we might be required to pay legal and other expenses to defend the claim, as well as pay uncovered damages awards resulting from a claim brought successfully against us and these damages could be significant and have a material adverse effect on our financial condition. Furthermore, whether or not we are ultimately successful in defending any such claims, we might be required to direct significant financial and managerial resources to such defense and adverse publicity is likely to result.
Risks associated with operating in foreign countries could materially adversely affect our business.
We have expanded our operations in Canada in order to market INCIVEK and KALYDECO and in other international markets in order to market KALYDECO. A significant portion of our commercial supply chain, including sourcing of raw materials and manufacturing, is located in China, Japan and the European Union. Consequently, we are, and will continue to be, subject to risks related to operating in foreign countries. Risks associated with conducting operations in foreign countries include:
|
•
|
differing regulatory requirements for drug approvals and regulation of approved drugs in foreign countries;
|
|
•
|
collectibility of accounts receivable;
|
|
•
|
unexpected changes in tariffs, trade barriers and regulatory requirements;
|
|
•
|
economic weakness, including inflation, or political instability in particular foreign economies and markets;
|
|
•
|
compliance with tax, employment, immigration and labor laws for employees living or traveling abroad;
|
|
•
|
foreign taxes, including withholding of payroll taxes;
|
|
•
|
foreign currency fluctuations, which could result in increased operating expenses or reduced revenues, and other obligations incident to doing business or operating in another country;
|
43
|
•
|
workforce uncertainty in countries where labor unrest is more common than in the United States;
|
|
•
|
production shortages resulting from any events affecting raw material supply or manufacturing capabilities abroad; and
|
|
•
|
business interruptions resulting from geo-political actions, including war and terrorism.
|
These and other risks associated with our international operations could materially adversely affect our business.
In addition, our international operations are subject to regulation under U.S. law. For example, the Foreign Corrupt Practices Act prohibits U.S. companies and their representatives from offering, promising, authorizing or making payments to foreign officials for the purpose of obtaining or retaining business abroad. In many countries, the health care professionals we regularly interact with may meet the definition of a foreign government official for purposes of the Foreign Corrupt Practices Act. We also are subject to import/export control laws. Failure to comply with domestic or foreign laws could result in various adverse consequences, including the possible delay in approval or refusal to approve a product, recalls, seizures, withdrawal of an approved product from the market, the imposition of civil or criminal sanctions, the prosecution of executives overseeing our international operations and corresponding bad publicity and negative perception of our company in foreign countries.
If we acquire or license technologies, resources or drug candidates, we will incur a variety of costs and may never realize benefits from the transaction.
If appropriate opportunities become available, we might license or acquire technologies, resources, drugs or drug candidates. We might never realize the anticipated benefits of such a transaction, and we may later incur impairment charges related to assets acquired in any such transaction. In particular, due to the risks inherent in drug development, we may not successfully develop or obtain marketing approval for the drug candidates we acquire. For example, we incurred a $105.8 million impairment charge in the third quarter of 2011 in connection with VX-759, which we obtained through our 2009 acquisition of ViroChem. Future licenses or acquisitions could result in potentially dilutive issuances of equity securities, the incurrence of debt, the creation of contingent liabilities, impairment expenses related to goodwill, and impairment or amortization expenses related to other intangible assets, which could harm our financial condition.
If we fail to attract and retain skilled employees, our business could be materially harmed.
The number of our employees increased by approximately
10%
during
2012
and approximately
18%
during
2011
, and we are likely to experience additional growth in 2013. Because our drug discovery and development activities are highly technical in nature, we require the services of highly qualified and trained scientists who have the skills necessary to conduct these activities. In addition, we need to attract and retain employees with experience in marketing and commercialization of medicines. We face intense competition for our personnel from our competitors and other companies throughout our industry. Moreover, the growth of local biotechnology companies and the expansion of major pharmaceutical companies into the Boston area have increased competition for the available pool of skilled employees, especially in technical fields, and the high cost of living in Massachusetts makes it difficult to attract employees from other parts of the country to Massachusetts. Our ability to commercialize our products, and achieve our research and development objectives, depends on our ability to respond effectively to these demands and expand our internal organization to accommodate anticipated growth. If we are unable to hire qualified personnel or manage our growth effectively, there could be a material adverse effect on our business.
The loss of the services of key employees or the failure to effectively integrate key employees could negatively affect our business and future growth.
Our future success will depend in large part on our ability to retain the services of our key scientific and management personnel and to integrate new scientific and management personnel into our business. A loss of key personnel or a failure to properly integrate new personnel could be disruptive. We have entered into employment agreements with some executives and provide compensation-related benefits to all of our key employees that vest over time and therefore induce them to remain with us. However, the employment agreements can be terminated by the executive on relatively short notice. The value to employees of stock-related benefits that vest over time—such as options and restricted stock—is significantly affected by movements in our stock price, and may at any point in time be insufficient to counteract more lucrative offers from other companies. A failure to retain, as well as hire, train and effectively integrate into our organization a sufficient
44
number of qualified scientists, professionals, sales personnel and senior management would negatively affect our business and our ability to grow our business.
If we do not comply with laws regulating the protection of the environment and health and human safety, our business could be adversely affected.
Our research and development efforts involve the controlled use of hazardous materials, chemicals and various radioactive compounds. Although we believe that our safety procedures for handling and disposing of these materials comply with the standards prescribed by state, federal and foreign regulations, the risk of accidental contamination or injury from these materials can not be eliminated. If an accident occurs, we could be held liable for resulting damages, which could be substantial. We also are subject to numerous environmental, health and workplace safety laws and regulations, including those governing laboratory procedures, exposure to blood-borne pathogens and the handling of biohazardous materials. Although we maintain workers’ compensation insurance to cover us for costs we may incur due to injuries to our employees resulting from the use of these materials, this insurance may not provide adequate coverage against potential liabilities. We maintain insurance to cover pollution conditions or other extraordinary or unanticipated events relating to our use and disposal of hazardous materials that we believe is appropriate based on the small amount of hazardous materials we generate. Additional federal, state and local laws and regulations affecting our operations may be adopted in the future. We may incur substantial costs to comply with, and substantial fines or penalties if we violate, any of these laws or regulations.
Risks Related to Holding Our Common Stock and Potential Financing Activities
Our stock price may fluctuate.
Market prices for securities of companies such as ours are highly volatile. From January 1, 2011 to December 31, 2012, our common stock traded between
$26.50
and
$66.10
per share. The market for our stock, like that of other companies in the pharmaceuticals industry, has from time to time experienced significant price and volume fluctuations. The future market price of our securities could be significantly and adversely affected by factors such as:
|
•
|
the information contained in our quarterly earnings releases, including our net product revenues, royalty revenues and operating expenses for completed periods and guidance regarding future periods;
|
|
•
|
prescription data and other information disclosed by third-parties regarding our business or products;
|
|
•
|
announcements of FDA actions with respect to our drugs or our competitors’ drugs, or regulatory filings for our drug candidates or those of our competitors or of results of clinical trials or nonclinical studies relating to our drugs, drug candidates or those of our competitors;
|
|
•
|
technological innovations or the introduction of new drugs by our competitors;
|
|
•
|
government regulatory action;
|
|
•
|
public concern as to the safety of drugs developed by us or our competitors;
|
|
•
|
developments in patent or other intellectual property rights or announcements relating to these matters;
|
|
•
|
developments in domestic and international governmental policy or regulation, for example relating to intellectual property rights;
|
|
•
|
developments relating specifically to other companies and market conditions for pharmaceutical and biotechnology stocks or stocks in general;
|
|
•
|
business development, capital structuring or financing activities; and
|
|
•
|
general worldwide or national economic, political and capital market conditions.
|
Our quarterly operating results are subject to significant fluctuation.
Our operating results have fluctuated from quarter to quarter in the past, and we expect that they will continue to do so in the future. Factors that have caused quarterly fluctuations in the past include variable amounts of product revenues and
45
collaboration revenues, impairment charges, charges for excess and obsolete INCIVEK inventories and changes in the fair value of derivative instruments. We cannot accurately predict our future revenues from our products, and our revenues from our products could vary on a quarterly basis. Our revenues from our products, and in particular INCIVEK, may be affected by, among other factors, seasonality and the timing of orders from our significant customers. Our quarterly results also could be significantly affected by significant charges, which may or may not be similar to charges we have experienced in the past. Most of our operating expenses relate to our research and development activities, do not vary directly with the amount of revenues and are difficult to adjust in the short term. As a result, if revenues in a particular quarter are below expectations, we are unlikely to proportionately reduce operating expenses for that quarter.
These examples are only illustrative and other risks, including those discussed in these “Risk Factors,” could also cause fluctuations in our reported financial results. Our operating results during any one period do not necessarily suggest the results of future periods.
We expect that results from our clinical development activities and the clinical development activities of our competitors will continue to be released periodically, and may result in significant volatility in the price of our common stock.
Any new information regarding our products and drug candidates or competitive products or potentially competitive drug candidates can substantially affect investors’ perceptions regarding our future prospects. We, our collaborators and our competitors periodically provide updates regarding drug development programs, typically through press releases, conference calls and presentations at medical conferences. These periodic updates often include interim or final results from clinical trials conducted by us or our competitors and/or information about our or our competitors’ expectations regarding regulatory filings and submissions as well as future clinical development of our products or drug candidates, competitive products or potentially competitive drug candidates. The timing of the release of information by us regarding our drug development programs is often beyond our control and is influenced by the timing of receipt of data from our clinical trials and by the general preference among pharmaceutical companies to disclose clinical data during medical conferences. In addition, the information disclosed about our clinical trials, or our competitors' clinical trials, may be based on interim rather than final data that may involve interpretation difficulties and may in any event not accurately predict final results.
We could be negatively affected by securities class action complaints.
On September 6, 2012, a purported securities class action lawsuit was commenced in the United States District Court for the District of Massachusetts under the caption
City of Bristol Pension Fund v. Vertex Pharmaceuticals Incorporated, et al.
, naming as defendants us and certain of our current and former officers and directors. The lawsuit alleges that we made material misrepresentations and/or omissions of material fact in our public disclosures during the period from May 7, 2012 through June 28, 2012, all in violation of Section 10(b) of the Securities Exchange Act of 1934, as amended, and Rule 10b-5 promulgated thereunder. By order dated December 12, 2012, the court appointed the City of Bristol lead plaintiff and appointed the City of Bristol's attorneys lead counsel. The plaintiffs filed an amended complaint on February 11, 2013. The plaintiffs seek unspecified monetary damages on behalf of the putative class and an award of costs and expenses, including attorney's fees, as well as disgorgement of the proceeds from certain individual defendants' sales of our common stock. We believe that this action is without merit and intend to defend it vigorously. This action will take time and money to defend and may distract us from more productive activities. No assurance can be provided that we will be successful in defending this claim or that insurance proceeds will be sufficient to cover any liability under such claims.
We may need to raise additional capital that may not be available.
Although we do not have any plans to do so in the near term, we may in the future need to raise additional capital. Any potential public offering or private placement may or may not be similar to the transactions that we have completed in the past. Any debt financing may be on terms that, among other things, include conversion features that could result in dilution to our then-existing security holders and restrict our ability to pay interest and dividends—although we do not intend to pay dividends for the foreseeable future. Any equity financings would result in dilution to our then-existing security holders. If adequate funds are not available on acceptable terms, or at all, we may be required to curtail significantly or discontinue one or more of our research, drug discovery or development programs, including clinical trials, incur significant cash exit costs, or attempt to obtain funds through arrangements with collaborators or others that may require us to relinquish rights to certain of our technologies, drugs or drug candidates. Based on many factors, including general economic conditions, additional financing may not be available on acceptable terms, if at all.
46
Outstanding indebtedness may make it more difficult to obtain additional financing or reduce our flexibility to act in our best interests.
We are obligated to repay an aggregate of
$400.0 million
for our convertible senior subordinated notes due 2015, or 2015 Notes, no later than October 1, 2015. We also are obligated to make semi-annual interest payments on the outstanding principal amount of the 2015 Notes. We may issue additional convertible debt or incur other types of indebtedness in the future. The level of our indebtedness could affect us by:
|
•
|
making it more difficult to obtain additional financing for working capital, capital expenditures, debt service requirements or other purposes;
|
|
•
|
shortening the duration of available revolving credit because lenders may seek to avoid conflicting maturity dates;
|
|
•
|
constraining our ability to react quickly in an unfavorable economic climate or to changes in our business or the pharmaceutical industry; or
|
|
•
|
potentially requiring the dedication of substantial amounts to service the repayment of outstanding debt, including periodic interest payments, thereby reducing the amount of cash available for other purposes.
|
Issuances of additional shares of our common stock could cause the price of our common stock to decline.
As of
December 31, 2012
, we had
217.3 million
shares of common stock issued and outstanding. As of
December 31, 2012
, we also had outstanding options to purchase
19.7 million
shares of common stock with a weighted-average exercise price of
$38.09
per share and
8.2 million
shares of common stock issuable upon conversion of our 2015 Notes, at a conversion price of approximately
$48.83
per share. Outstanding vested options are likely to be exercised if the market price of our common stock exceeds the applicable exercise price, and, in the future, we expect to issue additional options and restricted stock to directors and employees. In addition, we may issue additional common stock or restricted securities in the future as part of financing activities or business development activities and any such issuances may have a dilutive effect on existing shareholders. Sales of substantial amounts of our common stock in the open market, or the availability of such shares for sale, could adversely affect the price of our common stock. In addition, the issuance of restricted common stock or common stock upon exercise of any outstanding options would be dilutive, and may cause the market price for a share of our common stock to decline.
We have adopted anti-takeover provisions and are subject to Massachusetts corporate laws that may frustrate any attempt to remove or replace our current management or effectuate a business combination involving Vertex.
Our corporate charter and by-law provisions and Massachusetts state laws may discourage certain types of transactions involving an actual or potential change of control of Vertex that might be beneficial to us or our security holders. Our charter provides for staggered terms for the members of the Board of Directors. Our by-laws grant the directors a right to adjourn annual meetings of shareholders, and certain provisions of our by-laws may be amended only with an 80% shareholder vote. We may issue shares of any class or series of preferred stock in the future without shareholder approval and upon such terms as our Board of Directors may determine. The rights of the holders of common stock will be subject to, and may be adversely affected by, the rights of the holders of any class or series of preferred stock that may be issued in the future. Massachusetts state law prohibits us from engaging in specified business combinations, unless the combination is approved or consummated in a prescribed manner, and prohibits voting by any shareholder who acquires 20% or more of our voting stock without shareholder approval. As a result, shareholders or other parties may find it more difficult to remove or replace our current management.
SPECIAL NOTE REGARDING FORWARD-LOOKING STATEMENTS
This Annual Report on Form 10-K and, in particular, the description of our Business set forth in Item 1, the Risk Factors set forth in this Item 1A and our Management’s Discussion and Analysis of Financial Condition and Results of Operations set forth in Item 7 contain or incorporate a number of forward-looking statements within the meaning of Section 27A of the Securities Act of 1933, as amended, and Section 21E of the Securities Exchange Act of 1934, as amended, including statements regarding:
47
|
•
|
expectations regarding the amount of, timing of and trends with respect to our revenues, costs and expenses and other gains and losses, including those related to net product revenues from sales of INCIVEK and KALYDECO and royalty revenues from net sales of INCIVO and to the intangible assets associated with the ViroChem acquisition and the Alios collaboration;
|
|
•
|
our expectations regarding clinical trials, development timelines and regulatory authority filings and submissions for telaprevir, ivacaftor, VX-135, VX-222, VX-509, VX-661, VX-787 and VX-809;
|
|
•
|
our expectations regarding the timing of data from our clinical trials of ivacaftor monotherapy and VX-809 in combination with ivacaftor, the possibility of using that data to support regulatory submissions and the timing of those potential submissions;
|
|
•
|
our ability to successfully market INCIVEK and/or KALYDECO or any of our other drug candidates if we obtain regulatory approval;
|
|
•
|
our expectations regarding the timing and structure of clinical trials of our drugs and drug candidates, including telaprevir, ivacaftor, VX-135, VX-222, VX-509, VX-661, VX-787 and VX-809, and the expected timing of our receipt of data from our ongoing and planned clinical trials;
|
|
•
|
the data that will be generated by ongoing and planned clinical trials and the ability to use that data to support regulatory filings;
|
|
•
|
our beliefs regarding the support provided by clinical trials and preclinical and nonclinical studies of our drug candidates for further investigation, clinical trials or potential use as a treatment;
|
|
•
|
the focus of our drug development efforts and our financial and management resources and our plan to continue investing in our research and development programs and our strategy to develop our drug candidates, alone or with third party-collaborators;
|
|
•
|
the establishment, development and maintenance of collaborative relationships;
|
|
•
|
potential business development activities;
|
|
•
|
our ability to use our research programs to identify and develop new drug candidates to address serious diseases and significant unmet medical needs;
|
|
•
|
our estimates regarding obligations associated with a lease of a facility in Kendall Square, Cambridge, Massachusetts; and
|
|
•
|
our liquidity and our expectations regarding the possibility of raising additional capital.
|
Any or all of our forward-looking statements in this Annual Report on Form 10-K may turn out to be wrong. They can be affected by inaccurate assumptions or by known or unknown risks and uncertainties. Many factors mentioned in this Annual Report on Form 10-K will be important in determining future results. Consequently, no forward-looking statement can be guaranteed. Actual future results may vary materially from expected results. We also provide a cautionary discussion of risks and uncertainties under “Risk Factors” above in this Item 1A. These are factors and uncertainties that we think could cause our actual results to differ materially from expected results. Other factors and uncertainties besides those listed there could also adversely affect us.
Without limiting the foregoing, the words “believes,” “anticipates,” “plans,” “intends,” “expects” and similar expressions are intended to identify forward-looking statements. There are a number of factors and uncertainties that could cause actual events or results to differ materially from those indicated by such forward-looking statements, many of which are beyond our control, including the factors and uncertainties set forth under “Risk Factors” above in this Item 1A. In addition, the forward-looking statements contained herein represent our estimate only as of the date of this filing and should not be relied upon as representing our estimate as of any subsequent date. While we may elect to update these forward-looking statements at some point in the future, we specifically disclaim any obligation to do so to reflect actual results, changes in assumptions or changes in other factors affecting such forward-looking statements.
48
|
ITEM 1B.
|
UNRESOLVED STAFF COMMENTS
|
We did not receive any written comments from the Securities and Exchange Commission prior to the date 180 days before the end of the fiscal year ended December 31, 2012 regarding our filings under the Securities Exchange Act of 1934, as amended, that have not been resolved.
|
ITEM 2.
|
PROPERTIES
|
Massachusetts Headquarters
We lease an aggregate of approximately 870,000 square feet of space in eleven facilities situated near our current corporate headquarters located at 130 Waverly Street in Cambridge, Massachusetts. In May 2011, in order to consolidate our operations in Massachusetts into one campus, we entered into two leases pursuant to which we agreed to lease approximately 1.1 million square feet of office and laboratory space in two connected buildings being built at Fan Pier in Boston, Massachusetts, which will become our new corporate headquarters. We expect that the leases will commence in December 2013 and will extend for 15 years from the commencement date. We have an option to extend the term of the leases for an additional ten years. In addition, in connection with our relocation to Boston, we entered into a lease in June 2012 for approximately 100,000 square feet of space in the Boston Marine Industrial Park, in close proximity to the Fan Pier site. We expect to use this additional space for certain logistical and laboratory operations and small-scale manufacturing equipment that will complement the new office and laboratory facilities at our Fan Pier headquarters.
Existing Facilities in Massachusetts
We currently lease approximately 100,000 square feet of laboratory and office space for our 130 Waverly Street corporate headquarters and approximately 192,000 square feet of laboratory and office space at 200 Sidney Street, located adjacent to our corporate headquarters. The 130 Waverly Street and 200 Sidney Street leases expire on December 31, 2015. We lease approximately 145,000 square feet at 88 Sidney Street, Cambridge, Massachusetts under a lease that expires in June 2014. We also lease approximately 56,000 square feet of office space at One Marina Park Drive, Boston, Massachusetts. This is a five-year lease that began in the third quarter of 2011 with one option to extend for either five or ten years.
The lease for our Kendall Square, Cambridge, Massachusetts facility will expire in 2018. We have the option to extend this lease for two consecutive ten-year terms. We have subleased approximately 145,000 square feet of the Kendall Square facility and use the remaining 147,000 square feet of space we lease in the facility for our research operations. The subleases are for terms ending in 2015, with one sublease having an extension option to 2018.
Transition to Fan Pier Corporate Headquarters
We are in the process of planning our transition to our new corporate headquarters at Fan Pier. We expect that this transition will be complicated and will require us to expend significant logistical and financial resources in both 2013 and 2014. We are endeavoring to complete the interior fit-out of the two new buildings by late 2013, including the construction of new laboratory and office space that will support our current and future needs. We also are planning for a staggered move of employees, office and laboratory supplies, and specific equipment from our current facilities to our new headquarters beginning after completion of the fit-out of the two new buildings in early 2014 and continuing into mid-2014. In addition, we are preparing to decommission our existing laboratory facilities in Cambridge, Massachusetts upon completion of the move to our Fan Pier headquarters.
Additional United States and Worldwide Locations
In addition to our facilities in Massachusetts, we lease an aggregate of approximately 230,000 square feet of space in facilities located in California, Washington DC, Iowa, Canada, Switzerland, the United Kingdom, France, Germany and Australia. This includes laboratory and office space to support our research and development organizations in San Diego, California, Montreal, Quebec, Coralville, Iowa and Milton Park, Abingdon, England.
49
|
ITEM 3.
|
LEGAL PROCEEDINGS
|
On September 6, 2012, a purported shareholder class action,
City of Bristol Pension Fund v. Vertex Pharmaceuticals Incorporated, et al.
, was filed in the United States District Court for the District of Massachusetts, naming us and certain of our current and former officers and directors as defendants. The lawsuit alleges that we made material misrepresentations and/or omissions of material fact in our public disclosures during the period from May 7, 2012 through June 28, 2012, all in violation of Section 10(b) of the Securities Exchange Act of 1934, as amended, and Rule 10b-5 promulgated thereunder. By order dated December 12, 2012, the court appointed the City of Bristol lead plaintiff and appointed the City of Bristol's attorneys lead counsel. The plaintiffs filed an amended complaint on February 11, 2013. The plaintiffs seek unspecified monetary damages on behalf of the putative class and an award of costs and expenses, including attorney's fees, as well as disgorgement of the proceeds from certain individual defendants' sales of our common stock. We believe that this action is without merit and intend to defend it vigorously.
|
ITEM 4.
|
MINE SAFETY DISCLOSURES
|
Not applicable.
50
|
ITEM 5.
|
MARKET FOR REGISTRANT'S COMMON EQUITY, RELATED STOCKHOLDER MATTERS AND ISSUER PURCHASES OF EQUITY SECURITIES
|
Market Information
Our common stock is traded on The NASDAQ Global Select Market under the symbol “VRTX.” The following table sets forth for the periods indicated the high and low sale prices per share of our common stock as reported by NASDAQ Stock Market LLC:
|
Year Ended December 31, 2012:
|
High
|
Low
|
|||||
|
First quarter
|
$
|
43.13
|
|
$
|
32.04
|
|
|
|
Second quarter
|
66.10
|
|
35.26
|
|
|||
|
Third quarter
|
59.98
|
|
46.03
|
|
|||
|
Fourth quarter
|
60.00
|
|
38.44
|
|
|||
|
Year Ended December 31, 2011:
|
|||||||
|
First quarter
|
$
|
52.13
|
|
$
|
35.19
|
|
|
|
Second quarter
|
58.87
|
|
44.57
|
|
|||
|
Third quarter
|
54.38
|
|
39.06
|
|
|||
|
Fourth quarter
|
45.26
|
|
26.50
|
|
|||
Shareholders
As of
February 15, 2013
, there were 2,277 holders of record of our common stock.
Performance Graph
CUMULATIVE TOTAL RETURN
Based on Initial Investment of $100 on December 31, 2007
with dividends reinvested (fiscal years ended December 31)
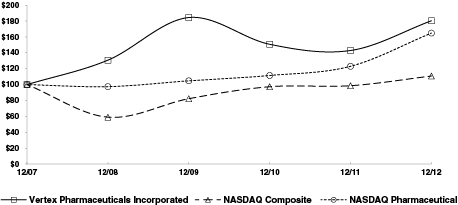
51
Dividends
We have never declared or paid any cash dividends on our common stock, and we currently expect that any future earnings will be retained for use in our business.
Issuer Repurchases of Equity Securities
The table set forth below shows all repurchases of securities by us during the three months ended
December 31, 2012
:
|
Period
|
Total Number
of Shares Purchased |
Average Price
Paid per Share |
Total Number of Shares
Purchased as Part of Publicly Announced Plans or Programs |
Maximum Number of
Shares that May Yet be Purchased Under the Plans or Programs |
||||
|
Oct. 1, 2012 to Oct. 31, 2012
|
14,425
|
|
$
|
0.01
|
|
—
|
—
|
|
|
Nov. 1, 2012 to Nov. 30, 2012
|
27,159
|
|
$
|
0.01
|
|
—
|
—
|
|
|
Dec. 1, 2012 to Dec. 31, 2012
|
23,573
|
|
$
|
0.01
|
|
—
|
—
|
|
The repurchases were made under the terms of our Amended and Restated 2006 Stock and Option Plan. Under this plan, we award shares of restricted stock to our employees that typically are subject to a lapsing right of repurchase by us. We may exercise this right of repurchase if a restricted stock recipient’s service to us is terminated. If we exercise this right, we are required to repay the purchase price paid by or on behalf of the recipient for the repurchased restricted shares, which typically is the par value per share of $0.01. Repurchased shares returned to the Amended and Restated 2006 Stock and Option Plan are available for future awards under the terms of that plan.
52
|
ITEM 6.
|
SELECTED FINANCIAL DATA
|
The following unaudited selected consolidated financial data are derived from our audited consolidated financial statements. These data should be read in conjunction with our audited consolidated financial statements and related notes that are included elsewhere in this Annual Report on Form 10-K and with “Management’s Discussion and Analysis of Financial Condition and Results of Operations” included in Item 7 below.
|
Year Ended December 31,
|
|||||||||||||||||||
|
2012
|
2011
|
2010
|
2009
|
2008
|
|||||||||||||||
|
(in thousands, except per share amounts)
|
|||||||||||||||||||
|
Consolidated Statements of Operations Data:
|
|||||||||||||||||||
|
Product revenues, net
|
$
|
1,333,458
|
|
$
|
950,889
|
|
$
|
—
|
|
$
|
—
|
|
$
|
—
|
|
||||
|
Royalty revenues
|
141,498
|
|
50,015
|
|
30,244
|
|
28,320
|
|
37,483
|
|
|||||||||
|
Collaborative revenues
|
52,086
|
|
409,722
|
|
113,126
|
|
73,569
|
|
138,021
|
|
|||||||||
|
Total revenues
|
1,527,042
|
|
1,410,626
|
|
143,370
|
|
101,889
|
|
175,504
|
|
|||||||||
|
Total costs and expenses (1)
|
1,524,710
|
|
1,296,806
|
|
839,447
|
|
715,901
|
|
638,212
|
|
|||||||||
|
Income (loss) from operations
|
2,332
|
|
113,820
|
|
(696,077
|
)
|
(614,012
|
)
|
(462,708
|
)
|
|||||||||
|
Net loss (income) attributable to noncontrolling interest (Alios) (2)
|
(55,897
|
)
|
(11,605
|
)
|
—
|
|
—
|
|
—
|
|
|||||||||
|
Net income (loss) attributable to Vertex
|
$
|
(107,032
|
)
|
$
|
29,574
|
|
$
|
(754,626
|
)
|
$
|
(642,178
|
)
|
$
|
(459,851
|
)
|
||||
|
Net income (loss) per diluted share attributable to Vertex common shareholders
|
$
|
(0.50
|
)
|
$
|
0.14
|
|
$
|
(3.77
|
)
|
$
|
(3.71
|
)
|
$
|
(3.27
|
)
|
||||
|
Shares used in per diluted share calculations
|
211,946
|
|
208,807
|
|
200,402
|
|
173,259
|
|
140,556
|
|
|||||||||
|
As of December 31,
|
|||||||||||||||||||
|
2012
|
2011
|
2010
|
2009
|
2008
|
|||||||||||||||
|
(in thousands)
|
|||||||||||||||||||
|
Consolidated Balance Sheet Data:
|
|||||||||||||||||||
|
Cash, cash equivalents and marketable securities
|
$
|
1,321,215
|
|
$
|
968,922
|
|
$
|
1,031,411
|
|
$
|
1,284,913
|
|
$
|
832,101
|
|
||||
|
Total assets
|
2,759,288
|
|
2,204,280
|
|
1,725,446
|
|
1,955,488
|
|
980,479
|
|
|||||||||
|
Total current liabilities
|
432,624
|
|
392,348
|
|
474,783
|
|
284,883
|
|
216,564
|
|
|||||||||
|
Long-term debt obligations (3)
|
400,000
|
|
400,000
|
|
400,000
|
|
159,972
|
|
287,500
|
|
|||||||||
|
Construction financing lease obligation (4)
|
268,031
|
|
55,950
|
|
—
|
|
—
|
|
—
|
|
|||||||||
|
Other long-term obligations
|
424,251
|
|
390,470
|
|
346,690
|
|
414,287
|
|
237,541
|
|
|||||||||
|
(1)
|
In 2012, total costs and expenses included an aggregate of
$133.2 million
in lower of cost or market charges for excess and obsolete INCIVEK inventories. See
Note F
to our financial statements.
|
In 2011, total costs and expenses included an intangible asset impairment charge of $105.8 million. See
Note I
to our financial statements.
|
(2)
|
Net loss (income) attributable to noncontrolling interest (Alios) relates to our collaboration with Alios. See
Note B
to our financial statements.
|
|
(3)
|
As of December 31, 2012, long-term debt obligations consisted of $400.0 million in aggregate principal amount of convertible senior subordinated notes (due 2015). See Note K to our financial statements.
|
|
(4)
|
In 2011, we entered into two leases for our future corporate headquarters. We are deemed for accounting purposes to be the owner of the buildings during the construction period. See
Note H
to our financial statements.
|
53
|
ITEM 7.
|
MANAGEMENT'S DISCUSSION AND ANALYSIS OF FINANCIAL CONDITION AND RESULTS OF OPERATIONS
|
OVERVIEW
We are in the business of discovering, developing, manufacturing and commercializing small molecule drugs for patients with serious diseases. Over the last two years, we have obtained approval for, and initiated commercial sales of, our first two products: INCIVEK (telaprevir), which we market in the United States and Canada for the treatment of adults with genotype 1 hepatitis C virus, or HCV, infection; and KALYDECO (ivacaftor), which we market in the United States, Canada and Europe for the treatment of patients six years of age and older with cystic fibrosis, or CF, who have a specific genetic mutation that is referred to as the G551D mutation. We receive royalties from sales in Europe and other countries of telaprevir, which is marketed as INCIVO, by our collaborator, Janssen Pharmaceutica, N.V.
We invest in scientific innovation to create transformative medicines for patients with serious diseases, with a focus on specialty markets. Our strategy is to make focused investments to invent and develop innovative drugs, while we continue to market INCIVEK and KALYDECO to eligible patients to generate revenues and maintain a strong financial position.
Each of our products has achieved rapid acceptance for the treatment of patients in the United States, and our total revenues have increased from $143.4 million in 2010 to $1.5 billion in 2012. Our 2012 total revenues included INCIVEK net product revenues of
$1.2 billion
and KALYDECO net product revenues of
$171.6 million
. As of December 31, 2012, we had cash, cash equivalents and marketable securities of
$1.3 billion
. We expect that our total net product revenues will decline in 2013. Our net product revenues from sales of INCIVEK declined over the course of 2012, and we expect this trend to continue due to reduced demand for current therapies for HCV infection, as it appears that new competitive therapies will reach the market over the next several years. We expect that KALYDECO product revenues will increase in 2013 as compared to 2012, as we secure reimbursement for KALYDECO in additional international markets. In the future, we expect that our ability to increase net product revenues will be dependent upon increasing KALYDECO sales and introducing one or more of our late-stage development products to the market.
In the near term, we plan to focus most of our drug development investment on the following key programs:
Cystic Fibrosis -
Our goal is to develop treatment regimens that will provide benefits to as many patients with CF as possible and to maximize those benefits. We are conducting three Phase 3 label-expansion clinical trials and a proof-of-concept clinical trial of ivacaftor monotherapy in people with certain mutations in their cystic fibrosis transmembrane conductance regulator, or
CFTR,
gene that were not studied in prior Phase 3 clinical trials. In February 2013, we initiated an international pivotal Phase 3 development program to evaluate combinations of ivacaftor and our investigational CF corrector VX-809 for patients with the most prevalent genetic mutation that causes CF.
HCV
- We are investigating all-oral, interferon-free treatment regimens that are 12 weeks or less in duration with a goal of providing a high viral cure rate and improved tolerability, in order to be commercially competitive in the HCV market of the future. We plan to conduct multiple Phase 2 clinical trials to evaluate all-oral combination treatment regimens that include our HCV nucleotide analogue VX-135 together with molecules that have potentially complimentary mechanisms, such as ribavirin, or RBV, HCV protease inhibitors, HCV NS5A inhibitors and non-nucleoside HCV polymerase inhibitors.
Autoimmune Diseases
- We are evaluating our JAK3 inhibitor, VX-509, in a Phase 2 clinical trial that is expected to enroll approximately 350 patients with rheumatoid arthritis.
We may seek collaborators for some of our drug candidates in order to diversify risk, broaden or accelerate or otherwise benefit a development program in an effort to fully-realize the value of a drug candidate.
We plan to continue investing in our research programs and supporting scientific innovation in order to identify and develop transformative medicines. We believe that pursuing research in diverse areas allows us to balance the risks inherent in drug development and may provide the drug candidates that will form our pipeline in future years. We have later-stage research programs in the areas of cystic fibrosis, Huntington's disease, multiple sclerosis and cancer.
Discovery and development of a new pharmaceutical product is a difficult and lengthy process that requires significant financial resources along with extensive technical and regulatory expertise and can take 10 to 15 years or more. Potential drug candidates are subjected to rigorous evaluations, driven in part by stringent regulatory considerations, designed to
54
generate information concerning efficacy, side-effects, proper dosage levels and a variety of other physical and chemical characteristics that are important in determining whether a drug candidate should be approved for marketing as a pharmaceutical product. Most chemical compounds that are investigated as potential drug candidates never progress into development, and most drug candidates that do advance into development never receive marketing approval. Because our investments in drug candidates are subject to considerable risks, we closely monitor the results of our discovery research, clinical trials and nonclinical studies, and frequently evaluate our drug development programs in light of new data and scientific, business and commercial insights, with the objective of balancing risk and potential. This process can result in relatively abrupt changes in focus and priority as new information becomes available and we gain additional understanding of our ongoing programs and potential new programs as well as those of our competitors.
If we believe the data from a completed registration program support approval of a drug candidate, we submit a New Drug Application, or NDA, to the United States Food and Drug Administration, or FDA, requesting approval to market the drug candidate in the United States and seek analogous approvals from comparable regulatory authorities in foreign jurisdictions. To obtain approval, we must, among other things, demonstrate with evidence gathered in nonclinical studies and well-controlled clinical trials that the drug candidate is safe and effective for the disease it is intended to treat and that the manufacturing facilities, processes and controls for the manufacture of the drug candidate are adequate. The FDA and foreign regulatory authorities have substantial discretion in deciding whether or not a drug candidate should be granted approval based on the benefits and risks of the drug candidate in the treatment of a particular disease, and could delay, limit or deny regulatory approval. If regulatory delays are significant or regulatory approval is limited or denied altogether, our financial results and the commercial prospects for the drug candidate involved will be harmed.
CF
KALYDECO (ivacaftor) is approved in the United States, Canada and the European Union for the treatment of patients with CF six years of age and older who have the G551D mutation on at least one allele of the
CFTR
gene. We are continuing our work in CF to identify and develop treatment regimens that will provide benefits to as many patients with CF as possible and to maximize those benefits. We have multiple ongoing clinical development programs to evaluate our CF treatment regimens, and our research group is working to identify additional corrector compounds that could be included in future dual- and/or triple-combination treatment regimens that have the potential to provide additional benefits to patients with CF.
Ivacaftor (monotherapy)
We are conducting three Phase 3 label-expansion clinical trials and a Phase 2 clinical trial of ivacaftor monotherapy:
|
•
|
We have completed enrollment in a Phase 3 clinical trial evaluating ivacaftor in patients six years of age and older with CF with gating mutations other than the G551D mutation.
|
|
•
|
We are continuing enrollment in a Phase 3 clinical trial evaluating ivacaftor in patients six years of age and older with CF with the R117H mutation in the
CFTR
gene on at least one allele.
|
|
•
|
We have begun dosing patients in a Phase 3 clinical trial in which we are evaluating a pediatric formulation of ivacaftor as a treatment for children two to five years of age with gating mutations in the
CFTR
gene, including the G551D mutation.
|
|
•
|
We are enrolling patients in a Phase 2 clinical trial in which we are evaluating ivacaftor in patients with CF who have clinical evidence of residual CFTR function.
|
If we are able to establish that these additional patient groups will benefit from ivacaftor monotherapy, there is the potential to increase the number of patients eligible for treatment with ivacaftor monotherapy to more than 10% of patients with CF. We expect to obtain data from the Phase 3 clinical trials evaluating patients six years of age and older in 2013.
55
VX-809 in Combination with Ivacaftor
In February 2013, we initiated an international pivotal Phase 3 clinical program to evaluate combinations of VX-809 and ivacaftor in patients with CF who have two copies of the F508del mutation in their
CFTR
gene (homozygous). We plan to conduct two 24-week Phase 3 clinical trials that are designed to support approval of the combination of VX-809 and ivacaftor for patients 12 years of age and older. Each Phase 3 clinical trial will enroll approximately 500 patients with CF who are homozygous for the F508del mutation, for a total of approximately 1,000 patients. The two clinical trials have the same design and together will be conducted at approximately 200 clinical trial sites in North America, Europe and Australia. We expect to obtain final safety and efficacy data from both Phase 3 clinical trials in 2014. If these trials are successful, we plan to submit an NDA to the FDA in 2014 and a Marketing Authorization Application, or MAA, to the European Medicines Agency, or EMA.
We also plan to conduct an 8-week exploratory Phase 2 clinical trial of VX-809 in combination with ivacaftor in patients with CF who are 12 years of age and older and who have one copy of the F508del mutation in the
CFTR
gene and a pharmacokinetics and safety clinical trial to evaluate VX-809 in combination with ivacaftor in children with CF six to eleven years of age who have two copies of the F508del mutation. If successful, we plan to use the data from the pharmacokinetics and safety clinical trial, along with data from the two Phase 3 clinical trials, for registration in the United States in patients six to eleven years of age, following registration in patients 12 years of age and older, and are continuing discussions with European regulatory agencies for patients in this age group.
HCV
Janssen and we market INCIVEK/INCIVO in direct competition with Merck & Co., Inc.'s VICTRELIS™ (boceprevir), another HCV protease inhibitor that was approved for sale in the United States and Europe in 2011. We expect that a number of new therapies for HCV infection will become available to patients over the next several years. The most advanced drug candidates, Gilead's GS-7977 and Janssen's TMC435, may be approved for administration in combination with pegylated-interferon, or peg-IFN, and RBV, as soon as late 2013 or 2014. The top-line results reported by Gilead and Janssen from recently completed Phase 3 clinical trials suggest that the safety and efficacy profiles of GS-7977 and TMC435 will position them, if approved, to potentially take a significant portion of the market for HCV therapies.
We plan to compete in the HCV infection market as it shifts away from current treatment regimens, including our INCIVEK triple-combination therapy, to regimens that incorporate new drugs with improved safety, efficacy and/or tolerability, by pursuing development of all-oral regimens incorporating one or more of our drug candidates, particularly our HCV nucleotide analogue VX-135. A number of pharmaceutical companies are investigating combination regimens that incorporate one or more of an HCV protease inhibitor, an HCV nucleotide analogue, an HCV non-nucleotide polymerase inhibitor or an NS5A inhibitor. Clinical trials of these investigational combination regimens are being conducted in a wide variety of patient populations, including treatment-naïve and treatment-failure patients, and across all HCV genotypes, which respond differently to different combinations of molecules employing different mechanisms. In the future, we expect that the market for any specific HCV treatment regimen, including INCIVEK triple-combination therapy, could be affected by the introduction of new competitive drugs or drug combinations, sales from currently approved drugs, adverse information regarding the safety characteristics or efficacy of the regimen, significant new information regarding potential treatment regimens being evaluated in clinical trials, and enrollment by patients in clinical trials being conducted by us or our competitors. While it is possible that a portion of patients with HCV infection would continue to benefit from treatment regimens that include peg-IFN, we expect that treatment regimens that include the administration of peg-IFN by injection will command a relatively small portion of the overall market.
We are evaluating potential all-oral treatment regimens in planned and ongoing Phase 2 clinical trials in order to determine which regimen or regimens appear likely to provide benefits to patients and to take forward into Phase 3 clinical development. Some of our competitors' potential all-oral treatment regimens are more advanced, including all-oral treatment regimens that are being evaluated in Phase 3 clinical trials by Gilead and Abbvie, Inc. While the development and regulatory timelines for drug candidates for the treatment of HCV infection are subject to risk and uncertainty, and the development of a number of HCV infection drug candidates, including Bristol-Myers Squibb's BMS-986094 and one of our two HCV nucleotide analogues, ALS-2158, ended in 2012, we believe that (i) substantial additional clinical data regarding potential all-oral treatment regimens will become available in 2013 and (ii) it is possible that one or more all-oral treatment regimens for genotype 1 HCV infection could be commercially available as soon as late 2014. As a result, if we are successful in developing all-oral treatment regimens that include VX-135 and/or VX-222, independently or with a collaborator, it is likely
56
that our all-oral treatment regimens would compete directly with one or more previously approved all-oral treatment regimens.
Drug Supply
In order to generate revenues from our approved products, we must manufacture, or have manufactured, our products in accordance with our specifications and regulatory requirements and in sufficient quantities to satisfy demand. We rely on an international network of third parties to manufacture and distribute our products and for supplies of compounds for clinical trials, and we expect that we will continue to rely on third parties to provide these manufacturing services for the foreseeable future. Third-party contract manufacturers, including some in China, supply us with raw materials, and contract manufacturers in the European Union and the United States convert these raw materials into drug substance and convert the drug substance into final dosage form. Establishing and managing this global supply chain requires a significant financial commitment and the creation and maintenance of numerous third-party relationships. Although we believe we effectively manage the business relationships with companies in our supply chain, we do not have complete control over their activities.
We require a supply of INCIVEK for commercial sale in the United States and Canada. We attempt to manage our INCIVEK inventory levels based on forecasted demand, which has had variable results due to the rapidly evolving nature of the HCV market, which resulted in decreased demand for INCIVEK. We currently believe that we have sufficient supply to meet forecasted demand for INCIVEK. In addition, we have significant quantities of materials that we do not expect to utilize.
We require a supply of ivacaftor for commercial sale (as KALYDECO) and for use in our clinical trials. We obtain ivacaftor to meet our commercial and clinical supply needs through a third-party manufacturing network. Our supply chain includes sole source suppliers. A disruption in the commercial supply of KALYDECO for patients would have a significant impact on patients, our business and our product revenues. A disruption in the clinical supply of ivacaftor could delay the completion of clinical trials and impact timelines for filing an sNDA or NDA. Accordingly, we are in the process of establishing secondary sources for our KALYDECO supply needs to reduce the risk of a supply disruption. In 2013, we plan to obtain an alternative source for the active ingredient of ivacaftor, which is a sole-sourced material that is critical to the supply of ivacaftor, and to obtain second source suppliers in 2014 for other components of the ivacaftor supply chain. There can be no assurance that we will be able to establish secondary sources for all of our KALYDECO supply needs on a timely basis or at all.
Regulatory Compliance
Our marketing of pharmaceutical products, which began in 2011, is subject to extensive and complex laws and regulations. We have a corporate compliance program designed to actively identify, prevent and mitigate risk through the implementation of compliance policies and systems and the promotion of a culture of compliance. Among other laws, regulations and standards, we are subject to various federal and state laws pertaining to health care fraud and abuse, including anti-kickback and false claims statutes, and laws prohibiting the promotion of drugs for unapproved, or off-label, uses. Anti-kickback laws make it illegal for a prescription drug manufacturer to solicit, offer, receive or pay any remuneration in exchange for, or to induce, the referral of business, including the purchase or prescription of a particular drug. False claims laws prohibit anyone from presenting for payment to third-party payors, including Medicare and Medicaid, claims for reimbursed drugs or services that are false or fraudulent, claims for items or services not provided as claimed or claims for medically unnecessary items or services. We expect to continue to devote substantial resources to maintain, administer and expand these compliance programs globally.
Operations
Over the last several years we experienced significant growth and expanded our operations globally to support the launch of our first two products and our continued investment in key development and research programs. We are planning to move our corporate headquarters and a majority of our employees from a number of buildings in Cambridge, Massachusetts into a new facility in Boston, Massachusetts in the first half of 2014. This move is intended to allow us to consolidate our headquarters into one campus and to update our physical infrastructure, including our laboratories and other research facilities. In order to manage the global expansion of our business and our move to these new headquarters, we will need to enhance our cross-functional operational, financial and management processes while continuing to attract and maintain highly skilled employees. We expect that managing our growing operations will be challenging and will require significant financial and management resources.
57
RESULTS OF OPERATIONS
|
2012/2011
Comparison |
2011/2010
Comparison |
||||||||||||||||||||||||
|
2012
|
2011
|
2010
|
Increase (Decrease)
|
Increase (Decrease)
|
Increase (Decrease)
|
Increase/ (Decrease)
|
|||||||||||||||||||
|
(in thousands)
|
(in thousands, except percentages)
|
||||||||||||||||||||||||
|
Revenues
|
$
|
1,527,042
|
|
$
|
1,410,626
|
|
$
|
143,370
|
|
$
|
116,416
|
|
8
|
%
|
$
|
1,267,256
|
|
884
|
%
|
||||||
|
Operating costs and expenses
|
1,524,710
|
|
1,296,806
|
|
839,447
|
|
227,904
|
|
18
|
%
|
457,359
|
|
54
|
%
|
|||||||||||
|
Other loss, net
|
(53,467
|
)
|
(72,641
|
)
|
(58,549
|
)
|
(19,174
|
)
|
(26
|
)%
|
14,092
|
|
24
|
%
|
|||||||||||
|
Net loss (income) attributable to noncontrolling interest (Alios)
|
(55,897
|
)
|
(11,605
|
)
|
—
|
|
44,292
|
|
382
|
%
|
11,605
|
|
n/a
|
|
|||||||||||
|
Net income (loss) attributable to Vertex
|
$
|
(107,032
|
)
|
$
|
29,574
|
|
$
|
(754,626
|
)
|
n/a
|
|
n/a
|
|
n/a
|
|
n/a
|
|
||||||||
Net Income (Loss) Attributable to Vertex
Net loss attributable to Vertex was
$(107.0) million
in
2012
compared to net income attributable to Vertex of
$29.6 million
in 2011. The net loss attributable to Vertex in 2012 as compared to the net income attributable to Vertex in 2011 was due to increased operating expenses partially offset by increased revenues. Our
increased
revenues in
2012
as compared to
2011
were due to
increase
d INCIVEK net product revenues, increased INCIVO royalty revenues and KALYDECO net product revenues for which there were no comparable revenues in 2011, partially offset by
decrease
d collaborative revenues. Our operating costs and expenses increased in
2012
as compared to
2011
, principally due to increased research and development expenses, increased sales, general and administrative expenses and increased cost of product revenues.
In 2012, net income (loss) attributable to Vertex was negatively affected by an aggregate of
$133.2 million
in lower of cost or market charges for excess and obsolete INCIVEK inventories and an increase in the fair value of contingent milestone payments and royalties payable by us to Alios of
$115.0 million
. In 2011, net income attributable to Vertex was negatively affected by an impairment charge that had a net effect of
$73.1 million
and an increase in the fair value of contingent milestone payments and royalties payable by us to Alios of
$70.0 million
.
In 2010, prior to the obtaining marketing approval for our first product in 2011, we had net loss attributable to Vertex of
$(754.6) million
. Our increased revenues in 2011 as compared to 2010 were the result of INCIVEK net product revenues and collaborative milestone revenues in 2011 for which there were no comparable revenues in 2010. Our increased revenues were partially offset by increased operating costs and expenses in 2011 as compared to 2010.
Our operating costs and expenses in
2012
,
2011
and
2010
included
$114.3 million
,
$118.2 million
and
$91.1 million
, respectively, of stock-based compensation expense.
Net Income (Loss) Attributable to Vertex per Diluted Share
Net loss attributable to Vertex was
$(0.50)
per diluted share in
2012
as compared to net income attributable to Vertex of
$0.14
per diluted share in
2011
and net loss attributable to Vertex of
$(3.77)
per diluted share in
2010
.
58
Revenues
|
2012/2011
Comparison |
2011/2010
Comparison |
||||||||||||||||||||||||
|
2012
|
2011
|
2010
|
Increase/(Decrease)
|
Increase/(Decrease)
|
Increase/(Decrease)
|
Increase/(Decrease)
|
|||||||||||||||||||
|
(in thousands)
|
(in thousands, except percentages)
|
||||||||||||||||||||||||
|
Product revenues, net
|
$
|
1,333,458
|
|
$
|
950,889
|
|
$
|
—
|
|
$
|
382,569
|
|
40
|
%
|
$
|
950,889
|
|
n/a
|
|
||||||
|
Royalty revenues
|
141,498
|
|
50,015
|
|
30,244
|
|
91,483
|
|
183
|
%
|
19,771
|
|
65
|
%
|
|||||||||||
|
Collaborative revenues
|
52,086
|
|
409,722
|
|
113,126
|
|
(357,636
|
)
|
(87
|
)%
|
296,596
|
|
262
|
%
|
|||||||||||
|
Total revenues
|
$
|
1,527,042
|
|
$
|
1,410,626
|
|
$
|
143,370
|
|
$
|
116,416
|
|
8
|
%
|
$
|
1,267,256
|
|
884
|
%
|
||||||
Product Revenues, Net
|
2012
|
2011
|
2010
|
|||||||||
|
(in thousands)
|
|||||||||||
|
INCIVEK
|
$
|
1,161,813
|
|
$
|
950,889
|
|
$
|
—
|
|
||
|
KALYDECO
|
171,645
|
|
—
|
|
—
|
|
|||||
|
Total product revenues, net
|
$
|
1,333,458
|
|
$
|
950,889
|
|
$
|
—
|
|
||
Our total net product revenues
increase
d by
40%
in 2012 as compared to 2011 due to increased INCIVEK net product revenues in 2012 as compared to 2011 and KALYDECO net product revenues in 2012 for which there were no comparable revenues in 2011. In 2013, we expect that total product revenues will decline due to an expected decrease in INCIVEK net product revenues partially offset by an expected increase in KALYDECO net product revenues.
We began recognizing net product revenues from sales of INCIVEK in the second quarter of 2011. Our INCIVEK net product revenues increased by
$210.9 million
in 2012 as compared to 2011 due to our recognition of INCIVEK net product revenues over a full fiscal year in 2012 as compared to for a partial fiscal year in 2011. INCIVEK net product revenues have been declining on a quarterly basis since reaching a peak in the fourth quarter of 2011 and were
$222.8 million
in the fourth quarter of 2012. The declines in INCIVEK net product revenues in 2012 were principally due to decreasing numbers of patients with genotype 1 HCV infection who chose to start treatment with available treatment options. We believe these decreases are the result of a combination of factors, including new safety and efficacy data that have been reported by our competitors regarding treatment regimens for HCV infection that may become commercially available over the next several years.
We began recognizing net product revenues from sales of KALYDECO in the first quarter of 2012, and KALYDECO net product revenues increased on a quarterly basis during 2012. Since its approval, most eligible patients in the United States have initiated and are receiving treatment with KALYDECO. KALYDECO net product revenues were
$58.5 million
in the fourth quarter of 2012, including
$8.6 million
of net product revenues from countries in Europe. Further increases in KALYDECO net product revenues in 2013 are dependent on ongoing reimbursement decisions in international markets. We currently receive funding for KALYDECO from France and Germany, while we are continuing to discuss the reimbursement rate we will receive in those countries in future periods. Funding for KALYDECO has been recommended in England and Ireland, and we anticipate that reimbursement in these countries will begin in the second quarter of 2013.
Royalty Revenues
Janssen obtained approval to market INCIVO in the European Union in the third quarter of 2011. Our royalty revenues
increased
by
$91.5 million
in
2012
as compared to
2011
due to a
$97.3 million
increase
in royalty revenues from sales of INCIVO by Janssen. Our royalty revenues
increased
by
$19.8 million
in
2011
as compared to
2010
due to
$20.3 million
of revenues recognized in
2011
from sales of INCIVO by Janssen for which there were no comparable revenues in
2010
. Mitsubishi Tanabe's license to market telaprevir in Japan is fully paid.
We recognized royalty revenues related to sales by GlaxoSmithKline of an HIV protease inhibitor that was discovered and developed pursuant to our collaboration with GlaxoSmithKline of
$23.9 million
,
$29.7 million
and
$30.2 million
in
2012
,
2011
and
2010
, respectively. We sold our rights to these HIV royalties in 2008 for a one-time cash payment of
$160.0 million
.
59
Collaborative Revenues
Our collaborative revenues have fluctuated significantly on an annual basis. This variability has been due to, among other things: the achievement of significant milestone revenues in 2011; the 2009 amendment of our collaboration agreement with Mitsubishi Tanabe, which provided for an up-front payment that was recognized over the period from the third quarter of 2009 through the second quarter of 2012; the 2011 amendment to our collaboration agreement with the Cystic Fibrosis Foundation Therapeutics Incorporated, or CFFT, which began providing us additional research and development support in 2011; and variable revenues we received from services we provided to Janssen and Mitsubishi Tanabe through our third-party manufacturing network.
The table presented below is a summary of our collaborative revenues for
2012
,
2011
and
2010
:
|
2012
|
2011
|
2010
|
|||||||||
|
(in thousands)
|
|||||||||||
|
Collaborative revenues:
|
|||||||||||
|
Janssen
|
$
|
16,178
|
|
$
|
274,393
|
|
$
|
30,750
|
|
||
|
Mitsubishi Tanabe
|
18,879
|
|
121,675
|
|
81,868
|
|
|||||
|
CFFT
|
16,960
|
|
13,654
|
|
—
|
|
|||||
|
Other
|
69
|
|
—
|
|
508
|
|
|||||
|
Total collaborative revenues
|
$
|
52,086
|
|
$
|
409,722
|
|
$
|
113,126
|
|
||
In
2011
, we recognized
$250.0 million
in milestone revenues under our collaboration agreement with Janssen, for which there were no comparable milestone revenues in 2012 or 2010. Our other collaborative revenues from Janssen relate to the amortization of an up-front payment we received in 2006, net reimbursements (payments) for telaprevir development costs and reimbursements for manufacturing services. We do not expect to earn any future milestone payments pursuant to this collaboration agreement with Janssen.
From the beginning of 2010 through the first quarter of 2012, we recognized $9.6 million each quarter in collaborative revenues related to a one-time payment that we received from Mitsubishi Tanabe in 2009. In addition, in the fourth quarter of 2011, we recognized a $65.0 million commercial milestone payment from Mitsubishi Tanabe and from the second quarter of 2010 through the second quarter of 2012 we recognized revenues related to manufacturing services we provided to Mitsubishi Tanabe through our third-party manufacturing network. We did not recognize any collaborative revenues from Mitsubishi Tanabe in the second half of 2012 and will not recognize any future collaborative revenues pursuant to our collaboration agreement with Mitsubishi Tanabe.
Operating Costs and Expenses
|
2012/2011
Comparison |
2011/2010
Comparison |
||||||||||||||||||||||||
|
2012
|
2011
|
2010
|
Increase/
(Decrease) |
Increase/
(Decrease) |
Increase/
(Decrease) |
Increase/
(Decrease) |
|||||||||||||||||||
|
(in thousands)
|
(in thousands, except percentages)
|
||||||||||||||||||||||||
|
Cost of product revenues
|
$
|
236,742
|
|
$
|
63,625
|
|
$
|
—
|
|
$
|
173,117
|
|
272
|
%
|
$
|
63,625
|
|
n/a
|
|
||||||
|
Royalty expenses
|
43,143
|
|
16,880
|
|
12,730
|
|
26,263
|
|
156
|
%
|
4,150
|
|
33
|
%
|
|||||||||||
|
Research and development expenses
|
806,185
|
|
707,706
|
|
637,416
|
|
98,479
|
|
14
|
%
|
70,290
|
|
11
|
%
|
|||||||||||
|
Sales, general and administrative expenses
|
436,796
|
|
400,721
|
|
187,800
|
|
36,075
|
|
9
|
%
|
212,921
|
|
113
|
%
|
|||||||||||
|
Restructuring expense
|
1,844
|
|
2,074
|
|
1,501
|
|
(230
|
)
|
(11
|
)%
|
573
|
|
38
|
%
|
|||||||||||
|
Intangible asset impairment charge
|
—
|
|
105,800
|
|
—
|
|
(105,800
|
)
|
(100
|
)%
|
105,800
|
|
n/a
|
|
|||||||||||
|
Total costs and expenses
|
$
|
1,524,710
|
|
$
|
1,296,806
|
|
$
|
839,447
|
|
$
|
227,904
|
|
18
|
%
|
$
|
457,359
|
|
54
|
%
|
||||||
Cost of Product Revenues
Our cost of product revenues in 2012 and 2011 included the cost of producing inventories that corresponded to product revenues for the reporting period, plus the third-party royalties payable on our net sales of INCIVEK and KALYDECO. In addition, cost of product revenues in 2012 included an aggregate of
$133.2 million
in charges for excess and obsolete INCIVEK inventories. Most of the manufacturing costs of INCIVEK and KALYDECO sold in the periods presented were expensed as research and development expenses in prior periods.
60
Our cost of product revenues increased in 2012 compared to 2011 due to our increased net product revenues and the charges for excess and obsolete INCIVEK inventories that we incurred in 2012. As of
December 31, 2012
, we had
$22.8 million
in remaining INCIVEK inventories. We evaluate our INCIVEK inventories on a quarterly basis, and future changes in the commercial outlook for INCIVEK could result in additional charges for excess and obsolete INCIVEK inventories in future periods.
Royalty Expenses
Royalty expenses include third-party royalties payable upon net sales of telaprevir by our collaborators and royalty expenses related to a subroyalty payable to a third party on net sales of an HIV protease inhibitor sold by GlaxoSmithKline. Royalty expenses in 2012 increased compared to 2011 primarily due to increased third-party royalties payable on net sales of INCIVO by Janssen. Our royalty expenses in future periods will be dependent on our collaborators' net sales of telaprevir in their territories. Royalty expenses in 2010 and in 2011 prior to the launch of INCIVO by Janssen primarily related to a subroyalty payable to a third party on net sales of an HIV protease inhibitor sold by GlaxoSmithKline. The subroyalty expense offsets a corresponding amount of HIV royalty revenues. We expect to continue to recognize this subroyalty as an expense in future periods.
Research and Development Expenses
|
2012/2011
Comparison |
2011/2010
Comparison |
||||||||||||||||||||||||
|
2012
|
2011
|
2010
|
Increase
|
Increase
|
Increase
|
Increase
|
|||||||||||||||||||
|
(in thousands)
|
(in thousands, except percentages)
|
||||||||||||||||||||||||
|
Research expenses
|
$
|
235,588
|
|
$
|
216,903
|
|
$
|
189,273
|
|
$
|
18,685
|
|
9
|
%
|
$
|
27,630
|
|
15
|
%
|
||||||
|
Development expenses
|
570,597
|
|
490,803
|
|
448,143
|
|
79,794
|
|
16
|
%
|
42,660
|
|
10
|
%
|
|||||||||||
|
Total research and development expenses
|
$
|
806,185
|
|
$
|
707,706
|
|
$
|
637,416
|
|
$
|
98,479
|
|
14
|
%
|
$
|
70,290
|
|
11
|
%
|
||||||
Our research and development expenses include internal and external costs incurred for research and development of our drugs and drug candidates. We do not assign our internal costs, such as salary and benefits, stock-based compensation expense, laboratory supplies and infrastructure costs, to individual drugs or drug candidates, because the employees within our research and development groups typically are deployed across multiple research and development programs. These internal costs are significantly greater than our external costs, such as the costs of services provided to us by clinical research organizations and other outsourced research, which we do allocate by individual program. All research and development costs for our drugs and drug candidates are expensed as incurred.
To date, we have incurred in excess of
$5.5 billion
in research and development expenses associated with drug discovery and development. The successful development of our drug candidates is highly uncertain and subject to a number of risks. In addition, the duration of clinical trials may vary substantially according to the type, complexity and novelty of the drug candidate and the disease indication being targeted. The FDA and comparable agencies in foreign countries impose substantial requirements on the introduction of therapeutic pharmaceutical products, typically requiring lengthy and detailed laboratory and clinical testing procedures, sampling activities and other costly and time-consuming procedures. Data obtained from nonclinical and clinical activities at any step in the testing process may be adverse and lead to discontinuation or redirection of development activities. Data obtained from these activities also are susceptible to varying interpretations, which could delay, limit or prevent regulatory approval. The duration and cost of discovery, nonclinical studies and clinical trials may vary significantly over the life of a project and are difficult to predict. Therefore, accurate and meaningful estimates of the ultimate costs to bring our drug candidates to market are not available.
Over the three year period ended December 31, 2012, costs related to our HCV and CF programs have represented the largest portion of our development costs. Any estimates regarding development and regulatory timelines for our drug candidates are highly subjective and subject to change. In the first quarter of 2013, we initiated a pivotal Phase 3 clinical program to evaluate VX-809 in combination with ivacaftor. We expect to obtain final safety and efficacy data from two Phase 3 clinical trials in this program in 2014. If these clinical trials are successful, we plan to submit an NDA to the FDA in 2014. We cannot make a meaningful estimate when, if ever, our other clinical development programs will generate revenues and cash flows.
61
Research Expenses
|
2012/2011
Comparison |
2011/2010
Comparison |
||||||||||||||||||||||||
|
2012
|
2011
|
2010
|
Increase/
(Decrease) |
Increase/
(Decrease) |
Increase/
(Decrease) |
Increase/
(Decrease) |
|||||||||||||||||||
|
(in thousands)
|
(in thousands, except percentages)
|
||||||||||||||||||||||||
|
Research Expenses:
|
|||||||||||||||||||||||||
|
Salary and benefits
|
$
|
78,488
|
|
$
|
76,355
|
|
$
|
67,508
|
|
$
|
2,133
|
|
3
|
%
|
$
|
8,847
|
|
13
|
%
|
||||||
|
Stock-based compensation expense
|
25,147
|
|
25,305
|
|
23,496
|
|
(158
|
)
|
(1
|
)%
|
1,809
|
|
8
|
%
|
|||||||||||
|
Laboratory supplies and other direct expenses
|
40,005
|
|
35,641
|
|
29,145
|
|
4,364
|
|
12
|
%
|
6,496
|
|
22
|
%
|
|||||||||||
|
Contractual services
|
21,471
|
|
13,213
|
|
9,881
|
|
8,258
|
|
62
|
%
|
3,332
|
|
34
|
%
|
|||||||||||
|
Infrastructure costs
|
70,477
|
|
66,389
|
|
59,243
|
|
4,088
|
|
6
|
%
|
7,146
|
|
12
|
%
|
|||||||||||
|
Total research expenses
|
$
|
235,588
|
|
$
|
216,903
|
|
$
|
189,273
|
|
$
|
18,685
|
|
9
|
%
|
$
|
27,630
|
|
15
|
%
|
||||||
Over the past three years we have maintained a substantial investment in research activities resulting in a
9%
increase
in research expenses in
2012
as compared to
2011
and a
15%
increase
in research expenses in
2011
as compared to
2010
. We expect to continue to invest in our research programs with a focus on identifying drug candidates for specialty markets.
Development Expenses
|
2012/2011
Comparison |
2011/2010
Comparison |
||||||||||||||||||||||||
|
2012
|
2011
|
2010
|
Increase/
(Decrease) |
Increase/
(Decrease) |
Increase/
(Decrease) |
Increase/
(Decrease) |
|||||||||||||||||||
|
(in thousands)
|
(in thousands, except percentages)
|
||||||||||||||||||||||||
|
Development Expenses:
|
|||||||||||||||||||||||||
|
Salary and benefits
|
$
|
147,574
|
|
$
|
126,441
|
|
$
|
108,617
|
|
$
|
21,133
|
|
17
|
%
|
$
|
17,824
|
|
16
|
%
|
||||||
|
Stock-based compensation expense
|
46,386
|
|
50,269
|
|
41,702
|
|
(3,883
|
)
|
(8
|
)%
|
8,567
|
|
21
|
%
|
|||||||||||
|
Laboratory supplies and other direct expenses
|
36,585
|
|
33,588
|
|
33,231
|
|
2,997
|
|
9
|
%
|
357
|
|
1
|
%
|
|||||||||||
|
Contractual services
|
217,406
|
|
149,033
|
|
113,031
|
|
68,373
|
|
46
|
%
|
36,002
|
|
32
|
%
|
|||||||||||
|
Drug supply costs
|
14,044
|
|
34,133
|
|
65,902
|
|
(20,089
|
)
|
(59
|
)%
|
(31,769
|
)
|
(48
|
)%
|
|||||||||||
|
Infrastructure costs
|
108,602
|
|
97,339
|
|
85,660
|
|
11,263
|
|
12
|
%
|
11,679
|
|
14
|
%
|
|||||||||||
|
Total development expenses
|
$
|
570,597
|
|
$
|
490,803
|
|
$
|
448,143
|
|
$
|
79,794
|
|
16
|
%
|
$
|
42,660
|
|
10
|
%
|
||||||
Our development expenses
increased
by
$79.8 million
, or
16%
, in
2012
as compared to
2011
and by
$42.7 million
, or
10%
, in
2011
as compared to
2010
, principally due to increases in headcount and the expansion of our development efforts as we completed the registration programs for telaprevir and ivacaftor, prepared the regulatory filings needed to obtain approval for these products and continued the development of our other drug candidates. We expect our development expenses to increase in 2013 as compared to 2012 due to ongoing and planned clinical trials in the areas of CF, HCV infection and autoimmune diseases.
Sales, General and Administrative Expenses
|
2012/2011
Comparison |
2011/2010
Comparison |
||||||||||||||||||||||||
|
2012
|
2011
|
2010
|
Increase
|
Increase
|
Increase
|
Increase
|
|||||||||||||||||||
|
(in thousands)
|
(in thousands, except percentages)
|
||||||||||||||||||||||||
|
Sales, general and administrative expenses
|
$
|
436,796
|
|
$
|
400,721
|
|
$
|
187,800
|
|
$
|
36,075
|
|
9
|
%
|
$
|
212,921
|
|
113
|
%
|
||||||
Sales, general and administrative expenses increased in 2012 compared to 2011 by 9%, primarily due to the expansion of our global commercial organization to support the launch of KALYDECO in North America and Europe and increased compensation and benefits for our INCIVEK sales force for a full year in 2012 versus a partial year in 2011, when we
62
launched INCIVEK in the United States in May 2011. Sales, general and administrative expenses increased substantially in 2011 compared to 2010 as a result of increases in workforce expenses as we prepared for and commercially launched INCIVEK in 2011 and KALYDECO in early 2012. We expect that our sales, general and administrative expenses will decrease in 2013 as compared to 2012.
Restructuring Expense
Our restructuring expense relates to remaining lease obligations for space that we do not occupy following restructuring activities in 2003. As of December 31, 2012, our accrued restructuring liability was
$23.3 million
. In
2012
,
2011
and
2010
, we recorded restructuring expense of
$1.8 million
,
$2.1 million
and
$1.5 million
, respectively. In
2012
,
2011
and
2010
, we made cash payments of
$14.9 million
,
$14.9 million
and
$14.8 million
, respectively, against the accrued expense and received
$10.0 million
,
$9.5 million
and
$8.8 million
, respectively, in sublease rental payments. During 2013, we expect to make additional cash payments of
$15.5 million
against the accrued expense and to receive
$10.7 million
in sublease rental payments.
Intangible Asset Impairment Charge
In
2011
, we recorded a
$105.8 million
impairment charge related to VX-759, a non-nucleoside HCV polymerase inhibitor that we acquired through our acquisition of ViroChem Pharma Inc., or ViroChem, in 2009. In connection with this impairment charge, we recorded a credit of
$32.7 million
in our provision for income taxes resulting in a net effect on our income related to this impairment charge of
$73.1 million
in 2011. There were no corresponding intangible asset impairment charges in 2010 or 2012.
Non-operating Items
Interest Income
Interest income was
$1.9 million
in both
2012
and
2011
. Interest income
decreased
by
$0.1 million
, or
4%
, to
$1.9 million
in
2011
from
$2.0 million
in
2010
. Our cash, cash equivalents and marketable securities yielded less than 1% on an annual basis in 2012.
Interest Expense
Interest expense
decreased
by
$21.8 million
, or
57%
, to
$16.7 million
in
2012
from
$38.5 million
in
2011
. This decrease was the result of decreased interest expense related to our secured notes due 2012, which were redeemed in 2011. Interest expense
increased
by
$19.2 million
, or
99%
, to
$38.5 million
in
2011
from
$19.3 million
in
2010
. This increase was primarily the result of the 3.35% convertible senior subordinated notes due 2015, or 2015 Notes, we issued in September 2010. In 2013, we expect to incur
$13.4 million
in interest expense related to the 2015 Notes.
Change in Fair Value of Derivative Instruments
In
2011
and
2010
, we recorded losses of
$16.8 million
and
$41.2 million
, respectively, in connection with the embedded and free-standing derivatives associated with two financial transactions that we entered into in September 2009. In 2011, the contingent milestone payments that were the subject of the 2009 financial transactions were earned in full and we recorded our final expenses related to these transactions.
Provision for Income Taxes
In 2012, we recorded a provision for income taxes of
$38.8 million
. This provision for income taxes was principally due to a provision of
$39.0 million
attributable to noncontrolling interest (Alios).
In 2011, we recorded a provision for income taxes of
$19.3 million
. This provision for income taxes was due to a provision of
$48.8 million
attributable to noncontrolling interest (Alios) related to the accounting for the collaboration between Alios and us and a provision of
$3.7 million
for state taxes, partially offset by a benefit from income taxes of $32.7 million due to a tax benefit resulting from the impairment of VX-759.
Provisions for income taxes payable by Alios in 2012 and 2011 reduced net income attributable to noncontrolling interest (Alios) by a corresponding amount and as a result had no effect on the net income (loss) attributable to Vertex in 2012 or 2011.
63
Noncontrolling Interest (Alios)
The net loss (income) attributable to noncontrolling interest (Alios) recorded on our consolidated statements of operations reflects Alios’ net loss (income) for the reporting period, excluding revenues related to the up-front payment and milestone payments earned by Alios and adjusted for any changes during the reporting period in the fair value of the contingent milestone and royalty payments payable by us to Alios.
A summary of net loss (income) attributable to noncontrolling interest (Alios) in 2012 and 2011 is as follows:
|
2012
|
2011
|
|||||
|
(in thousands)
|
||||||
|
Loss (income) before provision for (benefit from) income taxes
|
$
|
20,044
|
|
$
|
9,536
|
|
|
Decrease (increase) in fair value of contingent milestone and royalty payments
|
(114,970
|
)
|
(69,950
|
)
|
||
|
Provision for (benefit from) income taxes
|
39,029
|
|
48,809
|
|
||
|
Net loss (income) attributable to noncontrolling interest (Alios)
|
$
|
(55,897
|
)
|
$
|
(11,605
|
)
|
In 2012 and 2011, the fair value of contingent milestone payments and royalties payable by us to Alios increased by
$115.0 million
and
$70.0 million
, respectively. The increases in the fair value of contingent milestone payments and royalties payable by us to Alios were due to the advancement of our HCV nucleotide analogue program in 2011 and 2012, including the positive data we received in 2012 from a Phase 1 clinical trial that evaluated ALS-2200 (now formulated as VX-135).
Increases in the fair value of the contingent milestone payments and royalties payable by us to Alios result in a decrease in net income attributable to Vertex (or an increase in net loss attributable to Vertex) on a dollar-for-dollar basis. If VX-135 continues to advance in clinical development, we expect to record additional increases in the fair value of these contingent milestone and royalty payments. Changes in the fair value of these contingent milestone and royalty payments and the effects of these changes on net income (loss) attributable to Vertex were material in 2012 and 2011 and may be material in future periods.
LIQUIDITY AND CAPITAL RESOURCES
As of
December 31, 2012
, we had cash, cash equivalents and marketable securities, excluding Alios’ cash and cash equivalents, of
$1.3 billion
, which was an
increase
of
$352.3 million
from
$968.9 million
as of
December 31, 2011
. This
increase
was due to cash receipts from product sales and royalties and
$191.7 million
in cash we received from issuances of common stock pursuant to employee benefit plans. These cash receipts were partially offset by cash expenditures we made related to, among other things, research and development expenses, sales, general and administrative expenses and milestone payments to Alios, as well as
$92.6 million
for capital expenditures for property and equipment.
Sources of Liquidity
We intend to rely on cash flows from product sales as our primary source of liquidity and cash flows from royalties as a secondary source of liquidity. We also generate proceeds from the issuance of common stock under our employee benefit plans. Other possible sources of liquidity include commercial debt, public and private offerings of our equity and debt securities, strategic collaborative agreements that include research and/or development funding, development milestones and royalties on the sales of products, software and equipment leases, strategic sales of assets or businesses and financial transactions.
Future Capital Requirements
We are incurring substantial expenses to commercialize INCIVEK and KALYDECO, while at the same time continuing focused investment in our research and development programs. We may require capital to repay the $400.0 million in aggregate principal amount of 2015 Notes that mature on October 1, 2015. The 2015 Notes bear interest at the rate of
3.35%
per annum, and we are required to make semi-annual interest payments on the outstanding principal balance of the 2015 Notes on April 1 and October 1 of each year. The 2015 Notes are convertible, at the option of the holder, into our common stock at a price equal to approximately
$48.83
per share, subject to adjustment, and can be called by us at any time on or after October 1, 2013. In addition, we have substantial lease obligations that will continue through 2028.
64
We expect that cash flows from INCIVEK/INCIVO and KALYDECO together with our current cash, cash equivalents and marketable securities will be sufficient to fund our operations for at least the next twelve months. The adequacy of our available funds to meet our future operating and capital requirements will depend on many factors, including the amounts of future revenues generated by INCIVEK/INCIVO and KALYDECO, and the number, breadth, cost and prospects of our
research and development programs.
Financing Strategy
Although we do not have any plans to do so in the near term, we may raise additional capital through public offerings or private placements of our securities, securing new collaborative agreements or other methods of financing. As part of our strategy for managing our capital structure, we have from time to time adjusted the amount and maturity of our debt obligations through new issues, privately negotiated transactions and market purchases, depending on market conditions and our perceived needs at the time. We expect to continue pursuing a general financial strategy that may lead us to undertake one or more additional transactions with respect to our outstanding debt obligations, and the amounts involved in any such transactions, individually or in the aggregate, may be material. We will continue to manage our capital structure and to consider all financing opportunities, whenever they may occur, that could strengthen our long-term liquidity profile. Any capital transaction related to our outstanding debt obligations may or may not be similar to transactions in which we have engaged in the past. There can be no assurance that any such financing opportunities will be available on acceptable terms, if at all.
CONTRACTUAL COMMITMENTS AND OBLIGATIONS
The first part of the following table sets forth commitments and obligations that were recorded on our consolidated balance sheet at December 31, 2012. Certain other obligations and commitments, while not required to be included on the consolidated balance sheet, may have a material effect on our liquidity. We have presented these items in the remaining rows of the table below in order to present a more complete picture of our financial position and liquidity.
|
Payments Due by Period
|
|||||||||||||||||||
|
2013
|
2014-2015
|
2016-2017
|
2018 and later
|
Total
|
|||||||||||||||
|
(in thousands)
|
|||||||||||||||||||
|
Commitments and Obligations Recorded on the Consolidated Balance Sheet at December 31, 2012:
|
|||||||||||||||||||
|
Convertible senior subordinated notes (due October 2015) principal payment
|
$
|
—
|
|
$
|
400,000
|
|
$
|
—
|
|
$
|
—
|
|
$
|
400,000
|
|
||||
|
Convertible senior subordinated notes (due October 2015) interest payment
|
3,350
|
|
—
|
|
—
|
|
—
|
|
3,350
|
|
|||||||||
|
Capital lease obligations
|
13,707
|
|
15,170
|
|
—
|
|
—
|
|
28,877
|
|
|||||||||
|
Construction financing lease obligation
|
—
|
|
912
|
|
1,151
|
|
138,189
|
|
140,252
|
|
|||||||||
|
Research, development and drug supply costs
|
5,771
|
|
—
|
|
—
|
|
—
|
|
5,771
|
|
|||||||||
|
Additional Commitments and Obligations at December 31, 2012:
|
|||||||||||||||||||
|
Convertible senior subordinated notes (due October 2015) interest payments
|
10,050
|
|
26,800
|
|
—
|
|
—
|
|
36,850
|
|
|||||||||
|
Facility operating leases, excluding Fan Pier Leases
|
61,503
|
|
99,960
|
|
55,496
|
|
36,723
|
|
253,682
|
|
|||||||||
|
Fan Pier Leases
|
83,304
|
|
133,500
|
|
133,261
|
|
676,215
|
|
1,026,280
|
|
|||||||||
|
Research, development and drug supply costs
|
4,247
|
|
—
|
|
—
|
|
—
|
|
4,247
|
|
|||||||||
|
Other
|
13,681
|
|
2,497
|
|
164
|
|
—
|
|
16,342
|
|
|||||||||
|
Total contractual commitments and obligations
|
$
|
195,613
|
|
$
|
678,839
|
|
$
|
190,072
|
|
$
|
851,127
|
|
$
|
1,915,651
|
|
||||
Commitments and Obligations Recorded on the Consolidated Balance Sheet at December 31, 2012
In 2010, we issued $400.0 million in aggregate principal amount of 2015 Notes. The principal and interest accrued as of December 31, 2012 under these notes is included on our consolidated balance sheet as of December 31, 2012. The interest that is due for periods after December 31, 2012 is not required under GAAP to be reflected on our consolidated balance sheet and is set forth separately on the table above.
65
In 2012, we entered into various agreements for the lease of equipment and software licenses, expiring in 2015. The leases were accounted for as capital leases. Liabilities assumed under capital leases are recorded within “Capital lease obligations, current portion” and “Capital lease obligations, excluding current portion” on our consolidated balance sheet.
Our construction financing lease obligation relates to two buildings under construction on Fan Pier in Boston, Massachusetts. Although we will lease the space in these buildings, we are deemed for accounting purposes to be the owner of these buildings during the construction period and have recorded a long-term liability under the caption “Construction financing lease obligation” on our consolidated balance sheet.
Commitments set forth under “Research, development and drug supply costs” represent contractual commitments entered into for materials and services in the normal course of business that were reflected in “Accrued expenses” on our consolidated balance sheet as of December 31, 2012.
Additional Commitments and Obligations Not Required to be Recorded on Consolidated Balance Sheet at December 31, 2012
Our future minimum commitments and contractual obligations include interest that will accrue on the 2015 Notes after December 31, 2012, facility operating leases, our leases for the Fan Pier buildings, and contractual commitments related to our research, development and drug supply activities. These items are not required to be recorded on our consolidated balance sheet.
Our future minimum commitments under our Kendall Square lease for the period commencing on January 1, 2013 are
$18.3 million
for
2013
,
$36.7 million
for
2014
and
2015
,
$36.7 million
for
2016
and
2017
, and
$6.1 million
from January 1, 2018 through the expiration of the lease in April 2018. These amounts are included in the table above as part of our facility operating leases. Rent payments for our Kendall Square lease will be subject to increase in May 2013, based on changes in an inflation factor. We are using approximately 40% of the Kendall Square facility for our operations. We have entered into two subleases for the remaining rentable square footage at the Kendall Square facility to offset our on-going contractual lease obligations. The future minimum committed income from the subleases is
$8.5 million
for
2013
and
$12.5 million
for
2014
and
2015
. These amounts are not offset against our obligations set forth in the table above. See
Note Q, "Restructuring Expense,"
to our consolidated financial statements.
“Fan Pier Leases” sets forth the future minimum rental payments that we are obligated to pay after taking occupancy of approximately 1.1 million square feet of office and laboratory space in two buildings under construction in Boston, Massachusetts less certain amounts reflected on the consolidated balance sheet as of December 31, 2012 under the caption “Construction financing lease obligation.” We expect to commence these rental payments in December 2013. The rental payments will extend for 15 years from the commencement date.
Commitments set forth under “Research, development and drug supply costs” represent contractual commitments entered into for materials and services in the normal course of business that were not recorded on our consolidated balance sheet as of December 31, 2012.
A commercial milestone payment we expect to pay to CFFT upon achievement of certain sales levels for KALYDECO is included in “Other” for 2013.
Collaborative Arrangements
We have entered into certain research and development collaboration agreements with third parties that include the funding of certain development, manufacturing and commercialization efforts with the potential for future milestone and royalty payments upon the achievement of pre-established developmental, regulatory and/or commercial targets. Our obligation to fund these efforts is contingent upon continued involvement in the programs and/or the lack of any adverse events that could cause the discontinuance of the programs. Due to the nature of these arrangements, the future potential payments related to the attainment of specified development and regulatory approval milestones over a period of several years are inherently uncertain, and accordingly, no amounts have been recorded in our consolidated balance sheet as of December 31, 2012. See Note B, "Collaborative Arrangements," to our consolidated financial statements.
Pursuant to our collaboration with Alios, Alios is eligible to receive development milestone payments from us of up to
$312.5 million
if VX-135 is approved and commercialized. The agreement provides for additional development milestone
66
payments to Alios if a second HCV nucleotide analogue is approved and commercialized. As of December 31, 2012, Alios had earned
$60.0 million
of these milestone payments, all of which had been paid as of December 31, 2012. Alios also is eligible to receive commercial milestone payments from us of up to
$750.0 million
, as well as tiered royalties on net sales of approved drugs. Contingent payments under this agreement become due and payable only upon achievement of certain milestones and are not included in the contractual obligations table above.
Tax-related Obligations
We exclude liabilities pertaining to uncertain tax positions from our summary of contractual obligations as we cannot make a reliable estimate of the period of cash settlement with the respective taxing authorities. As of December 31, 2012, we have
$4.1 million
of liabilities associated with uncertain tax positions,
$2.7 million
of which are directly attributable to Alios. We have no legal obligation associated with Alios’ potential tax liabilities. As of December 31, 2012, we cannot reasonably estimate the amount we expect to pay within the next twelve months in connection with such settlements.
Other Funding Commitments
As of December 31, 2012, we have several ongoing clinical trials. We make our most significant clinical trial payments to clinical research organizations, or CROs. Although our contracts with CROs are cancelable, at our option, with notice, we historically have not cancelled such contracts. We have recorded accrued expenses of approximately $26 million on our consolidated balance sheet for expenditures incurred for clinical trials as of December 31, 2012. We have approximately $170 million in cancelable future commitments based on existing contracts as of December 31, 2012 that are not included in the contractual commitments and obligations table because of our termination rights. These amounts reflect commitments based on existing contracts and do not reflect any future modifications to, or terminations of, existing contracts or anticipated or potential new contracts.
Our table detailing contractual commitments and obligations does not include severance payment obligations to certain of our executive officers in the event of a not-for-cause employment termination under existing employment contracts.
CRITICAL ACCOUNTING POLICIES AND ESTIMATES
Our discussion and analysis of our financial condition and results of operations is based upon our consolidated financial statements prepared in accordance with generally accepted accounting principles in the United States, or GAAP. The preparation of these financial statements requires us to make certain estimates and assumptions that affect the reported amounts of assets and liabilities and the reported amounts of revenues and expenses during the reported periods. We monitor and analyze changes in facts and circumstances that might have a material effect on our estimates and assumptions. Changes in estimates are reflected in reported results for the period in which they become known. We base our estimates on historical experience and various other assumptions, including in certain circumstances future projections, that we believe to be reasonable under the circumstances. Actual results may differ from our estimates.
We believe that our application of the following accounting policies, each of which requires significant judgments and estimates on the part of management, are the most critical to aid in fully understanding and evaluating our reported financial results:
|
•
|
revenue recognition;
|
|
•
|
consolidation of variable interest entity;
|
|
•
|
intangible assets;
|
|
•
|
accruals;
|
|
•
|
commercial supplies and inventories; and
|
|
•
|
income taxes.
|
Our accounting policies, including the ones discussed below, are more fully described in the Notes to our consolidated financial statements, including
Note A, "Nature of Business and Accounting Policies,"
included in this Annual Report on Form 10-K.
67
Revenue Recognition
Product Revenues, Net
We generate product revenues principally from sales in the United States. We sell our products to a limited number of major wholesalers, as well as selected regional wholesalers and specialty pharmacy providers, collectively our customers, who subsequently resell our products to patients and health care providers. Separately, we have arrangements with numerous third-party payors that provide for government-mandated and privately-negotiated rebates, chargebacks and discounts. We recognize net product revenues from sales of our products upon delivery to our customers as long as:
|
•
|
there is persuasive evidence that an arrangement exists between us and our customer;
|
|
•
|
collectability is reasonably assured; and
|
|
•
|
the price is fixed or determinable.
|
We have written contracts with our customers and delivery occurs when a customer receives our products. We evaluate the creditworthiness of each of our customers and have determined that all of our material customers are creditworthy. In order to conclude that the price is fixed or determinable, we must be able to calculate our gross product revenues from our customers and reasonably estimate our net product revenues. Our gross product revenues are based on the fixed price for our products that we charge our customers. We estimate our net product revenues by deducting from our gross product revenues (i) trade allowances, such as invoice discounts for prompt payment and customer fees, (ii) estimated government and private payor rebates, chargebacks and discounts, such as Medicaid reimbursements, (iii) reserves for expected product returns and (iv) estimated costs of incentives offered to certain indirect customers, including patients. These estimates, and in particular the estimates for rebates, chargebacks and discounts and expected product returns, require us to make significant judgments that materially affect our recognition of net product revenues on sales of our products.
The value of the rebates, chargebacks and discounts provided to third-party payors per course of treatment vary significantly and are based on government-mandated discounts and our arrangements with other third-party payors. Typically, government-mandated discounts in the United States and Canada are significantly larger than discounts provided to other third-party payors. In order to estimate our total rebates, chargebacks and discounts, we estimate the percentage of prescriptions that will be covered by each third-party payor, which is referred to as the payor mix. We track available information regarding changes, if any, to the payor mix for our products, to our contractual terms with third-party payors and to applicable governmental programs and regulations and levels of our products in the distribution channel. We adjust our estimated rebates, chargebacks and discounts based on new information, including information regarding actual rebates, chargebacks and discounts for our products, as it becomes available. Claims by third-party payors for rebates, chargebacks and discounts frequently are submitted to us three to six months following the related sales, potentially resulting in adjustments in the period in which the new information becomes known. If we increased our estimate of the percentage of patients receiving our products covered by third-party payors entitled to government-mandated discounts by two percentage points, our net product revenues would decrease by less than one percent for the three months ended December 31, 2012.
Our customers have the right to return unopened unprescribed packages beginning six months prior to the labeled expiration date and ending twelve months after the labeled expiration date. As of December 31, 2012, returns of our products have been minimal. Based on our specialty distribution model with weekly reporting of inventory levels provided to us by our limited number of customers, prescription data from third parties, the estimated remaining shelf life of our products previously shipped and currently being shipped, and contractual agreements with our customers, which include provisions designed to limit the amount of inventory they maintain, we have estimated that our product returns will be less than one percent of cumulative sales. We track actual returns by individual production lots and will continue to monitor inventory levels in the distribution channel. If necessary, we will adjust our estimated product returns based on new information as it becomes available.
KALYDECO was approved in the European Union in the third quarter of 2012 and international KALYDECO net product revenues did not represent a significant portion of our total net product revenues in 2012. In 2013, we expect that an increased percentage of our net product revenues will be due to sales of KALYDECO in international markets. We sell KALYDECO in Europe primarily to distributors, government run hospitals and private pharmacies that prescribe KALYDECO to patients. We recognize net product revenues from sales of KALYDECO in Europe upon delivery to our customers as long as there is persuasive evidence that an arrangement exists between us and our customer, collectability is reasonably assured, and the price is fixed or determinable.
68
Up-front License Fees
We recognize revenues from nonrefundable, up-front license fees related to collaboration agreements, including the $165.0 million we received from Janssen in 2006, on a straight-line basis over the contracted or estimated period of performance. The period of performance over which the revenues are recognized is typically the period over which the research and/or development is expected to occur. When the period of performance is based on the period over which research and/or development is expected to occur, we are required to make estimates regarding drug development and commercialization timelines. Because of the many risks and uncertainties associated with the development of drug candidates, these estimates regarding the period of performance have changed in the past and may change in the future. Our estimates regarding the period of performance under the Janssen collaboration agreement were adjusted in 2007, 2009 and 2010, as a result of changes in the global development plan for telaprevir. These adjustments were made on a prospective basis beginning in the periods in which the changes were identified and resulted in decreases in the amount of revenues we recognized on a quarterly basis from the Janssen collaboration.
Milestone Payments
At the inception of each agreement that includes contingent milestone payments payable to us, we evaluate whether the contingencies underlying each milestone event are substantive, specifically reviewing factors such as the scientific and other risks that must be overcome to achieve the milestone event, as well as the level of successful effort and investment required. If we do not consider a milestone event to be substantive, the revenues from the related milestone payment will be recognized over the period of performance. Where a substantive milestone event is achieved pursuant to a collaboration agreement and the corresponding payment is reasonably assured, we recognize the payment as earned. Because achievement of a substantive milestone event under a collaboration agreement typically requires the completion of a number of activities conducted over a significant period of time, the expenses related to achieving the milestone event often are incurred prior to the period in which the milestone payment is recognized. The milestone events that we achieved under our Janssen collaboration agreement in 2011 that resulted in $250.0 million in revenues were considered substantive and the revenues related to each milestone event were recognized in the quarter in which the corresponding payment became reasonably assured.
Royalty Revenues
Royalty revenues for INCIVO are recognized based on net sales of INCIVO as reported to us by Janssen and are recognized in the period the sales occur. Because net sales as reported by Janssen include certain estimates, we could experience future adjustments to royalty revenues and the adjustments could be significant.
Consolidation of Variable Interest Entity
In 2011, we entered into an agreement with Alios pursuant to which we agreed to collaborate on the research, development and commercialization of ALS-2200 (now formulated as VX-135) and ALS-2158, two HCV nucleotide analogues discovered by Alios. In 2012, we received data from Phase 1 clinical trials in which Alios evaluated ALS-2200 and ALS-2158. Based on this data, we are continuing the development of VX-135 and have ended all development activities related to ALS-2158. We are responsible for all expenses related to the development and commercialization of the compounds and provide research funding to Alios. We paid Alios a $60.0 million up-front payment, and Alios is eligible to receive research and development milestone payments, commercial milestone payments and tiered royalties on net sales of any approved drugs licensed by us under the collaboration agreement. Our interests in Alios are limited to those accorded to us pursuant to our collaboration agreement with Alios, and we have no equity interest, or right to acquire any equity interest, in Alios. In addition to Alios’ activities related to HCV nucleotide analogues, Alios is engaged in separate programs directed at developing novel drugs.
Our collaboration with Alios requires us to apply accounting policies that involve significant judgments and that have a material effect on our consolidated financial statements. Under applicable accounting guidance, as a result of the relationship established through the collaboration agreement, Alios is deemed to be a variable interest entity, or VIE. Because we acquired an exclusive license to certain intellectual property belonging to the VIE, and based on the significance of the licensed intellectual property to Alios taken as a whole, the collaboration is treated for accounting purposes as if we have acquired an interest in the entire VIE. In the Alios collaboration, where (a) through the joint steering committee, we have the power to direct the development and commercialization of VX-135, which are the activities that most significantly affect the
69
economic performance of Alios, (b) we are required to fund research and development activities related to the licensed assets and (c) we are entitled to receive a majority of the potential revenues from sales of any drugs developed pursuant to the collaboration, we are deemed under accounting guidance to be the primary beneficiary of a VIE that is a business. As a result, we are required to consolidate Alios’ financial statements into our financial statements.
We believe that the following effects of the consolidation on our consolidated financial statements are the most significant:
|
•
|
In each period, we record net loss (income) attributable to the Alios noncontrolling interest. This net loss (income) reflects Alios’ net loss (income) for the period as adjusted for gains and losses in the fair value of the contingent milestone and royalty payments payable by us to Alios. Determining the fair value of the contingent milestone and royalty payments payable by us to Alios requires us to make significant estimates regarding the probability and potential timing of achieving each of the milestones pursuant to the agreement, future potential net sales of the HCV nucleotide analogues licensed from Alios and appropriate discount and tax rates. We base our estimate of the probability of achieving the relevant milestones on industry data for similar assets and our own experience. The discount rates used in the valuation model represent a measure of credit risk associated with settling the liability. Significant judgment is used in determining the appropriateness of these assumptions at each reporting period. Changes in these assumptions could have a material effect on the fair value of milestone and royalty payment obligation. We expect that the net loss (income) attributed to noncontrolling interest (Alios) will continue to be affected by changes in the fair value of the contingent milestone and royalty payments. For example, in 2012 we received positive results from a Phase 1 clinical trial of ALS-2200 and the fair value of the contingent milestone and royalty payments increased by
$115.0 million
due to increases in the likelihood of achieving milestones and obtaining regulatory approvals, together with decreases in the time period over which we are discounting potential milestone and royalty payments. Increases in the fair value of the contingent milestone payments and royalties payable by us to Alios result in a decrease in net income attributable to Vertex (or an increase in net loss attributable to Vertex) on a dollar-for-dollar basis. Changes in the fair value of these contingent milestone and royalty payments and the effects of these changes on net income (loss) attributable to Vertex were material in 2012 and 2011 and may be material in future periods.
|
|
•
|
Since the effective date of the collaboration agreement we have consolidated all of Alios’ expenses and revenues into our consolidated statements of operations, eliminating all intercompany balances and transactions. In future periods, if Alios increases its headcount and/or expands its activities related to its other programs, its operating expenses could increase substantially. To the extent that Alios pursues other programs, we expect that expenses of Alios related to those activities would be reflected in our research and development expenses and our sales, general and administrative expenses as a result of the financial statement consolidation. We would not be entitled to any benefits from those activities. If we cease to have the power to direct the activities that most significantly affect the economic performance of Alios because of the expansion of Alios' activities related to its other programs or for any other reason cease to be Alios' primary beneficiary, we would deconsolidate Alios.
|
|
•
|
We reflect all of Alios’ cash and cash equivalents as restricted cash and cash equivalents (Alios) when we consolidate Alios’ balance sheets. We do not have any rights to Alios’ cash or cash equivalents; these resources are not available to fund research and development programs pursuant to the collaboration agreement and these amounts do not provide us with any additional liquidity. As a result of payments we have made to Alios under the collaboration agreement, Alios had significant liquid assets as of December 31, 2012. Alios has control over the restricted cash and cash equivalents (Alios), including the ability to distribute the restricted cash and cash equivalents to Alios’ equityholders, and as a result this asset, although carried on our consolidated balance sheet, is not included in the discussion of our liquidity and should be disregarded when evaluating our financial condition.
|
Intangible Assets
As of December 31, 2012 and 2011, our intangible assets consisted of indefinite-lived in-process research and development assets of (i) $250.6 million related to our HCV nucleotide analogue program, which includes the HCV nucleotide analogue VX-135 and included the HCV nucleotide analogue ALS-2158 and (ii) $412.9 million related to VX-222. We collaborate with Alios on research and development activities related to the HCV nucleotide program and acquired VX-222 when we acquired ViroChem Pharma Inc., or ViroChem, in 2009.
70
Each of these research and development assets relate to drug candidates that are being developed for the treatment of HCV infection. We maintain an indefinite-lived in-process research and development asset on our consolidated balance sheet until either the research and development project underlying it is completed or the asset becomes impaired. If we complete a project, we will amortize the carrying value of the related intangible asset as part of cost of product revenues over the remaining estimated life of the asset. If we determine that an asset has become impaired or we abandon a project, we write down the carrying value of the related intangible asset to its fair value and take an impairment charge in the period in which the impairment occurs.
We assess the fair value of assets, including intangible assets such as in-process research and development assets, using a variety of methods, including present-value models that are based upon multiple probability-weighted scenarios involving the development and potential commercialization of the acquired drug candidates. The present-value models require us to make significant assumptions regarding the estimates that market participants would make in evaluating a drug candidate, including the probability of successfully completing clinical trials and obtaining regulatory approval to market the drug candidate, the timing of and the expected costs to complete in-process research and development projects, future net cash flows from potential drug sales, which are based on estimates of the sales price of the drug, the number of patients that will be diagnosed and treated and our competitive position in the marketplace, and appropriate discount and tax rates.
We test our intangible assets for impairment on an annual basis as of October 1, and more frequently if indicators are present or changes in circumstance suggest that impairment may exist. Events that could result in an impairment, or trigger an interim impairment assessment, include the receipt of additional clinical or nonclinical data regarding our drug candidate or a potentially competitive drug candidate, changes in the clinical development program for a drug candidate or new information regarding potential sales for the drug. In connection with each annual impairment assessment and any interim impairment assessment, we compare the fair value of the asset as of the date of the assessment with the carrying value of the asset on our consolidated balance sheet.
The field of HCV infection treatment is highly competitive and characterized by rapid technological advances, and several of our competitors are conducting Phase 3 clinical trials evaluating their drug candidates for the treatment of genotype 1 HCV infection, including clinical trials evaluating all-oral treatment regimens and combination treatment regimens that include peg-IFN and ribavirin. There can be no assurance that we will successfully develop VX-135 or VX-222. If the fair value of VX-135 and/or VX-222 becomes impaired due to (i) unfavorable safety or efficacy data from any ongoing or future clinical trial of our drug regimens, (ii) regulatory delays, (iii) favorable results of testing or earlier FDA or foreign regulatory approval of competitors' products or (iv) any other information that affects the prospects of successfully developing or commercializing VX-135 or VX-222, we would incur significant charges in the period in which the impairment occurs.
Alios Collaboration
We recorded $250.6 million of intangible assets on our consolidated balance sheet based on our estimate of the fair value of Alios' HCV nucleotide analogue program as of the transaction date and made significant estimates regarding: the probability of obtaining regulatory approval of an HCV nucleotide analogue; the timing and expected costs of clinical trials and other development activities; future potential cash flows from sales of drugs and the appropriate discount and tax rates. We determined because of the advancement of VX-135 that there was no impairment to the Alios HCV nucleotide program in the third quarter of 2012 when we ended development of ALS-2158. No impairment has been found with respect to these intangible assets since the effective date of the collaboration.
ViroChem Acquisition
As of December 31, 2010, the intangible assets acquired from ViroChem that were reflected on our consolidated balance sheet related to two drug candidates, VX-222 and VX-759. VX-222 and VX-759 had estimated fair values on the acquisition date and December 31, 2010 of $412.9 million and $105.8 million, respectively. The estimated fair values ascribed to VX-222 and VX-759 on the acquisition date were based on the estimated fair value that would be ascribed to each of these drug candidates by a market participant that acquired both drug candidates in a single transaction.
In the third quarter of 2011, we identified certain factors that were considered impairment indicators related to VX-759. We determined that the fair value of VX-759 was zero dollars, based on the advancement of VX-222 in the third quarter of 2011, our consideration of potentially competitive drug candidates and other factors. This determination resulted in a $105.8 million impairment charge in 2011.
71
We have tested the fair value of VX-222 on an annual basis since the acquisition date and no impairment has been identified.
As
of October 1, 2012, we estimated the fair value that would be attributed to VX-222 by a market participant based on probability weighted present-value models involving updated assumptions and estimates regarding the status of the VX-222 development program, the potential future cash flows from sales of VX-222, and an appropriate discount rate. When we updated our assumptions, we considered among other factors, the following: (i) we continue to evaluate VX-222 in Phase 2 clinical trials and believe that a treatment regimen containing VX-222 in combination with other direct-acting antivirals such as VX-135 can be developed for patients with genotype 1 HCV infection, (ii) our competitors initiated several Phase 2 and Phase 3 clinical trials during the second half of 2012 that include treatment arms with non-nucleoside HCV polymerase inhibitors in combination with other direct-acting antivirals that could potentially be competitive in the market for the treatment of HCV infection and (iii) we believe that in the future several competitive treatment regimens will be available to treat patients with genotype 1 HCV infection. Using these updated assumptions, we determined that as of October 1, 2012, a market participant would assign a fair value to VX-222 exceeding the value reflected on our consolidated balance sheet. Accordingly, we determined that the value of VX-222 was not impaired as of October 1, 2012 and there were no indicators of impairment as of December 31, 2012.
Accruals
Research and development expenses, including amounts funded through research and development collaborations, and sales, general and administrative expenses are expensed as incurred. When third-party service providers' billing terms do not coincide with our period-end, we are required to make estimates of our obligations to those third parties, including clinical trial and pharmaceutical development costs, contractual services costs, costs for drug supply, marketing expenses and infrastructure expenses incurred in a given accounting period and record accruals at the end of the period. We base our estimates on our knowledge of the research and development programs, services performed for the period, past history for related activities and the expected duration of the third-party service contract, where applicable.
Commercial Supplies and Inventories
We began capitalizing the costs of our INCIVEK inventories on January 1, 2011 and the costs of our KALYDECO inventories on January 1, 2012. We capitalize inventories produced in preparation for initiating sales of a drug candidate when the related drug candidate is considered to have a high likelihood of regulatory approval and the related costs are expected to be recoverable through sale of the inventories. In determining whether or not to capitalize such inventories, we evaluate, among other factors, information regarding the drug candidate's safety and efficacy, the status of regulatory submissions and communications with regulatory authorities and the outlook for commercial sales, including the existence of current or anticipated competitive drugs and the availability of reimbursement. In addition, we evaluate risks associated with manufacturing the drug candidate and the remaining shelf life of the inventories. After we begin capitalizing inventories, we perform an assessment of the recoverability of capitalized inventory during each reporting period, and write down any excess and obsolete inventories to their net realizable value in the period in which the impairment is first identified.
The field of treatment of HCV infection is highly competitive and characterized by rapid technological advances. In 2012, following periodic assessments of the recoverability of our inventories, we recorded within cost of product revenues an aggregate of
$133.2 million
in charges for excess and obsolete INCIVEK inventories. Periodic assessments of the recoverability of capitalized costs involve significant estimates and judgments on the part of management. The charges and corresponding inventory write-downs were based on our analysis of our INCIVEK inventory levels in relation to our commercial outlook for INCIVEK. As part of the analysis, we considered, among other factors, (i) decreases in demand for INCIVEK during 2012 and our expectation that demand would decrease further in the future, (ii) the potential development by us of other drugs and combination treatments for HCV infection, including pursuant to collaboration agreements to evaluate VX-135 in combination with drug candidates controlled by third parties, that make it unlikely that INCIVEK will play a role in future combination therapies, (iii) the placement of a Boxed Warning on the INCIVEK prescribing information in December 2012, (iv) the potential development by our competitors of other drugs and combination treatments for HCV infection, (v) positive results reported in 2012 from clinical trials of drug candidates being developed by us and our competitors and (vi) the initiation by our competitors of additional Phase 2 and Phase 3 clinical trials evaluating drug candidates for the treatment of HCV infection. As of
December 31, 2012
, we had
$22.8 million
in remaining INCIVEK inventories. We evaluate our INCIVEK inventories on a quarterly basis, and future changes in the outlook for commercial sales of INCIVEK, including changes due to future developments with respect to demand for INCIVEK or the advancement or approval of other drugs or combination treatments for HCV infection, could result in additional inventory write-downs and related charges in future periods.
72
Income Taxes
We maintain a valuation allowance on our net operating losses and other deferred tax assets because we have an extended history of annual losses. Our U.S. federal net operating loss carryforwards totaled approximately
$2.6 billion
as of December 31, 2012. On a quarterly basis, we reassess the valuation allowance for deferred income tax assets. After consideration of all the evidence, both positive and negative, we continue to maintain a valuation allowance on the deferred tax asset as of December 31, 2012 because it is more likely than not that the deferred tax asset will not be realized. In future periods, if we determine that it is more likely than not that the deferred tax asset will be realized, (i) the valuation allowance would be decreased, (ii) a portion or all of the deferred tax asset would be reflected on our consolidated balance sheet and (iii) we would record non-cash benefits in our statements of operations related to the reflection of the deferred tax asset on our consolidated balance sheet.
RECENT ACCOUNTING PRONOUNCEMENTS
Refer to
Note A, "Nature of Business and Accounting Policies,"
in the accompanying notes to the consolidated financial statements for a discussion of recent accounting pronouncements.
|
ITEM 7A.
|
QUANTITATIVE AND QUALITATIVE DISCLOSURES ABOUT MARKET RISK
|
As part of our investment portfolio, we own financial instruments that are sensitive to market risks. The investment portfolio is used to preserve our capital until it is required to fund operations, including our research and development activities. None of these market risk-sensitive instruments are held for trading purposes. We do not have derivative financial instruments in our investment portfolio.
Interest Rate Risk
We invest our cash in a variety of financial instruments, principally securities issued by the United States government and its agencies, investment grade corporate bonds and commercial paper, and money market funds. These investments are denominated in U.S. dollars. All of our interest-bearing securities are subject to interest rate risk and could decline in value if interest rates fluctuate. Substantially all of our investment portfolio consists of marketable securities with active secondary or resale markets to help ensure portfolio liquidity, and we have implemented guidelines limiting the term-to-maturity of our investment instruments. Due to the conservative nature of these instruments, we do not believe that we have a material exposure to interest rate risk.
Foreign Exchange Market Risk
As a result of our foreign operations, we face exposure to movements in foreign currency exchange rates, primarily the Euro, Swiss Franc, British Pound and Canadian Dollar against the U.S. dollar. The current exposures arise primarily from cash, accounts receivable, intercompany receivables, payables and inventories, and calculations of royalties receivable from net sales denominated in foreign currencies. Both positive and negative affects to our net revenues from international product sales from movements in foreign currency exchange rates are partially mitigated by the natural, opposite affect that foreign currency exchange rates have on our international operating expenses.
We are considering a foreign currency management program with the objective of reducing the volatility of exchange rate fluctuations on our operating results and to increase the visibility of the foreign exchange impact on forecasted revenues.
|
ITEM 8.
|
FINANCIAL STATEMENTS AND SUPPLEMENTARY DATA
|
The information required by this Item 8 is contained on pages F-1 through F-44 of this Annual Report on Form 10-K.
|
ITEM 9.
|
CHANGES AND DISAGREEMENTS WITH ACCOUNTANTS ON ACCOUNTING AND FINANCIAL DISCLOSURE
|
Not applicable.
73
|
ITEM 9A.
|
CONTROLS AND PROCEDURES
|
(1) Evaluation of Disclosure Controls and Procedures.
The Company’s chief executive officer and chief financial officer, after evaluating the effectiveness of the Company’s disclosure controls and procedures (as defined in Rule 13a-15(e) and Rule 15d-15(e) promulgated under the Securities Exchange Act of 1934, as amended) as of the end of the period covered by this Annual Report on Form 10-K, have concluded that, based on such evaluation, the Company’s disclosure controls and procedures were effective. In designing and evaluating the disclosure controls and procedures, the Company’s management recognized that any controls and procedures, no matter how well designed and operated, can provide only reasonable assurance of achieving the desired control objectives, and the Company’s management necessarily was required to apply its judgment in evaluating the cost-benefit relationship of possible controls and procedures.
(2) Management’s Annual Report on Internal Control Over Financial Reporting.
The management of the Company is responsible for establishing and maintaining adequate internal control over financial reporting. Internal control over financial reporting is defined in Rule 13a-15(f) and Rule 15d-15(f) promulgated under the Securities Exchange Act of 1934, as amended, as a process designed by, or under the supervision of, the Company’s principal executive and principal financial officers and effected by the Company’s Board of Directors, management and other personnel, to provide reasonable assurance regarding the reliability of financial reporting and the preparation of financial statements for external purposes in accordance with generally accepted accounting principles. The Company’s internal control over financial reporting includes those policies and procedures that:
|
•
|
pertain to the maintenance of records that, in reasonable detail, accurately and fairly reflect the transactions and dispositions of the assets of the Company;
|
|
•
|
provide reasonable assurance that transactions are recorded as necessary to permit preparation of financial statements in accordance with generally accepted accounting principles, and that receipts and expenditures of the Company are being made only in accordance with authorizations of management and directors of the Company; and
|
|
•
|
provide reasonable assurance regarding prevention or timely detection of unauthorized acquisition, use or disposition of the Company’s assets that could have a material effect on the financial statements.
|
Because of its inherent limitations, internal control over financial reporting may not prevent or detect misstatements. Also, projections of any evaluation of effectiveness to future periods are subject to the risk that controls may become inadequate because of changes in conditions, or that the degree of compliance with the policies or procedures may deteriorate.
The Company’s management assessed the effectiveness of the Company’s internal control over financial reporting as of December 31, 2012. In making this assessment, it used the criteria set forth in the Internal Control—Integrated Framework issued by the Committee of Sponsoring Organizations of the Treadway Commission (COSO). Based on its assessment, the Company’s management has concluded that, as of December 31, 2012, the Company’s internal control over financial reporting is effective based on those criteria.
The Company’s independent registered public accounting firm, Ernst & Young LLP, issued an attestation report on the Company’s internal control over financial reporting. See Section 4 below.
(3) Changes in Internal Controls.
During the quarter ended December 31, 2012, there were no changes in the Company's internal control over financial reporting that materially affected, or are reasonably likely to materially affect, the Company's internal control over financial reporting.
74
(4) Report of Independent Registered Public Accounting Firm
The Board of Directors and Shareholders of
Vertex Pharmaceuticals Incorporated
We have audited Vertex Pharmaceuticals Incorporated’s internal control over financial reporting as of December 31, 2012, based on criteria established in Internal Control—Integrated Framework issued by the Committee of Sponsoring Organizations of the Treadway Commission (the COSO criteria). Vertex Pharmaceuticals Incorporated’s management is responsible for maintaining effective internal control over financial reporting, and for its assessment of the effectiveness of internal control over financial reporting included in the accompanying Management’s Annual Report on Internal Control Over Financial Reporting. Our responsibility is to express an opinion on the company’s internal control over financial reporting based on our audit.
We conducted our audit in accordance with the standards of the Public Company Accounting Oversight Board (United States). Those standards require that we plan and perform the audit to obtain reasonable assurance about whether effective internal control over financial reporting was maintained in all material respects. Our audit included obtaining an understanding of internal control over financial reporting, assessing the risk that a material weakness exists, testing and evaluating the design and operating effectiveness of internal control based on the assessed risk, and performing such other procedures as we considered necessary in the circumstances. We believe that our audit provides a reasonable basis for our opinion.
A company’s internal control over financial reporting is a process designed to provide reasonable assurance regarding the reliability of financial reporting and the preparation of financial statements for external purposes in accordance with generally accepted accounting principles. A company’s internal control over financial reporting includes those policies and procedures that (1) pertain to the maintenance of records that, in reasonable detail, accurately and fairly reflect the transactions and dispositions of the assets of the company; (2) provide reasonable assurance that transactions are recorded as necessary to permit preparation of financial statements in accordance with generally accepted accounting principles, and that receipts and expenditures of the company are being made only in accordance with authorizations of management and directors of the company; and (3) provide reasonable assurance regarding prevention or timely detection of unauthorized acquisition, use, or disposition of the company’s assets that could have a material effect on the financial statements.
Because of its inherent limitations, internal control over financial reporting may not prevent or detect misstatements. Also, projections of any evaluation of effectiveness to future periods are subject to the risk that controls may become inadequate because of changes in conditions, or that the degree of compliance with the policies or procedures may deteriorate.
In our opinion, Vertex Pharmaceuticals Incorporated maintained, in all material respects, effective internal control over financial reporting as of December 31, 2012, based on the COSO criteria.
We also have audited, in accordance with the standards of the Public Company Accounting Oversight Board (United States), the consolidated balance sheets of Vertex Pharmaceuticals Incorporated as of December 31, 2012 and 2011, and the related consolidated statements of operations, comprehensive income (loss), shareholders’ equity and noncontrolling interest, and cash flows for each of the three years in the period ended December 31, 2012 of Vertex Pharmaceuticals Incorporated and our report dated
March 1, 2013
expressed an unqualified opinion thereon.
/s/ Ernst & Young LLP
Boston, Massachusetts
March 1, 2013
|
ITEM 9B.
|
OTHER INFORMATION
|
Not applicable.
75
Portions of our definitive Proxy Statement for the 2013 Annual Meeting of Shareholders, or 2013 Proxy Statement, during which, we expect to, among other things, (i) elect our Class III Directors, (ii) conduct the non-binding advisory vote on our executive compensation program and (iii) ratify the appointment of our independent registered accounting firm, are incorporated by reference into this Part III of our Annual Report on Form 10-K.
|
ITEM 10.
|
DIRECTORS, EXECUTIVE OFFICERS AND CORPORATE GOVERNANCE
|
The information regarding directors required by this Item 10 will be included in our 2013 Proxy Statement under “Election of Directors,” “Corporate Governance and Risk Management” and “Shareholder Proposals for the 2014 Annual Meeting and Nominations for Director” and is incorporated herein by reference. Other information required by this Item 10 will be included in the 2013 Proxy Statement under “Section 16(a) Beneficial Ownership Reporting Compliance” and “Code of Conduct” and is incorporated herein by reference. The information regarding executive officers required by this Item 10 as well as certain information regarding our directors is included in Part I of this Annual Report on Form 10-K.
|
ITEM 11.
|
EXECUTIVE COMPENSATION
|
The information required by this Item 11 will be included in the 2013 Proxy Statement under “Compensation Committee Interlocks and Insider Participation,” “Compensation Discussion and Analysis,” “Compensation and Equity Tables,” “Director Compensation,” “Management Development and Compensation Committee Report” and/or “Corporate Governance and Risk Management” and is incorporated herein by reference.
|
ITEM 12.
|
SECURITY OWNERSHIP OF CERTAIN BENEFICIAL OWNERS AND MANAGEMENT AND RELATED STOCKHOLDER MATTERS
|
The information required by this Item 12 will be included in the 2013 Proxy Statement under “Security Ownership of Certain Beneficial Owners and Management” and “Equity Compensation Plan Information” and is incorporated herein by reference.
|
ITEM 13.
|
CERTAIN RELATIONSHIPS AND RELATED TRANSACTIONS, AND DIRECTOR INDEPENDENCE
|
The information required by this Item 13 will be included in the 2013 Proxy Statement under “ Election of Directors,” “Corporate Governance and Risk Management,” “Approval of Related Person Transactions” and “Transactions with Related Persons” and is incorporated herein by reference.
|
ITEM 14.
|
PRINCIPAL ACCOUNTANT FEES AND SERVICES
|
The information required by this Item 14 will be included in the 2013 Proxy Statement under “Ratification of the Appointment of Independent Registered Public Accounting Firm” and is incorporated herein by reference.
76
|
ITEM 15.
|
EXHIBITS AND FINANCIAL STATEMENT SCHEDULES
|
(a)(1) The Financial Statements required to be filed by Items 8 and 15(c) of Form 10-K, and filed herewith, are as follows:
|
Page Number in
this Form 10-K |
|
|
Report of Independent Registered Public Accounting Firm
|
F-1
|
|
Consolidated Statements of Operations for the years ended December 31, 2012, 2011 and 2010
|
F-2
|
|
Consolidated Statements of Comprehensive Income (Loss) for the years ended December 31, 2012, 2011 and 2010
|
F-3
|
|
Consolidated Balance Sheets as of December 31, 2012 and 2011
|
F-4
|
|
Consolidated Statements of Shareholders’ Equity and Noncontrolling Interest for the years ended December 31, 2012, 2011 and 2010
|
F-5
|
|
Consolidated Statements of Cash Flows for the years ended December 31, 2012, 2011 and 2010
|
F-6
|
|
Notes to Consolidated Financial Statements
|
F-7
|
(a)(2) Financial Statement Schedules have been omitted because they are either not applicable or the required information is included in the consolidated financial statements or notes thereto listed in (a)(1) above.
(a)(3) Exhibits.
The following is a list of exhibits filed as part of this Annual Report on Form 10-K.
|
Exhibit Number
|
Exhibit Description
|
Filed with
this report |
Incorporated by
Reference herein from—Form or Schedule |
Filing Date/
Period Covered |
SEC File/
Reg. Number |
|
3.1
|
Restated Articles of Organization of Vertex Pharmaceuticals Incorporated, as amended.
|
10-Q
(Exhibit 3.1)
|
August 11, 2008
|
000-19319
|
|
|
3.2
|
By-laws of Vertex Pharmaceuticals Incorporated, as amended and restated as of February 5, 2013.
|
8-K
(Exhibit 3.1)
|
February 11, 2013
|
000-19319
|
|
|
4.1
|
Specimen stock certificate.
|
S-1
(Exhibit 4.1)
|
July 18, 1991
|
33-40966
|
|
|
4.2
|
Subordinated Indenture, dated as of September 28, 2010, by and between Vertex Pharmaceuticals Incorporated and U.S. Bank National Association, as trustee.
|
8-K
(Exhibit 4.1)
|
September 29, 2010
|
000-19319
|
|
|
4.3
|
First Supplemental Indenture, dated as of September 28, 2010, by and between Vertex Pharmaceuticals Incorporated and U.S. Bank National Association, as trustee.
|
8-K
(Exhibit 4.2)
|
September 29, 2010
|
000-19319
|
|
|
4.4
|
Form of 3.35% Convertible Senior Subordinated Note due 2015.
|
8-K
(Exhibit 4.3)
|
September 29, 2010
|
000-19319
|
|
|
Collaboration Agreements
|
|||||
|
10.1
|
License, Development, Manufacturing and Commercialization Agreement, dated June 30, 2006, by and between Vertex Pharmaceuticals Incorporated and Janssen Pharmaceutica, N.V.†
|
10-K
(Exhibit 10.1)
|
February 22, 2012
|
000-19319
|
|
|
10.2
|
License, Development and Commercialization Agreement, dated as of June 11, 2004, between Vertex Pharmaceuticals Incorporated and Mitsubishi Pharma Corporation.†
|
10-Q
(Exhibit 10.1)
|
November 9, 2009
|
000-19319
|
|
|
10.3
|
Second Amendment to License, Development and Commercialization Agreement, dated July 30, 2009, between Mitsubishi Tanabe Pharma Corporation and Vertex Pharmaceuticals Incorporated.†
|
10-Q
(Exhibit 10.2)
|
November 9, 2009
|
000-19319
|
|
|
10.4
|
Research Agreement and License Agreement, both dated December 16, 1993, between Vertex and Burroughs Wellcome Co.†
|
10-K
(Exhibit 10.16)
|
Year Ended
December 31, 1993
|
000-19319
|
|
|
10.5
|
Research, Development and Commercialization Agreement, dated as of May 24, 2004, between Vertex Pharmaceuticals Incorporated and Cystic Fibrosis Foundation Therapeutics Incorporated.†
|
10-Q/A
(Exhibit 10.2)
|
August 19, 2011
|
000-19319
|
|
|
10.6
|
Amendment No. 1 to Research, Development and Commercialization Agreement, dated as of January 6, 2006, between Vertex Pharmaceuticals Incorporated and Cystic Fibrosis Foundation Therapeutics Incorporated.†
|
10-K
(Exhibit 10.9)
|
March 16, 2006
|
000-19319
|
|
77
|
Exhibit Number
|
Exhibit Description
|
Filed with
this report |
Incorporated by
Reference herein from—Form or Schedule |
Filing Date/
Period Covered |
SEC File/
Reg. Number |
|
10.7
|
Amendment No. 2 to Research, Development and Commercialization Agreement, dated as of March 17, 2006, between Vertex Pharmaceuticals Incorporated and Cystic Fibrosis Foundation Therapeutics Incorporated.
|
10-Q/A
(Exhibit 10.6)
|
August 19, 2011
|
000-19319
|
|
|
10.8
|
Amendment No. 5 to Research, Development and Commercialization Agreement, effective as of April 1, 2011, between Vertex Pharmaceuticals Incorporated and Cystic Fibrosis Foundation Therapeutics Incorporated.†
|
10-Q
(Exhibit 10.3)
|
August 9, 2011
|
000-19319
|
|
|
10.9
|
Research and Development Agreement between the Company and Eli Lilly and Company effective June 11, 1997†
|
10-Q
(Exhibit 10.1)
|
August 14, 1997
|
000-19319
|
|
|
10.10
|
License and Collaboration Agreement, dated June 13, 2011, by and between Alios BioPharma, Inc. and Vertex Pharmaceuticals Incorporated and Vertex Pharmaceuticals (Switzerland) LLC.†
|
10-Q
(Exhibit 10.1)
|
August 9, 2011
|
000-19319
|
|
|
Financial Transaction
|
|||||
|
10.11
|
Purchase Agreement, dated May 30, 2008, by and between Vertex Pharmaceuticals Incorporated and Fosamprenavir Royalty, L.P.
|
10-Q
(Exhibit 10.2)
|
August 11, 2008
|
000-19319
|
|
|
Leases
|
|||||
|
10.12
|
Lease, dated May 5, 2011, between Fifty Northern Avenue LLC and Vertex Pharmaceuticals Incorporated.†
|
10-Q
(Exhibit 10.4)
|
August 9, 2011
|
000-19319
|
|
|
10.13
|
Lease, dated May 5, 2011, between Eleven Fan Pier Boulevard LLC and Vertex Pharmaceuticals Incorporated.†
|
10-Q
(Exhibit 10.5)
|
August 9, 2011
|
000-19319
|
|
|
10.14
|
Lease, dated as of March 3, 1995, between Fort Washington Realty Trust and Vertex.
|
10-K
(Exhibit 10.15)
|
Year Ended
December 31, 1994
|
000-19319
|
|
|
10.15
|
First Amendment to Lease, dated as of December 29, 1995, between Fort Washington Realty Trust and Vertex Pharmaceuticals Incorporated.
|
10-K
(Exhibit 10.15)
|
Year Ended
December 31, 1995
|
000-19319
|
|
|
10.16
|
Second Amendment to Lease, dated as of June 13, 1997, between Fort Washington Realty Trust and Vertex Pharmaceuticals Incorporated.
|
10-K
(Exhibit 10.20)
|
March 26, 1998
|
000-19319
|
|
|
10.17
|
Third, Fourth and Fifth Amendments to Lease between Fort Washington Realty Trust and Vertex Pharmaceuticals Incorporated.†
|
10-K
(Exhibit 10.14)
|
March 26, 2001
|
000-19319
|
|
|
10.18
|
Lease, dated as of September 17, 1999, between Trustees of Fort Washington Realty Trust and Vertex Pharmaceuticals Incorporated.†
|
10-Q
(Exhibit 10.27)
|
November 15, 1999
|
000-19319
|
|
|
10.19
|
Amendment to Lease, dated January 12, 2009, by and between BMR-200 Sidney Street LLC (as successor in interest to Fort Washington Realty Trust), and Vertex Pharmaceuticals Incorporated.
|
10-Q
(Exhibit 10.4)
|
May 11, 2009
|
000-19319
|
|
|
10.20
|
Lease, dated as of January 18, 2001, between Kendall Square, LLC and Vertex Pharmaceuticals Incorporated.†
|
10-K
(Exhibit 10.16)
|
March 26, 2001
|
000-19319
|
|
|
10.21
|
Agreement for Lease, dated as of November 4, 1998, between Milton Park Limited, Vertex Pharmaceuticals Incorporated and Vertex Pharmaceuticals (Europe) Limited.
|
10-K
(Exhibit 10.21)
|
March 30, 1999
|
000-19319
|
|
|
10.22
|
Lease between MEPC Milton Park No.1 Limited and MEPC Milton Park No. 2 Limited, Vertex Pharmaceuticals (Europe) Limited and Vertex Pharmaceuticals Incorporated, dated June 10, 2009.
|
10-Q
(Exhibit 10.1)
|
August 10, 2009
|
000-19319
|
|
|
Equity Plans
|
|||||
|
10.23
|
1996 Stock and Option Plan, as amended and restated as of March 14, 2005.*
|
10-K
(Exhibit 10.3)
|
March 16, 2005
|
000-19319
|
|
|
10.24
|
Form of Stock Option Grant under 1996 Stock and Option Plan.*
|
8-K
(Exhibit 10.1)
|
February 9, 2005
|
000-19319
|
|
|
10.25
|
Amended and Restated 2006 Stock and Option Plan.*
|
10-Q
(Exhibit 10.3)
|
August 8, 2012
|
000-19319
|
|
|
10.26
|
Form of Stock Option Grant under 2006 Stock and Option Plan.*
|
8-K
(Exhibit 10.2)
|
May 15, 2006
|
000-19319
|
|
|
10.27
|
Form of Restricted Stock Award under 2006 Stock and Option Plan.*
|
8-K
(Exhibit 10.3)
|
May 15, 2006
|
000-19319
|
|
|
10.28
|
Form of Restricted Stock Award (Performance Accelerated Restricted Stock) under 2006 Stock and Option Plan.*
|
8-K
(Exhibit 10.4)
|
May 15, 2006
|
000-19319
|
|
|
10.29
|
Form of Stock Option Grant-Performance Accelerated 2009 Stock-Options.*
|
10-K
(Exhibit 10.33)
|
February 19, 2010
|
000-19319
|
|
|
10.30
|
Vertex Pharmaceuticals Incorporated Employee Stock Purchase Plan, as amended and restated.*
|
10-Q
(Exhibit 10.4)
|
August 8, 2012
|
000-19319
|
|
78
|
Exhibit Number
|
Exhibit Description
|
Filed with
this report |
Incorporated by
Reference herein from—Form or Schedule |
Filing Date/
Period Covered |
SEC File/
Reg. Number |
|
Agreements with Executive Officers and Directors
|
|||||
|
10.31
|
Agreement between Jeffrey M. Leiden and Vertex, dated December 14, 2011.*
|
10-K
(Exhibit 10.34)
|
February 22, 2012
|
000-19319
|
|
|
10.32
|
Employee Non-disclosure, Non-competition and Inventions Agreement between Jeffrey M. Leiden and Vertex, dated December 14, 2011.*
|
10-K
(Exhibit 10.35)
|
February 22, 2012
|
000-19319
|
|
|
10.33
|
Transition Agreement between Matthew W. Emmens and Vertex, dated December 14, 2011.*
|
10-K
(Exhibit 10.38)
|
February 22, 2012
|
000-19319
|
|
|
10.34
|
Employment Agreement, dated as of August 27, 2012, between Vertex Pharmaceuticals Incorporated and Stuart Arbuckle.*
|
10-Q
(Exhibit 10.1)
|
November 6, 2012
|
000-19319
|
|
|
10.35
|
Change of Control Agreement, dated as of August 27, 2012, between Vertex Pharmaceuticals Incorporated and Stuart Arbuckle.*
|
10-Q
(Exhibit 10.2)
|
November 6, 2012
|
000-19319
|
|
|
10.36
|
Employment Agreement, dated as of June 11, 2012, between Vertex Pharmaceuticals Incorporated and Kenneth L. Horton.*
|
10-Q
(Exhibit 10.1)
|
August 8, 2012
|
000-19319
|
|
|
10.37
|
Change of Control Agreement, dated as of June 11, 2012, between Vertex Pharmaceuticals Incorporated and Kenneth L. Horton.*
|
10-Q
(Exhibit 10.2)
|
August 8, 2012
|
000-19319
|
|
|
10.38
|
Second Amended and Restated Employment Agreement, dated November 15, 2012, between Peter Mueller and Vertex.*
|
X
|
|
|
|
|
10.39
|
Second Amended and Restated Change of Control Agreement, dated November 15, 2012, between Vertex and Peter Mueller.*
|
X
|
|
|
|
|
10.40
|
Amended and Restated Employment Agreement, dated as of November 8, 2004, between Vertex and Ian F. Smith.*
|
10-Q
(Exhibit 10.13)
|
November 9, 2004
|
000-19319
|
|
|
10.41
|
Amendment No. 1 to Amended and Restated Employment Agreement between Ian F. Smith and Vertex, dated December 29, 2008.*
|
10-K
(Exhibit 10.66)
|
February 17, 2009
|
000-19319
|
|
|
10.42
|
Employment Agreement, dated as of January 26, 2012 between Vertex and David T. Howton.*
|
10-K
(Exhibit 10.50)
|
February 22, 2012
|
000-19319
|
|
|
10.43
|
Change of Control Agreement, dated as of January 26, 2012 between Vertex and David T. Howton.*
|
10-K
(Exhibit 10.51)
|
February 22, 2012
|
000-19319
|
|
|
10.44
|
Separation and General Release Agreement, dated as of November 29, 2012, between Vertex and David T. Howton.*
|
X
|
|||
|
10.45
|
Form of Employee Non-Disclosure and Inventions Agreement.*
|
S-1
(Exhibit 10.4)
|
May 30, 1991
|
33-40966
|
|
|
10.46
|
Vertex Employee Compensation Plan.*
|
X
|
|||
|
10.47
|
Vertex Pharmaceuticals Non-Employee Board Compensation.*
|
10-K
(Exhibit 10.57)
|
February 22, 2012
|
000-19319
|
|
|
Subsidiaries
|
|||||
|
21.1
|
Subsidiaries of Vertex Pharmaceuticals Incorporated.
|
X
|
|||
|
Consent
|
|||||
|
23.1
|
Consent of Independent Registered Public Accounting Firm Ernst & Young LLP.
|
X
|
|||
|
Certifications
|
|||||
|
31.1
|
Certification of the Chief Executive Officer under Section 302 of the Sarbanes-Oxley Act of 2002.
|
X
|
|||
|
31.2
|
Certification of the Chief Financial Officer under Section 302 of the Sarbanes-Oxley Act of 2002.
|
X
|
|||
|
32.1
|
Certification of the Chief Executive Officer and the Chief Financial Officer under Section 906 of the Sarbanes-Oxley Act of 2002.
|
X
|
|||
|
101.INS
|
XBRL Instance
|
X
|
|||
|
101.SCH
|
XBRL Taxonomy Extension Schema
|
X
|
|||
|
101.CAL
|
XBRL Taxonomy Extension Calculation
|
X
|
|||
|
101.LAB
|
XBRL Taxonomy Extension Labels
|
X
|
|||
|
101.PRE
|
XBRL Taxonomy Extension Presentation
|
X
|
|||
|
101.DEF
|
XBRL Taxonomy Extension Definition
|
X
|
|||
* Management contract, compensatory plan or agreement.
|
†
|
Confidential portions of this document have been filed separately with the Securities and Exchange Commission pursuant to a request for confidential treatment.
|
79
SIGNATURES
Pursuant to the requirements of Section 13 or 15(d) of the Securities Exchange Act of 1934, the registrant has duly caused this report to be signed on its behalf by the undersigned, thereunto duly authorized.
|
Vertex Pharmaceuticals Incorporated
|
||
|
March 1, 2013
|
By:
|
/s/ Jeffrey M. Leiden
|
|
Jeffrey M. Leiden
Chief Executive Officer
|
||
Pursuant to the requirements of the Securities Exchange Act of 1934, this report has been signed below by the following persons on behalf of the registrant and in the capacities and on the dates indicated.
|
Name
|
Title
|
Date
|
|||||||||||
|
/s/ Jeffrey M. Leiden
|
Chair of the Board, President and Chief Executive Officer (Principal Executive Officer)
|
||||||||||||
|
Jeffrey M. Leiden
|
March 1, 2013
|
||||||||||||
|
/s/ Ian F. Smith
|
Executive Vice President and Chief Financial Officer (Principal Financial Officer)
|
||||||||||||
|
Ian F. Smith
|
March 1, 2013
|
||||||||||||
|
/s/ Paul M. Silva
|
Senior Vice President and Corporate Controller (Principal Accounting Officer)
|
||||||||||||
|
Paul M. Silva
|
March 1, 2013
|
||||||||||||
|
/s/ David Altshuler
|
Director
|
||||||||||||
|
David Altshuler
|
March 1, 2013
|
||||||||||||
|
/s/ Joshua S. Boger
|
Director
|
||||||||||||
|
Joshua S. Boger
|
March 1, 2013
|
||||||||||||
|
/s/ Matthew W. Emmens
|
Director
|
||||||||||||
|
Matthew W. Emmens
|
March 1, 2013
|
||||||||||||
|
/s/ Terrence C. Kearney
|
Director
|
||||||||||||
|
Terrence C. Kearney
|
March 1, 2013
|
||||||||||||
|
/s/ Yuchun Lee
|
Director
|
||||||||||||
|
Yuchun Lee
|
March 1, 2013
|
||||||||||||
|
/s/ Margaret G. McGlynn
|
Director
|
||||||||||||
|
Margaret G. McGlynn
|
March 1, 2013
|
||||||||||||
|
/s/ Wayne J. Riley
|
Director
|
||||||||||||
|
Wayne J. Riley
|
March 1, 2013
|
||||||||||||
|
/s/ Bruce I. Sachs
|
Director
|
||||||||||||
|
Bruce I. Sachs
|
March 1, 2013
|
||||||||||||
|
/s/ Elaine S. Ullian
|
Director
|
||||||||||||
|
Elaine S. Ullian
|
March 1, 2013
|
||||||||||||
80
Report of Independent Registered Public Accounting Firm
The Board of Directors and Shareholders of
Vertex Pharmaceuticals Incorporated
We have audited the accompanying consolidated balance sheets of Vertex Pharmaceuticals Incorporated as of December 31, 2012 and 2011, and the related consolidated statements of operations, comprehensive income (loss), shareholders’ equity and noncontrolling interest, and cash flows for each of the three years in the period ended December 31, 2012. These financial statements are the responsibility of the Company’s management. Our responsibility is to express an opinion on these financial statements based on our audits.
We conducted our audits in accordance with the standards of the Public Company Accounting Oversight Board (United States). Those standards require that we plan and perform the audit to obtain reasonable assurance about whether the financial statements are free of material misstatement. An audit includes examining, on a test basis, evidence supporting the amounts and disclosures in the financial statements. An audit also includes assessing the accounting principles used and significant estimates made by management, as well as evaluating the overall financial statement presentation. We believe that our audits provide a reasonable basis for our opinion.
In our opinion, the financial statements referred to above present fairly, in all material respects, the consolidated financial position of Vertex Pharmaceuticals Incorporated at December 31, 2012 and 2011, and the consolidated results of its operations and its cash flows for each of the three years in the period ended December 31, 2012, in conformity with U.S. generally accepted accounting principles.
We also have audited, in accordance with the standards of the Public Company Accounting Oversight Board (United States), Vertex Pharmaceuticals Incorporated’s internal control over financial reporting as of December 31, 2012, based on the criteria established in Internal Control—Integrated Framework issued by the Committee of Sponsoring Organizations of the Treadway Commissions and our report dated
March 1, 2013
expressed an unqualified opinion thereon.
|
/s/ Ernst & Young LLP
|
|
Boston, Massachusetts
March 1, 2013
F-1
|
VERTEX PHARMACEUTICALS INCORPORATED
(in thousands, except per share amounts)
|
|||||||||||
|
Year Ended December 31,
|
|||||||||||
|
2012
|
2011
|
2010
|
|||||||||
|
Revenues:
|
|||||||||||
|
Product revenues, net
|
$
|
1,333,458
|
|
$
|
950,889
|
|
$
|
—
|
|
||
|
Royalty revenues
|
141,498
|
|
50,015
|
|
30,244
|
|
|||||
|
Collaborative revenues
|
52,086
|
|
409,722
|
|
113,126
|
|
|||||
|
Total revenues
|
1,527,042
|
|
1,410,626
|
|
143,370
|
|
|||||
|
Costs and expenses:
|
|||||||||||
|
Cost of product revenues (Note F)
|
236,742
|
|
63,625
|
|
—
|
|
|||||
|
Royalty expenses
|
43,143
|
|
16,880
|
|
12,730
|
|
|||||
|
Research and development expenses
|
806,185
|
|
707,706
|
|
637,416
|
|
|||||
|
Sales, general and administrative expenses
|
436,796
|
|
400,721
|
|
187,800
|
|
|||||
|
Restructuring expense
|
1,844
|
|
2,074
|
|
1,501
|
|
|||||
|
Intangible asset impairment charge
|
—
|
|
105,800
|
|
—
|
|
|||||
|
Total costs and expenses
|
1,524,710
|
|
1,296,806
|
|
839,447
|
|
|||||
|
Income (loss) from operations
|
2,332
|
|
113,820
|
|
(696,077
|
)
|
|||||
|
Interest income
|
1,940
|
|
1,878
|
|
1,955
|
|
|||||
|
Interest expense
|
(16,653
|
)
|
(38,452
|
)
|
(19,275
|
)
|
|||||
|
Change in fair value of derivative instruments
|
—
|
|
(16,801
|
)
|
(41,229
|
)
|
|||||
|
Income (loss) before provision for (benefit from) income taxes
|
(12,381
|
)
|
60,445
|
|
(754,626
|
)
|
|||||
|
Provision for (benefit from) income taxes
|
38,754
|
|
19,266
|
|
—
|
|
|||||
|
Net income (loss)
|
(51,135
|
)
|
41,179
|
|
(754,626
|
)
|
|||||
|
Net loss (income) attributable to noncontrolling interest (Alios)
|
(55,897
|
)
|
(11,605
|
)
|
—
|
|
|||||
|
Net income (loss) attributable to Vertex
|
$
|
(107,032
|
)
|
$
|
29,574
|
|
$
|
(754,626
|
)
|
||
|
Net income (loss) per share attributable to Vertex common shareholders:
|
|||||||||||
|
Basic
|
$
|
(0.50
|
)
|
$
|
0.14
|
|
$
|
(3.77
|
)
|
||
|
Diluted
|
$
|
(0.50
|
)
|
$
|
0.14
|
|
$
|
(3.77
|
)
|
||
|
Shares used in per share calculations:
|
|||||||||||
|
Basic
|
211,946
|
|
204,891
|
|
200,402
|
|
|||||
|
Diluted
|
211,946
|
|
208,807
|
|
200,402
|
|
|||||
The accompanying notes are an integral part of the consolidated financial statements.
F-2
|
VERTEX PHARMACEUTICALS INCORPORATED
Consolidated Statements of Comprehensive Income (Loss)
(in thousands)
|
|||||||||||
|
Year ended December 31,
|
|||||||||||
|
2012
|
2011
|
2010
|
|||||||||
|
Net income (loss)
|
$
|
(51,135
|
)
|
$
|
41,179
|
|
$
|
(754,626
|
)
|
||
|
Changes in other comprehensive income (loss):
|
|||||||||||
|
Unrealized holding gains (losses) on marketable securities, net of tax
|
305
|
|
(119
|
)
|
46
|
|
|||||
|
Foreign currency translation adjustment
|
198
|
|
133
|
|
(473
|
)
|
|||||
|
Total changes in other comprehensive income (loss)
|
503
|
|
14
|
|
(427
|
)
|
|||||
|
Comprehensive income (loss)
|
(50,632
|
)
|
41,193
|
|
(755,053
|
)
|
|||||
|
Comprehensive loss (income) attributable to noncontrolling interest (Alios)
|
(55,897
|
)
|
(11,605
|
)
|
—
|
|
|||||
|
Comprehensive income (loss) attributable to Vertex
|
$
|
(106,529
|
)
|
$
|
29,588
|
|
$
|
(755,053
|
)
|
||
The accompanying notes are an integral part of the consolidated financial statements.
F-3
|
VERTEX PHARMACEUTICALS INCORPORATED
(in thousands, except share and per share amounts)
|
|||||||
|
December 31,
|
|||||||
|
2012
|
2011
|
||||||
|
Assets
|
|||||||
|
Current assets:
|
|||||||
|
Cash and cash equivalents
|
$
|
489,407
|
|
$
|
475,320
|
|
|
|
Marketable securities, available for sale
|
831,808
|
|
493,602
|
|
|||
|
Restricted cash and cash equivalents (Alios)
|
69,983
|
|
51,878
|
|
|||
|
Accounts receivable, net
|
143,250
|
|
183,135
|
|
|||
|
Inventories
|
30,464
|
|
112,430
|
|
|||
|
Prepaid expenses and other current assets
|
24,673
|
|
14,889
|
|
|||
|
Total current assets
|
1,589,585
|
|
1,331,254
|
|
|||
|
Restricted cash
|
31,934
|
|
34,090
|
|
|||
|
Property and equipment, net
|
433,609
|
|
133,176
|
|
|||
|
Intangible assets
|
663,500
|
|
663,500
|
|
|||
|
Goodwill
|
30,992
|
|
30,992
|
|
|||
|
Other assets
|
9,668
|
|
11,268
|
|
|||
|
Total assets
|
$
|
2,759,288
|
|
$
|
2,204,280
|
|
|
|
Liabilities and Shareholders’ Equity
|
|||||||
|
Current liabilities:
|
|||||||
|
Accounts payable
|
$
|
101,292
|
|
$
|
74,642
|
|
|
|
Accrued expenses
|
264,884
|
|
243,187
|
|
|||
|
Deferred revenues, current portion
|
27,566
|
|
45,037
|
|
|||
|
Accrued restructuring expense, current portion
|
4,758
|
|
4,932
|
|
|||
|
Capital lease obligations, current portion
|
13,707
|
|
—
|
|
|||
|
Income taxes payable (Alios)
|
715
|
|
12,075
|
|
|||
|
Other liabilities, current portion
|
19,702
|
|
12,475
|
|
|||
|
Total current liabilities
|
432,624
|
|
392,348
|
|
|||
|
Deferred revenues, excluding current portion
|
96,242
|
|
118,095
|
|
|||
|
Accrued restructuring expense, excluding current portion
|
18,570
|
|
21,381
|
|
|||
|
Capital lease obligations, excluding current portion
|
15,170
|
|
—
|
|
|||
|
Convertible senior subordinated notes (due 2015)
|
400,000
|
|
400,000
|
|
|||
|
Deferred tax liability
|
280,367
|
|
243,707
|
|
|||
|
Construction financing lease obligation
|
268,031
|
|
55,950
|
|
|||
|
Other liabilities, excluding current portion
|
13,902
|
|
7,287
|
|
|||
|
Total liabilities
|
1,524,906
|
|
1,238,768
|
|
|||
|
Commitments and contingencies (Note S and Note U)
|
|
|
|
|
|||
|
Redeemable noncontrolling interest (Alios)
|
38,530
|
|
37,036
|
|
|||
|
Shareholders’ equity:
|
|||||||
|
Preferred stock, $0.01 par value; 1,000,000 shares authorized; none issued and outstanding at December 31, 2012 and 2011
|
—
|
|
—
|
|
|||
|
Common stock, $0.01 par value; 300,000,000 shares authorized at December 31, 2012 and 2011; 217,286,868 and 209,303,995 shares issued and outstanding at December 31, 2012 and 2011, respectively
|
2,149
|
|
2,072
|
|
|||
|
Additional paid-in capital
|
4,519,448
|
|
4,200,659
|
|
|||
|
Accumulated other comprehensive loss
|
(550
|
)
|
(1,053
|
)
|
|||
|
Accumulated deficit
|
(3,521,867
|
)
|
(3,414,835
|
)
|
|||
|
Total Vertex shareholders’ equity
|
999,180
|
|
786,843
|
|
|||
|
Noncontrolling interest (Alios)
|
196,672
|
|
141,633
|
|
|||
|
Total shareholders’ equity
|
1,195,852
|
|
928,476
|
|
|||
|
Total liabilities and shareholders’ equity
|
$
|
2,759,288
|
|
$
|
2,204,280
|
|
|
_____________________
|
(1)
|
Amounts include the assets and liabilities of Vertex’s variable interest entity (“VIE”), Alios BioPharma, Inc. (“Alios”). Vertex’s interests and obligations with respect to the VIE’s assets and liabilities are limited to those accorded to Vertex in its agreement with Alios. See
Note B, "Collaborative Arrangements,"
to these consolidated financial statements for amounts.
|
The accompanying notes are an integral part of the consolidated financial statements.
F-4
|
Vertex Pharmaceuticals Incorporated
Consolidated Statements of Shareholders’ Equity and Noncontrolling Interest
(in thousands)
|
||||||||||||||||||||||||||||||||||
|
Common Stock
|
Additional
Paid-in Capital |
Accumulated
Other Comprehensive Income (Loss) |
Accumulated Deficit
|
Total Vertex
Shareholders’ Equity |
Noncontrolling
Interest (Alios) |
Total
Shareholders’ Equity |
Redeemable
Noncontrolling Interest (Alios) |
|||||||||||||||||||||||||||
|
Shares
|
Amount
|
|||||||||||||||||||||||||||||||||
|
Balance, December 31, 2009
|
199,955
|
|
$
|
1,982
|
|
$
|
3,784,787
|
|
$
|
(640
|
)
|
$
|
(2,689,783
|
)
|
$
|
1,096,346
|
|
$
|
—
|
|
$
|
1,096,346
|
|
$
|
—
|
|
||||||||
|
Unrealized holding gains (losses) on marketable securities, net of tax
|
46
|
|
46
|
|
46
|
|
||||||||||||||||||||||||||||
|
Foreign currency translation adjustment
|
(473
|
)
|
(473
|
)
|
(473
|
)
|
||||||||||||||||||||||||||||
|
Net income (loss)
|
(754,626
|
)
|
(754,626
|
)
|
(754,626
|
)
|
||||||||||||||||||||||||||||
|
Issuances of common stock:
|
||||||||||||||||||||||||||||||||||
|
Convertible senior subordinated notes (due 2013) conversion
|
1,386
|
|
14
|
|
31,551
|
|
31,565
|
|
31,565
|
|
||||||||||||||||||||||||
|
Benefit plans
|
2,182
|
|
20
|
|
39,971
|
|
39,991
|
|
39,991
|
|
||||||||||||||||||||||||
|
Stock-based compensation expense
|
91,124
|
|
91,124
|
|
91,124
|
|
||||||||||||||||||||||||||||
|
Balance, December 31, 2010
|
203,523
|
|
$
|
2,016
|
|
$
|
3,947,433
|
|
$
|
(1,067
|
)
|
$
|
(3,444,409
|
)
|
$
|
503,973
|
|
$
|
—
|
|
$
|
503,973
|
|
$
|
—
|
|
||||||||
|
Unrealized holding gains (losses) on marketable securities, net of tax
|
(119
|
)
|
(119
|
)
|
(119
|
)
|
||||||||||||||||||||||||||||
|
Foreign currency translation adjustment
|
133
|
|
133
|
|
133
|
|
||||||||||||||||||||||||||||
|
Net income (loss)
|
29,574
|
|
29,574
|
|
11,605
|
|
41,179
|
|
||||||||||||||||||||||||||
|
Issuances of common stock:
|
||||||||||||||||||||||||||||||||||
|
Benefit plans
|
5,781
|
|
56
|
|
133,362
|
|
133,418
|
|
(25
|
)
|
133,393
|
|
||||||||||||||||||||||
|
Stock-based compensation expense
|
118,964
|
|
118,964
|
|
304
|
|
119,268
|
|
||||||||||||||||||||||||||
|
Tax benefit from equity compensation
|
900
|
|
900
|
|
|
|
900
|
|
||||||||||||||||||||||||||
|
Alios noncontrolling interest upon consolidation
|
130,486
|
|
130,486
|
|
36,299
|
|
||||||||||||||||||||||||||||
|
Change in liquidation value of noncontrolling interest
|
(737
|
)
|
(737
|
)
|
737
|
|
||||||||||||||||||||||||||||
|
Balance, December 31, 2011
|
209,304
|
|
$
|
2,072
|
|
$
|
4,200,659
|
|
$
|
(1,053
|
)
|
$
|
(3,414,835
|
)
|
$
|
786,843
|
|
$
|
141,633
|
|
$
|
928,476
|
|
$
|
37,036
|
|
||||||||
|
Unrealized holding gains (losses) on marketable securities, net of tax
|
305
|
|
305
|
|
305
|
|
||||||||||||||||||||||||||||
|
Foreign currency translation adjustment
|
198
|
|
198
|
|
198
|
|
||||||||||||||||||||||||||||
|
Net income (loss)
|
(107,032
|
)
|
(107,032
|
)
|
55,897
|
|
(51,135
|
)
|
||||||||||||||||||||||||||
|
Issuances of common stock:
|
||||||||||||||||||||||||||||||||||
|
Benefit plans
|
7,983
|
|
77
|
|
201,760
|
|
201,837
|
|
155
|
|
201,992
|
|
||||||||||||||||||||||
|
Stock-based compensation expense
|
115,058
|
|
115,058
|
|
481
|
|
115,539
|
|
||||||||||||||||||||||||||
|
Tax benefit from equity compensation
|
1,971
|
|
1,971
|
|
|
|
1,971
|
|
||||||||||||||||||||||||||
|
Change in liquidation value of redeemable noncontrolling interest
|
(1,494
|
)
|
(1,494
|
)
|
1,494
|
|
||||||||||||||||||||||||||||
|
Balance, December 31, 2012
|
217,287
|
|
$
|
2,149
|
|
$
|
4,519,448
|
|
$
|
(550
|
)
|
$
|
(3,521,867
|
)
|
$
|
999,180
|
|
$
|
196,672
|
|
$
|
1,195,852
|
|
$
|
38,530
|
|
||||||||
The accompanying notes are an integral part of the consolidated financial statements.
F-5
|
VERTEX PHARMACEUTICALS INCORPORATED
(in thousands)
|
|||||||||||
|
Year Ended December 31,
|
|||||||||||
|
2012
|
2011
|
2010
|
|||||||||
|
Cash flows from operating activities:
|
|||||||||||
|
Net income (loss)
|
$
|
(51,135
|
)
|
$
|
41,179
|
|
$
|
(754,626
|
)
|
||
|
Adjustments to reconcile net income (loss) to net cash provided by (used in) operating activities:
|
|||||||||||
|
Depreciation and amortization expense
|
38,191
|
|
35,041
|
|
30,459
|
|
|||||
|
Stock-based compensation expense
|
114,285
|
|
118,226
|
|
91,124
|
|
|||||
|
Other non-cash based compensation expense
|
10,261
|
|
8,525
|
|
6,552
|
|
|||||
|
Intangible asset impairment charge
|
—
|
|
105,800
|
|
—
|
|
|||||
|
Secured notes (due 2012) discount amortization expense
|
—
|
|
18,409
|
|
13,589
|
|
|||||
|
Change in fair value of derivative instruments
|
—
|
|
16,801
|
|
41,229
|
|
|||||
|
Deferred income taxes
|
36,660
|
|
(7,501
|
)
|
—
|
|
|||||
|
Loss on disposal of property and equipment
|
390
|
|
55
|
|
39
|
|
|||||
|
Write-downs of inventories to net realizable value
|
133,189
|
|
—
|
|
—
|
|
|||||
|
Other non-cash items, net
|
(212
|
)
|
264
|
|
(31
|
)
|
|||||
|
Changes in operating assets and liabilities, excluding the effects of the acquisition of a variable interest entity (Alios):
|
|||||||||||
|
Accounts receivable, net
|
39,912
|
|
(170,606
|
)
|
(2,923
|
)
|
|||||
|
Inventories
|
(29,925
|
)
|
(111,388
|
)
|
—
|
|
|||||
|
Prepaid expenses and other current assets
|
(12,259
|
)
|
(1,717
|
)
|
(600
|
)
|
|||||
|
Accounts payable
|
14,892
|
|
37,468
|
|
(1,182
|
)
|
|||||
|
Accrued expenses and other liabilities
|
29,232
|
|
116,822
|
|
11,213
|
|
|||||
|
Excess tax benefit from share-based payment arrangements
|
(1,971
|
)
|
(900
|
)
|
—
|
|
|||||
|
Accrued restructuring expense
|
(2,985
|
)
|
(3,282
|
)
|
(4,422
|
)
|
|||||
|
Income taxes payable (Alios)
|
(11,360
|
)
|
12,075
|
|
—
|
|
|||||
|
Deferred revenues
|
(39,324
|
)
|
(71,536
|
)
|
(65,863
|
)
|
|||||
|
Net cash provided by (used in) operating activities
|
267,841
|
|
143,735
|
|
(635,442
|
)
|
|||||
|
Cash flows from investing activities:
|
|||||||||||
|
Purchases of marketable securities
|
(1,705,829
|
)
|
(721,545
|
)
|
(1,234,719
|
)
|
|||||
|
Sales and maturities of marketable securities
|
1,367,927
|
|
1,016,040
|
|
1,284,806
|
|
|||||
|
Payment for acquisition of a variable interest entity (Alios)
|
—
|
|
(60,000
|
)
|
—
|
|
|||||
|
Expenditures for property and equipment
|
(71,140
|
)
|
(34,595
|
)
|
(38,054
|
)
|
|||||
|
Decrease (increase) in restricted cash and cash equivalents
|
2,156
|
|
—
|
|
(3,777
|
)
|
|||||
|
Decrease (increase) in restricted cash and cash equivalents (Alios)
|
(18,105
|
)
|
12,695
|
|
—
|
|
|||||
|
Decrease (increase) in other assets
|
(826
|
)
|
(183
|
)
|
(955
|
)
|
|||||
|
Net cash provided by (used in) investing activities
|
(425,817
|
)
|
212,412
|
|
7,301
|
|
|||||
|
Cash flows from financing activities:
|
|||||||||||
|
Excess tax benefit from share-based payment arrangements
|
1,971
|
|
900
|
|
—
|
|
|||||
|
Issuances of common stock from employee benefit plans
|
191,721
|
|
124,862
|
|
33,434
|
|
|||||
|
Issuance of convertible senior subordinated notes (due 2015)
|
—
|
|
—
|
|
391,645
|
|
|||||
|
Payments to redeem secured notes (due 2012)
|
—
|
|
(155,000
|
)
|
—
|
|
|||||
|
Settlement of milestone derivatives
|
—
|
|
(95,000
|
)
|
—
|
|
|||||
|
Payments on capital lease obligations
|
(2,615
|
)
|
—
|
|
—
|
|
|||||
|
Payments on construction financing lease obligation
|
(18,873
|
)
|
—
|
|
—
|
|
|||||
|
Debt conversion costs
|
—
|
|
—
|
|
(22
|
)
|
|||||
|
Net cash provided by (used in) financing activities
|
172,204
|
|
(124,238
|
)
|
425,057
|
|
|||||
|
Effect of changes in exchange rates on cash
|
(141
|
)
|
214
|
|
(377
|
)
|
|||||
|
Net increase (decrease) in cash and cash equivalents
|
14,087
|
|
232,123
|
|
(203,461
|
)
|
|||||
|
Cash and cash equivalents—beginning of period
|
475,320
|
|
243,197
|
|
446,658
|
|
|||||
|
Cash and cash equivalents—end of period
|
$
|
489,407
|
|
$
|
475,320
|
|
$
|
243,197
|
|
||
|
Supplemental disclosure of cash flow information:
|
|||||||||||
|
Cash paid for interest
|
$
|
13,400
|
|
$
|
13,512
|
|
$
|
761
|
|
||
|
Cash paid for income taxes
|
$
|
9,318
|
|
$
|
—
|
|
$
|
—
|
|
||
|
Conversion of convertible senior subordinated notes (due 2013) for common stock
|
$
|
—
|
|
$
|
—
|
|
$
|
32,071
|
|
||
|
Accrued interest offset to additional paid-in capital on conversion of convertible senior subordinated notes (due 2013)
|
$
|
—
|
|
$
|
—
|
|
$
|
140
|
|
||
|
Unamortized debt issuance costs of converted convertible senior subordinated notes (due 2013) offset to additional paid-in capital
|
$
|
—
|
|
$
|
—
|
|
$
|
624
|
|
||
|
Capitalization of construction in-process related to construction financing lease obligation
|
$
|
235,594
|
|
$
|
54,655
|
|
$
|
—
|
|
||
|
Assets acquired under capital lease obligations
|
$
|
30,101
|
|
$
|
—
|
|
$
|
—
|
|
||
The accompanying notes are an integral part of the consolidated financial statements.
F-6
VERTEX PHARMACEUTICALS INCORPORATED
Notes to Consolidated Financial Statements
|
A.
|
Nature of Business and Accounting Policies
|
Business
Vertex Pharmaceuticals Incorporated (“Vertex” or the “Company”) is in the business of discovering, developing, manufacturing and commercializing small molecule drugs for patients with serious diseases. The Company's
two
products are INCIVEK (telaprevir), which the Company markets in the United States and Canada for the treatment of adults with genotype 1 hepatitis C virus ("HCV") infection, and KALYDECO (ivacaftor), which the Company markets in the United States, Canada and Europe for the treatment of patients six years of age and older with cystic fibrosis ("CF"), who have a specific genetic mutation that is referred to as the G551D mutation.
The Company began recognizing net product revenues from sales of INCIVEK and KALYDECO, and related cost of product revenues related to INCIVEK and KALYDECO, in the second quarter of 2011 and first quarter of 2012, respectively. The Company’s collaborator, Janssen Pharmaceutica, N.V. (“Janssen”), began marketing telaprevir in its territories under the brand name INCIVO in September 2011. The Company’s net loss attributable to Vertex for
2012
was
$(107.0) million
, or
$(0.50)
per share. As of
December 31, 2012
, the Company had cash, cash equivalents and marketable securities of
$1.3 billion
. The Company expects that cash flows from the sales of its products and the royalties it expects to receive from Janssen, together with the Company’s cash, cash equivalents and marketable securities, will be sufficient to fund its operations for at least the next twelve months.
Vertex is subject to risks common to companies in its industry including, but not limited to, the dependence on revenues from its lead products, competition, uncertainty about clinical trial outcomes, uncertainties relating to pharmaceutical pricing and reimbursement, rapid technological change, uncertain protection of proprietary technology, the need to comply with government regulations, share price volatility, dependence on collaborative relationships and potential product liability.
Basis of Presentation
The consolidated financial statements reflect the operations of (i) the Company, (ii) its wholly-owned subsidiaries and (iii) Alios BioPharma, Inc. (“Alios”), a collaborator that is a variable interest entity (a “VIE”) for which the Company is deemed under applicable accounting guidance to be the primary beneficiary. All material intercompany balances and transactions have been eliminated. The Company operates in one segment, pharmaceuticals. Please refer to
Note W, "Segment Information,"
for enterprise-wide disclosures regarding the Company’s revenues, major customers and long-lived assets by geographic area.
Use of Estimates
The preparation of consolidated financial statements in accordance with accounting principles generally accepted in the United States of America (“GAAP”) requires management to make certain estimates and assumptions that affect the reported amounts of assets and liabilities and disclosure of contingent assets and liabilities at the date of the consolidated financial statements, and the amounts of revenues and expenses during the reported periods. Significant estimates in these consolidated financial statements have been made in connection with the calculation of revenues, inventories, research and development expenses, sales, general and administrative expenses, stock-based compensation expense, restructuring expense, the fair value of intangible assets, noncontrolling interest (Alios), income tax provision, derivative instruments and debt securities. The Company bases its estimates on historical experience and various other assumptions, including in certain circumstances future projections, that management believes to be reasonable under the circumstances. Actual results could differ from those estimates. Changes in estimates are reflected in reported results in the period in which they become known.
F-7
VERTEX PHARMACEUTICALS INCORPORATED
Notes to Consolidated Financial Statements (Continued)
Revenue Recognition
Product Revenues, Net
The Company sells its products principally to a limited number of major wholesalers, as well as selected regional wholesalers and specialty pharmacy providers (collectively, its “Customers”), that subsequently resell the products to patients and health care providers. The Company recognizes net revenues from product sales upon delivery as long as (i) there is persuasive evidence that an arrangement exists between the Company and the Customer, (ii) collectibility is reasonably assured and (iii) the price is fixed or determinable.
The Company has written contracts with its Customers and delivery occurs when a Customer receives a shipment of a product. The Company evaluates the creditworthiness of each of its Customers to determine whether revenues can be recognized upon delivery, subject to satisfaction of the other requirements, or whether recognition is required to be delayed until receipt of payment. In order to conclude that the price is fixed or determinable, the Company must be able to (i) calculate its gross product revenues from sales to Customers and (ii) reasonably estimate its net product revenues. The Company calculates gross product revenues based on the price that the Company charges its Customers. The Company estimates its net product revenues by deducting from its gross product revenues (a) trade allowances, such as invoice discounts for prompt payment and customer fees, (b) estimated government and private payor rebates, chargebacks and discounts, such as Medicaid reimbursements, (c) estimated reserves for expected product returns and (d) estimated costs of incentives offered to certain indirect customers, including patients.
Trade Allowances:
The Company generally provides invoice discounts on product sales to its Customers for prompt payment and pays fees for distribution services, such as fees for certain data that Customers provide to the Company. The payment terms for sales to Customers generally include a
2%
discount for payment within 30 days. The Company expects that, based on its experience, its Customers will earn these discounts and fees, and deducts the full amount of these discounts and fees from its gross product revenues and accounts receivable at the time such revenues are recognized.
Rebates, Chargebacks and Discounts:
The Company contracts with Medicaid, other government agencies and various private organizations (collectively, its “Third-party Payors”) so that products will be eligible for purchase by, or partial or full reimbursement from, such Third-party Payors. The Company estimates the rebates, chargebacks and discounts it will provide to Third-party Payors and deducts these estimated amounts from its gross product revenues at the time the revenues are recognized. For each product, the Company estimates the aggregate rebates, chargebacks and discounts that it will provide to Third-party Payors based upon (i) the Company’s contracts with these Third-party Payors, (ii) the government-mandated discounts applicable to government-funded programs and (iii) information obtained from the Company’s Customers and other third parties regarding the payor mix for such product.
Product Returns:
The Company estimates the amount of each product that will be returned and deducts these estimated amounts from its gross revenues at the time the revenues are recognized. The Company’s Customers have the right to return unopened unprescribed packages beginning
six
months prior to the labeled expiration date and ending
twelve
months after the labeled expiration date. To date product returns have been minimal and, based on inventory levels held by its Customers and its distribution model, the Company believes that returns of its products will continue to be minimal.
Other Incentives:
Other incentives that the Company offers to indirect customers include co-pay mitigation rebates provided by the Company to commercially insured patients who have coverage and who reside in states that permit co-pay mitigation programs. The Company’s co-pay mitigation programs are intended to reduce each participating patient’s portion of the financial responsibility for a product’s purchase price to a specified dollar amount. Based upon the terms of the Company's co-pay mitigation programs, the Company estimates average co-pay mitigation amounts for each of its products in order to establish its accruals for co-pay mitigation rebates and deducts these estimated amounts from its gross product revenues at the later of the date (i) the revenues are recognized or (ii) the incentive is offered. The Company’s co-pay mitigation rebates are subject to expiration.
F-8
VERTEX PHARMACEUTICALS INCORPORATED
Notes to Consolidated Financial Statements (Continued)
The following table summarizes activity in each of the product revenue allowance and reserve categories for the years ended December 31, 2012 and 2011:
|
Trade
Allowances |
Rebates,
Chargebacks and Discounts |
Product
Returns |
Other
Incentives |
Total
|
|||||||||||||
|
(in thousands)
|
|||||||||||||||||
|
2012
|
|||||||||||||||||
|
Beginning Balance
|
$
|
11,162
|
|
$
|
52,659
|
|
$
|
340
|
|
$
|
5,202
|
|
$
|
69,363
|
|
||
|
Provision related to current period sales
|
55,913
|
|
216,942
|
|
2,067
|
|
19,103
|
|
294,025
|
|
|||||||
|
Adjustments related to prior period sales
|
29
|
|
3,883
|
|
1,498
|
|
72
|
|
5,482
|
|
|||||||
|
Credits/payments made
|
(61,688
|
)
|
(209,924
|
)
|
(1,053
|
)
|
(20,812
|
)
|
(293,477
|
)
|
|||||||
|
Ending Balance
|
$
|
5,416
|
|
$
|
63,560
|
|
$
|
2,852
|
|
$
|
3,565
|
|
$
|
75,393
|
|
||
|
2011
|
|||||||||||||||||
|
Beginning Balance
|
$
|
—
|
|
$
|
—
|
|
$
|
—
|
|
$
|
—
|
|
$
|
—
|
|
||
|
Provision related to current period sales
|
38,228
|
|
75,145
|
|
553
|
|
9,692
|
|
123,618
|
|
|||||||
|
Credits/payments made
|
(27,066
|
)
|
(22,486
|
)
|
(213
|
)
|
(4,490
|
)
|
(54,255
|
)
|
|||||||
|
Ending Balance
|
$
|
11,162
|
|
$
|
52,659
|
|
$
|
340
|
|
$
|
5,202
|
|
$
|
69,363
|
|
||
Royalty Revenues
The Company’s royalty revenues on commercial sales of INCIVO (telaprevir) by Janssen are based on net sales of licensed products in licensed territories as provided by Janssen. The Company recognizes royalty revenues in the period the sales occur. The Company has sold its rights to receive certain royalties on sales of an HIV protease inhibitor (fosamprenavir) and recognizes the revenues related to this sale as royalty revenues. In the circumstance where the Company has sold its rights to future royalties under a license agreement and also maintains continuing involvement in the royalty arrangement (but not significant continuing involvement in the generation of the cash flows payable to the purchaser of the future royalty rights), the Company defers recognition of the proceeds it receives for the royalty stream and recognizes these deferred revenues over the life of the license agreement pursuant to the units-of-revenue method. The Company’s estimates regarding the estimated remaining royalty payments due to the purchaser have changed in the past and may change in the future.
Collaborative Revenues
The Company also recognizes revenues generated through collaborative research, development and/or commercialization agreements. The terms of these agreements typically include payment to the Company of one or more of the following: nonrefundable, up-front license fees; development and commercial milestone payments; funding of research and/or development activities; payments for services the Company provides through its third-party manufacturing network; and royalties on net sales of licensed products. Each of these types of payments results in collaborative revenues, except for revenues from royalties on net sales of licensed products, which are classified as royalty revenues.
Agreements Entered into prior to January 1, 2011
Collaborative research, development and/or commercialization agreements entered into prior to January 1, 2011 that contain multiple elements of revenue are divided into separate units of accounting if certain criteria are met, including whether the delivered element has stand-alone value to the collaborator and whether there is objective and reliable evidence of the fair value of the undelivered obligation(s). The Company allocates consideration it receives among the separate units either on the basis of each unit’s fair value or using the residual method, and applies the applicable revenue recognition criteria to each of the separate units.
F-9
VERTEX PHARMACEUTICALS INCORPORATED
Notes to Consolidated Financial Statements (Continued)
Up-front License Fees
The Company recognizes revenues from nonrefundable, up-front license fees on a straight-line basis over the contracted or estimated period of performance, which is typically the period over which the research and development is expected to occur or manufacturing services are expected to be provided. In order to estimate the period of performance, the Company is required to make estimates regarding the drug development and commercialization timelines for drugs and drug candidates being developed pursuant to the applicable agreement. The Company’s estimates regarding the period of performance under its collaboration agreements did not change during 2012, but have changed in the past and may change in the future.
Milestone Payments
At the inception of each agreement that includes research and development milestone payments, the Company evaluates whether each milestone is substantive on the basis of the contingent nature of the milestone, specifically reviewing factors such as the scientific and other risks that must be overcome to achieve the milestone, as well as the level of effort and investment required. The Company recognizes revenues related to substantive milestones in full in the period in which the substantive milestone is achieved if payment is reasonably assured. If a milestone is not considered substantive, the Company recognizes the applicable milestone payment over the period of performance. Commercial milestone payments are recognized in full upon achievement, if payment is reasonably assured.
Research and Development Activities/Manufacturing Services
Under certain of its collaboration agreements, the Company is entitled to reimbursement from its collaborators for specified research and development expenses and/or is entitled to payments for specified manufacturing services that the Company provides through its third-party manufacturing network. The Company considers the nature and contractual terms of the arrangement and the nature of the Company’s business operations in order to determine whether research and development funding will result in collaborative revenues or an offset to research and development expenses. The Company typically recognizes the revenues related to these reimbursable expenses and recognizes the revenues related to the manufacturing services in the period in which it incurred the reimbursable expenses or provided the manufacturing services.
Agreements Entered into or Materially Modified on or after January 1, 2011
On January 1, 2011, updated guidance on the recognition of revenues for agreements with multiple deliverables became effective and applies to any agreements entered into or materially modified by the Company on or after January 1, 2011. This updated guidance (i) relates to whether multiple deliverables exist, how the deliverables in a revenue arrangement should be separated and how the consideration should be allocated; (ii) requires companies to allocate revenues in an arrangement using management’s best estimate of selling prices of deliverables if a vendor does not have vendor-specific objective evidence or third-party evidence of selling price; and (iii) eliminates the use of the residual method and requires companies to allocate revenues using the relative selling price method. Subsequent to December 31, 2010, the Company has not entered into any material agreements or material modifications to existing agreements that would be accounted for by the Company pursuant to this updated guidance. If the Company enters into or materially modifies an agreement with multiple deliverables, this updated guidance could have a material effect on the Company’s consolidated financial statements in future periods.
Concentration of Credit Risk
Financial instruments that potentially subject the Company to concentration of credit risk consist principally of money market funds and marketable securities. The Company places these investments with highly rated financial institutions, and, by policy, limits the amounts of credit exposure to any one financial institution. These amounts at times may exceed federally insured limits. The Company has not experienced any credit losses in these accounts and does not believe it is exposed to any significant credit risk on these funds. The Company has no foreign exchange contracts, option contracts or other foreign exchange hedging arrangements.
The Company also is subject to credit risk from its accounts receivable related to its product sales and collaborators. The majority of the Company's accounts receivable arises from product sales in the United States. The Company evaluates the creditworthiness of each of its customers and has determined that all of its material customers are creditworthy. To date, the
F-10
VERTEX PHARMACEUTICALS INCORPORATED
Notes to Consolidated Financial Statements (Continued)
Company has not experienced significant losses with respect to the collection of its accounts receivable. The Company believes that its allowance for doubtful accounts was adequate at December 31, 2012. Please refer to
Note W, "Segment Information,"
for further information.
Cash and Cash Equivalents
The Company considers all highly liquid investments with original maturities of
three
months or less at the date of purchase to be cash equivalents. Cash equivalents consist principally of money market funds and debt securities.
Restricted Cash
Restricted cash consists of balances held in deposit with certain banks predominantly to collateralize conditional stand-by letters of credit in the names of the Company’s landlords pursuant to certain operating lease agreements. The Company also separately discloses on its consolidated balance sheets restricted cash and cash equivalents (Alios). Please refer to
Note B, "Collaborative Arrangements,"
for further information.
Marketable Securities
The Company's marketable securities consist of investments in U.S. Treasuries, government-sponsored enterprise securities and high-grade corporate bonds and commercial paper that are classified as available-for-sale. The Company classifies marketable securities available to fund current operations as current assets on its consolidated balance sheets. Marketable securities are classified as long-term assets on the consolidated balance sheets if (i) they have been in an unrealized loss position for longer than one year and (ii) the Company has the ability and intent to hold them (a) until the carrying value is recovered and (b) such holding period may be longer than one year. The Company's marketable securities are stated at fair value with their unrealized gains and losses included as a component of accumulated other comprehensive income (loss), which is a separate component of shareholders’ equity, until such gains and losses are realized. The fair value of these securities is based on quoted prices for identical or similar assets. If a decline in the fair value is considered other-than-temporary, based on available evidence, the unrealized loss is transferred from other comprehensive income (loss) to the consolidated statements of operations.
The Company reviews investments in marketable securities for other-than-temporary impairment whenever the fair value of an investment is less than the amortized cost and evidence indicates that an investment’s carrying amount is not recoverable within a reasonable period of time. To determine whether an impairment is other-than-temporary, the Company considers whether it has an intent to sell, or whether it is more likely than not that the Company will be required to sell, the investment before recovery of the investment’s amortized cost basis. Evidence considered in this assessment includes reasons for the impairment, compliance with the Company’s investment policy, the severity and the duration of the impairment and changes in value subsequent to year end. Please refer to
Note E, "Marketable Securities,"
for further information.
There were no charges recorded for other-than-temporary declines in fair value of marketable securities in
2012
,
2011
or
2010
. Realized gains and losses are determined using the specific identification method and are included in interest income in the consolidated statements of operations. There were no gross realized gains or losses recognized in
2012
,
2011
or
2010
.
Stock-based Compensation Expense
The Company expenses the fair value of employee stock options and other forms of stock-based employee compensation over the associated employee service period on a straight-line basis. For awards with performance conditions, the Company estimates the likelihood of satisfaction of the performance conditions, which affects the period over which the expense is recognized, and recognizes the expense using the accelerated attribution model. Stock-based compensation expense is determined based on the fair value of the award at the grant date, including estimated forfeitures, and is adjusted each period to reflect actual forfeitures and the outcomes of certain performance conditions. Please refer to
Note M, "Stock-based Compensation Expense,"
for further information.
F-11
VERTEX PHARMACEUTICALS INCORPORATED
Notes to Consolidated Financial Statements (Continued)
Research and Development Expenses
The Company expenses as incurred all research and development expenses, including amounts funded by research and development collaborations. The Company capitalizes nonrefundable advance payments made by the Company for research and development activities and expenses the payments as the related goods are delivered or the related services are performed.
Research and development expenses are comprised of costs incurred by the Company in performing research and development activities, including salary and benefits; stock-based compensation expense; laboratory supplies and other direct expenses; contractual services costs, including clinical trial and pharmaceutical development costs; expenses associated with drug supplies that are not being capitalized; and infrastructure costs, including facilities costs and depreciation expense.
Advertising Expenses
The Company expenses the costs of advertising, including promotional expenses, as incurred. Advertising expenses, recorded in sales, general and administrative expenses, were
$58.6 million
,
$30.8 million
and
$0
in 2012, 2011 and 2010, respectively.
Inventories
The Company values its inventories at the lower of cost or market. The Company determines the cost of its inventories, which includes amounts related to materials and manufacturing overhead, on a first-in, first-out basis. The Company performs an assessment of the recoverability of capitalized inventory during each reporting period, and writes down any excess and obsolete inventories to their realizable value in the period in which the impairment is first identified. Shipping and handling costs incurred for inventory purchases are capitalized and recorded upon sale in cost of product revenues in the consolidated statements of operations. Shipping and handling costs incurred for product shipments are recorded as incurred in cost of product revenues in the consolidated statements of operations.
The Company capitalizes inventories produced in preparation for initiating sales of a drug candidate when the related drug candidate is considered to have a high likelihood of regulatory approval and the related costs are expected to be recoverable through sales of the inventories. In determining whether or not to capitalize such inventories, the Company evaluates, among other factors, information regarding the drug candidate’s safety and efficacy, the status of regulatory submissions and communications with regulatory authorities and the outlook for commercial sales, including the existence of current or anticipated competitive drugs and the availability of reimbursement. In addition, the Company evaluates risks associated with manufacturing the drug candidate and the remaining shelf-life of the inventories. Please refer to
Note F, "Inventories,"
for further information.
Property and Equipment
Property and equipment are recorded at cost. Depreciation expense is provided using the straight-line method over the estimated useful life of the related asset, generally
four
to
seven
years for furniture and equipment and
three
to
five
years for computers and software. Leasehold improvements are depreciated using the straight-line method over the lesser of the useful life of the improvements or the estimated remaining life of the associated lease. Additions and betterments to property and equipment are capitalized. Maintenance and repairs to an asset that do not improve or extend its life are charged to operations. When assets are retired or otherwise disposed of, the assets and related accumulated depreciation are eliminated from the accounts and any resulting gain or loss is reflected in the Company’s consolidated statements of operations. The Company performs an assessment of the fair value of the assets if indicators of impairment are identified during each reporting period and records the assets at the lower of the net book value or the fair value of the assets.
The Company records certain construction costs incurred by a landlord as an asset and corresponding financing obligation on the Company's consolidated balance sheets. Please refer to
Note H, "Fan Pier Leases,"
for further information.
F-12
VERTEX PHARMACEUTICALS INCORPORATED
Notes to Consolidated Financial Statements (Continued)
Capital Leases
The assets and liabilities associated with capital lease agreements are recorded at the present value of the minimum lease payments at the inception of the lease agreement. The assets are amortized using the straight-line method over the estimated useful life of the related asset or the remaining life of the associated lease. Amortization of assets that the Company leases pursuant to a capital lease is included in depreciation expense. The Company performs an assessment of the fair value of the assets if indicators of impairment are identified during each reporting period and records the assets at the lower of the net book value or the fair value of the assets. Assets recorded under capital leases are recorded within "Property and equipment, net" and liabilities related to those assets are recorded within "Capital lease obligations, current portion" and "Capital lease obligations, excluding current portion," on the Company's consolidated balance sheets.
Income Taxes
Deferred tax assets and liabilities are recognized for the expected future tax consequences of temporary differences between the financial statement carrying amounts and the income tax bases of assets and liabilities. A valuation allowance is applied against any net deferred tax asset if, based on the available evidence, it is more likely than not that some or all of the deferred tax assets will not be realized.
The Company records liabilities related to uncertain tax positions in accordance with guidance that clarifies the accounting for uncertainty in income taxes recognized in a company's financial statements by prescribing a minimum recognition threshold and measurement attribute for the financial statement recognition and measurement of a tax position taken or expected to be taken in a tax return. The Company does not believe any such uncertain tax positions currently pending will have a material adverse effect on its consolidated financial statements, although an adverse resolution of one or more of these uncertain tax positions in any period could have a material effect on the Company's consolidated statements of operations for that period.
Financial Transaction Expenses
Issuance costs incurred to complete the Company’s convertible senior subordinated note offerings and the financial transactions that the Company entered into in September 2009 were deferred and included in other assets on the Company’s consolidated balance sheets. The issuance costs are amortized using the effective interest rate method over the term of the related debt or financial instrument. The amortization expense related to the issuance costs is included in interest expense on the consolidated statements of operations.
The Company defers direct and incremental costs associated with the sale of its rights to future royalties. These costs are included in other assets on the Company’s consolidated balance sheets and are amortized in the same manner and over the same period during which the related deferred revenues are recognized as royalty revenues. The amortization expense related to these transaction expenses is included in royalty expenses on the Company's consolidated statements of operations. Expenses incurred in connection with common stock issuances are recorded as an offset to additional paid-in capital on the Company's consolidated balance sheets.
Business Combinations
The Company assigns the value of consideration, including contingent consideration, transferred in business combinations to the appropriate accounts on the Company's consolidated balance sheet based on its fair value as of the effective date of the transaction. The Company accounted for its collaboration with Alios (the "Alios Collaboration") as a business combination as of June 13, 2011 (the effective date of the Company's collaboration agreement with Alios) as discussed in the "Variable Interest Entities"
policy described below. Increases in the fair value of the contingent payments pursuant to collaborations accounted for as business combinations result in a decrease in net income attributable to Vertex (or an increase in net loss attributable to Vertex) on a dollar-for-dollar basis. Transaction costs and any restructuring costs associated with these transactions are expensed as incurred.
F-13
VERTEX PHARMACEUTICALS INCORPORATED
Notes to Consolidated Financial Statements (Continued)
Variable Interest Entities
The Company reviews each collaboration agreement pursuant to which the Company licenses assets owned by a collaborator in order to determine whether or not the collaborator is a VIE. If the collaborator is a VIE, the Company assesses whether or not the Company is the primary beneficiary of that VIE based on a number of factors, including (i) which party has the power to direct the activities that most significantly affect the VIE’s economic performance, (ii) the parties’ contractual rights and responsibilities pursuant to the collaboration agreement and (iii) which party has the obligation to absorb losses or the right to receive benefits from the VIE. If the Company determines it is the primary beneficiary of a VIE, the Company consolidates the statements of operations and financial condition of the VIE into the Company’s consolidated financial statements. The Company consolidates Alios’ financial statements by (A) eliminating all intercompany balances and transactions and (B) allocating the noncontrolling interest in Alios between redeemable noncontrolling interest (Alios) and noncontrolling interest (Alios) on the Company's consolidated balance sheet and reflecting net loss (income) attributable to noncontrolling interest (Alios) in the Company’s consolidated statement of operations.
The Company re-evaluates the Alios Collaboration each reporting period in order to determine if there are changes in circumstances that would result in the Company ceasing to consolidate the statements of operations and financial condition of Alios into the Company’s consolidated financial statements. If Alios ceases to be a VIE or if the Company is no longer Alios’ primary beneficiary, the Company would deconsolidate Alios.
As of June 13, 2011, December 31, 2011 and December 31, 2012, the Company evaluated the Alios Collaboration and determined that Alios is a VIE and that the Company is Alios’ primary beneficiary. Please refer to
Note B, "Collaborative Arrangements,"
for further information.
Fair Value of In-process Research and Development Assets and Contingent Payments in Business Combinations
The Company estimates the fair value of assets, including the fair value of in-process research and development assets and contingent payments pursuant to collaborations accounted for as business combinations, from the perspective of a market participant, using a variety of methods. The present-value models used to estimate the fair values of research and development assets and contingent payments pursuant to collaborations incorporate significant assumptions, including: assumptions regarding the probability of obtaining marketing approval and/or achieving relevant development milestones for a drug candidate; estimates regarding the timing of and the expected costs to develop a drug candidate; estimates of future cash flows from potential product sales and/or the potential to achieve certain commercial milestones with respect to a drug candidate; and the appropriate discount and tax rates.
In-process Research and Development Assets
The Company records the fair value of in-process research and development assets as of the transaction date. Each of these assets is accounted for as an indefinite-lived intangible asset and maintained on the Company’s consolidated balance sheet until either the project underlying it is completed or the asset becomes impaired. If a project is completed, the carrying value of the related intangible asset is amortized as a part of cost of product revenues over the remaining estimated life of the asset beginning in the period in which the project is completed. If the asset becomes impaired or is abandoned, the carrying value of the related intangible asset is written down to its fair value and an impairment charge is recorded in the period in which the impairment occurs. In-process research and development assets are tested for impairment on an annual basis as of October 1, and more frequently if indicators are present or changes in circumstances suggest that impairment may exist. Please refer to
Note I, "Intangible Assets and Goodwill,"
for further information.
Goodwill
The difference between the purchase price and the fair value of assets acquired and liabilities assumed in a business combination is allocated to goodwill. Goodwill is evaluated for impairment on an annual basis as of October 1, and more frequently if indicators are present or changes in circumstances suggest that impairment may exist. Please refer to
Note I, "Intangible Assets and Goodwill,"
for further information.
F-14
VERTEX PHARMACEUTICALS INCORPORATED
Notes to Consolidated Financial Statements (Continued)
Derivative Instruments and Embedded Derivatives
The Company has entered into financial transactions involving free-standing derivative instruments and embedded derivatives. The embedded derivatives are required to be bifurcated from the host instruments because the derivatives are not clearly and closely related to the host instruments. The Company determines the fair value of each derivative instrument or embedded derivative on the date of issuance and at the end of each quarterly period. The estimates of the fair value of these derivatives, particularly with respect to derivatives related to the achievement of milestones in the development of telaprevir, included significant assumptions regarding the estimates market participants would make in order to evaluate these derivatives. Please refer to
Note K, "Convertible Senior Subordinated Notes,"
and
Note N, "September 2009 Financial Transactions,"
for further information.
Restructuring Expense
The Company records costs and liabilities associated with exit and disposal activities based on estimates of fair value in the period the liabilities are incurred. In periods subsequent to the initial measurement, the Company measures changes to the liability using the credit-adjusted risk-free discount rate applied in the initial period. The Company evaluates and adjusts these liabilities as appropriate for changes in circumstances at least on a quarterly basis. Please refer to
Note Q, "Restructuring Expense,"
for further information.
Comprehensive Income (Loss)
Comprehensive income (loss) consists of net income (loss) and other comprehensive income (loss), which includes foreign currency translation adjustments and unrealized gains and losses on certain marketable securities. For purposes of comprehensive income (loss) disclosures, the Company does not record tax provisions or benefits for the net changes in foreign currency translation adjustment, as the Company intends to permanently reinvest undistributed earnings in its foreign subsidiaries.
Foreign Currency Translation and Transactions
All material consolidated entities have the U.S. dollar as their functional currency. Non-U.S. dollar functional currency subsidiaries have assets and liabilities translated into U.S. dollars at rates of exchange in effect at the end of the year. Revenue and expense amounts are translated using the average exchange rates for the period. Net unrealized gains and losses resulting from foreign currency translation are included in accumulated other comprehensive income (loss), which is a separate component of shareholders’ equity. Included in accumulated other comprehensive income (loss) are net unrealized losses related to foreign currency translation of
$0.7 million
,
$0.9 million
and
$1.1 million
at
December 31, 2012
,
2011
, and
2010
, respectively. Net foreign currency exchange transaction gains or losses are included in net income (loss) on the Company’s consolidated statement of operations. Net transaction gains were
$0.4 million
for 2012 and net transaction losses were
$0.7 million
and
$0.1 million
in 2011 and 2010, respectively.
Net Income (Loss) Per Share Attributable to Vertex Common Shareholders
Basic and diluted net income per share attributable to Vertex common shareholders are presented in conformity with the two-class method required for participating securities. Under the two-class method, earnings are allocated to (i) Vertex common shares, excluding shares of restricted stock that have been issued but have not yet vested, and (ii) participating securities, based on their respective weighted-average shares outstanding for the period. Shares of unvested restricted stock have the non-forfeitable right to receive dividends on an equal basis with other outstanding common stock. As a result, these unvested shares of restricted stock are considered participating securities that must be included in the calculation of basic and diluted net income per share attributable to Vertex common shareholders using the two-class method. Potentially dilutive shares result from the assumed exercise of outstanding stock options (the proceeds of which are then assumed to have been used to repurchase outstanding stock using the treasury stock method) and the assumed conversion of convertible notes.
Basic net loss per share attributable to Vertex common shareholders is based upon the weighted-average number of common shares outstanding during the period, excluding restricted stock that has been issued but is not yet vested. Diluted net loss per share attributable to Vertex common shareholders is based upon the weighted-average number of common shares
F-15
VERTEX PHARMACEUTICALS INCORPORATED
Notes to Consolidated Financial Statements (Continued)
outstanding during the period plus additional weighted-average common equivalent shares outstanding during the period when the effect is dilutive.
Recent Accounting Pronouncements
In the first quarter of 2012, the Company retrospectively adopted amended guidance issued in June 2011 by the Financial Accounting Standards Board ("FASB") that resulted in two separate, but consecutive, statements of operations and comprehensive income (loss) that affected the presentation of the Company's consolidated financial statements.
In the third quarter of 2012, the FASB issued amended guidance applicable to annual impairment tests of indefinite-lived intangible assets. The FASB added an optional qualitative assessment for determining whether an indefinite-lived intangible asset is impaired. Prior to this guidance, companies were required to perform an annual impairment test that included a calculation of the fair value of the asset and a comparison of that fair value with its carrying value. If the carrying value exceeded the fair value, an impairment was recorded. The amended guidance allows a company the option to perform a qualitative assessment, considering both negative and positive evidence, regarding the potential impairment of the indefinite-lived intangible asset. If, based on the qualitative analysis, a company determines that it is more likely than not that the fair value of such an asset exceeds its carrying value, the company would be permitted to conclude that the indefinite-lived intangible asset was not impaired without a quantitative calculation of the fair value of the asset. Otherwise, the company would perform the quantitative calculation of the fair value and the comparison with the carrying value. This amended guidance will be effective for annual impairment tests performed by the Company for the year ending December 31, 2013.
The Company did not adopt any new accounting pronouncements during
2012
that had a material effect on the Company’s consolidated financial statements.
|
B.
|
Collaborative Arrangements
|
Janssen Pharmaceutica, N.V.
In 2006, the Company entered into a collaboration agreement with Janssen for the development, manufacture and commercialization of telaprevir, which Janssen began marketing under the brand name INCIVO in certain of its territories in September 2011. Under the collaboration agreement, Janssen agreed to be responsible for
50%
of the drug development costs incurred under the development program for the parties’ territories (North America for the Company, and the rest of the world, other than specified countries in Asia, for Janssen) and has exclusive rights to commercialize telaprevir in its territories including Europe, South America, the Middle East, Africa and Australia.
Janssen pays the Company a tiered royalty averaging in the
mid-20% range
as a percentage of net sales of INCIVO in Janssen’s territories. Janssen is required under the agreement to use diligent efforts to maximize net sales of INCIVO in its territories through its commercial marketing, pricing and contracting strategies. In addition, Janssen is responsible for certain third-party royalties on net sales of INCIVO in its territories.
Janssen made a
$165.0 million
up-front license payment to the Company in 2006. The up-front license payment is being amortized over the Company’s estimated period of performance under the collaboration agreement. As of
December 31, 2012
, there were
$43.5 million
in deferred revenues related to this up-front license payment that the Company expects to recognize over the remaining estimated period of performance.
Under the collaboration agreement, Janssen agreed to make contingent milestone payments for successful development, approval and launch of telaprevir as a product in its territories. At the inception of the agreement, the Company determined that all of these contingent milestones were substantive and would result in revenues in the period in which the milestone was achieved. The Company has earned
$350.0 million
of these contingent milestone payments, including a
$50.0 million
milestone payment earned in the first quarter of 2011 in connection with the European Medicines Agency’s acceptance of the marketing authorization application for INCIVO and an aggregate of
$200.0 million
in milestone payments earned in the third quarter of 2011 related to the approval of INCIVO by the European Commission and the launch of INCIVO in the European Union. The Company does not expect to receive any further milestone payments under this agreement.
F-16
VERTEX PHARMACEUTICALS INCORPORATED
Notes to Consolidated Financial Statements (Continued)
Under the Janssen collaboration agreement, each party incurs internal and external reimbursable expenses related to the telaprevir development program and is reimbursed by the other party for
50%
of these expenses. The Company recognizes the full amount of the reimbursable costs it incurs as research and development expenses on its consolidated statements of operations. The Company recognizes the amounts that Janssen is obligated to pay the Company with respect to reimbursable expenses, net of reimbursable expenses incurred by Janssen, as collaborative revenues. During 2012 and 2011, Janssen incurred more reimbursable costs than the Company, and the net amounts payable by the Company to reimburse Janssen were recorded as a reduction of collaborative revenues.
Each of the parties is responsible for drug supply in its territories. During the three years ended December 31, 2012, the Company provided Janssen certain services through the Company’s third-party manufacturing network for telaprevir. Reimbursements from Janssen for these manufacturing services were recorded as collaborative revenues.
Janssen may terminate the collaboration agreement upon the later of (i)
one
year’s advance notice and (ii) such period as may be required to assign and transfer to the Company specified filings and approvals. The agreement also may be terminated by either party for a material breach by the other, subject to notice and cure provisions. Unless earlier terminated, the agreement will continue in effect until the expiration of Janssen’s royalty obligations, which expire on a country-by-country basis on the later of (a) the last-to-expire patent covering INCIVO or (b) ten years after the first commercial sale in the country. In the European Union, the Company has a patent covering the composition-of-matter of INCIVO that expires in 2026.
During the three years ended
December 31, 2012
, the Company recognized the following revenues attributable to the Janssen collaboration:
|
2012
|
2011
|
2010
|
|||||||
|
(in thousands)
|
|||||||||
|
Royalty revenues
|
$
|
117,592
|
|
$
|
20,289
|
|
$
|
—
|
|
|
Collaborative revenues:
|
|||||||||
|
Amortized portion of up-front payment
|
$
|
12,428
|
|
$
|
12,428
|
|
$
|
12,428
|
|
|
Milestone revenues
|
—
|
|
250,000
|
|
—
|
|
|||
|
Net reimbursement (payment) for telaprevir development costs
|
(3,507
|
)
|
(8,418
|
)
|
9,245
|
|
|||
|
Reimbursement for manufacturing services
|
7,257
|
|
20,383
|
|
9,077
|
|
|||
|
Total collaborative revenues attributable to the Janssen collaboration
|
$
|
16,178
|
|
$
|
274,393
|
|
$
|
30,750
|
|
|
Total revenues attributable to the Janssen collaboration
|
$
|
133,770
|
|
$
|
294,682
|
|
$
|
30,750
|
|
Mitsubishi Tanabe Pharma Corporation
The Company has a collaboration agreement (the “MTPC Agreement”) with Mitsubishi Tanabe Pharma Corporation ("Mitsubishi Tanabe") pursuant to which Mitsubishi Tanabe has a fully-paid license to manufacture and commercialize TELAVIC (the brand name under which Mitsubishi Tanabe is marketing telaprevir) in Japan and other specified countries in Asia. In September 2011, Mitsubishi Tanabe obtained approval to market TELAVIC in Japan.
The parties entered into the MTPC Agreement in 2004 and amended it in 2009. Pursuant to the MTPC Agreement, Mitsubishi Tanabe provided financial and other support for the development and commercialization of telaprevir, made a
$105.0 million
payment in connection with the 2009 amendment of the collaboration agreement and made a
$65.0 million
commercial milestone payment recognized as collaborative revenues in the fourth quarter of 2011. There are no further payments under this collaboration agreement. Mitsubishi Tanabe is responsible for its own development and manufacturing costs in its territory.
Mitsubishi Tanabe may terminate the MTPC Agreement at any time without cause upon
60
days’ prior written notice to the Company. The MTPC Agreement also may be terminated by either party for a material breach by the other, subject to notice and cure provisions. Unless earlier terminated, the MTPC Agreement will continue in effect until the expiration of the last-to-expire patent covering telaprevir in Mitsubishi Tanabe's territories. In Japan, the Company has a patent covering the composition-of-matter of telaprevir that expires in 2021.
F-17
VERTEX PHARMACEUTICALS INCORPORATED
Notes to Consolidated Financial Statements (Continued)
The
$105.0 million
payment that the Company received in the third quarter of 2009 in connection with the amendment to the MTPC Agreement was a nonrefundable, up-front license fee, and revenues related to the 2009 payment were recognized on a straight-line basis over the period of performance of the Company’s obligations under the amended agreement. The final deferred revenues related to the 2009 up-front license payment were recognized in April 2012. In connection with the amendment to the MTPC Agreement, the Company supplied manufacturing services to Mitsubishi Tanabe, until April 2012, through the Company’s third-party manufacturing network for telaprevir.
During the three years ended
December 31, 2012
, the Company recognized the following collaborative revenues attributable to the Mitsubishi Tanabe collaboration:
|
2012
|
2011
|
2010
|
|||||||
|
(in thousands)
|
|||||||||
|
Amortized portion of up-front payments
|
$
|
12,744
|
|
$
|
38,232
|
|
$
|
38,232
|
|
|
Milestone revenues
|
485
|
|
68,515
|
|
—
|
|
|||
|
Payments for manufacturing services
|
5,650
|
|
14,928
|
|
43,636
|
|
|||
|
Total collaborative revenues attributable to the Mitsubishi Tanabe collaboration
|
$
|
18,879
|
|
$
|
121,675
|
|
$
|
81,868
|
|
Cystic Fibrosis Foundation Therapeutics Incorporated
In April 2011, the Company entered into an amendment (the “April 2011 Amendment”) to its existing collaboration agreement with Cystic Fibrosis Foundation Therapeutics Incorporated (“CFFT”) pursuant to which CFFT agreed to provide financial support for (i) development activities for VX-661, a corrector compound discovered under the collaboration, and (ii) additional research and development activities directed at discovering new corrector compounds.
The Company entered into the original collaboration agreement with CFFT in 2004 and amended it several times prior to 2011 to, among other things, provide partial funding for its cystic fibrosis drug discovery and development efforts. In 2006, the Company received a
$1.5 million
milestone payment from CFFT. There are no additional milestones payable by CFFT to the Company pursuant to the collaboration agreement, as amended. Under the April 2011 Amendment, CFFT agreed to provide the Company with up to
$75.0 million
in funding over approximately
five
years for corrector-compound research and development activities. The Company retains the right to develop and commercialize KALYDECO (ivacaftor), VX-809, VX-661 and any other compounds discovered during the course of the research collaboration with CFFT. The Company recognized collaborative revenues from this collaboration of
$17.0 million
,
$13.7 million
and
$0
, respectively, in
2012
,
2011
and
2010
.
In the original agreement, as amended prior to the April 2011 Amendment, the Company agreed to pay CFFT tiered royalties calculated as a percentage, ranging from single digits to sub-teens, of annual net sales of any approved drugs discovered during the research term that ended in 2008, including KALYDECO, VX-809 and VX-661. The April 2011 Amendment provides for a tiered royalty in the same range on net sales of corrector compounds discovered during the research term that began in 2011. In the third quarter of 2012, CFFT earned a commercial milestone payment from the Company upon achievement of certain sales levels for KALYDECO, which was reflected in the Company's cost of product revenues for 2012. The Company is obligated to make
one
additional commercial milestone payment upon achievement of certain sales levels of KALYDECO. The Company also is obligated to make a total of
two
one-time commercial milestone payments upon achievement of certain sales levels for corrector compounds.
The Company began marketing KALYDECO in the United States in the first quarter of 2012 and began marketing KALYDECO in certain countries in the European Union in the third quarter of 2012. The Company has royalty obligations to CFFT for each compound commercialized pursuant to this collaboration until the expiration of patents covering that compound. The Company has patents in the United States and European Union covering the composition-of-matter of ivacaftor that expire in 2027 and 2025, respectively, subject to potential patent life extensions. CFFT may terminate its funding obligations under the collaboration, as amended, in certain circumstances, in which case there will be a proportional adjustment to the royalty rates and commercial milestone payments for certain corrector compounds. The collaboration also may be terminated by either party for a material breach by the other, subject to notice and cure provisions.
F-18
VERTEX PHARMACEUTICALS INCORPORATED
Notes to Consolidated Financial Statements (Continued)
Alios BioPharma, Inc.
License and Collaboration Agreement
In June 2011, the Company entered into a license and collaboration agreement (the “Alios Agreement”) with Alios, a privately-held biotechnology company. The Company and Alios are collaborating on the research, development and commercialization of an HCV nucleotide analogue discovered by Alios, VX-135, which is designed to act on the HCV polymerase. In the third quarter of 2012, the Company ended the development of ALS-2158, a second HCV nucleotide analogue discovered by Alios and licensed to the Company pursuant to the Alios Agreement, because a Phase 1 clinical trial demonstrated that there was insufficient antiviral activity to warrant proceeding with further clinical development of that compound.
Alios and the Company began clinical development of ALS-2200 (now formulated as VX-135) and ALS-2158 in December 2011. The Company is responsible for all costs related to development, commercialization and manufacturing of each compound licensed to the Company pursuant to the Alios Agreement, provided funding to Alios to conduct the Phase 1 clinical trials for ALS-2200 and ALS-2158 and is providing funding for a research program directed to the discovery of additional HCV nucleotide analogues that act on the HCV polymerase.
Under the terms of the Alios Agreement, the Company received exclusive worldwide rights to ALS-2200 (VX-135) and ALS-2158, and has the option to select additional compounds discovered in the research program. Upon entering into the Alios Agreement, the Company paid Alios a
$60.0 million
up-front payment. As of December 31, 2012, Alios had earned an aggregate of $
60.0 million
in development milestone payments pursuant to the Alios Agreement, including a
$25.0 million
milestone payment in 2012. The Alios Agreement provides for development milestone payments to Alios of up to an additional $
312.5 million
if VX-135 is approved and commercialized. The Alios Agreement also provides for additional development milestone payments to Alios if a second HCV nucleotide analogue is approved and commercialized. In addition, Alios is eligible to receive commercial milestone payments of up to
$750.0 million
, as well as tiered royalties on net sales of approved drugs.
The Company may terminate the Alios Agreement (i) upon
30
days’ notice to Alios if the Company ceases development after VX-135 has experienced a technical failure and/or (ii) upon
60
days’ notice to Alios at any time after the Company completes specified Phase 2a clinical trials. The Alios Agreement also may be terminated by either party for a material breach by the other, and by Alios for the Company’s inactivity or if the Company challenges certain Alios patents, in each case subject to notice and cure provisions. Unless earlier terminated, the Alios Agreement will continue in effect until the expiration of the Company’s royalty obligations, which expire on a country-by-country basis on the later of (a) the date the last-to-expire patent covering a licensed product expires or (b)
ten
years after the first commercial sale in the country.
Alios is continuing to operate as a separate entity, is engaged in other programs directed at developing novel drugs that are not covered by the Alios Agreement and maintains ownership of the underlying patent rights that are licensed to the Company pursuant to the Alios Agreement. Under applicable accounting guidance, the Company has determined that Alios is a VIE, that Alios is a business and that the Company is Alios’ primary beneficiary. The Company based these determinations on, among other factors, the significance to Alios of the licensed compounds and on the Company’s power, through the joint steering committee for the licensed compounds established under the Alios Agreement, to direct the activities that most significantly affect the economic performance of Alios.
Accordingly, the Company consolidated Alios’ statements of operations and balance sheet with the Company’s consolidated financial statements beginning on June 13, 2011. However, the Company’s interests in Alios are limited to those accorded to the Company in the Alios Agreement. In particular, the Company did not acquire any equity interest in Alios, any interest in Alios’ cash and cash equivalents or any control over Alios’ activities that do not relate to the Alios Agreement. Alios does not have any right to the Company’s assets except as provided in the Alios Agreement.
Intangible Assets and Goodwill
As of December 31, 2012 and 2011, the Company had
$250.6 million
of intangible assets and
$4.9 million
of goodwill related to the Alios Collaboration. Please refer to
Note I, "Intangible Assets and Goodwill,"
for further information.
F-19
VERTEX PHARMACEUTICALS INCORPORATED
Notes to Consolidated Financial Statements (Continued)
Noncontrolling Interest (Alios)
The Company records noncontrolling interest (Alios) on
two
lines on its consolidated balance sheets. The noncontrolling interest (Alios) is reflected on two separate lines because Alios has both common shareholders and preferred shareholders that are entitled to redemption rights in certain circumstances. The Company records net loss (income) attributable to noncontrolling interest (Alios) on its consolidated statements of operations, reflecting Alios' net loss (income) for the reporting period, adjusted for changes in the fair value of contingent milestone and royalty payments, which is evaluated each reporting period. A summary of net loss (income) attributable to noncontrolling interest (Alios) for the two years ended December 31, 2012 is as follows:
|
2012
|
2011
|
|||||
|
(in thousands)
|
||||||
|
Loss (income) before provision for (benefit from) income taxes
|
$
|
20,044
|
|
$
|
9,536
|
|
|
Decrease (increase) in fair value of contingent milestone and royalty payments
|
(114,970
|
)
|
(69,950
|
)
|
||
|
Provision for (benefit from) income taxes
|
39,029
|
|
48,809
|
|
||
|
Net loss (income) attributable to noncontrolling interest (Alios)
|
$
|
(55,897
|
)
|
$
|
(11,605
|
)
|
The Company uses present-value models to determine the estimated fair value of the contingent milestone and royalty payments, based on assumptions regarding the probability of achieving the relevant milestones, estimates regarding the time to develop drug candidates, estimates of future product sales and the appropriate discount and tax rates. The Company bases its estimate of the probability of achieving the relevant milestones on industry data for similar assets and its own experience. The discount rates used in the valuation model represent a measure of credit risk associated with settling the liability. Significant judgment is used in determining the appropriateness of these assumptions at each reporting period. Changes in these assumptions could have a material effect on the fair value of the contingent milestone and royalty payments.
In 2012 and 2011, the fair value of the contingent milestone payments and royalties payable by Vertex to Alios related to the in-licensed HCV nucleotide analogue program increased by
$115.0 million
and
$70.0 million
, respectively, due to the advancement of the Company's HCV nucleotide program in 2011 and 2012, including the positive data the Company received in 2012 from a Phase 1 clinical trial that evaluated ALS-2200. If VX-135 continues to advance in clinical development, the Company expects it will record additional increases in the fair value of the contingent milestone and royalty payments in future periods. Changes in the fair value of these contingent milestone and royalty payments, and the effects of these changes on net income (loss) attributable to Vertex, were material in 2012 and 2011 and may be material in future periods.
F-20
VERTEX PHARMACEUTICALS INCORPORATED
Notes to Consolidated Financial Statements (Continued)
Alios Balance Sheet Information
The following table summarizes items related to Alios included in the Company’s consolidated balance sheets:
|
As of December 31,
|
||||||
|
2012
|
2011
|
|||||
|
(in thousands)
|
||||||
|
Restricted cash and cash equivalents (Alios)
|
$
|
69,983
|
|
$
|
51,878
|
|
|
Prepaid expenses and other current assets
|
672
|
|
2,299
|
|
||
|
Property and equipment, net
|
1,728
|
|
1,925
|
|
||
|
Intangible assets
|
250,600
|
|
250,600
|
|
||
|
Goodwill
|
4,890
|
|
4,890
|
|
||
|
Other assets
|
861
|
|
133
|
|
||
|
Accounts payable
|
1,054
|
|
4,132
|
|
||
|
Accrued expenses
|
6,099
|
|
4,304
|
|
||
|
Income taxes payable (Alios)
|
715
|
|
12,075
|
|
||
|
Deferred tax liability
|
152,781
|
|
116,121
|
|
||
|
Other liabilities, excluding current portion
|
910
|
|
1,030
|
|
||
|
Redeemable noncontrolling interest (Alios)
|
38,530
|
|
37,036
|
|
||
|
Noncontrolling interest (Alios)
|
196,672
|
|
141,633
|
|
||
The Company has recorded Alios’ cash and cash equivalents as restricted cash and cash equivalents (Alios) because (i) the Company does not have any interest in or control over Alios’ cash and cash equivalents and (ii) the Alios Agreement does not provide for these assets to be used for the development of the assets that the Company licensed from Alios pursuant to the Alios Agreement. Assets recorded as a result of consolidating Alios’ financial condition into the Company’s consolidated balance sheets do not represent additional assets that could be used to satisfy claims against the Company’s general assets.
Research and Development Funding
The Company’s collaborators funded portions of the Company’s research and development programs related to specific drugs, drug candidates and research targets, including, in 2012 and 2011, telaprevir, VX-661 and research directed toward identifying additional corrector compounds for the treatment of cystic fibrosis, and in 2010, telaprevir. The Company’s collaborative revenues, including amortization of up-front license fees and milestone revenues, were
$52.1 million
,
$409.7 million
and
$113.1 million
, respectively, in 2012, 2011 and 2010. The Company’s research and development expenses allocated to programs in which a collaborator funded at least a portion of the research and development expenses were approximately
$133 million
,
$146 million
and
$156 million
, respectively, in 2012, 2011 and 2010.
F-21
VERTEX PHARMACEUTICALS INCORPORATED
Notes to Consolidated Financial Statements (Continued)
|
C.
|
Net Income (Loss) Per Share Attributable to Vertex Common Shareholders
|
The following table sets forth the computation of basic and diluted net income (loss) per share for the three years ended December 31, 2012:
|
2012
|
2011
|
2010
|
|||||||
|
(in thousands, except per share amounts)
|
|||||||||
|
Basic net income (loss) attributable to Vertex per common share calculation:
|
|||||||||
|
Net income (loss) attributable to Vertex common shareholders
|
$
|
(107,032
|
)
|
$
|
29,574
|
|
$
|
(754,626
|
)
|
|
Less: Undistributed earnings allocated to participating securities
|
—
|
|
(291
|
)
|
—
|
|
|||
|
Net income (loss) attributable to Vertex common shareholders—basic
|
$
|
(107,032
|
)
|
$
|
29,283
|
|
$
|
(754,626
|
)
|
|
Basic weighted-average common shares outstanding
|
211,946
|
|
204,891
|
|
200,402
|
|
|||
|
Basic net income (loss) attributable to Vertex per common share
|
$
|
(0.50
|
)
|
$
|
0.14
|
|
$
|
(3.77
|
)
|
|
Diluted net income (loss) attributable to Vertex per common share calculation:
|
|||||||||
|
Net income (loss) attributable to Vertex common shareholders
|
$
|
(107,032
|
)
|
$
|
29,574
|
|
$
|
(754,626
|
)
|
|
Less: Undistributed earnings allocated to participating securities
|
—
|
|
(285
|
)
|
—
|
|
|||
|
Net income (loss) attributable to Vertex common shareholders—diluted
|
$
|
(107,032
|
)
|
$
|
29,289
|
|
$
|
(754,626
|
)
|
|
Weighted-average shares used to compute basic net income (loss) per common share
|
211,946
|
|
204,891
|
|
200,402
|
|
|||
|
Effect of potentially dilutive securities:
|
|||||||||
|
Stock options
|
—
|
|
3,863
|
|
—
|
|
|||
|
Other
|
—
|
|
53
|
|
—
|
|
|||
|
Weighted-average shares used to compute diluted net income (loss) per common share
|
211,946
|
|
208,807
|
|
200,402
|
|
|||
|
Diluted net income (loss) attributable to Vertex per common share
|
$
|
(0.50
|
)
|
$
|
0.14
|
|
$
|
(3.77
|
)
|
The Company did not include the securities described in the following table in the computation of the diluted net income (loss) attributable to Vertex per common share calculations because the effect would have been anti-dilutive during each such period:
|
2012
|
2011
|
2010
|
||||
|
(in thousands)
|
||||||
|
Stock options
|
19,726
|
|
9,626
|
|
21,293
|
|
|
Convertible senior subordinated notes
|
8,192
|
|
8,192
|
|
8,192
|
|
|
Unvested restricted stock and restricted stock units
|
2,350
|
|
8
|
|
1,950
|
|
|
D.
|
Fair Value Measurements
|
The fair value of the Company’s financial assets and liabilities reflects the Company’s estimate of amounts that it would have received in connection with the sale of the assets or paid in connection with the transfer of the liabilities in an orderly transaction between market participants at the measurement date. In connection with measuring the fair value of its assets and liabilities, the Company seeks to maximize the use of observable inputs (market data obtained from sources independent from the Company) and to minimize the use of unobservable inputs (the Company’s assumptions about how market participants would price assets and liabilities). The following fair value hierarchy is used to classify assets and liabilities based on the observable inputs and unobservable inputs used in order to value the assets and liabilities:
|
Level 1:
|
Quoted prices in active markets for identical assets or liabilities. An active market for an asset or liability is a market in which transactions for the asset or liability occur with sufficient frequency and volume to provide pricing information on an ongoing basis.
|
|
Level 2:
|
Observable inputs other than Level 1 inputs. Examples of Level 2 inputs include quoted prices in active markets for similar assets or liabilities and quoted prices for identical assets or liabilities in markets that are not active.
|
|
Level 3:
|
Unobservable inputs based on the Company’s assessment of the assumptions that market participants would use in pricing the asset or liability.
|
F-22
VERTEX PHARMACEUTICALS INCORPORATED
Notes to Consolidated Financial Statements (Continued)
The Company’s investment strategy is focused on capital preservation. The Company invests in instruments that meet the credit quality standards outlined in the Company’s investment policy. This policy also limits the amount of credit exposure to any one issue or type of instrument. As of December 31, 2012, the Company’s investments were in a money market fund, short-term U.S. Treasury securities, short-term government-sponsored enterprise securities, corporate debt securities and commercial paper.
As of December 31, 2012, all of the Company’s financial assets that were subject to fair value measurements were valued using observable inputs. The Company’s financial assets valued based on Level 1 inputs consisted of a money market fund, U.S. Treasury securities and government-sponsored enterprise securities. The Company’s financial assets valued based on Level 2 inputs consisted of corporate debt securities and commercial paper, which consist of investments in highly-rated investment-grade corporations. During 2012, 2011 and 2010, the Company did not record an other-than-temporary impairment charge related to its financial assets. The Company’s noncontrolling interest (Alios) includes the fair value of the contingent milestone and royalty payments, which is valued based on Level 3 inputs. Please refer to
Note B, "Collaborative Arrangements,"
for further information.
The following table sets forth the Company’s financial assets (excluding Alios’ cash equivalents) subject to fair value measurements:
|
Fair Value Measurements as
of December 31, 2012 |
||||||||||||
|
Fair Value Hierarchy
|
||||||||||||
|
Total
|
Level 1
|
Level 2
|
Level 3
|
|||||||||
|
(in thousands)
|
||||||||||||
|
Financial assets carried at fair value:
|
||||||||||||
|
Cash equivalents:
|
||||||||||||
|
Money market funds
|
$
|
268,463
|
|
$
|
268,463
|
|
$
|
—
|
|
$
|
—
|
|
|
Marketable securities:
|
||||||||||||
|
U.S. Treasury securities
|
111,350
|
|
111,350
|
|
—
|
|
—
|
|
||||
|
Government-sponsored enterprise securities
|
440,225
|
|
440,225
|
|
—
|
|
—
|
|
||||
|
Commercial paper
|
225,449
|
|
—
|
|
225,449
|
|
—
|
|
||||
|
Corporate debt securities
|
54,784
|
|
—
|
|
54,784
|
|
—
|
|
||||
|
Restricted cash
|
31,934
|
|
31,934
|
|
—
|
|
—
|
|
||||
|
Total
|
$
|
1,132,205
|
|
$
|
851,972
|
|
$
|
280,233
|
|
$
|
—
|
|
Alios’ cash equivalents of
$68.7 million
as of December 31, 2012 consisted of money market funds, which are valued based on Level 1 inputs.
As of
December 31, 2012
, the Company had
$400.0 million
in aggregate principal amount of
3.35%
convertible senior subordinated notes due 2015 (the “2015 Notes”) on its consolidated balance sheet. As of December 31, 2012, these 2015 Notes had a fair value of approximately
$444 million
based on Level 2 inputs.
F-23
VERTEX PHARMACEUTICALS INCORPORATED
Notes to Consolidated Financial Statements (Continued)
|
E.
|
Marketable Securities
|
A summary of the Company’s cash, cash equivalents and marketable securities is shown below:
|
Amortized
Cost |
Gross
Unrealized Gains |
Gross
Unrealized Losses |
Fair Value
|
|||||||||
|
(in thousands)
|
||||||||||||
|
December 31, 2012
|
||||||||||||
|
Cash and cash equivalents:
|
||||||||||||
|
Cash and money market funds
|
$
|
489,407
|
|
$
|
—
|
|
$
|
—
|
|
$
|
489,407
|
|
|
Total cash and cash equivalents
|
$
|
489,407
|
|
$
|
—
|
|
$
|
—
|
|
$
|
489,407
|
|
|
Marketable securities:
|
||||||||||||
|
U.S. Treasury securities (due within 1 year)
|
$
|
111,350
|
|
$
|
2
|
|
$
|
(2
|
)
|
$
|
111,350
|
|
|
Government-sponsored enterprise securities (due within 1 year)
|
440,181
|
|
49
|
|
(5
|
)
|
440,225
|
|
||||
|
Commercial paper (due within 1 year)
|
225,294
|
|
155
|
|
—
|
|
225,449
|
|
||||
|
Corporate debt securities (due within 1 year)
|
15,429
|
|
1
|
|
(1
|
)
|
15,429
|
|
||||
|
Corporate debt securities (due after 1 year through 5 years)
|
39,358
|
|
10
|
|
(13
|
)
|
39,355
|
|
||||
|
Total marketable securities
|
$
|
831,612
|
|
$
|
217
|
|
$
|
(21
|
)
|
$
|
831,808
|
|
|
Total cash, cash equivalents and marketable securities
|
$
|
1,321,019
|
|
$
|
217
|
|
$
|
(21
|
)
|
$
|
1,321,215
|
|
|
December 31, 2011
|
||||||||||||
|
Cash and cash equivalents:
|
||||||||||||
|
Cash and money market funds
|
$
|
362,035
|
|
$
|
—
|
|
$
|
—
|
|
$
|
362,035
|
|
|
Government-sponsored enterprise securities
|
113,302
|
|
—
|
|
(17
|
)
|
113,285
|
|
||||
|
Total cash and cash equivalents
|
$
|
475,337
|
|
$
|
—
|
|
$
|
(17
|
)
|
$
|
475,320
|
|
|
Marketable securities:
|
||||||||||||
|
U.S. Treasury securities (due within 1 year)
|
$
|
22,105
|
|
$
|
2
|
|
$
|
—
|
|
$
|
22,107
|
|
|
Government-sponsored enterprise securities (due within 1 year)
|
471,589
|
|
8
|
|
(102
|
)
|
471,495
|
|
||||
|
Total marketable securities
|
$
|
493,694
|
|
$
|
10
|
|
$
|
(102
|
)
|
$
|
493,602
|
|
|
Total cash, cash equivalents and marketable securities
|
$
|
969,031
|
|
$
|
10
|
|
$
|
(119
|
)
|
$
|
968,922
|
|
Alios’
$70.0 million
and
$51.9 million
, respectively, of cash and money market funds as of
December 31, 2012
and 2011, recorded on the Company’s consolidated balance sheets in “Restricted cash and cash equivalents (Alios),” are not included in the above table.
|
F.
|
Inventories
|
The Company began capitalizing inventory costs for INCIVEK on January 1, 2011 and inventory costs for KALYDECO on January 1, 2012. The following table sets forth the Company's inventories by product:
|
As of December 31,
|
||||||
|
2012
|
2011
|
|||||
|
(in thousands)
|
||||||
|
INCIVEK
|
$
|
22,792
|
|
$
|
112,430
|
|
|
KALYDECO
|
7,672
|
|
—
|
|
||
|
Total
|
$
|
30,464
|
|
$
|
112,430
|
|
F-24
VERTEX PHARMACEUTICALS INCORPORATED
Notes to Consolidated Financial Statements (Continued)
The following table sets forth the Company’s inventories by type:
|
As of December 31,
|
||||||
|
2012
|
2011
|
|||||
|
(in thousands)
|
||||||
|
Raw materials
|
$
|
3,754
|
|
$
|
32,213
|
|
|
Work-in-process
|
11,317
|
|
47,010
|
|
||
|
Finished goods
|
15,393
|
|
33,207
|
|
||
|
Total
|
$
|
30,464
|
|
$
|
112,430
|
|
In 2012, the Company recorded within cost of product revenues an aggregate of
$133.2 million
in lower of cost or market charges for excess and obsolete INCIVEK inventories. The Company's aggregate of
$133.2 million
in charges in 2012 for excess and obsolete INCIVEK inventories were the result of a
$78.0 million
charge during the second quarter of 2012 and a
$55.2 million
charge during the fourth quarter of 2012. The charges and corresponding inventory write-downs were based on the Company's analysis of its INCIVEK inventory levels in relation to its commercial outlook for INCIVEK. The aggregate of
$133.2 million
in lower of cost or market charges for excess and obsolete INCIVEK inventories affected the net income (loss) attributable to Vertex per diluted share, net of tax, by
$(0.61)
in 2012.
The field of treatment of HCV infection is highly competitive and characterized by rapid technological advances. In order to determine the amount of the inventory charges, the Company considered, among other factors, (i) decreases in demand for INCIVEK during 2012 and the Company's expectation that demand would decrease further in the future, (ii) the potential development by the Company of other drugs and combination treatments for HCV infection, including pursuant to collaboration agreements to evaluate VX-135 in combination with drug candidates controlled by third parties, that make it unlikely that INCIVEK will play a role in future combination therapies, (iii) the placement of a Boxed Warning on the INCIVEK prescribing information in December 2012, (iv) the potential development by the Company's competitors of other drugs and combination treatments for HCV infection, (v) positive results reported in 2012 from clinical trials of drug candidates being developed by the Company and its competitors and (vi) the initiation by the Company's competitors of additional Phase 2 and Phase 3 clinical trials evaluating drug candidates for the treatment of HCV infection.
|
G.
|
Property and Equipment
|
Property and equipment, net consisted of the following:
|
As of December 31,
|
||||||
|
2012
|
2011
|
|||||
|
(in thousands)
|
||||||
|
Furniture and equipment
|
$
|
173,766
|
|
$
|
151,961
|
|
|
Leasehold improvements
|
123,770
|
|
107,169
|
|
||
|
Software
|
101,276
|
|
56,923
|
|
||
|
Computers
|
40,779
|
|
33,116
|
|
||
|
Construction-in-process
|
290,703
|
|
55,070
|
|
||
|
Total property and equipment, gross
|
730,294
|
|
404,239
|
|
||
|
Less: accumulated depreciation
|
(296,685
|
)
|
(271,063
|
)
|
||
|
Total property and equipment, net
|
$
|
433,609
|
|
$
|
133,176
|
|
Construction-in-process as of December 31, 2012 and 2011, included
$290.7 million
and
$55.1 million
, respectively, related to construction costs for the buildings at Fan Pier in Boston, Massachusetts. Please refer to
Note H, "Fan Pier Leases,"
for further information.
Total property and equipment, gross, as of December 31, 2012 and 2011, included
$30.1 million
and
$0
, respectively, for property and equipment recorded under capital leases. Accumulated depreciation, as of December 31, 2012 and 2011, included
$1.1 million
and
$0
, respectively, of accumulated depreciation for property and equipment recorded under capital leases.
F-25
VERTEX PHARMACEUTICALS INCORPORATED
Notes to Consolidated Financial Statements (Continued)
The Company recorded depreciation expense of
$35.7 million
,
$28.9 million
and
$27.9 million
, respectively, in
2012
,
2011
and
2010
.
|
H.
|
Fan Pier Leases
|
In the second quarter of 2011, the Company entered into
two
leases, pursuant to which the Company agreed to lease approximately
1.1 million
square feet of office and laboratory space in
two
buildings (the "Buildings") that the landlord is building at Fan Pier in Boston, Massachusetts (the “Fan Pier Leases”). The Company expects to commence lease payments in December 2013 and to make payments for the period ending
15
years from the commencement date. The Company has an option to extend the term of the Fan Pier Leases for an additional
ten
years.
Because the Company is involved in the construction project, including having responsibility to pay for a portion of the costs of finish work and structural elements of the Buildings, the Company is deemed for accounting purposes to be the owner of the Buildings during the construction period. Accordingly, the Company has recorded project construction costs incurred by the landlord as an asset and a related financing obligation in “Property and equipment, net” and “Construction financing lease obligation,” respectively, on the Company’s consolidated balance sheets. The Company bifurcates its future lease payments pursuant to the Fan Pier Leases into (i) a portion that is allocated to the Buildings and (ii) a portion that is allocated to the land on which the Buildings are being constructed, which is recorded as rental expense. Although the Company will not begin making lease payments pursuant to the Fan Pier Leases until the commencement date, the portion of the lease obligations allocated to the land is treated for accounting purposes as an operating lease that commenced in the second quarter of 2011.
Once the landlord completes the construction of the Buildings, the Company will evaluate the Fan Pier Leases in order to determine whether or not the Fan Pier Leases meet the criteria for “sale-leaseback” treatment. If the Fan Pier Leases meet the “sale-leaseback” criteria, the Company will remove the asset and the related liability from its consolidated balance sheet and treat the Fan Pier Leases as either operating or capital leases based on the Company’s assessment of the accounting guidance. The Company expects that upon completion of construction of the Buildings the Fan Pier Leases will not meet the “sale-leaseback” criteria. If the Fan Pier Leases do not meet “sale-leaseback” criteria, the Company will treat the Fan Pier Leases as a financing obligation and will depreciate the asset over its estimated useful life.
|
I.
|
Intangible Assets and Goodwill
|
Intangible Assets
As of December 31, 2012 and 2011, the Company's intangible assets consisted of indefinite-lived in-process research and development assets of (i)
$250.6 million
related to its HCV nucleotide analogue program, which includes the HCV nucleotide analogue VX-135 and included the HCV nucleotide analogue ALS-2158 and (ii)
$412.9 million
related to VX-222. The Company collaborates with Alios on research and development activities related to the HCV nucleotide program and acquired VX-222 when it acquired ViroChem Pharma Inc. ("ViroChem") in March 2009. Each of these research and development assets relate to drug candidates that are being developed for the treatment of HCV infection.
The Company tests its intangible assets for impairment on an annual basis as of October 1, and more frequently if indicators are present or changes in circumstance suggest that impairment may exist. Events that could result in an impairment, or trigger an interim impairment assessment, include the receipt of additional clinical or nonclinical data regarding the Company's drug candidate or a potentially competitive drug candidate, changes in the clinical development program for a drug candidate or new information regarding potential sales for the drug.
The field of HCV infection treatment is highly competitive and characterized by rapid technological advances, and several of the Company's competitors are conducting Phase 3 clinical trials evaluating their drug candidates for the treatment of genotype 1 HCV infection, including clinical trials evaluating all-oral combinations and combinations that include pegylated-interferon and ribavirin. There can be no assurance that the Company will be able to successfully develop VX-135 or VX-222. If the fair value of VX-135 or VX-222 becomes impaired as the result of unfavorable safety or efficacy data from any ongoing or future clinical trial or because of any other information regarding the prospects of successfully developing or commercializing VX-135 or VX-222, the Company would incur significant charges in the period in which the impairment occurs.
F-26
VERTEX PHARMACEUTICALS INCORPORATED
Notes to Consolidated Financial Statements (Continued)
Alios Collaboration
In June 2011, the Company recorded
$250.6 million
of intangible assets on its consolidated balance sheet based on the Company's estimate of the fair value of Alios' HCV nucleotide analogue program, including the intellectual property related to ALS-2200 and ALS-2158. In the third quarter of 2012, after the Company discontinued the development of ALS-2158, the Company evaluated the Alios HCV nucleotide analogue program for impairment. The Company determined that there was no impairment to the program in the third quarter of 2012 because of the advancement of ALS-2200 (now formulated as VX-135). No impairment has been found with respect to the HCV nucleotide analogue program since the effective date of the Alios Agreement.
ViroChem Acquisition
As of December 31, 2010, the intangible assets acquired from ViroChem that were reflected on the Company's consolidated balance sheet related to two drug candidates, VX-222 and VX-759. VX-222 and VX-759 had estimated fair values on the acquisition date and December 31, 2010 of
$412.9 million
and
$105.8 million
, respectively. In the third quarter of 2011, the Company determined that the fair value of VX-759 had become impaired and that its fair value was
zero
. As a result, the Company recorded an impairment charge in 2011 of
$105.8 million
that was reflected as an intangible asset impairment charge on the Company's consolidated statement of operations. In connection with this impairment charge, the Company recorded a benefit from income taxes of
$32.7 million
.
The Company has tested the fair value of VX-222 on an annual basis since the acquisition date and no impairment has been identified. As of October 1, 2012, the Company estimated the fair value that would be attributed to VX-222 by a market participant based on probability weighted present-value models involving updated assumptions and estimates regarding the status of the VX-222 development program, the potential future cash flows from sales of VX-222 and an appropriate discount rate. When the Company updated its assumptions, it considered among other factors, the following: (i) the Company continues to evaluate VX-222 in Phase 2 clinical trials and believes that a treatment regimen containing VX-222 in combination with other direct-acting antivirals such as VX-135 can be developed for patients with genotype 1 HCV infection, (ii) the Company's competitors initiated several Phase 2 and Phase 3 clinical trials during the second half of 2012 that include treatment arms with non-nucleoside HCV polymerase inhibitors in combination with other direct-acting antivirals that could potentially be competitive in the market for the treatment of HCV infection and (iii) the Company believes that in the future several competitive treatment regimens will be available to treat patients with genotype 1 HCV infection. Using these updated assumptions, the Company determined that as of October 1, 2012, a market participant would assign a fair value to VX-222 exceeding the value reflected on the consolidated balance sheet. Accordingly, the Company determined that the value of VX-222 was not impaired as of October 1, 2012. There were no indicators of impairment as of December 31, 2012.
A deferred tax liability related to ViroChem of
$127.6 million
recorded as of December 31, 2012 and 2011 primarily relates to the tax effect of future amortization or impairments associated with VX-222, which are not deductible for tax purposes.
Goodwill
As of
December 31, 2012
and
2011
, goodwill of
$31.0 million
was recorded on the Company's consolidated balance sheets. There was no change to goodwill during the year ended December 31, 2012.
F-27
VERTEX PHARMACEUTICALS INCORPORATED
Notes to Consolidated Financial Statements (Continued)
|
J.
|
Accrued Expenses
|
Accrued expenses consisted of the following:
|
As of December 31,
|
||||||
|
2012
|
2011
|
|||||
|
(in thousands)
|
||||||
|
Research, development and commercial contract costs
|
$
|
63,960
|
|
$
|
66,426
|
|
|
Payroll and benefits
|
62,140
|
|
57,453
|
|
||
|
Product revenue allowances
|
69,936
|
|
58,201
|
|
||
|
Royalty payable
|
29,007
|
|
28,603
|
|
||
|
Unrecognized tax benefits
|
4,106
|
|
4,360
|
|
||
|
Interest
|
3,395
|
|
3,363
|
|
||
|
Professional fees
|
11,226
|
|
12,785
|
|
||
|
Other
|
21,114
|
|
11,996
|
|
||
|
Total
|
$
|
264,884
|
|
$
|
243,187
|
|
|
K.
|
Convertible Senior Subordinated Notes
|
Convertible Senior Subordinated Notes (due 2015)
In September 2010, the Company completed an offering of
$400.0 million
in aggregate principal amount of 2015 Notes. This offering resulted in
$391.6 million
of net proceeds to the Company. The underwriting discount of
$8.0 million
and other expenses of
$0.4 million
were recorded as debt issuance costs and are included in other assets on the Company’s consolidated balance sheets. The 2015 Notes were issued pursuant to and are governed by the terms of an indenture (as supplemented, the “Indenture”).
The 2015 Notes are convertible at any time, at the option of the holder, into common stock at a price equal to approximately
$48.83
per share, or
20.4794
shares of common stock per
$1,000
principal amount of the 2015 Notes, subject to adjustment. The 2015 Notes bear interest at the rate of
3.35%
per annum, and the Company is required to make semi-annual interest payments on the outstanding principal balance of the 2015 Notes on April 1 and October 1 of each year. The 2015 Notes mature on October 1, 2015.
Prior to October 1, 2013, if the closing price of the Company’s common stock has exceeded
130%
of the then applicable conversion price for at least
20
trading days within a period of
30
consecutive trading days, the Company may redeem the 2015 Notes at its option, in whole or in part, at a redemption price equal to
100%
of the principal amount of the 2015 Notes to be redeemed. If the Company elects to redeem the 2015 Notes prior to October 1, 2013, or the holder elects to convert the 2015 Notes into shares of the Company's common stock after receiving notice of such redemption, the Company will be obligated to make an additional payment, payable in cash or, subject to certain conditions, shares of the Company’s common stock, so that the Company’s total interest payments on the 2015 Notes being redeemed and such additional payment shall equal
three
years of interest. On or after October 1, 2013, the Company may redeem the 2015 Notes at its option, in whole or in part, at the redemption prices stated in the Indenture plus accrued and unpaid interest, if any, to, but excluding, the redemption date.
Holders may require the Company to repurchase some or all of their 2015 Notes upon the occurrence of certain fundamental changes of Vertex, as set forth in the Indenture, at
100%
of the principal amount of the 2015 Notes to be repurchased, plus any accrued and unpaid interest, if any, to, but excluding, the repurchase date.
If a fundamental change occurs that is also a specific type of change of control under the Indenture, the Company will pay a make-whole premium upon the conversion of the 2015 Notes in connection with any such transaction by increasing the applicable conversion rate on such 2015 Notes. The make-whole premium will be in addition to, and not in substitution for, any cash, securities or other assets otherwise due to holders of the 2015 Notes upon conversion. The make-whole premium will be determined by reference to the Indenture and is based on the date on which the fundamental change becomes effective
F-28
VERTEX PHARMACEUTICALS INCORPORATED
Notes to Consolidated Financial Statements (Continued)
and the price paid, or deemed to be paid, per share of the Company’s common stock in the transaction constituting the fundamental change, subject to adjustment.
Based on the Company’s evaluation of the 2015 Notes, the Company determined that the 2015 Notes contain a single embedded derivative. This embedded derivative relates to potential penalty interest payments that could be imposed on the Company for a failure to comply with its securities reporting obligations pursuant to the 2015 Notes. This embedded derivative required bifurcation because it was not clearly and closely related to the host instrument. The Company has determined that the value of this embedded derivative was nominal as of September 28, 2010, the issue date of the 2015 Notes,
December 31, 2011
, and
December 31, 2012
.
Convertible Senior Subordinated Notes (due 2013)
On January 1, 2010, the Company had outstanding $
32.1 million
in aggregate principal amount of
4.75%
convertible senior subordinated notes due 2013. In the first quarter of 2010, holders of these notes converted these notes into
1,386,006
shares of newly issued common stock.
|
L.
|
Common Stock, Preferred Stock and Equity Plans
|
The Company is authorized to issue
300,000,000
shares of common stock. Holders of common stock are entitled to
one
vote per share. Holders of common stock are entitled to receive dividends, if and when declared by the Company’s Board of Directors, and to share ratably in the Company’s assets legally available for distribution to the Company’s shareholders in the event of liquidation. Holders of common stock have no preemptive, subscription, redemption or conversion rights. The holders of common stock do not have cumulative voting rights.
The Company is authorized to issue
1,000,000
shares of preferred stock in one or more series and to fix the powers, designations, preferences and relative participating, option or other rights thereof, including dividend rights, conversion rights, voting rights, redemption terms, liquidation preferences and the number of shares constituting any series, without any further vote or action by the Company's shareholders. As of December 31, 2012 and 2011, the Company had no shares of preferred stock issued or outstanding.
Stock and Option Plans
The purpose of each of the Company’s stock and option plans is to attract, retain and motivate its employees, consultants and directors. Awards granted under these plans can be incentive stock options (“ISOs”), nonstatutory stock options (“NSOs”), restricted stock (“RSs”), restricted stock units (“RSUs”) or other equity-based awards, as specified in the individual plans.
Shares issued under all of the Company’s plans are funded through the issuance of new shares. The following table contains information about the Company’s equity plans:
|
As of December 31, 2012
|
|||||||
|
Title of Plan
|
Group Eligible
|
Type of Award
Granted |
Awards
Outstanding |
Additional Awards
Authorized for Grant |
|||
|
2006 Stock and Option Plan
|
Employees, Non-employee Directors and Consultants
|
NSO, ISO,
RS and RSU |
20,551,584
|
|
5,751,677
|
|
|
|
1996 Stock and Option Plan
|
Employees, Non-employee Directors, Advisors and Consultants
|
NSO, ISO and RS
|
1,524,010
|
|
—
|
|
|
|
Total
|
22,075,594
|
|
5,751,677
|
|
|||
All options granted under the Company’s 2006 Stock and Option Plan (“2006 Plan”) and 1996 Stock and Option Plan were granted with an exercise price equal to the fair value of the underlying common stock on the date of grant. As of
December 31, 2012
, the only stock and option plan under which the Company makes new equity awards is the Company’s 2006 Plan. Under the 2006 Plan, no stock options can be awarded with an exercise price less than the fair market value on
F-29
VERTEX PHARMACEUTICALS INCORPORATED
Notes to Consolidated Financial Statements (Continued)
the date of grant. The Company’s shareholders approved increases in the number of shares authorized for issuance pursuant to the 2006 Plan of
3,000,000
shares and
12,000,000
shares, respectively, in 2012 and 2010.
During the three years ended
December 31, 2012
, grants to current employees and directors had a grant date that was the same as the date the award was approved by the Company’s Board of Directors. During the three years ended
December 31, 2012
, for grants to new employees and directors, the date of grant for awards was the employee’s first day of employment or the date the director was elected to the Company’s Board of Directors. All options awarded under the Company’s stock and option plans expire not more than ten years from the grant date.
During the three years ended
December 31, 2012
, all shares of outstanding restricted stock and restricted stock units have been granted at price equal to
$0.01
, the par value of the Company’s common stock. Vesting of options, restricted stock and restricted stock units generally is ratable over specified periods, usually four years, and is determined by the Company’s Board of Directors.
The following table summarizes information related to the outstanding and exercisable options during the year ended
December 31, 2012
:
|
Stock Options
|
Weighted-average
Exercise Price |
Weighted-average
Remaining Contractual Life |
Aggregate Intrinsic
Value |
||||||
|
(in thousands)
|
(per share)
|
(in years)
|
(in thousands)
|
||||||
|
Outstanding at December 31, 2011
|
20,923
|
|
$
|
34.23
|
|
||||
|
Granted
|
6,043
|
|
43.80
|
|
|||||
|
Exercised
|
(5,856
|
)
|
29.51
|
|
|||||
|
Forfeited
|
(1,310
|
)
|
41.01
|
|
|||||
|
Expired
|
(74
|
)
|
39.47
|
|
|||||
|
Outstanding at December 31, 2012
|
19,726
|
|
$
|
38.09
|
|
7.15
|
$
|
107,016
|
|
|
Exercisable at December 31, 2012
|
10,849
|
|
$
|
34.54
|
|
5.93
|
$
|
84,297
|
|
|
Total exercisable or expected to vest at December 31, 2012
|
18,782
|
|
$
|
37.83
|
|
7.06
|
$
|
104,931
|
|
The aggregate intrinsic value in the table above represents the total pre-tax amount, net of exercise price, that would have been received by option holders if all option holders had exercised all options with an exercise price lower than the market price on
December 31, 2012
, which was
$41.20
based on the average of the high and low price of the Company’s common stock on that date.
The total intrinsic value (the amount by which the fair market value exceeded the exercise price) of stock options exercised during
2012
,
2011
and
2010
was
$148.7 million
,
$90.5 million
and
$10.5 million
, respectively. The total cash received by the Company as a result of employee stock option exercises during
2012
,
2011
and
2010
was
$172.8 million
,
$109.6 million
and
$22.2 million
, respectively.
The following table summarizes information about stock options outstanding and exercisable at
December 31, 2012
:
|
Options Outstanding
|
Options Exercisable
|
||||||||||
|
Range of Exercise Prices
|
Number
Outstanding |
Weighted-average
Remaining Contractual Life |
Weighted-average
Exercise Price |
Number
Exercisable |
Weighted-average
Exercise Price |
||||||
|
(in thousands)
|
(in years)
|
(per share)
|
(in thousands)
|
(per share)
|
|||||||
|
$ 9.07–$20.00
|
1,000
|
|
3.12
|
$
|
15.38
|
|
1,000
|
|
$
|
15.38
|
|
|
$20.01–$30.00
|
1,415
|
|
6.35
|
$
|
29.30
|
|
1,039
|
|
$
|
29.11
|
|
|
$30.01–$40.00
|
12,590
|
|
6.86
|
$
|
36.09
|
|
7,770
|
|
$
|
35.29
|
|
|
$40.01–$50.00
|
2,331
|
|
9.32
|
$
|
48.04
|
|
216
|
|
$
|
46.92
|
|
|
$50.01–$60.00
|
2,328
|
|
8.68
|
$
|
53.41
|
|
816
|
|
$
|
54.18
|
|
|
$60.01–$64.30
|
62
|
|
9.34
|
$
|
63.17
|
|
8
|
|
$
|
63.14
|
|
F-30
VERTEX PHARMACEUTICALS INCORPORATED
Notes to Consolidated Financial Statements (Continued)
The following table summarizes the restricted stock activity of the Company during the year ended
December 31, 2012
:
|
Restricted
Stock |
Weighted-average
Grant-date Fair Value |
||||
|
(in thousands)
|
(per share)
|
||||
|
Unvested at December 31, 2011
|
2,100
|
|
$
|
37.13
|
|
|
Granted
|
1,428
|
|
45.46
|
|
|
|
Vested
|
(998
|
)
|
35.11
|
|
|
|
Cancelled
|
(260
|
)
|
40.09
|
|
|
|
Unvested at December 31, 2012
|
2,270
|
|
$
|
42.92
|
|
The total fair value of restricted stock that vested during
2012
,
2011
and
2010
(measured on the date of vesting) was
$41.1 million
,
$34.6 million
and
$20.1 million
, respectively.
Employee Stock Purchase Plan
The Company has an employee stock purchase plan (the “ESPP”). The ESPP permits eligible employees to enroll in a twelve-month offering period comprising
two six-month
purchase periods. Participants may purchase shares of the Company’s common stock, through payroll deductions, at a price equal to
85%
of the fair market value of the common stock on the first day of the applicable
twelve-month offering
period, or the last day of the applicable six-month purchase period, whichever is lower. Purchase dates under the ESPP occur on or about May 14 and November 14 of each year. In 2012, the Company's shareholders approved an increase in the number of shares of common stock authorized for issuance pursuant to the ESPP of
2,500,000
. As of
December 31, 2012
, there were
2,280,000
shares of common stock authorized for issuance pursuant to the ESPP.
In
2012
, the following shares were issued to employees under the ESPP:
|
Year Ended December 31, 2012
|
|||
|
(in thousands,
except per share amount) |
|||
|
Number of shares
|
702
|
|
|
|
Average price paid per share
|
|
$26.71
|
|
|
M.
|
Stock-based Compensation Expense
|
The Company recognizes share-based payments to employees as compensation expense using the fair value method. The fair value of stock options and shares purchased pursuant to the ESPP is calculated using the Black-Scholes option pricing model. The fair value of restricted stock and restricted stock units typically is based on the intrinsic value on the date of grant. Stock-based compensation, measured at the grant date based on the fair value of the award, is typically recognized as expense ratably over the service period. The expense recognized over the service period includes an estimate of awards that will be forfeited.
The effect of stock-based compensation expense during the three years ended
December 31, 2012
was as follows:
|
2012
|
2011
|
2010
|
|||||||
|
(in thousands)
|
|||||||||
|
Stock-based compensation expense by line item:
|
|||||||||
|
Research and development expenses
|
$
|
71,533
|
|
$
|
75,574
|
|
$
|
65,198
|
|
|
Sales, general and administrative expenses
|
42,752
|
|
42,652
|
|
25,926
|
|
|||
|
Total stock-based compensation expense included in costs and expenses
|
$
|
114,285
|
|
$
|
118,226
|
|
$
|
91,124
|
|
During
2012
and
2011
, the Company capitalized
$1.3 million
and $
1.0 million
, respectively, of stock-based compensation expense to inventories, all of which was attributable to employees who supported the Company’s manufacturing operations for the Company's products.
F-31
VERTEX PHARMACEUTICALS INCORPORATED
Notes to Consolidated Financial Statements (Continued)
The stock-based compensation expense by type of award during the three years ended
December 31, 2012
was as follows:
|
2012
|
2011
|
2010
|
|||||||
|
(in thousands)
|
|||||||||
|
Stock-based compensation expense by type of award:
|
|||||||||
|
Stock options
|
$
|
79,047
|
|
$
|
83,098
|
|
$
|
64,005
|
|
|
Restricted stock and restricted stock units
|
29,194
|
|
30,708
|
|
22,960
|
|
|||
|
ESPP share issuances
|
7,298
|
|
5,462
|
|
4,159
|
|
|||
|
Less stock-based compensation expense capitalized to inventories
|
(1,254
|
)
|
(1,042
|
)
|
—
|
|
|||
|
Total stock-based compensation expense included in costs and expenses
|
$
|
114,285
|
|
$
|
118,226
|
|
$
|
91,124
|
|
The following table sets forth the Company’s unrecognized stock-based compensation expense, net of estimated forfeitures, as of
December 31, 2012
by type of award and the weighted-average period over which that expense is expected to be recognized:
|
As of December 31, 2012
|
|||
|
Unrecognized Expense
Net of Estimated Forfeitures |
Weighted-average
Recognition Period |
||
|
(in thousands)
|
(in years)
|
||
|
Type of award:
|
|||
|
Stock options
|
$156,225
|
2.69
|
|
|
Restricted stock and restricted stock units
|
68,094
|
|
2.58
|
|
ESPP share issuances
|
5,661
|
|
0.65
|
Stock Options
The Company issues stock options with service conditions, which are generally the vesting periods of the awards. In 2009, the Company also issued, to certain members of senior management, stock options with performance conditions that vested upon the satisfaction of the performance conditions by the end of the first quarter of 2012. The Company uses the Black-Scholes option pricing model to estimate the fair value of stock options at the grant date. The Black-Scholes option pricing model uses the option exercise price as well as estimates and assumptions related to the expected price volatility of the Company’s stock, the rate of return on risk-free investments, the expected period during which the options will be outstanding, and the expected dividend yield for the Company’s stock to estimate the fair value of a stock option on the grant date. The options granted during
2012
,
2011
and
2010
had a weighted-average grant-date fair value per share of
$19.72
,
$20.88
and
$18.52
, respectively.
The fair value of each option granted during
2012
,
2011
and
2010
was estimated on the date of grant using the Black-Scholes option pricing model with the following weighted-average assumptions:
|
2012
|
2011
|
2010
|
||||
|
Expected stock price volatility
|
47.93
|
%
|
49.53
|
%
|
52.17
|
%
|
|
Risk-free interest rate
|
0.95
|
%
|
2.09
|
%
|
2.44
|
%
|
|
Expected term of options (in years)
|
5.78
|
|
5.74
|
|
5.71
|
|
|
Expected annual dividends
|
—
|
|
—
|
|
—
|
|
The weighted-average valuation assumptions were determined as follows:
|
•
|
Expected stock price volatility:
Options to purchase the Company’s stock with remaining terms of greater than one year are regularly traded in the market. Expected stock price volatility is calculated using the trailing one month average of daily implied volatilities prior to grant date.
|
F-32
VERTEX PHARMACEUTICALS INCORPORATED
Notes to Consolidated Financial Statements (Continued)
|
•
|
Risk-free interest rate:
The Company bases the risk-free interest rate on the interest rate payable on U.S. Treasury securities in effect at the time of grant for a period that is commensurate with the assumed expected option term.
|
|
•
|
Expected term of options:
The expected term of options represents the period of time options are expected to be outstanding. The Company uses historical data to estimate employee exercise and post-vest termination behavior. The Company believes that all groups of employees exhibit similar exercise and post-vest termination behavior and therefore does not stratify employees into multiple groups in determining the expected term of options.
|
|
•
|
Expected annual dividends:
The estimate for annual dividends is
$0.00
because the Company has not historically paid, and does not intend for the foreseeable future to pay, a dividend.
|
Restricted Stock and Restricted Stock Units
The Company issues restricted stock and restricted stock units with service conditions, which are generally the vesting periods of the awards. The Company also issues, to certain members of senior management, restricted stock and restricted stock units that vest upon the earlier of the satisfaction of (i) a performance condition or (ii) a service condition.
Employee Stock Purchase Plan
The weighted-average fair value of each purchase right granted during
2012
,
2011
and
2010
was
$12.90
,
$9.80
and
$10.19
, respectively. The following table reflects the weighted-average assumptions used in the Black-Scholes option pricing model for
2012
,
2011
and
2010
:
|
2012
|
2011
|
2010
|
||||
|
Expected stock price volatility
|
46.90
|
%
|
51.32
|
%
|
43.92
|
%
|
|
Risk-free interest rate
|
0.16
|
%
|
0.08
|
%
|
0.24
|
%
|
|
Expected term (in years)
|
0.74
|
|
0.72
|
|
0.71
|
|
|
Expected annual dividends
|
—
|
|
—
|
|
—
|
|
The expected stock price volatility for ESPP offerings is based on implied volatility. The Company bases the risk-free interest rate on the interest rate payable on U.S. Treasury securities in effect at the time of grant for a period that is commensurate with the assumed expected term. The expected term represents purchases and purchase periods that take place within the offering period. The expected annual dividends estimate is
$0.00
because the Company has not historically paid, and does not for the foreseeable future intend to pay, a dividend.
|
N.
|
September 2009 Financial Transactions
|
2012 Notes
In September 2009, the Company sold
$155.0 million
in aggregate of secured notes due 2012 (the “2012 Notes”) for an aggregate of
$122.2 million
pursuant to a note purchase agreement with Olmsted Park S.A. (the “Purchaser”). The 2012 Notes were issued at a discount and did not pay current interest prior to maturity. The 2012 Notes were scheduled to mature on October 31, 2012, subject to earlier mandatory redemption to the extent that specified milestone events set forth in the Company’s collaboration with Janssen occurred prior to October 31, 2012. In February 2011, the Company received a milestone payment of
$50.0 million
and subsequently redeemed
$50.0 million
of 2012 Notes pursuant to their terms. The remaining
$105.0 million
of 2012 Notes were redeemed on October 31, 2011, with the proceeds of milestone payments received from Janssen in October 2011. The 2012 Notes contained an embedded derivative related to the potential mandatory redemption or early repayment of the 2012 Notes at the face amount prior to their maturity date. The fair value of this embedded derivative was evaluated quarterly, with changes in the fair value of the embedded derivative resulting in a corresponding gain or loss. The Company recorded quarterly interest expense related to the 2012 Notes using the effective interest rate method.
F-33
VERTEX PHARMACEUTICALS INCORPORATED
Notes to Consolidated Financial Statements (Continued)
Sale of Contingent Milestone Payments
In September 2009, the Company entered into
two
purchase agreements with the Purchaser pursuant to which the Company sold its rights to an aggregate of
$95.0 million
in contingent milestone payments under the Janssen agreement related to the launch of telaprevir in the European Union, for nonrefundable payments totaling
$32.8 million
. The Purchaser received the
$95.0 million
in milestone payments from Janssen in the fourth quarter of 2011. The Company determined that this sale of a future revenue stream should be accounted for as a liability. The fair value of the rights sold to the Purchaser pursuant to the purchase agreements was evaluated each reporting period until the payments were received in the fourth quarter of 2011, with changes in the fair value of the derivative instruments based on the probability of achieving the milestones, the timing of achieving the milestones or discount rates resulting in a corresponding gain or loss.
Expenses Related to September 2009 Financial Transactions
The table below sets forth the total expenses related to the September 2009 financial transactions for
2012
,
2011
and
2010
:
|
2012
|
2011
|
2010
|
|||||||
|
(in thousands)
|
|||||||||
|
Expenses and Losses (Gains):
|
|||||||||
|
Interest expense related to 2012 Notes
|
$
|
—
|
|
$
|
21,687
|
|
$
|
15,068
|
|
|
Change in fair value of embedded derivative related to 2012 Notes
|
—
|
|
(400
|
)
|
1,637
|
|
|||
|
Change in fair value of free-standing derivatives related to the sale of milestone payments
|
—
|
|
17,201
|
|
39,592
|
|
|||
|
Total September 2009 financial transaction expenses
|
$
|
—
|
|
$
|
38,488
|
|
$
|
56,297
|
|
|
O.
|
Sale of HIV Protease Inhibitor Royalty Stream
|
In 2008, the Company sold to a third party its rights to receive royalty payments from GlaxoSmithKline plc, net of royalty amounts to be earned by and due to a third party, for a one-time cash payment of
$160.0 million
. These royalty payments relate to net sales of HIV protease inhibitors, which had been developed pursuant to a collaboration agreement between the Company and GlaxoSmithKline plc. As of
December 31, 2012
, the Company had
$80.3 million
in deferred revenues related to the one-time cash payment, which it is recognizing over the life of the collaboration agreement with GlaxoSmithKline plc based on the units-of-revenue method. In addition, the Company continues to recognize royalty revenues equal to the amount of the third-party subroyalty and an offsetting royalty expense for the third-party subroyalty payment.
|
P.
|
Income Taxes
|
The components of income (loss) before provision for (benefit from) income taxes during the three years ended
December 31, 2012
consisted of the following:
|
2012
|
2011
|
2010
|
|||||||
|
(in thousands)
|
|||||||||
|
United States
|
$
|
256,816
|
|
$
|
343,515
|
|
$
|
(719,859
|
)
|
|
Foreign
|
(269,197
|
)
|
(283,070
|
)
|
(34,767
|
)
|
|||
|
Income (loss) before provision for (benefit from) income taxes
|
$
|
(12,381
|
)
|
$
|
60,445
|
|
$
|
(754,626
|
)
|
F-34
VERTEX PHARMACEUTICALS INCORPORATED
Notes to Consolidated Financial Statements (Continued)
The components of provision for (benefit from) income taxes during the three years ended
December 31, 2012
consisted of the following:
|
2012
|
2011
|
2010
|
|||||||
|
(in thousands)
|
|||||||||
|
Current taxes:
|
|||||||||
|
United States
|
$
|
2,057
|
|
$
|
22,275
|
|
$
|
—
|
|
|
Foreign
|
(1,865
|
)
|
(561
|
)
|
—
|
|
|||
|
State
|
1,902
|
|
8,655
|
|
—
|
|
|||
|
Total current taxes
|
$
|
2,094
|
|
$
|
30,369
|
|
$
|
—
|
|
|
Deferred taxes:
|
|||||||||
|
United States
|
$
|
31,308
|
|
$
|
19,629
|
|
$
|
—
|
|
|
Foreign
|
—
|
|
(32,692
|
)
|
—
|
|
|||
|
State
|
5,352
|
|
1,960
|
|
—
|
|
|||
|
Total deferred taxes
|
$
|
36,660
|
|
$
|
(11,103
|
)
|
$
|
—
|
|
|
Provision for (benefit from) income taxes
|
$
|
38,754
|
|
$
|
19,266
|
|
$
|
—
|
|
The Company’s federal statutory income tax rates for
2012
,
2011
and
2010
were
35%
,
35%
and
34%
, respectively. The Company had income from operations in
2012
and
2011
and incurred losses from operations in
2010
. The Company recorded a valuation allowance against its net operating losses and other net deferred tax assets due to uncertainties related to the realizability of these tax assets.
The difference between the Company’s “expected” tax provision (benefit), as computed by applying the U.S. federal corporate tax rate to income (loss) before provision for (benefit from) income taxes, and actual tax is reconciled as follows:
|
2012
|
2011
|
2010
|
|||||||
|
(in thousands)
|
|||||||||
|
Income (loss) before provision for (benefit from) income taxes
|
$
|
(12,381
|
)
|
$
|
60,445
|
|
$
|
(754,626
|
)
|
|
Expected tax provision (benefit)
|
(4,333
|
)
|
21,156
|
|
(256,574
|
)
|
|||
|
State taxes, net of federal benefit
|
7,075
|
|
10,624
|
|
(46,108
|
)
|
|||
|
Foreign rate differential
|
62,425
|
|
43,629
|
|
632
|
|
|||
|
Tax credits
|
(1,980
|
)
|
(51,086
|
)
|
(23,292
|
)
|
|||
|
Unbenefited operating losses
|
(30,364
|
)
|
(6,286
|
)
|
322,551
|
|
|||
|
Non-deductible expenses
|
3,198
|
|
1,953
|
|
2,158
|
|
|||
|
Rate change
|
3,275
|
|
—
|
|
—
|
|
|||
|
Other
|
(542
|
)
|
(724
|
)
|
633
|
|
|||
|
Provision for (benefit from) income taxes
|
$
|
38,754
|
|
$
|
19,266
|
|
$
|
—
|
|
For federal income tax purposes, as of
December 31, 2012
, the Company has net operating loss carryforwards of approximately
$2.6 billion
and tax credits of
$98.0 million
, which may be used to offset future federal income and tax liability, respectively. For state income tax purposes, the Company has net operating loss carryforwards of approximately
$1.5 billion
and tax credits of
$60.3 million
, which may be used to offset future state income and tax liability, respectively. These operating loss carryforwards began to expire in 2006, and the tax credit carryforwards began to expire in 2005. After consideration of all the evidence, both positive and negative, the Company continues to maintain a valuation allowance for the full amount of the
2012
deferred tax asset because it is more likely than not that the deferred tax asset will not be realized. In future periods, if management determines that it is more likely than not that the deferred tax asset will be realized, (i) the valuation allowance would be decreased, (ii) a portion or all of the deferred tax asset would be reflected on the Company’s consolidated balance sheet and (iii) the Company would record non-cash benefits in its consolidated statements of operations related to the reflection of the deferred tax asset on its consolidated balance sheet.
F-35
VERTEX PHARMACEUTICALS INCORPORATED
Notes to Consolidated Financial Statements (Continued)
Unrecognized tax benefits during the two years ended
December 31, 2012
consisted of the following:
|
2012
|
2011
|
|||||
|
(in thousands)
|
||||||
|
Unrecognized tax benefits beginning of year
|
$
|
4,360
|
|
$
|
2,374
|
|
|
Gross change for current year positions
|
598
|
|
2,569
|
|
||
|
Increase for prior period positions
|
—
|
|
—
|
|
||
|
Decrease for prior period positions
|
—
|
|
—
|
|
||
|
Decrease due to settlements and payments
|
—
|
|
—
|
|
||
|
Decrease due to statute limitations
|
(852
|
)
|
(583
|
)
|
||
|
Unrecognized tax benefits end of year
|
$
|
4,106
|
|
$
|
4,360
|
|
The Company had gross unrecognized tax benefits of
$4.1 million
and
$4.4 million
, respectively, as of
December 31, 2012
and
2011
. At
December 31, 2012
,
$4.1 million
represented the amount of unrecognized tax benefits that, if recognized, would result in a reduction of the Company’s effective tax rate. In 2013, it is reasonably possible that the Company will reduce the balance of its unrecognized tax benefits by
$0.3 million
due to the application of statute of limitations and settlements with taxing authorities, all of which would reduce the Company’s effective tax rate.
Deferred tax assets and liabilities are determined based on the difference between financial statement and tax bases using enacted tax rates in effect for the year in which the differences are expected to reverse. The components of the deferred taxes were as follows:
|
As of December 31,
|
||||||
|
2012
|
2011
|
|||||
|
(in thousands)
|
||||||
|
Deferred tax assets:
|
||||||
|
Net operating loss
|
$
|
777,687
|
|
$
|
870,367
|
|
|
Tax credit carryforwards
|
147,074
|
|
167,759
|
|
||
|
Property and equipment
|
10,701
|
|
15,537
|
|
||
|
Intangibles
|
63,353
|
|
71,076
|
|
||
|
Deferred revenues
|
44,867
|
|
59,939
|
|
||
|
Stock-based compensation
|
83,979
|
|
90,563
|
|
||
|
Inventories
|
56,564
|
|
23,883
|
|
||
|
Accrued expenses
|
27,945
|
|
30,636
|
|
||
|
Unrealized loss
|
—
|
|
245
|
|
||
|
Gross deferred tax assets
|
1,212,170
|
|
1,330,005
|
|
||
|
Valuation allowance
|
(1,211,561
|
)
|
(1,329,775
|
)
|
||
|
Total deferred tax assets
|
609
|
|
230
|
|
||
|
Deferred tax liabilities:
|
||||||
|
Unrealized gain
|
(376
|
)
|
—
|
|
||
|
Contingent milestone and royalty payment obligation
|
(50,904
|
)
|
(14,241
|
)
|
||
|
Acquired intangibles
|
(229,696
|
)
|
(229,696
|
)
|
||
|
Net deferred tax liabilities
|
$
|
(280,367
|
)
|
$
|
(243,707
|
)
|
Generally, tax return deductions are allowable on stock-based compensation plans but may arise in different amounts and periods from when stock-based compensation expense is recognized in the financial statements. If the tax return deduction for an award exceeds the cumulative stock-based compensation expense recognized in the financial statements, any excess tax benefit is recognized as additional paid-in capital when the deduction reduces income tax payable. The net tax amount of the unrealized excess tax benefits as of
December 31, 2012
was approximately
$115 million
. As of
December 31, 2012
, the gross amount of this excess tax deduction in the net operating loss carryforward was approximately
$525 million
.
The valuation allowance decreased by
$118.2 million
from
December 31, 2011
to
December 31, 2012
because the Company utilized net operating losses in
2012
to offset taxable income.
F-36
VERTEX PHARMACEUTICALS INCORPORATED
Notes to Consolidated Financial Statements (Continued)
The Company files United States federal income tax returns and income tax returns in various state, local and foreign jurisdictions. The Company is no longer subject to any tax assessment from an income tax examination in the United States before 2007 and any other major taxing jurisdiction for years before 2005, except where the Company has net operating losses or tax credit carryforwards that originate before 2005. The Company is currently under examination by Revenue Quebec for the year ended March 11, 2009 and the year ended December 31, 2007. No adjustments have been reported. The Company is not under examination by any other jurisdictions for any tax year.
The Company currently intends to reinvest the total amount of its unremitted earnings, which have not been significant to date, in the local international jurisdiction or to repatriate the earnings only when tax-effective. As a result, the Company has not provided for U.S. federal income taxes on the unremitted earnings of its international subsidiaries. Upon repatriation of those earnings, in the form of dividends or otherwise, the Company would be subject to U.S. federal income taxes (subject to an adjustment for foreign tax credits) and withholding taxes payable to the various foreign countries. Determination of the amount of the unrecognized deferred U.S. federal income tax liability is not practical due to the complexity associated with this hypothetical calculation; however, unrecognized foreign tax credits would be available to reduce some portion of the U.S. federal income tax liability.
|
Q.
|
Restructuring Expense
|
In June 2003, Vertex adopted a plan to restructure its operations to coincide with its increasing internal emphasis on advancing drug candidates through clinical development to commercialization. The restructuring was designed to re-balance the Company’s relative investments in research and development to better support the Company’s long-term strategy. At that time, the restructuring plan included a workforce reduction, write-offs of certain assets and a decision not to occupy approximately
290,000
square feet of specialized laboratory and office space in Cambridge, Massachusetts under lease to Vertex (the “Kendall Square Lease”). The Kendall Square Lease commenced in January 2003 and has a
15
-year term. In the second quarter of 2005, the Company revised its assessment of its real estate requirements and decided to use approximately
120,000
square feet of the facility subject to the Kendall Square Lease (the “Kendall Square Facility”) for its operations, beginning in 2006. The remaining rentable square footage of the Kendall Square Facility currently is subleased to third parties.
The Company’s initial estimate of its liability for net ongoing costs associated with the Kendall Square Lease obligation was recorded in the second quarter of 2003 at fair value. The restructuring expense incurred from the second quarter of 2003 through the end of the first quarter of 2005 (i.e., immediately prior to the Company’s decision to use a portion of the Kendall Square Facility for its operations) relates to the estimated incremental net ongoing lease obligations associated with the entire Kendall Square Facility, together with imputed interest costs relating to the restructuring liability. The restructuring expense incurred in the period beginning in the second quarter of 2005 relates only to the portion of the Kendall Square Facility that the Company is not occupying and does not intend to occupy for its operations. The remaining lease obligations, which are associated with the portion of the Kendall Square Facility that the Company occupies and uses for its operations, are recorded as rental expense in the period incurred. The Company reviews its assumptions and estimates quarterly and updates its estimates of this liability as changes in circumstances require. The expense and liability recorded is calculated using probability-weighted discounted cash-flows of the Company’s estimated ongoing lease obligations, including contractual rental and build-out commitments, net of estimated sublease rentals, offset by related sublease costs.
In estimating the expense and liability under its Kendall Square Lease obligation, the Company estimated (i) the costs to be incurred to satisfy rental and build-out commitments under the lease (including operating costs), (ii) the lead-time necessary to sublease the space, (iii) the projected sublease rental rates, and (iv) the anticipated durations of subleases. The Company uses a credit-adjusted risk-free rate of approximately
10%
to discount the estimated cash flows. The Company reviews its estimates and assumptions on at least a quarterly basis, intends to continue such reviews until the termination of the Kendall Square Lease, and will make whatever modifications the Company believes necessary, based on the Company’s best judgment, to reflect any changed circumstances. The Company’s estimates have changed in the past, and may change in the future, resulting in additional adjustments to the estimate of the liability. Changes to the Company’s estimate of the liability are recorded as additional restructuring expense/(credit). In addition, because the Company’s estimate of the liability includes the application of a discount rate to reflect the time-value of money, the Company records imputed interest costs
F-37
VERTEX PHARMACEUTICALS INCORPORATED
Notes to Consolidated Financial Statements (Continued)
related to the liability each quarter. These costs are included in restructuring expense (credit) on the Company’s consolidated statements of operations.
The activity related to restructuring and other liability for 2003 was as follows:
|
Charge
in 2003 |
Cash
payments in 2003 |
Non-cash
write-off in 2003 |
Liability as of
December 31, 2003 |
|||||||||
|
(in thousands)
|
||||||||||||
|
Lease restructuring and other operating lease expense
|
$
|
84,726
|
|
$
|
(15,200
|
)
|
$
|
—
|
|
$
|
69,526
|
|
|
Employee severance, benefits and related costs
|
2,616
|
|
(2,616
|
)
|
—
|
|
—
|
|
||||
|
Leasehold improvements and asset impairments
|
4,482
|
|
—
|
|
(4,482
|
)
|
—
|
|
||||
|
Total
|
$
|
91,824
|
|
$
|
(17,816
|
)
|
$
|
(4,482
|
)
|
$
|
69,526
|
|
In 2003, the lease restructuring and other operating lease expense included
$78.7 million
of lease restructuring expense and
$6.0 million
of lease operating expense incurred prior to the decision not to occupy the Kendall Square Facility. The restructuring accrual as of December 31, 2003 related only to the lease restructuring expense.
The activity related to restructuring for 2004 through
2012
was as follows:
|
2012
|
2011
|
2010
|
2004-2012
|
|||||||||
|
(in thousands)
|
||||||||||||
|
Liability, beginning of the period
|
$
|
26,313
|
|
$
|
29,595
|
|
$
|
34,017
|
|
$
|
69,526
|
|
|
Cash payments
|
(14,853
|
)
|
(14,904
|
)
|
(14,759
|
)
|
(163,697
|
)
|
||||
|
Cash received from subleases
|
10,024
|
|
9,548
|
|
8,836
|
|
65,038
|
|
||||
|
Credit for portion of facility Vertex decided to occupy in 2005
|
—
|
|
—
|
|
—
|
|
(10,018
|
)
|
||||
|
Restructuring expense
|
1,844
|
|
2,074
|
|
1,501
|
|
62,479
|
|
||||
|
Liability, end of the period
|
$
|
23,328
|
|
$
|
26,313
|
|
$
|
29,595
|
|
$
|
23,328
|
|
In each period, the Company records lease restructuring expense attributable to imputed interest related to the restructuring liability. In certain periods, the restructuring expense also reflects the revision of certain key estimates and assumptions about building operating expenses and sublease income.
|
R.
|
Employee Benefits
|
The Company has a 401(k) retirement plan (the “Vertex 401(k) Plan”) in which substantially all of its permanent U.S. employees are eligible to participate. Participants may contribute up to
60%
of their annual compensation to the Vertex 401(k) Plan, subject to statutory limitations. The Company may declare discretionary matching contributions to the Vertex 401(k) Plan that are payable in Vertex common stock. The match is paid in the form of fully vested interests in a Vertex common stock fund. Employees have the ability to transfer funds from the stock fund invested in Vertex common stock, subject to certain restrictions. As of
December 31, 2012
,
854,000
shares of common stock remained available for grant under the Vertex 401(k) Plan. The Company declared matching contributions to the Vertex 401(k) Plan as follows:
|
2012
|
2011
|
2010
|
|||||||
|
(in thousands)
|
|||||||||
|
Discretionary matching contributions during the year ended December 31,
|
$
|
10,261
|
|
$
|
8,619
|
|
$
|
6,552
|
|
|
Shares issued during the year ended December 31,
|
242
|
|
183
|
|
174
|
|
|||
|
Shares issuable as of the year ended December 31,
|
53
|
|
62
|
|
42
|
|
|||
|
S.
|
Commitments
|
The Company leases its facilities and certain equipment and software. The Company’s facility leases have terms through 2028. The leases of the Company’s current primary facilities in Cambridge were extended in 2009 through December 2015. In 2011, the Company entered into leases for buildings being constructed at Fan Pier in Boston, Massachusetts, which will become the Company's new corporate headquarters. The Company expects to commence lease payments in December 2013
F-38
VERTEX PHARMACEUTICALS INCORPORATED
Notes to Consolidated Financial Statements (Continued)
and to make payments for the period ending
15
years from the commencement date. The Company has an option to extend the term of the Fan Pier Leases for an additional
ten
years. Please refer to
Note H, "Fan Pier Leases,"
for additional information regarding this commitment.
The term of the Kendall Square Lease began on January 1, 2003. The Company occupies and uses for its operations approximately
120,000
square feet of the Kendall Square Facility. The Company has sublease arrangements in place for the remaining rentable square footage of the Kendall Square Facility, with terms that expire in April 2015 and August 2015. Rent payments pursuant to the Kendall Square Lease will be subject to increase in May 2013, based on changes in an inflation index. These increases are treated as contingent rentals. The Kendall Square Lease will expire in 2018, and the Company has the option to extend the term for
two
consecutive terms of
10
years each. Please refer to
Note Q, "Restructuring Expense,"
for further information.
As of
December 31, 2012
, future minimum commitments under the Fan Pier Leases, facility operating leases with terms of more than one year and expected sublease income under the Company’s subleases for the Kendall Square Facility were as follows:
|
Year
|
Fan Pier
Leases |
Kendall Square
Lease |
Kendall Sublease
Income |
Other
Operating Leases |
Total Lease
Commitments (Net of Sublease Income) |
||||||||||
|
(in thousands)
|
|||||||||||||||
|
2013
|
$
|
83,304
|
|
$
|
18,338
|
|
$
|
(8,495
|
)
|
$
|
43,165
|
|
$
|
136,312
|
|
|
2014
|
67,206
|
|
18,338
|
|
(8,495
|
)
|
35,375
|
|
112,424
|
|
|||||
|
2015
|
67,206
|
|
18,338
|
|
(3,976
|
)
|
27,909
|
|
109,477
|
|
|||||
|
2016
|
67,206
|
|
18,338
|
|
—
|
|
9,916
|
|
95,460
|
|
|||||
|
2017
|
67,206
|
|
18,338
|
|
—
|
|
8,904
|
|
94,448
|
|
|||||
|
Thereafter
|
814,404
|
|
6,113
|
|
—
|
|
30,610
|
|
851,127
|
|
|||||
|
Total minimum lease payments
|
$
|
1,166,532
|
|
$
|
97,803
|
|
$
|
(20,966
|
)
|
$
|
155,879
|
|
$
|
1,399,248
|
|
During 2012, 2011 and 2010, rental expense was
$57.1 million
,
$49.4 million
and
$46.6 million
, respectively, of which
$11.6 million
,
$11.2 million
and
$11.6 million
, respectively, related to the Kendall Square Facility and
$6.6 million
,
$3.9 million
and
$0
, respectively, related to the Fan Pier land lease. Please refer to
Note H, "Fan Pier Leases,"
for further information.
In 2012, the Company entered into various agreements for the lease of equipment and software licenses, expiring in 2015. The leases were accounted for as capital leases. The capital leases bear interest at rates of approximately
4%
per year. The following table sets forth the Company’s future minimum payments due under capital leases as of December 31, 2012:
|
Year
|
(in thousands)
|
||
|
2013
|
$
|
14,502
|
|
|
2014
|
9,005
|
|
|
|
2015
|
6,537
|
|
|
|
Total payments
|
30,044
|
|
|
|
Less: amount representing interest
|
(1,167
|
)
|
|
|
Present value of payments
|
$
|
28,877
|
|
In addition, the Company has committed to make potential future milestone and royalty payments pursuant to the Alios Agreement. Payments generally become due and payable upon the achievement of certain developmental, regulatory and/or commercial milestones. Please refer to
Note B, "Collaborative Arrangements,"
for further information.
In September 2010, the Company issued
$400.0 million
in aggregate principal of 2015 Notes. Please refer to
Note K, "Convertible Senior Subordinated Notes,"
for further information.
F-39
VERTEX PHARMACEUTICALS INCORPORATED
Notes to Consolidated Financial Statements (Continued)
|
T.
|
Legal Proceedings
|
On September 6, 2012, a purported shareholder class action,
City of Bristol Pension Fund v. Vertex Pharmaceuticals Incorporated, et al.
, was filed in the United States District Court for the District of Massachusetts, naming the Company and certain of the Company's current and former officers and directors of the Company as defendants. The lawsuit alleges that the Company made material misrepresentations and/or omissions of material fact in the Company's disclosures during the period from May 7, 2012 through June 28, 2012, all in violation of Section 10(b) of the Securities Exchange Act of 1934, as amended, and Rule 10b-5 promulgated thereunder. By order dated December 12, 2012, the court appointed the City of Bristol lead plaintiff and appointed the City of Bristol's attorneys lead counsel. The plaintiffs filed an amended complaint on February 11, 2013. The plaintiffs seek unspecified monetary damages on behalf of the putative class and an award of costs and expenses, including attorney's fees, as well as disgorgement of the proceeds from certain individual defendants' sales of our common stock. The Company believes that this action is without merit and intends to defend it vigorously. As of December 31, 2012, the Company has not recorded any reserves for this purported class action.
|
U.
|
Contingencies
|
The Company has certain contingent liabilities that arise in the ordinary course of its business activities. The Company accrues a reserve for contingent liabilities when it is probable that future expenditures will be made and such expenditures can be reasonably estimated. There were no material contingent liabilities accrued as of
December 31, 2012
or
2011
.
|
V.
|
Guarantees
|
As permitted under Massachusetts law, the Company’s Articles of Organization and By-laws provide that the Company will indemnify certain of its officers and directors for certain claims asserted against them in connection with their service as an officer or director. The maximum potential amount of future payments that the Company could be required to make under these indemnification provisions is unlimited. However, the Company has purchased directors’ and officers’ liability insurance policies that could reduce its monetary exposure and enable it to recover a portion of any future amounts paid. No indemnification claims currently are outstanding, and the Company believes the estimated fair value of these indemnification arrangements is minimal.
The Company customarily agrees in the ordinary course of its business to indemnification provisions in agreements with clinical trial investigators and sites in its drug development programs, sponsored research agreements with academic and not-for-profit institutions, various comparable agreements involving parties performing services for the Company, and its real estate leases. The Company also customarily agrees to certain indemnification provisions in its drug discovery, development and commercialization collaboration agreements. With respect to the Company’s clinical trials and sponsored research agreements, these indemnification provisions typically apply to any claim asserted against the investigator or the investigator’s institution relating to personal injury or property damage, violations of law or certain breaches of the Company’s contractual obligations arising out of the research or clinical testing of the Company’s compounds or drug candidates. With respect to lease agreements, the indemnification provisions typically apply to claims asserted against the landlord relating to personal injury or property damage caused by the Company, to violations of law by the Company or to certain breaches of the Company’s contractual obligations. The indemnification provisions appearing in the Company’s collaboration agreements are similar to those for the other agreements discussed above, but in addition provide some limited indemnification for its collaborator in the event of third-party claims alleging infringement of intellectual property rights. In each of the cases above, the indemnification obligation generally survives the termination of the agreement for some extended period, although the Company believes the obligation typically has the most relevance during the contract term and for a short period of time thereafter. The maximum potential amount of future payments that the Company could be required to make under these provisions is generally unlimited. The Company has purchased insurance policies covering personal injury, property damage and general liability that reduce its exposure for indemnification and would enable it in many cases to recover all or a portion of any future amounts paid. The Company has never paid any material amounts to defend lawsuits or settle claims related to these indemnification provisions. Accordingly, the Company believes the estimated fair value of these indemnification arrangements is minimal.
The Company entered into an underwriting agreement with Merrill Lynch, Pierce, Fenner & Smith Incorporated dated September 23, 2010 (the “Underwriting Agreement”), relating to the public offering and sale of the 2015 Notes. The
F-40
VERTEX PHARMACEUTICALS INCORPORATED
Notes to Consolidated Financial Statements (Continued)
Underwriting Agreement requires the Company to indemnify the underwriter against any loss it may suffer by reason of the Company’s breach of any representation or warranty relating to the public offering, the Company’s failure to perform certain covenants in the Underwriting Agreement, the inclusion of any untrue statement of material fact in the prospectus used in connection with the offering, the omission of any material fact needed to make those materials not misleading, and any actions taken by the Company or its representatives in connection with the offering. The representations, warranties, covenants and indemnification provisions in the Underwriting Agreement are of a type customary in agreements of this sort. The Company believes the estimated fair value of this indemnification arrangement is minimal.
|
W.
|
Segment Information
|
The Company operates in one segment, pharmaceuticals. Enterprise-wide disclosures about revenues, significant customers, and property and equipment, net by location are presented below.
Revenues by Product
Product revenues, net consisted of the following:
|
2012
|
2011
|
2010
|
|||||||||
|
(in thousands)
|
|||||||||||
|
INCIVEK
|
$
|
1,161,813
|
|
$
|
950,889
|
|
$
|
—
|
|
||
|
KALYDECO
|
171,645
|
|
—
|
|
—
|
|
|||||
|
Total product revenues, net
|
$
|
1,333,458
|
|
$
|
950,889
|
|
$
|
—
|
|
||
Revenues by Geographic Location
The following table summarizes total revenues from external customers and collaborators by geographic region. Product revenues are attributed to countries based on the location of the customer. Collaborative revenues are attributed to the operations of the Company in the United States. Royalty revenues are attributed to countries based on the location of the collaborator.
|
2012
|
2011
|
2010
|
|||||||||
|
(in thousands)
|
|||||||||||
|
United States
|
$
|
1,373,516
|
|
$
|
1,389,568
|
|
$
|
143,370
|
|
||
|
Outside of the United States
|
|||||||||||
|
Europe
|
129,786
|
|
20,289
|
|
—
|
|
|||||
|
Other
|
23,740
|
|
769
|
|
—
|
|
|||||
|
Total revenues outside of the United States
|
153,526
|
|
21,058
|
|
—
|
|
|||||
|
Total revenues
|
$
|
1,527,042
|
|
$
|
1,410,626
|
|
$
|
143,370
|
|
||
Significant Customers
The following table summarizes gross revenues and accounts receivable from each of the Company’s customers who individually accounted for
10%
or more of total gross revenues and/or
10%
or more of total accounts receivable:
|
Percent of Total Gross Revenues
|
Percent of Accounts Receivable
|
|||||||||||
|
Year Ended December 31,
|
As of December 31,
|
|||||||||||
|
2012
|
2011
|
2010
|
2012
|
2011
|
||||||||
|
AmerisourceBergen Drug Corporation
|
32
|
%
|
25
|
%
|
—
|
%
|
22
|
%
|
35
|
%
|
||
|
McKesson Corporation
|
29
|
%
|
24
|
%
|
—
|
%
|
26
|
%
|
30
|
%
|
||
|
Cardinal Health Incorporated
|
15
|
%
|
15
|
%
|
—
|
%
|
<10
|
%
|
20
|
%
|
||
|
Janssen
|
<10
|
%
|
19
|
%
|
21
|
%
|
26
|
%
|
10
|
%
|
||
|
Mitsubishi Tanabe
|
<10
|
%
|
<10
|
%
|
57
|
%
|
—
|
%
|
<10
|
%
|
||
F-41
VERTEX PHARMACEUTICALS INCORPORATED
Notes to Consolidated Financial Statements (Continued)
Property and Equipment, Net by Location
The following table summarizes property and equipment, net by location:
|
As of December 31,
|
|||||||
|
2012
|
2011
|
||||||
|
(in thousands)
|
|||||||
|
United States
|
$
|
400,102
|
|
$
|
109,480
|
|
|
|
Outside of the United States
|
|||||||
|
United Kingdom
|
30,622
|
|
21,377
|
|
|||
|
Other
|
2,885
|
|
2,319
|
|
|||
|
Total property and equipment, net outside of the United States
|
33,507
|
|
23,696
|
|
|||
|
Total property and equipment, net
|
$
|
433,609
|
|
$
|
133,176
|
|
|
|
X.
|
Quarterly Financial Data (unaudited)
|
|
Three Months Ended
|
||||||||||||
|
March 31,
2012 |
June 30,
2012 (1) |
Sept. 30,
2012 |
Dec. 31,
2012 (2) |
|||||||||
|
(in thousands, except per share amounts)
|
||||||||||||
|
Revenues:
|
||||||||||||
|
Product revenues, net
|
$
|
375,375
|
|
$
|
373,273
|
|
$
|
303,501
|
|
$
|
281,309
|
|
|
Royalty revenues
|
38,981
|
|
33,480
|
|
25,586
|
|
43,451
|
|
||||
|
Collaborative revenues
|
24,381
|
|
11,552
|
|
6,919
|
|
9,234
|
|
||||
|
Total revenues
|
438,737
|
|
418,305
|
|
336,006
|
|
333,994
|
|
||||
|
Costs and expenses:
|
||||||||||||
|
Cost of product revenues
|
25,918
|
|
104,549
|
|
30,680
|
|
75,595
|
|
||||
|
Royalty expenses
|
13,293
|
|
9,874
|
|
7,856
|
|
12,120
|
|
||||
|
Research and development expenses
|
196,371
|
|
196,544
|
|
200,161
|
|
213,109
|
|
||||
|
Sales, general and administrative expenses
|
111,146
|
|
117,514
|
|
97,684
|
|
110,452
|
|
||||
|
Restructuring expense (credit)
|
360
|
|
594
|
|
696
|
|
194
|
|
||||
|
Intangible asset impairment charge
|
—
|
|
—
|
|
—
|
|
—
|
|
||||
|
Total costs and expenses
|
347,088
|
|
429,075
|
|
337,077
|
|
411,470
|
|
||||
|
Income (loss) from operations
|
91,649
|
|
(10,770
|
)
|
(1,071
|
)
|
(77,476
|
)
|
||||
|
Interest income
|
364
|
|
560
|
|
519
|
|
497
|
|
||||
|
Interest expense
|
(4,105
|
)
|
(4,195
|
)
|
(4,560
|
)
|
(3,793
|
)
|
||||
|
Change in fair value of derivative instruments
|
—
|
|
—
|
|
—
|
|
—
|
|
||||
|
Income (loss) before provision for (benefit from) income taxes
|
87,908
|
|
(14,405
|
)
|
(5,112
|
)
|
(80,772
|
)
|
||||
|
Provision for (benefit from) income taxes
|
32
|
|
20,063
|
|
21,355
|
|
(2,696
|
)
|
||||
|
Net income (loss)
|
87,876
|
|
(34,468
|
)
|
(26,467
|
)
|
(78,076
|
)
|
||||
|
Net loss (income) attributable to noncontrolling interest (Alios)
|
3,714
|
|
(30,463
|
)
|
(31,076
|
)
|
1,928
|
|
||||
|
Net income (loss) attributable to Vertex
|
$
|
91,590
|
|
$
|
(64,931
|
)
|
$
|
(57,543
|
)
|
$
|
(76,148
|
)
|
|
Net income (loss) per share attributable to Vertex common shareholders:
|
||||||||||||
|
Basic
|
$
|
0.44
|
|
$
|
(0.31
|
)
|
$
|
(0.27
|
)
|
$
|
(0.35
|
)
|
|
Diluted
|
$
|
0.43
|
|
$
|
(0.31
|
)
|
$
|
(0.27
|
)
|
$
|
(0.35
|
)
|
|
Shares used in per share calculations:
|
||||||||||||
|
Basic
|
208,018
|
|
211,344
|
|
213,767
|
|
214,607
|
|
||||
|
Diluted
|
219,264
|
|
211,344
|
|
213,767
|
|
214,607
|
|
||||
F-42
VERTEX PHARMACEUTICALS INCORPORATED
Notes to Consolidated Financial Statements (Continued)
|
Three Months Ended
|
||||||||||||
|
March 31,
2011 |
June 30,
2011 |
Sept. 30,
2011 (3) |
Dec. 31,
2011 |
|||||||||
|
(in thousands, except per share amounts)
|
||||||||||||
|
Revenues:
|
||||||||||||
|
Product revenues, net
|
$
|
—
|
|
$
|
74,535
|
|
$
|
419,595
|
|
$
|
456,759
|
|
|
Royalty revenues
|
6,061
|
|
10,010
|
|
8,539
|
|
25,405
|
|
||||
|
Collaborative revenues
|
67,601
|
|
29,879
|
|
231,066
|
|
81,176
|
|
||||
|
Total revenues
|
73,662
|
|
114,424
|
|
659,200
|
|
563,340
|
|
||||
|
Costs and expenses:
|
||||||||||||
|
Cost of product revenues
|
—
|
|
5,404
|
|
35,285
|
|
22,936
|
|
||||
|
Royalty expenses
|
2,666
|
|
3,902
|
|
3,121
|
|
7,191
|
|
||||
|
Research and development expenses
|
158,612
|
|
173,604
|
|
189,052
|
|
186,438
|
|
||||
|
Sales, general and administrative expenses
|
71,523
|
|
96,663
|
|
110,654
|
|
121,881
|
|
||||
|
Restructuring expense (credit)
|
760
|
|
741
|
|
(419
|
)
|
992
|
|
||||
|
Intangible asset impairment charge
|
—
|
|
—
|
|
105,800
|
|
—
|
|
||||
|
Total costs and expenses
|
233,561
|
|
280,314
|
|
443,493
|
|
339,438
|
|
||||
|
Income (loss) from operations
|
(159,899
|
)
|
(165,890
|
)
|
215,707
|
|
223,902
|
|
||||
|
Interest income
|
1,402
|
|
202
|
|
77
|
|
197
|
|
||||
|
Interest expense
|
(12,001
|
)
|
(6,962
|
)
|
(7,059
|
)
|
(12,430
|
)
|
||||
|
Change in fair value of derivative instruments
|
(5,598
|
)
|
(2,220
|
)
|
(8,115
|
)
|
(868
|
)
|
||||
|
Income (loss) before provision for (benefit from) income taxes
|
(176,096
|
)
|
(174,870
|
)
|
200,610
|
|
210,801
|
|
||||
|
Provision for (benefit from) income taxes
|
—
|
|
24,448
|
|
(27,842
|
)
|
22,660
|
|
||||
|
Net income (loss)
|
(176,096
|
)
|
(199,318
|
)
|
228,452
|
|
188,141
|
|
||||
|
Net loss (income) attributable to noncontrolling interest (Alios)
|
—
|
|
25,249
|
|
(7,342
|
)
|
(29,512
|
)
|
||||
|
Net income (loss) attributable to Vertex
|
$
|
(176,096
|
)
|
$
|
(174,069
|
)
|
$
|
221,110
|
|
$
|
158,629
|
|
|
Net income (loss) per share attributable to Vertex common shareholders:
|
||||||||||||
|
Basic
|
$
|
(0.87
|
)
|
$
|
(0.85
|
)
|
$
|
1.06
|
|
$
|
0.76
|
|
|
Diluted
|
$
|
(0.87
|
)
|
$
|
(0.85
|
)
|
$
|
1.02
|
|
$
|
0.74
|
|
|
Shares used in per share calculations:
|
||||||||||||
|
Basic
|
202,329
|
|
204,413
|
|
206,002
|
|
206,758
|
|
||||
|
Diluted
|
202,329
|
|
204,413
|
|
219,349
|
|
217,602
|
|
||||
|
(1)
|
During the second quarter of 2012, the Company recorded within cost of product revenues a lower of cost or market charge of
$78.0 million
for excess and obsolete INCIVEK inventories. This charge affected net income (loss) attributable to Vertex per diluted share, net of tax, by
$(0.36)
for the second quarter of 2012, resulting in a net loss attributable to Vertex per diluted share in the second quarter of 2012. See
Note F, "Inventories,"
for further information.
|
|
(2)
|
During the fourth quarter of 2012, the Company recorded within cost of product revenues a lower of cost or market charge of
$55.2 million
for excess and obsolete INCIVEK inventories. This charge resulted in a
$0.25
increase in the net loss attributable to Vertex per diluted share for the fourth quarter of 2012. See
Note F, "Inventories,"
for further information.
|
|
(3)
|
During the third quarter of 2011, the Company recorded an impairment charge of
$105.8 million
. In connection with this impairment charge, the Company recorded a benefit from income taxes of
$32.7 million
resulting in a net decrease in net income attributable to Vertex related to this impairment charge of
$73.1 million
in the third quarter of 2011.
|
F-43
TABLE OF CONTENTS
Part IItem 1. BusinessItem 1A. Risk FactorsItem 1B. Unresolved Staff CommentsItem 2. PropertiesItem 3. Legal ProceedingsItem 4. Mine Safety DisclosuresPart IIItem 5. Market For Registrant's Common Equity, Related Stockholder Matters and Issuer Purchases Of Equity SecuritiesItem 6. Selected Financial DataItem 7. Management's Discussion and Analysis Of Financial Condition and Results Of OperationsItem 7A. Quantitative and Qualitative Disclosures About Market RiskItem 8. Financial Statements and Supplementary DataItem 9. Changes and Disagreements with Accountants on Accounting and Financial DisclosureItem 9A. Controls and ProceduresItem 9B. Other InformationPart IIIItem 10. Directors, Executive Officers and Corporate GovernanceItem 11. Executive CompensationItem 12. Security Ownership Of Certain Beneficial Owners and Management and Related Stockholder MattersItem 13. Certain Relationships and Related Transactions, and Director IndependenceItem 14. Principal Accountant Fees and ServicesPart IVItem 15. Exhibits and Financial Statement Schedules