VERTEX PHARMACEUTICALS INC / MA
10-Ks and 10-Qs
|
|
|
|
|
|
|
|
|
|
|
|
|
|
|
|
|
|
|
|
|
|
|
|
|
|
|
|
|
|
|
|
|
|
|
|
|
|
|
|
|
|
|
|
|
|
|
|
|
|
|
|
|
|
|
|
|
|
|
UNITED STATES
SECURITIES AND EXCHANGE COMMISSION
WASHINGTON, D.C. 20549
________________________________________________________
FORM 10-Q
|
x
|
QUARTERLY REPORT PURSUANT TO SECTION 13 OR 15(d) OF THE SECURITIES EXCHANGE ACT OF 1934
|
|
FOR THE QUARTERLY PERIOD ENDED MARCH 31, 2019
|
|
|
or
|
|
|
o
|
TRANSITION REPORT PURSUANT TO SECTION 13 OR 15(d) OF THE SECURITIES EXCHANGE ACT OF 1934
|
|
FOR THE TRANSITION PERIOD FROM
TO
|
|
Commission file number 000-19319
____________________________________________
Vertex Pharmaceuticals Incorporated
(Exact name of registrant as specified in its charter)
|
Massachusetts
|
04-3039129
|
|
(State or other jurisdiction of
incorporation or organization) |
(I.R.S. Employer
Identification No.) |
|
50 Northern Avenue, Boston, Massachusetts
|
02210
|
|
(Address of principal executive offices)
|
(Zip Code)
|
Registrant’s telephone number, including area code
(617) 341-6100
____________________________________________
Indicate by check mark whether the registrant: (1) has filed all reports required to be filed by Section 13 or 15(d) of the Securities Exchange Act of 1934 during the preceding 12 months (or for such shorter period that the registrant was required to file such reports), and (2) has been subject to such filing requirements for the past 90 days. Yes
x
No
o
Indicate by check mark whether the registrant has submitted electronically every Interactive Data File required to be submitted pursuant to Rule 405 of Regulation S-T (§232.405 of this chapter) during the preceding 12 months (or for such shorter period that the registrant was required to submit such files). Yes
x
No
o
Indicate by check mark whether the registrant is a large accelerated filer, an accelerated filer, a non-accelerated filer, a smaller reporting company, or an emerging growth company. See the definitions of “large accelerated filer,” “accelerated filer,” “smaller reporting company,” and “emerging growth company” in Rule 12b-2 of the Exchange Act.
|
Large accelerated filer
x
|
Accelerated filer
o
|
Non-accelerated filer
o
|
Smaller reporting company
o
|
|
Emerging growth company
o
|
|
||
If an emerging growth company, indicate by check mark if the registrant has elected not to use the extended transition period for complying with any new or revised financial accounting standards provided pursuant to Section 13(a) of the Exchange Act.
o
Indicate by check mark whether the registrant is a shell company (as defined in Rule 12b-2 of the Exchange Act). Yes
o
No
x
Indicate the number of shares outstanding of each of the issuer’s classes of common stock, as of the latest practicable date.
|
Common Stock, par value $0.01 per share
|
256,121,360
|
|
Class
|
Outstanding at April 24, 2019
|
VERTEX PHARMACEUTICALS INCORPORATED
FORM 10-Q
FOR THE QUARTER ENDED MARCH 31, 2019
TABLE OF CONTENTS
|
Page
|
||
|
Condensed Consolidated Statements of Operations - Three Months Ended March 31, 2019 and 20
18
|
||
|
Condensed Consolidated Statements of Comprehensive Income - Three Months Ended March 31, 2019 and 20
18
|
||
|
Condensed Consolidated Balance Sheets - March 31, 2019 and
December 31, 2018
|
||
|
Condensed Consolidated Statements of Shareholders' Equity and Noncontrolling Interest - Three Months Ended
March 31, 2019 and 2018
|
||
|
Condensed Consolidated Statements of Cash Flows - Three Months Ended
March 31, 2019 and 2018
|
||
“We,” “us,” “Vertex” and the “Company” as used in this Quarterly Report on Form 10-Q refer to Vertex Pharmaceuticals Incorporated, a Massachusetts corporation, and its subsidiaries.
“Vertex,” “KALYDECO
®
,” “ORKAMBI
®
,” “SYMDEKO
®
” and “SYMKEVI
®
” are registered trademarks of Vertex. Other brands, names and trademarks contained in this Quarterly Report on Form 10-Q are the property of their respective owners.
We use the brand name for our products when we refer to the product that has been approved and with respect to the indications on the approved label. Otherwise, including in discussions of our cystic fibrosis development programs, we refer to our compounds by their scientific (or generic) name or VX developmental designation.
Part I. Financial Information
Item 1. Financial Statements
VERTEX PHARMACEUTICALS INCORPORATED
Condensed Consolidated Statements of Operations
(unaudited)
(in thousands, except per share amounts)
|
Three Months Ended March 31,
|
|||||||
|
2019
|
2018
|
||||||
|
Revenues:
|
|||||||
|
Product revenues, net
|
$
|
857,253
|
|
$
|
637,729
|
|
|
|
Collaborative and royalty revenues
|
1,182
|
|
3,070
|
|
|||
|
Total revenues
|
858,435
|
|
640,799
|
|
|||
|
Costs and expenses:
|
|||||||
|
Cost of sales
|
95,092
|
|
71,613
|
|
|||
|
Research and development expenses
|
339,490
|
|
310,553
|
|
|||
|
Sales, general and administrative expenses
|
147,045
|
|
129,808
|
|
|||
|
Restructuring income
|
—
|
|
(76
|
)
|
|||
|
Total costs and expenses
|
581,627
|
|
511,898
|
|
|||
|
Income from operations
|
276,808
|
|
128,901
|
|
|||
|
Interest income
|
15,615
|
|
5,789
|
|
|||
|
Interest expense
|
(14,868
|
)
|
(16,886
|
)
|
|||
|
Other income, net
|
42,610
|
|
96,838
|
|
|||
|
Income before provision for (benefit from) income taxes
|
320,165
|
|
214,642
|
|
|||
|
Provision for (benefit from) income taxes
|
51,534
|
|
(12,659
|
)
|
|||
|
Net income
|
268,631
|
|
227,301
|
|
|||
|
Income attributable to noncontrolling interest
|
—
|
|
(17,038
|
)
|
|||
|
Net income attributable to Vertex
|
$
|
268,631
|
|
$
|
210,263
|
|
|
|
Amounts per share attributable to Vertex common shareholders:
|
|||||||
|
Net income:
|
|||||||
|
Basic
|
$
|
1.05
|
|
$
|
0.83
|
|
|
|
Diluted
|
$
|
1.03
|
|
$
|
0.81
|
|
|
|
Shares used in per share calculations:
|
|||||||
|
Basic
|
255,695
|
|
253,231
|
|
|||
|
Diluted
|
260,175
|
|
258,526
|
|
|||
The accompanying notes are an integral part of these condensed consolidated financial statements.
2
VERTEX PHARMACEUTICALS INCORPORATED
Condensed Consolidated Statements of Comprehensive Income
(unaudited)
(in thousands)
|
Three Months Ended March 31,
|
|||||||
|
2019
|
2018
|
||||||
|
Net income
|
$
|
268,631
|
|
$
|
227,301
|
|
|
|
Changes in other comprehensive income (loss):
|
|||||||
|
Unrealized holding gains (losses) on marketable securities, net
|
596
|
|
(460
|
)
|
|||
|
Unrealized losses on foreign currency forward contracts, net of tax of $1.5 million and $0.3 million, respectively
|
(222
|
)
|
(862
|
)
|
|||
|
Foreign currency translation adjustment
|
4,967
|
|
(2,729
|
)
|
|||
|
Total changes in other comprehensive income (loss)
|
5,341
|
|
(4,051
|
)
|
|||
|
Comprehensive income
|
273,972
|
|
223,250
|
|
|||
|
Comprehensive income attributable to noncontrolling interest
|
—
|
|
(17,038
|
)
|
|||
|
Comprehensive income attributable to Vertex
|
$
|
273,972
|
|
$
|
206,212
|
|
|
The accompanying notes are an integral part of these condensed consolidated financial statements.
3
VERTEX PHARMACEUTICALS INCORPORATED
Condensed Consolidated Balance Sheets
(unaudited)
(in thousands, except per share amounts)
|
March 31,
|
December 31,
|
||||||
|
2019
|
2018
|
||||||
|
Assets
|
|||||||
|
Current assets:
|
|||||||
|
Cash and cash equivalents
|
$
|
2,893,885
|
|
$
|
2,650,134
|
|
|
|
Marketable securities
|
584,150
|
|
518,108
|
|
|||
|
Accounts receivable, net
|
438,297
|
|
409,688
|
|
|||
|
Inventories
|
136,698
|
|
124,360
|
|
|||
|
Prepaid expenses and other current assets
|
130,009
|
|
140,819
|
|
|||
|
Total current assets
|
4,183,039
|
|
3,843,109
|
|
|||
|
Property and equipment, net
|
742,559
|
|
812,005
|
|
|||
|
Goodwill
|
50,384
|
|
50,384
|
|
|||
|
Deferred tax assets
|
1,467,518
|
|
1,499,672
|
|
|||
|
Operating lease assets
|
60,573
|
|
—
|
|
|||
|
Other assets
|
39,041
|
|
40,728
|
|
|||
|
Total assets
|
$
|
6,543,114
|
|
$
|
6,245,898
|
|
|
|
Liabilities and Shareholders’ Equity
|
|||||||
|
Current liabilities:
|
|||||||
|
Accounts payable
|
$
|
82,262
|
|
$
|
110,987
|
|
|
|
Accrued expenses
|
532,745
|
|
604,495
|
|
|||
|
Early access sales accrual
|
382,703
|
|
354,404
|
|
|||
|
Other current liabilities
|
108,758
|
|
50,406
|
|
|||
|
Total current liabilities
|
1,106,468
|
|
1,120,292
|
|
|||
|
Long-term finance lease liabilities
|
560,381
|
|
581,550
|
|
|||
|
Long-term operating lease liabilities
|
63,484
|
|
—
|
|
|||
|
Long-term advance from collaborator
|
83,471
|
|
82,573
|
|
|||
|
Other long-term liabilities
|
5,997
|
|
26,280
|
|
|||
|
Total liabilities
|
1,819,801
|
|
1,810,695
|
|
|||
|
Commitments and contingencies
|
—
|
|
—
|
|
|||
|
Shareholders’ equity:
|
|||||||
|
Preferred stock, $0.01 par value; 1,000 shares authorized; none issued and outstanding
|
—
|
|
—
|
|
|||
|
Common stock, $0.01 par value; 500,000 shares authorized, 256,351 and 255,172 shares issued and outstanding, respectively
|
2,561
|
|
2,546
|
|
|||
|
Additional paid-in capital
|
7,475,909
|
|
7,421,476
|
|
|||
|
Accumulated other comprehensive income
|
6,000
|
|
659
|
|
|||
|
Accumulated deficit
|
(2,761,157
|
)
|
(2,989,478
|
)
|
|||
|
Total shareholders’ equity
|
4,723,313
|
|
4,435,203
|
|
|||
|
Total liabilities and shareholders’ equity
|
$
|
6,543,114
|
|
$
|
6,245,898
|
|
|
The accompanying notes are an integral part of these condensed consolidated financial statements.
4
VERTEX PHARMACEUTICALS INCORPORATED
Condensed Consolidated Statements of Shareholders’ Equity and Noncontrolling Interest
(unaudited)
(in thousands)
|
Common Stock
|
Additional
Paid-in Capital |
Accumulated
Other Comprehensive (Loss) Income |
Accumulated Deficit
|
Total Vertex
Shareholders’ Equity |
Noncontrolling
Interest |
Total
Shareholders’ Equity |
||||||||||||||||||||||||
|
Shares
|
Amount
|
|||||||||||||||||||||||||||||
|
Balance at December 31, 2017
|
253,253
|
|
$
|
2,512
|
|
$
|
7,157,362
|
|
$
|
(11,572
|
)
|
$
|
(5,119,723
|
)
|
$
|
2,028,579
|
|
$
|
13,727
|
|
$
|
2,042,306
|
|
|||||||
|
Cumulative effect adjustment for adoption of new accounting guidance
|
—
|
|
—
|
|
—
|
|
(24,120
|
)
|
33,349
|
|
9,229
|
|
—
|
|
9,229
|
|
||||||||||||||
|
Other comprehensive loss, net of tax
|
—
|
|
—
|
|
—
|
|
(4,051
|
)
|
—
|
|
(4,051
|
)
|
—
|
|
(4,051
|
)
|
||||||||||||||
|
Net income
|
—
|
|
—
|
|
—
|
|
—
|
|
210,263
|
|
210,263
|
|
17,038
|
|
227,301
|
|
||||||||||||||
|
Repurchase of common stock
|
(67
|
)
|
(1
|
)
|
(11,250
|
)
|
—
|
|
—
|
|
(11,251
|
)
|
—
|
|
(11,251
|
)
|
||||||||||||||
|
Issuance of common stock under benefit plans
|
1,682
|
|
30
|
|
89,656
|
|
—
|
|
—
|
|
89,686
|
|
—
|
|
89,686
|
|
||||||||||||||
|
Stock-based compensation expense
|
—
|
|
—
|
|
78,601
|
|
—
|
|
—
|
|
78,601
|
|
—
|
|
78,601
|
|
||||||||||||||
|
Other VIE activity
|
—
|
|
—
|
|
—
|
|
—
|
|
—
|
|
—
|
|
(1,000
|
)
|
(1,000
|
)
|
||||||||||||||
|
Balance at March 31, 2018
|
254,868
|
|
$
|
2,541
|
|
$
|
7,314,369
|
|
$
|
(39,743
|
)
|
$
|
(4,876,111
|
)
|
$
|
2,401,056
|
|
$
|
29,765
|
|
$
|
2,430,821
|
|
|||||||
|
Balance at December 31, 2018
|
255,172
|
|
$
|
2,546
|
|
$
|
7,421,476
|
|
$
|
659
|
|
$
|
(2,989,478
|
)
|
$
|
4,435,203
|
|
$
|
—
|
|
$
|
4,435,203
|
|
|||||||
|
Cumulative effect adjustment for adoption of new accounting guidance
|
—
|
|
—
|
|
—
|
|
—
|
|
(40,310
|
)
|
(40,310
|
)
|
—
|
|
(40,310
|
)
|
||||||||||||||
|
Other comprehensive income, net of tax
|
—
|
|
—
|
|
—
|
|
5,341
|
|
—
|
|
5,341
|
|
—
|
|
5,341
|
|
||||||||||||||
|
Net income
|
—
|
|
—
|
|
—
|
|
—
|
|
268,631
|
|
268,631
|
|
—
|
|
268,631
|
|
||||||||||||||
|
Repurchases of common stock
|
(564
|
)
|
(6
|
)
|
(103,833
|
)
|
—
|
|
—
|
|
(103,839
|
)
|
—
|
|
(103,839
|
)
|
||||||||||||||
|
Issuance of common stock under benefit plans
|
1,743
|
|
21
|
|
64,023
|
|
—
|
|
—
|
|
64,044
|
|
—
|
|
64,044
|
|
||||||||||||||
|
Stock-based compensation expense
|
—
|
|
—
|
|
94,243
|
|
—
|
|
—
|
|
94,243
|
|
—
|
|
94,243
|
|
||||||||||||||
|
Balance at March 31, 2019
|
256,351
|
|
$
|
2,561
|
|
$
|
7,475,909
|
|
$
|
6,000
|
|
$
|
(2,761,157
|
)
|
$
|
4,723,313
|
|
$
|
—
|
|
$
|
4,723,313
|
|
|||||||
The accompanying notes are an integral part of these condensed consolidated financial statements.
5
VERTEX PHARMACEUTICALS INCORPORATED
Condensed Consolidated Statements of Cash Flows
(unaudited)
(in thousands)
|
Three Months Ended March 31,
|
|||||||
|
2019
|
2018
|
||||||
|
Cash flows from operating activities:
|
|||||||
|
Net income
|
$
|
268,631
|
|
$
|
227,301
|
|
|
|
Adjustments to reconcile net income to net cash provided by operating activities:
|
|||||||
|
Stock-based compensation expense
|
93,791
|
|
78,136
|
|
|||
|
Depreciation expense
|
27,140
|
|
16,343
|
|
|||
|
Write-downs of inventories to net realizable value
|
1,270
|
|
3,619
|
|
|||
|
Deferred income taxes
|
43,425
|
|
3,587
|
|
|||
|
Unrealized gain on equity securities
|
(43,551
|
)
|
(95,458
|
)
|
|||
|
Other non-cash items, net
|
(3,701
|
)
|
5,827
|
|
|||
|
Changes in operating assets and liabilities:
|
|||||||
|
Accounts receivable, net
|
(30,136
|
)
|
(13,473
|
)
|
|||
|
Inventories
|
(13,139
|
)
|
(8,208
|
)
|
|||
|
Prepaid expenses and other assets
|
7,941
|
|
25,482
|
|
|||
|
Accounts payable
|
(24,145
|
)
|
2,154
|
|
|||
|
Accrued expenses and other liabilities
|
(38,425
|
)
|
(31,469
|
)
|
|||
|
Early access sales accrual
|
35,683
|
|
38,816
|
|
|||
|
Net cash provided by operating activities
|
324,784
|
|
252,657
|
|
|||
|
Cash flows from investing activities:
|
|||||||
|
Purchases of available-for-sale debt securities
|
(128,215
|
)
|
(38,653
|
)
|
|||
|
Maturities of available-for-sale debt securities
|
107,118
|
|
94,365
|
|
|||
|
Expenditures for property and equipment
|
(18,041
|
)
|
(29,279
|
)
|
|||
|
Investment in equity securities
|
—
|
|
(21,500
|
)
|
|||
|
Net cash (used in) provided by investing activities
|
(39,138
|
)
|
4,933
|
|
|||
|
Cash flows from financing activities:
|
|||||||
|
Issuances of common stock under benefit plans
|
63,620
|
|
88,403
|
|
|||
|
Repurchase of common stock
|
(99,839
|
)
|
(10,000
|
)
|
|||
|
Advance from collaborator
|
5,000
|
|
2,500
|
|
|||
|
Payments on capital lease and construction financing lease obligations
|
—
|
|
(9,331
|
)
|
|||
|
Payments on finance leases
|
(9,385
|
)
|
—
|
|
|||
|
Proceeds related to construction financing lease obligation
|
—
|
|
9,566
|
|
|||
|
Repayments of advanced funding
|
(1,385
|
)
|
(1,182
|
)
|
|||
|
Other financing activities
|
—
|
|
(1,000
|
)
|
|||
|
Net cash (used in) provided by financing activities
|
(41,989
|
)
|
78,956
|
|
|||
|
Effect of changes in exchange rates on cash
|
(378
|
)
|
1,656
|
|
|||
|
Net increase in cash and cash equivalents
|
243,279
|
|
338,202
|
|
|||
|
Cash, cash equivalents and restricted cash—beginning of period
|
2,658,253
|
|
1,667,526
|
|
|||
|
Cash, cash equivalents and restricted cash—end of period
|
$
|
2,901,532
|
|
$
|
2,005,728
|
|
|
|
Supplemental disclosure of cash flow information:
|
|||||||
|
Cash paid for interest
|
$
|
13,148
|
|
$
|
16,825
|
|
|
|
Cash paid for income taxes
|
$
|
1,835
|
|
$
|
1,897
|
|
|
|
Capitalization of costs related to construction financing lease obligation
|
$
|
—
|
|
$
|
3,716
|
|
|
|
Issuances of common stock from employee benefit plans receivable
|
$
|
510
|
|
$
|
2,124
|
|
|
|
Accrued share repurchase liability
|
$
|
4,000
|
|
$
|
—
|
|
|
The accompanying notes are an integral part of these condensed consolidated financial statements.
6
VERTEX PHARMACEUTICALS INCORPORATED
Notes to Condensed Consolidated Financial Statements
(unaudited)
A. Basis of Presentation and Accounting Policies
Basis of Presentation
The accompanying condensed consolidated financial statements are unaudited and have been prepared by Vertex Pharmaceuticals Incorporated (“Vertex” or the “Company”) in accordance with accounting principles generally accepted in the United States of America (“GAAP”).
The condensed consolidated financial statements reflect the operations of the Company and its wholly-owned subsidiaries. The Company's condensed consolidated financial statements for the interim period ended
March 31, 2018
also include the financial results of BioAxone Biosciences, Inc. (“BioAxone”), a variable interest entity (“VIE”) that the Company consolidated from 2014 through
December 31, 2018
. All material intercompany balances and transactions have been eliminated. The Company operates in
one
segment, pharmaceuticals. The Company has reclassified certain items from the prior year’s condensed consolidated financial statements to conform to the current year’s presentation.
Certain information and footnote disclosures normally included in the Company’s
2018
Annual Report on Form 10-K have been condensed or omitted. These interim financial statements, in the opinion of management, reflect all normal recurring adjustments necessary for a fair presentation of the financial position and results of operations for the interim periods ended
March 31, 2019
and
2018
.
The results of operations for the interim periods are not necessarily indicative of the results of operations to be expected for the full fiscal year. These interim financial statements should be read in conjunction with the audited financial statements for the year ended
December 31, 2018
, which are contained in the
2018
Annual Report on Form 10-K.
Use of Estimates
The preparation of condensed consolidated financial statements in accordance with GAAP requires management to make certain estimates and assumptions that affect the reported amounts of assets and liabilities and disclosure of contingent assets and liabilities at the date of the condensed consolidated financial statements, and the amounts of revenues and expenses during the reported periods. Significant estimates in these condensed consolidated financial statements have been made in connection with the calculation of revenues, research and development expenses, goodwill, deferred tax asset valuation allowances and the provision for or benefit from income taxes. The Company bases its estimates on historical experience and various other assumptions, including in certain circumstances future projections that management believes to be reasonable under the circumstances. Actual results could differ from those estimates. Changes in estimates are reflected in reported results in the period in which they become known.
Recently Adopted Accounting Standards
Leases
In 2016, the FASB issued ASU No. 2016-02,
Leases (Topic 842)
(“ASC 842”), which amends a number of aspects of lease accounting and requires entities to recognize right-of-use assets and liabilities on the balance sheet. ASC 842 became effective on January 1, 2019. The Company has finalized its review of its portfolio of existing leases and current accounting policies and has concluded that the amended guidance results in the recognition of additional assets and corresponding liabilities on its balance sheets. The Company also has finalized changes to its controls to address the adoption and ongoing lease accounting and related disclosure requirements of the new standard.
Until December 31, 2018, the Company applied build-to-suit accounting and was the deemed owner of its leased corporate headquarters in Boston and research site in San Diego, for which it was recognizing depreciation expense over the buildings’ useful lives and imputed interest on the corresponding construction financing lease obligations. Under the amended guidance that became effective January 1, 2019, the Company accounts for these buildings as finance leases, resulting in increased depreciation expense over the respective lease terms of 15-16 years, which are significantly shorter than the buildings’ useful lives of 40 years. The Company also expects a reduction in its imputed interest expense in the initial years of each finance lease term. In 2019, the Company expects an increase in operating expenses of approximately
$26 million
and a decrease in interest expense of approximately
$13 million
due to this change.
7
VERTEX PHARMACEUTICALS INCORPORATED
Notes to Condensed Consolidated Financial Statements
(unaudited)
In July 2018, the FASB issued ASU No. 2018-11,
Leases (Topic 842): Targeted Improvements
(“ASU 2018-11”), which offered a transition option to entities adopting ASC 842. Under ASU 2018-11, entities could elect to apply ASC 842 using a modified-retrospective adoption approach resulting in a cumulative effect adjustment to accumulated deficit at the beginning of the year in which the new lease standard is adopted, rather than adjustments to the earliest comparative period presented in their financial statements. The Company adopted ASC 842 using the modified-retrospective method. As of January 1, 2019, the Company recorded a cumulative effect adjustment to increase its “
Accumulated deficit
” by
$40.3 million
related to the adjustments to its build-to-suit leases described in the previous paragraph.
The Company elected the package of transition practical expedients for leases that commenced prior to January 1, 2019, allowing it not to reassess (i) whether any expired or existing contracts contain leases, (ii) the lease classification for any expired or existing leases and (iii) the initial indirect costs for any existing leases.
Additionally, the Company recorded, upon adoption of ASC 842 on January 1, 2019, operating lease assets of
$61.7 million
and corresponding liabilities of
$71.9 million
related to its real estate leases that are not treated as finance leases under ASC 842. The difference between these assets and liabilities is primarily attributable to prepaid or accrued lease payments. The Company also reclassified amounts that were recorded as “Capital lease obligations, current portion” and “Capital lease obligations, excluding current portion” as of December 31, 2018 to “
Other current liabilities
” and “
Long-term finance lease liabilities
,” respectively, on January 1, 2019. These adjustments had
no
impact on the Company’s condensed consolidated statement of operations and had
no
impact on the Company’s accumulated deficit.
The cumulative effect of applying ASC 842 on the Company’s condensed consolidated balance sheet as of January 1, 2019 was as follows:
|
Balance as of
|
Balance as of
|
||||||||||
|
December 31, 2018 ^
|
Adjustments
|
January 1, 2019
|
|||||||||
|
Assets
|
(in thousands)
|
||||||||||
|
Prepaid expenses and other current assets
|
$
|
140,819
|
|
$
|
(2,930
|
)
|
$
|
137,889
|
|
||
|
Property and equipment, net
|
812,005
|
|
(53,920
|
)
|
758,085
|
|
|||||
|
Deferred tax assets
|
1,499,672
|
|
11,236
|
|
1,510,908
|
|
|||||
|
Operating lease assets
|
—
|
|
61,674
|
|
61,674
|
|
|||||
|
Total assets
|
$
|
6,245,898
|
|
$
|
16,060
|
|
$
|
6,261,958
|
|
||
|
Liabilities and Shareholders’ Equity
|
|||||||||||
|
Capital lease obligations, current portion
|
$
|
9,817
|
|
$
|
(9,817
|
)
|
$
|
—
|
|
||
|
Other current liabilities
|
40,589
|
|
34,304
|
|
74,893
|
|
|||||
|
Capital lease obligations, excluding current portion
|
19,658
|
|
(19,658
|
)
|
—
|
|
|||||
|
Construction financing lease obligation, excluding current portion
|
561,892
|
|
(561,892
|
)
|
—
|
|
|||||
|
Long-term finance lease liabilities
|
—
|
|
569,487
|
|
569,487
|
|
|||||
|
Long-term operating lease liabilities
|
—
|
|
64,849
|
|
64,849
|
|
|||||
|
Other long-term liabilities
|
26,280
|
|
(20,903
|
)
|
5,377
|
|
|||||
|
Accumulated deficit
|
(2,989,478
|
)
|
(40,310
|
)
|
(3,029,788
|
)
|
|||||
|
Total liabilities and shareholders’ equity
|
$
|
6,245,898
|
|
$
|
16,060
|
|
$
|
6,261,958
|
|
||
|
^ As reported in the Company’s 2018 Annual Report on Form 10-K.
|
|||||||||||
Please refer to
Note K, “Leases,”
for further information regarding the Company’s leases as well as certain disclosures required by ASC 842.
Derivatives and Hedging
In 2017, the FASB issued ASU 2017-12,
Derivatives and Hedging (Topic 815)
(“ASU 2017-12”), which helps simplify certain aspects of hedge accounting and enables entities to more accurately present their risk management activities in their financial statements. ASU 2017-12 became effective January 1, 2019. The adoption of ASU 2017-12 did not have a significant effect on the Company’s condensed consolidated financial statements.
8
VERTEX PHARMACEUTICALS INCORPORATED
Notes to Condensed Consolidated Financial Statements
(unaudited)
Recently Issued Accounting Standards
Internal-Use Software
In 2018, the FASB issued ASU 2018-15,
Intangibles—Goodwill and Other—Internal-Use Software (Subtopic 350-40): Customer’s Accounting for Implementation Costs Incurred in a Cloud Computing Arrangement That Is a Service Contract
(“ASU 2018-15”), which clarifies the accounting for implementation costs in cloud computing arrangements. ASU 2018-15 is effective on January 1, 2020. Early adoption is permitted. The Company currently is evaluating the impact the adoption of ASU 2018-15 may have on its condensed consolidated financial statements.
Fair Value Measurement
In 2018, the FASB issued ASU 2018-13,
Fair Value Measurement (Topic 820): Disclosure Framework-Changes to the Disclosure Requirements for Fair Value Measurement
(“ASU 2018-13”), which modifies the disclosure requirements for fair value measurements. ASU 2018-13 is effective on January 1, 2020. Early adoption is permitted. The Company currently is evaluating the impact the adoption of ASU 2018-13 may have on its disclosures.
For a discussion of other recent accounting pronouncements please refer to Note A, “Nature of Business and Accounting Policies—Recent Accounting Pronouncements,” in the
2018
Annual Report on Form 10-K.
Summary of Significant Accounting Policies
The Company’s significant accounting policies are described in Note A, “Nature of Business and Accounting Policies,” in its
2018
Annual Report on Form 10-K. The Company is disclosing changes in its accounting policies related to guidance that became effective January 1,
2019
in this Quarterly Report on Form 10-Q. Specifically, the Company has included its policy pursuant to its adoption of ASC 842 below.
Leases
At the inception of an arrangement, the Company determines whether the arrangement contains a lease. If a lease is identified in an arrangement, the Company recognizes a right-of-use asset and liability on its balance sheet and determines whether the lease should be classified as a finance or operating lease. The Company does not recognize assets or liabilities for leases with lease terms of less than
12
months.
A lease qualifies as a finance lease if any of the following criteria are met at the inception of the lease: (i) there is a transfer of ownership of the leased asset to the Company by the end of the lease term, (ii) the Company holds an option to purchase the leased asset that it is reasonably certain to exercise, (iii) the lease term is for a major part of the remaining economic life of the leased asset, (iv) the present value of the sum of lease payments equals or exceeds substantially all of the fair value of the leased asset, or (v) the nature of the leased asset is specialized to the point that it is expected to provide the lessor no alternative use at the end of the lease term. All other leases are recorded as operating leases.
Finance and operating lease assets and liabilities are recognized at the lease commencement date based on the present value of the lease payments over the lease term using the discount rate implicit in the lease. If the rate implicit is not readily determinable, the Company utilizes its incremental borrowing rate at the lease commencement date. Operating lease assets are further adjusted for prepaid or accrued lease payments. Operating lease payments are expensed using the straight-line method as an operating expense over the lease term. Finance lease assets are amortized to depreciation expense using the straight-line method over the shorter of the useful life of the related asset or the lease term. Finance lease payments are bifurcated into (i) a portion that is recorded as imputed interest expense and (ii) a portion that reduces the finance liability associated with the lease.
The Company does not separate lease and non-lease components when determining which lease payments to include in the calculation of its lease assets and liabilities. Variable lease payments are expensed as incurred. If a lease includes an option to extend or terminate the lease, the Company reflects the option in the lease term if it is reasonably certain it will exercise the option.
9
VERTEX PHARMACEUTICALS INCORPORATED
Notes to Condensed Consolidated Financial Statements
(unaudited)
Finance leases are recorded in “
Property and equipment, net
,” “
Other current liabilities
” and “
Long-term finance lease liabilities
” on the Company’s condensed consolidated balance sheet. Operating leases are recorded in “
Operating lease assets
,” “
Other current liabilities
” and “
Long-term operating lease liabilities
” on the Company’s condensed consolidated balance sheet.
|
B.
|
Revenue Recognition
|
Disaggregation of Revenue
Revenues by Product
Product revenues, net consisted of the following:
|
Three Months Ended March 31,
|
|||||||
|
2019
|
2018
|
||||||
|
(in thousands)
|
|||||||
|
SYMDEKO/SYMKEVI
|
$
|
320,275
|
|
$
|
34,124
|
|
|
|
ORKAMBI
|
293,007
|
|
354,066
|
|
|||
|
KALYDECO
|
243,971
|
|
249,539
|
|
|||
|
Total product revenues, net
|
$
|
857,253
|
|
$
|
637,729
|
|
|
Revenues by Geographic Location
Net product revenues are attributed to countries based on the location of the customer. Collaborative and royalty revenues are attributed to countries based on the location of the Company’s subsidiary associated with the collaborative arrangement related to such revenues. Total revenues from external customers and collaborators by geographic region consisted of the following:
|
Three Months Ended March 31,
|
|||||||
|
2019
|
2018
|
||||||
|
(in thousands)
|
|||||||
|
United States
|
$
|
641,104
|
|
$
|
482,667
|
|
|
|
Outside of the United States
|
|||||||
|
Europe
|
167,751
|
|
131,895
|
|
|||
|
Other
|
49,580
|
|
26,237
|
|
|||
|
Total revenues outside of the United States
|
217,331
|
|
158,132
|
|
|||
|
Total revenues
|
$
|
858,435
|
|
$
|
640,799
|
|
|
In
the three months ended March 31, 2019
and
2018
, revenues attributable to Germany contributed the largest amount to the Company’s European revenues.
French Early Access Programs
In 2015, the Company began distributing ORKAMBI through early access programs in France and continues to be engaged in ongoing pricing discussions regarding the final price for ORKAMBI in France. The Company expects that the difference between the amounts it has collected to date based on the invoiced price and the final negotiated price for ORKAMBI in France will be returned to the French government.
Pursuant to the revenue recognition accounting guidance that was applicable until December 31, 2017, the Company’s ORKAMBI net product revenues for 2015, 2016 and 2017 did not include any net product revenues from sales of ORKAMBI in France because the price was not fixed and determinable at the time of delivery. Upon adopting ASU 2014-09,
Revenues from Contracts with Customers (Topic 606)
,
in the first quarter of 2018, the Company began recognizing net product revenues on a portion of its current period sales based on its estimate of consideration it expects to retain that will not be subject to a significant reversal in amounts recognized. If the Company’s estimate regarding the amounts it will receive for
10
VERTEX PHARMACEUTICALS INCORPORATED
Notes to Condensed Consolidated Financial Statements
(unaudited)
ORKAMBI supplied pursuant to these early access programs changes, the Company will reflect the effect of the change in estimate in “
Product revenues, net
” in the period in which the change in estimate occurs.
As of
March 31, 2019
and
December 31, 2018
, the Company’s condensed consolidated balance sheets included an “
Early access sales accrual
” of
$382.7 million
and
$354.4 million
, respectively, which was primarily related to the amount it may be required to return to the French government related to ORKAMBI early access programs, which is considered to be a refund liability.
Contract Liabilities
The Company recorded contract liabilities of
$51.4 million
and
$24.9 million
as of
March 31, 2019
and
December 31, 2018
, respectively, related to annual contracts with government-owned and supported customers in international markets that limit the amount of annual reimbursement the Company can receive. Upon exceeding the annual reimbursement amount, products are provided free of charge, which is a material right. These contracts, which are classified as “
Other current liabilities
,” include upfront payments and fees. The Company defers a portion of the consideration received for shipments made up to the annual reimbursement limit, and the deferred amount is recognized as revenue when the free products are shipped. The Company’s product revenue contracts include performance obligations that are one year or less.
Several of the Company’s contract liabilities relate to contracts with annual reimbursement limits in international markets in which the annual period associated with the contract is not the same as the Company’s fiscal year. In the majority of international markets in which the Company has a contract with an annual reimbursement limit, the annual period associated with the contract is the same as the Company’s fiscal year, resulting in no contract liability balance at the end of the year and no revenues recognized in the current year related to performance obligations satisfied in previous years. For the international markets in which the periods associated with these annual contracts are not the same as the Company’s fiscal year, the Company recognizes revenues related to performance obligations satisfied in previous years; however, these amounts are not material to the Company’s financial statements and do not relate to any performance obligations that were satisfied more than 12 months prior to the beginning of the current year.
|
C.
|
Collaborative Arrangements and Acquisitions
|
The Company has entered into numerous agreements pursuant to which it collaborates with third parties on research, development and commercialization programs, including in-license and out-license agreements and asset acquisitions.
In-license Agreements
The Company has entered into a number of license agreements in order to advance and obtain access to technologies and services related to its research and early-development activities. The Company is generally required to make an upfront payment upon execution of the license agreement; development, regulatory and commercialization milestones payments upon the achievement of certain product research, development and commercialization objectives; and royalty payments on future sales, if any, of commercial products resulting from the collaboration.
Pursuant to the terms of its in-license agreements, the Company’s collaborators lead the discovery efforts and the Company leads all preclinical, development and commercialization activities associated with the advancement of any drug candidates and funds all expenses unless otherwise described below.
The Company typically can terminate its in-license agreements by providing advance notice to its collaborators; the required length of notice is dependent on whether any product developed under the license agreement has received marketing approval. The Company’s license agreements may be terminated by either party for a material breach by the other, subject to notice and cure provisions. Unless earlier terminated, these license agreements generally remain in effect until the date on which the royalty term and all payment obligations with respect to all products in all countries have expired.
CRISPR Therapeutics AG
In 2015, the Company entered into a strategic collaboration, option and license agreement (the “CRISPR Agreement”) with CRISPR Therapeutics AG and its affiliates (“CRISPR”) to collaborate on the discovery and development of potential new treatments aimed at the underlying genetic causes of human diseases using CRISPR-Cas9 gene-editing technology. The
11
VERTEX PHARMACEUTICALS INCORPORATED
Notes to Condensed Consolidated Financial Statements
(unaudited)
Company has the exclusive right to license up to
six
CRISPR-Cas9-based targets, including targets for the potential treatment of sickle cell disease. In connection with the CRISPR Agreement, the Company made an upfront payment to CRISPR of
$75.0 million
and an investment in CRISPR’s stock. The Company has also made several subsequent investments in CRISPR’s common stock, which has resulted in CRISPR becoming a related party of the Company. Please refer to
Note F, “Marketable Securities and Equity Investments,”
for further information regarding the Company’s investment in CRISPR’s common stock.
The Company funds all the discovery activities conducted pursuant to the CRISPR Agreement. For targets that the Company elects to license, other than hemoglobinopathy treatments, the Company would lead all development and global commercialization activities. For each target that the Company elects to license, other than hemoglobinopathy targets, CRISPR has the potential to receive up to
$420.0 million
in development, regulatory and commercial milestones as well as royalties on net product sales. As part of the collaboration, the Company and CRISPR share equally all development costs and potential worldwide revenues related to potential hemoglobinopathy treatments, including treatments for beta thalassemia and sickle cell disease.
In 2017, the Company entered into a co-development and co-commercialization agreement with CRISPR pursuant to the terms of the CRISPR Agreement, under which the Company and CRISPR are co-developing and will co-commercialize CTX001 (the “CTX001 Co-Co Agreement”) for the treatment of hemoglobinopathy, including treatments for sickle cell disease and beta thalassemia. The Company concluded that the CTX001 Co-Co Agreement is a cost-sharing arrangement, which results in the net impact of the arrangement being recorded in “
Research and development expenses
” in its condensed consolidated statements of operations. During
the three months ended March 31, 2019
and
2018
, the net expense related to the CTX001 Co-Co Agreement was
$7.0 million
and
$3.6 million
, respectively.
Other In-license Agreements
In 2016, the Company entered into a strategic collaboration and licensing agreement with Moderna Therapeutics, Inc. (“Moderna”), pursuant to which the parties are seeking to identify and develop messenger ribonucleic acid, or mRNA, therapeutics for the treatment of CF. The Company made an upfront payment to Moderna of
$20.0 million
and an investment in Moderna’s preferred stock, which converted to common stock when Moderna became a publicly traded company in December 2018. Moderna has the potential to receive future development and regulatory milestones of up to
$275.0 million
, as well as royalties on net product sales. Please refer to
Note F, “Marketable Securities and Equity Investments,”
for further information regarding the Company’s investment in Moderna’s common stock.
In December 2018, the Company entered into a strategic collaboration and licensing agreement (the “Arbor Agreement”) with Arbor Biotechnologies, Inc. (“Arbor”) focused on the discovery of novel proteins, including DNA endonucleases, to advance the development of new gene-editing therapies. Pursuant to the Arbor Agreement, Arbor’s platform technology is being applied in the collaboration activities for up to five Vertex disease areas in exchange for an upfront payment of
$30.0 million
. In addition, the Company received a convertible promissory note that matures in 2023 for an additional
$15.0 million
payment. For each product identified by the collaboration, Arbor has the potential to receive up to
$337.5 million
in development, regulatory and commercial milestones as well as royalties on net product sales.
The Company determined that the fair value of the convertible promissory note approximated its contractual value upon agreement execution and classifies the convertible note in “
Other assets
” at amortized cost. The Company determined that substantially all of the fair value of the Arbor Agreement was attributable to an in-process research and development asset and no substantive processes were acquired that would constitute a business. The Company concluded that it did not have any alternative future use for the acquired in-process research and development asset and recorded the
$30.0 million
upfront payment to “
Research and development expenses
.”
In 2015, the Company entered into a strategic collaboration and license agreement with Parion Sciences, Inc. (“Parion”) focused on the development of investigational epithelial sodium channel (“ENaC”) inhibitors for the potential treatment of CF and all other pulmonary diseases. Parion received a
$5.0 million
milestone that was recorded as “
Research and development expenses
” in
the three months ended March 31, 2019
and has the potential to receive additional development and regulatory milestones related to the ENaC inhibitors.
12
VERTEX PHARMACEUTICALS INCORPORATED
Notes to Condensed Consolidated Financial Statements
(unaudited)
Variable Interest Entities (VIEs)
The Company has licensed rights to certain drug candidates from these third-party collaborators, which has resulted in the consolidation of certain third-parties’ financial statements into the Company’s condensed consolidated financial statements as VIEs for certain periods of time. As of December 31, 2018, and continuing through the first quarter of 2019, the Company had no consolidated VIEs reflected in its financial statements.
BioAxone Biosciences, Inc.
In 2014, the Company entered into a license and collaboration agreement (the “BioAxone Agreement”) with BioAxone, which resulted in the consolidation of BioAxone as a VIE beginning in October 2014. The Company made an initial payment to BioAxone of
$10.0 million
in 2014.
In
the three months ended March 31, 2018
, the Company recorded net income attributable to noncontrolling interest of
$17.0 million
, which was primarily related to a
$24.0 million
increase in the fair value of the contingent payments payable by Vertex to BioAxone due to (i) the expiration of an option held by the Company to purchase BioAxone in the first quarter of 2018 that increased the probability of a
$10.0 million
license continuation fee for VX-210 (which was ultimately paid in the first quarter of 2018) and (ii) the probability that additional milestone and royalty payments related to the BioAxone Agreement would be paid. Net income attributable to noncontrolling interest also included a
$6.4 million
benefit from income taxes during
the three months ended March 31, 2018
that was primarily related to the increase in the fair value of the contingent payments.
In October 2018, the Company announced it would stop clinical development of VX-210 and terminate the Phase 2b clinical trial of VX-210 based on the recommendation of the clinical trial’s Data Safety Monitoring Board and the Company’s review of interim data from the clinical trial. In December 2018, the Company notified BioAxone of its intent to terminate the BioAxone Agreement and executed a release that immediately allowed BioAxone to control development of its neurological programs other than VX-210 without the Company’s consent. As a result, the Company deconsolidated BioAxone as of December 31, 2018 because it determined that it no longer was the primary beneficiary of BioAxone as it no longer had the power to direct the significant activities of BioAxone. The net impact of the deconsolidation was not material to the Company’s condensed consolidated statement of operations.
Asset Acquisition
Concert Pharmaceuticals
In 2017, the Company acquired certain CF assets including VX-561 (the “Concert Assets”) from Concert Pharmaceuticals Inc. (“Concert”) pursuant to an asset purchase agreement (the “Concert Agreement”). VX-561 is an investigational CFTR potentiator that has the potential to be used as part of combination regimens of CFTR modulators to treat CF. Pursuant to the Concert Agreement, Vertex paid Concert
$160.0 million
in cash for the Concert Assets, which was recorded to “
Research and development expenses
” in 2017. If VX-561 is approved as part of a combination regimen to treat CF, Concert could receive up to an additional
$90.0 million
in milestones based on regulatory approval in the United States and reimbursement in the United Kingdom, Germany or France.
Out-license agreements
The Company has entered into licensing agreements pursuant to which it has out-licensed rights to certain drug candidates to third-party collaborators. Pursuant to these out-license agreements, the Company’s collaborators become responsible for all costs related to the continued development of such drug candidates and obtain development and commercialization rights to these drug candidates. Depending on the terms of the agreements, the Company’s collaborators may be required to make upfront payments, milestone payments upon the achievement of certain product research and development objectives and may also be required to pay royalties on future sales, if any, of commercial products resulting from the collaboration. The termination provisions associated with these collaborations are generally the same as those described above related to the Company’s in-license agreements.
13
VERTEX PHARMACEUTICALS INCORPORATED
Notes to Condensed Consolidated Financial Statements
(unaudited)
Merck KGaA, Darmstadt, Germany
In January 2017, the Company entered into a strategic collaboration and license agreement (the “Oncology Agreement”) with Merck KGaA, Darmstadt, Germany (the “Licensee”). Pursuant to the Oncology Agreement, the Company granted the Licensee an exclusive worldwide license to research, develop and commercialize
four
oncology research and development programs including
two
clinical-stage programs targeting DNA damage repair: its ataxia telangiectasia and Rad3-related protein kinase inhibitor program, or ATR program, including VX-970 and VX-803, and its DNA-dependent protein kinase inhibitor program, or DNA-PK program, including VX-984. In addition, the Company granted the Licensee exclusive, worldwide rights to
two
pre-clinical programs. The Company recorded the
$230.0 million
upfront payment related to the Oncology Agreement as “
Collaborative and royalty revenues
” upon delivery of the license in 2017. The Company’s activities related to the Oncology Agreement were substantially complete in 2017.
In December 2018, the Company entered into an agreement with Merck KGaA, Darmstadt, Germany (the “DNA-PK Agreement”) whereby the Company licensed the two lead Vertex DNA-PK compounds from its DNA-PK program for use in the field of gene integration for six specific indications. In exchange for this exclusive worldwide license to research, develop and commercialize the DNA-PK program for the specified indications within the field of gene integration, the Company made an upfront payment of
$65.0 million
. Merck KGaA, Darmstadt, Germany has the potential to receive additional milestones, primarily related to approval and reimbursement in various markets, as well as royalties on net product sales.
The Company evaluated the DNA-PK Agreement and concluded it represents a modification of the Oncology Agreement pursuant to ASC 606. As of December 2018, when the Company entered into the DNA-PK Agreement, the Company had completed its obligations under the Oncology Agreement, but the Oncology Agreement was an open contract pursuant to ASC 606 since the Company could receive future royalty payments from the commercialization of the licensed programs under the Oncology Agreement.
In applying ASC 606, the Company determined that the license granted under the DNA-PK Agreement is distinct from the license granted by the Company under the Oncology Agreement since the license to the two lead Vertex DNA-PK compounds is capable of being distinct as the Company is able to benefit from the license via its ability to internally develop and commercialize the two lead Vertex DNA-PK compounds in the six named indications in the field of gene-editing, and the license is not dependent on Merck KGaA, Darmstadt, Germany providing any specialized services to the Company. In addition, the license to the two lead Vertex DNA-PK compounds granted to the Company under the DNA-PK Agreement is distinct from the license granted by the Company under the Oncology Agreement as the rights conveyed in the licenses differ and both parties have the ability to commercially benefit from the licenses on their own. Furthermore, the consideration attributable to the license of the two lead Vertex DNA-PK compounds represents fair value. Therefore, the Company determined it should account for the DNA-PK Agreement as a separate agreement.
The Company determined that substantially all of the fair value of the DNA-PK Agreement was attributable to a single in-process research and development asset that did not constitute a business. The Company concluded that it did not have any alternative future use for the acquired in-process research and development asset and recorded the
$65.0 million
payment to “
Research and development expenses
” accordingly.
Janssen Pharmaceuticals, Inc.
In 2014, the Company entered into an agreement with Janssen Pharmaceuticals, Inc. (“Janssen”). Pursuant to the agreement, Janssen has an exclusive worldwide license to develop and commercialize certain drug candidates for the treatment of influenza, including pimodivir. The Company has received upfront and milestone payments of
$60.0 million
from Janssen to date. The most recent milestone was earned based on Janssen’s initiation of a Phase 3 clinical trial in 2017.
Cystic Fibrosis Foundation
The Company has a research, development and commercialization agreement that was originally entered into in 2004 with Cystic Fibrosis Foundation (“CFF”), as successor in interest to the Cystic Fibrosis Foundation Therapeutics, Inc. This agreement was most recently amended in 2016 (the “2016 Amendment”). Pursuant to the agreement, as amended, the Company agreed to pay royalties ranging from low-single digits to mid-single digits on potential sales of certain compounds
14
VERTEX PHARMACEUTICALS INCORPORATED
Notes to Condensed Consolidated Financial Statements
(unaudited)
first synthesized and/or tested between March 1, 2014 and August 31, 2016, including VX-659 and VX-445, and tiered royalties ranging from single digits to sub-teens on any approved drugs first synthesized and/or tested during a research term on or before February 28, 2014, including KALYDECO (ivacaftor), ORKAMBI (lumacaftor in combination with ivacaftor) and SYMDEKO/SYMKEVI (tezacaftor in combination with ivacaftor). For combination products, such as ORKAMBI and SYMDEKO, sales are allocated equally to each of the active pharmaceutical ingredients in the combination product. There are
no
remaining commercial milestone payments payable by the Company to CFF pursuant to the agreement.
Pursuant to the 2016 Amendment, the Company received an upfront payment of
$75.0 million
and is receiving development funding from CFF of up to
$6.0 million
annually. The Company concluded that the upfront payment plus any future development funding represent a form of financing pursuant to ASC 730 and thus records the amounts as a liability on the condensed consolidated balance sheet, primarily reflected in “
Long-term advance from collaborator
.” The Company reduces this liability over the estimated royalty term of the agreement and reflects the reductions as an offset to “
Cost of sales
” and as “
Interest expense
.”
The Company has royalty obligations to CFF for ivacaftor, lumacaftor and tezacaftor until the expiration of patents covering those compounds. The Company has patents in the United States and European Union covering the composition-of-matter of ivacaftor that expire in 2027 and 2025, respectively, subject to potential patent extension. The Company has patents in the United States and European Union covering the composition-of-matter of lumacaftor that expire in 2030 and 2026, respectively, subject to potential extension. The Company has patents in the United States and European Union covering the composition-of-matter of tezacaftor that expire in 2027 and 2028, respectively, subject to potential extension.
|
D.
|
Earnings Per Share
|
Basic net income per share attributable to Vertex common shareholders is based upon the weighted-average number of common shares outstanding during the period, excluding restricted stock, restricted stock units and performance-based restricted stock units, or “PSUs,” that have been issued but are not yet vested. Diluted net income per share attributable to Vertex common shareholders is based upon the weighted-average number of common shares outstanding during the period plus additional weighted-average common equivalent shares outstanding during the period when the effect is dilutive.
15
VERTEX PHARMACEUTICALS INCORPORATED
Notes to Condensed Consolidated Financial Statements
(unaudited)
The following table sets forth the computation of basic and diluted net income per share for the periods ended:
|
Three Months Ended March 31,
|
|||||||
|
2019
|
2018
|
||||||
|
(in thousands, except per share amounts)
|
|||||||
|
Basic net income attributable to Vertex per common share calculation:
|
|||||||
|
Net income attributable to Vertex common shareholders
|
$
|
268,631
|
|
$
|
210,263
|
|
|
|
Less: Undistributed earnings allocated to participating securities
|
—
|
|
(99
|
)
|
|||
|
Net income attributable to Vertex common shareholders—basic
|
$
|
268,631
|
|
$
|
210,164
|
|
|
|
Basic weighted-average common shares outstanding
|
255,695
|
|
253,231
|
|
|||
|
Basic net income attributable to Vertex per common share
|
$
|
1.05
|
|
$
|
0.83
|
|
|
|
Diluted net income attributable to Vertex per common share calculation:
|
|||||||
|
Net income attributable to Vertex common shareholders
|
$
|
268,631
|
|
$
|
210,263
|
|
|
|
Less: Undistributed earnings allocated to participating securities
|
—
|
|
(97
|
)
|
|||
|
Net income attributable to Vertex common shareholders—diluted
|
$
|
268,631
|
|
$
|
210,166
|
|
|
|
Weighted-average shares used to compute basic net income per common share
|
255,695
|
|
253,231
|
|
|||
|
Effect of potentially dilutive securities:
|
|||||||
|
Stock options
|
2,585
|
|
3,248
|
|
|||
|
Restricted stock and restricted stock units (including PSUs)
|
1,870
|
|
2,013
|
|
|||
|
Employee stock purchase program
|
25
|
|
34
|
|
|||
|
Weighted-average shares used to compute diluted net income per common share
|
260,175
|
|
258,526
|
|
|||
|
Diluted net income attributable to Vertex per common share
|
$
|
1.03
|
|
$
|
0.81
|
|
|
The Company did not include the securities in the following table in the computation of the net income per share attributable to Vertex common shareholders calculations because the effect would have been anti-dilutive during each period:
|
Three Months Ended March 31,
|
|||||
|
2019
|
2018
|
||||
|
(in thousands)
|
|||||
|
Stock options
|
2,837
|
|
1,633
|
|
|
|
Unvested restricted stock and restricted stock units (including PSUs)
|
6
|
|
4
|
|
|
|
E.
|
Fair Value Measurements
|
The fair value of the Company’s financial assets and liabilities reflects the Company’s estimate of amounts that it would have received in connection with the sale of the assets or paid in connection with the transfer of the liabilities in an orderly transaction between market participants at the measurement date. In connection with measuring the fair value of its assets and liabilities, the Company seeks to maximize the use of observable inputs (market data obtained from sources independent from the Company) and to minimize the use of unobservable inputs (the Company’s assumptions about how market participants would price assets and liabilities). The following fair value hierarchy is used to classify assets and liabilities based on the observable inputs and unobservable inputs used in order to value the assets and liabilities:
16
VERTEX PHARMACEUTICALS INCORPORATED
Notes to Condensed Consolidated Financial Statements
(unaudited)
|
Level 1:
|
Quoted prices in active markets for identical assets or liabilities. An active market for an asset or liability is a market in which transactions for the asset or liability occur with sufficient frequency and volume to provide pricing information on an ongoing basis.
|
|
Level 2:
|
Observable inputs other than Level 1 inputs. Examples of Level 2 inputs include quoted prices in active markets for similar assets or liabilities and quoted prices for identical assets or liabilities in markets that are not active.
|
|
Level 3:
|
Unobservable inputs based on the Company’s assessment of the assumptions that market participants would use in pricing the asset or liability.
|
The Company’s investment strategy is focused on capital preservation. The Company invests in instruments that meet the credit quality standards outlined in the Company’s investment policy. This policy also limits the amount of credit exposure to any one issue or type of instrument. The Company maintains strategic investments separately from the investment policy that governs its other cash, cash equivalents and marketable securities as described in “
Note F, “Marketable Securities and Equity Investments.”
As of
March 31, 2019
, the Company’s investments were in money market funds, U.S. Treasury securities, government-sponsored enterprise securities, corporate debt securities, commercial paper and corporate equity securities. Additionally, the Company utilizes foreign currency forward contracts intended to mitigate the effect of changes in foreign exchange rates on its condensed consolidated statement of operations.
As of
March 31, 2019
, all of the Company’s financial assets and liabilities that were subject to fair value measurements were valued using observable inputs. The Company’s financial assets valued based on Level 1 inputs consisted of money market funds, U.S. Treasury securities, government-sponsored enterprise securities and corporate equity securities. The Company’s financial assets and liabilities valued based on Level 2 inputs consisted of certain corporate equity securities as described below, corporate debt securities, commercial paper, which consisted of investments in highly-rated investment-grade corporations, and foreign currency forward contracts with reputable and creditworthy counterparties. In 2018, Moderna became a publicly traded company. The Company has valued its investment in Moderna based on Level 2 inputs due to transfer restrictions subsequent to Moderna’s initial public offering lasting until December 2019. The reduction in fair value recorded on the Company’s condensed consolidated balance sheet related to this transfer restriction is not material to its financial statements. During
the three months ended March 31, 2019
and
2018
, the Company did not record any other-than-temporary impairment charges related to its financial assets.
17
VERTEX PHARMACEUTICALS INCORPORATED
Notes to Condensed Consolidated Financial Statements
(unaudited)
The following table sets forth the Company’s financial assets and liabilities subject to fair value measurements (and does not include
$1.5 billion
and $
1.4 billion
of cash as of
March 31, 2019
and
December 31, 2018
, respectively):
|
Fair Value Measurements as of March 31, 2019
|
|||||||||||||||
|
Fair Value Hierarchy
|
|||||||||||||||
|
Total
|
Level 1
|
Level 2
|
Level 3
|
||||||||||||
|
(in thousands)
|
|||||||||||||||
|
Financial instruments carried at fair value (asset positions):
|
|||||||||||||||
|
Cash equivalents:
|
|||||||||||||||
|
Money market funds
|
$
|
1,354,656
|
|
$
|
1,354,656
|
|
$
|
—
|
|
$
|
—
|
|
|||
|
U.S. Treasury securities
|
5,996
|
|
5,996
|
|
—
|
|
—
|
|
|||||||
|
Government-sponsored enterprise securities
|
11,786
|
|
11,786
|
|
—
|
|
—
|
|
|||||||
|
Corporate debt securities
|
4,519
|
|
—
|
|
4,519
|
|
—
|
|
|||||||
|
Commercial paper
|
35,955
|
|
—
|
|
35,955
|
|
—
|
|
|||||||
|
Marketable securities:
|
|||||||||||||||
|
Corporate equity securities
|
210,874
|
|
192,207
|
|
18,667
|
|
—
|
|
|||||||
|
Government-sponsored enterprise securities
|
15,181
|
|
15,181
|
|
—
|
|
—
|
|
|||||||
|
Corporate debt securities
|
231,572
|
|
—
|
|
231,572
|
|
—
|
|
|||||||
|
Commercial paper
|
126,523
|
|
—
|
|
126,523
|
|
—
|
|
|||||||
|
Prepaid expenses and other current assets:
|
|||||||||||||||
|
Foreign currency forward contracts
|
19,210
|
|
—
|
|
19,210
|
|
—
|
|
|||||||
|
Other assets:
|
|||||||||||||||
|
Foreign currency forward contracts
|
973
|
|
—
|
|
973
|
|
—
|
|
|||||||
|
Total financial assets
|
$
|
2,017,245
|
|
|
$
|
1,579,826
|
|
$
|
437,419
|
|
$
|
—
|
|
||
|
Financial instruments carried at fair value (liability positions):
|
|||||||||||||||
|
Other current liabilities:
|
|||||||||||||||
|
Foreign currency forward contracts
|
$
|
(310
|
)
|
$
|
—
|
|
$
|
(310
|
)
|
$
|
—
|
|
|||
|
Other long-term liabilities:
|
|||||||||||||||
|
Foreign currency forward contracts
|
(68
|
)
|
—
|
|
(68
|
)
|
—
|
|
|||||||
|
Total financial liabilities
|
$
|
(378
|
)
|
$
|
—
|
|
$
|
(378
|
)
|
$
|
—
|
|
|||
18
VERTEX PHARMACEUTICALS INCORPORATED
Notes to Condensed Consolidated Financial Statements
(unaudited)
|
Fair Value Measurements as of December 31, 2018
|
|||||||||||||||
|
Fair Value Hierarchy
|
|||||||||||||||
|
Total
|
Level 1
|
Level 2
|
Level 3
|
||||||||||||
|
(in thousands)
|
|||||||||||||||
|
Financial instruments carried at fair value (asset positions):
|
|||||||||||||||
|
Cash equivalents:
|
|||||||||||||||
|
Money market funds
|
$
|
1,226,603
|
|
$
|
1,226,603
|
|
$
|
—
|
|
$
|
—
|
|
|||
|
U.S. Treasury securities
|
5,966
|
|
5,966
|
|
—
|
|
—
|
|
|||||||
|
Government-sponsored enterprise securities
|
7,123
|
|
7,123
|
|
—
|
|
—
|
|
|||||||
|
Commercial paper
|
58,268
|
|
—
|
|
58,268
|
|
—
|
|
|||||||
|
Marketable securities:
|
|||||||||||||||
|
Corporate equity securities
|
167,323
|
|
153,733
|
|
13,590
|
|
—
|
|
|||||||
|
U.S. Treasury securities
|
6,026
|
|
6,026
|
|
—
|
|
—
|
|
|||||||
|
Government-sponsored enterprise securities
|
10,704
|
|
10,704
|
|
—
|
|
—
|
|
|||||||
|
Corporate debt securities
|
233,665
|
|
—
|
|
233,665
|
|
—
|
|
|||||||
|
Commercial paper
|
100,390
|
|
—
|
|
100,390
|
|
—
|
|
|||||||
|
Prepaid expenses and other current assets:
|
|||||||||||||||
|
Foreign currency forward contracts
|
19,023
|
|
—
|
|
19,023
|
|
—
|
|
|||||||
|
Other assets:
|
|||||||||||||||
|
Foreign currency forward contracts
|
1,514
|
|
—
|
|
1,514
|
|
—
|
|
|||||||
|
Total financial assets
|
$
|
1,836,605
|
|
$
|
1,410,155
|
|
$
|
426,450
|
|
$
|
—
|
|
|||
|
Financial instruments carried at fair value (liability positions):
|
|||||||||||||||
|
Other current liabilities:
|
|||||||||||||||
|
Foreign currency forward contracts
|
$
|
(340
|
)
|
$
|
—
|
|
$
|
(340
|
)
|
$
|
—
|
|
|||
|
Other long-term liabilities:
|
|||||||||||||||
|
Foreign currency forward contracts
|
(108
|
)
|
—
|
|
(108
|
)
|
—
|
|
|||||||
|
Total financial liabilities
|
$
|
(448
|
)
|
$
|
—
|
|
$
|
(448
|
)
|
$
|
—
|
|
|||
Please refer to
Note F, “Marketable Securities and Equity Investments,”
for the carrying amount and related unrealized gains (losses) by type of investment.
19
VERTEX PHARMACEUTICALS INCORPORATED
Notes to Condensed Consolidated Financial Statements
(unaudited)
|
F.
|
Marketable Securities and Equity Investments
|
A summary of the Company’s cash equivalents and marketable securities, which are recorded at fair value (and do not include
$1.5 billion
and $
1.4 billion
of cash as of
March 31, 2019
and
December 31, 2018
, respectively), is shown below:
|
Amortized Cost
|
Gross
Unrealized Gains |
Gross
Unrealized Losses |
Fair Value
|
||||||||||||
|
(in thousands)
|
|||||||||||||||
|
As of March 31, 2019
|
|||||||||||||||
|
Cash equivalents:
|
|||||||||||||||
|
Money market funds
|
$
|
1,354,656
|
|
$
|
—
|
|
$
|
—
|
|
$
|
1,354,656
|
|
|||
|
U.S. Treasury securities
|
5,996
|
|
—
|
|
—
|
|
5,996
|
|
|||||||
|
Government-sponsored enterprise securities
|
11,787
|
|
—
|
|
(1
|
)
|
11,786
|
|
|||||||
|
Corporate debt securities
|
4,519
|
|
—
|
|
—
|
|
4,519
|
|
|||||||
|
Commercial paper
|
35,959
|
|
—
|
|
(4
|
)
|
35,955
|
|
|||||||
|
Total cash equivalents
|
1,412,917
|
|
—
|
|
(5
|
)
|
1,412,912
|
|
|||||||
|
Marketable securities:
|
|||||||||||||||
|
Government-sponsored enterprise securities
|
15,180
|
|
2
|
|
(1
|
)
|
15,181
|
|
|||||||
|
Corporate debt securities
|
231,516
|
|
88
|
|
(32
|
)
|
231,572
|
|
|||||||
|
Commercial paper
|
126,515
|
|
34
|
|
(26
|
)
|
126,523
|
|
|||||||
|
Total marketable debt securities
|
373,211
|
|
124
|
|
(59
|
)
|
373,276
|
|
|||||||
|
Corporate equity securities
|
133,157
|
|
79,093
|
|
(1,376
|
)
|
210,874
|
|
|||||||
|
Total marketable securities
|
$
|
506,368
|
|
$
|
79,217
|
|
$
|
(1,435
|
)
|
$
|
584,150
|
|
|||
|
As of December 31, 2018
|
|||||||||||||||
|
Cash equivalents:
|
|||||||||||||||
|
Money market funds
|
$
|
1,226,603
|
|
$
|
—
|
|
$
|
—
|
|
$
|
1,226,603
|
|
|||
|
U.S. Treasury securities
|
5,967
|
|
—
|
|
(1
|
)
|
5,966
|
|
|||||||
|
Government-sponsored enterprise securities
|
7,124
|
|
—
|
|
(1
|
)
|
7,123
|
|
|||||||
|
Commercial paper
|
58,271
|
|
—
|
|
(3
|
)
|
58,268
|
|
|||||||
|
Total cash equivalents
|
1,297,965
|
|
—
|
|
(5
|
)
|
1,297,960
|
|
|||||||
|
Marketable securities:
|
|||||||||||||||
|
U.S. Treasury securities
|
6,026
|
|
—
|
|
—
|
|
6,026
|
|
|||||||
|
Government-sponsored enterprise securities
|
10,704
|
|
—
|
|
—
|
|
10,704
|
|
|||||||
|
Corporate debt securities
|
234,088
|
|
|
27
|
|
(450
|
)
|
233,665
|
|
||||||
|
Commercial paper
|
100,498
|
|
—
|
|
(108
|
)
|
100,390
|
|
|||||||
|
Total marketable debt securities
|
351,316
|
|
27
|
|
(558
|
)
|
350,785
|
|
|||||||
|
Corporate equity securities
|
133,157
|
|
40,619
|
|
(6,453
|
)
|
167,323
|
|
|||||||
|
Total marketable securities
|
$
|
484,473
|
|
$
|
40,646
|
|
$
|
(7,011
|
)
|
$
|
518,108
|
|
|||
Available-for-sale debt securities were recorded in the Company's condensed consolidated balance sheets at fair value as follows:
|
As of March 31, 2019
|
As of December 31, 2018
|
||||||
|
(in thousands)
|
|||||||
|
Cash and cash equivalents
|
$
|
1,412,912
|
|
$
|
1,297,960
|
|
|
|
Marketable securities
|
373,276
|
|
350,785
|
|
|||
|
Total
|
$
|
1,786,188
|
|
$
|
1,648,745
|
|
|
20
VERTEX PHARMACEUTICALS INCORPORATED
Notes to Condensed Consolidated Financial Statements
(unaudited)
Available-for-sale debt securities by contractual maturity were as follows:
|
As of March 31, 2019
|
As of December 31, 2018
|
||||||
|
(in thousands)
|
|||||||
|
Matures within one year
|
$
|
1,775,571
|
|
$
|
1,647,500
|
|
|
|
Matures after one year through five years
|
10,617
|
|
1,245
|
|
|||
|
Total
|
$
|
1,786,188
|
|
$
|
1,648,745
|
|
|
The Company has a limited number of available-for-sale debt securities in insignificant loss positions as of
March 31, 2019
, which it does not intend to sell and has concluded it will not be required to sell before recovery of the amortized costs for the investments at maturity. The Company did
no
t record any charges for other-than-temporary declines in the fair value of available-for-sale debt securities or gross realized gains or losses in
the three months ended March 31, 2019
and
2018
.
The Company maintains strategic investments separately from the investment policy that governs its other cash, cash equivalents and marketable securities. The Company’s investments in the common stock of publicly traded companies, CRISPR and Moderna as of
March 31, 2019
and
December 31, 2018
, respectively, have readily determinable fair values and are recorded in “
Marketable securities
” on its condensed consolidated balance sheets. As of
March 31, 2019
and
December 31, 2018
, the total fair value of the Company’s strategic investments in the common stock of publicly traded companies, was
$210.9 million
and
$167.3 million
, respectively. During
the three months ended March 31, 2019
and
2018
, the Company recorded unrealized gains of
$43.6 million
and
$95.5 million
, respectively, primarily related to increases in the fair value of its investment in CRISPR.
As of
March 31, 2019
, the carrying value of the Company’s equity investments without readily determinable fair values, which are recorded in “
Other assets
” on its condensed consolidated balance sheets, was
$13.6 million
.
|
G.
|
Accumulated Other Comprehensive Income (Loss)
|
The following table summarizes the changes in accumulated other comprehensive (loss) income by component:
|
Unrealized Holding Gains (Losses), Net of Tax
|
|||||||||||||||
|
Foreign Currency Translation Adjustment
|
On Available-For-Sale Debt Securities
|
On Foreign Currency Forward Contracts
|
Total
|
||||||||||||
|
(in thousands)
|
|||||||||||||||
|
Balance at December 31, 2018
|
$
|
(11,227
|
)
|
$
|
(536
|
)
|
$
|
12,422
|
|
$
|
659
|
|
|||
|
Other comprehensive income before reclassifications
|
4,967
|
|
596
|
|
5,126
|
|
10,689
|
|
|||||||
|
Amounts reclassified from accumulated other comprehensive income
|
—
|
|
—
|
|
(5,348
|
)
|
(5,348
|
)
|
|||||||
|
Net current period other comprehensive income (loss)
|
4,967
|
|
596
|
|
(222
|
)
|
5,341
|
|
|||||||
|
Balance at March 31, 2019
|
$
|
(6,260
|
)
|
$
|
60
|
|
$
|
12,200
|
|
$
|
6,000
|
|
|||
21
VERTEX PHARMACEUTICALS INCORPORATED
Notes to Condensed Consolidated Financial Statements
(unaudited)
|
Unrealized Holding Gains (Losses), Net of Tax
|
|||||||||||||||||||
|
Foreign Currency Translation Adjustment
|
On Available-For-Sale Debt Securities
|
On Equity Securities
|
On Foreign Currency Forward Contracts
|
Total
|
|||||||||||||||
|
(in thousands)
|
|||||||||||||||||||
|
Balance at December 31, 2017
|
$
|
(21,031
|
)
|
$
|
(594
|
)
|
$
|
25,069
|
|
$
|
(15,016
|
)
|
$
|
(11,572
|
)
|
||||
|
Other comprehensive loss before reclassifications
|
(2,729
|
)
|
(460
|
)
|
—
|
|
(7,639
|
)
|
(10,828
|
)
|
|||||||||
|
Amounts reclassified from accumulated other comprehensive income (loss)
|
—
|
|
—
|
|
—
|
|
6,777
|
|
6,777
|
|
|||||||||
|
Net current period other comprehensive loss
|
(2,729
|
)
|
(460
|
)
|
—
|
|
(862
|
)
|
(4,051
|
)
|
|||||||||
|
Amounts reclassified to accumulated deficit pursuant to adoption of new accounting standard
|
949
|
|
—
|
|
(25,069
|
)
|
—
|
|
(24,120
|
)
|
|||||||||
|
Balance at March 31, 2018
|
$
|
(22,811
|
)
|
$
|
(1,054
|
)
|
$
|
—
|
|
$
|
(15,878
|
)
|
$
|
(39,743
|
)
|
||||
|
H.
|
Hedging
|
Foreign currency forward contracts - Designated as hedging instruments
The Company maintains a hedging program intended to mitigate the effect of changes in foreign exchange rates for a portion of the Company’s forecasted product revenues denominated in certain foreign currencies. The program includes foreign currency forward contracts that are designated as cash flow hedges under GAAP having contractual durations from
one
to
eighteen
months. The Company recognizes realized gains and losses for the effective portion of such contracts in “
Product revenues, net
” in its condensed consolidated statements of operations in the same period that it recognizes the product revenues that were impacted by the hedged foreign exchange rate changes.
The Company formally documents the relationship between foreign currency forward contracts (hedging instruments) and forecasted product revenues (hedged items), as well as the Company’s risk management objective and strategy for undertaking various hedging activities, which includes matching all foreign currency forward contracts that are designated as cash flow hedges to forecasted transactions. The Company also formally assesses, both at the hedge’s inception and on an ongoing basis, whether the foreign currency forward contracts are highly effective in offsetting changes in cash flows of hedged items. If the Company were to determine that a (i) foreign currency forward contract is not highly effective as a cash flow hedge, (ii) foreign currency forward contract has ceased to be a highly effective hedge or (iii) forecasted transaction is no longer probable of occurring, the Company would discontinue hedge accounting treatment prospectively. The Company measures effectiveness based on the change in fair value of the forward contracts and the fair value of the hypothetical foreign currency forward contracts with terms that match the critical terms of the risk being hedged. As of
March 31, 2019
, all hedges were determined to be highly effective.
The Company considers the impact of its counterparties’ credit risk on the fair value of the foreign currency forward contracts. As of
March 31, 2019
and
December 31, 2018
, credit risk did not change the fair value of the Company’s foreign currency forward contracts.
22
VERTEX PHARMACEUTICALS INCORPORATED
Notes to Condensed Consolidated Financial Statements
(unaudited)
The following table summarizes the notional amount of the Company’s outstanding foreign currency forward contracts designated as cash flow hedges under GAAP:
|
As of March 31, 2019
|
As of December 31, 2018
|
||||||
|
Foreign Currency
|
(in thousands)
|
||||||
|
Euro
|
$
|
373,264
|
|
$
|
335,179
|
|
|
|
British pound sterling
|
76,685
|
|
73,460
|
|
|||
|
Australian dollar
|
70,889
|
|
52,820
|
|
|||
|
Canadian dollar
|
40,089
|
|
43,759
|
|
|||
|
Total foreign currency forward contracts
|
$
|
560,927
|
|
$
|
505,218
|
|
|
Foreign currency forward contracts - Not designated as hedging instruments
The Company also enters into foreign currency forward contracts with contractual maturities of less than
one
month, which are designed to mitigate the effect of changes in foreign exchange rates on monetary assets and liabilities, including intercompany balances. These contracts are not designated as hedging instruments under GAAP. The Company recognizes realized gains and losses for such contracts in “
Other income, net
” in its condensed consolidated statements of operations each period. As of
March 31, 2019
, the notional amount of the Company’s outstanding foreign currency forward contracts where hedge accounting under GAAP is not applied was
$220.9 million
.
During
the three months ended March 31, 2019
and
2018
, the Company recognized the following related to foreign currency forward contacts in its condensed consolidated statements of operations:
|
Three Months Ended March 31,
|
|||||||
|
2019
|
2018
|
||||||
|
(in thousands)
|
|||||||
|
Designated as hedging instruments - Reclassified from AOCI
|
|||||||
|
Product revenues, net
|
$
|
6,839
|
|
$
|
(6,485
|
)
|
|
|
Not designated as hedging instruments
|
|||||||
|
Other income, net
|
$
|
3,151
|
|
$
|
1,539
|
|
|
The following table summarizes the fair value of the Company’s outstanding foreign currency forward contracts designated as cash flow hedges under GAAP included on its condensed consolidated balance sheets:
|
As of March 31, 2019
|
||||||||||
|
Assets
|
Liabilities
|
|||||||||
|
Classification
|
Fair Value
|
Classification
|
Fair Value
|
|||||||
|
(in thousands)
|
||||||||||
|
Prepaid expenses and other current assets
|
$
|
19,210
|
|
Other current liabilities
|
$
|
(310
|
)
|
|||
|
Other assets
|
973
|
|
Other long-term liabilities
|
(68
|
)
|
|||||
|
Total assets
|
$
|
20,183
|
|
Total liabilities
|
$
|
(378
|
)
|
|||
|
As of December 31, 2018
|
||||||||||
|
Assets
|
Liabilities
|
|||||||||
|
Classification
|
Fair Value
|
Classification
|
Fair Value
|
|||||||
|
(in thousands)
|
||||||||||
|
Prepaid expenses and other current assets
|
$
|
19,023
|
|
Other current liabilities
|
$
|
(340
|
)
|
|||
|
Other assets
|
1,514
|
|
Other long-term liabilities
|
(108
|
)
|
|||||
|
Total assets
|
$
|
20,537
|
|
Total liabilities
|
$
|
(448
|
)
|
|||
23
VERTEX PHARMACEUTICALS INCORPORATED
Notes to Condensed Consolidated Financial Statements
(unaudited)
As of
March 31, 2019
, the Company expects amounts that are related to foreign exchange forward contracts designated as cash flow hedges under GAAP recorded in “
Prepaid expenses and other current assets
” and “
Other current liabilities
” to be reclassified to earnings within twelve months.
The following table summarizes the potential effect of offsetting derivatives by type of financial instrument designated as cash flow hedges under GAAP on the Company’s condensed consolidated balance sheets:
|
As of March 31, 2019
|
|||||||||||||||||||
|
Gross Amounts Recognized
|
Gross Amounts Offset
|
Gross Amounts Presented
|
Gross Amounts Not Offset
|
Legal Offset
|
|||||||||||||||
|
Foreign currency forward contracts
|
(in thousands)
|
||||||||||||||||||
|
Total assets
|
$
|
20,183
|
|
$
|
—
|
|
$
|
20,183
|
|
$
|
(378
|
)
|
$
|
19,805
|
|
||||
|
Total liabilities
|
$
|
(378
|
)
|
$
|
—
|
|
$
|
(378
|
)
|
$
|
378
|
|
$
|
—
|
|
||||
|
As of December 31, 2018
|
|||||||||||||||||||
|
Gross Amounts Recognized
|
Gross Amounts Offset
|
Gross Amounts Presented
|
Gross Amounts Not Offset
|
Legal Offset
|
|||||||||||||||
|
Foreign currency forward contracts
|
(in thousands)
|
||||||||||||||||||
|
Total assets
|
$
|
20,537
|
|
$
|
—
|
|
$
|
20,537
|
|
$
|
(448
|
)
|
$
|
20,089
|
|
||||
|
Total liabilities
|
$
|
(448
|
)
|
$
|
—
|
|
$
|
(448
|
)
|
$
|
448
|
|
$
|
—
|
|
||||
I. Inventories
Inventories consisted of the following:
|
As of March 31, 2019
|
As of December 31, 2018
|
||||||
|
(in thousands)
|
|||||||
|
Raw materials
|
$
|
11,649
|
|
$
|
9,677
|
|
|
|
Work-in-process
|
80,529
|
|
87,944
|
|
|||
|
Finished goods
|
44,520
|
|
26,739
|
|
|||
|
Total
|
$
|
136,698
|
|
$
|
124,360
|
|
|
J. Revolving Credit Facility
In October 2016, the Company entered into a Credit Agreement (the “Credit Agreement”) with Bank of America, N.A., as administrative agent and the lenders referred to therein. The Credit Agreement provides for a
$500.0 million
revolving facility,
$300.0 million
of which was drawn at closing (the “Loans”) and was repaid in February 2017. The Credit Agreement also provides that, subject to satisfaction of certain conditions, the Company may request that the borrowing capacity under the Credit Agreement be increased by an additional
$300.0 million
. The Credit Agreement matures on October 13, 2021.
The Loans will bear interest, at the Company’s option, at either a base rate or a Eurodollar rate, in each case plus an applicable margin. Under the Credit Agreement, the applicable margins on base rate loans range from
0.75%
to
1.50%
and the applicable margins on Eurodollar loans range from
1.75%
to
2.50%
, in each case based on the Company’s consolidated leverage ratio (the ratio of the Company’s total consolidated debt to the Company’s trailing twelve-month EBITDA).
The Loans are guaranteed by certain of the Company’s domestic subsidiaries and secured by substantially all of the Company’s assets and the assets of the Company’s domestic subsidiaries (excluding intellectual property, owned and leased real property and certain other excluded property) and by the equity interests of the Company’s subsidiaries, subject to certain exceptions. Under the terms of the Credit Agreement, the Company must maintain, subject to certain limited exceptions, a consolidated leverage ratio of
3.00
to 1.00 and consolidated EBITDA of at least
$200.0 million
, in each case measured on a quarterly basis.
24
VERTEX PHARMACEUTICALS INCORPORATED
Notes to Condensed Consolidated Financial Statements
(unaudited)
The Credit Agreement contains customary representations and warranties and usual and customary affirmative and negative covenants. The Credit Agreement also contains customary events of default. In the case of a continuing event of default, the administrative agent would be entitled to exercise various remedies, including the acceleration of amounts due under outstanding loans.
K. Leases
Finance Leases
The Company’s finance lease assets and liabilities primarily relate to its corporate headquarters in Boston and research site in San Diego (the “Buildings”). These Buildings are classified as finance leases because the present value of the sum of the lease payments associated with the Buildings exceeds substantially all of the fair value of the Buildings. The Company also has outstanding finance leases for equipment.
Prior to the adoption of ASC 842 on January 1, 2019, the Company was deemed for accounting purposes to be the owner of the Buildings during their construction periods and recorded project construction costs incurred by its landlords. Upon completion of the Buildings, the Company determined that the underlying leases did not meet the criteria for “sale-leaseback” treatment. Accordingly, the Company depreciated the Buildings over 40 years and recorded interest expense associated with the financing obligations for the Buildings. The Company bifurcated the lease payments pursuant to the Buildings into (i) a portion that was allocated to the buildings and (ii) a portion that is allocated to the land on which the buildings were constructed. The portion of the lease obligations allocated to the land was treated as an operating lease.
Pursuant to ASC 842, the Company adjusted the amounts recorded on its condensed consolidated balance sheet as of January 1, 2019 for the Buildings to reflect the present value of the lease payments over the remaining lease term related to the Buildings. The finance lease assets associated with the Buildings are amortized to depreciation expense using the straight-line method over the remaining lease term, which is significantly shorter than the Buildings’ useful lives. The Company continues to record interest expense associated with the finance lease liabilities for the Buildings.
Corporate Headquarters
In 2011, the Company entered into
two
lease agreements, pursuant to which the Company leases approximately
1.1 million
square feet of office and laboratory space in
two
buildings in Boston, Massachusetts for a term of
15
years. Base rent payments commenced in December 2013, and will continue through December 2028. The Company utilizes this initial period as its lease term. The Company has an option to extend the lease terms for an additional ten years.
San Diego Lease
In 2015, the Company entered into a lease agreement pursuant to which the Company leases approximately
170,000
square feet of office and laboratory space in San Diego, California for a term of
16
years. Base rent payments will commence in the second quarter of 2019, and will continue through May 2034. The Company utilizes this initial period as its lease term. The Company has an option to extend the lease term for up to
two
additional
five
-year terms. The Company placed this building in service in the second quarter of 2018.
Operating Leases
The Company’s operating leases relate to its real estate leases that are not classified as finance leases.
25
VERTEX PHARMACEUTICALS INCORPORATED
Notes to Condensed Consolidated Financial Statements
(unaudited)
Aggregate Lease Information Related to the Application of ASC 842
The following information is disclosed in accordance with ASC 842, which became effective January 1, 2019. The components of lease cost recorded in the Company’s condensed consolidated statement of operations were as follows:
|
Three Months Ended March 31, 2019
|
|||
|
(in thousands)
|
|||
|
Operating lease cost
|
$
|
2,639
|
|
|
Finance lease cost
|
|||
|
Amortization of leased assets
|
12,365
|
|
|
|
Interest on lease liabilities
|
13,449
|
|
|
|
Variable lease cost
|
6,762
|
|
|
|
Sublease income
|
(1,484
|
)
|
|
|
Net lease cost
|
$
|
33,731
|
|
The Company’s variable lease cost during
the three months ended March 31, 2019
primarily related to operating expenses, taxes and insurance associated with its finance leases. The Company’s sublease income during
the three months ended March 31, 2019
primarily related to subleases for an insignificant portion of the Company’s corporate headquarters.
The Company’s leases are included on its condensed consolidated balance sheets as follows:
|
As of March 31, 2019
|
As of December 31, 2018 ^
|
||||||
|
(in thousands)
|
|||||||
|
Finance leases
|
|||||||
|
Property and equipment, net
|
$
|
473,129
|
|
$
|
640,952
|
|
|
|
Total finance lease assets
|
$
|
473,129
|
|
$
|
640,952
|
|
|
|
Capital lease obligations, current portion
|
$
|
—
|
|
$
|
9,817
|
|
|
|
Other current liabilities
|
35,725
|
|
5,271
|
|
|||
|
Capital lease obligations, excluding current portion
|
—
|
|
19,658
|
|
|||
|
Construction financing lease obligation, excluding current portion
|
—
|
|
561,892
|
|
|||
|
Long-term finance lease liabilities
|
560,381
|
|
—
|
|
|||
|
Total finance lease liabilities
|
$
|
596,106
|
|
$
|
596,638
|
|
|
|
Operating leases
|
|||||||
|
Operating lease assets
|
$
|
60,573
|
|
$
|
—
|
|
|
|
Total operating lease assets
|
$
|
60,573
|
|
$
|
—
|
|
|
|
Other current liabilities
|
$
|
7,520
|
|
$
|
—
|
|
|
|
Long-term operating lease liabilities
|
63,484
|
|
—
|
|
|||
|
Total operating lease liabilities
|
$
|
71,004
|
|
$
|
—
|
|
|
|
^ As reported in the Company’s 2018 Annual Report on Form 10-K.
|
|||||||
Maturities of the Company’s finance and operating lease liabilities in accordance with ASC 842 as of
March 31, 2019
were as follows:
26
VERTEX PHARMACEUTICALS INCORPORATED
Notes to Condensed Consolidated Financial Statements
(unaudited)
|
Year
|
Finance Leases
|
Operating Leases
|
Total
|
|||||||||
|
(in thousands)
|
||||||||||||
|
Remainder of 2019
|
$
|
61,339
|
|
$
|
7,331
|
|
$
|
68,670
|
|
|||
|
2020
|
88,998
|
|
10,366
|
|
99,364
|
|
||||||
|
2021
|
87,365
|
|
8,658
|
|
96,023
|
|
||||||
|
2022
|
85,016
|
|
8,233
|
|
93,249
|
|
||||||
|
2023
|
84,092
|
|
8,151
|
|
92,243
|
|
||||||
|
Thereafter
|
512,804
|
|
46,212
|
|
559,016
|
|
||||||
|
Total lease payments
|
919,614
|
|
88,951
|
|
1,008,565
|
|
||||||
|
Less: amount representing interest
|
(323,508
|
)
|
(17,947
|
)
|
(341,455
|
)
|
||||||
|
Present value of lease liabilities
|
$
|
596,106
|
|
$
|
71,004
|
|
$
|
667,110
|
|
|||
The weighted-average remaining lease terms and discount rates related to the Company’s leases were as follows:
|
Three Months Ended March 31, 2019
|
||
|
Weighted-average remaining lease term (in years)
|
||
|
Finance leases
|
10.45
|
|
|
Operating leases
|
10.91
|
|
|
Weighted-average discount rate
|
||
|
Finance leases
|
9.11
|
%
|
|
Operating leases
|
4.05
|
%
|
Please refer to
Note O, “Additional Cash Flow Information,”
for cash flow impact of the Company’s leases.
Additional Lease Information Related to the Application of ASC 840
The following information is disclosed in accordance with ASC 840,
Leases (Topic 840)
(“ASC 840”), which was applicable until December 31, 2018. As of December 31, 2018, future minimum commitments under the Company’s real estate leases with initial terms of more than one year were as follows:
|
Year
|
Fan Pier
Leases |
San Diego
Lease
|
Other
Leases |
Total Lease
Commitments |
||||||||||||
|
(in thousands)
|
||||||||||||||||
|
2019
|
$
|
66,540
|
|
$
|
5,324
|
|
$
|
13,207
|
|
$
|
85,071
|
|
||||
|
2020
|
72,589
|
|
9,127
|
|
14,270
|
|
95,986
|
|
||||||||
|
2021
|
72,589
|
|
9,127
|
|
12,529
|
|
94,245
|
|
||||||||
|
2022
|
72,589
|
|
9,127
|
|
12,045
|
|
93,761
|
|
||||||||
|
2023
|
72,589
|
|
9,530
|
|
11,952
|
|
94,071
|
|
||||||||
|
Thereafter
|
389,855
|
|
119,864
|
|
65,472
|
|
575,191
|
|
||||||||
|
Total minimum lease payments
|
$
|
746,751
|
|
$
|
162,099
|
|
$
|
129,475
|
|
$
|
1,038,325
|
|
||||
As of December 31, 2018, the Company’s total sublease income to be received related to its facility leases was
$6.2 million
. During
the three months ended March 31, 2018
, rental expense was
$4.6 million
.
27
VERTEX PHARMACEUTICALS INCORPORATED
Notes to Condensed Consolidated Financial Statements
(unaudited)
As of December 31, 2018, the Company had outstanding capital leases totaling gross property and equipment of
$94.8 million
and accumulated depreciation of
$34.0 million
. The capital leases, which were related to equipment and leasehold improvements, bore interest at rates ranging from less than 1% to 6% per year. The Company’s capital lease amortization was included in depreciation expense during
the three months ended March 31, 2018
. The following table set forth the Company’s future minimum payments due under capital leases as of December 31, 2018:
|
Year
|
(in thousands)
|
|||
|
2019
|
$
|
10,770
|
|
|
|
2020
|
7,282
|
|
||
|
2021
|
5,649
|
|
||
|
2022
|
3,300
|
|
||
|
2023
|
1,974
|
|
||
|
Thereafter
|
3,085
|
|
||
|
Total payments
|
32,060
|
|
||
|
Less: amount representing interest
|
(2,585
|
)
|
||
|
Present value of payments
|
$
|
29,475
|
|
|
L. Stock-based Compensation Expense and Share Repurchase
Stock-based compensation expense
During
the three months ended March 31, 2019
and
2018
, the Company recognized the following stock-based compensation expense:
|
Three Months Ended March 31,
|
|||||||
|
2019
|
2018
|
||||||
|
(in thousands)
|
|||||||
|
Stock-based compensation expense by type of award:
|
|||||||
|
Restricted stock and restricted stock units (including PSUs)
|
$
|
63,510
|
|
$
|
50,418
|
|
|
|
Stock options
|
28,156
|
|
26,055
|
|
|||
|
ESPP share issuances
|
2,577
|
|
2,128
|
|
|||
|
Stock-based compensation expense related to inventories
|
(452
|
)
|
(465
|
)
|
|||
|
Total stock-based compensation included in costs and expenses
|
$
|
93,791
|
|
$
|
78,136
|
|
|
|
Stock-based compensation expense by line item:
|
|
|
|||||
|
Cost of sales
|
$
|
1,338
|
|
$
|
813
|
|
|
|
Research and development expenses
|
59,715
|
|
48,488
|
|
|||
|
Sales, general and administrative expenses
|
32,738
|
|
28,835
|
|
|||
|
Total stock-based compensation included in costs and expenses
|
93,791
|
|
78,136
|
|
|||
|
Income tax effect
|
(39,524
|
)
|
(21,859
|
)
|
|||
|
Total stock-based compensation included in costs and expenses, net of tax
|
$
|
54,267
|
|
$
|
56,277
|
|
|
The following table sets forth the Company’s unrecognized stock-based compensation expense as of
March 31, 2019
, by type of award and the weighted-average period over which that expense is expected to be recognized:
28
VERTEX PHARMACEUTICALS INCORPORATED
Notes to Condensed Consolidated Financial Statements
(unaudited)
|
As of March 31, 2019
|
|||||
|
Unrecognized Expense
|
Weighted-average
Recognition Period |
||||
|
(in thousands)
|
(in years)
|
||||
|
Type of award:
|
|||||
|
Restricted stock and restricted stock units (including PSUs)
|
$
|
475,787
|
|
2.55
|
|
|
Stock options
|
$
|
193,321
|
|
2.84
|
|
|
ESPP share issuances
|
$
|
2,555
|
|
0.43
|
|
The following table summarizes information about stock options outstanding and exercisable as of
March 31, 2019
:
|
Options Outstanding
|
Options Exercisable
|
|||||||||||||||
|
Range of Exercise Prices
|
Number
Outstanding |
Weighted-average
Remaining Contractual Life |
Weighted-average
Exercise Price |
Number
Exercisable |
Weighted-average
Exercise Price |
|||||||||||
|
(in thousands)
|
(in years)
|
(per share)
|
(in thousands)
|
(per share)
|
||||||||||||
|
$29.07–$40.00
|
252
|
|
1.67
|
$
|
35.87
|
|
252
|
|
$
|
35.87
|
|
|||||
|
$40.01–$60.00
|
437
|
|
3.20
|
$
|
50.23
|
|
437
|
|
$
|
50.23
|
|
|||||
|
$60.01–$80.00
|
525
|
|
5.02
|
$
|
74.83
|
|
516
|
|
$
|
74.82
|
|
|||||
|
$80.01–$100.00
|
2,481
|
|
6.95
|
$
|
89.20
|
|
1,315
|
|
$
|
89.81
|
|
|||||
|
$100.01–$120.00
|
622
|
|
5.88
|
$
|
109.32
|
|
614
|
|
$
|
109.24
|
|
|||||
|
$120.01–$140.00
|
773
|
|
6.36
|
$
|
130.20
|
|
653
|
|
$
|
130.24
|
|
|||||
|
$140.01–$160.00
|
1,287
|
|
8.82
|
$
|
155.51
|
|
333
|
|
$
|
155.35
|
|
|||||
|
$160.01–$180.00
|
502
|
|
8.30
|
$
|
162.94
|
|
177
|
|
$
|
162.95
|
|
|||||
|
$180.01–$187.53
|
1,823
|
|
9.65
|
$
|
185.29
|
|
115
|
|
$
|
182.72
|
|
|||||
|
Total
|
8,702
|
|
7.28
|
$
|
124.11
|
|
4,412
|
|
$
|
100.04
|
|
|||||
Share repurchase program
The Company’s Board of Directors approved a share repurchase program, pursuant to which the Company is authorized to repurchase up to
$500.0 million
of its common stock between February 1, 2018 and December 31, 2019. Under the share repurchase program, the Company is authorized to purchase shares from time to time through open market or privately negotiated transactions. Such purchases may be made pursuant to Rule 10b5-1 plans or other means as determined by the Company’s management and in accordance with the requirements of the SEC.
During the
three months ended March 31, 2019
and
2018
, the Company repurchased
537,018
and
67,084
shares, respectively, of its common stock under the share repurchase program for an aggregate of
$98.0 million
(of which
$4.0 million
was accrued as of
March 31, 2019
) and
$11.3 million
, respectively, including commissions and fees. As of
March 31, 2019
, there is a total of
$52.0 million
remaining for repurchases under the share repurchase program. The Company expects to fund further repurchases of its common stock through a combination of cash on hand and cash generated by operations.
M. Income Taxes
The Company is subject to U.S. federal, state, and foreign income taxes. For
the three months ended March 31, 2019
, the Company recorded a provision for income taxes of
$51.5 million
. The Company’s effective tax rate for
the three months ended March 31, 2019
is lower than the U.S. statutory rate primarily due to excess tax benefits related to stock-based compensation and utilization of net operating losses to offset pre-tax operating income. The Company’s provision for income taxes for
the three months ended March 31, 2019
increased compared to historical amounts due to the release of the Company’s valuation allowance on the majority of its net operating losses and other deferred tax assets as of December 31, 2018. Starting in
the three months ended March 31, 2019
, the Company began recording a provision for income taxes on its pre-tax income using an estimated effective tax rate that approximates statutory rates. Due to the Company's ability to offset
29
VERTEX PHARMACEUTICALS INCORPORATED
Notes to Condensed Consolidated Financial Statements
(unaudited)
its pre-tax income against previously benefited net operating losses, it expects the majority of its tax provision to represent a non-cash expense until its net operating losses have been fully utilized.
During
the three months ended March 31, 2018
, the Company’s benefit from income taxes of
$12.7 million
included a benefit from income taxes of
$21.9 million
from excess tax benefits related to stock-based compensation partially offset by provisions for income taxes of
$6.4 million
related to BioAxone’s income taxes (as a result of an increase in the fair value of the contingent payments payable by the Company to BioAxone) and the Company’s U.S. state and foreign taxes.
As noted above, the Company released the valuation allowance on the majority of net operating losses and other deferred tax assets and maintained a valuation allowance of
$168.5 million
related primarily to U.S. state and foreign tax attributes as of December 31, 2018. On a periodic basis, the Company reassesses any valuation allowances that it maintains on its deferred tax assets, weighing positive and negative evidence to assess the recoverability of the deferred tax assets.
The Company has reviewed the tax positions taken, or to be taken, in its tax returns for all tax years currently open to examination by a taxing authority. Unrecognized tax benefits represent the aggregate tax effect of differences between tax return positions and the benefits recognized in the financial statements. As of
March 31, 2019
and
December 31, 2018
, the Company had
$25.2 million
and
$19.5 million
, respectively, of gross unrecognized tax benefits, which would affect the Company’s tax rate if recognized. The Company does not expect that its unrecognized tax benefits will materially increase within the next twelve months. The Company accrues interest and penalties related to unrecognized tax benefits as a component of its provision for income taxes.
As of March 31, 2019
,
no
significant interest or penalties were accrued. The Company did not recognize any material interest or penalties related to uncertain tax positions during
the three months ended March 31, 2019
and
2018
.
As of
March 31, 2019
, foreign earnings, which were not significant, have been retained indefinitely by foreign subsidiaries for indefinite reinvestment. Upon repatriation of those earnings, in the form of dividends or otherwise, the Company could be subject to withholding taxes payable to the various foreign countries.
The Company files U.S. federal income tax returns and income tax returns in various state, local and foreign jurisdictions. The Company is no longer subject to any tax assessment from an income tax examination in the United States or any other major taxing jurisdiction for years before 2011, except where the Company has net operating losses or tax credit carryforwards that originate before 2011. The Company has various income tax audits ongoing at any time throughout the world. No adjustments have been reported for any jurisdiction under audit.
N. Commitments and Contingencies
Guaranties and Indemnifications
As permitted under Massachusetts law, the Company’s Articles of Organization and By-laws provide that the Company will indemnify certain of its officers and directors for certain claims asserted against them in connection with their service as an officer or director. The maximum potential amount of future payments that the Company could be required to make under these indemnification provisions is unlimited. However, the Company has purchased directors’ and officers’ liability insurance policies that could reduce its monetary exposure and enable it to recover a portion of any future amounts paid.
No
indemnification claims currently are outstanding, and the Company believes the estimated fair value of these indemnification arrangements is minimal.
The Company customarily agrees in the ordinary course of its business to indemnification provisions in agreements with clinical trial investigators and sites in its drug development programs, sponsored research agreements with academic and not-for-profit institutions, various comparable agreements involving parties performing services for the Company and its real estate leases. The Company also customarily agrees to certain indemnification provisions in its drug discovery, development and commercialization collaboration agreements. With respect to the Company’s clinical trials and sponsored research agreements, these indemnification provisions typically apply to any claim asserted against the investigator or the investigator’s institution relating to personal injury or property damage, violations of law or certain breaches of the Company’s contractual obligations arising out of the research or clinical testing of the Company’s compounds or drug
30
VERTEX PHARMACEUTICALS INCORPORATED
Notes to Condensed Consolidated Financial Statements
(unaudited)
candidates. With respect to lease agreements, the indemnification provisions typically apply to claims asserted against the landlord relating to personal injury or property damage caused by the Company, to violations of law by the Company or to certain breaches of the Company’s contractual obligations. The indemnification provisions appearing in the Company’s collaboration agreements are similar to those for the other agreements discussed above, but in addition provide some limited indemnification for its collaborator in the event of third-party claims alleging infringement of intellectual property rights. In each of the cases above, the indemnification obligation generally survives the termination of the agreement for some extended period, although the Company believes the obligation typically has the most relevance during the contract term and for a short period of time thereafter. The maximum potential amount of future payments that the Company could be required to make under these provisions is generally unlimited. The Company has purchased insurance policies covering personal injury, property damage and general liability that reduce its exposure for indemnification and would enable it in many cases to recover all or a portion of any future amounts paid. The Company has never paid any material amounts to defend lawsuits or settle claims related to these indemnification provisions. Accordingly, the Company believes the estimated fair value of these indemnification arrangements is minimal.
Other Contingencies
The Company has certain contingent liabilities that arise in the ordinary course of its business activities. The Company accrues a reserve for contingent liabilities when it is probable that future expenditures will be made and such expenditures can be reasonably estimated. There were
no
material contingent liabilities accrued as of
March 31, 2019
or
December 31, 2018
.
O. Additional Cash Flow Information
The cash, cash equivalents and restricted cash at the beginning and ending of each period presented in the Company’s condensed consolidated statements of cash flows for the
three months ended March 31, 2019
and
2018
consisted of the following:
|
Three Months Ended March 31,
|
|||||||||||||||
|
2019
|
2018
|
||||||||||||||
|
Beginning of period
|
End of period
|
Beginning of period
|
End of period
|
||||||||||||
|
(in thousands)
|
|||||||||||||||
|
Cash and cash equivalents
|
$
|
2,650,134
|
|
$
|
2,893,885
|
|
$
|
1,665,412
|
|
$
|
1,995,893
|
|
|||
|
Prepaid expenses and other current assets
|
4,910
|
|
6,250
|
|
2,114
|
|
9,835
|
|
|||||||
|
Other assets
|
3,209
|
|
1,397
|
|
—
|
|
—
|
|
|||||||
|
Cash, cash equivalents and restricted cash per statement of cash flows
|
$
|
2,658,253
|
|
$
|
2,901,532
|
|
$
|
1,667,526
|
|
$
|
2,005,728
|
|
|||
Supplemental cash flow information related to the Company’s leases was as follows:
|
Three Months Ended March 31, 2019
|
|||
|
(in thousands)
|
|||
|
Cash paid for amounts included in the measurement of lease liabilities:
|
|||
|
Operating cash flows from operating leases
|
$
|
2,531
|
|
|
Operating cash flows from finance leases
|
$
|
11,910
|
|
|
Financing cash flows from finance leases
|
$
|
9,385
|
|
|
Right-of-use assets obtained in exchange for lease obligations
|
|||
|
Operating leases
|
$
|
—
|
|
|
Finance leases
|
$
|
—
|
|
31
Item 2. Management’s Discussion and Analysis of Financial Condition and Results of Operations
OVERVIEW
We invest in scientific innovation to create transformative medicines for people with serious diseases. Our business is focused on developing and commercializing therapies for the treatment of cystic fibrosis, or CF, and advancing our research and development programs in other serious diseases. Our marketed products are SYMDEKO/SYMKEVI (tezacaftor in combination with ivacaftor), ORKAMBI (lumacaftor in combination with ivacaftor) and KALYDECO (ivacaftor), which are collectively approved to treat approximately half of the 75,000 CF patients in North America, Europe and Australia. Our triple combination regimens, if approved, would significantly increase the number of CF patients eligible for our products and could provide an improved treatment option for a majority of the patients currently eligible for our products. In fourth quarter of 2018 and first quarter of 2019, we reported positive data, including interim data, from the Phase 3 clinical trials evaluating the triple combinations of VX-659, tezacaftor and ivacaftor and VX-445, tezacaftor and ivacaftor in patients (i) who have a copy of the
F508del
mutation in their
CFTR
gene and a second mutation that results in minimal
CFTR
function, whom we refer to as F508del/Min patients; and (ii) who have two copies of the
F508del
mutation, whom we refer to as F508del homozygous patients. We expect to have final 24-week data from both Phase 3 triple combination programs in the second quarter of 2019. We expect to submit a New Drug Application, or NDA, to the United States Food and Drug Administration, or FDA, in the third quarter of 2019 and a Marketing Authorization Application, or MAA, in Europe in the fourth quarter of 2019 for a triple combination regimen. We also have earlier-stage programs in pain, beta thalassemia, sickle cell disease, alpha-1 antitrypsin deficiency and focal segmental glomerulosclerosis.
First quarter
of
2019
Financial Highlights
Revenues
In the
first quarter
of
2019
, our net product revenues continued to increase due to the approval of our third CF medicine, SYMDEKO/SYMKEVI, in 2018. During the remainder of 2019, we expect our net product revenues to increase due to increased revenues from SYMDEKO/SYMKEVI.
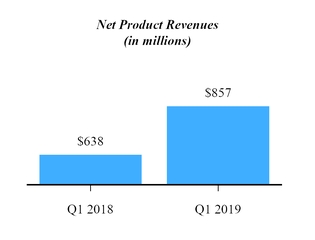
Expenses
In the
first quarter
of
2019
, combined R&D and SG&A expenses increased by
10%
from
$440.4 million
in the
first quarter
of
2018
to
$486.5 million
. In the
first quarter
of
2019
, cost of sales was
11%
of our net product revenues.
Balance Sheet
Increased balance sheet strength driven by earnings.
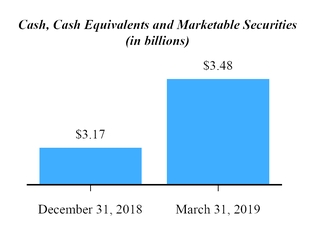
Business Highlights
Cystic Fibrosis
|
•
|
Announced positive data from two Phase 3 clinical trials evaluating the triple combination of VX-445, tezacaftor and ivacaftor in F508del/Min patients and F508del homozygous patients 12 years of age or older.
|
|
•
|
Obtained approval for SYMDEKO in Australia for certain patients 12 years of age or older.
|
|
•
|
Obtained approval for ORKAMBI in the European Union for children 2 to 5 years of age.
|
32
|
•
|
Initiated Phase 2 dose-ranging clinical trial to evaluate the potentiator VX-561 as a potential once-daily monotherapy.
|
|
•
|
Obtained approval for KALYDECO in the United States for infants 6 to <12 months of age.
|
|
•
|
Initiated Phase 2 clinical trial evaluating the potential once-daily triple combination of VX-121 (an additional next-generation corrector) with VX-561 and tezacaftor.
|
Expanding Pipeline
|
•
|
Obtained Fast Track Designation for VX-814, our first small molecule alpha-1 antitrypsin deficiency corrector.
|
|
•
|
Announced with CRISPR Therapeutics that the first patient has been treated with CTX001 in a Phase 1/2 clinical trial of patients with transfusion-dependent beta thalassemia.
|
|
•
|
Announced with CRISPR Therapeutics that first patient has been enrolled in a Phase 1/2 clinical trial of patients with sickle cell disease.
|
|
•
|
Obtained Fast Track designation for CTX001 for both transfusion-dependent beta thalassemia and sickle cell disease.
|
Research
We plan to continue investing in our research programs and fostering scientific innovation in order to identify and develop transformative medicines. Our current internal research programs include programs targeting cystic fibrosis, pain, beta thalassemia, sickle cell disease, alpha-1 antitrypsin and focal segmental glomerulosclerosis. We believe that pursuing research in diverse areas allows us to balance the risks inherent in drug development and may provide drug candidates that will form our pipeline in future years. To supplement our internal research programs, we collaborate with biopharmaceutical and technology companies, leading academic research institutions, government laboratories, foundations and other organizations as needed to advance research in our areas of therapeutic interest and to access technologies needed to execute on our strategy.
Drug Discovery and Development
Discovery and development of a new pharmaceutical product is a difficult and lengthy process that requires significant financial resources along with extensive technical and regulatory expertise. Potential drug candidates are subjected to rigorous evaluations, driven in part by stringent regulatory considerations, designed to generate information concerning efficacy, side effects, proper dosage levels and a variety of other physical and chemical characteristics that are important in determining whether a drug candidate should be approved for marketing as a pharmaceutical product. Most chemical compounds that are investigated as potential drug candidates never progress into development, and most drug candidates that do advance into development never receive marketing approval. Because our investments in drug candidates are subject to considerable risks, we closely monitor the results of our discovery, research, clinical trials and nonclinical studies and frequently evaluate our drug development programs in light of new data and scientific, business and commercial insights, with the objective of balancing risk and potential. This process can result in abrupt changes in focus and priorities as new information becomes available and as we gain additional understanding of our ongoing programs and potential new programs, as well as those of our competitors.
If we believe that data from a completed registration program support approval of a drug candidate, we submit an NDA to the FDA requesting approval to market the drug candidate in the United States and seek analogous approvals from comparable regulatory authorities in jurisdictions outside the United States. To obtain approval, we must, among other things, demonstrate with evidence gathered in nonclinical studies and well-controlled clinical trials that the drug candidate is safe and effective for the disease it is intended to treat and that the manufacturing facilities, processes and controls for the manufacture of the drug candidate are adequate. The FDA and ex-U.S. regulatory authorities have substantial discretion in deciding whether or not a drug candidate should be granted approval based on the benefits and risks of the drug candidate in the treatment of a particular disease, and could delay, limit or deny regulatory approval. If regulatory delays are significant or regulatory approval is limited or denied altogether, our financial results and the commercial prospects for the drug candidate involved will be harmed.
Regulatory Compliance
Our marketing of pharmaceutical products is subject to extensive and complex laws and regulations. We have a corporate compliance program designed to actively identify, prevent and mitigate risk through the implementation of compliance policies and systems and through the promotion of a culture of compliance. Among other laws, regulations and standards, we are subject to various U.S. federal and state laws, and comparable laws in other jurisdictions, pertaining to health care fraud and abuse, including anti-kickback and false claims laws, and laws prohibiting the promotion of drugs for unapproved or off-
33
label uses. Anti-kickback laws make it illegal for a prescription drug manufacturer to solicit, offer, receive or pay any remuneration to induce the referral of business, including the purchase or prescription of a particular drug that is reimbursed by a state or federal program. False claims laws prohibit anyone from knowingly or willfully presenting for payment to third-party payors, including Medicare and Medicaid, claims for reimbursed drugs or services that are false or fraudulent, claims for items or services not provided as claimed, or claims for medically unnecessary items or services. We are subject to laws and regulations that regulate the sales and marketing practices of pharmaceutical manufacturers, as well as laws such as the U.S. Foreign Corrupt Practices Act, which govern our international business practices with respect to payments to government officials. We expect to continue to devote substantial resources to maintain, administer and expand these compliance programs globally.
Reimbursement
Sales of our products depend, to a large degree, on the extent to which our products are reimbursed by third-party payors, such as government health programs, commercial insurance and managed health care organizations. We dedicate substantial management and other resources in order to obtain and maintain appropriate levels of reimbursement for our products from third-party payors, including governmental organizations in the United States and ex-U.S. markets.
In the United States, we have worked successfully with third party payors in order to promptly obtain appropriate levels of reimbursement for our CF medicines and as such, more than 95% of patients across the U.S. have access to our medicines. We continue to engage in discussions with numerous commercial insurers and managed health care organizations, along with government health programs that are typically managed by authorities in the individual states, to ensure that payors recognize the significant benefits that our medicines provide by treating the underlying cause of cystic fibrosis and continue to provide access to our current medicines.
In Europe and other ex-U.S. markets, we seek government reimbursement for our medicines on a country-by-country basis. This is necessary for each new medicine, as well as label expansions for our current medicines in most countries. We successfully obtained reimbursement for KALYDECO in each significant ex-U.S. market within two years of approval. We are experiencing significant challenges in obtaining reimbursement for ORKAMBI in certain ex-U.S. markets. Specifically, we have been discussing potential reimbursement for ORKAMBI in England and France, which represent significant potential markets for our CF medicines, since its approval in 2015. In other ex-U.S. markets, including Australia, Denmark, Germany, Ireland, Sweden and Italy, we have reached pricing and reimbursement agreements for ORKAMBI. In some of these countries we have innovative reimbursement arrangements that provide a pathway to access and rapid reimbursement for certain future CF medicines, including arrangements in Ireland, Denmark and Australia. SYMKEVI, which was approved in the European Union in the fourth quarter of 2018, is available in certain European countries, including Germany, Denmark and Ireland.
Collaboration Arrangements and Strategic Investments
In-License Agreements
We have entered into collaborations with biotechnology and pharmaceutical companies in order to acquire rights or to license drug candidates or technologies that enhance our pipeline and/or our research capabilities. Over the last several years, we entered into collaboration agreements with:
|
•
|
CRISPR Therapeutics AG and its affiliates, or CRISPR, pursuant to which we are collaborating on the discovery and development of potential new treatments aimed at the underlying genetic causes of human diseases using CRISPR-Cas9 gene-editing technology;
|
|
•
|
Arbor Biotechnologies, Inc., or Arbor, pursuant to which we are collaborating on the discovery of novel proteins, including DNA endonucleases, to advance the development of new gene-editing therapies; and
|
|
•
|
Moderna Therapeutics, Inc., or Moderna, pursuant to which we are seeking to identify and develop messenger ribonucleic acid, or mRNA therapeutics for the treatment of CF.
|
Generally, when we in-license a technology or drug candidate, we make upfront payments to the collaborator, assume the costs of the program and agree to make contingent payments, which could consist of milestone, royalty and option payments. Depending on many factors, including the structure of the collaboration, the significance of the drug candidate that we license to the collaborator’s operations and the other activities in which our collaborators are engaged, the accounting for these transactions can vary significantly.
For example, the upfront payments and expenses incurred in connection with our CRISPR and Moderna collaborations are being expensed as research expenses because the collaboration represents a small portion of each of these collaborator’s overall business. CRISPR and Moderna’s activities unrelated to our collaborations have no effect on our consolidated
34
financial statements. In contrast certain of our collaborators, including BioAxone Biosciences, Inc., or BioAxone, have historically been accounted for as variable interest entities, or VIEs, and historically have been included in our consolidated financial statements due to: (i) the significance of the respective licensed programs to our collaborator as a whole, (ii) our power to control the significant activities of the entities under each collaboration, and (iii) our obligation to absorb losses and right to receive benefits that potentially could have been significant. In 2018, we determined that the above conditions were no longer satisfied with respect to BioAxone. As a result, we deconsolidated BioAxone from our consolidated financial statements.
A collaborator that we account for as a VIE may engage in activities unrelated to our collaboration. The revenues and expenses unrelated to the programs we in-license from our VIEs have historically been immaterial to our consolidated financial statements. The activities unrelated to our collaboration were not material to our financial statements during the periods that we consolidated BioAxone. As a result of the deconsolidation, we do not expect to have similar items for 2019 based on our current collaborations. In periods in which we have consolidated VIEs, we have evaluated the fair value of the contingent payments payable by us on a quarterly basis. Changes in the fair value of these contingent future payments affected net income attributable to Vertex on a dollar-for-dollar basis, with increases in the fair value of contingent payments payable by us to a VIE resulting in a decrease in net income attributable to Vertex (or an increase in net loss attributable to Vertex) and decreases in the fair value of contingent payments payable by us to a VIE resulting in an increase in net income attributable to Vertex (or decrease in net loss attributable to Vertex). For additional information regarding our VIEs see
Note C, “Collaborative Arrangements and Acquisitions,”
and our critical accounting policies in our
2018
Annual Report on Form 10-K.
Out-License Agreements
We also have out-licensed internally developed programs to collaborators who are leading the development of these programs. These out-license arrangements include our collaboration agreements with:
|
•
|
Janssen Pharmaceuticals, Inc., or Janssen which is evaluating pimodivir in Phase 3 clinical trials for the treatment of influenza; and
|
|
•
|
Merck KGaA, Darmstadt, Germany, which licensed oncology research and development programs from us in early 2017.
|
Pursuant to these out-licensing arrangements, our collaborators are responsible for the research, development and commercialization costs associated with these programs, and we are entitled to receive contingent milestone and/or royalty payments. As a result, we do not expect to incur significant expenses in connection with these programs and have the potential for future collaborative and royalty revenues resulting from these programs.
Strategic Investments
In connection with our business development activities, we have periodically made equity investments in our collaborators. As of
March 31, 2019
and December 31, 2018, we held strategic equity investments in CRISPR and Moderna, both public companies, and certain private companies, and we may make additional strategic equity investments in the future. While we invest the majority of our cash, cash equivalents and marketable securities in instruments that meet specific credit quality standards and limit our exposure to any one issue or type of instrument, our strategic investments are maintained and managed separately from our other cash, cash equivalents and marketable securities. Any changes in the fair value of equity investments with readily determinable fair values (including publicly traded securities such as CRISPR and Moderna) are recorded to other income (expense), net in our condensed consolidated statement of operations. For equity investments without readily determinable fair values (including private equity investments), each reporting period we are required to re-evaluate the carrying value of the investment, which may result in other income (expense).
In the
first quarter
of
2019
and
2018
we recorded within other income (expense), unrealized gains of
$43.6 million
and
$95.5 million
, respectively, related to increases in the fair value of our strategic investments, which were included in our net income attributable to Vertex. To the extent that we continue to hold strategic investments, particularly strategic investments in publicly traded companies, we will record other income (expense) related to these strategic investments on a quarterly basis. Due to the high volatility of stocks in the biotechnology industry, we expect the value of these strategic investments to fluctuate and that the increases or decreases in the fair value of these strategic investments will continue to have material impacts on our net income (expense) and our profitability on a quarterly and/or annual basis.
35
RESULTS OF OPERATIONS
|
Three Months Ended March 31,
|
Increase/(Decrease)
|
|||||||||||||
|
2019
|
2018
|
$
|
%
|
|||||||||||
|
(in thousands)
|
||||||||||||||
|
Revenues
|
$
|
858,435
|
|
$
|
640,799
|
|
$
|
217,636
|
|
34
|
%
|
|||
|
Operating costs and expenses
|
581,627
|
|
511,898
|
|
69,729
|
|
14
|
%
|
||||||
|
Other non-operating income, net
|
43,357
|
|
68,703
|
|
(25,346
|
)
|
**
|
|
||||||
|
Provision for (benefit from) income taxes
|
51,534
|
|
(12,659
|
)
|
**
|
|
**
|
|
||||||
|
Net income attributable to Vertex
|
$
|
268,631
|
|
$
|
210,263
|
|
$
|
58,368
|
|
28
|
%
|
|||
|
Net income per diluted share attributable to Vertex common shareholders
|
$
|
1.03
|
|
$
|
0.81
|
|
||||||||
|
Diluted shares used in per share calculations
|
260,175
|
|
258,526
|
|
||||||||||
|
** Not meaningful
|
||||||||||||||
Net Income Attributable to Vertex
Net
income
attributable to Vertex was
$268.6 million
in the
first quarter
of
2019
as compared to net
income
attributable to Vertex of
$210.3 million
in the
first quarter
of
2018
. Our total revenues increased in the
first quarter
of
2019
as compared to the
first quarter
of
2018
due to a
$219.5 million
increase in net product revenues. The increase in operating costs and expenses in the
first quarter
of
2019
as compared to the
first quarter
of
2018
was primarily due to increased cost of sales, research and development expenses and sales, general and administrative expenses.
Other non-operating income, net
, in the
first quarter
of
2019
and
2018
primarily related to total unrealized gains associated with increases in the fair value of our strategic investments.
In the first quarter of 2019, we began recording a
provision for income taxes
based primarily on our pre-tax income using an estimated effective tax rate that approximates statutory rates resulting in a provision for income taxes of
$51.5 million
. Due to our ability to offset our pre-tax income against previously benefited net operating losses the majority of our tax provision in the first quarter of 2019 is a non-cash expense. In the first quarter of 2018, we did not record a similar provision for income taxes based on our pre-tax income because we did not release our tax valuation allowance until the fourth quarter of 2018.
Earnings Per Share
Diluted net
income
per share attributable to Vertex common shareholders was
$1.03
in the
first quarter
of
2019
as compared to diluted net
income
per share attributable to Vertex common shareholders of
$0.81
in the
first quarter
of
2018
.
Revenues
|
Three Months Ended March 31,
|
Increase/(Decrease)
|
|||||||||||||
|
2019
|
2018
|
$
|
%
|
|||||||||||
|
(in thousands)
|
||||||||||||||
|
Product revenues, net
|
$
|
857,253
|
|
$
|
637,729
|
|
$
|
219,524
|
|
34
|
%
|
|||
|
Collaborative and royalty revenues
|
1,182
|
|
3,070
|
|
(1,888
|
)
|
(61
|
)%
|
||||||
|
Total revenues
|
$
|
858,435
|
|
$
|
640,799
|
|
$
|
217,636
|
|
34
|
%
|
|||
Product Revenues, Net
|
Three Months Ended March 31,
|
Increase/(Decrease)
|
|||||||||||||
|
2019
|
2018
|
$
|
%
|
|||||||||||
|
(in thousands)
|
||||||||||||||
|
SYMDEKO/SYMKEVI
|
$
|
320,275
|
|
$
|
34,124
|
|
$
|
286,151
|
|
839
|
%
|
|||
|
ORKAMBI
|
293,007
|
|
354,066
|
|
(61,059
|
)
|
(17
|
)%
|
||||||
|
KALYDECO
|
243,971
|
|
249,539
|
|
(5,568
|
)
|
(2
|
)%
|
||||||
|
Total product revenues, net
|
$
|
857,253
|
|
$
|
637,729
|
|
$
|
219,524
|
|
34
|
%
|
|||
In the
first quarter
of
2019
, our net product revenues increased by
$219.5 million
as compared to the
first quarter
of
2018
. The increase in net product revenues was due to the increasing number of patients being treated with SYMDEKO/SYMKEVI, partially offset by decreased ORKAMBI and KALYDECO net product revenues due primarily to the launch of SYMDEKO in
36
the United States. We believe that our net product revenues will increase for the remainder of 2019 due primarily to increases in SYMDEKO/SYMKEVI net product revenues. Our net product revenues also are dependent on, if, and when, we obtain additional reimbursement agreements for our medicines in ex-U.S. markets, particularly in the United Kingdom and France.
SYMDEKO/SYMKEVI
SYMDEKO/SYMKEVI net product revenues were
$320.3 million
in the
first quarter
of
2019
compared to
$34.1 million
in the
first quarter
of
2018
. SYMDEKO was approved by the FDA in February 2018 and SYMKEVI was approved in the European Union in November 2018. In the
first quarter
of
2019
, SYMKEVI net product revenues were
$31.6 million
in ex-U.S. markets. We expect SYMDEKO/SYMKEVI net product revenues to continue to increase for the remainder of 2019.
ORKAMBI
The approval of SYMDEKO/SYMKEVI has had a negative effect on the net product revenues from ORKAMBI, as a portion of the patients who were being treated with ORKAMBI have switched to SYMDEKO/SYMKEVI. Due primarily to patients switching from ORKAMBI to SYMDEKO in the United States, ORKAMBI net product revenues decreased by
17%
in the
first quarter
of
2019
as compared to the
first quarter
of
2018
. In the
first quarter
of
2019
, ORKAMBI net product revenues were
$293.0 million
, including
$91.2 million
of net product revenues from ex-U.S. markets, compared to ORKAMBI net product revenues of
$354.1 million
in the
first quarter
of
2018
, including
$71.8 million
of net product revenues from ex-U.S. markets. Our condensed consolidated balance sheet includes
$382.7 million
collected as of
March 31, 2019
in France related to ORKAMBI supplied under early access programs at the invoiced price. We have recognized limited net product revenues to date on sales of ORKAMBI in France due to ongoing pricing discussions regarding the reimbursement rate for ORKAMBI. Please refer to
Note B, “Revenue Recognition,”
for a discussion of our accounting treatment for our early access program for ORKAMBI in France.
KALYDECO
In the
first quarter
of
2019
, KALYDECO net product revenues were
$244.0 million
, including
$94.6 million
of net product revenues from ex-U.S. markets, compared to KALYDECO net product revenues of
$249.5 million
in the
first quarter
of
2018
, including
$86.2 million
of net product revenues from ex-U.S. markets. The decrease in the
first quarter
of
2019
as compared to the
first quarter
of
2018
was primarily due to a portion of the patients who were being treated with KALYDECO switching to SYMDEKO in the United States partially offset by additional patients being treated with KALYDECO as we completed reimbursement discussions in various ex-U.S. jurisdictions and increased the number of patients eligible to receive KALYDECO through label expansions.
Collaborative and Royalty Revenues
Our collaborative and royalty revenues were
$1.2 million
in the
first quarter
of
2019
as compared to
$3.1 million
in the
first quarter
of
2018
. Our collaborative revenues have historically fluctuated significantly from one period to another and may continue to fluctuate in the future. Our future royalty revenues will be dependent on if, and when, our collaborators, including Janssen, Inc. and Merck KGaA, Darmstadt, Germany are able to successfully develop drug candidates that we have out-licensed to them.
Operating Costs and Expenses
|
`
|
Three Months Ended March 31,
|
Increase/(Decrease)
|
||||||||||||
|
2019
|
2018
|
$
|
%
|
|||||||||||
|
(in thousands)
|
||||||||||||||
|
Cost of sales
|
$
|
95,092
|
|
$
|
71,613
|
|
$
|
23,479
|
|
33
|
%
|
|||
|
Research and development expenses
|
339,490
|
|
310,553
|
|
28,937
|
|
9
|
%
|
||||||
|
Sales, general and administrative expenses
|
147,045
|
|
129,808
|
|
17,237
|
|
13
|
%
|
||||||
|
Restructuring income
|
—
|
|
(76
|
)
|
76
|
|
**
|
|
||||||
|
Total costs and expenses
|
$
|
581,627
|
|
$
|
511,898
|
|
$
|
69,729
|
|
14
|
%
|
|||
|
** Not Meaningful
|
||||||||||||||
Cost of Sales
Our cost of sales primarily consists of the cost of producing inventories that corresponded to product revenues for the reporting period, plus the third-party royalties payable on our net sales of our products. Pursuant to our agreement with the CFF, our tiered third-party royalties on sales of SYMDEKO/SYMKEVI, ORKAMBI and KALYDECO, calculated as a
37
percentage of net sales, range from the single digits to the sub-teens. As a result of the tiered royalty rate, which resets annually, our cost of sales as a percentage of net product revenues are lower at the beginning of each calendar year.
Over the last several years, our cost of sales has been increasing primarily due to increased net product revenues. Our cost of sales as a percentage of our net product revenues was approximately
11%
in each of the
first quarter
of
2018
and
2019
. For the remainder of 2019, we expect our total cost of sales will increase due to our tiered third-party royalties and that our costs of sales as a percentage of total net product revenues will be similar to our cost of sales as a percentage of total net product revenues in 2018.
Research and Development Expenses
|
Three Months Ended March 31,
|
Increase/(Decrease)
|
|||||||||||||
|
2019
|
2018
|
$
|
%
|
|||||||||||
|
(in thousands)
|
||||||||||||||
|
Research expenses
|
$
|
90,463
|
|
$
|
77,942
|
|
$
|
12,521
|
|
16
|
%
|
|||
|
Development expenses
|
249,027
|
|
232,611
|
|
16,416
|
|
7
|
%
|
||||||
|
Total research and development expenses
|
$
|
339,490
|
|
$
|
310,553
|
|
$
|
28,937
|
|
9
|
%
|
|||
Our research and development expenses include internal and external costs incurred for research and development of our drugs and drug candidates and expenses related to certain technology that we acquire or license through business development transactions. We do not assign our internal costs, such as salary and benefits, stock-based compensation expense, laboratory supplies and other direct expenses and infrastructure costs, to individual drugs or drug candidates, because the employees within our research and development groups typically are deployed across multiple research and development programs. These internal costs are significantly greater than our external costs, such as the costs of services provided to us by clinical research organizations and other outsourced research, which we allocate by individual program. All research and development costs for our drugs and drug candidates are expensed as incurred.
Since January 2017, we have incurred approximately
$3.1 billion
in research and development expenses associated with drug discovery and development. The successful development of our drug candidates is highly uncertain and subject to a number of risks. In addition, the duration of clinical trials may vary substantially according to the type, complexity and novelty of the drug candidate and the disease indication being targeted. The FDA and comparable agencies in foreign countries impose substantial requirements on the introduction of therapeutic pharmaceutical products, typically requiring lengthy and detailed laboratory and clinical testing procedures, sampling activities and other costly and time-consuming procedures. Data obtained from nonclinical and clinical activities at any step in the testing process may be adverse and lead to discontinuation or redirection of development activities. Data obtained from these activities also are susceptible to varying interpretations, which could delay, limit or prevent regulatory approval. The duration and cost of discovery, nonclinical studies and clinical trials may vary significantly over the life of a project and are difficult to predict. Therefore, accurate and meaningful estimates of the ultimate costs to bring our drug candidates to market are not available.
In
2018
and the
first quarter
of
2019
, costs related to our CF programs represented the largest portion of our development costs. Any estimates regarding development and regulatory timelines for our drug candidates are highly subjective and subject to change. Until we have data from Phase 3 clinical trials, we cannot make a meaningful estimate regarding when, or if, a clinical development program will generate revenues and cash flows. In the fourth quarter of 2018 and first quarter of 2019, we obtained positive results from Phase 3 clinical trials evaluating triple combinations of VX-659, tezacaftor and ivacaftor and VX-445, tezacaftor and ivacaftor. We plan to submit an NDA to the U.S. FDA in the third quarter of 2019 and a MAA in Europe in the fourth quarter of 2019 for either a VX-659 triple combination regimen or a VX-445 triple combination regimen.
38
Research Expenses
|
Three Months Ended March 31,
|
Increase/(Decrease)
|
|||||||||||||
|
2019
|
2018
|
$
|
%
|
|||||||||||
|
(in thousands)
|
||||||||||||||
|
Research Expenses:
|
||||||||||||||
|
Salary and benefits
|
$
|
24,379
|
|
$
|
24,088
|
|
$
|
291
|
|
1
|
%
|
|||
|
Stock-based compensation expense
|
17,535
|
|
14,760
|
|
2,775
|
|
19
|
%
|
||||||
|
Outsourced services and other direct expenses
|
23,364
|
|
18,813
|
|
4,551
|
|
24
|
%
|
||||||
|
Collaboration and asset acquisition payments
|
—
|
|
308
|
|
(308
|
)
|
**
|
|
||||||
|
Infrastructure costs
|
25,185
|
|
19,973
|
|
5,212
|
|
26
|
%
|
||||||
|
Total research expenses
|
$
|
90,463
|
|
$
|
77,942
|
|
$
|
12,521
|
|
16
|
%
|
|||
|
** Not meaningful
|
||||||||||||||
We maintain a substantial investment in research activities. Our research expenses increased by
16%
in the first quarter of 2019 as compared to the first quarter of 2018 as a result of expenses related to additional headcount in our research organization and increased infrastructure costs. In the
first quarter
of
2019
and
2018
, “
Collaboration and asset acquisition payments
” were not significant; however, our research expenses have been affected, and are expected to continue to be affected, by research expenses associated with our business development activities. We expect to continue to invest in our research programs with a focus on identifying drug candidates with the goal of creating transformative medicines for serious diseases.
Development Expenses
|
Three Months Ended March 31,
|
Increase/(Decrease)
|
|||||||||||||
|
2019
|
2018
|
$
|
%
|
|||||||||||
|
(in thousands)
|
||||||||||||||
|
Development Expenses:
|
||||||||||||||
|
Salary and benefits
|
$
|
60,507
|
|
$
|
57,002
|
|
$
|
3,505
|
|
6
|
%
|
|||
|
Stock-based compensation expense
|
42,180
|
|
33,728
|
|
8,452
|
|
25
|
%
|
||||||
|
Outsourced services and other direct expenses
|
89,874
|
|
99,192
|
|
(9,318
|
)
|
(9
|
)%
|
||||||
|
Collaboration and asset acquisition payments
|
5,250
|
|
250
|
|
5,000
|
|
**
|
|
||||||
|
Drug supply costs
|
7,894
|
|
8,421
|
|
(527
|
)
|
(6
|
)%
|
||||||
|
Infrastructure costs
|
43,322
|
|
34,018
|
|
9,304
|
|
27
|
%
|
||||||
|
Total development expenses
|
$
|
249,027
|
|
$
|
232,611
|
|
$
|
16,416
|
|
7
|
%
|
|||
|
** Not meaningful
|
||||||||||||||
Our development expenses
increased
by
7%
in the
first quarter
of
2019
as compared to the
first quarter
of
2018
, primarily due to increased headcount to support our advancing pipeline and increased infrastructure costs partially offset by decreases in expenses related to our CF programs.
Sales, General and Administrative Expenses
|
Three Months Ended March 31,
|
Increase/(Decrease)
|
|||||||||||||
|
2019
|
2018
|
$
|
%
|
|||||||||||
|
(in thousands)
|
||||||||||||||
|
Sales, general and administrative expenses
|
$
|
147,045
|
|
$
|
129,808
|
|
$
|
17,237
|
|
13
|
%
|
|||
Sales, general and administrative expenses
increased
by
13%
in the
first quarter
of
2019
as compared to the
first quarter
of
2018
, primarily due to increased global support for our medicines and incremental investment to support the potential launch of our triple combination regimen.
Other Non-Operating Income, Net
Interest Income
Interest income was
$15.6 million
in the
first quarter
of
2019
compared to
$5.8 million
in the
first quarter
of
2018
. The increase in interest income in the
first quarter
of
2019
as compared to the
first quarter
of
2018
was primarily due to an increase in our cash equivalents and marketable securities and prevailing market interest rates. Our future interest income will be
39
dependent on the amount of, and prevailing market interest rates on, our outstanding cash equivalents and marketable securities.
Interest Expense
Interest expense was
$14.9 million
in the
first quarter
of
2019
compared to
$16.9 million
in the
first quarter
of
2018
. The majority of our interest expense in these periods was related to imputed interest expense associated with our leased corporate headquarters in Boston and our research site in San Diego. On January 1, 2019, we adopted ASC 842,
Leases
, which resulted in a reduction in our imputed interest expense associated with these leases in the
first quarter
of
2019
as compared to the
first quarter
of
2018
. We expect similar reductions in our imputed interest expense associated with these leases in the initial years subsequent to the adoption of this accounting guidance as compared to the amounts that were recorded in accordance with the previously applicable guidance. In addition to the updated accounting guidance, our future interest expense will also be dependent on whether, and to what extent, we reborrow amounts under our credit facility.
Other Income, Net
Other income, net
was
income
of
$42.6 million
in the
first quarter
of
2019
compared to
income
of
$96.8 million
in the
first quarter
of
2018
. Our other income in these periods is primarily related to increases in fair value of our strategic investments. The value of these strategic investments has fluctuated significantly in the past, including decreasing significantly in the second half of 2018. In future periods, we expect our other income (expense), net to fluctuate based on increases or decreases in the fair value of our strategic investments.
Noncontrolling Interest
The net income attributable to noncontrolling interest recorded on our condensed consolidated statements of operations reflects our VIE’s net (income) loss for the reporting period adjusted for any changes in the noncontrolling interest holders’ claim to net assets, including contingent milestone, royalty and option payments.
As of December 31, 2018, we deconsolidated BioAxone and had no noncontrolling interest in the
first quarter
of
2019
as a result. In the
first quarter
of
2018
, we recorded net income attributable to noncontrolling interest of
$17.0 million
, which was primarily related to a
$24.0 million
increase in the fair value of the contingent payments payable by us to BioAxone partially offset by an associated benefit from income taxes. The increase in the fair value of contingent payments was primarily due to the expiration of an option held by us to purchase BioAxone that resulted in our election to continue our license for VX-210, which increased the probability that additional milestone and royalty payments related to the license for VX-210 would be paid.
Income Taxes
In the
first quarter
of
2019
, we recorded a
provision for income taxes
of
$51.5 million
as compared to a
benefit from income taxes
of
$12.7 million
in the
first quarter
of
2018
. Our effective tax rate for the
first quarter
of
2019
is lower than the U.S. statutory rate primarily due to excess tax benefits related to stock-based compensation and utilization of net operating losses to offset pre-tax operating income. The change in our
provision for income taxes
in the
first quarter
of
2019
compared to the
first quarter
of
2018
was primarily due to the release of our valuation allowance on the majority of our net operating losses and other deferred tax assets in the fourth quarter of 2018. Starting in
first quarter
of
2019
, we began recording a provision for income taxes on our pre-tax income using an estimated effective tax rate that approximates statutory rates. Due to our ability to offset our pre-tax income against previously benefited net operating losses we expect the majority of our tax provision to represent a non-cash expense until our net operating losses have been fully utilized.
The
benefit from income taxes
in the
first quarter
of
2018
primarily related to a benefit from income taxes of $21.9 million for excess tax benefits associated with stock-based compensation offset by provisions for income taxes of $6.4 million attributable to noncontrolling interest and our U.S. state and foreign taxes.
40
LIQUIDITY AND CAPITAL RESOURCES
The following table summarizes the components of our financial condition as of
March 31, 2019
and
December 31, 2018
:
|
March 31,
|
December 31,
|
Increase/(Decrease)
|
||||||||||||
|
2019
|
2018
|
$
|
%
|
|||||||||||
|
(in thousands)
|
||||||||||||||
|
Cash, cash equivalents and marketable securities
|
$
|
3,478,035
|
|
$
|
3,168,242
|
|
$
|
309,793
|
|
10
|
%
|
|||
|
Working Capital
|
||||||||||||||
|
Total current assets
|
4,183,039
|
|
3,843,109
|
|
339,930
|
|
9
|
%
|
||||||
|
Total current liabilities
|
(1,106,468
|
)
|
(1,120,292
|
)
|
(13,824
|
)
|
(1
|
)%
|
||||||
|
Total working capital
|
$
|
3,076,571
|
|
$
|
2,722,817
|
|
$
|
353,754
|
|
13
|
%
|
|||
As of
March 31, 2019
, total working capital was
$3.1 billion
, which represented
an increase
of
$354 million
from
$2.7 billion
as of
December 31, 2018
. The most significant items that
increased
total working capital in the
first quarter
of
2019
were
$324.8 million
of cash provided by operations, a
$43.6 million
increase in the fair value of our strategic investments and
$63.6 million
of cash received from issuances of common stock under our employee benefit plans partially offset by
$99.8 million
of cash used to repurchase shares of our common stock and expenditures for property and equipment of
$18.0 million
as well as other expenditures.
Sources of Liquidity
As of
March 31, 2019
, we had cash, cash equivalents and marketable securities of
$3.5 billion
, which represented an increase of
$310 million
from
$3.2 billion
as of
December 31, 2018
. We intend to rely on our existing cash, cash equivalents and marketable securities together with cash flows from product sales as our primary source of liquidity. We are receiving cash flows from sales of SYMDEKO/SYMKEVI, ORKAMBI and KALYDECO. Future cash flows will be dependent on, among other things, the timing of and our ability to complete reimbursement discussions in European countries and, if and when, we obtain approval for a triple combination regimen.
We may borrow up to $500.0 million pursuant to a revolving credit facility that we entered into in 2016. We may repay and reborrow amounts under the revolving credit agreement without penalty. Subject to certain conditions, we may request that the borrowing capacity under this credit agreement be increased by an additional $300.0 million.
In the
first quarter
of
2019
, we received significant proceeds from the issuance of common stock under our employee benefit plans, but the amount and timing of future proceeds from employee benefits plans is uncertain. Since the beginning of 2018, the value of our strategic investment in CRISPR has fluctuated significantly on a quarterly basis. The future value of our strategic investments, including our investments in CRISPR and Moderna, is uncertain. Other possible sources of future liquidity include strategic collaborative agreements that include research and/or development funding, commercial debt, public and private offerings of our equity and debt securities, development milestones and royalties on sales of products, software and equipment leases, strategic sales of assets or businesses and financial transactions. Negative covenants in our credit agreement may prohibit or limit our ability to access these sources of liquidity.
Future Capital Requirements
We have significant future capital requirements, including:
|
•
|
significant expected operating expenses to conduct research and development activities and to operate our organization; and
|
|
•
|
substantial facility and capital lease obligations, including leases for two buildings in Boston, Massachusetts that continue through 2028 and a lease in San Diego, California that continues through 2034.
|
In addition,
|
•
|
As of
March 31, 2019
, we have accrued approximately
$382.7 million
from ORKAMBI early access programs in France. We expect we will be required to repay a portion of the collected amounts to the French government based
|
41
on the difference between the invoiced price of ORKAMBI and the final price for ORKAMBI in France once we conclude our ongoing pricing discussions with the French government.
|
•
|
We have entered into certain collaboration agreements with third parties that include the funding of certain research, development and commercialization efforts with the potential for future milestone and royalty payments by us upon the achievement of pre-established developmental and regulatory targets and/or commercial targets, and we may enter into additional business development transactions, including acquisitions, collaborations and equity investments, that require additional capital. For example, in 2018, we made
$100.4 million
of upfront and milestone payments related to collaborations and asset acquisitions.
|
|
•
|
To the extent we borrow amounts under the credit agreement we entered into in October 2016, we would be required to repay any outstanding principal amounts in 2021.
|
In January 2018, we announced a share repurchase program to repurchase up to $500.0 million of shares of our common stock through December 31, 2019. As of
March 31, 2019
,
$52.0 million
remained available to fund repurchases under the share repurchase program.
We expect that cash flows from our products together with our current cash, cash equivalents and marketable securities will be sufficient to fund our operations for at least the next twelve months. The adequacy of our available funds to meet our future operating and capital requirements will depend on many factors, including the amounts of future revenues generated by products, and the potential introduction of one or more of our other drug candidates to the market, including a triple combination regimen for patients with CF, the level of our business development activities and the number, breadth, cost and prospects of our research and development programs.
Financing Strategy
We may raise additional capital by borrowing under credit agreements, through public offerings or private placements of our securities or securing new collaborative agreements or other methods of financing. We will continue to manage our capital structure and will consider all financing opportunities, whenever they may occur, that could strengthen our long-term liquidity profile. There can be no assurance that any such financing opportunities will be available on acceptable terms, if at all.
CONTRACTUAL COMMITMENTS AND OBLIGATIONS
Our commitments and obligations were reported in our Annual Report on Form 10-K for the year ended
December 31, 2018
, which was filed with the Securities and Exchange Commission, or SEC, on
February 13, 2019
. There have been no material changes from the contractual commitments and obligations previously disclosed in that Annual Report on Form 10-K.
CRITICAL ACCOUNTING POLICIES AND ESTIMATES
Our discussion and analysis of our financial condition and results of operations is based upon our condensed consolidated financial statements prepared in accordance with generally accepted accounting principles in the United States. The preparation of these financial statements requires us to make certain estimates and assumptions that affect the reported amounts of assets and liabilities, the disclosure of contingent assets and liabilities at the date of the condensed consolidated financial statements and the reported amounts of revenues and expenses during the reported periods. These items are monitored and analyzed by management for changes in facts and circumstances, and material changes in these estimates could occur in the future. Changes in estimates are reflected in reported results for the period in which the change occurs. We base our estimates on historical experience and various other assumptions that we believe to be reasonable under the circumstances. Actual results may differ from our estimates if past experience or other assumptions do not turn out to be substantially accurate. During the three months ended
March 31, 2019
, there were no material changes to our critical accounting policies as reported in our Annual Report on Form 10-K for the year ended
December 31, 2018
, which was filed with the SEC on
February 13, 2019
.
RECENT ACCOUNTING PRONOUNCEMENTS
For a discussion of recent accounting pronouncements, please refer to
Note A, “Basis of Presentation and Accounting Policies.”
Item 3. Quantitative and Qualitative Disclosures About Market Risk
As part of our investment portfolio, we own financial instruments that are sensitive to market risks. The investment portfolio is used to preserve our capital until it is required to fund operations, including our research and development activities. None of these market risk-sensitive instruments are held for trading purposes. We do not have derivative financial instruments in our investment portfolio.
Interest Rate Risk
We invest our cash in a variety of financial instruments, principally securities issued by the U.S. government and its agencies, investment-grade corporate bonds and commercial paper, and money market funds. These investments are denominated in U.S. Dollars. All of our interest-bearing securities are subject to interest rate risk and could decline in value if interest rates fluctuate. Substantially all of our investment portfolio consists of marketable securities with active secondary or resale markets to help ensure portfolio liquidity, and we have implemented guidelines limiting the term-to-maturity of our investment instruments. Due to the conservative nature of these instruments, we do not believe that we have a material
42
exposure to interest rate risk. If interest rates were to increase or decrease by 1%, the fair value of our investment portfolio would increase or decrease by an immaterial amount.
In 2016, we entered into a credit agreement. Loans under the credit agreement bear interest, at our option, at either a base rate or a Eurodollar rate, in each case plus an applicable margin. The applicable margin on base rate loans ranges from 0.75% to 1.50% and the applicable margin on Eurodollar loans ranges from 1.75% to 2.50%, in each case, based on our consolidated leverage ratio (as defined in the credit agreement). We do not believe that changes in interest rates related to the credit agreement would have a material effect on our financial statements. As of
March 31, 2019
, we had no principal or interest outstanding. A portion of our “
Interest expense
” in
2019
will be dependent on whether, and to what extent, we reborrow amounts under the existing facility.
Foreign Exchange Market Risk
As a result of our foreign operations, we face exposure to movements in foreign currency exchange rates, primarily the Euro and British Pound against the U.S. Dollar. The current exposures arise primarily from cash, accounts receivable, intercompany receivables and payables, payables and accruals and inventories. Both positive and negative effects to our net revenues from international product sales from movements in exchange rates are partially mitigated by the natural, opposite effect that exchange rates have on our international operating costs and expenses.
We have a foreign currency management program with the objective of reducing the effect of exchange rate fluctuations on our operating results and forecasted revenues and expenses denominated in foreign currencies. We currently have cash flow hedges for the Euro, British Pound, Canadian Dollar and Australian Dollar related to a portion of our forecasted product revenues that qualify for hedge accounting treatment under U.S. GAAP. We do not seek hedge accounting treatment for our foreign currency forward contracts related to monetary assets and liabilities that impact our operating results. As of
March 31, 2019
, we held foreign exchange forward contracts that were designated as cash flow hedges with notional amounts totaling
$560.9 million
and had a net fair value of
$19.8 million
recorded on our condensed consolidated balance sheet.
Although not predictive in nature, we believe a hypothetical 10% threshold reflects a reasonably possible near-term change in exchange rates. Assuming that the
March 31, 2019
exchange rates were to change by a hypothetical 10%, the fair value recorded on our condensed consolidated balance sheet related to our foreign exchange forward contracts that were designated as cash flow hedges as of
March 31, 2019
would change by approximately
$56.1 million
. However, since these contracts hedge a specific portion of our forecasted product revenues denominated in certain foreign currencies, any change in the fair value of these contracts is recorded in “
Accumulated other comprehensive income
” on our condensed consolidated balance sheet and is reclassified to earnings in the same periods during which the underlying product revenues affect earnings. Therefore, any change in the fair value of these contracts that would result from a hypothetical 10% change in exchange rates would be entirely offset by the change in value associated with the underlying hedged product revenues resulting in no impact on our future anticipated earnings and cash flows with respect to the hedged portion of our forecasted product revenues.
Item 4. Controls and Procedures
Evaluation of Disclosure Controls and Procedures
Our chief executive officer and chief financial officer, after evaluating the effectiveness of our disclosure controls and procedures (as defined in Rules 13a-15(e) and 15d-15(e) under the Securities Exchange Act of 1934, as amended) as of the end of the period covered by this Quarterly Report on Form 10-Q, have concluded that, based on such evaluation, as of
March 31, 2019
our disclosure controls and procedures were effective and designed to provide reasonable assurance that the information required to be disclosed is recorded, processed, summarized and reported within the time periods specified in the SEC’s rules and forms. In designing and evaluating our disclosure controls and procedures, our management recognized that any controls and procedures, no matter how well designed and operated, can provide only reasonable assurance of achieving the desired control objectives, and our management necessarily was required to apply its judgment in evaluating the cost-benefit relationship of possible controls and procedures.
Changes in Internal Controls Over Financial Reporting
No change in our internal control over financial reporting (as defined in Rules 13a-15(f) and 15d-15(f) under the Securities Exchange Act of 1934, as amended) occurred during the three months ended
March 31, 2019
that has materially
43
affected, or is reasonably likely to materially affect, our internal control over financial reporting. We implemented and modified certain internal controls in connection with the new lease accounting standard, ASC 842,
Leases
, which we adopted effective January 1, 2019. There were no significant changes to our internal control over financial reporting due to the adoption of this standard.
PART II. Other Information
Item 1. Legal Proceedings
We are not currently subject to any material legal proceedings.
Item 1A. Risk Factors
Information regarding risk factors appears in Item 1A of our Annual Report on Form 10-K for the year ended
December 31, 2018
, which was filed with the SEC on
February 13, 2019
. There have been no material changes from the risk factors previously disclosed in the Annual Report on Form 10-K.
SPECIAL NOTE REGARDING FORWARD-LOOKING STATEMENTS
This Quarterly Report on Form 10-Q and, in particular, our Management’s Discussion and Analysis of Financial Condition and Results of Operations set forth in Part I-Item 2, contain or incorporate a number of forward-looking statements within the meaning of Section 27A of the Securities Act of 1933, as amended, and Section 21E of the Securities Exchange Act of 1934, as amended, including statements regarding:
|
•
|
our expectations regarding the amount of, timing of and trends with respect to our revenues, costs and expenses and other gains and losses, including those related to net product revenues;
|
|
•
|
our expectations regarding clinical trials, development timelines and regulatory authority filings and submissions for ivacaftor, lumacaftor, tezacaftor, VX-659, VX-445, VX-150 and the timelines for regulatory filings for a triple combination regimen;
|
|
•
|
our ability to obtain reimbursement for our medicines in ex-U.S. markets and our ability to otherwise successfully market our medicines or any of our other drug candidates for which we obtain regulatory approval;
|
|
•
|
our expectations regarding the timing and structure of clinical trials of our drugs and drug candidates and the expected timing of our receipt of data from our ongoing and planned clinical trials;
|
|
•
|
the data that will be generated by ongoing and planned clinical trials and the ability to use that data to advance compounds, continue development or support regulatory filings;
|
|
•
|
our beliefs regarding the support provided by clinical trials and preclinical and nonclinical studies of our drug candidates for further investigation, clinical trials or potential use as a treatment;
|
|
•
|
our plan to continue investing in our research and development programs and our strategy to develop our drug candidates, alone or with third party-collaborators;
|
|
•
|
the establishment, development and maintenance of collaborative relationships;
|
|
•
|
potential business development activities;
|
|
•
|
potential fluctuations in foreign currency exchange rates;
|
|
•
|
our ability to use our research programs to identify and develop new drug candidates to address serious diseases and significant unmet medical needs; and
|
|
•
|
our liquidity and our expectations regarding the possibility of raising additional capital.
|
Any or all of our forward-looking statements in this Quarterly Report on Form 10-Q may turn out to be wrong. They can be affected by inaccurate assumptions or by known or unknown risks and uncertainties. Many factors mentioned in this Quarterly Report on Form 10-Q will be important in determining future results. Consequently, no forward-looking statement
44
can be guaranteed. Actual future results may vary materially from expected results. We also provide a cautionary discussion of risks and uncertainties under “Risk Factors” in Item 1A of our Annual Report on Form 10-K for the year ended
December 31, 2018
, which was filed with the SEC on
February 13, 2019
. These are factors and uncertainties that we think could cause our actual results to differ materially from expected results. Other factors and uncertainties besides those listed there could also adversely affect us.
Without limiting the foregoing, the words “believes,” “anticipates,” “plans,” “intends,” “expects” and similar expressions are intended to identify forward-looking statements. There are a number of factors and uncertainties that could cause actual events or results to differ materially from those indicated by such forward-looking statements, many of which are beyond our control. In addition, the forward-looking statements contained herein represent our estimate only as of the date of this filing and should not be relied upon as representing our estimate as of any subsequent date. While we may elect to update these forward-looking statements at some point in the future, we specifically disclaim any obligation to do so to reflect actual results, changes in assumptions or changes in other factors affecting such forward-looking statements.
Item 2. Unregistered Sales of Equity Securities and Use of Proceeds
Issuer Repurchases of Equity Securities
We have a share repurchase program, announced in January 2018, under which we are authorized to repurchase up to $500.0 million of our common stock by December 31, 2019. As of December 31, 2018, we had repurchased
$350.0 million
of common stock under this program and had remaining available
$150.0 million
to repurchase additional shares under this program. The table set forth below shows repurchases of securities by us during the three months ended
March 31, 2019
; including shares repurchased under our share repurchase program and a small number of restricted shares repurchased by us from employees pursuant to our equity programs. As of
March 31, 2019
, we had repurchased
$448.0 million
of common stock under the share repurchase program and had remaining available
$52.0 million
to repurchase additional shares pursuant to this program.
|
Period
|
Total Number
of Shares Purchased (1) |
Average Price
Paid per Share |
Total Number of Shares
Purchased as Part of Publicly Announced Plans or Programs (2) |
Approximate Dollar Value of Shares that May Yet be Purchased Under the Plans or Programs (2)
|
|
|
January 1, 2019 to January 31, 2019
|
70,691
|
$169.74
|
69,778
|
$138,000,783
|
|
|
February 1, 2019 to February 28, 2019
|
183,914
|
$184.86
|
183,366
|
$104,002,661
|
|
|
March 1, 2019 to March 31, 2019
|
285,909
|
$181.87
|
283,874
|
$52,004,541
|
|
|
Total
|
540,514
|
$181.30
|
537,018
|
$52,004,541
|
|
(1)
Consists of
537,018
shares repurchased pursuant to our share repurchase program (described in footnote 2 below) at an average price per share of
$182.48
and
3,496
restricted shares repurchased for $0.01 per share from our employees pursuant to our equity plans. While we have restricted shares that are continuing to vest under our equity plans that are subject to repurchase rights upon termination of service, we have transitioned our equity program to granting restricted stock units. Unvested restricted stock units are forfeited upon termination of service and do not result in an issuer repurchase that would be reflected in this table.
(2)
Under our share repurchase program, we are authorized to purchase shares from time to time through open market or privately negotiated transactions and such purchases may be made pursuant to Rule 10b5-1 plans or other means as determined by our management and in accordance with the requirements of the Securities and Exchange Commission. The approximate dollar value of shares that may yet be repurchased is based solely on shares that may be repurchased under the share repurchase program and excludes any shares that may be repurchased under our employee equity programs.
45
Item 6. Exhibits
|
Exhibit Number
|
Exhibit Description
|
|
10.1
|
|
|
10.2
|
|
|
31.1
|
|
|
31.2
|
|
|
32.1
|
|
|
101.INS
|
XBRL Instance
|
|
101.SCH
|
XBRL Taxonomy Extension Schema
|
|
101.CAL
|
XBRL Taxonomy Extension Calculation
|
|
101.LAB
|
XBRL Taxonomy Extension Labels
|
|
101.PRE
|
XBRL Taxonomy Extension Presentation
|
|
101.DEF
|
XBRL Taxonomy Extension Definition
|
* Management contract, compensatory plan or agreement.
46
SIGNATURES
Pursuant to the requirements of the Securities Exchange Act of 1934, the registrant has duly caused this report to be signed on its behalf by the undersigned thereunto duly authorized.
|
Vertex Pharmaceuticals Incorporated
|
||
|
May 1, 2019
|
By:
|
/s/ Charles Wagner
|
|
Charles Wagner
|
||
|
Executive Vice President, Chief Financial Officer
(principal financial officer and duly authorized officer) |
||
47
TABLE OF CONTENTS
Part I. Financial InformationItem 1. Financial StatementsItem 2. Management S Discussion and Analysis Of Financial Condition and Results Of OperationsItem 3. Quantitative and Qualitative Disclosures About Market RiskItem 4. Controls and ProceduresPart II. Other InformationItem 1. Legal ProceedingsItem 1A. Risk FactorsItem 2. Unregistered Sales Of Equity Securities and Use Of ProceedsItem 6. Exhibits