VISHAY INTERTECHNOLOGY INC
10-Ks and 10-Qs
|
|
|
|
|
|
|
|
|
|
|
|
|
|
|
|
|
|
|
|
|
|
|
|
|
|
|
|
|
|
|
|
|
|
|
|
|
|
|
|
|
|
|
|
|
|
|
UNITED STATES
SECURITIES AND EXCHANGE COMMISSION
WASHINGTON, D.C. 20549
FORM
10-K
For the fiscal year ended
December 31, 2020
or
For the transition period from _______ to _______
Commission file number
1-7416
(Exact name of registrant as specified in its charter)
|
|
|
|
(State or other jurisdiction of
incorporation or organization)
|
(IRS employer identification no.)
|
(Address of principal executive offices)
(
610
)
644-1300
(Registrant’s telephone number, including area code)
Securities registered pursuant to Section 12(b) of the Act:
|
Title of each class
|
Trading symbol
|
Name of exchange on which registered
|
|
|
|
|
Securities registered pursuant to Section 12(g) of the Act:
None
Indicate by check mark if the registrant is a well-known seasoned issuer, as defined in Rule 405 of the Securities Act.
Yes
☒
No
◻
Indicate by check mark if the registrant is not required to file reports pursuant to Section 13 or Section 15(d) of the Act.
Yes
◻
No
☒
Note
– Checking the box above will not relieve any registrant required to file reports under Section 13 or 15(d) of the Exchange Act from their obligations under those Sections.
Indicate by check mark whether the registrant (1) has filed all reports required to be filed by Section 13 or 15(d) of the Securities Exchange Act of 1934 during the preceding 12 months (or for such shorter period that the registrant was required to file such reports), and (2) has been subject to such filing requirements for the past 90 days.
Yes
☒
No
◻
Indicate by check mark whether the registrant has submitted electronically every Interactive Data File required to be submitted pursuant to Rule 405 of Regulation S-T (§ 232.405 of this chapter) during the preceding 12 months (or for such shorter period that the registrant was required to submit such files).
Yes
☒
No
◻
Indicate by check mark whether the registrant is a large accelerated filer, an accelerated filer, a non-accelerated filer, a smaller reporting company, or an emerging growth company. See definitions of “large accelerated filer,” “accelerated filer,” “smaller reporting company,” and "emerging growth company" in Rule 12b-2 of the Exchange Act.
|
|
☒
|
Accelerated filer
|
◻
|
|||
|
Non-accelerated filer
|
◻
|
Smaller reporting company
|
|
|||
|
Emerging growth company
|
|
If an emerging growth company, indicate by check mark if the registrant has elected not to use the extended transition period for complying with any new or revised financial accounting standards provided pursuant to Section 13(a) of the Exchange Act.
◻
Indicate by check mark whether the registrant has filed a report on and attestation to its management’s assessment of the effectiveness of its internal control over financial reporting under Section 404(b) of the Sarbanes-Oxley Act (15 U.S.C. 7262(b)) by the registered public accounting firm that prepared or issued its audit report.
☒
Indicate by checkmark whether the registrant is a shell company (as defined in Rule 12b-2 of the Act).
Yes
☐
No
☒
The aggregate market value of the voting stock held by non-affiliates computed by reference to the price at which the common equity was last sold as of the last business day of the registrant’s most recently completed second fiscal quarter ($14.87 on July 4, 2020), assuming conversion of all of its Class B common stock held by non-affiliates into common stock of the registrant, was $
1,977,000,000
. There is no non-voting stock outstanding.
As of February 22, 2021, registrant had
132,633,616
shares of its common stock and
12,097,148
shares of its Class B common stock outstanding.
DOCUMENTS INCORPORATED BY REFERENCE
Portions of the registrant’s definitive proxy statement, which will be filed within 120 days of December 31, 2020, are incorporated by reference into Part III.
This page intentionally left blank.
Vishay Intertechnology, Inc.
Form 10-K for the year ended December 31, 2020
CONTENTS
|
Consolidated Financial Statements
|
|
3
|
Item 1.
|
BUSINESS
|
Our Business
Vishay Intertechnology, Inc. (“Vishay,” the “Company,” “we,” “us,” or “our”) manufactures one of the world’s largest portfolios of discrete semiconductors and passive electronic components that support innovative designs in the automotive, industrial, computing, consumer, telecommunications, military, aerospace, and medical markets. Serving customers worldwide, Vishay brands itself as
The DNA of tech
.™
Semiconductors include MOSFETs, diodes, and optoelectronic components. Passive components include resistors, inductors, and capacitors. Our semiconductor components are used for a wide variety of functions, including power control, power conversion, power management, signal switching, signal routing, signal blocking, signal amplification, two-way data transfer, one-way remote control, and circuit isolation. Our passive components are used to restrict current flow, suppress voltage increases, store and discharge energy, control alternating current (“AC”) and voltage, filter out unwanted electrical signals, and perform other functions.
The Vishay Story
For almost six decades we have been building what we call
The DNA of tech.
TM
The Vishay journey began with one man, the late Dr. Felix Zandman, and a revolutionary technology. In the 1950’s, Dr. Felix Zandman was issued patents for his PhotoStress® coatings and instruments, used to reveal and measure the distribution of stresses in structures such as airplanes and cars under live load conditions. His research in this area led him to develop Bulk Metal® foil resistors – ultra-precise, ultra-stable resistors with performance exceeding any other resistor available to date.
In 1962, Dr. Zandman, with a loan from the late Alfred P. Slaner, founded Vishay to develop and manufacture Bulk Metal foil resistors. Concurrently, J.E. Starr developed foil resistance strain gages, which also became part of Vishay. Throughout the 1960’s and 1970’s, Vishay established itself as a technical and market leader in foil resistors, PhotoStress products, and strain gages.
From that beginning, we grew and strengthened our business both organically and through strategic passive component acquisitions beginning in 1985 and semiconductor acquisitions beginning in the late 1990’s. From discrete semiconductors to passive components; from the smallest diode to the most powerful capacitor, Vishay manufactures a breadth of products which we call
The DNA of tech.™
Through R&D, manufacturing, engineering, quality, sales and marketing, we generate a variety of components that support inventors and innovators creating new generations of products spanning many sectors: automotive, industrial, computing, consumer, telecommunications, military, aerospace, and medical.
Together with major manufacturers of electronic products worldwide, we are supporting next level automation in multiple areas, including factories, the electrification of the automobile, 5G network technology, and the rapid expansion of connectivity across everything (IoT).
We continue to implement Dr. Zandman’s vision, strategy, and culture as we work tirelessly to enhance value for our stockholders.
Vishay was incorporated in Delaware in 1962 and maintains its principal executive offices at 63 Lancaster Avenue, Malvern, Pennsylvania 19355-2143. Our telephone number is (610) 644-1300.
4
Our Competitive Strengths
Global Technology Leader
As industry evolves,
The DNA of tech™
evolves. We were founded based on the inventions of Dr. Felix Zandman and we continue to emphasize technological innovation as a driver of growth. Many of our products and manufacturing techniques, technologies, and packaging methods have been invented, designed, and developed by Dr. Zandman, our engineers, and our scientists. Our components today are smaller, faster, and more reliable than in the past, helping our customers to be more inventive and evolve their businesses. Our components are used by virtually all major manufacturers of electronic products worldwide in the automotive, industrial, computing, consumer, telecommunications, military and aerospace, and medical markets. They are found inside products and systems used every day, from automobiles to airplanes, power grids, phones, and pacemakers. We are currently a worldwide technology and market leader in wirewound and other power resistors, leaded film resistors, thin film SMD resistors, power inductors, wet and conformal-coated tantalum capacitors, capacitors for power electronics, power rectifiers, low-voltage power MOSFETs, and infrared components.
Research and Development Provides Customer-Driven Growth Solutions
We maintain strategically placed application and product support centers where proximity to customers and our manufacturing locations enables us to more easily gauge and satisfy the needs of local markets. The breadth of our product portfolio along with the proximity of our field application engineers to customers provides increased opportunities to have our components selected and designed into new end products by customers in all relevant market segments. We also maintain research and development personnel and promote programs at a number of our production facilities to develop new products and new applications of existing products, and to improve manufacturing processes and technologies. We plan to grow our business and increase earnings per share, in part, through accelerating the development of new products and technologies and increasing design-in opportunities by expanding our technical resources for providing solutions to customers.
Operational Excellence
We are a leading manufacturer in our industry, with a broad product portfolio, access to a wide range of end markets and sales channels, and geographic diversity. We have solid, well-established relationships with our customers and strong distribution channels. Our senior management team is highly experienced, with deep industry knowledge. Over the past two decades, our management team has successfully restructured our company and integrated several acquisitions. We can adapt our operations to changing economic conditions, as demonstrated by our ability to remain profitable and generate cash through the volatile economic cycle of the recent past.
Broad Market Penetration
We have one of the broadest product lines of discrete semiconductors and passive components among our competitors. Our broad product portfolio allows us to penetrate markets in all industry segments and all regions, which reduces our exposure to a particular end market or geographic location. We plan to grow our business and increase earnings per share, in part, through improving market penetration by expanding manufacturing facilities for our most successful products, increasing technical resources, and developing markets for specialty products in Asia. See Note 15 to our consolidated financial statements for net revenues by region and end market.
Strong Track Record of Growth through Acquisitions
Since 1985, we have expanded our product line through various strategic acquisitions, growing from a small manufacturer of precision resistors and resistance strain gages to one of the world’s largest manufacturers and suppliers of a broad line of electronic components. We have successfully integrated the acquired companies within our existing management and operational structure, reducing selling, general, and administrative expenses through the integration or elimination of redundant sales and administrative functions, creating manufacturing synergies, while improving customer service. We plan to grow our business and increase earnings per share, in part, through targeted acquisitions. We have often targeted high margin niche business acquisitions. We also target strategic acquisitions of businesses with technology and engineering capabilities that we can use to grow our business.
Strong Free Cash Flow Generation
We refer to the amount of cash generated from operations in excess of our capital expenditure needs and net of proceeds from the sale of assets as “free cash” (see "Overview" included in Item 7, “Management’s Discussion and Analysis of Financial Condition and Results of Operations” for "free cash" definition and reconciliation to generally accepted accounting principles ("GAAP")). Due to our strong operational management, cost control measures, efficient capital expenditures, broad product portfolio, and strong market position, we have generated positive “free cash” in each of the past 24 years and “free cash” in excess of $80 million in each of the past 19 years. We expect the benefits of our restructuring and other cost cutting measures (see “Cost Management” included in Item 7, “Management’s Discussion and Analysis of Financial Condition and Results of Operations”) to contribute to our “free cash” generation going forward.
Financial Strength and Flexibility
As of December 31, 2020, our cash and short-term investment balance exceeded our debt balance by $383.5 million. We also maintain a credit facility, which provides a revolving commitment of up to $750 million through June 5, 2024, which was substantially all available as of December 31, 2020. Our net cash position and short-term investment balance, available revolving commitment, and strong “free cash” flow generation provide financial strength and flexibility and reduce our exposure to future economic uncertainties.
5
Our Key Challenges
Economic Environment
Our business and operating results have been and will continue to be impacted by the global economy and the local economies in which our customers operate. Our revenues are dependent on end markets that are impacted by fluctuating consumer and industrial demand, and our operating results can be adversely affected by reduced demand in those markets.
Competition
Our business is highly competitive worldwide, with low transportation costs and few import barriers. Our major competitors, some of which are larger than us, have significant financial resources and technological capabilities. To continue to grow our business successfully, we need to continually develop, introduce, and market new and innovative products, modify existing products, respond to technological change, and customize certain products to meet customer requirements.
Continuous Innovation and Protection of Intellectual Property
Our ability to compete effectively with other companies depends, in part, on our ability to maintain the proprietary nature of our technology. Although we have been awarded, have filed applications for, or have licenses to use, numerous patents in the United States and other countries, there can be no assurance concerning the degree of protection afforded by these patents or the likelihood that pending patents will be issued.
Continuing to Grow through Acquisitions
Our long-term historical growth in revenues and net earnings has resulted in large part from our strategy of growth through acquisitions. For this strategy to remain successful, we need to continue to identify attractive and available acquisition candidates, complete acquisitions on favorable terms, and integrate new businesses, manufacturing processes, employees, and logistical arrangements into our existing management and operating infrastructure.
Recent Events: COVID-19 Pandemic
Our business has been adversely impacted by the widespread global outbreak of COVID-19. Impacts have included disruptions in our ability to manufacture products and disruptions in the operations of our customers and modes of shipping. To continue to be successful, we will need to continue to adapt our business and operations for the impacts of the COVID-19 pandemic and potential future coronavirus outbreaks and the mitigation efforts by governments to attempt to control their spread.
Recent Events: Global Trade Disruption
Established global trade agreements and procedures are being challenged, particularly by the U.S. government. Trade disputes have resulted in tariffs and other trade restrictions including import / export prohibitions. Disruptions to global trade could result in customers seeking different sources of product and reducing our revenues, or requiring us to seek different sources of supply and increasing our costs. New or revised trade agreements could negatively impact profitability or require changes in operations in the long-term. We remain cognizant of these challenges and seek to minimize their effects whenever possible.
For a more detailed discussion of the risks and uncertainties inherent in our business, which could materially and adversely affect our business, results of operations or financial condition, see “Risk Factors” in Item 1A.
6
Key Business Strategies
Since our first acquisition in 1985, we have pursued a business strategy that principally consists of the following elements:
Invest in Innovation to Drive Growth
We plan to continue to use our research and development (“R&D”), engineering, and product marketing resources to continually roll out new and innovative products. As part of our plan to foster intensified internal growth, we have increased our worldwide R&D and engineering technical staff, and increased our technical field sales force in Asia to increase opportunities to design-in our products in local markets. Our ability to react to changing customer needs and industry trends will continue to be key to our success. We intend to leverage our insights into customer demand to continually develop new innovative products within our existing lines and to modify our existing core products to make them more appealing, addressing changing customer needs and industry trends.
We are directing increased funding and are focusing on developing products to capitalize on the connectivity, mobility, and sustainability growth drivers of our business.
Cost Management
We place a strong emphasis on controlling our costs. We focus on controlling fixed costs and reducing variable costs. When our ongoing cost management activities are not adequate, we take actions to maintain our cost competitiveness including restructuring our business to improve efficiency and operating performance.
Growth through Strategic Acquisitions
We plan to continue to expand within the electronic components industry, through the acquisition of other manufacturers of electronic components that have established positions in major markets, reputations for product innovation, quality, and reliability, strong customer bases, and product lines with which we have substantial marketing and technical expertise.
Customer Service Excellence
We maintain significant production facilities in those regions where we market the bulk of our products in order to enhance the service and responsiveness that we provide to our customers. We aim to further strengthen our relationships with customers and strategic partners by providing broad product lines that allow us to provide “one-stop shop” service, whereby they can streamline their design and purchasing processes by ordering multiple types of products.
Our growth plan was designed based on the tenets of the key business strategies listed above.
7
Products
We design, manufacture, and market electronic components that cover a wide range of functions and technologies. Our products include both commodity and non-commodity products in which we believe we enjoy a good reputation and strong brand recognition, including our Siliconix, Dale, Draloric, Beyschlag, Sfernice, MCB, UltraSource, Applied Thin-Film Products, IHLP®, HiRel Systems, Sprague, Vitramon, Roederstein, ESTA, and BCcomponents brands. We promote our ability to provide “one-stop shop” service to customers, whereby they can streamline their design and purchasing processes by ordering multiple types of products from Vishay. Our technical sales force consisting of field application engineers offers customers the complete breadth of the Vishay portfolio for their applications. We aim to use this broad portfolio to increase opportunities to have our components selected and “designed in” to new end products.
Product Segments
Our products can be divided into two general classes: semiconductors and passive components. Semiconductors are sometimes referred to as “active components” because they require power to function whereas passive components do not require power to function.
Our semiconductor and passive components products are further categorized based on their functionality for financial reporting purposes.
Semiconductors
Our semiconductor products include metal oxide semiconductor field-effect transistors ("MOSFETs"), diodes, and optoelectronic components. Semiconductors are typically used to perform functions such as switching, amplifying, rectifying, routing, or transmitting electrical signals, power conversion, and power management.
MOSFETs Segment
MOSFETs function as solid state switches to control power. Our MOSFETs business includes both the commodity and non-commodity markets in which we believe that we enjoy a good reputation and strong brand recognition (Siliconix). MOSFETs applications include mobile phones, notebook and desktop computers, tablet computers, digital cameras, televisions, DC/DC and AC/DC switch mode power supplies, solar inverters, automotive and industrial systems. We are a leader in low-voltage TrenchFET MOSFETs and also offer high-voltage MOSFETs. Our MOSFETs product line includes low- and medium-voltage TrenchFET MOSFETs, high-voltage planar MOSFETs, high voltage Super Junction MOSFETs, power integrated circuits (power ICs), and integrated function power devices. We are one of the technology leaders in MOSFETs, with a tradition of innovation in wafer design, packaging, and performance.
Diodes Segment
Diodes route, regulate, and block radio frequency, analog, and power signals; protect systems from surges or electrostatic discharge damage; or provide electromagnetic interference filtering.
Our Diodes business is a solid business with a strong market presence in both the commodity and non-commodity markets. The products that comprise our Diodes business represent our broadest product line and include rectifiers, small signal diodes, protection diodes, thyristors/SCRs and power modules. The primary application of rectifiers, found inside the power supplies of virtually all electronic equipment, is to derive DC power from the AC supply. Vishay is the worldwide leader in rectifiers, having a broad technology base and a good position in automotive, industrial, computing and consumer markets. Our rectifier innovations include TMBS® using Trench MOS barrier Schottky rectifier technology, which reduces power loss and improves the efficiency of end systems and eSMP®, the best in class high-current density surface mount packages. Our wide selection of small signal diodes consist of the following functions: switching, tuning, band-switching, RF attenuation and voltage regulation (Zener). They are available in various glass and plastic packaging options and generally are used in electronic circuits, where small currents and high frequencies are involved. Vishay is also one of the market leaders for TVS (transient voltage suppressor) diodes. The portfolio of protection diodes includes ESD protection and EMI filter. Our thyristors or SCR (silicon-controlled rectifiers) are very popular in the industrial high-voltage AC power control applications. The fast growing markets of solar inverter and HEV/EV are the focus of our power modules business (IGBT or MOSFET modules). These modules can be customized to fit in different customer design requirements.
Optoelectronic Components Segment
Optoelectronic components emit light, detect light, or do both. Our Optoelectronic Components business has a strong market presence in both the commodity and non-commodity markets. Our broad range of standard and customer specific optoelectronic components includes infrared (“IR”) emitters and detectors, IR remote control receivers, optocouplers, solid-state relays, optical sensors, light-emitting diodes (“LEDs”), 7-segment displays, and IR data transceiver modules (IrDA®). Our IR remote control receivers are designed for use in infrared remote control, data transmission, and light barrier applications in end products including televisions, set-top boxes, notebook computers, and audio systems. We are the leading manufacturer of IR remote control receivers. Our optocouplers electrically isolate input and output signals. Uses include switch-mode power supplies, consumer electronics, telecommunications equipment, solar inverters, and industrial systems. Our IR data transceiver modules are used for short range, two-way, high-speed, and secure wireless data transfer between electronic devices such as home medical appliances, mobile phones, industrial data loggers, and metering. Our optical sensors product line was considerably strengthened by our acquisition of Capella in 2014. Our optical sensors products include ambient light sensors, optical encoders, integrated photodiode and I/V amplifiers, proximity sensors, color sensors, and UV sensors. Applications include telecommunications, mobile phones, smartphone, handheld devices, digital cameras, laptops, desktop computers, LED backlighting, office automation equipment, household electrical appliance and automotive electronics. Our LEDs are designed for backlighting and illumination in automotive and other applications. Our LEDs include ultra-bright as well as small surface-mount packages, with products available in all standard colors including white.
8
Passive Components
Our passive components include resistors, inductors, and capacitors. Passive components are used to store electrical charges, to limit or resist electrical current, and to help in filtering, surge suppression, measurement, timing, and tuning applications.
Resistors Segment
Resistors impede electric current. Resistors are basic components used in all forms of electronic circuitry to adjust and regulate levels of voltage and current.
Our Resistors business is our original business. We maintain the broadest portfolio of resistor products worldwide. Under current market conditions, the business is solid, predictable, and growing at relatively stable selling prices. We are a market leader with a strong technology base, many specialty products, and strong brand recognition (such as our Dale, Draloric, Beyschlag, and Sfernice brands). We focus on higher value markets in specialized industries, while maintaining a complete portfolio of commodity products. We do not aim to be the volume leader in commodity markets.
Resistors vary widely in precision and cost, and are manufactured from numerous materials and in many forms. Linear resistive components are classified as variable or fixed, depending on whether or not their resistance is adjustable. Non-linear resistors function by varying in resistance under influence of temperature (thermistors) or voltage (varistors). They can be used in temperature-measuring applications or as current or voltage-limiting devices. We manufacture virtually all types of fixed resistors, both in discrete and network forms, as well as many variable types.
Vishay resistor innovations include Power Metal Strip® technology. These resistors feature very low resistance and are used to measure changes in current flow (current sensing) or divert current flow (shunting).
Inductors Segment
Inductors also impede electric current. Inductors use an internal magnetic field to change alternating current phase and resist alternating current. While part of our traditional business, the inductors product line has grown significantly in recent years.
We are a market leader with a strong technology base, many specialty products, and strong name recognition (such as our IHLP® and HiRel Systems brands). We focus on higher value markets in specialized industries, such as the industrial, automotive, military, and medical end markets.
Inductor applications include controlling AC current and voltage, filtering out unwanted electrical signals, and energy storage. Vishay inductor innovations include our patented IHLP low-profile, high-current inductor technology with industry-leading specifications. Our low-profile, high-current inductors save circuit board space and power in voltage regulator module (“VRM”) and DC to DC converter applications. In addition, we are a worldwide leader in custom magnetic solutions focusing on high performance and high reliability.
Capacitors Segment
Capacitors store energy and discharge it when needed. Our Capacitors business consists of a broad range of reliable, high-quality products. We have a strong presence worldwide in specialty markets based on our product performance and reliability and strong brand recognition (including our Sprague, Vitramon, Roederstein, BCcomponents, and ESTA brands). We focus on higher value markets in specialized industries, while maintaining a complete portfolio of commodity products. We do not aim to be the volume leader in commodity markets. Capacitors are used in almost all electronic circuits. They store energy and discharge it when needed. Important applications for capacitors include electronic filtering for linear and switching power supplies; decoupling and bypass of electronic signals for integrated circuits and circuit boards; and frequency control, timing and conditioning of electronic signals for a broad range of applications.
We manufacture products based on all major capacitor technologies: tantalum (molded chip tantalum, coated chip tantalum, solid through-hole tantalum, wet tantalum, and polymer), ceramic (multilayer chip and ceramic disc), film, power, heavy-current, and aluminum electrolytic. Our capacitors range from tiny surface-mount devices for hearing aids and mobile devices to large power correction capacitors used in renewable energy, heavy industry, and electrical power grids. We are a recognized technology leader in many product ranges, securing our strong position in military and medical markets, and in a wide range of industrial and automotive applications. Our wet tantalum and MicroTan™ technologies are market leaders.
9
Military Qualifications
We have qualified certain of our products under various military specifications approved and monitored by United States government agencies, and under certain European military specifications. Qualification levels are based in part upon the rate of failure of products. In order to maintain the classification level of a product, we must continuously perform tests on the product and the results of these tests must be reported to the government agencies. If the product fails to meet the requirements for the applicable classification level, the product’s classification may be reduced to a lower level. During the time that the classification level is reduced for a product with military application, net revenues and earnings attributable to that product may be adversely affected.
Manufacturing Operations
In order to better serve our customers, we maintain production facilities in locations where we market the bulk of our products, such as the United States, Germany, and Asia. To optimize production efficiencies, we have whenever practicable established manufacturing facilities in countries, such as India, Israel, Malaysia, Mexico, the People’s Republic of China, and the Philippines, where we can benefit from lower labor costs and also benefit from various government incentives, including tax relief.
One of our most sophisticated manufacturing operations is the production of power semiconductor components. This manufacturing process involves two phases of production: wafer fabrication and assembly (or packaging). Wafer fabrication subjects silicon wafers to various thermal, metallurgical, and chemical process steps that change their electrical and physical properties. These process steps define cells or circuits within numerous individual devices (termed “dies” or “chips”) on each wafer. Assembly is the sequence of production steps that divides the wafer into individual chips and encloses the chips in structures (termed “packages”) that make them usable in a circuit. Both wafer fabrication and assembly phases incorporate wafer level and device level electrical testing to ensure that device design integrity has been achieved.
In the United States, our manufacturing facilities are located in California, Connecticut, Minnesota, Nebraska, New Hampshire, New York, Rhode Island, South Dakota, Vermont, and Wisconsin. In Asia, our main manufacturing facilities are located in the People’s Republic of China, the Republic of China (Taiwan), India, and Malaysia. In Europe, our main manufacturing facilities are located in Germany, France, and the Czech Republic. We have substantial manufacturing facilities in Israel. We also have manufacturing facilities in Austria, Dominican Republic, Japan, Hungary, Italy, Mexico, Portugal, and the Philippines. Over the past several years, we have invested substantial resources to increase the efficiency of our plants, which we believe will further reduce production costs.
All of our manufacturing operations have received ISO 9001 certification.
ISO 9001 is a comprehensive set of quality program standards developed by the International Standards Organization.
Sources of Supplies
Although most materials incorporated in our products are available from a number of sources, certain materials, including plastics and metals, are available only from a relatively limited number of suppliers or are subject to significant price volatility.
Silicon wafers are the most important raw material for the manufacturing of our semiconductor products. Silicon wafers are manufactured from high-purity silicon, a metalloid. There have at times been industry-wide shortages of high-purity silicon resulting primarily from growing demand of the electronic component and solar power industries, and limited growth in high-purity silicon manufacturing capacities. Shifts in demand for high-purity silicon and in turn, silicon wafers, have resulted in significant fluctuation in prices of silicon wafers.
We are a major consumer of the world’s annual production of tantalum, a metal used in the manufacturing of tantalum capacitors. There are few suppliers that process tantalum ore into capacitor grade tantalum powder.
Certain materials, in addition to tantalum and including tin, tungsten, and gold are available only from a relatively limited number of suppliers, the source for which may be in the Democratic Republic of the Congo ("DRC") or an adjoining country. We are working to have a supply chain that is 100% certified conflict-free.
Palladium, a metal used to produce multi-layer ceramic capacitors, is currently found primarily in South Africa and Russia. Palladium is a commodity metal that is subject to price volatility. We periodically enter into short-term commitments to purchase palladium.
Certain metals used in the manufacture of our products, such as copper, are traded on active markets, and can be subject to significant price volatility.
Our policy is to enter into short-term commitments to purchase defined portions of annual consumption of these metals if market prices decline below budget.
10
Inventory and Backlog
We manufacture both standardized products and those designed and produced to meet customer specifications. We maintain an inventory of standardized components and monitor the backlog of outstanding orders for our products.
We include in our backlog only open orders that we expect to ship in the next twelve months. Many of our customers encounter uncertain and changing demand for their products. They typically order products from us based on their forecasts. If demand falls below customers’ forecasts, or if customers do not control their inventory effectively, they may cancel or reschedule the shipments included in our backlog, in many instances without the payment of any penalty. Therefore, our backlog at any point in time is not necessarily indicative of the results to be expected for future periods.
Customers and Marketing
We sell our products to original equipment manufacturers (“OEMs”), electronic manufacturing services (“EMS”) companies, which manufacture for OEMs on an outsourcing basis, and independent distributors that maintain large inventories of electronic components for resale to OEMs and EMS companies. See Note 15 to our consolidated financial statements for net revenues by customer type.
Our sales organizations are regionally based. While our sales and support procedures are typically similar across all regions, we remain flexible in our ability to offer programs tailored to our customers’ specific support requirements in each local area. The aim of our sales organizations is supporting our customers across all product lines, developing new design wins, negotiating contracts, and providing general commercial support as would normally be expected of a large multi-national sales force.
We have an established Strategic Global Account program, which provides each of our top customers with a dedicated Strategic Global Account Manager. Our Strategic Global Account Managers are typically highly experienced salesmen or saleswomen who are capable of providing key customers with the coordination and management visibility required in a complex multi-product business relationship. They typically coordinate the sales, pricing, contract, logistic, quality, and other aspects of the customer’s business requirements. The Strategic Global Account Manager normally is the focal point of communication between Vishay and our main customers. We maintain a similar program for our strategic distributors as well.
We work with our customers so that our products are incorporated into the design of electronic equipment at the earliest stages of development and to provide technical and applications support. In addition to our staff of direct field sales personnel, independent manufacturers’ representatives, and distributors, our Business Development group maintains teams of dedicated Field Application Engineers (“FAEs”) to assist our customers in solving technical problems and in developing products to meet specific customer application needs using our entire product portfolio to provide support for our customers’ engineering needs. Organized by market segment, our Business Development FAEs bring specific knowledge of component applications in their areas of expertise in the automotive, telecommunications, computer, consumer/entertainment, industrial, peripherals, digital consumer, and other market segments. With the ultimate goal of a Vishay “design-in” – the process by which our customers specify a Vishay component in their products – this program offers our customers enhanced access to all Vishay technologies while at the same time increasing design wins, and ultimately sales, for us. Most importantly, the process is closely monitored via a proprietary database developed by our Business Development group. Our database captures specific design activities and allows for real-time measurement of new business potential for our management team.
Our top 30 customers have been relatively stable despite not having long-term commitments to purchase our products. With selected customers, we have signed longer term (greater than one year) contracts for specific products. Net revenues from our top 30 customers represent approximately 70% of our total net revenues. No single customer comprised more than 10% of our total net revenues for 2020.
In certain areas we also work with sales representatives. The commission expense for these sales representatives is not material.
Research and Development
Many of our products and manufacturing techniques, technologies, and packaging methods have been invented, designed, and developed by Dr. Felix Zandman, our engineers, and our scientists. We maintain strategically placed design centers where proximity to customers enables us to more easily gauge and satisfy the needs of local markets. These design centers are located predominantly in the United States, Germany, Italy, Israel, the People’s Republic of China, France, and the Republic of China (Taiwan).
We also employ research and development personnel and promote programs at a number of our production facilities to develop new products and new applications of existing products and to improve manufacturing processes and technologies. This decentralized system encourages product development at individual manufacturing facilities, closer to our customers.
11
Competition
We face strong competition in various product lines from both domestic and foreign manufacturers. Our primary competitors by product type include:
| • |
MOSFETs:
Infineon, ON Semiconductor, Renesas, STMicroelectronics, Toshiba.
|
| • |
Diodes:
Diodes Inc., Nexperia, ON Semiconductor, Rohm, STMicroelectronics.
|
| • |
Optoelectronic Components:
Broadcom, ON Semiconductor, Renesas, Toshiba.
|
| • |
Resistors:
Bourns,
KOA, Murata, Panasonic, Rohm, TDK-EPCOS, Yageo.
|
| • |
Inductors:
Bourns,
Cyntec, Murata, Panasonic, Taiyo Yuden, TDK-EPCOS, Yageo.
|
| • |
Capacitors:
Kyocera, Murata, Nichicon, Panasonic, Taiyo Yuden, TDK-EPCOS, Yageo.
|
There are many other companies that produce products in the markets in which we compete.
Our competitive position depends on our ability to maintain a competitive advantage on the basis of product quality, know-how, proprietary data, market knowledge, service capability, technological innovation, business reputation, and price competitiveness. Our sales and marketing programs aim to compete by offering our customers a broad range of world-class technologies and products, superior global sales and distribution support, and a secure and multi-location source of product supply.
Recently there has been a considerable amount of consolidation activity in the electronic component industry, some of which involved our primary competitors. We view the industry consolidation as an opportunity for us to gain business as an independent second-source supplier.
Patents and Licenses
We have made a significant investment in securing intellectual property protection for our technology and products. We seek to protect our technology by, among other things, filing patent applications for technology considered important to the development of our business. We also rely upon trade secrets, unpatented know-how, continuing technological innovation, and the aggressive pursuit of licensing opportunities to help develop and maintain our competitive position.
Our ability to compete effectively with other companies depends, in part, on our ability to maintain the proprietary nature of our technology. Although we have been awarded, have filed applications for, or have been licensed under, numerous patents in the United States and other countries, there can be no assurance concerning the degree of protection afforded by these patents or the likelihood that pending patents will be issued.
We require all of our
technical, research and development, sales and marketing, and management employees and most consultants and other advisors to execute confidentiality agreements upon the commencement of employment or consulting relationships with us. These agreements provide that all confidential information developed or made known to the entity or individual during the course of the entity’s or individual’s relationship with us is to be kept confidential and not disclosed to third parties except in specific circumstances. Substantially all of our technical, research and development, sales and marketing, and management employees have entered into agreements providing for the assignment to us of rights to inventions made by them while employed by us.
When we believe other companies are misappropriating our intellectual property rights, we vigorously enforce those rights through legal action, and we intend to continue to do so. See Item 3, “Legal Proceedings.”
Although we have numerous United States and foreign patents covering certain of our products and manufacturing processes, no particular patent is considered individually material to our business.
Human Capital
As a global company, we collaborate internationally and celebrate the diversity of our local cultures. Employees are encouraged to bring their unique perspectives, help identify opportunities to collaborate, and open themselves to the career development that comes from learning from others.
As of
December 31, 2020
, we employed approximately
21,600
full time employees worldwide.
Reflecting our global business, our executive management team and many leadership positions are dispersed throughout the world.
12
Employees by location are summarized as follows:
|
United States
|
2,200
|
|||
|
People’s Republic of China
|
6,500
|
|||
|
Germany
|
2,100
|
|||
|
Israel
|
2,100
|
|||
|
Taiwan
|
1,800
|
|||
|
Czech Republic
|
1,200
|
|||
|
India
|
1,100
|
|||
|
Other Europe
|
1,500
|
|||
|
Other Americas
|
1,300
|
|||
|
Other Asia
|
1,800
|
|||
|
Total
|
21,600
|
Many of our employees outside the United States are members of workers councils or unions, or otherwise subject to collective bargaining agreements. Employees at one small U.S. facility, representing less than 1% of our U.S. workforce, are represented by a trade union. We consider our relations with our employees to be good.
Our future success is substantially dependent on our ability to attract and retain highly qualified technical and administrative personnel.
In order to prepare for the future Vishay introduced a Young Talent Program. Every year a diverse cross-cultural, cross-regional and cross-functional group of young individuals is being identified to prepare for higher leadership roles.
To identify and develop future leaders Vishay established a global Vishay Academy. Employee development programs focus on offering individual and group learning to maintain profitable business growth while also increasing speed and agility to meet customer demand. Global training and development programs include courses in leadership development, P&L management, business finance for non-finance leaders, distance leadership / global matrix management. A robust succession plan for the top 200 positions in the organization and levels below has been created recently. A specialist career model also provides development opportunities for technical roles in parallel to management careers.
Vishay has accelerated a global continuous improvement program to ensure increase of efficiencies and product quality through employee participation.
During the COVID-19 pandemic in 2020, Vishay continued to deliver training and development courses. To protect our employees, courses were delivered online, including live events for all employees. Communication from executive management has played an important role to regularly inform employees and keep them engaged.
Regulatory Compliance
We are required to comply with numerous regulations that are normal and customary to businesses in our industry and the jurisdictions in which we operate. These regulations relate to, among other things, environmental health and safety, procurement integrity, export control, government security regulations, employment practices, accuracy of records and the recording of costs, anti-corruption, and privacy. See Item 1A, “Risk Factors,” for additional discussion of such regulations and the potential consequences for non-compliance.
Environmental Health and Safety
We have adopted an Environmental Health and Safety Corporate Policy that commits us to achieve and maintain compliance with applicable environmental laws, to promote proper management of hazardous materials for the safety of our employees and the protection of the environment, and to minimize the hazardous materials generated in the course of our operations. This policy is implemented with accountability directly to the Board of Directors. In addition, our manufacturing operations are subject to various federal, state, and local laws restricting discharge of materials into the environment.
We are involved in environmental remediation programs at various sites currently or formerly owned by us and our subsidiaries both within and outside of the U.S., in addition to involvement as a potentially responsible party (“PRP”) at Superfund sites. Certain obligations as a PRP have arisen in connection with business acquisitions. The remediation programs are on-going and the ultimate cost of site cleanup is difficult to predict given the uncertainties regarding the extent of the required cleanup, the interpretation of applicable laws and regulations and alternative cleanup methods. See Item 3, “Legal Proceedings.”
We are not involved in any pending or threatened proceedings that would require curtailment of our operations. We continually expend funds to ensure that our facilities comply with applicable environmental regulations. While we believe that we are in material compliance with applicable environmental laws, we cannot accurately predict future developments and do not necessarily have knowledge of all past occurrences on sites that we currently occupy. More stringent environmental regulations may be enacted in the future, and we cannot determine the modifications, if any, in our operations that any such future regulations might require, or the cost of compliance with such regulations. Moreover, the risk of environmental liability and remediation costs is inherent in the nature of our business and, therefore, there can be no assurance that material environmental costs, including remediation costs, will not arise in the future.
13
With each acquisition, we attempt to identify potential environmental concerns and to minimize, or obtain indemnification for, the environmental matters we may be required to address. In addition, we establish reserves for specifically identified potential environmental liabilities. We believe that the reserves we have established are adequate. Nevertheless, we have in the past and may in the future inherit certain pre-existing environmental liabilities, generally based on successor liability doctrines. Although we have never been involved in any environmental matter that has had a material adverse impact on our overall operations, there can be no assurance that in connection with any past or future acquisition we will not be obligated to address environmental matters that could have a material adverse impact on our operations.
Company Information and Website
We file annual, quarterly, and current reports, proxy statements, and other documents with the Securities and Exchange Commission (“SEC”) under the Securities Exchange Act of 1934. The SEC maintains an Internet website that contains reports, proxy and information statements, and other information regarding issuers, including us, that file electronically with the SEC. The public can obtain any documents that we file with the SEC at http://www.sec.gov.
In addition, our company website can be found on the Internet at www.vishay.com. The website contains information about us and our operations. Copies of each of our filings with the SEC on Form 10-K, Form 10-Q, and Form 8-K, and all amendments to those reports, can be viewed and downloaded free of charge as soon as reasonably practicable after the reports and amendments are electronically filed with or furnished to the SEC. To view the reports, access ir.vishay.com and click on “SEC Filings.”
The following corporate governance related documents are also available on our website:
| • |
Corporate Governance Principles
|
| • |
Code of Business Conduct and Ethics
|
| • |
Code of Ethics for Financial Officers
|
| • |
Audit Committee Charter
|
| • |
Nominating and Corporate Governance Committee Charter
|
| • |
Compensation Committee Charter
|
| • |
Clawback Policy
|
| • |
Hedging-Pledging Policy
|
| • |
Nominating and Corporate Governance Committee Policy Regarding Qualification of Directors
|
| • |
Procedures for Securityholders’ Submissions of Nominating Recommendations
|
| • |
Related Party Transactions Policy
|
| • |
Ethics Helpline
|
To view these documents, access ir.vishay.com and click on “Corporate Governance.”
Any of the above documents can also be obtained in print by any stockholder upon request to our Investor Relations Department at the following address:
Corporate Investor Relations
Vishay Intertechnology, Inc.
63 Lancaster Avenue
Malvern, PA 19355-2143
14
|
Item 1A.
|
RISK FACTORS
|
From time to time, information provided by us, including but not limited to statements in this report, or other statements made by or on our behalf, may contain “forward-looking” information within the meaning of the Private Securities Litigation Reform Act of 1995. Such statements involve a number of risks, uncertainties, and contingencies, many of which are beyond our control, which may cause actual results, performance, or achievements to differ materially from those anticipated. Set forth below are important factors that could cause our results, performance, or achievements to differ materially from those in any forward-looking statements made by us or on our behalf. You should understand that it is not possible to predict or identify all such factors. Consequently, you should not consider the following to be a complete discussion of all potential risks or uncertainties.
Risks relating to our business
Our business may be adversely affected by the widespread outbreak of diseases, including the COVID-19 pandemic and the mitigation efforts by governments worldwide to control its spread.
The widespread global outbreak of COVID-19 has adversely affected our business. Impacts have included disruptions in our ability to manufacture products and disruptions in the operations of our customers and modes of shipping. While we are unable to accurately predict the full extent to which the COVID-19 pandemic and the mitigation efforts by governments to attempt to control its spread will have on our business due to numerous uncertainties, thus far the impacts have resulted in increased costs and a reduction in sales to certain regions and end-markets. We cannot predict when the impact of the COVID-19 pandemic will end or when future coronavirus outbreaks or pandemics will occur.
The potential risks and effects of the COVID-19 pandemic and the related economic crisis that could have an adverse effect on our business include, but are not limited to:
|
•
|
Adverse impact on our customers and supply channels;
|
|
•
|
Decrease in sales, product demand and pricing and unfavorable economic and market conditions;
|
|
•
|
Increased costs, including higher shipping costs due to reduced shipping capacity;
|
|
•
|
Restrictions on our manufacturing, support operations or workforce, or similar limitations for our customers, vendors, and suppliers, that could limit our ability to meet customer demand;
|
|
•
|
Potential increased credit risk if customers, distributors, and resellers are unable to pay us, or must delay paying their obligations to us;
|
|
•
|
Restrictions or disruptions of transportation, such as reduced availability of air transport, port closures, and increased border controls or closures could result in delays;
|
|
•
|
Impact on our workforce/employees due to the ease with which the virus spreads and the current shelter-in-place orders; and
|
|
•
|
Cybersecurity risks as a result of extended periods of remote work arrangements.
|
Such effects could result in us being required to record impairment charges related to our property and equipment, intangible assets, or goodwill.
Our business is cyclical and future periods of decline and increased demand are not predictable.
The electronic component industry is highly cyclical and experiences periods of decline from time to time. We and others in the electronic component industry have experienced these conditions in the recent past and cannot predict when we may experience downturns in the future. Market conditions, such as during a decline in product demand on a global basis, could result in order cancellations and deferrals, lower average selling prices, and a material and adverse impact on our results of operations. These declines in demand are usually driven by market conditions in the end markets for our products, but may also result from distributors not appropriately managing their inventory levels.
We may also experience intense demand for our products in periods of a rising economy and we may have difficulty expanding our manufacturing capacity to satisfy demand during such periods. Factors which could limit such expansion include delays in procurement of manufacturing equipment, shortages of skilled personnel, and physical constraints on expansion of our facilities.
Changes in the demand mix, needed technologies, and these end markets may adversely affect our ability to match our products, inventory, and capacity to meet customer demand and could adversely affect our operating results and financial condition. A slowdown in demand or recessionary trends in the global economy makes it more difficult for us to predict our future sales and manage our operations, and could adversely impact our results of operations. C
apacity that we add during upturns in the business cycle may result in excess capacity during periods when demand for our products recede, resulting in inefficient use of capital which could also adversely affect us.
15
We have incurred, and may in the future incur, restructuring costs and associated asset write-downs.
To remain competitive, particularly when business conditions are difficult, we sometimes attempt to reduce our cost structure by restructuring our existing businesses, where we seek to achieve synergies, eliminate redundant facilities and staff positions, and move operations, where possible, to jurisdictions with lower labor costs. We incurred restructuring costs in 2020 and 2019 to implement global cost reduction and management rejuvenation programs as part of our continuous efforts to improve efficiency and operating performance. We also incurred significant restructuring expenses from 2014 to 2017, including accelerated depreciation expenses related to assets that were no longer used after the implementation of the associated restructuring programs.
Additionally, our long-term strategy includes growing through the integration of acquired businesses, and GAAP requires plant closure and employee termination costs that we incur in connection with our acquisition activities to be recorded as expenses in our consolidated statement of operations, as such expenses are incurred. For this reason, we expect to have some level of future restructuring expenses due to acquisitions.
In the past we have grown through successful integration of acquired businesses, but this may not continue.
Our long-term historical growth in revenues and net earnings has resulted in large part from our strategy of expansion through acquisitions. Despite our plan to continue to grow, in part, through targeted acquisitions, we may be unable to continue to identify, have the financial capabilities to acquire, or successfully complete transactions with suitable acquisition candidates. We are subject to various U.S. and foreign competition laws and regulations that may affect our ability to complete certain acquisitions. Also, if an acquired business fails to operate as anticipated, cannot be successfully integrated with our other businesses, or we cannot effectively mitigate the assumed, contingent, and unknown liabilities acquired, our results of operations, financial condition, enterprise value, market value, and prospects could all be materially adversely affected.
To remain successful, we must continue to innovate, and our investments in new technologies may not prove successful.
Our future operating results are dependent on our ability to continually develop, introduce, and market new and innovative products, to modify existing products, to respond to technological change, and to customize certain products to meet customer requirements. There are numerous risks inherent in this process, including the risks that we will be unable to anticipate the direction of technological change or that we will be unable to develop and market new products and applications in a timely fashion to satisfy customer demands. If this occurs, we could lose customers and experience adverse effects on our financial condition and results of operations.
In addition to our own research and development initiatives, we periodically invest in technology start-up enterprises, in which we may acquire a controlling or noncontrolling interest but whose technology would be available to be commercialized by us. There are numerous risks in investments of this nature including the limited operating history of such start-up entities, their need for capital, and their limited or absence of production experience, as well as the risk that their technologies may prove ineffective or fail to gain acceptance in the marketplace. Certain of our historical investments in start-up companies have not succeeded, and there can be no assurance that our current and future investments in start-up enterprises will prove successful.
Our results are sensitive to raw material availability, quality, and cost.
Many of our products require the use of raw materials that are produced in only a limited number of regions around the world or are available from only a limited number of suppliers. Our results of operations may be materially adversely affected if we have difficulty obtaining these raw materials, the quality of available raw materials deteriorates, or there are significant price increases for these raw materials. The determination that any of the raw materials used in our products are so called "conflict minerals" originating from the Democratic Republic of the Congo or adjoining countries could increase the probability that we will encounter the challenges noted above, incur additional expenses to comply with government regulations, and face public scrutiny. For periods in which the prices of these raw materials are rising, we may be unable to pass on the increased cost to our customers, which would result in decreased margins for the products in which they are used. For periods in which the prices are declining, we may be required to write down our inventory carrying cost of these raw materials, because we record our inventory at the lower of cost or market. Depending on the extent of the difference between market price and our carrying cost, this write-down could have a material adverse effect on our results of operations.
From time to time there have been short-term market shortages of certain raw materials used in our products. While these shortages have not historically adversely affected our ability to increase production of products containing these materials, they have historically resulted in higher raw material costs for us. We cannot make any assurances that any of these market shortages in the future would not adversely affect our ability to increase production, particularly during periods of growing demand for our products. To assure availability of raw materials in times of shortage, we may enter into long-term supply contracts for these materials, which may prove costly, unnecessary, and burdensome when the shortage abates.
16
Our ability to compete effectively with other companies depends, in part, on our ability to maintain the proprietary nature of our technology and to operate our business without infringing or violating the intellectual property rights of others.
Protection of intellectual property often involves complex legal and factual issues. We will be able to protect our proprietary rights from unauthorized use by third parties only to the extent that our proprietary technologies are covered by valid and enforceable patents or are effectively maintained as trade secrets. We have applied, and will continue to apply, for patents covering our technologies and products, as we deem appropriate. However, our applications may not result in issued patents. Also, our existing patents and any future patents may not be sufficiently broad to prevent others from practicing our technologies or from developing competing products. Others may independently develop similar or alternative technologies, design around our patented technologies, or may challenge or seek to invalidate our patents. Also, the legal system in certain countries in which we operate may not provide or may not continue to provide sufficient, intellectual property legal protections and remedies.
Litigation regarding patent and other intellectual property rights is prevalent in the electronic components industry, particularly the discrete semiconductor sector. We have on occasion been notified that we may be infringing on patent and other intellectual property rights of others. In addition, customers purchasing components from us have rights to indemnification under certain circumstances if such components violate the intellectual property rights of others. Further, we have observed that in the current business environment, electronic component and semiconductor companies have become more aggressive in asserting and defending patent claims against competitors. We will continue to vigorously defend our intellectual property rights, and may become party to disputes regarding patent licensing and cross patent licensing. Although licenses are generally offered in such situations and we have successfully resolved these situations in the past, there can be no assurance that we will not be subject to future litigation alleging intellectual property rights infringement, or that we will be able to obtain licenses on acceptable terms. An unfavorable outcome regarding one of these matters could have a material adverse effect on our business and results of operations.
We face intense competition in our business, and we market our products to an increasingly concentrated group of customers.
Our business is highly competitive worldwide, with low transportation costs and few import barriers. We compete principally on the bases of product quality and reliability, availability, customer service, technological innovation, timely delivery, and price. The electronic component industry has become increasingly concentrated and globalized in recent years as many of our primary competitors have been acquired. The acquiring companies, most of which are larger than us, have significant financial resources and technological capabilities.
Our customers have also become increasingly concentrated in recent years, and as a result, their buying power has increased and they have had greater ability to negotiate favorable pricing and terms. This trend has adversely affected our average selling prices, particularly for commodity components.
Our backlog is subject to customer cancellation.
Many of the orders that comprise our backlog may be canceled by our customers without penalty. Our customers may on occasion double and triple order components from multiple sources to ensure timely delivery when demand exceeds global supply. They often cancel orders when business is weak and inventories are excessive. Therefore, we cannot be certain that the amount of our backlog accurately reflects the level of orders that we will ultimately deliver. Our results of operations could be adversely impacted if customers cancel a material portion of orders in our backlog.
Our future success is substantially dependent on our ability to attract and retain highly qualified technical, managerial, marketing, finance, and administrative personnel.
Rapid changes in technologies, frequent new product introductions, and declining average selling prices over product life cycles require us to attract and retain highly qualified personnel to develop and manufacture products that feature technological innovations and bring them to market on a timely basis. Our complex operations also require us to attract and retain highly qualified administrative personnel in functions such as legal, tax, accounting, financial reporting, auditing, and treasury. The market for personnel with such qualifications is highly competitive. While we have employment agreements with certain of our executives, we have not entered into employment agreements with all of our key personnel.
The loss of the services of or the failure to effectively recruit qualified personnel could have a material adverse effect on our business.
17
Interruptions in our information technology systems could adversely affect our business.
We rely on the efficient and uninterrupted operation of complex information technology systems and networks to operate our business. Any significant system or network disruption, including, but not limited to, new system implementations, computer viruses, security breaches, phishing, spoofing, cyberattacks, facility issues or energy blackouts could have a material adverse impact on our operations and results of operations. These incidents, which might be related to industrial or other espionage, include covertly introducing malware and spyware to our computers and networks (or to an electronic system operated by a third party for our benefit) and impersonating authorized users, among others. Such a network disruption could result in a loss of the confidentiality of our intellectual property or the release of sensitive competitive information or customer, supplier or employee personal data. Any loss of such information could harm our competitive position, result in a loss of customer confidence, and cause us to incur significant costs to remedy the damages caused by the disruptions or security breaches. We have implemented protective measures to prevent against and limit the effects of system or network disruptions, but there can be no assurance that such measures will be sufficient to prevent or limit the damage from any disruptions and any such disruption could have a material adverse impact on our business and results of operations.
Third-party service providers, such as foundries, subcontractors, distributors, and vendors have access to certain portions of our sensitive data. In the event that these service providers do not properly safeguard our data that they hold, security breaches and loss of our data could result. Any such loss of data by our third-party service providers could have a material adverse impact on our business and results of operations.
Significant fluctuations in interest rates could adversely affect our results of operations and financial position.
We are exposed to changes in interest rates as a result of our borrowing activities and our cash balances. Our credit facility bears interest at variable rates based on LIBOR. A significant increase in LIBOR would significantly increase our interest expense. A general increase in interest rates would be largely offset by an increase in interest income earned on our cash and short-term investment balances, which are currently greater than our debt balances. However, there can be no assurance that the interest rate earned on cash and short-term investments will move in tandem with the interest rate paid on our variable rate debt.
Future acquisitions could require us to issue additional indebtedness or equity.
If we were to undertake a substantial acquisition for cash, the acquisition would likely need to be financed in part through bank borrowings or the issuance of public or private debt. This acquisition financing would likely decrease our ratio of earnings to fixed charges and adversely affect other leverage criteria. Under our credit facility, we are required to obtain the lenders’ consent for certain additional debt financing and to comply with other covenants including the application of specific financial ratios. We cannot make any assurances that the necessary acquisition financing would be available to us on acceptable terms if and when required. If we were to undertake an acquisition for equity, the acquisition may have a dilutive effect on the interests of the holders of our common stock.
Regulatory and compliance related risks
Future changes in our environmental liability and compliance obligations may harm our ability to operate or increase our costs.
Our operations, products and/or product packaging are subject to, among other matters, environmental laws and regulations governing, among other matters, air emissions, wastewater discharges, the handling, disposal and remediation of hazardous substances, wastes and certain chemicals used or generated in our manufacturing processes, employee health and safety labeling or other notifications with respect to the content or other aspects of our processes, products or packaging, restrictions on the use of certain materials in or on design aspects of our products or product packaging, and responsibility for disposal of products or product packaging. We establish reserves for specifically identified potential environmental liabilities. Nevertheless, we have in the past and may in the future inherit certain pre-existing environmental liabilities, generally based on successor liability doctrines, or otherwise incur environmental liabilities. We are involved in remediation programs and related litigation at various current and former properties and at third-party disposal sites both within and outside of the United States, including involvement as a potentially responsible party at Superfund sites. Although we have never been involved in any environmental matter that has had a material adverse impact on our overall operations, there can be no assurance that in connection with any past or future acquisition, future developments, including related to our remediation programs, or otherwise, we will not be obligated to address environmental matters that could have a material adverse impact on our results of operations. In addition, more stringent environmental laws and regulations may be enacted in the future, and we cannot presently determine the modifications, if any, in our operations that any such future regulations might require, or the cost of compliance with current and future laws and regulations. In order to resolve liabilities at various sites, we have entered into various administrative orders and consent decrees, some of which may be, under certain conditions, reopened or subject to renegotiation.
Our products are sold to or used in goods sold to the U.S. government and other governments. By virtue of such sales, we are subject to various regulatory requirements and risks in the event of non-compliance.
We sell products under prime and subprime contracts with the U.S. government and other governments. Many of these products are used in military applications. Government contractors must comply with specific procurement regulations and other requirements. These requirements, although customary in government contracts, impact our performance and compliance costs. Failure to comply with these regulations and requirements could result in contract modifications or termination, and the assessment of penalties and fines, which could negatively impact our results of operations and financial condition. Our failure to comply with these regulations and requirements could also lead to suspension or debarment, for cause, from government contracting or subcontracting for a period of time. Among the causes for debarment are violations of various statutes, including those related to procurement integrity, export control, government security regulations, employment practices, protection of the environment, accuracy of records and the recording of costs, and foreign corruption. The termination of a government contract as a result of any of these acts could have a negative impact on our results of operations and financial condition and could have a negative impact on our reputation and ability to procure other government contracts in the future.
18
We have qualified certain of our products under various military specifications approved and monitored by the United States Defense Electronic Supply Center and under certain European military specifications. These products are assigned certain classification levels. In order to maintain the classification level of a product, we must continuously perform tests on the products and the results of these tests must be reported to governmental agencies. If a product fails to meet the requirements of the applicable classification level, its classification may be reduced to a lower level. A decrease in the classification level for a product with a military application could have an adverse impact on the net revenues and earnings attributable to that product.
Our credit facility restricts our current and future operations and requires compliance with certain financial covenants.
Our credit facility includes restrictions on, among other things, incurring indebtedness, incurring liens on assets, making investments and acquisitions, making asset sales, and paying cash dividends and making other restricted payments. Our credit facility also requires us to comply with other covenants, including the maintenance of specific financial ratios. If we are not in compliance with all of such covenants, the credit facility could be terminated by the lenders, and all amounts outstanding pursuant to the credit facility could become immediately payable. Additionally, our convertible debt instruments have cross-default provisions that could accelerate repayment in the event the indebtedness under the credit facility is accelerated.
Risks associated with our operations outside the United States
We are subject to the risks of political, economic, and military instability in countries outside the United States in which we operate.
We have substantial operations outside the United States, and approximately 75% of our revenues during 2020 were derived from sales to customers outside the United States. Certain of our assets are located, and certain of our products are produced, in countries which are subject to risks of social, political, economic, and military instability. This instability could result in wars, riots, nationalization of industry, currency fluctuation, and labor unrest. These conditions could have an adverse impact on our ability to operate in these regions and, depending on the extent and severity of these conditions, could materially and adversely affect our overall financial condition, results of operations, and our ability to access our liquidity.
Our business has been in operation in Israel for 50 years, where we have substantial manufacturing operations. Although we have never experienced any material interruption in our operations attributable to these factors, in spite of several Middle East crises, including wars, our financial condition and results of operations might be adversely affected if events were to occur in the Middle East that interfered with our operations in Israel.
Our global operations are subject to extensive anti-corruption laws and other regulations.
The U.S. Foreign Corrupt Practices Act and similar foreign anti-corruption laws generally prohibit companies and their intermediaries from making improper payments or providing anything of value to improperly influence foreign government officials for the purpose of obtaining or retaining business, or obtaining an unfair advantage. Recent years have seen a substantial increase in the global enforcement of anti-corruption laws. Our continued operation and expansion outside the United States, including in developing countries, could increase the risk of such violations or violations under other regulations relating to limitations on or licenses required for sales made to customers located in certain countries. Violations of these laws may result in severe criminal or civil sanctions, could disrupt our business, and result in a material adverse effect on our reputation, business and results of operations or financial condition.
We attempt to improve profitability by controlling labor costs, but these activities could result in labor unrest or considerable expense.
Historically, our primary labor cost controlling strategy was to transfer manufacturing operations to countries with lower production costs, such as the Dominican Republic, India, Malaysia, Mexico, the People’s Republic of China, and the Philippines. We believe that our manufacturing footprint is suitable to serve our customers and end markets, while maintaining lower manufacturing costs. We do not anticipate further transferring any significant existing operations to lower-labor-cost countries; however, acquired operations may be transferred to lower-labor-cost countries when integrated into Vishay. Currently, our primary labor cost controlling strategy involves reducing hours and limiting the use of subcontractors and foundries when demand for our products decreases. Shifting operations to lower-labor-cost countries, reducing hours, or limiting the use of subcontractors and foundries could result in production inefficiencies, higher costs, and/or strikes or other types of labor unrest.
19
We are subject to foreign currency exchange rate risks which may impact our results of operations.
We are exposed to foreign currency exchange rate risks, particularly due to market values of transactions in currencies other than the functional currencies of certain subsidiaries. From time to time, we utilize forward contracts to hedge a portion of projected cash flows from these exposures.
Our significant foreign subsidiaries are located in Germany, Israel, and Asia. We finance our operations in Europe and certain locations in Asia in local currencies. Our operations in Israel and most significant locations in Asia are largely financed in U.S. dollars, but these subsidiaries also have significant transactions in local currencies. Our exposure to foreign currency risk is mitigated to the extent that the costs incurred and the revenues earned in a particular currency offset one another. Our exposure to foreign currency risk is more pronounced in situations where, for example, production labor costs are predominantly paid in local currencies while the sales revenue for those products is denominated in U.S. dollars. This is particularly the case for products produced in Israel, the Czech Republic, and China.
A change in the mix of the currencies in which we transact our business could have a material effect on results of operations. Furthermore, the timing of cash receipts and disbursements could have a material effect on our results of operations, particularly if there are significant changes in exchange rates in a short period of time.
Most of our operating cash is generated by our non-U.S. subsidiaries, and our U.S. parent company and U.S. subsidiaries have significant payment obligations.
We generate a significant amount of cash and profits from our non-U.S. subsidiaries. We used substantially all of the amounts repatriated in 2018, 2019, and 2020 to significantly re-shape the capital structure of the Company. As of December 31, 2020, substantially all of our cash and cash equivalents and short-term investments were held by subsidiaries outside of the United States. Our unused revolving credit facility provides us with additional U.S. liquidity.
U.S. tax obligations, cash dividends to stockholders, share repurchases, additional convertible debt repurchases, and principal and interest payments on our debt instruments need to be paid by our U.S. parent company, Vishay Intertechnology, Inc. Our U.S. subsidiaries have other operating cash needs.
If our U.S. cash and cash equivalents and short-term investment and other liquidity sources are inadequate to satisfy these obligations, we may be required to repatriate additional cash to the United States. If we are unable to repatriate adequate cash to the United States to satisfy these obligations, it could materially and adversely affect our overall financial condition, results of operations and our liquidity.
Changes in U.S. trade policies, and related factors beyond our control, may adversely impact our business, financial condition, and results of operations.
Our business is subject to risks associated with U.S. and foreign legislation and regulations relating to imports, including quotas, duties, tariffs or taxes, and other import charges or restrictions, which could adversely affect our operations and our ability to import products. The U.S. has taken actions that impact U.S. trade with China, including imposing tariffs on certain goods manufactured in China and imported into the U.S., including certain of our products. Such actions may impact our competitiveness and adversely affect the demand for these products, or if those costs cannot be passed on to our customers, could adversely impact our results of operations for affected segments and the Company as a whole.
Further changes in U.S. trade policy could trigger additional retaliatory actions by affected countries. If these consequences are realized, it could result in a general economic downturn or otherwise have a material adverse effect on our business.
20
Risks related to our capital structure
The holders of our Class B common stock have effective voting control of our company, giving them the effective ability to prevent a change in control transaction.
We have two classes of common stock: common stock and Class B common stock. The holders of common stock are entitled to one vote for each share held, while the holders of Class B common stock are entitled to 10 votes for each share held. At December 31, 2020, the holders of Class B common stock held approximately 47.7% of the voting power of the Company. The ownership of Class B common stock is highly concentrated, and holders of Class B common stock effectively can cause the election of directors and approve other actions as stockholders. Mrs. Ruta Zandman (a member of our Board of Directors) controls the voting of, solely or on a shared basis with Marc Zandman (our Executive Chairman) and Ziv Shoshani (a member of our Board of Directors), approximately 89.7% of our Class B common stock and 42.9% of the total voting power of our capital stock as of December 31, 2020. Holders of our Class B common stock may act in ways that are contrary to, or not in the best interests of, holders of our common stock. The voting rights of the holders of our Class B common stock effectively give such holders the ability to prevent transactions that would result in a change in control of us, including transactions in which holders of our common stock might otherwise receive a premium for their shares over the then-current market price.
Our acquisition strategy could be impeded if our Board of Directors were reluctant to authorize the issuance of substantial additional shares.
Our overall long-term business strategy has historically included a strong focus on acquisitions financed alternatively through cash on hand or the incurrence of indebtedness. We may in the future be presented with attractive investment or strategic opportunities that, because of their size and our financial condition at the time, would require the issuance of substantial additional amounts of our common stock. If such opportunities were to arise, our Board of Directors may consider the potentially dilutive effect on the interests and voting power of our existing stockholders, including our Class B stockholders, and may therefore be reluctant to authorize the issuance of additional shares. Any such reluctance could impede our ability to complete certain transactions.
Our outstanding convertible debt instruments may impact the trading price of our common stock.
We believe that many investors in, and potential purchasers of, convertible debt instruments employ, or seek to employ, a convertible arbitrage strategy with respect to these instruments. Investors that employ a convertible arbitrage strategy with respect to convertible debt instruments typically implement that strategy by selling short the common stock underlying the convertible instrument and dynamically adjusting their short position while they hold the instrument. The implementation of this strategy by investors in our convertible debentures, as well as related market regulatory actions, could have a significant impact on the trading prices of our common stock, and the trading prices and liquidity of our convertible debentures. The price of our common stock and our convertible debentures could also be affected by possible sales of our common stock by investors who view our convertible debentures as more attractive means of equity participation in us.
Anti-takeover defenses in our amended and restated certificate of incorporation, our amended and restated bylaws and under Delaware law may impede or discourage a merger, a takeover attempt or other business combinations, which could also reduce the market price of our common stock.
We are a Delaware corporation, and the anti-takeover provisions of Delaware law impose various impediments to the ability of a third party to acquire control of us, even if a change in control would be beneficial to our existing stockholders. Our amended and restated certificate of incorporation and amended and restated bylaws also contain provisions that could delay or prevent a change in control of our company. These provisions could also make it difficult for stockholders to elect directors that are not nominated by the current members of our board of directors or take other corporate actions, including effecting changes in our management. These provisions include:
|
•
|
the provision that our Class B common stock is generally entitled to ten votes per share, while our common stock is entitled to one vote per share, enabling the holders of our Class B common stock to effectively control the outcome of substantially all matters submitted to a vote of our stockholders, including the election of directors and change of control transactions;
|
|
•
|
the provision establishing a classified board of directors with three-year staggered terms and the provision that a director may be removed only for cause, each of which could delay the ability of stockholders to change the membership of a majority of our board of directors;
|
|
•
|
the ability of our board of directors to issue shares of preferred stock and to determine the price and other terms of those shares, including preferences and voting rights, without stockholder approval, which could be used to significantly dilute the ownership of a hostile acquirer;
|
|
•
|
the right of our board of directors to elect a director to fill a vacancy created by the expansion of our board of directors or the resignation, death or removal of a director, which prevents stockholders from being able to fill vacancies on our board of directors;
|
|
•
|
the requirement that a special meeting of stockholders may be called only by the directors or by any officer instructed by the directors to call the meeting, which could delay the ability of our stockholders to force consideration of a proposal or to take action, including the removal of directors; and
|
|
•
|
the ability of our board of directors, by majority vote, to amend the bylaws, which may allow our board of directors to take additional actions to prevent an unsolicited takeover and inhibit the ability of an acquirer to amend the bylaws to facilitate an unsolicited takeover attempt.
|
21
In addition, as a Delaware corporation, we are subject to Section 203 of the Delaware General Corporation Law. This statute prohibits a Delaware corporation listed on a national securities exchange from engaging in a business combination with an interested stockholder (generally a person who, together with its affiliates, owns or within the last three years has owned 15% or more of our voting stock subject to certain exceptions) for a period of three years after the date of the transaction in which the person became an interested stockholder, unless the business combination is approved in a prescribed manner. The application of Section 203 also could have the effect of delaying or preventing a change in control of us. Any of these provisions could, under certain circumstances, depress the market price of our common stock.
The ability of our board of directors or a committee thereof to create and issue a new series of preferred stock and certain provisions of Delaware law and our certificate of incorporation and bylaws could impede a merger, takeover attempt or other business combination involving us or discourage a potential acquirer from making a tender offer for our common stock, which, under certain circumstances, could reduce the market price of our common stock.
Risks related to the spin-off of the Vishay Precision Group
Vishay Precision Group is using the Vishay
name under license from us, which could result in product and market confusion or the loss of certain of our rights to the Vishay name
.
VPG has a worldwide, perpetual and royalty-free license from us to use the “Vishay” mark
as part of its corporate name and in connection with the manufacture, sale, and marketing of the products and services that comprise its measurements and foil resistors businesses. The license of the Vishay name to VPG is important to VPG because the success of VPG depends on the reputation of the Vishay brand for these products and services built over many years. Nonetheless, there exists the risk that the use by VPG could cause confusion in the marketplace over the products of the two companies, that any negative publicity associated with a product or service of VPG following the spin-off could be mistakenly attributed to our company or that we could lose our own rights to the “Vishay” mark if we fail to impose sufficient controls on VPG’s use of the mark.
General Risk Factors
In addition to the risks relating specifically to our business, a variety of other factors relating to general conditions could cause actual results, performance, or achievements to differ materially from those expressed in any of our forward-looking statements. These factors include:
| • |
overall economic and business conditions;
|
| • |
competitive factors in the industries in which we conduct our business;
|
| • |
changes in governmental regulation;
|
| • |
changes in tax requirements, including tax rate changes, new tax laws, and revised tax law interpretations;
|
| • |
changes in GAAP or interpretations of GAAP by governmental agencies and self-regulatory groups;
|
| • |
interest rate fluctuations, foreign currency rate fluctuations, and other capital market conditions; and
|
| • |
economic and political conditions in international markets, including governmental changes and restrictions on the ability to transfer capital across borders.
|
Our common stock, traded on the New York Stock Exchange, has in the past experienced, and may continue to experience, significant fluctuations in price and volume. We believe that the financial performance and activities of other publicly traded companies in the electronic component industry could cause the price of our common stock to fluctuate substantially without regard to our operating performance.
We operate in a continually changing business environment, and new factors emerge from time to time. Other unknown and unpredictable factors also could have a material adverse effect on our future financial condition and results of operations.
22
|
Item 1B.
|
UNRESOLVED STAFF COMMENTS
|
None.
|
Item 2.
|
PROPERTIES
|
At December 31, 2020, our business had 54 manufacturing locations. Our manufacturing facilities include owned and leased locations. Some locations include both owned and leased facilities in the same location. The list of manufacturing facilities below excludes former manufacturing facilities that are not presently used for manufacturing activities due to our restructuring activities. See Note 4 to our consolidated financial statements for further information related to our restructuring efforts, as well as additional information in “Cost Management” included in Item 7, “Management’s Discussion and Analysis of Financial Condition and Results of Operations.”
In the opinion of management, our properties and equipment generally are in good operating condition and are adequate for our present needs. Owning many of our manufacturing facilities provides us meaningful financial and operating benefits, including long-term stability and a necessary buffer for economic downturns. We do not anticipate difficulty in renewing existing leases as they expire or in finding alternative facilities.
The principal locations of our owned manufacturing facilities, along with available space including administrative offices, are as follows:
|
Owned Locations
|
Business Segment
|
Approx. Available Space (Square Feet)
|
|
|
United States
|
|||
|
Columbus, NE
|
Resistors
|
201,000
|
|
|
Bennington, VT
|
Capacitors
|
64,000
|
|
|
Yankton, SD
|
Inductors
|
60,000
|
|
|
Warwick, RI
|
Resistors
|
56,000
|
|
|
Niagara Falls, NY
|
Resistors
|
34,000
|
|
|
Marshall, MN
|
Inductors
|
22,000
|
|
|
Non-U.S.
|
|||
|
Vocklabruck, Austria
|
Diodes
|
100,000
|
|
|
People's Republic of China
|
|||
|
Tianjin
|
Diodes
|
370,000
|
|
|
Shanghai
|
Diodes
|
195,000
|
|
|
Xi'an
|
MOSFETs and Diodes
|
121,000
|
|
|
Czech Republic
|
|||
|
Blatna
|
Resistors and Capacitors
|
276,000
|
|
|
Dolni Rychnov
|
Resistors and Capacitors
|
183,000
|
|
|
Prachatice
|
Capacitors
|
92,000
|
|
|
Volary
|
Resistors
|
35,000
|
|
|
France
|
|||
|
Nice
|
Resistors
|
221,000
|
|
|
Chateau Gontier
|
Resistors
|
82,000
|
|
|
Hyeres
|
Resistors
|
59,000
|
|
|
Germany
|
|||
|
Selb
|
Resistors and Capacitors
|
472,000
|
|
|
Heide
|
Resistors
|
264,000
|
|
|
Landshut
|
Capacitors
|
75,000
|
|
|
Fichtelberg
|
Resistors
|
36,000
|
|
|
Budapest, Hungary
|
Diodes
|
101,000
|
|
|
Loni, India
|
Resistors and Capacitors
|
395,000
|
|
|
Israel
|
|||
|
Dimona
|
Resistors and Capacitors
|
404,000
|
|
|
Migdal Ha'Emek
|
Capacitors
|
288,000
|
|
|
Be'er Sheva
|
Resistors, Inductors and Capacitors
|
276,000
|
|
|
Turin, Italy
|
Diodes
|
102,000
|
|
|
Miharu, Japan
|
Capacitors
|
165,000
|
|
|
Melaka, Malaysia
|
Optoelectronic Components
|
156,000
|
|
|
Juarez, Mexico
|
Resistors
|
60,000
|
|
|
Famalicao, Portugal
|
Capacitors
|
222,000
|
|
|
Republic of China (Taiwan)
|
|||
|
Taipei
|
Diodes
|
366,000
|
|
|
Kaohsiung
|
MOSFETs
|
63,000
|
23
The principal locations of our leased manufacturing facilities, along with available space including administrative offices, are as follows:
|
Leased Locations
|
Business Segment
|
Approx. Available
Space (Square Feet)
|
|
|
United States
|
|||
|
Columbus, NE
|
Resistors
|
87,000
|
|
|
Milwaukee, WI
|
Resistors
|
42,000
|
|
|
Ontario, CA
|
Resistors
|
38,000
|
|
|
Dover, NH
|
Inductors
|
35,000
|
|
|
Hollis, NH
|
Resistors
|
25,000
|
|
|
Fremont, CA
|
Resistors
|
18,000
|
|
|
East Windsor, CT
|
Resistors
|
17,000
|
|
|
Duluth, MN
|
Inductors
|
10,000
|
|
|
Non-U.S.
|
|||
|
Klagenfurt, Austria
|
Capacitors
|
150,000
|
|
|
People’s Republic of China
|
|||
|
Danshui
|
Capacitors, Inductors, and Resistors
|
446,000
|
|
|
Shanghai
|
MOSFETs
|
300,000
|
|
|
Shatian
|
Capacitors and Resistors
|
218,000
|
|
|
Zhuhai
|
Inductors
|
179,000
|
|
|
Long Xi
|
Resistors
|
36,000
|
|
|
Prestice, Czech Republic
|
Capacitors
|
15,000
|
|
|
Santo Domingo, Dominican Republic
|
Inductors
|
44,000
|
|
|
Germany
|
|||
|
Itzehoe
|
MOSFETs
|
217,000
|
|
|
Heilbronn
|
Diodes and Optoelectronic Components
|
139,000
|
|
|
Selb
|
Capacitors
|
47,000
|
|
|
Mumbai, India
|
Diodes
|
34,000
|
|
|
Mexico
|
|||
|
Juarez
|
Resistors
|
102,000
|
|
|
Mexicali
|
Resistors
|
15,000
|
|
|
Manila, Philippines
|
Optoelectronic Components
|
149,000
|
|
|
Kaohsiung, Republic of China (Taiwan)
|
Diodes
|
130,000
|
24
|
Item 3.
|
LEGAL PROCEEDINGS
|
From time to time we are involved in routine litigation incidental to our business. Management believes that such matters, either individually or in the aggregate, should not have a material adverse effect on our business or financial condition.
Intellectual Property Matters
We are engaged in discussions with various parties regarding patent licensing and cross patent licensing issues. In addition, we have observed that in the current business environment, electronic component and semiconductor companies have become more aggressive in asserting and defending patent claims against competitors. We are a party to disputes alleging infringement of third-party patents. When we believe other companies are misappropriating our intellectual property rights, we vigorously enforce those rights through legal action, and we intend to continue to do so.
Environmental Matters
Vishay is involved in environmental remediation programs at various sites currently or formerly owned by Vishay and its subsidiaries both within and outside of the U.S., in addition to involvement as a potentially responsible party (“PRP”) at Superfund sites. Certain obligations as a PRP have arisen in connection with business acquisitions. The remediation programs are on-going and the ultimate cost of site cleanup is difficult to predict given the uncertainties regarding the extent of the required cleanup, the interpretation of applicable laws and regulations, and alternative cleanup methods. See also Note 13 to our consolidated financial statements.
Vishay GSI, Inc. (“VGSI”), a wholly owned subsidiary of the Company, is a direct defendant in two separate, but related, litigation matters: (1)
101 Frost Street Associates, L.P. v. United States Department of Energy et al
.; and (2)
Hicksville Water District v. United States Department of Energy, et al
. VGSI is also a third-party defendant in a third related matter,
United States v Island Transportation Corp. et al.
All three cases are pending in the United State District Court for the Eastern District of New York.
The three cases contain claims for recovery of response costs under the Comprehensive Environmental Response, Compensation and Liability Act (“CERCLA”), and allege that a predecessor’s manufacturing operations in Hicksville, New York (the “Site”), between 1960 and 1993, impacted groundwater beneath and downgradient of the Site. The groundwater beneath and downgradient of the Site is part of the New Cassel/Hicksville Groundwater Contamination Site, which was added to the National Priorities List pursuant to CERCLA on September 15, 2011. The Company is vigorously contesting plaintiff’s claims and will aggressively prosecute its affirmative claims.
|
Item 4.
|
MINE SAFETY DISCLOSURES
|
None.
25
INFORMATION ABOUT OUR EXECUTIVE OFFICERS
The following table sets forth certain information regarding our executive officers as of February 24, 2021:
|
Name
|
Age
|
Positions Held
|
|
|
Marc Zandman*
|
59
|
Executive Chairman of the Board, Chief Business Development Officer, and President, Vishay Israel Ltd.
|
|
|
Dr. Gerald Paul*
|
71
|
Chief Executive Officer, President, and Director
|
|
|
Lori Lipcaman
|
63
|
Executive Vice President and Chief Financial Officer
|
|
|
Johan Vandoorn
|
64
|
Executive Vice President and Chief Technical Officer
|
|
|
David Valletta
|
60
|
Executive Vice President Worldwide Sales
|
|
|
Joel Smejkal
|
54
|
Executive Vice President Corporate Business Development
|
|
|
Clarence Tse
|
62
|
Executive Vice President and Business Head Semiconductors
|
|
|
Jeff Webster
|
50
|
Executive Vice President and Business Head Passive Components
|
|
|
Andreas Randebrock
|
56
|
Executive Vice President Global Human Resources
|
* Member of the Executive Committee of the Board of Directors.
Marc Zandman was appointed Executive Chairman of the Board and Chief Business Development Officer effective June 5, 2011. Mr. Zandman has served as a Director of Vishay since 2001 and President of Vishay Israel Ltd. since 1998. Mr. Zandman previously was Vice Chairman of the Board from 2003 to June 2011, and Chief Administration Officer from 2007 to June 2011. Mr. Zandman was Group Vice President of Vishay Measurements Group from 2002 to 2004. Mr. Zandman has served in various other capacities with Vishay since 1984. He is the son of the late Dr. Felix Zandman, Vishay’s Founder. Mr. Zandman controls, on a shared basis with Ruta Zandman and Ziv Shoshani, approximately 34.0% of the total voting power of our capital stock as of December 31, 2019. He also is non-executive Chairman of Vishay Precision Group, Inc., an independent, publicly-traded company spun-off from Vishay Intertechnology in 2010.
Dr. Gerald Paul was appointed Chief Executive Officer effective January 1, 2005. Dr. Paul has served as a Director of the Company since 1993, and has been President of the Company since March 1998. Dr. Paul also was Chief Operating Officer from 1996 to 2006. Dr. Paul previously was an Executive Vice President of the Company from 1996 to 1998, and President of Vishay Electronic Components, Europe from 1994 to 1996. Dr. Paul has been Managing Director of Vishay Electronic GmbH, a subsidiary of the Company, since 1991. Dr. Paul has been employed by Vishay and a predecessor company since 1978.
Lori Lipcaman was appointed Executive Vice President and Chief Financial Officer of the Company effective September 1, 2011. Ms. Lipcaman had been appointed Executive Vice President Finance and Chief Accounting Officer in September 2008. Previously, she served as Vishay’s Corporate Senior Vice President, Operations Controller, from March 1998 to September 2008. Prior to that, she served in various positions of increasing responsibility in finance and controlling since joining the Company in May 1989.
Johan Vandoorn was appointed Executive Vice President and Chief Technical Officer effective August 1, 2011. Mr. Vandoorn is responsible for Vishay’s technical development and internal growth programs. Mr. Vandoorn has held various positions of increasing responsibility since Vishay’s acquisition of BCcomponents Holdings BV (“BCcomponents”) in 2002, including Executive Vice President – Passive Components (2006 – 2012). Mr. Vandoorn had been Vice President – Global Operations of BCcomponents from 2000 until its acquisition by Vishay, and previously worked for Philips Components (“Philips”) from 1980 until Philips sold the BCcomponents business to a private equity firm in 1998.
David Valletta serves as Vishay’s Executive Vice President – Worldwide Sales, a position he has held since 2007. Mr. Valletta has held various positions of increasing responsibility since Vishay’s acquisition of Vitramon in 1994.
Prior to joining Vitramon, Mr. Valletta also worked for AVX Corporation. His experience with Vishay includes various positions within the Americas region in direct and distribution sales management and global sales responsibility for the Company’s key strategic customers.
Joel Smejkal was appointed Executive Vice President Corporate Business Development effective July 1, 2020. Mr. Smejkal previously was Executive Vice President and Business Head Passive Components from 2017. Mr. Smejkal has held various positions of increasing responsibility since joining Vishay in 1990 including Senior Vice President Global Distribution Sales (2012 - 2016). Mr. Smejkal's experience with Vishay includes worldwide and divisional leadership roles in engineering, marketing, operations and sales. He was a product developer of 18 U.S. Patents for the Power Metal Strip® resistor technology and brings significant business development, marketing and sales experience.
Clarence Tse was appointed Executive Vice President and Business Head Semiconductors effective January 1, 2017. Mr. Tse has held various positions of increasing responsibility since Vishay's acquisition of Siliconix/Telefunken in 1998, including Senior Vice President, Diodes Division (2008 - 2016), Senior Vice President, Power Diodes Division (2002 - 2008) and Vice President, Finance and Administration Asia (1998 - 2001). Mr. Tse was first hired by Siliconix in 1985.
Jeff Webster was appointed Executive Vice President and Business Head Passive Components effective July 1, 2020. Mr. Webster has held various positions of increasing responsibility since joining Vishay in 2000 including Senior Vice President Global Quality (2014 - 2019) and Vice President Global Quality - Actives (2000 - 2014). Prior to joining Vishay, Mr. Webster worked for Intersil. Mr. Webster's experience includes roles in Quality, Operations, and R&D.
Andreas Randebrock was appointed Executive Vice President Global Human Resources effective July 1, 2020. Mr. Randebrock has been working for Vishay since 2015 as Senior Vice President Employee Development. Before Mr. Randebrock joined Vishay he worked as a management consultant in the field of leadership, human resources, and organizational consulting for more than 20 years. From 1998 until 2015, Mr. Randebrock was employed by the global human resources consultancy Hay Group (acquired in 2015 by Korn Ferry) where he held various positions of increasing responsibility and was a partner.
26
|
Item 5.
|
MARKET FOR REGISTRANT’S COMMON EQUITY, RELATED STOCKHOLDER MATTERS, AND ISSUER PURCHASES OF EQUITY SECURITIES
|
Our common stock is listed on the New York Stock Exchange under the symbol VSH. The following table sets forth the high and low sales prices for our common stock as reported on the New York Stock Exchange composite tape for the indicated fiscal quarters. Holders of record of our common stock totaled approximately 1,000 at February 22, 2021. Because many of the shares of our common stock are held by brokers and other institutions on behalf of stockholders, we are unable to estimate the total number of beneficial owners represented by these stockholders of record.
In 2014, the Company's Board of Directors instituted a quarterly cash dividend program and declared the first cash dividend in the history of Vishay. Quarterly cash dividends have been paid in each quarter since the first fiscal quarter of 2014. We expect to continue to pay quarterly dividends, although the amount and timing of any future dividends remains subject to authorization of our Board of Directors.
The following table sets forth, for the indicated periods, the high and low sales prices of our common stock and the quarterly cash dividends declared.
|
|
Common stock price range
|
Dividends declared
|
||||||||||||||||||||||
|
2020
|
2019
|
per share
|
||||||||||||||||||||||
|
High
|
Low
|
High
|
Low
|
2020
|
2019
|
|||||||||||||||||||
|
Fourth quarter
|
$
|
20.99
|
$
|
15.74
|
$
|
21.61
|
$
|
16.29
|
$
|
0.0950
|
$
|
0.0950
|
||||||||||||
|
Third quarter
|
$
|
17.59
|
$
|
14.50
|
$
|
18.23
|
$
|
14.36
|
$
|
0.0950
|
$
|
0.0950
|
||||||||||||
|
Second quarter
|
$
|
18.41
|
$
|
13.40
|
$
|
20.85
|
$
|
15.06
|
$
|
0.0950
|
$
|
0.0950
|
||||||||||||
|
First quarter
|
$
|
23.25
|
$
|
11.23
|
$
|
22.94
|
$
|
16.63
|
$
|
0.0950
|
$
|
0.0850
|
||||||||||||
At February 22, 2021, we had outstanding 12,097,148 shares of Class B common stock, par value $.10 per share, each of which entitles the holder to ten votes.
The Class B common stock generally is not transferable except in certain very limited instances, and there is no market for those shares. The Class B common stock is convertible, at the option of the holder, into common stock on a share for share basis. As a result of the passing of our founder and former Executive Chairman, Dr. Felix Zandman, Mrs. Ruta Zandman (a member of our Board of Directors) controls the voting of, solely or on a shared basis with Marc Zandman (our Executive Chairman) and Ziv Shoshani (a member of our Board of Directors) approximately 89.7% of our Class B common stock and 42.9% of the total voting power of our capital stock as of December 31, 2020.
Certain of our debt obligations contain restrictions as to the payment of cash dividends. See "Financial Condition, Liquidity, and Capital Resources" included in Item 7, "Management's Discussion and Analysis of Financial Condition and Results of Operations."
On November 17, 2020, the Company’s Board of Directors extended the authorization of the Executive Committee of the Board to execute a program to repurchase up to $150 million of common stock on the open market. Such transactions are subject to market and business conditions, legal requirements, and other factors. The program implementing such authorization does not obligate us to acquire any shares of common stock, and it may be terminated or suspended at any time at our discretion, in accordance with applicable laws and regulations. No shares have been repurchased pursuant to this program.
In the fourth fiscal quarter of 2020, the Company repurchased $2.6 million of the Company's convertible senior debentures due 2041. The aggregate purchase price for the repurchases was $3.5 million. The convertible senior debentures the Company repurchased in the fourth fiscal quarter had been convertible into approximately 0.2 million shares of Vishay common stock, assuming physical settlement.
27
Stock Performance Graph
The line graph below compares the cumulative total stockholder return on Vishay’s common stock over a 5-year period with the returns on the Standard & Poor’s MidCap 400 Stock Index (of which Vishay is a component), the Standard & Poor’s 500 Stock Index, and the Philadelphia Semiconductor Index. The line graph assumes that $100 had been invested at December 31, 2015 and assumes that all dividends were reinvested.
|
|
Base
|
Years Ending December 31,
|
|||||||||
|
Period
|
|||||||||||
|
Company Name / Index
|
2015
|
2016
|
2017
|
2018
|
2019
|
2020
|
|||||
|
Vishay Intertechnology, Inc.
|
100
|
136.97
|
177.96
|
156.81
|
189.20
|
188.21
|
|||||
|
S&P 500 Index
|
100
|
111.96
|
136.40
|
130.42
|
171.49
|
203.04
|
|||||
|
S&P MidCap 400 Index
|
100
|
120.74
|
140.35
|
124.80
|
157.49
|
179.00
|
|||||
|
Philadelphia Semiconductor Index
|
100
|
139.32
|
195.80
|
183.97
|
300.35
|
461.53
|
|||||
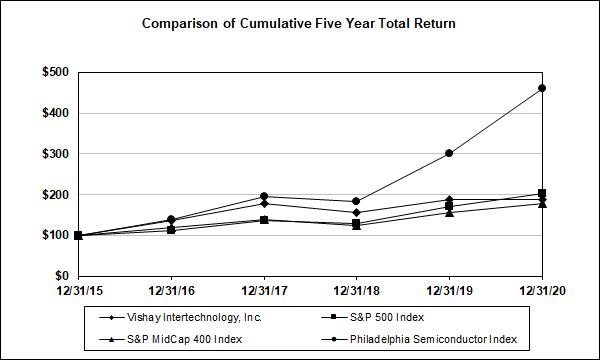
|
Item 6.
|
SELECTED FINANCIAL DATA
|
28
|
Item 7.
|
MANAGEMENT’S DISCUSSION AND ANALYSIS OF FINANCIAL CONDITION AND RESULTS OF OPERATIONS
|
This Management's Discussion and Analysis (“MD&A”) is intended to provide an understanding of Vishay's financial condition, results of operations and cash flows by focusing on changes in certain key measures from year to year. The MD&A should be read in conjunction with our Consolidated Financial Statements and accompanying Notes filed herewith, commencing on page F-1 of this report. This discussion contains forward-looking statements that involve risks and uncertainties. Our actual results could differ materially from those anticipated in these forward-looking statements as a result of various factors, including those discussed elsewhere in this Annual Report on Form 10-K, particularly in Item 1A. “Risk Factors.”
Overview
Vishay Intertechnology, Inc. ("Vishay," "we," "us," or "our")
manufactures one of the world’s largest portfolios of discrete semiconductors and passive electronic components that are essential to innovative designs in the automotive, industrial, computing, consumer, telecommunications, military, aerospace, and medical markets.
We operate in six segments based on product functionality: MOSFETs, Diodes, Optoelectronic Components, Resistors, Inductors, and Capacitors.
We are focused on enhancing stockholder value by growing our business and improving earnings per share. Since 1985, we have pursued a business strategy of growth through focused research and development and acquisitions. We plan to continue to grow our business through intensified internal growth supplemented by opportunistic acquisitions, while at the same time maintaining a prudent capital structure. To foster intensified internal growth, we have increased our worldwide R&D and engineering technical staff; we are expanding critical manufacturing capacities; we are increasing our technical field sales force in Asia to increase our market access to the industrial segment and increase the design-in of our products in local markets; and we are directing increased funding and focus on developing products to capitalize on the connectivity, mobility, and sustainability growth drivers of our business. In addition to our growth plan, we also have opportunistically repurchased our stock and, as further described below, reduced dilution risks by repurchasing substantially all of our convertible senior debentures.
In 2014, our Board of Directors instituted a quarterly dividend payment program and declared the first cash dividend in the history of Vishay. We have paid dividends each quarter since the first fiscal quarter of 2014, and further increased the quarterly cash dividend by 12% to $0.095 per share in the second fiscal quarter of 2019.
We have been re-shaping our capital structure since the enactment of the U.S. Tax Cuts and Jobs Act (“TCJA”) in December 2017. We repatriated over $1 billion (net of withholding taxes) of cash to the United States since the enactment of the TCJA. In 2019, we replaced our existing credit agreement that was due to expire in December 2020 with a new agreement that will expire in June 2024. Among other benefits of the new credit facility, the aggregate commitment of revolving loans increased to $750 million with the ability to request up to $300 million of incremental facilities, subject to the satisfaction of certain conditions. We used the net proceeds from the 2018 issuance of $600 million principal amount of new convertible senior notes due 2025 and repatriated cash to reduce the amount of our outstanding convertible senior debentures, which had become less tax-efficient because of the TCJA, from $575 million to $0.3 million as of December 31, 2020. On February 4, 2021, we redeemed the remaining convertible senior debentures. On May 20, 2020, our Board of Directors authorized a program to repurchase up to $200 million of the outstanding convertible senior notes due 2025 in open market repurchases or through privately negotiated transactions. Such transactions provide us more flexibility to adjust our debt levels if necessary. We repurchased $134.7 million principal amount of convertible senior notes in the year ended December 31, 2020. Our debt instruments and transactions are more fully described in Note 6 to the consolidated financial statements.
Our business and operating results have been and will continue to be impacted by worldwide economic conditions. Our revenues are dependent on end markets that are impacted by consumer and industrial demand, and our operating results can be adversely affected by reduced demand in those global markets. The worldwide economy and, specifically, our business have been impacted by the outbreak of the coronavirus ("COVID-19"). The pandemic has significantly impacted the global market, including our customers, suppliers, and shipping partners, which has impacted our net revenues. We have also incurred incremental costs separable from normal operations that are directly attributable to the pandemic and containment efforts, primarily salaries and wages for employees impacted by quarantines and additional safety measures, including masks and temperature scanners, which were partially offset by government subsidies. The net impact of the costs and subsidies are classified as cost of products sold of $4.6 million and selling, general, and administrative benefits of $1.5 million based on employee function on the consolidated statement of operations for the year ended December 31, 2020. We exclude from the amounts reported above indirect financial changes from the COVID-19 pandemic such as general macroeconomic effects and higher shipping costs due to reduced shipping capacity. See additional information regarding our competitive strengths and key challenges as disclosed in Part 1.
We believe the economic impact of the COVID-19 pandemic on Vishay will be temporary. We have significant liquidity to withstand the temporary disruptions in the economic environment. However, we continue to closely monitor our fixed costs, capital expenditure plans, inventory, and capital resources to respond to changing conditions and to ensure we have the management, business processes, and resources to meet our future needs. We will react quickly and professionally to changes in demand to minimize manufacturing inefficiencies and excess inventory build. In the third fiscal quarter of 2019, we announced global cost reduction and management rejuvenation programs as part of our continuous efforts to improve efficiency and operating performance, which were fully implemented by the end of 2020. Our cost reduction program is more fully described in Note 4 to the consolidated financial statements and in "Cost Management" below.
We utilize several financial metrics, including net revenues, gross profit margin, segment operating income, end-of-period backlog, book-to-bill ratio, inventory turnover, change in average selling prices, net cash and short-term investments (debt), and free cash generation to evaluate the performance and assess the future direction of our business. See further discussion in “Financial Metrics” and “Financial Condition, Liquidity, and Capital Resources” below. The COVID-19 pandemic has impacted almost all key financial metrics throughout 2020. We experienced a broad recovery in orders and sales beginning in the third fiscal quarter of 2020 that accelerated in the fourth fiscal quarter, primarily due to increased demand from distributors. The increases in orders and sales positively impacted almost all key financial metrics.
29
Net revenues for the year ended December 31, 2020 were $2.502 billion, compared to net revenues of $2.668 billion and $3.035 billion for the years ended December 31, 2019 and 2018, respectively. Net earnings attributable to Vishay stockholders for the year ended December 31, 2020 were $122.9 million, or $0.85 per diluted share, compared to $163.9 million, or $1.13 per diluted share, and $345.8 million, or $2.24 per share, for the years ended December 31, 2019 and 2018, respectively.
We define adjusted net earnings as net earnings determined in accordance with GAAP adjusted for various items that management believes are not indicative of the intrinsic operating performance of our business. We define free cash as the cash flows generated from continuing operations less capital expenditures plus net proceeds from the sale of property and equipment. The reconciliations below include certain financial measures which are not recognized in accordance with GAAP, including adjusted net earnings, adjusted earnings per share, and free cash. These non-GAAP measures should not be viewed as alternatives to GAAP measures of performance or liquidity. Non-GAAP measures such as adjusted net earnings, adjusted earnings per share, and free cash do not have uniform definitions. These measures, as calculated by Vishay, may not be comparable to similarly titled measures used by other companies. Management believes that adjusted net earnings and adjusted earnings per share are meaningful because they provide insight with respect to our intrinsic operating results. Management believes that free cash is a meaningful measure of our ability to fund acquisitions, repay debt, and otherwise enhance stockholder value through stock repurchases or dividends.
Net earnings attributable to Vishay stockholders for the years ended December 31, 2020, 2019, and 2018 include items affecting comparability. The items affecting comparability are
(in thousands, except per share amounts)
:
|
|
Years ended December 31,
|
|||||||||||
|
2020
|
2019
|
2018
|
||||||||||
|
GAAP net earnings attributable to Vishay stockholders
|
$
|
122,923
|
$
|
163,936
|
$
|
345,758
|
||||||
|
Reconciling items affecting gross income:
|
||||||||||||
|
Impact of COVID-19 pandemic
|
4,563
|
-
|
-
|
|||||||||
|
Other reconciling items affecting operating income:
|
||||||||||||
|
Impact of COVID-19 pandemic
|
(1,451
|
)
|
-
|
-
|
||||||||
|
Restructuring and severance costs
|
743
|
24,139
|
-
|
|||||||||
|
Reconciling items affecting other income (expense):
|
||||||||||||
|
Loss on early extinguishment of debt
|
8,073
|
2,030
|
26,583
|
|||||||||
|
Reconciling items affecting tax expense (benefit):
|
||||||||||||
|
Change in deferred taxes due to early extinguishment of debt
|
$
|
(1,563
|
)
|
$
|
(1,601
|
)
|
$
|
(54,877
|
)
|
|||
|
Effects of cash repatriation program
|
(190
|
)
|
(9,583
|
)
|
(10,047
|
)
|
||||||
|
Effects of changes in uncertain tax positions
|
3,751
|
2,831
|
-
|
|||||||||
|
Effects of tax-basis foreign exchange gain
|
-
|
7,554
|
-
|
|||||||||
|
Enactment of TCJA
|
-
|
-
|
25,496
|
|||||||||
|
Tax effects of pre-tax items above
|
(2,799
|
)
|
(6,211
|
)
|
(5,812
|
)
|
||||||
|
Adjusted net earnings
|
$
|
134,050
|
$
|
183,095
|
$
|
327,101
|
||||||
|
Adjusted weighted average diluted shares outstanding
|
145,228
|
145,136
|
154,622
|
|||||||||
|
Adjusted earnings per diluted share
|
$
|
0.92
|
$
|
1.26
|
$
|
2.12
|
||||||
Although the term "free cash" is not defined in GAAP, each of the elements used to calculate free cash is presented as a line item on the face of our consolidated statements of cash flows prepared in accordance with GAAP.
|
|
Years ended December 31,
|
|||||||||||
|
2020
|
2019
|
2018
|
||||||||||
|
Net cash provided by continuing operating activities
|
$
|
314,938
|
$
|
296,444
|
$
|
258,506
|
||||||
|
Proceeds from sale of property and equipment
|
403
|
577
|
55,561
|
|||||||||
|
Less: Capital expenditures
|
(123,599
|
)
|
(156,641
|
)
|
(229,899
|
)
|
||||||
|
Free cash
|
$
|
191,742
|
$
|
140,380
|
$
|
84,168
|
||||||
Our results for 2020 represent the impacts of the COVID-19 pandemic on our business that resulted in a sharp decrease in demand in first half of the year followed by a sharp and broad recovery in the latter part of the year. Our results for 2019 represent the effects of the normalization of demand that we began to experience in the fourth fiscal quarter of 2018 and accelerated through 2019. Our percentage of euro-based sales approximates our percentage of euro-based expenses so the euro foreign currency impact on revenues was substantially offset by the impact on expenses. Our pre-tax results were consistent with expectations based on our business model.
Our free cash results were significantly impacted by the payment of cash taxes related to the cash repatriated to the U.S. of $16.3 million, $38.8 million and $156.8 million in 2020, 2019, and 2018, respectively, and the installment payments of the U.S. transition tax of $14.8 million in each year in the reporting period.
30
Financial Metrics
We utilize several financial metrics to evaluate the performance and assess the future direction of our business. These key financial measures and metrics include net revenues, gross profit margin, operating margin, segment operating income, end-of-period backlog, and the book-to-bill ratio. We also monitor changes in our inventory turnover and our or publicly available average selling prices (“ASP”).
Gross profit margin is computed as gross profit as a percentage of net revenues. Gross profit is generally net revenues less costs of products sold, but also deducts certain other period costs, particularly losses on purchase commitments and inventory write-downs. Losses on purchase commitments and inventory write-downs have the impact of reducing gross profit margin in the period of the charge, but result in improved gross profit margins in subsequent periods by reducing costs of products sold as inventory is used. Gross profit margin is clearly a function of net revenues, but also reflects our cost management programs and our ability to contain fixed costs.
Operating margin is computed as gross profit less operating expenses as a percentage of net revenues. We evaluate business segment performance on segment operating margin. Only dedicated, direct selling, general, and administrative expenses of the segments are included in the calculation of segment operating income. Segment operating margin is computed as operating income less items such as restructuring and severance costs, asset write-downs, goodwill and indefinite-lived intangible asset impairments, inventory write-downs, gain or losses on purchase commitments, global operations, sales and marketing, information systems, finance and administrative groups, and other items, expressed as a percentage of net revenues. We believe that evaluating segment performance excluding such items is meaningful because it provides insight with respect to intrinsic operating results of the segment. Operating margin is clearly a function of net revenues, but also reflects our cost management programs and our ability to contain fixed costs.
End-of-period backlog is one indicator of future revenues. We include in our backlog only open orders that we expect to ship in the next twelve months. If demand falls below customers’ forecasts, or if customers do not control their inventory effectively, they may cancel or reschedule the shipments that are included in our backlog, in many instances without the payment of any penalty. Therefore, the backlog is not necessarily indicative of the results to be expected for future periods.
An important indicator of demand in our industry is the book-to-bill ratio, which is the ratio of the amount of product ordered during a period as compared with the product that we ship during that period. A book-to-bill ratio that is greater than one indicates that our backlog is building and that we are likely to see increasing revenues in future periods. Conversely, a book-to-bill ratio that is less than one is an indicator of declining demand and may foretell declining revenues.
We focus on our inventory turnover as a measure of how well we are managing our inventory. We define inventory turnover for a financial reporting period as our costs of products sold for the four fiscal quarters ending on the last day of the reporting period divided by our average inventory (computed using each fiscal quarter-end balance) for this same period. A higher level of inventory turnover reflects more efficient use of our capital.
Pricing in our industry can be volatile. Using our and publicly available data, we analyze trends and changes in average selling prices to evaluate likely future pricing. The erosion of average selling prices of established products is typical for semiconductor products. We attempt to offset this deterioration with ongoing cost reduction activities and new product introductions. Our specialty passive components are more resistant to average selling price erosion. All pricing is subject to governing market conditions and is independently set by us.
31
The quarter-to-quarter trends in these financial metrics can also be an important indicator of the likely direction of our business. The following table shows net revenues, gross profit margin, operating margin, end-of-period backlog, book-to-bill ratio, inventory turnover, and changes in ASP for our business as a whole during the five fiscal quarters beginning with the fourth fiscal quarter of 2019 through the fourth fiscal quarter of 2020
(dollars in thousands)
:
|
|
4th Quarter
2019
|
1st Quarter
2020
|
2nd Quarter
2020
|
3rd Quarter
2020
|
4th Quarter
2020
|
|||||||||||||||
|
Net revenues
|
$
|
609,577
|
$
|
612,841
|
$
|
581,717
|
$
|
640,160
|
$
|
667,180
|
||||||||||
|
Gross profit margin
(1)
|
22.2
|
%
|
24.0
|
%
|
22.5
|
%
|
23.7
|
%
|
22.8
|
%
|
||||||||||
|
Operating margin
(2)
|
4.0
|
%
|
7.7
|
%
|
7.0
|
%
|
9.6
|
%
|
9.0
|
%
|
||||||||||
|
End-of-period backlog
|
$
|
911,300
|
$
|
1,005,200
|
$
|
914,300
|
$
|
927,900
|
$
|
1,239,800
|
||||||||||
|
Book-to-bill ratio
|
0.94
|
1.17
|
0.82
|
0.99
|
1.44
|
|||||||||||||||
|
Inventory turnover
|
4.3
|
4.2
|
3.9
|
4.4
|
4.6
|
|||||||||||||||
|
Change in ASP vs. prior quarter
|
-0.8
|
%
|
-1.1
|
%
|
0.1
|
%
|
-1.1
|
%
|
-0.3
|
%
|
||||||||||
_______________
(1) Gross margin for the first, second, third, and fourth fiscal quarters of 2020 includes $3.1 million, $0.9 million, $0.2 million, and $0.3 million, respectively, of expenses directly related to the COVID-19 outbreak (see Note 8 to our consolidated financial statements).
(2) Operating margin for the fourth fiscal quarter of 2019 and second fiscal quarter of 2020 includes $16.9 million, and $0.7 million, respectively, of restructuring and severance expenses (see Note 4 to our consolidated financial statements). Operating margin for the first, second, third, and fourth fiscal quarters of 2020 also includes in total $3.4 million, $0.2 million, $(0.2) million, and $(0.3) million, respectively, of expenses (benefits) directly related to the COVID-19 outbreak (see Note 8 to our consolidated financial statements).
See “Financial Metrics by Segment” below for net revenues, book-to-bill ratio, and gross profit margin broken out by segment.
Revenues increased versus the prior fiscal quarter and the fourth fiscal quarter of 2019. The recovery in demand that began in the third fiscal quarter of 2020 accelerated significantly in the fourth fiscal quarter primarily due to distribution customers and perceived future supply shortages. Distributor inventory levels continued to decrease in the fourth fiscal quarter. The increased orders increased the book-to-bill ratio and backlog and reduced pressure on average selling prices.
Gross profit margin decreased versus the prior fiscal quarter, but increased versus the prior year quarter. Gross profit margin in the fourth fiscal quarter of 2020 was burdened by higher freight and metal prices as well as the impact of a weaker U.S. dollar versus currencies in which we incur costs, but no sales.
The book-to-bill ratio in the fourth fiscal quarter of 2020 increased to 1.44 versus 0.99 in the third fiscal quarter of 2020. The book-to-bill ratios in the fourth fiscal quarter of 2020 for distributors and original equipment manufacturers ("OEM") were 1.89 and 0.96, respectively, versus ratios of 0.99 and 1.01, respectively, during the third fiscal quarter of 2020.
32
Financial Metrics by Segment
The following table shows net revenues, book-to-bill ratio, gross profit margin, and segment operating margin broken out by segment for the five fiscal quarters beginning with the fourth fiscal quarter of 2019 through the fourth fiscal quarter of 2020
(dollars in thousands)
:
|
|
4th Quarter
2019
|
1st Quarter
2020
|
2nd Quarter
2020
|
3rd Quarter
2020
|
4th Quarter
2020
|
|||||||||||||||
|
MOSFETs
|
||||||||||||||||||||
|
Net revenues
|
$
|
116,215
|
$
|
116,893
|
$
|
118,944
|
$
|
133,976
|
$
|
131,567
|
||||||||||
|
Book-to-bill ratio
|
0.94
|
1.12
|
0.97
|
0.93
|
1.64
|
|||||||||||||||
|
Gross profit margin
|
23.7
|
%
|
24.1
|
%
|
22.7
|
%
|
22.1
|
%
|
22.4
|
%
|
||||||||||
|
Segment operating margin
|
16.1
|
%
|
16.0
|
%
|
14.8
|
%
|
15.0
|
%
|
15.3
|
%
|
||||||||||
|
Diodes
|
||||||||||||||||||||
|
Net revenues
|
$
|
123,382
|
$
|
115,343
|
$
|
124,187
|
$
|
123,744
|
$
|
139,274
|
||||||||||
|
Book-to-bill ratio
|
0.88
|
1.36
|
0.61
|
1.05
|
1.65
|
|||||||||||||||
|
Gross profit margin
|
16.3
|
%
|
16.9
|
%
|
20.1
|
%
|
16.8
|
%
|
17.8
|
%
|
||||||||||
|
Segment operating margin
|
12.6
|
%
|
12.5
|
%
|
16.0
|
%
|
12.8
|
%
|
14.1
|
%
|
||||||||||
|
Optoelectronic Components
|
||||||||||||||||||||
|
Net revenues
|
$
|
51,047
|
$
|
54,179
|
$
|
49,130
|
$
|
64,955
|
$
|
68,352
|
||||||||||
|
Book-to-bill ratio
|
1.11
|
1.40
|
0.96
|
0.97
|
1.46
|
|||||||||||||||
|
Gross profit margin
|
20.2
|
%
|
26.9
|
%
|
23.9
|
%
|
32.8
|
%
|
27.7
|
%
|
||||||||||
|
Segment operating margin
|
12.7
|
%
|
19.7
|
%
|
16.2
|
%
|
26.5
|
%
|
21.3
|
%
|
||||||||||
|
Resistors
|
||||||||||||||||||||
|
Net revenues
|
$
|
147,883
|
$
|
159,208
|
$
|
140,412
|
$
|
145,362
|
$
|
161,201
|
||||||||||
|
Book-to-bill ratio
|
0.95
|
1.05
|
0.73
|
1.06
|
1.24
|
|||||||||||||||
|
Gross profit margin
|
23.5
|
%
|
28.1
|
%
|
23.2
|
%
|
24.2
|
%
|
25.3
|
%
|
||||||||||
|
Segment operating margin
|
19.0
|
%
|
24.4
|
%
|
19.9
|
%
|
20.7
|
%
|
21.0
|
%
|
||||||||||
|
Inductors
|
||||||||||||||||||||
|
Net revenues
|
$
|
76,520
|
$
|
73,785
|
$
|
65,185
|
$
|
79,399
|
$
|
75,260
|
||||||||||
|
Book-to-bill ratio
|
1.05
|
0.98
|
0.96
|
0.96
|
1.03
|
|||||||||||||||
|
Gross profit margin
|
33.5
|
%
|
31.2
|
%
|
31.1
|
%
|
33.5
|
%
|
30.1
|
%
|
||||||||||
|
Segment operating margin
|
30.3
|
%
|
27.5
|
%
|
27.2
|
%
|
30.4
|
%
|
27.0
|
%
|
||||||||||
|
Capacitors
|
||||||||||||||||||||
|
Net revenues
|
$
|
94,530
|
$
|
93,433
|
$
|
83,859
|
$
|
92,724
|
$
|
91,526
|
||||||||||
|
Book-to-bill ratio
|
0.84
|
1.20
|
0.90
|
0.95
|
1.54
|
|||||||||||||||
|
Gross profit margin
|
17.9
|
%
|
21.8
|
%
|
18.1
|
%
|
19.8
|
%
|
17.5
|
%
|
||||||||||
|
Segment operating margin
|
12.3
|
%
|
16.1
|
%
|
12.5
|
%
|
14.8
|
%
|
12.5
|
%
|
||||||||||
_________
33
Acquisition Activity
As part of our growth strategy, we seek to expand through targeted acquisitions of other manufacturers of electronic components that have established positions in major markets, reputations for product quality and reliability, and product lines with which we have substantial marketing and technical expertise. This includes exploring opportunities to acquire targets to gain market share, penetrate different geographic markets, enhance new product development, round out our existing product lines, or grow our high margin niche market businesses. Acquisitions of passive components businesses would likely be made to strengthen and broaden our position as a specialty product supplier; acquisitions of discrete semiconductor businesses would be made to increase market share and to generate synergies. To limit our financial exposure, we have implemented a policy not to pursue acquisitions if our post-acquisition debt would exceed 2.5x our pro forma earnings before interest, taxes, depreciation, and amortization (“EBITDA”). For these purposes, we calculate pro forma EBITDA as the adjusted EBITDA of Vishay and the target for Vishay’s four preceding fiscal quarters, with a pro forma adjustment for savings which management estimates would have been achieved had the target been acquired by Vishay at the beginning of the four fiscal quarter period.
On October 1, 2020, we acquired the worldwide business and substantially all of the U.S. assets of Applied Thin-Film Products ("ATP"), a California-based, privately-held manufacturer of custom, build-to-print thin film substrates for the microwave, fiber optic, and life science industries. Concurrently, a Chinese subsidiary of Applied Thin-Film Products entered into an agreement to sell certain inventory and equipment to a subsidiary of Vishay for approximately $0.4 million at a later date. The total acquisition price was $25.9 million. The results and operations of this acquisition have been included in the Resistors segment since October 1, 2020. ATP did not have a material impact on
our consolidated results for the year ended December 31, 2020
.
On January 3, 2019, we acquired substantially all of the assets and liabilities of Bi-Metallix, Inc. ("Bi-Metallix"), a U.S.-based, privately-held provider of electron beam continuous strip welding services for $11.9 million. We were a major customer of Bi-Metallix, and the acquired business has been vertically integrated into our Resistors segment. The results and operations of this acquisition have been included in the Resistors segment since January 3, 2019. Bi-Metallix did not have a material impact on our consolidated results for the years ended December 31, 2020 and 2019.
There is no assurance that we will be able to identify and acquire additional suitable acquisition candidates at price levels and on terms and conditions we consider acceptable.
34
Cost Management
We place a strong emphasis on controlling our costs, and use various measures and metrics to evaluate our cost structure.
We define variable costs as expenses that vary with respect to quantity produced. Fixed costs do not vary with respect to quantity produced over the relevant time period. Contributive margin is calculated as net revenue less variable costs. It may be expressed in dollars or as a percentage of net revenue. Management uses this measure to determine the amount of profit to be expected for any change in revenues. While these measures are typical cost accounting measures, none of these measures are recognized in accordance with GAAP. The classification of expenses as either variable or fixed is judgmental and other companies might classify such expenses differently. These measures, as calculated by Vishay, may not be comparable to similarly titled measures used by other companies.
We closely monitor variable costs and seek to achieve the contributive margin in our business model. Over a period of many years, we have generally maintained a contributive margin of between 45% - 47% of revenues. The erosion of average selling prices, particularly of our semiconductor products, that is typical of our industry, and inflation negatively impact contributive margin and drive us to continually seek ways to reduce our variable costs. Our variable cost reduction efforts include increasing the efficiency in our production facilities by expending capital for automation, reducing materials costs, materials substitution, increasing wafer size and shrinking dies to maximize efficiency in our semiconductor production processes, and other yield improvement activities.
Our cost management strategy also includes a focus on controlling fixed costs recorded as costs of products sold or selling, general, and administrative expenses and maintaining our break-even point (adjusted for acquisitions). We seek to limit increases in selling, general, and administrative expenses to the rate of inflation, excluding foreign currency exchange effects and substantially independent of sales volume changes. At constant fixed costs, we would expect each $1 million increase in revenues to increase our operating income by approximately $450,000 to $470,000. Sudden changes in the business conditions, however, may not allow us to quickly adapt our manufacturing capacity and cost structure.
Occasionally, our ongoing cost containment activities are not adequate and we must take actions to maintain our cost competitiveness. We incurred significant restructuring expenses in our past to reduce our cost structure. Historically, our primary cost reduction technique was through the transfer of production to the extent possible from high-labor-cost countries to lower-labor-cost countries. We believe that our manufacturing footprint is suitable to serve our customers and end markets, while maintaining lower manufacturing costs. Since 2013, our cost reduction programs have primarily focused on reducing fixed costs, including selling, general, and administrative expenses.
We continue to monitor the economic environment and its potential effects on our customers and the end markets that we serve.
In the third fiscal quarter of 2019, we announced global cost reduction and management rejuvenation programs as part of our continuous efforts to improve efficiency and operating performance. The programs were primarily designed to reduce manufacturing fixed costs and selling, general, and administrative ("SG&A") costs company-wide, and provide management rejuvenation. The programs in total are expected to lower costs by approximately $15 million annually beginning in 2021, of which approximately 50% is expected to be realized as reduced manufacturing fixed costs and 50% is expected to be realized as reduced SG&A expenses. The implementation of these programs did not impact planned research and development activities.
We first solicited volunteers to accept a voluntary separation / early retirement offer, which was generally successful. The voluntary separation benefits varied by country and job classification, but generally offered a cash loyalty bonus. A limited number of involuntary terminations were necessary to achieve the cost reduction targets.
No manufacturing facility closures occurred pursuant to these programs.
The programs are now substantially implemented. We incurred restructuring expense of $24.9 million, including $0.7 million in 2020, to implement these programs.
We do not anticipate any material restructuring activities in 2021. However, a worsening business environment for the electronics industry, a prolonged impact of the COVID-19 pandemic, or a significant economic downturn may require us to implement additional restructuring initiatives.
See Note 4 to our consolidated financial statements for additional information.
In uncertain times, we focus on managing our production capacities in accordance with customer requirements, and maintain discipline in terms of our fixed costs and capital expenditures. Even as we seek to manage our costs, we remain cognizant of the future requirements of our demanding markets. We continue to pursue our growth plans through investing in capacities for strategic product lines, and through increasing our resources for R&D, technical marketing, and field application engineering; supplemented by opportunistic acquisitions of specialty businesses.
Our long-term strategy includes growth through the integration of acquired businesses, and GAAP requires plant closure and employee termination costs that we incur in connection with our acquisition activities to be recorded as expenses in our consolidated statement of operations, as such expenses are incurred. We have not incurred any material plant closure or employee termination costs related to any of the businesses acquired since 2011, but we expect to have some level of future restructuring expenses due to acquisitions.
35
Foreign Currency Translation
We are exposed to foreign currency exchange rate risks, particularly due to transactions in currencies other than the functional currencies of certain subsidiaries. We occasionally use forward exchange contracts to economically hedge a portion of our projected cash flows from these exposures.
GAAP requires that entities identify the “functional currency” of each of their subsidiaries and measure all elements of the financial statements in that functional currency. A subsidiary’s functional currency is the currency of the primary economic environment in which it operates. In cases where a subsidiary is relatively self-contained within a particular country, the local currency is generally deemed to be the functional currency. However, a foreign subsidiary that is a direct and integral component or extension of the parent company’s operations generally would have the parent company’s currency as its functional currency. We have both situations among our subsidiaries.
Foreign Subsidiaries which use the Local Currency as the Functional Currency
We finance our operations in Europe and certain locations in Asia in local currencies, and accordingly, these subsidiaries utilize the local currency as their functional currency. For those subsidiaries where the local currency is the functional currency, assets and liabilities in the consolidated balance sheets have been translated at the rate of exchange as of the balance sheet date. Translation adjustments do not impact the results of operations and are reported as a separate component of stockholders’ equity.
For those subsidiaries where the local currency is the functional currency, revenues and expenses are translated at the average exchange rate for the year. While the translation of revenues and expenses into U.S. dollars does not directly impact the consolidated statement of operations, the translation effectively increases or decreases the U.S. dollar equivalent of revenues generated and expenses incurred in those foreign currencies. The dollar was weaker during 2020 versus 2019, with the translation of foreign currency revenues and expenses into U.S. dollars increasing reported revenues and expenses versus 2019, but stronger during 2019 versus 2018, with the translation of foreign currency revenues and expenses into U.S. dollars decreasing reported revenues and expenses versus 2018.
Foreign Subsidiaries which use the U.S. Dollar as the Functional Currency
Our operations in Israel and most significant locations in Asia are largely financed in U.S. dollars, and accordingly, these subsidiaries utilize the U.S. dollar as their functional currency. For those foreign subsidiaries where the U.S. dollar is the functional currency, all foreign currency financial statement amounts are remeasured into U.S. dollars. Exchange gains and losses arising from remeasurement of foreign currency-denominated monetary assets and liabilities are included in the results of operations. While these subsidiaries transact most business in U.S. dollars, they may have significant costs, particularly payroll-related, which are incurred in the local currency. The cost of products sold and selling, general, and administrative expense for the year ended December 31, 2020 have been slightly unfavorably impacted (compared to the prior year) and more significantly unfavorably impacted in the fourth fiscal quarter of 2020 (compared to the prior year quarter) by local currency transactions of subsidiaries which use the U.S. dollar as their functional currency.
See Item 7A for additional discussion of foreign currency exchange risk.
36
Critical Accounting Policies and Estimates
Our significant accounting policies are summarized in Note 1 to our consolidated financial statements. We identify here a number of policies that entail significant judgments or estimates.
Revenue Recognition
Revenue is measured based on the consideration specified in contracts with customers, and excludes any sales incentives and amounts collected on behalf of third parties. We recognize revenue when we satisfy our performance obligations.
We have a broad line of products that we sell to original equipment manufacturers ("OEMs"), electronic manufacturing services ("EMS") companies, which manufacture for OEMs on an outsourcing basis, and independent distributors that maintain large inventories of electronic components for resale to OEMs and EMS companies.
We recognize revenue on sales to distributors when the distributor takes control of the products ("sold-to" model). We have agreements with distributors that allow distributors a limited credit for unsaleable products, which we refer to as a "scrap allowance." Consistent with industry practice, we also have a "stock, ship and debit" program whereby we consider requests by distributors for credits on previously purchased products that remain in distributors' inventory, to enable the distributors to offer more competitive pricing. In addition, we have contractual arrangements whereby we provide distributors with protection against price reductions initiated by us after product is sold by us to the distributor and prior to resale by the distributor.
We recognize the estimated variable consideration to be received as revenue and record a related accrued expense for the consideration not expected to be received, based upon an estimate of product returns, scrap allowances, "stock, ship and debit" credits, and price protection credits that will be attributable to sales recorded through the end of the period. We make these estimates based upon sales levels to our customers during the period, inventory levels at the distributors, current and projected market conditions, and historical experience under the programs. While we utilize a number of different methodologies to estimate the accruals, all of the methodologies take into account sales levels to customers during the relevant period, inventory levels at the distributors, current and projected market trends and conditions, recent and historical activity under the relevant programs, changes in program policies, and open requests for credits. These procedures require the exercise of significant judgments. We believe that we have a reasonable basis to estimate future credits under the programs.
See Notes 1 and 9 to our consolidated financial statements for further information.
Convertible Debt Instruments
As of December 31, 2020, we had two issuances of convertible debt instruments outstanding. On February 4, 2021, we redeemed the remaining convertible senior debentures. Current GAAP requires us to separately account for the liability and equity components of convertible debt instruments in a manner that reflects our nonconvertible debt borrowing rate when interest costs are recognized in subsequent periods. The resulting discount on the debt is amortized as non-cash interest expense in future periods. Additionally, upon extinguishment of convertible debt instruments, GAAP requires the aggregate repurchase payment to be allocated between the liability and equity (including temporary equity) components of the convertible debt instruments, using our nonconvertible debt borrowing rate at the time of extinguishment. The estimated nonconvertible debt borrowing rate can significantly impact the accounting for convertible debt instruments. The estimation of our nonconvertible debt borrowing rate requires significant judgment. We employ a market approach and base our estimate on observed data from companies with similar capital structures and debt instruments as well as data obtained from third-party financial institutions. We believe we have a reasonable basis to estimate our nonconvertible debt borrowing rate.
This accounting will change upon the adoption of ASU No. 2020-06 on January 1, 2021.
See Notes 1 and 6 to our consolidated financial statements for further information.
Inventories
We value our inventories at the lower of cost or net realizable value, with cost determined under the first-in, first-out method. The valuation of our inventories requires our management to make market estimates. For work in process goods, we are required to estimate the cost to completion of the products and the prices at which we will be able to sell the products. For finished goods, we must assess the prices at which we believe the inventory can be sold. Inventories are also adjusted for estimated obsolescence and written down to net realizable value based upon estimates of future demand, technology developments and market conditions.
Goodwill
See Note 1 to our consolidated financial statements for a description of our goodwill impairment tests.
The fair value of reporting units for goodwill impairment testing purposes is measured primarily using present value techniques based on projected cash flows from the reporting unit. The calculated results are evaluated for reasonableness using comparable company data. The determination of the fair value of the reporting units requires us to make significant estimates and assumptions. These estimates and assumptions primarily include, but are not limited to: the selection of appropriate peer group companies; control premiums appropriate for acquisitions in the industries in which we compete; the discount rate; terminal growth rates; and forecasts of revenue, operating income, depreciation and amortization, and capital expenditures.
37
Due to the inherent uncertainty involved in making these estimates, actual financial results could differ from those estimates. In addition, changes in assumptions concerning future financial results or other underlying assumptions could have a significant impact on the fair value of the reporting unit and the amount of the goodwill impairment charge.
Our defined benefit plans are concentrated in the United States, Germany, and the Republic of China (Taiwan). At December 31, 2020, our U.S. plans include various non-qualified plans. The table below summarizes information about our pension and other postretirement benefit plans. This information should be read in conjunction with Note 11 to our consolidated financial statements
(amounts in thousands):
|
|
Benefit
obligation
|
Plan assets
|
Funded
position
|
Informally
funded assets
|
Net position
|
Unrecognized
actuarial
items
|
||||||||||||||||||
|
U.S. non-qualified pension plans
|
$
|
45,564
|
$
|
-
|
$
|
(45,564
|
)
|
$
|
30,400
|
$
|
(15,164
|
)
|
$
|
10,709
|
||||||||||
|
German pension plans
|
199,576
|
-
|
(199,576
|
)
|
4,917
|
(194,659
|
)
|
69,682
|
||||||||||||||||
|
Taiwanese pension plans
|
60,753
|
45,189
|
(15,564
|
)
|
-
|
(15,564
|
)
|
12,568
|
||||||||||||||||
|
Other pension plans
|
47,480
|
29,145
|
(18,335
|
)
|
-
|
(18,335
|
)
|
12,230
|
||||||||||||||||
|
OPEB plans
|
16,233
|
-
|
(16,233
|
)
|
-
|
(16,233
|
)
|
2,463
|
||||||||||||||||
|
Other retirement obligations
|
14,282
|
-
|
(14,282
|
)
|
-
|
(14,282
|
)
|
-
|
||||||||||||||||
|
$
|
383,888
|
$
|
74,334
|
$
|
(309,554
|
)
|
$
|
35,317
|
$
|
(274,237
|
)
|
$
|
107,652
|
|||||||||||
Accounting for defined benefit pension and other postretirement plans involves numerous assumptions and estimates. The discount rate at which obligations could effectively be settled and the expected long-term rate of return on plan assets are two critical assumptions in measuring the cost and benefit obligations of our pension and other postretirement benefit plans. Other important assumptions include the anticipated rate of future increases in compensation levels, estimated mortality, and for certain postretirement medical plans, increases or trends in health care costs. Management reviews these assumptions at least annually. We use independent actuaries and investment advisers to assist us in formulating assumptions and making estimates. These assumptions are updated periodically to reflect the actual experience and expectations on a plan specific basis as appropriate.
In the U.S., we utilize published long-term high quality bonds to determine the discount rate at the measurement date. In Germany and the Republic of China (Taiwan), we utilize published long-term government bond rates to determine the discount rate at the measurement date. We utilize bond yields at various maturity dates that reflect the timing of expected future benefit payments. We believe the discount rates selected are the rates at which these obligations could effectively be settled.
Non-qualified plans in the U.S. are considered by law to be unfunded. However, the Company maintains assets in a rabbi trust to fund benefit payments under certain of these plans. Such assets would be subject to creditor claims under certain conditions. (See also Notes 11 and 18 to our consolidated financial statements.)
Many of our non-U.S. plans are unfunded based on local laws and customs. For those non-U.S. plans that do maintain investments, their asset holdings are primarily cash and fixed income securities, based on local laws and customs.
Some non-U.S. plans also informally fund their plans by holding certain available-for-sale investments. Such assets would be subject to creditor claims under certain conditions. (See also Note 18 to our consolidated financial statements.)
We set the expected long-term rate of return based on the expected long-term average rates of return to be achieved by the underlying investment portfolios. In establishing this rate, we consider historical and expected returns for the asset classes in which the plans are invested, advice from pension consultants and investment advisors, and current economic and capital market conditions. The expected return on plan assets is incorporated into the computation of pension expense. The difference between this expected return and the actual return on plan assets is deferred. The net deferral of past asset losses (gains) affects the calculated value of plan assets and, ultimately, future pension expense (income).
We continue to seek to de-risk our global pension exposures. Such actions could result in increased net periodic pension cost due to lower expected rates of return on plan assets and/or possible additional charges to recognize unamortized actuarial items if all or a portion of the obligations were to be settled.
We believe that the current assumptions used to estimate plan obligations and annual expenses are appropriate. However, if economic conditions change or if our investment strategy changes, we may be inclined to change some of our assumptions, and the resulting change could have a material impact on the consolidated statements of operations and on the consolidated balance sheet.
38
Income Taxes
We are subject to income taxes in the U.S. and numerous foreign jurisdictions. Significant judgment is required in evaluating our tax positions and determining our provision for income taxes. During the ordinary course of business, there are many transactions and calculations for which the ultimate tax determination is uncertain. We establish reserves for tax-related uncertainties based on estimates of whether, and the extent to which, additional taxes will be due. These reserves are established when we believe that certain positions might be challenged despite our belief that our tax return positions are fully supportable. We adjust these reserves in light of changing facts and circumstances and the provision for income taxes includes the impact of reserve provisions and changes to reserves that are considered appropriate.
These accruals for tax-related uncertainties are based on our best estimate of potential tax exposures. When particular matters arise, a number of years may elapse before such matters are audited by tax authorities and finally resolved. Favorable resolution of such matters could be recognized as a reduction to our effective tax rate in the year of resolution. Unfavorable resolution of any particular issue could increase the effective tax rate and may require the use of cash in the year of resolution.
Our U.S. federal income tax returns are under examination for the years ended December 31, 2017 and 2018. The IRS may, however, ask for supporting documentation for net operating losses for the years ended December 31, 2013 - 2016, which were utilized in the year ended December 31, 2017.
During 2020, certain tax examinations were concluded and certain statutes of limitations lapsed. Our tax provision for those years includes adjustments related to the resolution of these matters. The tax returns of significant non-U.S. subsidiaries currently under examination are located in the following jurisdictions: Germany (2013 through 2016), India (2004 through 2017), and Singapore (2015 through 2019). The Company and its subsidiaries also file income tax returns in other taxing jurisdictions in the U.S. and around the world, many of which are still open to examination.
See Notes 1 and 5 to consolidated financial statements for additional information.
39
Results of Operations
Statement of operations’ captions as a percentage of net revenues and the effective tax rates were as follows:
|
|
Years ended December 31,
|
|||||||||||
|
2020
|
2019
|
2018
|
||||||||||
|
Costs of products sold
|
76.7
|
%
|
74.8
|
%
|
70.7
|
%
|
||||||
|
Gross profit
|
23.3
|
%
|
25.2
|
%
|
29.3
|
%
|
||||||
|
Selling, general, and administrative expenses
|
14.8
|
%
|
14.4
|
%
|
13.3
|
%
|
||||||
|
Operating income
|
8.4
|
%
|
9.8
|
%
|
16.0
|
%
|
||||||
|
Income before taxes and noncontrolling interest
|
6.3
|
%
|
8.5
|
%
|
13.7
|
%
|
||||||
|
Net earnings (loss) attributable to Vishay stockholders
|
4.9
|
%
|
6.1
|
%
|
11.4
|
%
|
||||||
|
________
|
||||||||||||
|
Effective tax rate
|
21.8
|
%
|
27.2
|
%
|
16.9
|
%
|
||||||
Net Revenues
Net revenues were as follows
(dollars in thousands)
:
|
|
2020
|
2019
|
2018
|
|||||||||
|
Net revenues
|
$
|
2,501,898
|
$
|
2,668,305
|
$
|
3,034,689
|
||||||
|
Change versus prior year
|
$
|
(166,407
|
)
|
$
|
(366,384
|
)
|
||||||
|
Percentage change versus prior year
|
-6.2
|
%
|
-12.1
|
%
|
||||||||
Changes in net revenues were attributable to the following:
|
|
2020 vs. 2019
|
2019 vs. 2018
|
||||||
|
Change attributable to:
|
||||||||
|
Decrease in volume
|
-4.4
|
%
|
-9.8
|
%
|
||||
|
Decrease in average selling prices
|
-2.8
|
%
|
-1.1
|
%
|
||||
|
Foreign currency effects
|
0.5
|
%
|
-1.6
|
%
|
||||
|
Acquisitions
|
0.2
|
%
|
0.1
|
%
|
||||
|
Other
|
0.3
|
%
|
0.3
|
%
|
||||
|
Net change
|
-6.2
|
%
|
-12.1
|
%
|
||||
Demand for our products in 2020 was significantly impacted by the COVID-19 pandemic, in which we experienced significant decreases, particularly in the second fiscal quarter, due primarily to closures of customer facilities followed by a broad recovery beginning in the third fiscal and accelerating in the fourth fiscal quarter. We experienced a decrease in demand beginning in the fourth fiscal quarter of 2018 that accelerated through 2019 as customers, particularly distributors, reduced orders as they decreased their inventory. The negative impact of the COVID-19 pandemic in 2020, particularly through the first half of 2020, and the declining order rates experienced through 2019 result in decreased net revenues compared to the prior year periods.
Gross Profit and Margins
Gross profit margins for the year ended December 31, 2020 were 23.3%, as compared to 25.2% for the year ended December 31, 2019. The decrease in gross profit margin is primarily due to decreased sales volume, and also includes the negative impacts of higher freight and metals costs. Higher freight and metals costs contributed to the decrease in our contributive margin in 2020, despite manufacturing efficiencies.
Gross profit margins for the year ended December 31, 2019 were 25.2%, as compared to 29.3% for the year ended December 31, 2018.
The decrease is primarily due to decreased sales volume, temporary manufacturing inefficiencies, and the impact of tariffs on products imported from China. We were not able to completely offset the normal negative impacts of inflation and average selling price decline by cost reductions and innovation due to the negative impact of manufacturing inefficiencies caused by capacity adaptations. As a result, our contributive margin decreased in 2019.
40
Segments
Analysis of revenues and gross profit margins for our segments is provided below.
MOSFETs
Net revenues of the MOSFETs segment were as follows
(dollars in thousands):
|
|
Years ended December 31,
|
|||||||||||
|
2020
|
2019
|
2018
|
||||||||||
|
Net revenues
|
$
|
501,380
|
$
|
509,145
|
$
|
547,643
|
||||||
|
Change versus comparable prior year period
|
$
|
(7,765
|
)
|
$
|
(38,498
|
)
|
||||||
|
Percentage change versus comparable prior year period
|
-1.5
|
%
|
-7.0
|
%
|
||||||||
Changes in MOSFETs segment net revenues were attributable to the following:
|
|
2020 vs. 2019
|
2019 vs. 2018
|
||||||
|
Change attributable to:
|
||||||||
|
Change in volume
|
4.1
|
%
|
-3.3
|
%
|
||||
|
Decrease in average selling prices
|
-5.6
|
%
|
-3.2
|
%
|
||||
|
Foreign currency effects
|
0.3
|
%
|
-0.9
|
%
|
||||
|
Other
|
-0.3
|
%
|
0.4
|
%
|
||||
|
Net change
|
-1.5
|
%
|
-7.0
|
%
|
||||
Gross profit margins for the MOSFETs segment were as follows:
|
|
Years ended December 31,
|
|||||||||||
|
2020
|
2019
|
2018
|
||||||||||
|
Gross profit margins
|
22.8
|
%
|
24.8
|
%
|
26.6
|
%
|
||||||
The MOSFETs segment net revenues decreased slightly in 2020 versus the prior year. Net revenues were negatively impacted by the temporary closure of our main manufacturing facility in China in the first fiscal quarter of 2020 and a significant decrease in revenues from automotive customers in the second fiscal quarter of 2020 due to the COVID-19 pandemic and mitigation efforts. Sales volume increased in the second half of 2020. The increased sales volume was fully offset the impact of declining selling prices. We experienced a significant increase in Asia, supported by our IC products, but significant decreases in the Europe and the Americas regions.
The gross profit margin in 2020 decreased versus the prior year primarily due to lower average selling prices, higher metals prices, and the negative impact of inventory reduction, partially offset by higher sales volume and cost reduction measures.
We experienced a significant decrease in average selling prices versus 2019. The decrease is partly due to negative customer and product mix. Due to increased demand, we anticipate prices will stabilize in 2021.
We continue to invest to expand mid- and long-term manufacturing capacity for strategic product lines.
41
Diodes
Net revenues of the Diodes segment were as follows
(dollars in thousands):
|
|
Years ended December 31,
|
|||||||||||
|
2020
|
2019
|
2018
|
||||||||||
|
Net revenues
|
$
|
502,548
|
$
|
557,143
|
$
|
712,936
|
||||||
|
Change versus comparable prior year period
|
$
|
(54,595
|
)
|
$
|
(155,793
|
)
|
||||||
|
Percentage change versus comparable prior year period
|
-9.8
|
%
|
-21.9
|
%
|
||||||||
Changes in Diodes segment net revenues were attributable to the following:
|
|
2020 vs. 2019
|
2019 vs. 2018
|
||||||
|
Change attributable to:
|
||||||||
|
Decrease in volume
|
-6.2
|
%
|
-19.6
|
%
|
||||
|
Decrease in average selling prices
|
-4.4
|
%
|
-2.0
|
%
|
||||
|
Foreign currency effects
|
0.4
|
%
|
-1.1
|
%
|
||||
|
Other
|
0.4
|
%
|
0.8
|
%
|
||||
|
Net change
|
-9.8
|
%
|
-21.9
|
%
|
||||
Gross profit margins for the Diodes segment were as follows:
|
|
Years ended December 31,
|
|||||||||||
|
2020
|
2019
|
2018
|
||||||||||
|
Gross profit margins
|
17.9
|
%
|
20.4
|
%
|
27.6
|
%
|
||||||
After record net revenues in 2018, net revenues of our Diodes segment significantly decreased in 2019 and 2020. Net revenues have been negatively impacted by excess supply in the supply chain. The decrease versus 2019 is due to significant decreases in the Americas and Europe regions, partially offset by increases in the Asia region. Decreased average selling prices also contributed to the decrease in net revenues.
Gross profit margin decreased versus the prior year primarily due to decreases in volume and average selling prices, partially offset by cost reduction measures.
Continued low customer demand in 2020 further increased the pressure on selling prices. Negative customer and product mix also contributed to the lower prices. As a result, we experienced a moderate decrease in average selling prices versus the prior year.
42
Optoelectronic Components
Net revenues of the Optoelectronic Components segment were as follows
(dollars in thousands):
|
|
Years ended December 31,
|
|||||||||||
|
2020
|
2019
|
2018
|
||||||||||
|
Net revenues
|
$
|
236,616
|
$
|
222,986
|
$
|
289,727
|
||||||
|
Change versus comparable prior year period
|
$
|
13,630
|
$
|
(66,741
|
)
|
|||||||
|
Percentage change versus comparable prior year period
|
6.1
|
%
|
-23.0
|
%
|
||||||||
Changes in Optoelectronic Components segment net revenues were attributable to the following:
|
|
2020 vs. 2019
|
2019 vs. 2018
|
||||||
|
Change attributable to:
|
||||||||
|
Change in volume
|
6.4
|
%
|
-19.3
|
%
|
||||
|
Decrease in average selling prices
|
-1.4
|
%
|
-3.1
|
%
|
||||
|
Foreign currency effects
|
0.9
|
%
|
-1.7
|
%
|
||||
|
Other
|
0.2
|
%
|
1.1
|
%
|
||||
|
Net change
|
6.1
|
%
|
-23.0
|
%
|
||||
Gross profit margins for the Optoelectronic Components segment were as follows:
|
|
Years ended December 31,
|
|||||||||||
|
2020
|
2019
|
2018
|
||||||||||
|
Gross profit margin
|
28.1
|
%
|
24.0
|
%
|
34.6
|
%
|
||||||
The Optoelectronic Components segment net revenues increased significantly in 2020 versus the prior year. The increase is primarily due to significant increases in the second half of 2020. The increase was primarily due to distribution customers especially in Asia.
The gross profit margin increased significantly versus the prior year. The increase is primarily due to the significant increases in volume, our cost reduction measures, the positive impact of an inventory increase and lower inventory obsolescence, partially offset by lower average selling prices and cost inflation.
The pricing pressure for our established Optoelectronic Components products decreased in parallel with the increase in demand. Average selling prices also benefited from some customers that prioritized securing supply over price reductions due to the COVID-19 pandemic. Therefore, average selling prices decreased slightly versus the prior year.
43
Resistors
Net revenues of the Resistors segment were as follows
(dollars in thousands):
|
|
Years ended December 31,
|
|||||||||||
|
2020
|
2019
|
2018
|
||||||||||
|
Net revenues
|
$
|
606,183
|
$
|
657,192
|
$
|
716,394
|
||||||
|
Change versus comparable prior year period
|
$
|
(51,009
|
)
|
$
|
(59,202
|
)
|
||||||
|
Percentage change versus comparable prior year period
|
(7.8
|
)%
|
(8.3
|
)%
|
||||||||
Changes in Resistors segment net revenues were attributable to the following:
|
|
2020 vs. 2019
|
2019 vs. 2018
|
||||||
|
Change attributable to:
|
||||||||
|
Decrease in volume
|
-7.4
|
%
|
-7.0
|
%
|
||||
|
Change in average selling prices
|
-1.9
|
%
|
0.2
|
%
|
||||
|
Foreign currency effects
|
0.7
|
%
|
-2.5
|
%
|
||||
|
Acquisitions
|
0.8
|
%
|
0.5
|
%
|
||||
|
Other
|
0.0
|
%
|
0.5
|
%
|
||||
|
Net change
|
-7.8
|
%
|
-8.3
|
%
|
||||
Gross profit margins for the Resistors segment were as follows:
|
|
Years ended December 31,
|
|||||||||||
|
2020
|
2019
|
2018
|
||||||||||
|
Gross profit margin
|
25.3
|
%
|
28.4
|
%
|
33.3
|
%
|
||||||
Net revenues of the Resistors segment decreased significantly versus the prior year. We experienced a significant decrease in net revenues in the Europe region, a slight decrease in the Americas region, and a significant increase in the Asia region. Sales to distributor and industrial customers decreased significantly.
The gross profit margin decreased versus the prior year. The decrease is due to lower sales volume, reduced average selling prices, labor cost increases, and increased shipping and metal prices, partially offset by fixed cost reductions and the positive impact of an inventory increase.
Average selling prices decreased slightly versus the prior year.
44
Inductors
Net revenues of the Inductors segment were as follows
(dollars in thousands):
|
|
Years ended December 31,
|
|||||||||||
|
2020
|
2019
|
2018
|
||||||||||
|
Net revenues
|
$
|
293,629
|
$
|
298,642
|
$
|
301,892
|
||||||
|
Change versus comparable prior year period
|
$
|
(5,013
|
)
|
$
|
(3,250
|
)
|
||||||
|
Percentage change versus comparable prior year period
|
(1.7
|
)%
|
(1.1
|
)%
|
||||||||
Changes in Inductors segment net revenues were attributable to the following:
|
|
2020 vs. 2019
|
2019 vs. 2018
|
||||||
|
Change attributable to:
|
||||||||
|
Increase in volume
|
0.4
|
%
|
1.4
|
%
|
||||
|
Decrease in average selling prices
|
-2.4
|
%
|
-1.6
|
%
|
||||
|
Foreign currency effects
|
0.3
|
%
|
-0.8
|
%
|
||||
|
Other
|
0.0
|
%
|
-0.1
|
%
|
||||
|
Net change
|
-1.7
|
%
|
-1.1
|
%
|
||||
Gross profit margins for the Inductors
segment were as follows:
|
|
Years ended December 31,
|
|||||||||||
|
2020
|
2019
|
2018
|
||||||||||
|
Gross profit margin
|
31.5
|
%
|
32.4
|
%
|
32.8
|
%
|
||||||
Net revenues of the Inductors segment decreased slightly versus the prior year. Decreases in the Europe and Americas regions were partially offset by a significant increase in the Asia region. Reduced sales to automotive and medical customers were partially offset by increased sales to military and aerospace, telecommunications, and industrial customers.
The gross profit margin decreased versus the prior year. The decrease is primarily due to lower average selling prices, labor costs increases, and increased shipping costs, partially offset by manufacturing efficiencies, lower materials prices, and variable cost reductions.
Average selling prices decreased slightly versus the prior year.
We expect long-term growth in this segment, and are positioned to capitalize on future market upturns.
45
Capacitors
Net revenues of the Capacitors segment were as follows
(dollars in thousands):
|
|
Years ended December 31,
|
|||||||||||
|
2020
|
2019
|
2018
|
||||||||||
|
Net revenues
|
$
|
361,542
|
$
|
423,197
|
$
|
466,097
|
||||||
|
Change versus comparable prior year period
|
$
|
(61,655
|
)
|
$
|
(42,900
|
)
|
||||||
|
Percentage change versus comparable prior year period
|
-14.6
|
%
|
-9.2
|
%
|
||||||||
Changes in Capacitors segment net revenues were attributable to the following:
|
|
2020 vs. 2019
|
2019 vs. 2018
|
||||||
|
Change attributable to:
|
||||||||
|
Decrease in volume
|
-15.7
|
%
|
-8.8
|
%
|
||||
|
Increase in average selling prices
|
1.1
|
%
|
2.3
|
%
|
||||
|
Foreign currency effects
|
0.4
|
%
|
-2.3
|
%
|
||||
|
Other
|
-0.4
|
%
|
-0.4
|
%
|
||||
|
Net change
|
-14.6
|
%
|
-9.2
|
%
|
||||
Gross profit margins for the Capacitors segment were as follows:
|
|
Years ended December 31,
|
|||||||||||
|
2020
|
2019
|
2018
|
||||||||||
|
Gross profit margin
|
19.4
|
%
|
22.3
|
%
|
23.3
|
%
|
||||||
Net revenues of the Capacitors segment decreased significantly versus the prior year. All regions decreased. The decrease is primarily due to lower sales to distributor, industrial, and automotive customers. Delays of government-sponsored projects significantly impacted the segment.
The gross profit margin decreased versus the prior year. The decrease is due to lower sales volume, negative product mix, and increased shipping costs, partially offset by higher average selling prices, manufacturing efficiencies, fixed cost reductions, and lower labor costs.
Despite the lower sales volume, average selling prices have increased slightly versus the prior year. The increase is primarily due to increased prices for certain materials that were passed through to our customers.
46
Selling, General, and Administrative Expenses
Selling, general, and administrative (“SG&A”) expenses are summarized as follows
(dollars in thousands)
:
|
|
Years ended December 31,
|
|||||||||||
|
2020
|
2019
|
2018
|
||||||||||
|
Total SG&A expenses
|
$
|
371,450
|
$
|
384,631
|
$
|
403,404
|
||||||
|
as a percentage of sales
|
14.8
|
%
|
14.4
|
%
|
13.3
|
%
|
||||||
SG&A expenses for the year ended December 31, 2020 includes $(1.5) million of incremental net costs (benefits) separable from normal operations directly attributable to the COVID-19 outbreak. SG&A expenses decreased due to reduced travel and other discretionary spending due to the COVID-19 pandemic.
Certain items included in SG&A expenses impact the comparability of these amounts, as summarized below
(in thousands)
:
|
|
Years ended December 31,
|
|||||||||||
|
2020
|
2019
|
2018
|
||||||||||
|
Amortization of intangible assets
|
$
|
8,113
|
$
|
8,476
|
$
|
11,807
|
||||||
Certain intangible assets became fully amortized in the third fiscal quarter of 2018 and the second and third fiscal quarters of 2020.
47
Other Income (Expense)
2020 Compared to 2019
Interest expense for the year ended December 31, 2020 decreased by $
2.1
million versus the year ended December 31, 2019. The decrease is primarily attributable to
repurchases of convertible debt instruments and the lower interest rate environment due to the COVID-19 pandemic.
We repurchased $151.5 million principal amount of convertible debt instruments in 2020. We recognized a $8.1 million loss on early extinguishment of the repurchased convertible debt instruments in 2020.
The following table analyzes the components of the line “Other” on the consolidated statements of operations
(in thousands):
|
|
Years ended December 31,
|
|||||||||||
|
2020
|
2019
|
Change
|
||||||||||
|
Foreign exchange gain (loss)
|
$
|
(4,095
|
)
|
$
|
(1,414
|
)
|
$
|
(2,681
|
)
|
|||
|
Interest income
|
3,709
|
8,445
|
(4,736
|
)
|
||||||||
|
Other components of net periodic pension expense
|
(13,613
|
)
|
(13,959
|
)
|
346
|
|||||||
|
Investment income
|
2,271
|
6,448
|
(4,177
|
)
|
||||||||
|
Other
|
(26
|
)
|
61
|
(87
|
)
|
|||||||
|
$
|
(11,754
|
)
|
$
|
(419
|
)
|
$
|
(11,335
|
)
|
||||
2019 Compared to 2018
Interest expense for the year ended December 31, 2019 decreased by $3.0 million versus the year ended December 31, 2018. The decrease is primarily attributable to reduced interest expense on the revolving credit facility and the convertible senior debentures as a result of using cash repatriated in 2018 to repay the balance of the credit facility in the third fiscal quarter of 2018 and to repurchase convertible senior debentures, partially offset by the issuance of convertible senior notes due 2025 in the second fiscal quarter of 2018.
We repurchased $19.4 million principal amount of convertible senior debentures in 2019. We recognized a $2.0 million loss on early extinguishment of the repurchased convertible debentures in 2019.
The following table analyzes the components of the line “Other” on the consolidated statements of operations
(in thousands):
|
|
Years ended December 31,
|
|||||||||||
|
2019
|
2018
|
Change
|
||||||||||
|
Foreign exchange gain (loss)
|
$
|
(1,414
|
)
|
$
|
(1,991
|
)
|
$
|
577
|
||||
|
Interest income
|
8,445
|
11,940
|
(3,495
|
)
|
||||||||
|
Other components of net periodic pension expense
|
(13,959
|
)
|
(13,118
|
)
|
(841
|
)
|
||||||
|
Investment income (loss)
|
6,448
|
(1,646
|
)
|
8,094
|
||||||||
|
Other
|
61
|
(266
|
)
|
327
|
||||||||
|
$
|
(419
|
)
|
$
|
(5,081
|
)
|
$
|
4,662
|
|||||
48
Income Taxes
For the years ended December 31, 2020, 2019, and 2018, the effective tax rates were 21.8%, 27.2%, and 16.9%, respectively. With the reduction in the U.S. statutory rate to 21% beginning January 1, 2018, we expect that our effective tax rate will now be higher than the U.S. statutory rate, excluding unusual transactions. Historically, the effective tax rates were generally less than the U.S. statutory rate primarily because of earnings in foreign jurisdictions. Discrete tax items impacted our effective tax rate for each period presented. These items were $2.0 million in 2020, $0.8 million (tax benefit) in 2019, and $39.4 million (tax benefit) in 2018.
We repatriated $104.1 million, $188.7 million, and $724 million to the United States, and paid withholding and foreign taxes of $16.3 million, $38.8 million, and $156.8 million in the years ended December 31, 2020, 2019, and 2018, respectively. The cash repatriation program that we initiated in 2017 in response to the Tax Cuts and Jobs Act ("TCJA") enacted in the United States is now completed.
The effective tax rates for the years ended December 31, 2020, 2019, and 2018 were impacted by the effect of the repurchase of convertible debentures. We recognized tax benefits of $1.6 million, $1.6 million, and $54.9 million in 2020, 2019, and 2018, respectively, reflecting the reduction in deferred tax liabilities related to the special tax attributes of the convertible debentures.
See Note 6 to our consolidated financial statements.
We recorded tax benefits of $0.2 million, $9.6 million, and $10.0 million during the years ended December 31, 2020, 2019, and 2018, respectively, due to adjustments to remeasure the deferred taxes related to our cash repatriation program, such as foreign currency effects, and to consider certain corporate reorganizational activities that impact repatriation.
The effective tax rates for the years ended December 31, 2020 and 2019 were also impacted by $3.8 million and $2.8 million, respectively, of net tax expense for changes in uncertain tax positions.
As part of our cash repatriation activity, we settled an intercompany loan, which previously had been accounted for at the historical foreign exchange rate (akin to an equity contribution) because the debtor entity did not have the intent or ability to repay such intercompany loan. Currency translation adjustments were recorded in accumulated other comprehensive income, and were not included in U.S. GAAP pre-tax income. Our cash repatriation activity resulted in the ability to repay such intercompany loan. Upon settlement of this intercompany loan, the foreign entity realized a taxable gain. Income tax expense for the year ended December 31, 2019 includes tax expense of $7.6 million related to this tax-basis foreign exchange gain.
The effective tax rate for the year ended December 31, 2018 was significantly impacted by $25.5 million of TCJA measurement period adjustments.
We operate in a global environment with significant operations in various locations outside the United States. Accordingly, the consolidated income tax rate is a composite rate reflecting our earnings and the applicable tax rates in the various locations where we operate. Part of our historical strategy has been to achieve cost savings through the transfer and expansion of manufacturing operations to countries where we can take advantage of lower labor costs and available tax and other government-sponsored incentives.
Additional information about income taxes is included in Note 5 to our consolidated financial statements.
49
Financial Condition, Liquidity, and Capital Resources
We focus on our ability to generate cash flows from operations. The cash generated from operations is used to fund our capital expenditure plans, and cash in excess of our capital expenditure needs is available to fund our acquisition strategy, to reduce debt levels, and to pay dividends and repurchase stock. We have generated cash flows from operations in excess of $200 million in each of the last 19 years, and cash flows from operations in excess of $100 million in each of the last 26 years.
Management uses a non-GAAP measure, "free cash," to evaluate our ability to fund acquisitions, repay debt, and otherwise enhance stockholder value through stock repurchases or dividends. See "Overview" above for "free cash" definition and reconciliation to GAAP. Vishay has generated positive "free cash" in each of the past 24 years, and "free cash" in excess of $80 million in each of the last 19 years. In this volatile economic environment, we continue to focus on the generation of free cash, including an emphasis on cost controls.
The COVID-19 pandemic and the mitigation efforts by governments to control its spread has not had significant impact on our financial condition, liquidity, or capital resources.
We repatriated $104.1 million and $188.7 million to the United States, and paid cash taxes of $16.3 million and $38.8 million related to the repatriations in 2020 and 2019, respectively. The payments of these cash taxes were recorded as operating cash flows and any future cash taxes associated with the TCJA transition tax and related foreign taxes on repatriated cash will generally be recorded as operating cash flows. The payment of these cash taxes significantly impacted cash flows from operations and free cash for the years ended December 31, 2020 and 2019. We expect our business to continue to be a reliable generator of free cash, partially offset by such tax payments. There is no assurance, however, that we will be able to continue to generate cash flows from operations and free cash at the same levels, or at all, going forward if the current economic environment worsens.
The $104.1 million repatriation in the second fiscal quarter of 2020 completed our cash repatriation program that we initiated in response to the TCJA. We continue to evaluate the TCJA's provisions and may further adjust our financial and capital structure and business practices accordingly.
We maintain a revolving credit facility, which provides an aggregate commitment of $750 million of revolving loans available until June 5, 2024. The maximum amount available on the revolving credit facility is restricted by the financial covenants described below. The credit facility also provides us the ability to request up to $300 million of incremental facilities, subject to the satisfaction of certain conditions, which could take the form of additional revolving commitments, incremental “term loan A” or “term loan B” facilities, or incremental equivalent debt.
At December 31, 2020, we had no amounts outstanding on our revolving credit facility. We had no amounts outstanding at December 31, 2019. We borrowed $479 million and repaid $479 million on the revolving credit facility during the year ended December 31, 2020. The average outstanding balance on our revolving credit facility calculated at fiscal month-ends was $40.8 million and the highest amount outstanding on our revolving credit facility at a fiscal month end was $115 million during the year ended December 31, 2020.
The revolving credit facility limits or restricts us from, among other things, incurring indebtedness, incurring liens on its respective assets, making investments and acquisitions (assuming our pro forma leverage ratio is greater than 2.75 to 1.00), making asset sales, and paying cash dividends and making other restricted payments (assuming our pro forma leverage ratio is greater than 2.50 to 1.00), and requires us to comply with other covenants, including the maintenance of specific financial ratios.
The financial maintenance covenants include (a) an interest coverage ratio of not less than 2.00 to 1; and (b) a leverage ratio of not more than 3.25 to 1 (and a pro forma ratio of 3.00 to 1 on the date of incurrence of additional debt). The computation of these ratios is prescribed in Article VI of the Credit Agreement between Vishay Intertechnology, Inc. and JPMorgan Chase Bank, N.A., which has been filed with the SEC as Exhibit 10.1 to our current report on Form 8-K filed June 5, 2019.
We were in compliance with all financial covenants under the credit facility at December 31, 2020. Our interest coverage ratio and leverage ratio were 16.14 to 1 and 1.26 to 1, respectively. We expect to continue to be in compliance with these covenants based on current projections. Based on our current EBITDA and outstanding revolver balance, the usable capacity on the revolving credit facility is approximately $730 million.
If we are not in compliance with all of the required financial covenants, the credit facility could be terminated by the lenders, and any amounts then outstanding pursuant to the credit facility could become immediately payable. Additionally, our convertible senior notes due 2025 have cross-default provisions that could accelerate repayment in the event the indebtedness under the credit facility is accelerated.
50
The credit facility allows an unlimited amount of defined “Investments,” which include certain intercompany transactions and acquisitions, provided our pro forma leverage ratio is equal to or less than 2.75 to 1.00. If our pro forma leverage ratio is greater than 2.75 to 1.00, such Investments are subject to certain limitations.
The credit facility also allows an unlimited amount of defined "Restricted Payments," which include cash dividends and share repurchases, provided our pro forma leverage ratio is equal to or less than 2.50 to 1.00. If our pro forma leverage ratio is greater than 2.50 to 1.00, the credit facility allows such payments up to $100 million per annum (subject to a cap of $300 million for the term of the facility, with up to $25 million of any unused amount of the $100 million per annum base available for use in the next succeeding calendar year).
Borrowings under the credit facility bear interest at LIBOR plus an interest margin. The applicable interest margin is based on our leverage ratio. Based on our current leverage ratio, any new borrowings will bear interest at LIBOR plus 1.50%. The interest rate on any borrowings increases to LIBOR plus 1.75% if our leverage ratio is between 1.50 to 1 and 2.50 to 1 and further increases to 2.00% if our leverage ratio equals or exceeds 2.50 to 1.
We also pay a commitment fee, also based on its leverage ratio, on undrawn amounts. The undrawn commitment fee, based on Vishay's current leverage ratio, is 0.25% per annum. Such undrawn commitment fee increases to 0.30% per annum if our leverage ratio is between 1.50 to 1 and 2.50 to 1 and further increases to 0.35% per annum if our leverage ratio equals or exceeds 2.50 to 1.
The borrowings under the credit facility are secured by a lien on substantially all assets, including accounts receivable, inventory, machinery and equipment, and general intangibles (but excluding real estate, intellectual property registered or licensed solely for use in, or arising solely under the laws of, any country other than the United States, assets located solely outside of the United States and deposit and securities accounts), of Vishay and certain significant subsidiaries located in the United States, and pledges of stock in certain significant domestic and foreign subsidiaries; and are guaranteed by certain significant subsidiaries.
During 2020, we repurchased $134.7 million principal amount of convertible senior notes due 2025 for $128.3 million and $16.9 million principal amount of convertible senior debentures due 2041 for $23.3 million. We borrowed from our revolving credit facility to fund the repurchases, a portion of which was repaid upon the completion of the cash repatriation plan in the second fiscal quarter. Such transactions provide us more flexibility to adjust our debt levels if necessary.
As of December 31, 2020, substantially all of our cash and cash equivalents and short-term investment were held in countries outside of the United States. Our substantially undrawn credit facility provides us with significant operating liquidity in the United States. We expect, at least initially, to fund any future repurchases of convertible debt instruments, as well as other obligations required to be paid by the U.S. parent company, Vishay Intertechnology, Inc., including cash dividends to stockholders, share repurchases, and principal and interest payments on our debt instruments by borrowing under our revolving credit facility. Our U.S. subsidiaries also have cash operating needs.
Management expects to use the credit facility from time-to-time to meet certain short-term financing needs. We expect that cash on-hand and cash flows from operations will be sufficient to meet our longer-term financing needs related to normal operating requirements, regular dividend payments, and our research and development and capital expenditure plans. Additional acquisition activity, share repurchases, convertible debt repurchases, or conversion of our convertible debt instruments may require additional borrowing under our credit facility or may otherwise require us to incur additional debt. No principal payments on our debt are due before 2025 and our revolving credit facility expires in June 2024.
Our contractual commitments are detailed in the Contractual Commitments table below.
Prior to three months before the maturity date, our convertible senior debentures are convertible by the holders under certain circumstances. The convertible senior debentures due 2040 were convertible at December 31, 2020. The Company redeemed the remaining $0.3 million principal amount of convertible senior debentures due 2040 on February 4, 2021. The convertible senior notes due 2025 are not currently convertible. Pursuant to the indenture governing convertible senior notes due 2025 and the amendments thereto incorporated in the Supplemental Indenture dated December 23, 2020, we will cash-settle the principal amount of $1,000 per note and settle any additional amounts in shares of our common stock. We intend to finance the principal amount of any converted debt instruments using borrowings under our credit facility. No conversions have occurred to date.
51
We invest a portion of our excess cash in highly liquid, high-quality instruments with maturities greater than 90 days, but less than 1 year, which we classify as short-term investments on our consolidated balance sheets. As these investments were funded using a portion of excess cash and represent a significant aspect of our cash management strategy, we include the investments in the calculation of net cash and short-term investments (debt).
The interest rates on our short-term investments vary by location, but can be up to 150 bps higher than the interest rates on our cash accounts. The average interest rate on our short-term investments was approximately 0.0% due to the negative interest rate environment in Europe and the very low interest rate environment in the United States. Transactions related to these investments are classified as investing activities on our consolidated statements of cash flows.
The amount of short-term investments at December 31, 2020 is lower than normal due to the recently completed cash repatriation activity.
The following table summarizes the components of net cash and short-term investments (debt)
(in thousands)
:
|
|
December 31,
2020
|
December 31,
2019
|
||||||
|
Credit Facility
|
$
|
-
|
$
|
-
|
||||
|
Convertible senior notes, due 2025*
|
406,268
|
509,128
|
||||||
|
Convertible senior debentures, due 2040*
|
130
|
126
|
||||||
|
Convertible senior debentures, due 2041*
|
-
|
6,677
|
||||||
|
Deferred financing costs
|
(11,512
|
)
|
(16,784
|
)
|
||||
|
Total debt
|
394,886
|
499,147
|
||||||
|
Cash and cash equivalents
|
619,874
|
694,133
|
||||||
|
Short-term investments
|
158,476
|
108,822
|
||||||
|
Net cash and short-term investments (debt)
|
$
|
383,464
|
$
|
303,808
|
||||
*Represents the carrying amount of the convertible debt instruments, which is comprised of the principal amount of the instruments, net of the unamortized discount.
"Net cash and short-term investments (debt)" does not have a uniform definition and is not recognized in accordance with GAAP. This measure should not be viewed as an alternative to GAAP measures of performance or liquidity. However, management believes that an analysis of "net cash and short-term investments (debt)" assists investors in understanding aspects of our cash and debt management. The measure, as calculated by us, may not be comparable to similarly titled measures used by other companies.
Our financial condition as of
December 31, 2020
continued to be strong, with the current ratio (current assets to current liabilities) of 3.0 to 1, as compared to 3.3 to 1 as of
December 31, 2019
. The decrease is primarily due to the increase in trade accounts payable and accrued payroll and related expenses. Our ratio of total debt to Vishay stockholders' equity was 0.25 to 1 at
December 31, 2020
as compared to a ratio of 0.34 to 1 at
December 31, 2019
. The decrease in the ratio is primarily due to
repurchases of convertible debt instruments.
Cash flows provided by operating activities were $314.9 million for the year ended December 31, 2020, as compared to cash flows provided by operations of $296.4 million for the year ended December 31, 2019. The increase in operating cash flows is partially due to less repatriation cash taxes paid in 2020 versus 2019.
Cash paid for property and equipment for the year ended December 31, 2020 was $123.6 million, as compared to $156.6 million for the year ended December 31, 2019. We expect capital spending of approximately $175 million in 2021, as required to fulfill increased demand.
Cash paid for dividends to our common and Class B common stockholders totalled $55.0 million and $53.4 million for the years ended December 31, 2020 and 2019, respectively. We expect dividend payments in 2021 to total approximately $55.0 million. However, any future dividend declaration and payment remains subject to authorization by our Board of Directors.
52
In evaluating our liquidity and capital resources, we consider our outstanding contractual commitments.
As of December 31, 2020 we had contractual obligations as follows
(in thousands)
:
|
|
Payments due by period
|
|||||||||||||||||||||||||||
|
Total
|
2021
|
2022
|
2023
|
2024
|
2025
|
Thereafter
|
||||||||||||||||||||||
|
Long-term debt
|
$
|
465,644
|
$
|
300
|
$
|
-
|
$
|
-
|
$
|
-
|
$
|
465,344
|
$
|
-
|
||||||||||||||
|
Interest payments on long-term debt
|
53,113
|
12,346
|
12,345
|
12,345
|
11,278
|
4,799
|
-
|
|||||||||||||||||||||
|
Operating leases
|
140,044
|
22,671
|
19,128
|
15,628
|
14,172
|
13,227
|
55,218
|
|||||||||||||||||||||
|
Letters of credit
|
1,310
|
-
|
-
|
-
|
1,310
|
-
|
-
|
|||||||||||||||||||||
|
Expected pension and postretirement plan funding
|
220,538
|
19,901
|
22,538
|
26,593
|
21,028
|
28,646
|
101,832
|
|||||||||||||||||||||
|
Estimated costs to complete construction in progress
|
51,600
|
51,600
|
-
|
-
|
-
|
-
|
-
|
|||||||||||||||||||||
|
TCJA transition tax
|
140,195
|
14,757
|
14,757
|
27,669
|
36,893
|
46,119
|
-
|
|||||||||||||||||||||
|
Uncertain tax positions
|
41,458
|
4,796
|
-
|
-
|
-
|
-
|
36,662
|
|||||||||||||||||||||
|
Purchase commitments
|
48,032
|
30,461
|
16,011
|
1,560
|
-
|
-
|
-
|
|||||||||||||||||||||
|
Other long-term liabilities
|
67,694
|
-
|
-
|
-
|
-
|
-
|
67,694
|
|||||||||||||||||||||
|
Total contractual cash obligations
|
$
|
1,229,628
|
$
|
156,832
|
$
|
84,779
|
$
|
83,795
|
$
|
84,681
|
$
|
558,135
|
$
|
261,406
|
||||||||||||||
Commitments for long-term debt are based on the amount required to settle the obligation. Accordingly, the discounts and capitalized deferred financing costs associated with our convertible debt instruments are excluded from the calculation of long-term debt commitments in the table above.
Commitments for interest payments on long-term debt are cash commitments based on the stated maturity dates of each agreement and include fees under our revolving credit facility, which expires on June 4, 2024. Commitments for interest payments on long-term debt exclude non-cash interest expense related to the amortization of the discount associated with our convertible debt instruments.
Various factors could have a material effect on the amount of future principal and interest payments. Principal and interest commitments associated with our convertible debt instruments are based on the amounts outstanding as of December 31, 2020 as adjusted for the redemption of the convertible senior debentures due 2040 on February 4, 2021. No further repurchases are considered. Additionally, interest commitments for our revolving credit facility are based on the rate prevailing at December 31, 2020, but actual rates are variable and are certain to change over time.
The TCJA imposed a one-time transition tax on deferred foreign earnings of 15.5% for liquid assets and 8% for illiquid assets, payable in defined increments over eight years. As a result of this requirement, we expect to pay $184.5 million, net of estimated applicable foreign tax credits, and after utilization of net operating loss and R&D and FTC Credit carryforwards. As of December 31, 2020, $44.3 million has been paid.
Our consolidated balance sheet at December 31, 2020 includes liabilities associated with uncertain tax positions in multiple taxing jurisdictions where we conduct business. Due to the uncertain and complex application of tax regulations, combined with the difficulty in predicting when tax audits throughout the world may be concluded, we cannot make reliable estimates of the timing of the remaining cash outflows relating to these liabilities. Accordingly, we have classified the amount recorded as a current liability as payable within one year, and the remaining uncertain tax positions are classified as payments due thereafter, although actual timing of payments may be sooner.
There are certain guarantees and indemnifications extended among Vishay and VPG in accordance with the terms of the Master Separation and Distribution Agreement and the Tax Matters Agreement. The guarantees primarily relate to certain contingent tax liabilities included in the Tax Matters Agreement. See Note 19 to our consolidated financial statements for further discussion of the Tax Matters Agreement. These obligations are included in the uncertain tax positions disclosed above, but were not material to us as of December 31, 2020.
Expected pension and postretirement plan funding is based on a projected schedule of benefit payments under the plans.
We maintain long-term foundry arrangements with subcontractors to ensure access to external front-end capacity for our semiconductor products. The purchase commitments in the table above represent the estimated minimum commitments for silicon wafers under these arrangements. Our actual purchases in future periods are expected to be greater than these minimum commitments.
Other long-term liabilities in the table above include obligations that are reflected on our consolidated balance sheets as of December 31, 2020. We include the current portion of the long-term liabilities in the table above. Other long-term liabilities for which we are unable to reasonably estimate the timing of the settlement are classified as payments due thereafter in the table above, although actual timing of payments may be sooner.
For a further discussion of our long-term debt, pensions and other postretirement benefits, leases, uncertain tax positions, and purchase commitments, see Notes 3, 5, 6, 11, and 13 to our consolidated financial statements.
53
Inflation
Normally, inflation does not have a significant impact on our operations as our products are not generally sold on long-term contracts. Consequently, we can adjust our selling prices, to the extent permitted by competition and other market conditions, to reflect cost increases caused by inflation.
See also “Commodity Price Risk” included in Item 7A, “Quantitative and Qualitative Disclosures About Market Risk” for additional related information.
Recent Accounting Pronouncements
See Note 1 to our consolidated financial statements for information about recent accounting pronouncements.
|
Item 7A.
|
QUANTITATIVE AND QUALITATIVE DISCLOSURES ABOUT MARKET RISK
|
Market Risk Disclosure
We are exposed to certain financial risks, including fluctuations in foreign currency exchange rates, interest rates, and commodity prices.
We manage our exposure to these market risks through internally established policies and procedures and, when deemed appropriate, through the use of derivative financial instruments. Our policies do not allow speculation in derivative instruments for profit or execution of derivative instrument contracts for which there are no underlying exposures. We do not use financial instruments for trading purposes and we are not a party to any leveraged derivatives. We monitor our underlying market risk exposures on an ongoing basis and believe that we can modify or adapt our hedging strategies as needed.
Interest Rate Risk
We are exposed to changes in interest rates as a result of our borrowing activities and our cash balances. On a selective basis, we have in the past entered into interest rate swap or cap agreements to reduce the potential negative impact that increases in interest rates could have on our outstanding variable rate debt. As of December 31, 2020, 2019, and 2018 we did not have any outstanding interest rate swap or cap agreements.
The interest paid on our credit facility is based on a LIBOR spread. At December 31, 2020, we had no amounts outstanding under the revolving credit facility. Future borrowings under the revolving credit commitment will bear interest at LIBOR plus 1.50%.
Our convertible debt instruments bear interest at a fixed rate, and accordingly are not subject to interest rate fluctuation risks.
At December 31, 2020, we had $619.9 million of cash and cash equivalents and $158.5 million of short-term investments, which earn interest at various variable rates.
Based on the debt and cash positions at December 31, 2020, we would expect a 50 basis point increase or decrease in interest rates to increase or decrease our annualized net earnings by approximately $3.1 million.
See Note 6 to our consolidated financial statements for additional information about our long-term debt. Also see “Economic Outlook and Impact on Operations and Future Financial Results” included in Item 7, “Management’s Discussion and Analysis of Financial Condition and Results of Operations” for additional discussion of market risks.
Foreign Exchange Risk
We are exposed to foreign currency exchange rate risks, particularly due to market values of transactions in currencies other than the functional currencies of certain subsidiaries.
We use forward exchange contracts to economically hedge a portion of these exposures. We entered into forward contracts with highly-rated financial institutions to mitigate the foreign currency risk associated with intercompany loans denominated in a currency other than the legal entity's functional currency.
The notional amount of the forward contracts was $100 million as of December 31, 2020. The forward contracts are short-term in nature and are expected to be renewed at our discretion until the intercompany loans are repaid. We have not designated the forward contracts as hedges for accounting purposes, and as such the change in the fair value of contracts is recognized in our consolidated statements of operations as a component of other income (expense). We do not utilize derivatives or other financial instruments for trading or other speculative purposes.
Our significant foreign subsidiaries are located in Germany, Israel, and Asia. We finance our operations in Europe and certain locations in Asia in local currencies. Our operations in Israel and most significant locations in Asia are largely financed in U.S. dollars, but these subsidiaries also have significant transactions in local currencies. Our exposure to foreign currency risk is mitigated to the extent that the costs incurred and the revenues earned in a particular currency offset one another. Our exposure to foreign currency risk is more pronounced in Israel, the Czech Republic, and China because the percentage of expenses denominated in Israeli shekels, Czech koruna, and Chinese renminbi to total expenses is much greater than the percentage of sales denominated in Israeli shekels, Czech koruna, and Chinese renminbi to total sales. Therefore, if the Israeli shekel, Czech koruna, and Chinese renminbi strengthen against all or most of our other major currencies, our operating profit is reduced. Where possible, we maintain local currency denominated cash balances in these countries approximately equal to the local currency liabilities to naturally hedge our exposures. We also have a slightly higher percentage of euro-denominated sales than expenses. Therefore, when the euro strengthens against all or most of our other major currencies, our operating profit is slightly increased. Accordingly, we monitor several important cross-rates.
54
We have performed sensitivity analyses of our consolidated foreign exchange risk as of December 31, 2020 and 2019, using a model that measures the change in the values arising from a hypothetical 10% adverse movement in foreign currency exchange rates relative to the U.S. dollar, with all other variables held constant. The foreign currency exchange rates we used were based on market rates in effect at December 31, 2020 and 2019. The sensitivity analyses indicated that a hypothetical 10% adverse movement in foreign currency exchange rates would impact our net earnings by approximately $2.6 million and $3.1 million at December 31, 2020 and December 31, 2019, respectively, although individual line items in our consolidated statement of operations would be materially affected. For example, a 10% weakening in all foreign currencies would decrease the U.S. dollar equivalent of operating income generated in foreign currencies, which would be offset by foreign exchange gains of our foreign subsidiaries that have significant transactions in U.S. dollars or have the U.S. dollar as their functional currency.
A change in the mix of the currencies in which we transact our business could have a material effect on the estimated impact of the hypothetical 10% movement in the value of the U.S. dollar. Furthermore, the timing of cash receipts and disbursements could result in materially different actual results versus the hypothetical 10% movement in the value of the U.S. dollar, particularly if there are significant changes in exchange rates in a short period of time.
Commodity Price Risk
Although most materials incorporated in our products are available from a number of sources, certain materials are available only from a relatively limited number of suppliers or are subject to significant price volatility. Our results of operations may be materially and adversely affected if we have difficulty obtaining these raw materials, the quality of available raw materials deteriorates, or there are significant price changes for these raw materials. The determination that any of the raw materials used in our products are conflict minerals originating from the Democratic Republic of the Congo and adjoining countries could increase the probability that we will encounter the challenges noted above, incur additional expenses to comply with government regulations, and face public scrutiny. For periods in which the prices of these raw materials are rising, we may be unable to pass on the increased cost to our customers which would result in decreased margins for the products in which they are used. For periods in which the prices are declining, we may be required to write down our inventory carrying cost of these raw materials, since we record our inventory at the lower of cost or market. Depending on the extent of the difference between market price and our carrying cost, this write-down could have a material adverse effect on our net earnings. We also may need to record losses for adverse purchase commitments for these materials in periods of declining prices.
Silicon wafers are the most important raw material for the manufacturing of our semiconductor products. Silicon wafers are manufactured from high-purity silicon, a metalloid. There have at times been industry-wide shortages of high-purity silicon resulting primarily from growing demand of the electronic component and solar power industries, and limited growth in high-purity silicon manufacturing capacities. Shifts in demand for high-purity silicon and in turn, silicon wafers, have resulted in significant fluctuation in prices of silicon wafers.
We are a major consumer of the world’s annual production of tantalum, a metal used in the manufacturing of tantalum capacitors. There are few suppliers that process tantalum ore into capacitor grade tantalum powder.
Palladium, a metal used to produce multi-layer ceramic capacitors, is currently found primarily in South Africa and Russia. Palladium is a commodity metal that is subject to price volatility. We periodically enter into short-term commitments to purchase palladium.
Certain metals used in the manufacture of our products, such as copper, are traded on active markets, and can be subject to significant price volatility. Our policy is to enter into short-term commitments to purchase defined portions of annual consumption of these metals if market prices decline below budget.
We estimate that a 10% increase or decrease in the costs of raw materials subject to commodity price risk would decrease or increase our net earnings by $7.4 million, assuming that such changes in our costs have no impact on the selling prices of our products and that we have no pending commitments to purchase metals at fixed prices.
55
|
Item 8.
|
FINANCIAL STATEMENTS AND SUPPLEMENTARY DATA
|
The financial statements required by this Item are filed herewith, commencing on page F-1 of this report.
|
Item 9.
|
CHANGES IN AND DISAGREEMENTS WITH ACCOUNTANTS ON ACCOUNTING AND FINANCIAL DISCLOSURE
|
None.
|
Item 9A.
|
CONTROLS AND PROCEDURES
|
Conclusion Regarding the Effectiveness of Disclosure Controls and Procedures
An evaluation was performed under the supervision and with the participation of our management, including the Chief Executive Officer (“CEO”) and Chief Financial Officer (“CFO”), of the effectiveness of the design and operation of our disclosure controls and procedures, as such term is defined under Rule 13a-15(e) and Rule 15d-15(e) promulgated under the Securities Exchange Act of 1934, as amended. Based on that evaluation, our CEO and CFO concluded that our disclosure controls and procedures were effective as of the end of the period covered by this annual report to ensure that information required to be disclosed in reports that we file or submit under the Exchange Act is: (1) recorded, processed, summarized, and reported within the time periods specified in the SEC’s rules and forms; and (2) accumulated and communicated to our management, including our CEO and CFO, as appropriate to allow timely decisions regarding required disclosure.
Changes in Internal Control Over Financial Reporting
There were no changes in our internal control over financial reporting during our last fiscal quarter that have materially affected, or are reasonably likely to materially affect, our internal control over financial reporting.
Certifications
The certifications of our CEO and CFO pursuant to Section 302 of the Sarbanes-Oxley Act of 2002 are filed as Exhibits 31.1 and 31.2 to this Annual Report on Form 10-K. We have also filed with the New York Stock Exchange the most recent Annual Certification as required by Section 303A.12(a) of the New York Stock Exchange Listed Company Manual.
Management’s Report on Internal Control Over Financial Reporting
Our management is responsible for establishing and maintaining adequate internal control over financial reporting, as such term is defined in Exchange Act Rules 13a-15(f) and 15d-15(f). Under the supervision and with the participation of our management, including our CEO and CFO, we conducted an evaluation of the effectiveness of our internal control over financial reporting as of December 31, 2020 based on the 2013 framework set forth in
Internal Control – Integrated Framework
issued by the Committee of Sponsoring Organizations of the Treadway Commission. Based on that evaluation, our management concluded that our internal control over financial reporting was effective as of December 31, 2020.
Ernst & Young LLP has issued an attestation report on the effectiveness of our internal control over financial reporting. Their report is set forth below.
56
Report of Independent Registered Public Accounting Firm
To the Stockholders and the Board of Directors of Vishay Intertechnology, Inc.
Opinion on Internal Control over Financial Reporting
We have audited Vishay Intertechnology, Inc.’s internal control over financial reporting as of December 31, 2020, based on criteria established in Internal Control—Integrated Framework issued by the Committee of Sponsoring Organizations of the Treadway Commission (2013 framework) (the COSO criteria). In our opinion, Vishay Intertechnology, Inc. (the Company) maintained, in all material respects, effective internal control over financial reporting as of December 31, 2020, based on the COSO criteria.
We also have audited, in accordance with the standards of the Public Company Accounting Oversight Board (United States) (PCAOB), the consolidated balance sheets of the Company as of December 31, 2020 and 2019, and the related consolidated statements of operations, comprehensive income, stockholders’ equity, and cash flows for each of the three years in the period ended December 31, 2020, and the related notes and our report dated February 24, 2021 expressed an unqualified opinion thereon.
Basis for Opinion
The Company’s management is responsible for maintaining effective internal control over financial reporting and for its assessment of the effectiveness of internal control over financial reporting included in the accompanying Management’s Report on Internal Control Over Financial Reporting. Our responsibility is to express an opinion on the Company’s internal control over financial reporting based on our audit. We are a public accounting firm registered with the PCAOB and are required to be independent with respect to the Company in accordance with the U.S. federal securities laws and the applicable rules and regulations of the Securities and Exchange Commission and the PCAOB.
We conducted our audit in accordance with the standards of the PCAOB. Those standards require that we plan and perform the audit to obtain reasonable assurance about whether effective internal control over financial reporting was maintained in all material respects.
Our audit included obtaining an understanding of internal control over financial reporting, assessing the risk that a material weakness exists, testing and evaluating the design and operating effectiveness of internal control based on the assessed risk, and performing such other procedures as we considered necessary in the circumstances. We believe that our audit provides a reasonable basis for our opinion.
Definition and Limitations of Internal Control Over Financial Reporting
A company’s internal control over financial reporting is a process designed to provide reasonable assurance regarding the reliability of financial reporting and the preparation of financial statements for external purposes in accordance with generally accepted accounting principles. A company’s internal control over financial reporting includes those policies and procedures that (1) pertain to the maintenance of records that, in reasonable detail, accurately and fairly reflect the transactions and dispositions of the assets of the company; (2) provide reasonable assurance that transactions are recorded as necessary to permit preparation of the financial statements in accordance with generally accepted accounting principles, and that receipts and expenditures of the company are being made only in accordance with authorizations of management and directors of the company; and (3) provide reasonable assurance regarding prevention or timely detection of unauthorized acquisition, use, or disposition of the company’s assets that could have a material effect on the financial statements.
Because of its inherent limitations, internal control over financial reporting may not prevent or detect material misstatements. Also, projections of any evaluation of effectiveness to future periods are subject to the risk that controls may become inadequate because of changes in conditions, or that the degree of compliance with the policies or procedures may deteriorate.
/s/ Ernst & Young LLP
Philadelphia, Pennsylvania
February 24, 2021
57
|
Item 9B.
|
OTHER INFORMATION
|
None.
|
Item 10.
|
DIRECTORS, EXECUTIVE OFFICERS, AND CORPORATE GOVERNANCE
|
We have a code of ethics applicable to our Chief Executive Officer, Chief Financial Officer, Principal Accounting Officer or Controller, and financial managers. The text of this code has been posted on our website. To view the code, go to our website at ir.vishay.com and click on Corporate Governance. You can obtain a printed copy of this code, free of charge, by contacting us at the following address:
Corporate Investor Relations
Vishay Intertechnology, Inc.
63 Lancaster Avenue
Malvern, PA 19355-2143
It is our intention to satisfy the disclosure requirement under Item 5.05 of Form 8-K regarding any amendment to, or any waiver from, a provision of this code by posting such information on our website, at the aforementioned address and location.
Certain information required under this Item with respect to our Executive Officers is set forth in Part I hereof under the caption “Executive Officers of the Registrant.”
Other information required under this Item will be contained in our definitive proxy statement, which will be filed within 120 days of December 31, 2020, our most recent fiscal year end, and is incorporated herein by reference.
|
Item 11.
|
EXECUTIVE COMPENSATION
|
Information required under this Item will be contained in our definitive proxy statement, which will be filed within 120 days of December 31, 2020, our most recent fiscal year end, and is incorporated herein by reference.
|
Item 12.
|
SECURITY OWNERSHIP OF CERTAIN BENEFICIAL OWNERS AND MANAGEMENT AND RELATED STOCKHOLDER MATTERS
|
Information required under this Item will be contained in our definitive proxy statement, which will be filed within 120 days of December 31, 2020, our most recent fiscal year end, and is incorporated herein by reference.
|
Item 13.
|
CERTAIN RELATIONSHIPS AND RELATED TRANSACTIONS, AND DIRECTOR INDEPENDENCE
|
Information required under this Item will be contained in our definitive proxy statement, which will be filed within 120 days of December 31, 2020, our most recent fiscal year end, and is incorporated herein by reference.
|
Item 14.
|
PRINCIPAL ACCOUNTING FEES AND SERVICES
|
Information required under this Item will be contained in our definitive proxy statement, which will be filed within 120 days of December 31, 2020, our most recent fiscal year end, and is incorporated herein by reference.
58
|
Item 15.
|
EXHIBITS, FINANCIAL STATEMENT SCHEDULES
|
(a)
Documents Filed as Part of Form 10-K
| 1. |
Financial Statements
|
The Consolidated Financial Statements for the year ended December 31, 2020 are filed herewith. See Index to the Consolidated Financial Statements on page F-1 of this report.
| 2. |
Financial Statement Schedules
|
All financial statement schedules have been omitted because they are not applicable, not material, or the required information is shown in the consolidated financial statements or the notes thereto.
| 3. |
Exhibits
|
|
|
||
59
|
|
||
60
|
|
||
|
101**
|
Interactive Data File (Annual Report on Form 10-K, for the year ended December 31, 2020, furnished in iXBRL (Inline eXtensible Business Reporting Language)).
|
|
|
104**
|
Cover Page Interactive Data File (formatted as Inline eXtensible Business Reporting Language and contained in Exhibit 101)
|
__________________
* Confidential treatment has been requested by, and accorded to, VPG with respect to certain portions of this Exhibit. Omitted portions have been filed separately by VPG with the Securities and Exchange Commission.
** Filed herewith.
† Denotes a management contract or compensatory plan, contract, or arrangement.
|
Item 16.
|
|
Form 10-K Summary
|
Not applicable.
61
Pursuant to the requirement of Section 13 or 15(d) of the Securities Exchange Act of 1934, the Registrant has duly caused this report to be signed on its behalf by the undersigned, thereunto duly authorized.
VISHAY INTERTECHNOLOGY, INC.
|
By:
|
/s/ Gerald Paul
|
|
|
Dr. Gerald Paul
|
||
|
President and Chief Executive Officer
|
||
|
February 24, 2021
|
Pursuant to the requirements of the Securities Exchange Act of 1934, this report has been signed below by the following persons on behalf of the Registrant and in the capacities and on the dates indicated below.
|
Signature
|
Title
|
Date
|
|
Principal Executive Officer:
|
||
|
/s/ Gerald Paul
|
President, Chief Executive Officer,
|
February 24, 2021
|
|
Dr. Gerald Paul
|
and Director
|
|
|
Principal Financial and Accounting Officer:
|
||
|
/s/ Lori Lipcaman
|
Executive Vice President and Chief
|
February 24, 2021
|
|
Lori Lipcaman
|
Financial Officer
|
|
|
Board of Directors:
|
||
|
/s/ Marc Zandman
|
Executive Chairman of
|
February 24, 2021
|
|
Marc Zandman
|
the Board of Directors
|
|
|
/s/ Michael Cody
|
Director
|
February 24, 2021
|
|
Michael Cody
|
||
|
/s/ Abraham Ludomirski
|
Director
|
February 24, 2021
|
|
Dr. Abraham Ludomirski
|
||
|
/s/ Ziv Shoshani
|
Director
|
February 24, 2021
|
|
Ziv Shoshani
|
||
|
/s/ Timothy V. Talbert
|
Director
|
February 24, 2021
|
|
Timothy V. Talbert
|
||
|
/s/ Jeffrey H. Vanneste
|
Director
|
February 24, 2021
|
|
Jeffrey H. Vanneste
|
||
|
/s/ Thomas C. Wertheimer
|
Director
|
February 24, 2021
|
|
Thomas C. Wertheimer
|
||
|
/s/ Ruta Zandman
|
Director
|
February 24, 2021
|
|
Ruta Zandman
|
||
|
/s/ Raanan Zilberman
|
Director
|
February 24, 2021
|
|
Raanan Zilberman
|
62
Vishay Intertechnology, Inc.
Index to Consolidated Financial Statements
|
Report of Independent Registered Public Accounting Firm
|
F-2
|
|
Audited Consolidated Financial Statements
|
|
|
Consolidated Balance Sheets
|
F-4
|
|
Consolidated Statements of Operations
|
F-6
|
|
Consolidated Statements of Comprehensive Income
|
F-7
|
|
Consolidated Statements of Cash Flows
|
F-8
|
|
Consolidated Statements of Stockholders’ Equity
|
F-9
|
|
Notes to the Consolidated Financial Statements
|
F-10
|
F-
1
To the Stockholders and the Board of Directors of Vishay Intertechnology, Inc.
Opinion on the Financial Statements
We have audited the accompanying consolidated balance sheets of Vishay Intertechnology, Inc. (the Company) as of December 31, 2020 and 2019, and the related consolidated statements of operations, comprehensive income, stockholders' equity, and cash flows for each of the three years in the period ended December 31, 2020, and the related notes (collectively referred to as the “consolidated financial statements”). In our opinion, the consolidated financial statements present fairly, in all material respects, the financial position of the Company at December 31, 2020 and 2019, and the results of its operations and its cash flows for each of the three years in the period ended December 31, 2020, in conformity with U.S. generally accepted accounting principles.
We also have audited, in accordance with the standards of the Public Company Accounting Oversight Board (United States) (PCAOB), the Company’s internal control over financial reporting as of December 31, 2020, based on criteria established in Internal Control—Integrated Framework issued by the Committee of Sponsoring Organizations of the Treadway Commission (2013 framework) and our report dated February 24, 2021 expressed an unqualified opinion thereon.
Basis for Opinion
These financial statements are the responsibility of the Company’s management. Our responsibility is to express an opinion on the Company’s financial statements based on our audits. We are a public accounting firm registered with the PCAOB and are required to be independent with respect to the Company in accordance with the U.S. federal securities laws and the applicable rules and regulations of the Securities and Exchange Commission and the PCAOB.
We conducted our audits in accordance with the standards of the PCAOB. Those standards require that we plan and perform the audit to obtain reasonable assurance about whether the financial statements are free of material misstatement, whether due to error or fraud. Our audits included performing procedures to assess the risks of material misstatement of the financial statements, whether due to error or fraud, and performing procedures that respond to those risks. Such procedures included examining, on a test basis, evidence regarding the amounts and disclosures in the financial statements. Our audits also included evaluating the accounting principles used and significant estimates made by management, as well as evaluating the overall presentation of the financial statements. We believe that our audits provide a reasonable basis for our opinion.
Critical Audit Matter
The critical audit matter communicated below is a matter arising from the current period audit of the financial statements that was communicated or required to be communicated to the audit committee and that: (1) relates to accounts or disclosures that are material to the financial statements and (2) involved our especially challenging, subjective or complex judgments. The communication of the critical audit matter does not alter in any way our opinion on the consolidated financial statements, taken as a whole, and we are not, by communicating the critical audit matter below, providing a separate opinion on the critical audit matter or on the account or disclosure to which it relates.
F-
2
|
Sales Returns and Allowances Accruals
|
||
|
Description of the Matter
|
At December 31, 2020, the Company’s liability for sales returns and allowances was $39.6 million. As discussed in Note 1 of the consolidated financial statements, the Company recognizes the estimated variable consideration to be received as revenue from contracts with customers and recognizes a related accrued liability for estimated future credits that will be issued to its customers, primarily distributors, for product returns, scrap allowance, “stock, ship and debit” and price protection programs with those customers.
Auditing management’s sales returns and allowances accruals involved a high degree of subjectivity due to the significant judgment required in evaluating management’s estimates of future credits that will be issued to customers for sales that were recognized during the period. In particular, the estimates were sensitive to significant assumptions such as projected market trends and conditions that drive expected demand and pricing of the Company’s products to be sold from distributor inventories in the future, inventory levels at customer locations subject to future credits, and the amount of future credits that are expected to be provided to the customers.
|
|
|
How We Addressed the Matter in Our Audit
|
We obtained an understanding, evaluated the design and tested the operating effectiveness of controls over the Company’s sales returns and allowances review process. For example, we tested controls over management’s review of the significant assumptions described above.
To test the estimated sales returns and allowances accruals, we performed audit procedures that included, among others, assessing methodologies and testing the significant assumptions discussed above and the completeness and accuracy of the underlying data used by the Company in its analyses. We inspected contracts with customers in evaluating whether the assumptions used by management agreed with the terms and conditions of the contracts. In addition, we compared the significant assumptions used by management to current industry and economic trends that affect demand for the Company’s products, pricing trends and actual historical credit experience. We also assessed the historical accuracy of management’s estimates and performed sensitivity analyses of significant assumptions to evaluate the changes in the sales returns and allowances accruals that would result from changes in the significant assumptions.
|
|
/s/ Ernst & Young LLP
We have served as the Company's auditor since 1968.
Philadelphia, Pennsylvania
February 24, 2021
F-
3
VISHAY INTERTECHNOLOGY, INC.
(In thousands, except share amounts)
|
|
December 31,
2020
|
December 31,
2019
|
||||||
|
|
||||||||
|
Assets
|
||||||||
|
Current assets:
|
||||||||
|
Cash and cash equivalents
|
$
|
|
$
|
|
||||
|
|
||||||||
|
Short-term investments
|
|
|
||||||
|
|
||||||||
|
Accounts receivable, net of allowances for credit losses of $
|
|
|
||||||
|
|
||||||||
|
Inventories:
|
||||||||
|
Finished goods
|
|
|
||||||
|
Work in process
|
|
|
||||||
|
Raw materials
|
|
|
||||||
|
Total inventories
|
|
|
||||||
|
|
||||||||
|
Prepaid expenses and other current assets
|
|
|
||||||
|
Total current assets
|
|
|
||||||
|
|
||||||||
|
Property and equipment, at cost:
|
||||||||
|
Land
|
|
|
||||||
|
Buildings and improvements
|
|
|
||||||
|
Machinery and equipment
|
|
|
||||||
|
Construction in progress
|
|
|
||||||
|
Allowance for depreciation
|
(
|
)
|
(
|
)
|
||||
|
Property and equipment, net
|
|
|
||||||
|
|
||||||||
|
Right of use assets
|
|
|
||||||
|
Goodwill
|
|
|
||||||
|
|
||||||||
|
Other intangible assets, net
|
|
|
||||||
|
|
||||||||
|
Other assets
|
|
|
||||||
|
Total assets
|
$
|
|
$
|
|
||||
Continues on following page.
F-
4
VISHAY INTERTECHNOLOGY, INC.
Consolidated Balance Sheets (continued)
(In thousands, except share amounts)
|
|
December 31,
2020
|
December 31,
2019
|
||||||
|
Liabilities, temporary equity, and equity
|
||||||||
|
Current liabilities:
|
||||||||
|
Notes payable to banks
|
$
|
|
$
|
|
||||
|
Trade accounts payable
|
|
|
||||||
|
Payroll and related expenses
|
|
|
||||||
|
Lease liabilities
|
|
|
||||||
|
Other accrued expenses
|
|
|
||||||
|
Income taxes
|
|
|
||||||
|
Total current liabilities
|
|
|
||||||
|
|
||||||||
|
Long-term debt, less current portion
|
|
|
||||||
|
U.S. transition tax payable
|
|
|
||||||
|
Deferred income taxes
|
|
|
||||||
|
Long-term lease liabilities
|
|
|
||||||
|
Other liabilities
|
|
|
||||||
|
Accrued pension and other postretirement costs
|
|
|
||||||
|
Total liabilities
|
|
|
||||||
|
|
||||||||
|
Commitments and contingencies
|
|
|
||||||
|
Redeemable convertible debentures
|
|
|
||||||
|
|
||||||||
|
Stockholders' equity:
|
||||||||
|
Preferred stock, par value $
|
|
|
||||||
|
Common stock, par value $
|
|
|
||||||
|
Class B convertible common stock, par value $
|
|
|
||||||
|
Capital in excess of par value
|
|
|
||||||
|
Retained earnings
|
|
|
||||||
|
Accumulated other comprehensive income (loss)
|
|
(
|
)
|
|||||
|
Total Vishay stockholders' equity
|
|
|
||||||
|
Noncontrolling interests
|
|
|
||||||
|
Total equity
|
|
|
||||||
|
Total liabilities, temporary equity, and equity
|
$
|
|
$
|
|
||||
See accompanying notes.
F-
5
VISHAY INTERTECHNOLOGY, INC.
(In thousands, except per share amounts)
|
|
Years ended December 31,
|
|||||||||||
|
2020
|
2019
|
2018
|
||||||||||
|
Net revenues
|
$
|
|
$
|
|
$
|
|
||||||
|
Costs of products sold
|
|
|
|
|||||||||
|
Gross profit
|
|
|
|
|||||||||
|
Selling, general, and administrative expenses
|
|
|
|
|||||||||
|
Restructuring and severance costs
|
|
|
|
|||||||||
|
Operating income
|
|
|
|
|||||||||
|
Other income (expense):
|
||||||||||||
|
Interest expense
|
(
|
)
|
(
|
)
|
(
|
)
|
||||||
|
Other
|
(
|
)
|
(
|
)
|
(
|
)
|
||||||
|
Loss on early extinguishment of debt
|
(
|
)
|
(
|
)
|
(
|
)
|
||||||
|
Total other income (expense)
|
(
|
)
|
(
|
)
|
(
|
)
|
||||||
|
Income before taxes
|
|
|
|
|||||||||
|
Income tax expense
|
|
|
|
|||||||||
|
Net earnings
|
|
|
|
|||||||||
|
Less: net earnings attributable to noncontrolling interests
|
|
|
|
|||||||||
|
Net earnings attributable to Vishay stockholders
|
$
|
|
$
|
|
$
|
|
||||||
|
Basic earnings per share attributable to Vishay stockholders:
|
$
|
|
$
|
|
$
|
|
||||||
|
Diluted earnings per share attributable to Vishay stockholders:
|
$
|
|
$
|
|
$
|
|
||||||
|
Weighted average shares outstanding - basic
|
|
|
|
|||||||||
|
Weighted average shares outstanding - diluted
|
|
|
|
|||||||||
|
Cash dividends per share
|
$
|
|
$
|
|
$
|
|
||||||
See accompanying notes.
F-
6
VISHAY INTERTECHNOLOGY, INC.
(In thousands)
|
|
Years ended December 31,
|
|||||||||||
|
2020
|
2019
|
2018
|
||||||||||
|
Net earnings
|
$
|
|
$
|
|
$
|
|
||||||
|
Other comprehensive income (loss), net of tax
|
||||||||||||
|
Pension and other post-retirement actuarial items
|
(
|
)
|
(
|
)
|
|
|||||||
|
Foreign currency translation adjustment
|
|
(
|
)
|
(
|
)
|
|||||||
|
Other comprehensive income (loss)
|
|
(
|
)
|
(
|
)
|
|||||||
|
Comprehensive income
|
|
|
|
|||||||||
|
Less: comprehensive income attributable to noncontrolling interests
|
|
|
|
|||||||||
|
Comprehensive income attributable to Vishay stockholders
|
$
|
|
$
|
|
$
|
|
||||||
See accompanying notes.
F-
7
VISHAY INTERTECHNOLOGY, INC.
(In thousands)
|
|
Years ended December 31,
|
|||||||||||
|
2020
|
2019
|
2018
|
||||||||||
|
Operating activities
|
||||||||||||
|
Net earnings
|
$
|
|
$
|
|
$
|
|
||||||
|
Adjustments to reconcile net earnings to net cash provided by operating activities:
|
||||||||||||
|
Depreciation and amortization
|
|
|
|
|||||||||
|
(Gain) loss on disposal of property and equipment
|
|
(
|
)
|
(
|
)
|
|||||||
|
Accretion of interest on convertible debt instruments
|
|
|
|
|||||||||
|
Inventory write-offs for obsolescence
|
|
|
|
|||||||||
|
Pensions and other postretirement benefits, net of contributions
|
|
(
|
)
|
(
|
)
|
|||||||
|
Loss on early extinguishment of debt
|
|
|
|
|||||||||
|
Deferred income taxes
|
(
|
)
|
(
|
)
|
(
|
)
|
||||||
|
Other
|
|
|
|
|||||||||
|
Change in U.S. transition tax liability
|
(
|
)
|
(
|
)
|
(
|
)
|
||||||
|
Change in repatriation tax liability
|
(
|
)
|
(
|
)
|
(
|
)
|
||||||
|
Net change in operating assets and liabilities, net of effects of businesses acquired
|
|
(
|
)
|
(
|
)
|
|||||||
|
Net cash provided by operating activities
|
|
|
|
|||||||||
|
Investing activities
|
||||||||||||
|
Capital expenditures
|
(
|
)
|
(
|
)
|
(
|
)
|
||||||
|
Proceeds from sale of property and equipment
|
|
|
|
|||||||||
|
Purchase of businesses, net of cash acquired
|
(
|
)
|
(
|
)
|
(
|
)
|
||||||
|
Purchase of short-term investments
|
(
|
)
|
(
|
)
|
(
|
)
|
||||||
|
Maturity of short-term investments
|
|
|
|
|||||||||
|
Other investing activities
|
(
|
)
|
|
(
|
)
|
|||||||
|
Net cash provided by (used in) investing activities
|
(
|
)
|
(
|
)
|
|
|||||||
|
Financing activities
|
||||||||||||
|
Proceeds from long-term borrowings
|
|
|
|
|||||||||
|
Issuance costs
|
|
(
|
)
|
(
|
)
|
|||||||
|
Repurchase of convertible debt instruments
|
(
|
)
|
(
|
)
|
(
|
)
|
||||||
|
Net proceeds (payments) on revolving credit lines
|
|
|
(
|
)
|
||||||||
|
Dividends paid to common stockholders
|
(
|
)
|
(
|
)
|
(
|
)
|
||||||
|
Dividends paid to Class B common stockholders
|
(
|
)
|
(
|
)
|
(
|
)
|
||||||
|
Net changes in short-term borrowings
|
(
|
)
|
(
|
)
|
|
|||||||
|
Distributions to noncontrolling interests
|
(
|
)
|
(
|
)
|
(
|
)
|
||||||
|
Cash withholding taxes paid when shares withheld for vested equity awards
|
(
|
)
|
(
|
)
|
(
|
)
|
||||||
|
Net cash used in financing activities
|
(
|
)
|
(
|
)
|
(
|
)
|
||||||
|
Effect of exchange rate changes on cash and cash equivalents
|
|
(
|
)
|
(
|
)
|
|||||||
|
Net increase (decrease) in cash and cash equivalents
|
(
|
)
|
|
(
|
)
|
|||||||
|
Cash and cash equivalents at beginning of year
|
|
|
|
|||||||||
|
Cash and cash equivalents at end of year
|
$
|
|
$
|
|
$
|
|
||||||
See accompanying notes
F-
8
VISHAY INTERTECHNOLOGY, INC.
(In thousands, except share amounts)
|
|
Common
Stock
|
Class B
Convertible
Common
Stock
|
Capital in
Excess of Par
Value
|
Retained
Earnings
(Accumulated
Deficit)
|
Accumulated
Other
Comprehensive
Income (Loss)
|
Total Vishay
Stockholders'
Equity
|
Noncontrolling
Interests
|
Total Equity
|
||||||||||||||||||||||||
|
Balance at December 31, 2017
|
$
|
|
$
|
|
$
|
|
$
|
(
|
)
|
$
|
|
$
|
|
$
|
|
$
|
|
|||||||||||||||
|
Cumulative effect of accounting change for adoption of ASU 2016-01
|
|
|
|
|
(
|
)
|
|
|
|
|||||||||||||||||||||||
|
Net earnings
|
|
|
|
|
|
|
|
|
||||||||||||||||||||||||
|
Other comprehensive income (loss)
|
|
|
|
|
(
|
)
|
(
|
)
|
|
(
|
)
|
|||||||||||||||||||||
|
Distributions to noncontrolling interests
|
|
|
|
|
|
|
(
|
)
|
(
|
)
|
||||||||||||||||||||||
|
Conversion of Class B shares (
|
|
(
|
)
|
|
|
|
|
|
|
|||||||||||||||||||||||
|
Temporary equity reclassifications
|
|
|
|
|
|
|
|
|
||||||||||||||||||||||||
|
Issuance of stock and related tax withholdings for vested restricted stock units (
|
|
|
(
|
)
|
|
|
(
|
)
|
|
(
|
)
|
|||||||||||||||||||||
|
Dividends declared ($
|
|
|
|
(
|
)
|
|
(
|
)
|
|
(
|
)
|
|||||||||||||||||||||
|
Stock compensation expense
|
|
|
|
|
|
|
|
|
||||||||||||||||||||||||
|
Issuance of convertible notes due 2025
|
|
|
|
|
|
|
|
|
||||||||||||||||||||||||
|
Repurchase of convertible debentures
|
|
|
(
|
)
|
|
|
(
|
)
|
|
(
|
)
|
|||||||||||||||||||||
|
Balance at December 31, 2018
|
$
|
|
$
|
|
$
|
|
$
|
(
|
)
|
$
|
(
|
)
|
$
|
|
$
|
|
$
|
|
||||||||||||||
|
Cumulative effect of accounting change for adoption of ASU 2016-02
|
|
|
|
|
|
|
|
|
||||||||||||||||||||||||
|
Net earnings
|
|
|
|
|
|
|
|
|
||||||||||||||||||||||||
|
Other comprehensive income (loss)
|
|
|
|
|
(
|
)
|
(
|
)
|
|
(
|
)
|
|||||||||||||||||||||
|
Conversion of Class B shares (
|
|
|
|
|
|
|
|
|
||||||||||||||||||||||||
|
Distributions to noncontrolling interests
|
|
|
|
|
|
|
(
|
)
|
(
|
)
|
||||||||||||||||||||||
|
Temporary equity reclassification
|
|
|
|
|
|
|
|
|
||||||||||||||||||||||||
|
Issuance of stock and related tax withholdings for vested restricted stock units (
|
|
|
(
|
)
|
|
|
(
|
)
|
|
(
|
)
|
|||||||||||||||||||||
|
Dividends declared ($
|
|
|
|
(
|
)
|
|
(
|
)
|
|
(
|
)
|
|||||||||||||||||||||
|
Stock compensation expense
|
|
|
|
|
|
|
|
|
||||||||||||||||||||||||
|
Repurchase of convertible debentures
|
|
|
(
|
)
|
|
|
(
|
)
|
|
(
|
)
|
|||||||||||||||||||||
|
Balance at December 31, 2019
|
$
|
|
$
|
|
$
|
|
$
|
|
$
|
(
|
)
|
$
|
|
$
|
|
$
|
|
|||||||||||||||
|
Cumulative effect of accounting change for adoption of ASU 2016-13 (see Note 1)
|
|
|
|
(
|
)
|
|
(
|
)
|
|
(
|
)
|
|||||||||||||||||||||
|
Net earnings
|
|
|
|
|
|
|
|
|
||||||||||||||||||||||||
|
Other comprehensive income
|
|
|
|
|
|
|
|
|
||||||||||||||||||||||||
|
Conversion of Class B shares (
|
|
|
|
|
|
|
|
|
||||||||||||||||||||||||
|
Distributions to noncontrolling interests
|
|
|
|
|
|
|
(
|
)
|
(
|
)
|
||||||||||||||||||||||
|
Temporary equity reclassification
|
|
|
|
|
|
|
|
|
||||||||||||||||||||||||
|
Issuance of stock and related tax withholdings for vested restricted stock units (
|
|
|
(
|
)
|
|
|
(
|
)
|
|
(
|
)
|
|||||||||||||||||||||
|
Dividends declared ($
|
|
|
|
(
|
)
|
|
(
|
)
|
|
(
|
)
|
|||||||||||||||||||||
|
Stock compensation expense
|
|
|
|
|
|
|
|
|
||||||||||||||||||||||||
|
Repurchase of convertible debt instruments
|
|
|
(
|
)
|
|
|
(
|
)
|
|
(
|
)
|
|||||||||||||||||||||
|
Balance at December 31, 2020
|
$
|
|
$
|
|
$
|
|
$
|
|
$
|
|
$
|
|
$
|
|
$
|
|
||||||||||||||||
See accompanying notes.
F-
9
NOTES TO CONSOLIDATED FINANCIAL STATEMENTS
(dollars in thousands, except per share amounts)
Vishay Intertechnology, Inc. (“Vishay” or the “Company”)
manufactures one of the world’s largest portfolios of discrete semiconductors and passive electronic components that are essential to innovative designs in the automotive, industrial, computing, consumer, telecommunications, military, aerospace, and medical markets. Semiconductors include MOSFETs, diodes, and optoelectronic components. Passive components include resistors, inductors, and capacitors.
Note 1 – Summary of Significant Accounting Policies
Use of Estimates
The preparation of financial statements in conformity with accounting principles generally accepted in the United States (“GAAP”) requires management to make estimates and assumptions that affect the amounts reported in the consolidated financial statements and accompanying notes. Actual results could differ significantly from those estimates.
Principles of Consolidation
The consolidated financial statements include the accounts of Vishay and all of its subsidiaries in which a controlling financial interest is maintained. For those consolidated subsidiaries in which the Company’s ownership is less than
100
percent, the outside stockholders’ interests are shown as noncontrolling interest in the accompanying consolidated balance sheets. Investments in affiliates over which the Company has significant influence but not a controlling interest are carried on the equity basis. Investments in affiliates over which the Company does not have significant influence are accounted for by the cost method. All intercompany transactions, accounts, and profits are eliminated.
Revenue Recognition
The Company recognizes revenue from contracts with customers when it satisfies the performance obligations within the contract. The Company has framework agreements with many of its customers that contain the terms and conditions of future sales, but do not create enforceable rights or obligations. For revenue recognition purposes, the Company considers the combined purchase orders and the terms and conditions contained within such framework agreements to be contracts.
Payment terms for the Company's sales are generally less than
sixty days
. Substantially all of the Company's receivables historically have been and are expected to continue to be collected within
twelve months
of the transfer of products to the customer and the Company expects this to continue going forward. Accordingly, the Company does not recognize a financing component of the transaction price.
Revenue is measured based on the consideration specified in contracts with customers, and excludes any sales incentives and amounts collected on behalf of third parties. The Company recognizes revenue when it satisfies its performance obligations. The Company analyzes its contracts to determine whether the promise in the contract to construct and transfer goods to the customer is a performance obligation that will be satisfied over time or at a point in time. When the Company's performance does not create an asset with an alternative use to the Company and the Company has an enforceable right to payment for performance completed to date, the Company transfers control of a good or service over time and, therefore, satisfies a performance obligation and recognizes revenue over time. The Company has a limited number of contracts for custom products that meet the criteria to recognize revenue over time.
The Company's contracts contain
two
performance obligations: delivery of products and warranty protection. The Company does not sell separate, enhanced, or extended warranty coverage, but through its customary business practices, the Company has created implied service-type warranties, which are accounted for as separate performance obligations. Revenue is allocated between these two performance obligations and recognized as the obligations are satisfied. The allocation of revenue to warranty protection is based on an estimate of expected cost plus margin. The delivery of products performance obligation is satisfied and product sales revenue is recognized when the customer takes control of the products. Warranty revenue is deferred and the warranty protection performance obligation is satisfied and revenue is recognized over the warranty period, which is typically less than
twenty four months
from sale to end customer. The warranty deferred revenue liability is recorded within Other Accrued Expenses and Other Liabilities on the accompanying consolidated balance sheets. The deferred revenue balance associated with the service-type warranty performance obligations and the components that comprise the change in the deferred revenue balance are not significant.
The Company has a broad line of products that it sells to original equipment manufacturers ("OEMs"), electronic manufacturing services ("EMS") companies, which manufacture for OEMs on an outsourcing basis, and independent distributors that maintain large inventories of electronic components for resale to OEMs and EMS companies.
F-
10
NOTES TO CONSOLIDATED FINANCIAL STATEMENTS
(dollars in thousands, except per share amounts)
Note 1 – Summary of Significant Accounting Policies (continued)
The Company recognizes revenue on sales to distributors when the distributor takes control of the products ("sold-to" model). The Company has agreements with distributors that allow distributors a limited credit for unsaleable products, which it terms a "scrap allowance." Consistent with industry practice, the Company also has a "stock, ship and debit" program whereby it considers requests by distributors for credits on previously purchased products that remain in distributors' inventory, to enable the distributors to offer more competitive pricing. In addition, the Company has contractual arrangements whereby it provides distributors with protection against price reductions initiated by the Company after product is sold by the Company to the distributor and prior to resale by the distributor.
The Company recognizes the estimated variable consideration to be received as revenue and records a related accrued expense for the consideration not expected to be received, based upon its estimate of product returns, scrap allowances, "stock, ship and debit" credits, and price protection credits that will be attributable to sales recorded through the end of the period. The Company makes these estimates based upon sales levels to its distributors during the period, inventory levels at the distributors, current and projected market conditions, and historical experience under the programs. While the Company utilizes a number of different methodologies to estimate the accruals, all of the methodologies take into account sales levels to distributors during the relevant period, inventory levels at the distributors, current and projected market trends and conditions, recent and historical activity under the relevant programs, changes in program policies, and open requests for credits. These procedures require the exercise of significant judgments. The Company believes that it has a reasonable basis to estimate future credits under the programs. See sales returns and allowances accrual activity in Note 9.
The Company pays commissions to external sales representatives on a per-sale basis. Accordingly, these commissions are expensed as incurred because the future amortization period of the asset that the Company otherwise would have recognized is one year or less. Internal staff are not paid commissions.
The Company has elected to account for shipping and handling as activities to fulfill the promise to transfer the product even if the shipping and handling activities are performed after the customer obtains control. The Company does not evaluate whether shipping and handling activities are promised services to its customers. If control transfers and revenue is recognized for the related products before the shipping and handling activities occur, the related costs of those shipping and handling activities is accrued. The Company applies this accounting policy election consistently to similar types of transactions.
See disaggregated revenue information in Note 15
.
Research and Development Expenses
Research and development costs are expensed as incurred. The amount charged to expense for research and development (exclusive of purchased in-process research and development) aggregated $
70,861
, $
69,827
, and $
72,885
, for the years ended December 31, 2020, 2019, and 2018, respectively. The Company spends additional amounts for the development of machinery and equipment for new processes and for cost reduction measures.
Income Taxes
The provision for income taxes is determined using the asset and liability approach of accounting for income taxes. Under this approach, deferred taxes represent the future tax consequences expected to occur when the reported amounts of assets and liabilities are recovered or paid. The provision for income taxes represents income taxes paid or payable for the current year plus the change in deferred taxes during the year. Deferred taxes result from differences between the financial and tax bases of the Company’s assets and liabilities and are adjusted for changes in tax rates and tax laws when changes are enacted. Valuation allowances have been established for deferred tax assets which the Company believes do not meet GAAP criteria of “more likely than not” to be realized. This criterion requires a level of judgment regarding future taxable income, which may be revised due to changes in market conditions, tax laws, or other factors. If the Company’s assumptions and estimates change in the future, valuation allowances established may be increased, resulting in increased tax expense. Conversely, if the Company is ultimately able to utilize all or a portion of the deferred tax assets for which a valuation allowance has been established, then the related portion of the valuation allowance can be released, resulting in decreased tax expense.
The Company and its subsidiaries are subject to income taxes in the U.S. and numerous foreign jurisdictions. Significant judgment is required in evaluating the Company’s tax positions and determining its provision for income taxes. During the ordinary course of business, there are many transactions and calculations for which the ultimate tax determination is uncertain. The Company establishes reserves for tax-related uncertainties based on estimates of whether, and the extent to which, additional taxes will be due. These reserves are established when the Company believes that certain positions might be challenged despite the Company’s belief that its tax return positions are fully supportable. The Company adjusts these reserves in light of changing facts and circumstances and the provision for income taxes includes the impact of reserve provisions and changes to reserves that are considered appropriate.
These accruals for tax-related uncertainties are based on management’s best estimate of potential tax exposures. When particular matters arise, a number of years may elapse before such matters are audited by tax authorities and finally resolved. Favorable resolution of such matters could be recognized as a reduction to the Company’s effective tax rate in the year of resolution. Unfavorable resolution of any particular issue could increase the effective tax rate and may require the use of cash in the year of resolution. The amount included in current liabilities on the accompanying consolidated balance sheets reflect only amounts expected to be settled in cash within one year.
See Note 5.
F-
11
NOTES TO CONSOLIDATED FINANCIAL STATEMENTS
(dollars in thousands, except per share amounts)
Note 1 – Summary of Significant Accounting Policies (continued)
Cash, Cash Equivalents, and Short-Term Investments
Cash and cash equivalents includes demand deposits and highly liquid investments with maturities of
three months
or less when purchased. Highly liquid investments with original maturities greater than three months, but less than one year are classified as short-term investments. At December 31, 2020 and 2019, the Company’s short-term investments were comprised of time deposits with financial institutions whose original maturity exceeds three months, but less than one year.
Allowance for Credit Losses
Effective January 1, 2020, the Company estimates its credit losses on financial instruments using a current expected credit loss model. Prior to January 1, 2020, the Company estimated its credit losses using an incurred loss impairment methodology, which was not materially different than the methodology adopted on January 1, 2020. See "Recent Accounting Guidance Adopted" below. The Company maintains an allowance for doubtful accounts receivable for estimated losses resulting from the inability of its customers to make required payments.
Payment terms for the Company's sales are generally less than ninety days. Substantially all of the Company's trade receivables are collected within twelve months of the transfer of products to the customer and the Company expects this to continue going forward. The credit loss allowance is determined through an analysis of the aging of accounts receivable and assessments of risk that are based on historical trends and an evaluation of the impact of current and projected economic conditions. Receivables from customers with deteriorating financial condition and those over 180 days past due are removed from the pool and evaluated separately. Net credit loss expense (benefit) for accounts receivable was
$
475
, $
(
592
)
, and $
2,570
for the years ended
December 31, 2020
,
2019
, and
2018
, respectively.
The Company’s cash equivalents, short-term investments, and restricted investments are accounted for as held-to-maturity debt instruments, at amortized cost. Interest income on these instruments is recorded as Other income on the consolidated statements of operations and interest receivable is recognized as a separate asset and recorded in Prepaid expenses and other current assets on the consolidated balance sheets. The Company has not experienced a credit loss on the principal or interest receivable of its cash equivalents, short-term investments, or restricted investments. The Company pools its cash equivalents, short-term investments, and restricted investments by credit rating of the issuing financial institution and estimates an allowance for credit losses based on the corporate bond default ratios, evaluation of the impact of current and projected economic conditions, and probability of credit loss. Net credit loss expense for cash equivalents, short-term investments, and restricted investments was immaterial for the year ended December 31, 2020. The Company does not measure an allowance for credit losses on interest receivable. Any uncollectible interest receivable is recognized by reversing interest income within the fiscal quarter that the interest becomes uncollectible.
The Company has an immaterial amount of other short-term held-to-maturity debt instruments recorded within Prepaid expenses and other current assets on the consolidated balance sheets. The Company analyzes these assets on a separate asset basis and estimates an allowance for credit losses based on historical credit loss rates and an evaluation of the impact of current and projected economic conditions. Net credit loss expense for these other short-term held-to-maturity debt instruments was immaterial for the year ended December 31, 2020.
Inventories
Inventories are stated at the lower of cost, determined by the first-in, first-out method, or net realizable value. Inventories are adjusted for estimated obsolescence and written down to net realizable value based upon estimates of future demand, technology developments, and market conditions.
Property and Equipment
Property and equipment is carried at cost and is depreciated principally by the straight-line method based upon the estimated useful lives of the assets. Machinery and equipment are being depreciated over useful lives of
seven years
to
ten years
. Buildings and building improvements are being depreciated over useful lives of
twenty years
to
forty years
. Construction in progress is not depreciated until the assets are placed in service. The estimated cost to complete construction in progress at December 31, 2020 was approximately $
51,600
. Depreciation expense was $
158,117
, $
155,985
, and $
150,056
for the years ended December 31, 2020, 2019, and 2018, respectively. Gains and losses on the disposal of assets which do not qualify for presentation as discontinued operations are included in the determination of operating margin (within selling, general, and administrative expenses). Individually material gains and losses on disposal are separately disclosed in the notes to the consolidated financial statements.
Goodwill and Other Intangible Assets
Goodwill represents the excess of the cost of a business acquired over the fair value of the related net assets at the date of acquisition. Certain intangible assets may be assigned indefinite useful lives. Goodwill and indefinite-lived intangible assets are not amortized but rather are tested for impairment at least annually. These tests are performed more frequently whenever events or changes in circumstances indicate that the assets might be impaired. The Company's business segments (see Note 15) represent its reporting units for goodwill impairment testing purposes. At December 31, 2020 and 2019, respectively, the Company has
no
recorded indefinite-lived intangible assets.
Definite-lived intangible assets are amortized over their estimated useful lives. Patents and acquired technology are being amortized over useful lives of
seven years
to
twenty-five years
. Capitalized software is amortized over periods of
three years
to
ten years
, primarily included in costs of products sold on the consolidated statements of operations. Customer relationships are amortized over useful lives of
five years
to
twenty years
. Noncompete agreements are amortized over periods of
three years
to
ten years
. The Company continually evaluates the reasonableness of the useful lives of these assets.
F-
12
NOTES TO CONSOLIDATED FINANCIAL STATEMENTS
(dollars in thousands, except per share amounts)
Note 1 – Summary of Significant Accounting Policies (continued)
GAAP prescribes a quantitative method for determining goodwill impairment. The Company has the option of performing a qualitative assessment before performing the quantitative impairment test. If it is determined, on the basis of qualitative factors, that the fair value of the reporting unit is not more likely than not less than the carrying amount, the quantitative impairment test is not required. If it is determined that the fair value of the reporting unit is more likely than not less than the carrying amount, the quantitative impairment test is required.
The Company determines the fair value of the reporting unit and compares that fair value to the net book value of the reporting unit. The fair value of the reporting unit is determined using various valuation techniques, including a comparable companies market multiple approach and a discounted cash flow analysis (an income approach). If the net book value of the reporting unit were to exceed the fair value, the Company would recognize an impairment charge.
Impairment of Long-Lived Assets
The carrying value of long-lived assets held-and-used, other than goodwill and indefinite-lived intangible assets, is evaluated when events or changes in circumstances indicate the carrying value may not be recoverable or the useful life has changed. The carrying value of a long-lived asset group is considered impaired when the total projected undiscounted cash flows from such asset group are separately identifiable and are less than the carrying value. In that event, a loss is recognized based on the amount by which the carrying value exceeds the fair market value of the long-lived asset group. Fair market value is determined primarily using present value techniques based on projected cash flows from the asset group. Losses on long-lived assets held-for-sale, other than goodwill and indefinite-lived intangible assets, are determined in a similar manner, except that fair market values are reduced for anticipated disposal costs.
Available-for-Sale Securities
Short-term investments and other assets reported on the accompanying consolidated balance sheets include time deposits with financial institutions whose original maturity exceeds three months, but less than one year that are classified as held-to-maturity instruments, and investments in marketable securities that are classified as available-for-sale instruments. The available-for-sale instruments include assets that are held in trust related to the Company’s non-qualified pension and deferred compensation plans (see Note 11) and assets that are intended to fund a portion of the Company’s other postretirement benefit obligations outside of the U.S. These assets are reported at fair value, based on quoted market prices as of the end of the reporting period. Unrealized gains and losses are reported, net of their related tax consequences, as Other Income (Expense) on the consolidated statements of operations. At the time of sale, the assets that are held in trust related to the Company’s non-qualified pension and deferred compensation plans, any gains (losses) calculated by the specific identification method are recognized as a reduction (increase) to benefits expense, within selling, general, and administrative expenses.
Financial Instruments
The Company uses financial instruments in the normal course of its business, including from time to time, derivative financial instruments. Additionally, from time to time, the Company enters into contracts that are not considered derivative financial instruments in their entirety, but that include embedded derivative features.
Other financial instruments include cash and cash equivalents, held-to-maturity short-term investments, accounts receivable, and notes payable. The carrying amounts of these financial instruments reported on the accompanying consolidated balance sheets approximate their fair values due to the short-term nature of these assets and liabilities.
Stock-Based Compensation
Compensation costs related to stock-based payment transactions are recognized in the consolidated financial statements. The amount of compensation cost is measured based on the grant-date fair value of the equity (or liability) instruments issued. Compensation cost is recognized over the period that an officer, employee, or non-employee director is required to provide service in exchange for the award. For awards subject to graded vesting, the Company recognizes expense over the service period for each separately vesting portion of the award as if the award was, in-substance, multiple awards. The Company recognizes compensation cost for restricted stock units (“RSUs”) that are expected to vest and records cumulative adjustments in the period that the expectation changes.
Foreign Currency Translation
The Company has significant operations outside of the United States. The Company finances its operations in Europe and certain locations in Asia in local currencies, and accordingly, these subsidiaries utilize the local currency as their functional currency. The Company’s operations in Israel and most significant locations in Asia are largely financed in U.S. dollars, and accordingly, these subsidiaries utilize the U.S. dollar as their functional currency.
For those subsidiaries where the local currency is the functional currency, assets and liabilities on the accompanying consolidated balance sheets have been translated at the rate of exchange as of the balance sheet date. Translation adjustments do not impact the consolidated results of operations and are reported as a separate component of stockholders’ equity. Revenues and expenses are translated at the average exchange rate for the year. While the translation of revenues and expenses into U.S. dollars does not directly impact the statement of operations, the translation effectively increases or decreases the U.S. dollar equivalent of revenues generated and expenses incurred in those foreign currencies.
F-
13
NOTES TO CONSOLIDATED FINANCIAL STATEMENTS
(dollars in thousands, except per share amounts)
Note 1 – Summary of Significant Accounting Policies (continued)
For those foreign subsidiaries where the U.S. dollar is the functional currency, all foreign currency financial statement amounts are remeasured into U.S. dollars. Exchange gains and losses arising from remeasurement of foreign currency-denominated monetary assets and liabilities are included in the consolidated results of operations.
Commitments and Contingencies
Liabilities for loss contingencies, including environmental remediation costs, arising from claims, assessments, litigation, fines, penalties, and other sources are recorded when it is probable that a liability has been incurred and the amount of the assessment and/or remediation can be reasonably estimated. The costs for a specific environmental remediation site are discounted if the aggregate amount of the obligation and the amount and timing of the cash payments for that site are fixed or reliably determinable based upon information derived from the remediation plan for that site. Accrued liabilities for environmental matters recorded at December 31, 2020 and 2019 do not include claims against third parties.
Restructuring and Severance Costs
Restructuring and severance costs reflect charges resulting from cost reduction programs implemented by the Company. Restructuring and severance costs include exit costs, severance benefits pursuant to an on-going arrangement, voluntary termination compensation under a defined program, and any related pension curtailment and settlement charges.
The Company recognizes expense for one-time benefits only after management has committed to a plan, the plan is sufficiently detailed to provide the number, classification, and location of employees to be terminated as well as the expected completion date, the plan has been sufficiently communicated to employees such that they are able to determine the type and amount of benefits they will receive if terminated, and it is unlikely that the plan will be significantly changed or withdrawn. If an employee is not required to render service beyond a minimum retention period, the Company recognizes expense once the aforementioned criteria have been met. If an employee is required to render service beyond a minimum retention period, the Company recognizes expense over the period that the employee is required to render future service.
The Company recognizes expense for on-going benefit arrangements when the liability is reasonably estimable and considered probable.
The Company recognizes expense for voluntary separation / early retirement when the employee delivers an irrevocable voluntary termination notice pursuant to a defined Company program.
The Company recognizes other exit costs as incurred.
Self-Insurance Programs
The Company uses a combination of insurance and self-insurance mechanisms to provide for the potential liabilities for workers’ compensation, general liability, property damage, director and officers’ liability, and vehicle liability.
As part of its self-insurance program for certain risks, the Company created a wholly-owned captive insurance entity in 2007. At December 31, 2020, the captive insurance entity provides only property and general liability insurance, although it is licensed to also provide casualty and directors’ and officers’ insurance. The captive insurance entity had
no
amounts accrued for outstanding claims at December 31, 2020 and 2019.
Certain investments held by the captive insurance entity are restricted primarily for the purpose of potential insurance claims. Such amounts are recorded in other noncurrent assets, and total $
9,281
and $
10,259
at December 31, 2020 and 2019, respectively, representing required statutory reserves of the captive insurance entity.
Convertible Debt Instruments
The Company separately accounts for the liability and equity components of convertible debt instruments that may be settled in cash in a manner that reflects the Company’s nonconvertible debt borrowing rate. The liability component at issuance is recognized at fair value, based on the fair value of a similar instrument that does not have a conversion feature. A discount is recorded if debt instruments are issued at a coupon rate which is below the rate of a similar instrument that did not have a conversion feature at issuance. The equity component is based on the excess of the principal amount of the debt instruments over the fair value of the liability component, after adjusting for an allocation of debt issuance costs and the deferred tax impact, and is recorded as capital in excess of par. Debt discounts are amortized as additional non-cash interest expense over the expected life of the debt. The adoption of
Accounting Standards Update ("ASU") No. 2020-06,
Debt – Debt With Conversion and Other Options (Subtopic 470-20) and Derivatives and Hedging – Contracts in Entity’s Own Equity (Subtopic 815-40): Accounting for Convertible Instruments and Contracts in an Entity’s Own Equity,
on
January 1, 2021 significantly impacts the accounting for the Company's convertible debt instruments. See additional information in "Recent Accounting Guidance Not Yet Adopted" below.
F-
14
NOTES TO CONSOLIDATED FINANCIAL STATEMENTS
(dollars in thousands, except per share amounts)
Note 1 – Summary of Significant Accounting Policies (continued)
Leases
The Company leases buildings and machinery and equipment used for manufacturing and/or sales and administrative purposes. The Company is also party to various service, warehousing, and other agreements that it evaluates for potential embedded leases. Substantially all of the Company’s leases are structured and classified as operating leases.
The Company leases assets in each region in which it operates. The Company’s leases are generally denominated in the currency of the leased assets' location, which may not be the functional currency of the subsidiary lessee. Accordingly, the Company remeasures its lease liability and recognizes a transactional gain/loss for leases denominated in currencies other than the functional currency of the subsidiary lessee.
The Company recognizes right of use assets and lease liabilities for leases greater than twelve months in duration based on the contract consideration for lease components through the term of the lease and the applicable discount rate. Leases with a duration less than or equal to twelve months are considered short-term leases. The Company does not recognize right of use assets or lease liabilities for short-term leases and classifies the expense as short-term lease expense. Variable lease payments based on an index or rate are included in the right of use assets and lease liabilities based on the effective rates at lease commencement. Changes in the rates or indices do not impact the right of use asset or lease liability and are recognized as a component of lease expense in the consolidated statements of operations. Variable lease payments not based on an index or rate are not included in the initial right of use asset and lease liability and are recognized when incurred as a component of lease expense in the consolidated statements of operations.
The Company has elected to not separate contract consideration for lease and non-lease components for its building leases. In addition to the noncancellable period of a lease, the Company includes periods covered by extension options it is reasonably certain to exercise, termination options that it is reasonably certain not to exercise, and extension and termination options controlled by the lessor in its determination of the lease term. The Company uses the rate implicit in the contract whenever possible when determining the applicable discount rate. When the implicit rate is not used, the Company employs a portfolio approach based on the duration of the lease. The portfolio lease rates are calculated monthly.
No individual lease is considered significant and there are no leases that have not yet commenced that are considered significant.
See Note 3.
Recent Accounting Pronouncements
Recent Accounting Guidance Not Yet Adopted
In August 2020, the
Financial Accounting Standards Board ("FASB")
issued ASU No. 2020-06. The ASU simplifies the accounting for certain financial instruments with characteristics of liability and equity, including convertible debt instruments. The ASU reduces the number of accounting models available for convertible debt instruments, requires the use of the if-converted method for the calculation of diluted earnings per share for convertible debt instruments, and increases disclosure requirements. The ASU is effective for the Company for interim and annual periods beginning on or after January 1, 2022, with the ability to early adopt for interim and annual periods beginning on or after January 1, 2021. The Company will adopt the ASU effective January 1, 2021. Based on work performed to date, the Company
expects to record a $
66,078
decrease in additional paid in capital from the derecognition of the bifurcated equity component of the convertible debt instruments, $
59,246
increase in debt from the derecognition of the discount associated with the bifurcated equity component of the convertible debt instruments and $
21,159
increase to the opening balance of retained earnings, representing the cumulative interest expense, net of tax effects, recognized related to the amortization of the bifurcated conversion option. The Company also expects to write-off the deferred tax liabilities related to the convertible debt instruments. Adoption of the ASU will not have a significant impact on the diluted sharecount due to Vishay exercising existing rights to legally amend the indenture governing the convertible senior notes due 2025. See Note 6.
Recent Accounting Guidance Adopted
In June 2016, the FASB issued ASU No. 2016-13,
Financial Instruments - Credit Losses (Topic 326): Measurement of Credit Losses on Financial Instruments
. The ASU replaced the incurred loss impairment methodology in current GAAP with a methodology that reflects expected credit losses and requires consideration of a broader range of reasonable and supportable information to inform credit loss estimates. The Company adopted the ASU effective January 1, 2020.
The ASU is applicable to the Company's trade accounts receivable, cash equivalents, short-term investments, restricted investments, and other short-term held-to-maturity debt instruments recorded within Prepaid expenses and other current assets on the consolidated balance sheets. The adoption of ASU 2016-13 on January 1, 2020 had no material impact on the Company’s allowance for accounts trade receivable credit losses. The Company recorded cumulative-effect adjustments to January 1, 2020 retained earnings of $
810
and $
260
to recognize an allowance for credit losses for cash equivalents, short-term investments, and restricted investments and other short-term held-to-maturity debt instruments, respectively, upon the adoption of ASU 2016-13.
Reclassifications
Certain prior year amounts have been reclassified. Such reclassifications had no effect on reported net earnings attributable to Vishay stockholders, total assets, stockholders' equity, or the statements of cash flows.
F-
15
NOTES TO CONSOLIDATED FINANCIAL STATEMENTS
(dollars in thousands, except per share amounts)
Note
2 - Acquisition and Divestiture Activities
As part of its growth strategy, the Company seeks to expand through targeted acquisitions of other manufacturers of electronic components that have established positions in major markets, reputations for product quality and reliability, and product lines with which the Company has substantial marketing and technical expertise.
Year ended December 31, 2020
On
October 1, 2020
, the Company acquired the worldwide business and substantially all of the U.S. assets of
Applied Thin-Film Products
, a California-based, privately-held manufacturer of custom, build-to-print thin film substrates for the microwave, fiber optic, and life science industries. Concurrently, a Chinese subsidiary of Applied Thin-Film Products entered into an agreement to sell certain inventory and equipment to a subsidiary of Vishay for approximately $
350
at a later date. The total acquisition price was $
25,852
, subject to customary post-closing adjustments. Based on its estimate of their fair values pending finalization of the net working capital adjustment, the Company allocated $
10,800
of the purchase price to definite-lived intangible assets. After allocating the purchase price to the assets acquired and liabilities assumed based on a preliminary estimation of their fair values at the date of acquisition, the Company recorded goodwill of $
6,548
related to this acquisition. The results and operations of this acquisition have been included in the Resistors segment since October 1, 2020. The inclusion of this acquisition did not have a material impact on the Company's consolidated results for the year ended December 31, 2020. The goodwill related to this acquisition is included in the Resistors reporting unit for goodwill impairment testing.
Year ended December 31, 2019
On
January 3, 2019
, the Company acquired substantially all of the assets of
Bi-Metallix, Inc.
("Bi-Metallix"), a U.S.-based, privately-held provider of electron beam continuous strip welding services for $
11,862
. The Company was a major customer of Bi-Metallix, and the acquired business has been vertically integrated into the Company's Resistors segment. Based on an estimate of their fair values, the Company allocated $
2,900
of the purchase price to definite-lived intangible assets. After allocating the purchase price to the assets acquired and liabilities assumed based on an estimation of their fair values at the date of acquisition, the Company recorded goodwill of $
3,324
related to this acquisition. The results and operations of this acquisition have been included in the Resistors segment since January 3, 2019. The goodwill related to this acquisition is included in the Resistors reporting unit for goodwill impairment testing.
Year ended December 31, 2018
On
February 8, 2018
, the Company acquired substantially all of the assets and liabilities of
UltraSource, Inc.
("UltraSource"), a U.S.-based, privately-held thin film circuit and thin film interconnect manufacturer, for $
13,596
. Based on an estimate of their fair values, the Company allocated $
6,500
of the purchase price to definite-lived intangible assets. After allocating the purchase price to the assets acquired and liabilities assumed based on an estimation of their fair values at the date of acquisition, the Company recorded goodwill of $
4,227
related to this acquisition. The results and operations of this acquisition have been included in the Resistors segment since February 8, 2018. The goodwill related to this acquisition is included in the Resistors reporting unit for goodwill impairment testing.
On
June 11, 2018
, the Company acquired
EuroPower Holdings Ltd.
("EuroPower") for $
2,939
, net of cash acquired. EuroPower is a distributor of electronic components in the United Kingdom. After allocating the purchase price to the assets acquired and liabilities assumed based on an estimation of their fair values at the date of acquisition, the Company recorded goodwill of $
1,068
related to this acquisition. The goodwill related to this acquisition is included in the Resistors reporting unit for goodwill impairment testing.
Had these acquisitions occurred as of the beginning of the periods presented in these consolidated financial statements, the pro forma statements of operations would not be materially different than the consolidated statements of operations presented.
F-
16
NOTES TO CONSOLIDATED FINANCIAL STATEMENTS
(dollars in thousands, except per share amounts)
Note 3 – Leases
The net right of use assets and lease liabilities recognized on the consolidated balance sheets for the Company's operating leases as of December 31, 2020 and 2019 are presented below:
|
|
December 31,
2020
|
December 31,
2019
|
||||||
|
Right of use assets
|
||||||||
|
Operating Leases
|
||||||||
|
Buildings and improvements
|
$
|
|
$
|
|
||||
|
Machinery and equipment
|
|
|
||||||
|
Total
|
$
|
|
$
|
|
||||
|
Current lease liabilities
|
||||||||
|
Operating Leases
|
||||||||
|
Buildings and improvements
|
$
|
|
$
|
|
||||
|
Machinery and equipment
|
|
|
||||||
|
Total
|
$
|
|
$
|
|
||||
|
Long-term lease liabilities
|
||||||||
|
Operating Leases
|
||||||||
|
Buildings and improvements
|
$
|
|
$
|
|
||||
|
Machinery and equipment
|
|
|
||||||
|
Total
|
$
|
|
$
|
|
||||
|
Total lease liabilities
|
$
|
|
$
|
|
||||
Lease expense is classified in the statements of operations based on asset use. Total lease cost recognized on the consolidated statements of operations is as follows:
|
|
Years ended December 31,
|
|||||||
|
|
2020
|
2019
|
||||||
|
Lease expense
|
||||||||
|
Operating lease expense
|
$
|
|
$
|
|
||||
|
Short-term lease expense
|
|
|
||||||
|
Variable lease expense
|
|
|
||||||
|
Total lease expense
|
$
|
|
$
|
|
||||
The Company paid $
23,814
and $
21,552
for its operating leases during the years ended December 31, 2020 and 2019, respectively, which are included in operating cash flows on the consolidated statements of cash flows. The weighted-average remaining lease term for the Company's operating leases is
8.9
years and the weighted-average discount rate is
5.9
% as of December 31, 2020.
The undiscounted future lease payments for the Company's operating lease liabilities are as follows:
|
December 31,
2020
|
||||
|
2021
|
$
|
|
||
|
2022
|
|
|||
|
2023
|
|
|||
|
2024
|
|
|||
|
2025
|
|
|||
|
Thereafter
|
|
|||
The undiscounted future lease payments presented in the table above include payments through the term of the lease, which may include periods beyond the noncancellable term. The difference between the total payments above and the lease liability balance is due to the discount rate used to calculate lease liabilities.
F-
17
NOTES TO CONSOLIDATED FINANCIAL STATEMENTS
(dollars in thousands, except per share amounts)
Note 4 – Restructuring and Related Activities
The Company places a strong emphasis on controlling its costs and combats general price inflation by continuously improving its efficiency and operating performance. When the ongoing cost containment activities are not adequate, the Company takes actions to maintain its cost competitiveness.
The Company incurred significant restructuring costs in its past to reduce its cost structure. Historically, the Company's primary cost reduction technique was through the transfer of production from high-labor-cost countries to lower-labor-cost countries. Since 2013, the Company's cost reduction programs have primarily focused on reducing fixed costs, including selling, general, and administrative expenses.
In 2019, the Company announced global cost reduction and management rejuvenation programs as part of its continuous efforts to improve efficiency and operating performance. The programs were primarily designed to reduce manufacturing fixed costs and selling, general, and administrative costs company-wide, and provide management rejuvenation. These programs are now fully implemented. The Company incurred charges of $
24,882
, primarily related to cash severance costs, to implement these programs.
The following table summarizes the activity to date related to this program:
|
Expense recorded in 2019
|
$
|
|
||
|
Cash paid
|
(
|
)
|
||
|
Foreign currency translation
|
|
|||
|
Balance at December 31, 2019
|
$
|
|
||
|
Expense recorded in 2020
|
|
|||
|
Cash paid
|
(
|
)
|
||
|
Foreign currency translation
|
|
|||
|
Balance at December 31, 2020
|
$
|
|
Severance benefits are generally paid in a lump sum at cessation of employment. The current portion of the liability is $
11,595
and is included in other accrued expenses in the accompanying consolidated balance sheet. The non-current portion of the liability is $
1,862
and is included in other liabilities in the accompanying consolidated balance sheet.
F-
18
NOTES TO CONSOLIDATED FINANCIAL STATEMENTS
(dollars in thousands, except per share amounts)
Note 5 – Income Taxes
U.S. Tax Reform: Tax Cuts and Jobs Act
On December 22, 2017, the Tax Cuts and Jobs Act (the "TCJA") was enacted in the United States. The TCJA represented sweeping changes in U.S. tax law. Among the numerous changes in tax law, the TCJA permanently reduced the U.S. corporate income tax rate to
21
% beginning in 2018; imposed a one-time transition tax on deferred foreign earnings; established a partial territorial tax system by allowing a
100
% dividends received deduction on qualifying dividends paid by foreign subsidiaries; limited deductions for net interest expense; expanded the U.S. taxation of foreign earned income to include "global intangible low-taxed income" ("GILTI") of foreign subsidiaries; and imposed a base erosion anti-abuse minimum tax ("BEAT").
As permitted by SAB No. 118, the tax expense recorded in the fourth fiscal quarter of 2017 due to the enactment of the TCJA was considered "provisional," based on reasonable estimates. After additional analysis was completed in 2018, the Company identified additional amounts available to be repatriated to the U.S. and additional information regarding the foreign taxes payable and recorded additional provisional tax expense to accrue the incremental foreign income taxes and withholding taxes payable to foreign jurisdiction. The Company collected and analyzed detailed information about the earnings and profits of its non-U.S. subsidiaries, the related taxes paid, the amounts which could be repatriated, the foreign taxes which may be incurred on repatriation, and the associated impact of these items under the TCJA, including under regulatory guidance issued in 2018, throughout the measurement period that ended as of December 31, 2018. The Company recognized $
25,496
of additional tax expense directly and indirectly related to the enactment of the TCJA in 2018.
The TCJA transitioned the U.S. from a worldwide tax system to a territorial tax system. Under previous law, companies could indefinitely defer U.S. income taxation on unremitted foreign earnings. The TCJA imposed a one-time transition tax on deferred foreign earnings of
15.5
% for liquid assets and
8.0
% for illiquid assets, payable in defined increments over eight years. As a result of this requirement, the Company expects to pay $
184,467
. The first installments of $
14,757
were paid in 2020, 2019, and 2018.
The Company repatriated $
104,091
, $
188,742
, and $
724,000
to the United States, and paid withholding and foreign taxes of $
16,258
, $
38,814
, and $
156,767
in 2020, 2019, and 2018, respectively. Tax expense for these repatriation transactions was substantially recorded in 2017 upon enactment of the TCJA.
Substantially all of the amounts repatriated were used to repay certain third party and intercompany indebtedness, to pay the U.S. transition tax, to fund capital expansion projects,
and to fund the repurchase of convertible debt instruments (see Note 6).
There are additional amounts of unremitted foreign earnings in other countries, which continue to be reinvested indefinitely, and the Company has made no provision for incremental foreign income taxes and withholding taxes payable to foreign jurisdictions related to these amounts. Determination of the amount of the unrecognized deferred foreign tax liability for these amounts is not practicable because of the complexities associated with its hypothetical calculation.
Certain provisions of the TCJA had a significant impact on the Company's effective tax rate and are expected to have a significant impact in future periods. Because the various provisions of the TCJA are interrelated, and because of changes in the Company’s operations and changes in the capital structure in response to the TCJA, the impact of any specific provision of the TCJA cannot be isolated. The Company recognized a significant amount of GILTI income in 2020, 2019, and 2018, but was able to utilize related foreign tax credits to reduce the impact on the effective tax rate. The Company has elected to account for GILTI tax in the period in which it is incurred and, therefore, does not provide any deferred taxes in the consolidated financial statements at December 31, 2020, 2019, or 2018. The inclusion of significant GILTI income was a contributing factor in allowing the Company to avoid a limitation on the deductibility of its U.S. interest expense in 2020, 2019, and 2018. The Company was subject to the BEAT minimum tax of $
750
, $
2,900
, and $
0
in 2020, 2019, and 2018, respectively. BEAT could increase the Company’s future tax by disallowing certain otherwise deductible payments from the U.S. to non-U.S. subsidiaries and imposing a minimum tax if greater than the regular tax.
The Company's repurchase of outstanding convertible debentures (see Note 6) reduced the Company's tax rate.
F-
19
NOTES TO CONSOLIDATED FINANCIAL STATEMENTS
(dollars in thousands, except per share amounts)
Note 5 – Income Taxes (continued)
Income (loss) from continuing operations before taxes and noncontrolling interests consists of the following components:
|
Years ended December 31,
|
||||||||||||
|
|
2020
|
2019
|
2018
|
|||||||||
|
|
||||||||||||
|
Domestic
|
$
|
(
|
)
|
$
|
(
|
)
|
$
|
(
|
)
|
|||
|
Foreign
|
|
|
|
|||||||||
|
|
$
|
|
$
|
|
$
|
|
||||||
Significant components of income taxes are as follows:
|
Years ended December 31,
|
||||||||||||
|
|
2020
|
2019
|
2018
|
|||||||||
|
|
||||||||||||
|
Current:
|
||||||||||||
|
Federal
|
$
|
|
$
|
|
$
|
|
||||||
|
State and local
|
|
|
|
|||||||||
|
Foreign
|
|
|
|
|||||||||
|
|
|
|
||||||||||
|
Deferred:
|
||||||||||||
|
Federal
|
(
|
)
|
(
|
)
|
(
|
)
|
||||||
|
State and local
|
(
|
)
|
(
|
)
|
(
|
)
|
||||||
|
Foreign
|
(
|
)
|
(
|
)
|
(
|
)
|
||||||
|
(
|
)
|
(
|
)
|
(
|
)
|
|||||||
|
Total income tax expense
|
$
|
|
$
|
|
$
|
|
||||||
F-
20
NOTES TO CONSOLIDATED FINANCIAL STATEMENTS
(dollars in thousands, except per share amounts)
Note 5 – Income Taxes (continued)
Deferred income taxes reflect the net tax effects of temporary differences between the carrying amounts of assets and liabilities for financial reporting purposes and the amounts for income tax purposes. Significant components of the Company’s deferred tax assets and liabilities are as follows:
|
December 31,
|
||||||||
|
|
2020
|
2019
|
||||||
|
Deferred tax assets:
|
||||||||
|
Pension and other retiree obligations
|
$
|
|
$
|
|
||||
|
Inventories
|
|
|
||||||
|
Net operating loss carryforwards
|
|
|
||||||
|
Tax credit carryforwards
|
|
|
||||||
|
Other accruals and reserves
|
|
|
||||||
|
Total gross deferred tax assets
|
|
|
||||||
|
Less valuation allowance
|
(
|
)
|
(
|
)
|
||||
|
|
|
|||||||
|
Deferred tax liabilities:
|
||||||||
|
Property and equipment
|
(
|
)
|
(
|
)
|
||||
|
Earnings not permanently reinvested
|
|
(
|
)
|
|||||
|
Convertible debentures
|
(
|
)
|
(
|
)
|
||||
|
Other - net
|
(
|
)
|
(
|
)
|
||||
|
Total gross deferred tax liabilities
|
(
|
)
|
(
|
)
|
||||
|
Net deferred tax assets (liabilities)
|
$
|
|
$
|
|
||||
The Company makes significant judgments regarding the realizability of its deferred tax assets (principally net operating losses and tax credits). The carrying value of deferred tax assets is based on the Company’s assessment that it is more likely than not that the Company will realize these assets after consideration of all available positive and negative evidence. As of December 31, 2020, the Company has generated an excess U.S. foreign tax credit of $
68,874
. Because the Company does not anticipate sufficient U.S. foreign source income during the carryforward period, the Company has not recognized the benefit of the carryforward as of December 31, 2020.
A reconciliation of income tax expense at the U.S. federal statutory income tax rate to actual income tax provision is as follows:
|
Years ended December 31,
|
||||||||||||
|
|
2020
|
2019
|
2018
|
|||||||||
|
Tax at statutory rate
|
$
|
|
$
|
|
$
|
|
||||||
|
State income taxes, net of U.S. federal tax benefit
|
(
|
)
|
(
|
)
|
(
|
)
|
||||||
|
Effect of foreign operations
|
(
|
)
|
|
|
||||||||
|
Tax on earnings not permanently reinvested
|
|
|
|
|||||||||
|
Unrecognized tax benefits
|
|
|
|
|||||||||
|
Repurchase of senior convertible debentures
|
(
|
)
|
(
|
)
|
(
|
)
|
||||||
|
TCJA - remeasurement of net deferred tax liabilities
|
|
|
(
|
)
|
||||||||
|
TCJA - transition tax on unremitted foreign earnings
|
|
|
|
|||||||||
|
Foreign income taxable in the U.S.
|
|
|
|
|||||||||
|
Deferred tax rate impact of corporate reorganization
|
|
(
|
)
|
|
||||||||
|
Other
|
|
|
(
|
)
|
||||||||
|
Total income tax expense
|
$
|
|
$
|
|
$
|
|
||||||
F-
21
NOTES TO CONSOLIDATED FINANCIAL STATEMENTS
(dollars in thousands, except per share amounts)
Note 5 – Income Taxes (continued)
Income tax expense for the years ended December 31, 2020, 2019, and 2018 includes certain discrete tax items for changes in uncertain tax positions, valuation allowances, tax rates, and other related items. These items total $
1,998
, $
799
(tax benefit), and $
39,428
(tax benefit) in 2020, 2019, and 2018, respectively.
For the year ended December 31, 2020, the discrete items include a tax benefit of $
1,563
resulting from the early extinguishment of convertible senior debentures, reflecting the reduction in deferred tax liabilities related to the special tax attributes of the debentures and $
190
(tax benefit) of adjustments to remeasure of deferred taxes related to the cash repatriation program described above, and $
3,751
of tax expense for changes in uncertain tax positions.
For the year ended December 31, 2019, the discrete items include
$
7,554
related to a tax-basis foreign exchange gain on the settlement of an intercompany loan, which previously had been accounted for at the historical foreign exchange rate (akin to an equity contribution) because the debtor entity did not have the intent or ability to repay such intercompany loan. Currency translation adjustments were recorded in accumulated other comprehensive income, and were not included in U.S. GAAP pre-tax income. The Company’s cash repatriation activity resulted in the ability to repay such intercompany loan. Upon settlement of this intercompany loan, the foreign entity realized a taxable gain. Discrete tax items also include
a tax benefit of $
1,601
resulting from the early extinguishment of convertible senior debentures, reflecting the reduction in deferred tax liabilities related to the special tax attributes of the debentures, $
9,583
(tax benefit) of adjustments to remeasure of deferred taxes related to the cash repatriation program described above, and $
2,831
of tax expense for changes in uncertain tax positions.
For the year ended December 31, 2018, the discrete items include $
25,496
related to the enactment of the TCJA, as previously described, a tax benefit of $
54,877
resulting from the early extinguishment of convertible senior debentures, reflecting the reduction in deferred tax liabilities related to the special tax attributes of the debentures, and $
10,047
(tax benefit) of adjustments to remeasure the deferred taxes related to the cash repatriation program described above.
At December 31, 2020, the Company had the following significant net operating loss carryforwards for tax purposes:
|
Expires
|
||||||||
|
Austria
|
$
|
|
No expiration
|
|||||
|
Belgium
|
|
No expiration
|
||||||
|
Israel
|
|
No expiration
|
||||||
|
Italy
|
|
No expiration
|
||||||
|
Japan
|
|
-
|
||||||
|
Netherlands
|
|
-
|
||||||
|
The Republic of China (Taiwan)
|
|
-
|
||||||
|
California
|
|
-
|
||||||
|
Pennsylvania
|
|
-
|
||||||
At December 31, 2020, the Company had the following significant tax credit carryforwards available:
|
Expires
|
||||||||
|
U.S. Foreign Tax Credit
|
$
|
|
-
|
|||||
|
California Research Credit
|
|
No expiration
|
||||||
F-
22
NOTES TO CONSOLIDATED FINANCIAL STATEMENTS
(dollars in thousands, except per share amounts)
Note 5 – Income Taxes (continued)
Net income taxes paid were $
69,706
, $
185,654
, and $
248,958
for the years ended December 31, 2020, 2019, and 2018, respectively. Net income taxes paid for the years ended December 31, 2020, 2019, and 2018 include $
16,258
, $
38,814
and $
156,767
, respectively, for repatriation activity and $
14,757
in each period for the TCJA transition tax.
See Note 19 for a discussion of the tax-related uncertainties for the pre-spin-off period of Vishay Precision Group, Inc. (“VPG”), which was spun off on July 6, 2010.
The following table summarizes changes in the liabilities associated with unrecognized tax benefits:
|
Years ended December 31,
|
||||||||||||
|
|
2020
|
2019
|
2018
|
|||||||||
|
|
||||||||||||
|
Balance at beginning of year
|
$
|
|
$
|
|
$
|
|
||||||
|
Addition based on tax positions related to the current year
|
|
|
|
|||||||||
|
Addition based on tax positions related to prior years
|
|
|
|
|||||||||
|
Currency translation adjustments
|
|
|
(
|
)
|
||||||||
|
Reduction based on tax positions related to prior years
|
(
|
)
|
|
|
||||||||
|
Reduction for settlements
|
(
|
)
|
(
|
)
|
(
|
)
|
||||||
|
Reduction for lapses of statute of limitation
|
|
(
|
)
|
|
||||||||
|
Balance at end of year
|
$
|
|
$
|
|
$
|
|
||||||
All of the unrecognized tax benefits of $
40,652
and $
36,868
, as of December 31, 2020 and 2019, respectively, would reduce the effective tax rate if recognized.
The Company recognizes interest and penalties related to unrecognized tax benefits in income tax expense. At December 31, 2020 and 2019, the Company had accrued interest and penalties related to the unrecognized tax benefits of $
3,239
and $
3,561
, respectively. During the years ended December 31, 2020, 2019, and 2018, the Company recognized $
128
, $
1,201
, and $
1,470
, respectively, in interest and penalties.
The Company and its subsidiaries file U.S. federal income tax returns, as well as tax returns in multiple states and foreign jurisdictions. The Company's
U.S. federal income tax returns are under examination for the years ended December 31, 2017 and 2018. The IRS may, however, ask for supporting documentation for net operating losses for the years ended December 31, 2013 - 2016, which were utilized in the year ended December 31, 2017.
During the years ended December 31, 2020, 2019, and 2018, certain tax examinations were concluded and certain statutes of limitations lapsed. The tax provision for those years includes adjustments related to the resolution of these matters, as reflected in the table above. The tax returns of significant non-U.S. subsidiaries currently under examination are located in the following jurisdictions: Germany (2013 through 2016), India (2004 through 2017), and Singapore (2015 through 2019). The Company and its subsidiaries also file income tax returns in other taxing jurisdictions in the U.S. and around the world, many of which are still open to examination.
The timing of the resolution of income tax examinations is highly uncertain, as are the amounts and timing of tax payments that result from such examinations. These events could cause large fluctuations in the balance sheet classification of current and non-current unrecognized tax benefits. The Company believes that in the next 12 months it is reasonably possible that certain income tax examinations will conclude or the statutes of limitation on certain income tax periods open to examination will expire, or both. Given the uncertainties described above, the Company can only determine an estimate of potential decreases in unrecognized tax benefits ranging from $
4,506
to $
9,249
.
F-
23
NOTES TO CONSOLIDATED FINANCIAL STATEMENTS
(dollars in thousands, except per share amounts)
Note 6 – Long-Term Debt
Long-term debt consists of the following:
|
December 31,
2020
|
December 31,
2019
|
|||||||
|
Credit facility
|
$
|
|
$
|
|
||||
|
Convertible senior notes, due 2025
|
|
|
||||||
|
Convertible senior debentures, due 2040
|
|
|
||||||
|
Convertible senior debentures, due 2041
|
|
|
||||||
|
Deferred financing costs
|
(
|
)
|
(
|
)
|
||||
|
|
|
|||||||
|
Less current portion
|
|
|
||||||
|
|
$
|
|
$
|
|
||||
Credit Facility
The Company maintains a credit agreement with a consortium of banks led by JPMorgan Chase Bank, N.A., as administrative agent, and the lenders (the "Credit Facility"), which provides an aggregate commitment of $
750,000
of revolving loans available until
June 5, 2024
. The Credit Facility also provides for the ability of Vishay to request up to $
300,000
of incremental facilities, subject to the satisfaction of certain conditions, which could take the form of additional revolving commitments, incremental “term loan A” or “term loan B” facilities, or incremental equivalent debt.
Borrowings under the Credit Facility bear interest at LIBOR plus an interest margin. The applicable interest margin is based on the Company's leverage ratio. Based on the Company's current leverage ratio, borrowings bear interest at LIBOR plus
1.50
%
. The Company also pays a commitment fee, also based on its leverage ratio, on undrawn amounts. The undrawn commitment fee, based on the Company's current leverage ratio, is
0.25
%
per annum.
The Credit Facility allows an unlimited amount of defined “Investments,” which include certain intercompany transactions and acquisitions, provided the Company's pro forma leverage ratio is equal to or less than
2.75
to 1.00. If the Company's pro forma leverage ratio is greater than
2.75
to 1.00, such Investments are subject to certain limitations.
The Credit Facility also allows an unlimited amount of defined "Restricted Payments," which include cash dividends and share repurchases, provided the Company's pro forma leverage ratio is equal to or less than
2.50
to 1.00. If the Company's pro forma leverage ratio is greater than
2.50
to 1.00, the Credit Facility allows such payments up to $
100,000
per annum (subject to a cap of $
300,000
for the term of the facility, with up to $
25,000
of any unused amount of the $
100,000
per annum base available for use in the next succeeding calendar year).
Borrowings under the Credit Facility are secured by a lien on substantially all assets, including accounts receivable, inventory, machinery and equipment, and general intangibles (but excluding real estate, intellectual property registered or licensed solely for use in, or arising solely under the laws of, any country other than the United States, assets located solely outside of the United States and deposit and securities accounts), of the Company and certain significant subsidiaries located in the United States, and pledges of stock in certain significant domestic and foreign subsidiaries; and are guaranteed by certain significant subsidiaries.
The Credit Facility limits or restricts the Company and its subsidiaries, from, among other things, incurring indebtedness, incurring liens on its respective assets, making investments and acquisitions (assuming the Company’s pro forma leverage ratio is greater than
2.75
to 1.00), making asset sales, and paying cash dividends and making other restricted payments (assuming the Company's pro forma leverage ratio is greater than
2.50
to 1.00), and requires the Company to comply with other covenants, including the maintenance of specific financial ratios.
The Credit Facility also contains customary events of default, including, but not limited to, failure to pay principal or interest, failure to pay or default under other material debt, material misrepresentation or breach of warranty, violation of certain covenants, a change of control, the commencement of bankruptcy proceedings, the insolvency of the Company or certain of its significant subsidiaries, and the rendering of a judgment in excess of $
50,000
against the Company or its subsidiaries. Upon the occurrence of an event of default under the Credit Facility, the Company's obligations under the credit facility may be accelerated and the lending commitments under the credit facility may be terminated.
At December 31, 2020 and 2019, there was $
748,690
and $
747,912
, respectively, available under the Credit Facility. Letters of credit totaling $
1,310
and $
2,088
were outstanding at December 31, 2020 and 2019, respectively.
The Credit Facility was entered into on
June 5, 2019
, and replaced a similar arrangement, which provided up to $
640,000
of aggregate commitments.
F-
24
NOTES TO CONSOLIDATED FINANCIAL STATEMENTS
(dollars in thousands, except per share amounts)
Note 6 – Long-Term Debt (continued)
Convertible Debt Instruments
The following table summarizes some key facts and terms regarding the outstanding convertible debt instruments as of December 31, 2020:
|
|
Due 2025
|
Due 2040
|
||||||
|
Issuance date
|
|
|
||||||
|
Maturity date
|
|
|
||||||
|
Principal amount
|
$
|
|
$
|
|
||||
|
Cash coupon rate (per annum)
|
|
%
|
|
%
|
||||
|
Nonconvertible debt borrowing rate at issuance (per annum)
|
|
%
|
|
%
|
||||
|
Conversion rate effective December 10, 2020 (per $1 principal amount)
|
|
|
||||||
|
Effective conversion price effective December 10, 2020 (per share)
|
$
|
|
$
|
|
||||
|
|
$
|
|
$
|
|
||||
|
Initial call date
|
n/a
|
|
||||||
The terms of the fully retired convertible senior debentures due 2041 and due 2042 were generally congruent to the convertible senior debentures due 2040.
Vishay was prohibited from redeeming the convertible senior debentures prior to the respective initial call dates. On or after the initial call date and prior to the maturity date, Vishay may redeem for cash all or part of the debentures at a redemption price equal to
100
% of the principal amount of the debentures to be redeemed, plus accrued and unpaid interest to, but excluding, the redemption date, if the last reported sale price of Vishay’s common stock has been at least
150
% of the conversion price then in effect for at least
20
trading days during any
30
consecutive trading day period prior to the date on which Vishay provides notice of redemption. On January 5, 2021, Vishay gave notice to the holders of its convertible senior debentures due 2040
that Vishay would redeem the debentures on February 4, 2021. The redemption price was paid in cash and was equal to 100% of the principal amount plus accrued but unpaid interest to, but excluding February 4, 2021.
Prior to
three months
before the maturity date, the holders may convert their convertible senior debentures due 2040 only under the following circumstances: (1) the sale price of Vishay common stock reaches
130
% of the conversion price for a specified period; (2) the trading price of the debentures falls below
98
% of the product of the sale price of Vishay's common stock and the conversion rate for a specified period; (3) Vishay calls any or all of the debentures for redemption, at any time prior to the close of business on the third scheduled trading day immediately preceding the redemption date; or (4) upon the occurrence of specified corporate events. The convertible senior debentures due 2040 were convertible as of December 31, 2020 and remained convertible until they were redeemed.
Prior to December 15, 2024, the holders of the convertible senior notes due 2025 may convert their notes only under the following circumstances: (1) the sale price of Vishay common stock reaches
130
% of the conversion price for a specified period; (2) the trading price of the notes falls below
98
% of the product of the sale price of Vishay's common stock and the conversion rate for a specified period; or (3) upon the occurrence of specified corporate transactions. The convertible senior notes due 2025 are not currently convertible.
Effective December 23, 2020, the Company exercised a provision in the Indenture governing the convertible senior notes due 2025, as further described below.
On January 5, 2021, the trustee of the convertible senior notes due 2025 executed a supplemental indenture dated as of December 23, 2020 (the "Supplemental Indenture"), regarding the notes. The Supplemental Indenture amends the indenture governing the notes dated as of June 12, 2018, to incorporate the Company's election.
Pursuant to the Supplemental Indenture, at the direction of its Board of Directors, Vishay has fixed the “Specified Dollar Amount” (as defined in the Indenture) that shall apply to all future conversions of notes at $1 cash per $1 principal amount. The fixing of the Specified Dollar Amount requires Vishay to satisfy its conversion obligations by paying cash with respect to such Specified Dollar Amount. Prior to entering into the Supplemental Indenture, Vishay had the option to settle any convertible senior notes due 2025 presented for conversion by delivering cash, shares of common stock or any combination thereof. At the direction of its Board of Directors, Vishay had always intended, upon conversion, to repay the principal amount of the convertible senior notes due 2025 in cash and settle any additional amounts in common stock. The entry into a Supplemental Indenture codifies this intention and removes Vishay’s option to settle the principal amount of the convertible senior notes due 2025 in shares of common stock upon conversion.
The Company intends to early adopt ASU No. 2020-06, effective January 1, 2021. Among other things, ASU No. 2020-06 requires the use of the if-converted method of calculating diluted earnings per share for the convertible notes due 2025. Entering into the Supplemental Indenture will reduce the potential dilutive impact of the convertible senior notes due 2025 for purposes of earnings per share computations versus what would have otherwise been required pursuant to ASU No 2020-06. See more information in Note 1.
The quarterly cash dividend program of the Company results in adjustments to the conversion rate and effective conversion price for the convertible debt instruments effective as of the ex-dividend date of each cash dividend. The conversion rate and effective conversion price for the convertible senior notes due 2025 is adjusted for quarterly cash dividends to the extent such dividends exceed $
0.085
per share of common stock.
Vishay must provide additional shares upon conversion if there is a “fundamental change” in the business as defined in the indenture governing the convertible senior notes due 2025.
F-
25
NOTES TO CONSOLIDATED FINANCIAL STATEMENTS
(dollars in thousands, except per share amounts)
Note 6 – Long-Term Debt (continued)
Prior to the adoption of ASU No. 2020-06, GAAP requires an issuer to separately account for the liability and equity components of the instrument in a manner that reflects the issuer’s nonconvertible debt borrowing rate when interest costs are recognized in subsequent periods. The resulting discount on the debt is amortized as non-cash interest expense in future periods. Subsequent to the adoption of ASU No. 2020-06, Vishay's convertible debt instruments will not be bifurcated into liability and equity components and non-cash interest will only include amortization of deferred financing costs.
The carrying values of the liability and equity components of the convertible debt instruments are reflected in the Company’s accompanying consolidated balance sheets as follows:
|
Principal
amount of the
convertible
debt
|
Unamortized
discount
|
Carrying
value of
liability
component
|
Equity
component
(including
temporary
equity) - net
carrying value
|
|||||||||||||
|
December 31, 2020
|
||||||||||||||||
|
Convertible senior notes due 2025
|
$
|
|
(
|
)
|
$
|
|
$
|
|
||||||||
|
Convertible senior debentures
|
$
|
|
(
|
)
|
$
|
|
$
|
|
||||||||
|
Total
|
$
|
|
$
|
(
|
)
|
$
|
|
$
|
|
|||||||
|
December 31, 2019
|
||||||||||||||||
|
Convertible senior notes due 2025
|
$
|
|
(
|
)
|
$
|
|
$
|
|
||||||||
|
Convertible senior debentures
|
$
|
|
(
|
)
|
$
|
|
$
|
|
||||||||
|
Total
|
$
|
|
$
|
(
|
)
|
$
|
|
$
|
|
|||||||
Interest is payable on the convertible debt instruments semi-annually at the cash coupon rate; however, the remaining debt discount is being amortized as additional non-cash interest expense using an effective annual interest rate equal to the Company’s estimated nonconvertible debt borrowing rate at the time of issuance. In addition to ordinary interest, contingent interest will accrue in certain circumstances relating to the trading price of the convertible senior debentures due 2040 and under certain other circumstances, beginning
ten years
subsequent to their issuance. Contingent interest is not currently payable on the convertible senior debentures due 2040. The convertible senior notes due 2025 do not possess contingent interest features.
Interest expense related to the convertible debt instruments is reflected on the accompanying consolidated statements of operations for the years ended December 31:
|
|
Contractual
coupon
interest
|
Non-cash
amortization
of debt
discount
|
Other non-cash
interest expense
|
Total interest
expense
related to the
debentures
|
||||||||||||
|
2020
|
||||||||||||||||
|
Convertible senior notes due 2025
|
$
|
|
|
|
$
|
|
||||||||||
|
Convertible senior debentures
|
$
|
|
|
|
$
|
|
||||||||||
|
Total
|
$
|
|
$
|
|
$
|
|
$
|
|
||||||||
|
2019
|
||||||||||||||||
|
Convertible senior notes due 2025
|
$
|
|
|
|
$
|
|
||||||||||
|
Convertible senior debentures
|
$
|
|
|
(
|
)
|
$
|
|
|||||||||
|
Total
|
$
|
|
$
|
|
$
|
|
$
|
|
||||||||
|
2018
|
||||||||||||||||
|
Convertible senior notes due 2025
|
$
|
|
|
|
$
|
|
||||||||||
|
Convertible senior debentures
|
|
|
|
|
||||||||||||
|
Total
|
$
|
|
$
|
|
$
|
|
$
|
|
||||||||
F-
26
NOTES TO CONSOLIDATED FINANCIAL STATEMENTS
(dollars in thousands, except per share amounts)
Note 6 – Long-Term Debt (continued)
The Company used substantially all of the net proceeds of the 2018 issuance of convertible senior notes due 2025 and cash, including a substantial amount of cash repatriated to the United States (see Note 5) to repurchase $
273,690
, $
116,922
, and $
147,832
principal amounts of convertible senior debentures due 2040, due 2041, and due 2042, respectively, in 2018. The net carrying value of the debentures repurchased were $
111,294
, $
45,157
, and $
62,503
, respectively. In accordance with the authoritative accounting guidance for convertible debentures, the aggregate repurchase payment of $
960,995
was allocated between the liability ($
241,706
) and equity (including temporary equity, $
719,289
) components of the convertible debentures, using the Company's nonconvertible debt borrowing rate at the time of the repurchases. As a result, the Company recognized a loss on extinguishment of convertible debentures of $
26,583
, including the write-off of a portion of unamortized debt issuance costs.
The Company used cash to repurchase $
1,010
, $
16,188
and $
2,168
principal amounts of convertible senior debentures due 2040, due 2041, and due 2042, respectively, in 2019. The net carrying value of the debentures repurchased were $
417
, $
6,282
, and $
924
, respectively. In accordance with the authoritative accounting guidance for convertible debentures, the aggregate repurchase payment of $
27,863
was allocated between the liability ($
9,568
) and equity (including temporary equity, $
18,295
) components of the convertible debentures, using the Company's nonconvertible debt borrowing rate at the time of the repurchase. As a result, the Company recognized a loss on extinguishment of convertible debentures of $
2,030
, including the write-off of a portion of unamortized debt issuance costs. The convertible senior debentures due 2042 have been fully repurchased, and the trustee has confirmed that the Company has satisfied and discharged its obligations under the indenture governing the convertible senior debentures due 2042.
The Company used cash to repurchase $
134,656
principal amount of convertible senior notes due 2025 in 2020. The net carrying value of the debentures repurchased was $
115,978
. In accordance with the authoritative accounting guidance for convertible debt, the aggregate repurchase payments of $
128,328
were allocated between the liability ($
118,587
) and equity ($
9,741
) components of the convertible notes, using the Company's nonconvertible debt borrowing rate at the time of the repurchases. As a result, the Company recognized a loss on extinguishment of convertible notes of $
4,600
, including the write-off of unamortized debt issuance costs.
The Company used cash to repurchase $
16,890
principal amount of convertible senior debentures due 2041 in 2020. The net carrying value of the debentures repurchased was $
6,715
. The aggregate repurchase payment of $
23,355
was allocated between the liability ($
10,075
) and equity ($
13,280
) components of the convertible debentures, using the Company's nonconvertible debt borrowing rate at the time of the repurchase. As a result, the Company recognized a loss on extinguishment of convertible debentures of $
3,473
, including the write-off of unamortized debt issuance costs.
The convertible senior debentures due 2041 have been fully repurchased, and the trustee has confirmed that the Company has satisfied and discharged its obligations under the indenture governing the convertible senior debentures due 2041.
Other Borrowings Information
The Credit Facility, of which no amounts were drawn as of December 31, 2020, expires in 2024. The convertible senior notes mature in 2025.
At December 31, 2020 and 2019, the Company had committed and uncommitted short-term credit lines with various U.S. and foreign banks aggregating approximately $
6,000
, with substantially no amounts borrowed.
Interest paid was $
15,450
, $
16,177
, and $
23,859
for the years ended December 31, 2020, 2019, and 2018, respectively.
See Note 18 for further discussion on the fair value of the Company’s long-term debt.
F-
27
NOTES TO CONSOLIDATED FINANCIAL STATEMENTS
(dollars in thousands, except per share amounts)
Note 7 – Stockholders’ Equity
The Company’s Class B common stock carries
10
votes per share while the common stock carries
1
vote per share. Class B shares are transferable only to certain permitted transferees while the common stock is freely transferable. Class B shares are convertible on a
one-for-one
basis at any time into shares of common stock. Transfers of Class B shares other than to permitted transferees result in the automatic conversion of the Class B shares into common stock.
The Board of Directors may only declare dividends or other distributions with respect to the common stock or the Class B common stock if it grants such dividends or distributions in the same amount per share with respect to the other class of stock. Stock dividends or distributions on any class of stock are payable only in shares of stock of that class. Shares of either common stock or Class B common stock cannot be split, divided, or combined unless the other is also split, divided, or combined equally. Cash dividends were paid quarterly in 2020 and 2019.
The Credit Facility also allows an unlimited amount of defined "Restricted Payments," which include cash dividends and share repurchases, provided the Company's pro forma leverage ratio is equal to or less than
2.50
to 1.00. If the Company's pro forma leverage ratio is greater than
2.50
to 1.00, the Credit Facility allows such payments up to $
100,000
per annum (subject to a cap of $
300,000
for the term of the facility, with up to $
25,000
of any unused amount of the $
100,000
per annum base available for use in the next succeeding calendar year).
At December 31, 2020, the Company had reserved shares of common stock for future issuance as follows:
|
Restricted stock units outstanding
|
|
|||
|
Phantom stock units outstanding
|
|
|||
|
2007 Stock Incentive Program - available to grant
|
|
|||
|
Convertible senior debentures, due 2040*
|
|
|||
|
Convertible senior notes, due 2025*
|
|
|||
|
Conversion of Class B common stock
|
|
|||
|
|
|
__________________
*
At December 31, 2020, the convertible senior debentures due 2040 are convertible into
24,544
shares of Vishay common stock. Based on the effective conversion rate at December 31, 2020, the convertible senior notes due 2025 would be convertible into
14,836,842
shares of Vishay common stock. The Company has reserved adequate shares to ensure it could issue the maximum amount of shares to be delivered upon a make-whole fundamental change as defined in the indentures governing the convertible debt instruments.
F-
28
NOTES TO CONSOLIDATED FINANCIAL STATEMENTS
(dollars in thousands, except per share amounts)
Note 8 – Details of Expenses
The caption “Other” on the accompanying consolidated statements of operations consists of the following:
|
|
Years ended December 31,
|
|||||||||||
|
|
2020
|
2019
|
2018
|
|||||||||
|
|
||||||||||||
|
Foreign exchange gain (loss)
|
$
|
(
|
)
|
$
|
(
|
)
|
$
|
(
|
)
|
|||
|
Interest income
|
|
|
|
|||||||||
|
Other components of periodic pension expense
|
(
|
)
|
(
|
)
|
(
|
)
|
||||||
|
Investment income (expense)
|
|
|
(
|
)
|
||||||||
|
Other
|
(
|
)
|
|
(
|
)
|
|||||||
|
|
$
|
(
|
)
|
$
|
(
|
)
|
$
|
(
|
)
|
|||
The Company repurchased $
151,546
, $
19,366
, and $
538,444
, principal amounts of convertible debt instruments and recognized losses on early extinguishment of the repurchased convertible debt of $
8,073
, $
2,030
, and $
26,583
in 2020, 2019, and 2018, respectively.
Impact of the Coronavirus Outbreak
The Company's operations have been impacted by the coronavirus ("COVID-19") outbreak. Some manufacturing facilities were temporarily closed and some are operating at levels less than full capacity. The Company has incurred incremental costs separable from normal operations that are directly related to the outbreak and containment efforts, primarily wages paid to manufacturing employees during government-mandated shut-downs, additional wages and hardship allowances for working during lockdown periods, additional costs of cleaning and disinfecting facilities, costs of additional safety equipment for employees, and temporary housing for employees due to travel restrictions, which were partially offset by government subsidies. The net impact of the costs and subsidies are reported as cost of products sold of $
4,563
and selling, general, and administrative benefits of $
1,451
based on employee function on the consolidated statement of operations for the year ended December 31, 2020.
The Company's insurance coverages generally exclude losses incurred due to pandemics. Any amounts that may be received will not be recognized until all contingencies are settled.
F-
29
NOTES TO CONSOLIDATED FINANCIAL STATEMENTS
(dollars in thousands, except per share amounts)
Note 9 – Other Accrued Expenses
Other accrued expenses consist of the following:
|
December 31,
|
||||||||
|
|
2020
|
2019
|
||||||
|
|
||||||||
|
Sales returns and allowances
|
$
|
|
$
|
|
||||
|
Goods received, not yet invoiced
|
|
|
||||||
|
Accrued restructuring
|
|
|
||||||
|
Other
|
|
|
||||||
|
|
$
|
|
$
|
|
||||
Sales returns and allowances accrual activity is shown below:
|
Years Ended December 31,
|
||||||||||||
|
|
2020
|
2019
|
2018
|
|||||||||
|
Beginning balance
|
$
|
|
$
|
|
$
|
|
||||||
|
Sales returns and allowances
|
|
|
|
|||||||||
|
Credits issued
|
(
|
)
|
(
|
)
|
(
|
)
|
||||||
|
Foreign currency
|
|
(
|
)
|
(
|
)
|
|||||||
|
Ending balance
|
$
|
|
$
|
|
$
|
|
||||||
F-
30
NOTES TO CONSOLIDATED FINANCIAL STATEMENTS
(dollars in thousands, except per share amounts)
Note 10 – Accumulated Other Comprehensive Income (Loss)
The cumulative balance of each component of other comprehensive income (loss) and the income tax effects allocated to each component are as follows:
|
Pension and
other post-
retirement
actuarial items
|
Currency
translation
adjustment
|
Unrealized gain
(loss) on
available-for-sale
securities
|
Total
|
|||||||||||||
|
Balance at January 1, 2018
|
$
|
(
|
)
|
$
|
|
$
|
|
$
|
|
|||||||
|
Cumulative effect of accounting for adoption of ASU 2016-01
|
|
|
(
|
)
|
(
|
)
|
||||||||||
|
Other comprehensive income before reclassifications
|
|
(
|
)
|
|
$
|
(
|
)
|
|||||||||
|
Tax effect
|
(
|
)
|
|
|
$
|
(
|
)
|
|||||||||
|
Other comprehensive income before reclassifications, net of tax
|
|
(
|
)
|
|
$
|
(
|
)
|
|||||||||
|
Amounts reclassified out of AOCI
|
|
|
|
$
|
|
|||||||||||
|
Tax effect
|
(
|
)
|
|
|
$
|
(
|
)
|
|||||||||
|
Amounts reclassified out of AOCI, net of tax
|
|
|
|
$
|
|
|||||||||||
|
Net comprehensive income (loss)
|
$
|
|
$
|
(
|
)
|
$
|
|
$
|
(
|
)
|
||||||
|
Balance at December 31, 2018
|
$
|
(
|
)
|
$
|
|
$
|
|
$
|
(
|
)
|
||||||
|
Other comprehensive income before reclassifications
|
(
|
)
|
(
|
)
|
|
$
|
(
|
)
|
||||||||
|
Tax effect
|
|
|
|
$
|
|
|||||||||||
|
Other comprehensive income before reclassifications, net of tax
|
(
|
)
|
(
|
)
|
|
$
|
(
|
)
|
||||||||
|
Amounts reclassified out of AOCI
|
|
|
|
$
|
|
|||||||||||
|
Tax effect
|
(
|
)
|
|
|
$
|
(
|
)
|
|||||||||
|
Amounts reclassified out of AOCI, net of tax
|
|
|
|
$
|
|
|||||||||||
|
Net comprehensive income (loss)
|
$
|
(
|
)
|
$
|
(
|
)
|
$
|
|
$
|
(
|
)
|
|||||
|
Balance at December 31, 2019
|
$
|
(
|
)
|
$
|
|
$
|
|
$
|
(
|
)
|
||||||
|
Other comprehensive income before reclassifications
|
(
|
)
|
|
|
$
|
|
||||||||||
|
Tax effect
|
|
|
|
$
|
|
|||||||||||
|
Other comprehensive income before reclassifications, net of tax
|
(
|
)
|
|
|
$
|
|
||||||||||
|
Amounts reclassified out of AOCI
|
|
|
|
$
|
|
|||||||||||
|
Tax effect
|
(
|
)
|
|
|
$
|
(
|
)
|
|||||||||
|
Amounts reclassified out of AOCI, net of tax
|
|
|
|
$
|
|
|||||||||||
|
Net comprehensive income (loss)
|
$
|
(
|
)
|
$
|
|
$
|
|
$
|
|
|||||||
|
Balance at December 31, 2020
|
$
|
(
|
)
|
$
|
|
$
|
|
$
|
|
|||||||
The Company recognized a cumulative-effect adjustment to retained earnings (accumulated deficit) of $
1,801
for the cumulative change in fair value of available-for-sale equity investments previously recognized in other comprehensive income due to the adoption of ASU 2016-01 on January 1, 2018.
F-
31
NOTES TO CONSOLIDATED FINANCIAL STATEMENTS
(dollars in thousands, except per share amounts)
Note 11 – Pensions and Other Postretirement Benefits
The Company maintains various retirement benefit plans. GAAP requires employers to recognize the funded status of a benefit plan, measured as the difference between plan assets at fair value and the benefit obligation, in its balance sheet. The recognition of the funded status on the balance sheet requires employers to recognize actuarial items (such as actuarial gains and losses, prior service costs, and transition obligations) as a component of other comprehensive income, net of tax.
The following table summarizes amounts recorded on the accompanying consolidated balance sheets associated with these various retirement benefit plans:
|
December 31,
|
||||||||
|
2020
|
2019
|
|||||||
|
|
||||||||
|
Included in "Other assets":
|
||||||||
|
Non-U.S. pension plans
|
$
|
|
$
|
|
||||
|
Total included in other assets
|
$
|
|
$
|
|
||||
|
Included in "Payroll and related expenses":
|
||||||||
|
U.S. pension plans
|
$
|
(
|
)
|
$
|
(
|
)
|
||
|
Non-U.S. pension plans
|
(
|
)
|
(
|
)
|
||||
|
U.S. other postretirement plans
|
(
|
)
|
(
|
)
|
||||
|
Non-U.S. other postretirement plans
|
(
|
)
|
(
|
)
|
||||
|
Total included in payroll and related expenses
|
$
|
(
|
)
|
$
|
(
|
)
|
||
|
Accrued pension and other postretirement costs:
|
||||||||
|
U.S. pension plans
|
$
|
(
|
)
|
$
|
(
|
)
|
||
|
Non-U.S. pension plans
|
(
|
)
|
(
|
)
|
||||
|
U.S. other postretirement plans
|
(
|
)
|
(
|
)
|
||||
|
Non-U.S. other postretirement plans
|
(
|
)
|
(
|
)
|
||||
|
Other retirement obligations
|
(
|
)
|
(
|
)
|
||||
|
Total accrued pension and other postretirement costs
|
$
|
(
|
)
|
$
|
(
|
)
|
||
|
Accumulated other comprehensive loss:
|
||||||||
|
U.S. pension plans
|
$
|
|
$
|
|
||||
|
Non-U.S. pension plans
|
|
|
||||||
|
U.S. other postretirement plans
|
|
(
|
)
|
|||||
|
Non-U.S. other postretirement plans
|
|
|
||||||
|
Total accumulated other comprehensive loss*
|
$
|
|
$
|
|
||||
* -
Amounts included in accumulated other comprehensive loss are presented in this table pre-tax.
Defined Benefit Pension Plans
U.S. Pension Plans
The Company maintained several defined benefit pension plans which covered most full-time U.S. employees. These included pension plans which are “qualified” under the Employee Retirement Income Security Act of 1974 (“ERISA”) and the Internal Revenue Code, and “non-qualified” pension plans which provide defined benefits primarily to U.S. employees whose benefits under the qualified pension plan would be limited by ERISA and the Internal Revenue Code. The Company’s principal qualified U.S. pension plan (the Vishay Retirement Plan) was frozen effective January 1, 2009 and terminated in 2016.
The Company’s principal non-qualified U.S. pension plan (the Vishay Non-qualified Retirement Plan) was a contributory pension plan designed to provide similar defined benefits to covered U.S. employees whose benefits under the Vishay Retirement Plan were limited by the Internal Revenue Code. The Vishay Non-qualified Retirement Plan was similar in construction to the Vishay Retirement Plan, except that the plan is not qualified under the Internal Revenue Code.
The Vishay Non-qualified Retirement Plan, like all non-qualified plans, is considered to be unfunded. The Company maintains a non-qualified trust, referred to as a “rabbi” trust, to fund benefit payments under this plan. Rabbi trust assets are subject to creditor claims under certain conditions and are not the property of employees. Therefore, they are accounted for as other noncurrent assets. Assets held in trust related to the non-qualified pension plan were $
29,157
and $
27,012
at December 31, 2020 and 2019, respectively.
F-
32
NOTES TO CONSOLIDATED FINANCIAL STATEMENTS
(dollars in thousands, except per share amounts)
Note 11 – Pensions and Other Postretirement Benefits (continued)
In 2008, the Company adopted amendments to the Vishay Non-Qualified Retirement Plan such that effective January 1, 2009, the plan was frozen. Pursuant to these amendments, no new employees may participate in the plans, no further participant contributions were required or permitted, and no further benefits shall accrue after December 31, 2008. Benefits accumulated as of December 31, 2008 will be paid to employees upon or following retirement, and the Company will likely need to make additional cash contributions to the rabbi trust to fund this accumulated benefit obligation.
The Company also maintains other pension plans which provide supplemental defined benefits primarily to former U.S. employees whose benefits under qualified pension plans were limited by the Internal Revenue Code. These non-qualified plans are all non-contributory plans, and are considered to be unfunded.
In 2004, the Company entered into an employment agreement with Dr. Felix Zandman, its Executive Chairman and then-Chief Executive Officer. Pursuant to this agreement, the Company is providing an annual retirement benefit of approximately $
614
to his surviving spouse. The Company maintains a non-qualified trust, referred to as a “rabbi” trust, to fund benefit payments under this plan. Rabbi trust assets are subject to creditor claims under certain conditions and are not the property of employees. Therefore, they are accounted for as other noncurrent assets. Assets held in trust related to this non-qualified pension plan were $
1,243
and $
605
at December 31, 2020 and 2019, respectively.
Non-U.S. Pension Plans
The Company provides pension and similar benefits to employees of certain non-U.S. subsidiaries consistent with local practices. Pension benefits earned are generally based on years of service and compensation during active employment.
The following table sets forth a reconciliation of the benefit obligation, plan assets, and funded status related to U.S. and non-U.S. pension plans:
|
December 31, 2020
|
December 31, 2019
|
|||||||||||||||
|
|
U.S.
Plans
|
Non-U.S.
Plans
|
U.S.
Plans
|
Non-U.S.
Plans
|
||||||||||||
|
Change in benefit obligation:
|
||||||||||||||||
|
Benefit obligation at beginning of year
|
$
|
|
$
|
|
$
|
|
$
|
|
||||||||
|
Service cost
|
|
|
|
|
||||||||||||
|
Interest cost
|
|
|
|
|
||||||||||||
|
Plan amendments
|
|
|
|
|
||||||||||||
|
Actuarial (gains) losses
|
|
|
|
|
||||||||||||
|
Benefits paid
|
(
|
)
|
(
|
)
|
(
|
)
|
(
|
)
|
||||||||
|
Curtailments and settlements
|
|
(
|
)
|
|
|
|||||||||||
|
Currency translation
|
|
|
|
(
|
)
|
|||||||||||
|
Benefit obligation at end of year
|
$
|
|
$
|
|
$
|
|
$
|
|
||||||||
|
Change in plan assets:
|
||||||||||||||||
|
Fair value of plan assets at beginning of year
|
$
|
|
$
|
|
$
|
|
|
|||||||||
|
Actual return on plan assets
|
|
|
|
|
||||||||||||
|
Company contributions
|
|
|
|
|
||||||||||||
|
Benefits paid
|
(
|
)
|
(
|
)
|
(
|
)
|
(
|
)
|
||||||||
|
Currency translation
|
|
|
|
|
||||||||||||
|
Fair value of plan assets at end of year
|
$
|
|
$
|
|
$
|
|
$
|
|
||||||||
|
Funded status at end of year
|
$
|
(
|
)
|
$
|
(
|
)
|
$
|
(
|
)
|
$
|
(
|
)
|
||||
F-
33
NOTES TO CONSOLIDATED FINANCIAL STATEMENTS
(dollars in thousands, except per share amounts)
Note 11 – Pensions and Other Postretirement Benefits (continued)
The plan assets are stated at fair value. See Note 18 for further discussion of the valuation of the plan assets.
Amounts recognized in the accompanying consolidated balance sheets consist of the following:
|
December 31, 2020
|
December 31, 2019
|
|||||||||||||||
|
U.S.
Plans
|
Non-U.S.
Plans
|
U.S.
Plans
|
Non-U.S.
Plans
|
|||||||||||||
|
Other assets
|
$
|
|
$
|
|
$
|
|
$
|
|
||||||||
|
Accrued benefit liability - current
|
(
|
)
|
(
|
)
|
(
|
)
|
(
|
)
|
||||||||
|
Accrued benefit liability - non-current
|
(
|
)
|
(
|
)
|
(
|
)
|
(
|
)
|
||||||||
|
Accumulated other comprehensive loss
|
|
|
|
|
||||||||||||
|
|
$
|
(
|
)
|
$
|
(
|
)
|
$
|
(
|
)
|
$
|
(
|
)
|
||||
Actuarial items consist of the following:
|
December 31, 2020
|
December 31, 2019
|
|||||||||||||||
|
U.S.
Plans
|
Non-U.S.
Plans
|
U.S.
Plans
|
Non-U.S.
Plans
|
|||||||||||||
|
Unrecognized net actuarial loss
|
$
|
|
$
|
|
$
|
|
$
|
|
||||||||
|
Unamortized prior service cost
|
|
|
|
|
||||||||||||
|
|
$
|
|
$
|
|
$
|
|
$
|
|
||||||||
The following table sets forth additional information regarding the projected and accumulated benefit obligations:
|
December 31, 2020
|
December 31, 2019
|
|||||||||||||||
|
U.S.
Plans
|
Non-U.S.
Plans
|
U.S.
Plans
|
Non-U.S.
Plans
|
|||||||||||||
|
Accumulated benefit obligation, all plans
|
$
|
|
$
|
|
$
|
|
$
|
|
||||||||
|
Plans for which the accumulated benefit obligation exceeds plan assets:
|
||||||||||||||||
|
Projected benefit obligation
|
$
|
|
$
|
|
$
|
|
$
|
|
||||||||
|
Accumulated benefit obligation
|
|
|
|
|
||||||||||||
|
Fair value of plan assets
|
|
|
|
|
||||||||||||
The following table sets forth the components of net periodic pension cost:
|
Years ended December 31,
|
||||||||||||||||||||||||
|
|
2020
|
2019
|
2018
|
|||||||||||||||||||||
|
|
U.S.
Plans
|
Non-U.S.
Plans
|
U.S.
Plans
|
Non-U.S.
Plans
|
U.S.
Plans
|
Non-U.S.
Plans
|
||||||||||||||||||
|
Service cost
|
$
|
|
$
|
|
$
|
|
$
|
|
$
|
|
$
|
|
||||||||||||
|
Interest cost
|
|
|
|
|
|
|
||||||||||||||||||
|
Expected return on plan assets
|
|
(
|
)
|
|
(
|
)
|
|
(
|
)
|
|||||||||||||||
|
Amortization of actuarial losses
|
|
|
|
|
|
|
||||||||||||||||||
|
Amortization of prior service cost
|
|
|
|
|
|
|
||||||||||||||||||
|
Curtailment and settlement losses
|
|
|
|
|
|
|
||||||||||||||||||
|
Net periodic pension cost
|
$
|
|
$
|
|
$
|
|
$
|
|
$
|
|
$
|
|
||||||||||||
F-
34
NOTES TO CONSOLIDATED FINANCIAL STATEMENTS
(dollars in thousands, except per share amounts)
Note 11 – Pensions and Other Postretirement Benefits (continued)
See Note 10 for the pretax, tax effect and after tax amounts included in other comprehensive income during the years ended December 31, 2020, 2019, and 2018. The estimated actuarial items for the defined benefit pensions plans that will be amortized from accumulated other comprehensive loss into net periodic pension cost during 2021 is $
10,000
.
The following weighted average assumptions were used to determine benefit obligations at December 31 of the respective years:
|
|
2020
|
2019
|
||||||||||||||
|
U.S.
Plans
|
Non-U.S.
Plans
|
U.S.
Plans
|
Non-U.S.
Plans
|
|||||||||||||
|
Discount rate
|
|
%
|
|
%
|
|
%
|
|
%
|
||||||||
|
Rate of compensation increase
|
|
%
|
|
%
|
|
%
|
|
%
|
||||||||
The following weighted average assumptions were used to determine the net periodic pension costs:
|
|
Years ended December 31,
|
|||||||||||||||
|
|
2020
|
2019
|
||||||||||||||
|
|
U.S.
Plans
|
Non-U.S.
Plans
|
U.S.
Plans
|
Non-U.S.
Plans
|
||||||||||||
|
Discount rate
|
|
%
|
|
%
|
|
%
|
|
%
|
||||||||
|
Rate of compensation increase
|
|
%
|
|
%
|
|
%
|
|
%
|
||||||||
|
Expected return on plan assets
|
|
%
|
|
%
|
|
%
|
|
%
|
||||||||
The plans’ expected return on assets is based on management’s expectations of long-term average rates of return to be achieved by the underlying investment portfolios. In establishing this assumption, management considers historical and expected returns for the asset classes in which the plans are invested, advice from pension consultants and investment advisors, and current economic and capital market conditions.
The investment mix between equity securities and fixed income securities is based upon achieving a desired return, balancing higher return, more volatile equity securities, and lower return, less volatile fixed income securities and is adjusted for the expected duration of the obligation and the funded status of the plan. Investment allocations are made across a range of securities, maturities and credit quality. The Company’s non-U.S. defined benefit plan investments are based on local laws and customs. Most plans invest in cash and local government fixed income securities, although plans in certain countries have investments in equity securities. The plans do not invest in securities of Vishay or its subsidiaries. Negative investment returns could ultimately affect the funded status of the plans, requiring additional cash contributions. See Note 18 for further information on the fair value of the plan assets by asset category.
Estimated future benefit payments are as follows:
|
U.S.
Plans
|
Non-U.S.
Plans
|
|||||||
|
2021
|
$
|
|
$
|
|
||||
|
2022
|
|
|
||||||
|
2023
|
|
|
||||||
|
2024
|
|
|
||||||
|
2025
|
|
|
||||||
|
2026-2030
|
|
|
||||||
The Company’s anticipated 2020 contributions for defined benefit pension plans will approximate the expected benefit payments disclosed above.
F-
35
NOTES TO CONSOLIDATED FINANCIAL STATEMENTS
(dollars in thousands, except per share amounts)
Note 11 – Pensions and Other Postretirement Benefits (continued)
Other Postretirement Benefits
In the U.S., the Company maintains unfunded non-pension postretirement plans, including medical benefits for certain executives and their surviving spouses, which are funded as costs are incurred. The Company also maintains
two
unfunded non-pension postretirement plans at
two
European subsidiaries.
The following table sets forth a reconciliation of the benefit obligation, plan assets, and accrued benefit cost related to U.S. and non-U.S. non-pension defined benefit postretirement plans:
|
December 31, 2020
|
December 31, 2019
|
|||||||||||||||
|
U.S.
Plans
|
Non-U.S.
Plans
|
U.S.
Plans
|
Non-U.S.
Plans
|
|||||||||||||
|
Change in benefit obligation:
|
||||||||||||||||
|
Benefit obligation at beginning of year
|
$
|
|
$
|
|
$
|
|
$
|
|
||||||||
|
Service cost
|
|
|
|
|
||||||||||||
|
Interest cost
|
|
|
|
|
||||||||||||
|
Actuarial (gains) losses
|
|
|
|
|
||||||||||||
|
Benefits paid
|
(
|
)
|
(
|
)
|
(
|
)
|
(
|
)
|
||||||||
|
Currency translation
|
|
|
|
(
|
)
|
|||||||||||
|
Benefit obligation at end of year
|
$
|
|
$
|
|
$
|
|
$
|
|
||||||||
|
Fair value of plan assets at end of year
|
$
|
|
$
|
|
$
|
|
$
|
|
||||||||
|
Funded status at end of year
|
$
|
(
|
)
|
$
|
(
|
)
|
$
|
(
|
)
|
$
|
(
|
)
|
||||
Amounts recognized in the accompanying consolidated balance sheets consist of the following:
|
December 31, 2020
|
December 31, 2019
|
|||||||||||||||
|
U.S.
Plans
|
Non-U.S.
Plans
|
U.S.
Plans
|
Non-U.S.
Plans
|
|||||||||||||
|
Accrued benefit liability - current
|
$
|
(
|
)
|
$
|
(
|
)
|
$
|
(
|
)
|
$
|
(
|
)
|
||||
|
Accrued benefit liability - non-current
|
(
|
)
|
(
|
)
|
(
|
)
|
(
|
)
|
||||||||
|
Accumulated other comprehensive income
|
|
|
(
|
)
|
|
|||||||||||
|
|
$
|
(
|
)
|
$
|
(
|
)
|
$
|
(
|
)
|
$
|
(
|
)
|
||||
F-
36
NOTES TO CONSOLIDATED FINANCIAL STATEMENTS
(dollars in thousands, except per share amounts)
Note 11 – Pensions and Other Postretirement Benefits (continued)
Actuarial items consist of the following:
|
December 31, 2020
|
December 31, 2019
|
|||||||||||||||
|
U.S.
Plans
|
Non-U.S.
Plans
|
U.S.
Plans
|
Non-U.S.
Plans
|
|||||||||||||
|
Unrecognized net actuarial loss (gain)
|
$
|
|
$
|
|
$
|
(
|
)
|
$
|
|
|||||||
|
|
$
|
|
$
|
|
$
|
(
|
)
|
$
|
|
|||||||
The following table sets forth the components of net periodic benefit cost:
|
Years ended December 31,
|
||||||||||||||||||||||||
|
|
2020
|
2019
|
2018
|
|||||||||||||||||||||
|
U.S.
Plans
|
Non-U.S.
Plans
|
U.S.
Plans
|
Non-U.S.
Plans
|
U.S.
Plans
|
Non-U.S.
Plans
|
|||||||||||||||||||
|
Service cost
|
$
|
|
$
|
|
$
|
|
$
|
|
$
|
|
$
|
|
||||||||||||
|
Interest cost
|
|
|
|
|
|
|
||||||||||||||||||
|
Amortization of actuarial (gains) losses
|
|
|
(
|
)
|
|
(
|
)
|
|
||||||||||||||||
|
Amortization of prior service credit
|
|
|
|
|
(
|
)
|
|
|||||||||||||||||
|
Curtailment and settlement losses
|
|
|
|
|
|
|
||||||||||||||||||
|
Net periodic benefit cost (benefit)
|
$
|
|
$
|
|
$
|
|
$
|
|
$
|
|
$
|
|
||||||||||||
The estimated actuarial items for the other postretirement benefit plans that will be amortized from accumulated other comprehensive loss into net periodic benefit cost during 2021 are not material.
The following weighted average assumptions were used to determine benefit obligations at December 31 of the respective years:
|
|
2020
|
2019
|
||||||||||||||
|
|
U.S.
Plans
|
Non-U.S.
Plans
|
U.S.
Plans
|
Non-U.S.
Plans
|
||||||||||||
|
Discount rate
|
|
%
|
|
%
|
|
%
|
|
%
|
||||||||
|
Rate of compensation increase
|
|
%
|
|
%
|
|
%
|
|
%
|
||||||||
The following weighted average assumptions were used to determine the net periodic benefit costs:
|
|
Years ended December 31,
|
|||||||||||||||
|
|
2020
|
2019
|
||||||||||||||
|
|
U.S.
Plans
|
Non-U.S.
Plans
|
U.S.
Plans
|
Non-U.S.
Plans
|
||||||||||||
|
Discount rate
|
|
%
|
|
%
|
|
%
|
|
%
|
||||||||
|
Rate of compensation increase
|
|
%
|
|
%
|
|
%
|
|
%
|
||||||||
The impact of a one-percentage-point change in assumed health care cost trend rates on the net periodic benefit cost and postretirement benefit obligation is not material.
F-
37
NOTES TO CONSOLIDATED FINANCIAL STATEMENTS
(dollars in thousands, except per share amounts)
Note 11 – Pensions and Other Postretirement Benefits (continued)
Estimated future benefit payments are as follows:
|
U.S.
Plans
|
Non-U.S.
Plans
|
|||||||
|
2021
|
$
|
|
$
|
|
||||
|
2022
|
|
|
||||||
|
2023
|
|
|
||||||
|
2024
|
|
|
||||||
|
2025
|
|
|
||||||
|
2026-2030
|
|
|
||||||
As the plans are unfunded, the Company’s anticipated contributions for 2021 are equal to its estimated benefits payments.
Other Retirement Obligations
The Company participates in various other defined contribution and government-mandated retirement plans based on local law or custom. The Company periodically makes required contributions for certain of these plans, whereas other plans are unfunded retirement bonus plans which will be paid at the employee's retirement date. At December 31, 2020 and 2019, the accompanying consolidated balance sheets include $
14,282
and $
12,871
, respectively, within accrued pension and other postretirement costs related to these plans.
The Company’s U.S. employees are eligible to participate in a 401(k) savings plan, which provides for Company matching contributions. The Company’s matching expense for the plans was $
6,363
, $
6,481
, and $
6,353
for the years ended December 31, 2020, 2019, and 2018, respectively. No material amounts are included in the accompanying consolidated balance sheets at December 31, 2020 and 2019 related to unfunded 401(k) contributions.
Certain key employees participate in a deferred compensation plan. During the years ended December 31, 2020, 2019, and 2018, these employees could defer a portion of their compensation until retirement, or elect shorter deferral periods. The Company maintains a liability within other noncurrent liabilities on its consolidated balance sheets related to these deferrals. The Company maintains a non-qualified trust, referred to as a “rabbi” trust, to fund payments under this plan. Rabbi trust assets are subject to creditor claims under certain conditions and are not the property of employees. Therefore, they are accounted for as other noncurrent assets. Assets held in trust related to the deferred compensation plan at December 31, 2020 and 2019 were approximately $
27,491
and $
24,531
, respectively.
F-
38
NOTES TO CONSOLIDATED FINANCIAL STATEMENTS
(dollars in thousands, except per share amounts)
Note 12 – Stock-Based Compensation
The Company has various stockholder-approved programs which allow for the grant of share-based compensation to officers, employees, and non-employee directors.
The amount of compensation cost related to stock-based payment transactions is measured based on the grant-date fair value of the equity instruments issued. The fair value of each option award is estimated on the date of grant using the Black-Scholes option-pricing model. The Company determines compensation cost for restricted stock units ("RSUs"), phantom stock units, and restricted stock based on the grant-date fair value of the underlying common stock adjusted for expected dividends paid over the required vesting period for non-participating awards. Compensation cost is recognized over the period that an officer, employee, or non-employee director provides service in exchange for the award.
The following table summarizes share-based compensation expense recognized:
|
Years ended December 31,
|
||||||||||||
|
|
2020
|
2019
|
2018
|
|||||||||
|
|
||||||||||||
|
Restricted stock units
|
$
|
|
$
|
|
$
|
|
||||||
|
Phantom stock units
|
|
|
|
|||||||||
|
Total
|
$
|
|
$
|
|
$
|
|
||||||
The Company recognizes compensation cost for RSUs that are expected to vest and records cumulative adjustments in the period that the expectation changes.
The following table summarizes unrecognized compensation cost and the weighted average remaining amortization periods at December 31, 2020
(amortization periods in years)
:
|
Unrecognized
Compensation
Cost
|
Weighted
Average
Remaining
Amortization
Periods
|
|||||||
|
|
||||||||
|
Restricted stock units
|
$
|
|
|
|||||
|
Phantom stock units
|
|
|
||||||
|
Total
|
$
|
|
||||||
The Company currently expects all performance-based RSUs to vest and all of the associated unrecognized compensation cost for performance-based RSUs presented in the table above to be recognized.
F-
39
NOTES TO CONSOLIDATED FINANCIAL STATEMENTS
(dollars in thousands, except per share amounts)
Note 12 – Stock-Based Compensation (continued)
2007 Stock Incentive Program
The Company's 2007 Stock Incentive Program (the "2007 Program"), as amended and restated, was approved by Vishay's stockholders at Vishay's Annual Meeting of Stockholders on May 20, 2014. The 2007 Program permits the grant of up to
6,500,000
shares of restricted stock, unrestricted stock, RSUs, stock options, and phantom stock units, to officers, employees, and non-employee directors of the Company. Such instruments are available for grant until
May 20, 2024
.
At December 31, 2020, the Company has reserved
2,307,000
shares of common stock for future grants of equity awards pursuant to the 2007 Program. If any outstanding awards are forfeited by the holder or cancelled by the Company, the underlying shares would be available for regrant to others.
Restricted Stock Units
Each RSU entitles the recipient to receive a share of common stock when the RSU vests.
RSU activity is presented below
(number of RSUs in thousands)
:
|
Years ended December 31,
|
||||||||||||||||||||||||
|
|
2020
|
2019
|
2018
|
|||||||||||||||||||||
|
|
Number of
RSUs
|
Weighted
Average
Grant-date
Fair Value
|
Number of
RSUs
|
Weighted
Average
Grant-date
Fair Value
|
Number of
RSUs
|
Weighted
Average
Grant-date
Fair Value
|
||||||||||||||||||
|
|
||||||||||||||||||||||||
|
Outstanding:
|
||||||||||||||||||||||||
|
Beginning of year
|
|
$
|
|
|
$
|
|
|
$
|
|
|||||||||||||||
|
Granted
|
|
|
|
|
|
|
||||||||||||||||||
|
Vested*
|
(
|
)
|
|
(
|
)
|
|
(
|
)
|
|
|||||||||||||||
|
Cancelled or forfeited
|
(
|
)
|
|
(
|
)
|
|
|
|
||||||||||||||||
|
End of year
|
|
$
|
|
|
$
|
|
|
$
|
|
|||||||||||||||
|
|
||||||||||||||||||||||||
|
Expected to vest
|
|
|
|
|||||||||||||||||||||
*
The number of RSUs vested includes shares that the Company withheld on behalf of employees to satisfy statutory tax withholding requirements.
The number of performance-based RSUs scheduled to vest increases ratably based on the achievement of defined performance criteria between the established target and maximum levels. RSUs with performance-based vesting criteria are expected to vest as follows
(number of RSUs in thousands)
:
|
Vesting Date
|
Expected to
Vest
|
Not Expected
to Vest
|
Total
|
|||||||||
|
January 1, 2021**
|
|
|
|
|||||||||
|
January 1, 2022
|
|
|
|
|||||||||
|
January 1, 2023
|
|
|
|
|||||||||
**
The performance vesting criteria for the performance-based RSUs with a vesting date of January 1, 2021 were achieved.
In the event of (i) any termination (other than for cause) after attaining retirement age (as defined in the respective executive's employment arrangement), the executive's outstanding RSUs shall immediately vest and the outstanding performance-based RSUs shall vest on their normal vesting date to the extent applicable performance criteria are realized; and (ii) a change of control of Vishay, all of such executive’s outstanding RSUs and performance-based RSUs shall immediately vest. In the event of voluntary termination by the executive prior to attaining retirement age or termination for cause, the executive’s outstanding RSUs and performance-based RSUs will be forfeited.
F-
40
NOTES TO CONSOLIDATED FINANCIAL STATEMENTS
(dollars in thousands, except per share amounts)
Note 12 – Stock-Based Compensation (continued)
Phantom Stock Units
The 2007 Program authorizes the grant of phantom stock units to the extent provided for in the Company's employment agreements with certain executives. Each phantom stock unit entitles the recipient to receive a share of common stock at the individual's termination of employment or any other future date specified in the applicable employment agreement. Phantom stock units participate in dividend distribution on the same basis as the Company's common stock and Class B common stock. Dividend equivalents are issued in the form of additional units of phantom stock. The phantom stock units are fully vested at all times.
The following table summarizes the Company’s phantom stock units activity
(number of phantom stock units in thousands)
:
|
Years ended December 31,
|
||||||||||||||||||||||||
|
|
2020
|
2019
|
2018
|
|||||||||||||||||||||
|
Number of
Phantom
Stock Units
|
Grant-date
Fair Value per
Unit
|
Number of
Phantom
Stock Units
|
Grant-date
Fair Value per
Unit
|
Number of
Phantom
Stock Units
|
Grant-date
Fair Value per
Unit
|
|||||||||||||||||||
|
Outstanding:
|
||||||||||||||||||||||||
|
Beginning of year
|
|
|
|
|||||||||||||||||||||
|
Granted
|
|
$
|
|
|
$
|
|
|
$
|
|
|||||||||||||||
|
Dividend equivalents issued
|
|
|
|
|||||||||||||||||||||
|
End of year
|
|
|
|
|||||||||||||||||||||
F-
41
NOTES TO CONSOLIDATED FINANCIAL STATEMENTS
(dollars in thousands, except per share amounts)
Note 13 – Commitments and Contingencies
Environmental Matters
The Company is subject to various federal, state, local, and foreign laws and regulations governing environmental matters, including the use, discharge, and disposal of hazardous materials. The Company’s manufacturing facilities are believed to be in substantial compliance with current laws and regulations. Complying with current laws and regulations has not had a material adverse effect on the Company’s financial condition.
The Company has engaged environmental consultants and attorneys to assist management in evaluating potential liabilities related to environmental matters. Management assesses the input from these consultants along with other information known to the Company in its effort to continually monitor these potential liabilities. Management assesses its environmental exposure on a site-by-site basis, including those sites where the Company has been named as a “potentially responsible party.” Such assessments include the Company’s share of remediation costs, information known to the Company concerning the size of the hazardous waste sites, their years of operation, and the number of past users and their financial viability.
As of December 31, 2020, the Company has accrued environmental liabilities of $
11,710
, of which $
4,929
is included in other accrued liabilities on the accompanying consolidated balance sheet, and $
6,781
is included in other noncurrent liabilities on the accompanying consolidated balance sheet.
While the ultimate outcome of these matters cannot be determined, management does not believe that the final disposition of these matters will have a material adverse effect on the Company’s consolidated financial position, results of operations, or cash flows. The Company’s present and past facilities have been in operation for many years. These facilities have used substances and have generated and disposed of wastes which are or might be considered hazardous. Therefore, it is possible that additional environmental issues may arise in the future, which the Company cannot now predict.
Litigation
The Company is a party to various claims and lawsuits arising in the normal course of business. The Company is of the opinion that these litigations or claims will not have a material negative effect on its consolidated financial position, results of operations, or cash flows.
Semiconductor Foundry Agreements
The Company’s Siliconix subsidiary maintains long-term foundry agreements with subcontractors to ensure access to external front-end capacity.
Since 2004, Siliconix has maintained long-term foundry arrangements for semiconductor manufacturing with Tower Semiconductor, pursuant to which Siliconix transferred certain technology to Tower Semiconductor and committed to purchase a minimum amount of semiconductor wafers. The Company has minimum purchase commitments pursuant to its current arrangements with Tower Semiconductor and other foundry partners of $
30,461
, $
16,011
, and $
1,560
for the years 2021 through 2023, respectively. The minimum purchase commitments with Tower Semiconductor are based on a 18-month rolling forecast and, accordingly, the 2022 through 2023 minimum purchase commitments will likely increase. The Company has the option to purchase wafers in addition to the minimum commitment and, accordingly, actual purchases may be different than the amounts disclosed above. The Company paid no penalties due to its 2020 purchase commitments. The Company's 2019 purchases pursuant to its arrangements were less than the minimum purchase commitment and it paid an immaterial penalty.
Product Quality Claims
The Company is a party to various product quality claims in the normal course of business. See Note 1 for further information on the Company's warranty obligations.
Executive Employment Agreements
The Company has employment agreements with certain of its senior executives. These employment agreements provide incremental compensation in the event of termination. The Company does not provide any severance or other benefits specifically upon a change in control.
F-
42
NOTES TO CONSOLIDATED FINANCIAL STATEMENTS
(dollars in thousands, except per share amounts)
Note 14 – Current Vulnerability Due to Certain Concentrations
Market Concentrations
The Company's largest customer, TTI, Inc., an electronics distributor, represented approximately
10
% of consolidated net revenues in 2019, and slightly less than 10% in 2020. The loss of this customer could have a material effect on the results of operations of the Company. No other customers represented greater than 10% of consolidated net revenue in 2020 or 2019.
A material portion of the Company's revenues are derived from the worldwide industrial, automotive, telecommunications, and computing markets. These markets have historically experienced wide variations in demand for end products. If demand for these end products should decrease, the producers thereof could reduce their purchases of the Company's products, which could have an adverse effect on the Company's results of operations and financial position.
Certain subsidiaries and product lines have customers which comprise greater than 10% of the subsidiary's or product line's net revenues. The loss of one of these customers could have a material effect on the results of operations of the subsidiary or product line and financial position of the subsidiary, which could result in an impairment charge which could be material to the Company's consolidated financial statements.
Credit Risk Concentrations
Financial instruments with potential credit risk consist principally of cash and cash equivalents, short-term investments, accounts receivable, and notes receivable. Concentrations of credit risk with respect to receivables are generally limited due to the Company’s large number of customers and their dispersion across many countries and industries. As of December 31, 2020, one customer comprised
17.2
% of the Company’s accounts receivable balance. This customer comprised
19.4
% of the Company’s accounts receivable balance as of December 31, 2019. No other customer comprised greater than 10% of the Company’s accounts receivable balance as of December 31, 2020 or December 31, 2019. The Company continually monitors the credit risks associated with its accounts receivable and adjusts the allowance for uncollectible accounts accordingly. The credit risk exposure associated with the accounts receivable is limited by the allowance and is not considered material to the financial statements.
The Company maintains cash and cash equivalents and short-term investments with various major financial institutions. The Company is exposed to credit risk related to the potential inability to access liquidity in financial institutions where its cash and cash equivalents and short-term investments are concentrated. As of December 31, 2020, the following financial institutions held over 10% of the Company’s combined cash and cash equivalents and short-term investments balance:
|
MUFG Bank Ltd.*
|
|
%
|
||
|
JPMorgan*
|
|
%
|
||
|
HSBC*
|
|
%
|
||
|
Bank of China
|
|
%
|
*
Participant in Credit Facility
Sources of Supplies
Many of the Company’s products require the use of raw materials that are produced in only a limited number of regions around the world or are available from only a limited number of suppliers. The Company’s consolidated results of operations may be materially and adversely affected if there are significant price increases for these raw materials, the Company has difficulty obtaining these raw materials, or the quality of available raw materials deteriorates. For periods in which the prices of these raw materials are rising, the Company may be unable to pass on the increased cost to the Company’s customers, which would result in decreased margins for the products in which they are used. For periods in which the prices are declining, the Company may be required to write down its inventory carrying cost of these raw materials which, depending on the extent of the difference between market price and its carrying cost, could have a material adverse effect on the Company’s net earnings.
Vishay is a major consumer of the world’s annual production of tantalum. Tantalum, a metal purchased in powder or wire form, is the principal material used in the manufacture of tantalum capacitors. There are few suppliers that process tantalum ore into capacitor grade tantalum powder.
From time to time, there have been short-term market shortages of raw materials utilized by the Company. While these shortages have not historically adversely affected the Company’s ability to increase production of products containing these raw materials, they have historically resulted in higher raw material costs for the Company. The Company cannot assure that any of these market shortages in the future would not adversely affect the Company’s ability to increase production, particularly during periods of growing demand for the Company’s products.
F-
43
NOTES TO CONSOLIDATED FINANCIAL STATEMENTS
(dollars in thousands, except per share amounts)
Note 14 – Current Vulnerability Due to Certain Concentrations (continued)
Certain raw materials used in the manufacture of the Company’s products, such as gold, copper, palladium, and other metals, are traded on active markets and can be subject to significant price volatility. To ensure adequate supply and to provide cost certainty, the Company’s policy is to enter into short-term commitments to purchase defined portions of annual consumption of the raw materials utilized by the Company if market prices decline below budget. If after entering into these commitments, the market prices for these raw materials decline, the Company must recognize losses on these adverse purchase commitments.
Customer requirements and certain laws regarding so called "conflict minerals," which include tantalum, tungsten, tin, and gold, all of which are used in the Company’s products, could result in increased prices and decreased supply of these materials, which could negatively affect the Company’s consolidated results of operations.
Geographic Concentration
The Company has operations outside the United States, and approximately
75
% of revenues earned during 2020 were derived from sales to customers outside the United States. Additionally, as of December 31, 2020, $
752,662
of the Company’s cash and cash equivalents and short-term investments were held by subsidiaries outside of the United States. Some of the Company’s products are produced and cash and cash equivalents and short-term investments are held in countries which are subject to risks of political, economic, and military instability. This instability could result in wars, riots, nationalization of industry, currency fluctuations, and labor unrest. These conditions could have an adverse impact on the Company’s ability to operate in these regions and, depending on the extent and severity of these conditions, could materially and adversely affect the Company’s overall financial condition, operating results, and ability to access its liquidity when needed.
As of December 31, 2020 the Company’s cash and cash equivalents and short-term investments were concentrated in the following countries:
|
Singapore
|
|
%
|
||
|
Germany
|
|
%
|
||
|
Israel
|
|
%
|
||
|
United States
|
|
%
|
||
|
People's Republic of China
|
|
%
|
||
|
The Republic of China (Taiwan)
|
|
%
|
||
|
Other Asia
|
|
%
|
||
|
Other Europe
|
|
%
|
||
|
Other
|
|
%
|
Certain of the Company's non-U.S. subsidiaries have cash and cash equivalents and short-term investments deposited in U.S. financial institutions.
Vishay has been in operation in Israel for
50
years. The Company has never experienced any material interruption in its operations attributable to these factors, in spite of several Middle East crises, including wars.
F-
44
NOTES TO CONSOLIDATED FINANCIAL STATEMENTS
(dollars in thousands, except per share amounts)
Note 15 – Segment and Geographic Data
Vishay is a global manufacturer and supplier of electronic components. Vishay operates, and its chief operating decision maker makes strategic and operating decisions with regards to assessing performance and allocating resources based on,
six
reporting segments: MOSFETs, Diodes, Optoelectronic Components, Resistors, Inductors, and Capacitors. These segments represent groupings of product lines based on their functionality:
|
●
|
Metal oxide semiconductor field effect transistors ("MOSFETs") function as solid state switches to control power.
|
|
|
●
|
|
Diodes route, regulate, and block radio frequency, analog, and power signals; protect systems from surges or electrostatic discharge damage; or provide electromagnetic interference filtering.
|
|
●
|
Optoelectronic components emit light, detect light, or do both.
|
|
|
●
|
|
Resistors are basic components used in all forms of electronic circuitry to adjust and regulate levels of voltage and current.
|
|
●
|
Inductors use an internal magnetic field to change alternating current phase and resist alternating current.
|
|
|
●
|
Capacitors store energy and discharge it when needed.
|
Vishay's reporting segments generate substantially all of their revenue from product sales to the industrial, automotive, telecommunications, computing, consumer products, power supplies, military and aerospace, and medical end markets. An immaterial portion of revenues are from royalties.
The Company evaluates business segment performance on operating income, exclusive of certain items ("segment operating income"). Only dedicated, direct selling, general, and administrative expenses of the segments are included in the calculation of segment operating income. The Company's calculation of segment operating income excludes such selling, general, and administrative costs as global operations, sales and marketing, information systems, finance and administration groups, as well as restructuring and severance costs, the direct impact of the COVID-19 outbreak, and other items affecting comparability. Management believes that evaluating segment performance excluding such items is meaningful because it provides insight with respect to intrinsic operating results of the Company. These items represent reconciling items between segment operating income and consolidated operating income. Business segment assets are the owned or allocated assets used by each business.
The Company also regularly evaluates gross profit by segment to assist in the analysis of consolidated gross profit. The Company considers segment operating income to be the more important metric because it more fully captures the business operations of the segments.
F-
45
NOTES TO CONSOLIDATED FINANCIAL STATEMENTS
(dollars in thousands, except per share amounts)
Note 15 – Segment and Geographic Data (continued)
The following tables set forth business segment information:
|
MOSFETs
|
Diodes
|
Optoelectronic
Components
|
Resistors
|
Inductors
|
Capacitors
|
Corporate /
Other
|
Total
|
|||||||||||||||||||||||||
|
|
||||||||||||||||||||||||||||||||
|
Year ended December 31, 2020:
|
||||||||||||||||||||||||||||||||
|
Net revenues
|
$
|
|
$
|
|
$
|
|
$
|
|
$
|
|
$
|
|
$
|
|
$
|
|
||||||||||||||||
|
Gross Profit
|
|
|
|
|
|
|
(
|
)
|
$
|
|
||||||||||||||||||||||
|
Segment Operating Income
|
|
|
|
|
|
|
(
|
)
|
$
|
|
||||||||||||||||||||||
|
Depreciation expense
|
|
|
|
|
|
|
|
$
|
|
|||||||||||||||||||||||
|
Capital expenditures
|
|
|
|
|
|
|
|
$
|
|
|||||||||||||||||||||||
|
|
||||||||||||||||||||||||||||||||
|
Total Assets as of December 31, 2020:
|
$
|
|
$
|
|
$
|
|
$
|
|
$
|
|
$
|
|
$
|
|
$
|
|
||||||||||||||||
|
|
||||||||||||||||||||||||||||||||
|
Year ended December 31, 2019:
|
||||||||||||||||||||||||||||||||
|
Net revenues
|
$
|
|
$
|
|
$
|
|
$
|
|
$
|
|
$
|
|
$
|
|
$
|
|
||||||||||||||||
|
Gross Profit
|
|
|
|
|
|
|
|
$
|
|
|||||||||||||||||||||||
|
Segment Operating Income
|
|
|
|
|
|
|
|
$
|
|
|||||||||||||||||||||||
|
Depreciation expense
|
|
|
|
|
|
|
|
$
|
|
|||||||||||||||||||||||
|
Capital expenditures
|
|
|
|
|
|
|
|
$
|
|
|||||||||||||||||||||||
|
|
||||||||||||||||||||||||||||||||
|
Total Assets as of December 31, 2019:
|
$
|
|
$
|
|
$
|
|
$
|
|
$
|
|
$
|
|
$
|
|
$
|
|
||||||||||||||||
|
|
||||||||||||||||||||||||||||||||
|
Year ended December 31, 2018:
|
||||||||||||||||||||||||||||||||
|
Net revenues
|
$
|
|
$
|
|
$
|
|
$
|
|
$
|
|
$
|
|
$
|
|
$
|
|
||||||||||||||||
|
Gross Profit
|
|
|
|
|
|
|
|
$
|
|
|||||||||||||||||||||||
|
Segment Operating Income
|
|
|
|
|
|
|
|
$
|
|
|||||||||||||||||||||||
|
Depreciation expense
|
|
|
|
|
|
|
|
$
|
|
|||||||||||||||||||||||
|
Capital expenditures
|
|
|
|
|
|
|
|
$
|
|
|||||||||||||||||||||||
|
|
||||||||||||||||||||||||||||||||
|
Total Assets as of December 31, 2018:
|
$
|
|
$
|
|
$
|
|
$
|
|
$
|
|
$
|
|
$
|
|
$
|
|
||||||||||||||||
________________
|
Years ended December 31,
|
||||||||||||
|
|
2020
|
2019
|
2018
|
|||||||||
|
Reconciliation:
|
||||||||||||
|
Segment Operating Income
|
$
|
|
$
|
|
$
|
|
||||||
|
Restructuring and Severance Costs
|
(
|
)
|
(
|
)
|
|
|||||||
|
Impact of COVID-19 on Selling, General, and Administrative Expenses
|
|
|
|
|||||||||
|
Unallocated Selling, General, and Administrative Expenses
|
(
|
)
|
(
|
)
|
(
|
)
|
||||||
|
Consolidated Operating Income (Loss)
|
$
|
|
$
|
|
$
|
|
||||||
|
Unallocated Other Income (Expense)
|
(
|
)
|
(
|
)
|
(
|
)
|
||||||
|
Consolidated Income Before Taxes
|
$
|
|
$
|
|
$
|
|
||||||
The Company has a broad line of products that it sells to OEMs, EMS companies, and independent distributors. The distribution of sales by customer type is shown below:
|
Years Ended December 31,
|
||||||||||||
|
|
2020
|
2019
|
2018
|
|||||||||
|
Distributors
|
$
|
|
$
|
|
$
|
|
||||||
|
OEMs
|
|
|
|
|||||||||
|
EMS companies
|
|
|
|
|||||||||
|
$
|
|
$
|
|
$
|
|
|||||||
F-
46
NOTES TO CONSOLIDATED FINANCIAL STATEMENTS
(dollars in thousands, except per share amounts)
Note 15 – Segment and Geographic Data (continued)
Net revenues were attributable to customers in the following regions:
|
|
Years Ended December 31,
|
|||||||||||
|
|
2020
|
2019
|
2018
|
|||||||||
|
Asia
|
$
|
|
$
|
|
$
|
|
||||||
|
Europe
|
|
|
|
|||||||||
|
Americas
|
|
|
|
|||||||||
|
$
|
|
$
|
|
$
|
|
|||||||
The Company generates substantially all of its revenue from product sales to end customers in the industrial, automotive, telecommunications, computing, consumer products, power supplies, military and aerospace, and medical end markets. Sales by end market are presented below:
|
Years Ended December 31,
|
||||||||||||
|
|
2020
|
2019
|
2018
|
|||||||||
|
Industrial
|
$
|
|
$
|
|
$
|
|
||||||
|
Automotive
|
|
|
|
|||||||||
|
Telecommunications
|
|
|
|
|||||||||
|
Computing
|
|
|
|
|||||||||
|
Consumer Products
|
|
|
|
|||||||||
|
Power Supplies
|
|
|
|
|||||||||
|
Military and Aerospace
|
|
|
|
|||||||||
|
Medical
|
|
|
|
|||||||||
|
$
|
|
$
|
|
$
|
|
|||||||
The following table summarizes net revenues based on revenues generated by subsidiaries located within the identified geographic area:
|
|
Years ended December 31,
|
|||||||||||
|
|
2020
|
2019
|
2018
|
|||||||||
|
|
||||||||||||
|
United States
|
$
|
|
$
|
|
$
|
|
||||||
|
Germany
|
|
|
|
|||||||||
|
Other Europe
|
|
|
|
|||||||||
|
Israel
|
|
|
|
|||||||||
|
Asia
|
|
|
|
|||||||||
|
$
|
|
$
|
|
$
|
|
|||||||
The following table summarizes property and equipment based on physical location:
|
December 31,
|
||||||||
|
|
2020
|
2019
|
||||||
|
|
||||||||
|
United States
|
$
|
|
$
|
|
||||
|
Germany
|
|
|
||||||
|
Other Europe
|
|
|
||||||
|
Israel
|
|
|
||||||
|
People's Republic of China
|
|
|
||||||
|
Republic of China (Taiwan)
|
|
|
||||||
|
Other Asia
|
|
|
||||||
|
Other
|
|
|
||||||
|
|
$
|
|
$
|
|
||||
F-
47
NOTES TO CONSOLIDATED FINANCIAL STATEMENTS
(dollars in thousands, except per share amounts)
Note 16 – Earnings Per Share
Basic earnings per share is computed using the weighted average number of common shares outstanding during the periods presented. Diluted earnings per share is computed using the weighted average number of common shares outstanding adjusted to include the potentially dilutive effect of stock options and restricted stock units (see Note 12), convertible debt instruments (see Note 6), and other potentially dilutive securities.
The following table sets forth the computation of basic and diluted earnings per share attributable to Vishay stockholders
(shares in thousands)
:
|
Years ended December 31,
|
||||||||||||
|
2020
|
2019
|
2018
|
||||||||||
|
Numerator:
|
||||||||||||
|
Net earnings attributable to Vishay stockholders
|
$
|
|
$
|
|
$
|
|
||||||
|
Denominator:
|
||||||||||||
|
Denominator for basic earnings per share:
|
||||||||||||
|
Weighted average shares
|
|
|
|
|||||||||
|
Outstanding phantom stock units
|
|
|
|
|||||||||
|
Adjusted weighted average shares - basic
|
|
|
|
|||||||||
|
Effect of dilutive securities:
|
||||||||||||
|
Convertible debt instruments
|
|
|
|
|||||||||
|
Restricted stock units
|
|
|
|
|||||||||
|
Dilutive potential common shares
|
|
|
|
|||||||||
|
Denominator for diluted earnings per share:
|
||||||||||||
|
Adjusted weighted average shares - diluted
|
|
|
|
|||||||||
|
Basic earnings per share attributable to Vishay stockholders
|
$
|
|
$
|
|
$
|
|
||||||
|
Diluted earnings per share attributable to Vishay stockholders
|
$
|
|
$
|
|
$
|
|
||||||
Diluted earnings per share for the years presented do not reflect the following weighted average potential common shares, as the effect would be antidilutive
(in thousands)
:
|
|
Years ended December 31,
|
|||||||||||
|
|
2020
|
2019
|
2018
|
|||||||||
|
Convertible debt instruments:
|
||||||||||||
|
Convertible Senior Debentures, due 2041
|
|
|
|
|||||||||
|
Convertible Senior Notes, due 2025
|
|
|
|
|||||||||
|
Weighted average other
|
|
|
|
|||||||||
The Company's convertible debt instruments are only convertible for specified periods upon the occurrence of certain events.
The Company's convertible debentures due 2040 became convertible subsequent to the December 31, 2020 evaluation of the conversion criteria. In periods that the convertible debt instruments are not convertible, the certain conditions which could trigger conversion of the debt instruments have been deemed to be non-substantive, and accordingly, the Company assumes the conversion of these instruments in its diluted earnings per share computation during periods in which they are dilutive.
The Company, upon conversion, will repay the principal amounts of the convertible debt instruments in cash and settle any additional amounts in shares of Vishay common stock. Prior to the adoption of ASU No. 2020-06 on January 1, 2020, the convertible instruments are included in the diluted earnings per share computation using the “treasury stock method” (similar to options and warrants) rather than the “if converted method” otherwise required for convertible debt. Under the “treasury stock method,” Vishay calculates the number of shares issuable under the terms of the convertible instruments based on the average market price of Vishay common stock during the period, and that number is included in the total diluted shares figure for the period. If the average market price is less than $
12.22
, no shares are included in the diluted earnings per share computation for the convertible senior debentures due 2040 and if the average market price is less than $
31.36
no shares are included in the diluted earnings per share computation for the convertible senior notes due 2025.
F-
48
NOTES TO CONSOLIDATED FINANCIAL STATEMENTS
(dollars in thousands, except per share amounts)
Note 17 – Additional Cash Flow Information
Changes in operating assets and liabilities, net of effects of businesses acquired, consist of the following
:
|
Years ended December 31,
|
||||||||||||
|
|
2020
|
2019
|
2018
|
|||||||||
|
|
||||||||||||
|
Accounts receivable
|
$
|
|
$
|
|
$
|
(
|
)
|
|||||
|
Inventories
|
(
|
)
|
|
(
|
)
|
|||||||
|
Prepaid expenses and other current assets
|
|
|
(
|
)
|
||||||||
|
Accounts payable
|
|
(
|
)
|
(
|
)
|
|||||||
|
Other current liabilities
|
|
(
|
)
|
|
||||||||
|
Net change in operating assets and liabilities
|
$
|
|
$
|
(
|
)
|
$
|
(
|
)
|
||||
F-
49
NOTES TO CONSOLIDATED FINANCIAL STATEMENTS
(dollars in thousands, except per share amounts)
Note 18 – Fair Value Measurements
The fair value measurement accounting guidance establishes a valuation hierarchy of the inputs used to measure fair value. This hierarchy prioritizes the inputs to valuation techniques used to measure fair value into three broad levels. The following is a brief description of those three levels:
Level 1: Observable inputs such as quoted prices (unadjusted) in active markets for identical assets or liabilities.
Level 2: Inputs other than quoted prices that are observable for the asset or liability, either directly or indirectly. These include quoted prices for similar assets or liabilities in active markets and quoted prices for identical or similar assets or liabilities in markets that are not active.
Level 3: Unobservable inputs that reflect the Company’s own assumptions.
An asset or liability’s classification within the hierarchy is determined based on the lowest level input that is significant to the fair value measurement.
The following table provides the financial assets and liabilities carried at fair value measured on a recurring basis:
|
Total Fair Value
|
Level 1
|
Level 2
|
Level 3
|
|||||||||||||
|
December 31, 2020
|
||||||||||||||||
|
Assets:
|
||||||||||||||||
|
Assets held in rabbi trusts
|
$
|
|
$
|
|
$
|
|
$
|
|
||||||||
|
Available for sale securities
|
$
|
|
|
|
|
|||||||||||
|
Non - U.S. Defined Benefit Pension Plan Assets:
|
||||||||||||||||
|
Equity securities
|
$
|
|
|
|
|
|||||||||||
|
Fixed income securities
|
$
|
|
|
|
|
|||||||||||
|
Cash
|
$
|
|
|
|
|
|||||||||||
|
$
|
|
$
|
|
$
|
|
$
|
|
|||||||||
|
December 31, 2019
|
||||||||||||||||
|
Assets:
|
||||||||||||||||
|
Assets held in rabbi trusts
|
$
|
|
$
|
|
$
|
|
$
|
|
||||||||
|
Available for sale securities
|
$
|
|
|
|
|
|||||||||||
|
Non - U.S. Defined Benefit Pension Plan Assets:
|
||||||||||||||||
|
Equity securities
|
$
|
|
|
|
|
|||||||||||
|
Fixed income securities
|
$
|
|
|
|
|
|||||||||||
|
Cash
|
$
|
|
|
|
|
|||||||||||
|
$
|
|
$
|
|
$
|
|
$
|
|
|||||||||
As described in Note 6, the Company allocated the aggregate repurchase payment of convertible debt instruments between the associated liability and equity components of the repurchased convertible senior debentures based on a nonrecurring fair value measurement of the convertible senior debentures immediately prior to the repurchases. The nonrecurring fair value measurements are considered Level 3 measurements. See Note 6 for further information on the measurements and inputs.
F-
50
NOTES TO CONSOLIDATED FINANCIAL STATEMENTS
(dollars in thousands, except per share amounts)
Note 18 – Fair Value Measurements (continued)
The Company maintains non-qualified trusts, referred to as “rabbi” trusts, to fund payments under deferred compensation and non-qualified pension plans. Rabbi trust assets consist primarily of marketable securities, classified as available-for-sale, and company-owned life insurance assets. The marketable securities held in the rabbi trusts are valued using quoted market prices on the last business day of the year. The company-owned life insurance assets are valued in consultation with the Company’s insurance brokers using the value of underlying assets of the insurance contracts. The fair value measurement of the marketable securities held in the rabbi trust is considered a Level 1 measurement and the measurement of the company-owned life insurance assets is considered a Level 2 measurement within the fair value hierarchy.
The Company maintains defined benefit retirement plans in certain of its non-U.S. subsidiaries. The assets of the plans are measured at fair value.
Equity securities held by the non-U.S. defined benefit retirement plans consist of equity securities that are valued based on quoted market prices on the last business day of the year. The fair value measurement of the equity securities is considered a Level 1 measurement within the fair value hierarchy.
Fixed income securities held by the non-U.S. defined benefit retirement plans consist of government bonds in the Philippines and India and corporate notes that are valued based on quoted market prices on the last business day of the year. The fair value measurement of the fixed income securities is considered a Level 1 measurement within the fair value hierarchy.
Cash held by the non-U.S. defined benefit retirement plans consists of demand deposits on account in various financial institutions to fund current benefit payments. The carrying amount of the cash approximates its fair value.
The Company holds investments in debt securities that are intended to fund a portion of its pension and other postretirement benefit obligations outside of the U.S. The investments are valued based on quoted market prices on the last business day of the year. The fair value measurement of the investments is considered a Level 1 measurement within the fair value hierarchy.
The Company enters into forward contracts with highly-rated financial institutions to mitigate the foreign currency risk associated with intercompany loans denominated in a currency other than the legal entity's functional currency. The notional amount of the forward contracts was $
100,000
as of December 31, 2020. There were no such contracts outstanding as of December 31, 2019. The forward contracts are short-term in nature and are expected to be renewed at the Company's discretion until the intercompany loans are repaid. We have not designated the forward contracts as hedges for accounting purposes, and as such the change in the fair value of the contracts is recognized in the consolidated statement of operations as a component of other income (expense). The Company estimates the fair value of the forward contracts based on applicable and commonly used pricing models using current market information and is considered a Level 2 measurement within the fair value hierarchy. The value of the forward contracts was immaterial as of December 31, 2020. The Company does not utilize derivatives or other financial instruments for trading or other speculative purposes.
The fair value of the long-term debt, excluding the deferred financing costs, at December 31, 2020 and 2019 is approximately $
491,400
and $
632,200
, respectively, compared to its carrying value, excluding the derivative liability and capitalized deferred financing costs, of $
406,398
and $
515,931
, respectively. The Company estimates the fair value of its long-term debt using a combination of quoted market prices for similar financing arrangements and expected future payments discounted at risk-adjusted rates, which are considered level 2 inputs.
At December 31, 2020 and 2019, the Company’s short-term investments were comprised of time deposits with financial institutions that have maturities that exceed 90 days from the date of acquisition; however they all mature within one year from the respective balance sheet dates. The Company's short-term investments are accounted for as held-to-maturity debt instruments, at amortized cost, which approximates their fair value. The investments are funded with excess cash not expected to be needed for operations prior to maturity; therefore, the Company believes it has the intent and ability to hold the short-term investments until maturity. At each reporting date, the Company performs an evaluation to determine if any unrealized losses are other-than-temporary.
No
other-than-temporary impairments have been recognized on these securities, and there are
no
unrecognized holding gains or losses for these securities during the periods presented. There have been
no
transfers to or from the held-to-maturity classification. All decreases in the account balance are due to returns of principal at the securities’ maturity dates. Interest on the securities is recognized as interest income when earned.
At December 31, 2020 and 2019, the Company’s cash and cash equivalents were comprised of demand deposits, time deposits with maturities of three months or less when purchased, and money market funds. The Company estimates the fair value of its cash, cash equivalents, and short-term investments using level 2 inputs. Based on the current interest rates for similar investments with comparable credit risk and time to maturity, the fair value of the Company's cash, cash equivalents, and held-to-maturity short-term investments approximate the carrying amounts reported in the accompanying consolidated balance sheets.
The Company’s financial instruments also include accounts receivable, short-term notes payable, and accounts payable. The carrying amounts for these financial instruments reported in the accompanying consolidated balance sheets approximate their fair values.
F-
51
NOTES TO CONSOLIDATED FINANCIAL STATEMENTS
(dollars in thousands, except per share amounts)
Note 19 – Related Party Transactions
Vishay Precision Group, Inc.
On July 6, 2010, Vishay completed the spin-off of its measurements and foil resistors businesses into an independent, publicly-traded company, Vishay Precision Group, Inc. Vishay’s common stockholders received
1 share of VPG common stock for every 14 shares of Vishay common stock
they held on the record date, June 25, 2010, and Vishay’s Class B common stockholders received
1 share of VPG Class B common stock for every 14 shares of Vishay Class B common stock
they held on the record date.
Following the spin-off, VPG is an independent company and Vishay retains no ownership interest.
Relationship with VPG after Spin-off
Following the spin-off, VPG and Vishay operate separately, each as independent public companies. Vishay has no ownership interest in VPG. However, Ruta Zandman solely or on a shared basis with Marc Zandman and Ziv Shoshani, all of whom are members of Vishay's Board of Directors, control a large portion of the voting power of both Vishay and VPG. Marc Zandman, Vishay’s Executive Chairman of the Board and an executive officer of Vishay, serves as the Chairman of VPG. Ziv Shoshani, CEO of VPG, serves as a director of Vishay. Additionally, Timothy V. Talbert, a member of Vishay’s Board of Directors is also a member of the Board of Directors of VPG.
In connection with the completion of the spin-off, Vishay and its subsidiaries entered into several agreements with VPG and its subsidiaries that govern the relationship of the parties following the spin-off. Among the agreements entered into with VPG and its subsidiaries were a transition services agreement, several lease agreements, and supply agreements. None of the agreements have had nor are expected to have a material impact on Vishay’s financial position, results of operations, or liquidity. Some of these agreements have expired and have not been renewed.
Vishay also entered into a trademark license agreement with VPG pursuant to which Vishay granted VPG the license to use certain trademarks, service marks, logos, trade names, entity names, and domain names which include the term “Vishay.” The license granted VPG the limited, exclusive, royalty-free right and license to use certain marks and names incorporating the term “Vishay” in connection with the design, development, manufacture, marketing, provision and performance of certain VPG products that do not compete with any products within Vishay’s product range as constituted immediately following the separation and certain services provided in connection with the products. The license cannot be terminated except as a result of willful misconduct or liquidation bankruptcy of VPG.
Until the spin-off, VPG was included in Vishay’s consolidated federal income tax returns and with Vishay and/or certain of Vishay’s subsidiaries in applicable combined or unitary state and local income tax returns. In conjunction with the spin-off, Vishay and VPG entered a tax matters agreement under which Vishay generally will be liable for all U.S. federal, state, local, and foreign income taxes attributable to VPG with respect to taxable periods ending on or before the distribution date except to the extent that VPG has a liability for such taxes on its books at the time of the spin-off. Vishay is also principally responsible for managing any income tax audits by the various tax jurisdictions for pre-spin-off periods. Vishay has fully indemnified VPG of tax exposures arising prior to the spin-off.
F-
52
NOTES TO CONSOLIDATED FINANCIAL STATEMENTS
(dollars in thousands, except per share amounts)
Note 20 – Goodwill and Other Intangible Assets
The Company performs its annual goodwill impairment test as of the first day of the fiscal fourth quarter. No impairment was identified as a result of the Company's annual impairment tests for 2020, 2019, and 2018.
The changes in the carrying amount of goodwill by segment for the years ended December 31, 2020 and 2019 were as follows:
|
Optoelectronic
Components
|
Resistors
|
Inductors
|
Total
|
|||||||||||||
|
Balance at December 31, 2018
|
$
|
|
$
|
|
$
|
|
$
|
|
||||||||
|
Bi-Metallix acquisition
|
|
|
|
|
||||||||||||
|
Exchange rate effects
|
|
(
|
)
|
|
(
|
)
|
||||||||||
|
Balance at December 31, 2019
|
$
|
|
$
|
|
$
|
|
$
|
|
||||||||
|
Applied Thin-Film Products acquisition
|
|
|
|
|
||||||||||||
|
Exchange rate effects
|
|
|
|
|
||||||||||||
|
Balance at December 31, 2020
|
$
|
|
$
|
|
$
|
|
$
|
|
||||||||
Other intangible assets are as follows:
|
December 31,
2020
|
December 31,
2019
|
|||||||
|
Intangible assets subject to amortization:
|
||||||||
|
Patents and acquired technology
|
$
|
|
$
|
|
||||
|
Capitalized software
|
|
|
||||||
|
Customer relationships
|
|
|
||||||
|
Tradenames
|
|
|
||||||
|
|
|
|||||||
|
Accumulated amortization:
|
||||||||
|
Patents and acquired technology
|
(
|
)
|
(
|
)
|
||||
|
Capitalized software
|
(
|
)
|
(
|
)
|
||||
|
Customer relationships
|
(
|
)
|
(
|
)
|
||||
|
Tradenames
|
(
|
)
|
(
|
)
|
||||
|
(
|
)
|
(
|
)
|
|||||
|
Net Intangible Assets Subject to Amortization
|
$
|
|
$
|
|
||||
Amortization expense (excluding capitalized software) was $
8,113
, $
8,476
, and $
11,807
, for the years ended December 31, 2020, 2019, and 2018, respectively.
Estimated annual amortization expense of intangible assets on the balance sheet at December 31, 2020 for each of the next five years is as follows:
|
2021
|
$
|
|
||
|
2022
|
|
|||
|
2023
|
|
|||
|
2024
|
|
|||
|
2025
|
|
F-
53
TABLE OF CONTENTS
Part IItem 1. BusinessItem 1A. Risk FactorsItem 1B. Unresolved Staff CommentsItem 2. PropertiesItem 3. Legal ProceedingsItem 4. Mine Safety DisclosuresPart IIItem 5. Market For Registrant S Common Equity, Related Stockholder Matters, and Issuer Purchases Of Equity SecuritiesItem 6. Selected Financial DataItem 7. Management S Discussion and Analysis Of Financial Condition and Results Of OperationsItem 7A. Quantitative and Qualitative Disclosures About Market RiskItem 8. Financial Statements and Supplementary DataItem 9. Changes in and Disagreements with Accountants on Accounting and Financial DisclosureItem 9A. Controls and ProceduresItem 9B. Other InformationPart IIIItem 10. Directors, Executive Officers, and Corporate GovernanceItem 11. Executive CompensationItem 12. Security Ownership Of Certain Beneficial Owners and Management and Related Stockholder MattersItem 13. Certain Relationships and Related Transactions, and Director IndependenceItem 14. Principal Accounting Fees and ServicesPart IVItem 15. Exhibits, Financial Statement SchedulesItem 16. Form 10-k SummaryNote 1 Summary Of Significant Accounting PoliciesNote 1 Summary Of Significant Accounting Policies (continued)Note 2 - Acquisition and Divestiture ActivitiesNote 3 LeasesNote 4 Restructuring and Related ActivitiesNote 5 Income TaxesNote 5 Income Taxes (continued)Note 6 Long-term DebtNote 6 Long-term Debt (continued)Note 7 Stockholders EquityNote 8 Details Of ExpensesNote 9 Other Accrued ExpensesNote 10 Accumulated Other Comprehensive Income (loss)Note 11 Pensions and Other Postretirement BenefitsNote 11 Pensions and Other Postretirement Benefits (continued)Note 12 Stock-based CompensationNote 12 Stock-based Compensation (continued)Note 13 Commitments and ContingenciesNote 14 Current Vulnerability Due To Certain ConcentrationsNote 14 Current Vulnerability Due To Certain Concentrations (continued)Note 15 Segment and Geographic DataNote 15 Segment and Geographic Data (continued)Note 16 Earnings Per ShareNote 17 Additional Cash Flow InformationNote 18 Fair Value MeasurementsNote 18 Fair Value Measurements (continued)Note 19 Related Party TransactionsNote 20 Goodwill and Other Intangible Assets